Thematic global evaluation of - OECD
261
Thematic global evaluation of European Commission support to the education sector in partner countries (including basic and secondary education) Final Report Volume IIb December 2010 Evaluation for the European Commission
-
Upload
khangminh22 -
Category
Documents
-
view
1 -
download
0
Transcript of Thematic global evaluation of - OECD
Thematic global evaluation ofEuropean Commission support to theeducation sector in partner countries
(including basic and secondary education)
Final ReportVolume IIb
December 2010
Evaluation for the European Commission


European Group forEvaluation EEIG
Germany
Framework contract forMulti-country thematic and regional/country-level
strategy evaluation studies and synthesis in the areaof external co-operation
Particip GmbHGermany
LOT 2:Multi-country evaluation studies on social/humandevelopment issues of EC external co-operation
Aide à la Décision EconomiqueBelgium
Ref.: EuropeAid/122888/C/SER/MultiContract n° EVA 2007/social LOT2
Italy
Deutsches Institut fürEntwicklungspolitik
Germany
Thematic global evaluation ofEuropean Commission support to theeducation sector in partner countries
(including basic and secondary education)
European Centre forDevelopment Policy Management
The Netherlands
Overseas Development InstituteUnited Kingdom
Final Report Volume IIb
South ResearchBelgium
December 2010
A consortium ofParticip-ADE–DRN-DIE–ECDPM-ODI
c/o Particip GmbH, leading company:HeadquartersMerzhauser Str. 183D - 79100 Freiburg / GermanyPhone: +49-761-79074-0Fax: +49-761-79074-90
This evaluation was carried out byParticip GmbH

The core evaluation team was composed by: Georg Ladj(Team leader), Wim Biervliet, Armand Hughes d’Aeth,François Orivel, Peter Christensen.
The evaluation was managed by the Joint Evaluation Unit(EuropeAid, DG DEV and DG Relex).
This report has been prepared by Particip GmbH. Theopinions expressed in this document represent the viewsof the authors, which are not necessarily shared by theEuropean Commission or by the authorities of thecountries concerned.


Thematic global evaluation ofEuropean Commission support to theeducation sector in partner countries
(including basic and secondary education)Final Report
The report consists of two volumes:
Volume I: Final Report
Volume II: Annexes
VOLUME I: DRAFT FINAL REPORT
Executive Summary
1. Introduction
2. Methodology
3. Main Findings and Analysis: Answers to the Evaluation Questions and overall assessment of theEC Strategy
4. Conclusions and recommendations
VOLUME II: ANNEXES
VOLUME IIa: DETAILED ANSWERS TO THE EVALUATION QUESTIONS
Annex 1: Detailed answers to the Evaluation Questions
VOLUME IIb: MAIN INDVIDUAL ANALYSES
Annex 2: Inventory and typology of EC support to basic and secondary education
Annex 3: EC Support to the education sector in partner countries: Results of the survey to EUDs
Annex 4: Analysis of the European Court of Auditors (ECA) reports on education and GBS in Africa(Niger, Liberia, Namibia, Tanzania, Uganda and Burkina Faso)
Annex 5: Focus Group Analysis (Results of video-conferences with a sample of EU Delegations)
VOLUME IIc: COUNTRY NOTES
Annex 6: Bangladesh
Annex 7: Pakistan
Annex 8: Dominican Republic
Annex 9: Niger
Annex 10: South Africa
Annex 11: Tunisia
VOLUME IId: ToR, SOME DEFINITIONS, FURTHER INDIVIDUAL ANALYSES, REFERENCES
Annex 12: Terms of Reference
Annex 13: Evaluation methodology
Annex 14: Subsector definitions for the education sector
Annex 15: Definitions of major education-related indicators
Annex 16: Final set of evaluation questions, judgment criteria and indicators

VOLUME IId (continued): ToR, SOME DEFINITIONS, FURTHER INDIVIDUAL ANALYSES,REFERENCES
Annex 17: Test of EC Guidance for evaluations related to education
Annex 18: International policy framework for basic and secondary education – and how the ECsupports it
Annex 19: EC policy related to support to education
Annex 20: EC intervention logic related to basic and secondary education and the process of selectingEvaluation Questions
Annex 21: Support to basic and secondary education: Global financing needs versus relativeimportance in EC support and human resources allocated
Annex 22: Note on international education indicators: Overview of EFA goals and indicators, MDGs,MDG targets and indicators, and FTI indicators
Annex 23: Detailed statistical tables related to the desk study countries
Annex 24: Details about compulsory education in the desk study countries
Annex 25: Overview of international and regional surveys related to learning achievements
Annex 26: Analysis of EC Country Strategy Papers (CSPs)
Annex 27: List of people interviewed/met
Annex 28: Documents consulted

Thematic global evaluation of European Commission support to the education sector in partner countries(Including basic and secondary education); Final Report Vol. IIb, December 2010; Particip GmbH
i
Table of contents
List of tables ....................................................................................................................................... v
List of figures.................................................................................................................................... vii
List of boxes .................................................................................................................................... viii
1 Annex 2: Inventory and typology of EC support to basic andsecondary education ................................................................................................ 1
1.1 Introduction............................................................................................................................. 1
1.2 Results of the inventory and typology................................................................................. 2
1.2.1 Global overview of the EC support to the education sector........................................... 2
1.2.2 EC’s “direct” support to the education sector................................................................. 3
1.2.3 EC’s “indirect” support to the education sector: General Budget Support ................... 17
1.3 Summary ............................................................................................................................... 19
1.4 Appendix 1: Inventory details ............................................................................................. 21
1.4.1 List of education DAC sector codes and screening key words.................................... 21
1.4.2 Key challenges and approach to the mapping of interventions ................................... 27
1.4.3 Limits to take into account............................................................................................ 37
1.4.4 List of interventions financed by the EC to support the education sectorbetween 2000 and 2007............................................................................................... 38
1.4.5 List of general budget support financed by the EC between 2000 and2007 ............................................................................................................................. 38
1.4.6 List of recipient countries of EC funds in the education sector .................................... 45
2 Annex 3: EC Support in the education sector in partner countries:Results of the survey to EUDs............................................................................... 49
2.1 Internal resources for education support .......................................................................... 49
2.1.1 Within the Delegation, at anytime between 2000 and 2007, has therebeen at least one person specifically responsible for support and issuesrelated to education sector, whether or not as part of the Social Sector? ................... 49
2.1.2 If nobody is specifically in charge/responsible for education, how is yourDelegation dealing with issues related to the education sector in general,and with basic and secondary education in particular? ............................................... 50
2.1.3 What have been the major trends in workload (e.g. regarding sub-sectorssupported, shifts from project monitoring to policy dialogue?...................................... 50
2.1.4 How has the Delegation developed its institutional capacity to deal witheducation sector related issues, specifically issues related to basic andsecondary education in the period 2000-2007?........................................................... 51
2.1.5 Other issues raised by the Delegations regarding staffing and workload.................... 51
2.2 The importance of basic and secondary education in the country ................................ 52
2.2.1 In your opinion, how much importance does the National Governmentattribute to enhancing basic education? ...................................................................... 52
2.2.2 In your opinion, how much importance does the National Governmentattribute to enhancing secondary education? .............................................................. 55
2.3 Some hard facts, mainly related to progress towards indicators of theParis Declaration: “In the light of the Rome and Paris Declarations and theAccra High Level Forum, please indicate changes which occurred in ECsupport to education in your partner country between 2003 and 2007related to a number of indicators?” ................................................................................... 58

Thematic global evaluation of European Commission support to the education sector in partner countries(Including basic and secondary education); Final Report Vol. IIb, December 2010; Particip GmbH
ii
2.3.1 Percentage of EC education aid that uses partner country procurementsystems ........................................................................................................................ 59
2.3.2 Percentage of EC aid to the education sector that is provided either asbudget support or using programme-based approaches for supporting aPRSP or comparable objectives .................................................................................. 59
2.3.3 Number of EC-supported project implementation units running parallel togovernment institutions within the education sector .................................................... 60
2.3.4 Number of joint field missions regarding support to education(Government, EC and other development partners).................................................... 61
2.3.5 Degree to which shared analytical work of support to education is takingplace (Government, EC and other development partners) .......................................... 62
2.3.6 Percentage of EC aid disbursement to education released according toagreed schedules......................................................................................................... 62
2.3.7 The Paris Declaration also indicates the need for "joint and harmonisededucation assistance strategies". How joint and harmonized would youassess education assistance strategies of the donor community in yourcountry?........................................................................................................................ 63
2.4 Changes in sector performance and outcomes................................................................ 64
2.4.1 For the period 2000 - 2007, how would you, overall, rate the EC'scontribution to improving education sector performance and outcomes inbasic and secondary education in the country?........................................................... 64
2.4.2 At a more specific level, and for the period 2000 - 2007, in your opinion,how well has EC support contributed to improving the following specificeducation sector outcomes? ........................................................................................ 66
2.4.3 What are the issues/factors that hampered further improvements relatedto overall education sector performance and outcomes in basic andsecondary education between 2000 and 2007? .......................................................... 72
2.4.4 For the period 2000 - 2007, what has been the added value of ECsupport to basic and secondary education in the country?.......................................... 75
2.5 Programming of support to education............................................................................... 75
2.5.1 In your opinion, what role did basic education and secondary educationplay within the first and second CSP/NIP drafted during the evaluationperiod? ......................................................................................................................... 76
2.5.2 Quality of dialogue and co-ordination in the programming of support ......................... 77
2.6 Policy dialogue, coordination, harmonization, alignment - issues related toGeneral Budget Support ...................................................................................................... 81
2.6.1 At a general level, how important is/was the General Budget Supportsupported by the EC regarding coordination, harmonization andalignment issues related to education?........................................................................ 81
2.6.2 What role does and did EC play in preparing and monitoring the GeneralBudget Support with regard to issues related to support to education? ...................... 81
2.6.3 Overall, what importance/weight would you attribute to EC in the contextof policy dialogue on General Budget Support? .......................................................... 83
2.7 Coordination, harmonization, alignment - at the level of the educationsector ..................................................................................................................................... 83
2.7.1 What kind of co-ordination and consultative mechanisms related tosupport to education exist(ed) at the sector level in the country, and howwould you characterize them? ..................................................................................... 83
2.8 Does the EC co-fund programmes in your country that are implementedby development banks, UN organisations or through FTI?............................................. 88
2.9 Education for All - Fast Track Initiative.............................................................................. 88

Thematic global evaluation of European Commission support to the education sector in partner countries(Including basic and secondary education); Final Report Vol. IIb, December 2010; Particip GmbH
iii
2.9.1 Is the Fast Track Initiative (FTI) relevant for your country? What kind ofconsultation mechanisms have been put in place between the ECD andFTI on sector support issues including SBS? .............................................................. 88
2.9.2 In your opinion, to what extent the FTI Catalytic Fund helped to improvecountry preparedness for EC sector support? ............................................................. 89
2.9.3 If an FTI country appraisal has taken place, how do/did the Delegationshare its results with EC HQ in Brussels? ................................................................... 89
2.10 Aid modalities and channels............................................................................................... 89
2.10.1 Overall suitability of the aid channels the EC uses (contracts) forachieving education sector outcomes in partner countries.......................................... 89
2.10.2 Suitability of the aid channels the EC uses (contracts) for achievingeducation sector outcomes in partner countries by themes ........................................ 92
2.10.3 Overall suitability of the aid modalities the EC uses for achievingeducation sector outcomes in partner countries .......................................................... 99
2.10.4 Suitability of the aid modalities the EC uses for achieving educationsector outcomes in partner countries by themes ....................................................... 102
2.11 Appendix: EUD Survey Form ............................................................................................ 109
3 Annex 4: Analysis of the European Court of Auditors (ECA) reportson education and GBS in Africa (Niger, Liberia, Namibia, Tanzania,Uganda and Burkina Faso)................................................................................... 131
3.1 Introduction......................................................................................................................... 135
3.1.1 Data collection tools and methods used (their limits and possibleconstraints)................................................................................................................. 135
3.1.2 Main characteristics of EC support the countries....................................................... 136
3.2 EQ1-relevance: To what extent is EC support aligned to educationdevelopment objectives in national development plans, such as PRSPs,and ensured coherence between EC development co-operation policieson education and other EC policies affecting education?............................................. 136
3.2.1 JC11: Degree to which EC education interventions are relevant to andaligned with PRSP or similar national policy or strategy objectives........................... 136
3.2.2 JC12: Degree to which EC education support is harmonised andtransparent in supporting PRSP or similar national policy or strategyobjectives ................................................................................................................... 139
3.2.3 JC13: The Commission has ensured the overall coherence of itseducation support....................................................................................................... 141
3.3 EQ2-access: To what extent has EC support to education contributed toimproving access to basic education? ............................................................................ 142
3.4 EQ3-secondary: To what extent has EC support to education contributedto improving transition to secondary level (both lower and upper)? ........................... 152
3.4.2 JC32: Capacity of secondary institutions to accommodate potentialenrolments and to meet expected rise in demand for enrolment(especially at lower secondary level) ......................................................................... 154
3.5 EQ4-quality: To what extent has EC support to education contributed toimproving the quality of education? ................................................................................ 155
3.5.1 JC41: Availability of strategies and resources to enhance quality oflearning and teaching................................................................................................. 155
3.5.2 JC42: Quality related efficiency measures................................................................. 160
3.5.3 JC43: Qualifications and competencies of teachers and school leadersenhanced.................................................................................................................... 161

Thematic global evaluation of European Commission support to the education sector in partner countries(Including basic and secondary education); Final Report Vol. IIb, December 2010; Particip GmbH
iv
3.5.4 JC44: Provisions made to ensure minimum quality education for childrenin difficult circumstances and ethnic minorities .......................................................... 163
3.6 EQ5-skills: To what extent has EC support to education contributed toenhancing basic education skills, especially literacy and numeracy? ........................ 164
3.6.1 JC51: Literacy and numeracy enhanced ................................................................... 164
3.6.2 JC52: Improved core learning achievements............................................................. 165
3.7 EQ6-delivery: To what extent has EC support to education helped inimproving education system service delivery and resourcing? ................................... 166
3.7.1 JC61: Sound pro-poor sector policy framework in place ........................................... 166
3.7.2 JC62: Resource allocations in line with education sector requirements.................... 167
3.7.3 JC63: Evidence of linkages between education sector reform and broadernational reforms; decentralisation, civil service reform and public financemanagement reform................................................................................................... 169
3.7.4 JC64: Increased capacity for addressing education reform andmanagement issues ................................................................................................... 170
3.8 EQ7-transparency: To what extent has EC support to education helpedstrengthening transparency and accountability of the management ofeducation service delivery? .............................................................................................. 172
3.8.1 JC71: Strengthened and operational institutional and proceduralframework in the education sector related to transparency andaccountability issues at national and sub-national level ............................................ 172
3.8.2 JC72: Strengthened role and involvement of non state actors, civil societyand local government in education sector management processes.......................... 178
3.8.3 JC73: Strengthened staff competencies related to accountability issues.................. 180
3.8.4 JC74: Degree to which EC support for education is promoting mutualaccountability and predictability with partner countries.............................................. 182
3.9 EQ8-3Cs: To what extent and how has the EC contributed to improvingco-ordination, complementarity and synergies with Member States andother donors in the education sector, in line with the Paris Declaration?................... 184
3.9.1 JC81: Donor co-ordination mechanisms are in place or being set up withthe EC providing value added.................................................................................... 184
3.9.2 JC82: Complementarity between the interventions of the EC, the EUMember States and other donor agencies active in the education sector ................. 187
3.9.3 JC83: Level of synergy between EC-supported trust funds and banks andEC support at country level ........................................................................................ 190
3.10 EQ9-modal: To what extent have the various aid modalities and fundingchannels and their combinations, in particular GBS/SBS/SSP/projects,been appropriate and contributed to improving access to, equity andpolicy-based resource allocation in education?............................................................. 191
3.10.1 JC91: Improved analytical thoroughness in the selection andimplementation process of aid modalities and channels (e.g. discussionof alternatives)............................................................................................................ 191
3.10.2 JC92: Contribution of EC GBS and SBS to policy based resourceallocations and pro-poor objectives in the education sector ...................................... 197
3.10.3 JC93: Increased efficiency of EC aid delivery............................................................ 202
3.10.4 JC94: EC’s contribution to the FTI provides added value to EC support atcountry level ............................................................................................................... 206
3.10.5 JC95: EC support to development banks provides added value to ECsupport to education at country level ......................................................................... 207
3.11 Conclusions ........................................................................................................................ 207

Thematic global evaluation of European Commission support to the education sector in partner countries(Including basic and secondary education); Final Report Vol. IIb, December 2010; Particip GmbH
v
3.11.1 Trends in choice of education indicators (quantity versus quality) ............................ 207
3.11.2 Appropriateness of selection of aid modality through assessing selectionbased on relevant guidelines ..................................................................................... 208
3.11.3 Achievement of education sector outcomes, related to targets ofeducation indicators measured by full or partial disbursement.................................. 209
3.11.4 Capacity development efforts and their results, e.g. related to educationstatistics, sector monitoring, Education Sector Plans, EMIS, FMIS - PFM................ 210
3.11.5 EC’s role in education sector and broader policy dialogue........................................ 210
3.11.6 Timeliness and quality of monitoring efforts, including actions in case ofproblems..................................................................................................................... 212
4 Annex 5: Focus Group Analysis (Results of video-conferences with asample of EU Delegations)................................................................................... 215
4.1 Introduction......................................................................................................................... 216
4.1.1 Purpose and objectives.............................................................................................. 216
4.1.2 Methodology............................................................................................................... 216
4.1.3 Structure of the report ................................................................................................ 218
4.2 Findings............................................................................................................................... 218
4.2.1 Introduction................................................................................................................. 218
4.2.2 Research question 1: Access issues, primary and secondary .................................. 221
4.2.3 Research question 2: Service Delivery ...................................................................... 224
4.2.4 Research question 3: Transparency and accountability ............................................ 230
4.2.5 Research question 4: Coordination, complementarity, synergy ................................ 232
4.2.6 Research question 5: Aid modalities.......................................................................... 236
4.3 Appendices ......................................................................................................................... 241
4.3.1 List of participants ...................................................................................................... 241
4.3.2 Interview guide ........................................................................................................... 242
List of tablesTable 1: Country/region breakdown, education sector without HE and VET, 2000-
2007 ............................................................................................................................... 8
Table 2: Country/regional breakdown of GBS with a reference to the educationsector............................................................................................................................ 18
Table 3: Education sub-sector categories used for classification of interventions .................... 31
Table 4: Description of aid delivery methods ............................................................................. 32
Table 5: Proposed classification, definition and typical characteristics of type of aidmodalities used by the EC to deliver its “direct” support to the educationsector............................................................................................................................ 33
Table 6: Information analysis provided in CRIS for each aid modality ...................................... 34
Table 7: List of general budget support financed by the EC between 2000 and2007 ............................................................................................................................. 39
Table 8: List of recipient countries of EC funds in the education sector .................................... 45
Table 9: Results of survey to EUDs: Evolution of staffing dealing with education inEUDs ............................................................................................................................ 49
Table 10: Results of survey to EUDs: Perceptions on importance attributed bynational governments to basic education..................................................................... 52

Thematic global evaluation of European Commission support to the education sector in partner countries(Including basic and secondary education); Final Report Vol. IIb, December 2010; Particip GmbH
vi
Table 11: Results of survey to EUDs: Perceptions on importance attributed bynational governments towards enhancing basic education – some trends ................. 55
Table 12: Results of survey to EUDs: Perceptions on importance attributed bynational governments towards enhancing secondary education ................................. 55
Table 13: Results of survey to EUDs: Perceptions on importance attributed bynational governments towards enhancing secondary education – sometrends ........................................................................................................................... 58
Table 14: Results of survey to EUDs: Percentage of EC education aid that usespartner country procurement systems ......................................................................... 59
Table 15: Results of survey to EUDs: Percentage of EC aid to the education sectorthat is provided either as budget support or using programme-basedapproaches for supporting a PRSP or comparable objectives .................................... 60
Table 16: Results of survey to EUDs: Number of EC-supported projectimplementation units running parallel to government institutions within theeducation sector ........................................................................................................... 61
Table 17: Results of survey to EUDs: Number of joint field missions regardingsupport to education (Government, EC and other development partners) .................. 61
Table 18: Results of survey to EUDs: Degree to which shared analytical work ofsupport to education is taking place (Government, EC and otherdevelopment partners) ................................................................................................. 62
Table 19: Results of survey to EUDs: Percentage of EC aid disbursement toeducation released according to agreed schedules..................................................... 63
Table 20: Results of survey to EUDs: Existence of joint and harmonized educationassistance strategies.................................................................................................... 63
Table 21: Results of survey to EUDs: Overall rating of the EC's contribution toimproving education sector performance and outcomes in basic andsecondary education in the country ............................................................................. 65
Table 22: Results of survey to EUDs: Rating of the EC's contribution to improvingspecific aspects of education sector performance and outcomes in basicand secondary education in the country ...................................................................... 67
Table 23: Results of survey to EUDs: Rating of role of basic and secondaryeducation within the CSPs/NIPs drafted during the period underevaluation ..................................................................................................................... 76
Table 24: Results of survey to EUDs: Rating of quality of dialogue and coordinationwith Government when drafting the CSPs/NIPs during the period underevaluation ..................................................................................................................... 77
Table 25: Results of survey to EUDs: Rating of quality of dialogue and coordinationwith EU MS when drafting the CSPs/NIPs during the period underevaluation ..................................................................................................................... 78
Table 26: Results of survey to EUDs: Rating of quality of dialogue and coordinationwith other donors when drafting the CSPs/NIPs during the period underevaluation ..................................................................................................................... 79
Table 27: Results of survey to EUDs: Rating of quality of dialogue and coordinationwith other stakeholders when drafting the CSPs/NIPs during the periodunder evaluation........................................................................................................... 80
Table 28: Results of survey to EUDs: Importance of financing, accountability andcapacity building measures related to education in policy dialogue relatedto the GBS.................................................................................................................... 82
Table 29: Results of survey to EUDs: How EUDs perceive EC’s importance in thecontext of policy dialogue on GBS ............................................................................... 83
Table 30: Coordination and consultative mechanisms related to support toeducation: Between the EC and the Government........................................................ 85

Thematic global evaluation of European Commission support to the education sector in partner countries(Including basic and secondary education); Final Report Vol. IIb, December 2010; Particip GmbH
vii
Table 31: Countries suggested for the video-conference .......................................................... 217
Table 32: Final composition of focus groups ............................................................................. 217
Table 33 : Aid modalities (and channels) applied in the focus group countries.......................... 220
Table 34: Corruption Perception Index, Transparency International ......................................... 230
List of figuresFigure 1: Global overview of EC financial contribution to the education sector ............................ 2
Figure 2: Trend in the amount contracted between 2000 and 2007 (€ million) forthe education sector (incl. and excl. HE and VET) ........................................................ 3
Figure 3: Sector breakdown (including and excluding HE and VET) by maineducation sub-sector, contracts (€ million), 2000-2007 ................................................. 4
Figure 4: Trend in the amounts contracted (€ million) between 2000 and 2007 bymain education sub-sector (without HE and VET) ......................................................... 5
Figure 5: Sector breakdown by detailed education sub-sector (without HE andVET), contracts 2000-2007 ............................................................................................ 5
Figure 6: Regional breakdown, education sector with and without HE and VET,contracts (€ million), 2000-2007..................................................................................... 6
Figure 7: Disbursement levels by region, education sector without HE and VET,2000-2007 ...................................................................................................................... 7
Figure 8: Breakdown of modalities used by the EC to delivery its aid, contracts (€million), education sector without HE and VET, 2000-2007 .......................................... 9
Figure 9: Trend of the amount contracted by modality used by the EC to deliver itsaid, contracts (€ million), education sector without HE and VET, 2000-2007 ............................................................................................................................. 10
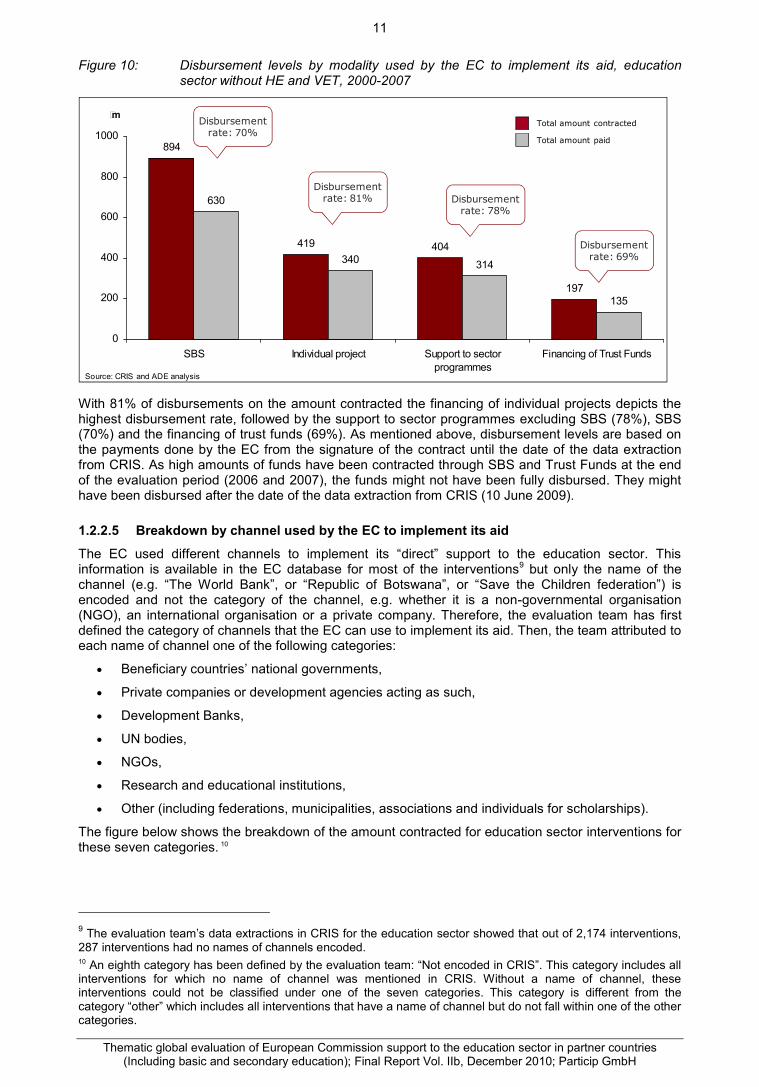
Figure 10: Disbursement levels by modality used by the EC to implement its aid,education sector without HE and VET, 2000-2007...................................................... 11
Figure 11: Breakdown by channel used by the EC to deliver its aid, contracts (€million), education sector without HE and VET, 2000-2007 ........................................ 12
Figure 12: Disbursement levels by channel used by the EC to deliver its aid,education sector without HE and VET, 2000-2007...................................................... 12
Figure 13: Regional breakdown by main education sub-sector without HE and VET,contracts (€ million), 2000-2007................................................................................... 13
Figure 14: Regional breakdown by main education sub-sector including HE andVET, contracts (€ million), 2000-2007.......................................................................... 14
Figure 15: Regional breakdown by type of modality, contracts (€ million), educationsector without HE and VET, 2000-2007....................................................................... 15
Figure 16: Regional breakdown by type of modality, contracts (€ million), educationsector including HE and VET, 2000-2007.................................................................... 15
Figure 17: Sectoral breakdown by type of modality, contracts (€ million), educationsector without HE and VET, 2000-2007....................................................................... 16
Figure 18: Sectoral breakdown by type of modality, contracts (€ million), educationsector including HE and VET, 2000-2007.................................................................... 16
Figure 19: Trend in the amounts transferred through GBS (€ million), 2000-2007....................... 17
Figure 20: Schematic approach to mapping EC support to education.......................................... 29
Figure 21: Approach used to identify GBS relevant to the education sector ................................ 35
Figure 22: Results of survey to EUDs: Perceived suitability of delivery channels toachieve education sector outcomes............................................................................. 89
Figure 23: Results of survey to EUDs: Access to basic education - perceivedsuitability of channels ................................................................................................... 93

Thematic global evaluation of European Commission support to the education sector in partner countries(Including basic and secondary education); Final Report Vol. IIb, December 2010; Particip GmbH
viii
Figure 24: Results of survey to EUDs: Improving transition to secondary - perceivedsuitability of channels ................................................................................................... 94
Figure 25: Results of survey to EUDs: Improving access to education fordisadvantaged groups - perceived suitability of channels ........................................... 95
Figure 26: Results of survey to EUDs: Improving quality of education - perceivedsuitability of channels ................................................................................................... 96
Figure 27: Results of survey to EUDs: Improving learning achievements - perceivedsuitability of channels ................................................................................................... 97
Figure 28: Results of survey to EUDs: Improving management of education servicedelivery - perceived suitability of channels................................................................... 98
Figure 29: Results of survey to EUDs: Improving transparency and accountability ofeducation service delivery - perceived suitability of channels ..................................... 99
Figure 30: Results of survey to EUDs: Perceived suitability of modalities to achieveeducation sector outcomes ........................................................................................ 100
Figure 31: Results of survey to EUDs: Access to basic education - perceivedsuitability of modalities ............................................................................................... 102
Figure 32: Results of survey to EUDs: Improving transition to secondary - perceivedsuitability of modalities ............................................................................................... 103
Figure 33: Results of survey to EUDs: Improving access to education fordisadvantaged groups - perceived suitability of modalities........................................ 104
Figure 34: Results of survey to EUDs: Improving quality of education - perceivedsuitability of modalities ............................................................................................... 105
Figure 35: Results of survey to EUDs: Improving learning achievements - perceivedsuitability of modalities ............................................................................................... 105
Figure 36: Results of survey to EUDs: Improving management of education servicedelivery - perceived suitability of modalities............................................................... 106
Figure 37: Results of survey to EUDs: Improving transparency and accountability ofeducation service delivery - perceived suitability of modalities.................................. 107
List of boxesBox 1: Key findings of the inventory and typology .................................................................... 1
Box 2: Bangladesh: An example of what coordination with Governments mightrequire .......................................................................................................................... 84

Thematic global evaluation of European Commission support to the education sector in partner countries(Including basic and secondary education); Final Report Vol. IIb, December 2010; Particip GmbH
1
1 Annex 2: Inventory and typology of EC support to basic andsecondary education
1.1 IntroductionThis chapter presents the inventory and typology of the EC’s funding in the education sector in partnercountries. It focuses on the scope of the evaluation as defined by the ToR. It concerns thus the EC’sfunding with respect to basic and secondary education during the period 2000 and 2007 in thecountries covered by this evaluation. Where useful, reference is however made to higher education(HE) and vocational education and training (VET). Moreover, it distinguishes systematically betweendirect support and indirect support (i.e. GBS with a reference to the education sector, as furtherexplained below) 1.
The approach developed by the evaluation team to compile the inventory is presented in detail in theannexes (section 1.4). The key elements of the inventory and typology are presented in section 1.2.The main findings are provided in the box below.
Box 1: Key findings of the inventory and typology The EC’s direct support to the education sector amounted to around € 1.9 billion during
the period 2000-2007; This support had a general increasing trend over the period with a serrated pattern The direct support focused on basic education (including primary education) and on the
support to the education sector as a whole while support to secondary education wasmarginal in relative terms;
The main beneficiary regions in absolute terms for the direct support were ACP and Asia. Sector Budget Support was the main modality used by the EC to deliver its direct support
to the education sector. Other modalities used were the financing of individual projects,the support to sector programmes excluding SBS2 and the financing of Trust Funds.
The EC’s indirect support (meaning General Budget Support referring to the educationsector, among other sectors), amounted to around € 3.2 billion over the period 2000-2007.
This support concerned 37 of the 43 countries in which the EC provided GBS, nearlyexclusively in ACP;
Over the period 2000-2007, indirect support increased until 2003 then had a decreasingtrend until the end of the period
Section 1.2 provides the results of the inventory and typology work. It starts with a globaloverview and provides then the results for respectively the direct and the indirect support;
Section 1.3 proposes then a summary of the inventory and typology as well as, on that basis, alist of issues to be further investigated in the next stages of the evaluation.
Additional information on the inventory and typology is provided in the annexes (section 1.4):
List of education DAC sector codes and screening key words
Key challenges for mapping the interventions and the approach developed to tackle them. Asinformation was not readily available, it was indeed necessary to develop a suitable workingmethod to list and classify the interventions;
Limits of the inventory and typology;
List of interventions financed by the EC to support the education sector between 2000 and2007 (due to the volume of this information it is provided in a separate file);
List of recipient countries of EC funds in the education sector;
List of GBS financed by the EC between 2000 and 2007.
1 “Direct support” should be understood here as support that targets directly and entirely the education sector. Itshould be distinguished from “indirect support” (see below), to be understood as support that is dedicated toeducation as one sector among others.2 This is not an official category of EC aid delivery methods, but, as a clear categorisation of SPSPs was lacking inthe CRIS database, the evaluation team used it as category for the analysis. See Appendix 1 for further details.

Thematic global evaluation of European Commission support to the education sector in partner countries(Including basic and secondary education); Final Report Vol. IIb, December 2010; Particip GmbH
2
1.2 Results of the inventory and typologyThe outputs of the inventory are presented in the following sub-sections:
1.2.1: Global overview of the EC support to the education sector
1.2.2: EC’s “direct” support to the education sector
1.2.3: EC’s “indirect” support to the education
These sections are mainly descriptive, but provide also, where possible on the basis of informationcontained in the list of interventions extracted from CRIS, explanations of the observed outputs, orsuggest hypotheses or questions to be further investigated in the next stages of the evaluation.
All the figures presented below have been obtained using the Common Relex Information System(CRIS). The approach developed by the evaluation team to compile this inventory as well as the limitsto take into account are presented in detail in the annexes (section 11). The financial figures used areall contracted amounts, i.e. the amounts related to the contract signed between the EC and aspecific “contractor” for the implementation of an intervention. Figures on the disbursements from theEC to the “contractors” are also provided, i.e. the payments effectively done by the EC to the“contractors” on the amount contracted. They concern all payments made since the signature of thecontract until the date of the data extraction from CRIS (10 June 2009) by the evaluation team.3
1.2.1 Global overview of the EC support to the education sector
As mentioned earlier, the thematic scope of the present evaluation is the education sector, with theexception of HE and VET.
For the sake of the global overview, the evaluation team deemed it however useful to also presentfinancial contributions including HE and VET, notably with a view to situating the thematic scope of theevaluation in the broader context of the entire support of the EC to the education sector.
The figure below presents the global overview of all EC financial contributions to the education sector,as defined in the thematic scope of the evaluation, from 2000 to 2007. It also includes the financialcontributions towards HE and VET.
Figure 1: Global overview of EC financial contribution to the education sector
“Indirect” support
General BudgetSupport ~ €4bn
Type of intervention
Educationsector
interventions“Direct”support
Type of support
~ €1.9bn
Individualprojects
Support to sectorprogrammes
(excluding SBS)
Sector BudgetSupport (SBS)
Financing ofTrust Funds
€1027mincl HE&VET
€921mincl HE&VET
€623mincl HE&VET
€197m
GBS with referenceto education
~ €3.2bn
Full amounteducationspecific
(1)
(1)This concerns GBS which refers through performance indicators or stated objectives to the education sector, among others. No statementcan be made on the share of the €3.2bn that effectively went to the education sector
€894m
€419m
€404m
€204mincl HE&VET
~€2.8bnincl HE&VET
Financial support of the Commission
3 This is the only information on disbursements available in the data extraction from CRIS. The actualdisbursements from the “contractors” to the final beneficiary are not available in CRIS. The dates of the paymentsare also not available in the data extractions from CRIS. Only the sum of all payments done from the signature ofthe contract until the date of the data extraction from CRIS is available.

Thematic global evaluation of European Commission support to the education sector in partner countries(Including basic and secondary education); Final Report Vol. IIb, December 2010; Particip GmbH
3
As shown, over the period 2000-2007, the EC contracted a total amount of around €1.9bn for directsupport to the education sector without HE and VET, using the following types of aid modalities:sector budget support, individual projects, support to sector programmes (excluding SBS) andfinancing of Trust Funds; they are discussed more in-depth further on. Of this amount, around€ 1.4 billion (i.e. 74% of the total amount contracted) was disbursed over the same period. Whentaking into consideration HE and VET, the total amount contracted by the EC over the period 2000-2007, through its “direct” support, was of around € 2.8 billion; of which € 2.1 billion (i.e. 75%) wasdisbursed. The EC financial contributions supporting the sectors that fall within the scope of thisevaluation (thus not including HE and VET) represent 69% of the total amount contracted by the ECfor the entire education sector.
A substantial part of the GBS provided by the EC can be considered as indirect support to theeducation sector. Over the period 2000-2007, a total amount of around € 4 billion has been transferredto national governments of beneficiary countries under GBS operations. Out of this total amount,around € 3.2 billion concerned GBS for which the EC referred, among other sectors, to the educationsector. It is important to underline that it cannot be stated that this amount went to theeducation sector; it can only be stated that the amount refers to those GBS for which the EC inone way or another pursued goals for the education sector, among other sectors. As forGeneral Budget Support, no statement can be made on the share of the €3.2bn that effectivelywent to the education sector.
Detailed evolutions and breakdowns of these financial contributions to the education sector arepresented in the following sections. Although they are not in the direct scope of this evaluation,comparisons with the entire education sector (i.e. including HE and VET) are provided when deemeduseful to place the subject of the evaluation in the wider perspective of the EC’s support to the entireeducation sector.
1.2.2 EC’s “direct” support to the education sector
1.2.2.1 Trends in the EC’s funding between 2000 and 2007
The figure below shows the trend in the amounts contracted over the period 2000-2007 for the directsupport to respectively the entire education sector and the education sector without HE and VET.
Figure 2: Trend in the amount contracted between 2000 and 2007 (€ million) for the educationsector (incl. and excl. HE and VET)
645
344407
235
81
534
339
190 265
129
233
326
580
148176
580
100
200
300
400
500
600
700
2000 2001 2002 2003 2004 2005 2006 2007
€m
yearSource: CRIS and ADE analysis
Education sectorTotal: ~ €2.8bn
Education sectorwithout HE & VETTotal ~ €1.9bn
Although the evolution over the whole evaluation period shows a serrated pattern, there is a globalupward trend of amounts contracted for the education sector. Indeed, between 2000 and 2007 theamounts evolved from € 190 million to € 534 million for the entire education sector and from€ 129 million to € 326 million without HE and VET.

Thematic global evaluation of European Commission support to the education sector in partner countries(Including basic and secondary education); Final Report Vol. IIb, December 2010; Particip GmbH
4
1.2.2.2 Sector breakdown
The following figure provides a sector breakdown of the funds contracted by the EC to support theeducation sector. It is based on the four main sub-sectors of the DAC sector classification (education,level unspecified, basic education, secondary education, post-secondary education). It shows theshare of the amounts contracted for interventions falling within the scope of the evaluation, i.e. theeducation sector without HE and VET, and for the entire education sector. As presented in Table 3(section 1.4.2.2.2), the DAC sector classification includes VET within secondary education and HEwithin post-secondary education. That explains the large difference of the share of secondaryeducation from the first pie (scope of the evaluation i.e. without VET and HE) to the second pie(including HE and VET).
Figure 3: Sector breakdown (including and excluding HE and VET) by main education sub-sector, contracts (€ million), 2000-2007
Basiceducation€1003m
Education,level unspecified
€869m
Secondaryeducation
€454m
Post-secondaryeducation
€449m
36%
31%
17%
16%
(1)
Source: CRIS and ADE analysis(1) All interventions (including sector programmes) that cover the entire education sector and that cannot be classif ied under a specif ic education sub-sectorNote:
Basiceducation€1003m
Education,level unspecified
€869m
Secondary education€42m
53%
45%
2%
(1)
Education sector (scope of the evaluation) Education sector (incl. HE & VET)
The figure shows that:
The main focus over the period 2000-2007 was on basic education (53% of the total amountcontracted or € 1 billion);
There was also an important emphasis (45% of the funds contracted) on the so-called“education, level unspecified” as defined by the DAC sector classification (see section 1.4.1).This sub-sector includes interventions for the support of education policy and administrativemanagement, education facilities and training, teacher training, educational research and alsosector programmes that cover the entire education sector and that cannot be classified underanother education sub-sector;
Secondary education, taking into account the scope of the evaluation, represents a small shareof the amounts contracted by the EC (only 2% or € 42 million);
However, with higher education and vocational training included in the total amount contracted,secondary education (which includes vocational training as defined in the DAC classification)and post-secondary education represent respectively 17 and 16%.
The figure below shows the trend in the amounts contracted over the period 2000-2007 by maineducation sub-sector (without HE and VET).

Thematic global evaluation of European Commission support to the education sector in partner countries(Including basic and secondary education); Final Report Vol. IIb, December 2010; Particip GmbH
5
Figure 4: Trend in the amounts contracted (€ million) between 2000 and 2007 by maineducation sub-sector (without HE and VET)
0
50
100
150
200
250
300
350
2000 2001 2002 2003 2004 2005 2006 2007
Basic education
Education, levelunspecified
Secondaryeducation
Total amount contracted2000-2007
~ €1.9bn
€m
yearSource: CRIS and ADE analysis
Further breakdown by detailed education sub-sectors is presented here below. Where possible,interventions have been classified under one of the detailed sub-sectors4.
Figure 5: Sector breakdown by detailed education sub-sector (without HE and VET), contracts2000-2007
Primary education
Basic education
Education facilities and trainingEducation policy and administrative management
Education, level unspecified
Source: CRIS and ADE analysis
secondary educationBasic life skills for youth and adults
38%
37%
12%
4%3%2%
Teacher training (1%)Early childhood education (0.5%)
Educational research (0.5%)
(1)
(1)
(2)
(2) All interventions supporting basic education but that cannot be further classif ied under a sub-sector of basic education
All interventions (including sector programmes) that cover the entire education sector and that cannot be classif ied under aspecif ic education sub-sector
2%
4 Some interventions could not be classified under a detailed sub-sector and were thus classified under one of themain education sub-sectors mentioned above. For instance, the intervention entitled “Support to basic education”in Lao People’s Democratic Republic has been classified under the main sub-sector “basic education”. Indeed,according to the data extracted, no further information could indicate whether it was related specifically to onedetailed sub-sector related to basic education, i.e. primary education or basic life skills for youth and adults orearly childhood education.

Thematic global evaluation of European Commission support to the education sector in partner countries(Including basic and secondary education); Final Report Vol. IIb, December 2010; Particip GmbH
6
The sector breakdown by detailed education sub-sector shows the following:
Primary education is the most important sub-sector supported by the EC after the category“education, level unspecified”5. It represents 37% (€714m) of the total amount contracted forthe entire education sector.
Relatively small amounts were contracted for the other education detailed sub-sectors such aseducation facilities and training, secondary education, basic life skills for youth and adults, etc.
1.2.2.3 Geographical breakdown
Two types of geographical breakdown are provided hereafter: a regional and a country breakdown.
The regional breakdown of the EC support the education sector with and without HE and VET ispresented in the figures below.
Figure 6: Regional breakdown, education sector with and without HE and VET, contracts (€million), 2000-2007
Source: CRIS and ADE analysis(1) MULTI REGION: covering several regions or unspecif ied locationNote:
Regional breakdown for the educationsector (scope of the evaluation)
Regional breakdown for the educationsector including HE & VET
ACP€758m
ENP - MEDA€189m
ASIA€735m
LATIN AMERICA€186m
ENP - TACIS€14m
MULTIREGION
€32m
40%
37%
10%
10%
2%1%
ACP€959m
ENP - MEDA€450m
ASIA€879m
LATIN AMERICA€379m
ENP - TACIS€73m
MULTIREGION
€34m
35%
32%
15%
14%
3%1%
(1) (1)
As shown in the figure, the main regional focus of the EC support to the education sector without HEand VET is in ACP (40% or €758m) and in Asia (37% or €735m). For the other regions, relativelysmaller amounts have been contracted over the evaluation period: €189m in ENP-MEDA, €186m inLatin America, €32m for the category “multi region” and €14m in ENP-TACIS.
When including HE and VET, the relative shares of ACP and ASIA decrease whereas the ones for theENP-MEDA, Latin America and ENP-TACIS increase.The disbursement6 rates by region on theamounts contracted during the period 2000-2007 are displayed in the figure below.
5 This category includes all interventions that cover the entire education sector and that cannot be classified undera detailed education sub-sector. It is included in the figure to reflect the correct share of the detailed sub-sectorsbut does not give much insight in terms of education sub-sectors supported by the EC.6 CRIS provides the sum of all payments made on the contracted amount for each intervention from the signatureof the contract until the date of the data extraction by the evaluation team. The data extractions have been madeby the evaluation team on 10 June 2009. Therefore the amounts of disbursement presented in the figures beloware the sum of all payments made by the EC for contracts signed between 2000 and 2007 (the evaluation period)until 10 June 2009. For instance, the amount disbursed extracted from the EC database for a contract signed in2007 would be the sum of the payments made from 2007 to 10 June 2009 and not the payments only made in2007.

Thematic global evaluation of European Commission support to the education sector in partner countries(Including basic and secondary education); Final Report Vol. IIb, December 2010; Particip GmbH
7
Figure 7: Disbursement levels by region, education sector without HE and VET, 2000-2007
Source: CRIS and ADE analysis
758 735
189 186
32 14
617
446
147182
16 130
200
400
600
800
ACP ASIA ENP - MEDA LATIN AMERICA MULTI REGION ENP - TACIS
Total amount contracted
Total amount paid€m
Disbursementrate: 81%
Disbursementrate: 78%
Disbursementrate: 61%
Disbursementrate: 98% Disbursement
rate: 49%Disbursement
rate: 92%
The highest disbursement rates can be observed for Latin America reaching nearly 100% and ENP-TACIS, 92%. ACP and ENP-MEDA have a disbursement rate of around 81%, Asia 78% and thecategory “multi region” only 49%. The rationale behind these disbursement rates will have to be furtheranalysed in the evaluation but the analysis of the data extracted shows that, for instance, in LatinAmerica, the great majority of funds have been contracted in 2000 for the reconstruction of schoolsfollowing the Mitch Hurricane, under the PRRAC - Programa de Reconstruccion Regional paraAmerica Central. At the date of the data extraction by the evaluation team (10 June 2009), theseamounts had been fully disbursed.
The relative weight of the amounts contracted for education interventions (without HE and VET) byregion compared to the total amount contracted for all interventions in each region depicts as follows7:
For ACP countries, 3.3% of the total amount contracted under the EDF have supportededucation interventions during the period 2000-2007.
For Asian countries, 19.4% of the total amount contracted under the geographical budget lineAsia and DCI-Asia during the period 2000-2007 contributed to support the education sector.
For MEDA countries, 3.5% of the total amount contracted during the period 2000-2007 underthe budget lines MEDA 1 and 2 focused on the education sector (without HE and VET).
For Latin America countries, 8% of the total amount contracted under the ALA budget linesupported education interventions during the period 2000-2007.
For TACIS countries, 0.5% of the total amount contracted under the TACIS budget line wasdedicated to support the education sector (without HE and VET).
In terms of country breakdown, for reasons of presentation, the table below shows the 18 largestrecipient countries of EC funds to support the education sector without HE and VET. The full list ofcountries (119 countries) is presented in section 1.4.6. The table provides also the share of the
7 In order to calculate the relative weight, the only data available was the data extracted from CRIS by theevaluation team at the time of the elaboration of the inventory (10 June 2009). This data concerns all theinterventions contracted by the EC between 2000 and 2007 and among others the geographic budget lines suchas EDF (for ACP); MED (for MEDA); ALA and DCI-ALA (for Latin America); ASIA and DCI-ASIA (for Asia); andTACIS (for Tacis). The relative share of the EC support to the education sector by region has thus beencalculated by taking the total amount contracted between 2000 and 2007 by geographical budget line and theamount of the direct support of the EC to the education sector for these geographical budget lines, as in theinventory elaborated by the evaluation team. The financial contributions under these geographical budget linescover 90% of the total amount contracted for the education sector. The remaining 10% are from thematic budgetlines.

Thematic global evaluation of European Commission support to the education sector in partner countries(Including basic and secondary education); Final Report Vol. IIb, December 2010; Particip GmbH
8
amount contracted by country on the total amount contracted, the total amount disbursed by countryand the disbursement rate on the amount contracted by country.
Table 1: Country/region breakdown, education sector without HE and VET, 2000-2007
Country/regionAmount
contracted(€m)
% on totalamount
contracted
Amountdisbursed
(€m)
Disbursementrate
INDIA 355 19% 203 57%BANGLADESH 141 7% 81 58%PAKISTAN 110 6% 71 65%ACP COUNTRIES 78 4% 50 64%NICARAGUA 73 4% 72 98%TANZANIA 70 4% 50 72%TUNISIA 70 4% 58 83%JORDAN 67 4% 41 61%DOMINICAN REPUBLIC 57 3% 46 81%HONDURAS 52 3% 51 97%BOTSWANA 51 3% 41 79%SUDAN 51 3% 50 99%INDONESIA 40 2% 15 38%ERITREA 37 2% 18 49%NAMIBIA 34 2% 27 80%UGANDA 33 2% 33 98%ALL COUNTRIES 32 2% 16 49%HAITI 32 2% 30 95%VIETNAM 28 1% 24 85%CAMBODIA 27 1% 25 93%OTHER 475 25% 418 88%TOTAL 1.914 100% 1.420 74%
Source: CRIS and ADE analysisNote: “Other” includes 91 other countries presented in section 1.4.6
As shown, together the 18 main recipient countries (not including the categories “ACP countries” and“all countries”8) represent 69% of the funds. Among them the biggest beneficiaries by far are India,Bangladesh and Pakistan, accounting together for 32% of the total funding, the remaining countriesreceiving each between 1 to 4% of the total funding.
1.2.2.4 Breakdown by type of modality used by the EC to deliver its aid
As described in section 1.4.2.2.2, the EC delivered its “direct” support to the education sector throughSBS, individual projects, support to sector programmes excluding SBS (SSP), and the financing oftrust funds (including the FTI). The figure below shows the share of these four modalities on the totalamount contracted to support the education sector without HE and VET.
8 The categories “ACP countries” and “all countries” are defined as such in CRIS. The first category containsinterventions covering more than one country in the ACP region. The second category contains interventionscovering more than one country without a specific regional focus or interventions with an unspecified location.

Thematic global evaluation of European Commission support to the education sector in partner countries(Including basic and secondary education); Final Report Vol. IIb, December 2010; Particip GmbH
9
Figure 8: Breakdown of modalities used by the EC to delivery its aid, contracts (€ million),education sector without HE and VET, 2000-2007
Source: CRIS and ADE analysisNote: SBS: Sector Budget Support ; Individual projects: individual projects ; Support to sector programmes: sector policysupport programme other than SBS ; Financing of Trust Funds - FTI: WB Trust Funds and Fast Track Initiative – Catalytic Fund
SBS€894m
Individualprojects€419m
Support to sectorprogrammes
€404m
Financing of Trust Funds(including FTI)
€197m
47%
22%
21%
10%
Total amount contracted2000-2007
~ €1.9bn
It appears that:
Nearly half (47%) of the EC’s funds to the education sector were delivered through SBSoperations;
The financing of individual projects was the second largest modality used by the EC to deliverits aid to support the education sector. It represented 22% of the total amount contracted.
The EC supported also education sector policy programmes of beneficiary countries that arenot delivered through sector budget support. This modality represented 21% of the totalamount contracted by the EC.
For the education sector, the financing of trust funds (10% of the total amount contracted)concerned mainly the EC’s contribution to the FTI.
The evolution of amounts contracted through the four different modalities is presented in the figurebelow.

Thematic global evaluation of European Commission support to the education sector in partner countries(Including basic and secondary education); Final Report Vol. IIb, December 2010; Particip GmbH
10
Figure 9: Trend of the amount contracted by modality used by the EC to deliver its aid,contracts (€ million), education sector without HE and VET, 2000-2007
40
200
83
327
83
1936
104
56
13
39
86
515876
143
20
71
10
4126 5444
152
127
63
0
50
100
150
200
250
300
350
2000 2001 2002 2003 2004 2005 2006 2007
SBSIndividual projectSupport to sector programmesFinancing of Trust Funds
€m
Source: CRIS and ADE analysis
Total amount contracted2000-2007
~ €1.9bn
There is an uneven trend by modality over the period 2000-2007:
High amounts of funds have been contracted through SBS in 2002 and 2003 and in 2006 and2007 compared to the other modalities;
Since 2000 there was a trend towards an increase of SSP, with a notable peak in 2004 and adecrease in 2007 compared to 2006.
The use of trust funds started in 2005 and slightly increased in 2006 and 2007;
The use of individual projects has decreased from 2000 to 2002, but has then again reachedhigher levels to become even the second most used modality in 2006, with again a decrease in2007, but still remaining at a level higher than those between 2001 and 2005.
Here again, it will be important for the evaluation to provide insights on these evolutions and notablyon the switching and/or combined use of different aid modalities. As explained in section 1.2.3, it willalso be essential in this respect to take into account the use of GBS relevant to the education sector.
The levels of the EC disbursements on the amount contracted over the period 2000-2007 per type ofmodality are shown in the figure below.
Thematic global evaluation of European Commission support to the education sector in partner countries(Including basic and secondary education); Final Report Vol. IIb, December 2010; Particip GmbH
11
Figure 10: Disbursement levels by modality used by the EC to implement its aid, educationsector without HE and VET, 2000-2007
Source: CRIS and ADE analysis
894
419 404
197
630
340 314
135
0
200
400
600
800
1000
SBS Individual project Support to sectorprogrammes
Financing of Trust Funds
Total amount contracted
Total amount paid
€m Disbursementrate: 70%
Disbursementrate: 81% Disbursement
rate: 78%
Disbursementrate: 69%
With 81% of disbursements on the amount contracted the financing of individual projects depicts thehighest disbursement rate, followed by the support to sector programmes excluding SBS (78%), SBS(70%) and the financing of trust funds (69%). As mentioned above, disbursement levels are based onthe payments done by the EC from the signature of the contract until the date of the data extractionfrom CRIS. As high amounts of funds have been contracted through SBS and Trust Funds at the endof the evaluation period (2006 and 2007), the funds might not have been fully disbursed. They mighthave been disbursed after the date of the data extraction from CRIS (10 June 2009).
1.2.2.5 Breakdown by channel used by the EC to implement its aid
The EC used different channels to implement its “direct” support to the education sector. Thisinformation is available in the EC database for most of the interventions9 but only the name of thechannel (e.g. “The World Bank”, or “Republic of Botswana”, or “Save the Children federation”) isencoded and not the category of the channel, e.g. whether it is a non-governmental organisation(NGO), an international organisation or a private company. Therefore, the evaluation team has firstdefined the category of channels that the EC can use to implement its aid. Then, the team attributed toeach name of channel one of the following categories:
Beneficiary countries’ national governments,
Private companies or development agencies acting as such,
Development Banks,
UN bodies,
NGOs,
Research and educational institutions,
Other (including federations, municipalities, associations and individuals for scholarships).
The figure below shows the breakdown of the amount contracted for education sector interventions forthese seven categories. 10
9 The evaluation team’s data extractions in CRIS for the education sector showed that out of 2,174 interventions,287 interventions had no names of channels encoded.10 An eighth category has been defined by the evaluation team: “Not encoded in CRIS”. This category includes allinterventions for which no name of channel was mentioned in CRIS. Without a name of channel, theseinterventions could not be classified under one of the seven categories. This category is different from thecategory “other” which includes all interventions that have a name of channel but do not fall within one of the othercategories.

Thematic global evaluation of European Commission support to the education sector in partner countries(Including basic and secondary education); Final Report Vol. IIb, December 2010; Particip GmbH
12
Figure 11: Breakdown by channel used by the EC to deliver its aid, contracts (€ million),education sector without HE and VET, 2000-2007
Source: CRIS and ADE analysisNote: Other: federations, municipalities, individuals (for scholarships), associations and unidentif iable names
Governments
Private companies/developmentagencies
DevelopmentBanks
Research and educationinstitutions1%1%4%
4%
9%
12%
17%
52%
NGO
UN bodiesNot encoded in CRIS
Other
As shown in the figure, more than half of the total amount contracted by the EC to support theeducation sector goes through national governments of beneficiary countries (which is coherent withthe relative weight of SBS). Development banks are the second main channel used by the EC todeliver its aid (17%). This includes mainly the World Bank for the FTI but also the Asian DevelopmentBank for large interventions in Bangladesh and Pakistan. NGOs (12%), privatecompanies/development agencies acting as such (9%) and the UN bodies (4%) are the three othermain channels used by the EC.
In terms of disbursement, the following figure shows the EC’s disbursement rate by category ofchannel11.
Figure 12: Disbursement levels by channel used by the EC to deliver its aid, education sectorwithout HE and VET, 2000-2007
Source: CRIS and ADE analysis
1.025
334
186 16871
15
747
219149 145
39 130
200
400
600
800
1.000
Governments DevelopmentBanks
NGO Privatecompanies /development
agencies
UN bodies Research andeducationinstitutions
Total amounts contracted
Total amount paid
€m
Disbursementrate: 73%
Disbursementrate: 66%
Disbursementrate: 80% Disbursement
rate: 86%Disbursement
rate: 55% Disbursementrate: 91%
11 This figure does not show the disbursement rate of the category of channels themselves for the implementationof the activities

Thematic global evaluation of European Commission support to the education sector in partner countries(Including basic and secondary education); Final Report Vol. IIb, December 2010; Particip GmbH
13
Research and education institutions show the highest disbursement rates (91%), followed by privatecompanies or development agencies acting as such (86%), while the rates through governments andNGO are respectively of 80% and 73%. Development banks (66%) and the UN bodies (55%) rank withthe lowest rates. For disbursement rate through Development banks, it mainly concerns contribution tothe FTI Catalytic Funds managed by the WB that have only been contracted at the end of theevaluation period (2006 and 2007) and might have not yet been disbursed at the date of the dataextraction.
1.2.2.6 Breakdown by region and sector
Further breakdowns using combinations of the various dimensions presented above allow a betterunderstanding of the EC support to the education sector. The figure below presents the regionalbreakdown by main education sub-sector that lies within the thematic scope of the evaluation, i.e.without HE and VET. However, for this particular breakdown, it is also interesting to examine theresults including HE and VET in order to understand better the sector focus of the EC in the differentregions. Therefore an additional figure, including HE and VET is also presented below.
Figure 13: Regional breakdown by main education sub-sector without HE and VET, contracts (€million), 2000-2007
Source: CRIS and ADE analysis
281
595
73
20 6
472
139
86
160
85 130
6 00
100
200
300
400
500
600
ACP ASIA ENP - MEDA LATIN AMERICA ENP - TACIS
Basic education
Secondary education
€m
Education, level unspecif ied(1)
(1)Excluding all interventions for vocational training, which is out of the thematic evaluation scope
The figure shows variation in the focus by region:
The main focus in ACP was on interventions covering the entire education sector of a country(sub-sector “education, level unspecified”) and on basic education (respectively 62 and 37% ofthe total amount contracted in the region), which includes mainly primary education.
In Asia, a large majority of funds went to basic education (81%).
In both ACP and Asia, the share of secondary education was only marginal (less than 1%).
ENP-MEDA received fewer funds for basic education and education level unspecified thanACP and Asia but secondary education is more supported than in the other regions amountingto 16% of the funding.
In Latin America the majority of funds concern the “level unspecified” category, while only 11%and 3 % went to respectively basic and secondary education;
In ENP-TACIS, shares of comparable magnitude went to both basic education and “education,level unspecified” (respectively 44 and 54%).
Including the HE and VET allows to reflect other EC priorities in terms of education sector in thedifferent regions, as shown in the figure below.

Thematic global evaluation of European Commission support to the education sector in partner countries(Including basic and secondary education); Final Report Vol. IIb, December 2010; Particip GmbH
14
Figure 14: Regional breakdown by main education sub-sector including HE and VET, contracts(€ million), 2000-2007
Source: CRIS and ADE analysis
281
595
73
20 6
472
139
86
160
8
113
32
224
6519
93114
67
134
40
0
100
200
300
400
500
600
ACP ASIA ENP - MEDA LATIN AMERICA ENP - TACIS
Basic education
Secondary education
€m
Education, level unspecif ied
Post-secondary education
Including HE and VET does not substantially change the picture for the ACP and ASIA region, butprovides another ranking of priorities for the other regions:
In the ACP region, the main focus remains clearly on basic education and on the “education,level unspecified”;
In Asia, the main focus remains on basic education but post-secondary education is nearly asimportant as the “education, level unspecified”
In the ENP-MEDA region the picture is different: secondary education becomes by far the mostimportant, notably through the support to vocational training (50% of the total amountcontracted in the region);
In Latin America, the picture also changes: the cumulative support to secondary and post-secondary education is nearly equal to the combined support to basic education and“education, level unspecified”;
In ENP-TACIS, even if the support is smaller in terms of amounts contracted, the main priorityof the EC is on secondary and post-secondary education (81% for both).
1.2.2.7 Breakdown by region and type of modality
The breakdown by region and type of modality used by the EC to deliver its “direct” support to theeducation sector without HE and VET is presented here below. Here again, differences can beobserved when including HE and VET, which is shown in the next figure.

Thematic global evaluation of European Commission support to the education sector in partner countries(Including basic and secondary education); Final Report Vol. IIb, December 2010; Particip GmbH
15
Figure 15: Regional breakdown by type of modality, contracts (€ million), education sectorwithout HE and VET, 2000-2007
Source: CRIS and ADE analysis
263
403
137
91
158 158
13
70
14
183157
3925
154
17
0
100
200
300
400
ACP ASIA ENP - MEDA LATIN AMERICA ENP - TACIS
€m SBS
Support to sector programmes
Financing of TF
Individual project
With some exceptions, the patterns observed at global level are confirmed throughout the regions:
SBS, which is globally the main modality used, is also the main modality used in each region,except ENP-TACIS (35% of the total amount contracted in ACP, 55% in Asia, 72% in ENP-MEDA and 49% in Latin America);
As at the global level, the financing of individual projects is also the second main modality usedby the EC, except in ENP-MEDA where the support to sector programmes excluding SBS isbudget-wise more important than the individual projects (7% for the individual projects and 21%for SSP);
SSP is the third most important modality (except for ENP-MEDA as mentioned above);
The focus of support via Trust funds for education lies in the ACP countries.
The figure below depicts the same breakdown but including HE and VET:
Figure 16: Regional breakdown by type of modality, contracts (€ million), education sectorincluding HE and VET, 2000-2007
Source: CRIS and ADE analysis
320
403
213
91
248
299
60
234
73
236
161 172
54
156
17 50
100
200
300
400
ACP ASIA ENP - MEDA LATIN AMERICA ENP - TACIS
€m SBS
Support to sector programmes
Financing of TF
Individual project
The main differences when including HE and VET compared to the previous figure are that:
The financing of individual projects in Latin America becomes the main modality used with 62%of the total amount contracted in that region compared to 24% for SBS;

Thematic global evaluation of European Commission support to the education sector in partner countries(Including basic and secondary education); Final Report Vol. IIb, December 2010; Particip GmbH
16
In ENP-MEDA, the use of SSP is considerably more important than in the previous figure andnearly equals the use of SBS (respectively 38% and 47%).
1.2.2.8 Breakdown by sector and type of modality
It is interesting here again to analyse the breakdown by sector and type of modality for the educationsector excluding and including HE and VET. It allows understanding better the different modalitiesused by the EC when supporting the thematic scope of the evaluation and those used for the rest ofthe education sector. The following two figures present these differences:
Figure 17: Sectoral breakdown by type of modality, contracts (€ million), education sectorwithout HE and VET, 2000-2007
Source: CRIS and ADE analysis
469
395
30
202 209
7
215184
4
11780
0
100
200
300
400
500
Basic education Education, level unspecified Secondary education
SBS
Support to sector programmes
Financing of TF
€m
Individual project
(1)
(1)Excluding all interventions for vocational training, which is out of the thematic evaluation scope
SBS is the main modality used to deliver support to the three sub-sectors, followed by indvidualprojects and support to sector programmes excluding SBS. This is again coherent with whatwas observed at a more global level;
The financing of TFs does not intervene for secondary education.
As shown in the figure below, the picture is rather different when including HE and VET.
Figure 18: Sectoral breakdown by type of modality, contracts (€ million), education sectorincluding HE and VET, 2000-2007
Source: CRIS and ADE analysis
469
395
89 73
202 209175
335
215184 190
34
11780
70
100
200
300
400
500
Basic education Education, level unspecified Secondary education Post-secondary education
SBS
Support to sector programmes
Financing of TF
€m
Individual project

Thematic global evaluation of European Commission support to the education sector in partner countries(Including basic and secondary education); Final Report Vol. IIb, December 2010; Particip GmbH
17
Including HE and VET provides the following insights:
SBS is not the priority modality used for the vocational training component of secondaryeducation. Indeed, whereas it was the preferred modality when vocational training was notincluded, the main modalities used are now SSP (42%) and individual projects (38%);
A similar observation can be made for post-secondary education, where the emphasis onindividual projects is by far the biggest (75%).
1.2.3 EC’s “indirect” support to the education sector: General Budget Support
During the period 2000-2007, the EC has financed a total number of 98 GBS operations in 43countries12 falling within the geographical scope of this evaluation. The total amount actuallytransferred to the beneficiary countries’ national treasury for these GBS operations was around€4bn13.
Out of these 98 GBS operations, 73 had a reference to the education sector expressed by theirperformance indicators, when available in the FA, or by their stated objectives. This concerned 37countries. In financial terms, the 73 GBS represented around €3.2bn, i.e. 81% of the total fundstransferred by the EC through GBS. It should be re-emphasised that as it concerns GeneralBudget Support, no statement can be made on the share of the €3.2bn that effectively went tothe education sector.
Section 1.4.4 presents the 98 GBS financed by the EC, indicating whether they have a reference tothe education sector or not. Additional information is provided on the decision reference, thebeneficiary country, the year of the first transfer by the EC, the status (closed or on-going) of the GBSand the total amount transferred for each GBS operation from the date of the first transfer up to 2007(end date of the current evaluation period).
The figure below shows the trend in the amounts transferred through GBS between 2000 and 2007. Itpresents separately all the GBS operations (98 for a total amount of €4bn) and those referringexplicitly to the education sector (73 for a total amount of €3.2bn).
Figure 19: Trend in the amounts transferred through GBS (€ million), 2000-2007
562
472
151
789
354
179
374
453
780
264
352
475421
618570
345
0
100
200
300
400
500
600
700
800
2000 2001 2002 2003 2004 2005 2006 2007
€m
yearSource: CRIS and ADE analysis
GBSTotal: ~ €4bn
GBS withreference toeducation
Total ~ €3.2bn
Financing of GBS operations increased from 2000 to 2003 reaching an annual amount of around€780m for the years 2002 and 2003. From 2004, financing through GBS funds has decreased until
12 In some countries, more than one GBS operation has been financed by the EC over the period 2000-2007.13 This amount represents the funding that the beneficiary countries have actually received in their nationaltreasury in order to support their national development strategy. It does not include the amounts contracted by theEC for technical assistance, audits or evaluations linked to the GBS.

Thematic global evaluation of European Commission support to the education sector in partner countries(Including basic and secondary education); Final Report Vol. IIb, December 2010; Particip GmbH
18
2007 (except for an increase in 2005), with €374m in 2007. GBS that have a reference to theeducation sector followed the overall trend.
The following table shows the country breakdown of funds transferred by the EC through GBSoperations, focusing on the GBS operations with a reference to the education sector. The greatmajority of the GBS funds were transferred to ACP countries. Out of the 37 countries that benefitedfrom GBS with a reference to the education sector, 35 are part of the ACP countries, one of the ENP–MEDA region and one is located in Latin America. The six main beneficiary countries accounted fornearly 50% of the GBS referring to education.
Table 2: Country/regional breakdown of GBS with a reference to the education sectorRegion/Country Amount
transferred (€million)
% on total amounttransferred
ACP RegionMozambique 370 11,59%Burkina Faso 314 9,84%Zambia 279 8,72%Tanzania 226 7,07%Ghana 182 5,68%Mali 173 5,43%Niger 155 4,84%Rwanda 145 4,52%Uganda 157 4,90%Kenya 137 4,29%Madagascar 118 3,70%Ethiopia 118 3,69%Jamaica 102 3,20%Benin 88 2,75%Sierra Leone 77 2,41%Senegal 75 2,36%Malawi 63 1,97%Chad 54 1,69%Burundi 43 1,35%Dominican Republic 38 1,18%Central African Republic 30 0,95%Cape verde 25 0,77%Haiti 20 0,63%Mauritania 15 0,48%Lesotho 15 0,45%Turcs & Caico 11 0,33%Papua New Guinea 10 0,31%Gambia 9 0,27%Djibouti 8 0,24%Ivory Coast 5 0,16%Vanuatu 4 0,12%Gabon 3 0,11%Guyana 3 0,10%Sao Tomé-et-Principe 3 0,08%Guinea Bissau 1 0,04%ENP - MEDA RegionWest Bank and Gaza strip 98 3,07%Latin America RegionParaguay 23 0,72%TOTAL 3.196 100,00%

Thematic global evaluation of European Commission support to the education sector in partner countries(Including basic and secondary education); Final Report Vol. IIb, December 2010; Particip GmbH
19
1.3 SummaryThis section proposes a wrap-up of the information provided by the inventory and typology in aschematic and detailed listing of facts and findings.
Between 2000 and 2007, the EC supported the education sector through direct and indirect support:
Direct support to the education sector amounted to around €1.9bn.
Indirect support in the form of GBS with reference to the education sector, among others,amounted to €3.2bn (no statement can be made on the share of the €3.2bn that effectivelywent to the education sector) and concerned 37 of the 43 countries to which the EC providedGBS.
The thematic scope of the evaluation represents 69% of the total direct support of the EC tothe sector.
The following trends can be observed:
Direct support (with and without HE & VET) showed a serrated pattern, but with a trendtowards increase (from levels of €129m in 2000 to €580m and €326m in 2006 and 2007);
GBS referring to the education sector follows, in broad lines, the overall trend of GBS, i.e. acontinuous increase from 2000 to 2003 (from €151m to €618m) followed by a continuousdecrease (except in 2005) to a level of €264m in 2007;
In terms of geographical spread of GBS with reference to the education sector, among others:
o GBS concerned 37 countries, all in the ACP region, except one in the ENP-MEDAregion and one in Latin America;
o The six main beneficiary countries accounted for 48.33% of the GBS referring toeducation, among other sectors.
With respect to the different aspects of direct support:
1) In terms of sub-sectors:
Direct support focused on basic education (53% of which 37% concerned primary education)and on support to the education sector as a whole (45%), much less on secondary education(2%);
The evolution of the support to the different sub-sectors is characterized by strong increasesand decreases, the peak for secondary education being in 2006.
2) In terms of geographic spread:
In absolute figures 77% of the direct funding went to the ACP (40%) and Asia region (37%),smaller shares (each time 10%) to respectively ENP-MEDA and Latin America;
In relative terms compared to the EC’s overall external assistance for each region, Asia andLatin America are the main regions benefiting from the EC’s support to education (respectively19.4% and 8% of the total amount contracted in these regions is for the education support).The EC support to education, in relative terms, represents 3.5% in MEDA, 3.3% in ACP and0.5% in TACIS.
69% of the funds went to 18 countries, three Asian countries alone accounting for 32% of thefunding, the remaining 15 countries accounting for between 1 to 4%;
3) In terms of aid modalities:
SBS was by far the main modality used (47%), followed by individual projects (22%), SSP(21%) and financing of TFs (10%).
Over the period considered, the trend in use of modality has been uneven over the years, but:
o SBS is characterized by three main evolutions: A multiplication by 10 of the supportfrom 2001 to 2002 (from €20m to €200m); followed by a continuous decrease until alevel of €10m in 2005; and again an increase to levels of €327m and €143m in 2006and 2007.
o The use of individual projects approach remained at levels between €19m and €54muntil 2005 but then increased again to €104m and €56m in 2006 and 2007
o SSP use increased until 2004 becoming the main modality used in 2004;

Thematic global evaluation of European Commission support to the education sector in partner countries(Including basic and secondary education); Final Report Vol. IIb, December 2010; Particip GmbH
20
o The use of TFs started only in 2005, but already in 2007 it had become the secondmost important modality used.
4) In terms of channels:
More than half (54%) of the funds go through governments, which is in line with the relativeweight of SBS;
Development Banks (mainly World Bank (WB) and Asian Development Bank (ADB)) are thesecond most important channel (17%);
Other main channels used are: NGOs, private companies/ Development agencies acting assuch, and the UN.
5) In terms of disbursements:
The overall disbursement level of direct support was of 74%;
Disbursement rates varied by region, modality and channel.

Thematic global evaluation of European Commission support to the education sector in partner countries(Including basic and secondary education); Final Report Vol. IIb, December 2010; Particip GmbH
21
1.4 Appendix 1: Inventory details
1.4.1 List of education DAC sector codes and screening key words
This annex presents the DAC sector classification for the education sector. The sector codes (DAC 5code and CRS code), descriptions and clarifications come from the OECD web site. The so-called“DAC 5 code” and “CRS code” represent education sub-sectors. Each CRS code is related to one andonly one DAC 5 code. The clarifications of each CRS code are those defined by the OECD and werecomplemented by the information provided in the EGEval “Typology of action supported by the EC inthe Education sector” (2004). This study delineated the education sector and provided for each DACsector code additional clarifications for a more accurate classification of education interventionsfinanced by the EC.
The information provided by the OECD and the EGEval Typology for each DAC sector code was usedby the evaluation team as a basis to derive key words. They were then used to screen the ECinterventions titles in order to identify the relevant ones falling within the education sector. These keywords were used in English, French, Spanish and Portuguese.

Thematic global evaluation of European Commission support to the education sector in partner countries(Including basic and secondary education); Final Report Vol. IIb, December 2010; Particip GmbH
22
DAC 5CODE
CRSCODE
DESCRIPTION Clarifications / Additional noteson coverage from DAC
document, evaluation guidelinesand Egeval typology
Key wordsderived for each
DAC code
Screening keywords inENGLISH
Screening keywords inFRENCH
Screening keywords inSPANISH
Screening keywords in
PORTUGUESE
110 EDUCATION 111 Education,
levelunspecified
The codes in this category areto be used only when level ofeducation is unspecified orunknown (e.g. training ofprimary school teachers shouldbe coded under 11220).
EducationprogrammesEducation sectorISCED(InternationalStandardClassification)
*edu program**edu sect**educ**ISCED*
*sect* educ**program edu**éduc*
*set instru*
11110 Education policyandadministrativemanagement
Education sector policy,planning and programmes; aidto education ministries,administration and managementsystems; institution capacitybuilding and advice; schoolmanagement and governance;curriculum and materialsdevelopment; unspecifiededucation activities.Support to development ofnational educational planningsystems (EMIS= educationmanagement informationsystem)
Education sectorpolicyEducation policyEducationmanagementSchoolImprovementPlanSchoolDevelopmentPlanSchoolManagementcurriculummaterialdevelopmentEMIS
*Edu sect*poli**Edu manag**School**Curricul**EMIS*
*éducation sectpolit**gestioneducation**école**ecole*
*educación**escuela*
*instrução**escola*
11120 Educationfacilities andtraining
Educational buildings,equipment, materials; subsidiaryservices to education (boardingfacilities, staff housing);language training; colloquia,seminars, lectures, short-termtraining programmes in issuesrelated to educational facilitiesand procurement etc.
Education facilityDidacticBoardingcolloqlectureteach
*edu facil**didactic**boarding**colloq**lecture**teach*
*educationbâtiment**internat**enseign*
*colegi intern**enseñe**ensene*
*ensine*
11130 Teacher training Teacher education (where the Teacher train *pre-service*

Thematic global evaluation of European Commission support to the education sector in partner countries(Including basic and secondary education); Final Report Vol. IIb, December 2010; Particip GmbH
23
DAC 5CODE
CRSCODE
DESCRIPTION Clarifications / Additional noteson coverage from DAC
document, evaluation guidelinesand Egeval typology
Key wordsderived for each
DAC code
Screening keywords inENGLISH
Screening keywords inFRENCH
Screening keywords inSPANISH
Screening keywords in
PORTUGUESE
level of education isunspecified); in-service and pre-service training; materialsdevelopment.
TeachereducationPre-serviceIn-service
*preservice**in-service**inservice*
11182 Educationalresearch
Research and studies oneducation effectiveness,relevance and quality;systematic evaluation andmonitoring.
EducationresearchEducationeffectivenessEducationmonitoring
*edu research**edu eff* *edumoni*
*éducrecherche**éduc eff* *édumoni*
*edu invest* *instruçãopesquisa*
112 Basiceducation
Basic educationEducation for allInclusiveeducationtextbooksmother tongueilliteratelearning outcomePISACompletion rateProgression rate
*BESP**BESCSP**bas edu**EFA**inclusive edu**textbook**mothertongue**illiterate**learn* *PISA*
*édu bas**EPT* *cahier**illetr* *languematernel*
*libro* *lenguamaternal*
*bási instrução**livro* *lingüetade mãe*
11220 Primaryeducation
Formal and non-formal primaryeducation for children; allelementary and first cyclesystematic instruction; provisionof learning materials.
All elementary and first cycle(e.g. grades 1-4, 1-6, 1-7)depending on the country'seducation structure, the termbasic education is used in somecountries to refer to grades 1 -9education in the formal
PrimaryeducationFormal educationNon-formaleducationTeachingmaterialLearning materialElementaryUPE (UniversalPrimaryEducation)
*PEDAL**BPEP**DPEP* *primedu* *formedu* *teachmat* *learnmat* *UPE**pupil* *Fasttrack* *catalyticfund*
*édu prim* *éduform* *élève**scolair*
*prelimin**instru*
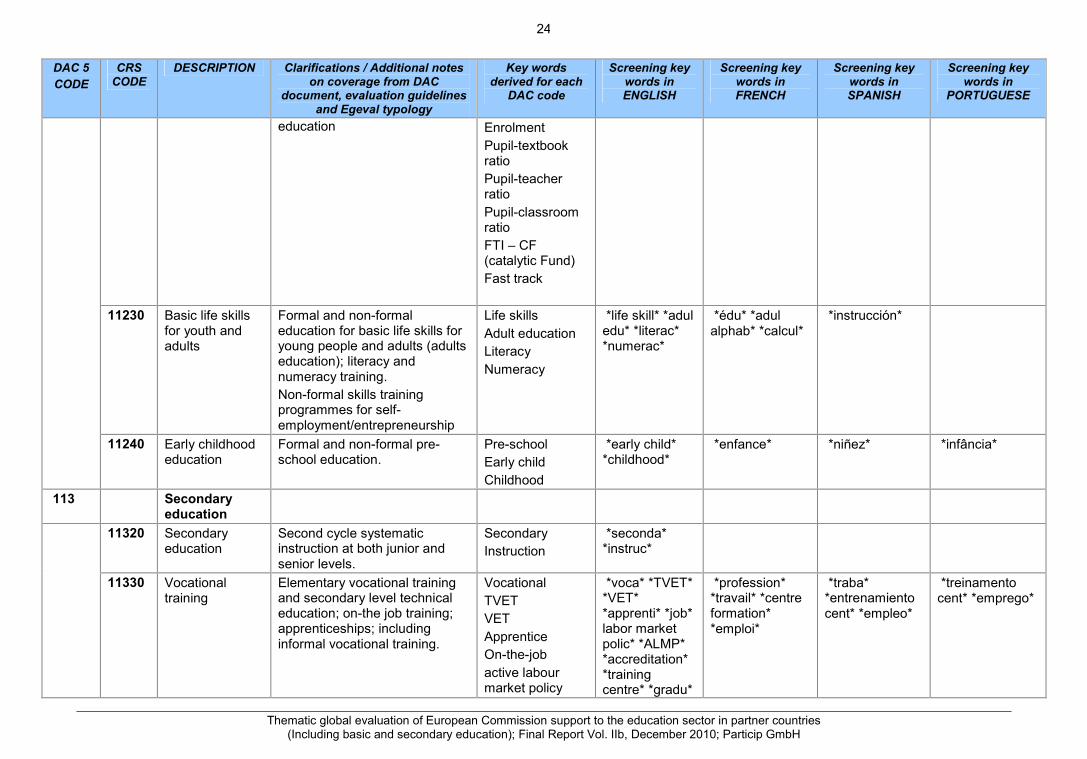
Thematic global evaluation of European Commission support to the education sector in partner countries(Including basic and secondary education); Final Report Vol. IIb, December 2010; Particip GmbH
24
DAC 5CODE
CRSCODE
DESCRIPTION Clarifications / Additional noteson coverage from DAC
document, evaluation guidelinesand Egeval typology
Key wordsderived for each
DAC code
Screening keywords inENGLISH
Screening keywords inFRENCH
Screening keywords inSPANISH
Screening keywords in
PORTUGUESE
education EnrolmentPupil-textbookratioPupil-teacherratioPupil-classroomratioFTI – CF(catalytic Fund)Fast track
11230 Basic life skillsfor youth andadults
Formal and non-formaleducation for basic life skills foryoung people and adults (adultseducation); literacy andnumeracy training.Non-formal skills trainingprogrammes for self-employment/entrepreneurship
Life skillsAdult educationLiteracyNumeracy
*life skill* *aduledu* *literac**numerac*
*édu* *adulalphab* *calcul*
*instrucción*
11240 Early childhoodeducation
Formal and non-formal pre-school education.
Pre-schoolEarly childChildhood
*early child**childhood*
*enfance* *niñez* *infância*
113 Secondaryeducation
11320 Secondaryeducation
Second cycle systematicinstruction at both junior andsenior levels.
SecondaryInstruction
*seconda**instruc*
11330 Vocationaltraining
Elementary vocational trainingand secondary level technicaleducation; on-the job training;apprenticeships; includinginformal vocational training.
VocationalTVETVETApprenticeOn-the-jobactive labourmarket policy
*voca* *TVET**VET**apprenti* *job*labor marketpolic* *ALMP**accreditation**trainingcentre* *gradu*
*profession**travail* *centreformation**emploi*
*traba**entrenamientocent* *empleo*
*treinamentocent* *emprego*

Thematic global evaluation of European Commission support to the education sector in partner countries(Including basic and secondary education); Final Report Vol. IIb, December 2010; Particip GmbH
25
DAC 5CODE
CRSCODE
DESCRIPTION Clarifications / Additional noteson coverage from DAC
document, evaluation guidelinesand Egeval typology
Key wordsderived for each
DAC code
Screening keywords inENGLISH
Screening keywords inFRENCH
Screening keywords inSPANISH
Screening keywords in
PORTUGUESE
ALMPAccreditationtraining centregraduateSMEJob centreInformal sectorwork-basedemploymentcompetitivenessenterpriseentrepreneurself-employmentemployabilityqualification
*SME**employment*
114 Post-secondaryeducation
Post-secondary
11420 Highereducation
Degree and diplomaprogrammes at universities,colleges and polytechnics suchas BA, MA and PhDprogrammes, MSc,programmes, teachersqualification (e.g.. diplomas),etc.
Overseas scholarships,fellowships such as post-graduate programmes, visitingprofessors
Higher educationPolytechnicUniversityCollegeDiplomaFacultyAcademicscientificresearchorganisationtechnologytransferlibrarycohort
*higher edu**polytechni**universi**colleg**diploma**facul**academ**scientificresearch**technolotransfer**librar**knowledge**brain drain*
*école sup**ecole sup**diplôme**recherchescientif**connaissance*
*edu sup**conocimiento*
*conhecimento*

Thematic global evaluation of European Commission support to the education sector in partner countries(Including basic and secondary education); Final Report Vol. IIb, December 2010; Particip GmbH
26
DAC 5CODE
CRSCODE
DESCRIPTION Clarifications / Additional noteson coverage from DAC
document, evaluation guidelinesand Egeval typology
Key wordsderived for each
DAC code
Screening keywords inENGLISH
Screening keywords inFRENCH
Screening keywords inSPANISH
Screening keywords in
PORTUGUESE
innovationmobilityforeign languageKnowledge baseKnowledgesocietybrain drain
11430 Advancedtechnical andmanagerialtraining
Professional-level vocationaltraining programmes and in-service training (shorter coursesnot leading to a degree orofficial qualification; upgradingskills in IT, management, latesttechnology, etc.).
advanced *advancedmanagement*

Thematic global evaluation of European Commission support to the education sector in partner countries(Including basic and secondary education); Final Report Vol. IIb, December 2010; Particip GmbH
27
1.4.2 Key challenges and approach to the mapping of interventions
1.4.2.1 The key challenges
Three key challenges had to be tackled for constructing this inventory and typology.
The first challenge is common to all mapping exercises for thematic evaluations and relates tothe information source on which they are based. The main source for identifying interventionsof the EC in the education sector is indeed the EC’s Common RELEX Information System(CRIS). The CRIS database gathers operational data (decisions, projects, contractsdescriptions) and financial data (budget lines, commitments, payments) on the EC’s externalassistance managed by the EuropeAid Co-operation Office (AIDCO) and DG for ExternalRelations of the European EC (RELEX), for Development (DEV) and for the Enlargement(ELARG). Since 15 February 2009, CRIS also encompasses data relating to the EuropeanDevelopment Funds (previously in the On Line Accounting System -OLAS- database), inaddition to data on interventions financed by the general Community budget. Therefore, as ofthat date it is the sole source for identifying EC interventions in the education sector (as formost other sectors).However, CRIS stays an information system that is mainly used by EC staff in Brussels and inpartner countries for the day-to-day management of EC’s interventions. Some limits remainsfor the purpose of an inventory of a sectoral evaluation such as the present one. The main oneis that CRIS does not offer the possibility to obtain a readily available list of all the EC financialcontributions to the education sector. Indeed, in many cases no sector code has beenattributed to the interventions.14
A second challenge is related both to the use of CRIS and to the nature of the aid modalitiesused in the education sector. It is indeed not possible to identify automatically in CRIS whetherthe EC’s funds have been delivered through sector budget support (SBS) or general budgetsupport (GBS). Information on the type of modality used by the EC to deliver the aid is notencoded as such.
The third challenge relates more specifically to the need to tackle GBS in the inventory. GBS,per se, are un-earmarked funds transferred to the national treasury of the beneficiary countryto support its national development strategy. These funds are used by the country inaccordance with its public financial management system. The funds provided by the ECthrough GBS are thus not supporting directly a particular sector. They might nevertheless beindirectly linked to a certain sector. Indeed the EC might for instance define performanceindicators in a particular sector, to guide the release of the so-called variable tranches15. It isknown that for several GBS, such indicators refer to the education sector. The inventory shouldthus also cover GBS that is in this sense “relevant” to the education sector. Such coverage ofGBS has not yet been carried out in any of the thematic evaluations carried out so far. It ischallenging for mainly two reasons:
o Because it requires an identification of GBSo Because it requires an identification of those GBS that refer to the education sector.
With a view to tackle these three key challenges, the evaluation team developed a specific andsystematic approach which allowed to:
Identify the relevant interventions in terms of EC’s support to the education sector; Categorise these interventions by type of modality used by the EC to deliver its aid; Identify those GBS that are relevant to the education sector.
14 Only 27% of the interventions have a DAC sector code encoded in CRIS. This percentage has been calculatedby the evaluation team on the basis of the data extraction from CRIS for all contracts signed by the EC between2000 and 2007. Indeed, out of 41,637 contracts, only 11,319 contracts have a DAC sector code attributed.15 GBS disbursements are made through the use of either fixed or variable tranches. According to the ECguidelines on GBS, fixed tranches have “a fixed value and are disbursed in full (if all conditions set in theFinancing Agreement are met) or not at all.” Variable tranches have “a maximum value and are disbursed in full orin part with the amount being disbursed being based on performance achieved in relation to pre-specified targetsor designated performance criteria and indicators.”

Thematic global evaluation of European Commission support to the education sector in partner countries(Including basic and secondary education); Final Report Vol. IIb, December 2010; Particip GmbH
28
A distinction should be made in this respect between the approach developed to cover the directsupport of the EC in the education sector and the indirect support (the GBS). Each of theseapproaches is further detailed hereafter.
1.4.2.2 Approach for the “direct” support to the education sector
The figure below schematizes the approach applied to provide a mapping of the EC’s interventions inthe education sector. This included assigning relevant sector codes and showing which modalitieshave been used.

Thematic global evaluation of European Commission support to the education sector in partner countries(Including basic and secondary education); Final Report Vol. IIb, December 2010; Particip GmbH
29
Figure 20: Schematic approach to mapping EC support to education
PHASE 1
Constituting a list ofinterventii
ons
Extracting data from CRIS at decision level and contract level forall EC financed interventions
Constituting a list of key wordsrelated to the education sector
and sub-sectors
Screening all EC financedinterventions with key words
Description ofDAC sector
classification
Key words quality control byeducation experts
PHASE 2
Assigningsector
codes andaid
modalities
Evaluationguidelines foreducation and
Egeval typology
Allocate sector code of the decisionto all the related contracts
Qualitycontrol
List of 2261 contracts and related Decisions ofCommission interventions in the education sector
Line by line analysis of the contract and decision titles of the list
If decision title mentions the sector: If decision title does not mention the sector:
Allocate sector code on the basis of theanalysis of each contract title
A sector code is allocated to each intervention of the list
Establish list of sector codes on the basis ofDAC sector classification and Egeval typology
Establish list of aid modalities used by the Commissionand definitions
Line by line analysis of the information provided in CRIS
Allocate an aid modality according to information provided andtypical characteristics of each aid modality (see table 18)
An aid modality is allocated to each intervention of the list Qualitycontrol
As further explained hereafter, two main phases can be distinguished in this approach:
Phase 1: constituting a list of interventions of the EC support to the education sector;
Phase 2: assigning a sector code to each intervention and identifying the type of modality usedby the EC to deliver its aid.

Thematic global evaluation of European Commission support to the education sector in partner countries(Including basic and secondary education); Final Report Vol. IIb, December 2010; Particip GmbH
30
1.4.2.2.1 Phase 1: Constituting a list of interventions of the EC’s support to the education sector
As DAC sector codes were not always encoded in CRIS, they could not serve as a basis to identify allinterventions financed by the EC to support the education sector. To identify these interventions, theteam needed to be able to undertake a comprehensive and systematic screening of the informationcontained in the database. The idea was to undertake this screening using a set of key words, as isfurther explained below.
However, CRIS does not provide a search option allowing for such a key words screening. Therefore,as a first step, the evaluation team extracted from CRIS the data at contract and decision levelfor all interventions financed by the EC from 2000 to 2007. The team then compiled these data inone single list that was suitable for the automatic screening with key words.
Such a set of key words was however not readily available. The next challenge was thus toconstitute a set of key words that would allow capturing in this comprehensive list those ECinterventions that are relevant to the education sector16. To do so, the team systematically derived keywords using two types of sources:
the education DAC sector codes’ descriptions and clarifications defined by the OECD17;
the EuropeAid evaluation guidelines for the education sector (“Delineation of the educationsector”) and the “Typology of action supported by the EC in the education sector” prepared byEGEval in 2004.
The set of key words obtained in this way is presented in section 1.4.1. Each key word was translatedfrom English to French, Spanish and Portuguese, so as to be able to capture interventions whichwould have their title displayed in one of these languages. The list of key words was further checkedby the education experts of the evaluation team, and some additional commonly used acronyms forimportant EC’s interventions in the education sector, such as the Fast Track Initiative (FTI), wereadded to the list.
The third step consisted then in screening the list by using the set of key words. Here the teamproceeded in two stages:
through a first screening, all contracts related to a decision that contained one of the key termsin its title were selected;
a second screening of all contracts related to the remaining decisions was then undertaken.Indeed, some decisions are entitled as: “3rd Rehabilitation Programme: Support to localcommunities and civil society” under which some contracts are relevant to the educationsector, such as: “Primary Education Development in Hiran-Galgadud Regions”, and some arenot. Among these contracts, those that contained one of the key words in their title wereselected.
The compilation of the contracts selected through this two-step screening and the cross-checking withEC’s internal work on a list of education interventions resulted in a final list of 2,261 EC interventionsin the education sector (hereafter called “the list” and presented in detail in section 1.4.4). This listgathered information on:
the beneficiary country,
the financial contributions (amounts contracted and paid),
the name of the contractor,
the nature of the contract,
the date of signature of the contract and
the contract and decision reference number.
This list was nearly complete to allow providing a good overview and typology of the EC direct supportto the education sector. Two elements were missing though: information on the sub-sectors concerned
16 It is important to note that the inventory of direct support only concerns interventions that are “entirely” relevantto the education sector. Accordingly, it does not include for instance general social sector interventions (includingTFs) that have, among others, an education component.17 http://www.oecd.org/document/21/0,3343,en_2649_34447_1914325_1_1_1_1,00.html

Thematic global evaluation of European Commission support to the education sector in partner countries(Including basic and secondary education); Final Report Vol. IIb, December 2010; Particip GmbH
31
and on the aid modalities used. These elements were not displayed in the list but “re-constructed” bythe team as explained hereafter.
1.4.2.2.2 Phase 2: Assigning a sub-sector to each intervention and identifying the type of modalityused by the EC to deliver its aid
1) Assigning a sector code
The final list obtained displayed the different “direct” interventions of the EC in the education sector.However, this list did not assign “sub-sectors” such as “primary” or “secondary” education to eachintervention. This type of information was required, on the one hand to allow the team to provide amore refined classification and thus understanding the type of interventions the EC supported in theeducation sector, but also to identify the interventions that fell directly within the scope of theevaluation.
The DAC sector codes were used as the set of categories for the sector classification of theinterventions. This set of education sub-sector categories was the following (the categories fallingwithin the scope of the evaluation are those highlighted in yellow):
Table 3: Education sub-sector categories used for classification of interventionsDAC 5Code
CRS Code Description
110 EDUCATION111 Education, level unspecified
11110 Education policy and administrative management11120 Education facilities and training11130 Teacher training11182 Educational research
112 Basic education11220 Primary education11230 Basic life skills for youth and adults11240 Early childhood education
113 Secondary education11320 Secondary education11330 Vocational training
114 Post-secondary education11420 Higher education11430 Advanced technical and managerial training
On this basis, the team analysed the list and assigned to each intervention a sub-sector category18,proceeding as follows:
First, the titles of the decisions were examined one by one. When the decision title indicated clearly asub-sector category, all the contracts related to this decision were classified under this sub-sectorcategory19; when the decision clearly related to the entire education sector and not to a sub-sector inparticular20, the contracts were classified under the general education DAC code (11100 education,level unspecified);
18 The allocation of DAC codes by the team follows the general guidelines of the DAC on “Reporting on thepurpose of aid” where it is stated that “the sector of destination of a contribution should be selected by answeringthe question “which specific area of the recipient’s economic or social structure is the transfer intended to foster”.The sector classification does not refer to the type of goods or services provided by the donor. Sector specificeducation or research activities (e.g. agricultural education) or construction of infrastructure (e.g. agriculturalstorage) should be reported under the sector to which they are directed, not under education, construction, etc.”http://www.oecd.org/document/21/0,3343,en_2649_34447_1914325_1_1_1_1,00.html19 Example: the decision title: “PROJECT IN SUPPORT OF PRIMARY EDUCATION” in Angola is clearly relatedto the primary education, DAC code 11220.20 Example: the decision title: “NAMIBIA EDUCATION & TRAINING PROGRAMME” is clearly related to the entireeducation sector, DAC code 11100.

Thematic global evaluation of European Commission support to the education sector in partner countries(Including basic and secondary education); Final Report Vol. IIb, December 2010; Particip GmbH
32
When the decision title did not allow assigning a sub-category, the related contract titles wereexamined one by one. They were classified under a sub-category, when this category appeared in thetitle21. Due to the lack of DAC codes encoded in CRIS, the evaluation team had indeed to allocate aDAC code for the majority of the interventions. This allocation was mainly based on the interventions’titles. For some large interventions and when titles were not clear enough, the team referred to thedescription of the type of activities, when available on the internet and on CRIS.
A quality check for the allocation of the DAC codes was then undertaken22. Moreover, additional cross-checking with the 2004 EGEval typology and previous education sector inventories have been carriedout by the team in order to obtain the most comprehensive and best possible inventory and typology ofEC support to the education sector.
This approach allowed assigning sub-sector categories to all the interventions of the list.
2) Identifying the type of aid modalities used
The approach developed by the evaluation team to identify the type of aid modalities used for eachintervention is based on the EC’s classification of aid delivery methods. However, for the purpose ofthe evaluation and considering the information available in CRIS, a new refined classificationof types of aid modalities has been elaborated by the evaluation team. The purpose is mainly toprovide more detailed information for the analysis in the next phases of the evaluation. The followingparagraphs explain how the classification used was derived from the EC’s definition of aid deliverymethods. They also explain how each intervention was classified under one specific type of aidmodality.
The EC uses three types of approaches to deliver its aid: project approach, sector approach andmacro/global approach23. The table below summarises the related EC aid delivery methods.
Table 4: Description of aid delivery methodsApproach Related financing modalities
Projectapproach
“A project is a series of activities aimed at bringing about clearly specified objectives within adefined time period and with a defined budget.” It is further explained that “the EC follows theproject approach in particular to support initiatives outside the public sector, such as throughcivil society and the private sectors.” It uses EC procurement and grant award procedures.
Sectorapproach
“The European EC uses the sector approach as a way of working with partner governments,donors and other stakeholders. It ensures partner governments’ ownership of developmentpolicy, strategy and spending. (…) As a result of following a sector approach, governments inconsultation with partner donors and other stakeholders may develop a sector programme.” Itis further explained that the sector programme may use the following forms of financing : “Sector budget support is the modality of choice, wherever appropriate, and consists of
a transfer of funds to the partner government national treasury to be used in pursuit of anagreed set of sector outputs and outcomes.
Common pooled funds or common basket funding (resources from a number of donorspooled using one agreed set of procedures) in support of a specific set of activities in thesector programme. Usually one donor will take responsibility for co-ordinating andmanaging the pooled funds. Funds are released by the donor to government accordingto agreed criteria.
EC procedures that follow contracting and procurement rules.”Macro/global
approach “The European EC defines budget support as the transfer of financial resources of an
external financing agency to the national treasury of a partner country. These financialresources form part of the partner country’s global resources, and are consequently usedin accordance with its public financial management system.”
21 Example: the decision title: “HUMAN RESOURCES DEVELOPMENT PROGRAMME 2 (HRDP 2)” in PapuaNew Guinea does not indicate whether this programme is for the education sector in general or a sub-sector inparticular. Therefore the contracts’ titles under that decision are analysed and education sub-sector DAC codesare allocated for relevant contracts such as the DAC code 11120 (education facilities and training) for the contractwith the title: “EXTENSION OF UNIVERSITY OF TECHNOLOGY (UNITECH) WORKS” and the DAC code 11130(teacher training) for the contract with the title “KABALEO TEACHERS COLLEGE; KUMAGAI GUMI LTD.6,963,876.53PGK”.22 The list of interventions with the DAC sector code allocated was sent to the senior members of the evaluationteam to check the sector allocation of the first 200 largest interventions.23 See the EuropeAid web site: http://ec.europa.eu/europeaid/how/delivering-aid/index_en.htm

Thematic global evaluation of European Commission support to the education sector in partner countries(Including basic and secondary education); Final Report Vol. IIb, December 2010; Particip GmbH
33
This categories needed however to be made more workable for the current exercise. Indeed “pooledfunding” and “EC procedures” cannot be differentiated in CRIS. Hence one cannot decide whether aspecific amount is allocated to a “project” or to a “sector” approach. Therefore, the team used a similarbut slightly different set of categories that had the advantage of being workable, while allowing for acomprehensive but mutually exclusive classification. The set of categories used is presented in thetable below. It concerns the “direct” support of the EC to the education sector, the “indirect” (GBS)being tackled separately in the next section.
Table 5: Proposed classification, definition and typical characteristics of type of aid modalitiesused by the EC to deliver its “direct” support to the education sector
Type of aidmodality
Definition Typical characteristics
Sector BudgetSupport
As defined by the EC Support an entire sector or sub-sector The partner government is the main actor
and is the main direct beneficiary of thefunds
Other limited number of actors are involvedfor audit, evaluation and/or technicalassistance
Support tosector
programmesexcluding SBS
As defined by the EC under the sectorapproach but excluding sector budgetsupport – “includes the modalities ECprocurement and grant award procedures”and “Common Pool Funds”
Support an entire sector or sub-sector Involve the partner government among
other actors
Individualprojects
As defined by the EC under projectapproach
Does not support an entire sector or sub-sector
Initiative outside the public sector
Financing ofTrust Funds
Not defined by the EC as one of the aiddelivery methods. It was however neededto classify the EC contributions to the FTICatalytic fund managed by the WB. Thefinancing of trust fund was thus added asone of the type of modality used by the ECto deliver its direct support to educationsector. All other contributions to WB TrustFunds specific to the education sectorhave also been classified under thiscategory
Financial contributions managed by theWorld Bank
Information on these aid modalities is however not readily available in CRIS. The aid modality that hasbeen used for a certain intervention can only be identified through a line by line analysis of dataprovided for each intervention and by using “proxies”.
Indeed, CRIS provides some information that is related to typical characteristics of each modality. Forinstance, the funds delivered through SBS are directly transferred to the partner government. Suchinformation can be found in CRIS which mentions the direct beneficiary of the funds for eachintervention. This information alone is however not sufficient to conclude that all interventions with thepartner government as direct beneficiary of the funds are delivered through SBS. Indeed, fundsdelivered through GBS are also transferred directly to the partner government. Therefore, otherinformation provided in CRIS has to be analysed line by line to conclude that the intervention isdelivered through SBS or another type of modality. In this specific case the title would provide the rightinformation as SBS would normally refer in its title to the sector concerned.
It was thus by combining such different types of information on a case by case analysis that the teamwas able to determine for each intervention the aid modality that had been used. More specifically, thisconcerned a systematic analysis of four types of information provided in CRIS (Title of the Decision,Amounts contracted, Name of the contractor, Title of the Contract). The table below list the conditionsthat needed to be fulfilled to decide which modality had been used for the intervention analysed.

Thematic global evaluation of European Commission support to the education sector in partner countries(Including basic and secondary education); Final Report Vol. IIb, December 2010; Particip GmbH
34
Table 6: Information analysis provided in CRIS for each aid modalityInformation provided in CRISType of aid
modality Title of theDecision
Amountscontracted
Name ofcontractor
Title of the contract
Sector BudgetSupport isallocated when:
Indication ofsector budgetsupport or aneducation sub-sector or theeducation sectoras a whole
One very largeamount comparedto the other amountcontracted underthe same Decision
The largest amountcontracted is to thepartner government
Indication of sector budgetsupport or limited number ofcontracts related to thesame Decision (of which foraudit, evaluation and/ortechnical assistance)
Support tosectorprogrammes isallocated when:
Indication of aneducation sub-sector or theeducation sectoras a whole
no specificcondition
All type ofcontractor but atleast one of theamount contractedis to the partnergovernment
Large number of contractsunder the same Decisionfor constructions, services,supplies, etc.
Individualproject isallocated when:
No indication of aneducation sub-sector or theeducation sectoras a whole
no specificcondition
All type ofcontractor exceptthe partnergovernment
Small number of contractsunder the same Decision(except for the financing ofscholarships)
Financing ofTrust Funds isallocated when:
Indication of theFTI Catalytic Fund
no specificcondition
The World BankGroup
no specific condition
This approach based on a line by line analysis through proxies constitutes a good basis for identifyingthese aid modalities. As it is based on proxies and given some limitations inherent to CRIS, onecannot exclude that in certain cases wrong aid modalities have been mentioned for certaininterventions. With a view to avoid such mistakes, the team has conducted specific checks for thelargest interventions, notably through analysis of documents available on the internet.
1.4.2.3 Approach for the indirect support
Identifying the indirect support provided by the EC to the education sector in the form of GBS relevantto the education sector, required tackling two main difficulties:
First, to provide an overview of the EC’s GBS provided during the period and in the countriescovered by this evaluation;
Second, to identify within these GBS, those that were relevant to the education sector.
The approach developed to do so is further detailed hereafter. Its main steps are summarised in thefollowing figure.

Thematic global evaluation of European Commission support to the education sector in partner countries(Including basic and secondary education); Final Report Vol. IIb, December 2010; Particip GmbH
35
Figure 21: Approach used to identify GBS relevant to the education sector
PHASE 1
IdentifyingGBS
Collecting all CSP/NIP for the period 2000-2007
Identifying countries where a GBS is foreseen through analysis of all CSP/NIP andaddendum and cross-checking with Commission documents on GBS
PHASE 2
IdentifyingGBS that isrelevant to
theeducation
sector
Collecting the Financing Agreement (FA) for each GBS
Analysing the FA to determine relevance of the GBS for the education sector, i.e.:
Line by line analysis of the information provided in CRIS
Decision titleindicate GBS or
povertyreductionstrategy
Number of contractsunder a same decision
is limited (incl audit,evaluation and/or TA)
Largest amountscontracted undera same decision
to the partnergovernment
List of all GBS financed by the Commission over the period 2000-2007
Extracting from CRIS at contract and decision level all interventions financed by theCommission over the period 2000-2007 in the countries where a GBS was announced
Checking the performance indicatorsmatrix for variable tranches disbursement
Checking the general goal of theGBS when performance indicators
are not defined in the FA
List of all GBS financed by the Commission over the period2000-2007 that are relevant for the education sector
List of countries where GBS is announced
Identify interventions as GBS when:
Contract titleindicate GBS or
povertyreductionstrategy
1.4.2.3.1 Phase 1: Identifying EC’s GBS
As explained above, CRIS does not allow identifying automatically all the GBS financed by the EC. Itwas not workable to analyse in CRIS line by line all the intervention’s data at contract and decisionlevel. Therefore, the team made a pre-selection with a view to limit the number of interventions to beanalysed. More specifically, it selected only the countries where the EC announced that supportunder the form of GBS would be provided. This required collecting and screening all CSPs/NIPs24
that the EC had with its partner countries in order to identify in which country a GBS was announced.
24 Which are available on DG RELEX and DG DEV web sites

Thematic global evaluation of European Commission support to the education sector in partner countries(Including basic and secondary education); Final Report Vol. IIb, December 2010; Particip GmbH
36
Overall, 181 CSP/NIP25 were screened and 48 out of them had a GBS foreseen in their NIP. This workwas then cross-checked and completed with information of internal EC documents provided to theevaluation team by EC staff in charge of GBS. Indeed, for the ACP countries, the GBS are eitherforeseen in their CSP/NIP or indicated in their updates following the mid and end-term reviews.However, for countries outside the ACP region, GBS are not systematically announced in theCSP/NIP. This allowed adding 6 countries, which, together with the list already obtained, constitutedthe set of selected countries.
As a second step, CRIS data extractions of all interventions financed between 2000 and 2007were made for the countries selected. They constituted the basis to identify the EC’s GBS through aline by line analysis.
Several criteria were used to decide whether an intervention could be considered as GBS. Indeed, asdefined by the EC, GBS is “a transfer to the national treasury in support of a national development orreform policy and strategy”. The main direct beneficiary of funds transferred through GBS is thus thepartner government. Other typical characteristics of GBS are:
Support to the national development or poverty reduction strategy and not to a particular sectoror sub-sector
Large amounts contracted compared to other interventions delivered through other aidmodalities
The largest amounts contracted under the same Decision are to the partner government.
Other limited number of actors are involved and only for audit, evaluation and/or technicalassistance
Taking into account these typical characteristics and the information provided in CRIS, GBS wereidentified in the country data extractions when:
The title of the Decision indicated a general budget support or a support to the nationaldevelopment or poverty reduction strategy
The largest amounts contracted under a same Decision went to the partner government
The number of contracts under a same Decision were limited and included audit, evaluationand/or technical assistance
The title of the contracts indicated a general budget support or a support to the nationaldevelopment or poverty reduction strategy
Through this systematic data analysis, the team identified 98 GBS in 43 countries (see section 1.4.5).
1.4.2.3.2 Phase 2: Identifying those GBS relevant to the education sector
Once all GBS financed by the EC over the period 2000-2007 were identified, the remaining challengewas to identify those GBS that were relevant to the education sector. Indeed, as defined in the ECguidelines on General Budget Support26, this aid modality represents a “transfer to the nationaltreasury in support of a national development or reform policy and strategy (...) In supporting anational policy and strategy, GBS should be built around the fundamental goals the EC wishes tosupport.”
In this context, “GBS relevant to the education sector” was considered as GBS for which the ECsupported “fundamental goals” relating to the education sector. To do so the team collected, in theCRIS database or when not available from the EC staff27, the Financing Agreements (FA) of the GBSconcerned. These FAs were then analysed. Two criteria were used by the team to decide whetherthe goals of a GBS were education sector relevant:
The performance indicators matrix for the release of the variable tranches referred to the educationsector. As explained in the EC guidelines for General Budget Support, “it is important to ensure that
25 Because the temporal scope of this evaluation is the period 2000-2007, for the ACP regions, the 2000-2007CSP/NIP and their addendum following the mid and end-term review have been screened whereas for the otherregions (ALA, MEDA, TACIS) the 2002-2006 and the 2007-2013 CSP/NIP have been screened.26 European EC, “Guidelines on the Programming, Design & Management of General Budget Support”, 200727 Out of the 98 GBS identified, 3 Financing Agreements were not available directly in CRIS but sent to theevaluation team by the EC staff in charge of those GBS.

Thematic global evaluation of European Commission support to the education sector in partner countries(Including basic and secondary education); Final Report Vol. IIb, December 2010; Particip GmbH
37
any strategic orientations set out in a national policy and strategy find their expression in a matrix ofperformance indicators”. If this matrix included education indicators, the team considered that thisparticular GBS could be considered as relevant to the education sector;.
When performance indicators were not defined in the FA, but when the general goals of the GBSreferred explicitly to the education sector, those GBS were also considered as relevant to theeducation sector.
This gave rise to a list of 73 GBS in 37 countries that can be considered as “relevant to the educationsector”.
1.4.3 Limits to take into account
The specific and systematic approach used for the elaboration of the inventory of the EC’s “direct” and“indirect” support to the education sector is considered by the evaluation team as the best possibleand most comprehensive way of tackling this complex exercise. However, it is important to makeexplicit the limits of this exercise.
With respect to the approach for the inventory of the “direct” support the following elements shouldbe taken into account:
A number of choices needed to be made by the team:o This concerned notably the set of key terms to be used for the screening of the EC’s
interventions in the CRIS database. Although there is a rational basis for thesechoices and although they have been chosen with a view to maximising the coverage,one cannot exclude that relevant interventions have not been grasped by the keywords selected.
o Once the list of interventions of EC support to the education sector was established,the team had to make choices in terms of classification of the interventions under aneducation DAC sector code and assignment of the aid modality used. Here again,while there was a sound basis for each choice made, it is clear that it mainly relied oninformation presented in the database and on the interpretation of this information.
Although a sound and systematic approach was applied, the results remain dependant to acertain extent on limits that concern the CRIS database28. Indeed, some of the workdepended on the information provided in the decision or contract title. As an example, if noneof them referred to one of the key words but was relevant to education, it was not included inthe list. However, the data cross-checking with previous education inventories and internalwork of the EC’s services in charge of education interventions helped the team to obtain themost comprehensive inventory.
Some limits concern also the inventory for the “indirect” support. In terms of “indirect” support through GBS, the approach starts with the assumption that GBS
are foreseen in the CSP/NIP and/or indicated in their addendum following the mid and end-term review. Although it is considered as the best possible approach to delimit the number ofinterventions to be screened line by line in order to identify GBS in CRIS, one cannot excludethe possibility that some GBS have not been identified because they were not mentioned inthe CSPs/NIPs. However, cross-checking with internal EC documents on GBS allowed theteam to identify those GBS not foreseen in the CSP/NIP;
The identification of GBS within each country data extractions is based on a sound andsystematic analysis of the information provided in CRIS. However, it only relies on what isprovided in CRIS, with all its limitations, and the interpretation of this information by theevaluation team.
Clear criteria were used to determine whether a GBS was relevant to the education sector ornot. These were based exclusively on information displayed in the FA. The analysis of the FAsfor GBS allowed identifying the goals the EC wished to support when providing the funds.However, it is not possible to analyse whether these funds have actually supported the
28 The limits inherent to CRIS for the purpose of an inventory for sectoral/thematic evaluations are described indepth the Inventory Notes for the Evaluation of EC’s external co-operation with partner countries through theorganisations of the UN family, May 2008, for the Evaluation of EC’s aid delivery through development banks andEIB, November 2008 and for the evaluation of EC aid delivery through civil society organisations, December2008, available on the EuropeAid website.

Thematic global evaluation of European Commission support to the education sector in partner countries(Including basic and secondary education); Final Report Vol. IIb, December 2010; Particip GmbH
38
education sector and whether the disbursements of these funds have been done on the basisof improved education performance indicators set in the FA.
1.4.4 List of interventions financed by the EC to support the education sector between 2000and 2007
This annex lists all the interventions financed by the EC in the education sector between 2000 and200729 and falling within the geographical scope of the evaluation30. They were extracted from CRISusing the key words screening approach, as detailed in the report. Due to the volume of informationthe table is provided in a separate file.
This list provides the following information:
The Decision reference number
The Decision title
The contract reference number related to the Decision
The contract title related to the Decision
The contract start date (signature by the EC)
The contract end date (expiry date of the contract)
The amount contracted (in €)
The amount paid (in €)
The geographical zone (country or region for regional interventions)
The DAC sector
The modality used by the EC to deliver its aid
The channel category used by the EC to get its aid delivered
The first section lists all the interventions falling within the thematic scope of the evaluation, i.e. theeducation sector without higher education and vocational training. The second section lists all theinterventions in higher education and vocational training only.
Within each section, the interventions are sorted by Decision with their related contracts (one ormore), starting from the largest one.
1.4.5 List of general budget support financed by the EC between 2000 and 2007
This annex presents all the general budget support (GBS) operations financed by the EC between2000 and 2007. They were extracted from CRIS using the specific approach explained in the report.
For each GBS, the following information is provided:
The Decision reference number
The recipient country
The year of the first transfer of funds by the EC to the recipient country. Dates marked with a *indicates that the first transfer of funds was made before the year 2000, i.e. outside thetemporal scope of the evaluation, and these amount transferred are thus not taken into accountin the table.
The status of the GBS (closed or on-going)
The title of the GBS
The total amount transferred by the EC to the national treasury of the recipient country from thedate of the first transfer until the year 2007. All funds transferred after 2007 for GBS listed inthe table have not been taken into account because outside of the evaluation temporal scope.
29 The date of signature of the contract by the EC was used to determine the interventions falling within thetemporal scope of the evaluation30 All regions where EC co-operation is implemented with the exception of regions and countries under themandate of DG Enlargement

Thematic global evaluation of European Commission support to the education sector in partner countries(Including basic and secondary education); Final Report Vol. IIb, December 2010; Particip GmbH
39
The indication of whether GBS refer to the education sector or not. This information wasextracted from each GBS Financing Agreement and is based on the analysis of performanceindicators or general stated goals, as explained in the report.
The GBS are sorted by recipient countries and years of the first transfer.
Table 7: List of general budget support financed by the EC between 2000 and 2007Decision Ref Country Year of
firsttransfer
Status Title of GBS Totalamount
transferred
Referenceto the
educationsector
FED/1999/014-629
2000* Closed APPUI A L'AJUSTEMENTSTRUCTUREL (PAS 31999/2000 ) - PIN
16.200.000 no
FED/2000/015-220
2001 Closed PROGRAMME APPUIREFORMESECONOMIQUES 2001(PARE 2001)
16.723.610 yes
FED/2003/016-395
Benin
2004 On-going
APPUI BUDGETAIRECONJOINT POUR LAREDUCTION DE LAPAUVRETE (2003-2005)
71.200.000 yes
FED/1999/014-578
2000* Closed APPUI A L'AJUSTEMENTSTRUCTUREL 99/00
9.800.000 yes
FED/2000/015-219
2001 Closed APPUI BUDGETAIREREDUCTION PAUVRETE2001 (ABRP 2001)
20.000.000 yes
FED/2002/015-886
2002 On-going
Appui budgetaire pour lareduction de la pauvreteABRP 2002-2004
103.990.000 yes
FED/2005/017-744
Burkina Faso
2005 On-going
APPUI BUDGETAIRE POURLA REDUCTION DE LAPAUVRETE 2005-2008
180.583.333 yes
FED/2002/016-048
2003 On-going
PROGRAMMED'ALLâGEMENT DE LADETTE ET APPUI AUXRÎFORMES ÎCO NOMIQUES(ADARE 2003)
26.520.000 no
FED/2004/016-893
2004 On-going
Appui à la réduction de lapauvreté 2004-2006 (PPARP2004-2006) et d'allégementdes arriérés multilatéraux -programme générald'importations
43.303.333 yes
FED/2007/018-917
Burundi
2007 On-going
Programme d'Appuibudgétaire à la stabilisationmacro-économique
29.000.000 no
DCI-ASIE/2007/019-017
Cambodia 2007 On-going
EC General Budget Supportfor Cambodia
22.200.000 no
FED/2000/015-224
Cameroon 2003 Closed PROGRAMME APPUIBUDGETAIRE LUTTECONTRE LAPAUVRETÎ2000-2001
18.010.000 no
FED/2001/015-407
2001 On-going
PROGRAMME D'APPUI AL'AJUSTEMENTSTRUCTUREL (PAS 2000)
11.000.000 yes
FED/2004/017-422
Cap-Vert
2004 On-going
PREOGRAMME D'APPUIBUDGETAIRE D'URGENCE(2004-2005)
5.500.000 no
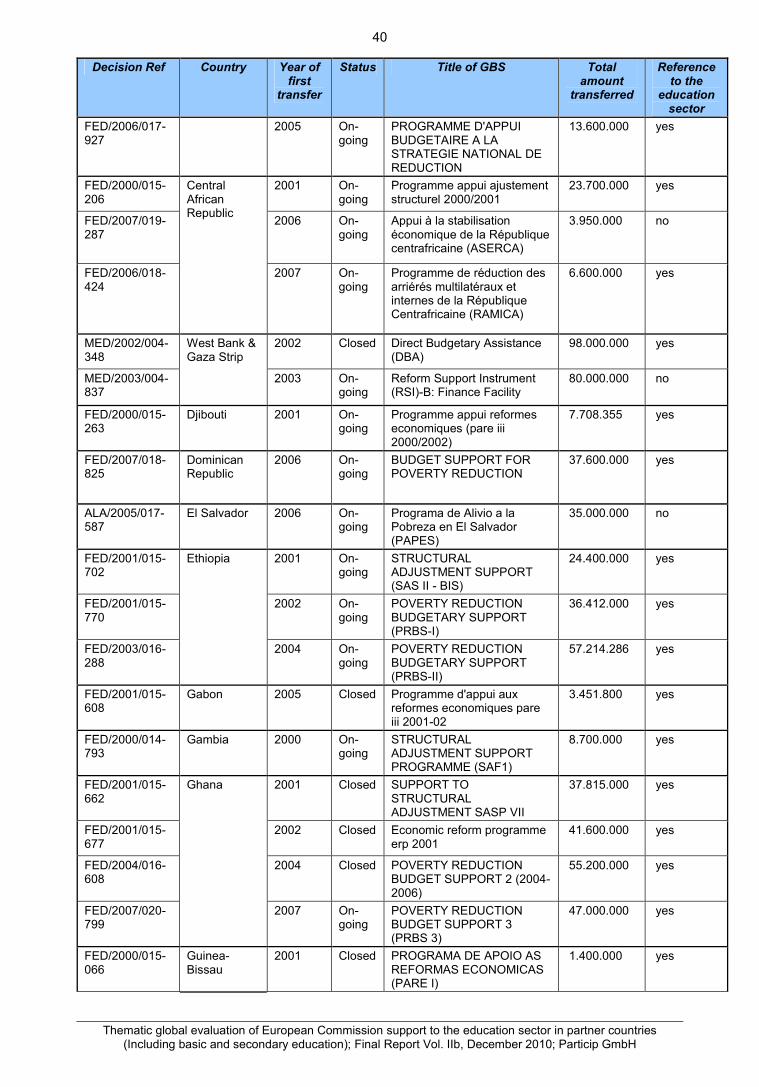
Thematic global evaluation of European Commission support to the education sector in partner countries(Including basic and secondary education); Final Report Vol. IIb, December 2010; Particip GmbH
40
Decision Ref Country Year offirst
transfer
Status Title of GBS Totalamount
transferred
Referenceto the
educationsector
FED/2006/017-927
2005 On-going
PROGRAMME D'APPUIBUDGETAIRE A LASTRATEGIE NATIONAL DEREDUCTION
13.600.000 yes
FED/2000/015-206
2001 On-going
Programme appui ajustementstructurel 2000/2001
23.700.000 yes
FED/2007/019-287
2006 On-going
Appui à la stabilisationéconomique de la Républiquecentrafricaine (ASERCA)
3.950.000 no
FED/2006/018-424
CentralAfricanRepublic
2007 On-going
Programme de réduction desarriérés multilatéraux etinternes de la RépubliqueCentrafricaine (RAMICA)
6.600.000 yes
MED/2002/004-348
2002 Closed Direct Budgetary Assistance(DBA)
98.000.000 yes
MED/2003/004-837
West Bank &Gaza Strip
2003 On-going
Reform Support Instrument(RSI)-B: Finance Facility
80.000.000 no
FED/2000/015-263
Djibouti 2001 On-going
Programme appui reformeseconomiques (pare iii2000/2002)
7.708.355 yes
FED/2007/018-825
DominicanRepublic
2006 On-going
BUDGET SUPPORT FORPOVERTY REDUCTION
37.600.000 yes
ALA/2005/017-587
El Salvador 2006 On-going
Programa de Alivio a laPobreza en El Salvador(PAPES)
35.000.000 no
FED/2001/015-702
2001 On-going
STRUCTURALADJUSTMENT SUPPORT(SAS II - BIS)
24.400.000 yes
FED/2001/015-770
2002 On-going
POVERTY REDUCTIONBUDGETARY SUPPORT(PRBS-I)
36.412.000 yes
FED/2003/016-288
Ethiopia
2004 On-going
POVERTY REDUCTIONBUDGETARY SUPPORT(PRBS-II)
57.214.286 yes
FED/2001/015-608
Gabon 2005 Closed Programme d'appui auxreformes economiques pareiii 2001-02
3.451.800 yes
FED/2000/014-793
Gambia 2000 On-going
STRUCTURALADJUSTMENT SUPPORTPROGRAMME (SAF1)
8.700.000 yes
FED/2001/015-662
2001 Closed SUPPORT TOSTRUCTURALADJUSTMENT SASP VII
37.815.000 yes
FED/2001/015-677
2002 Closed Economic reform programmeerp 2001
41.600.000 yes
FED/2004/016-608
2004 Closed POVERTY REDUCTIONBUDGET SUPPORT 2 (2004-2006)
55.200.000 yes
FED/2007/020-799
Ghana
2007 On-going
POVERTY REDUCTIONBUDGET SUPPORT 3(PRBS 3)
47.000.000 yes
FED/2000/015-066
Guinea-Bissau
2001 Closed PROGRAMA DE APOIO ASREFORMAS ECONOMICAS(PARE I)
1.400.000 yes

Thematic global evaluation of European Commission support to the education sector in partner countries(Including basic and secondary education); Final Report Vol. IIb, December 2010; Particip GmbH
41
Decision Ref Country Year offirst
transfer
Status Title of GBS Totalamount
transferred
Referenceto the
educationsector
FED/2006/017-936
2006 On-going
APPUI BUDGETAIRE A LASTABILISATION (ABS1)
5.500.000 no
FED/2006/020-749
2007 On-going
APPUI BUDGETAIRE DESTABILISATION ABS II
5.700.000 no
FED/1999/014-399
2000* Closed SUPPORT PROGRAMMEFOR ECONOMIC REFORMS(SAS V : 1999)
3.300.000 yes
FED/2004/016-892
Guyana
2004 On-going
Poverty Reduction BudgetSupport
33.579.650 no
FED/2006/020-710
2006 On-going
CONVENTION DEFINANCEMENT APPUIBUDGETAIRE D'URGENCE
10.000.000 no
FED/2007/020-775
Haiti
2007 On-going
PROGRAMME D'AIDEBUDGETAIRE
20.000.000 yes
FED/2001/015-675
Ivory Coast 2002 On-going
PROGRAMME D APPUI ALA RELANCEECONOMIQUE (PARE I2001/2002
5.000.000 yes
FED/1999/014-693
2000* Closed SUPPORT FOR ECONOMICREFORM PROGRAMME(SERP)
31.000.000 yes
FED/2001/015-469
2001 Closed Support to the economicreform programme 2001-2003serp ii
21.400.000 yes
FED/2002/016-017
2004 On-going
SUPPORT TO ECONOMICREFORM PROGRAMME III(SERP III)
24.744.335 yes
FED/2004/016-973
Jamaica
2004 Closed Emergency Assistance -Budgetary Support
25.000.000 yes
MED/2002/003-312
2002 Closed Structural Adjustment FacilityIII - SAF III
59.700.000 no
MED/2003/005-635
Jordan
2003 Closed Emergency BudgetarySupport in Jordan
34.900.000 no
FED/2000/015-139
2001 Closed POVERTY REDUCTIONBUDGET SUPPORT(PRBS1)
17.000.000 yes
FED/2004/017-389
Kenya
2005 On-going
POVERTY REDUCTIONSUPPORT PROGAMME
120.000.000 yes
FED/2001/015-408
Lesotho 2001 Closed Poverty reduction budgetarysupport program prbsp2001/2002
14.500.000 yes
FED/1999/014-400
2000* Closed APPUI AU PROGRAMMED'AJUSTEMENTSTRUCTUREL (PAS II -99/2000)
33.730.000 yes
FED/2002/016-091
2002 Closed Programme d appuibudgetaire d urgence (pabu)
69.327.000 no
FED/2003/016-531
2004 On-going
PROGRAMME D'APPUIBUDGETAIRE A LAREDUCTION DE LAPAUVRETE (PARP)
30.675.000 yes
FED/2005/017-741
Madagascar
2005 On-going
PROGRAMME D'APPUIBUDGETAIRE POURREDUCTION DE LAPAUVRETE II
54.000.000 yes

Thematic global evaluation of European Commission support to the education sector in partner countries(Including basic and secondary education); Final Report Vol. IIb, December 2010; Particip GmbH
42
Decision Ref Country Year offirst
transfer
Status Title of GBS Totalamount
transferred
Referenceto the
educationsector
FED/1999/014-528
2000* Closed STRUCTURALADJUSTMENT SUPPORT(SAF IV : 99/01) - PIN
31.490.000 no
FED/2005/017-849
2005 On-going
POVERTY REDUCTIONBUDGETARY SUPPORTPROGRAMME
33.100.000 yes
FED/2007/019-638
Malawi
2006 On-going
Poverty Reduction BudgetSupport Programme 2
30.000.000 yes
FED/1999/014-534
2001* Closed APPUI A L'AJUSTEMENTSTRUCTUREL (PAS 99/00) -FAS
6.000.000 no
FED/2002/016-063
2002 Closed APPUI BUDGETAIRE AUCADRE STRATEGIQUE DELUTTE CONTRE LAPAUVRETE (CSLP) 2001
22.395.000 yes
FED/2003/016-414
Mali
2003 On-going
PROGRAMMEPLURIANNUEL D'APPUIBUDGÎTAIRE AU CADRESTRATÎGIQUE DE LUTTECONTRE LA PAUVRETE
151.030.000 yes
FED/2001/015-414
Mauritania 2001 Closed Appui budgetaire au cadrestratÎgique lutte contrepauvrete FAS 2000
15.315.000 yes
FED/1997/013-719
2000* Closed GENERAL IMPORTPROGRAMME (GIP III)
56.500.000 yes
FED/2000/015-215
2001 Closed POVERTY REDUCTIONBUDGET SUPPORT(PRBS1).
65.000.000 yes
FED/2002/015-996
2002 Closed POVERTY REDUCTIONBUDGET SUPPORT II(PRBS II) 2002-2005
166.032.000 yes
FED/2006/017-943
Mozambique
2006 On-going
POVERTY REDUCTIONBUDGET SUPPORTPROGRAMME (PRBS III)
82.918.000 yes
ALA/2004/016-837
Nicaragua 2006 On-going
Programa de apoyo al PlanNacional de Desarrollo conenfoque rural
68.000.000 no
FED/2000/015-214
2000 Closed APPUI PROGRAMMEAJUSTEMENTSTRUCTUREL (PAPAS V)
23.640.000 yes
FED/2001/015-535
2002 Closed CONTRIBUTIONSUPPLEMENTAIRE AUPROGRAMMECOMMUNAUTAIRE D'APPUIA L'AJUSTEMENTSTRUCTUREL (PAPAS IV)
3.160.000 no
FED/2002/015-890
2002 Closed PROGRAMME D APPUI ALA RESTAURATION DESEQUILIBRES MACROECONOMIQUES
19.250.000 no
FED/2003/016-251
2003 Closed PROGRAMMEPLURIANNUEL D'APPUI ALA REDUCTION DE LAPAUVRETE 2003-2005 -(PPARP 2003-2005
74.250.000 yes
FED/2005/017-874
Niger
2005 On-going
PROGRAMMEPLURIANNUEL D'APPUI ALA REDUCTION DE LA
56.751.000 yes

Thematic global evaluation of European Commission support to the education sector in partner countries(Including basic and secondary education); Final Report Vol. IIb, December 2010; Particip GmbH
43
Decision Ref Country Year offirst
transfer
Status Title of GBS Totalamount
transferred
Referenceto the
educationsector
PAUVRETE
FED/2000/015-221
2002 On-going
POVERTY ALLEVIATIONBUDGETARY SUPPORT(PABS 4)
73.500.000 yes
FED/2005/017-078
Ouganda
2005 On-going
5th poverty alleviation budgetsupport (PABS V)
83.045.000 yes
FED/2000/015-106
Papouasie-New-Guinea
2001 Closed Structural adjustment supportprogramme (2000/2001)
9.800.000 yes
ALA/2006/018-053
Paraguay 2007 On-going
Programa de apoyopresupuestario a la luchacontra la pobreza focalizada
23.000.000 yes
FED/1998/014-149
2000* Closed STRUCTURALADJUSTMENT SUPPORTPROGRAMME (SAF1)
1.200.000 yes
FED/2000/015-211
2001 Closed STUCTURAL ADJUSTMENTSUPPORT (SAP 2)
61.815.000 yes
FED/2003/016-320
2003 On-going
PROGRAMMEPLURIANNUEL D'APPUI ALA REDUCTION DE LAPAUVRETE 2003-2005(PPARP 2003-2005)
45.764.000 yes
FED/2005/017-852
Rwanda
2006 On-going
BUDGET SUPPORT FORPOVERTY REDUCTION
35.800.000 yes
FED/2000/015-222
Sao Tome-Principe
2001 Closed PROGRAMME D'APPUIL'AJUSTEMENTSTRUCTUREL (PAS 2001-2002)
2.539.374 yes
FED/1999/014-527
2003 Closed APPUI BUDGETAIREDIRECT A L'AJUSTEMENTSTRUCTUREL FAS 99/00
25.300.000 yes
FED/2004/017-388
Senegal
2005 On-going
APPUI BUDGETAIRE A LASTRATEGIE DEREDUCTION DE LAPAUVRETE
50.000.000 yes
FED/2000/015-223
2004 Closed POST CONFLICT BUDGETSUPPORT (PCBS)
18.180.000 yes
FED/2004/017-043
Sierra Leone
2005 On-going
POVERTY REDUCTIONBUDGET SUPPORT
59.000.000 yes
FED/2001/015-457
2001 Closed POVERTY REDUCTIONBUDGET SUPPORT FAS2000
75.000.000 yes
FED/2003/016-313
2003 Closed POVERTY REDUCTIONBUDGET SUPPORTPROGRAMME 2003-2006
94.500.000 yes
FED/2006/017-917
Tanzania
2006 On-going
PRBS03 POVERTYREDUCTION BUDGETSUPPORT PROGRAMME2006-2008
56.500.000 yes
FED/2000/015-225
Tchad 2001 Closed POVERTY REDUCTIONBUDGETARY SUPPORTPROGRAMME (PRBSP)01/02
33.973.429 yes

Thematic global evaluation of European Commission support to the education sector in partner countries(Including basic and secondary education); Final Report Vol. IIb, December 2010; Particip GmbH
44
Decision Ref Country Year offirst
transfer
Status Title of GBS Totalamount
transferred
Referenceto the
educationsector
FED/2003/016-363
2003 On-going
PROGRAMME D'APPUIBUDGETAIRE POUR LAREDUCTION DE LAPAUVRETE ET LACROISSANCE (2003-2006)
20.000.000 yes
MED/2002/003-350
2002 Closed Programme d'ajustementstructurel (FAS-III)
66.906.000 no
MED/2005/017-322
2005 On-going
Facilité d'AjustementStructurel IV
77.750.000 no
MED/2006/018-438
Tunisia
2007 On-going
Tunisie - Programme d'appuià la compétivité (PAC I)
38.000.000 no
FED/2006/020-686
Turcs &Caico
2006 On-going
BUDGET SUPPORTPROGRAMME
10.515.000 yes
FED/2001/015-420
2001 Closed SUPPORT TO ECONOMICREFORM PROGRAMME(SERP) 2000/1
1.525.000 yes
FED/2004/017-385
2004 On-going
SUPPORT TO ECONOMICREFORM PROGRAMME2004-2006
1.300.000 no
FED/2006/018-697
Vanuatu
2007 On-going
Support to the EconomicReform Programme (SERP)2007-2010
2.400.000 yes
FED/2000/015-065
2001 Closed Saf v - sysmin 115.097.500 yes
FED/2003/016-366
2004 On-going
POVERTY REDUCTIONBUDGET SUPPORTPROGRAMME 2003-2006(PRBS01 )
103.700.000 yes
FED/2006/018-569
Zambia
2007 On-going
PRBS 02 (2007-2008) 60.000.000 yes

Thematic global evaluation of European Commission support to the education sector in partner countries(Including basic and secondary education); Final Report Vol. IIb, December 2010; Particip GmbH
45
1.4.6 List of recipient countries of EC funds in the education sector
This annex provides the list of all recipient countries of EC funds to support the education sector fallingwithin the scope of the evaluation (education sector without higher education and vocational educationand training). They are sorted by total amount contracted starting with the highest. It also provides theshare of the amount contracted by country on the total amount contracted, the total amount disbursedby country and the disbursement rate on the amount contracted by country. The last column providesthe total amount contracted by the EC to support HE and VET in these countries.
Table 8: List of recipient countries of EC funds in the education sector
Country/regionAmount
contracted(€ million)
% on totalamount
contractedAmount
disbursedDisbursement rate
Amountcontractedfor HE and
VET (€million)
INDIA 354.76 18.54% 202.65 57% 4.25
BANGLADESH 140.87 7.36% 81.27 58% 14.14
PAKISTAN 110.10 5.75% 71.15 65% 2.76
ACP COUNTRIES 78.14 4.08% 49.74 64% 16.40
NICARAGUA 72.73 3.80% 71.63 98% 0.81
TANZANIA 70.38 3.68% 50.34 72% -
TUNISIA 69.68 3.64% 57.71 83% 94.79
JORDAN 67.37 3.52% 41.15 61% 2.56
DOMINICAN REPUBLIC 56.67 2.96% 46.10 81% 13.06
HONDURAS 52.31 2.73% 50.67 97% 19.74
BOTSWANA 51.09 2.67% 40.52 79% 18.85
SUDAN 51.00 2.66% 50.47 99% 11.87
INDONESIA 40.38 2.11% 15.19 38% -
ERITREA 36.60 1.91% 17.88 49% -
NAMIBIA 33.66 1.76% 26.91 80% 1.91
UGANDA 33.43 1.75% 32.88 98% 0.56
ALL COUNTRIES 32.25 1.68% 15.84 49% 1.93
HAITI 32.18 1.68% 30.47 95% 5.55
VIETNAM 28.20 1.47% 23.99 85% 1.40
CAMBODIA 27.20 1.42% 25.16 93% 1.89
MOROCCO 25.60 1.34% 24.89 97% 69.94
FIJI 25.45 1.33% 15.98 63% -
PAPUA NEW GUINEA 23.25 1.21% 17.96 77% 1.86
MOZAMBIQUE 22.98 1.20% 21.25 92% 2.50
ANGOLA 22.35 1.17% 20.11 90% -
GUATEMALA 19.63 1.03% 19.63 100% 1.67
SOUTH AFRICA 19.09 1.00% 16.83 88% 23.67
ZAMBIA 17.58 0.92% 17.21 98% -
ALGERIA 17.08 0.89% 14.97 88% 10.66
EL SALVADOR 15.59 0.81% 15.59 100% 0.57
PACIFIC REGION 15.13 0.79% 14.57 96% 4.29

Thematic global evaluation of European Commission support to the education sector in partner countries(Including basic and secondary education); Final Report Vol. IIb, December 2010; Particip GmbH
46
Country/regionAmount
contracted(€ million)
% on totalamount
contractedAmount
disbursedDisbursement rate
Amountcontractedfor HE and
VET (€million)
BURKINA FASO 13.18 0.69% 12.27 93% 0.52
VANUATU 12.72 0.66% 12.64 99% 3.12
SWAZILAND 10.68 0.56% 3.62 34% -
ZIMBABWE 10.44 0.55% 10.38 99% -
GRENADA 10.11 0.53% 10.11 100% 0.03
MYANMAR 10.09 0.53% 6.21 62% -
NIGER 9.37 0.49% 8.24 88% 4.65
GUINEA ( CONAKRY ) 8.85 0.46% 8.40 95% 0.50
SOMALIA 8.46 0.44% 7.07 84% -
PANAMA 7.98 0.42% 7.69 96% 6.90
ARGENTINA 7.91 0.41% 7.57 96% -
COMOROS 7.65 0.40% 7.29 95% -
SAINT VINCENT AND THEGRENADINES
7.28 0.38% 5.93 81% -
GABON 7.21 0.38% 7.16 99% 0.06
RUSSIA 6.82 0.36% 6.14 90% 10.82
IVORY COAST 6.28 0.33% 6.21 99% 0.81
MADAGASCAR 5.22 0.27% 3.99 76% 0.12
AFGHANISTAN 5.17 0.27% 4.97 96% 3.11
ETHIOPIA 4.90 0.26% 3.77 77% 1.83
LAOS 4.81 0.25% 4.05 84% 0.11
TUVALU 4.44 0.23% 4.42 100% -
LEBANON 4.37 0.23% 3.82 87% 23.45
KIRIBATI 3.99 0.21% 3.87 97% -
NETHERLANDS ANTILLES 3.89 0.20% 3.10 80% -
THAILAND 3.62 0.19% 2.46 68% 3.45
RWANDA 3.49 0.18% 3.06 88% 0.54
TONGA 3.46 0.18% 3.38 98% -
CHINA 3.39 0.18% 3.19 94% 61.59
WEST BANK AND GAZA STRIP 3.32 0.17% 2.63 79% 10.57
PERU 3.23 0.17% 2.66 82% 23.16
WESTERN SAMOA 3.15 0.16% 3.15 100% -
UKRAINE 3.01 0.16% 2.99 99% 5.31
KENYA 2.85 0.15% 1.48 52% 4.81
GAMBIA 2.64 0.14% 2.43 92% -
COOK ISLAND 2.47 0.13% 2.46 100% -
ASIA 2.45 0.13% 2.13 87% 39.87

Thematic global evaluation of European Commission support to the education sector in partner countries(Including basic and secondary education); Final Report Vol. IIb, December 2010; Particip GmbH
47
Country/regionAmount
contracted(€ million)
% on totalamount
contractedAmount
disbursedDisbursement rate
Amountcontractedfor HE and
VET (€million)
CAMEROUN 1.89 0.10% 1.31 69% 2.11
BURUNDI 1.78 0.09% 0.82 46% -
TACIS REGION 1.66 0.09% 1.66 100% 24.53
TADZHIKISTAN 1.53 0.08% 1.20 78% 0.76
SOUTH ASIA REGION 1.41 0.07% 1.27 90% -
SIERRA LEONE 1.34 0.07% 1.20 90% -
GUYANA 1.33 0.07% 1.33 100% -
BOLIVIA 1.27 0.07% 1.12 88% 1.46
SRI LANKA 1.26 0.07% 1.26 100% 0.19
TOGO 1.22 0.06% 1.09 90% 0.49
EGYPT 1.10 0.06% 1.04 94% 15.68
BRAZIL 1.08 0.06% 1.07 100% 2.91
VENEZUELA 1.04 0.05% 1.04 100% 0.47
MALI 0.91 0.05% 0.91 100% 0.05
NIGERIA 0.89 0.05% 0.89 100% 0.19
ARMENIA 0.85 0.04% 0.78 92% 4.68
CHILE 0.85 0.04% 0.77 91% 0.40
BENIN 0.84 0.04% 0.38 45% -
CONGO ( DEMOCRATICREPUBLIC OF )
0.80 0.04% 0.79 99% 1.36
SOLOMON ISLANDS 0.75 0.04% 0.74 99% -
SENEGAL 0.75 0.04% 0.48 65% 1.14
PHILIPPINES 0.68 0.04% 0.68 100% 2.22
PARAGUAY 0.61 0.03% 0.61 100% 1.00
ISRAEL 0.60 0.03% 0.60 100% -
CAPE VERDE 0.59 0.03% 0.31 53% 0.21
MALAWI 0.50 0.03% 0.35 70% -
GHANA 0.48 0.03% 0.48 100% 0.39
URUGUAY 0.44 0.02% 0.44 100% 5.59
CUBA 0.40 0.02% 0.36 90% -
MEXICO 0.39 0.02% 0.39 100% 2.57
GUINEA BISSAU 0.36 0.02% 0.36 100% 0.99
TRINITAD AND TOBAGO 0.25 0.01% 0.25 100% 26.80
LIBERIA 0.25 0.01% 0.24 97% 1.41
LATIN AMERICA COUNTRIES 0.23 0.01% 0.23 100% 26.01
SOUTHERN AFRICA REGION 0.21 0.01% 0.21 100% -
BARBADOS 0.20 0.01% 0.04 20% -

Thematic global evaluation of European Commission support to the education sector in partner countries(Including basic and secondary education); Final Report Vol. IIb, December 2010; Particip GmbH
48
Country/regionAmount
contracted(€ million)
% on totalamount
contractedAmount
disbursedDisbursement rate
Amountcontractedfor HE and
VET (€million)
ECUADOR 0.20 0.01% 0.20 100% 0.38
COLUMBIA 0.19 0.01% 0.19 100% 0.57
UZBEKISTAN 0.16 0.01% 0.16 100% 2.20
NEPAL 0.14 0.01% 0.13 93% 0.55
GEORGIA 0.13 0.01% 0.13 100% 1.95
CENTRAL AFRICANREPUBLIC
0.12 0.01% 0.10 80% 0.36
KIRGHIZSTAN 0.12 0.01% 0.12 98% 0.34
MAURITIUS 0.10 0.00% 0.10 100% -
SYRIA 0.09 0.00% 0.08 88% 27.98
ANTIGUA & BARBUDA 0.09 0.00% 0.09 100% 6.09
SOUTH AMERICA REGION 0.08 0.00% 0.08 100% 99.31
BELARUS 0.07 0.00% 0.07 100% 5.48
DOMINICA 0.05 0.00% 0.05 100% -
CHAD 0.05 0.00% 0.05 100% 0.45
KAZAKHSTAN 0.03 0.00% 0.02 80% 1.46
EAST TIMOR 0.02 0.00% 0.02 100% -
TOTAL 1.913.97 100.00% 1.419.94 74%

Thematic global evaluation of European Commission support to the education sector in partner countries(Including basic and secondary education); Final Report Vol. IIb, December 2010; Particip GmbH
49
2 Annex 3: EC Support to the education sector in partnercountries: Results of the survey to EUDs
The survey to EU Delegations (EUDs) constitutes a major building block of research to strengthen theevidence-base of the evaluation. It aimed at capturing EUDs perceptions on a number of topics suchas policy dialogue, co-ordination, alignment, harmonization, changes in sector performance andoutcomes, and the usefulness of various aid modalities and channels.
The web-survey was launched early January 2010, with a deadline for 23 EUDs selected (= deskstudy sample countries) to respond until January 20, 2010. As only few had responded by that date, itwas extended until January 26, date by which still not more than 50% had responded. A close follow-up allowed the evaluation team to receive responses from 21 out of 23 EUDs. Due to a programmingerror, one section had been omitted in most of the responses. EUDs were asked to fill that gap, whichwas done by most of them.
The survey form including quantitative and qualitative elements is attached. Results are presentedbelow.
2.1 Internal resources for education support
2.1.1 Within the Delegation, at anytime between 2000 and 2007, has there been at least oneperson specifically responsible for support and issues related to education sector,whether or not as part of the Social Sector?
In the overwhelming majority of surveyed EUDs (19 out of 21 that responded) at least one person wasin charge of issues related to education during the period under evaluation. From those that hadnobody in charge, either the Head of Section took responsibility for dealing with education issues, orresponsibility was shared between him and a project officer.
When looking at the detailed figures the picture is as follows:
Information on the earlier evaluation period is rather sketchy.
The majority of EUDs had one person in charge of education during the entire period, withpeaks in 2003 and 2005, where rather frequently two persons were in charge.
Number of staff dealing with education seems to even increase after 2005 where a number ofEUDs indicate have three or even four persons dealing with education
Table 9: Results of survey to EUDs: Evolution of staffing dealing with education in EUDs2001 2003 2005 2007/08
No. of staff No. % No. % No. % No. %No response 8 38% 6 29% 2 10% 2 10%
1 9 43% 10 48% 12 57% 12 57%2 4 19% 5 24% 7 33% 3 14%3 2 9.5%4 2 9.5%
Total observations 21 100% 21 100% 21 100% 21 100%

Thematic global evaluation of European Commission support to the education sector in partner countries(Including basic and secondary education); Final Report Vol. IIb, December 2010; Particip GmbH
50
0
2
4
6
8
10
12
no response 1 2 3 4
No.
of
resp
onse
s
No. of staff dealing with education in EUDs
Staff dealing with Education in EUDs 2003
Delegation responses
0
2
4
6
8
10
12
no response 1 2 3 4
No.
of
resp
onse
s
No. of staff dealing with education in EUDs
Staff dealing with Education in EUDs 2005
Delegation responses
0
2
4
6
8
10
12
no response 1 2 3 4
No.
of
resp
onse
s
No. of staff dealing with education in EUDs
Staff dealing with Education in EUDs 2007/08
Delegation responses
In terms of other education sub-sectors which are concentrated on with a substantial portion of theEUD workload, the responses relate to issues such as adult basic education and training (SouthAfrica), a teacher education programme (Pakistan), sector and policy dialogue (Tanzania and India),all of which could still be categorized as part of the scope of the evaluation, or also regional education(TVET & HE) programmes (Nicaragua).
Apart from GBS, Mozambique noted some workload related to the use of Calls for Proposals (CfP) forprimary education related grants, which was only used once in 2006 with one disbursement to aneducation pool fund, where the EUD was then very active in managing the resulting contracts.
2.1.2 If nobody is specifically in charge/responsible for education, how is your Delegationdealing with issues related to the education sector in general, and with basic andsecondary education in particular?
Only two countries responded on this question (Eritrea and Jamaica) but in both instances theyexhibited continuity to their education work, as the Head of Section continued work on education whenno staff members were available whose task was specifically concerned with education.
2.1.3 What have been the major trends in workload (e.g. regarding sub-sectors supported,shifts from project monitoring to policy dialogue?
Regarding the issue of “shifts in workload during the evaluation period, the shift from projectmonitoring work to sector policy dialogue becomes apparent. This underpins the trend in fundingprovided by the inventory towards various forms of sector support or even GBS. This shift holds truefor all regions (e.g. ACP: Botswana, Burkina Faso, Tanzania, Dominican Republic, Uganda; ALA-Asia:Pakistan, Vietnam; ENPI; Russia, Occupied Palestinian Territory; and ALA-LA: Argentina, Nicaragua),as well as for when these countries are classified as fragile states (Pakistan & Occupied PalestinianTerritory).
When looking at regional programmes, data indicate a certain increase to be managed. However,such regional programmes mainly concern Higher Education, and more limited, TVET, both educationsectors being outside the scope of this evaluation. In terms of impact on workload of such

Thematic global evaluation of European Commission support to the education sector in partner countries(Including basic and secondary education); Final Report Vol. IIb, December 2010; Particip GmbH
51
programmes, the increase seemed to mainly be concentrated in ALA-Asia, especially in relation tohigher education and VET (Bangladesh, India, and Indonesia), while, contrasting to this, Bangladeshnoted a decreasing importance of regional education projects.
Data also clearly indicate a shift in focus on sub-sectors: Several countries had their focus changedfrom one sub-sector to another during the course of the evaluation period (e.g. Dominican Republic:TVET to primary and secondary, India: scope has shifted from primary to also encompass HE,Tajikistan: shift from primary/secondary to VET, or Argentina from primary to including also secondary,TVET & HE).
Overall, responses from the EUDs point to a massive increase in workload for education(specifically mentioned here by India, Botswana, Argentina, Nicaragua and Indonesia but also impliedby responses on policy dialogue). This is partly grounded on the fact that policy dialogue means thataccompanying policy analysis is needed for all education sub-sectors and not merely for one or twosub-sectors. Besides the demands placed on staff in relation to policy analysis in the education sector,the responses show that attending and actively participating in sector working groups and policydialogue is perceived as taking up a great deal of staff working time.
2.1.4 How has the Delegation developed its institutional capacity to deal with educationsector related issues, specifically issues related to basic and secondary education inthe period 2000-2007?
Various means have been employed to maintain and improve EUD institutional capacities to deal witheducation sector related issues. Given the fact that the evaluation period covers the period ofreorganization of EC external aid, including deconcentration, it is apparent that contracting educationor social sector specialists as the main person in charge was the mostly used option among the deskstudy countries (e.g. in Burkina Faso, Ghana, South Africa, Tanzania, Bangladesh, Vietnam, Tunisia,as well as the Occupied Palestinian Territory). Moreover, some EUDs hired additional contractual stafffor short periods to cover peaks and gaps.
Another way of increasing institutional capacity is naturally training: EUDs indicate that staff membersparticipated in training in Brussels on key issues on education (especially related to aid modalitiesemployed). However, it does not become clear from the answers how many staff participated.
A second element to increase capacity respectively for keeping it up to date major trends in theeducation sector can be seen in the participation in thematic meetings organised at HQ. Moreover, alarge EUD, namely India, was able to provide in-house training on managing SBS.
The third element cited as a method of building capacity of education sector staff was “learning on thejob”, among which regular participation in policy dialogue, and maintaining close contacts with relevantEC staff in Brussels.
2.1.5 Other issues raised by the Delegations regarding staffing and workload
The EUDs comments pertain mainly to the lack of qualified staff available to the EUDs (DominicanRepublic, India, Pakistan, Tunisia and Nicaragua prior to 2005). This pattern appeared to be cross-regional as ACP, ALA-Asia, ALA-LA and ENPI EUDs were all included among the responses on a lackof qualified staff. Tunisia mentioned the effects associated with the devolution process on work qualityand finds the transition from Individual experts to contractual agents as really having affected thequality of their work.
A special case is India, which made the important point of the problem of competition between donorsin relation to sector budget support activities and the fact that due to staff shortages the EUD only hadone staff member per programme. If staff were not available to take part in multi-donor meetings dueto illness then it sometimes reflected badly on the work of the Commission compared to other donors’large teams and resources. In India they would use framework contracts to tide them over for thesecond seat on a Joint Review Mission. In Nicaragua as well, for instance, qualified budget supportstaff have only been working in the EUD since November 2007. In one case (Pakistan) the Head ofSection dealt with education sector budget support issues as he had public financial managementexperience.
One of the EUDs (Uganda) thought it would be useful to have education sector specific training on anannual basis.

Thematic global evaluation of European Commission support to the education sector in partner countries(Including basic and secondary education); Final Report Vol. IIb, December 2010; Particip GmbH
52
2.2 The importance of basic and secondary education in the country
2.2.1 In your opinion, how much importance does the National Government attribute toenhancing basic education?
The following table depicts the assessment of the EUDs how they see governments puttingimportance into the following issues related to basic education.
In legal provisions and policy statements;
In policy dialogue with EC and other development partners;
In national budget allocation to basic education; and in
Other issues being considered relevant.
Table 10: Results of survey to EUDs: Perceptions on importance attributed by nationalgovernments to basic education
1st year of reference 2nd year of referenceScoring levelsNo. of
responses% cit. No. of
responses%
In legal provisions and policy statementsNo information available: None 1 5.6% 0 0,0%Low 4 22.2% 0 0,0%Medium 6 33.3% 8 40,0%
High 7 38.9% 12 60,0%Total 18 100.0% 20 100,0%In policy dialogue with EC and other development partnersNo information available: None 3 16.7% 1 5,0%Low 2 11.1% 2 10,0%Medium 9 50.0% 10 50,0%High 4 22.2% 7 35,0%Total 18 100.0% 20 100,0%In national budget allocation to basic educationNo information available: None 2 11.1% 1 5,0%Low 7 38.9% 4 20,0%Medium 3 16.7% 6 30,0%High 6 33.3% 9 45,0%Total 18 100.0% 20 100,0%
Source: EUD survey
Note: The question left open to the respondents which first year he/she wanted to refer to.Therefore, the basis for the answer is a bit heterogeneous. However, most of the answersrefer to 2002 (ten out of 18 responses), followed by 2003 (three out of 18). The same appliesto the second period of reference: most answers refer to 2007 (nine out of 18), followed by2008 (seven out of 18).

Thematic global evaluation of European Commission support to the education sector in partner countries(Including basic and secondary education); Final Report Vol. IIb, December 2010; Particip GmbH
53
0
2
4
6
8
10
12
No informationavailable: None
Low Medium High
No.
of r
espo
nses
Extent of importance attributed
Importance attributed by National Government inlegal provisions and policy statements
1st year of reference 2nd year of reference
0
2
4
6
8
10
12
No informationavailable: None
Low Medium HighN
o. o
f res
pons
es
Extent of importance attributed
Importance attributed by National Government inpolicy dialogue with EC and other partners
1st year of reference 2nd year of reference
0
2
4
6
8
10
12
No informationavailable: None
Low Medium High
No.
of r
espo
nses
Extent of importance attributed
Importance attributed by National Government innational budget allocation
1st year of reference 2nd year of reference
In relation to the degree of importance attributed to basic education in legal provisions andpolicy statements, the majority of EUD responses attributed a high importance level among nationalgovernments for the reference years 2003 (seven out of 19) and 2007 (12 out of 20). For thosecountries where GBS had been instituted (Burkina Faso, Dominican Republic, Ghana, Jamaica,Mozambique, Niger, Tanzania, Uganda and Vietnam), the importance of basic education stayed highand remained high in Mozambique and Uganda, which could show the importance the countryattributed to basic education despite the introduction of GBS. Only in two countries, according to theEUDs, did the importance decrease from high to medium (Tanzania and Vietnam), which tends toreflect the shift in focus of the relevant countries from basic education to other sub-sectors ofeducation.
For countries where either SBS or SWAp approaches have been implemented (Bangladesh,Botswana, India, Indonesia, Nicaragua, Pakistan, Tanzania, Tunisia and Uganda) only Uganda andPakistan indicated the high importance of basic education in legal provisions for both reference years,which tended to echo national priorities rather than the institutionalization of sector dialogue and asector budget support programme. Priority increased for basic education up to ‘high’ for Nicaragua,India and Tunisia, demonstrating at least for the first two countries the concerted effort of sectordialogue on national policy priorities. Moreover, the EUD to Nicaragua noted that on legal provisionsgovernment priority attributed to basic education increased when the general law on education n. 582was introduced in 2007.
However the degree of ‘medium’ responses marked was also quite significant for both 2003 (six out of18) and 2007 (eight out of 21). The GBS countries where medium importance was marked for bothyears only included Ghana, whilst the increase in importance up to medium was only true for BurkinaFaso. Bangladesh (which has sector programme approach) stayed at the medium level for bothreference years on the importance of basic education in national policy, which perhaps indicated themore informal methods of instituting basic education employed in the country. An increase inimportance from low to medium was only registered in Botswana.
The general direction of responses in relation to the importance the national government attachesto enhancing basic education in relation to policy dialogue with the EC and other developmentpartners was marked as mainly (only) medium in 2003 (nine out of 19) and 2007 (ten out of 20). TheGBS countries of Burkina Faso, Ghana and Vietnam all marked policy dialogue as of mediumimportance in 2003, which probably reflects the limited degree of negotiations having been held upuntil then. The SBS countries of Nicaragua, Tunisia, Pakistan, India and Botswana, but alsoBangladesh, all marked policy dialogue as of medium importance in 2003. This tends to show thatpolicy dialogue had already been raised to certain degree of importance in these GBS and SBScountries even as early as 2003, when programmes had not really been properly instituted. It isnoticeable that, with the exception of Tajikistan, all the countries marking this issue as of high(Mozambique, Tanzania, Uganda and Tajikistan) or of medium importance are all either GBS or SBScountries possibly showing the influence of EC and development partner incentives to increasingdialogue.
In 2007 the effects of extensive policy dialogue did not appear to be reflected in the EUD responsesas still only 50% of responses marked the importance as ‘medium’; however, those marking ‘high’ hadgone up. In 2007 the medium importance EUD responses included only two countries which are not in

Thematic global evaluation of European Commission support to the education sector in partner countries(Including basic and secondary education); Final Report Vol. IIb, December 2010; Particip GmbH
54
the process of receiving general or sector budget support; namely Argentina and Occupied PalestinianTerritory. Otherwise, the countries marking medium for both 2003 and 2007 were Botswana, Ghana,Pakistan and Nicaragua, with the other ‘medium’ countries in 2007 being the Dominican Republic,Eritrea, Tanzania and Indonesia.
Four EUD responses attributed a high priority to this issue among national governments in 2003(Mozambique, Tanzania, Uganda and Tajikistan) and 7 in 2007 (Tajikistan, Tunisia, India,Bangladesh, Uganda, Mozambique and Burkina Faso). In 2003, none of the countries were involved inGBS, whereas in 2007 Uganda, Mozambique and Burkina Faso had GBS instituted. In terms of SBS,only Uganda out of the high priority countries in 2003 was implementing SBS, whilst in 2007 Tunisia,India, Bangladesh and Uganda were involved in SBS. Thus the high priority indications for the secondreference year pretty much accords with those countries involved in sector policy dialogue, as wouldbe expected.
In this context, the Nicaragua EUD remarked that between 2003 and 2004 the level of interest wasmedium to high during the period when the education SWAp was being prepared and installed, whilstafter that the importance attributed to basic education policy dialogue trailed off and went to merelymedium between 2005 and 2007 before ‘dialogue consolidation’ set in between 2008 and 2009.
So overall, EUDs seem to perceive a trend towards governments’ increasingly attributing importanceto issues of basic education in the framework of policy dialogue with development partners. This isespecially true for countries that receive sector budget support.
As for the importance as regards national budget allocations, the EUD responses indicate a trendtowards government more and more translating policy commitments on basic education also intobudget allocations required to meet the demands for basic education. Whether policy dialogue onnational budgetary allocations has contributed to such a shift, cannot be confirmed from the purescorings.
Here again the Nicaragua EUD remarked that national budgetary allocations doubled in 2007 and sothe importance of basic education for the national government could be marked as high. But post 2009these allocations have stagnated.
Anyway, when relating the scorings to the type of EC support given, the following appears: thosecountries with high importance marked for 2007 related to the issue of importance given by theGovernments to budgetary allocations for basic education were mainly countries receiving either GBS(Ghana, Mozambique and Uganda) or SBS (Indonesia and Tunisia) and engaged in some form ofbudgetary dialogue on basic education. The other countries marked as allocating a high importance tobasic education in budgetary allocations in 2007, namely Argentina, South Africa, Tajikistan and theOccupied Palestinian Territory appear to reflect national government priorities more than developmentpartner budgetary priorities.
Botswana demonstrated that dialogue with the EC assisted national policy in boosting basic educationowing to lagging indicators towards the end of the evaluation period and the importance of basiceducation increased when it was shown that it is vital to build a solid foundation of basic education forthe entire system.
The comments from the EUDs indicated the disturbing trend in relation to fragile states such asEritrea and Occupied Palestinian Territory where funding from donors for basic education is said to bedecreasing in both cases. The EUD Eritrea mentioned the reduction in funds due to the ‘inhospitableconditions for effective cooperation’ whilst the West Bank mentioned that Western donor funds weredecreasing whilst Arab donors were increasing their funding for basic education.
Meanwhile, the case of Argentina demonstrated the extensive provisioning carried out on improvingthe status of education and enhancing the quality of education in the country. Since 2003 a newlegislative framework for education has been established in order to foster education coverage andquality as a way of tackling social exclusion and poverty. In 2005 the Law on Technical andProfessional Education was passed to reinforce technical schools and renew their training profiles andsystem organization. Additionally, the National Congress approved the Law on Financing ofEducation, establishing a continuous growth in the budget appropriations directed to education, with agoal to increase public investment in education up to 6% of the GDP by 2010. In this sense, thetargets established by the law were overreached since its approval. The reform of the Argentineeducation system was reinforced by the approval in 2006 of the new National Education Law. The Lawintroduces the obligation for the State to provide free secondary education and the universalisation ofinitial (pre-school) education (taking to 13 years the mandatory minimum of education). Other keyfeatures of the approved legislation are related to teachers career and training. On the one hand, it isforeseen in the new law that career development and promotion of the teachers can take place in two

Thematic global evaluation of European Commission support to the education sector in partner countries(Including basic and secondary education); Final Report Vol. IIb, December 2010; Particip GmbH
55
areas: teaching proper and school management. On the other hand, a National Institute for TeachingTraining was created, with the aim to contribute to the cohesion of the system and to increase quality.
Quality issues were also noted as being of major importance in the basic education subsector inSouth Africa, Indonesia, Occupied Palestinian Territory and Nicaragua. South Africa focused onradical curriculum reforms, Indonesia and Occupied Palestinian Territory initially focused onconstruction of schools but later strategies focused on quality in response to development partnerpriorities for the latter case, whilst Nicaragua’s old and new strategies from the evaluation period bothfocused on quality.
On the issue of ownership, the conflicting examples of Bangladesh and Eritrea were noticeable. Theattitude of Bangladesh’s government to dialogue on basic education has improved and become morepositive whilst Eritrea’s has turned in the opposite direction and this has strongly influenceddevelopment partner spending on this sub-sector.
The benefits of dialogue are clearly an impetus to increasing importance of basic education in thenational governments and Tunisia is a case in point according to their comments. With the entry intoforce of the new budget sector dialogue instrument in 2005 the quality of dialogue improvedsubstantially and became far more open.
The following can be summarized:
Table 11: Results of survey to EUDs: Perceptions on importance attributed by nationalgovernments towards enhancing basic education – some trends
Issue Observations/findings/trendsIn legal provisions andpolicy statements
The high importance attributed to basic education is reflected in the legal provisionsand policy documents mentioned. Most EUDs mentioned the national governments’concerted efforts at legal provisioning for education over the evaluation period (e.g. inBurkina Faso, Dominican Republic, Indonesia, Pakistan, Russia, Tajikistan,Argentina & Nicaragua). A shift from access to quality was noted by a few EUDs(South Africa, Indonesia, Occupied Palestinian Territory and Nicaragua).
In policy dialogue withEC and otherdevelopment partners
In relation to the medium importance attributed to policy dialogue with the EC andother development partners overall, it was difficult to detect any trends from theresponses that the EUDs provided. Policy dialogue has been recorded as havingincreased but the reasons for the medium importance are not clear, despite theintroduction of GBS or SBS in most of the ‘medium’ response countries during thecourse of the evaluation period.
In national budgetallocation to basiceducation
National budgetary allocations for education in general were discussed but notalways specifically in relation to basic education. The responses trend of basiceducation mainly having a low priority in 2003 to having a high priority in nationalbudget allocations in 2007 is not entirely traceable in the comments from the EUDsthereafter.
Other, please specify The comments from Nicaragua emphasize the changing nature of governmentpriorities according to international or national policy priorities.
2.2.2 In your opinion, how much importance does the National Government attribute toenhancing secondary education?
The following tables depict the EUD perceptions on importance attributed by national governmentstowards enhancing secondary education.
Table 12: Results of survey to EUDs: Perceptions on importance attributed by nationalgovernments towards enhancing secondary education
1st year of reference 2nd year of referenceScoring levelsNo. of
responses% cit. No. of
responses%
In legal provisions and policy statementsNo information available:None
4 22,2% 1 5,0%
Low 8 44,4% 2 10,0%Medium 3 16,7% 7 35,0%High 3 16,7% 10 50,0%Total 18 100,0% 20 100,0%

Thematic global evaluation of European Commission support to the education sector in partner countries(Including basic and secondary education); Final Report Vol. IIb, December 2010; Particip GmbH
56
1st year of reference 2nd year of referenceScoring levelsNo. of
responses% cit. No. of
responses%
In policy dialogue with EC and other development partnersNo information available:None
5 27,8% 2 10,0%
Low 6 33,3% 6 30,0%Medium 5 27,8% 9 45,0%High 2 11,1% 3 15,0%Total 18 100,0% 20 100,0%In national budget allocation to basic educationNo information available:None
6 33,3% 3 15,0%
Low 6 33,3% 2 10,0%Medium 4 22,2% 8 40,0%High 2 11,1% 7 35,0%Total 18 100,0% 20 100,0%
Source: EUD survey
Note: The question left open to the respondents which first year he/she wanted to refer to, thebasis for the answer is a bit heterogeneous. However, most of the answers refer to 2002 (tenout of 18), followed by 2003 (three out of 18) (indicated in the table as ‘1st year of reference).The same applies to the second period of reference: most answers refer to 2007 (nine out of18), followed by 2008 (seven out of 18) (indicated in the table as 2nd year of reference).
0123456789
10
No informationavailable: None
Low Medium High
No.
of
resp
onse
s
Extent of importance
Importance of secondary education in legal provisionsand policy statements
1st year of reference 2nd year of reference
0123456789
10
No informationavailable: None
Low Medium High
No.
of
resp
onse
s
Extent of importance
Importance of secondary education in policy dialoguewith EC and others
1st year of reference 2nd year of reference
0123456789
10
No informationavailable: None
Low Medium High
No.
of
resp
onse
s
Extent of importance
Importance of secondary education in national budgetallocation
1st year of reference 2nd year of reference

Thematic global evaluation of European Commission support to the education sector in partner countries(Including basic and secondary education); Final Report Vol. IIb, December 2010; Particip GmbH
57
According to the EUDs:
In 2002, secondary education had a low degree of importance in legal provisions andpolicy statements according to the EUDs (eight out of 18), whilst in 2007 that importance hadjumped to high (ten out of 20).
Policy dialogue was marked as mainly of low priority for secondary education (six out of 18responses provided) in 2002 and of medium priority in 2007 (nine out of 20 responses).
The importance accorded to national budgetary allocations on secondary educationappeared to be mainly low (six out of 18 responses) in 2002 and medium in 2007 (eight out of20 responses provided). Noticeable is also the fact that six out of 18 responses were markedas having no information available: none in 2002, and three out of 18 in 2007, which shows thelimited statistics available on secondary education allocations.
For the category ‘other’, Nicaragua again mentioned that the comments made for basiceducation above also hold true for secondary education.
From the responses, secondary education seemed to have been largely overlooked towardsthe beginning of the evaluation period and then some concerted efforts were employed toredress this imbalance towards the end of the evaluation period.
Surprisingly (or perhaps fittingly) almost all EUDs marking the importance of secondary educationin legal provisions and policy statements in their partner country as low in 2002 were countrieswhich subsequently had an SBS or at least a sector approach instituted (Bangladesh, India,Nicaragua, Pakistan, Tanzania and Tunisia). Argentina and Vietnam were the two exceptions to thisrule.
For 2007, 50% of respondents marked the importance as high, where four of the respondents wereinvolved in considerable SBS (India, Indonesia, Tunisia and Uganda), with two countries involved inGBS (Dominican Republic and Uganda). The other respondents marking this issue as of highimportance in 2007 probably reflect national secondary education priorities (Argentina, Russia, SouthAfrica and Tajikistan).
In relation to policy dialogue one would expect that SBS countries mainly rank secondary educationas a high priority for the second reference year, when implementing sector-wide policies for the entireeducation sector. However, 45% of respondents marked ‘medium’ in 2007 out of which sevencountries were SBS countries (Bangladesh, Botswana, India, Indonesia, Nicaragua, Tanzania andPakistan) and three were GBS countries (Dominican Republic, Ghana and Tanzania). Uganda,Tunisia and Tajikistan remarked that policy dialogue was of high importance in 2007, where Uganda isboth a GBS and an SBS country, Tunisia an SBS country and Tajikistan was recipient of neither atthat time.
The lack of priority of secondary education for most of the respondent countries is evident in theirnational budgetary allocations on secondary education for the years 2002 and 2007, going frommainly low to mainly medium importance, according to EUDs. Those countries where the importanceincreased from low to medium between 2002 and 2007 included three SBS (or the like) countries;namely India, Nicaragua and Tanzania, which had all instituted this aid modality during that timeframe.
The preliminary conclusions one can draw from the results for this section are that secondaryeducation has often been neglected in national education policies and this is only justbeginning to be addressed.
The general trends of the EUD comments would appear to indicate that there is a lack of quality andcoverage of secondary education in most countries surveyed and this is currently (starting towardsthe end of the evaluation period) trying to be addressed. Pakistan points to the fact that the previousfocus had been on primary education but with the SBS in Sindh the focus had shifted to the educationsector as a whole. Tunisia made the interesting point that the lack of quality in this sub-sector hadintensified dialogue with headquarters and with Ministry staff.
A focus on improving the quality of secondary education can be evidenced in the comments fromSouth Africa and Bangladesh and a new and intense focus on developing this sub-sector in otherresponses with free secondary education in Tanzania and universal secondary education plans inArgentina.
The ‘later’ attention given to secondary education is evidenced by the plans in India on improvingsecondary education being included in the 2007-2012 five-year plan or the Tanzanian roll-out of free
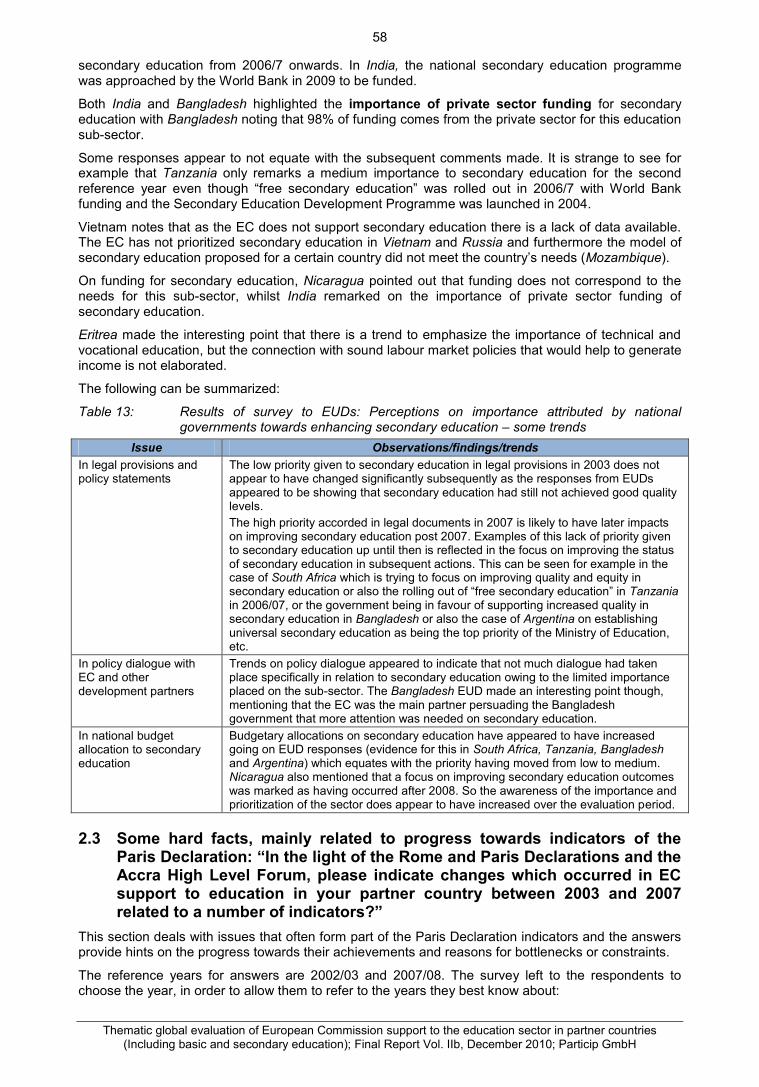
Thematic global evaluation of European Commission support to the education sector in partner countries(Including basic and secondary education); Final Report Vol. IIb, December 2010; Particip GmbH
58
secondary education from 2006/7 onwards. In India, the national secondary education programmewas approached by the World Bank in 2009 to be funded.
Both India and Bangladesh highlighted the importance of private sector funding for secondaryeducation with Bangladesh noting that 98% of funding comes from the private sector for this educationsub-sector.
Some responses appear to not equate with the subsequent comments made. It is strange to see forexample that Tanzania only remarks a medium importance to secondary education for the secondreference year even though “free secondary education” was rolled out in 2006/7 with World Bankfunding and the Secondary Education Development Programme was launched in 2004.
Vietnam notes that as the EC does not support secondary education there is a lack of data available.The EC has not prioritized secondary education in Vietnam and Russia and furthermore the model ofsecondary education proposed for a certain country did not meet the country’s needs (Mozambique).
On funding for secondary education, Nicaragua pointed out that funding does not correspond to theneeds for this sub-sector, whilst India remarked on the importance of private sector funding ofsecondary education.
Eritrea made the interesting point that there is a trend to emphasize the importance of technical andvocational education, but the connection with sound labour market policies that would help to generateincome is not elaborated.
The following can be summarized:
Table 13: Results of survey to EUDs: Perceptions on importance attributed by nationalgovernments towards enhancing secondary education – some trends
Issue Observations/findings/trendsIn legal provisions andpolicy statements
The low priority given to secondary education in legal provisions in 2003 does notappear to have changed significantly subsequently as the responses from EUDsappeared to be showing that secondary education had still not achieved good qualitylevels.The high priority accorded in legal documents in 2007 is likely to have later impactson improving secondary education post 2007. Examples of this lack of priority givento secondary education up until then is reflected in the focus on improving the statusof secondary education in subsequent actions. This can be seen for example in thecase of South Africa which is trying to focus on improving quality and equity insecondary education or also the rolling out of “free secondary education” in Tanzaniain 2006/07, or the government being in favour of supporting increased quality insecondary education in Bangladesh or also the case of Argentina on establishinguniversal secondary education as being the top priority of the Ministry of Education,etc.
In policy dialogue withEC and otherdevelopment partners
Trends on policy dialogue appeared to indicate that not much dialogue had takenplace specifically in relation to secondary education owing to the limited importanceplaced on the sub-sector. The Bangladesh EUD made an interesting point though,mentioning that the EC was the main partner persuading the Bangladeshgovernment that more attention was needed on secondary education.
In national budgetallocation to secondaryeducation
Budgetary allocations on secondary education have appeared to have increasedgoing on EUD responses (evidence for this in South Africa, Tanzania, Bangladeshand Argentina) which equates with the priority having moved from low to medium.Nicaragua also mentioned that a focus on improving secondary education outcomeswas marked as having occurred after 2008. So the awareness of the importance andprioritization of the sector does appear to have increased over the evaluation period.
2.3 Some hard facts, mainly related to progress towards indicators of theParis Declaration: “In the light of the Rome and Paris Declarations and theAccra High Level Forum, please indicate changes which occurred in ECsupport to education in your partner country between 2003 and 2007related to a number of indicators?”
This section deals with issues that often form part of the Paris Declaration indicators and the answersprovide hints on the progress towards their achievements and reasons for bottlenecks or constraints.
The reference years for answers are 2002/03 and 2007/08. The survey left to the respondents tochoose the year, in order to allow them to refer to the years they best know about:
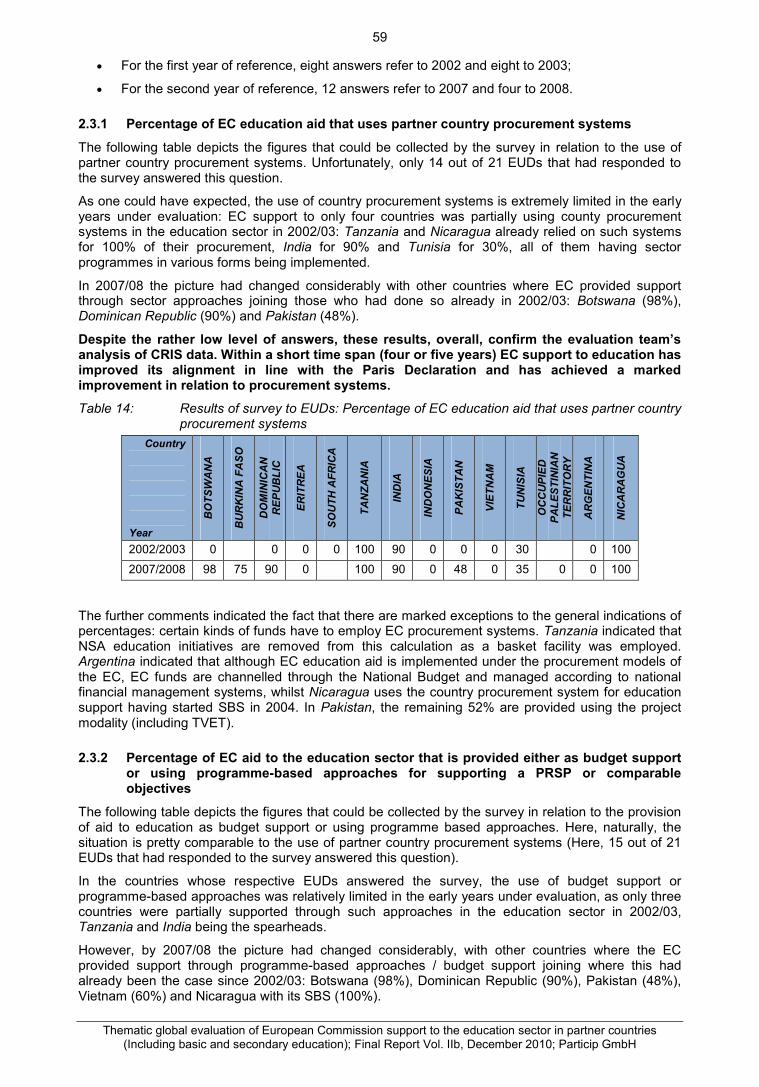
Thematic global evaluation of European Commission support to the education sector in partner countries(Including basic and secondary education); Final Report Vol. IIb, December 2010; Particip GmbH
59
For the first year of reference, eight answers refer to 2002 and eight to 2003;
For the second year of reference, 12 answers refer to 2007 and four to 2008.
2.3.1 Percentage of EC education aid that uses partner country procurement systems
The following table depicts the figures that could be collected by the survey in relation to the use ofpartner country procurement systems. Unfortunately, only 14 out of 21 EUDs that had responded tothe survey answered this question.
As one could have expected, the use of country procurement systems is extremely limited in the earlyyears under evaluation: EC support to only four countries was partially using county procurementsystems in the education sector in 2002/03: Tanzania and Nicaragua already relied on such systemsfor 100% of their procurement, India for 90% and Tunisia for 30%, all of them having sectorprogrammes in various forms being implemented.
In 2007/08 the picture had changed considerably with other countries where EC provided supportthrough sector approaches joining those who had done so already in 2002/03: Botswana (98%),Dominican Republic (90%) and Pakistan (48%).
Despite the rather low level of answers, these results, overall, confirm the evaluation team’sanalysis of CRIS data. Within a short time span (four or five years) EC support to education hasimproved its alignment in line with the Paris Declaration and has achieved a markedimprovement in relation to procurement systems.
Table 14: Results of survey to EUDs: Percentage of EC education aid that uses partner countryprocurement systems
Country
Year
BO
TSW
AN
A
BU
RK
INA
FA
SO
DO
MIN
ICA
NR
EPU
BLI
C
ERIT
REA
SOU
TH A
FRIC
A
TAN
ZAN
IA
IND
IA
IND
ON
ESIA
PAK
ISTA
N
VIET
NA
M
TUN
ISIA
OC
CU
PIED
PALE
STIN
IAN
TER
RIT
OR
Y
AR
GEN
TIN
A
NIC
AR
AG
UA
2002/2003 0 0 0 0 100 90 0 0 0 30 0 100
2007/2008 98 75 90 0 100 90 0 48 0 35 0 0 100
The further comments indicated the fact that there are marked exceptions to the general indications ofpercentages: certain kinds of funds have to employ EC procurement systems. Tanzania indicated thatNSA education initiatives are removed from this calculation as a basket facility was employed.Argentina indicated that although EC education aid is implemented under the procurement models ofthe EC, EC funds are channelled through the National Budget and managed according to nationalfinancial management systems, whilst Nicaragua uses the country procurement system for educationsupport having started SBS in 2004. In Pakistan, the remaining 52% are provided using the projectmodality (including TVET).
2.3.2 Percentage of EC aid to the education sector that is provided either as budget supportor using programme-based approaches for supporting a PRSP or comparableobjectives
The following table depicts the figures that could be collected by the survey in relation to the provisionof aid to education as budget support or using programme based approaches. Here, naturally, thesituation is pretty comparable to the use of partner country procurement systems (Here, 15 out of 21EUDs that had responded to the survey answered this question).
In the countries whose respective EUDs answered the survey, the use of budget support orprogramme-based approaches was relatively limited in the early years under evaluation, as only threecountries were partially supported through such approaches in the education sector in 2002/03,Tanzania and India being the spearheads.
However, by 2007/08 the picture had changed considerably, with other countries where the ECprovided support through programme-based approaches / budget support joining where this hadalready been the case since 2002/03: Botswana (98%), Dominican Republic (90%), Pakistan (48%),Vietnam (60%) and Nicaragua with its SBS (100%).

Thematic global evaluation of European Commission support to the education sector in partner countries(Including basic and secondary education); Final Report Vol. IIb, December 2010; Particip GmbH
60
It is to be noted that the respondent from Bangladesh indicated that in 2007 most education supportwas provided using a sector support programme (PDPEP II), whilst Pakistan mentioned educationsupport (including TVET) was predominantly provided using a project modality (apart from the SindhEducation Reform Program which is a sector support programme). Otherwise, the EUD in Tajikistanindicated that the country was granted 13.5 mio. USD under the FTI Catalytic Fund for 2010-2011, theimplementation of which is being entrusted to the MoE, with the WB as fund administrator, by usinggovernment procurement systems.
This also demonstrates some progress made in the education sector on one of the Paris Declarationindicators for harmonisation.
Table 15: Results of survey to EUDs: Percentage of EC aid to the education sector that isprovided either as budget support or using programme-based approaches forsupporting a PRSP or comparable objectives
Country
Year
BO
TSW
AN
A
BU
RK
INA
FA
SO
DO
MIN
ICA
NR
EPU
BLI
C
ERIT
REA
SOU
TH A
FRIC
A
TAN
ZAN
IA
IND
IA
Ban
glad
esh
IND
ON
ESIA
PAK
ISTA
N
VIET
NA
M
TUN
ISIA
OC
CU
PIED
PALE
STIN
IAN
TER
RIT
OR
Y
AR
GEN
TIN
A
NIC
AR
AG
UA
2002/2003 0 0 0 0 95 90 0 0 0 0 20 0 02007/2008 98 75 90 0 95 90 60 0 48 60 30 0 0 100
2.3.3 Number of EC-supported project implementation units running parallel to governmentinstitutions within the education sector
The following table depicts the figures that could be collected by the survey in relation to projectimplementation units running parallel to government institutions within the education sector.
For the first reference year one EUD indicated that there were four parallel projectimplementation units - PIU (South Africa), 7 out of 14 EUDs indicated one parallel PIU, and sixout of 14 EUDs indicated that there were no education-related PIUs at all in operation in theircountry.
For the second reference year, out of 15 responses only two indicated that there was one parallel PIUand all the other respondents indicated that no parallel PIUs existing any more. The trend clearly wasto phase out parallel PIUs during the course of the evaluation period (e.g. Nicaragua has had nonesince 2005, Argentina includes Technical Units implementing EC aid in the MoE, Tajikistan is phasingout PIUs in the education sector, whilst Uganda mentioned that a PIU was transferred fromindependent arrangement to being included in the Ministry by the end of 2007.
While the average number of parallel units for the first year was 0.79, it had shrunk to 0.13 units onaverage for the second reference year (among the 14 EUDs who answered this question). In terms ofquantitative responses, this clearly demonstrates the progress of the surveyed EUDs in achievingParis Declaration indicators, and also underlines the move towards sector approaches which are nolonger in need of PIUs.The survey also provided some room for qualitative comments on the question. Some EUDs indicatedthat no data was available to EUD staff on the issue of parallel PIUs (e.g. in Jamaica, Tajikistan).Others commented that there were PIUs in operation which are not classified as parallel PIUsaccording to the EC definition31 (e.g. Indonesia had three such PIUs).It is to be noted that Bangladesh indicated that in 2007 most education support was provided using asector support programme (PDPEP II), whilst Pakistan mentioned education support (including TVET)was also provided using a project modality (apart from the Sindh Education Reform Program which isa sector support programme). Otherwise, the EUD in Tajikistan indicated that the country was granted13.5 mio. USD under the FTI Catalytic Fund for 2010-2011, the implementation of which is beingentrusted to the MoE, with the WB as fund administrator, by using government procurement systems.
This also demonstrates some progress made in the education sector on one of the Paris Declarationindicators for harmonisation.
31 We assume the Delegation refers to the definition provided in the Backbone Strategy (EuropeAid (2008): TheReforming Technical Cooperation and Project Implementation Units for External Aid provided by the EuropeanCommission. A Backbone Strategy)

Thematic global evaluation of European Commission support to the education sector in partner countries(Including basic and secondary education); Final Report Vol. IIb, December 2010; Particip GmbH
61
Table 16: Results of survey to EUDs: Number of EC-supported project implementation unitsrunning parallel to government institutions within the education sector
Country
YearB
OTS
WA
NA
BU
RK
INA
FA
SO
DO
MIN
ICA
NR
EPU
BLI
C
ERIT
REA
Gha
na
SOU
TH A
FRIC
A
TAN
ZAN
IA
Ban
glad
esh
IND
IA
IND
ON
ESIA
PAK
ISTA
N
VIET
NA
M
TUN
ISIA
OC
CU
PIED
PALE
STIN
IAN
TER
RIT
OR
Y
AR
GEN
TIN
A
NIC
AR
AG
UA
2002/2003 1 1 0 1 0 4 0 1 0 1 1 0 0 12007/2008 0 0 0 1 0 n/a 0 0 0 0 0 1 0 0 0 0
It is to be noted that some EUDs indicated that no data was available to EUD staff on the issue ofparallel PIUs (e.g. in Jamaica and Tajikistan). Other comments demonstrated that there were PIUs inoperation but they are not classed as parallel PIUs according to the EC definition32 (e.g. Indonesia hadthree PIUs). Otherwise, the trend was to phase out PIUs during the course of the evaluation period orstill ongoing, i.e. Nicaragua has had none since 2005, Argentina includes Technical Unitsimplementing EC aid in the MoE, Tajikistan is phasing out PIUs in the education sector, whilst Ugandamentioned that a PIU was transferred from independent arrangement to being included in the Ministryby the end of 2007. In Eritrea, support to ESDP is managed by a PIU, as this was the option preferredby the Government.
2.3.4 Number of joint field missions regarding support to education (Government, EC andother development partners)
As with the previous Paris Declaration indicators, progress has also been made on increasing thenumber of joint field missions. The average number of joint field missions for the first reference yearwas 1.60 whilst the corresponding figure for the second reference year had increased to 3.17.However, it should be noted that figures for the early years under evaluation are rather limited, as onlyfive EUDs were in the position to answer the question, with the highest number of joint missions(namely two) being performed in India, Tunisia and Burkina Faso. For the second reference year theleading lights are Argentina and Occupied Palestinian Territory33 with the highest number; namelyeight joint missions. However, the figure for Occupied Palestinian Territory seems to mainly concerntertiary education, where the EC, together with the World Bank, is engaged.
But even when not considering this high figure, the results would still demonstrate that the surveyedEUDs are making good progress on increasing the numbers of joint missions in the education sector.
Table 17: Results of survey to EUDs: Number of joint field missions regarding support toeducation (Government, EC and other development partners)Country
Year
BO
TSW
AN
A
BU
RK
INA
FA
SO
Tanz
ania
Ban
glad
esh
IND
IA
PAK
ISTA
N
VIET
NA
M
TUN
ISIA
OC
CU
PIED
PALE
STIN
IAN
TER
RIT
OR
YTa
jikis
tan
AR
GEN
TIN
A
NIC
AR
AG
UA
2002/2003 2 2 1 2
2007/2008 1 2 1 3 2 2 2 4 8 1 8 3
Furthermore, where sector budget support are being implemented in the education sector there hasusually been a fair degree of planned harmonization (e.g. in Bangladesh, India, Tanzania, Uganda)with various forms of field missions, e.g. Joint Review Missions/Monitoring Missions, taking place, andrelevant stakeholders being involved, e.g. also CSOs as for instance in Tanzania.
However, also countries which are focusing on a project modality have still been able to carry out jointproject field visits (e.g. Eritrea or Occupied Palestinian Territory).
32 We assume the Delegation refers to the definition provided in the Backbone Strategy (EuropeAid (2008): TheReforming Technical Cooperation and Project Implementation Units for External Aid provided by the EuropeanCommission. A Backbone Strategy)33 The figure for the Occupied Palestinian Territory seems to mainly concern tertiary education, where the EC,together with the World Bank, is engaged. This project seems to be entirely managed by the Ministry of Educationand Higher Education (MoEHE) with twice-yearly joint missions between the three parties.

Thematic global evaluation of European Commission support to the education sector in partner countries(Including basic and secondary education); Final Report Vol. IIb, December 2010; Particip GmbH
62
2.3.5 Degree to which shared analytical work of support to education is taking place(Government, EC and other development partners)
When looking a the degree to which shared analytical work between Government, EC and otherdevelopment partners has developed during the evaluation period, the trends are as follows:
For the first reference year (2002/03), six EUDs out of 16 responding EUDs indicated thatshared analytical work is being carried out to a ‘limited extent’ (Nicaragua, Vietnam, Pakistan,Bangladesh, Burkina Faso & Botswana), two EUDs indicated to aa ‘medium extent’ (Tanzaniaand Tunisia), and two to a ’high extent’ (India and Uganda) of shared analytical work. Theremaining six EUDs indicated that no shared analytical work was being carried out or that thisquestion was not applicable. None of the respondents stated that such works pertained to theoption had reached a ‘very high extent’. When these results are conjoined with available dataon the type of modality employed to support education, it appears that where already sectorapproaches had already been implemented during the early period under evaluation, the notionof jointly working on analysis had already been spread and there existed a greater amount ofjoint analytical work.
For the second reference year (2007/08), the picture appears to have changed substantially, tonow only two out of 16 EUDs indicating a ‘limited extent’ of shared work (Eritrea and Indonesiawho had previously indicated their response as not applicable), six EUDs indicated ‘mediumextent’ (Burkina Faso, Ghana, Vietnam, Pakistan, Bangladesh and Occupied PalestinianTerritory), five EUDs indicated ‘high extent’ (Tunisia, Argentina, Nicaragua, India andBotswana; out of which all but Argentina are recipients of sector budget support) and twoEUDs (Tanzania and Uganda) even indicated to a ‘very high extent’. Again this shows, with theexception of Argentina, the direct effect of more “advanced” forms of sector support – namelySBS (Tanzania, Nicaragua, Tunisia, India, Botswana) – and/or GBS (Uganda, Tanzania) onthe need to undertake analytical work in a shared form. On the other hand, Burkina Faso,Ghana, Vietnam are rather countries where GBS in various forms has prevailed with less directinfluence on what is happening in the education sector; perhaps therefore the scoring ismodest.
The results demonstrate the steady progress on eliminating a doubling up of analytical work andperforming more shared efforts.
Table 18: Results of survey to EUDs: Degree to which shared analytical work of support toeducation is taking place (Government, EC and other development partners)
Country
Year
BO
TSW
AN
A
BU
RK
INA
FA
SO
DO
MIN
ICA
NR
EPU
BLI
C
ERIT
REA
Gha
na
SOU
TH A
FRIC
A
TAN
ZAN
IA
Uga
nda
Ban
glad
esh
IND
IA
IND
ON
ESIA
PAK
ISTA
N
VIET
NA
M
TUN
ISIA
OC
CU
PIED
PALE
STIN
IAN
TER
RIT
OR
Y
AR
GEN
TIN
A
NIC
AR
AG
UA
2002/2003 1 1 0 N/A N/A 0 2 3 1 3 N/A 1 1 2 N/A 1
2007/2008 4 2 0 N/A 2 4 4 2 3 1 2 2 3 2 3 3Legend:N/A= not applicable 2= medium extentNone=0 3= high extent1= limited extent 4= very high extent
2.3.6 Percentage of EC aid disbursement to education released according to agreedschedules
It is difficult to make any quantitative conclusions related to “percentage of EC aid disbursement toeducation released according to agreed schedules” from the figures obtained from the rather fewEUDs that provided answers to the question. The following table depicts the figures that could becollected by the survey from eight EUDs.
The comments clearly indicate that certain projects or programmes were delayed and so were notable to abide by the agreed release schedule (e.g. Indonesia for certain projects and Eritreaexperienced severe delays). Moreover the experience made by Tanzania on the start of sector andbudget support programmes indicates that moving to SBS may require Governments to go though alearning curve in order to be able to provide substantiated requests for disbursements. On the other

Thematic global evaluation of European Commission support to the education sector in partner countries(Including basic and secondary education); Final Report Vol. IIb, December 2010; Particip GmbH
63
hand, the example of Pakistan shows that sector indicators need to be met for tranches to bereleased: the release of the first tranche of Sindh Education Reform Programme had been scheduledfor release in 2007 but was delayed as two key issues (merit-based teacher recruitment and GoSSERP ownership) had not been adequately resolved; disbursement was therefore only made inOctober 2008. The same applies to the support to secondary education in Tunisia.
Although not quantified in the table below, it should be mentioned that Nicaragua experienced veryhigh rates of disbursement for the sector budget support to education (PAPSE) between 2004 and2007 of 96.6% of the total by the end of the programme. However, only 75.8% of variable trancheamounts have been paid. Unfortunately the EUD does not indicate reasons for the non-payment.
Table 19: Results of survey to EUDs: Percentage of EC aid disbursement to educationreleased according to agreed schedules
Country
Year
BO
TSW
AN
A
DO
MIN
ICA
NR
EPU
BLI
C
SOU
TH A
FRIC
A
IND
IA
IND
ON
ESIA
PAK
ISTA
N
VIET
NA
M
TUN
ISIA
2002/2003 50 50 100 0 100 80 202007/2008 60 100 100 50 50 80 35
2.3.7 The Paris Declaration also indicates the need for "joint and harmonised educationassistance strategies". How joint and harmonized would you assess educationassistance strategies of the donor community in your country?
Out of 20 EUDs giving their rating on how joint and harmonized they perceive the educationassistance strategies of the donor community in the country, the medium category was used mostly,i.e. six out of 20 responses (Burkina Faso, Dominican Republic, Vietnam, Occupied PalestinianTerritory, Tajikistan and Argentina). five out of 20 EUDs (25%, Ghana, Tanzania, Uganda, Tunisia,Nicaragua) responded that harmonization of strategies was ‘high’ whilst only two out of 20 (10%)indicated that harmonization was considered being as ‘very high’ (e.g. in India and Mozambique).
From the results it would appear that harmonization of strategies is at good levels five years after theagreement with the Paris Declaration.
Table 20: Results of survey to EUDs: Existence of joint and harmonized education assistancestrategies
Scoring levels No. ofresponses
%
Very high 2 10,0%High 5 25,0%Medium 6 30,0%Low 2 10,0%Very low 2 10,0%Not at all 0 0,0%N/A 3 15,0%Total 20 100,0%
0
1
2
3
4
5
6
Very high High Medium Low Very low Not at all N/A
No.
of
res
pons
es
Degree of harmonization
Existence of joint and harmonized education assistancestrategies
Extent of harmonized strategies
From the detailed answers related to the scorings some further trends can be derived:
The very high responses for India and Mozambique seem to reflect considerable efforts thathave gone into coordination combined with the existence of long-standing cooperation andbroad-based discussion fora.
Detailed answers of those EUDs indicating ‘high’ are close to the first category of answers,also indicating cooperation in the education sector (working) group being in place (Ghana) andall projects being jointly monitored in that group, and a functioning sector dialogue being inplace (Tanzania and Nicaragua) in countries receiving sector budget support (and partly GBS).

Thematic global evaluation of European Commission support to the education sector in partner countries(Including basic and secondary education); Final Report Vol. IIb, December 2010; Particip GmbH
64
At the medium scale, where most respondents assessed their position (six out of 20), certain(recent) efforts at harmonizing education assistance strategies were registered (DominicanRepublic), while despite the fact that no formal coordination mechanism is in place inArgentina, dialogue with Government and other donors seems to contribute to a certain degreeof harmonisation.
Respondents from EUDs to Indonesia and Pakistan found there to be a low degree ofharmonisation with a greater focus more on information sharing. While the situation seems tohave improved in Indonesia after 2007, probably as a consequence of the existence of a donorEducation Sector Working Group, Pakistan seems to be a case where still patchwork related toeducation support still prevails. However, the EUD also noted some progress in that regard:
o In Sindh three major donors work in education: the WB, the EC and USAID. The ECEUD led the donor roundtable in Sindh in 2004 to formulate Sindh's Education SectorPlan and has, since then and according to the EUD, remained a dominant member ofthe Sindh Education Donors Group. The WB and the EC hold regular consultationsthrough their Joint Review Missions (JRMs) of the Sindh Education Plan SupportProgramme, whilst coordination with USAID rather takes place at project level (e.g.out of the 23 districts in Sindh, it has been agreed that USAID will upgrade theeducation management system of 11 districts and EC funds will do the same for theremaining 12).
o Moreover, very recently, in the North Western Frontier Province (NWFP), all donorsincluding the WB, AusAid, USAID, DfID, the Netherlands, JICA, and Norway assistedthe GoNWFP in finalising a fully costed Education Sector Plan. In addition, all donorshave agreed to work together in a Sector Wide Approach in NWFP and amemorandum of understanding has been prepared in that regard, which seems tohave been signed by the majority of donors.
In terms of very low ratings, the scoring for Eritrea represents a clear case for of agovernments not taking up responsibility for ensuring harmonized support or assessments (norfor of providing relevant budget information that would be required to produce a kind of jointassistance strategy), while the answer from the South African EUD points to the fact thateducation donors supporting education in South Africa were still rather working in isolation until2006, a fact that seems to have changed since, then due to efforts of jointly developing the2007-2013 CSP for the country together with EU MS.
Three EUDs marked the question as “not applicable”, namely ratings related to Jamaica (as they arenot involved in the sector and provide aid via GBS), Botswana, with very few education sector donors;and Russia, who is also not an official ODA recipient.
2.4 Changes in sector performance and outcomes
2.4.1 For the period 2000 - 2007, how would you, overall, rate the EC's contribution toimproving education sector performance and outcomes in basic and secondaryeducation in the country?
The following table depicts the figures that could be collected by the EUD survey regarding the EUD’sperception of EC's contribution to improving education sector performance and outcomes in basic andsecondary education in the country. Here, EUDs assume that the EC has contributed to improvingeducation sector outcomes to a medium to considerable extent on the whole, as 12 out of 19responses (63%) pertained to the second and third highest options. Out of 19 respondents, six foundthe EC’s contribution to be ‘significant’ and another six EUDs found the EC’s contribution to be of‘medium significance’. None of the respondents indicated the highest option of ‘very significant’. ThreeEUD responses pertained to the option ‘less significant’ and two to ‘not at all significant’. But it is alsonoteworthy that the option of having made no progress in sector performance and outcomes was notchosen by any of the respondents.
The responses pertaining to the highest chosen option of ‘significant’ relate to Tanzania, Uganda,India, Tajikistan, Argentina and Nicaragua, where all but Tajikistan and Argentina have been recipientsof EC sector budget support. Tanzania and Uganda are also recipients of general budget support. Forthose indicating ‘medium significance’ Bangladesh is a recipient of a form of sector support andGhana, Mozambique and Vietnam are recipients of general budget support with the OccupiedPalestinian Territory and Eritrea being the exception not receiving either SBS or GBS.

Thematic global evaluation of European Commission support to the education sector in partner countries(Including basic and secondary education); Final Report Vol. IIb, December 2010; Particip GmbH
65
The countries indicating ‘less significant’ were Botswana, South Africa and Pakistan. Where SouthAfrica is concerned this may be because the volume of EC aid to the education sector is lowcompared to the general education budget in the country. However, for Botswana and Pakistan thisresponse is quite disturbing considering the fact that Pakistan is the recipient of the third largestamount of EC aid to the education sector according to the inventory (€ 110 million committed) for theperiod 2000-2007, whilst for Botswana this figure amounts to € 51 million.
The two EUDs marking ‘not at all significant’ were the Dominican Republic and Indonesia. In the caseof Indonesia, despite being sector budget support recipient this aid has only been beginning to flowsince 2007/2008 and so this could be a reason for the lack of effects up until now. As the DominicanRepublic has also been a recipient of a fairly large chunk of EC education aid, this response is quitesurprising and deserves further attention during the field phase.
Table 21: Results of survey to EUDs: Overall rating of the EC's contribution to improvingeducation sector performance and outcomes in basic and secondary education in thecountry
Categories Number ofresponses Frequency
Very significant 0 0.0%Significant 6 31.6%Medium significant 6 31.6%Less significant 3 15.8%Not at allsignificant 2 10.5%
No progress insector performance andoutcomes
0 0.0%
N/A 2 10.5%Totalobservations 23 100%
0
1
2
3
4
5
6
Verysignificant
Significant Mediumsignificant
Lesssignificant
Not at allsignificant
No progressin perform
ance &outcomes
N/A
No.
of r
espo
nses
Categories of contribution
EC's contribution to improving education sector performance (basicand 2ndary education)
Extent of improvement
From the reasons for the ratings provided in the comments the main reasons for attributing asignificant rating to the EC aid contribution to improving education sector outcomes related to the factthat the EC was usually the main donor for GBS (Uganda), has been the main contributor to theeducation sector for the country (Tanzania) or has been the main donor of a highly successfulprogramme to support education in the country (India and Tajikistan). The case of Argentina wasinteresting for the fact that the EC support was described as being well focused despite notcontributing as much as the national spending on education, where the EC contributed to thedevelopment of broad ICT use and training. Meanwhile, Nicaragua is an interesting example of wherethe EC supported the regions particularly affected by a natural disaster (Hurricane Mitch) in terms ofteacher training and rehabilitation, which, according to the EUD were regions which had traditionallybeen neglected by other development partners.
The medium significance explanations pertain to situations where the EC support experienced severedelays (Eritrea) or to situations where the EC only financed education via GBS in the country (Ghanaand Mozambique). As for Bangladesh, the EUD response indicated among the reasons for scoringthat the EC dropped out of the secondary education sub-sector in 2004 having previously been anactive supporter. Occupied Palestinian Territory found the assistance to be low to the educationsector, which explains the scoring.
The less significant responses relate to the limited outcomes of EC aid rather than the volumes(Botswana), the late begin of EC contributions only in 2007 (Pakistan) and the rather insignificantsums involved compared to the national budget for education (less than 1%; South Africa). Botswananoted how the sector support programme focused more on improving the efficiency of managementrather than sector outcomes and that the SBS acted more as a first step on the road to making theGovernment more aware about the main issues and how to solve them as well as a way of improvingdialogue. Pakistan mentioned that the EC support to Sindh only began in 2007 and that it is thus tooearly to assess any effects on outcomes.
Those countries rating EC aid as not at all significant (Dominican Republic and Indonesia) bothmentioned that EC funding had not been very significant in the education sector until 2007 and thushad not had time to have any significant impacts on outcomes.

Thematic global evaluation of European Commission support to the education sector in partner countries(Including basic and secondary education); Final Report Vol. IIb, December 2010; Particip GmbH
66
The option not applicable was chosen by two countries Jamaica and Russia. For Jamaica the answeris fairly logical as there is little focus on education in EC support and almost all EC support related toeducation is provided using GBS. The response from Russia indicated that despite not being officialODA recipient, still received a certain degree of EC education aid in an indirect fashion. Education isnot a focal sector in the CSP or NIP but some projects funded the education sector, for instanceeducation was one of the three priority areas of the AP 2005 "North Caucasus Special Programme"where funds have been used to train teachers and for equipment purchases for primary schools inChechnya and Ingushetia. Furthermore, again in 2005, education also became a priority in theframework of the fourth EU-Russia Common Space initiative (Common Space for Research andEducation, including cultural aspects), where major importance is placed on life skills education for theyouth.
2.4.2 At a more specific level, and for the period 2000 - 2007, in your opinion, how well hasEC support contributed to improving the following specific education sectoroutcomes?
The following tables depict the figures that could be collected by the survey on the perception of theextent to which EC support contributed to improving specific education sector outcomes. The followingsections provide the findings on each specific item.
The general trend showed that, according to EUDs, the EC had impacted to a medium to lowextent on education sector outcomes, as for four of the questions the majority of the answers weremarked as ‘to a low extent’ whilst the bulk of answers for two questions pertained to the option ‘to amedium extent’ and for one of the questions the majority of the responses were evenly dividedbetween high, medium and low (on improving transition to secondary education – both lower andupper.

Thematic global evaluation of European Commission support to the education sector in partner countries(Including basic and secondary education); Final Report Vol. IIb, December 2010; Particip GmbH
67
Table 22: Results of survey to EUDs: Rating of the EC's contribution to improving specific aspects of education sector performance and outcomes inbasic and secondary education in the country
Categories Improvingaccess to
basiceducation
Improvingtransition tosecondaryeducation
(both lowerand upper)
Improving access toeducation for
disadvantagedsegments of the
population (e.g. girls,handicapped, rural…)
Improvingthe quality
of education
Improvinglearning
achievements ineducation,
especially literacyand numeracy
Improvingmanagement of
educationservice delivery
Improvingtransparency andaccountability ofeducation service
delivery
Other item(pleasespecifybelow)
No. % No. % No. % No. % No. % No. % No. % No. %To a very highextent
1 5.6 0 0.0 0 0.0 0 0.0 0 0.0 0 0.0 0 0.0 0 0.0
To a highextent
4 22.2 4 23.5 6 35.3 5 27.8 2 11.8 5 29.4 3 18.8 1 25.0
To a mediumextent
6 33.3 4 23.5 2 11.8 5 27.8 4 23.5 6 35.3 4 25.0 0 0.0
To a lowextent
5 27.8 4 23.5 7 41.2 7 38.9 5 29.4 2 11.8 5 31.3 0 0.0
Not at all 1 5.6 1 5.9 1 5.9 1 5.6 3 17.6 2 11.8 2 12.5 1 25.0No progressobserved
1 5.6 2 11.8 0 0.0 0 0.0 1 5.9 1 5.9 1 6.3 0 0.0
N/A 0 0.0 2 11.8 1 5.9 0 0.0 2 11.8 1 5.9 1 6.3 2 50.0Totalobservations
18 100.0 17 100.0 17 100.0 18 100.0 17 100.0 17 100.0 16 100.0 4 100.0
Source: EUD survey

Thematic global evaluation of European Commission support to the education sector in partner countries(Including basic and secondary education); Final Report Vol. IIb, December 2010; Particip GmbH
68
0
1
2
3
4
5
6
7
To a veryhigh
extent
To a highextent
To amediumextent
To a lowextent
Not at all Noprogressobserved
N/A
No.
of
resp
onse
s
Categories of Improvement
Improving access to basic education
Extent of improvement
0
1
2
3
4
5
6
7
To a veryhigh
extent
To a highextent
To amediumextent
To a lowextent
Not at all Noprogressobserved
N/A
No.
of
resp
onse
s
Categories of Improvement
Improving transition to secondary education (bothlower and upper)
Extent of improvement
0
1
2
3
4
5
6
7
To a veryhigh
extent
To a highextent
To amediumextent
To a lowextent
Not at all Noprogressobserved
N/A
No.
of
resp
onse
s
Categories of Improvement
Improving access to education for disadvantagedsegments of the population (e.g. girls, handicapped,
rural…)
Extent of improvement
0
1
2
3
4
5
6
7
To a veryhigh
extent
To a highextent
To amediumextent
To a lowextent
Not at all Noprogressobserved
N/A
No.
of
resp
onse
s
Categories of Improvement
Improving the quality of education
Extent of improvement
0
1
2
3
4
5
6
7
To a veryhigh
extent
To a highextent
To amediumextent
To a lowextent
Not at all Noprogressobserved
N/A
No.
of
resp
onse
s
Categories of Improvement
Improving learning achievements in education,especially literacy and numeracy
Extent of improvement
0
1
2
3
4
5
6
7
To a veryhigh
extent
To a highextent
To amediumextent
To a lowextent
Not at all Noprogressobserved
N/A
No.
of
resp
onse
s
Categories of Improvement
Improving management of education servicedelivery
Extent of Improvement

Thematic global evaluation of European Commission support to the education sector in partner countries(Including basic and secondary education); Final Report Vol. IIb, December 2010; Particip GmbH
69
0
1
2
3
4
5
6
7
To a veryhigh
extent
To a highextent
To amediumextent
To a lowextent
Not at all Noprogressobserved
N/A
No.
of
resp
onse
s
Categories of Improvement
Improving transparency and accountability ofeducation service delivery
Extent of improvement
2.4.2.1 EC's contribution to improving access to basic education
The majority of the EUD responses relate to EC aid having improved access to basic education to amedium extent only (six out of 18 responses). The second largest group of respondents scored “to alow extent” (five out of 18 responses) and the third largest group “to a high extent” (four out of 18responses). The mediums included Ghana, Mozambique (GBS countries), Tunisia (SBS country),Tajikistan, Occupied Palestinian Territory and Argentina. The high respondents were all countries withSBS or other forms of sector support (Bangladesh, India, Nicaragua and Tanzania) plus partly alsoGBS, whilst the lows included fragile states such as Pakistan (SBS) and Eritrea, as well as Botswana(SBS), South Africa and Vietnam (GBS). The sole respondent indicating to a very high extent for thisquestion was Uganda, which has been recipient of both SBS and GBS. The EU D noted the fact thatthe EC was the lead donor for education between 2000-2001 and that the EC represented ‘the face’ ofother donors in relation to policy dialogue and appeared to play the role of the most importanteducation donor during the evaluation period. No progress observed was indicated by Indonesia,probably due to the fact that support only substantially started in 2007.
Overall, these answers reflect a perception of EC support having been helpful to enhancingaccess to basic education, but, in the majority of cases, not having had a significant impact.The pattern of answers related to aid modalities is too mixed to allow for a clear conclusion onthe effectiveness of individual modalities.
2.4.2.2 EC's contribution to improving transition to secondary education (both lower andupper)
Responses on the EC contribution related to improving the transition to secondary education werefairly mixed with four EUD responses each (22.2%) being given to high and medium out of 18 EUDrespondents , and five respondents scoring “low”. Compared to EC contribution to “access” thisscoring is less positive, thus possibly indicating the fact that less emphasis has been put on“completion” – i.e. also “quality”.
The high group included Tanzania, Uganda, Nicaragua (both GBS and SBS support), Tunisia (SBSrecipient). Tanzania and Uganda pointed out the importance of GBS/SBS and sector dialogue inmoving the attention of all concerned towards secondary education. Nicaragua mentioned the use ofsecondary education indicators in the SBS programme and Tunisia highlighted the targeting of equityof access across all regions with a simultaneous transfer of responsibility to the regions as well as asystem of specialization (‘competency based approach’) to promote linkages with higher andvocational education.
The medium respondents included two GBS recipients (Ghana and Vietnam), one recipient of sectorsupport (Bangladesh) and one country which receives neither (Argentina). Argentina pointed out thereduction in drop-out rates which had contributed to increasing the transition rate to secondary, whilstthe other countries did not provide reasons for their scorings.
Botswana, India, Pakistan (all countries receiving SBS or other sector support) and OccupiedPalestinian Territory all indicated “to a low extent” for this question: the focus of EC aid had not reallybeen on secondary education issues, and only started emerging rather recently in India and Pakistan.

Thematic global evaluation of European Commission support to the education sector in partner countries(Including basic and secondary education); Final Report Vol. IIb, December 2010; Particip GmbH
70
The reasons for the responses ‘no progress observed’ (Eritrea and Indonesia) relate to the limitedextent of EC contributions for this sub-sector at least in Indonesia in the period under evaluation.
2.4.2.3 EC's contribution to improving access to education for disadvantaged segments ofthe population
The responses on improving access were mainly scored as to a low extent (seven out of 17responses), whilst the second highest group of respondents fell under the ‘to a high extent’ category(six out of 17 respondents). Disadvantaged segments of society had only minimally been assisted inincreasing their access to education in Botswana, Eritrea, South Africa, Tanzania, Indonesia, Pakistanand Occupied Palestinian Territory. Eritrea noted that EC support for construction had only had effectsin the second half of 2009, Tanzania noted the use of NSA initiatives that have helped increasingaccess for disadvantaged segments of the population to a limited extent and Indonesia noted thesmall volumes of aid to uprooted peoples as EC’s contribution in that regard. Nevertheless, despite theindication of low extent, South Africa did mention that rural school facilities had been upgradedincluding ramps for the physically handicapped as well as the provision of nutrition centres but sadlyonly benefitting very few pupils.
The countries marking ‘high’ extent included Nicaragua, Tunisia, India, Bangladesh, Uganda andGhana. Especially the EUD India highlighted that the issue of disadvantaged has both been tackled bymeans of targeted NGO support, out of which were later mainstreamed in SSA (e.g. work with AgaKhan Foundation as part of the "PESLE" programme).
From the answers it appears as if among the main means of improving access to education fordisadvantaged segments of the population has been through specific projects that, possibly, have thenbeen mainstreamed. Overall, EUD answers indicate a rather mixed contribution of EC toimproving access to education for disadvantaged.
2.4.2.4 EC's contribution to improving the quality of education
The main route of responses here pertained to the EC improving quality only to a low extent (sevenout of 18 responses). But ten out of 18 respondents were evenly divided between the high andmedium extent categories (five EUD responses each).
The low extent responses on quality are for Botswana, Ghana, Mozambique, South Africa, Indonesia,Pakistan and Occupied Palestinian Territory. The situation in Botswana appeared to be that the EDFnine programme during the evaluation period helped the EUD to raise the concerns about quality andto make sure that indicators on quality were included in the EDF 10 monitoring. Ghana raised theinteresting point that the lack of focus on quality was due to the MDG political bias on quantity.Indonesia, Pakistan and Occupied Palestinian Territory attributed the late start-up of support to a lackof impact on improving quality.
High impacts on improving quality with EC education aid were recorded by the EUDs Uganda, Eritrea,Tajikistan, Argentina and Nicaragua. Eritrea noted the focus on training, in-service training andupgrading of qualifications of primary and middle school teachers as having improved quality, Ugandanoted the use of quality as a GBS indicator as a strong impetus to making improvements andNicaragua noted the use of a quality indicator for SBS (PAPSE) especially for improving learningresults on literacy and numeracy. Argentina remarked that although there is still no data available forthe whole country, teacher training and the provision of ICT equipment for primary schools hascontributed to increasing quality in 2,000 disadvantaged schools.
The mediums refer to Tunisia, Vietnam, India, Bangladesh and Tanzania, where Tunisia in particularremarked in the complex nature of secondary education in the country and that some actions areunderway but results and impacts could not really be measured as yet. Tanzania noted the importanceof SBS performance indicators related to improvements in quality, where only 43% of the variabletranche was paid due to limited progress on quality. The India EUD highlights the fact that secondaryeducation issues are constantly on the agenda during Joint Review Missions.
Overall, it is striking that only five out of 18 EUDs indicate that EC has contributed to a highextent to increasing quality, and surprisingly among these countries are three that only benefitted ofrather limited EC support during the evaluation period (Argentina, Eritrea and Tajikistan). On the otherhand, for the vast majority of countries that have received quite substantial support impacts ofEC support on increasing quality are considered rather limited. This may hint to the fact that inmost cases quality was not the initial focus of EC support.

Thematic global evaluation of European Commission support to the education sector in partner countries(Including basic and secondary education); Final Report Vol. IIb, December 2010; Particip GmbH
71
2.4.2.5 EC's contribution to improving learning achievements in education, especially literacyand numeracy
The EUD responses related mainly to the low extent option (six out of 18 respondents), whilst thesecond largest response group related to a medium extent (four out of 18 respondents).
The two high respondent EUDs were Nicaragua and Uganda, the latter indicating that the issue oflearning achievements constituted an indicator in the PABS IV GBS.
On the other hand, according to the EUDs, EC contribution to improving learning achievements ineducation, especially literacy and numeracy, has been rated as low for Botswana, Ghana, Tanzania,India and Pakistan. Botswana’s response appeared to indicate that little attention had been paid to thisissue up until the end of the evaluation period but subsequent policy dialogue has meant that thisissue will be a priority for future support. Ghana again pointed to the MDG bias on quantity rather thanquality and India remarked on the innovative approaches which had been developed under the PESLEprogramme and later replicated.
Bangladesh, Vietnam, Tunisia and Argentina remarked on medium levels of improvements on learningachievements but none of these countries backed up their scorings with commentaries.
The EUD South Africa indicates that none of the projects supported during the period under evaluationfocused on learner performance in literacy and numeracy, but emphasised that performance continuedto deteriorate during the period, as evidenced by the results of national assessments as well asregional and international comparative assessments. No progress on this issue was observed inEritrea, where the comments made pertain to the fact that no study had been undertaken to assesswhether the project implemented on education had an impact on the learning achievements of pupils.
Overall, it appears clearly that improving learning achievements was not a major focus of ECsupport during the period under evaluation, and that thus outcomes in that regard can at bestbe characterized as intermingled.
2.4.2.6 EC's contribution to improving management of education service delivery
Most answers of EUD respondents relating to service delivery improvements score EC contribution asmedium (seven out of 18 responses), while the high extent responses were the next largest groupamounting to five out of 17 responses.
Among the high extent respondents are Botswana, Eritrea, Nicaragua, Tajikistan and Uganda:
Botswana points out that for this issue the EUD has the ability to steer choices using TAsupport, studies and policy dialogue and feels that this is where changes can be made in thefastest way.
Eritrea also remarked that cooperation with the EC has definitely benefited both the PMU andMinistry of Education, as well as national education institutions.
Uganda pointed out that both project support and GBS had been employed to strengthenservice delivery in both a centralized and decentralized manner.
Nicaragua also elaborated on decentralization issues in this regard by saying that schoolautonomy and decentralisation were important for sector support between 2004 and 2007(PAPSE) but that the new administration has rejected the notion of autonomous schools post in2007, which was seen as an attempt to privatize education. However, the institutional supportprovided via GBS from 2007 onwards included actions on capacity building, planning andmonitoring assessment to strengthen the education sector.
Under the mediums, Ghana pointed out that improving service delivery is difficult to address usingGBS, whilst India highlighted the decentralization and village committee aspects are part of thegovernance aspects of the major SSA education support programme as well as a focus on the StatePartnership Programme in Chhattisgarh were Education constitutes a large component. Bangladesh,Tunisia, Vietnam and Argentina were the other EUD respondents under the medium extent scoring.
The scoring “low” for Tanzania reflects that the SBS programme foresaw a TA component to theministry to strengthen the policy and management capacity, a component, which, according to theEUD, was not implemented due to reluctance within the ministry to absorb such assistance. “Not at all”was scored by South Africa and the Dominican Republic where South Africa remarked that improvingservice delivery was not an objective of any of the projects funded during the period under evaluation.

Thematic global evaluation of European Commission support to the education sector in partner countries(Including basic and secondary education); Final Report Vol. IIb, December 2010; Particip GmbH
72
Overall, the qualitative responses elicited by the questionnaire on EC's contribution to improvingmanagement of education service delivery were too varied to trace clear trends related e.g. to the roleof the various aid modalities in strengthening service delivery. However, the rather mediocre scoringseems to indicate that impacts of EC support on improving service delivery have only been limited.
2.4.2.7 EC's contribution to improving transparency and accountability of education servicedelivery
5 out of 17 responses indicated a low impact of the EC’s contributions to improving transparency andaccountability of education service delivery, while 23.5% of responses were marked for both “medium”and “high” (each time four out of 17). This means that approximately 50% of the EUD respondentsthink that EC support has at least to a certain extent contributed to improving transparency andaccountability while the other 50% rather think this was not the case.
Eritrea and Pakistan are among the low extent answers, both countries classified as fragile/failed inthe definitions of the evaluation. Bangladesh, Mozambique and Vietnam are also included here, butunfortunately all these EUDs do not comment on their scorings.
The high scorings relate to Nicaragua, Uganda and Ghana which are all countries benefitting fromeither sector budget support and/or GBS. Nicaragua notes the use of a transparency andaccountability-related indicator in the PAPSE.
Mediums scorings were issued by Botswana, Tanzania, India and Tunisia, where Botswana’s scoringhas to be put into perspective given the fact that transparency and accountability in the system alreadyseem to be high. However, the Education Public Expenditure Review (EPER) helped to identify someissues such as the very poor management of the tertiary grant/loan scheme. The EUD Tanzaniaindicated that the EC was instrumental in initiating a PETS exercise in the education sector whenchairing the development partners group and following a lot of resistance the exercise was performedin 2008/9.
Overall, also for this subject the qualitative responses elicited by the questionnaire on EC'scontribution to improving transparency and accountability of education service delivery weretoo varied to trace clear trends related e.g. to the role of the various aid modalities instrengthening transparency and accountability. However, the very mixed scoring seems toindicate that impacts of EC support on transparency and accountability issues related toimproving service delivery have only been limited, possibly not yet materialised.
2.4.2.8 EC's contribution to improving “other items”
The other items were just pertaining to Botswana mentioning that the funding for education underEDF9 included a very wide range of indicators which allowed the EUD to streamline in the nextfunding phase under EDF10 and Tajikistan pointed to the improvements achieved in the budgetaryprocess in the education sector (through support to MTEF).
2.4.3 What are the issues/factors that hampered further improvements related to overalleducation sector performance and outcomes in basic and secondary educationbetween 2000 and 2007?
The survey suggested six issues that could be filled in related to issues/factors that hampered furtherimprovements related to overall education sector performance and outcomes in basic and secondaryeducation between 2000 and 2007. However, not all EUDs who had answered other questionsprovided six factors and it was difficult to group factors into regional patterns. This is an attempt togroup together the trends which emerged from the 19 EUDs that replied to this set of questions.
For most of the EUDs that have replied to the questionnaire, the first issues that seemed to havehampered further improvements of sector performance and outcomes in basic and secondaryeducation between 2000 and 2007 are clearly governance issues (with 13 issues cited by tencountries of the sample) and sector management issues (with 14 issues mentioned by 7 countries).
Further issues highlighted by the EUDs are limited financial resources (with six issues given by sixcountries), low competency of teachers and curriculum issues (with six issues given by threecountries), social and geographical conditions (with six issues cited by five countries), capacity ofinstitutions to enrol possible entrants (with five issues mentioned by four countries).

Thematic global evaluation of European Commission support to the education sector in partner countries(Including basic and secondary education); Final Report Vol. IIb, December 2010; Particip GmbH
73
Only three issues regarding access to data and documents have been mentioned by two countries,while five of the issues cited were concerning other country specific issues.
2.4.3.1 Governance issues
For four of the EUDs in ACP countries that replied, governance issues are considered to havehampered further improvements in basic and secondary education. While poor leadership in theMinistry was noted in Botswana, “limited capacity of Ministry of Education to manage resources, inparticular: weak human resources management, limited decentralisation of decision-making, and poorfinancial management” was highlighted for Mozambique. The changing governments and sectorstrategic planning in Dominican Republic and fragmented institutional setup in the education sectorbetween five different ministries in Tanzania are other governance issues identified in this region.
Asian respondents also pointed towards governance issues, including:
corruption (e.g. teachers occasionally hire lower-qualified and lower-paid staff to teach on theirbehalf) in Bangladesh;
political instability (changes in the government) as limiting improvements to the sector(Pakistan);
lack of coordinated and clear policies in the education sector, which is termed as a “lack ofgood governance” by the EUD Pakistan. The latter also mentioned the lack of attention paid bythe Government to tackling the education sector in a comprehensive way by not including theprivate sector and madrassas in policies.
Meanwhile, the case of India is fairly unique due to the size of the country and the EUD noted thevarying levels of development and different institutional state set-ups as posing a problem forimprovements, which makes uniform progress difficult to achieve.
The Latin American respondents spoke about similar problems to those experienced in other regions;with, besides rotation in Ministries causing a lack of sustainability, poor management was also aproblem with different government entities in charge for primary and secondary causing a loss ofefficiency (Nicaragua) and the national coordination and leadership as well as the legal frameworkbeing a problem (Argentina). The EUD Argentina noted the lack of a political priority in education asbeing a hindrance.
In MEDA-ENPI region, Tunisia was the only country questioned mentioning governance issues andnoted that decisions are still highly centralized.
2.4.3.2 Sector management issues
The EUDs Botswana and Mozambique are the two respondents from the ACP region identifyingsector management issues as significantly limiting improvements in the education sector. TheBotswana EUD drew attention to the fact that pre/primary level is neglected and that no sectorprogramme or a sector performance framework exists in the country which limits success.Mozambique pointed out the limited capacity related to programme implementation, in particular inDistricts and with regard to construction activities, as well as the fact that the model of secondaryschooling is perceived as not being responsive to the country’s needs and to the labour market.
Poor management capacities were also mainly mentioned by Asian EUD respondents; with the EUDPakistan mentioning poor sector management and the lack of capacity within the sector at all levels,and the EUD Vietnam speaking about a lack of results based management.
The rotating nature of the civil service and frequent changes in staff were hampering factors identifiedby both Bangladesh and Pakistan EUDs
Inefficient management in the education sector is also noted by the two EUDs in Latin America. InNicaragua, education disarticulation (between basic and secondary education with technical level andsecondary with higher education) appears to cause efficiency losses. The Nicaraguan EUD alsomentioned the insufficient links between actions, results and the budget.
In the MEDA-ENPI region, Tunisia observed that the diversification of education streams remains lowand that gateways between different sub sectors of education remain less attractive for students andparents, i.e. in vocational training.

Thematic global evaluation of European Commission support to the education sector in partner countries(Including basic and secondary education); Final Report Vol. IIb, December 2010; Particip GmbH
74
2.4.3.3 Financial resources
For three of the EUDs in ACP countries that replied, limitations in financial resources was cited as anissue that seemed to have hampered further improvements of sector performance and outcomes.While Ghana and Dominican Republic indicated limited financial resources, and the latter furtheradded to low government and societal prioritisation, Botswana pointed to an ineffective allocation ofresources.
Limited financial resources were also considered a hindering factor in Asia and Central Asia, inparticular for Indonesia where, according the EUD, Government allocation to education has been lowthough increasing progressively, in Bangladesh where the reputation and the salary of teachers areconsidered as low and not in line with their responsibilities and in the EUD Tajikistan indicated that thelow funding allocated by the GoT results in low salaries and, thus in brain drain.
2.4.3.4 Competency of teachers and curriculum issues
In the ACP region, the EUD South Africa was the only respondent observing numerous issues relatedto curriculum and competency of teachers. The EUD mentioned that the curriculum reforms were tooambitious and left teachers confused and uncertain of what to do. Furthermore, the EUD indicated thata large number of students have not had any pre-school preparation for school. The EUD alsoprovided detailed comments on several issues affecting success; such as multiple local languageswhich caused problems in terms of not enough teachers existing to teach at the (pre-) primary level inthe African languages as well as not being proficient enough in the teacher training language in orderto pass the teacher training examinations.
In the Asia region, the EUD Vietnam noted the low quality of teaching and curriculum, and in theMEDA-ENPI countries, the EUD Tunisia highlighted similar issues with young, inexperiencedteachers being recruited with poor quality teaching often being the result.
2.4.3.5 Social and geographical conditions (poverty, remote areas…)
In the ACP region, South Africa observed the fact that the roll-out of pre-primary preparation was notoccurring as had been hoped and that social issues such as HIV/AIDS were hindering the success ofeducation programmes in the country.
The Asian respondents point to the fact that parents who have no education will find it difficult(knowledge-wise and money-wise) to support their children at school (Bangladesh), but also thatgeneral poor development conditions of many remote rural areas, prevalence of poverty and socialexclusion, labour migration, presence of opposition movements, etc. are factors that can hamperimplementation and access to education to all (India). The widening gap between rural and urbanschools (urban schools have full day schooling while most rural schools have half day schooling) hasalso been highlighted by the EUD in Vietnam. In Tajikistan also indicated that remote areas are noteasily reachable as well as the lack of proper environment (sanitary, water electricity), which is notconducive to performance.
2.4.3.6 Capacity of institutions to enrol possible entrants - quality
In the ACP region, the EUDs Tanzania and Mozambique indicated that substantial increases inenrolments in primary education affected the quality of education. The EUD Tanzania elaborated onthe quality problems associated with the substantial increase in primary and secondary enrolments,without the necessary increase in physical and human resources, leading to major challenges forquality of primary and secondary education. For the Mozambique EUD, rapid expansion of primaryschool access appeared to occur at the expenses of quality of education. Tajikistan also spoke aboutsome issues one would associate more as being problems in ACP countries such as poorinfrastructure.
In the MEDA-ENPI region, Tunisia observed high attendance level of students due to thedemographic transition to be combined with the high enrolment rates in the basic education.

Thematic global evaluation of European Commission support to the education sector in partner countries(Including basic and secondary education); Final Report Vol. IIb, December 2010; Particip GmbH
75
2.4.3.7 Data quality and access
For Asia, the EUD Vietnam pointed to the lack of quality and lack of reliable data, as well as thedifficult access to draft documents of the government and indicated that when donors are consulted itis quite late (or even too late) in the process.
Similarly, the EUD Nicaragua highlighted poor data collection and analysis leading to poor monitoring.
2.4.4 For the period 2000 - 2007, what has been the added value of EC support to basic andsecondary education in the country?
2.4.4.1 Basic education
According to the EUDs, regarding basic education, the main added value of the EC appeared to bemainly related to its role as a catalyst for change in the sector as a result of policy dialogue(quoted specifically by Botswana, Ghana, Bangladesh to certain extent, India, Pakistan andNicaragua). Thus this was experienced as the added value for almost all regions. In a similar veinTajikistan spoke about the enhanced accountability which the EC has assured.
The role of the EC in relation to sector or general budget support discussions, including itscoordination role, is of course also noted as being of importance by several EUDs (GBS: Ghana,Mozambique, Nicaragua; SBS or the like: India, Nicaragua). The role of the EC in improving the statusand importance of basic and primary education is also seen as a major success by severalrespondents (Botswana, Uganda, Bangladesh, India).
Other issues highlighted as being where the EC provides an added value is in relation to improvingsector management issues such as on the importance of teacher training (Argentina) and onimproving education management (Vietnam and Argentina).
2.4.4.2 Secondary education
Regarding secondary education, the role of the EC in encouraging sector dialogue is also raised asmainly the most important EC added value (Nicaragua, Uganda and Pakistan). However, anothergeneral message is that the EC is not very active in the sub-sector of secondary education(Vietnam, India and South Africa).
The EC’s contribution in relation to furthering the TVET sub-sector (which is not part of the evaluation)is highlighted by two EUDs (Botswana and Argentina), whilst Tunisia highlights the added value of theEC in relation to the generalization of the use of IT in all schools. However, it is not clear whether thisspecifically only refers to secondary education.
A major success the EUD to Bangladesh highlights concerns the significant role the EC has playedin increasing the number of female teachers and increasing their qualifications in secondaryschools. This, according to the EUD, has encouraged more gender parity and a more favourableenvironment for girl’s continuing their education.
In terms of general budget support and sector budget support countries, it is surprising to seethat those countries receiving substantial SBS funds largely do not make substantial comments on theadded value of the EC in this sub-sector (apart from the comments indicated above from Bangladesh,Botswana, Pakistan and Tunisia). This could perhaps indicate the limited focus on secondaryeducation up until now. Pakistan is a special case as the EC provides SBS at provincial level where ithas already been said to have a strong added value in terms of encouraging change via sectordialogue. For GBS countries, only the EUD to Uganda pointed out that the EC was the first PABS IVGBS partner to include a secondary education indicator in relation to the release of the variabletranche.
2.5 Programming of support to educationThis section tries to explore possible changes in the role that education played in the programmingprocess for the two last programming rounds, as well as shedding light on the perception of the qualityof the preparation process of the CSPs.
The evaluation period covers the years 2000 to 2007. During this period, at least two CSPs andrelated NIPs have been formulated. EUD staff who answered the questionnaire might not have been

Thematic global evaluation of European Commission support to the education sector in partner countries(Including basic and secondary education); Final Report Vol. IIb, December 2010; Particip GmbH
76
working in the EUD during the entire period, but were nonetheless asked to provide feedback on theearlier programming cycles, to the extent possible. Overall, the response elicited from the EUDs on thetopic of programming needs to be viewed in light of the fact that only between 13 to 17 EUDs, out ofthe total 21 EUDs that replied to the survey, answered the CSP-related questions.
Furthermore, it should be kept in mind that there were no CSPs for certain countries (OccupiedPalestinian Territory, Russia, etc.) for at least one of the programming periods, possibly accounting forthe number of cases where questions were answered with ‘n/a’ (not applicable).
2.5.1 In your opinion, what role did basic education and secondary education play within thefirst and second CSP/NIP drafted during the evaluation period?
The following table shows the perception of EUD staff related to the role of basic and secondaryeducation within the CSPs/NIPs drafted during the period under evaluation.
Table 23: Results of survey to EUDs: Rating of role of basic and secondary education withinthe CSPs/NIPs drafted during the period under evaluation
Scoring levels 1st CSP during evaluationperiod
2nd CSP during evaluationperiod
No. ofresponses
% cit. No. ofresponses
%
Basic educationVery important 5 33,3% 6 40,0%Important 7 46,7% 4 26,7%Not really important 3 20,0% 2 13,3%Not at all important 0 0,0% 3 20,0%N/A 0 0,0% 0 0,0%Total 15 100,0% 15 100,0%Secondary educationVery important 2 13.3% 3 20.0%Important 6 40.0% 5 33.3%Not really important 2 13.3% 2 13.3%Not at all important 3 20.0% 4 26.7%N/A 2 13.3% 1 6.7%Total 15 100.0% 15 100.0%
0
1
2
3
4
5
6
7
Veryimportant
Important Not reallyimportant
Not at allimportant
N/A
No.
of
resp
onse
s
Extent of Importance
Role of Basic Education
1st CSP during evaluation period 2nd CSP during evaluation period
0
1
2
3
4
5
6
7
Veryimportant
Important Not reallyimportant
Not at allimportant
N/A
No.
of
resp
onse
s
Extent of importance
Role of Secondary Education
1st CSP during evaluation period 2nd CSP during evaluation period
2.5.1.1 Basic education
The results of the survey reveal that the majority of responding EUDs considered basic education asplaying an important or very important role in both CSP/NIP drafted during the period.

Thematic global evaluation of European Commission support to the education sector in partner countries(Including basic and secondary education); Final Report Vol. IIb, December 2010; Particip GmbH
77
In the first programming cycle, twelve out of fifteen EUDs rated the role of basic education as veryhigh. These were almost all EUDs that had to prepare and manage either GBS and/or forms of sectorsupports, e.g. India, Bangladesh, Tunisia, but also Ghana which only had GBS support.
In the second programming cycle, responses paint a slightly more diverse picture: Although themajority of EUDs (ten out of 15) still ranked the role of basic education as important or very important,one third of the EUDs considered the sector as not really important or not important at all. Here acertain shift can be observed, with basic education becoming more relevant and important for supportto countries like Indonesia, South Africa and Pakistan, with larger support being prepared.
Overall, however, there appears to be a reduction of the importance of the role of basiceducation in the second round of CSP/NIPs. When looking at the individual qualitative responses, asecond trend emerges: Concerning the first CSP the number of EUDs ranking the sector asimportant, was higher than those ranking it as very important, while it was the inverse for thesecond CSP. Appreciating both of these trends in combination, one may hypothesise that the surveyresults highlight a general change in programming – namely, focus on a more limited number ofsectors of intervention. Such a shift has been advocated under the Paris Agenda and in light of the EUConsensus, and may thus have had a significant effort on the distribution of focal sectors, and in turn,some effect on the incidence where basic education is singled out as a priority.
2.5.1.2 Secondary education
In contrast to basic education, secondary education is clearly considered less important than basiceducation by the EUDs. For both programming cycles roughly one half of all respondents (8/15)ranked the sub-sector as important or very important, while the other half considered it as not really ornot at all important, and in some cases it was considered as not relevant/applicable (N/A). ApparentlyEUDs do not perceive a decline in the importance of secondary education between the two rounds ofCSP/NIPs. This is surprising, as, overall, secondary education is only of marginal importance in ECsupport, when looking at individual commitments to the sub-sector only (and not considering the factthat partly secondary education is included in SBS). Qualitative answers provided do not helpidentifying the reasons for a scoring as “considerable importance”, given the fact that in merely none ofthe countries secondary education seems to play a major role in education support.
2.5.2 Quality of dialogue and co-ordination in the programming of support
2.5.2.1 Quality of dialogue and co-ordination with government
The quality of dialogue and co-ordination with the government in the preparation of the first CSP/NIPswas been rated as medium by about one half of all respondents (7/13). Two EUDs marked it as high,two as low, and two stated that there is no information available or that the question is not applicableto them.
Table 24: Results of survey to EUDs: Rating of quality of dialogue and coordination withGovernment when drafting the CSPs/NIPs during the period under evaluation
2002/03-2006/07 2007/08-2013Scoring levels No. of responses % cit. No. of answers %
High 2 15.4% 8 50.0%Medium 7 53.8% 5 31.3%Low 2 15.4% 2 12.5%No dialogue and coordination 0 0.0% 0 0.0%No information available 1 7.7% 0 0.0%N/A 1 7.7% 1 6.3%Total 13 100.0% 16 100.0%
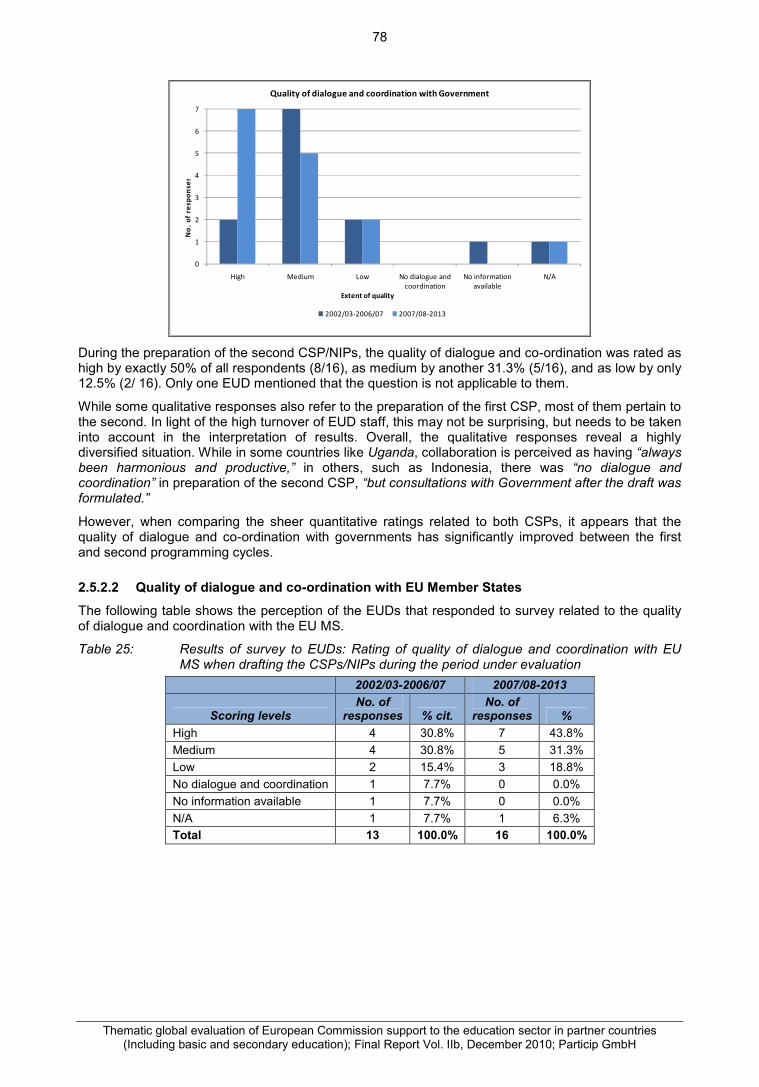
Thematic global evaluation of European Commission support to the education sector in partner countries(Including basic and secondary education); Final Report Vol. IIb, December 2010; Particip GmbH
78
0
1
2
3
4
5
6
7
High Medium Low No dialogue andcoordination
No informationavailable
N/A
No.
of
resp
onse
s
Extent of quality
Quality of dialogue and coordination with Government
2002/03-2006/07 2007/08-2013
During the preparation of the second CSP/NIPs, the quality of dialogue and co-ordination was rated ashigh by exactly 50% of all respondents (8/16), as medium by another 31.3% (5/16), and as low by only12.5% (2/ 16). Only one EUD mentioned that the question is not applicable to them.
While some qualitative responses also refer to the preparation of the first CSP, most of them pertain tothe second. In light of the high turnover of EUD staff, this may not be surprising, but needs to be takeninto account in the interpretation of results. Overall, the qualitative responses reveal a highlydiversified situation. While in some countries like Uganda, collaboration is perceived as having “alwaysbeen harmonious and productive,” in others, such as Indonesia, there was “no dialogue andcoordination” in preparation of the second CSP, “but consultations with Government after the draft wasformulated.”
However, when comparing the sheer quantitative ratings related to both CSPs, it appears that thequality of dialogue and co-ordination with governments has significantly improved between the firstand second programming cycles.
2.5.2.2 Quality of dialogue and co-ordination with EU Member States
The following table shows the perception of the EUDs that responded to survey related to the qualityof dialogue and coordination with the EU MS.
Table 25: Results of survey to EUDs: Rating of quality of dialogue and coordination with EUMS when drafting the CSPs/NIPs during the period under evaluation
2002/03-2006/07 2007/08-2013
Scoring levelsNo. of
responses % cit.No. of
responses %High 4 30.8% 7 43.8%Medium 4 30.8% 5 31.3%Low 2 15.4% 3 18.8%No dialogue and coordination 1 7.7% 0 0.0%No information available 1 7.7% 0 0.0%N/A 1 7.7% 1 6.3%Total 13 100.0% 16 100.0%
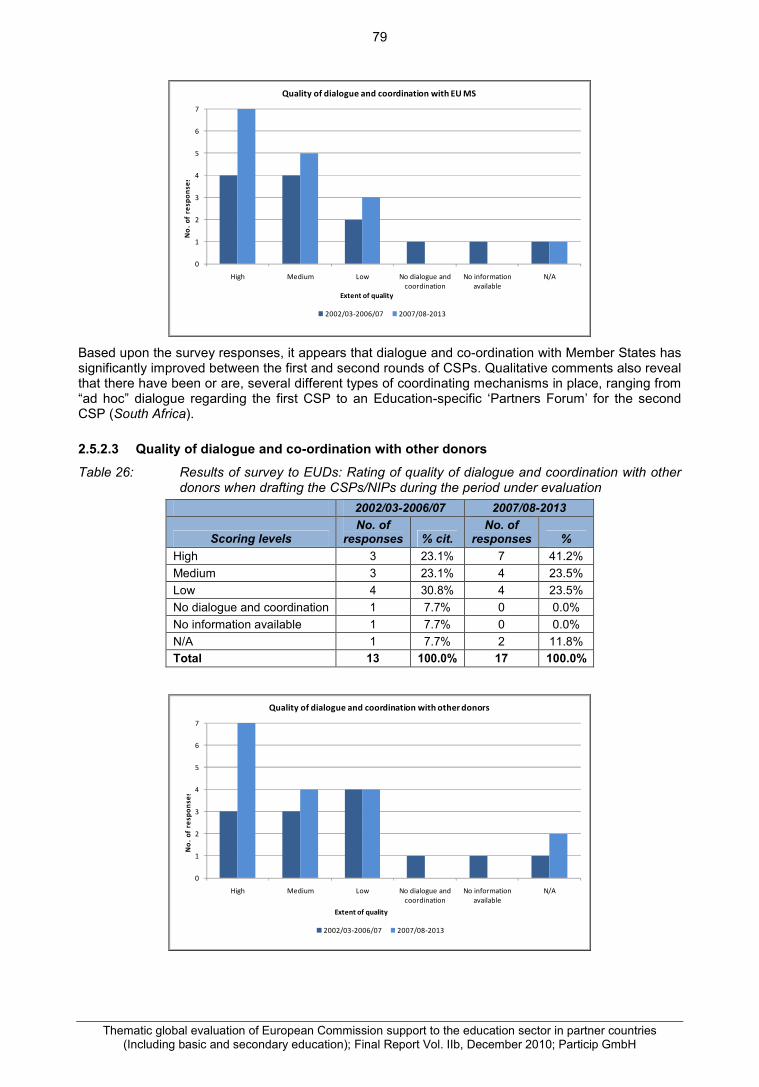
Thematic global evaluation of European Commission support to the education sector in partner countries(Including basic and secondary education); Final Report Vol. IIb, December 2010; Particip GmbH
79
0
1
2
3
4
5
6
7
High Medium Low No dialogue andcoordination
No informationavailable
N/A
No.
of
resp
onse
s
Extent of quality
Quality of dialogue and coordination with EU MS
2002/03-2006/07 2007/08-2013
Based upon the survey responses, it appears that dialogue and co-ordination with Member States hassignificantly improved between the first and second rounds of CSPs. Qualitative comments also revealthat there have been or are, several different types of coordinating mechanisms in place, ranging from“ad hoc” dialogue regarding the first CSP to an Education-specific ‘Partners Forum’ for the secondCSP (South Africa).
2.5.2.3 Quality of dialogue and co-ordination with other donors
Table 26: Results of survey to EUDs: Rating of quality of dialogue and coordination with otherdonors when drafting the CSPs/NIPs during the period under evaluation
2002/03-2006/07 2007/08-2013
Scoring levelsNo. of
responses % cit.No. of
responses %High 3 23.1% 7 41.2%Medium 3 23.1% 4 23.5%Low 4 30.8% 4 23.5%No dialogue and coordination 1 7.7% 0 0.0%No information available 1 7.7% 0 0.0%N/A 1 7.7% 2 11.8%Total 13 100.0% 17 100.0%
0
1
2
3
4
5
6
7
High Medium Low No dialogue andcoordination
No informationavailable
N/A
No.
of
resp
onse
s
Extent of quality
Quality of dialogue and coordination with other donors
2002/03-2006/07 2007/08-2013
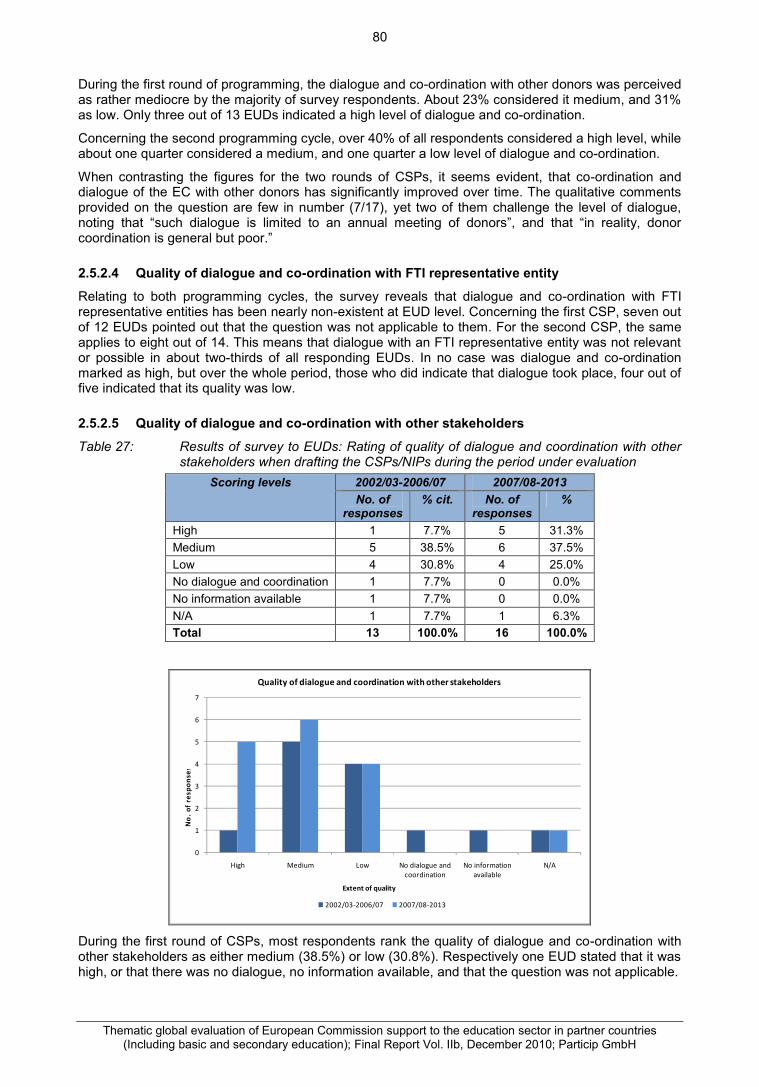
Thematic global evaluation of European Commission support to the education sector in partner countries(Including basic and secondary education); Final Report Vol. IIb, December 2010; Particip GmbH
80
During the first round of programming, the dialogue and co-ordination with other donors was perceivedas rather mediocre by the majority of survey respondents. About 23% considered it medium, and 31%as low. Only three out of 13 EUDs indicated a high level of dialogue and co-ordination.
Concerning the second programming cycle, over 40% of all respondents considered a high level, whileabout one quarter considered a medium, and one quarter a low level of dialogue and co-ordination.
When contrasting the figures for the two rounds of CSPs, it seems evident, that co-ordination anddialogue of the EC with other donors has significantly improved over time. The qualitative commentsprovided on the question are few in number (7/17), yet two of them challenge the level of dialogue,noting that “such dialogue is limited to an annual meeting of donors”, and that “in reality, donorcoordination is general but poor.”
2.5.2.4 Quality of dialogue and co-ordination with FTI representative entity
Relating to both programming cycles, the survey reveals that dialogue and co-ordination with FTIrepresentative entities has been nearly non-existent at EUD level. Concerning the first CSP, seven outof 12 EUDs pointed out that the question was not applicable to them. For the second CSP, the sameapplies to eight out of 14. This means that dialogue with an FTI representative entity was not relevantor possible in about two-thirds of all responding EUDs. In no case was dialogue and co-ordinationmarked as high, but over the whole period, those who did indicate that dialogue took place, four out offive indicated that its quality was low.
2.5.2.5 Quality of dialogue and co-ordination with other stakeholders
Table 27: Results of survey to EUDs: Rating of quality of dialogue and coordination with otherstakeholders when drafting the CSPs/NIPs during the period under evaluation
2002/03-2006/07 2007/08-2013Scoring levelsNo. of
responses% cit. No. of
responses%
High 1 7.7% 5 31.3%Medium 5 38.5% 6 37.5%Low 4 30.8% 4 25.0%No dialogue and coordination 1 7.7% 0 0.0%No information available 1 7.7% 0 0.0%N/A 1 7.7% 1 6.3%Total 13 100.0% 16 100.0%
0
1
2
3
4
5
6
7
High Medium Low No dialogue andcoordination
No informationavailable
N/A
No.
of
resp
onse
s
Extent of quality
Quality of dialogue and coordination with other stakeholders
2002/03-2006/07 2007/08-2013
During the first round of CSPs, most respondents rank the quality of dialogue and co-ordination withother stakeholders as either medium (38.5%) or low (30.8%). Respectively one EUD stated that it washigh, or that there was no dialogue, no information available, and that the question was not applicable.

Thematic global evaluation of European Commission support to the education sector in partner countries(Including basic and secondary education); Final Report Vol. IIb, December 2010; Particip GmbH
81
During the second round of CSPs, nearly 70% of all respondents referred to the quality of dialogueand co-ordination with other stakeholders as either medium (37%) or high (31.3%), while about onequarter ranked it as low. However, nobody indicated an absence of dialogue and co-ordination,although one EUD asserted that the question was not applicable.
When comparing the responses concerning both programming cycles, a clear trend emerges towardsa higher quality of dialogue and co-ordination with other stakeholders over time. The qualitativecomments accompanying the quantitative results repeatedly mention dialogue with NGOs and CSOs.
2.6 Policy dialogue, coordination, harmonization, alignment - issues related toGeneral Budget Support
Out of the 20 EUDs that replied to the question on existence of GBS, nine confirmed their existence.This corresponds, in principle, to the evaluation team’s findings from the CRIS database.
2.6.1 At a general level, how important is/was the General Budget Support supported by theEC regarding coordination, harmonization and alignment issues related to education?
Usually, a number of GBS indicators relate to education. This question aims at distilling the role GBSplays for education in order to improve coordination, harmonization and alignment at the sectoral level.
The GBS support was deemed important in terms of effect on coordination mechanisms by a majorityof the EUDs surveyed. Indeed, various GBS platform in the countries have created a space fordialogue among donors and the partner countries’ governments that facilitate the coordination amongstakeholders. For instance, in Vietnam, the EC is co-chair with the Government of Vietnam of aneducation sector working group under the Poverty Reduction Support Credit (PRSC) into which the ECpledges funds as GBS support. In Nicaragua, the EC participates in regular meetings with otherdonors to discuss the Performance Assessment Matrix that follows up social trends, includingeducation. Also the Ghana and Mozambique EUDs consider the GBS platform as being very importantin relation to coordination on education related issues.
There is a variety of points of view among the EUDs surveyed as regards GBS and harmonizationissues related to the education sector. However and perhaps surpisingly, the recourse of GBS hadapparently no effects on harmonization in the Dominican Republic and only limited effects in Vietnam.
The results of the survey show that, in several countries, GBS is not considered as importantregarding alignment issues for education. And, when a link between GBS and alignmentrelated to education exists, the link does not necessarily appear to be direct or strong.
2.6.2 What role does and did EC play in preparing and monitoring the General BudgetSupport with regard to issues related to support to education?
Survey results show that most EUDs (five out of eight answering) consider their role inpreparing and monitoring education issues in GBS support as at least considerable.
In those cases (2) where EUDs have scored their role as rather limited, in monitoring education relatedissues in the GBS, the EC relies on other donors, such as MS – a silent partnership agreement existsin Ghana for education with DfID, or issues of education are in the hands of MS that are directlyinvolved in the pooled fund for support to education, as is the case in Mozambique, or the EC limits itsmonitoring activities to the advent of disbursement requests (Dominican Republic).
However, most EUDs surveyed consider that the EC plays a considerable or very important role inpreparing and monitoring the GBS with regard to education issues, i.e. indicators related to education.This seems to be especially the case when the EC is involved in sector working groups linked to GBSwhere stakeholders actively and regularly interact on issues related to the education sector, as forinstance in Tanzania, where the EC was a very active member of the education sector donor group(and held the chair in 2007) during the period under evaluation. This group, jointly with the governmentand CSO representatives, assesses the performance of the sector on an annual basis, similarly thesame players agree on annual performance targets; or in Vietnam, where the EC is the lead donoramong MS for education, and co-chair of the education sector working group.
It is important to note that the situation can also be the other way round: Instead of the GBS leading indetermining the indicators, in the case of Tanzania, activities supported by the EC under the SBScontributed to improve monitoring GBS with regard to education related issues. This contribution

Thematic global evaluation of European Commission support to the education sector in partner countries(Including basic and secondary education); Final Report Vol. IIb, December 2010; Particip GmbH
82
seems to originated from an initiative aimed at building the capacity to collect and the reliability of datain the education sector.
2.6.2.1 If education-related indicators are part of GBS indicators, what modalities (such astype of meetings, participants, frequency, etc.) have been established for educationsector dialogue related to these indicators? How well are they functioning?
The sector dialogue related to GBS indicators is generally considered to function quite well byalmost all EUDs surveyed and can take place in a variety of ways:
In the case the Dominican Republic, very limited dialogue takes place; the information related to GBSindicators is directly collected through the NAO.
Yet, a dialogue related to GBS indicators occurs indeed in most cases, especially during theimplementation of sector reviews such as in Mozambique where an annual and a mid-year sectorreview are carried out feeding the annual joint review of overall performance of the GBS and in its midyear review. This education sector dialogue related to GBS seems to occur in a more systematicmanner such as in Uganda, Vietnam and Tanzania where working groups meet regularly to discusssector performance (every 2-3 months). While the education sector working group in Vietnam is cochaired by GOV and EC, in Tanzania it is being chaired by the PS of the Ministry of Education andattended by all key players active in the education sector. Moreover, in the latter case, the annualsector review takes place in August/September culminating in an annual high level meeting (chairedby the Minister) and resulting in a joint Aide Memoire with assessment of sector performance, and inan agreement on the performance targets for the following years (three year rolling plan) thatstipulates key milestones. The participation in the process is quite broad involving all key stakeholdersof the sector during the quarterly education sector meetings. In Uganda, also the Education SectorConsultative Committee (the highest policy making organ of the MoE) also seem to work well.
In Nicaragua, GBS indicators are monitored through the GBS Group in two annual meetings, a systemthat seemed to have worked well until 2008. Their preparation involves subgroups meetings formingthe basis for the government-donor dialogue. While only two indicators for primary education seem toexist, and are being monitored by the GBS, education sector monitoring at the sector level is based ona set of own indicators.
It is noteworthy that the distinction between technical meetings and meetings at policy level is pointedout in several answers. The participants are not necessarily the same in the two types of meeting.
2.6.2.2 If education-related indicators are part of GBS indicators, what importance dofinancing, accountability and capacity building measures related to education have inpolicy dialogue related to the GBS?
The following table provides an overview on EUDs’ perception of the importance of financing,accountability and capacity building measures related to education in policy dialogue related to theGBS. Given the rather low number of answers it is difficult to derive common strands. However, andapart form the issue of accountability, EUDs attribute, in the majority of cases, at least considerableimportance to all issues. Accountability issues seem less important.
Table 28: Results of survey to EUDs: Importance of financing, accountability and capacitybuilding measures related to education in policy dialogue related to the GBS
Notrelevant
Noimportance
Limitedimportance
Considerableimportance
Very highimportance Total
N° % N° % N° % N° % N° % N° %Financingissues
0 0.0% 1 11.1% 2 22.2% 4 44.4% 2 22.2% 9 100.0%
Accountability 0 0.0% 1 11.1% 3 33.3% 4 44.4% 1 11.1% 9 100.0%Capacitybuildingmeasures
0 0.0% 1 11.1% 2 22.2% 5 55.6% 1 11.1% 9 100.0%
The answers of the EUDs confirm the importance of financing, accountability and capacity buildingmeasures in the policy dialogue related to the GBS and the importance of these issues at educationsector level. But the answers do not strongly show the importance that such measures specifically

Thematic global evaluation of European Commission support to the education sector in partner countries(Including basic and secondary education); Final Report Vol. IIb, December 2010; Particip GmbH
83
related to education can have in policy dialogue related to the GBS, although some of the answersmention the fact that, in a general manner, sector policy dialogue feeds into GBS policy dialogue.
In other terms, it appears that the policy dialogue related to GBS seems to focus on very broad policyissues where sector specificities are not necessarily of high importance.
2.6.2.3 GBS usually has technical assistance and capacity building components. How is co-ordination between donors ensured in that regard?
When the education sector benefits from direct support (pool funding, etc.), usually no additionaltechnical assistance or capacity building components is provided in the framework of the GBS(Mozambique, Ghana, Uganda).
In the few cases concerned by the question, the coordination is most of the time effective and usuallytakes place during GBS meetings and reviews.
2.6.3 Overall, what importance/weight would you attribute to EC in the context of policydialogue on General Budget Support?
The following table provides an overview on EUDs’ perception of the importance of the role plaid bythe EC in the context of policy dialogue on GBS. EUDs attribute, in the majority of cases, at leastconsiderable importance to the EC role.
Table 29: Results of survey to EUDs: How EUDs perceive EC’s importance in the context ofpolicy dialogue on GBS
Scoring levels No. ofresponses
%
Not relevant 0 0.0%No importance 1 11.1%Limited importance 1 11.1%Considerableimportance
4 44.4%
Very high importance 3 33.3%Total 9 100.0%
When looking at the qualitative aspects the following can be summarised:
In several cases, the EC is a leading donor and, therefore, it naturally carries weight in thecontext of policy dialogue on GBS (the EC is the third largest GBS donor in Mozambique; it hasa leading role related to GBS in Nicaragua and Jamaica and has a leading role regardingsector working groups in Vietnam).
The role that the EC can play in the context of policy dialogue on GBS is not only related to itsrelative importance in the donor landscape but also to the panel of aid modalities used: The ECseems to be particularly active in policy dialogue on GBS when it only or mainly channels itsaid through this modality, for instance in the cases of Ghana, Jamaica, and Mozambique, butalso in Tanzania.
On the other hand, in the case of the Dominican Republic only very limited policy dialogue onGBS seems to take place.
2.7 Coordination, harmonization, alignment - at the level of the educationsector
2.7.1 What kind of co-ordination and consultative mechanisms related to support toeducation exist(ed) at the sector level in the country, and how would you characterizethem?
The survey aimed at capturing the different types of co-ordination and consultative mechanismsrelated to support to education that exist(ed) at the sector level, and there at different levels, i.e. withdifferent parties being involved:
Between the EC and Governments,

Thematic global evaluation of European Commission support to the education sector in partner countries(Including basic and secondary education); Final Report Vol. IIb, December 2010; Particip GmbH
84
Among the donors themselves, without Government,
Between the EC and the EU Member States,
Between donors and Government,
Trust Funds.
Results are complicated patterns of mechanisms, very country specific, and naturally related to thetype of support the EC is giving towards the education sector.
2.7.1.1 Mechanisms between the EC and Governments
Regarding mechanisms between EC and Government, the case of Bangladesh (see the followingbox) seems to be the most comprehensive one, providing a good snapshot of what coordinationand consultation might involve and require.
Box 2: Bangladesh: An example of what coordination with Governments might requireThe Bangladesh Development Forum intends to be a high-level discussion forum between government and thedevelopment partners in Bangladesh on all major subjects of relevance to development. It is still at its startingphase with the Government being the organizer and chair and the EC participating with other donors.The Joint Commission is a yearly bilateral forum at relatively high level on all issues related to EC developmentassistance to Bangladesh, providing an opportunity for both parties to express main concerns and appreciation.Also here the Government is the main organizer and chairing the forum.The Education Local Consultative Sub-Group (ELCG) holds about twice-yearly meetings on educationmatters, with representatives from donors, government, NGOs, UN, etc.; and special meetings, as and whenrequired, on skills development and non-formal primary education. According to the EUD, the quality, usefulnessand number of meetings vary with the chairmanship rotating among development partners. It is perceived as agood tool to interact, but obviously mainly with other development partners, as Government representatives onlyseem to attend occasionally. EC staff usually participates and held vice-chairmanship during one year.Project Steering Committee (PSC) on the TVET Reform project, which is co-chaired by government and ECrepresentatives, is seen as a meeting at medium level, usually, according to the EUD, ensuring support from awider group of government representatives. Government co-chairs, jointly with EC staff; and a considerablenumber of participants from various agencies and ministries are usually present.Monthly Project Monitoring and Coordination Committee (PMCC) meetings take place on the TVET Reformproject, i.e. seems to be a classical monitoring meeting, involving practical discussion at a relatively low level onimplementation-specific issues and problems. It seems to be a very useful exercise to ensure involvement of andapproval by major government stakeholders, with the Government chairing and many government participantsfrom various agencies and the ministry concerned being present.Advisory Board (AB) meeting of the non-formal primary education project, with several representatives fromgovernment, along with many other non-government participants, which is also characterized as very useful, withan active involvement of all stakeholders with frank discussions. EC holds chairmanship there.Formal consultation of government take place at various levels during project design, by EC staff and/orconsultants. Here the Government is asked to provide information on policy, strategy and plans. The quality andusefulness of such consultations seems to vary, but to usually provide good background information ongovernment’s positions.Moreover, the EC requests the government to officially approve certain documents during project design andimplementation, where approval often happens "in silence" in that the Government does not reply.Meetings with government representatives, as and when required, on specific topics, between EC staff anddirect counterparts in Government, usually upon request of EC staff.
The following table tries to capture the complex picture of coordination and consultative mechanismsbetween the EC and the Governments related to support to education that exist(ed) at the sector levelin the desk study countries, and some of their characteristics, as perceived by EUDs.
Overall, EUDs are rather positive on the existing mechanisms, indicating that some of themcan be well used for instance for pointing to deficiencies and to increasing alignment. EUDsperceive governments usually at least as active, perhaps not as active as one might wish, i.e.leading the processes. On the other hand, EUDs think they are also active players in thesemechanisms, partly taking leading roles, e.g. in Botswana.

Thematic global evaluation of European Commission support to the education sector in partner countries(Including basic and secondary education); Final Report Vol. IIb, December 2010; Particip GmbH
85
Table 30: Coordination and consultative mechanisms related to support to education: Between the EC and the GovernmentName of mechanism Major characteristics, e.g. regarding
quality and usefulness, and trends overthe past years
How would you characterize the roleof the government in each of these
groups, if applicable?
How would you characterize the roleof the EC (Delegation) in each of these
groups, if applicable?High level discussion fora(Bangladesh, India, also SouthAfrica)
Joint Commission meetings are anopportunity for both parties to express mainconcerns and appreciation at high level. But,in the case of India, the discussion seems toremain very general and consensual.In the case of South Africa, while such fora inthe early 2000s mainly dealt with operationalissues regarding project implementation nowthey increasingly deal with aid effectivenessissues and more strategic developmentalissues, e.g. the involvement of civil society inthe country's development.The Bangladesh Development Forum is toorecent to draw significant conclusions.
Active. Leading role. Active participation/partner.
Meetings specific to the sector policysupport program (Botswana, Tunisia,Dominican Republic))
Increasing policy dialogue, good mechanism.Good mechanism to point out weaknesses inthe education system and "guide" somereforms.Meetings are informal and irregular in thecase of the Dominican Republic
Active. Good appropriation by theGovernment.
Guiding role (recommendations are welltaken into considerations, as they areoften formulated on the basis of studiesor joint annual appraisals of the sector)
Technical Steering Committeemeetings (bi-annual) (Eritrea)
Useful for addressing project related issues,until now very limited debate on sectorstrategy
Chaired by Minister of Education withNAO participating
Prominent, de facto suggesting agendafor TSC meeting, the EC being the onlydonor apart from UNICEF represented inthe country with international sectorspecialists
Meetings specific toprogrammes/projects (Bangladesh)or regular management meetings(twice per month) (Eritrea)
Usually ensures support from a wider groupof government representatives than meetingsat higher level.
Active. Co-leading role.In the case of Eritrea meetings chaired bymanager of Education SectorDevelopment Plan PMU
Co-leading role.
Bilateral meeting: “programmingmeeting”, “ENP committees”, etc.(Occupied Palestinian Territory)
Contribute to align the interventions to thegovernment's needs, especially the“programming meeting” between the EC andthe Ministry of Planning.
Good (in “Occupied Palestinian Territory”,the co-ordination between the differentMinistries is cumbersome)
A mediation role between the ministries inthe case of “Occupied PalestinianTerritory”
No formal coordination/consultativemechanism (Argentina)
n/a n/a n/a

Thematic global evaluation of European Commission support to the education sector in partner countries(Including basic and secondary education); Final Report Vol. IIb, December 2010; Particip GmbH
86
2.7.1.2 Mechanisms exclusively organized and attended by the donors alone
As for mechanisms exclusively organized and attended by the donors alone, the EUDsmentioned a few only, again at various levels:
At the very general policy level, such as the Development Partner Forum in Botswana (revivedin 2008) discussing general aid effectiveness issues, where the EC is active, having fundedseveral Development Partner Fora meetings and the development of a donor database;
At the sector level, for instance the sector donor group in the Dominican Republic, that meetsless and less regularly as the government is more and more assuming a stronger coordinatingrole, and in which the EUD claims to have had a leading role;
At the level of individual programmes as for PEDP II in Bangladesh with a view to exchangingopinion and expertise on certain issues and developing a common position towards thegovernment (consortium meetings). Another example here is Eritrea, where WB implementsthe construction component of the ESDP through a Trust Fund Agreement. Here, discussionson sector strategies are informally taking place in the context of EC-WB cooperation oneducation sector project and trust fund issues. The EUD indicates that a close cooperation withthe WB on Trust Fund related issues exists, but, as the WB is not represented withinternational education experts in the country on a permanent basis, the interaction is limited toperiods where WB missions take place.
It should also be noted that, for a good number of years in India UNESCO held stewardship of whatwas called the "Education Donors Group". This group does no longer exist, as the number of donors inthe sector and in India in general has declined. However, still regular exchange of information on eachother's programmes seems to take place.
2.7.1.3 Mechanisms between the EC and the EU MS
When looking at coordination mechanisms related to education between the EC and the EU MS,very much depends upon how actively involved the MS are in the sector (e.g. in Eritrea they are not),and what kind of support EC is giving:
In Bangladesh, formal consultations take place with the EU MS during the design stage, withless formal consultations at the earlier stages, providing comments for further improvements ofthe design.
In India, EU Development Counsellors meet about six times a year, but education seems to beonly occasionally on the agenda. Moreover, ad hoc meetings, e.g. on CSP review, are beingheld, with the EUD trying to facilitate consensus building.
In Botswana, as no other MS than Germany is active in the education sector, ad hoc meetingsare the option chosen for coordination, which is equally the case in Burkina Faso (technicaland financing issues being at the core of discussion).
In Jamaica, where GBS is the only modality with a reference to education, EU MS are keptinformed, but active coordination only takes place with the UK. It should be noted thateducation issuers do not seem to be at the focus of coordination.
In South Africa, an Education and Training Development Partners' Forum was established in2007 and chaired by the Netherlands. Contrarily to other mechanisms it rather seems to be aforum mainly for exchange of information on who is doing what.
In the Occupied Palestinian Territory, in 2009 the development of an EU strategy for all sectorswas launched by the EC, including education, with the aim of coordinating and limiting thenumber of sector in which EC and MS are active. Moreover, once a week information andcoordination exchange take place with MS, the government being invited for specificinterventions / specific topics.
In Argentina, no formal mechanism to coordinate support among donors exists; however, akind of non-structured dialogue during programming, formulation and implementation takesplace with the World Bank, IADB and UNICEF, among other donors.

Thematic global evaluation of European Commission support to the education sector in partner countries(Including basic and secondary education); Final Report Vol. IIb, December 2010; Particip GmbH
87
2.7.1.4 Mechanisms between donors and government
As for coordination and consultative mechanisms related to support to education between donorsand government, survey results shows again a rather heterogeneous picture, with varying degrees ofEC leadership and role:
Formal coordination mechanisms exist in the framework of GBS support, such as Ghana(MDBS group), or Burkina Faso (Cadre Partenariat) where all major stakeholders involved ineducation meet every two months (donors, NGOs Ministry ff Education), chaired by theGovernment, and with a EUD trying to push.
Ad hoc coordination prevails in Botswana with only few donors being involved, while the SocialSector Group existing in Eritrea seems to be meeting only on an irregular basis, thus being ofonly limited use, especially when thinking in strategic and sector dimensions.
In South Africa, annual donor meeting is called upon by the national Department of Education.However, as this meeting seems to focusing on funding gaps for an ongoing financial year it isonly of limited value for the EC, as such needs cannot be covered on ad hoc bases.
As indicated, in Bangladesh, the Education Local Consultative Sub-Group (ELCG) holds abouttwice-yearly meetings on education matters, with representatives from donors, government,NGOs, UN, etc.; and special meetings, as and when required, on skills development and non-formal primary education. According to the EUD, the quality, usefulness and number ofmeetings vary with the chairmanship rotating among development partners. It is perceived as agood tool to interact, but obviously mainly with other development partners, as Governmentrepresentatives only seem to attend occasionally. EC staff usually participates and held vice-chairmanship during one year.
In India, currently the JRM (Joint Review Mission) is considered as "the" vector for donorcoordination, with twice-yearly meetings to review progress of SSA, and bringing togethereducation and financial experts from GoI and donors. The EUD characterizes these exercisesas good with frank exchange of information and common drafting of the aide-mémoire,leadership being ensured by the GoI (preparation of reports and presentation in the frameworkof the JRMs), with active participation of the EC as a member of the core group.
As for the Occupied Palestinian Territory, an Education Sector Working Group and HigherEducation Thematic Group meets approximately six to eight times a year, with the Ministry ofEducation and Higher Education chairing it (plus and one donor and UNESCO co-chairing).According to the EUD government’s role is strong in this group, and, given that education is nota focal sector EC’s involvement is judged by the EUD as equal to that of the other donors.
It is to be noted that the only EUD that explicitly mentioned other mechanisms is India. There, the EUDindicates the existence of civil society events that serve for visibility purposes, and exchange of viewsin a participatory manner, where EC trends in support of education in India are communicated.
2.7.1.5 Mechanisms related to trust fund agreements
As for coordination and consultative mechanisms in cases of trust fund agreements, surveyresults mainly refer to Eritrea and Pakistan:
As for Eritrea, the EUD sees all criteria that could be scored - coordin¬ation, complement¬arity,effic¬iency, effective¬ness and impact - as rather weak, highlighting that delays inimplementation had accumulated until June 2009, and had remained weakly addressed byWB. Only after a Rapid Results Approach applied as a desperate measure during 2009, firstresults in the component financed seem to have been achieved through a community approachto school construction.
The situation is different for Pakistan where a number of such agreements have been made,especially in the framework of the Earthquake Rehabilitation Programme with WB, UNICEF,ADB, and UNDP. Here, EUD scored all criteria between acceptable and good, highlightinghowever a very slow start and familiarization with adequate construction models for theearthquake areas, lacking sufficient technical expertise during the first years.
Overall, no real trend can be derived from the two cases; they rather seem to indicate that the qualityof implementation and outcomes of trust fund agreements is very much depending on individualsettings.

Thematic global evaluation of European Commission support to the education sector in partner countries(Including basic and secondary education); Final Report Vol. IIb, December 2010; Particip GmbH
88
2.8 Does the EC co-fund programmes in your country that are implementedby development banks, UN organisations or through FTI?
Only 12 EUDs provided an answer to the question of co-funding, four of them indicating the EC hadco-financed programmes. Considering that the question was aiming at the issue of co-funding relatedto programmes that are then being implemented by the other organisation, and not at cases where, forinstance, the WB and the EC are jointly financing education support or where the EC is co-funding anNGO project, analysis has to be limited to the following two countries:
Eritrea, where a trust fund agreement exists with the World Bank related to the implementationof the construction component of the Education Sector Development Programme (ESDP).Here, quality of coordination is perceived as rather weak – which is confirmed from othersources.
The picture is different for Pakistan, where, as part of the “Earthquake Emergency AssistanceProject (Education) in the Earthquake-Affected districts of AJK, Pakistan” contracts wereconcluded with UNICEF and the Asian Development Bank (€ 30 million and € 10 million), solelyrelated to post-earthquake reconstruction of school facilities. Despite the very slow start andfamiliarization with adequate construction models for the earthquake areas, and the lack ofsufficient technical expertise during their first years, as expressed by the EUD, the EUD scoresefficiency, effectiveness, impact rather good for cooperation with ADB, less favourable forefficiency and effectiveness of UNICEF support. Overall, coordination with the two bodiesseems to have been working well.
The EUD to Occupied Palestinian Territory mentioned the programme "Quality Systems for Qualityteachers" a programme which is putting in place the systems to implement the national teachereducation strategy. While this has only been contracted in 2008 (with UNESCO), and therefore fallsoutside the scope of the evaluation, the EUD indicates that coordination with UNESCO is good andthat the programme is highly complementarity to other EC support. Moreover, efficiency andeffectiveness so far are rated as good, given the short duration of the programme only.
2.9 Education for All - Fast Track Initiative
2.9.1 Is the Fast Track Initiative (FTI) relevant for your country? What kind of consultationmechanisms have been put in place between the ECD and FTI on sector support issuesincluding SBS?
Out of the 20 EUDs replying to this question, eight indicated that FTI is relevant to their country:Burkina Faso, Eritrea, Ghana, Mozambique, Uganda, Vietnam, Tajikistan and Nicaragua. While theEUD to Ghana reports that there is no consultation mechanism in existence, the other EUDs report onthe existence of various kinds of mechanisms:
In Burkina Faso, World Bank and EUD are part of the same group of donors for education,which seems to meet several times a month, and also related to progress on FTI.
In Eritrea, according to the EUD, an agreement exists between main implementers in education(WB, EC UNICEF) on the importance that FTI could play for Eritrea. Meetings among donorshave taken place on this subject, and the MoE has been made aware of the opportunities thatFTI poses, but the country has not gone yet through an FTI appraisal process. According to theEUD, since the end of 2009, discussions on FTI among WB, UNICEF and EC take placeregularly at every occasion of a WB supervision mission, and in between, via emailcommunication.
In Uganda, the Education Sector Working Groups is used for discussing about FTI issues,while in Vietnam the same type of mechanism has been established in November 2009, but, todate no meeting has taken place.
In Tajikistan, currently, there is no mechanism in place, but being discussed with the WB andthe Ministry of Education, given the fact that GOT recently received a USD 13.5 million grantunder the Catalytic Fund.
As for Nicaragua, consultation is rather informal, through exchange with EFA-FTI, while, on theother hand, participation in education round tables seems to facilitate such contacts.

Thematic global evaluation of European Commission support to the education sector in partner countries(Including basic and secondary education); Final Report Vol. IIb, December 2010; Particip GmbH
89
2.9.2 In your opinion, to what extent the FTI Catalytic Fund helped to improve countrypreparedness for EC sector support?
Only few perceptions of EUDs on the role of the FTI-CF in improving country preparedness for ECsector support could be gathered (6). Only one EUD, Tajikistan, is of the opinion that the FTI processhas been very significantly helping the country to prepare for SBS, as a catalytic factor behind themove towards SPSP which is foreseen (after evaluation period), and which seems to have improveddonor coordination and alignment. All other EUDs that answered the question, i.e. Burkina Faso,Ghana, Nicaragua, were of the opinion that the FTI was only helpful to a very limited extent,respectively not at all. This is quite understandable for all three of them, as in the first two countriesEC support has been channelled into GBS (almost exclusively) since a number of years, while in theNicaragua case the EC had already started its sector support when FTI became relevant. The otherEUDs rather complained about the lack of relation, while it seems as if in Burkina Faso the funds wereheld on a "non-trackable" account that gave no guarantee that additional resources would be given tothe Ministry of Education (Burkina Faso).
It should be noted that transparency and the sharing of financial information is a pre-condition forcountries to participate in FTI appraisals. According to the EUD these seem to be missing in Eritrea.
2.9.3 If an FTI country appraisal has taken place, how do/did the Delegation share its resultswith EC HQ in Brussels?
Only two EUDs, Uganda and Nicaragua, answered the question on how sharing of informationbetween them and HQ on results of FTI country appraisals took place. However, the answers givendid not indicate any mechanism for sharing information.
2.10 Aid modalities and channels
2.10.1 Overall suitability of the aid channels the EC uses (contracts) for achieving educationsector outcomes in partner countries
The questionnaire survey revealed an overview of the general suitability of various aid channels, asperceived by responsible EUD staff. The channels under consideration were: the partner government,NGOs, Development Banks, UN Bodies, private companies, research and education institutions, aswell as others that respondents named themselves. The following paragraphs summarise theresponses related to each channel, providing quantitative as well as qualitative data.
Figure 22: Results of survey to EUDs: Perceived suitability of delivery channels to achieveeducation sector outcomes
0,00
1,00
2,00
3,00
4,00
5,00
Perceived overall suitability of delivery channel toachieve education sector outcomes (average)
Scale: 5 = Very high; 4 = High; 3 = Medium; 2 = Low; 1 = Very low

Thematic global evaluation of European Commission support to the education sector in partner countries(Including basic and secondary education); Final Report Vol. IIb, December 2010; Particip GmbH
90
Channel Very high
High Medium Low Verylow
WeightedAverage
Government 6 8 2 1 0 4,12
NGO 0 5 8 3 1 3,00
Development Banks 0 3 3 1 3 2,60
UN Bodies 0 1 5 3 1 2,60
Private companies / dev. agencies acting as such 0 0 1 5 0 2,17
Research and education institutions 1 4 2 4 0 3,18
Overall, respondents on average ranked the government as having the highest suitability to achieveeducation sector outcomes, with a ‘high’ score of just above 4. NGOs and Research and educationinstitutions were perceived to have an average suitability of around three, i.e. medium. DevelopmentBanks and UN Bodies scored between two and three, and thus have suitability below medium, butabove low. And Private companies and development agencies acting as such were perceived to onlyhave low suitability for achieving education sector outcomes.
2.10.1.1 Government
The vast majority of all respondents who answered this question, indicated that they perceive thegovernment to have a very high (6) or high (8) suitability as a channel to achieve education outcomes.Only two EUDs described the suitability as medium, and none as low or very low, albeit threerespondents said that it was not applicable in their situation. The weighted average of all responses is4.12 – which indicates an overall ‘high’ suitability of the channel ‘government’.
Channel Very high High Medium Low Very low Weighted Average
Government 6 8 2 1 0 4,12
When providing reasons for their positive judgment, EUDs frequently point out the essential role of thegovernment in providing education services or in terms of the potential to create significant change(Botswana, Burkina Faso, Jamaica, South Africa, Bangladesh, Pakistan, and Argentina). Severalrespondents mentioned budget support as a modality in this context, and one EUD mentioned thepossibility of policy leverage related to working directly with the government.
2.10.1.2 NGOs
In terms of distribution, the largest number of all responses (8) elicited on this channel (17) indicated amedium suitability for NGOs as an education sector channel. This is confirmed by the weightedaverage score, which is three, i.e. medium suitability. Five respondents gave NGOs a high score, andthree a low score. Only one EUD remarked that the question was not applicable in their context.
Channel Very high High Medium Low Very low Weighted Average
NGO 0 5 8 3 1 3,00
The ‘medium’ scoring of NGOs is reflected in the set of qualitative answers accompanying thequantitative judgements. While several EUDs indicated that NGOs had a limited role and chance toachieve impact at a large level, most respondents pointed out specific roles for NGOs that theyperceived as important.
For example, two EUDs stated that NGOs have a complementing role to that of the government(Botswana; Bangladesh), in that they provide services outside the remit or provision of services by thegovernment. A number of respondents mentioned specific tasks which the see NGOs as handling,including support to children in difficulties, pre-schooling, and training of teachers (Botswana,Mozambique, India, Russia). Three questionnaire answers pointed out that NGOs had a special role interms of piloting projects/approaches (Burkina Faso, Mozambique, India). And another set ofresponses indicated that NGOs were suitable to address specific target groups, i.e. the mostmarginalised and those in distant locations or specific regions (Bangladesh, Indonesia, Vietnam,Russia). Two EUDs pointed out that NGOs have a special added value in terms of communityrelations, i.e. that they could improve the links between communities and schools and help to involvecommunities (Mozambique, Tajikistan). In Eritrea, the legal situation with regard to NGOs is such, thatbasically, “foreign NGOs have practically no licence to operate,” and “local NGOs […] cannot beconsidered as independent,” so no use of this channel for the purposes of education has been made.And finally, the EUD to Botswana asserted that NGOs may also take on a monitoring role (Botswana),to “monitor the performance of the sector and the implementation of government reforms and askGovernment to account for those.”

Thematic global evaluation of European Commission support to the education sector in partner countries(Including basic and secondary education); Final Report Vol. IIb, December 2010; Particip GmbH
91
2.10.1.3 Development Banks
Concerning Development Banks, the questionnaire revealed that half of the EUDs that answered thisquestion did not find the option applicable in their context. The majority of the other half of therespondents felt that the banks were of high (3) or medium (3) suitability, while a few asserted thatthey had low (1) or even very low (2) suitability. In terms of weighted average, a 2.6 indicates anoverall low to medium suitability.
Channel Very high High Medium Low Very low Weighted Average
Development Banks 0 3 3 1 3 2,60
The qualitative responses elicited by the questionnaire on the suitability of Development Banks weretoo varied to trace clear trends. Nevertheless, the individual answers may hold true for other contextsas well. For example, in South Africa, it was stated that while the government “may be open toreceiving technical assistance from development banks, but it does not wish to take loans from suchbanks.” In the context of Pakistan, it was asserted that “the WB in particular has a lot of expertise andresources for education and working with the Government.” This positive impression of workingthrough the WB is not shared by the EUD staff in Eritrea, who asserted, that “The Trust FundAgreement with the WB on the implementation of the Construction Component reflects the very limitedimpact that the EC has when using WB to channel its funds.” The respondent goes on to say that “thetwo or three supervision missions that WB sends to monitor implementation are insufficient toadequately monitor the implementation of this component […] and the shared mission Aide Memoirescan not substitute for critical expert analysis.” The EUD to Vietnam however, highlighted an addedvalue of working in the education sector through co-financing with the WB, namely that suchcooperation may result in a better flow of information, increased coordination and a more unified voicetowards the government.
2.10.1.4 UN Bodies
As for UN agencies, again, nearly half of all those who answered this question said that it was notapplicable. Of those who did rate UN bodies in terms of suitability as channels to achieve educationsector outcomes, all except one, indicated that it was either medium (5), or low (3). In terms ofweighted average, a 2.6 indicates an overall low to medium suitability.
Channel Very high High Medium Low Very low Weighted Average
UN Bodies 0 1 5 3 1 2,60
The related qualitative answers again do not reveal many trends except the following: that UN bodiesare particularly relevant when it comes to the provision of education services in crisis or (post-)conflictsituations, such as in the Occupied Palestinian Territory or Northern Pakistan (NWFP after the IDPcrisis). In Bangladesh, UNDP was applauded for its high availability and good relations with localpeople which it has in the Chittagong Hill Tracts; and in Indonesia, UNICEF was mentioned as a ‘goodchannel’, because “it reaches both national and grass-root levels.” Other respondents pointed out thatin their country there were no education contracts with UN bodies, or that UN bodies were not asrelevant as a channel for education service delivery.
2.10.1.5 Private companies
Nearly two-thirds of those who answered with regard to private companies indicated that the questionwas not applicable. Of the remaining third, the vast majority (five out of six) agreed that privatecompanies had a low suitability, while one EUD indicated suitability of a medium level. In terms ofweighted average, a 2.17 indicates an overall low suitability.
ChannelVeryhigh High Medium Low Very low
WeightedAverage
Private companies / dev. agencies acting as such 0 0 1 5 0 2,17
Since so few respondents felt that private companies were an applicable education service deliverychannel in their context, there are only a handful of qualitative comments on this channel elicitedthrough the questionnaire. The EUD to the Dominican Republic stated that private companies ordevelopment agencies acting as such had provided TA with positive results in the past, but that theyhad sustainability concerns. In the context of South Africa, according to the questionnaire, privatecompanies play a role in terms of providing materials and infrastructure, i.e. “providing textbooks andother learning materials and assist with the maintenance and upgrading of school facilities”. The EUDto Pakistan noted this channel was important because there was much knowledge and expertise inparticular for capacity building within it.

Thematic global evaluation of European Commission support to the education sector in partner countries(Including basic and secondary education); Final Report Vol. IIb, December 2010; Particip GmbH
92
2.10.1.6 Research and education institutions
EUD responses concerning research and educational institutions as channels for education aiddelivery were more varied than those for other channels. A large part of the EUDs either felt that suchinstitutions had a high suitability (4), and an equal part felt that they had a low suitability (4). Onerespondent gave them a very high score, and two a medium score. In terms of weighted average, a3.18 indicates an overall medium suitability.
Channel Very high High Medium Low Very low Weighted Average
Research and education institutions 1 4 2 4 0 3,18
The detail and nature of qualitative responses for this channel was quite mixed, and no general trendscan be observed, but a few highlights are worth citing. One EUD for example, pointed out that“research institutions can provide and have provided valuable insights into the reasons forunsatisfactory performance, and education institutions have to train teachers and educationmanagers.” Another EUD asserted that building the capacity of research and education institutionswas important to “allow them to play a meaningful role in proposing/implementing reforms andmonitoring the performance of the sector.” (Botswana)
2.10.1.7 Others
Only one out of all EUDs who answered the questionnaire survey indicated a rating for ‘other’channels of aid delivery suitable to achieve education sector outcomes in partner countries. However,the respondent did not indicate in the qualitative answer field what sort of channel he/she wasreferring to, nor provided any reasoning for the rating. Thus no conclusions can be drawn from theresponse.
2.10.2 Suitability of the aid channels the EC uses (contracts) for achieving education sectoroutcomes in partner countries by themes
After eliciting responses on the general perceived suitability of various aid channels, the survey wenton to ask for the suitability of these same channels with regard to specific education sector outcomes,namely:
Improving access to basic education;
Improving transition to secondary education (both lower and upper);
Improving access to education for disadvantaged segments of the population (e.g. girls,handicapped, rural…);
Improving the quality of education;
Improving leaning achievements in education;
Improving management of education service delivery;
Improving transparency and accountability of education service delivery; and
Others (to be specified by the respondents).
The following paragraphs summarise the responses related to each channel, providing quantitative aswell as qualitative data.
2.10.2.1 Access to basic education
In terms of the average score for each channel’s suitability with regard to the improvement of accessto basic education, the results of the survey show that the government was perceived as being mostsuitable, with its average suitability being perceived as ‘high.’ According to survey respondents, thesecond most suitable channel were “research and education institutions”, followed closely by NGOsand Development Banks. All of these three had an average suitability ranking of about three, i.e.medium. UN bodies and private companies and development agencies acting as such had a loweraverage ranking, above and around 2, i.e. low suitability.

Thematic global evaluation of European Commission support to the education sector in partner countries(Including basic and secondary education); Final Report Vol. IIb, December 2010; Particip GmbH
93
Figure 23: Results of survey to EUDs: Access to basic education - perceived suitability ofchannels
-1,002,003,004,005,00
Access to basic education:Perceived suitability of channel (average)
Scale: 5 = Very high; 4 = High; 3 = Medium; 2 = Low; 1 = Very low
Channel Very high High Medium Low Very low AverageGovernment 7 7 2 1 0 4,18NGO 0 4 7 3 1 2,93Development Banks 1 0 3 1 1 2,83UN Bodies 0 0 2 0 1 2,33Private companies / dev. agencies acting as such 0 0 0 3 0 2,00Research and education institutions 0 3 1 0 1 3,20
In terms of qualitative responses, there are no general trends that emerge. Nevertheless, a fewstatements are worth citing. Highlighting the high suitability of the government, respondents said that“the government is the main actor and the main target for that objective;” that the “government atcentral and decentralised levels are best places to deliver on basic education;” and that “by and largein the social sectors the government is the main service provider.” As regards the role of NGOs,responses truly vary, ranging from positive assessments of their suitability, such as “NGOs have agreat role to play, especially in rural areas,” to rather negatively judged suitability: “NGOs have no realrole in the provision of formal education.”
2.10.2.2 Improving transition to secondary
In terms of the average score for each channel’s suitability with regard to the improvement of thetransition to secondary education, again, the government receives the highest score. On average, thegovernment was ranked as having a high suitability, while all other channels had suitability betweenjust about two and three, i.e. low to medium. On the higher end of this spectrum were NGOs,Development Banks and Research and education institutions with scores around 2.5. And on thelower end were Private companies and DPs acting as such.

Thematic global evaluation of European Commission support to the education sector in partner countries(Including basic and secondary education); Final Report Vol. IIb, December 2010; Particip GmbH
94
Figure 24: Results of survey to EUDs: Improving transition to secondary - perceived suitability ofchannels
-1,002,003,004,005,00
Improving transition to secondary:Perceived suitability of channel (average)
Scale: 5 = Very high; 4 = High; 3 = Medium; 2 = Low; 1 = Very low
Channel Veryhigh
High Medium Low Verylow
Average
Government 5 7 1 1 0 4.14NGO 0 1 5 4 1 2.55Development Banks 0 0 4 1 1 2.50UN Bodies 0 0 2 1 1 2.25Private companies / dev. agencies acting as such 0 0 0 3 0 2.00Research and education institutions 0 2 1 0 2 2.60
Unfortunately, respondents did not provide a lot of qualitative answers to justify their scorings for thiseducation sector outcome. One respondent indicated that in fact this outcome was “something that isprobably not very well done by all the partners.” And other statements repeat the arguments raised forimproving access to basic education, i.e. that the government was the best placed to deliver on socialservices. An interesting statement by one EUD was that “NGOs can assist with addressing socialissues that prevent older children from remaining in school” (South Africa).
2.10.2.3 Improving access to education for disadvantaged groups
In terms of the average score for each channel’s suitability with regard to improving access toeducation for disadvantaged groups, NGOs score highest, followed closely by the government.Both of them are perceived to have an average suitability of just below ‘high’, while all other channelsare scored below medium, the lowest being Private companies and development agencies acting assuch.

Thematic global evaluation of European Commission support to the education sector in partner countries(Including basic and secondary education); Final Report Vol. IIb, December 2010; Particip GmbH
95
Figure 25: Results of survey to EUDs: Improving access to education for disadvantaged groups- perceived suitability of channels
-1,002,003,004,005,00
Improving access to education for disadvantagedgroups: Perceived suitability of channel (average)
Scale: 5 = Very high; 4 = High; 3 = Medium; 2 = Low; 1 = Very low
Channel Veryhigh
High Medium Low Verylow
Average
Government 4 4 5 0 1 3,71
NGO 4 5 4 1 0 3,86Development Banks 0 1 4 0 2 2,57
UN Bodies 0 1 3 0 1 2,80
Private companies / dev. agencies acting as such 0 0 0 3 0 2,00
Research and education institutions 0 2 1 1 1 2,80
Again, the qualitative answers for this sector outcome are not very detailed. However, a fewrespondents clearly point out the high suitability of NGOs with statements such as “NGOs can play avery important role in complementing government services for disadvantaged groups,” and “NGOs arebetter positioned to help vulnerable people.” Such statements seem to capture the general trend ofresponses, most of which perceive the specific suitability of NGOs to lie in their specific ability to focuson particular people groups and their needs.
2.10.2.4 Improving quality of education
In terms of the average score for each channel’s suitability with regard to the improving the quality ofeducation, both the government and the research and education institutions score highest, with scoresabove 3,5 but under 4, i.e. indicating quite a high suitability. NGOs, Development Banks and UNBodies all are perceived to have a medium suitability on average, with Private companies anddevelopment agencies acting as such again have a low score.

Thematic global evaluation of European Commission support to the education sector in partner countries(Including basic and secondary education); Final Report Vol. IIb, December 2010; Particip GmbH
96
Figure 26: Results of survey to EUDs: Improving quality of education - perceived suitability ofchannels
-1,002,003,004,005,00
Improving quality of education:Perceived suitability of channel (average)
Scale: 5 = Very high; 4 = High; 3 = Medium; 2 = Low; 1 = Very low
Channel Veryhigh
High Medium Low Verylow
Average
Government 6 4 2 4 0 3,75NGO 0 4 7 3 0 3,07Development Banks 0 3 3 0 2 2,88UN Bodies 0 2 2 0 1 3,00Private companies / dev. agencies acting assuch
0 0 1 2 1 2,00
Research and education institutions 2 3 2 0 1 3,63
When providing qualitative responses in relation to their scoring for this sector outcome, respondentsoften referred to earlier statements made for other outcomes. One EUD stated that “the improvementof the quality is a big challenge, as the technical services of the Ministry are often weak.” (BurkinaFaso) and another EUD relates the experience made with channelling funds through the WB,describing it as “tedious as the payment schedules to the beneficiaries are very fragmented (fivepayments of 20%) but the outcome [being] very good.” (Occupied Palestinian Territory).
2.10.2.5 Improving learning achievements
In terms of the average score for each channel’s suitability with regard to the improvement of learningachievement was highest again for the government, with a score of just below 4, i.e. high. NGOs, UNBodies and Research and education institutions had a perceived average score of around three, i.e.medium. Development banks scored around 2.5, and Private companies and development agenciesacting as such scored even below ‘low’.

Thematic global evaluation of European Commission support to the education sector in partner countries(Including basic and secondary education); Final Report Vol. IIb, December 2010; Particip GmbH
97
Figure 27: Results of survey to EUDs: Improving learning achievements - perceived suitability ofchannels
-1,002,003,004,005,00
Improving learning achievements:Perceived suitability of channel (average)
Scale: 5 = Very high; 4 = High; 3 = Medium; 2 = Low; 1 = Very low
Channel Veryhigh
High Medium Low Verylow
Average
Government 5 5 2 2 1 3,73NGO 0 2 7 3 0 2,92Development Banks 0 1 4 0 2 2,57UN Bodies 0 2 2 0 1 3,00Private companies / dev. agencies acting as such 0 0 0 3 1 1,75Research and education institutions 1 1 1 1 1 3,00
The few qualitative answers elicited, mostly refer to previous statements made for other outcomesresearched.
2.10.2.6 Improving management of education service delivery
In terms of the average score for each channel’s suitability with regard to improving the managementof education service delivery, the government again received a high score, just above 4. DevelopmentBanks scored above medium, followed by Research and education institutions and NGOs. UN Bodieshad a perceived suitability of just above 2, i.e. low, and private companies and development agenciesacting as such even lower.

Thematic global evaluation of European Commission support to the education sector in partner countries(Including basic and secondary education); Final Report Vol. IIb, December 2010; Particip GmbH
98
Figure 28: Results of survey to EUDs: Improving management of education service delivery -perceived suitability of channels
-1,002,003,004,005,00
Improving management of education service delivery:Perceived suitability of channel (average)
Scale: 5 = Very high; 4 = High; 3 = Medium; 2 = Low; 1 = Very low
Channel Veryhigh
High Medium Low Verylow
Average
Government 6 5 3 1 0 4,07
NGO 1 2 4 5 1 2,77Development Banks 1 2 3 0 1 3,29
UN Bodies 0 0 2 1 1 2,25
Private companies / dev. agencies acting as such 0 0 0 3 1 1,75
Research and education institutions 0 2 2 0 1 3,00
While many respondents just referred to previous statements made for other sector outcomes, a fewdid give insightful responses. One EUD responded by stating that there are reputable NGOS in thecountry that provide services with regard to the management of education service delivery, and onerespondent wrote that while they might not have the main responsibility in regard to this outcome,“CSOs can support this and assist in the monitoring and support to less resourced districts.” (Uganda)And finally, one EUD spoke of its own experience, saying that “SBS should be complemented withTechnical Assistance to achieve better results on this issue” (Nicaragua).
2.10.2.7 Improving transparency and accountability of education service delivery
In terms of the average score for each channel’s suitability with regard to the improvement oftransparency and accountability of education service delivery, three channels were scored fairlysimilarly, namely the government, NGOs, and Research and education institutions. All three scoredabove 3, but below 3.5 – indicating a bit more than ‘medium’ suitability on average. These threechannels were followed (with decreasing scores) by Private companies and development agenciesacting as such, Development Banks, and UN Bodies, all three scoring above two (i.e. low suitability). Itis interesting to note that the scoring for Private companies and development agencies acting as suchdiverges significantly from the scoring these channels had received for other education sectoroutcomes, being higher.
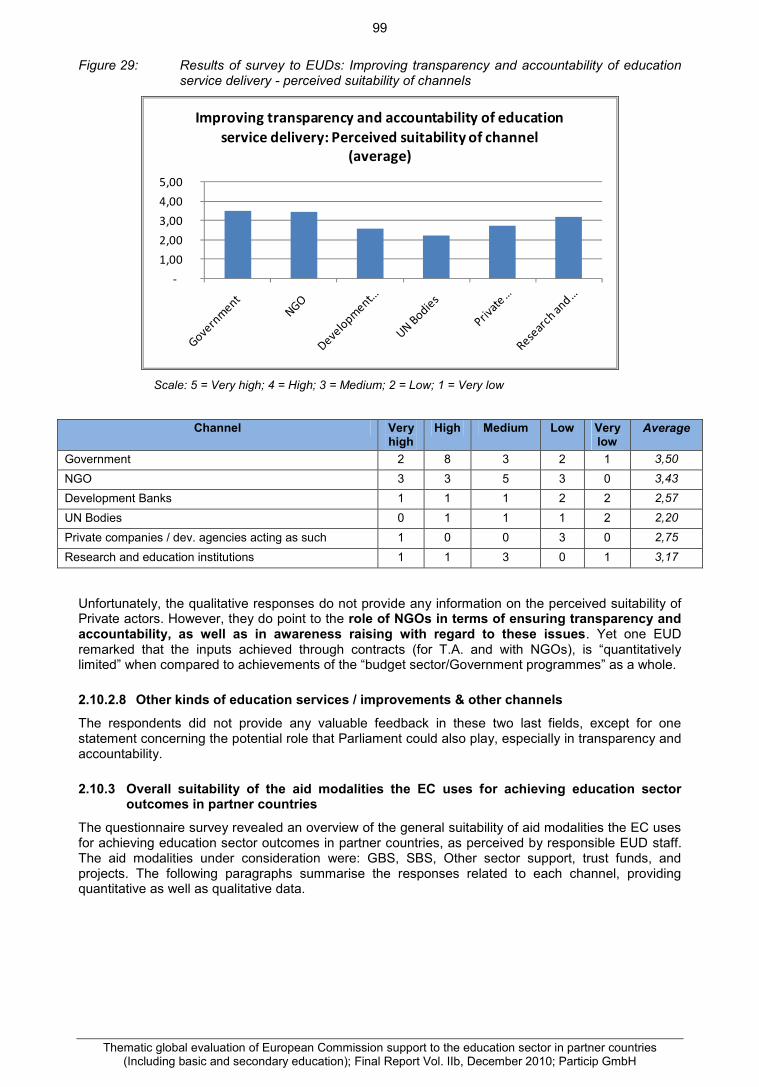
Thematic global evaluation of European Commission support to the education sector in partner countries(Including basic and secondary education); Final Report Vol. IIb, December 2010; Particip GmbH
99
Figure 29: Results of survey to EUDs: Improving transparency and accountability of educationservice delivery - perceived suitability of channels
-1,002,003,004,005,00
Improving transparency and accountability of educationservice delivery: Perceived suitability of channel
(average)
Scale: 5 = Very high; 4 = High; 3 = Medium; 2 = Low; 1 = Very low
Channel Veryhigh
High Medium Low Verylow
Average
Government 2 8 3 2 1 3,50
NGO 3 3 5 3 0 3,43Development Banks 1 1 1 2 2 2,57
UN Bodies 0 1 1 1 2 2,20
Private companies / dev. agencies acting as such 1 0 0 3 0 2,75
Research and education institutions 1 1 3 0 1 3,17
Unfortunately, the qualitative responses do not provide any information on the perceived suitability ofPrivate actors. However, they do point to the role of NGOs in terms of ensuring transparency andaccountability, as well as in awareness raising with regard to these issues. Yet one EUDremarked that the inputs achieved through contracts (for T.A. and with NGOs), is “quantitativelylimited” when compared to achievements of the “budget sector/Government programmes” as a whole.
2.10.2.8 Other kinds of education services / improvements & other channels
The respondents did not provide any valuable feedback in these two last fields, except for onestatement concerning the potential role that Parliament could also play, especially in transparency andaccountability.
2.10.3 Overall suitability of the aid modalities the EC uses for achieving education sectoroutcomes in partner countries
The questionnaire survey revealed an overview of the general suitability of aid modalities the EC usesfor achieving education sector outcomes in partner countries, as perceived by responsible EUD staff.The aid modalities under consideration were: GBS, SBS, Other sector support, trust funds, andprojects. The following paragraphs summarise the responses related to each channel, providingquantitative as well as qualitative data.

Thematic global evaluation of European Commission support to the education sector in partner countries(Including basic and secondary education); Final Report Vol. IIb, December 2010; Particip GmbH
100
Figure 30: Results of survey to EUDs: Perceived suitability of modalities to achieve educationsector outcomes
0,00
1,00
2,00
3,00
4,00
5,00
GBS SBS Other sectorsupport
Trust Funds Projects
Perceived suitability of modalities to achieve educationsector outcomes
Scale: 5 = Very high; 4 = High; 3 = Medium; 2 = Low; 1 = Very low
Modality Veryhigh
High Medium Low Verylow
Weighted Average
GBS 1 2 4 3 1 2,91
SBS 5 6 0 1 1 4,00
Other sector support 1 4 3 1 1 3,30
Trust Funds 0 3 3 0 1 3,14
Projects 0 4 8 6 0 2,89
2.10.3.1 General Budget Support
In terms of the distribution of responses, the small table below illustrates that most of the EUDs whichanswered this question, scored the suitability of GBS as medium, a few as high and a few as low. Thisis reflected in the weighted average score, which is 2.91 indicating a suitability just below medium.
Modality Very high High Medium Low Very low Weighted Average
GBS 1 2 4 3 1 2,91
The qualitative feedback on the reasons for this scoring are too mixed to identify trends, but areinsightful nonetheless. One respondent felt that GBS was a good tool, but “implied that the technicalministries have capacities to handle it,” which apparently in the case of this country (in Burkina Faso)was not perceived to be the case. Another respondent remarked that in his/her country of posting,budget support was projectised and had a “limited impact on the education sector” (DominicanRepublic). Yet another EUD staff felt that the use of GBS would reduce the potential for sectorspecific dialogue, while the staff of another EUD stated that GBS would be enable one todirectly affect the policy processes and dialogue. The most detailed response came from the EUDin Argentina, which is worth citing in its entirety: “Given the reduced amount of EC assistance vis a visnational and provincial education budgets, GBS would not contribute to policy focus. Additionally,given the structure of the National Budget Management System, the appropriations for specific actionsare only possible through a project approach.”
All these responses reveal that a broad array of perceptions on how suitable GBS is exist withinEUDs. But despite the fact that opinions vary, nearly no respondent considered the suitability of GBSfor education sector outcomes either very high, or very low.
2.10.3.2 Sector Budget Support
In terms of the distribution of scorings for SBS as an aid modality to achieve education sectoroutcomes, quite a clear picture presents itself. Eleven out of thirteen respondents who filled in a score,perceived the suitability of SBS to be either high (6) or very high (5). Only two respondents felt that itwas low or very low, and nobody felt that it was ‘medium.’ The weighted average suitability is 4,0

Thematic global evaluation of European Commission support to the education sector in partner countries(Including basic and secondary education); Final Report Vol. IIb, December 2010; Particip GmbH
101
which means that, on average, the EUDs felt that generally, SBS is highly suitable to achieveeducation sector outcomes.
Modality Very high High Medium Low Very low Weighted Average
SBS 5 6 0 1 1 4,00
The qualitative responses in relation to the suitability of budget support confirm the positive scoring.Many statements assert that SBS provides a good basis for policy dialogue. In this vein EUD’sspeak of “optimal opportunities for sector dialogue” and “high participation at policy dialogue comparedto the rather modest financial commitment.” One respondent pronounced that SBS was preferable toGBS in their country, since the MoE was “not strong enough towards the MoF” (Burkina Faso).Another EUD pointed out that in their experience; SBS is more workable at the provincial rather thanfederal level, since in their country, the provinces were responsible for implementation (Pakistan). Andfinally, one EUD staff (Tajikistan) responded by suggesting that as the EUD expands its support, “itmay be advisable to use a mix of aid modalities such as SBS (leverage can be very high,thanks to the privileged relation and partnership built with the Ministry of Finance), TA (inareas needed by the MoE) and projects for specific interventions related to communitymobilizations (teachers parents associations etc).”
2.10.3.3 Other sector support
The scorings in relation to ‘other sector support’ are distributed with a majority of responses at aroundhigh or medium suitability (seven out of ten). This is medium to high suitability is confirmed by theweighted average of 3.3.
Modality Very high High Medium Low Very low Weighted Average
Other sector support 1 4 3 1 1 3,30
Since the terminology of ‘other sector support’ can refer to a variety of practical situations, qualitativeresponses point in a number of directions. The kind of ‘other sector support’ that are mentioned,include: complementary technical assistance to budget support programmes and capacity buildinginitiatives, for example to conduct studies, expenditure reviews, assistance to develop plans/polices,etc., but also participation in different sector working groups, conference funding, and evenscholarships for students and academic staff.
2.10.3.4 Financing Trust Funds
In terms of the distribution of scorings in relation to the suitability of trust funds as an aid modality forthe achievements of education sector outcomes, most respondents either provided a high or mediumscore. The weighted average reflects this, with a score of 3.14 – which indicates a medium suitabilityof the aid modality.
Modality Very high High Medium Low Very low Weighted Average
Trust Funds 0 3 3 0 1 3,14
Unfortunately, there are very few qualitative responses concerning the suitability of trust funds. TheEUD to Indonesia respondent remarked that the “trust fund approach allows for coordination of donorscompared to projects.” But another EUD (Occupied Palestinian Territory) was more detailed, speakingof their own experience, in which “trust funds with the WB are not easy to manage and to monitor, butthe outcomes of the project are excellent (thanks to a high level of expertise within the WB)”.
2.10.3.5 Project support
In terms of the distribution of scorings in relation to the suitability of project support as an aid modalityfor the achievements of education sector outcomes, responses vary between a ‘high’ and ‘low’scoring. The weighted average score is 2.89 - indicating an average of perceived suitability of a‘medium’ level.
Modality Very high High Medium Low Very low Weighted Average
Projects 0 4 8 6 0 2,89
There is a broad range of qualitative responses on the project support modality, ranging from verypositive, to rather negative judgements:
On the positive side, projects are perceived as a good tool for improving specific technicalaspects, for piloting, to bridge gaps where GBS “is deficient”, for focusing on less advantagesgroups, and to promote research and innovation.

Thematic global evaluation of European Commission support to the education sector in partner countries(Including basic and secondary education); Final Report Vol. IIb, December 2010; Particip GmbH
102
On the more negative side, some EUDs expressed their views, asserting that impact may bevery limited, sustainability was at risk, there was a risk of in terms of corruption issues, and arisk that projects remain isolated.
A few EUDs pointed to conditions which were necessary to make projects successful, including theneeds for: close dialogue between all stakeholders, attention from the EUD to promote results at thehigher level, full alignment to national priorities, and high ownership of national authorities.
2.10.3.6 Other
The EUDs did not respond with regard to this option in the questionnaire.
2.10.4 Suitability of the aid modalities the EC uses for achieving education sector outcomes inpartner countries by themes
After eliciting responses on the general perceived suitability of various aid modalities, the survey wenton to ask for perceptions on the suitability of these same modalities with regard to specific educationsector outcomes, namely:
Improving access to basic education; Improving transition to secondary education (both lower and upper); Improving access to education for disadvantaged segments of the population (e.g. girls,
handicapped, rural…); Improving the quality of education; Improving leaning achievements in education; Improving management of education service delivery; Improving transparency and accountability of education service delivery; and Others (to be specified by the respondents).
The following paragraphs summarise the responses related to each aid modality, providingquantitative as well as qualitative data.
2.10.4.1 Access to basic education
In terms of the average score for each modality’s suitability with regard to improving access to basiceducation, SBS scored highest, followed by other sector support. Next in terms of ranking are trustfunds and projects. GBS has the lowest score, with a perceived suitability of around 2.5 – indicating alow-to-medium perceived suitability. Interestingly, the average scores for all modalities are below 4,which would indicate a rather high suitability.
Figure 31: Results of survey to EUDs: Access to basic education - perceived suitability ofmodalities
0,00
1,00
2,00
3,00
4,00
5,00
GBS SBS Other sectorsupport
Trust funds Projects
Access to basic education:Perceived suitability of modalities (average)
Scale: 5 = Very high; 4 = High; 3 = Medium; 2 = Low; 1 = Very low

Thematic global evaluation of European Commission support to the education sector in partner countries(Including basic and secondary education); Final Report Vol. IIb, December 2010; Particip GmbH
103
Modality Veryhigh
High Medium Low Verylow
WeightedAverage
GBS 1 1 3 4 2 2,55
SBS 3 5 3 1 2 3,43
Other sector support 0 2 4 0 0 3,33
Trust funds 0 2 2 0 1 3,00
Projects 1 2 9 2 1 3,00
Unfortunately, the qualitative responses with regard to this education sector outcome are not verycomprehensive. One EUD remarked that “projects are usually targeting marginalised groups” and that“in terms of numbers, they do well at local level and must be mainstreamed.” (India) Another EUD(Nicaragua) confirmed the high scoring for SBS by asserting that “SBS is the most appropriateinstrument to support national priorities in education to date.” Finally, one respondent stated that “GBSis useful as indicators assist Government policies”, but provides no further detail.
2.10.4.2 Improving transition to secondary
In terms of the average score for each modality’s suitability with regard to improving transition tosecondary, SBS has the highest score (above 3.5). Other sector support and trust funds have a bitmore than medium perceived suitability, while GBS and projects both rank lower, with scores justabove 2,5 – indicating a low to medium suitability.
Figure 32: Results of survey to EUDs: Improving transition to secondary - perceived suitability ofmodalities
0,00
1,00
2,00
3,00
4,00
5,00
GBS SBS Other sectorsupport
Trust funds Projects
Improving transition to secondary:Perceived suitability of modalities (average)
Scale: 5 = Very high; 4 = High; 3 = Medium; 2 = Low; 1 = Very low
Modality Veryhigh
High Medium Low Verylow
WeightedAverage
GBS 1 0 4 3 1 2,67
SBS 2 6 4 0 1 3,62
Other sector support 0 1 3 0 0 3,25
Trust funds 0 1 3 0 0 3,25
Projects 0 1 6 5 0 2,67
Unfortunately, the qualitative responses with regard to this education sector outcome are very limited.Most respondents simply referred to previous comments made.
2.10.4.3 Improving access to education for disadvantaged groups
In terms of the average score for each modality’s suitability with regard to improving access toeducation for disadvantaged groups, SBS and projects have the highest scores, with averages ofaround 3.5 – indicating a medium to high suitability. Other sector support received a scoring above,

Thematic global evaluation of European Commission support to the education sector in partner countries(Including basic and secondary education); Final Report Vol. IIb, December 2010; Particip GmbH
104
and trust funds around a medium suitability. GBS again ranks lowest, with an average perceivedsuitability of around 2.5 – indicating a low to medium suitability.
Figure 33: Results of survey to EUDs: Improving access to education for disadvantaged groups- perceived suitability of modalities
0,00
1,00
2,00
3,00
4,00
5,00
GBS SBS Other sectorsupport
Trust funds Projects
Improving access to education for disadvantagedgroups: Perceived suitability of modalities (average)
Scale: 5 = Very high; 4 = High; 3 = Medium; 2 = Low; 1 = Very low
Modality Veryhigh
High Medium Low Verylow
WeightedAverage
GBS 0 2 1 4 1 2,50
SBS 1 6 3 0 1 3,55
Other sectorsupport
0 1 4 0 0 3,20
Trust funds 0 1 2 1 0 3,00
Projects 2 6 5 2 0 3,53
Unfortunately, the qualitative responses with regard to this education sector outcome are not verycomprehensive. One of the respondents pointed out that projects tend to fit into areas omitted by aspecific large national flagship programme. Another EUD (Nicaragua) affirmed the suitability of NGOprojects which apparently “proved to be suitable and complementary.”
2.10.4.4 Improving quality of education
In terms of the average score for each modality’s suitability with regard to improving the quality ofeducation, SBS ranks highest with a score higher than 3,5, followed by trust funds, then other sectorsupport, then projects, and then GBS with a score of above 2,5.

Thematic global evaluation of European Commission support to the education sector in partner countries(Including basic and secondary education); Final Report Vol. IIb, December 2010; Particip GmbH
105
Figure 34: Results of survey to EUDs: Improving quality of education - perceived suitability ofmodalities
0,00
1,00
2,00
3,00
4,00
5,00
GBS SBS Other sectorsupport
Trust funds Projects
Improving quality of education:Perceived suitability of modalities (average)
Scale: 5 = Very high; 4 = High; 3 = Medium; 2 = Low; 1 = Very low
Modality Veryhigh
High Medium Low Verylow
WeightedAverage
GBS 1 1 3 4 1 2,70
SBS 2 7 4 0 1 3,64
Other sector support 0 1 3 0 0 3,25
Trust funds 0 2 2 0 0 3,50
Projects 0 5 4 3 1 3,00
Unfortunately, the qualitative responses with regard to this education sector outcome are not verycomprehensive. Concerning projects, one EUD (India) stated that they “do well, but are geographicallyor number wise limited.” And yet another EUD (Jamaica) revealed that there was a budget supportrelated indicator to encourage greater expenditure on the quality of education.
2.10.4.5 Improving learning achievements
In terms of the average score for each modality’s suitability with regard to improving learningachievements, again SBS ranks highest, but is closely followed by trust funds – both with an averagescore of around 3.5 indicating medium to high suitability. Other sector support also receives arelatively high scoring, clearly above medium suitability. Projects are perceived as nearly of a mediumsuitability, while GBS is ranked below 2.5 – indicating a low to medium suitability.
Figure 35: Results of survey to EUDs: Improving learning achievements - perceived suitability ofmodalities
0,00
1,00
2,00
3,00
4,00
5,00
GBS SBS Other sectorsupport
Trust funds Projects
Improving learning achievements:Perceived suitability of modalities (average)

Thematic global evaluation of European Commission support to the education sector in partner countries(Including basic and secondary education); Final Report Vol. IIb, December 2010; Particip GmbH
106
Scale: 5 = Very high; 4 = High; 3 = Medium; 2 = Low; 1 = Very low
Modality Veryhigh
High Medium Low Verylow
WeightedAverage
GBS 1 0 2 5 1 2,44
SBS 3 4 3 1 1 3,58
Other sector support 0 1 3 0 0 3,25
Trust funds 0 2 2 0 0 3,50
Projects 0 3 4 4 1 2,75
Again, the qualitative responses with regard to this education sector outcome are not verycomprehensive. Only one EUD (India) responded substantially in this regard, stating that in theircountry there were structural issues still to be addressed in their country’s main drive towards theimprovement of learning achievements. The same EUD also highlighted positive experiences with theproject approach with one specific NGO, concerning a project for the enrichment of school leveleducation.
2.10.4.6 Improving management of education service delivery
In terms of the average score for each modality’s suitability with regard to improving the managementof education service delivery, other sector support has the highest score with a clear 4, - i.e. highsuitability. SBS also is perceived to have a rather high suitability, followed by trust funds with a 3.5.Both projects and GBS are scored at around 2.5 – indicating a low to medium suitability.
Figure 36: Results of survey to EUDs: Improving management of education service delivery -perceived suitability of modalities
0,00
1,00
2,00
3,00
4,00
5,00
GBS SBS Other sectorsupport
Trust funds Projects
Improving management of education service delivery:Perceived suitability of modalities (average)
Scale: 5 = Very high; 4 = High; 3 = Medium; 2 = Low; 1 = Very low
Modality Veryhigh
High Medium Low Verylow
WeightedAverage
GBS 1 0 4 2 2 2,56
SBS 3 7 2 0 1 3,85
Other sectorsupport
1 1 1 0 0 4,00
Trust funds 0 2 2 0 0 3,50
Projects 0 3 2 3 2 2,60
The qualitative responses with regard to this education sector outcome are equally not verycomprehensive. One EUD pointed out that in their country there were structural issues to beaddressed in order to achieve this sector outcome, which could not really be addressed by projects.
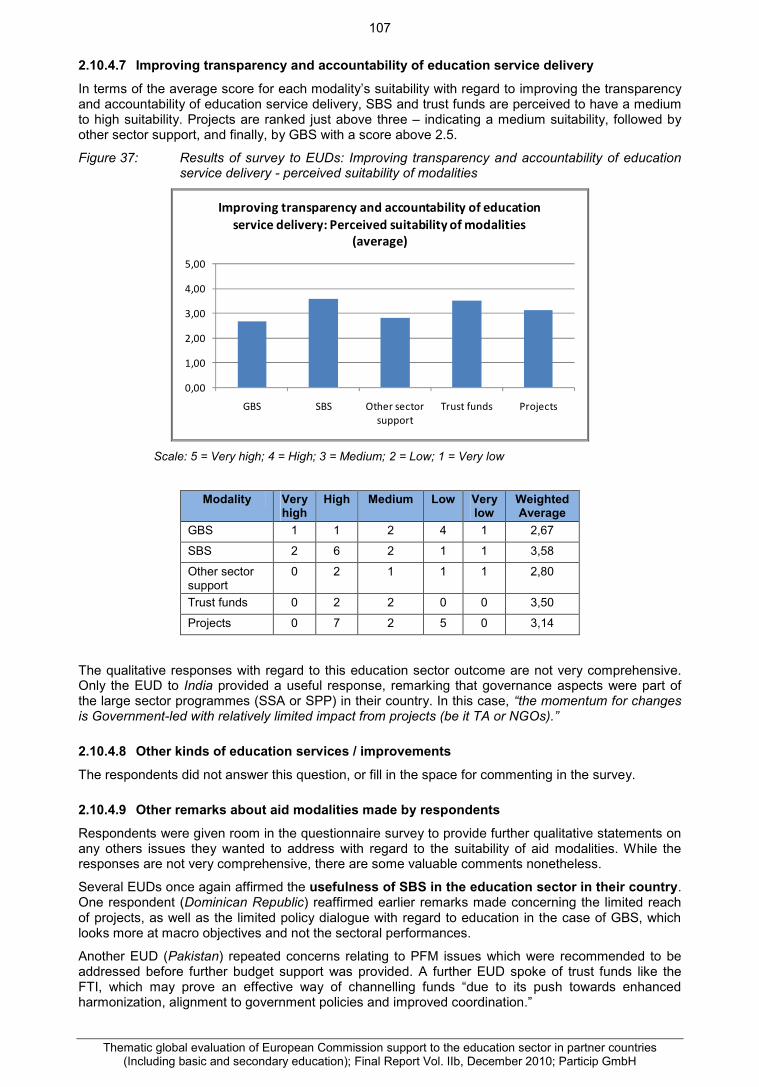
Thematic global evaluation of European Commission support to the education sector in partner countries(Including basic and secondary education); Final Report Vol. IIb, December 2010; Particip GmbH
107
2.10.4.7 Improving transparency and accountability of education service delivery
In terms of the average score for each modality’s suitability with regard to improving the transparencyand accountability of education service delivery, SBS and trust funds are perceived to have a mediumto high suitability. Projects are ranked just above three – indicating a medium suitability, followed byother sector support, and finally, by GBS with a score above 2.5.
Figure 37: Results of survey to EUDs: Improving transparency and accountability of educationservice delivery - perceived suitability of modalities
0,00
1,00
2,00
3,00
4,00
5,00
GBS SBS Other sectorsupport
Trust funds Projects
Improving transparency and accountability of educationservice delivery: Perceived suitability of modalities
(average)
Scale: 5 = Very high; 4 = High; 3 = Medium; 2 = Low; 1 = Very low
Modality Veryhigh
High Medium Low Verylow
WeightedAverage
GBS 1 1 2 4 1 2,67
SBS 2 6 2 1 1 3,58
Other sectorsupport
0 2 1 1 1 2,80
Trust funds 0 2 2 0 0 3,50
Projects 0 7 2 5 0 3,14
The qualitative responses with regard to this education sector outcome are not very comprehensive.Only the EUD to India provided a useful response, remarking that governance aspects were part ofthe large sector programmes (SSA or SPP) in their country. In this case, “the momentum for changesis Government-led with relatively limited impact from projects (be it TA or NGOs).”
2.10.4.8 Other kinds of education services / improvements
The respondents did not answer this question, or fill in the space for commenting in the survey.
2.10.4.9 Other remarks about aid modalities made by respondents
Respondents were given room in the questionnaire survey to provide further qualitative statements onany others issues they wanted to address with regard to the suitability of aid modalities. While theresponses are not very comprehensive, there are some valuable comments nonetheless.
Several EUDs once again affirmed the usefulness of SBS in the education sector in their country.One respondent (Dominican Republic) reaffirmed earlier remarks made concerning the limited reachof projects, as well as the limited policy dialogue with regard to education in the case of GBS, whichlooks more at macro objectives and not the sectoral performances.
Another EUD (Pakistan) repeated concerns relating to PFM issues which were recommended to beaddressed before further budget support was provided. A further EUD spoke of trust funds like theFTI, which may prove an effective way of channelling funds “due to its push towards enhancedharmonization, alignment to government policies and improved coordination.”

Thematic global evaluation of European Commission support to the education sector in partner countries(Including basic and secondary education); Final Report Vol. IIb, December 2010; Particip GmbH
108
And finally, one respondent questioned the term ‘other forms of support’ used at some stage in thequestionnaire, as well as the link between aid modality and outcomes. Regarding the latter, it wasstated that the “achievement of outcomes is not only dependent on the aid modality but also andperhaps mainly on the design, performance and management of the operation, whatever the modality(e.g. we have trust funds working well, so likely to achieve outcomes, others not working well, sounlikely to result in significant outcomes).”

Thematic global evaluation of European Commission support to the education sector in partner countries(Including basic and secondary education); Final Report Vol. IIb, December 2010; Particip GmbH
109
2.11 Appendix: EUD Survey Form

Thematic global evaluation of European Commission support to the education sector in partner countries(Including basic and secondary education); Final Report Vol. IIb, December 2010; Particip GmbH
110
:

Thematic global evaluation of European Commission support to the education sector in partner countries(Including basic and secondary education); Final Report Vol. IIb, December 2010; Particip GmbH
111
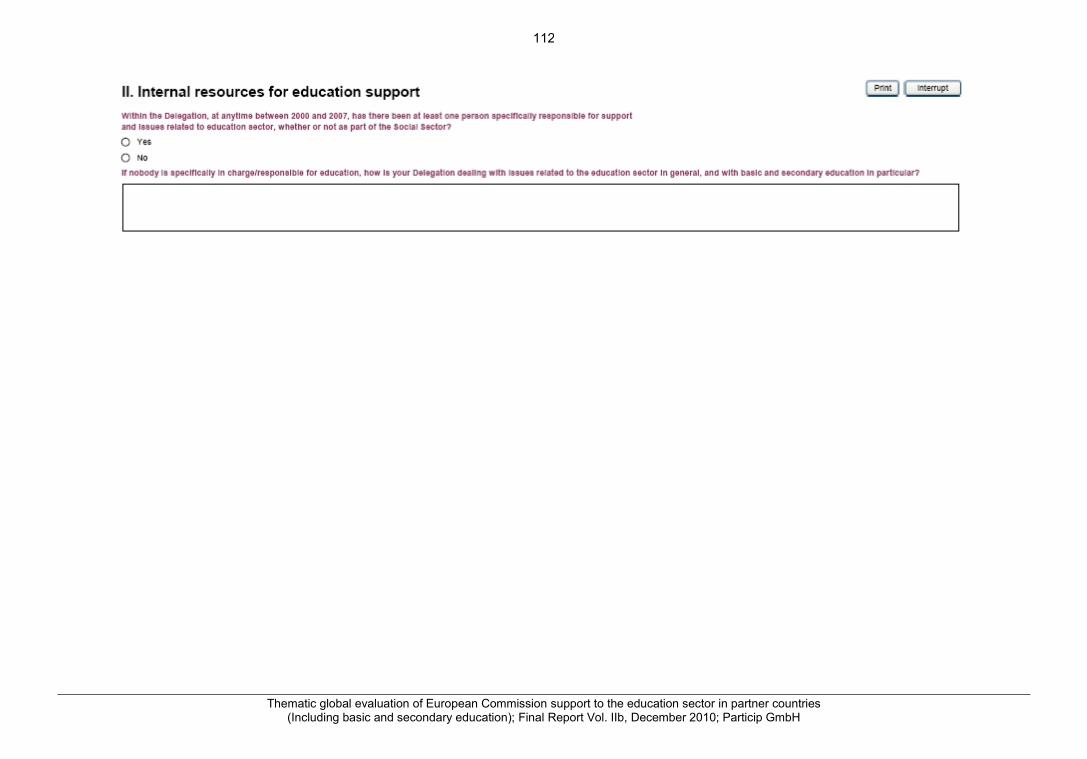
Thematic global evaluation of European Commission support to the education sector in partner countries(Including basic and secondary education); Final Report Vol. IIb, December 2010; Particip GmbH
112

Thematic global evaluation of European Commission support to the education sector in partner countries(Including basic and secondary education); Final Report Vol. IIb, December 2010; Particip GmbH
113

Thematic global evaluation of European Commission support to the education sector in partner countries(Including basic and secondary education); Final Report Vol. IIb, December 2010; Particip GmbH
114

Thematic global evaluation of European Commission support to the education sector in partner countries(Including basic and secondary education); Final Report Vol. IIb, December 2010; Particip GmbH
115

Thematic global evaluation of European Commission support to the education sector in partner countries(Including basic and secondary education); Final Report Vol. IIb, December 2010; Particip GmbH
116
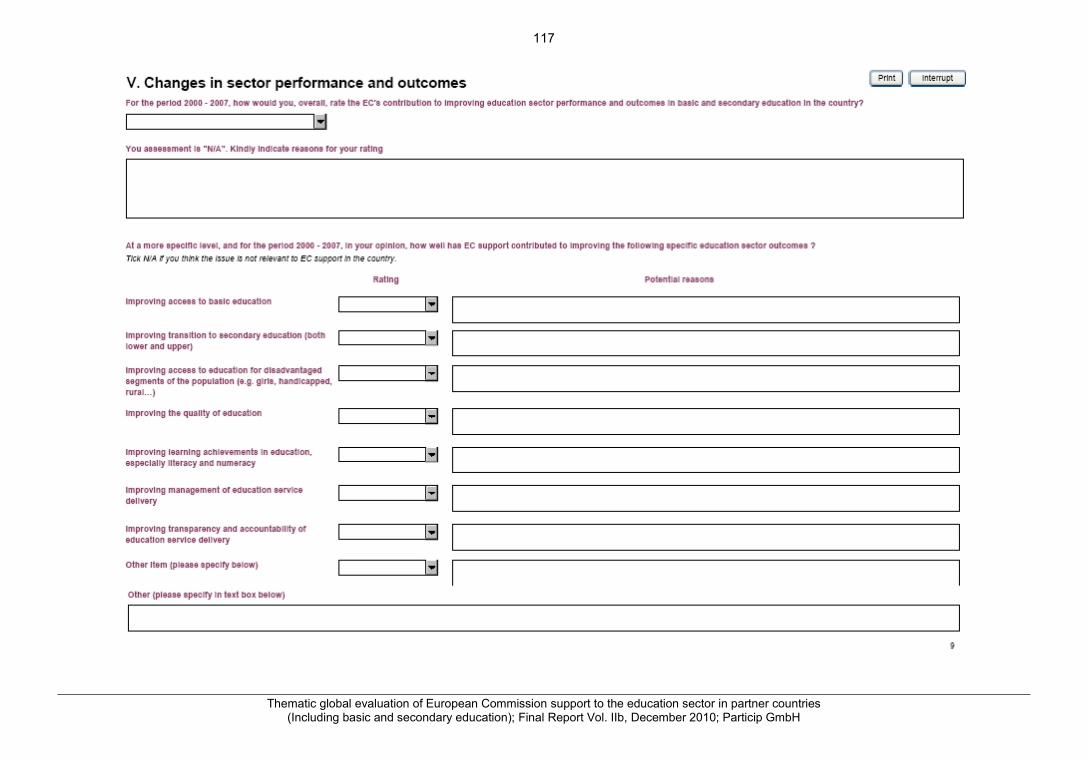
Thematic global evaluation of European Commission support to the education sector in partner countries(Including basic and secondary education); Final Report Vol. IIb, December 2010; Particip GmbH
117

Thematic global evaluation of European Commission support to the education sector in partner countries(Including basic and secondary education); Final Report Vol. IIb, December 2010; Particip GmbH
118

Thematic global evaluation of European Commission support to the education sector in partner countries(Including basic and secondary education); Final Report Vol. IIb, December 2010; Particip GmbH
119

Thematic global evaluation of European Commission support to the education sector in partner countries(Including basic and secondary education); Final Report Vol. IIb, December 2010; Particip GmbH
120

Thematic global evaluation of European Commission support to the education sector in partner countries(Including basic and secondary education); Final Report Vol. IIb, December 2010; Particip GmbH
121
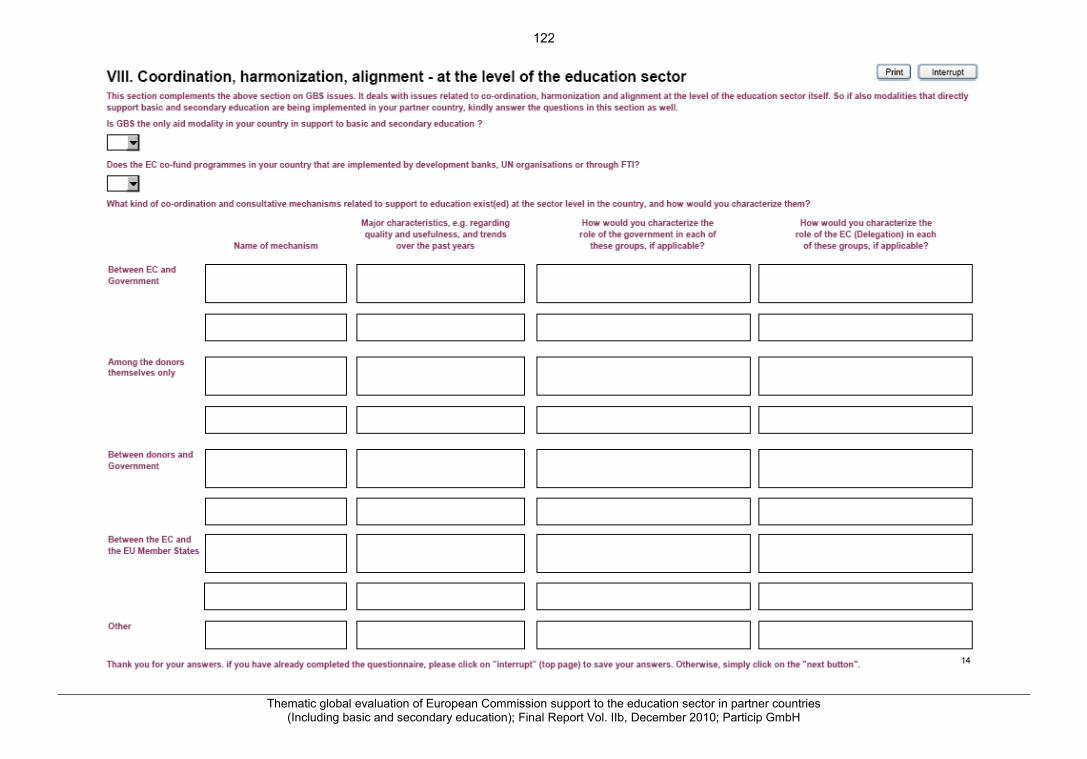
Thematic global evaluation of European Commission support to the education sector in partner countries(Including basic and secondary education); Final Report Vol. IIb, December 2010; Particip GmbH
122

Thematic global evaluation of European Commission support to the education sector in partner countries(Including basic and secondary education); Final Report Vol. IIb, December 2010; Particip GmbH
123

Thematic global evaluation of European Commission support to the education sector in partner countries(Including basic and secondary education); Final Report Vol. IIb, December 2010; Particip GmbH
124

Thematic global evaluation of European Commission support to the education sector in partner countries(Including basic and secondary education); Final Report Vol. IIb, December 2010; Particip GmbH
125

Thematic global evaluation of European Commission support to the education sector in partner countries(Including basic and secondary education); Final Report Vol. IIb, December 2010; Particip GmbH
126

Thematic global evaluation of European Commission support to the education sector in partner countries(Including basic and secondary education); Final Report Vol. IIb, December 2010; Particip GmbH
127

Thematic global evaluation of European Commission support to the education sector in partner countries(Including basic and secondary education); Final Report Vol. IIb, December 2010; Particip GmbH
128

Thematic global evaluation of European Commission support to the education sector in partner countries(Including basic and secondary education); Final Report Vol. IIb, December 2010; Particip GmbH
129

Thematic global evaluation of European Commission support to the education sector in partner countries(Including basic and secondary education); Final Report Vol. IIb, December 2010; Particip GmbH
130

Thematic global evaluation of European Commission support to the education sector in partner countries(Including basic and secondary education); Final Report Vol. IIb, December 2010; Particip GmbH
131
3 Annex 4: Analysis of the European Court of Auditors (ECA)reports on education and GBS in Africa (Niger, Liberia, Namibia,Tanzania, Uganda and Burkina Faso)
List of abbreviationsABRP Appui Budgétaire à la Réduction de la PauvretéACC Anti-Corruption CommissionAIDCO EuropeAid Co-operation OfficeAMRP Autorité de régulation des marchés publicsBSMS Budget Support for Macroeconomic StabilisationCF Catalytic FundCGAB Cadre Général d’organisation des Appuis Budgétaires (General framework of the organisation
of budget support)CONFEMEN Conference of Ministers of Education of French-Speaking CountriesCSE Country Strategy EvaluationCSO Civil Society OrganisationCSLP Cadre stratégique de lutte contre la pauvreté (Strategic Framework for the Fight against
Poverty)CSP Country Strategy PaperCSRS Civil Service Reform StrategyCST Commission sectorielle et thématique (Sectoral and Thematic Committees)CWIQ Core Welfare Indicators QuestionnaireDDRR Disarmament, Demobilisation, Reinsertion and ReintegrationDEG Donor Economist GroupDFID Department for International DevelopmentDG DEV EC Directorate General on DevelopmentDoL Division of LabourDP Development PartnerEC European CommissionECA European Court of AuditorsECHO European Commission’s humanitarian aid departmentECSEL EC Support to Education in LiberiaEDF European Development FundEducation DPG Development Partner GroupEFA Education for All Initiative (co-ordinated by UNESCO)EFA-FTI Education for All-Fast Track InitiativeEMIS Education Management Information SystemEPF Education Pooled FundEQ Evaluation QuestionEQUIP Education Quality Improvement through PedagogyESDP Education and Training Sector Development ProgrammeESP Education Sector ProgrammeESPR Education Sector Performance ReportESPSP Education Sector Policy Support ProgrammeETSIP Education and Training Sector Improvement ProgrammeEU European UnionEUD European Union DelegationFAFPCA Fonds d’appui à la formation professionnelle continue et à l’apprentissageFINMAP Financial Management and Accountability ProgrammeFMIS Financial Management Information SystemFTI Fast Track InitiativeGAC General Audit CommissionGBF Government of Burkina FasoGBS General Budget SupportGDP Gross Domestic Product

Thematic global evaluation of European Commission support to the education sector in partner countries(Including basic and secondary education); Final Report Vol. IIb, December 2010; Particip GmbH
132
GEMAP Governance and Economic Management Assistance Programme – LiberiaGER Gross Enrolment RateGFTAM Global Fund Tuberculosis, Aids & MalariaGIR Gross Intake RateGoL Government of LiberiaGoN Government of NigerGoT Government of TanzaniaGoU Government of UgandaGPI Gender Parity IndexGRN Government of the Republic of NamibiaHIPC Heavily Indebted Poor CountryHIV Human Immuno-deficiency VirusHQ HeadquartersIDP Internally Displaced PersonIMF International Monetary FundiQSG Inter-service Quality Support GroupJAF Joint Assessment FrameworkJAS Joint Assistant StrategyJC Judgement CriteriaJESR Joint Education Sector ReviewJHS Junior High SchoolLGAs Local Government AdministrationsLPERP Liberia Primary Education Recovery ProgrammeLRRD Linking Relief, Rehabilitation and DevelopmentMDG Millennium Development GoalsMEBA Ministère de l’Education et de l’Enseignement de base (Ministry of Basic Education ) – NigerMKUKUTA National Strategy for Growth and Reduction of Poverty (Swahili acronym) – TanzaniaMoE Ministry of EducationMoU Memorandum of UnderstandingMoEVT Ministry of Education and Vocational TrainingMS Member StateMTEF Medium-Term Expenditure FrameworkMTR Mid Term ReviewNACSAP National Anti-Corruption Strategy and Action Plan - TanzaniaNAO National Authorising OfficerNDP National Development PlanNER Net enrolment RatioNGO Non-Governmental OrganisationNIP National Indicative ProgrammeNSA Non-State ActorsNSGRP National Strategy for Growth and Reduction of Poverty, see: MKUKUTAODI Overseas Development InstituteOECD Organisation for Economic Co-operation & DevelopmentOECD-DAC The Development Assistance Committee of the Organisation for Economic Co-operation &
DevelopmentOLAF European Anti-Fraud officeOVC Orphans-Vulnerable ChildrenOVI Objectively Verifiable IndicatorsoQSG office Quality Support Group (within EuropeAid)PABS Poverty Alleviation Budget SupportPAF Performance Assessment FrameworkPAP Priority Action PlanPASEB Programme d’appui au secteur de l’éducation de base – Burkina FasoPASEC Programme d’Analyse des Systèmes Educatifs des Pays CONFEMENPCCB Prevention and Combating Corruption BureauPCR Primary Completion Rate

Thematic global evaluation of European Commission support to the education sector in partner countries(Including basic and secondary education); Final Report Vol. IIb, December 2010; Particip GmbH
133
PDDE Plan décennal de développement de l'éducationPDDEB Plan Décennal de Développement de l’Education de BasePEAP Poverty Eradication Action Plan – UgandaPEDP Primary Education Development ProgramPEFA Public Expenditure and Financial AccountabilityPEM Public Expenditure ManagementPEMCOM Public Expenditure Management CommitteePETS Public Expenditure Tracking SurveysPFM Public Finance ManagementPPARP Programme Pluriannuel d’Appui à la Réduction de la PauvretéPPDA Public Procurement and Disposal of Assets AuthorityPRBS Poverty Reduction Budget Support ProgrammePRGF Poverty Reduction and Growth Facility – LiberiaPRP Poverty Reduction ProgrammePRS Poverty Reduction StrategyPRSP Poverty Reduction Strategy PaperPS Permanent SecretaryQSG Quality Support GroupRESEN Rapport d’état d’un système éducatif national (Country Status Report on a National
Educational System)ROM Results-Oriented MonitoringSADC Southern African Development CommunitySACMEQ Southern African Consortium for Monitoring Education QualitySBS Sector Budget SupportSDF School Development FundsSHS Senior High SchoolSIDA Swedish International Development Cooperation AgencySMART Specific, Measurable, Achievable, Relevant, Time-boundSOUTEBA Programme d’appui au secteur de l’éducation de base – NigerSPSP Sector Policy Support ProgrammeTA Technical AssistanceTAPS Technical and Administrative Provisions for ImplementationTEN-MET Tanzanian Education Network – Mtando wa Elimu TanzaniaUBOS Uganda Bureau of StatisticsUIS UNESCO Institute for StatisticsUN United NationsUNDP United Nations Development ProgrammeUNESCO United Nations Educational, Scientific and Cultural OrganizationUNICEF United Nations International Children’s Emergency FundUSD United States DollarVET Vocational Education and TrainingWB World Bank

Thematic global evaluation of European Commission support to the education sector in partner countries(Including basic and secondary education); Final Report Vol. IIb, December 2010; Particip GmbH
134

Thematic global evaluation of European Commission support to the education sector in partner countries(Including basic and secondary education); Final Report Vol. IIb, December 2010; Particip GmbH
135
3.1 IntroductionThe purpose of the “Thematic global evaluation of European Commission support to the education sectorin partner countries (Including basic and secondary education)” is to assess “to what extent theCommission assistance has been relevant, efficient, effective and sustainable in providing the expectedimpacts in the education sector. It should also assess the co-ordination and complementarity with otherdonors and actors, the coherence with the relevant EC policies and partner Governments' priorities andactivities as well as with international legal commitments in education.”This document analyses the preliminary findings of missions and desk studies of the European Court ofAuditors (ECA) undertaken very recently in Africa. This analysis has been conducted within theframework of this global evaluation, given the fact that, due to a number of reasons, field visits hadespecially been reduced in this region. The analysis thus aims at cross-checking the evaluation’s ownevidence, at complementing it, at comparing between the countries, and at identifying trends and patternsthat might emerge from the ECA reports. It covers all aspects / EQs of the present evaluation to which theaudits provide relevant information. The results of the analysis will feed into the final report.
It is noted that the period of evaluation is from 2000 to 2007. However acquisition of quantitative andqualitative data from the ECA report also included data for the period 2008-2009. These additionalelements will especially be helpful with a view to identify effects and (intermediate) impacts of EC supportgiven that impacts of the 2000-07 programmes take longer to materialise than outputs and outcomes tobecome manifest.
A special emphasis has been put on the following issues:
Trends in choice of education indicators (quantity versus quality) – check of PerformanceAssessment Frameworks;
Appropriateness of selection of aid modality through assessing selection based on relevantguidelines, i.e. this relates to the identification and formulation stages – link to ProgrammingGuidelines for GBS and SBS;
Achievement of education sector outcomes, related to targets of education indicators measured byfull or partial disbursement;
Capacity development efforts and their results, e.g. related to education statistics, sectormonitoring, Education Sector Plans, EMIS, FMIS - PFM;
EC’s role in education sector and broader policy dialogue – also check link to the policy matrix andinvolvement of DPs, banks, etc. in dialogue and GBS/SBS;
Timeliness and quality of monitoring efforts, including actions in case of problems.
It should be noted that this report is based on the preliminary findings of the ECA, changes in the finalreports, if any, cannot be considered, as the reports are not yet available.
3.1.1 Data collection tools and methods used (their limits and possible constraints)
The main source of information for this qualitative analysis was the ECA’s Statements of PreliminaryFindings of the desk studies and the field missions reports in Burkina Faso, Liberia, Namibia, Niger andTanzania, for the Audit of EC Development Assistance for Education, as well as the Statement ofpreliminary findings related to the mission to Uganda for the Audit of the Commission’s Management ofGeneral Budget Support.
During the extraction phase, the relevant information has been selected from the ECA reports, country bycountry, and the extracted text has been sorted out by indicators and Judgment Criteria in grids that hadbeen created for each Evaluation Question. The structure of the grids has been used to analyse the ECAaudits along the EQs, JCs and indicators and to compare between countries.
During the synthesis phase, we have analysed the available information by indicators, JCs and EQs,trying to identify trends between countries and focusing on the EC contribution.
It should be noted that the ECA audits presented some major limits themselves given the fact that most ofthe information contained in the reports did not always provide sufficient information regarding theindicators of the global evaluation.

Thematic global evaluation of European Commission support to the education sector in partner countries(Including basic and secondary education); Final Report Vol. IIb, December 2010; Particip GmbH
136
3.1.2 Main characteristics of EC support the countries
EC support to the sample of ECA audits can be summarised as follows:
In Liberia, the main EC interventions supporting the Education Sector are: i) the EC Support toEducation in Liberia (ECSEL), which is a Project (2006 –2010) under the 9th EDF amounting € 12million, and ii) the Budget Support for Macroeconomic Stabilisation (BSMS) (2009-2011), which isa General Budget Support of € 20.2 million under the 10th EDF.
in Niger, the main EC interventions supporting the Education Sectorare: i) the Poverty ReductionSupport Programme (Programme pluriannuel d’appui à la réduction de la pauvreté) 2006-2008,which is a General Budget Support amounting € 91 million with an education component of € 12million, and ii) the Poverty Reduction Support Programme 2009-2011 of € 93 million. Related tobasic education, the EC support mainly covered the SOUTEBA programme amounting € 8.7million.
In Burkina Faso in the 1990s, EC support to education had focused on basic education andliteracy (total € 27 million between 1991 and 1996). Burkina Faso has been one of the firstcountries to benefit from the budget support where education was considered as priority socialsector (together with health). While the 8th EDF was based on a project approach in support of asector program (PASEB), the 9th EDF took the form of sector budget support and the 10th EDF isbased on a single overall GBS in the form of MDG contract that Burkina Faso was the first countryto benefit. Moreover, in 2009, Burkina Faso was included to the EFA – FTI.
In Tanzania, the main EC interventions supporting the Education Sector are: i) the PovertyReduction Budget Support Programme 2006-2008 (PRBS03), which is a General Budget Supportamounting € 101.8 million, ii) the Support to Education Sector Reform Programme, which is aSector Budget Support (2006- 2010) of € 43.5 million and iii) the MDG contract 2009-2015amounting € 305 million. Further projects targeting youth with disabilities and girls’ education havealso been supported by the EC.
In Namibia, the Education Sector Programme (ESP) financing agreement was signed inSeptember 2003 and covers the period from 2003/04 to 2008/09 with a total budget of € 24million. A new 15-year plan, the Education and Training Sector Improvement Programme(ETSIP), has then been developed with technical support from the World Bank.
Uganda has been receiving budget support from the EC since 1991 when the first of five ‘PovertyAlleviation Budget Support’ (PABS) programmes was launched. For the 9th EDF (PABS V) € 87million (35% of the Country Strategy Paper (CSP)) was allocated to GBS and for the 10th EDFGBS € 175 million (40 % of the CSP) was allocated through the new ‘MDG Contract’ instrument.For both the 9th EDF and 10th EDF, GBS has been used in Uganda as a third main channel ofEDF support in addition to the two selected focal sectors of transport (approximately 40% ofallocations) and rural development (approximately 15% of allocations).
The following sections provide a comparative analysis of the findings Analysis of the European Court ofAuditors (ECA) reports on education and GBS in Africa.
3.2 EQ1-relevance: To what extent is EC support aligned to educationdevelopment objectives in national development plans, such as PRSPs, andensured coherence between EC development co-operation policies oneducation and other EC policies affecting education?
3.2.1 JC11: Degree to which EC education interventions are relevant to and aligned with PRSPor similar national policy or strategy objectives
Summary of ECA findings related to JC11
From the ECA report it can be concluded that the situation in the countries and the needs of thebeneficiaries have been taken into account during the drafting of the CSP or other EC strategies insupport of education. This is valid for Liberia, Namibia, Burkina Faso and Tanzania.
For Niger, an alignment of EC support to national priorities can be seen only for the support givenunder the 9th EDF. As education support in the 10th EDF has been reduced, issues such as ‘gender’and ‘demographic growth’ which are of increasing importance for Niger, have not been addressed,according to the ECA report. In the case of Uganda, the EC has aligned on the reform programme ofUganda (MKUKUTA) which, according to the ECA report, does not have not clear defined priorities.Also, the ECA report of Uganda raises some doubts that EC funds within the GBS are distributed

Thematic global evaluation of European Commission support to the education sector in partner countries(Including basic and secondary education); Final Report Vol. IIb, December 2010; Particip GmbH
137
according on the needs of the country.
The ECA reports do not give a lot of information on I-112; only the Tanzania report states that EC’sSBS contribution corresponds to 1.5% of the national budget for education.
No information was available for I-113.
3.2.1.1 I-111: Appropriate consideration of in-country situation and beneficiary requirements inEC response strategy
The ECA reports revealed that the in-country situation and the beneficiary requirements have beenclearly taken into account in Tanzania, Liberia and Burkina Faso. This is stated only indirectly in the ECAreport for Namibia. It seems that only for Uganda the priorities defined in the GBS, including those ofeducation are not clearly defined and do not sufficiently reflect the in-country situation/needs. Noinformation could be found in the ECA report of Niger.
Liberia: As a post-conflict country (14 years of civil war that ended in the 2003 Accra PeaceAccord and a first democratic elected government taking power in January 2006) Liberia isgradually reestablishing public sector institutions and services. From 2008 on the Liberia 2008Poverty Reduction Strategy (PRS) (and before that an Interim Poverty Reduction Strategy) tookinto consideration the MDGs, including MDG2, which is included in one of four priority “pillars” –Infrastructure and Basic Services.
Even before the existing of the PRS, the Liberia Primary Education Recovery Programme(LPERP) started as a three year action programme (2007-2009) based on the priorities for Post-Conflict Education sector Recovery in Post-Conflict Liberia.
The LPERP served as the main strategic document for the GoL efforts to re-establish primaryeducation from 2007-2009. According to the ECA report, the GoL did not have an endorsedcomprehensive education sector plan until 2009.
The 2009 Education Sector Plan (ESP) builds on and expands the work completed under theLPERP. It has been appraised in 2010 by the DPs in the education sector and covers allsubsectors; it will form the basis for the GoL’s application to the FTI’s Catalytic Fund.
EC’s first support to the education sector in Liberia was through the ECSEL project (2006 –2010)34 even though the reasons for the support did not reflect completely the requirements setout in the programming guidelines (e.g. no ESP). The main reason for launching the support,according to the ECA report, is “the fact that the civil war during 1989-2003 left a large proportionof youth between ten and 25 years without or with only limited education. Many of these werechild soldiers. A large proportion of the IDPs (in total some 850 000) were in effect left without anyaccess to public schools”. The ECSEL project was funded in recognition of the limitations ofemergency programmes as well as the GoL’s strategic outlook for the education sector and itsMDG two aspirations. Taking into consideration the limited institutional capacity of the GoL andthe EC’s own capacity constraints the ECSEL was designed to be managed through long-termTechnical Assistance (TA).
In parallel to the country’s LPERP, which was established in 2007, was a three-years action planand could be seen as the strategic document of the GoL from 2007-2009, the CSP/NIP (2008-2013) took into consideration the education sector activities within a single focal sector “LinkingRelief to Rehabilitation and Development” (LRRD) with five sub focal sectors, one of which iseducation sector support. Thus, according to the ECA report “the Commission’s choice ofeducation as a sub focal sector did not reflect an assessment of its comparative advantage in thesector but a recognition of the emerging needs in a country recovering from a humanitarian crisiswith only a few DPs to support it”.
Furthermore, the CSP stated that the EC approach will remain flexible, while its main activitieswill focus on the ongoing ECSEL project, “which is deemed to embrace the organisational andinstitutional capacity aspects of the ‘current education sector strategy (which was established in2009)’”.
The ECA report stated the EUD had sufficient relevant information about the education sectorand duly reviewed it in preparation of the CSP/NIP 2008-2013.
Namibia: Namibia has yet the status of an upper middle-income country, but has one of the mostunequal societies in the world with a Gini coefficient of 0.74. Since socio-economic inequalities
34 € 12 million Financing Agreement for ECSEL in October 2006.

Thematic global evaluation of European Commission support to the education sector in partner countries(Including basic and secondary education); Final Report Vol. IIb, December 2010; Particip GmbH
138
closely correlate with a lack of access to and of quality of education for the poorest, it is, accordingto the ECA report, particularly important to address inequalities in a country like Namibia. Still, andcompared to other African countries, Namibia spends an important portion of its public expenditure(25% of its budget in the years 2005-2007) for the education sector. But the government seems tohave difficulties in controlling the expenditure in the sector leading to frequent budget overrun.
The 15 year strategic plan, the Education and Training Sector Improvement Programme (ETSIP),adopted by the government in 2006/2007 can be seen as the response to its overall “Vision 2030”government strategy as well as the national Development Plan (NDP), which focuses on thefurther developing a knowledge-based economy.
On the EC side, the CSP 2008-2013 for Namibia offers some insight into the challenges facingNamibia in the education sector, including the inefficiencies and lack of quality in public educationexpenditure as well as considerable regional and social disparities.
Niger: Niger is one of the countries with the lowest school enrolment and literacy rates. The mosturgent problems are the access to primary education, the huge inequality between urban and ruralareas, the significant gender gap and a general poor quality of education (especially in secondaryeducation).
Within the 9th EDF the EC supported the poverty reduction programme (PPARP) whereeducation was a priority sector In order to tackle the problems in secondary education the ECsupported programme “soutien à la formation professionnelle” and the SOUTEBA programme(programme d’appui à l’Education de base). The latter has the aim to enhance quality and accessto primary education.
In the 10th EDF this education sector component has been abolished. According to the ECAreport neither the issue of demographic increase nor gender issues have been properlyintegrated into the EC support. This even though these issues are integrated in the PRP asstrategic axes to reach MDG goals and these issues are recognised to have impacts on theperformance of the intervention in the education sector.
Burkina Faso: Like Niger, Burkina Faso is one of the countries with the lowest school enrolmentand literacy rates. In this regard the EC support has been traditionally focused access to primaryeducation and literacy, according to the ECA report. Burkina Faso has been one of the firstcountries to benefit of sector budget support for the education (started under the 8th EDF), whichwere considered as priority sectors in order to fight against poverty. Within the 10th EDF, SBS hasbeen replaced by GBS.
Tanzania: Tanzania is a low income country with an annual per capita income equivalent to USD534 in 2008 (just under USD 1.5 per capita per day) and a population estimated at 41 millionpeople. Poverty is substantial in rural areas where just under 75% of the population live. Thegovernment’s focus has mainly been on the MDG-related enrolment in primary school and,according to ECA, is likely to be one of the reasons why the quality of education has been given alower priority. Despite the GoT’s efforts the performance of secondary school students in nationalexaminations is still modest.
In response to the considerable needs the GoT has adopted an Education and Training SectorDevelopment Programme (ESDP), which was updated in September 2007 to cover the period2008-2017.
The ESDP is an essential part of the public sector reform agenda laid down in the MKUKUTA –the National Strategy for Growth and Reduction of Poverty (Swahili acronym), which has setspecific operational targets for ensuring equitable access to quality education, and fit into theGoT’s plan for achieving the educational goals stated in its Development Vision 2025.
The CSP 2008-2013 has been designed on a joint review of the state of play of the educationsector of DPs. This analysis included a review of the relevant parts of the MKUKUTA35 and allother resources available to the DP community. Further, local NSAs/CSOs were involved but didnot provide significant input for the programming process, according to the ECA report. TheEducation and Training Sector Development Programme (ESDP) adopted by the government isan essential part of the public sector reform agenda laid down in the MKUKUTA.
The decision not to choose education as a focal sector contradicted the recommendations of theCommission’s own education specialists and the independent evaluation of the country strategyevaluation of 2006. (“What is recommended in this respect is a continued concentration of funds
35 This Swahili acronym is the name oft the National Strategy for Growth and Reduction of Poverty of Tanzania.

Thematic global evaluation of European Commission support to the education sector in partner countries(Including basic and secondary education); Final Report Vol. IIb, December 2010; Particip GmbH
139
in areas where EC’s comparative advantages are well established: (1) road network, and (2)basic education.” CSE Tanzania, p. vii)
Uganda: The priorities for the education sector within the GBS programme under the 9th EDF arenot very clearly defined according to the ECA report: “the financing proposal highlights the generalissue of reduced quality in primary and post-primary education as a priority area to be addressedwithout explaining what is the specific objective of the GBS programme in this respect and how itwill be achieved within the timeframe of the programme. It also states that attention will be paid tobetter targeting of public expenditure for secondary education to the poor without giving anyspecific EC objectives in this respect and how they will be achieved within the programmetimeframe. Moreover, how far the EC contribution of financial resources to the GoU budget isintended to lead to an increase in the national education budget to address some of thesepriorities is unclear: the Financing Proposal merely refers to the Mid-Term Expenditure Framework(MTEF) budgetary ceilings for education and notes that there will need to be a strong emphasis oncost efficiency if priorities are to be met:”
Furthermore, although support to the health and education sectors were important objectives forthe GBS programmes, no capacity building support to these sectors was foreseen. The lack ofcapacity building in health and education in earlier GBS programmes in Uganda was one of thecriticisms of the Joint Evaluation of GBS (1994-2004). The 9th EDF Financing Proposal foresawsupplementary capacity building in the education and health sectors through the funding ofstudies, evaluations and reviews. However, this was limited to a specific study on HIV/AIDSspending in Uganda.
The 10th EDF put less emphasis on social sector targets of the MDG (2-6), but on thedevelopment of growth (MDG1). In its whole the “10th EDF CSP’s National Indicative ProgrammeIntervention Framework matrix on GBS contains somewhat more detail than for the 9th EDF butagain was not further developed during the programme identification and formulation stage”.
3.2.1.2 I-112: Percentage of EC aid to the education sector that is provided either as budgetsupport or using programme-based approaches for supporting PRSP objectives
Also for this indicator no information can be yielded from the ECA reports.
3.2.1.3 I-113: Change in number of project implementation units running parallel to governmentinstitutions within the education sector
No information was available on this indictor in the ECA reports.
3.2.2 JC12: Degree to which EC education support is harmonised and transparent in supportingPRSP or similar national policy or strategy objectives
Summary of ECA findings related to JC12
Joint reviews are the most commonly quoted mean which ensures coherence between the nationalstrategies and the EC support. These joint works do contribute to increased harmonization andalignment during the implementation of EC support or in regard to a future programme.
Moreover, a financial amendment, like in the case of Namibia’s ESF, may lead to the alignment withthe priorities of the national education programme (ETSIP) and eventually to the introduction of a newresult framework and to a revision of most of the provisions in the existing agreement.
The ECA reports make clear that EC aligned on national strategies where existing. In these countrieswhere no education sector plan existed, the EC contributed to the design of the strategy through policydialogue, reviews, etc. in order to ensure the alignment to international commitments andbeneficiaries’ needs. This was the case in Tanzania, were the revision of the CSP and the nationalEducation and Training Sector Development Programme (ESDP) were written during the same period.The EUD through Joint Reviews and participation in committees was able to influence substantiallythe GoT’s implementation and revision of the ESDP.
The Joint Assistance Strategy of DP in Tanzania and the Joint Assessment Framework in Uganda areone of the first joint strategy worldwide and are likely to enhance the overall coherence in the countythrough a shared strategic approach between all donors and the government.

Thematic global evaluation of European Commission support to the education sector in partner countries(Including basic and secondary education); Final Report Vol. IIb, December 2010; Particip GmbH
140
3.2.2.1 I-121: Degree to which joint (government and other development partners) field missionsand shared analytical work take place related to education support
The information found in the ECA report on joint action can be resumed to DP-government joint reviews,mostly in the framework of budget support programmes. According to the ECA reports of Namibia andBurkina Faso these reviews have been able to ensure certain coherence between government’sprogramme and the EC support. In Liberia, the ESP appraisal and revisions have been conducted in theaim to give input to the Catalytic Fund preparation.
Overall, however, the ECA reports are rather silent regarding the level of detail and the quality ofanalytical work and the number of field missions undertaken.
Namibia: While, according to the ECA report, the current sector policy was initially developed withlimited input from the EUD, subsequent joint appraisal of the GoN and the EUD ensured that theinput from the EUD was considered. In addition to this, general assessments of the PFM systemhave been provided through the Joint Annual Reports.
Burkina Faso: Also in Burkina Faso joint review missions are used in order to get a betterharmonization and alignment between GBF’s strategy and EC support. The EC supports theimplementation of the primary education development plan (Plan décennal de développement del’éducation de base, PDDEB), which foresees a precise calendar of coordination and discussion inorder to ensure the monitoring of the action plan. The joint review missions and meetings withdonors and the GBF are part of the PDDEB. Furthermore, the updating of the PPDEB follows ajoint work plan (“programme de travail conjoint concernant l’actualisation du PPDEB”) and takesinto account the evaluation of the first phase of the PDDEB 2002-2005 as well as the orientationsof EFA-FTI.
Tanzania: In Tanzania annual joint sector review (JESR) take place and are attended by high levelGoT officials, DPs and civil society organisations. As part of the review process, the trends in theallocations to education over time are assessed as well as the degree of improvement in thedevelopment process. The JESR which is only one discussion forum between the GoT and the DPhas been made possible through intense policy dialogue. The conclusion of the ECA report is:“The overall education policy dialogue structure for DPs and the government is now wellestablished and demonstrates political leadership and ownership by the GoT.“
Niger: Since 2003 has the EUD supported the education sector development plan (Plan décennalde développement de l’éducation, PDDE) and has participated in the annual joint sector reviews.They look at the progress reports and assess the relevance, outcomes, effectiveness and impactand formulate recommendations.
Liberia: In order to assist the GoL in its application for the catalytic fund support, the EUD togetherwith other DPs have brought input in the form of a joint ESP appraisal (January 2010) andsubsequent revisions. The FTI application was to be submitted in March 2010.
3.2.2.2 I-122: Joint and harmonised education assistance strategies
Concerning the design and implementation of a joint or harmonised education assistance strategy, thefollowing points can be highlighted:
Namibia: In 2009, the EUD was trying to enhance the dialogue with the GRN in the framework ofthe formulation of the new Education Sector Policy Support Programme. As a result of thedialogue the Education and Training Sector Improvement Programme (ETSIP) should find ways tobe more in line with EFA and MDG2 goals and as well become more focused on equity issues andprimary education. Yet, the current ETSIP focuses on secondary level access and completion withlimited attention being paid to primary education.
According to the ECA report the ETSIP has been designed by the GRN and the World Bankwithout input of other DPs including the EUD. Due to a funding gap between the end of the 9th
EDF and the effective start of the 10th EDF, a “rider” to the ESP financing agreement wasintroduced in August 2007. This amendment provided additional support which was aligned onETSIP priorities. This led to the introduction of a new result framework and also to a revision ofmost of the provisions in the existing agreement. From 2010 on, the EC is re-directing its supportto the pre-primary and primary education.

Thematic global evaluation of European Commission support to the education sector in partner countries(Including basic and secondary education); Final Report Vol. IIb, December 2010; Particip GmbH
141
Tanzania: Tanzania is the only reviewed country that mentioned a CSP/NIP (CSP 2008-2013)which is based on a Joint Assistance Strategy of DPs36. In order to design the CSP the DPs haveconducted a joint review of the state of play of the education sector which included a review ofrelevant parts of the MKUKUTA and all other resources available to the DP community as awhole.
It must be noted that the national Education and Training Sector Development Programme(ESDP) was updated during the same time period where the CSP was drafted. The ECA reporthighlights that the EUD through Joint Reviews and participation in committees was able toinfluence substantially the GoT’s implementation and revision of the ESDP.
Uganda: The EC has contributed with other budget support donors and the GoU to theestablishment of a new Joint Assessment Framework (JAF) for the three years 2008-9, 2009-10,2010-2011 which was signed at the time of the ECA mission in October 2009. Moreover, the EChas also taken steps to strengthen its capacity for dialogue on health and education in the contextof the new MDG contract by recruiting a contract agent (expatriate economist) with expertise inthese areas.
The specific objectives of the CSP NIP 2008-2013 are stated as being “to contribute to thenational policy and strategy’s specific goals as laid out in the Joint Assessment Framework (JAF)Part II and III, with particular attention given to targets and policy actions related to the areas ofEducation, Health and Public Finance Management”. This does not provide much clarity on theEC’s specific objectives as delays in the preparation of the National Development Plan meantthat the JAF was established in the absence of the former whereas it would have been preferablefor the JAF to be derived from it.
3.2.3 JC13: The Commission has ensured the overall coherence of its education support
Summary of ECA findings related to JC13
The ECA reports do not provide much information on the coherence of EC’s support to the educationsector in the countries. The reports mostly pointed out the coexistence of different types of support orsupport directed to different types of actors as critical issues. Only in Liberia the support provided byECHO (but no intervention was directed to the education sector) and on the other hand the ECSELproject for primary education seems to point out a careful balance between the two instruments.
Three country reports mentioned the support of NSA-projects in addition to sector support. Thus, theECA report did not give information on the coherence between the different types of support.
3.2.3.1 I-131: The DGs dealing with education have an operational working relationship indesigning education-related strategies and programmes
No information related to this indicator could be found in the ECA reports.
36 See also the website of the Tanzania Development Partners Group (DPG),http://www.tzdpg.or.tz/external/home.html, which sets out the principles of the Joint Assistance Strategy for Tanzania(JAST): The DPG in Tanzania support the Government’s efforts to deliver on the goals and targets of the MKUKUTAand the MKUZA, using the JAST’s guiding principles. “The JAST is the national medium-term framework formanaging cooperation between the government of Tanzania and development partners at a country level. It is aimedat deepening the impact of the relationship between the government of Tanzania and its development partners bystrengthening national ownership of the development process, and harmonising processes and procedures in waysthat make aid more effective and simpler to manage. It aims to facilitate effective development partnership outcomesbased on mutual trust and respect, frank and open dialogue and mutual accountability under a single partnershipframework. The conceptual foundation of the JAST is guided by the accumulated experience and lessons learnedfrom the Tanzania Assistance Strategy (TAS) which served as medium-term framework to deepen the nationalownership and Government leadership of the development process. The founding principles of JAST are also in linewith the principles of the Monetary Consensus on Financing for Development (2002), the Rome Declaration on AidHarmonisation (2003), the Marrakech Memorandum Managing for Results (2204) and the Paris Declaration on AidEffectiveness (2005). Given the high increase in new emerging development and global initiatives on aid effectives,the JAST highlights the need to for all aid assistance to be integrated into the Government budget and Exchequersystem. The JAST also promotes the ‘division of labour’ in order to achieve optimal allocation of responsibilities andtasks both within the Government and Development Partners based on the comparative advantage. Since the officialsigning in December 2006, JAST process has attracted significant resources in support of various programmes andthe impact has been felt across key sectors such as health, agriculture and education.”

Thematic global evaluation of European Commission support to the education sector in partner countries(Including basic and secondary education); Final Report Vol. IIb, December 2010; Particip GmbH
142
3.2.3.2 I-132: Coherence between the EC political and development responses (e.g. conflictprevention strategies and in difficult partnerships)
No information related to this indicator could be found in the ECA reports.
3.2.3.3 I-133: Coherence between the different (financial) instruments available for promotingeducation
Only for one country analysed, the ECA reports only indicate elements related to the coherence ofinstruments:
Liberia: In recognition of the limitations of emergency programmes37 (no EC funded humanitarianactivities aimed at the education sector) the EC concluded the € 12 million ECSEL support inOctober 2006. ECSEL was built on other EC-led emergency activities carried out in the frameworkon UNDP’s Disarmament, Demobilisation, Reinsertion and Reintegration (DDRR) programme andECHO’s humanitarian aid operations. It was to provide “a bridge for widening the scope ofemergency education to all children without exception”.
3.2.3.4 I-134: Coherence of EC responses to the different actors in the education arena (centraland local governments, parliaments, NSAs, others), at both national and regional levels
Only in three ECA reports Non-State-Actors were mentioned. In Tanzania and Burkina Faso the ECsupports directly projects NSA-projects. However not much is said about coherence with the overallcountry programme.
Namibia: As in practice Non-State Actors have not been involved in the policy dialogue around thedesign of the ETSIP, the 10th EDF foresee a specific component on social accountability toenhance NSAs’ involvement in the Education sector.
Burkina Faso: Contrarily to Namibia, Non-State-Actors in Burkina Faso have been involved inpolicy dialogue and the implementation of interventions directly financed by the government.According to the ECA report, NSAs a part of the “cadre de partenarial pour l’éducation”. InBurkina. Through thematic budget lines, the EC finances NGO projects in the education sector,especially in the area of non-formal education. According to the ECA report this is acomplementary source of information for EUD other than information provided from thegovernment.
Tanzania: Under the 9th EDF, in addition to the GBS, four education sector projects directly fundedNon State Actors (NSA)/Non Governmental Organisations (NGO) through the co-financing budgetline. However the ECA report doesn’t include info on the coherence with the overall countryprogramme.
3.3 EQ2-access: To what extent has EC support to education contributed toimproving access to basic education?
3.3.1 JC21: All children access and complete a full course of primary schooling - (MDG two) and(EFA two)
MDG2: Ensuring that by 2015, children everywhere, boys and girls alike, will be able to complete a fullcourse of primary schooling.
EFA 2: Ensuring that by 2015 all children, particularly girls, children in difficult circumstances andthose belonging to ethnic minorities, have access to, and complete, free and compulsory primaryeducation of good quality.
The European Consensus of 2005 placed strong emphasis on EU contributing to the achievement of theMillennium Development Goals (MDGs), including MDG two (Achieving universal primary education) andMDG three (Promote gender equality and empower women, for instance through the elimination ofgender disparities in primary and secondary education). It further noted that the EC should aim tocontribute to “Education for All” (EFA), stating that the priorities in education were quality education,vocational training and addressing inequalities.
37 The EC earmarked considerable amounts, according to the ECHO web-site for humanitarian aid some € 96 millionsince 2003 between 2003-2008 and continues to provide humanitarian aid in Liberia, including food, sanitation andhealth services (mainly through ECHO).

Thematic global evaluation of European Commission support to the education sector in partner countries(Including basic and secondary education); Final Report Vol. IIb, December 2010; Particip GmbH
143
Summary of ECA findings related to JC21
The comparison between the countries analysed shows a wide range of scores regarding theenrolment in primary school, with NERs in 2008 ranging from 49% in Niger to 97% in Uganda.
The Primary Completion Rates vary between the countries analysed, with a significant high score inNamibia where the share of children completing a full course of primary almost corresponds to morethan the double compared to Niger and Burkina Faso in 2008 (38%). This share remains slightlyabove half of the children for Tanzania, Uganda and Liberia.
The enrolment and completion rates have in most countries analysed been selected as indicators inEC support to education at sector or GBS support level. The data shows mixed results as regards theperformance compared to the targets set.
According to the ECA reports, the MDG2 will most likely not been achieved by 2015 in the countriesanalysed and for which data was available, including Namibia, in spite of the important amount of publicexpenditures in education. Apart from the information given at indicators level below, the followingcomplementary information by country can be extracted from the ECA reports:
The poverty in Tanzania, especially in rural areas, has a profound impact on the demand for publicservices, including schooling, the primary school part of which was made free and compulsory in2002. The annual per capita income was indeed equivalent to USD 534 in 2008 (just under USD1.5 per capita per day) for a population estimated at 41 million people. Concluding a review of theprogress made towards the MDG targets, it is stated in the CSP 2008-2013 that Tanzania hasalready achieved MDG2, universal primary education. According to the ECA audit, this is not thecase and the error was also highlighted by EuropeAid in the inter-service consultation on theCSP/NIP but was not corrected in the final version of the CSP. The CSP referred to a primaryschool enrolment rate of 91% in 2006. According to the ECA audit, the fulfillment of the MDG two“Achieve Universal Primary Education” is at risk in Tanzania.
Despite the progress achieved, the MDGs and EFA goals are far to be reached in Burkina Fasoconsidering the necessary financial, material and human resources. The Government of BurkinaFaso (GBF) indicates that the target of successful universal enrolment with 100% childrenaccessing primary education and a 100% completion rate could only been reached in 2020.Moreover, the ECA report indicates that indicators on access to primary education might havebeen overestimated. Indeed, the 2006 Census showed that the population has grown at a rate of3.1% per year, and that the actual population in 2006 was at least exceeding 600,000 peoplecompared to the forecasts (including 460,000 children of school age). It is also to be noted that thenumber of pupils in schools that are not official and recognised, including madrasas, is not knownbut estimated as important and might create another distortion affecting access indicators.
Despite the fact that the Government of the Republic of Namibia (GRN) consistently spent close toa quarter of its total expenditure on education, education outcomes are modest. As regardsMDG2, Namibia scores well when compared with most other African countries. However, overallindicators that are available show mixed results. Available indicators demonstrate decreasingtrends in enrolment and survival rates since 2005. Although recent data suggest that access toprimary education has improved in 2008, the reliability of the underlying data is questionable, asstated by ECA. The MDG targets for 2015 will be difficult for Namibia to reach. It should howeverbe noted that this analysis does not always agree with the conclusions of the Mid-Term progressreport on MDG for Namibia of September 2008. The reason is that the MDG report used figuresfrom 2006 whereas this statement of preliminary findings uses figures from 2007 and 2008. Theobjectives of the Education Sector Programme (ESP), which started 2003, have been replaced bythose of the Education and Training Sector Improvement Programme (ETSIP) in 2007. The ETSIPaims at strengthening the immediate supply of middle to high level skilled labour to meet labourmarket demands and supports overall national development goals. Therefore, the focus of ETSIPrelated to general education has been on secondary level access and completion with limitedattention paid to primary education, to MDGs and EFA goals. In its formulation for the newEducation Sector Policy Support Programme (ESPSP) under the 10th EDF (in the originaltimetable for the ESPSP, the financing proposal was supposed to be presented to the EDFCommittee in September/October 2009), the EC is re-directing since 2009 its support to pre-primary and primary education in order to support the country in achieving the MDGs and EFAgoals. As regards the specific impact of EC contribution, the ECA report indicates that it is difficultto assess the ESP’s contribution to planned improvements in education outcomes after six years

Thematic global evaluation of European Commission support to the education sector in partner countries(Including basic and secondary education); Final Report Vol. IIb, December 2010; Particip GmbH
144
of implementation due to its initial slow implementation, the subsequent change in the programmestrategy and the shortcomings in the monitoring system. However, where data was available, theoverall progress on education outcomes was assessed by the GRN and the EUD as mixed withpoor performance in terms of quality and addressing inequalities. Available indicators demonstratedecreasing trends in enrolment and survival rates since 2005. The unusual improvement in the2008 enrolment rate is questionable. Significant achievements in the reduction of genderdisparities in the education have been achieved. Available indicators do not demonstrateimprovements in the quality of the education during ESP implementation, while a lack of indicatorsdoes not allow for assessing improvements in addressing inequalities (e.g. social, ethnic orregional disparities). Furthermore, according to ECA, it is difficult to assess how the ESP supportto ETSIP has contributed to the intended improvements in education in isolation because itssupport is aligned with the other donors’ support and with the GRN priorities.
In Liberia, poverty manifests itself in a poor access to education services including primaryeducation. Considering the performance of Liberia on the EFA goals over time, the ECA reportconcludes that it is evident that Liberia is unlikely to reach the MDG2 by 2015. In its draft Mid-Term Review (MTR), the EC has reached a similar conclusion. The EC Support to Education inLiberia (ECSEL) contributes to MDG2 and covers six results areas. Activities financed by theproject are deemed essential to improve both access and quality of primary education, includingprocurement of school materials, building of schools and teachers training. At the national levelthe Liberia 2008 Poverty Reduction Strategy (PRS) (and before that an Interim Poverty ReductionStrategy) takes into consideration the MDGs, including MDG2, which is included in one of fourpriority “pillars” – Infrastructure and Basic Services.
Niger is one of the countries where schooling and literacy rates are the lowest in the world.However, the efforts of national authorities with the support of the development partners (includingEC) contributed to improve access to primary education. Despite the progress achieved, theeducation MDGs and EFA goals are far to be achieved. The accelerated development and povertyreduction strategy has emphasized the difficulty for the GoN (Government of Niger) to ensure theobjective of primary education for all by 2015. According to the "EFA Global Monitoring Report2010", Niger is the last country over 128 in EFA Development Index (EDI) of 2007. The targets setby the 9th EDF for performance indicators in basic education have not been reached. The ECAreport considers the education system in Niger inefficient while funding for the education sector isinsufficient in view of the financial resources necessary to achieve the education MDG objectives.
It is noteworthy that three from the countries analysed, Uganda, Burkina Faso and Tanzania, have signedMDG contracts and thus show a commitment to monitoring and achieving the MDGs.
3.3.1.1 I-211: Apparent/Gross Intake Rate
Concerning the access to primary school, the available data from the ECA reports suggest that even if ithas increased, the Gross Intake Rate (GIR) remains far from 100%. In Burkina Faso, the high increase to85.7% in 2007 might have been biased by the underestimation of the population. In Niger, the GIRremains at a low level in 2007 (65%). The following information from the ECA reports gives more specificexplanations:
In Burkina Faso, the efforts of national authorities with the support of development partners (DP),including the EC, contributed to improve access to primary education. The GIR has almostdoubled between 2001 and 2007 and increased from 46.9% to 85.7%. In 2008, it has fallen by80%, partially due to the fact that statistics for 2008 are already based on the General Census ofthe population in 2006. The decennial plan for development of basic education (PDDEB38)however plans to increase the GIR to 88% by 2010 and 100% by 2015. According to the ECAaudit, these objectives seem unrealistic given the performance of 2008. Furthermore, theycontradict the education policy letter, which plans a 100% access to primary education only in2020. As regards the EC contribution in enrolment, the final evaluation report of PASEB states apositive evolution of the GIR in the intervention area of the programme during its duration (1999-2004). The report indicates that this evolution is above national average.
In Niger, there are large discrepancies between rural and urban areas. In 2007, the GIR to primaryschool was respectively of 58% in rural and 98% urban areas. Knowing that 83% of the populationlives in rural areas, this difference is even more significant. The GIR in the first year of schoolincreased from 49.8% in 2001-2002 to 65% in 2006-2007.
38 Plan décennal de développement de l’éducation de base

Thematic global evaluation of European Commission support to the education sector in partner countries(Including basic and secondary education); Final Report Vol. IIb, December 2010; Particip GmbH
145
3.3.1.2 I-212: Net Enrolment Ratio in primary education & Gross Enrolment Ratio in primary education
According to UNESCO, the Gross Enrolment Ratio (GER) corresponds to the number of pupils enrolledin a given level of education regardless of age expressed as a percentage of the population in thetheoretical age group for that level of education. The Net Enrolment Rate (NER) is the number of pupils inthe theoretical age group who are enrolled expressed as a percentage of the same population.
The comparison between the countries analysed shows a wide range of scores regarding the enrolmentin primary school, with NERs in 2008 ranging from 49% in Niger to 97% in Uganda.
In Niger, GER has increased from 37% to 54% between 2001 and 2007, which is below theobjective of 61% set by the first phase of the PDDE (2003-2007). The progress also remains slowin terms of disparities between urban and rural areas, where the GER rose from 41.7% to 57.1%between 2001-2002 and 2006-2007. According to UNESCO Institute for Statistics (UIS 2010), theNER in Niger increased from 26% to 49% between 1999 and 2008.
As regards the EC contribution to this increase, the ECA audit analyses the results of the“Education” component of PPARP (2006-2008) which supported the PDDE over the period aswell as the sectoral reform targeting Education for All of quality. One of the objectives of thePPDE was the increase in the enrolment rate. Between 2003 and 2006, the performancesregarding Primary GER (Indicator 3) remained below targets (e.g. 54% compared to the objectiveof 57% in 2008). The objectives of the first phase of PDDE (2003-2007) was to increase the GERin primary school (cycle de base) from 41.7 % in 2002 to 61 % in 2007 and the GER in rural areafrom 38 % in 2002 to 59 % in 2007. According to the ECA audit, the results are satisfactory interms of access to basic education thanks to massive recruitment of contract agents. In2005/2006, the global GER was 54% (with a target by 57%), while the GER in rural area was 52% (with a target set at 54 %). The performance was weak concerning primary school with a GERincreasing on average by 2% per year between 2004 and 2006. Moreover, disparities betweenregions are significant. In 2006, the gap between the region scoring the highest GER (58 %) andthe one with the lowest (43 %) was 15 points, excepting Niamey. According to the ECA audit, theSouteba programme (Programme d’appui au secteur de l’éducation de base) had an impact onaccess level and the GER increased by 34% on average between 2004 and 2008 (compared to atarget set at 30%). This trend is in line with national developments - the GER rose from 48% to58% in rural area.
In Burkina Faso, GER has risen from 45.1 to 72.5% within the period 2001-2007. It fell to 71% in2008, which is below the objective of 74%, also mainly due to the fact that statistics for 2008 arealready based on the General Census of the population in 2006. The PDDEB targets an increaseof GER 75% by 2010 and 78% in 2015. According to the ECA report, these objectives seemambitious, but realistic given the performance from 2008. The UIS statistics indicate an increase ofthe NER from 35% to 60% between 1999 and 2008.
As regards the EC contribution in enrolment, the final evaluation report of PASEB states apositive evolution of the GER in the intervention area of the programme during its duration (1999-2004). The report indicates that this evolution is in line with national developments.
In Liberia, the data for the EFA goals and indicators from the EFA Global Monitoring Report 2010suggest that while GER in primary has made a dramatic, positive jump from 41% in 1999 to 125%in 2007, the NER in primary has actually dropped in the same period (from 42% to 31%).However, according to ECA, a few of the observed changes in education outcomes can beattributed (even partially) to ECSEL, due to the considerable delays of the project. It is also to benoted that a national school census from 2006/2007 showed that only 15% of students in the firstyear of primary school were of the right age (6-7 years old), while half the students were 11-20years old. The ECA s auditors noted some apparent discrepancies between data presented in theEFA Global Monitoring Report and data used in the EC’s draft Mid-Term Review (MTR), forinstance related to the NER in primary. The EC’s data stem from UNDP’s latest MDG progressreport, the Ministry of Planning and Economic Affairs’ “Liberia's Progress Towards the MillenniumDevelopment Goals, 2008”, the 2004 MDG Report on Liberia and the World DevelopmentIndicators database. The data from these latter sources suggests that there has been a positivetrend in NERs for primary school between 1989 and 2007. As mentioned above, the data in theEFA Global Monitoring Report 2010 suggests that there has been a negative trend in NERs forprimary school between 1999 and 2007. Moreover, there are large discrepancies in the actualvalues presented for 2007, for instance for the NER in primary which is 31 % according to theGlobal Monitoring Report and 37,3 % in the most recent UNDP study, which has been used for inthe draft MTR.
Thematic global evaluation of European Commission support to the education sector in partner countries(Including basic and secondary education); Final Report Vol. IIb, December 2010; Particip GmbH
146
In Namibia; according to the data of EMIS Education Statistics 2008 and UNESCO Institute forStatistics, a negative trend can be observed for MDG indicator 2.1, i.e. NER for primary school,and a negative, or at least neutral),trend for MDG indicator 2.2, i.e. proportion of pupils reachinglast grade of primary in the period from 2005 to 2007.
As regards the EC contribution, the ECA report states that available indicators demonstratedecreasing trends in enrolment and survival rates during ESP implementation.
Although recent data suggest that access to primary education has improved in 2008 (whereNER reaching 97.4% compared to 92.3% the previous year), the reliability of the underlying datais questionable. According to the ECA report, the data might be distorted by the use of projectedpopulation figures based on the last 2001 Population and Housing Census. This figure wouldhave to be confirmed once the new Population Census is completed in 2011. However, thisstatistics vary slightly from the UIS data, according to which the NER increased from 88% in 1999to 89% in 2008, while the GER slightly decreased from 116% to 112%.
In Tanzania, the primary NER increased from 59% in 2000 to 97.3% in 2006-2007 and thendecreased slightly to 95.9% in 2008. The high enrolment rates have to be seen in the context ofincreasing drop-out rates, which, in 2009, have nearly reached the level of 2003. For the PovertyReduction Budget Support Programme 2006-2008 (PRBS03), the Net primary school enrolmentrate indicator has decreased after 2006. It should be noted that a World Bank-commissioned studyfound a 20% difference in NERs when comparing household survey and administrative data. Thedevelopment partners and the Government of Tanzania expect that a planned annual survey willhelp to improve the quality of the data. For UNESCO39 the quality of data on secondary educationis a major concern. The basis for the calculation of the enrolment rate (is data generated by theMoVET as the annual census is earlier than the “second selection” for Form five candidates(secondary school grade) and sometimes Formone(first grade in secondary school). The datareflects therefore secondary school capacity, or available school places, and not actual enrolment.
According to UIS 2010, the GER in Uganda decreased from 126% to 120% between 1999 and2008, with a NER of 97% in 2008, which is the highest rate compared to the other countriesanalysed.
As regards the EC support to Uganda, the 9th EDF GBS programme included indicators foreducation. Among them, Indicator E1 ‘Net Enrolment Ratio in primary education’ correspondsexactly to MDG Indicator 2.1. for monitoring MDG two ‘Achieve Universal Primary Education’although progress on this indicator tends to reduce quality. The Net Enrolment Rate (E1) wasforeseen to increase from the 2004 baseline of 88,7 % by 1,6 % to a target of 90,3 % in 2005 butthen by only a further 0,3 % to a target of 90,6 % in 2006. In the absence of any explanation thetargeted increase for 2006 seems low, particularly given that there was a two % increase from2003 to 2004. For the first variable tranche, the audit noted concerning primary school enrolmentan outcome of 95 % was recorded in 2004-5 compared with target of 90,3 %. This represents anincrease of 6,3 percentage points on the baseline compared with the 1,6 percentage pointstargeted. The GoU did not make any observations on this result, either to explain the goodperformance or to comment on the data reliability. The Delegation also did not address theseissues, merely noting that ‘the target was comfortably met’. Regarding the second tranche, theECA noted concerning primary school enrolment, given that the target for 2004-5 had been socomfortably exceeded (95 % compared to 90,3 %) it might have been expected that the 2005-6target would have been increased from 90,6 % which represented only a marginal increase from2004-5. The target was not changed and in fact performance fell back from 95 % to 91,7 %. Noreason for this reduced performance was given.
3.3.1.3 I-213: Primary Completion Rate (PCR)
The Primary Completion Rates vary between the countries analysed, with a significant high score inNamibia where the share of children completing a full course of primary almost corresponds to more thanthe double compared to Niger and Burkina Faso in 2008 (38%). This share remains slightly above half ofthe children for Tanzania, Uganda and Liberia.
In Niger, even if access to education has improved, a significant proportion of children do notfinish primary school. The primary completion rate increased from 25.6% to 41.7% between2001-2002 and 2006-2007 but it still at the lowest level compared to the other countries analysed.
39 “Assessing Education Data Quality in the Southern African Development Community (SADC): A. Synthesis ofSeven Country Assessments, UNESCO Institute of Statistics (UIS), October 2009. The six other countries wereLesotho, Madagascar, Mozambique, South Africa, Swaziland, Zambia.

Thematic global evaluation of European Commission support to the education sector in partner countries(Including basic and secondary education); Final Report Vol. IIb, December 2010; Particip GmbH
147
According to UIS statistics, the Gross Intake Rate to last grade of primary was 38% in 2008,meaning that 38% of children complete a full course of primary.As regards the EC contribution, the PCR has been selected as one of the indicators (E6) of the“Education” component of PPARP (2006-2008). The performances remained far below targetswith a PCR of 36% in 2005 compared to an objective of 50% in 2005 and a PCR of 40% in 2006compared to an objective set at 43%.
In Burkina Faso, the primary completion rate has significantly increased between 1997 and 2007(from 28% to 42%), but it is still at a low level. According to UIS statistics, the Gross Intake Rateto last grade of primary was 38% in 2008, meaning that 38% of children complete a full course ofprimary. The PDDEB40 is targeting an increase of the PCR to 51.3% by 2010 and to 70% by 2015.Based upon the performance of 2008, this goal seems unrealistic. It should be noted that in theframework of the PAP41-PRSP the objective for 2010 has been set at 51.7%, which is in line withthe PDDEB. Regarding the EC support, the PCR was an indicator of the ABRP (Budget Supportfor Poverty reduction) 2005-2008 under the 9th EDF. Data shows that the performance is higherthan objectives: the PCR increased from 32% in 2004 (compared to an objective set at 28.8%) to36.4% in 2006 (compared to a target of 35%).
In Tanzania, The PCR (Standard VII exam pass rate) increased from 22% in 2000 to 54.2% in2006 and then decreased to 52.7% in 2007. The ratio between the number of students startingschool with those passing Standard VII (cohort completing Standard VII) decreased from 70% in2000 to 62.4% in 2008. According to ECA, this evolution has to be seen in the context of theimplementation of the free primary school policy in 2002, which increased the number of studentsdramatically. The number of students increased by 12% per year from 2000-2003 and since thenincreased by some 4% per year.
In Uganda, the UIS statistics indicate that 56% of children complete a full course of primary in2008.As regards the EC support to Uganda, the 9th EDF GBS programme included the ‘CompletionRate P7’ as an indicator for education. The Completion Rate (E2) indicator was targeted to riseby onlyone% to 63% in 2005 while there had been a 6% rise from 2003 to 2004. A larger increaseof 4% is then targeted for 2006. Regarding the first variable tranche, the audit noted that‘Completion Rate – P7’ the GoU reported a 63% completion rate which exactly met the target.The GoU acknowledged that the figure of 63% had been based on population projections goingback to the 1991 census and that using the more recent 2002 census, which showed previouspopulation figures were underestimated, the completion rate was much lower at just 51%. Itnevertheless argued that as the target was also based on the 1991 census, the full paymentshould be made and the Commission accepted this approach. This case illustrates the fragility ofperformance indicators based on population projections. Concerning the second tranche, theaudit states for E2 that a new target rate of 50% was introduced by the GoU and agreed to by theDelegation which was actually below the reported 51% achieved in 2004-5. Nevertheless the2005-6 outcome was still below the new target at 48%. This result is in line with widespreadconcerns over the quality of primary education in Uganda since the establishment of UniversalPrimary Education. In this case the GoU provided only a very brief commentary on the reasonsfor not achieving the target. The EUD stated that this issue had been subject to substantialdialogue between it and other development partners and the GoU.
In Liberia, completion rates in Grade six (final grade of primary school) are modest around 62%.According to UIS statistics, the Gross intake rate to last grade of primary was 58%in 2008,meaning that 58% of children complete a full course of primary.
The UIS statistics indicate the highest primary completion rate in 2008 in Namibia with aproportion of 81% of children complete a full course of primary.
3.3.2 JC22: Gender parity in enrolment to primary, lower secondary and upper secondaryeducation - (MDG three) and (EFA five)
MDG 3: Eliminate gender disparity in primary and secondary education, preferably by 2005, and in alllevels of education no later than 2015 EFA 5: Eliminating gender disparities in primary and secondaryeducation by 2005, and achieving gender equality in education by 2015, with a focus on ensuring girls’full and equal access to and achievement in basic education of good quality.
40 Plan décennal de développement de l’éducation de base41 Priority Action Programme

Thematic global evaluation of European Commission support to the education sector in partner countries(Including basic and secondary education); Final Report Vol. IIb, December 2010; Particip GmbH
148
Summary of ECA findings related to JC22
While gender parity in education is likely to be achieved in Tanzania and Namibia, the trends are notso clear for Niger and Liberia. Considering the GPI in primary education, the UIS data show that in2008 it varied from 0.78 in Niger to 1.01 in Uganda. It increased constantly between 1999 and 2008 inall countries analysed, except in Namibia, where it fell from 1.03 to 0.99 within the period. As regardsGER for girls in primary and secondary, there are also significant differences in between the countriesanalysed. In 2008, while the GER for girls in primary school was only slightly above 50% in Niger, itwas 121% in Uganda. When Gender Parity indicators have been integrated into EC programming, theavailable data shows weak achievements compared to targets.
While gender parity in education is likely to be achieved in Tanzania and Namibia, the trends are not soclear for Niger and Liberia. Apart from the information given at indicators level below, the followingextraction from the ECA reports can provide some complementary information:
In Tanzania, equal access for girls and boys has almost been achieved according to the ECAreport.
It should be noted that the EC contributed at an amount of € 0.88 million to the Project “CivilSociety Action for Girls’ Education in Tanzania” with Camfed (2008 –2010).This small scaleproject might have an impact at local level. However, according to the ECA audit, no detailedanalysis has been done since the project is only at the beginning of its second year ofimplementation.
The comparison between Expected and Achieved Results of the Support to Education SectorReform Programme 2006-20010 (9th EDF) shows that the indicator for gender equity in primary,which was the Percentage of girls passing Primary School Leavers’ exam did not fulfill target in2008/2009, with a performance of 45% compared to an objective of 65%.
As regards the ESP contribution regarding MDG3 in Namibia, available indicators demonstratesignificant achievements in the reduction of gender disparities in education. One interestingfeature of Namibia is that gender parity has already been achieved in secondary education and islikely to be achieved in primary education. There are more girls in secondary education than boys,and girls tend to perform better than boys, with higher survival rates. Moreover, young women aregenerally more literate than young men (except in the Kavango region). According to the ECAreport, males are currently the problem in terms of gender equity.
In Niger, there are many institutional constraints to overcome in order to achieve equal opportunityfor girls to go to school and receive an education of quality. According to the ECA report, inaddition to the economic causes (the opportunity cost of girls’ work), girls’ under-enrolment is,however, mainly explained by socio-cultural causes, including:
o the promotion of women's reproductive role and early marriage
o strong inequalities in the division of labour and gender stereotypes at family level;
o the bad perception that communities have of schools (uprooting, acculturation, etc.);
o a low representation of women in decision-making bodies, because of their social status.
Some other institutional factors have also a negative impact on girls’ enrolment, such as:
o the co-existence of several types of rights, with the preeminence of customary andMuslim laws on constitutional law, which as an effect limits the effects of the principle ofequality in national legislation and international texts ratified by Niger,
o lack of structures in high school, e.g. boarding schools, for girls from rural areas,
o the low number, or even the absence of female teachers in rural areas,
o the weak knowledge of national capacity about the tools related to gender and in takingthem into account in the policy formulation.
For Liberia, the ECA report indicates a negative trend between 1999 and 2007 related to genderparity. It should however be noted that this contradicts a conclusion drawn in the GlobalMonitoring Report 201042, where Liberia is presented as a country that has improved gender parity
42 Global Monitoring Report 2010, on page 66

Thematic global evaluation of European Commission support to the education sector in partner countries(Including basic and secondary education); Final Report Vol. IIb, December 2010; Particip GmbH
149
but where participation has deteriorated between 1999 and 2007. The ECA audit noted that ‘few ofthe observed changes in education outcomes can be attributed (even partially) to ECSEL’.
3.3.2.1 I-221: Ratio of girls to boys in primary and secondary education / Gender parity index (GPI)
The Gender Parity Index (GPI), which is calculated by dividing the female Gross Enrolment Ratio by themale Gross Enrolment Ratio for the given level of education, varies significantly within the sample ofcountries analysed. According to UN statistics43, in 2008 the GPI in primary education varied between0.78 in Niger and 1.01 in Uganda. It increased constantly between 1999 and 2008 in all countriesanalysed, except in Namibia, where it fell from 1.03 to 0.99 within the period. For the other countries, theGPI in primary education has increased within the period from 1999 to 2008, from 0.68 to 0.78 In Niger,from 0.7 to 0.87 in Burkina Faso, from 0.74 to 0.9 in Liberia, from 0.92 to 1.01 in Uganda. It should benoted that this data is not available for Tanzania..
In Tanzania, the Girl/boy ratio in secondary education was an indicator of Poverty Reduction BudgetSupport Programme 2006-2008 (PRBS03) (9th EDF). The data available for 2006/07 shows aperformance (87.8%) below to the target (90%).
In Liberia, the Girls/boys enrolment ratio was amounting 88% in 2007/2008.
3.3.2.2 I-222: Gross Enrolment Ratio in primary and secondary education
There are significant differences in GER for girls in primary and secondary between the countriesanalysed. In 2008, while the GER for girls in primary school was only slightly above 50% in Niger, it was121% in Uganda.
In Niger, the GER for girls has been increasing from 33.3% to 51.1% between 2001/2002 and2007/2008, compared to a global increase from 41.7% to 62.8% during the same period.However, the GER disparities between girls and boys are strong. In 2005/2006 the GER was 44%for girls against 63% for boys. A constant 19 point gender gap has been found over the entireperiod. The first phase of PDDE (2003-2007) targeted an increase of the proportion of girlsenrolled in basic cycleonefrom 39.8% in 2002 to 43% in 2007 as well as the GER for girls from33.3% in 2002 to 56% in 2007. In this first phase, only € 81,000 has actually been spent for thepromotion of girls’ enrolment, which represents only 7% of the planned budget. This situationshows the difficulty of introducing gender component into educational policies in Niger, both for theGovernment and DP. The resources initially planned for this component, even if they had beenactually consumed, would certainly not have produced a significant impact, because they wereinsufficient to affect the various constraints to girls’ access to education. According to UIS, theGER for girls in primary education increased from 24% to 51% between 1999 and 2008. The GERfor girls in secondary education increased from 5% to 8% during the same period.
As regard the EC support, even if the Souteba project had a positive impact on the GER, the girlsenrolment rate in the intervention area remained about 41 % between 2004-2005 and 2008-2009.The project targeted an increase of five % over this period (2004-2009). This performance islower than national average.
In Burkina Faso, according to the PDDEB data, the gaps between the GIR as well as the GER forgirls compared to the global rates have respectively decreased from 6.6% in 2001 to 2.7% in 2008for the GIR and from 6.5% in 2001 to 3.6% in 2008 for the GER. However, these gaps hasrespectively increased in the PDDEB’s 20 priority provinces, from 11.7% in 2001 to 17.8% in 2008for the GIR and from 15.2% in 2001 to 16.6% in 2008 for the GER. Disparities between boys andgirls are more significant in terms of drop-out/completion rates of primary education than in therate of access to primary education. This is particularly the case in rural areas where drop-outrates from primary education are significantly higher for girls than boys, although the primarycompletion rate for girls was only 12% in 2007. According to UIS, the GER for girls in primaryeducation increased from 36% to 68% between 1999 and 2008. The GER for girls in secondaryeducation increased from 7% to 16% during the same period. The final evaluation report ofPASEB states that the girls’ GER is far below national average.
In Liberia, a negative trend for girls-to-boy GERs is noted from 85 % in 1999 to 83 % in 2007. Asmentioned above, the data used by the EC suggests to the opposite that there has been a positivetrend in the girls-to-boys ratios in primary from 2000-2006. According to UIS 2010 data, the GERfor girls in primary education increased from 83% to 86% between 1999 and 2008. The GER forgirls in secondary education increased from 26% to 27% during the same period.
43 http://unstats.un.org/unsd/mdg/SeriesDetail.aspx?srid=611

Thematic global evaluation of European Commission support to the education sector in partner countries(Including basic and secondary education); Final Report Vol. IIb, December 2010; Particip GmbH
150
In Namibia, the UIS indicates that the GER for girls in primary education decreased from 117% to112% between 1999 and 2008. The GER for girls in secondary education increased from 61% to71% during the same period.
In Uganda, according to UIS 2010 data, the GER for girls in primary education remained at 121%in 1999 and 2008, with a higher rate at 133% in 2002. As regards the GER for girls in secondaryeducation, it increased from 8% to 23% between 1999 and 2008.
In Tanzania, the NER to primary schools amounted respectively 97.6% for boys and 97.0% forgirls in 2006-2007.
3.3.3 JC23: Primary schooling is compulsory and free of costs to all pupils
Summary of ECA findings related to JC23
In Tanzania, primary education was made free and compulsory in 2002. Even though free schoolinghas been guaranteed in Liberia, Namibia and Niger, the enrolment of a child still involves someexpenditure, which sometimes can not be afforded by the families. For Uganda and Burkina Faso, it isnot specified in the ECA reports whether or not primary school is compulsory and free.
3.3.3.1 I-231: Compulsory (and free) primary education enacted
The ECA reports only randomly mention the issue of compulsory and free primary education, indicatingthat for Liberia as well as in Tanzania, primary education was made free and compulsory in 2002, andthat in Niger, school is free as well as in Namibia, where free schooling is guaranteed by the Constitution.
As for Tanzania, the ECA report indicates that the implementation of the free primary school policy in2002 increased the number of students dramatically. The number of students increased by 12% per yearfrom 2000-2003 and since then increased by some 4% per year. ”As a result, “the primary completionrate (Standard VII exam pass rate) increased from 22 percent in 2000 to 54.2% in 2006 and thendecreased to 52,7% in 2007. The ratio between the number of students starting school with those passingStandard VII (cohort completing Standard VII) decreased from 70% in 2000 to 62,4% in 2008.
3.3.3.2 I-232 School fees and other charges abolished
Even though free schooling has been guaranteed in Liberia, Namibia and Niger, the enrolment of a childstill involves some expenditure, which sometimes can not be afforded by the families.
In Liberia, despite the introduction of free and compulsory primary education the Core WelfareIndicators Questionnaire (CWIQ) data of 2007 suggested that parents are still paying considerableamounts of money for various fees and other “socially mandatory” expenses, including primaryschool fees (23,9 % of respondents) and uniforms (18,6 %). Considering that the CWIQ alsocovered private schools this is not surprising but reflect how socioeconomic disparities continue tohave an impact on access to primary education in Liberia.
As for Namibia, the ECA reports find policy contradictions within and between ETSIP and relatedgovernment programmes. One of the examples mentioned is the fact that while free schooling isguaranteed by the Constitution, parents are required to contribute to the so-called SchoolDevelopment Funds (SDF), which covers small expenditure44. The schools are financiallydependent on the SDFs for such basic provisions as textbooks, materials, renovation, and eventeachers, due to insufficient public funding. School maintenance (which is primarily theresponsibility of the Ministry of Works) is also suffering from insufficient funding. In addition to this,students have to pay for uniforms and examinations. All this affects heavily the poor areas wherethe number of students whose parents cannot afford to contribute to the SDF is high. While theseissues were not addressed in the financing agreement for the ESP under the 9th EDF, they havebeen raised in the course of the formulation process and in the financing proposal for the ESPSPunder the 10th. Moreover the report highlights that, “Currently (i.e. in 2009), the EUD is trying toenhance its dialogue with the GRN in the framework of the ESPSP formulation under the 10thEDF by seeking ways for ETSIP to better align with EFA and MDG2 goals, and focusing more onequity issues and primary education. One of the main challenges for the Delegation is to convincethe GRN to focus more on equity aspects (e.g. to provide true free schooling).”
In Niger, schooling for children in rural areas represents an opportunity cost, and even though theschool is said to be free, an enrolled child involves some expenditures. The enrolment of girls is
44 In the schools visited by the audit team, the fee/contribution varied between 50 NAD in a primary schooland 250 NAD in a secondary school.
Thematic global evaluation of European Commission support to the education sector in partner countries(Including basic and secondary education); Final Report Vol. IIb, December 2010; Particip GmbH
151
particularly problematic, as they are constantly needed for housework and to take care of youngerchildren.
3.3.4 JC24: Provisions to enhance access to education by disadvantaged groups
Summary of ECA findings related to JC24
In the countries analysed, even if improvements have been achieved regarding inequalities related todisadvantaged groups, partially with EC contribution, considerable inequities persist. The inclusion ofdisadvantaged and vulnerable groups has been included in the objectives of EC and other DPsprogrammes, as well as strategic plans and other policy documents. In Tanzania, crosscutting issuesrelevant for education such as exclusion of handicapped persons, orphans or vulnerable children areaddressed explicitly in the analysis for the education sector presented in the CSP. In Namibia, policiessuch as the Orphans and Vulnerable policy, the revised Early Childhood Development Policy, theTextbook Policy, the Vocational Education Act, have been set up.
In the countries analysed, even if improvements have been achieved regarding inequalities towardsdisadvantaged groups, partially with the EC contribution, considerable inequities persist. Apart from theinformation given at indicators level below, the following extraction from the ECA reports can providesome complementary information:
In Tanzania, the proportion of children with disabilities attending primary school (based on GER)slightly increased from 0.24% in 2006 to 0.29% in 2006-07 (0.33% for males and 0.24% forfemales). One of the Operational Targets of the National Strategy for Growth and Reduction ofPoverty (NSGRP)/ MKUKUTA is the “increased proportion of orphans and other vulnerablechildren enrolled, attending and completing primary education from 2% in 2000 to 30% in 2010.Based on the sector strategies (ESDP, PEDP and Secondary Education Development Plan) aswell as on the studies prepared to support the 2006 Education Sector Review, the “Increasedequitable, pro-poor and pro vulnerable educational services” constitutes one of the expectedresults pursued by the Support to Education Sector Reform Programme 2006-2010 (9th EDF).
Concerning direct EC support to disadvantaged groups, the EC contributed an amount of € 0.75million to the Project “Youth With Disabilities Community Programme” with Fida International(2005 –2011) and to the project “Promoting Access to Education for Deaf Blind and MultiplyDisabled Children in Tanzania” with Sense International, with an amount of € 0.24 million.According to ECA, the project with Sense International supporting the access of deaf-blindchildren has largely achieved the planned results. For ECA, the low proportion of children withdisabilities in primary schools demonstrates the particular need for such activities and the reportinsisits that the results of this project might encourage the government to pay more attention tothese groups at the national level.
With a view to estimating the impact of the Education SBS allocation on disadvantaged groups,the Poverty and Human Development Report 200945, as quoted by the ECA report, provides amitigated picture by stating that “Poor rural children have benefited from the expansion ofeducation, but the analysis of the Household Budget Survey data shows that the least poorcontinue to benefit disproportionately from government spending in education”.
In Namibia, due to the current financing model under which schools depend on parentalcontributions to the School Development Funds (SDFs), shortcomings are greater in the poorestareas of the country. Besides the socio-economic disparities, considerable inequities persistbetween the majority of pupils in urban areas on one side, and Orphans-Vulnerable Children(OVCs) and children belonging to the San minority on the other side. Moreover, the difficulties inreaching the most disadvantaged children (orphans, vulnerable children San children, childrenliving in remote areas), also with EC support through ESP implementation, have been underlinedby the ECA report. Where regional statistics are available, they suggest that the provision ofqualified teachers, textbooks and school facilities is most difficult in the poor areas.
3.3.4.1 I-241: Existence and implementation of inclusive education policies, strategies and financingmodalities
The issue of addressing the needs of disadvantaged and vulnerable groups has been included in theobjectives of EC and other DPs’ programmes, as well as in national strategic plans and other policydocuments.
45 Poverty and Human Development Report 2009, Research and Analysis Working Group, MKUKUTA MonitoringSystem, Ministry of Finance and Economic Affairs, United Republic of Tanzania, December 2009

Thematic global evaluation of European Commission support to the education sector in partner countries(Including basic and secondary education); Final Report Vol. IIb, December 2010; Particip GmbH
152
In Tanzania, these crosscutting issues are addressed explicitly in the analysis for the educationsector presented in the CSP. In the Joint Programming Document which is an integral part of theCSP the DPs state their collective intention to support the integration of HIV/Aids into the schoolcurriculum and find solutions to reduce the impact of HIV/AIDS on trained teacher (plus a numberof other issues) through the development and implementation of a strategic plan.
In Namibia, according to ECA, the main achievement of the ESP contribution is that most of thelegal and institutional framework has been now set up to enable ETSIP activities to beimplemented. Of importance are the Orphans and Vulnerable policy, the revised Early ChildhoodDevelopment Policy, the Textbook Policy, the Vocational Education Act. These policies whichpresent institutional and financial challenges have to be implemented. However, ECA indicatesthat the lack of indicators in does not allow them to assess the improvements from the ESP inaddressing inequalities (e.g. social, ethnic or regional disparities). Available indicators are notsufficiently disaggregated to allow the assessment of progress in the access to education and ofachievements of learners from low-income households and from disadvantaged groups. ECAconcludes that a major flaw in the ETSIP monitoring and evaluation system is the fact that it lacksadequate information for a pro-poor policy and decision making. However, the need to developdisaggregated statistics to show access and achievement levels of learners from low-incomehouseholds and disadvantaged groups is highlighted in ETSIP. The Education MonitoringInformation System (EMIS) is currently being revisited to capture levels of disaggregation, notablyin terms of Orphans and Vulnerable Children.
3.3.4.2 I-242: Flexible schooling for special target groups (e.g. nomadic groups, remote area dwellers)and I-243: Existence of equivalency programmes for disadvantaged students in the formal andnon-formal education sector
The ECA reports do not give any specific information regarding the existence of flexible schooling ofequivalency programmes for special target groups.
3.4 EQ3-secondary: To what extent has EC support to education contributed toimproving transition to secondary level (both lower and upper)?
3.4.1.1 JC31: Internal Efficiency of the school cycle from Primary to Lower & Senior Secondary
Summary of ECA findings related to JC31
The ECA audits show that the enrolment rates in secondary schools vary a lot between the countriesanalysed and their comparison with the enrolments rates in primary schools underlines the need toimprove the internal efficiency of the school cycle from Primary to Secondary.
Overall, there is only limited data in the ECA reports on changes in transition rates, and even wherethere is, it remains unsure what exactly the EC’s contribution to such changes had been. TheTransition Rate from Primary to Lower and Upper Secondary constitutes one of the performancetargets of EC programmes in Tanzania. While it has been increasing between 2000 and 2006, it isdecreasing since then. In Liberia, the transition rate to lower and upper secondary has been selectedas one of the performance indicators for basic education. In Burkina Faso, the set of indicators of theABRP 2005-2008 does not allow any monitoring regarding internal quality of the education system, inparticular the transition to secondary. In Namibia, it is difficult to assess rather the EC support hasbeen affecting the quality and efficiency of the education sector. When overall indicators are available,they show mixed results.
The ECA audits show that the enrolment rates in secondary schools vary a lot between different countriesanalysed. Furthermore, a comparison of secondary with the primary enrolment rates in the samecountries underlines the need to improve the internal efficiency of the school cycle from Primary toSecondary. In terms of statistics, the following information could be extracted from the ECA reports, andis presented here, even if it is not always conclusive about the transition rate:
In Tanzania, the Net Secondary Enrolment rates in Form 1-4 and in Form 5-6 respectivelyincreased from 6% to 24.4% and from 0.4% to 1.4% between 2002 and 2007/08. In the opposite,the percentage of cohort completing secondary (Form 1-4) decreased from 91% in 2003 to 86.1%in 2007/2008, while the percentage of cohort completing secondary Form 5-6 rose from 90.1% to98.9% between 2004 and 2007/2008.
In Liberia, the GER in Junior High School (JHS-Grade 7-9), i.e. first three years of secondary, was42% in 2007/2008, while it was 26% in Senior High School (SHS-Grade 10-12). The 2007 data
Thematic global evaluation of European Commission support to the education sector in partner countries(Including basic and secondary education); Final Report Vol. IIb, December 2010; Particip GmbH
153
showed that the Net Enrolment Rate (NER) was 37,34 % in primary school and 15,2 % insecondary (Junior High School (JHS) - first three years of secondary).
In Burkina Faso, the GER in secondary schools was 12% in 2007 which is above the objective setat 11.9% for 2009 and still below the target of 13.7% to be reached in 2010 according to the actionpriority programme of PRSP. The Priority Action plan of the Strategic Framework for the Fightagainst Poverty (PAP-CSLP) has been elaborated by the government of Burkina Faso in order tomake the PRSP more operational.
In Namibia, the survival rates to Grade five (first year of Upper Primary) and Grade eight (first yearof Junior Secondary) have increased between 2005 and 2006 and then decreased in 2007.
3.4.1.2 I-311: Transition Rate from Primary to Lower Secondary, and Upper, where available
The Transition Rate from Primary to Lower and Upper Secondary constitutes one of the performancetargets of EC and government programmes in Tanzania and Liberia. While it was increasing between2000 and 2006, it has been decreasing since then. In Burkina Faso and Namibia, it is difficult to assessrather the EC support has been affecting the transition to secondary.
In Tanzania, according to the ESPR (Education Sector Performance Report) 2008/2009, thetransition/pass rate from Standard VII (Final year of primary school) to Form I (First year ofsecondary school) has been increasing between 2000 and 2006-07 from 21% to 67.5%. Howeverit has been decreasing since 2006 and the MKUKUTA target of 60% for 2010 is at risk. In theframework of the MDG contract (10th EDF), the Transition Rate from Standard VII to Form Iconstitutes one of the performance targets for education for release of MDG-based tranche. TheTransition Rate from Standard VII to Form I also constitutes one of the indicators used for theDecember 2008 disbursement in the framework of the Education component of Poverty ReductionBudget Support Programme 2006-2008 (PRBS03) (9th EDF). According to the figures provided inthe latest payment file for PRBS03, the transition rate increased from 49.3% in 2005 to 60.3% in2006/2007, compared to a target set at 54% for 2006. It is to be noted that this value is notidentical as in JESR46-09 where it is 67.5% as mentioned above.
In Liberia, according to the data from the Education Sector Plan, the transition rates from Primaryto JHS and from JSH to SHS were respectively 71% and 75% in 2007/2008. No data concerningthe earlier years of the evaluation period was provided in the relevant ECA report.
In Burkina Faso, 23 indicators in the Framework of the Budget Support for Poverty Reduction2005-2008 (ABRP 2005-2008) concern basic education. According to the ECA audit, theseindicators allow for a quantitative monitoring regarding access to primary education and reductionof gender disparities. Nevertheless they are insufficient to perform a monitoring of educationquality, in particular regarding the transition to secondary education.
In Namibia, as regards the EC contribution, the ESP47 funded under the 9th EDF is supporting thestrengthening of quality, effectiveness and efficiency of the general education and training systemthrough the co-financing of ETSIP. In its first phase (2006-2011), the ETSIP is focused ondelivering specific activities aimed at improving the mid-term performance of the education sector(e.g. through critical policy reforms) rather than on intended short-term outcomes. This factor,coupled with the fact that ETSIP has been implemented only for three years and the shortcomingsin the ETSIP monitoring system, means that it is not possible to assess sustained improvementsof the quality, equity and efficiency of the education sector which could be attributed to theprogramme yet. Where overall indicators are available, they continue to show mixed results.
46 Joint Education Sector Review47 Education Sector Programme

Thematic global evaluation of European Commission support to the education sector in partner countries(Including basic and secondary education); Final Report Vol. IIb, December 2010; Particip GmbH
154
3.4.2 JC32: Capacity of secondary institutions to accommodate potential enrolments and tomeet expected rise in demand for enrolment (especially at lower secondary level)
Summary of ECA findings related to JC32
As regards budget allocations targeting a better access to secondary education, the analysedcountries present various trends. In Namibia, the EC supported secondary level access andcompletion by adhering to ETSIP priorities. In Uganda, the 9th EDF GBS programme states foreducation that attention will be paid to better targeting of public expenditure for secondary educationfor the poor. However, the EC did not set any specific objectives and it is still unclear how far the ECcontribution of financial resources to the GoU budget is intended to lead to an increase in the nationaleducation budget to address this priority. In Burkina Faso, the EFA-FTI constitutes the onlyprogramme focusing on Secondary Education. In Tanzania, the percentage of secondary studentsprovided with scholarship increased significantly between 2003 and 2007/2008 but has beendramatically decreasing in 2008/2009. The budget share for secondary education has decreasedbetween 2004 and 2008.
In the countries for which information is available in the ECA reports, it appears that the capacity ofsecondary institutions seems to be adapted to the demand and even often higher than in Primaryschools, considering that the capacity of secondary institutions to enroll possible entrants can partiallybe measured by the ratio of pupils to teacher and the number of schools. The data shows that inLiberia, the pupil to teacher ratio in public and community schools is higher in secondary than inprimary schools. In Namibia, the global number of schools and teachers increased at about the samerate as the number of students in secondary schools. The capacity of secondary institutions to enrollpossible entrants therefore seems to be growing together with the demand. Namibia's Vision 2030includes three objectives concerning access to and capacities in secondary education. In Tanzania,the total number of secondary school teachers increased between 2003 and 2007/2008 while thesecondary qualified teacher to pupil ratio decreased. According to ESPR, teacher deficit in Secondaryhas been estimated up to 62,567 in 2008/2009.
3.4.2.1 I-321: Provisions and budget allocations made to allow for increased access tosecondary education
While the EC supported the increase of budget allocations targeting a better access to secondaryeducation in Namibia and Uganda, the budget share for secondary education has decreased between2004 and 2008 in Tanzania, and according to the ECA report, the EFA-FTI constitutes the onlyprogramme focusing on Secondary Education in Burkina Faso.
In Namibia, as mentioned above, the EC supported secondary level access and completion. TheETSIP priorities were indeed focused on strengthening the immediate supply of middle to highlevel skilled labour to meet labour market demands and support overall national developmentgoals.
In Tanzania, the percentage of secondary students provided with scholarships increased from 6%in 2003 to 42.2% in 2007/2008. However, it has been dramatically decreasing afterwards and fellto 11.9% in 2008/2009. The budget share for secondary education has decreased by nearly 4.5percentage points between 2004 and 2008, where it was at 10.4%.
The Public Expenditure Tracking Survey (PETS) carried out in 2009 covered both primary andsecondary school budgets. It highlighted that the main discrepancies between the budgetallocated and the funds received by the schools were due to the fact that the budget was not fullyexecuted; that councils spent the money themselves for the benefit of the schools (in kindcontributions); on other education purposes or on entirely different sectors.
In Burkina Faso, the ratio of unit costs per pupil to GDP per capita in upper secondary (“2èmecycle de l’enseignement secondaire”) was 8% higher than the average in RESEN48 countries in2006, while it was 26% lower in the secondary (“premier cycle de l’enseignement secondaire”).According to the RESEN, the repetition and drop-out rates represent a high cost on publicexpenditures. While the government and the DP are neglecting secondary schooling, privatefunding is starting to look into it.
According to the ECA report, the EFA-FTI managed by the World Bank with the contribution ofthe Global Catalytic Fund constitutes the only programme focusing on Secondary Education.
48 RESEN is a Country Status Report on a National Educational System [“Rapport d’état d’un système éducatifnational”]

Thematic global evaluation of European Commission support to the education sector in partner countries(Including basic and secondary education); Final Report Vol. IIb, December 2010; Particip GmbH
155
3.4.2.2 I-322: Capacity of secondary institutions to enrol possible entrants measured by e.g. no.of places in relation to Primary graduates
Considering that the capacity of secondary institutions to enroll possible entrants can partially bemeasured by the ratio of pupils to teacher and the number of schools, data shows various developmentsin the countries analysed:
In Liberia, the teacher to pupil ratio in public and community schools is higher in secondary than inprimary schools. In 2007/2008, it was 1/23.8 in JHS and 1/23.2 is SHS, compared to 1/48.7 fromGrade 1-649.
In Namibia, the global number of schools and teachers increased at about the same rate as thenumber of students in secondary schools. The capacity of secondary institutions to enroll possibleentrants seems therefore to be growing together with the demand. According to the ECA audit, thenumber of students in secondary has increased by 1.1% between 2005 and 2008 (i.e. from148,104 to 163,879) while the total number of students increased by 1.03% (from 555,096 to577,290). The total number of both primary and secondary schools has globally increased by 1.1% since 2001 (from 1545 to 1661) and the total number of teachers has increased by 1.07%between 2005 and 2008 (from 19,304 to 20,830). According to the ECA audit, the overallsustainability of current government financed activities therefore seems to be ensured.
Namibia's Vision 2030, launched by the Namibian Government in June 2004, includes threeobjectives concerning access to and capacities in secondary education:
o Expand access to secondary school for the target age group by 2006;
o By 2015, there should be at least one teacher for every 35 learners in primary and 30learners in secondary schools. Government is working towards having 90% of thestructures permanent by 2015 opposed to the current 84% permanent and 16% non-permanent;
o Minimum qualification required to be appointed as a teacher in Basic Education would bea Teacher’s Diploma (for Primary Schools) and a Bachelor of Education Degree forSecondary Schools.
In Tanzania, the total number of secondary school teachers increased from 16,399 to 32,835between 2003 and 2007/08 while the secondary qualified teacher to pupil ratio decreased, from1/33 to 1/50. According to ESPR50, teacher deficit in Secondary has been estimated up to 62,567in 2008/2009.
3.5 EQ4-quality: To what extent has EC support to education contributed toimproving the quality of education?
3.5.1 JC41: Availability of strategies and resources to enhance quality of learning and teaching
Summary of ECA findings related to JC41
In most of the countries analysed, the quality of learning and teaching suffers from an inadequate ofhuman and material resources, such as qualified teachers, learning materials, textbooks and schoolstructures.
In Niger, Namibia and Tanzania, the government has elaborated strategies aiming at reinforcing thequality of education. In Niger, the PDDE elaborated by the Government, includes a quality componentand constitutes a global framework for interventions of all DP in the education sector. In Tanzania,quality in primary and secondary education is included in the operational targets of the NationalStrategy for Growth and Reduction of Poverty. In Namibia, the ETSIP adopted by the governmentconstitutes a 15 year strategic plan aiming at strengthening the quality of education. In those countriesas well as in Burkina Faso, Liberia and Uganda, EC programmes are also supporting the improvementof the education quality at all levels. The Souteba programme (Niger) and the EQUIP project(Tanzania) have contributed to improve the quality of education in their area of interventions. While theglobal impact of PASEB (Burkina Faso) is assessed as positive, the available data shows mixedperformance and few observed changes on education outcomes including quality can be attributed(even partially) to ECSEL (Liberia), due to the considerable delays of the project. The GBS PPARP(Niger) and the SBS « Support to the Education Sector Reform » (Tanzania) include targeted
49 Primary school50 Education Sector Performance Report
Thematic global evaluation of European Commission support to the education sector in partner countries(Including basic and secondary education); Final Report Vol. IIb, December 2010; Particip GmbH
156
indicators related to quality.
While in Tanzania, teacher’s salaries have not been adjusted in the last years and governmentofficials are paid “sitting allowances”, amounting 74% of the standard monthly salary of a primaryschool teacher to attend seminars and meetings; the teachers salaries constitute 75% of the educationbudget in Namibia, crowding out other important expenditures and about 20% of the wage bill is lost toteacher absenteeism in Uganda.
In all countries analysed, the pupil-teacher ratio is still considered as modest, and often belowobjectives. In Uganda, it is difficult to assess the achievements towards targets because data can beinflated by some schools in order to be allocated more capitation funds. In Niger and Burkina Faso,the rapid growth of population resulted in a high increase in the number of pupils and that have put thepupil-teacher ratio at risk. Only little information regarding the pupil-classroom ratio is given by theECA reports.
In most of the countries analysed, the quality of learning and teaching suffers from an inadequateprovision of human and material resources, such as qualified teachers, textbooks and school structures.Apart from the information given at indicators level below, the following extraction from the ECA reportscan provide some complementary information:
The Government of Liberia faces considerable challenges when it comes to ensuring qualityeducation at all levels, especially in terms of school structures: Every fifth primary school is stillcharacterized as “make-shift” (as opposed to “solid” or “semi solid”).
In Namibia, Education quality remains a cause of concern with leaving and repetition ratesstanding steadily at high rates. Moreover, there are insufficient books to ensure a 1:1 learner-to-textbook ratio and generally a lack of other learning materials. The adequate provision of qualifiedteachers, textbooks and school facilities, which clearly affects the quality of the education, is off-track when compared to the targets set by Vision 2030 and the targets set by the MoE for thefiscal year 2007/2008. Also, there are still many “make-shift” structures for primary schools andwhere permanent structures are in place; they are sometimes without running water, sanitationand/or electricity. Schools are financially dependent on the School Development Funds for suchbasic provisions as textbooks, materials, renovation, and even teachers, due to insufficient publicfunding. School maintenance (which is primarily the responsibility of the Ministry of Works) is alsosuffering from insufficient funding.
3.5.1.1 I-411: Existence of strategies for improving quality of learning and teaching such as‘Whole school development’
In Niger, Namibia and Tanzania, the government has elaborated strategies aiming at reinforcing thequality of education. In those countries as well as in Burkina Faso, Liberia and Uganda, EC programmesare also supporting the improvement of the education quality at all levels. The following information percountry could be distilled from the ECA reports:
In Niger, the decennial plan of education development 2003-2013 (PDDE51) is a sectoral strategyelaborated and developed into an Action Plan by the Government. This programme includes pre-primary, primary, secondary and non-formal education and it is implemented through the fundingof three components: Access, Quality and Institutional development. It represents a globalframework for interventions of all partners in the sector. As a result, the PPARP52 (EC) contributionto the expected results of PDDE is complementary to the intervention of other DP in this sector.
The ECA report indicates that the indicators used for the 9th EDF are not sufficient to monitor thequality of education. In the PPARP (2006-2008), the only indicator related to internal efficiency isthe Primary Completion rate, while the PDDE also selected the repetition rate, results to nationalexams and level in mathematics and French. The analysis of objectives and performances showsweaknesses in the quality of education. According to the ECA audit, this is due to insufficientfinancial resources allocated in the quality component (11.7% of expenditures), the inefficiency ofhuman resources management and the lack of global view in terms of initial and continuoustraining of teachers.
The impact of the Souteba project in its intervention area is assessed by the ECA audit as overallpositive. The Souteba project contributed to improve the quality of education in particular byproviding textbooks, guides and tools and supporting the CAPED (Cellules d’animationpédagogiques) for the ENI (École nationale d’instituteurs) and also some directories of the MEN
51 Plan décennal de développement de l'éducation52 Programme pluriannuel d’Appui à la réduction de la pauvreté (2006-2008)

Thematic global evaluation of European Commission support to the education sector in partner countries(Including basic and secondary education); Final Report Vol. IIb, December 2010; Particip GmbH
157
(Ministère de l’éducation nationale). According to the ECA audit, it also contributed to theintroduction of new approaches in the training of teachers and continuous training as well asregards bilingual modalities in basic education.
The Country Strategy Paper for the period 2008-2013 for Namibia offers some insight into thechallenges facing the country in the education sector, including the inefficiencies and lack ofquality in public education expenditure as well as considerable regional and social disparities. Inthe year 2006/2007 the GRN adopted a 15 year strategic plan, the Education and Training SectorImprovement Programme (ETSIP), in response to its overall “Vision 2030” government strategyand the national Development Plan (NDP), with the objective of further developing a knowledge-based economy.
As regards the EC contribution in Namibia to the quality of education, the ECA audit concludesthat available indicators do not demonstrate improvements in the quality of the education duringESP53 implementation. The ESP’s initial specific objectives have been superseded by those of theETSIP programme, which aims at strengthening the quality, effectiveness and efficiency of thegeneral education and training system. According to the ECA report, where data was available,the overall progress on education outcomes was assessed by the GRN and the Delegation asmixed with poor performance in terms of quality and addressing inequalities.
In Tanzania, Primary and Secondary Achievement & Quality are part of the operational targets ofthe National Strategy for Growth and Reduction of Poverty (NSGRP)/ MKUKUTA. However, thequality of education has been given a lower priority, mainly given the fact that the government’sfocus has mainly been on the MDG-related enrolment in primary school. The performance ofquality indicators shows the significant challenges facing the education sector in Tanzania.Several indicators indeed suggest that the quality of education in Tanzania is lacking. The primaryschool pupil/textbooks ratio of 1:3 for basic education was in 2008 still the same as agreedbetween the EC and the GoT in the CSP 2001-2007 of March 2002. Comparing the findings of thedraft Public Expenditure Tracking Survey (PETS) of 2009 and the last PETS of 2004, thecapitation grant for primary schools paid by the government per student per year, and whichcovers among other things the purchase of text books and maintenance of school buildings, hasdecreased. According to the most recent PETS of 2009, the capitation grant for primary schools is,at approximately USD 3,6, lower than the target amount referred to in the Country Strategy Paperfor the 9th EDF (USD six per student per year by 2003) and the amount mentioned in the PEDP Iprogramme document of 2002 (USD ten per pupil). Therefore there is a risk that the fundsavailable to purchase and renew school books and buildings will also not be sufficient in thefuture.
As regards the EC contribution to improve the quality in education, the ECA report indicates thatthe project Education Quality Improvement through Pedagogy (EQUIP) with Oxfam GB (CRIS No2005/095-398) addressed key issues related to the quality of education and ways to improve it.
Furthermore, the promotion of equity and quality basis education is one of the three mainpriorities of the Education SBS (“Support to Education Sector Reform”) financed under the 9thEDF. The payment of variable tranches is linked to the fulfillment of indicators including quality.However, in December 2009, two quality related indicators were not fulfilled:
o Reduction of cross-district disparities in pupils/teacher ratio in primary education (qualityand spatial equity in primary);
o Pupils/textbook in primary schools (quality in primary);
and two were only partly fulfilled (scored 0.5)
o Pupils/ grade A or diploma teachers in primary education (quality in primary);
o Percent of students passing the Form four examination (CSEE) (quality in secondary).
According to the ECA audit, the Education SBS (“Support to Education Sector Reform”) financedunder the 9th EDF has not yet achieved the expected results and indicators do not show theplanned improvements. Education quality remains an area of concern for the EC. An internalAIDCO note concludes that: “Performance is, however less encouraging […] which can haveserious implications on efficiency, equity and quality: e.g. the primary completion rate hasdeclined to 65%, the pass rate for primary leaving exam has fallen to 54% and some districtshave a pupil-teacher ratio as high as 74:1”.
53 Education Sector Programme

Thematic global evaluation of European Commission support to the education sector in partner countries(Including basic and secondary education); Final Report Vol. IIb, December 2010; Particip GmbH
158
Due to the priority given to the MDGs, the GoT has been more focused on enrolment than on theimprovement of education quality. The ECA report adds that NSAs/CSOs active in the sector to agreat extent share the DPs’ concern for education quality, although they put more emphasis onthe problematic situation for teachers. They also highlight the problem of a possible, gradualdevaluation of the pass criteria and the associated risk of diminishing education quality. ForPoverty Reduction Budget Support Programme 2006-2008 (PRBS03), both enrolment and qualityindicators have shown improvements since the start of the support (May 2006) but availableindicators for the two years passed since then (2006 and 2007) suggest that the trend hasreversed.
In Burkina Faso, the EC programme PASEB54 (2000-2005) has contributed to the improvement ofquality through infrastructures and the providing of material and equipment. According to the ECAaudit, it improved the material living conditions of teachers by providing them accommodations.However the project did not significantly improve the quality of learning for teachers and pupils,nor the quality of life of pupils at school. The available data show that its global impact is positivein the intervention area but limited. However, the sustainability of certain infrastructures (schoolcanteens, literacy centers and teaching material is at risk.
As regards the results of the Education and Capacity Building component budget support forPoverty Reduction 2005-2008, the analysis of indicators shows a performance below objectives.Even if achievements are visible for some indicators like provision of school books (which is stillinsufficient to ensure a 1:1 learner-to-textbook ratio), others are far below targets.
The numbers of Arithmetic and Reading books have significantly increased and the Pupil-Arithmetic books ratio was 0.91 in 2008 compared to 0.26 in 2001 while the Pupil-Reading booksratio increased from 0.49 in 2001 to 0.9 in 2008. According to the ECA, even if they are still underone book per pupil, the objective could be reached in 2010. According to the Program for theAnalysis of Education Systems (PASEC) at the Conference of Ministers of Education fromFrench-speaking countries (CONFEMEN)55 analysis, the quality of learning has decreased whilethe number of teachable children has increased.
As regards the EC contribution to improve the quality in education in Liberia, the ECA audit statesthat the considerable delays56 in the ECSEL57 project does not yet allow for a general assessmentof the results achieved. The only result of the ECSEL is the “empirical” improvement in the schoolbook-to-pupil ratio from 1:27 to 1:2, which was achieved between June 2008 and June 2009 andto which the ECSEL short term TA contributed. It should however be noted, that the largequantities of textbooks purchased have not yet been distributed to all schools and the “empirical”ratio therefore does not yet reflect the actual state of affairs in the class-rooms in most of Liberia’sprimary schools. As highlighted in a 2009 ROM58 assessment, some limited progress was alsomade with contributions from ECSEL funded TA in the development of the EducationManagement Information System (EMIS).
In Uganda, there are concerns over the quality of primary education since the establishment ofUniversal Primary Education. The 9th EDF Financing agreement of PEAP has highlighted thegeneral issue of reduced quality in primary and post-primary education as a priority area to beaddressed. However, it did not detail the specific objective of the GBS programme in this respect,and how it will be achieved within the timeframe of the programme.
3.5.1.2 I-412: Percentage of non-salary to salary budget allocation
While in Tanzania teachers’ salaries have not been adjusted in the last years; the teachers’ salariesconstitute 75% of the education budget in Namibia, crowding out other important expenditures and about20% of the wage bill is lost to teacher absenteeism in Uganda.
In Tanzania, teachers’ salaries have not been adjusted in recent years and teachers’ workenvironment is challenged in numerous ways, including with respect to transportation and (thephysical) collection of salaries. Furthermore, the Court’s auditors assess that housing conditionsfor teachers are not yet adequate.
54 Programme d’appui au secteur de l’éducation de base55 Les apprentissages scolaires au Burkina Faso: Les effets du contexte, les facteurs pour agir, Etude PASECBurkina Faso, Ministère de l’Enseignement de Base et de l’Alphabétisation, CONFEMEN, September 200956 These are largely caused by the delay in the deployment of a dedicated education project officer in the EUD andthe long term TA.57 EC Support to Education in Liberia58 Results Oriented Monitoring

Thematic global evaluation of European Commission support to the education sector in partner countries(Including basic and secondary education); Final Report Vol. IIb, December 2010; Particip GmbH
159
It should be noted that according to the EUD, government officials are paid “sitting allowances”when taking part in seminars or meetings. According to government rules a per diem of 80,000TSh (€ 40) is paid per day. This is equal to 74% of the standard monthly salary of a primaryschool teacher (approximately 110,000 TSh equal to € 58). For meetings out of the country, theper diem is even higher. The per diems are either paid out of the education budget or undercontracts with the EC or other contractors like UNESCO. According to the EUD, as part of theESMIS contract with UNESCO an amount of € 437,089 is budgeted for this type of expenditure.This issue of proliferation of allowances was also raised at the meeting of the Annual NationalPolicy Dialogue between the DPs and the GoT59 in November 2009.
In Namibia, teacher payroll expenditures account for more than 75% of the education budget,crowding out other recurrent expenditure, including purchasing of textbooks and materials, as wellas renovation. The EC financed an Expenditure Issues Paper and an Education ExpenditureStrategy to find ways to free money from the big payroll, which became part of the ETSIP financialstrategy.
ETSIP has not, however, succeeding in reducing personnel and utility expenditures. Someproposed changes were adopted, such as to de-couple teachers’ salaries from qualifications or afunding formula to provide more resources to disadvantaged regions, schools and communities.However, many others, such as the proposed staffing norms which led to significant oppositionfrom teachers were rejected. These proposed changes have been counteracted by a recent 12%pay increase for teacher and other civil servants, and systematic budget overrun of personalexpenditures amounting to some 6.52% in education for fiscal year 2007/2008. ETSIP also plansto generate efficiency savings by increasing the learner- teacher ratio to 40 which directlycontradicts the policy of learner-centred and inclusive education. Nevertheless, this target has notbeen reached. A recent EC funded study concludes that it is unlikely that efficiency savings canbe generated in the way prescribed in ETSIP because they are based on unrealisticassumptions60.
In Uganda, the 2009 Joint Assessment61, concluded that for education, despite targets being met,problems identified in previous assessment still persist. A 2007 study revealed about 20% of thewage bill – almost Ush 55 billion [€ 24.55 million62] – is lost to teacher absenteeism each year andthat only 18.2% of teachers are teaching at any point in time. Low teacher attendance rates reflectpoor school management, poor supervision by Government and insufficient support to teachers. Inaddition, problems arise from the inefficient distribution of resources across the sector such as theinefficient distribution of teachers within schools, within districts and between districts, theoveremphasis of resources at upper primary and the political redirection of grants at district level.
3.5.1.3 I-413: Pupil-teacher ratio
In all countries analysed, the pupil-teacher ratio is still considered as modest, and often below objectives.In Uganda, it is difficult to assess the achievements towards targets because data can be inflated bysome schools in order to be allocated more capitation funds. In Niger and Burkina Faso, the rapid growthof the population resulted in a high increase in the number of pupils and that have put the pupil-teacherratio at risk.
In Liberia, pupil-teacher ratios are quite modest at 1:49.
In Namibia, as mentioned above, ETSIP targeted to increasing the learner- teacher ratio to 40which has not been reached. This target differs from the target of 35 set in the GRN’s Vision 2030and even directly contradicts the policy of learner-centred and inclusive education. The ECA reportnotes that in systems which succeed in implementing such an approach to education, the cut-offpoint for class size is 27-28.
In Tanzania, the number of primary school teachers has increased by some 40 000 between thebaseline year of 2003 and 2008/09 but this is still not sufficient to meet the demand. The Primarypupil-teacher ratio has increased from 46:1 in 2000 to 53:1 in 2006-2007. Some districts even
59 Rapid Budget Analysis 200960 Support to the Formulation of the Education Sector Policy Support Programme in Namibia– Final Report July 2009.61 to which the Commission contributed with other budget support donors and the GoU within the new JointAssessment Framework (JAF)62 Employing a conversion rate from June 2007, based on the European Commission website: InforEuro:http://ec.europa.eu/budget/inforeuro/index.cfm?Language=en

Thematic global evaluation of European Commission support to the education sector in partner countries(Including basic and secondary education); Final Report Vol. IIb, December 2010; Particip GmbH
160
have a pupil-teacher ratio as high as 74:1. According to the ESPR 200963, the teacher deficit wasamounting to 30,405 for Primary and 62,567 for Secondary in 2008/2009.
In Uganda, it has been noted in the 2009 meeting of the Education Sector Consultative Committeethat some schools inflate pupil enrolment and teacher deployment so as to be allocated morecapitation funds. According to the ECA audit, such a situation makes all the harder the objectivemeasurement of whether targets are achieved and progress made in the sector. Unfortunately, theECA report does not provide any actual figures.
In Niger, the average number of pupils per teacher in public schools decreased slightly from 41 in2001-2002 to 40 in 2006-2007. The ECA report indicated that the high population growth rateresulted in an increase of the total number of children of primary school age from 2.3 millions in2005 to 2.9 millions in 2015, which requires the creation of at least 15.000 new classes and therecruitment of as many teachers over the period.
In Burkina Faso, as regards the results of the Education and Capacity Building component of theBudget Support for Poverty Reduction 2005-200864, the analysis of indicators shows aperformance below objectives for the pupil-chair and pupil-teacher ratios. According to the ECAreport, the under-performance concerning these indicators is mainly due to the rapid growth in thenumber of pupils, which was much higher than planned. The pupil-teacher ratio decreases withdifficulty and even increased to 54 in 2007 and 53 in 2008, compared to 52 in 2004. The target setby the Priority Action plan of the Strategic Framework for the Fight against Poverty (PAP-CSLP) is52 in 2010 and seems realistic according to the ECA.
3.5.1.4 I-414: Pupil-classroom ratio
The ECA reports give only little information regarding the pupil-classroom ratio.
In Tanzania, the ratio between primary school pupils and class rooms had improved in 2007 (1:77)compared to 2006 (1:92). However, in 2008 (1:109), it was again significantly above the level of2006. As regards the EC contribution, the “Support to Primary Education Development Plan(PEDP)” programme financed under the 8th EDF, which supported primary education, showedconsiderable achievements in terms of new class rooms built (80% of PEDP targets).
In Niger, the Souteba project contributed to improve the quality of education including by theconstruction of classrooms in the area of intervention (120 classrooms planned in total).
3.5.2 JC42: Quality related efficiency measures
Summary of ECA findings related to JC42
Very little information is to be found in the ECA reports regarding the efficiency trends and measures.The data provided by the ECA report show mixed performance regarding the trend of the drop-outrates in the analysed countries. The repetition rates have been decreasing in Tanzania and Niger,while it is still at a very high level in Burkina Faso.
3.5.2.1 I-421: Decreasing drop out ratesThe data provided by the ECA report show mixed performance regarding the trend of the drop-out ratesin the analysed countries:
In Namibia, school leaving rates after grade five and eight decreased between 2006 and 2007,respectively from 6.5% to 4% and from 10.4% to 6.7%, and increased between 2007 and 2008,respectively from 4% to 5.2% and from 6.7% to 9.5%.
In Tanzania, the primary drop-out rate decreased slightly between 2003 and 2006-2007, from3.80% to 3.20%.
In Burkina Faso, according to the RESEN65, the amounts spent on the results of repetition anddrop-out represent 31% of the resources allocated to the education sector and constitute a wasteof public spending. The repetition is higher in the last year of each cycle, in particular at the end ofprimary school, which leads affected children to drop their studies.
63 p. 79 and p. 7664 « Appui budgétaire pour la réduction de la pauvreté »65 RESEN is a Country Status Report on a National Educational System [« Rapport d’État d’un système éducatifnational »]

Thematic global evaluation of European Commission support to the education sector in partner countries(Including basic and secondary education); Final Report Vol. IIb, December 2010; Particip GmbH
161
3.5.2.2 I-422: Decreasing % repeaters among primary pupils
According to the data cited in the ECA reports, the repetition rates have been decreasing in Tanzania andNiger, while it is still at a very high level in Burkina Faso.
In Tanzania, the Primary repetition rate was 5.30% in 2003 and decreased to 4.40% in 2006-2007.
In Niger, the repetition rate in Primary education66 decreased from 13% in 2001-2002 to 4.9% in2006-2007.
In Namibia, the repetition rates at those grades were 23.9% and 25.3% in 2008.
In Burkina Faso, the repetition rate remains at a very high level. One of the objectives of the Letterof Policy Education [“Lettre de Politique Educative”] of Burkina Faso from July 2008 is to reducethe repetition rate in primary school from 12% to 8% in 2015.
3.5.3 JC43: Qualifications and competencies of teachers and school leaders enhanced
Summary of ECA findings related to JC43
Generally speaking, the ECA reports recognise the need for more or better teacher training. InTanzania and Namibia, there is still a lack in qualified teachers. In Liberia and Niger, the EC supportsinitial and continuous teacher’s training respectively through the ECSEL and the Souteba programme.
There is very little information provided by the ECA reports on teacher accreditation and upgrading.
In Tanzania and Namibia, there is still a lack in sufficiently qualified teachers. In Liberia and Niger, the ECsupports initial and continuous teacher’s training respectively through the ECSEL and the Soutebaprogramme. Nowhere in the ECA reports under consideration, is a significant measured enhancement inteacher and school leader quality mentioned. Apart from the information given at indicators level below,the following extraction from the ECA reports can provide some complementary information:
In Tanzania, there are not sufficient qualified teachers available to meet the demand. TheNSAs/CSOs active in the sector also share the perception that enrolment rates were increasedduring the last decade at the expense of education quality. There is still a lack of qualifiedteachers and the quality of teachers is deteriorating due to the recruitment of under-qualifiedteachers (all primary school teachers became secondary school teachers), very limited tutoring atschools and short, condensed programmes to train teachers.
As regards the EC contribution, the “Support to Primary Education Development Plan (PEDP)”programme financed under the 8th EDF, which supported primary education, showedconsiderable achievements in terms of new teachers trained and recruited (77% of PEDPtargets).
In Namibia, despite recent improvements, 28.9% of the teachers in primary school and 9.9% ofthe teachers in secondary are still under qualified, i.e. with less than three years of tertiaryeducation, of which 8.8% of those working in primary, and 2.6% of those working in secondary,have completed less than 12 years of schooling. According to the ECA report, the adequateprovision of qualified teachers, which clearly affects the quality of the education, is off-track whencompared to the targets set by Vision 2030 and the targets set by the MoE for the fiscal year2007/2008.
In Liberia, the ECA report noted that an estimated 60% of the teachers in primary and 42% of theteachers in JHS are characterized in the 2007 school census as “untrained”. In terms of the GoL’sallocations, some 2% of total public spending on education in the financial year 2007/2008 wasspent on teachers’ training. The Recruitement and training of qualified teachers constitutes one ofthe seven strategic objectives of the Government of Liberia in education for the 3-year lifetime ofthe Liberia 2008 Poverty Reduction Strategy (PRS).
The EC funded ECSEL (2006-2010) covers six results areas and project funded activitiesdeemed essential to improve both access and quality of primary education, including teacherstraining among others. Largely due to the limited institutional capacity of the GoL and the EC’sown capacity constraints, the ECSEL was designed to be managed through long-term TechnicalAssistance (TA). “Primary school teachers trained and continuously professionally upgraded (atleast 30% women) on the basis of generic teacher competencies” constitutes one of the results ofthe ECSEL. As of 1st March 2010, only one of the planned activities, Teacher- Training Plannedand Undertaken (5.2), had been implemented through the following sub-activities:
66 “Cycle de base 1”

Thematic global evaluation of European Commission support to the education sector in partner countries(Including basic and secondary education); Final Report Vol. IIb, December 2010; Particip GmbH
162
o The development of a status report providing an overview of teacher supply and demandon a national basis (still on-going in September 2010);
o The contribution to a scoping exercise to ascertain potential teacher-training modalities,suitable teacher-training providers and funding sources;
o The assistance in evaluating the suitability of potential teacher-training providers;
o The provision of significant resources for in- service teacher-training.
However, the implementation of the other activities planned, i.e. Policy and strategydeveloped for teacher-training (5.1) and Quality Assurance Improved (5.3) required ECSELextension to be implemented. Under the activity 5.1., the sub-activities planned are mainlyfocused on teacher-training, including:
o The development of a draft medium-term national teacher-training policy and strategy,with particular reference to female teachers;
o The development of options for the structuring of teacher-training to meet national needs;
o The development of a trainee teacher recruitment and selection policy, with specialemphasis on women and people with disabilities;
o The development of structures for ongoing continuing professional development ofteachers, particularly female teachers;
o The development of a sustainable strategy for the adequate financing of teacher- trainingand teachers.
In Niger, in the framework of the Souteba programme67 2005-2009, the duration of the initialtraining of teachers (“élèves-maîtres”) has been increased from one to two years and a newCompetency-based Approach (“approche par les compétences - APC) has replaced the Modularapproach in order to achieve a more results-oriented training of teachers. Thematic documentshave been created in order to test the Initial Training Plan in the National School for Teachers(“ENI - Écoles nationales d'Instituteurs”). The Souteba programme resulted in better conditions for theteachers through the rehabilitation and construction of National School for Teachers. As regardscontinuous training of teachers, a set of proposals for educational practices have been developed. Itsimplementation should bring new developments in global view and behavior, instead of bringing technicalchanges. However according to the ECA audit, these innovative approaches will take time to bringbehavioral changes and the viability of the impact of the continuous training is questionable.
3.5.3.1 I-431: Percentage of primary school teachers who are certified to teach according tonational standards (teacher accreditation)
There is very little information provided by the ECA reports on teacher accreditation.
In Tanzania, there are not sufficient qualified teachers available to meet the demand. The Primaryqualified teacher (grade A + above) to pupil ratio increased from 1:106 in 2003 to 1:73 in 2006-2007.
3.5.3.2 I-432: School, cluster based or district-based in-service teacher upgradinginstitutionalized
In Liberia, as mentioned above, “Primary school teachers trained and continuously professionallyupgraded (at least 30% women) on the basis of generic teacher competencies” constitutes one of theresults of the ECSEL, even if it is not clear if this is planned to happen at the school-, cluster- or district-levels. There is no information on teacher upgrading for the other countries analysed.
3.5.3.3 I-433: Training of school leaders on managerial skills in place and implemented
No information is provided by the ECA reports regarding the training of school leaders on managerialskills.
67 “Programme d’appui au secteur de l’éducation de base”

Thematic global evaluation of European Commission support to the education sector in partner countries(Including basic and secondary education); Final Report Vol. IIb, December 2010; Particip GmbH
163
3.5.4 JC44: Provisions made to ensure minimum quality education for children in difficultcircumstances and ethnic minorities
Summary of ECA findings related to JC44
Only very little information is provided by the ECA reports on the provisions made to ensure minimumquality education for children in difficult situations and ethnic minorities.
However the ECA audit for Namibia stated on a general note, that there are some difficulties inreaching the most disadvantaged children. Furthermore, available indicators are not sufficientlydisaggregated for this country to allow the assessment of progress in the access to education and ofachievements of learners from low-income households and from disadvantaged groups. TheEducation Monitoring Information System (EMIS) is currently being revisited to capture levels ofdesegregation, notably in terms of Orphans and Vulnerable Children.
Niger is the only country where provisions have been made for consideration of different mothertongue languages within a country through the EC funded Souteba programme that has introducednew approaches regarding bilingual education.
Apart from the information given at indicators level below, the following extraction from the ECA audit inNamibia can provide some complementary information.
The ECA report noted that, on a general level, there are some difficulties in Namibia in reaching the mostdisadvantaged children (orphans, vulnerable children San children, children living in remote areas).Furthermore, regional statistics when available suggest that the provision of qualified teachers, textbooksand school facilities is most difficult in the poor areas.
The report also noted that available indicators are not sufficiently disaggregated to allow the assessmentof progress in the access to education and of achievements of learners from low-income households andfrom disadvantaged groups. According to the ECA auditors, this is a major flaw in the ETSIP monitoringand evaluation system as it lacks adequate information for a pro-poor policy and decision making. Theneed to develop disaggregated statistics to show access and achievement levels of learners from low-income households and disadvantaged groups, is highlighted in ETSIP. The Education MonitoringInformation System (EMIS) is currently being revisited to capture levels of disaggregation, notably interms of Orphans and Vulnerable Children.
3.5.4.1 I-441: Upgrading of school buildings and construction of additional classrooms inremote areas and I-442: Incentive schemes for teachers in remote and disadvantagedareas operational
No information is provided by the ECA reports regarding these indicators.
3.5.4.2 I-443: Provision made for consideration of different mother tongue languages within acountry
Niger is the only country where provisions have been made for consideration of different mother tonguelanguages within a country. Even if Niger is a multicultural country with ten different national languages,the education system remains traditionally in French language.
The Souteba programme aims at providing access to an adapted education to disadvantaged children inrural area, in particular by providing a bilingual education and practical extracurricular activities. Teachershave been trained in order to be able to teach in four different national languages. Textbooks have beencreated and published for pupils as well as guidelines for the teachers in four different national languages.An evaluation of the bilingual education provided by Souteba has shown that the results of pupils whobenefited from this bilingual education have improved but results are still mixed. This study indicates thatthe support from Souteba has been largely wasted in the dysfunctional education system of Niger. One ofthe strategic axes of the second phase of PDDE (2008-2010) is to diversify the offer in primary educationby developing the bilingual education.
Thematic global evaluation of European Commission support to the education sector in partner countries(Including basic and secondary education); Final Report Vol. IIb, December 2010; Particip GmbH
164
3.6 EQ5-skills: To what extent has EC support to education contributed toenhancing basic education skills, especially literacy and numeracy?
3.6.1 JC51: Literacy and numeracy enhanced
Summary of ECA findings related to JC51
The performances regarding literacy and numeracy rates differ a lot between the countries analysed,with for example an adult literacy rate of 28.7% (Burkina Faso) and 72.3% (Tanzania) in 2007. In mostof these countries, the both youth and adult literacy are among the key objectives of the governmentand the EC support, but results are not always matching targets.
The ECA audits only give little information regarding surveys on literacy, numeracy and life skills. Itshould however be noted that, according to ECA, the officialisation of the use of national languages inprimary education seems to be the most appropriate way to improve the quality of learning (literacyand numeracy) of pupils in Niger, and that the quality of educational learning is insufficient in BurkinaFaso.
The governments of Tanzania and Burkina Faso have set objectives regarding the Primary School-grade passing and school leaving examination results. While the MKUKUTA objective has not beenmet in Tanzania, it is not specified whether the objective has been met in Burkina Faso.
3.6.1.1 I-511: Literacy and numeracy ratesThe performances regarding literacy and numeracy rates differ a lot between the countries analysed. Inmost of these countries, the literacy constitutes one of the key objectives of the government and the ECsupport, but results are not always matching targets. The following information per country could bedistilled from the ECA reports:
In Burkina Faso, the achievements observed between 1997 and 2007 in terms of literacy are quitemodest. The literacy rate of adults over 15 years old increased from 18.4% in 1997 to 28.7% in2007.
In the framework of the Education component of the Budget Support for Poverty Reduction(ABRP 2005-2008) funded under the 9th EDF, significant progresses have been achievedregarding literacy. However the literacy rate of only 28.7% in 2007 is far from the objective set at39.1% in 2008. Even if a large gap between urban and rural areas remains, the literacy rate inrural zone has doubled during the last decade (from 10.8% to 19.5%) and according to the ECAreport, it is predictable that the gap with the urban area will decrease, thanks to the widespreadaccess to primary education in rural zone.
In Uganda, the ‘Competency and Literacy Levels in P6’ has been selected as one of the educationindicators for the 9th EDF GBS programme. Concerning the first variable tranche, the target wasvery comfortably achieved for the Competency Level for Literacy and Numeracy indicator (E3),31.5% being reported against a target of 25%. Neither the GoU nor the EC commented on howthis high level of performance was achieved. Regarding the second tranche, the outcome showeda very marginal improvement from 31.5% to 32% while no target was set for 2005-2006.
In Niger, the number of literate adults constitutes one of the indicators of the governmenteducation plan PDDE. The data available indicates that this number has almost trebled between2001/2002 and 2008/2009 with an increase from 10,917 to 30,485 adults.
In Tanzania, the adult literacy rate was 72.3% in 2007 according to UNESCO data, which is themost recent figure available in the ECA report. The universal literacy constitutes one of theobjectives defined by the government. The Tanzania Development Vision 202568 targets a highquality livelihood for all Tanzanians through the eradication of illiteracy among others. Universalliteracy among women and men is also one of the operational targets of National Strategy forGrowth and Reduction of Poverty (NSGRP)/ MKUKUTA.
In Liberia, positive development in youth and adult literacy rates has been noted between 1999and 2007 and youth literacy rate was at 73.1 % in 2007/2008, which is considered as relatively lowby the ECA report.
Namibia’s youth (15-24 years) literacy rate (93%) is largely at par with other countries in theregion, including South Africa (95.4%) and Botswana (94.1%)
Universal literacy constitutes one of the objectives of Namibia’s Vision 2030:
68 according to information provided on the home-page of the Ministry of Education and Vocational Training

Thematic global evaluation of European Commission support to the education sector in partner countries(Including basic and secondary education); Final Report Vol. IIb, December 2010; Particip GmbH
165
o The literacy education rates for adults which was 80% in 2001, is expected to increase to90% in 2015 and ultimately 100% by the year 2030.
o Achieving a 50% improvement in levels of adult literacy by 2015, especially for women,and equitable access to basic and continuing education for all adults.
3.6.1.2 I-512: Results from surveys on literacy, numeracy and life skills
The ECA audits only give little information regarding surveys on literacy, numeracy and life skills.Nevertheless, the following information on Niger and Burkina Faso could be extracted from the reports:
In Niger, the ECA noted that the officialisation of the use of national languages in primaryeducation seems to be the most appropriate way to improve the quality of learning of pupils, inparticular in terms of basic skills (literacy and numeracy) from the beginning of the learning cycle.
In Burkina Faso, the auditors noted the importance of analysing the qualitative aspects of literacy.According to the RESEN in Burkina Faso, the literacy probability for an adult between 22 and 44years old that have been to school during six years was only 45% in 2007, whereas the averagewas 68% in Africa. The ECA report concludes that this indicates the lack of quality of educationallearning.
3.6.1.3 I-513: Primary School-grade passing and school leaving examination results
The governments of Tanzania and Burkina Faso have set objectives regarding the Primary School-gradepassing and school leaving examination results:
In Tanzania, the Standard VII exam pass rate, i.e. the pass rate for primary leaving exam initiallyincreased from the baseline value 22% in 2000 to 54.2% in 2006/2007. However this pass ratedecreased to 52.7% in 2007/2008 and remains below the target set at 60% by the MKUKUTA.
The ECA audit noted that the overall improvement of pass rates in primary school may have to beseen in the light of a possible, gradual lowering of the pass criteria towards putting greateremphasis on Kiswahili and less on English and Mathematics.
In Burkina Faso, the Letter on Education Policy [“Lettre de Politique Educative”] of Burkina Fasofrom July 2008 has defined as one of the targets for basic education an increase from 60% to100% of the proportion of pupils in CM2 (i.e. last year of primary school) passing the CEP exam in2015. It is not specified whether this objective has been met or not.
3.6.2 JC52: Improved core learning achievements
Summary of ECA findings related to JC52
In Tanzania, Niger and Namibia, the pass rates for final examinations in mathematics, sciences and inthe main language at Lower/Upper Secondary and at School Leaving Examination levels are part ofthe objectives of the government and the EC support, but results have only reached and evenexceeded targets in Namibia.
There is only little information given in the ECA reports regarding surveys on mathematics andscience. Nevertheless, the low competence of learners and teachers, especially in mathematics andEnglish has been underlined in Namibia while the quality of learning has been assessed to havedecreased with the raise in the number of teachable children in Burkina Faso.
3.6.2.1 I-521: Pass rate for final examinations in mathematics, sciences and in the main language atLower/Upper Secondary at School Leaving Examination level
In some of the countries analysed, the pass rates for final examinations in mathematics, sciences and inthe main language at Lower/Upper Secondary and at School Leaving Examination levels are part of theobjectives of the government and the EC support, but results have only reached targets in Namibia. Thefollowing information per country could be highlighted from the ECA audits:
In Tanzania, despite the GoT’s efforts the performance of secondary school students in nationalexaminations is still modest as the low performance of pupils in sciences, mathematics andlanguages indicate. After an initial increase from the baseline value 25.8% in 2000 to 35.7% in2006/2007, the Division 1-III in Form four examinations pass rate has decreased to 26.7% in2007/2008, which is far below the target set at 70% by the MKUKUTA.
In Niger, the percentages of pupils in CM2 (i.e. last year of primary school) that have reached theexpected threshold levels in mathematics and French have both decreased between 2001/2002and 2007/2008, respectively from 33% to 28.2% and from 31% and 27,6%.

Thematic global evaluation of European Commission support to the education sector in partner countries(Including basic and secondary education); Final Report Vol. IIb, December 2010; Particip GmbH
166
The results at national exams and the learning levels in mathematics and French are part of theinternal efficiency indicators of the PPARP (2006-2008). The percentage of pupils that havereached the expected level in French and Mathematic has constantly decreased since thebeginning of the EC funded PPARP programme.
In Namibia, the ETSIP contains two key performance indicators related to core learningachievements in mathematics, science and English.
The percentages of learners achieving D or better in mathematics, science and English in grade12 are targeted to increase respectively from 32.7%, 38.4% and 31.1% to 54.7%, 59.3% and52.1% in 2011. The percentages have risen between 2006 and 2008 and were in 2008 above thetargets set except for English.
The percentages of learners achieving D or better in mathematics, science and English in gradeten are targeted to increase respectively from 36.2%, 38.3% and 45.4% to 54.7%, 58.6% and62.9% in 2011. The percentages have risen between 2006 and 2008 and were far above thetargets set in 2008.
3.6.2.2 I-522: Results from surveys on mathematics and science
There is only little information given in the ECA reports regarding surveys on mathematics and science.Nevertheless, the following information on Namibia and Burkina Faso could be noted from the reports:
In Namibia, the SACMEQ’s studies69 have shown generally low competence of learners andteachers, especially in mathematics and English, with many students leaving school without theminimum educational skills.
In Burkina Faso, the PASEC study published in 2009 on the educational learning in 2007 hasanalysed the real learning level of pupils in 5th year of Primary school and their knowledge inFrench and mathematics. The objective of the test was to obtain the proportion of pupils thatachieve at least 40% of good answers to a set of questions (percentage considered as a minimalthreshold of knowledge). In a previous PASEC study of 1997, this proportion was 60%, whereas itwas only 34.8% in 2007. The ECA report concludes that, even if a direct comparison cannot bedone, the quality of learning appears to have decreased while the number of teachable childrenincreased.
3.7 EQ6-delivery: To what extent has EC support to education helped inimproving education system service delivery and resourcing?
3.7.1 JC61: Sound pro-poor sector policy framework in place
Summary of ECA findings related to JC61
Although not always being explicit, the ECA reports show that the National Strategy for Growth andReduction of Poverty of Tanzania has set specific operational targets for ensuring equitable access toquality education and the Liberia 2008 Poverty Reduction Strategy (PRS) takes into considerationMDG2 that is related to education. When existing these pro poor strategies and measures arehowever not budgeted.
The European Court of Auditors (ECA) reports analysed only provides little specific information on thisJudgment Criterion and related indicators.
3.7.1.1 I-611: PRSP or comparable documents incorporate and budget pro-poor education strategiesand measures
Although not always being explicit about whether or not PRSP or comparable documentsincorporate and budget pro-poor education strategies and measures the ECA audits clearlyindicate for two countries that such strategies and measures exist: The Education and TrainingSector Development Programme in Tanzania reflects the GoT’s priorities and is a response to theneeds of the sector. It is considered as an essential part of the public sector reform agenda laiddown in the MKUKUTA – the National Strategy for Growth and Reduction of Poverty, which haveset specific operational targets for ensuring equitable access to quality education, and fit into theGoT’s plan for achieving the educational goals stated in its Development Vision 2025.
69 SACMEQ stands for Southern and Eastern Africa Consortium for Monitoring Education Quality. It is a network offifteen ministries with a coordination centre in Harare providing monitoring and evaluation of the quality of their basiceducation systems.
Thematic global evaluation of European Commission support to the education sector in partner countries(Including basic and secondary education); Final Report Vol. IIb, December 2010; Particip GmbH
167
The Liberia 2008 Poverty Reduction Strategy (PRS) (and before that an Interim Poverty ReductionStrategy) takes into consideration the MDGs, including MDG2, which is included in one of fourpriority “pillars” – Infrastructure and Basic Services. Even if the PRSP includes a pro poor strategyas one of its pillars, it does not incorporate it into its budget. The PRS states the following as theseven strategic objectives of the Government of Liberia in education for the 3-year lifetime of thedocument: i) Strengthen the curriculum, ii) Improve access to quality, safe, and hygienic schools,iii) Recruit and train qualified teachers, iv) Improve learning achievement and school completionrates, v) Strengthen the quality and accessibility of skills and vocational training, vi) Improve thequality and standard of tertiary education while carrying out a limited and phased expansion anddecentralization, vii) Strengthen the overall governance, management, and financial basis of thesystem.
3.7.1.2 I-612: Existence of a costed medium term strategic plan complementing education sector policyand I-613: Schemes to deploy teachers from places with over supply to locations with teachershortages (teacher rationalization and deployment)
No information is provided by the ECA reports regarding these indicators.
3.7.2 JC62: Resource allocations in line with education sector requirements
Summary of ECA findings related to JC62
As this is frequently the case in Sub-Saharan Africa, the ECA reports found that the share ofeducation expenditure in total government expenditure remains below the FTI benchmark of 20 % forall countries analysed, except Namibia. As regards the shares of Gross Domestic Product (GDP)allocated to education, Namibia is also the only country for which data is available which has reachedthe target of 6%. In terms of allocations to the different sub-sectors of education, Tanzania is the onlycountry analysed with available data, which has reached the FTI target of 50% share of budgetallocated to primary education. The existence of an Education Medium Term Expenditure Framework(MTEF) is mentioned for most of the countries analysed. However, the ECA reports do not mentionhow the EC support is making them operational.
3.7.2.1 I-621: Appropriate budgetary resources allocated to the education sector (evolution ofshare of GDP allocated to education, and of share of education in public budget)between 2000 and 2007
As this is frequently the case in Sub-Saharan Africa, the ECA reports found that the share of educationexpenditure in total government expenditure remains below the FTI benchmark of 20 % for all countriesanalysed, except Namibia:
The Government of Liberia (GoL) spends the lowest share of total government expenditure oneducation in comparison with the other countries for which data was available to ECA (i.e. allcountries analysed except Uganda). Even if the total government expenditure for education hasincreased from USD 7.3 million in 2004/2005 to USD 23.3 million in 2007/2008, which reflected ageneral increase in total government expenditure, the share of education in public budgetremained around 10-12 % between 2004/2005 and 2007/2008. It is to be noted that during thefinancial year 2006/2007 the funds provided by the EC constituted some 2% of the totalgovernment and all Development Partners (DPs) resources that went into the education sector.According to a 2008 education donor survey70, the EC contributed with the equivalent ofUSDonemillion (or some EUR 757,800) to the sector between 2004/2005 and 2007/2008 (in thefinancial year 2006/2007).
As for Niger, Burkina Faso and Tanzania figures for government expenditure on education arecloser to the FTI benchmark than those for Liberia: According to the ECA report, in 2009, theGovernment of Niger spent 19 % of its total government expenditure for education (18% in 2006,see World Bank Edstats71). During the 9th and 10th EDF, Niger has benefited from a GBS in whicheducation was integrated as a priority sector (together with health). The EU also supportedimplementation of vocational training and basic education (SOUTEBA). The Niger has beenincluded in 2003 to the Fast Track - EFA initiative (EFA - FTI).
o In Burkina Faso, the share of education expenditure in total government expenditureincreased from 15.9% in 2001 to 18% in 2006.
70 Public Expenditure Management and Financial Accountability Review (PEMFAR) 2008, Liberia, Poverty ReductionEconomic Management Sector Unit (PREM 4) Africa Region Report No. 43282-LR, June 200971 No figures available for 2000-2005.
Thematic global evaluation of European Commission support to the education sector in partner countries(Including basic and secondary education); Final Report Vol. IIb, December 2010; Particip GmbH
168
o In those two countries, according to ECA, most of the investments in the education sectorhave been used to improve access rather than quality. One of the main reasons for this iscertainly the high population growth of 3.1% per year, i.e. the fact that access demandsare considerable and have been prioritized, albeit possibly not explicitly. In Niger, 49.6 %of the population was under 15 years old in 2009. As a potential effect of populationgrowth on education, the estimated total number of children to educate in the primarycycle would increase from 2.3 million in 2005 to 2.9 million in 2015, which would requirethe creation of at least 15,000 classes and recruitment of as many teachers over theperiod. According to the ECA report, the low level of indicators related to the quality ofeducation, such as completion rate, gender gap, repetition rate, results at national examsand level in mathematics and French, can be explained by the inadequate financialresources invested in the quality component of the budget (11.7% of spending),ineffective management of human resources and the absence of a clear planningregarding teacher’s training. Financing efforts in the education sector have beenabsorbed by the population growth that was higher than expected (3.1% according toestimations of 2006 compared with 2.4% in 1996),. According to the ECA report, theactual population in 2006 was at least exceeding 600,000 people than forecasted(including 460,000 children of school age) and the quality of learning has decreasedwhile the number of children enrolled rose.
The Government of Tanzania (GoT) which is highly dependent on external aid also allocatesaround 18-19% of its total annual expenditure budget to education. In the recent years, theeducation sector’s share of the total government budget has remained rather stable neutral,varying between 18.8% in financial year 2006/2007 and 18.3% in 2009/2010.
Contrarily to these countries, between 2005 and 2007 the Government of the Republic of Namibia(GRN) spent around a quarter of its total annual expenditure on education. This proportion isconsiderable even when compared with other governments in the region, such as thegovernments of Botswana and South Africa, where respectively 21% and 17.4% of totalexpenditure went to education in 2007. However, in Namibia the proportion of the budget thatgoes to education has gradually decreased over the last years, from 26.5% in 2005/2006 to 23.7%in 2007/2008. The ECA reports do not indicate reasons for this tendency. Overall, the contributionof donors to the education budget is rather minimal for Namibia. In particular, the EC’s actualcontribution to the education sector budget support constituted 0.8% of the total governmentexpenditure on education in the financial year 2007/08.
As for the shares of Gross Domestic Product (GDP) allocated to education, Burkina Faso and Tanzaniaalso remain below the EFA target of 6%, but has been reached by Namibia (6.5% in 2008, according toUNESCO Institute for Statistics)). This indicator does not appear specifically for the other countries in theECA reports.
In Burkina Faso, this proportion has slightly increased from 2.46 % to 2.84 % between 2001 and2006 but remains far from the average of other countries in Sub-Saharan Africa (4%) and from thetarget of 6% set by the UNESCO. However, the share of public expenditures in education on GDPper capita amounted to 4.3% in 2006 and represented one of the highest after Ghana. With aschool life expectancy of 4.2 years, the financial resources in the education sector have beenlargely wasted in Burkina Faso, according to the RESEN72. This can be explained by theexpensive costs of primary education in the country, which are 50% higher than the average of allRESEN countries, and with the drop out and repeater rates which consume around 31% of theresources allocated in the education sector. It is also to be noted that 50% of the public resourcesin education goes to the most educated, whereas in French and English speaking Africancountries it was respectively 44 % and 33 % on average. The main EC interventions audited byECA are: i) the Poverty Reduction Budget Support Programme 2005-2008, which is a GeneralBudget Support amounting EUR 192.4 million, and ii) the MDG contract 2009-2014 amountingEUR 320.1 million with an education component of EUR 28.8 million.
In Tanzania, the share of GDP allocated to education also remained under the 6% target, even if ithas increased from 5.3% and 5.8% between 2006/2007 and 2008/2009.
As mentioned above, the GRN is strongly committed to support education and is the only countryanalysed by ECA which has reached the target set by the UNESCO, with a share of more than 6%of GDP spent in the education sector. Overall sustainability of current government financed
72 RESEN is a Country Status Report on a National Educational System [« Rapport d’État d’un système éducatifnational »]
Thematic global evaluation of European Commission support to the education sector in partner countries(Including basic and secondary education); Final Report Vol. IIb, December 2010; Particip GmbH
169
activities seems to be ensured. The number of students is not increasing dramatically (555,096 in2005 with 148,104 in secondary and 577,290 in 2008 with 163,879 in secondary) and the numberof schools has increased since 2001 only by 1.1 % (from 1,545 to 1,661). The number of teachershas increased from 19,304 in 2005 to 20,830 in 2008. As regards the EC support to the educationsector, it has been implemented through specific large scale projects under the 7th and the 8th
EDFs. Considering the limitations with such an approach, including concerns over sustainabilityand the GRN’s efforts in developing a sector strategy, the EC decided to to move towards SBS.
In terms of allocations to the different sub-sectors of education, the following can be distilled from theECA reports:
Tanzania is the only country analysed and for which data in the ECA reports was available, whichhas reached the FTI target regarding the 50% share of budget allocated to primary education.However, as shown by the Education Sector Performance Report (ESPR) 2008/2009, budgetallocations for primary education in 2008 are 13% lower than in 2004. Moreover, in 2008 thebudget share for secondary education had dropped from 14.9% in 2004 to only 10.4%. On theother hand, the budget for university education has doubled since 2004. With its 26.3% share ofthe total education budget in 2008 the share for university education has reached about 50% ofthe level of primary education budget. The government’s focus has mainly been on the MDG-related enrolment in primary school and, according to ECA, is likely to be one of the reasons whythe quality of education has been given a lower priority.
In Liberia, some 29% of total public spending on education in the financial year 2007/2008 wasspent on primary education, which is a considerably lower share than the 50 % benchmarkrecommended by FTI. The EC concluded the € 12 million financing agreement for ECSEL inOctober 2006 covering six result areas. Activities financed are deemed essential to improve bothaccess and quality of primary education, including procurement of school materials, building ofschools and teachers training. The ECA report further indicates that, largely due to the limitedinstitutional capacity of the GoL and the EC’s own capacity constraints, ECSEL was designed tobe managed through long-term Technical Assistance (TA).
In Niger, the budget affected to basic education has increased from 18.6 % in 1991 to 20.9 % in2007. Nevertheless this trend has been reversed and this share fell to 18.8 % in 2008 and 19% in2009.
In Uganda, the 9th EDF Financing agreement of PEAP highlights the general issue of reducedquality in primary and post-primary education as a priority area to be addressed. It also states thatattention will be paid to better targeting of public expenditure for secondary education to the poor.It does not state clearly how far the EC contribution of financial resources to the GoU budget isintended to lead to an increase in the national education budget to address some of thesepriorities (i.e. the general issue of reduced quality in primary and post-primary education and ofbetter targeting of public expenditure for secondary education to the poor). According to EAC, theFinancing agreement merely refers to the Medium-Term Expenditure Framework (MTEF)budgetary ceilings for education and notes that there will need to be a strong emphasis on costefficiency if priorities are to be met.
It is finally to be noted, that Uganda, Burkina Faso and Tanzania have signed MDG contracts.
3.7.2.2 I-622: Education MTEF or the like operational
No explicit information is provided by the ECA reports regarding the operationality of the MTEFs in thecountries studied. However, the existence of an Education Medium Term Expenditure Framework (MTEF)is mentioned for Namibia, Uganda, Burkina Faso, Tanzania and its creation has been planned in Niger.
3.7.3 JC63: Evidence of linkages between education sector reform and broader nationalreforms; decentralisation, civil service reform and public finance management reform
Summary of ECA findings related to JC63
In Liberia, a comprehensive Civil Service Reform Strategy (CSRS) launched in 2008 is underimplementation. Reforms have been carried out in recent years in the Financial Management Systemsin most of the countries analysed by ECA. In Namibia, the PFM system is deemed to be robust while itis still weak in the other countries considered by ECA
3.7.3.1 I-631: Decentralisation caters for education sector requirements
None of the ECA reports provides specific information on this indicator.

Thematic global evaluation of European Commission support to the education sector in partner countries(Including basic and secondary education); Final Report Vol. IIb, December 2010; Particip GmbH
170
3.7.3.2 I-632: Civil service reforms enables increase in teacher salaries or, awaiting suchreforms, incentive payments are granted for teachers in hardship posts
In Liberia, a comprehensive Civil Service Reform Strategy (CSRS) launched in 2008 is underimplementation. The other ECA reports do not provide any specific information regarding this indicator forthe other countries.
3.7.3.3 I-633: Financial Management System operational
Reforms have been carried out in recent years in the Financial Management Systems in most of thecountries analysed by ECA.
For Namibia, the PFM system is deemed to be robust and current practices seem to ensure thatthe Ministry of Education benefits directly from EC’s SBS PFM systems in the other countries arejudged by ECA as being still weak: In Namibia, several subsequent assessments and audits,including reports by the Office of the Auditor General, have verified the robustness of the PublicExpenditure Management (PEM)/Public Financial Management (PFM) system in general and ofthe education sector in particular. The GRN’s current practice of earmarking the funds from theESP budget support for the Ministry of Education ensures that EC’s focal sector educationbenefits directly from the support.
In Uganda, the Annual PFM Reports from 2009 produced by the EUD observed that the FinancialManagement and Accountability Programme (FINMAP) had not adequately addressed key PFMpriorities and that its impact had therefore been limited.
According to the ECA report, the available information suggests that PFM reform in Liberia is stillat an early stage and has not yet been formalised nor had any tangible effects on the MoE. The2008 PEMFAR (Public Expenditure Management and Public Accountability Review), concludedthat the overall PFM system was weak and a 2009 ROM report on the MoE stated that: “Littleprogress is expected in the reform of the MoE or in public finance management”.
Reforms are currently being implemented in the PFM systems in Niger and Burkina Faso. InBurkina Faso, the PEFA (Public Expenditure and Financial Accountability) assessment concludedthat some weaknesses were remaining in the PFM. It should however be noted that PEFA is ageneral assessment and does not include any specific remarks on the education sector. In Niger,the PIMAP programme (Programme intégré de modernisation de l’administration publique)adopted in 2007 constitutes a global framework towards 2015. An audit on public procurement(2003- 2004) has been realised with financial support from the EC.
Concerning the general state of PFM in Tanzania, the report on a 2006 joint pilot audit by ECAand the National Audit Offices of Finland and the UK pointed to a number of weaknesses in theGoT’s financial processes, including errors identified by the Controller & Auditor (CAG) General ofTanzania. It was estimated that these weaknesses amount to 7% of GoT spending. The audit wascarried out in June 2006 within the framework of the group for Harmonisation in Overseas AuditProcedures (HOAP), which comprises the external auditors of organisations which provide officialaid. While the National Audit Offices of Finland and the UK, on the basis of a joint audit, concludedthat “against the background of a developing country within acknowledged weaknesses [...] therewas sufficient evidence to support the financial discharge of PRBS grants made in 2004-05 in theirrespective donors’ accounts”, the ECA involvement in the pilot audit was not intended to producean audit opinion and it did not draw similar conclusions. The risk of official corruption washighlighted several times in the report.
3.7.4 JC64: Increased capacity for addressing education reform and management issues
Summary of ECA findings related to JC64
In most of the countries analysed, the EC support to education contains capacity building andinstitutional support to the national ministries and trainings for local staff. However, most of the timethe capacity building programmes planned have not been implemented (in Liberia, Burkina Faso andTanzania), mostly due to delays and tendering problems.
The best results seem to have been achieved in Uganda, where the ECA report concludes that theEC’s procurement capacity support building project has made a useful contribution to improvingprocurement practices. As well as helping the PPDA develop procurement guidelines anddocumentation for local authorities, it has also provided training and equipment to the local authoritiesthemselves.

Thematic global evaluation of European Commission support to the education sector in partner countries(Including basic and secondary education); Final Report Vol. IIb, December 2010; Particip GmbH
171
On the other end, In Liberia, the restructuring of the MoE originally foreseen within the framework ofthe EC Support to Education in Liberia (ECSEL) is deemed to be too sensitive for any progress to bemade. In Burkina Faso, the institutional support to the Ministry of Basic Education that had beenplanned has not been implemented because of the great number and complexity of eligible actionsand number of delays.
In Tanzania, an institution building component has been introduced to complement the EducationSector Reform Programme 2006-20010 (9th EDF) divided in three axes: (i) supporting thedevelopment of an effective Education Sector Management Information System, (ii) supporting thedevelopment of education NGOs capacity, and (iii) providing major education actors with specificexpertise in planning and budgetary process at central and local level. However, the technicalassistance provided to support planning, monitoring, the budgeting process and financial managementin the education sector was, according to ECA not realised due to tendering problems and theministry’s reluctance to ask for technical assistance.
In Namibia, the Institutional and Capacity Building Support Facility created to strengthen theinsufficient institutional capacity and lack of qualified staff in the MoE, has not been used strategicallyto create capacity in the MoE but it has mainly focused on the procurement of TA on an “ad hoc”basis. As a consequence TA (consultants) leaves with the “capacity” once the contracts are finished.Furthermore, the procurement of TA was subject to delays and/or faced lack of funds and MoEcapacity developments efforts are affected by high staff turnover, which has slowed downimplementation.
3.7.4.1 I-641: Increased competencies for performance measurement of education in a timelymanner, at relevant levels (e.g. at national statistical service and of central and sub-national planning unit staff on Education Management Information Systems - EMIS)
In most of the countries analysed, the EC support to education contains capacity building and institutionalsupport to the national ministries and trainings for local staff. However, the results appear to be mitigated,according to ECA. This is underpinned by the following ECA findings:
In Liberia, the restructuring of the MoE originally foreseen within the framework of the EC Supportto Education in Liberia (ECSEL) is deemed to be too sensitive for any progress to be made. Still,some activities have been completed, including the terms of reference for a Mandate andFunctions Review.
In Namibia, according to the ECA report, the insufficient institutional capacity and lack of qualifiedstaff in the MoE were identified as issues to be tackled and accordingly the ESP set up anInstitutional and Capacity Building Support Facility. This facility is devolved to the MoE which canmanage it and contract Technical Assistance (TA) under its own procedures. Nevertheless,according to various sources used by the ECA report, this facility has not been used strategicallyto create capacity in the MoE but it has mainly focused on the procurement of TA on an “ad hoc”basis. As a consequence TA (consultants) leaves with the “capacity” once the contracts arefinished. Procurement of TA was subject to delays and/or faced lack of funds, which meant thatsome key studies were not carried out or carried out later than originally foreseen. In addition,MoE capacity developments efforts are affected by high staff turnover and the transfer of keyministerial staff members which has slowed down implementation.
In Burkina Faso, the education system is considered as inefficient by the ECA audit. Even if it hasbeen announced since 2005, there is still no plan for the capacity building in budgetarymanagement and procurement for the Ministry of Basic Education (Ministère de l’Education et del’Enseignement de base - MEBA). Moreover, the institutional support to education foreseen in theframework of the 9th EDF has not been implemented. The eligible actions of the multiannual planfor MEBA capacity building funded by the EUD have not been implemented because of their greatnumber and complexity. The proposed actions of the study requested by the GBF (Government ofBurkina Faso) to ensure consistency with the decentralisation of the MEBA, have not beenimplemented neither. According to ECA, this can mainly be explained by the introduction, inJanuary 2009, of a technical committee responsible for developing a unique and multiannual planfor the capacity building of the MEBA. This plan had been announced in June 2005 is still underpreparation. Considering the delay in the identification studies and the low ownership of the resultsof these studies by the MEBA, ECA concludes that it was not possible to commit the allocatedamounts before the deadline and therefore, no institutional support to education could be providedwithin the framework of the 2005-2008 Poverty Reduction Budget Support (ABRP).
In Tanzania, an institution building component has been introduced to complement the EducationSector Reform Programme 2006-20010 (9th EDF). This institutional support is divided in three

Thematic global evaluation of European Commission support to the education sector in partner countries(Including basic and secondary education); Final Report Vol. IIb, December 2010; Particip GmbH
172
axes: (i) supporting the development of an effective Education Sector Management InformationSystem, (ii) supporting the development of education NGOs capacity, and (iii) providing majoreducation actors with specific expertise in planning and budgetary process at central and locallevel. Furthermore, the EC is supporting the strengthening of the monitoring systems within theeducation sector. The European Commission contributes € 1.5 million to the improvement of theEducation Sector Management Information System (ESMIS) through this grant agreement withUNESCO. A small contract with a Civil Society Network supports an umbrella organisation (TEN-MET) for the NSAs/CSOs active in the education sector. The technical assistance provided tosupport planning, monitoring, the budgeting process and financial management in the educationsector was, according to ECA not realised due to tendering problems and the ministry’s reluctanceto ask for technical assistance.
In Uganda, under the 9th EDF the GBS programme Financing Agreement foresaw capacitybuilding support in the area of procurement. Specifically, funding was foreseen to strengthen thecapacity of the Public Procurement and Disposal of Assets Authority (PPDA) and local authoritiesto comply with the new 2003 Procurement Law which became applicable for local authorities from2006. The project “Procurement: Support to PPDA” (€ 936,035 contracted) was intended toprovide training and equipment to assist local governments to establish independent procurementunits and to assist the PPDA to develop procurement standards and guidelines and introduceinformation systems for monitoring compliance. Given that public procurement, particularly at locallevel, is generally a high risk area, according to ECA, this was a relevant and timely intervention toinclude in the GBS programme. The funding from the 9th EDF GBS programme of the contract‘Technical Assistance to Government Planning, Monitoring and Evaluation Functions’ (cost: € twomillion) is also considered by ECA as very relevant to the GoU’s and EC’s prioritisation of value-for-money issues through its objective of strengthening the link between PEAP objectives, outputsand outcomes and the allocation of budget resources. Moreover, the EC has also financed fromthe 9th EDF GBS programme a district statistical capacity building programme (Statistics: Supportto UBOS amounting € 1.67 million). This focus on district level is seen by ECA as particularlyrelevant given the fact that the Uganda Bureau of Statistics (UBOS) at national level is relativelywell-developed whereas capacity at local government level is often insufficient to meet therequirements of the decentralisation process which took place in the mid-90s. The 9th EDF GBSprogramme also foresaw supplementary capacity building in the education and health sectorsthrough the funding of studies, evaluations and reviews. Under the 10th EDF the Commission is toprovide € three million to a basket- fund for financing technical assistance to support theimplementation of the GoU’s Financial Management and Accountability Programme (FINMAP), itsnational PFM reform programme (2006/7-2010/11).
The ECA report concludes that the EC’s procurement capacity support building project has madea useful contribution to improving procurement practices. As well as helping the PPDA developprocurement guidelines and documentation for local authorities, it has also provided training andequipment to the local authorities themselves.
3.7.4.2 I-642: Training on policy analysis for national and sub/national staff
None of the ECA reports provides specific information on this indicator.
3.8 EQ7-transparency: To what extent has EC support to education helpedstrengthening transparency and accountability of the management ofeducation service delivery?
3.8.1 JC71: Strengthened and operational institutional and procedural framework in theeducation sector related to transparency and accountability issues at national and sub-national level
Summary of ECA findings related to JC71: Strengthened and operational institutional andprocedural framework in the education sector related to transparency and accountability
issues at national and sub-national level
Although the ECA reports do not focus heavily on the institutional and procedural frameworks in theeducation sector on the partner government’s side, they do include some relevant information in thisregard where there is a clear interface between these frameworks and EC support to the educationsector.
Generally speaking, all the countries under scrutiny in this analysis struggle with issues related to
Thematic global evaluation of European Commission support to the education sector in partner countries(Including basic and secondary education); Final Report Vol. IIb, December 2010; Particip GmbH
173
corruption to some extent, increasing the importance of transparency and accountability. Thegovernments of these countries have apparently all made efforts to address related problems, but torather varying degrees and with varying commitment.
In terms of the roles and responsibilities defined between government stakeholders involved on issuesof accountability and transparency the information level in the ECA reports is too limited to allow forany conclusive judgment.
As five out of the six ECA reports analysed contain a sufficient level of relevant information, it appearsthat generally speaking, there are controlling systems (such as audits) in place at the macro-level, butthat control systems at the lower level within the education sector appear weak, or are simply notmentioned. Furthermore, while existing efforts and structures are discussed, little evidence ispresented on specific recent improvements.
In terms of the availability of annual reports of education sector budgets and expenditures, the onlyinformation retrieved from the ECA reports was for Namibia, where there are “Summary Report(s) ofthe Auditor-General on the Accounts of the GRN” which are published each year. But it remainsunclear what level of detail regarding expenditures is included, and with what delay these reports arepublished. For the other countries, while budgets are sometimes mentioned in terms of figures, it is notmade evident with which detail and frequency such budgets are reported and the extent to which thisinformation is publically available.
With regard to procurement systems, two reports (Liberia, Uganda) reveal that capacity building isongoing to improve these, while one report (Burkina Faso) mentioned a heightened risk in publicprocurement in the education sector. However, no information is available on the actual improvementsthat may or may not have taken place in terms of enhancing accountability and transparency throughimproved procurement systems, and thus lower incidences of mis-procurement in the educationsystem.
The only information on teacher absenteeism contained in the ECA reports is on figures from onespecific point in time. In other words, there is no presentation of any improvements that have takenplace. Instead, the problem of teacher absenteeism, ‘ghost teachers’ and the associated financiallosses are discussed for Burkina Faso, Tanzania and Uganda.
Considering all the information gleaned from the ECA reports on the operational institutional andprocedural framework in the education sector with regard to accountability and transparency, twogeneral findings emerge:
The countries under consideration appear to be making efforts to improve on the status quo byvarious measures;
There either are no substantial improvements mentioned in the ECA reports, or no suchimprovements actually have been witnessed.
Apart from the information provided below on the specific indicators for this judgment criterion, the ECAreports include other contextual and relevant information, as summarised in the following lines.
All of the countries analysed struggle with issues related to corruption, and in some cases, the ECAreports point this out clearly. In the case of Liberia, for example, the report highlights the existence of‘rampant corruption’, citing an identification fiche for budget support. The ranking of these countries,according to the 2009 Corruption Perception Index, is: Liberia - 97, Tanzania - 126, Burkina Faso - 79,Namibia – 56, Uganda - 130. This only affirms the importance of accountability and transparency issuesat the institutional level. Liberia is recognised by the ECA report to be struggling with transparency andaccountability, but efforts are being made by the government, and cited GAC reports are deemed to begenerally independent and robust and have uncovered fundamental governance problems in the MoE,including on the lack of internal control and the occurrence of ghost employees.
One of the aims of the Liberia 2008 PRS for education is to strengthen the overall governance,management, and financial basis of the system. And one of the priorities in the recent Education SectorPlan (February 2010) is ‘Monitoring for Quality Improvement and Accountability.’ As regards support toPFM reforms, the ECA report states that the EC contribution to IMF Technical assistance will allow for amore transparent, efficient and effective management of public resources.The EC went ahead in employing the general budget support modality under the 10th EDF despite the factthat Liberia did not meet all the eligibility criteria for budget support, since a comprehensive sector policywas not yet established and fiscal/financial management was deemed inadequate. Implementation(TAPS) and the other information provided with the financing proposal for the BSMS did not contain anyexplicit risk mitigation measures but implicitly made reference to the need to continue the support to theGeneral Audit Commission (GAC) as a fiduciary/PFM safeguard. The ECA report asserts that the

Thematic global evaluation of European Commission support to the education sector in partner countries(Including basic and secondary education); Final Report Vol. IIb, December 2010; Particip GmbH
174
Commission decision on the BSMS adopted in December 2009 did not primarily reflect a concern for theeffectiveness of the assistance provided to the social sectors, but broader political and developmentalconcerns.The ECA report for Namibia points out that the GRN is committed to the fight against official corruption,but that the prior does not appear to strongly affect the education sector. None of the cases reported bythe Anti-Corruption Commission (ACC) suggest that there are significant or systemic corruption practicesin the education sector. This is also confirmed by investigations by the Ministry of Education’s internalaudit unit and reports by the Office of the Namibian Auditor General. The PFM system is deemed to berobust and current practices ensure that the Ministry of Education benefits directly from the budgetsupport.
After the start of ESP, several subsequent assessments and audits, including reports by the Office of theAuditor General have verified the robustness of the Public Expenditure Management (PEM)/PublicFinancial Management (PFM) system in general and of the education sector in particular. In addition tothis, general assessments of the PFM system have been provided through the Joint Annual Reports. TheGRN’s current practice of earmarking the funds from the ESP budget support for the Ministry of Educationensures that the focal sector benefits directly from the support.
Furthermore, the Education and Training Sector Improvement Programme (ETSIP), which was adoptedby the GRN in 2006/2007, includes one strategic objective on issues of transparency and accountability,namely to ‘improve management accountability and system efficiency.’ But the report provides noinformation on the results (thus far) in relation to this objective.
The ECA report for Burkina Faso highlights the findings of a 2007 diagnostic PEFA report, the results ofwhich substantially supported the analysis of the ongoing PFM reforms. The diagnostic report reveals thatBurkina Faso is a forerunner among the francophone African countries, even if certain weaknesses inPFM persist. Unfortunately, the PEFA remains at a general level and does not provide specific remarkson the education sector. However, one of the conclusions of the PEFA 2007 is that (at least up until 2007)no procedure existed to stop the possibility of salaries being allocated to ‘ghost’ employees. This seemsto be particularly relevant in the education sector.
The ECA report for Tanzania cites several previous studies relevant to the subject matter, pointing to anumber of weaknesses in the GoT’s financial processes, including errors identified by the Controller &Auditor (CAG) General of Tanzania amounting to 7% of GoT spending. In the EC SBS FinancingProposal of 2006, the 2006 PEFA assessment(s) was the basis for the EC’s assessment of the state ofthe PFM and subsequently the credibility and relevance of the PFM reform programme. The ECA’s auditteam therefore took note of the fact that an assessment of the impact of the PEFA frameworkcommissioned by the PEFA secretariat found that there was limited government engagement in the PEFAassessment process; that the PEFA framework was seen as a DP exercise and that until 2007 the GoTwas “hardly aware” of the exercise. Moreover, the lack of government ownership of the PFM ReformProgramme was later highlighted in the CSP as the main reason for the lack of progress. Thisfundamentally questions the credibility of the PFM reform and, according to ECA, may have had anegative impact on the effectiveness of the Education SBS during its implementation 2006 to 2010. ThePETS 2009, covering both primary and secondary education highlighted the problem of “leakage” but witha different definition than the one used in the PETS 2004, which was never endorsed by the GoT.
The ECA report Uganda pays special attention to the issue of fiduciary risk. It points out that while the 9th
EDF Financing Proposal does not include an assessment of fiduciary risk, it does foresee a number ofspecific short-term safeguard measures which could reduce fiduciary risk:
A specific provision to allow for the possibility of organising an independent audit of expendituremade under the programme. However, as the amount foreseen for this purpose was only up to€ 100,000, this measure could have little impact on addressing areas of fiduciary risk.
The possibility was also foreseen of carrying out ‘a compliance test’ as part of the assessment ofprogress in the implementation of PFM reforms. No further details of what was envisaged interms of compliance testing were given.
In addition, it foresaw the use of technical assistance funds (€ 500,000) to finance reviews andexpenditure tracking studies as well as monitoring and evaluation activities in the health andeducation sectors.
The Poverty Reduction Strategy Credits managed by the World Bank and supported by other GBSdonors such as Germany, have also included as conditions prior actions to be taken to improve publicfinance management and hence reduce fiduciary risk. These include the introduction of anti-corruptionlegislation, procurement-related measures, several actions leading to the independence of the AuditorGeneral’s Office and various measures to strengthen financial and budgetary reporting. However, by their

Thematic global evaluation of European Commission support to the education sector in partner countries(Including basic and secondary education); Final Report Vol. IIb, December 2010; Particip GmbH
175
nature these actions and the capacity building measures foreseen can generally only start to have asignificant impact on reducing fiduciary risk in the medium term. Moreover, according to the ECA report,the EC did not demonstrate how it would address specific risks.
For the 10th EDF no such specific short-term safeguards were foreseen. In its April 2008 annual PFMperformance report, prepared at the time of the finalisation of the MDG Contract, the EUD concluded that‘the current quality of the national PFM system and its prospective ameliorations provide sufficientfiduciary guarantees to provide direct budget support’. However, it is unclear what timeframe would benecessary for the ‘prospective ameliorations’ to take effect in terms of improved PFM outcomes andhence sufficient fiduciary guarantees being achieved. As for the 9th EDF, according to ECA, there was nolink made between specific risks and policy actions and capacity building measures that would addressthem.
Despite the conclusion of the 2008 Annual PFM report concerning the sufficiency of fiduciary guarantees,in its January 2009 EAMR the EUD proposed a major new initiative to provide a strong and urgentresponse to the risk of corruption: “In view of the coming general elections in 2011, and given the risingcases of corruption, the Delegation envisages to devote up to a maximum of ten million euro (10% ofbudget support programmes) to reinforce control bodies in Uganda. This will represent a new activity notinitially envisaged in the current budget support programme.” This proposal was being considered by theEC at the time of the audit mission in the context of the 10th EDF mid- term review.
According to the ECA report, the EUD has also established closer links with OLAF to better addresscorruption issues. In addition, at the time of the ECA mission (October 2009) it was in the process ofappointing a new contract agent to specifically work on accountability and corruption issues and toimprove the coordination between the governance and economic sections of the EUD on this matter. Untilthis time corruption had been largely treated as a governance issue by the EUD which led to it givingcorruption less attention from a PFM perspective.
The EC has also been one of the leading donors in putting corruption higher up both the political andoperational agenda, as stated by ECA. Thus corruption is now being addressed in the context politicaldialogue with the President of Uganda, according to the Cotonou Agreement Article 8. The donor workinggroup on anti-corruption which came to be considered by donors not sufficiently effective has beenmerged with the PFM donor working group. Donors are also working together to examine theimplementation of recently developed OECD best practices on corruption aimed at organising ex-ante agraduated response to deteriorating trends in corruption.
3.8.1.1 I-711: Roles and responsibilities defined between government stakeholders involved onissues of accountability and transparency
Unfortunately, the ECA reports under scrutiny for this analysis did not provide much information on thespecific division of roles and responsibilities with regard to the various government stakeholders involved.Only the reports for Liberia and Tanzania contained relevant statements.
Liberia: As for Liberia, the ECA report pointed out that an Anti-Corruption Commission,Governance Reform Commission and a General Audit Commission (GAC) had been establishedby the government in 2008, 2005 and 2005 respectively.
Namibia: Rather than clearly presenting the distribution of roles and responsibilities, the reportpoints out that the MoE had five general performance targets, which also had an impact on thegovernment’s priorities and activities in the education sector. However, no further specification asto this ‘impact’ is made.
Tanzania: Generally speaking, the management of both primary and secondary education hasbeen decentralised and is now the responsibility of the Local Government Administrations(LGAs), which report to the Prime Minister Office – Regional Administration and LocalGovernment (PMO-RALG). There is a National Anti-Corruption Strategy and Action Plan(NACSAP) in place with a phase II set out for the period 2008-2011. Also, in accordance withexisting anti-corruption legislation a Prevention and Combating Corruption Bureau (PCCB) hasbeen established and resourced. While the PCCB provides publicly available statistics aboutongoing court cases concerning official corruption (including the cases linked to the EPA fraud),there are no up-to-date reports or other information available about corrupt practices in general,or linked to specific sectors (education included). Also, there are no regular, publicly availablereports on the progress made in implementing the NACSAP.
Given the limited information on this indicator, neither general trend(s) can be identified at the level of thisindicator based on the ECA reports alone nor can any contribution of EC be identified to observedchanges.

Thematic global evaluation of European Commission support to the education sector in partner countries(Including basic and secondary education); Final Report Vol. IIb, December 2010; Particip GmbH
176
3.8.1.2 I-712: Improved control systems in place and operational
The ECA reports include varying degrees of information on control systems within the countries and theeducation sector.
Liberia: The GoL aimed to tackle official corruption in general through a number of initiatives,including the Governance and Economic Management Assistance Programme (GEMAP) since2005 and the IMF funded Poverty Reduction and Growth Facility (PRGF) since 2008. Also, a draftPFM law has been submitted to the legislature for approval and anticorruption legislation hasbeen enacted, followed by the establishment of an Anti-corruption Commission. A 2009 audit bythe GAC of the Ministry of Education (for HIPC 2006-07) was highly critical of the Ministry and itsmanagement. The report highlights basic governance problems, including a lack of effectiveinternal controls and documentation for payments, irregularities in payroll (including theoccurrence of “ghost” employees), and limitations to the auditors’ access to information, whichlead the Auditor General to issue a disclaimer of opinion. Taking all this into consideration, Liberiaappears to have developed some institutions with the mandate of controlling accountability andtransparency. And while the GAC audit does well, by identifying key concerns and raising thempublically, it also reveals that ‘internal controls and documentation’ within the MoE are notsufficiently strong. Namibia: While the ECA report for Namibia does not clearly speak of controlmechanisms in relation to accountability and transparency, it does discuss the generalinformation / monitoring systems in place and points out weaknesses which surely have an effectin terms of accountability and transparency. For example, it is highlighted that progress reportsprovided by the Ministry of Education do not provide the information needed to monitor educationoutcomes and review meetings are still focussed on progress for prior actions and processes.Also, according to ECA, the different results frameworks for ETSIP and the ESP financingagreement do not allow for a strategic analysis of the education sector progress and theMinistry’s reporting on ETSIP is not aligned with the ESP framework. It was also found that theEMIS, which serves as a basis for GRN’s reporting, has in itself some shortcomings. Qualityassurance reviews of the progress reports, annual implementation support missions andprocurement audits, foreseen in the ETSIP financing agreement, have not been carried out.
Burkina Faso: The ECA report for Burkina Faso does not discuss existent control systems per se,but it does present the findings of an external audit in relation to the implementation of thePDDEB in 2007, which check the financial controls in place. The related report noted manyirregularities and included a large set of 132 recommendations concerning issues which neededto be addressed. Tanzania: While the PCCB provides publicly available statistics about ongoingcourt cases concerning official corruption (including the cases linked to the EPA fraud), there areno up-to-date reports or other information available about corrupt practices in general, or linked tospecific sectors (education included). Also, there are no regular, publicly available reports on theprogress made in implementing the NACSAP.
Uganda: The ECA report for Uganda points out that for its part, the GoU has increasingly come torecognise that unsatisfactory performance in recent years in service delivery, particularly in healthand education, can be linked to fiduciary as well as efficiency issues. As a result, it and thedonors have agreed to include a number of indicators aimed at addressing fiduciary issues in thenew Joint Assessment Framework (JAF)73. These include the number of unqualified auditopinions given by the Office of the Auditor General and action taken to follow up grand corruptioncases. Under the 10th EDF the EC is set to provide three million euro to a basket-fund forfinancing technical assistance to support the implementation of the GoU’s Financial Managementand Accountability Programme (FINMAP), its national PFM reform programme (2006/7-2010/11).As such the Commission’s support represents a relevant response to developing PFM capacityand the implementation mechanism allows a more coordinated donor approach than was thecase under the 9th EDF. Nevertheless, donors are concerned that the GoU has been fundingFINMAP activities without sufficient prioritisation of key areas. It is unclear from thedocumentation how the amount of Commission funding to be allocated for this purpose wasdecided upon. The three million euro represents a rather small percentage (1,7 %) compared withthe 175 million euro in financial transfers foreseen. As for the 9th EDF programme, it is not clearthat the Commission assessed what is the optimal balance between financial transfers andcapacity building to maximise the benefits of the GBS programme.
73 The Joint Assessment Framework (JAF) was created by the GoU for the three years 2008-9, 2009-10, 2010-2011and was signed at the time of the ECA mission in October 2009. The overarching objective of the JAF is‘improved value for money in service delivery through removal of barriers in Public Finance Management and PublicSector Management systems while reinforcing compliance with regulations and avoidance of leakages
Thematic global evaluation of European Commission support to the education sector in partner countries(Including basic and secondary education); Final Report Vol. IIb, December 2010; Particip GmbH
177
Niger: there are significant risks of corruption within the education sector. An audit of the commondonor’s Fund from June 2006, in the framework of PDDE financing, concluded that there arenumber of dysfunctioning in the management of the DP Funds related to PDDE. The principalresult was that € six millions had disappeared from the State accounts. An investigation has beencarried out, which lead to the impeachment of two former ministers of Education who will bejudged by the High Court of Justice. The sector support from DP has been suspended as soon asthey learned about this case, and the UE blocked the disbursement of its GBS. Budget supportshave started again after reimbursement of the misappropriated funds by the Government ofNiger. However, no deep institutional reform has been conducted at the level of the ministry.Number of irregularities and failures in public procurement are mentioned to be the cause of thismisappropriation of funds. In July 2006, the Government of Niger has created a Authority tocontrol Public Procurement (“Autorité de régulation des marchés publics- AMRP”) and aDirectorate-General of Public Procurement Control. In 2007, the AMRP has been carrying out anevaluation that has been controlled by international auditors. This audit confirms that significantprogress has been achieved in the implementation of reforms of Public Procurements since 2006.A Public Expenditure Tracking Survey (PETS) has been conducted by the World Bank forEducation and Health in 2008. This survey highlights the lack of systematic saving of information,the fact that a budget increase does not always result in an increase in expenditures and thatsome deficiencies have been detected in the provision of school fourniture. As five out of the sixECA reports analysed contain a sufficient level of relevant information, it appears that generallyspeaking, there are controlling systems (such as audits) in place at the macro-level, but thatcontrol systems at the lower level within the education sector appear weak, or are simply notmentioned. Furthermore, while existing efforts and structures are discussed, little evidence ispresented on specific recent improvements.
3.8.1.3 I-713: Education sector budgets including last years budget release and expenditurespublished for national level and sub-national levels (Forecast budgets of year n availableby December 31 of year n-1, and executed budget available by December 31 of year n+1)
Unfortunately, the ECA reports do not provide much information in relation to this indicator.
As for Namibia, it appears evident from the documentation discussed in the ECA report, that thereare "Summary Report(s) of the Auditor-General on the Accounts of the GRN for the FinancialYear(s) Ended 31 March 2006, 2007, 2008," indicating that education sector budgets arepublished each year.” But it remains unclear what level of detail regarding expenditures isincluded, and with what delay these reports are published.
3.8.1.4 I-714: Procurement system enhances accountability and transparency and thus lowerincidences of mis-procurement in the education system
The ECA reports do not provide much information on procurement systems, and even less in relation toprocurement and accountability or transparency.
As for Liberia, the only statement concerning procurement, is that "development of capacity ofprocurement to achieve mandated functions" is ongoing in the ECSEL.
Concerning Burkina Faso, the report pointed out that two WB evaluations highlighted certainheightened risks related to PFM and public procurement in the education sector, but the reportdid not further discuss these.
In the case of Uganda, a capacity building project (“Procurement: Support to PPDA,” 2006-2008) andthe selection of two indicators in the 9th EDF Financing Proposal linked to implementing theprovisions of the new 2003 Procurement Act can be considered to contribute to reducing fiduciaryrisk. Thus capacity building support was provided to the Public Procurement and DisposalsAuthority (PPDA) and the procurement sections of local authorities and indicators were chosenon the setting up of the Contract Committees and Procurement Disposal Units, two key structuresfor implementing the Procurement Act, and the transparent display of tender and contractinformation. As well as helping the PPDA develop procurement guidelines and documentation forlocal authorities it has also provided training and equipment to the local authorities themselves. Inaddition, it supported the PPDA in carrying out procurement compliance checks on 120procurement entities, approximately half the total number of such bodies. The PPDA is nowcontinuing this exercise itself, planning to carry out 36 such checks per annum.

Thematic global evaluation of European Commission support to the education sector in partner countries(Including basic and secondary education); Final Report Vol. IIb, December 2010; Particip GmbH
178
3.8.1.5 I-715: Reduction in teacher absenteeism
Again, the ECA reports do not include a lot of information on this Indicator.
In Burkina Faso, two studies reported that 14.1% of total teaching hours are covered by substituteteachers or are not covered by teachers, i.e. not held at all.
Concerning Tanzania, the ECA report states that the only available indicator of likely corruption inthe education sector is the occurrence of ghost-teachers shown by the PETS of 2009, whichsuggests that there is an opportunity for rent seeking by officials from different authorities willingto collude to ensure the release of funds to non-existing teachers. The PETS 2009 shows that13% of the teachers on the official payroll of a primary school were not actually working at theschool. This represents an estimated loss equivalent of USD 4.6 per student or USD 37.8 millionin total for mainland Tanzania. For secondary schools the average proportion of absent teachersin the sample was also some 13%.
In Uganda, a 2007 study revealed that about 20% of the wage bill – almost Ush 55 billion (€ 24.55million74) – is lost to teacher absenteeism each year and that only 18.2 % of teachers are teachingat any point in time. Low teacher attendance rates reflect poor school management, poorsupervision by Government and insufficient support to teachers. In addition, problems arise fromthe inefficient distribution of resources across the sector such as the inefficient distribution ofteachers within schools, within districts and between districts, the overemphasis of resources atupper primary and the political redirection of grants at district level.
3.8.2 JC72: Strengthened role and involvement of non state actors, civil society and localgovernment in education sector management processes
Summary of ECA findings related to JC72: Strengthened role and involvement of non stateactors, civil society and local government in education sector management processes
At a general level, the ECA reports seem to suggest that in Burkina Faso and Uganda, a vibrant civilsociety and NSAs participate in the education sector to a significant extent. In the other countries, theinvolvement appears to be less significant, even though, in most cases, the EC is supporting it throughsome funding or the inclusion of related activities/indicators in its various kinds of support to education.
While the report for Liberia mentions ‘improved targeting of decentralised needs’ in terms of education,the ECA reports do not include any information on whether and how school management is dealt within specific legislation related to decentralisation.
Furthermore, no information is available on the share of the education budget that is managed atdecentralised levels.
In terms of the representation of school stakeholders in school management and monitoring, the ECAreports show that efforts exist on the government side, illustrated in the creation of for a such as a“Board of Governors, Parents-Teachers Association” (Liberia), and mandatory school committees(Tanzania). However, in the case of Liberia, community involvement apparently remains low, and inthe other countries, no further information is presented that would suggest high levels of communityinvolvement in school management and monitoring.
All in all, the findings on this judgement criterion based on the ECA reports are very limited and whereavailable, mixed, which does not allow for any general trends to be identified with sufficient degrees ofevidence.
Apart from the information provided below on the specific indicators for this judgment criterion, the ECAreports include other relevant information, as summarised in the following lines.
Although no further details are provided, the ECA report for Liberia points out that the EUD participates inand monitoring of dialogue between the national authorities and other stakeholders with regard to theeducation sector – indicating that other stakeholders are involved in consultations in the sector at arelatively high level.
While the ECA report points out that four forums are established to maintain policy dialogue with theMinistry of Education (i) ECSEL steering committee chaired by the MoE; ii) Education Pool Fund (EPF)Steering committee chaired by the MoE; iii) Education Sector Steering committee chaired by the MoE,
74 Employing a conversion rate from June 2007, based on the European Commission website: InforEuro:http://ec.europa.eu/budget/inforeuro/index.cfm?Language=en

Thematic global evaluation of European Commission support to the education sector in partner countries(Including basic and secondary education); Final Report Vol. IIb, December 2010; Particip GmbH
179
and iv) the Education Donors meetings), it is not clear to what extent NSAs, civil society and localgovernment are included in these fora.
In terms of programming, the ECA report reveals that one of the Objectively Verifiable Indicators (OVI) forthe ECSEL project is “Comprehensive education sector policy developed reflecting cross-sectoral inputfrom a wide range of stakeholders, including Non-State Actors.” However, no information is provided onactual data related to this indicator.
The ECA report for Namibia speaks of "limited involvement of Non-State Actors.” Although nationalregulations allow full participation of Non-State Actors (NSAs) in policy dialogue, the involvement of NSAsin ETSIP has been limited in practice. It was also noted, that there had been limited involvement of NSAsin the implementation of ESP. However, according to the report, the 10th EDF programme foresees aspecific component on social accountability to enhance NSAs’ involvement in the Education sector.According to the ECA report for Burkina Faso, NSAs are heavily involved in policy dialogue as well as inthe implementation of government-financed activities. For example, they are part of the partnership foreducation (Cadre de partenariat pour l’éducation), and are involved in the field of literacy. Furthermore,some NSAs are financed through thematic budget lines for projects in the field of education (especiallynon formal education), which allows them to collect education-related data from other sources than theGBF.The ECA report for Tanzania mentions that the EC supports CSO engagement through a small contractwith a Civil Society Network supporting the NSAs/CSOs active in the education sector.
According to the relevant ECA report, Uganda has quite a well-developed civil society and the EC hasregular contact with Non-State Actors (NSAs), for example through its General Budget thematicprogramme for NSAs which is subject to regular monitoring visits by the EUD. However, neither analysiscarried out by civil society on poverty and budgetary issues nor information gathered at grass roots levelduring project monitoring visits is systematically collected and used by the EUD as an input to itsmonitoring of GBS-related issues. And the ECA report does not mention the extent to which the NSAs areinvolved in the education sector at large.
3.8.2.1 I-721: Issues of school management dealt with within decentralisation act
There is no information on this indicator contained in the ECA reports.
3.8.2.2 I-722: Share of education budget managed at the decentralised level
There is nearly no information on this indicator contained in the ECA reports.
While there is no explicit mention of the share of the education budget managed at thedecentralised level in the ECA report for Liberia, there is reference to one related goal of theECSEL project, namely to "Support the development of policy to create/ strengthen ofdecentralised education sector PFM and initial capacity building of decentralized actors."According to the report, this was planned for the ECSEL, but will require ECSEL extension toactually be implemented. Moreover, there is one Objectively Verifiable Indicator (OVI) related toeducation sector management and decentralisation in the ECSL project’s programming, namely,that "Education Planning is linked to strategic goals, annual and medium-term budgeting andimproved targeting of decentralised needs."
3.8.2.3 I-723: School stakeholders represented in school management and monitoring
There is only very little information on this indicator contained in the ECA reports.
As for Liberia, the ECA report mentions a study by the EC75, which noted that while the 2001Education law required the establishment of a Board of Governors, Parents-Teachers Associationand a School Management Committee, these provisions had largely still not been implementedby 2007. The study also found that the system put in place to manage the School Block Grant insupport of poor children’s access to primary education has “limited transparency and is usuallykept and utilised with limited community consultation, by school principles.” In light of this reality,one of the aims of the ECSEL project is to “solicit participation from community structures foreducational delivery.” This was planned, and according to the ECA report, is apparently “ongoingas a cross-cutting activity.”
75 Study on Governance Challenges for Education in Fragile Situations – Liberia Country Study, September 2009
Thematic global evaluation of European Commission support to the education sector in partner countries(Including basic and secondary education); Final Report Vol. IIb, December 2010; Particip GmbH
180
In Tanzania, the ECA report highlights that at the local level, mandatory school committees havebeen established to reinforce governance and accountability. But the report goes no further inelaborating on the actual functioning, or on the results of these committees, nor on ECcontribution.
3.8.2.4 I-724: Existence of public scrutiny mechanisms
As pertains to the existence of public scrutiny mechanisms, the ECA reports do not deliver a lot ofinformation.
In Uganda, the EC supported NSAs through the General Budget Line Non State Actor Programme in2007 and, to a lesser extent, 2008 which focused on strengthening the capacity of civil society to holdlocal government responsible for its use of financial resources (so-called ‘downward accountability’). Butunfortunately, the ECA report does not provide further detail on the results of these actions in terms ofincreasing the watchdog role of civil society in Uganda
As other parts of the ECA report reveal, several Public Expenditure Tracking Surveys (PETS) have beencarried out in Tanzania, including one in 2004 and another in 2009. In 2004 a Public ExpenditureTracking Survey (PETS) on the PEDP programme was carried out, but the results were not accepted orendorsed by the government. The main reason was a difference of opinion as to the definition of“leakage”. The survey compared budget allocations of schools with the actually amounts received. Thedifference was classified as leakage and amounted therefore to 48 percent. The information from thePETS did not really lead to institutional reforms. No major changes were made. A critical report by theformer EC education programme manager which pointed out the deficiencies of the school grant systemwas censored by the government and an NGO was banned from visiting schools from 2005 to 2008 sinceit had been critical of the GoT. The PETS carried out in 2009 covered not only primary but also secondaryschool budgets. It found that the main discrepancies between the budget allocated and the fundsreceived by the schools were due to the fact that the budget was not fully executed; that councils spentthe money themselves for the benefit of the schools (in kind contributions); on other education purposesor on entirely different sectors. The EC supported the role of civil society in Tanzania through a smallcontract with a Civil Society Network which supports the NSAs/CSOs active in the education sector. But itis not clear if these CSOs primarily work in the education sector themselves, or take on a watchdog role.
3.8.3 JC73: Strengthened staff competencies related to accountability issues
Summary of ECA findings related to JC73: Strengthened staff competencies related toaccountability issues
The ECA reports provide very little information in relation to the indicators linked to this judgmentcriterion.
Discussions of the outcomes of education sector support usually centre on enrolment rates and otherMDG-related indicators. There is no direct mention of any increased and strengthened accountancyand bookkeeping competencies within the education sector.
Several ECA reports include reference to joint studies and reviews, but the information is too thin topronounce a strong judgement on the frequency and level of information regarding the educationsector in these. However, for both Liberia and Namibia, it is clear that joint DP appraisals of theeducation sector policy were done.
The ECA reports also remain rather unclear regarding the extent to which there has been anestablishment and monitoring of Annual Work Plans and Budgets linked to education sector plans andeducation MTEF. In the case of Liberia, the establishments of such budgets is clearly foreseen, but itis not clear to what extent it has been implemented yet. And in the case of Niger, there appears to bean institutionalised monitoring system concerning basic education, but it is not clear if this is related toannual work plans and budgets, and those in turn to an education MTEF.
Once again, the findings on this judgement criterion based on the ECA reports are very limited andwhere available, present a mixed picture, which does not allow for any general trends to be identifiedwith sufficient degrees of evidence.
While this judgment criterion certainly is crucial in terms of measuring the ability of the government todeliver accountable and transparent education sector services, the ECA reports, which predominantlyfocus on EC programming, do not provide a lot of information with regard to it.

Thematic global evaluation of European Commission support to the education sector in partner countries(Including basic and secondary education); Final Report Vol. IIb, December 2010; Particip GmbH
181
3.8.3.1 I-731: Increased and strengthened accountancy and bookkeeping competencies atdifferent levels
There is nearly no information on this indicator contained in the ECA reports.
As for Namibia, the relevant report mentions a “lack of analytical capacity” at the Ministry ofEducation (MoE), which apparently prevents a systematic use of the available data to betterensure needs-based planning and budgeting. In addition, MoE capacity development efforts arereported to be affected by high staff turnover and the transfer of key ministerial staff memberswhich has slowed down implementation.
3.8.3.2 I-732: Joint sector reviews including budget reviews periodically taking place
The ECA reports do not provide much information on this indicator.
In Liberia, it is pointed out that the ESP 2010-2020 was subject to a joint DP appraisal in January2010. The ECA report also mentions that the EUD has participated actively and providedcomments to the ESP, drawing attention to relevant omissions, for instance on the streamlining ofHIV/Aids issues. However, there is no mention of joint sector or budget reviews in the report.
As for Namibia, the ECA report makes clear that the EUD provided comments on the draft ESP,and that a joint ESP appraisal report was produced at some later stage. Yet it is not clear if thisreport really was the result of a comprehensive joint process, or if it included substantial jointanalysis of budget issues. However, according the ECA report there are general assessments ofthe PFM system in the form of Joint Annual Reports.
It is therefore not evident from the reports if sufficient capacity would exist to implement such joint sectorreviews in the countries analysed by ECA.
3.8.3.3 I-733: Establishment and monitoring of Annual Work Plans and Budgets linked toeducation sector plans and education MTEF (if existing) by Ministry of Education
Again, there is very little information on this indicator contained in the ECA reports.
In Liberia, the OVIs of the ECSEL project include one which is relevant to this indicator, namelythat “Education Planning is linked to strategic goals, annual and medium-term budgeting andimproved targeting of decentralised needs.” And one of the activities of the ECSEL project thatapparently is ‘ongoing’, is the "Strengthening of education sector planning and budgetingfunctions and procedures to incorporate demand-side annual and medium-term recurrent andcapital investment planning against sector budgets.” And two further activities are linked with theabove, i.e. support to the MoE in the elaboration of a medium term policy, and a contribution tothe development of medium term strategic plans to include the formal and non formal systems.While all of these activities are apparently ‘ongoing’, there is no further information on relatedoutputs and outcomes achieved.
The ECA report for Niger points out that the area of basic education is the most advanced in termsof monitoring and evaluation in the country. Together with the operational strategy that has beenin place in this regard since 2003in the framework of the FTI, this sub sector of PDDE(“Programme décennal de l’éducation” from the Government 2003-2013) is based on a list ofprecise indicators and outputs on which data are available, and regularly evaluated jointly by theMoE and DPs. Since Primary Education is considered as a priority at national (PovertyReducation Strategy) and international (MDG-EFA), the Education component is focused onbasic education. The indicators from the performance matrix of the PDDE constitute a frameworkfor the support of donors in the education sector. However, the ECA report does not make clear ifthese M&E activities are linked to a specific sector plan or MTEF, nor does it provide informationon secondary education in this regard.
In Niger, in the framework of Budget Support for Poverty Reduction 2006-2008 - EducationComponent, for the payment of the variable tranche in 2006 the Education indicator E1 has beenoverriden for scheduling reasons and replaced by an operational action plan, linked to MTEF anddetailing the activities and measures to be taken over the 2005-2006 school year, validated bythe MoE and the DP during the joint review in September 2005.

Thematic global evaluation of European Commission support to the education sector in partner countries(Including basic and secondary education); Final Report Vol. IIb, December 2010; Particip GmbH
182
3.8.4 JC74: Degree to which EC support for education is promoting mutual accountability andpredictability with partner countries
Summary of ECA findings related to JC74: Degree to which EC support for education ispromoting mutual accountability and predictability with partner countries
Although the ECA reports do not provide a lot of information on the actual percentage of EC aiddisbursement to education released according to agreed schedules in annual or multi-yearframeworks, in two cases, ample discussion of budget releases in their relation to accountability andpredictability exists.
In the case of Namibia, the ECA report asserts that the model of variable tranche releases based onmeasurable outcome indicators was generally appropriate in terms of accountability, but that in theimplementation, it lead to complications and delays. In the case of Uganda, the authors of the reportsargue that the system of variable tranches reduced predictability of funding under the 9th EDF, but thatthis was justified in light of the need for accountability as well as predictability. Interestingly, in bothcountries, one of the reasons for delays in payments lay in a late submission of payment requests bythe respective government.
Under the 10th EDF, both Burkina Faso as well as Uganda are MDG contract countries. This meansthat funds are provided on a more predictable basis over the whole of the programming cycle, to thebenefit of the partner country in terms of budgetary planning.
In terms of alignment with the partner country’s fiscal cycle, only the ECA report for Uganda clearlypresented the situation, revealing how under the 10th EDF, such an alignment is assured andpredictability over the cycle of the three year MTEF is increased.
Despite the valuable finings on a few countries relating to indicators for this judgment criterion, there isnot sufficient evidence to point out any overarching trends based on ECA reports alone.
3.8.4.1 I-741: Percentage of EC aid disbursement to education released according to agreedschedules in annual or multi-year frameworks
While information on this indicator is not available for all countries, there plenty of relevant informationcan be summarised from the Namibia and Uganda ECA reports.
In Namibia, after the adoption of ETSIP, donors, including the EC, and GRN signed aMemorandum of Understanding (MoU), aligning their aid and priorities to ETSIP following theParis Declaration principles and establishing detailed joint procedures for disbursement andmonitoring. The DPs aimed at increasing accountability through a rider to the ETSIP, whichintroduced another element in the disbursement mechanism, namely the possibility of partialdisbursements based on achievement levels to trigger payments (100% if at least 80% of prioractions met, 50% if less than 80% but more than 50% of prior actions met, 0% if less than 50%met). The ECA report judges that this might be an appropriate system when results are assessedthrough agreed, quantifiable performance indicators but is more challenging to apply when theassessment of prior actions is based on judgment and therefore open to interpretation.
The ECA report recounts the process of the release of the 4th tranche to illustrate the abovepoints: EC HQs decided to pay 50% of the tranche contrary to the opinion of the EUD and theGRN. The reason was the different interpretation of the achievement of one out of the 20 prioractions. The assessment of the fulfilment of the 5th tranche conditions has also proved difficultwith delays of more than nine months from the submission of the request for the release of funds.Prior to the adoption of the rider, the lack of sufficient progress in implementation of theprogramme had also led to a partial release of only 50% of the 3rd tranche with the agreement ofEC HQs, EUD and SIDA who also contributes to the budget support operation. Furthermore, thedelay incurred by the GRN in presenting the request meant that SIDA could not pay itscontribution. As SIDA could not roll its contribution over to the following fiscal year, the GRN lostthis € 3.2 million contribution.
In Burkina Faso, the EC engaged itself through and MDG contract. According the ECA report, thevision of the EUD and that expressed in the headquarter-produced guidelines differ significantlyon several points. The EUD wanted to maintain a mode of variable tranche releases, since thissignificantly altered the dynamics of policy dialogue.
In Uganda, the ECA report points to the fact that the predictability of the 9th EDF programme wasa priori reduced by the fact that up to 50% of the programme was to be channelled throughvariable tranches where disbursement depended on the achievement of targets set for specificperformance indicators. According the ECA, this reflects the EC’s fully justified concern to ensure
Thematic global evaluation of European Commission support to the education sector in partner countries(Including basic and secondary education); Final Report Vol. IIb, December 2010; Particip GmbH
183
performance as well as predictability. However, according the ECA findings, the programmeidentification and formulation documents do not explain how the EC decided that the allocation of50% of funds to a fixed tranche and 50% of the funds to a variable tranche was the mostappropriate way to meet its predictability and performance objectives in Uganda.
While the fixed tranches were all paid (1st tranche: € 15 million, 2nd and 3rd tranches € 14.25million each), for the first variable tranche only 81% (€ 17,795 million) was disbursed and for thesecond tranche just 68 % (€ 14.83 million). This represented a shortfall of approximately 12.5 %of the total programme resources. According to the data presented in the ECA report, paymentswere made much later than the schedule set out in the Financing Agreement. However, thereason for this is primarily delays in the submission of payment requests by the GoU. This reflectsboth the GoU’s strong macroeconomic position with regard to reserves, which made it less urgentto obtain disbursements, and its weak staff capacity for preparing the analytical documentationnecessary to support disbursement requests. To the extent that delays have occurred on the ECside in assessing and processing payment requests, this has been primarily due to EC concernsover PFM performance, notably in the wake of the GFTAM corruption scandal and persistentproblems with the level of domestic arrears. Moreover, the lack of clear criteria on whatconstituted satisfactory progress on PFM made it more difficult for the EUD and Headquarters toarrive at a clear position on whether Uganda was meeting this eligibility criterion. Payment wasalso held back another two months following the arrest of the main opposition leader at the timeof the 2006 elections.
Uganda is one of only eight countries receiving GBS under the 10th EDF in the form of an MDGContract. The ECA report points out that the MDG Contract approach represents an importanteffort by the EC to improve the predictability of its GBS by committing the funding for the six yearperiod of the CSP. In addition, the predictability of funding under the 10th EDF compared with the9th EDF is also in principle increased because the fixed tranches are increased from 50% to 70%of the programme. However, according the ECA findings, the significance of the MDG Contract inpotentially improving the predictability of GBS should not be overstated for the following reasons:
o the CSP, while not proving such a binding commitment as for MDG Contracts,nevertheless sets out an indicative allocation for GBS for the same six year period;
o in Uganda the real risk of political governance issues in the build up to the 2011 electionsposes a potential threat to the country’s eligibility notwithstanding the existence of anMDG Contract;
o as available data shows, the predictability of funding is relatively high in Yearoneof theMDG Contract when 100% of the funding is to be disbursed through a fixed tranche. Itthen becomes a little less so in Years two and three when the annual performancetranche becomes applicable (11.5% of annual funding) and much less so for Years 4-6when the MDG-based tranche also becomes applicable and 48.4% of funds are thenforeseen to be disbursed through the variable tranche mechanism. In effect, from Yearfour the country is again in a position similar to the 9th EDF with a three year time horizonand approximately 50% of funding being channelled through variable tranches.
3.8.4.2 I-742: Alignment of EC programming and financial cycle to partner country’s fiscal cycle
Unfortunately, only one of the ECA reports clearly points to an alignment of EC programming with thepartner country’s fiscal cycle.
The ECA report for Uganda states that the EC provides projections of future GBS disbursementsover the three year MTEF period. Estimates are sent in October-November and then revisedtwice in the period leading up to the finalisation of the annual budget. This ensures that thefinancial resources from the EC’s GBS programmes are fully taken into account in the GoUbudget preparation process. Furthermore, the ECA report points out that the schedule ofdisbursements under the 10th EDF is set up to try to ensure that funds arrive in Uganda during thefirst quarter of the financial year to facilitate management of the funds by the GoU. Thisrepresents an improvement over the 9th EDF where planned disbursements were not specificallyplanned for the first quarter.

Thematic global evaluation of European Commission support to the education sector in partner countries(Including basic and secondary education); Final Report Vol. IIb, December 2010; Particip GmbH
184
3.9 EQ8-3Cs: To what extent and how has the EC contributed to improving co-ordination, complementarity and synergies with Member States and otherdonors in the education sector, in line with the Paris Declaration?
3.9.1 JC81: Donor co-ordination mechanisms are in place or being set up with the EC providingvalue added
Summary of ECA findings related to JC81Only little indications are given in the ECA report to what extent the EC programming documentsmake references to other donor policies. In Tanzania the donors’ policies have been taken intoaccount through the Joint Assistance Strategy, in Niger collaboration between the EUD to a EUMember State (MS) has occurred for a project dealing with capacity building in vocational trainingorganisations (FAFPCA).More information could be found in the ECA reports related to coordination instances and mechanismsduring the implementation of support.The most quoted mean of coordination in the education sector in the report are sector workinggroups. The EUD in Tanzania, Liberia, Niger and Uganda are member of one or more working groupgathering DPs (and the government). It can be highlighted that the EUD has held the chair of the DPWorking Group on the Education Sector in Tanzania (2005-2006). Rather little detail could be found inrelation to the detailed EC role in coordination instances e.g. in Education Sector Working Group,except in the Tanzania report.Another mean of coordination are joint reviews, that have been used in Tanzania, Niger, BurkinaFaso and in Namibia.A recurrent issue in the ECA report is the role of the EUD officer in charge of education. This officer ismentioned in the reports of Tanzania, Liberia and Uganda and is seen as having widely contributed tothe dialogue with DPs and the government. The ECA reports highlight that the absence of the officerfor a certain period in the Tanzania and Liberia has implied withdrawal of the EUD in educationcoordination meetings.It is also worth mentioning the use of joint performance matrix’ using education sector relatedindicators. These matrixes are quoted in the report of Niger and Uganda (the Joint AssessmentFramework, seeI822).For Namibia, the ECA report mentioned the “aide memoire” between the DPs and the governmentrelated to the tranche disbursement. As the final decisions of disbursement are taken in headquarters,previous donor coordination in the country can be affected by differing headquarters decision,according to the ECA report.
3.9.1.1 I-811: EC programming and programme documents refer to other donors’ policies,particularly that of Member States’
The following information could be found in the ECA report on whether EC programming and programmedocuments refer to other donors’ policies, particularly that of MS’:
Tanzania: The situation is particular in Tanzania, as the EC support is part of the joint assistancestrategy (JAS) between donors in Tanzania. This joint programming exercise aimed at reducingtransaction costs which occurs due to the pursuit of different individual DP strategies. The CSPaligns on the JAS and thus reflects all the planned DP support and committement’s to Tanzania,even if this means that the EC had to accept that its programming guidelines could not be strictlyapplied. According to the ECA report, the joint nature of the analysis supporting the JAS andhence the CSP has facilitated a high degree of coordination and harmonisation between the DP.
Niger: In July 2009 a support has been created to increase the offer in trainings for organisationdealing with the vocational training, such as the federation of craftsmen of Niger and hence buildcapacities, the ”Fonds d’appui à la formation professionnelle continue et à l’apprentissage”(FAFPCA ). The interest in this sector is increasing and the EUD explored the possibility, withinthe framework of the 10th EDF, to delegate the coordination to a Member State. Bilateraldiscussion concluded to give a € 22.9 million programme to the Government of Luxembourg forthe period 2009-2015.
3.9.1.2 I-812: Level of co-ordination and consultation (e.g. for education sector or in relation toeducation conditions for budget support, Member States consultations, or on TA and
Thematic global evaluation of European Commission support to the education sector in partner countries(Including basic and secondary education); Final Report Vol. IIb, December 2010; Particip GmbH
185
capacity building), and I-813: EC is or has been Chair of mechanisms such as EducationSector Working Groups
The following information could be found in the ECA reports. For countries: Co-ordination and consultative frameworks for education in countries with both
SBS and GBS with education related indicators Tanzania: In the framework of the Joint Assistance Strategy, the level of coordination during the
implementation of the support is quite high. The ECA report even concludes that the donorcoordination is qualified as ‘tight”.The annual joint sector reviews (JESR) take place and are attended by high level GoT officials,DPs and civil society organisations. As part of the review process, the trends in the allocations toeducation over time are assessed as well as the degree of improvement in the developmentprocess. The JESR which is only one discussion forum between the GoT and the DP has beenmade possible through intense policy dialogue. This is especially true for the education sector.During the 3-4 year period leading up to the adoption of the updated national Education andTraining Sector Development Programme (ESDP) 2008-2017 (and the CSP 2008-2013), the EUDwas an active and influential member of the education DP community. The EUD has held thechair of the DP Working Group on the Education Sector (Education DPG) in 2007. The EUDwas part of the ‘Education Troika’ involving the EUD, the GoT and other DPs in sector dialogue.The ECA report comes to the conclusion that during the chairmanship of the Education DPG, theEUD’s education programme officer had more influence on the GoT’s education policy, than theEUD would have had if the EC had just been one of the DPs supporting education through theEducation SBS.It is important to note the role that the education officer of the EUD had. According to the ECAreport, it was through the activities of EUD education programme officer within the EducationDPG and her interactions with GoT officials through the PEDP, the Joint Education SectorReviews (JESR) and an ESPD committee, that it was able to influence the GoT’s implementationand revisions of the ESDPs (including the most recent update of September 2007 for the period2008-2013).Nevertheless, it must be highlighted that since the former education programme officer left inSeptember 2008 the EUD had however not taken part in the meetings of the Education DPGwhich is considered to be the main vehicle for education policy dialogue with the GoT.
Uganda (SBS completed): The EUD participated regularly in the Education Donors Group whichmeets monthly and generally attended by 8-15 donor agency staff. The local agent in theeconomic and social affairs section has traditionally represented the EUD. Since her arrival inmid-2008, an expatriate contract agent has also participated in the meetings. Based on theminutes available, the EC’s contribution has been quite limited but it has increased in 2009 mainlybecause of its involvement in the work on health and education indicators for the JointAssessment Framework (JAF).Furthermore, the local agent for education has also attended the higher level Education SectorConsultative Committee, a joint GoU – donor group, which meets every 2-3 months withtypically approximately 40 people attending. According to the ECA report, the minutes availableshows that the EUD had had little input into this forum, partly reflecting the fact that education isnot a focal sector for the EC as well as the large number of persons present at these meetings.Hence, in comparison to the health sector, the EUD has been more committed to the educationdialogue.The EC support to Uganda is provided through GBS since 1991.In order to cope with the requirement of the Paris Declaration on harmonisation and alignmementwhich requires donors to first define common positions and then speak with one voice through alead donor, the EUD participates in policy/technical donor working groups with the donors and insimilar working group with the GoU.
Furthermore, the EUD participates in the PFM donor group. The group has committed itself tomeet on a regular monthly basis but no formal terms of reference have been established. Thereare 6-7 active members and the EUD appears to play quite a prominent role among them. FromApril 2005 to April 2006 this PFM group was chaired by the EUD. However, according to the ECAaudit, it is difficult fully assess the EUD’s participation in the group because only the minutes of 12meetings could be identified for the period 2005 up to August 2009. The EUD is represented by acontract agent who is an economist but has built up knowledge of PFM issues through working onPFM over a number of years in Uganda.

Thematic global evaluation of European Commission support to the education sector in partner countries(Including basic and secondary education); Final Report Vol. IIb, December 2010; Particip GmbH
186
The EUD also participates through the same contract agent in the donor- GoU Public ExpenditureManagement Committee (PEMCOM). This body meets quarterly and is chaired by the PermanentSecretary of the Ministry of Finance and is normally attended by about 40 persons, of whomapproximately half are from the donor side. PEMCOM also serves as the steering committee ofFINMAP. According to the ECA audit, comprehensive minutes are kept. Furthermore, the qualityof the dialogue during the meetings has been satisfactory although better preparation of themeetings would have allowed discussions to focus more on strategic issues. There has also beena lack of in-depth PFM expertise on the donor side which risks undermining their credibility in theeyes of the GoU and which can also hinder progress on PFM. It was a special mission by PFMspecialists from World Bank headquarters in July 2008 which led to a major breakthrough indealing with the PFM reform process in Uganda. The EUD participant in the PFM forum has alsoregularly attended the monthly meetings of the Donor Economist Group (DEG) which in particularplays an important role in engaging with the GoU on budgetary matters. The EUD has activelycontributed to the Group without assuming a leading role.
Co-ordination and consultative frameworks for education in countries with GBSwith education related indicators
Niger: Niger has signed the Declaration of Paris, but until March 2010, no coordination frameworkhas been implemented. The ECA rapport admits that there have been important improvements indifferent sectors, including in primary education.
When it comes to coordination, meetings are held almost every month under the chair of theUNDP and the World Bank. These meetings aim at aligning little by little the programme and thefinancial instrument on the priorities of the revised PRSP. Annual joint review missions (GoNand DPs) are held in the framework of the sectoral review of the Education Plan (PDDE76).
The primary education sub-sector is the sector in the country with the best monitoring andevaluation situation. Since 2003 in the framework of the FTI this subsector has a precise list ofindicators to monitor the results together with the MoE and the donors. Furthermore, theEducation Plan (PDDE) is being monitored by the indicators of the performance matrix whichhas been agreed between the GoN and the DPs actively involved in the education sector inNiger.
Burkina Faso: The EUD is member of different coordination instances between the GBF and theDP. These coordination mechanisms give room to debate at all levels (global but also sectorlevel), according to the ECA report.The EUD participate in the general framework of the organisation of budget support (“cadregénéral d’organisation des appuis budgétaires” (CGAB). This framework structures the relationbetween the DPs and the GBF for the implementation of its PRSP(CSLP77). The CGAB is madeof six sector and thematic committee and one is specifically on education issues. The DPs areobservers in this committee.Since 2002 the EUD is one of 13 DPs which support the implementation of the national EducationPlan (PDDEB78), in close coordination with the other DPs. In order to monitor the implementationof the annual action plans of the PDDEB, there is a tight calendar of coordination and discussionmeetings. To this end, the EUD participates in the joint review missions (for which there is a“aide-memoire conjoint” and in the meetings of DP and GBF which take place once in a trimesterand in the technical working groups, in particular the one on the issue of governance.Furthermore there are coordination mechanism and regular meetings of DPs working oneducation issues.Furthermore the sector support under the 9th EDF has been integrated in the dialogue,coordination and review mechanisms existing for the PPDEB. In 2010, nine DPs are supportingthe implementation of the PRSP (CSLP)79. Countries where SBS or other forms of sector support prevail or are being
launched Namibia: According to the ECA report there have been contradictions between the financing
agreement and the MoU regarding disbursement conditions which affected also thecoordination between donors: In accordance with the review mechanisms, GRN and donors
76 “Plan décennal de développement de l’éducation”77 “Cadre stratégique de lutte contre la pauvreté”78 “Plan décennal de développement de l’éducation de base”79 The African Development Bank, the World Bank, the EC, Germany, Denmark, France, the Netherlands, Swedenand Switzerland.

Thematic global evaluation of European Commission support to the education sector in partner countries(Including basic and secondary education); Final Report Vol. IIb, December 2010; Particip GmbH
187
assessed and agreed on the achievement of prior actions during the recurrent review meetings.Subsequently, an “aide memoire”, signed by the GRN and the EUD was issued and served as abasis for the GRN to ask for next disbursement and for donors to pay. The ECA report highlights,that this procedure, aiming at strengthening alignment and harmonisation of donors’ procedures,is at odds with the fact that the final decision on disbursements is taken in HQs. In the case ofNamibia for the fourth tranche EC HQs decided to release only 50%, whereas Spain paid its fullcontribution on the basis of the agreement in the “aide memoire”, thereby undermining thecredibility of the EC’s cooperation, according to the ECA report. Other (mainly individual projects):
Liberia (individual projects and GBS from 2009 on: Regular Education Donors Meetings,organized by UNICEF, allow DPs to share information about each other’s activities in the sector(e.g. the elaboration of a donor matrix). According to the ECA report the DPs have made acoordinated effort to assist the GoL in its application for Catalytic Fund support, for instancethrough the joint ESP appraisal and subsequent revisions in which the EUD took active part byproviding substantial comments to the ESP and the appraisal report.The absence of a EC officer/agent responsible for the support to the social and cultural sectorin the EUD between August 2007 and September 2008 was noted. Only from September 2008and following a general improvement in the staffing situation the EUD has again been a fullyactive partner in the DP community and taken part in key activities such as the appraisal of theESP. The EUD is attending the Education Donor Meetings.
3.9.2 JC82: Complementarity between the interventions of the EC, the EU Member States andother donor agencies active in the education sector
Summary of ECA findings related to JC82In five of the six reports, it can be read that intervention financed through EC support is incomplementarity with the policies of other donors. A particular close collaboration at the design andprogramming phase with Member States can be seen in Tanzania (in the framework of the JAS) andin Namibia with Swedish SIDA.At the stage of the CSP formulation the ECA analysis identifies coordination procedure for Tanzaniaand Namibia. In Burkina Faso, the different financing modalities and focal sectors (SBS/GBS for theEC and a pool funding for other donors) induce coordination problems.At the programming stage, the information in the ECA report differs. For Tanzania, it is clear that adiscussion and coordination on focal sectors and on the education sector level, cross-cutting issuesrelated education has taken place. In Liberia the ECA reports states the coordination process betweendonors for the programming of the ECSEL project. For Namibia, the ECA reports speaks ofcomplementarity to characterise the EU support to the education sector and the support of otherdonors, especially in the framework of the “Fond Commun d’Appui au PDDE”, to which the EC doesnot contribute. No education specific information could be found for Uganda, but the ECA audit showsthe considerable inputs of the EUD into the dialogue which led to the establishment of the new JointAssessment Framework (JAF) through its insistence on the importance of results indicators.The ECA report on Namibia reveals interesting information: donor coordination has increased but lostgradually significance. This is, according to the ECA report, due to the phasing out of support of manydonors.No information was available in the ECA report concerning the degree to which the EC hasestablished trust fund agreements with UN organisations, Development Banks and bilateralorganisations.
3.9.2.1 I-821: EC/EUD strategic planning documents identify gaps, discuss means of filling them,and identify action to minimise overlaps
As regards the identification and filling of gaps and actions to minimise overlaps in EC/EUD strategicplanning documents, the ECA report do not specifically detail even though the question is indirectlytackled due to the existence of JAS, JAR, and other joint programming which imply coordination atstrategic level (cf. I822).
3.9.2.2 I-822: Extent to which the EC programming process related to education is co-ordinatedwith other (EU) donors
At the stage of planning interventions, Tanzania, Liberia, Uganda, Niger and Namibia show somecoordinated programming processes. While in Tanzania the JAS oblige to align focal sectors andcrosscutting issues, in Uganda the EUD contributed to the Joint Assessment Strategy by insisting on the
Thematic global evaluation of European Commission support to the education sector in partner countries(Including basic and secondary education); Final Report Vol. IIb, December 2010; Particip GmbH
188
importance of results indicators. In Niger the SBS of the EC is complementary to other DPs’ support,especially with the support in the framework of the “Fond Commun d’Appui au PDDE”.
In Namibia, the EC closely collaborated with Swedish SIDA to prepare the financing agreement for theMedium Term Expenditure Framework 2003-2007 and to develop a sector coordination mechanism in theframework of the design of new strategic plans. Furthermore, the ECA audit in Namibia states that donorcoordination has improved but lost significance due to the phasing out of support. The followinginformation could be extracted from the ECA reports:
Tanzania: In Tanzania EC support is provided through the JAS. Hence the planning and design ofthe CSP is the result of a compromise between DPs.
As a result of the JAS, the CSP 2008-2013 does not include education as focal sector, albeit therecommendation of the CSE evaluation. Two of the main reasons80 were, according to the ECAreport, the agreement reached in the Division of Labour agreement between the locallyrepresented DPs and the explicit wish of certain EU Member States DPs. The CSP indicates thefollowing: “The need to ensure better mainstreaming of environment in aid cooperation andsecondly for a more structured approach to monitoring poverty impacts within the PRBSarchitecture, and strengthening of the public financial management reform process. (…) TheDivision of Labour (DoL) discussions conducted as part of the JAS have also informed thechoices made in this response”81.
According to the ECA analysis, the DoL exercise had no consequence for most of the donors,while for the EC, it meant withdrawing as an active donor from six out of 16 sectors. Since theadoption of the CSP 2008-2013, the Netherlands and Finland have withdrawn as active donorsfrom the education sector, leaving the sector with only two active EU Member State donors (UKand Sweden). At the same time, the DoL exercise consolidated the continued engagement of 14donors, including eight EU Member States, as providers of GBS.
The joint nature of the assistance strategy and programming has facilitated alignment andharmonisation among DPs beginning at the planning phase of the support. Crosscutting issuesrelevant for education such as exclusion of handicapped, orphan and vulnerable children andgender are addressed explicitly in the analysis for the education sector presented in the CSP. Inthe Joint Programming Document, which is an integral part of the CSP, the DPs state theircollective intention to support the integration of HIV/Aids into the school curriculum and findsolutions to reduce the impact of HIV/AIDS on trained teacher (plus a number of other issues)through the development and implementation of a strategic plan.
Liberia: According to the ECA report, “it is evident from the background information provided in theCSP 2008-2013 that the Delegation was an active DP and that it duly considered the activities ofother DPs in the preparation of the adoption of the CSP in December 2007”. Discussions with theGoL and the DPs on the sector priorities were carried out in the inception phase of ECSEL(March – April 2009) and in the first ECSEL steering committee meeting (June 2009).
Uganda: The ECA report reveals that the EUD has made considerable inputs into the dialoguewhich led to the establishment of the new Joint Assessment Framework (JAF) in October 2009.At a roundtable meeting held during the ECA audit mission with other budget support donors, thelatter commended the EUD for the contribution it had made to the dialogue on setting up the JAFthrough its insistence on the importance of results indicators. However, in the absence of minutesof meetings and other documentation such as ‘back-to-the-office’ reports and file notes, the ECAreport could not provide a clear assessment of the EC’s efficiency and effectiveness in theprocess.
Not specifically focused on the education sector, the ECA report states that the basket funds forfinancial technical assistance for the national PFM reform programme, to which the ECparticipates, is a mechanism that allows a more coordinated donor approach than it has been thecase under the 9th EDF.
Niger: On the level of the education sector, principles of coordination have been put into placewhich allows a high level of coordination between the Ministry of Education and the DPs,according to the ECA report. In June 2003, a partnership framework (‘cadre partnearial’) hasbeen established between the MoE and the DPs and lays down the basis of the collaboration and
80 Another reason was the restriction imposed by the principle of concentration which recommended to have only twofocal sectors.81 CSP 2008-2013, p. 60.

Thematic global evaluation of European Commission support to the education sector in partner countries(Including basic and secondary education); Final Report Vol. IIb, December 2010; Particip GmbH
189
the implementation of the partnership. Indeed, the education sector is the sector with most of DPsand in which the World Bank has a confirmed leading role since 2008.
Furthermore the ECA report states that the sector support for education of the EUD is incomplementarity with the support of the other DP in the sector. Especially it is coordinated withthe sector support in the framework of the “Fond Commun d’Appui au PDDE” (which is alsobeneficiary of the FTI funds).
But the ECA report states also that for the design of the CSP 2008-2013, no formal process hasexisted in order to implement the Paris Declaration. Hence, there has been since then an informaland continuous process to align the Poverty Reduction Strategy, the sector policies and thenational budget.
Namibia: During the formulation of the CSP 2002-2007, education was identified as a focal sector.Convinced by the potentially greater and more sustainable benefits for the education sector, theEC initiated and commissioned a scoping study that eventually provided a framework for jointdonor support to the sector. Finally, the EC’s main donor partner in the sector, SIDA, alsoopted for sector budget support.
However, in the course of implementing the ESP financing agreement, the GRN reached theconclusion that the existing strategies failed to take a comprehensive view of the sector and wasunlikely to ensure that the Vision 2030 objectives could be met. On this background the twoministries responsible developed a new 15-year plan, the ETSIP82 with technical support from theWorld Bank.
The ETSIP, which was launched by the government during the implementation of the originalfinancing agreement on ESP, was the product of a complete review of the sector carried out bythe GRN with the technical support of the World Bank (WB). While having closely followed thesedevelopments, the EC (DG Development) communicated to the WB in July 2004 its concern thatnew policies and strategies were being developed without sufficient coordination with the rest ofthe donor community in Namibia. While the WB did agree to sign a Memorandum ofUnderstanding (MoU) with the other donors in the sector, it continued to play a special role as theGRN’s closest advisor in the design of ETSIP. The minutes and the invitation to the ETSIPpledging conferences organised by the GRN in March 2005 and April 2006, imply that the ETSIPprogramme was presented to the donor community as a “fait accompli”, with the role of budgetsupport donors largely reduced to that of co-financiers. The EC was however given theopportunity to provide its input through a “joint appraisal” carried out in October 2006.
The EC and Swedish SIDA has cooperated very closely during the preparation of the financingagreement for the Medium Term Expenditure Framework 2003-2007 and a sectorcoordination mechanism in the framework of the design of new strategic plans of theMinistry of Higher Education, Training and Employment Creation and the Ministry of BasicEducation, Sports and Culture. As mentioned before, this process was finally dropped in order todevelop a new 15-year plan, the Education and Training Sector Improvement Programme(ETSIP). Its formulation process was mainly supported by the World Bank.
According to the ECA report “Donor coordination has improved but gradually lost significance”.The reasons are the following: EC’s coordination with the WB did not work efficiently during theformulation of ETSIP. This is in part due to the fact that the WB does not have a country officewhich may have contributed to limited cooperation between the WB and the EUD. Even whentechnical teams were in mission to Namibia, the WB did not always participate in the donor’scoordination meetings, nor did it share its terms of reference for missions or the results fromthem. After the adoption of ETSIP, donors, including the EUD, and GRN signed a Memorandumof Understanding (MoU) aligning their aid and priorities to ETSIP following the Paris Declarationprinciples, and establishing detailed joint procedures for disbursement and monitoring. This wasan important step forward towards closer donor and GRN coordination. However, the MoUconflicted with some essential dispositions of the EC’s ESP financing agreement. According tothe ESP financing agreement and the MoU, the WB had to take the technical leadership of theprogramme. While the WB eventually signed the MoU, it did not take the technical leadership as itsubsequently withdrew from ETSIP. As a consequence some essential monitoring provisionshave never been implemented.
Furthermore, the statement that donor coordination has lost significance is supported by the factthat many donors are phasing out their support. This has been the case for SIDA which originally
82 Education and Training Sector Improvement Programme

Thematic global evaluation of European Commission support to the education sector in partner countries(Including basic and secondary education); Final Report Vol. IIb, December 2010; Particip GmbH
190
entered in partnership with the EC for the financing of the ESP or for Netherlands which hadenvisaged similar partnership which never materialised. Today, only the EC and Spain arecurrently providing sector budget support to GRN, while other donors, including the USgovernment through its Millennium Challenge Account, provide traditional project support.
Burkina Faso: According to the ECA report, the reason to choose a sector support modality for theeducation sector (under the 9th EDF), was related to will to be in line with the principles of theParis Declaration Hence, the other donors provide their support through a basket fundingmechanism. The EC is in this point not harmonized with the support of other donor. Although thesector support provided by the EDF has been integrated in the coordination mechanisms existingbetween donors and the government, other DPs regret that the EC does not support the poolfunding “Fonds commun de soutien au développement de l’enseignement de base (CAST-FSDEB)”. According to the ECA report, the non-alignment of financing modalities will haveconsequences on the management of the sector support. Furthermore, the EC does not supportnon-formal education as it is also not included in the FTI-EFA initiative.
The different support modalities and sector covered causes problems of harmonisation, accordingto the ECA report.
In the framework of the 10th EDF, the SBS education is abolished to gives way to a GBS.According to the ECA analysis, there are several reasons to maintain the sector support, onebeing the engagement of other DPs to provide in the future sector support to the country.83
3.9.2.3 I-823: Degree to which the EC has established trust fund agreements with UNorganisations, Development Banks and bilateral organisations
No information could be yield from the ECA report concerning the degree to which the EC hasestablished trust fund agreements with UN organisations, Development Banks and bilateralorganisations.
3.9.3 JC83: Level of synergy between EC-supported trust funds and banks and EC support atcountry level
Summary of ECA findings related to JC83
Even though the ECA report states that the EC support in Niger is complementary to the educationsupport of the other DPs, the multitude of donors and financing mechanism seems to show a lack ofcoordination which results in a limited problem solving capacity.
3.9.3.1 I-831: Co-funding FTI and trust fund arrangements with development banks iscomplementary with other interventions funded by the EC
The following information could be found in the ECA reports on whether Co-funding FTI and trust fundarrangements with development banks is complementary with other interventions funded by the EC:
Niger: According to the ECA report the support to primary education is characterised by animportant number of DPs (15) and a diversity of financial instruments through which the sector issupported (e.g. GBS, SBS, pool funding like for the “Fond Commun d’Appui au PDDE” andprojects). This means a heavy workload for the MoE. Despite rationalisation efforts, the dialoguebetween the MoE and the DP and the dialogue between DP and DP only focalise on specificfinancial problems or actions. But the ECA report states also that the support to the educationsector of the EC is fully in complementarity with the support of other DPs in the sector andespecially with the SBS received in the framework of the Fond Commun d’Appui au PDDE, whichis also funded by the FTI.)
3.9.3.2 I-832: FTI’ and development banks’ programmes co-funded by EC in the education sectorare co-ordinated with other interventions funded by the EC (at country, or at regionallevel)
No information could be found in the ECA reports on whether FTI’ and development banks’ programmesco-funded by EC in the education sector are co-ordinated with other interventions funded by the EC.
83 Other reasons are: the persistence of an important deficit in the financing of primary education (even with the FTI-EFA contract and the difficulties of Burkina Faso to reach MDG education objectives.

Thematic global evaluation of European Commission support to the education sector in partner countries(Including basic and secondary education); Final Report Vol. IIb, December 2010; Particip GmbH
191
3.10 EQ9-modal: To what extent have the various aid modalities and fundingchannels and their combinations, in particular GBS/SBS/SSP/projects, beenappropriate and contributed to improving access to, equity and policy-basedresource allocation in education?
3.10.1 JC91: Improved analytical thoroughness in the selection and implementation process ofaid modalities and channels (e.g. discussion of alternatives)
Summary of ECA findings related to JC91
While the choice of aid modality in Tanzania, Liberia und Namibia have been applied according toprogramming guidelines and the Cotonou Agreement criteria, Burkina Faso and Niger benefit from anexceptional financial mechanism, that has not been justified by any comprehensive evaluation or anyassessment of PFM in the education sector, although there are significant risks in both countries. TheEC support to Uganda has been provided through GBS modality under the 9th and the 10th EDF.Under the 10th EDF, Uganda, Burkina Faso and Tanzania are the only countries analysed that havesigned an ‘MDG Contract’.
In Tanzania, the choice of SBS as aid modality was made largely in accordance with the programmingguidelines and the fulfillment of the Cotonou criteria for Budget Support, although the credibility of thePFM reform during the period that the Education SBS has been under implementation could bequestioned. The EC’s decision to sign an MDG-Contract was to a great extent driven by policypreferences for the budget support modality and the disbursement performance of previous GBSprogrammes in Tanzania.
In Liberia, the decision not to apply an SBS modality for the implementation of ECSEL in 2006 wasbased on an analysis in accordance with the programming guidelines, which established that Liberiadid not meet all the eligibility criteria for budget support, since a comprehensive sector policy was notyet established and fiscal/financial management was deemed inadequate. The EC decision on theBSMS adopted in 2009 did not primarily reflect a concern for the effectiveness of the assistanceprovided to the social sectors but broader political and developmental concerns. The assessment ofGoL’s eligibility was unusually fast-tracked, giving insufficient time to duly complete a financingagreement (with pertinent performance indicators for education). The application of GBS required anad hoc review of the CSP which was undertaken with reference to article 5(2) of the CotonouAgreement. As there was no emergency or acute humanitarian crisis in Liberia at the time, it is notevident that the application of article 5(2) was pertinent in this case. The submission of theamendment of the CSP and the BSMS decision to the EDF committee triggered negative reactionsfrom some Member States.
In Namibia, the sector budget support modality for the ESP was found to have been applied inaccordance with programming guidelines and the Cotonou Agreement criteria. The government’s PFMsystem is deemed to be robust and current practices ensure that the Ministry of Education benefitsdirectly from the budget support.
In Burkina Faso and Niger, the inclusion of a sector support to education in the mid-term review of the9th EDF was not the result of a request from the Governments and / or analysis of the EUD. It hasmainly been motivated by the existence of EFA-FTI funding and political commitment. The EC did notconduct any comprehensive assessment of whether the choice of sector support was appropriate noron management of public finances in the sector. The decision, not to longer use the sectoral supportand the potential benefits of general budget support compared to sector support for education havenot been justified in the documents of the 10th EDF programming.
In Uganda for the 9th EDF GBS programme (2004/2005 – 2006/2007), € 87 million was committed forfinancial transfers which represented approximately 35% of Uganda’s original CSP allocation.However, no explanation was given of how the amount allocated related to country needs and theexpected risks and rewards of the GBS intervention. For the 10th EDF GBS programme to beimplemented through the MDG Contract instrument covering six years, € 175 million was committed,which represented 40% of the CSP allocation, but the 2008-2013 CSP does not explain how theamount of the GBS resources was decided upon.
No information is explicitly provided by the ECA reports regarding the selection of channels and thepercentage of EC education aid that uses partner country procurement systems.

Thematic global evaluation of European Commission support to the education sector in partner countries(Including basic and secondary education); Final Report Vol. IIb, December 2010; Particip GmbH
192
3.10.1.1 I-911: Selection of aid modalities explicitly discussed and analysed in the formulationand negotiation of CSP/ education sector support
According to the ECA audits, the choice of aid modality in Tanzania, Liberia und Namibia have beenapplied according to programming guidelines and the Cotonou Agreement criteria.
In Burkina Faso and Niger, the EC has chosen an exceptional aid modality. The financial mechanismadopted is a sector allocations within the general budget support, that Burkina Faso and Niger are theonly countries to benefit from.
The long tradition of budget support to Uganda provided by DP, including the EC, reflects the country’sstrong economic growth and macroeconomic stability since the early 1990s.
Under the 10th EDF, Uganda, Burkina Faso and Tanzania are the only countries analysed that are part ofthe few countries selected by the EC to receive GBS through the new ‘MDG Contract’ instrument. Ashighlighted by the ECA audits, the MDG Contract approach represents an important effort by the EC toimprove the predictability of its GBS by committing the funding for the six year period of the CountryStrategy Paper.
In Tanzania, the CE based its choice of aid modality for the SBS under the 9th EDF, on a comprehensiveindependent evaluation of the support to the education sector under the 8th EDF and quality reviews atthe identification and formulation stages. The EC’s analysis of the education policy and the effectivenessof the previous education programme through basket funding supported the move to the SBS modality.
While the EC’s GBS interventions all have had performance indicators for education, these interventionswere not initiated in response to needs in the education sector. Therefore, the GBS modality used forPRBS03 was applied with reference to the relevant guidelines for GBS and not the programmingguidelines for education. Moreover, GBS is not mentioned as a possible sector aid modality in theprogramming guidelines for education.
The decision to apply the SBS modality under the 9th EDF was supported by analyses aimed atdemonstrating that the three Cotonou criteria for budget support had been fulfilled on the basis of adynamic interpretation. For Public Expenditure Management (PEM)/Public Financial Management (PFM)the EC considers that the overall eligibility conditions as set out in the Cotonou Agreement are metinsofar as the recipient country shows commitment to implement the necessary reforms for improving itspublic finance management, as agreed with the donors. In accordance with its own guidelines, the ECcould therefore conclude that GoT was eligible for budget support as it deemed that the GoT at the timehad in place (or under implementation) a credible and relevant programme to improve PFM.
The allocations to macro-economic support approved with the adoption of the CSP/NIP 2008-2013 was toa great extent the result of the political priority being given to increase aid disbursements and theaccompanying promotion of budget support as the preferred aid modality. Moreover, in the CSP the ECspecifically emphasised the disbursement record of the GBS/PRBS framework, where it was stated that14 DPs had supported this with almost € 500 million in 2006. On this basis the EC committed anindicative amount of € 305 million for GBS in the NIP and later went on to develop the proposal for the sixyear MDG-Contract. With the MDG-Contract now signed the EUD is in to the process of disbursing 55%of its entire 10th EDF allocation through a single contract.
During the year that passed between the departure of the former education programme officer and theannouncement of the ECA’s mission the EC did not have in place staff with clear instructions on how tomanage the move from a combined education SBS and GBS approach to a pure GBS (MDG- Contract)approach, while honouring the CSP commitment to pay close attention to the quality of the sectordialogue. Following the signing of the Memorandum of Understanding (MoU) with DFID, the monitoring ofthe sector dialogue is now delegated to DFID. The programming guidelines for education and theguidelines for GBSs and MDG- Contracts do not provide detailed guidance on how to maintain policydialogue in the social sector for which there are performance indicators.
In Liberia, the decision not to apply an SBS modality for the implementation of ECSEL in 2006 wasbased on an analysis in accordance with the programming guidelines, which established that Liberia didnot meet all the eligibility criteria for budget support, since a comprehensive sector policy was not yetestablished and fiscal/financial management was deemed inadequate. The option for the EC to contributethrough the Education Pooled Fund (EPF), which was already under discussion among the other DPs(mainly UNICEF and The Netherlands) and established in March 2007, was only briefly considered in the“Background Report” of July 2005, which was prepared to support the formulation of the ECSEL.Considering the analysis provided in this report pooled funding seem initially to have been rejected on the

Thematic global evaluation of European Commission support to the education sector in partner countries(Including basic and secondary education); Final Report Vol. IIb, December 2010; Particip GmbH
193
basis of the assumption that contributing to this would automatically mean releasing funds into the GoL’ssector budget (Ministry of Education) and hence be subject to the same fiduciary risks as would havebeen the case with SBS.
Reacting to the constraints of the ECSEL project and the concerns expressed by the MoE and other DPs,the EC announced in February 2009 its intention to channel funds into the EPF. However, it was notdeemed possible to successfully complete the necessary ex ante, “5 pillar audit” of the EPF and getapproval for the subsequent amendment of the financing conditions before the expiration of the D+3deadline (20 October 2009). The EUD therefore had to announce in April 2009 that it was unable tosupport the EPF.
The EC’s decision on Budget Support for Macroeconomic Stability (BSMS) from December 2009 was notprimarily motivated by a concern for the effectiveness of assistance to the social sectors (includingeducation) but broader political and developmental concerns, including the EC’s wish to support thePresident’s reform efforts. The GoL’s eligibility and the financial allocation for budget support weredecided on in an unusually fast-tracked manner on the basis of a report on a four day mission toMonrovia in February 2009 by three headquarters staff. The mission acknowledged that a PFM reformstrategy was not yet in place (although it was expected that such strategy would be developed) and that aPFM Act was still to be passed. It also concluded that while the only available in-depth assessment of thePFM system, the 2008 Public Expenditure Management and Financial Accountability Review (PEMFAR),concluded that the overall PFM system was weak, this was to be considered outdated due to the“dynamism in the PFM process in Liberia”. This conclusion is in contrast to the finding of a September2009 ROM report on the MoE, which states that: “Little progress is expected in the reform of the MoE orin public finance management”. The Technical and Administrative Provisions for Implementation (TAPS)and the other information provided with the financing proposal for the BSMS did not contain any explicitrisk mitigation measures but implicitly made reference to the need to continue the support to the GeneralAudit Commission (GAC) as a fiduciary/PFM safeguard.
While the available information suggests that PFM reform is still at an early stage and has not yet beenformalised nor had any tangible effects the MoE, the approach applied by the EC in this case, however,largely reflects the approach described in the EC’s recently developed guidelines on budget support infragile situations.
The fact that a Financing Agreement was still not completed more than two months after the EC decision,is one of the consequence of the fast- tracked preparations of the BSMS (from CSP amendment to ECdecision in ten months), which did not allow for a comprehensive identification and formulation phase(including due consideration of relevant performance indicators for education). The EUD’s discussions onthe indicators have to date not involved the MoE, which has so far limited the scope for substantialdiscussions on policy and the chances of selecting the most pertinent indicators. This however reflects adecision taken by the GoL.
The use of GBS (the BSMS) required an ad hoc review of the CSP, which was undertaken with referenceto article 5(2) of the Annex IV of the Cotonou Agreement. This article states that in “exceptionalcircumstances” referred to in the Cotonou Agreement’s provisions on “humanitarian emergencyassistance”, an ad hoc review can be carried out on the demand of either party. As CommissionerMichel’s letter to President Johnson Sirleaf of 20 February 2009 shows, the reason why the EC waswilling to consider providing budget support was not an emergency or an acute humanitarian crisis but theEC’s assessment of the GoL’s improved performance with regard to macroeconomic stability and PFMreform. Therefore it is not evident that the application of article 5(2) was pertinent is this case.
Finally, the Court’s auditors noted, that while the EDF committee approved the ad hoc review and thesubsequent amendment of the CSP, the request triggered negative reactions from a number of MemberStates. This was most evident in the case of Germany, which made its approval conditional on moreexplicit risk mitigating and adequate accompanying measures. It also complained that the EC’s approachto budget support in fragile situations had not been subject to consultations with the Member States. As aresult of the request from Member States the EC provided the EDF committee with a document on “Riskassessment and mitigating measures”.
According to the ECA audit, HQ staff helped ensure the consideration of policy commitments oneducation in the CSP 2008-2013, covering the 10th EDF, for instance through the iQSG (Inter-serviceQuality Support Group) review in July 2007. It is noteworthy that already at the review meeting HQ staffexpressed some concern that the level of ambition with the number of sub-sectors targeted couldendanger the strategy’s implementation if the EUD would not be able to increase its human resources inthe months to come. Comments from both the thematic and the geographical units of AIDCO inconnection with first QSG for ECSEL, funded from the 9th EDF, suggested that the analytical basis fordetermining the size of the financial allocation for the project (€ 12 million) was weak. The most relevant

Thematic global evaluation of European Commission support to the education sector in partner countries(Including basic and secondary education); Final Report Vol. IIb, December 2010; Particip GmbH
194
and critical issues were raised by HQ staff in connection with the iQSG review meeting on 16 July 2007.As documented in the minutes of the meeting, the review included a systematic check of details relatingto the diagnostics, the strategy, the NIP and the formal content of the document. Among the issues raisedwere the particular problems related to former child soldiers, donor coordination and the design ofperformance indicators (including the need for SMART indicators).
In Namibia, the sector budget support modality has been applied in accordance with programmingguidelines and the Cotonou Agreement criteria. Education was identified as a focal sector in the CSP2002-2007. Convinced by the potentially greater and more sustainable benefits for the education sector,the EC initiated and commissioned a scoping study that eventually provided a framework for joint donorsupport to the sector. GRN’s eligibility for budget support was assessed partly on the basis of the scopingstudy and an assessment mission by HQ staff. The study presented alternative funding modalities(including project funding) and hence informed the EC’s decision to apply the sector budget supportmodality. The application of the sector budget support aid modality in the ESP under the 9th EDF wasfound to be made in accordance with the programming guidelines and the criteria in the CotonouAgreement’s article 61.214. Finally, it should be added that the EC’s main donor partner in the sector,SIDA, also opted for sector budget support.
In Niger and Burkina Faso, the EC has chosen sector support as aid modality. The financial mechanismadopted consisted of a sector budget support to education integrated into the general budget support inthe form of three annual tranches of respectively € 7 million for Niger and € five million for Burkina Faso.The exceptional nature of this mechanism should be emphasised, as Burkina Faso and Niger are the onlycountries that have benefited from it yet.
As this sector support was linked to general budget support, the assessment of eligibility criteria for sectorsupport has been based on, mutatis mutandis, those for general budget support. Therefore, the EC didnot carry out any comprehensive evaluation to ensure that the choice of sector support was appropriate inthose countries. According to the guidelines on support to sector programmes84, the EC has not made anyassessment of PFM in the education sector, although there are significant risks in both countries.
In Burkina Faso, the sector budget support, amounting to € 15 million, covered the years 2006-2008 while the amount was calculated at the first request made by the GBF (Government ofBurkina Faso) at EFA-FTI in 2002 to cover the deficit financing of the basic education sector forthe years 2004 and 2005.
In Niger, the analysis of the implementation of reforms related to public finance management isbased on the results of PEMFAR adopted in 2005. A Public Expenditure and FinancialAccountability (PEFA) exercise was conducted at the end of 2008, but has never been officiallyvalidated by the Ministry of Finance. These reviews were made in the process of public financereform initiated by the Government of Niger. The PEMFAR has a global scope and does includeany specific remarks on the education sector. The achievement of a comprehensive MTEF wasone of the priorities resulting from PEMFAR, the action plan exists since 2005 but the terms ofreference are not finalised yet. The EUD had proposed to provide short term technical assistancein order to advise, on a participatory basis, on a rationalisation of the budget preparation process.However this plan has not been retained.
In those two countries, under the 10th EDF, the sector approach to education has been abandoned infavor of General Budget Support85. Although there are good reasons for maintaining the sector approach(e.g. the ultimate commitment of the DP to provide sector budget support, the persistence of a largefinancing gap for basic education despite the EFA-FTI contract and the difficulty of reaching the MDGEducation Targets etc.), the reasons for this abandonment have not been explained in the CountryStrategy Paper 2007-2013 or in any documents that have served as basis for it.
The potential benefits of GBS compared to the sector support for education have not been explicitlyclarified neither. In addition, the guidelines for education programming in the CSP state that where the ECprovides GBS, it can draw on its experience in this area to move towards sector budget support.
In Burkina Faso, the choice of budget support in form of an MDG contract follows a different logicthan a sector approach, but it is not in contradiction with it. The analysis of the implementation of
84 From July 200785 with an “Education” budget within the variable tranches of € 15 million, which is less than half of the budget of theprevious programme in Niger

Thematic global evaluation of European Commission support to the education sector in partner countries(Including basic and secondary education); Final Report Vol. IIb, December 2010; Particip GmbH
195
reforms related to public finance management developed under the MDG contract is particularlybased on the results of the diagnostic PEFA established in early 2007. This diagnose was made inthe process of fiscal reform initiated by the GBF. It shows that Burkina Faso is spearheading thefrancophone African countries although some weaknesses remain in the management of publicfinances. PEFA has a general scope and gives few remarks specific to the education sector.
As the mid-term review of the 10th EDF was delayed, it has not been reviewed by the auditteam. The external evaluation of the EPT sector support under the 9th EDF to be conductedafter the intervention (Q3 2008) has still not been implemented and therefore could notcontribute to any debate on education in the context of this review.
The ECA report noted that sector support has been integrated into the mechanisms forconsultation between the DP and the GBF. In accordance with the principles of ownershipand alignment of development assistance, the EC has chosen a sector budget supportalthough not aligned with the support of other DP (common basket). The lack ofharmonisation has been a problem. In addition, the sector support does not cover non formaleducation.
Niger has introduced in the PRS (Poverty Reduction Strategy) (2008-2012) a new strategic focusfor achieving the MDGs on the control of population growth, as well as the objectives andstrategies of the "National Policy on Gender" of October 2007. However, the CSP (2008-2013)does not mention these issues, neither in the diagnosis of the country nor in the selected responsestrategy. Despite the acknowledged impact of these policies in the overall development andeducation in particular, no intervention in these areas has been provided. The CSP only indicatesthe efforts in this context during the analysis of the PRS Niger indicating that they "have not so farled to tangible results."
The long tradition of budget support to Uganda provided by DP, including the EC, reflects the country’sstrong economic growth and macroeconomic stability since the early 1990s. The PEAP came to be usedby the World Bank as a model for other countries to draw up poverty reduction strategy papers andUganda became the first country to benefit from the Heavily Indebted Poor Country Initiative (HIPC).Poverty levels fell from 56% in 1992 to 31% in 2006. Nevertheless, there has been increasing concernover political governance, serious levels of corruption, and limited progress towards the MDGs with majorissues in the efficiency and effectiveness of service delivery.
Uganda has been receiving budget support from the EC since 1991 when the first of five ‘PovertyAlleviation Budget Support’ (PABS) programmes was launched. These programmes continued up untilthe 10th EDF when Uganda was one of the countries selected by the EC to receive GBS through the new‘MDG Contract’ instrument. For the 9th EDF (PABS V) € 87 million (35% of the Country Strategy Paper(CSP)) was allocated to GBS and for the 10th EDF GBS € 175 million (40% of the CSP). For both the 9th
EDF and 10th EDF, General Budget Support has been used in Uganda as a third main channel of EDFsupport in addition to the two selected focal sectors of transport (approximately 40% of allocations) andrural development (approximately 15% of allocations).
As regards the 9th EDF GBS programme (2004/2005 – 2006/2007), € 87 million was committed forfinancial transfers which represented approximately 35% of Uganda’s original CSP allocation. The onlyexplanation found for how the amount of 9th EDF resources to be channeled through GBS wasdetermined is in Annex 1 of the 2002-2006 CSP which states that: “given the positive impact of the ECcontribution to macroeconomic support, future participation of this nature would be in line with the currentcontribution of about € 24.5 million per year.” The view that previous GBS had a positive impact couldalso have been a reason to increase rather than just maintain allocations. No explanation was given ofhow the amount allocated related to country needs and the expected risks and rewards of the GBSintervention.
For the 10th EDF GBS programme, to be implemented through the MDG Contract instrument covering sixyears, € 175 million was committed out of a CSP allocation of € 439 million (40%). The 2008-2013 CSPdoes not explain how the amount of the GBS resources was decided upon. Although the CSP refers tothe EC’s strategy to increase the level of GBS support, the annual allocations for the MDG Contractremained at approximately the same level as for the PABS V programme (€ 30 million per annum).
Uganda is one of the few countries receiving GBS under the 10th EDF in the form of an MDG Contract.The MDG Contract approach represents an important effort by the EC to improve the predictability of itsGBS by committing the funding for the six year period of the Country Strategy Paper. In addition, thepredictability of funding under the 10th EDF compared with the 9th EDF is also in principle increasedbecause the fixed tranches are increased from 50% to 70% of the programme.

Thematic global evaluation of European Commission support to the education sector in partner countries(Including basic and secondary education); Final Report Vol. IIb, December 2010; Particip GmbH
196
However, the significance of the MDG Contract in potentially improving the predictability of GBS shouldnot be overstated for the following reasons:
the Country Strategy Paper, while not proving such a binding commitment as for MDG Contracts,nevertheless sets out an indicative allocation for GBS for the same six year period;
in Uganda the real risk of political governance issues in the build up to the 2011 elections poses apotential threat to the country’s eligibility notwithstanding the existence of an MDG Contract;
the predictability of funding is relatively high in Yearoneof the MDG Contract when 100% of thefunding is to be disbursed through a fixed tranche. It then becomes a little less so in Years twoand three when the annual performance tranche becomes applicable (11.5% of annual funding)and much less so for Years 4-6 when the MDG-based tranche also becomes applicable and48.4% of funds are then foreseen to be disbursed through the variable tranche mechanism. Ineffect, from Year four the country is again in a position similar to the 9th EDF with a three year timehorizon and approximately 50% of funding being channeled through variable tranches.
On the other hand, as underlined in the Identification Fiche, when the 40% of the CSP allocated to GBS iscombined with the 12.5% allocated to Sector Budget Support, the EC achieves the Paris Declarationtarget of putting more than 50% of its assistance through country systems. The policy of increasing theproportion of assistance going through country systems is therefore one element explaining the amount ofthe allocation.
The Action Fiche sheds no light on how the amount of GBS was determined. However, the followingfactors were identified during the audit:
in the oQSG2 meeting, the EUD stated that the amount had been decided upon based on theassumption that the amount should be at the same level as past programmes;
in the same meeting AIDCO C1 expressed the view that not enough funding had beenprogrammed in the CSP for GBS;
in its written reply to a question by the audit mission team on this subject, the EUD noted that theamount allocated was also influenced by:
o a needs assessment taking into account on the one hand projected large increase indemand for public services due to high population growth and on the other handexpected increased revenues from new oil resources, private capital inflows and overalleconomic growth;
o a conservative approach based on the EC’s concerns about how far value for money wasbeing achieved from budgetary expenditure in the social sectors. At the same time thepercentage increased from the 9th to the 10th EDF because of the EC’s overall policy ofincreasing the proportion of funding going through budget support;
o the level of other donor funding.
3.10.1.2 I-912: Selection of channels explicitly discussed and analysed in the formulation andnegotiation of CSP and reflected upon by government / EUD
3.10.1.3 I-913: Percentage of EC education aid that uses partner country procurement systems
No information is provided by the ECA reports regarding these indicators.

Thematic global evaluation of European Commission support to the education sector in partner countries(Including basic and secondary education); Final Report Vol. IIb, December 2010; Particip GmbH
197
3.10.2 JC92: Contribution of EC GBS and SBS to policy based resource allocations and pro-poorobjectives in the education sector
Summary of ECA findings related to JC92
In Uganda, the 9th EDF GBS programme contains four education indicators which correspond topriority areas for the EC and are directly linked to MDGs, except E4.
In Niger and in Burkina Faso, the cooperation strategy of the EU fits into the Poverty ReductionStrategies of the countries, mainly via Budget Support. Budget support is monitored by theimplementation of a matrix of performance indicators. The indicators used for the 9th EDF constitute agood basis for the monitoring of the basic education sector in terms of access but are inadequate forthe monitoring the quality of education and reduction of disparities. Under the 10th EDF, the number ofindicators is insufficient to ensure disbursement linked to progress in the sector, which should becompensate that through dialogue on the basis of indicators from sector plans. Nevertheless, the EChas no specific guidelines regarding the scope of sectoral dialogue in General Budget Support.
The ECA reports are explicitly analysing the EUD’s participation in education policy dialogue inTanzania, Liberia, Uganda, Namibia and Burkina Faso. However the reports do not give furtherinformation on whether this dialogue incorporates financing, accountability and capacity developmentmeasures.
There is only little information provided by the ECA reports on the contribution of the EC GBS and SBS topolicy based resource allocations and pro-poor objectives in the education sector.
However, the ECA audit noted that in Uganda, despite the poverty reduction objective and the inequalitiesin Uganda between different regions, between urban and rural areas and between social groups, thehealth and education indicators are general and do not focus on poorer regions, rural areas or socialgroups. The education indicators did, however, include gender desegregation.
3.10.2.1 I-921: The release of both fixed and flexible tranches of General Budget Support hasbeen linked to education development targets
In Uganda, the 9th EDF GBS programme contains four education indicators which are generally relevant,according to the ECA audit. While E1, E2 and E3 correspond to priority areas for the EC, E4 is notdirectly linked to MDGs.
In Niger and in Burkina Faso, the cooperation strategy of the EU fits into the Poverty Reduction Strategiesof the countries, mainly via Budget Support. Budget support is monitored by the implementation of amatrix of performance indicators. While these indicators appear sufficient for a quantitative monitoring ofthe sector in terms of access and reduction of gender disparities, they are insufficient to monitor thequality of education and the reduction of regional and social disparities.
In Uganda, the € 87 million programme was divided 50%-50% between fixed and variable tranches and€ 1.975 million was to be paid for the achievement of the annual target set for each of the elevenperformance indicators. There is no analysis in the financing documentation of how far this amount wouldbe likely to have an incentive effect on the national authorities and no analysis of how the paymentamount for each target compared with the increased budgetary resources needed to achieve that target.It is open to question how far there was an incentive effect for the health and education ministries sincethere was no direct link between the variable tranche disbursements and the budget allocations of theseministries. As the EC GBS programme operated separately from the main PRSC budget supportprogramme led by the World Bank and to which the other budget support donors associated themselves,no other donor funds were directly linked to the achievement of the indicator targets, which would haveincreased their incentive effect for the Government.
As regards Education Sector Indicators, the 9th EDF GBS programme contains an annex on performanceindicators which for the four education indicators briefly explains the purpose of the indicator, thereliability of the data, how the data is to be verified, what is the public access to the data, the importanceof the indicator in terms of domestic accountability and how the evaluation of whether targets have beenmet will be carried out. It does not adequately explain the link between indicators and the nationaleducation policy and assess how far and how quickly the indicators are responsive to policy changes.
According to the ECA audit, the indicators selected for education are generally relevant. Two of theindicators, E2 “Completion Rate P7” and E3 – “Competency and Literacy Levels in P6” address qualityissues which are highlighted in the Financing Proposal as being very problematic in Uganda and areareas which the EC wishes to prioritise. Indicator E1 “Net Enrolment Ratio in primary education”

Thematic global evaluation of European Commission support to the education sector in partner countries(Including basic and secondary education); Final Report Vol. IIb, December 2010; Particip GmbH
198
corresponds exactly to MDG Indicator 2.1. for monitoring MDG two “Achieve Universal PrimaryEducation” although progress on this indicator tends to reduce quality.
The ECA report assessed the final education indicator, E4 – “Gross Secondary Enrolment Ratio” as moreproblematic in terms of its relevance. It is not directly linked to the MDGs and is also a generalquantitative indicator whereas the Financing Proposal prioritises the quality of provision and bettertargeting of public expenditure for secondary education to the poor. Unlike the other three educationindicators it was not classified by the GoU as a “critical undertaking” which meant that it was not properlymonitored by the Ministry of Education.
The Financing Proposal understated the weaknesses in the reliability of the data for indicator E1. In factprimary schools have a major incentive to inflate their enrolment rates since the number of enrolmentsdetermines the size of each school’s capitation grant. That this continues to be an issue was noted in a2009 meeting of the Education Sector Consultative Committee: “Records management at school anddistrict level is still poor. There are instances where schools inflate pupil enrolment and teacherdeployment so as to be allocated more capitation funds, which makes all the harder the objectivemeasurement of whether targets are achieved and progress made in the sector.
For the education targets, only the figures for the one year (2003) before the baseline year (2004) aregiven in the Financing Agreement. This means it is difficult to assess the incentive nature of the targetsagreed in terms of past trends. Moreover, no explanation is given for the targets set and in most casesthe targets set raise questions:
the Net Enrolment Rate (E1) was foreseen to increase from the 2004 baseline of 88.7% by 1.6%to a target of 90.3% in 2005 but then by only a further 0.3% to a target of 90.6% in 2006. In theabsence of any explanation the targeted increase for 2006 seems low, particularly given that therewas a 2% increase from 2003 to 2004;
the Completion Rate (E2) indicator was targeted to rise by only 1% to 63% in 2005 while there hadbeen a 6% rise from 2003 to 2004. A larger increase of 4% is then targeted for 2006;
the Competency Level for Literacy and Numeracy indicator (E3) showed a very large butunexplained increase from a 2005 target of 25% to a projection of 75% in 2007. No target is givenfor 2006 and no baseline given for 2004.
In Niger and in Burkina Faso, the cooperation strategy of the EU fits into the Poverty ReductionStrategies of the countries (SDRP86 in Niger and PRSP87 in Burkina Faso), mainly via budget support,which represents 60% of total aid in Burkina Faso.
Budget support is monitored by the implementation of a performance indicators matrix reflecting theexecution of respectively the SDRP and the PRSP. These indicators, including those related to education,are respectively based on the matrix of indicators of the PDDE (in Niger) and the priority actionprogramme of the PRSP88 (in Burkina Faso).
The ECA reports state that the indicators used for the 9th EDF constitute a good basis for the monitoringof the basic education sector in terms of access but are inadequate for the monitoring the quality ofeducation (e.g. transition to secondary, repetition, quality of learning) and reduction of regional and socialdisparities. Under the 10th EDF, the numbers of indicators are insufficient to ensure disbursement linkedto progress in the sector. The EC intends to compensate that through dialogue on the basis of indicatorsfrom the sector plan PDDE (Niger) and PDDEB (Burkina Faso). Nevertheless, the EC has no specificguidelines regarding the scope of sectoral dialogue in General Budget Support.
In Niger, in the multiannual support programme to Poverty Reduction 2006-2008 (PPARP 2006-2008), eight indicators were selected to estimate the volume of variable tranches of the global“education component” and of the additional sector tranche “education”. Apart from the indicatorsrelated to it within the variable tranches, the overall performance of the education sector is aspecific condition of disbursement. In the education sector, it is globally monitored by the “Tranchefixe modulable Education”.
In the PPARP 2009-2011 the sectoral tranche “Education” was removed and the number of“Education indicators” reduced to five. The emphasis has been given to the regular and thoroughdialogue on basic education which must be based on the indicators of the performance matrix
86 Accelerated Development and Poverty Reduction Strategy87 Poverty Reduction Strategy Paper [CSLP]88 PAP-CSLP

Thematic global evaluation of European Commission support to the education sector in partner countries(Including basic and secondary education); Final Report Vol. IIb, December 2010; Particip GmbH
199
from the decennial Development Plan for Education (PDDE) and agreed between the GDN andthe DP that are active in the education sector.
Nevertheless, the EC has no specific guidelines on the scope of sectoral dialogue in the contextof general budget support. As the level of budget execution of the MoE remains a concern of thisprogramme, an indicator on the budget execution rate in the sector of education has beenintroduced.
The payment of variable tranches of the PPARP (2006-2008) « Education » component is linkedto the eight following indicators:
o E1: Budget execution rate in the field of education,
o E2: Number of students per chair-desk (“table-bancs”) in rural areas,
o E3: Gross primary enrollment rate,
o E4: Gross primary enrollment rate for girls,
o E5: Gross primary enrollment rate in rural areas,
o E6: Primary Completion Rate,
o E7: Reform of curricula,
o E8: Student assessment.
In Burkina Faso, in the budget support for poverty reduction 2005-2008 (ABRP 2005-2008), 23indicators are related to basic education, including six for estimating the volume of variabletranches of the PRSP-Education component and 7 to estimate the volume of variable tranches ofsector support. The ten remaining indicators are selected to monitor the evolution in the sector.
According to the ECA report, the indicators for education are problematic the objectives are notalways clearly defined. As the level of implementation of the budget of the Ministry for BasicEducation (MEBA) remains a continuous concern, indicators for budget execution rate of theeducation sector are included in budget support programs. However, the budget execution rateindicator is limited given the difficulty in obtaining data.
In the framework of budget support for poverty reduction (ABRP) 2005-2008 of the 9th EDF, thefollowing targets related to basic education have been set in the Education Component - PRSPand the EFA sectoral tranches:
o better access, both physically and financially, to quality education services, especially forgirls,
o improving the financing of the education sector,
o improving PDDEB, including its steering mechanisms,
o institutional strengthening of MEBA.
As regards the MDG Contract - Budget Support for Growth and Poverty Reduction (2009 - 2014),the Education Indicators come from the performance matrix and the disbursement of the generalframework for budget support for the implementation of the PRSP (CGAB89-CSLP) 2008-2010.The targets could be revised to take into account the results from the Census of Population andHousing (RGPH) 2006 published in 2008. A mid-term evaluation should also analyse the issue ofregional disparities (with special emphasis on the priority provinces) and gender.
The EUD has developed its MDG contract even though the guidelines for these contracts werenot finalised by the HQ at that time. Thus, the vision of EUD and HQ vary significantly on twoissues particularly relevant concerning support to basic education.
The first disagreement concerns the principle of the MDG contract of a financing by fixedtranches during the first three years in order to better ensure the predictability of aid. Variability isonly introduced from the 3rd year onwards and is based on the performance indicators on healthand education. The EUD was in favor of keeping the annual performance tranche on a variablebasis from the first year onwards, which was refused by HQ based on the harmonisation of MDGcontracts. The EUD is concerned that the abandonment of a variable installment mode at thebeginning of the project would “make the political dialogue much more difficult, as the
89 Cadre général d’organisation des appuis budgétaires

Thematic global evaluation of European Commission support to the education sector in partner countries(Including basic and secondary education); Final Report Vol. IIb, December 2010; Particip GmbH
200
argumentation is not based on the expected results throughout the project but on the mid-termreview after three years. Much more time would have to be invested in this dialogue.
The second dispute concerns the removal of the component « institutional support » of the MDGcontract, which was seen by the EUD as a good instrument to support political dialogue despitethe few results of this component under the 9th EDF.
3.10.2.2 I-922: The release of fixed and variable tranches of SBS has been linked to educationdevelopment targets and policy triggers
In Tanzania and Namibia, the release of tranches of Education SBS has been linked to educationindicators. The following information could be highlighted in the ECA reports:
In Tanzania, the annual education sector performance reports and the matrix of the sector budgetsupport programme contain an adequate mixture of indicators and the information available is upto date. The payment of variable tranches of the “Support to Education Sector Reform”Programme 2006-2010 (9th EDF) is linked to the fulfillment of indicators in five key sector areas:access, equity, quality and management and finance. Of the two variable tranches paid from theEducation SBS in December 2008 and December 2009, respectively 52.5% (out of € six millionavailable) and 37.5% (out of € ten million available) was paid.
In Namibia, the 2007 rider to the ESP financing agreement introduced a new disbursementmechanism which the possibility of partial disbursements based on achievement levels to triggerpayments (100% if at least 80% of prior actions met, 50% if less than 80% but more than 50% ofprior actions met, 0% if less than 50% met). According to the ECA report, this might be anappropriate system when results are assessed through agreed, quantifiable performanceindicators but is more challenging to apply when the assessment of prior actions is based onjudgment and therefore open to interpretation.
The CSP comprises a comprehensive list of performance indicators, including some 40 indicatorspertaining to several sub-sectors of the education sector. A particular focus on MDG two hasbeen ensured during the identification and formulation phases of the 10th EDF, with the financingproposal for the new Education Sector Policy Support Programme (ESPSP).
3.10.2.3 I-923: Policy dialogue is incorporating financing, accountability and capacitydevelopment measures in the education sector
The ECA reports are explicitly analysing the EUD’s participation in education policy dialogue in Tanzania,Liberia, Uganda, Namibia and Burkina Faso. However the reports do not give further information onwhether this dialogue incorporates financing, accountability and capacity development measures.
In Tanzania, the overall education policy dialogue structure for DPs and the government is wellestablished and demonstrates political leadership and ownership by the GoT. In 2009 the Troika met thePermanent Secretary (PS) of the MoEVT90 twice, which was not the case in previous years. Joint annualsector reviews take place and are attended by high level GoT officials, DPs and CSOs and feed into theJESR91 process.
However, the EUD actively maintained an education policy dialogue with the GoT only during the first halfof the implementation period for the Education SBS. According to the programming guidelines oneducation, EC support should focus on a limited number of priorities based on the country’s most urgentneeds, and these priorities should determine the focus of the policy dialogue. This dialogue is consideredessential in the preparatory phase but also during the implementation phase to assist the beneficiarygovernment in properly carrying out the planned policies, measures and reforms.
During the 2007 chairmanship of the Education DPG, the EUD’s education programme officer had moreinfluence on the GoT’s education policy, thanks to this position, than she would have had if the EC wasjust one of the DPs supporting education through the Education SBS. Until her departure she was part ofthe Education Troika and still involved in dialogue with the GoT and other DPs. After the departure of theeducation programme officer, the EUD did not take part in the regular Education DPG meetings or theannual JESRs but maintained informal contacts with the DFID representative.
90 Ministry of Education and Vocational Training91 Joint Education Sector Review

Thematic global evaluation of European Commission support to the education sector in partner countries(Including basic and secondary education); Final Report Vol. IIb, December 2010; Particip GmbH
201
The MoU with DFID signed in October 2009 is not in line with the guidelines for SBS (July 2007), whichstates that “policy dialogue cannot be contracted out”. The EC is however of the opinion that the subdelegation of dialogue to DFID would be sufficient and in line with its policy. The SBS guidelines make noreference to the “EU Code of Conduct on complementarily and Division of Labour (DoL) in Developmentpolicy “of May 2007 or the possibility of sub delegating dialogue to EU Member State DPs.
Until September 2008, the policy dialogue focused on education indicators and outcomes. According tothe former education programme officer, the sector dialogue remained at technical level and discussionswere process- oriented. The discussions concerned sector-related issues such as sector reviews,performance reports and more generally monitoring and sector Performance Assessment Framework(PAF) and the design of a sector strategy. Education challenges were addressed more at a thematicworking group level. It was more difficult to implement corrective actions since a top- down approachwould have been necessary but simply was not possible due to insufficient ability or willingness at politicallevel.
Representatives of education sector NSAs/CSOs interviewed during the mission complained thatconsultations with government were often announced just one day before meetings were to take place,which made it very difficult to prepare properly.
It should be noted that one of the ongoing activity of the MDG contract (10th EDF) will be policy dialoguewith GoT around the underlying principles of the GBS Partnership Framework Memorandum, domesticaccountability, the PAF, the implementation of the PFM Reform Programme and the mainobjectives/outputs of the MKUKUTA and its successor programme.
In Liberia, there was a one year gap in the EC’s presence in the education sector on the ground fromAugust 2007, which was only partially compensated by back-stopping missions from EC headquarters.Since the arrival of the Contract Agent in September 2008, the EUD has taken part in a joint DPcoordinated dialogue with GoL, currently revolving around the completion of the ESP.
Four forums are established to maintain policy dialogue with the Ministry of Education:
ECSEL steering committee chaired by the MoE;
Education Pool Fund (EPF) Steering committee chaired by the MoE;
Education Sector Steering committee chaired by the MoE, and
the Education Donors meetings.
Since September 2008, the EUD has been active in all of them.
Discussions with the GoL and the DPs on the sector priorities were carried out in the inception phase ofECSEL (March – April 2009) and in the first ECSEL steering committee meeting (June 2009).
In Uganda, in the education sector, the EUD has regularly participated in the Education Donors Groupwhich meets monthly and generally attended by 8-15 donor agency staff. The local agent in the economicand social affairs section has traditionally represented the EUD. Since her arrival in mid-2008 anexpatriate contract agent has also participated in the meetings. Based on the minutes available, the EC’scontribution has been quite limited but it has increased in 2009 mainly because of its involvement in thework on health and education indicators for the JAF.
The local agent for education has also normally attended the higher level Education Sector ConsultativeCommittee, a joint GoU – donor group, which meets every 2-3 months with typically approximately 40people attending. From the minutes available the EUD has had little input into this forum, partly reflectingthe fact that education is not a focal sector for the EC as well as the large number of persons present atthese meetings.
The main feedback on GBS contained in 2007 Joint Annual Review is that ‘The GBS operation hascontinued to provide a credible platform for a constructive dialogue between the EUD and theGovernment services, as well as with other Development Partners active in this field’. This overstates thecontribution of GBS to promoting dialogue because, while a significant channel, it is by no means the onlyone: in particular there is the Article 8 Dialogue, the Local Development Partners Group framework for alldonors, and the leading role played by the EC in the sectoral dialogue in its two focal sectors. The ECAreport noted that the EUD has not made full use of the opportunities for dialogue presented by GBS,largely because of limited staff resources.

Thematic global evaluation of European Commission support to the education sector in partner countries(Including basic and secondary education); Final Report Vol. IIb, December 2010; Particip GmbH
202
In Namibia, the policy dialogue has not yet reached its full potential. Policy dialogue between GRN andthe EUD takes place trough existing instruments laid down by the GRN and the donors active in theeducation sector, such as the technical and annual reviews and bi-monthly meetings. In practice, thepolicy dialogue between GRN and the EUD has been closely tied to the review process. The delays andrather erratic review process, as well as its focus on specific prior actions, have not been conducive to amore strategic sector policy dialogue. The problems related to the release of annual tranches and the lackof an effective monitoring system has also limited the quality of the policy dialogue.
The EUD is trying to enhance its dialogue with the GRN in the framework of the ESPSP formulation underthe 10th EDF by seeking ways for ETSIP to better align with EFA and MDG2 goals, and focussing moreon equity issues and primary education. One of the main challenges for the EUD is to convince the GRNto focus more on equity aspects (e.g. to provide true free schooling).
In Burkina Faso, the EUD is a member of various coordination authorities between the GBF and the DPfacilitating discussion at all levels (global and sectoral). Thus, the EUD is involved in the generalframework for budget support (CGAB), which structures the relations between the DP and the GBF in theimplementation of the PRSP.
There are six sectoral and thematic committees (CST) - among which one is specifically focused oneducation- in the CGAB, in which the DPs are observers. Since 2002, the EUD is one of the 13 DPsupporting, in consultation, the implementation of the PDDEB. This framework provides a clear timetablefor consultations and discussions to monitor the implementation of annual action plans of the PDDEB. Inthis capacity, the EUD participates in reviews (common monitoring missions) and meetings between DPand GBF (quarterly meetings and technical meetings, particularly the thematic steering group) as well asin the coordination mechanisms / regular meetings of the education DP.
Non State Actors are also strongly involved in political dialogue (they are part of the partnershipframework for Education) as well as in the implementation of activities funded by the government; inparticular in the field of literacy.
3.10.3 JC93: Increased efficiency of EC aid delivery
Summary of ECA findings related to JC93
As stated in EQ6 under I-622, the existence of an Education Medium Term Expenditure Framework(MTEF) is mentioned for Namibia, Uganda, Burkina Faso, Tanzania and its creation has been plannedin Niger. However, no explicit information is provided by the ECA reports on whether or not the ECsupport contributed to make these MTEF operational.
No explicit information is provided in the ECA audits on the disbursement and expenditure rates by aidmodality and channel.
The level of compliance by beneficiaries of GBS and SBS with regard to policy triggers and indicatorsvaries a lot between the countries analysed.
In Burkina Faso, the assessment of payment request for the sector tranches for EFA has beendelayed. According to the EUD, on of the reasons were the contradictory instruction on thedemonstration of additionally from DG DEV and DG AIDCO.
In Namibia, the ESP payments were delayed due to the nature of the disbursement conditions andinsufficient progress on implementing the programme and that there are potential contradictionsbetween the financing agreement and the MoU regarding the disbursement conditions.
In Tanzania, the Government was typically slow to submit payment requests with the necessaryinformation to show that payment conditions had been met to the EUD. For the Education SBS, eightout of the ten indicators did not achieve their target for 2008/2009, which demonstrated a negativetrend in comparison with 2007/2008.
In Uganda, as regards Education Sector Indicators, for the first variable tranche, all four educationindicators were considered by both the GoU and the EC to have been met. Regarding the secondtranche, for only one education indicator (E1) was the amount paid in full, in one case nothing waspaid because of underperformance (E2) and for the other two indicators half of the amount was paidbecause of problems with the setting of targets.
In Niger, for the PPARP (2006-2008) the disbursement of tranches for 2007 has been considerablydelayed. In 2007, 38% of the variable tranche was paid while the fixed tranche has not been paidbecause HQs did not consider the progress achieved as sufficient, contrary to the EUD.

Thematic global evaluation of European Commission support to the education sector in partner countries(Including basic and secondary education); Final Report Vol. IIb, December 2010; Particip GmbH
203
3.10.3.1 I-931: Education MTEF or the like operational
As stated in EQ6 under I-622, the existence of an Education Medium Term Expenditure Framework(MTEF) is mentioned for Namibia, Uganda, Burkina Faso, Tanzania and its creation has been planned inNiger.
It should be noted that in Tanzania, the EC’s GBS and SBS are recorded as revenue in the GoTbudget. However, as it is not targeted budget support, neither are recorded in the Medium TermExpenditure Framework (MTEF) but are budgeted alongside with GoT’s own resources and otherGBS contributions.
The ECA audit also noted that in Uganda, the EC provides projections of future GBSdisbursements over the three year MTEF period. Estimates are sent in October-November andthen revised twice in the period leading up to the finalisation of the annual budget. This ensuresthat the financial resources from the EC’s GBS programmes are fully taken into account in theGOU budget preparation process.
In Namibia, the ESP framework was set out in the strategic plans of two ministries, the Ministry ofHigher Education, Training and Employment Creation (MHETEC) and the Ministry of BasicEducation, Sports and Culture (MBESC), a Medium Term Expenditure Framework (MTEF) for theimplementation period (2003-2007) and sector coordination mechanisms.
However, no explicit information is provided by the ECA reports on whether or not the EC supportcontributed to make these MTEF operational.
3.10.3.2 I-932: Disbursement and expenditure rates by aid modality and channel
No explicit information is provided in the ECA audits on the disbursement and expenditure rates by aidmodality and channel.
3.10.3.3 I-933: Adequate compliance levels by beneficiaries of GBS and SBS with regard to policytriggers and indicators
According to the ECA reports, payment requests have been delayed in Tanzania, while payments havebeen delayed in Burkina Faso, Niger and Namibia.
In Tanzania, the results regarding the achievement of target are deteriorating while the progressesachieved are not considered as sufficient by HQs in Niger. In Uganda, as regards Education SectorIndicators, the progress achieved for the first variable tranche were meeting targets, whereas there weremore mitigated for the second tranche.
In Burkina Faso, the assessment of payment request for the sector tranches for EFA has been delayed.According to the EUD, on of the reasons were the contradictory instruction on the demonstration ofadditionality from DG DEV and DG AIDCO.
In Namibia, the ESP payments were delayed due to the nature of the disbursement conditions andinsufficient progress on implementing the programme. The assessment of whether or not the prior actionshave been carried out has proven difficult in practice and led to disputes between the EUD, HQs and theGRN. The new disbursement mechanism which set conditions for partial releases of funds appears not tobe appropriate for the ESP financing agreement. As an example, for the release of the 4th tranche, HQsdecided to pay 50% of the tranche contrary to the opinion of the EUD and the GRN. The reason was thedifferent interpretation of the achievement of one out of the 20 prior actions. The assessment of thefulfillment of the 5th tranche conditions has also proved difficult with delays of more than nine months fromthe submission of the request for the release of funds.Prior to the adoption of the rider, the lack of sufficient progress in implementation of the programme hadalso led to a partial release of only 50% of the 3rd tranche with the agreement of HQs, EUD and SIDA.Furthermore, the delay incurred by the GRN in presenting the request meant that SIDA could not pay itscontribution. As SIDA could not roll its contribution over to the following fiscal year, the GRN lost this € 3.2million contribution.Furthermore, there are potential contradictions between the financing agreement and the MoU regardingdisbursement conditions. In accordance with the review mechanisms, GRN and donors assess and agreeon the achievement of prior actions during the recurrent review meetings. Subsequently, an “aidememoire”, signed by the GRN and the EUD is issued and serves as a basis for the GRN to ask for nextdisbursement and for donors to pay. This procedure, aiming at strengthening alignment andharmonisation of donors’ procedures, is at odds with the fact that the final decision on disbursements is
Thematic global evaluation of European Commission support to the education sector in partner countries(Including basic and secondary education); Final Report Vol. IIb, December 2010; Particip GmbH
204
taken in HQs. Whereas for the 4th tranche EC HQs decided to release only 50%, Spain paid its fullcontribution on the basis of the agreement in the “aide memoire”, thereby undermining the credibility ofthe EC’s cooperation.
In Tanzania, the Government was typically slow to submit payment requests with the necessaryinformation to show that payment conditions had been met to the EUD. The delays were mainly due tothe change from the basket funding mechanism to the SBS, the suspension due to the EPA case andadministrative delays at DG AIDCO. There was a 3-year delay between the last payment for the basketfund and the first payment for the SBS programme, while payments from GBS programmes continued inthe meantime.
According to the ECA report, eight out of the ten indicators of the Education SBS92 did not achieve theirtarget for 2008/2009. The number of indicator targets not achieved or partly achieved increased from sixto eight between 2007/2008 and 2008/2009, demonstrating a negative trend. The draft Mid Term Review(MTR) came to the conclusion that “SBS is mostly off track, i.e. only a minority of SBS indicators havebeen globally achieved, many of which are behind schedule, and only in a minority of cases are adequatemeasures taken when (threatening to go) off track” (Equals “C” rating”).AIDCO.C approved in December 2009 an amount of € 3.75 million with regard to the variable tranchesince the following indicators were either not or only partly fulfilled. The indicators that were partly fulfilledand scored 0.5 were:
Pupils/ grade A or diploma teachers in primary education (quality in primary)
Gross enrolment ratio in secondary - Form five to Form 6- (access in secondary education)
Percent of students passing the Form four examination (CSEE) (quality in secondary)The following indicators were not fulfilled:
Reduction of cross-district disparities in pupils/teacher ratio in primary education (quality andspatial equity in primary)
Pupils/textbook in primary schools (quality in primary)
Percent of girls passing Primary School Leavers’ exam (gender equity in primary)
Public expenditure on education as a percentage of total expenditure (Financing)
% of LGAs awarded clean audits by the National Audit Office (Decentralisation andaccountability).
According to the ECA report, the comparison between the fulfillment of the indicators for the last flexibletranche and the previous shows that number of targets achieved decreased from five to three, thenumber of targets partly achieved increased by one and the targets not achieved increased from four to 5.This shows that the results are not improving.
In Uganda, as regards Education Sector Indicators, for the first variable tranche, all four educationindicators were considered by both the GoU and the EC to have been met, in three of the four cases withmuch larger margins than would normally be expected. The EUD did not seek policy/operationalexplanations from the GoU concerning this, nor did it question the reliability of the statistics. It did,however, propose to address issues relating to baseline data and related targets in sector dialogue and todiscuss capacity building to support the Education Management Information System (EMIS). The auditnoted the following points:
for E1 concerning primary school enrolment an outcome of 95% was recorded in 2004-5compared with target of 90.3%. This represents an increase of 6.3 percentage points on thebaseline compared with the 1.6 percentage points targeted. The GoU did not make anyobservations on this result, either to explain the good performance or to comment on the datareliability. The EUD also did not address these issues, merely noting that ‘the target wascomfortably met’;
for E2 – “Completion Rate – P7” the GoU reported a 63% completion rate which exactly met thetarget. The GoU acknowledged that the figure of 63% had been based on population projectionsgoing back to the 1991 census and that using the more recent 2002 census, which showedprevious population figures were underestimated, the completion rate was much lower at just51%. It nevertheless argued that as the target was also based on the 1991 census, the full
92 sector support programme “Support to Education Sector Reform”

Thematic global evaluation of European Commission support to the education sector in partner countries(Including basic and secondary education); Final Report Vol. IIb, December 2010; Particip GmbH
205
payment should be made and the EC accepted this approach. This case illustrates the fragility ofperformance indicators based on population projections;
for E3 – “Competency in Numeracy and Literacy” the target was very comfortably achieved, 31.5%being reported against a target of 25%, an increase of 10,5 percentage points compared to thefour percentage point target. Again, neither the GoU nor the EC commented on how this high levelof performance was achieved;
for E4 concerning secondary school enrolment, only half of the schools reported data. Accordingto the GoU the data returned showed an enrolment rate of 23% and that, if extrapolated to thenon-reporting schools, would mean an enrolment rate of 40% compared with a target of 23% anda baseline of 22%. The EUD concluded that the target ‘seems to have been unrealistically low’ buthad to pay the full amount given that the target had been achieved.
Regarding the second tranche, for only one education indicator (E1) was the amount paid in full, in onecase nothing was paid because of underperformance (E2) and for the other two indicators half of theamount was paid because of problems with the setting of targets. In fact there were issues in relation toeach target:
for E1 concerning primary school enrolment, given that the target for 2004-2005 had been socomfortably exceeded (95% compared to 90.3%) it might have been expected that the 2005-2006target would have been increased from 90.6% which represented only a marginal increase from2004-2005. The target was not changed and in fact performance fell back from 95% to 91.7%. Noreason for this reduced performance was given;
for E2, “Completion Rate – P7” a new target rate of 50% was introduced by the GoU and agreedto by the EUD which was actually below the reported 51% achieved in 2004-2005. Neverthelessthe 2005-2006 outcome was still below the new target at 48%. This result is in line withwidespread concerns over the quality of primary education in Uganda since the establishment ofUniversal Primary Education. In this case the GoU provided only a very brief commentary on thereasons for not achieving the target. The EUD stated that this issue had been subject tosubstantial dialogue between it and other development partners and the GoU.
for E3, “Competency in Literacy and Numeracy”, no target was set for 2005-2006. The outcomeshowed a very marginal improvement from 31.5% to 32%. Despite the absence of a target and noexplanation for this, the GoU and the EUD proposed full disbursement for this indicator. The ECheadquarters decided on half the amount being paid, reasoning that there was “positive progress”on the one hand while pointing out on the other hand that without a target it could not be said thatit had been achieved.
for E4 on secondary school enrolment, the reported level was 22% compared with the target of25% and the estimated level of the previous year of 40%. Nevertheless the EUD proposed alongwith the GoU to pay the amount in full while the EC headquarters again decided to pay half theamount on the basis that there was “some progress over the baseline” of 18% in 2003-2004.
In Niger, as stated above, the payment of variable tranches of the PPARP (2006-2008) « Education »component has been linked to eight indicators. Apart from the indicator E1, no performance indicator hasreached the expected objective. As a result, the fixed tranche "Education" in 2007 has not been paid andonly 37% (€ 12.12 million) of the maximum amount of the education component (€ 33 million) was finallydisbursed under this programme. For the payment of the variable tranche in 2006, the education indicatorE1 has been cancelled out for scheduling reasons and replaced by an operational action plan linked tothe MTEF and detailing the activities and measures to be taken during the 2005-2006 school yearvalidated by the MoE and the DP during the joint review in September 2005. For the payment of thevariable tranche in 2007, the target (i.e. the rate of execution of 2005 budget of MoE stated on30/06/2006 is higher or equal to the average execution rate of total national budget) was considered to bemet, as the execution rate of the MoE was 89.8 % compared to 74.86 % at the level of the state.
As regards variable tranches, the performance is evaluated on the basis of a documented note showingthe results obtained regarding indicators and measures, that includes comments explaining why a resultwas not obtained and the measures taken to reverse the trend. The performance in the education sectoris also monitored in a comprehensive manner at the level of the fixed tranche “Education”. This evaluationis based on a joint assessment made by the Government and the DP during sector reviews.
For the PPARP (2006-2008) the disbursement of tranches for 2007 has been considerably delayed(payment in May 2008) given the difficulty of establishing objective judgments on the basis of the"Education" review and given the complexity of the situation of this sector. In 2007, 38% of the variable

Thematic global evaluation of European Commission support to the education sector in partner countries(Including basic and secondary education); Final Report Vol. IIb, December 2010; Particip GmbH
206
tranche was paid while the fixed tranche has not been paid because HQs did not consider the progressachieved as sufficient, contrary to the EUD. To avoid this situation in the future, AIDCO consideredimperative that following each review, the EUD and other donors adopt a clearer position towards thegovernment by contributing to the conclusion (positive or negative) of this review.
3.10.4 JC94: EC’s contribution to the FTI provides added value to EC support at country level
Summary of ECA findings related to JC94
Only little information is provided by the ECA reports on whether the EC contribution to the FTIprovides added value to EC support at country level. While Burkina Faso and Niger are benefittingfrom the EFA-FTI, the funding request has not been successful for Liberia.
In Niger and Burkina Faso, during the mid-term review of the 9th EDF Country Strategy (CSP 2001-2007), the EC and the NAO have decided in 2004 to give a fundamental place to acceleratinguniversal primary education through a non focal sector “Education for all” programme with a budget of€ 15 million for the period 2006-2008. This decision was taken based on a resolution of the Council toinclude in the mid-term review of the 9th EDF the new commitments in education including the supportto the EFA-FTI initiative. The Commission had decided that this support could be provided directly tocountries which had made an application for funding under this initiative (including those twocountries).
While Liberia was endorsed as a partner by the FTI in 2007, its application for support from the CFwas rejected, partly due to shortcomings, such as lack of capacity to effectively plan and manage thesub-sector and fiduciary risk, in the sub- sector programme transmitted with the application submittedon the basis of the LPERP. It was expected to submit a new application in March 2010 based on theESP with a decision by FTI on CF financial support expected in May 2010.
The Education for All – Fast-track Initiative (FTI) is a global partnership between donor and developingcountries to speed the progress towards the MDG of universal primary education by 2015. All lower-income countries which show serious commitment to achieve universal primary completion can receivesupport from F.T.I. While Burkina Faso and Niger are benefitting from the EFA-FTI, the funding requesthas not been successful for Liberia.
In 2009, Burkina Faso has been admitted to the Education for All – Fast Track Initiative (EFA-FTI) for a total of USD 102 million to implement in the context of a sector budget support over theperiod 2009-2011 managed by the World Bank (WB). An initial grant of USD 22 million had beenpaid late June 2009. The EFA-FTI initiative is primarily funded by a Catalytic Fund to which the EChas been involved so far with an amount of € 85 million.
Niger has been introduced in 2003 to the EFA-FTI for a total of USD 16 million to be implementedthrough a sector budget support managed by the World Bank (WB). An amount of USD eightmillion has been disbursed between 2005 and 2008 under Phase I of PDDE. The remaining USDeight million should finance, in 2010, the activities of the PDDE from 2009-2010. The EFA-FTI isfunded primarily by a Catalytic Fund to which the EC participated so far with € 85 million.
The Liberia Primary Education Recovery Programme (LPERP) met the requirements foradmission to the EFA FTI Partnership. However, the funding request to the Catalytic Fund (CF)Committee in May 2007 was not successful. The Education Sector Plan (ESP) builds on andexpands the work completed under the LPERP. The ESP has recently been appraised by the DPsin the education sector and covers all subsectors and will be the basis for the GoL’s application tothe FTI’s Catalytic Fund and any future sector wide interventions. The ESP sets priorities,identifies funding gaps and provides different scenarios for the sector.
Regular Education Donors Meetings, organized by UNICEF, allow DPs to share informationabout each other’s activities in the sector (e.g. the elaboration of a donor matrix). Recently theDPs have made a coordinated effort to assist the GoL in its application for CF support, forinstance through the joint ESP appraisal and subsequent revisions. The GoL’s new FTIapplication was supposed to be submitted in March 2010.
3.10.4.1 I-941: FTI improves partner country preparedness for EC sector support including SBS
In Niger and Burkina Faso, during the mid-term review of the 9th EDF Country Strategy (CSP 2001-2007), the EC and the NAO have decided in 2004 to give a fundamental place to accelerating universalprimary education through a non focal sector “Education for all” programme with a budget of € 15 millionfor the period 2006-2008. This decision was taken based on a resolution of the Council to include in themid-term review of the 9th EDF the new commitments in education including the support to the EFA-FTI

Thematic global evaluation of European Commission support to the education sector in partner countries(Including basic and secondary education); Final Report Vol. IIb, December 2010; Particip GmbH
207
initiative. The EC had decided that this support could be provided directly to countries which had made anapplication for funding under this initiative (including those two countries).
Burkina Faso was beneficiary of the PDDEB until 2008 in the sector of basic education (primaryeducation and literacy). With the implementation of the educational reform and the EPT-FTI contract,Burkina benefits since 2008 from a second phase of PDDEB including pre-primary and secondaryeducations. The support corresponding to the sectoral tranche for education EFA included a set ofmeasures particularly to enable the GBF to adapt the goals of PDDEB to the EFA-FTI goals, whichshould materialise in a second phase of PPDEB, and to improve the steering of PDDEB.
The PDDEB Phase II was adopted with delay in October 2007. It includes the technical and financialscenario of education reform as well as the financial cost and the funding gap (amounting € 141.5 million,which contributed to justify the aid request to the EFA-FTI initiative).
3.10.4.2 I-942: Level of regular consultations between EUD staff and FTI on sector support issuesincluding SBS
3.10.4.3 I-943: EUD consults EC HQ on results of FTI country appraisal undertaken
No information is provided by the ECA reports regarding these indicators.
3.10.5 JC95: EC support to development banks provides added value to EC support to educationat country level
Summary of ECA findings related to JC95
No information is provided by the ECA reports regarding the EC support to development banksprovides added value to EC support to education at country level.
3.10.5.1 I-951: Level of regular consultations between EUD staff and Development Banks/UNbodies on co-operation and co-ordination (general and programme-specific, if relevant)
No information is provided by the ECA reports regarding the level of regular consultations between EUDstaff and Development Banks/UN bodies on co-operation and co-ordination.
3.11 ConclusionsThe findings from the ECA reports have been synthesised around the following issues of special interest:
3.11.1 Trends in choice of education indicators (quantity versus quality)
As regards quantity indicators, in most countries analysed enrolment and completion rates have beenselected as indicators in EC support to education at sector or general budget support level. TheTransition Rate from Primary to Lower and Upper Secondary constitutes one of the performance targetsof EC programmes in Tanzania. In Liberia, the transition rate to lower and upper secondary has beenselected as one of the performance indicators for basic education. In Uganda, the 9th EDF GBSprogramme contains four education indicators which correspond to priority areas for the EC and aredirectly linked to MDGs, except E4 – “Gross Secondary Enrolment Ratio”. In Burkina Faso, 23 indicatorsin the Framework of the Budget Support for Poverty Reduction (ABRP 2005-2008) concern basiceducation. According to the ECA audit, these indicators allow for a quantitative monitoring regardingaccess to primary education and reduction of gender disparities. Nevertheless, they are insufficient toperform a monitoring of education quality, in particular regarding the transition to secondary education. InNamibia, it is difficult to assess to what extent the EC support has been affecting the quality and efficiencyof the education sector. The data, when available, shows mixed results as regards the performancecompared to the targets set.
In most countries analysed, the quality of learning and teaching suffers from an inadequate of human andmaterial resources, such as qualified teachers, learning materials, textbooks and school structures. InNiger, Namibia and Tanzania, the government has elaborated strategies aiming at reinforcing the qualityof education. In Niger, the PDDE elaborated by the Government, includes a quality component andconstitutes a global framework for interventions of all DP in the education sector. In Tanzania, quality inprimary and secondary education is included in the operational targets of the National Strategy for Growthand Reduction of Poverty. In Namibia, the ETSIP adopted by the government constitutes a 15 yearstrategic plan aiming at strengthening the quality of education. In those countries, as well as in BurkinaFaso, Liberia and Uganda, EC programmes are also supporting the improvement of education quality at

Thematic global evaluation of European Commission support to the education sector in partner countries(Including basic and secondary education); Final Report Vol. IIb, December 2010; Particip GmbH
208
all levels. The Souteba programme (Niger) and the EQUIP project (Tanzania) have contributed toimprove the quality of education in their area of interventions. While the global impact of PASEB (BurkinaFaso) is assessed as positive, the available data shows mixed performance and few observed changeson education outcomes including quality can be attributed (even partially) to ECSEL (Liberia), due to theconsiderable delays of the project. The GBS PPARP (Niger) and the SBS “Support to the EducationSector Reform” (Tanzania) include targeted indicators related to quality.
It is worth mentioning the use of joint performance matrix’ using education sector related indicators.These matrixes are quoted in the report of Niger and Uganda (the Joint Assessment Framework, see I-822).
3.11.2 Appropriateness of selection of aid modality through assessing selection based onrelevant guidelines
According to the ECA reports, the situation in Liberia, Namibia, Burkina Faso and Tanzania have beentaken into account during the drafting of the CSPs or other EC strategies in support of education. ForNiger, an alignment of EC support to national priorities can be seen only for the support given under the9th EDF. As education support in the 10th EDF has been reduced, issues such as “gender” and“demographic growth” which are of increasing importance for Niger, have not been addressed, accordingto the ECA report. In the case of Uganda, the EC has aligned on the reform programme of Uganda(MKUKUTA) which, according to the ECA report, does not have clearly defined priorities. Also, the ECAreport of Uganda raises some doubts that EC funds within the GBS are distributed according on theneeds of the country.
While the choice of aid modality in Tanzania, Liberia und Namibia has been made according toprogramming guidelines and the Cotonou Agreement criteria, Burkina Faso and Niger benefit from anexceptional financing mechanism93, that has not been justified by any comprehensive evaluation or anyassessment of PFM in the education sector, although there are significant risks in both countries. The ECsupport to Uganda has been provided through GBS modality under the 9th and the 10th EDF. Under the10th EDF, Uganda, Burkina Faso and Tanzania are the only countries analysed that have signed an ‘MDGContract’.
In Tanzania, the choice of SBS as aid modality was made largely in accordance with the programmingguidelines and the fulfillment of the Cotonou criteria for Budget Support, although the credibility of thePFM reform during the implementation period of the Education SBS could be questioned. The EC’sdecision to sign an MDG-Contract was to a great extent driven by policy preferences for the budgetsupport modality and the disbursement performance of previous GBS programmes in Tanzania.
In Liberia, the decision not to apply an SBS modality for the implementation of ECSEL in 2006 was basedon an analysis in accordance with the programming guidelines, which established that Liberia did notmeet all the eligibility criteria for budget support, since a comprehensive sector policy was not yetestablished and fiscal/financial management was deemed inadequate. According to ECA, the ECdecision on the BSMS adopted in 2009 did not primarily reflect a concern for the effectiveness of theassistance provided to the social sectors but broader political and developmental concerns. Theassessment of GoL’s eligibility was unusually fast-tracked, giving insufficient time to duly complete afinancing agreement (with pertinent performance indicators for education). The application of GBSrequired an ad hoc review of the CSP which was undertaken with reference to article 5(2) of the CotonouAgreement. As there was no emergency or acute humanitarian crisis in Liberia at the time, it is, accordingto ECA, not evident that the application of article 5(2) was pertinent in this case. The submission of theamendment of the CSP and the BSMS decision to the EDF committee triggered negative reactions fromsome Member States.
In Namibia, the sector budget support modality for the ESP was found to have been applied inaccordance with programming guidelines for Support to Sector Programmes of July 200794 and thecriteria in the Cotonou Agreement’s article 61.295. The government’s PFM system is deemed to be robustand current practices ensure that the Ministry of Education benefits directly from the budget support.
93 The financial mechanism adopted is a sector allocation within the general budget support, that Burkina Faso andNiger are the only countries to benefit from.94 Support to Sector Programmes – Covering the three financing modalities: Sector Budget Support, Pool Fundingand EC project procedures, Short Version, July 2007, European Commission.95 (a) Public expenditure management is sufficiently transparent, accountable and effective; (b) well definedmacroeconomic or sectoral policies established by the country itself and agreed to by its main donors are in place;and (c) public procurement is open and transparent.

Thematic global evaluation of European Commission support to the education sector in partner countries(Including basic and secondary education); Final Report Vol. IIb, December 2010; Particip GmbH
209
In Burkina Faso and Niger, the inclusion of a education sector allocation in the mid-term review of the 9th
EDF was not the result of a request from the Governments and / or analysis of the EUD. It has mainlybeen motivated by the existence of EFA-FTI funding and political commitment. The EC did not conductany comprehensive assessment of whether the choice of sector support was appropriate nor onmanagement of public finances in the sector. The decision to no longer use the sectoral support and thepotential benefits of general budget support compared to sector support for education has not beenjustified in the documents of the 10th EDF programming.
In Uganda for the 9th EDF GBS programme (2004/2005 – 2006/2007), € 87 million was committed forfinancial transfers which represented approximately 35% of Uganda’s original CSP allocation. However,no explanation was given of how the amount allocated related to country needs and the expected risksand rewards of the GBS intervention. For the 10th EDF GBS programme to be implemented through theMDG Contract instrument covering six years, € 175 million was committed, which represented 40% of theCSP allocation, but the 2008-2013 CSP does not explain how the amount of the GBS resources wasdecided upon.
It is noteworthy that three of the countries analysed, i.e. Uganda, Burkina Faso and Tanzania, havesigned MDG contracts and thus show a commitment to monitoring and achieving the MDGs.
3.11.3 Achievement of education sector outcomes, related to targets of education indicatorsmeasured by full or partial disbursement
The level of compliance by beneficiaries of GBS and SBS with regard to policy triggers and indicatorsvaries a lot between the countries analysed.
In Tanzania, the Government was typically slow to submit payment requests with the necessaryinformation to show that payment conditions had been met to the EUD. For the Education SBS,eight out of the ten indicators did not achieve their target for 2008/2009, which demonstrated anegative trend in comparison with 2007/2008.
In Uganda, as regards Education Sector Indicators, for the first variable tranche, all four educationindicators were considered by both the GoU and the EC to have been met. Regarding the secondtranche, for only one education indicator (E1) was the amount paid in full, in one case nothing waspaid because of underperformance (E2) and for the other two indicators half of the amount waspaid because of problems with the setting of targets.
In Niger, for the PPARP (2006-2008) the disbursement of tranches for 2007 has beenconsiderably delayed. In 2007, 38% of the variable tranche was paid while the fixed tranche hasnot been paid because HQs did not consider the progress achieved as sufficient, contrary to theEUD.
Although the ECA reports do not provide a lot of information on the actual percentage of EC aiddisbursement to education released according to agreed schedules in annual or multi-year frameworks, intwo cases, ample discussion of budget releases in their relation to accountability and predictability exists.
In the case of Namibia, the ECA report asserts that the model of variable tranche releases basedon measurable outcome indicators was generally appropriate in terms of accountability, but that inthe implementation, it lead to complications and delays.
In the case of Uganda, the authors of the reports argue that the system of variable tranchesreduced predictability of funding under the 9th EDF, but that this was justified in light of the needfor accountability as well as predictability. Interestingly, in both countries, one of the reasons fordelays in payments lay in a late submission of payment requests by the respective government.
Under the 10th EDF, Uganda, Burkina Faso and Tanzania are MDG contract countries. This means thatfunds are provided on a more predictable basis over the whole of the programming cycle, to the benefit ofthe partner country in terms of budgetary planning.
In terms of alignment with the partner country’s fiscal cycle, only the ECA report for Uganda clearlypresented the situation, revealing how under the 10th EDF, such an alignment is assured andpredictability over the cycle of the three year MTEF is increased.
Despite the valuable finings on a few countries relating to indicators for this judgment criterion, there isnot sufficient evidence to point out any overarching trends based on ECA reports alone.

Thematic global evaluation of European Commission support to the education sector in partner countries(Including basic and secondary education); Final Report Vol. IIb, December 2010; Particip GmbH
210
3.11.4 Capacity development efforts and their results, e.g. related to education statistics, sectormonitoring, Education Sector Plans, EMIS, FMIS - PFM
In most countries analysed, the EC support to education contains capacity building and institutionalsupport to the national ministries and trainings for local staff. However, most of the time the capacitybuilding programmes planned have not been implemented (in Liberia, Burkina Faso and Tanzania),mostly due to delays and tendering problems.
The best results seem to have been achieved in Uganda, where the ECA report concludes that the EC’sprocurement capacity support building project has made a useful contribution to improving procurementpractices. As well as helping the PPDA develop procurement guidelines and documentation for localauthorities, it has also provided training and equipment to the local authorities themselves.
On the other end, in Liberia, the restructuring of the MoE originally foreseen within the framework of theEC Support to Education in Liberia (ECSEL) is deemed to be too sensitive for any progress to be made.In Burkina Faso, the institutional support to the Ministry of Basic Education that had been planned has notbeen implemented because of the great number and complexity of eligible actions and number of delays.
In Tanzania, an institution building component has been introduced to complement the Education SectorReform Programme 2006-20010 (9th EDF) divided in three axes: (i) supporting the development of aneffective Education Sector Management Information System, (ii) supporting the development of educationNGOs capacity, and (iii) providing major education actors with specific expertise in planning andbudgetary process at central and local level. However, the technical assistance provided to supportplanning, monitoring, the budgeting process and financial management in the education sector was,according to ECA not realised due to tendering problems and the ministry’s reluctance to ask for technicalassistance.
In Namibia, the Institutional and Capacity Building Support Facility created to strengthen the insufficientinstitutional capacity and lack of qualified staff in the MoE has not been used strategically to createcapacity in the MoE but it has mainly focused on the procurement of TA on an “ad hoc” basis. As aconsequence TA (consultants) leaves with the “capacity” once the contracts are finished. Furthermore,the procurement of TA was subject to delays and/or faced lack of funds and MoE capacity developmentsefforts are affected by high staff turnover, which has slowed down implementation.
The existence of an Education Medium Term Expenditure Framework (MTEF) is mentioned for Namibia,Uganda, Burkina Faso, Tanzania and its creation has been planned in Niger. However, no explicitinformation is provided by the ECA reports on whether or not the EC support contributed to make theseMTEF operational.
3.11.5 EC’s role in education sector and broader policy dialogue
The ECA reports are explicitly analysing the EUD’s participation in education policy dialogue in Tanzania,Liberia, Uganda, Namibia and Burkina Faso.
In Tanzania, the overall education policy dialogue structure for DPs and the government is wellestablished and demonstrates political leadership and ownership by the GoT. In 2009, the Troika96 metthe Permanent Secretary (PS) of the MoEVT twice, which was not the case in previous years. Jointannual sector reviews take place and are attended by high level GoT officials, DPs and CSOs and feedinto the JESR process.
However, the EUD actively maintained an education policy dialogue with the GoT only during the first halfof the implementation period for the Education SBS. According to the programming guidelines oneducation, EC support should focus on a limited number of priorities based on the country’s most urgentneeds, and these priorities should determine the focus of the policy dialogue. This dialogue is consideredessential in the preparatory phase but also during the implementation phase to assist the beneficiarygovernment in properly carrying out the planned policies, measures and reforms.
During the 2007 chairmanship of the Education DPG, the EUD’s education programme officer had moreinfluence on the GoT’s education policy, thanks to this position, than she would have had if the EC wasjust one of the DPs supporting education through the Education SBS. Until her departure she was part ofthe Education Troika and still involved in dialogue with the GoT and other DPs. After the departure of theeducation programme officer, the EUD did not take part in the regular Education DPG meetings or theannual JESRs but maintained informal contacts with the DFID representative.
96 The outgoing, incoming and current chair of the Education DPG

Thematic global evaluation of European Commission support to the education sector in partner countries(Including basic and secondary education); Final Report Vol. IIb, December 2010; Particip GmbH
211
According to ECA, the MoU with DFID signed in October 2009 is not in line with the guidelines for SBS(July 2007), which states that “policy dialogue cannot be contracted out”. The EC is however of theopinion that the sub-delegation of dialogue to DFID would be sufficient and in line with its policy. The SBSguidelines make no reference to the “EU Code of Conduct on complementarily and Division of Labour(DoL) in Development policy “of May 2007 or the possibility of sub delegating dialogue to EU MemberState DPs.
Until September 2008, the policy dialogue focused on education indicators and outcomes. According tothe former education programme officer, the sector dialogue remained at technical level and discussionswere process- oriented. The discussions concerned sector-related issues such as sector reviews,performance reports and more generally monitoring and sector Performance Assessment Framework(PAF) and the design of a sector strategy. Education challenges were addressed more at a thematicworking group level. It was more difficult to implement corrective actions since a top- down approachwould have been necessary but simply was not possible due to insufficient ability or willingness at politicallevel.
Representatives of education sector NSAs/CSOs interviewed during the audit mission complained thatconsultations with government were often announced just one day before meetings were to take place,which made it very difficult to prepare properly.
In this context, it should be noted that one of the ongoing activities of the MDG contract (10th EDF) will bepolicy dialogue with GoT around the underlying principles of the GBS Partnership FrameworkMemorandum, domestic accountability, the PAF, the implementation of the PFM Reform Programme andthe main objectives/outputs of the MKUKUTA and its successor programme.
In Liberia, there was a one year gap in the EC’s presence in the education sector on the ground fromAugust 2007, which was only partially compensated by back-stopping missions from EC headquarters.Since the arrival of the Contract Agent in September 2008, the EUD has taken part in a joint DPcoordinated dialogue with GoL, currently revolving around the completion of the ESP. Since September2008, the EUD has been active in four forums established to maintain policy dialogue with the Ministry ofEducation. Discussions with the GoL and the DPs on the sector priorities were carried out in the inceptionphase of ECSEL (March – April 2009) and in the first ECSEL steering committee meeting (June 2009).
In Uganda, in the education sector, the EUD has regularly participated in the Education Donors Groupwhich meets monthly and generally attended by 8-15 donor agency staff. The local agent in the economicand social affairs section has traditionally represented the EUD. Since her arrival in mid-2008 anexpatriate contract agent has also participated in the meetings. Based on the minutes available,according to the ECA report, the EC’s contribution has been quite limited but it has increased in 2009mainly because of its involvement in the work on health and education indicators for the JAF. The localagent for education has also normally attended the higher level Education Sector ConsultativeCommittee, a joint GoU – donor group, which meets every 2-3 months with typically approximately 40people attending. From the minutes available to ECA, the EUD has had little input into this forum, partlyreflecting the fact that education is not a focal sector for the EC as well as the large number of personspresent at these meetings. The main feedback on GBS contained in 2007 Joint Annual Review is that‘”the GBS operation has continued to provide a credible platform for a constructive dialogue between theEUD and the Government services, as well as with other Development Partners active in this field”.According to the ECA report, this overstates the contribution of GBS to promoting dialogue because,while a significant channel, it is by no means the only one: in particular there is the Article 8 Dialogue, theLocal Development Partners Group framework for all donors, and the leading role played by the EC in thesectoral dialogue in its two focal sectors. The ECA report noted that the EUD has not made full use of theopportunities for dialogue presented by GBS, largely because of limited staff resources.
In Namibia, the policy dialogue has not yet reached its full potential. Policy dialogue between GRN andthe EUD takes place trough existing instruments laid down by the GRN and the donors active in theeducation sector, such as the technical and annual reviews and bi-monthly meetings. In practice, thepolicy dialogue between GRN and the EUD has been closely tied to the review process. The delays andrather erratic review process, as well as its focus on specific prior actions, have not been conducive to amore strategic sector policy dialogue. The problems related to the release of annual tranches and the lackof an effective monitoring system has also limited the quality of the policy dialogue.
The EUD is trying to enhance its dialogue with the GRN in the framework of the ESPSP formulation underthe 10th EDF by seeking ways for ETSIP to better align with EFA and MDG2 goals, and focusing more onequity issues and primary education. One of the main challenges for the EUD is to convince the GRN tofocus more on equity aspects (e.g. to provide true free schooling).
In Burkina Faso, the EUD is a member of various coordination authorities between the GBF and the DPfacilitating discussion at all levels (global and sectoral). Thus, the EUD is involved in the general

Thematic global evaluation of European Commission support to the education sector in partner countries(Including basic and secondary education); Final Report Vol. IIb, December 2010; Particip GmbH
212
framework for budget support (CGAB), which structures the relations between the DP and the GBF in theimplementation of the PRSP. There are six sectoral and thematic committees (CST) - among which oneis specifically focused on education- in the CGAB, in which the DPs are observers. Since 2002, the EUDis one of the 13 DP supporting, in consultation, the implementation of the PDDEB. This frameworkprovides a clear timetable for consultations and discussions to monitor the implementation of annualaction plans of the PDDEB. In this capacity, the EUD participates in reviews (common monitoringmissions) and meetings between DP and GBF (quarterly meetings and technical meetings, particularlythe thematic steering group) as well as in the coordination mechanisms / regular meetings of theeducation DP.
Non State Actors are also strongly involved in political dialogue (they are part of the partnershipframework for Education) as well as in the implementation of activities funded by the government; inparticular in the field of literacy.
3.11.6 Timeliness and quality of monitoring efforts, including actions in case of problems
The effectiveness of the EUD management and monitoring has been assessed by the ECA audits inTanzania, Niger, Namibia, Liberia and Burkina Faso:
In Tanzania, outcome indicators are assessed by the DPs in the Education DPG and throughannual sector performance reviews. The EUD did not take part in this process for 2008 and 2009.
Up to September 2008 the EUD actively monitored education outcomes. As the chair person ofthe Education DPG and as a member of its troika, the Delegation had significant influence on theeducation sector through the participation of the former education programme officer. Until thesignature of the MoU with DFID in October 2009 limited work was done by the Delegation in thisrespect.
Until September 2008 the EUD actively tested the reliability of the statistics and indicators. Theresults of a contract with UNESCO to improve the ESMIS system were only partly used after thedeparture of the education programme officer, as a substantive follow-up of the project was nolonger possible. A contract agent recently recruited by the Delegation to carry out povertymonitoring is now responsible for the monitoring of the project.
In the past, the EUD took direct action when education outcomes were deemed not to be ontrack. This was mainly possible because the former education programme officer was an activeand leading member of the Education DPG.
In Namibia, the progress reports provided by the Ministry of Education to ECA did not provide theinformation needed to monitor education outcomes and review meetings are still focused onprogress for prior actions and processes. Also, the different results frameworks for ETSIP and theESP financing agreement do not allow for a strategic analysis of the education sector progressand the Ministry’s reporting on ETSIP is not aligned with the ESP framework. It was also found byECA that the EMIS, which serves as a basis for GRN’s reporting, has in itself some shortcomings.Quality assurance reviews of the progress reports, annual implementation support missions andprocurement audits, foreseen in the financing agreement, have not been carried out. The EUDprovided support to improve the performance of the National Institute for Statistics and educationstatistics are considered by the EEP and other TFP as good. However, the EEP has no furtherinformation about the reliability of data used.
In Liberia, the EUD had timely and relevant information available to measure outputs and monitoroutcomes, including quarterly reports and the June 2009 report containing the situation analysisand the ECSEL inception report. It has mainly monitored education outcomes through thecoordinated efforts of the DPs in the education sector where UNICEF is currently the lead DP,while focusing its own efforts on the operational aspects of ECSEL. The Delegation has notapplied any methods to test the reliability of official education statistics.
Between August 2007 and September 2008, the EUD did not have an officer dedicated tomonitor the ongoing ECSEL project. Since then a full time CA has been assigned to the task.Support from HQ (AIDCO’s thematic unit) was regular and included missions until the end of2008, while there was a lapse in the support in 2009. The ROM mission in September 2009provided a clear assessment of the state of implementation of ECSEL, but it was carried out toolate to function as a corrective, early warning mechanism.
Due to the lack of staff the EUD was unable to follow-up on the many pending tasks related toESCEL between August 2007 and September 2008, which was the main reason for the project’sdelay. Despite interventions from the highest management level, the Commission was unable to

Thematic global evaluation of European Commission support to the education sector in partner countries(Including basic and secondary education); Final Report Vol. IIb, December 2010; Particip GmbH
213
respond to the staff needs in time to keep the project on track. Both a dedicated Delegation CAand the long term TA are now in place to ensure the day-to-day management of ESCEL. TheEUD conducts its policy dialogue through active participation in three different DP/GoL forumsand has contributed through discussions in the inception phase for ECSEL and in the appraisal ofthe ESP.
In Niger, the EUD has information to measure the achievements and track results. However, itsavailability is late and its quality is often inadequate. The EUD does not have any monitoringdocument resuming its strategy, objectives, activities and expected outcomes in education.
In Burkina Faso, the EUD has information to measure achievements and track results. However,the provision of timely and quality information is often insufficient.
The monitoring of results is done by indicators that are not always updated after revisions of thePRSP or PPDEB. The cost of monitoring, the number of structures for dialogue and the diversityof financing instruments remain important. The EUD does not have any synthesis documentallowing an internal and structured monitoring of indicators, activities and expected results inbasic education.
The education statistics are considered by the EUD and other DPs as good although someinconsistencies exist in the data produced by the Ministry of Basic Education. It should be notedthat the indicators of access to primary education are being revised downwards based on datafrom Census 2006 population.
In Niger and in Burkina Faso, the cooperation strategy of the EC fits into the Poverty ReductionStrategies of the countries, mainly via Budget Support. Budget support is monitored by theimplementation of a matrix of performance indicators. According to ECA, the indicators used forthe 9th EDF constitute a good basis for the monitoring of the basic education sector in terms ofaccess but are inadequate for the monitoring the quality of education and reduction of disparities.Under the 10th EDF, the number of indicators is judged as insufficient to ensure disbursementlinked to progress in the sector, which should be compensate that through dialogue on the basis ofindicators from sector plans. Nevertheless, the EC has no specific guidelines regarding the scopeof sectoral dialogue in General Budget Support.

Thematic global evaluation of European Commission support to the education sector in partner countries(Including basic and secondary education); Final Report Vol. IIb, December 2010; Particip GmbH
214

Thematic global evaluation of European Commission support to the education sector in partner countries(Including basic and secondary education); Final Report Vol. IIb, December 2010; Particip GmbH
215
4 Annex 5: Focus Group Analysis (Results of video-conferenceswith a sample of EU Delegations)
List of abbreviationsACP African, Caribbean and Pacific Group of StatesADB Asian Development BankCBO Community-based OrganisationCPI Corruption Perception IndexD&D de-concentration and decentralisationDANIDA Danish Agency for International DevelopmentDCI Development Cooperation InstrumentDfID UK Department for International DevelopmentDoL Division of labour meetingDP Development PartnerDPAC Development Partner Advisory CommitteeEC European CommissionERFKE Education Reform for the Knowledge EconomyESWG Education Sector Working GroupEU European UnionEUD European Union DelegationGBS General Budget SupportGEQIP General Education Quality Improvement ProgrammeHRDP2 Human Resources Development Programme 2ICT Information and Communication TechnologiesIDB Inter-American Development BankMDG Millennium Development GoalsMoE Ministry of EducationMoF Ministry of FinanceMS Member StateNGO Non-Governmental OrganisationOECD-DAC Organisation for Economic Co-operation and Development – Development Assistance
CommitteePBS Protectoral of Basic Service Delivery System (multi- donor trust fund in Ethiopia)PEFA Primary Education for AllPETS Public Expenditure Tracking SurveysPFM Public Finance ManagementPNG Papua New GuineaPRSP Poverty Reduction Strategy PaperSBS Sector Budget SupportSIDA Swedish International Development Cooperation AgencySSP Sector Support ProgrammeTA Technical AssistanceTVET Technical and Vocational Education and TrainingUNICEF United Nations Children's Fund

Thematic global evaluation of European Commission support to the education sector in partner countries(Including basic and secondary education); Final Report Vol. IIb, December 2010; Particip GmbH
216
4.1 Introduction
4.1.1 Purpose and objectives
In order to further strengthen the evidence base for the evaluation (i.e. beyond the desk study and thecountry visits), three video conferences have been organised with a number of selected EU Delegations(EUDs), each of which formed a focus group. Facilities available at EuropeAid premises in Brussels wereused. The specific purpose of focus groups was to cross-check evaluation findings and conclusions onselected topics.
Main research question
The purpose of the sessions was to get a clear appreciation / assessment from the target groups on howthey perceive successes and, possibly, failures of EC support to education in their respective country, aswell as the changes it may have brought about or supported. Thus the main research question was asfollows:
To what extent has EC support to education, direct or indirect (e.g. through General BudgetSupport (GBS)), contributed to improving education sector outcomes and impacts in the country?
Answers to this question were obtained through a sequence of questions that the groups were asked todiscuss. The main issues were the following:
1. Access issues
2. Service delivery, transparency and accountability
3. Coordination, complementarity and synergy
4. Aid modalities
Generally speaking, the interviews had the following characteristics:
Emphasis was on obtaining feedback on processes and developments/trends over the evaluationperiod 2000-2007, as identified in the Desk Report and during the field visits;
A selection of Evaluation Questions and Judgement Criteria were tackled;
Questions were open-ended, not pre-empting judgements. Their selection however was based onfindings and preliminary conclusions arrived at thus far.
A focus group protocol is annexed.
4.1.2 Methodology
4.1.2.1 Target groups
The target groups are representatives of the following:
Delegation staff dealing with education and/or
Delegation staff dealing with GBS
A maximum of two staff members per EUD participated.
Initial information on the technical limitations of the system suggested that only three EUDs could beinvited for each session. Further research revealed that it is possible to add many more. So the initial ideaof having a maximum of 3-4 conferences with three participating EUDs was adjusted to the following:three conferences with a maximum of about five participating EUDs. This was supposed to improve thelikely number of EUDs interviewed to about 15.
Each session was intended to last no longer than two hours. Time differences between the various timezones of where the EUDs are located were considered in the composition of the groups. Based on a rapidanalysis of the portfolio (based on inventory data produced by the evaluation), the evaluation teamsuggested conferences with the following countries:

Thematic global evaluation of European Commission support to the education sector in partner countries(Including basic and secondary education); Final Report Vol. IIb, December 2010; Particip GmbH
217
Table 31: Countries suggested for the video-conferenceACP ASIA ENP - MEDA ENP –
TACISLATIN AMERICA
Madagascar (GBSmainly)
Cambodia (mix ofmodalities)
Jordan (SectorBudget Support(SBS))
El Salvador(secondaryeducation, sectorsupport)
Kenya (GBS mainly) Myanmar (support viaUNICEF, starting endof evaluation period)
Morocco (sectorsupport, basiceducation)
Ecuador (mainsupport after 2007)
Zambia (SBS)* Paraguay (mainsupport after 2007)
Fiji (SBS)Ethiopia (GBS mainly)Papua New Guinea(sector support,projects)Zimbabwe (EducationTransition Programme)Somalia (projects,sector support underway)
* Millennium Development Goals (MDG) contract countryCountries marked in grey: could not participate in the focus group, due to time constraints
Overall, 12 EUDs participated out of a total of 15 who had been invited to participate.
4.1.2.2 Composition of the focus groups
Two hours were set aside for each conference. EUDs were invited by EuropeAid Headquarter in Brusselswhich provided the conference rooms and technical support for all participants and organisers.Considering time differences and in order to try and establish a suitable mix, the video-conference groupswere finally composed as follows:
Table 32: Final composition of focus groupsGroup 1*
July 5Group 2*
July 5Group 3*
July 58.30 – 10.30 11.00 – 13.00 hours 16.00 – 18.00 hours
Madagascar Cambodia El SalvadorJordan Somalia MoroccoEthiopia Zimbabwe ParaguayPapua New Guinea EcuadorFiji
4.1.2.3 Methods for data analysis (their limits and constraints)
The analysis of the three focus groups was based on the transcription of the taped focus groups.Following some assumptions per questions, the analysis focused on:
Frequency of occurrence of ideas
Order of appearance of an idea
Common patterns within the focus group and between groups
Non-mentioned ideas
Limits:
It is important to keep in mind the following limits of this qualitative analysis
The data collected cannot be completely assigned to the evaluation period: Even if participantswere aware of the evaluation period, they had either no deep knowledge of the evaluation perioddue to the fact that they started at their duty stations after 2007 or emphasized recentdevelopments and coming events which were more present and important for the participant.
Thematic global evaluation of European Commission support to the education sector in partner countries(Including basic and secondary education); Final Report Vol. IIb, December 2010; Particip GmbH
218
Only six out of 14 participants started their tasks with the EUDs before the end of 2007 (out ofthese two started during 2007). One participant has been in the EUD since 2005 but has been incharge of social affairs including education only since 2008.
There are a number of countries whose financing modality changed after the evaluation period orat the very end of the evaluation period. This is the case for:
o El Salvador: change from a individual project financing to a SBS for secondary educationin November 2009;
o Morocco: change from SSP (Sector Support Programme) to SBS in 2006;
o Paraguay: individual Projects until 2006, GBS from 2007 onwards and SBS fromDecember 2009;
o Ecuador: SBS for education from 2008.
Specific country situation which changed the political and economical context as well as financingmodalities at the end of the evaluation period/after the evaluation period and whose impacts stillstrongly affect today’s EC support to the education sector:
o Zimbabwe: suspension of sector support programme to a Trust Fund modality in 2006,the “Education Transition Fund Programme”;
o Ethiopia: suspension of GBS in 2005 to continue with a SSP, the “Protection of BasicServices System” (PBS).
4.1.3 Structure of the report
After a short introduction, the following section provides summarised answers to the questions asked inthe focus group. Every question summarises first each participant’s view before trying to identify trendsand to draw conclusions.
4.2 Findings
4.2.1 Introduction
The focus group discussion began with an introductory, open question. Participants were asked “Whatcomes to your mind when thinking of EC support to the education sector in your county, especially relatedto the support to basic and secondary education?” Further, participants were asked to describe the moststriking trends and characteristics in their country in the education sector.
Characteristics and trends of each country in brief:
Papua New Guinea (PNG): EC support financed mainly 1) infrastructure in secondary and vocationalschools and 2) the governmental reform (through the HRDP2, Human Resources DevelopmentProgramme) and 3) improvement of primary education facilities for rural schools with a particular focus onfemale students. The EUD seemed to work quite closely with the government e.g. the training of publicservants and teachers through the HRDP2 programme was quite successful, according to the EUD. Aproblem faced was with land owners who did not want to cooperate when it came to constructing newschool buildings.
Jordan: EC support had, to a great extent, supported the Jordanian education reform97 from 2006onwards, with approx. € 42 million through SBS. A second stream of funding came from the DCI(development cooperation instrument) fund and was directed towards Iraqi refugees in Jordan. Thetrends in Jordan’s education sector were:
the implementation of the “Education reform for the knowledge economy” (ERFKE), especially theintroduction of ICT (Information and communication technologies) in schools;
the increase of early childhood education, e.g. the expansion of kindergartens.
The main challenges were:
the increased number of pupils changing from private to public school due to the financial crisis;
the constant reduction of the education budget in the last three years as an answer to thesubstantial deficit in public finances.
97 Education Reform for the Knowledge Economy (ERfKE), 2003-2007

Thematic global evaluation of European Commission support to the education sector in partner countries(Including basic and secondary education); Final Report Vol. IIb, December 2010; Particip GmbH
219
Fiji: The particularity of the € 21 million EC support to Fiji was that the conceived sector supportprogramme to education was finally delivered as a project modality. It focused on infrastructureconstruction and upgrading of existing school facilities (e.g. water sanitation and solar power) in theremote islands and rural areas and in the most disadvantaged schools.
The characteristic of the support was, according to the EUD: “a very infrastructure-driven programme, itlooks at physical access and facilities and very little on the quality of the education being delivered.”
The future challenges for EC support to the education sector in Fiji are:
developing the dialogue with the interim government in the education sector;
focusing on disadvantaged students, especially during the period of the financial crisis;
tackling the multiple use of newly built schools e.g. as a shelter for storms also during the schoolperiod.
Madagascar. The education sector was only supported indirectly through GBS and was, according to theEUD, not a priority. Only approx. 20% of GBS funding went to the education sector, mainly toinfrastructure interventions.
The ‘Education for All’ initiative has been adopted in 2005 and is the intervention in the education sectorwhich links all donors. Madagascar was allocated USD 60 million from the Catalytic Fund from 2005 to2008.
The political crisis at the beginning of 2009 interrupted the implementation of the programme.
Ethiopia: The EC provided support to the education sector indirectly (until 2006 through GBS and todaythrough the multi-donor trust and the PBS.
The direct support provided funding for the education sector development programme and fundedtrainings and workshops as well as the provision of Technical Assistance (TA) to improve textbooks andeducation curricula for primary education and the development of the GEQIP (General Education QualityImprovement Programme)98. Indirect support was given to the education sector through the PBS, whichallocated 34% of total funds to the education sector.
Ethiopia has achieved the MDG2 goal “providing compulsory education for all” in 2008, by 100%. Eventhough access is almost universal in Ethiopia the challenge for the future will be to improve quality in theeducation sector, as quality has declined rather than improved with the increase in access, according tothe EUD.
Cambodia: Cambodia has used SBS since 2003. According to the EUD, the EC was a key partner for thegovernment in the sector of primary education and has “done a lot in terms of aid effectiveness, aboutattracting all other donors in one programme based approach”.
In complementarity to the SBS, the EC has continuously supported Non-Governmental Organisations(NGOs) and community-based organisations (CBOs) to fill the gaps in the implementation ofgovernmental policies, especially in remote provinces.
The main focus of EC support was on the improvement of the quality of education using teacher training,reducing drop-out rates and improving gender equality.
Zimbabwe: EC support before 2006 concentrated mainly on secondary education and provided physicalinfrastructure and equipment to schools. The support was interrupted in 2006 due to the political crisis. Apooled funding mechanism, ‘the education transition fund’ was put in place. The EC is one of the maincontributors to the fund.
Somalia: EC support was based on a sector-wide approach which is intensely discussed with both thethree regional and autonomous administrations in Somalia and the different Development Partners (DPs).The Somalia Operation Unit highlighted that although it is not possible to apply SBS, they tried to applythe principles of SBS as much as possible.
EC support to education focused on primary education (50% of the funds). The education situation inSomalia varies substantially depending on the region.
Paraguay: EC support has been delivered from 2006 onwards via GBS, where one of the social servicesrelated variable tranches was dedicated to education. Specific education SBS started in 2009.
98 € 3 million

Thematic global evaluation of European Commission support to the education sector in partner countries(Including basic and secondary education); Final Report Vol. IIb, December 2010; Particip GmbH
220
The EUD highlighted that approx. 90% of the education budget is made up of fixed expenditure. ECsupport concentrated on access to school in remote and poor districts by e.g. building and renovatingschools or roads.
Morocco: Since 1998, EC support had the objective of improving access and quality in schools,especially:
reducing the gap between private schools and public schools which are often in a bad condition;
reducing the gap between rural and urban areas;
Closing the gender-gap especially in secondary education and reducing the female drop-out rate.
EC support was delivered through two different modalities: from 1998 to 2006 through a € 20 millionproject approach. From 2006 to 2008 there has been a first SBS of € 20 million and a second SBS of € 93million.
Ecuador: Up until 2008, EC support to education consisted of a very small intervention dealing with theinclusion of marginalised children. From 2008 onwards Ecuador received SBS. The shift to SBS has beenachieved without previous experience of sector support in Ecuador. It has been made possible as the2006 Ten Year Education Plan of the new Ecuadorian Government, which was approved via areferendum, was inline with EC development goals and international commitments.
The challenges related to SBS were to make the Ecuadorian authorities understand what SBS is and howit works. After three years SBS seems today to be the preferred aid modality, according to the EUD. TheSBS 2008-2010 was linked to access and coverage of primary education and also to the reform of PublicFinance Management (PFM). The 2011 SBS will focus on quality of education and institutional reform ofthe sector.
El Salvador: Between 1999 and 2004 the EC contribution to the education sector was mainly aimed at thesecondary technical level and focused on quality aspects, the ‘APREMAT’ project99. The SBS whichstarted last year has again been an intervention directed towards secondary general education and willfocus on increasing the graduation rate of students in secondary schools (7th to 11th grades) and also inrelation to ICT.
Aid modalities
The following table provides a short overview of the main aid modalities (and channels) used in thecountries participating in the focus groups (FG).
Table 33 : Aid modalities (and channels) applied in the focus group countriesFG Country Financing modality
GBSMadagascarFinancing of Trust Funds
SBSJordanIndividual Project
GBSEthiopiaSSP
Individual ProjectPapua New GuineaSSP
FG 1
Fiji Individual ProjectSBSCambodia
Individual ProjectSomalia Individual Project
SSP
FG 2
ZimbabweIndividual ProjectIndividual ProjectEl Salvador
SBSSSP
FG 3
MoroccoSBS
99 APREMAT - Amélioration de l'enseignement secondaire technique, ALA/1997/002-405

Thematic global evaluation of European Commission support to the education sector in partner countries(Including basic and secondary education); Final Report Vol. IIb, December 2010; Particip GmbH
221
FG Country Financing modalityIndividual Project
GBSParaguay
SBSIndividual ProjectEcuador
SBS
In grey: financing modalities which started after 2007
4.2.2 Research question 1: Access issues, primary and secondary
In this section, participants were asked to state which of the following statements corresponds best to ECeducation support in the country:
“EC support has …
1. significantly contributed to both improved access to and quality of basic education in the country
2. significantly contributed to access to basic education but neglected quality aspects
3. not substantially contributed to increasing access to basic education in the country, nor toimproving quality
4. not really tackled secondary education issues, including access and quality”.
4.2.2.1 Main findings:
Focus group 1
Voting
In this focus group, four of the five participants chose statement number 2 (EC has improved access tobasic education but neglected quality aspects) as best describing the situation in the respective countries.Hence, only Madagascar and Papua New Guinea voted unrestrained for this statement, whereas Ethiopiacharacterised the country situation somewhere between the statements 2 and 4. The EUD in Fiji couldnot fit the country’s situation in one of the four options at all. The reason for this non-appropriateness ofone option is related to the fact that the EC education support programme was used to upgrade existinginfrastructure only100. Nevertheless, the EUD would rather not speak of improvement in access toeducation. For the quality aspects, this was more the part of AusAid than of the EC. The EC was henceinvolved in the support to teachers (preparation to teach in very remote areas) and in the provision of textbooks.
The EUD in Jordan stated that EC support has improved the quality in the education sector (primary andsecondary education), as access was (besides a few exceptions) not a problem and coverage rate isalmost universal. Hence, the representative nuanced statement 2 in the way that he would not use theword “substantial” to characterise the improvements in quality. “I think that things take time – especially inthe education sector that is a huge machine, the impacts take time to take place. So our contribution hasbeen important.”
The EUD in Papua New Guinea (PNG) was clearly in favour of statement 2 when referring to EC supportduring the evaluation period. Today, quality is seen as an important aspect and is addressed in thecurrent HRDP2101 programme. This is done through the distribution of 2.5 million textbooks in all primaryschools. EC support also financed teacher trainings. Moreover, the EUD in PNG also subscribed to thestatement that the improvement of quality takes time and the impact of today’s new programme will onlyshow in a couple of years.
Also Madagascar voted clearly in favour of statement number 2. Although financial support from the ECto the education sector was only indirect via GBS, the EUD stated that the support has contributed toincreasing access to basic education but had to neglect quality aspects in order to tackle the mostproblematic issue, which concerns access to education for all, due to a substantial increase in school-aged children.
100 The funds were used to upgrade existing facilities or to provide district education officers with boats or vehicles toincrease their mobility and to visit remote schools. The EUD Fiji indicated that the highest impact of EC support wason the provision of solar lighting, which according to the EUD, is extremely important in the country as most of theschools include dormitories.101 FED/1998/014-134

Thematic global evaluation of European Commission support to the education sector in partner countries(Including basic and secondary education); Final Report Vol. IIb, December 2010; Particip GmbH
222
“We cannot really say that we have neglected quality aspects because it was simply impossible to getto increase the number of school attendants and to increase the quality (at the same time)” (..) In sixyears we have multiplied by three the number of children in primary school (..). Of course the quality ispoor and that is a new issue for the coming year of course.”
The EUD in Ethiopia, as with Madagascar, admitted that quality had been neglected but that it has been aforced choice in order to first tackle the more urgent issue of access to education.
“Ethiopia probably has the lowest education rates on earth… Access is hugely important because mostrural areas did not have school – 86 % of the population (..). So the access was incredibly urgent. ThePBS (Protection of Basic Services Program) dealt with access first, not because there was a consciousdecision to say ‘let us not talk about quality’, it was rather that we had all these school children agedstudents who were not captured into the education sector. (..) So quality has definitely been neglectedand the government and the donors are the first to admit this.”
That is, in the coming education sector development programme (from 2010 onwards) quality will bemore in the focus than before, as “we had a very strong recognition that access is on the right track butnow we need to catch the quality as well”. The EUD representative indicated that, even if EC support hasnot directly tackled quality in the past, it has done so indirectly through the Catalytic Fund, as it hassupported the GEQUIP.102 Moreover, due to the important need to support primary education in Ethiopia,secondary education issues have not really been tackled. But the EUD is convinced that secondaryeducation will be indirectly concerned by the actions funded in the primary education sector in the future.
For the Fiji EUD representative none of the statements were really applicable. EC support mainlyupgraded existing school facilities (e.g. through the provision of solar lighting) and provided better accessto remote schools (through the provision of boats and vehicles to the district officers) but did notcontribute to increasing access to education. Furthermore, quality aspects of education were mainlysupported by AusAid in the form of teacher training and curriculum training without the involvement of theEC. Hence, an interesting project financed by the EC is the support to teachers in order to prepare themfor their first posting in a rural area or a remote island school.
Specific actions of the countries
In some countries EC support especially focused on specific target groups:
The focus in Jordan, where the EC is the only donor in the country using SBS, has been onvulnerable groups in the education sector. According to the EUD, EC support has made a realdifference and added value.
In Papua New Guinea, one of four EUD thematic budget lines is using an inclusive educationapproach. A programme financed through this budget line is assisting students with disabilities.According to the EUD, the mainstreaming of this subject in government’s policies has improved.Today, the Department of Education has taken up ownership of this programme and paysteachers who have been trained by EU funding.
In Papua New Guinea and Fiji EC support has been given to primary as well as to secondaryeducation. Only in Ethiopia has secondary education been neglected in order to concentrate onaccess to primary education.
Focus group 2
All three participants of this focus group voted in favour of statement 1, i.e. that both access and qualityhave been improved, even if such a vote has to be put into perspective.
For the EUD in Cambodia, EC support has contributed to improving access and quality, but the overallquality must still be described as poor. In the opinion of the EUD, EC support is best described as amixture between statement 1 and 2. It is worth highlighting that EC support has significantly contributed tostrengthening dialogue on quality issues, according to the EUD.
Only Zimbabwe stated that EC support to education has mainly addressed quality aspects within theevaluation period, as basic education was already at a high standard at the beginning of the year 2000.But during the last five years a decrease in access as well as in quality has been registered due to thepolitical crisis. He attributed the decrease in quality mainly to a significant brain drain of teachers to SouthAfrica. Nevertheless, even if in general terms quality seemed to have declined, the EC is still financingactions related to quality in the education sector such as teaching materials and books.
As for Somalia, especially in Somaliland, the gross enrolment rate has risen up to 45% in 2010 and thiscan largely be attributed to EC support, according to the EUD. Moreover, according to the representative,
102 The Catalytic Fund of the FTI has supported the Quality improvement programme with USD 98 million in 2010

Thematic global evaluation of European Commission support to the education sector in partner countries(Including basic and secondary education); Final Report Vol. IIb, December 2010; Particip GmbH
223
the EC has started a programme of systematic teacher training and certification in 2007103 and is presentlythe only one doing this in the country. “We believe it has a very strong impetus”.
Some specific support in the countries
In Somalia the specific focus of EC support was on gender balance, e.g. on the improvement of thefemale teacher rate.
Further, adult education was another focus as the literacy rate in Somalia is under 20%104. This isespecially true in rural areas. The EC has financed several literacy programmes which were establishedin close collaboration with community education committees (due to the lack of governmental structures).In addition, a particular problem remains in rural areas where overcrowded classrooms with up to 100children and a lack of sufficient teaching materials are particularly serious.
Due to the nature of EC support in Cambodia, which is SBS, support was focused on the Ministry ofEducation (MoE). The support was directed in particular towards the design and implementation of itspolicies, e.g. the Education Sector Strategic Plan or a policy on education for children with disabilities(March 2008). According to the EUD, all policies are linked to inclusive education, which, in Cambodia,covers disabled people, girls and indigenous communities.
Another specific target of 2007 SBS was the extension of non-formal education, which is a topicespecially important in remote and rural areas in which indigenous people live. There, according to theEUD, the EUD is working closely with NGOs and civil society in order to improve access to remoteschools.
For Zimbabwe neither remote areas nor gender were particular issues at primary level. The pictureslightly changed when looking at the secondary level. But EC support within the Transition ReformProgramme focused in particular on disadvantaged children.
Focus group 3
The situation in focus group 3 was more divided. Two countries were in favour of statement 1 (ElSalvador and Morocco) while Ecuador and Paraguay opted for statement 2.
In Paraguay the main focus in the education sector during the three years of GBS105 was to improve theenrolment of the third cycle of basic education in 66 districts with the highest level of poverty. Actionsfinanced were e.g. the renovation of schools and school facilities. In the Sector Budget SupportProgramme of 2009106 the focus has subsequently been placed on quality issues.
Also in Ecuador, the main focus was on access and coverage issues. However, according to the EUD,quality issues have not been deliberately neglected, but it was “an informed decision to focus moreaccording to the needs on access and coverage in this 1st phase of the SBS to the education sector”. Astoday the net enrolment rate is approximately 93%, the focus of the government is clearly to speed upactions in support of quality as e.g. completion rate is a problem. Further, the EUD indicated thatsecondary education was not really tackled in the SBS107.
However, due to the very small contribution of the EC to the overall education budget of Ecuador – duringthe last three years a total of € 41 million have been allocated, which is approximately 10 % of the sectorbudget – the EUD did not agree with the wording ‘significantly’. “The question was more to accompanythe sector and to engage in very deep and fluent political dialogue.”
The Morocco EUD saw its contribution between statement 1 and 3, as EC support contributed verysignificantly only in those regions in which support was focused. As in Ecuador, EC support to theeducation sector contributed only to a small proportion of the overall sector budget and thus cannot beclassified as ‘significant’. There were some focus regions where EC programmes have been particularlysignificant and were taken as an example for the 2008 emergency education plan of the Moroccangovernment.
In the case of El Salvador there had not been a project in the primary education sub-sector until the startof the 2009 sector support programme. The current SBS108 focuses especially on the increase ingraduation rate, the fight against early drop-out and the increase in access to computer education. Butagain here, the main scope of support lies in secondary education.
103 “Enhanced Quality and Learning in Somaliland and Puntland”, ONG-PVD/2006/018-227104 World Bank, 2002105 ‘Programa de apoyo presupuestario a la lucha contra la pobreza focalizada ‘, ALA/2006/018-053106 € 54 million, SBS to Paraguay, 2008107 “Improving Global Social Spending – Education”: € 12 million (2009)108 € 25 million; SBS “Social Cohesion” (2009).

Thematic global evaluation of European Commission support to the education sector in partner countries(Including basic and secondary education); Final Report Vol. IIb, December 2010; Particip GmbH
224
Moreover, in terms of quality, the EC financed the project “APREMAT” from 1999 to 2004109 which wasdesigned to support 22 national institutions training students in technical secondary education.
4.2.2.2 Conclusion
To summarise:
Five out of 12 participants were in favour of statement 1, saying that EC support has improvedboth access and quality;
Seven out of 12 participants were in favour of statement 2, saying that EC support has contributedto improving access to basic education but neglected quality aspects;
Two participants respectively were in favour of statement 3 (no substantial increase in access orquality) as well as 4 (secondary education aspects have not been tackled).
Within focus group number 1, four out of five participants were in favour of the statement ‘The EC hasimproved access to basic education but neglected quality aspects’. For Madagascar, Ethiopia and tosome extent Papua New Guinea, it has been a decision to neglect quality issues due to the urgency toimprove access in these countries. Nevertheless, quality issues started to be focal areas of concern in thecoming programmes as access issues are seen as being on track. The focus in Jordan was placed verymuch on quality, as access and coverage is almost achieved yet.
Focus group number 2 was in favour of the statement ‘The EC has significantly contributed to bothimproved access and quality of basic education in the country’. In Zimbabwe, EC support was mainlyconcentrated on quality issues during the period 2000 to 2006, as access to basic education was quitehigh at the beginning of the millennium. Albeit the fact that Cambodia and Somalia were in favour of thestatement that EC support has improved the quality of basic education, both EUDs highlight that quality isstill very poor in their countries.
The participants in focus group 3 were divided between statement 1 and 2. Ecuador and Paraguay optedfor statement two for different reasons:
In Paraguay the focus of the past GBS laid clearly on access. Now, the current SBS programme focusesmore on quality. In Ecuador it was an “informed decision” to neglect quality in the first phase of theSBS, similar to Madagascar (in the GBS), Ethiopia (in the GBS) and PNG (in the projects).
Morocco and El Salvador were in favour of the statement that both quality and access had beenimproved, but only to a certain extent. In Morocco education support was only targeted to certain specificregions and in El Salvador, SBS targeting primary education has only just started after several yearswithout any funds being committed to this sub-sector.
A recurrent feature is that a lot of participants could not chose one option but were the opinion that theircountry was somewhere in between two statements. This was the case for Ethiopia (statements 2 and 4),Cambodia (statements 1 and 2), Zimbabwe (statements 1 and 3), Morocco (statements 1 and 3) andEcuador (statements 2 and 4). The main reason for not choosing one option was the fact that ECsupport neither supported the education sector "significantly" nor “substantially", but wassomewhere in between.
Countries which chose statement 2 (i.e. Madagascar, Papua New Guinea, Ethiopia, and to a certainextent Cambodia, all in all 7 out of 12 countries) stated that quality issues will be tackled in futureprogrammes. There seemed to be a clear recognition that quality was neglected in the countrieswith the least developed education level.
It should be noted that in four out of 12 countries EC support has been especially targeted towardsdisadvantaged groups, especially girls, socio-economically disadvantaged people, indigenouscommunities or disabled people, thus taking up policy guidelines given in the CommissionCommunication "Education and training in the context of the fight against poverty in developing countries"(COM(2002) 116) and the Council Resolution on "Education and poverty" (Resolution EC 8958/02).
4.2.3 Research question 2: Service Delivery
Participants were asked to answer the following questions:
What role has EC support played in creating conditions for effective service delivery?’
What role has TA played in capacity building and what role should it play?
109 ALA/1997/002-405

Thematic global evaluation of European Commission support to the education sector in partner countries(Including basic and secondary education); Final Report Vol. IIb, December 2010; Particip GmbH
225
4.2.3.1 Main findings
Focus Group 1
Service Delivery
The EUD in Ethiopia saw EC support as extremely effective in providing infrastructure all around thecountry and thus making education possible. Among other things, the EC had contributed to thedevelopment of textbooks and curricula and had also contributed to the delivery of these textbooks.Overall, service delivery had increased also via teacher training to which the EC contributed andespecially the development of teacher’s certification, in place since the year 2000.
But it is important to keep in mind that in Ethiopia, 91%110 of the allocated PBS budget for education wentto cover the cost salaries in 2010. Thus, it is clear that there is little room for manoeuvre regardinginvestments.
As for Madagascar, the EC contributed to the coordination of donors within a “cadre de partenariat”(partnership framework). According to the EUD the main impact of EC support was to enforce theallocation of a reasonable part of the global budget to the education sector. As a result, approximately 20% went to the education sector from which around 60% was geared towards primary schools. The EUDstated that the advantage of budget support has been the power of discussion and negotiation during theallocation phase.
However, according to the EUD, EC influence during the allocation process remained limited in a sense,as reliable statistics concerning previous GBS periods did not exist, and thus less valid information aboutresults and achievements, which implied that it became difficult to exercise more pressure on thegovernment and negotiate a higher budget allocation for the education sector. It should be added, thatlike in Ethiopia, most of the budget was spent on salaries.
In Papua New Guinea, the EC tried to support effective service delivery at a national level, as well as atsub-national and local levels. EC contributed on one hand to policies and standards under theresponsibility of the government as well as to the delivery of education services.
However, one of PNG’s main problems was sector management, which includes the tracking of fundscoming from the central government. To remedy this drawback and to improve service delivery atechnical working group was created which gathers donors and the government. According to the EUD,the deficits were also a result of the lack of capacities within the Department of Education. In response tothis, the EUD assisted the MoE with the training of ministerial staff.
Moreover, and in order to tackle the problem of remote areas, the EC also supported a specific teachertraining programme with the aim of preparing teachers for a position in remote areas. In this context it isimportant to note that the teachers were selected by the local community and not by the EducationDepartment, and rather were endorsed by the latter.
For the EUD in Fiji EC support has helped create conditions for an effective service delivery at schoollevel, as a better learning environment at this level is the main issue in Fiji. The EC had on the one handsupported renovation and infrastructure, the supply of equipment and text book distribution, but alsoprovided capacity building in terms of learning standards (e.g. tools to review the standards of schoolfacilities and to budget accordingly).
At Ministry level the EC supported the improvement of service delivery by providing better mobility to theDistrict Education Officers and to enable them to link more closely with remote schools. According to theEUD, this had had a very positive impact on the relationship between schools and the District EducationOfficers and was a very cost-effectives means of improving the quality of service delivery.
Also in Jordan, the EC contributed to enhancing effective service delivery by supporting improvements tocreate a good learning environment (renovation and construction of schools and the provision ofequipment) and through teacher training, as the EC seemed to be the only donor to provide this kind ofassistance. This support was given in the framework of the first phase of the education reformprogramme 2003-2007111. Moreover, according to the EUD, the EC has provided some key input at schoollevel especially regarding special education needs. However, the EUD stated, that problems arose inrelation to service delivery due to a lack of political will to tackle governance issues, especiallydecentralisation plans.
110 Figures of 2010111 In July 2003, the government of Jordan launched the Education Reform for the Knowledge Economy (ERfKE)initiative. This five-year USD 380 million program was supported with USD 14.2 million by nine donors.

Thematic global evaluation of European Commission support to the education sector in partner countries(Including basic and secondary education); Final Report Vol. IIb, December 2010; Particip GmbH
226
The role of technical assistance
In Jordan technical assistance has mainly been provided to the ministry and helped, on the one hand tostrengthen policy dialogue and on the other hand to create tools to measure underperformance andquality at school level and thus to create conditions for better service delivery. In the opinion of the EUD:
“Technical assistance is really a good instrument that has to be combined with the sectoral budgetsupport. (..). I think a good combination of technical assistance and budget support is the way tofollow.”
Madagascar did not have TA at all which was, in the opinion of the EUD, deplorable, as the EUD couldonly accumulate knowledge about the developments in the Ministry or in the sector in an indirect manner.In the future and in the framework of the backbone strategy, which the EUD is preparing, TA is planned tobe used, but it seems as if only little TA support will be allocated to the education sector.
Like in Jordan TA had been used in Ethiopia to build capacities within the Ministry of Education. Amongother things, TA was instrumental in the development of textbooks and curricula. The EUD representativefelt that TA was “extremely useful” and helped to improve service delivery all over the country.
However, a major problem faced in Ethiopia was the high turnover of Ministry staff in the context of the‘business process reengineering’ process in 2009 which hit the MoE worst. Today the EUD is againspeaking about a “capacity gap”.
In Fiji, TA had mainly played a project management role to oversee infrastructure delivery, which isunderstandable as support to education was provided via the project modality. Unlike in Jordan orEthiopia no capacity development took place at central level nor has the link to the Ministry and policydialogue been strengthened.
According to the EUD in Papua New Guinea, TA played and continues to play a very important role. TAwas as a combination of project management and capacity building, specifically in the Departments forTeacher Education and Vocational Education with the officers in the Ministry, but also in the teachercolleges. In the past, TA was also used to build capacities in the area of decentralised schoolmanagement and leadership within the local communities.
As in the case of Ethiopia, PNG also faced the problem that the Ministry seemed not to be in the positionto be able to keep relevant qualified staff and sustaining capacity development thus remained a constantchallenge.
Focus Group 2
Service delivery
In Zimbabwe, according to the EUD, EC support has helped to improve service delivery in the formersector support programme. As for other participants in the FG, service delivery concentrated on the onehand on equipment, infrastructure and rehabilitation and on the other hand on improving the quality ofteacher training. Today, the situation is different, and EC support has yet to address the issue of effectivedelivery; efforts are concentrated on delivery of textbooks for children at the primary level.
As for Cambodia, one part of SBS is devoted to capacity development which was delivered in the form oftechnical assistance to the MoE. It should be noted that EC support to service delivery mainly remainedat central level through the institutional strengthening of the MoE, especially in the fields of planning,general and fund management. According to the EUD representative this capacity building supportyielded important impacts.
In the last years, Cambodia has been implementing a de-concentration and decentralisation (D&D)process. Thus, as more funds were directly channelled to schools a D&D programme has been put inplace with the aim of specifically working on this issue. Capacity building at the decentralised level is alsotargeted in the education programme currently under preparation.
With the aim of drawing lessons from preceding programmes and of following a less fragmentedapproach to TA, a pool fund with SIDA and UNICEF, the ‘Capacity Development Partnership Fund’, willbe created within the new SBS programme to assist the Ministry of Education and other departments intheir capacity building. The overall aim is to make aid to the education sector more comprehensive aswell as strengthening decentralised levels, which are expected to have more responsibilities and funds tohandle. In addition to the Capacity Development Partnership Fund, the EUD would also like to workthrough civil society organisations and NGOs to strengthen capacities at the local level, especiallyprovincial and district officers and school management committees.
For the Somalia Operations Unit, service delivery could not be separated from capacity development. As,until recently, it was not possible to work directly with the three education ministries in Somalia, capacitydevelopment had to build on projects managed by implementing partners, mainly NGOs. These covered
Thematic global evaluation of European Commission support to the education sector in partner countries(Including basic and secondary education); Final Report Vol. IIb, December 2010; Particip GmbH
227
seminars, on the job training, etc. Nevertheless, according to the representative of the SomaliaOperations Unit, EC support has not been systematic until now, but this is in a process of change, as akind of sector approach has been developed.
The EC contribution to service delivery has been through teacher training (one of the flagships),infrastructure provision, mainly rehabilitation of war-destroyed schools, provision of textbooks (in theSomali language) and the development of curricula.
Technical Assistance
Cambodia used TA at the central as well as at decentralised levels. Existing TA is focused at centralMinistry level for the moment. At decentralised levels, TA will be directed towards provincial officers ineducation or district officers or school management committees. In order to reach these target groups it isplanned to work in close collaboration with civil society organisations and NGOs.
In accordance with the MoE, which is currently in the process of developing a mid-term capacity plan,capacity development will not only take place at an individual basis, but also at institutional level. Itseemed as if, according to the EUD, the latter has been neglected by many donors in the last years.Moreover, institutional capacity building in the education sector in Cambodia is quite complex as the MoEincludes youth and sports but excludes vocational training which is located in a second ministry and non-formal education is located in a third ministry. “It was a little bit difficult to see what are really the needs inorder to have an institutional strengthening of the education sector”.
As indicated above, there has been a recent shift regarding TA support to the education sector inCambodia. The aim is to harmonise all TA from different donors, and to arrive at a useful division oflabour which does not stop at one Ministry but takes a more holistic perspective by looking at the entiresector.
“This is very ambitious, we are not yet there but there is a move towards this and the pool fund forCapacity Building in the sector of Education will be a big step.”
As for Somalia, efforts were being made in a consortium with UNICEF and implementing partners tocreate a more structured approach to TA delivery. This is done in a new capacity development project112
which will, similar to Cambodia, strengthen the capacities of district and provincial offers.
Although capacity building has been a major component up until 2006 in Zimbabwe, TA has not played aprominent role. In the current programme, the pool funding includes TA as a result of the depletion of thelast five years. TA is used to: 1) help to redevelop a national plan for primary and secondary education; 2)review the study curricula at secondary level; and 3) revitalise the education information system which didnot work during 2007 and 2008.
Focus group 3
Service delivery
EC support related to service delivery in Ecuador focused on the introduction of a transparent selectionprocess for teachers’ recruitment, the delivery of school equipment like uniforms and free textbooks andthe participatory reorganisation of general basic education curricula. Despite this contribution, the EUDwas convinced that EC support only played a minor role in improving service delivery due to the smallcontribution to the country’s education budget113. However, the EUD was of the opinion that the EC had aleverage effect due to very close political dialogue with the MoE and its discussions on outcomes andachievements in the education sector. Further, the EUD was able to take advantage of the 2009 externalmonitoring mission which opened dialogue on the issue of effectiveness and possible improvements.According to the EUD: “We were partner in the dialogue in the government’s large process of improvingthe sector”.
The situation was described in a similar way by the EUD in Morocco. Also here the EC contribution hasbeen not very significant compared to the overall national budget dedicated to education. And here againthe EUD emphasised the leverage effect of EC support, due to a ten year presence in the sector andfrequent exchanges with management staff in the education sector. Two lines of actions were highlightedby the EUD which are 1) the support of the EC to teacher training with the aim of improving quality and 2)TA (implemented using a project approach) related to the programming and management at centralministry level. The so-called ‘’programme module de simulation’ is today also used by other donors.
112 “Integrated Capacity Development for Somali Education Administrations (ICDSEA)”, Contract value: € 5,562,031;EC contribution: € 5 million; partners: UNICEF, CfBT, AET; Feb. 2010-Jan 2013113 EC support over the SBS period (2009 to 2011) amounted to € 12 million, while the annual education budget in thecountry is around USD 1.8 billion

Thematic global evaluation of European Commission support to the education sector in partner countries(Including basic and secondary education); Final Report Vol. IIb, December 2010; Particip GmbH
228
In Paraguay service delivery for the education sector in the framework of the GBS114 was strengthenedthrough a support to the social protection network in which the EC, according to the EUD, played animportant role. EC support concentrated especially on the districts with high levels of poverty in order toimprove access to education. According to the EUD, EC support did not only provide resources for theimplementation of the network in the education and health sector, but also contributed to an importantextent to the coordination of different institutions in the field. This network, having a broader scope thaneducation, seemed to have helped to ensure service delivery with a high level of coordination in thetargeted districts, according to the EUD.
For El Salvador, the role of the EC in service delivery has been positive, but has focused and was limitedto a certain number of schools, namely 22 technical institutions which were targeted in the past. As otherparticipants from Latin American countries stated before, the EC contribution to the education sector in ElSalvador was limited, as it made up less than 1% of the national budget for education.
Technical Assistance
In Ecuador TA plays a minor role in the SBS. There has been a light TA package which was used; 1) forthe PEFA study (on the request of the Ministry of Finance (MoF) and 2) for the EC support to the reformprocess of public management programme as well as the internal institutional reform. Here, for instance,TA was used to support national dialogue in the framework of the implementation of the public sectorprogramme; an international expert was recruited who could not be financed by the Ecuadorianauthorities. In the opinion of the EUD this light TA package was sufficient and helped to give punctualinput in support of government efforts; as Ecuador seemed to have a very restricted public procurementsystem, such recruitment would otherwise not have been possible.
For El Salvador, TA has played an important role in the past especially related to the production ofeducation materials for secondary technical schools, and is supposed to play such a role again in the newSBS which foresees € 2 million for TA on a total budget of € 25 million.
In Paraguay TA is foreseen for the recently started SBS. However, the priorities of the TA support are notyet defined with the MoF and MoE
Morocco is the only participant of this focus group to stress spontaneously the fact that TA played animportant role for effective service delivery. 115 While budgetary significance of TA was rather limited116, itwas important in terms of accompanying the government in its education reform process117.
Within the SBS programme there have been two TAs, one focusing on the training of teachers and themanagement of these trainings and the second supporting the government in its decentralisation processin the education sector. According to the EUD, the final evaluation on the SBS programme revealed apositive appreciation regarding the TA which should, nevertheless, continue to focus on very specificaspects with added value, like planning and teacher training. In the current SBS, TA will be focused onsupporting the government in its education reform, but only in very few and specific domains which hadbeen selected together with the government.
As indicated by the EUD, it is important to notice, that the TA provided to the Moroccan government hasbeen requested by the government. This means that the needs in terms of TA were identified by thegovernment itself. TA mainly consisted of short short-term assistance, ranging from 15 days to three orfour months, as the government was not in favour of long-term assistance. Emphasis seemed to be puton the fact that TA was only provided if it had a clear added value. The EUD also indicated that due to thefact that the TAs were all short-term contracts, in-house work load for the EUD has been significant (e.g.drafting of ToRs and the selection procedure).
It is interesting to note that the EC was the only one out of five donors or lending organisations providingTA in the country within the new common programme.
114 “Programa de apoyo presupuestario a la lucha contra la pobreza focalizada”, ALA/2006/018-053115 Further to the TA related to the SBS, the neighbourhood facility instrument provides € 2 million of TA between2009 and 2012116 The SBS from 2006.2008 provided € 20 million and € 1 million for TA. The SBS 2009-2011 For which 93 isforeseen provides a TA of € 4 million.117 National Education Emergency Support Programme 2009-12, launched in March 2009. The three-year € 2.7 billionemergency programme is being partially financed by a number of grants and loans from international organisations.In November, Morocco received a combined € 13 million in loans from the French Development Agency, the AfricanDevelopment Bank, the European Investment Bank, the World Bank, the European Commission and the MoroccanMinistry of Education.
Thematic global evaluation of European Commission support to the education sector in partner countries(Including basic and secondary education); Final Report Vol. IIb, December 2010; Particip GmbH
229
4.2.3.2 Conclusion
Service delivery
All in all, EC support has contributed to improving service provision at the school level, mainlyrelated to the provision of infrastructure and renovation of schools and school equipment (e.g. textbooks,uniforms etc.). This seemed rather prominent in Zimbabwe, Somalia, Ecuador and Ethiopia. On the otherhand capacity building has tackled different levels:
Funding/provision of teacher training (five participants: Papua New Guinea, Jordan, Zimbabwe,Somalia and Morocco);
Design of teacher certification/standardisation of teacher recruitment processes (Ethiopia,Madagascar, Ecuador);
Capacity building for ministries; training of ministerial officials or district officers (Fiji, Papua NewGuinea, Cambodia).
The participants of focus groups 1 and 2 were by the majority of the opinion that EC support hadcontributed to creating conditions for effective service delivery while the participants in focus group 3 weremore cautious to use the word “effective” or “significant” due to the rather small financial contribution ofthe EC to the overall education sector budget in the countries. Nevertheless, they emphasised theleverage effect of EC support due to the targeted support (Ecuador, El Salvador) or respectively due toa very long presence in the sector (Paraguay).
Technical Assistance
Especially the latter aspect is inextricably linked to TA: nine out of 12 participants confirmed having usedTA (in the form of a project modality). Only Paraguay, Zimbabwe and Madagascar had not used TA thusfar, but TA is planned for the programmes which just started or which are under development.
In six countries TA has been targeted towards the central level, i.e. the Ministries of Education andrelated departments. Only Cambodia, Papua New Guinea and Fiji provided or plan to provide TA at thedecentralised levels. The Cambodian approach is worth highlighting in particular the aspect; in order toaccompany the decentralisation process in the education sector, TA support will be directed towards thesub-national level in particular towards the provincial and district levels. The aim is to strengthen thecapacities of these bodies that are supposed to manage and allocate funds themselves.
Where EC support is given through a project approach, TA is naturally also used for project managementpurposes, mainly for huge infrastructure projects, as was the case in Fiji and PNG.
Overall, technical assistance is seen by most EUDs interviewed as a very important instrument whichis especially useful in combination with a sector support programme (e.g. in Jordan). Both the EUDsin Cambodia and Morocco spontaneously mentioned TA as an important means for effective servicedelivery. However, the high turnover within the MoE’s staff can be considered a recurrent problem thatwas especially mentioned by the EUDs in Ethiopia, Papua New Guinea and Cambodia. In order to tacklethis issue the EUD in Cambodia has oriented its TA towards institutional capacity strengthening ratherthan focusing on individual capacity strengthening. It should be mentioned that only two EUDs indicatedthat TA helped to develop policy dialogue towards the Ministry (Ecuador and Jordan) which is rather self-explanatory, as policy dialogue per se is usually under the remit of the EUD.
At a more specific level, EUDs indicated special areas where they thought TA has been very helpful insupport of improving service delivery:
TA to build capacity in the area of textbook and curricula development (mentioned by Zimbabwe,Ethiopia, Papua New Guinea and El Salvador);
TA to develop tools to measure performance of schools (Zimbabwe, Jordan and Ecuador).
In general, it appears that the EC played a major role in a lot of countries in the provision of TA. Inthis regard, five countries stated that the EC has contributed a lot to service delivery by taking up aleading role in the coordination of TA provision. For example in Morocco, the EC was the only donorproviding TA and had thus a coordination role when it came to TA. TA in Paraguay has helped to achievehigher coordination in the targeted districts and the EUDs in Cambodia and Papua New Guinea and theSomalia Operations Unit were working to achieve a coordinated approach between donors in regard toTA delivery. An interesting example in that regard is Cambodia where a ‘Capacity DevelopmentPartnership Fund’ has been created which aims at assisting the Ministry of Education and otherdepartments in their capacity building.

Thematic global evaluation of European Commission support to the education sector in partner countries(Including basic and secondary education); Final Report Vol. IIb, December 2010; Particip GmbH
230
4.2.4 Research question 3: Transparency and accountability
The question asked in this section was ’through what means EC support tackles issues of transparencyand accountability, especially related to the education sector.’ To situate the countries in terms ofachievements concerning transparency, the participants were shown the ranking of the countries in theTransparency International Index (cf. table below). This index measures the perceived level of public-sector corruption in 180 countries and territories around the world. The CPI (Corruption Perception Index)is a "survey of surveys", based on 13 different expert and business surveys. The ranking shows how onecountry compares to others included in the index.
Table 34: Corruption Perception Index, Transparency International
Group 1 Rank** Group 2* Rank Group 3* Rank
Madagascar 99 Cambodia 158 El Salvador -
Kenya 146 Myanmar 178 Morocco 89
Jordan 49 Somalia 180 Paraguay 154
Ethiopia 120 Zimbabwe 146 Ecuador 146
Papua New Guinea 154 Zambia 99
Fiji na
** Corruption Perceptions Index 2009,http://www.transparency.org/policy_research/surveys_indices/cpi/2009/cpi_2009_table
For reasons of time, focus group 1 did not tackle this question.
4.2.4.1 Main findings:
Focus Group 2
The FG2 quoted a range of different means to address accountability and transparency:
The EUD Cambodia indicated that very close policy dialogue with the Ministry of Education and theMinistry of Finance has been crucial to be able to use SBS in a country which has corruption problems.Especially in the situation of SBS where the funds are not tracked, the EUD had to “trust that this moneyis going to be used correctly. And in order to trust there is a lot of policy dialogue going on with theMinistry of Economic and Finance at very high level (…).” The EUD emphasised the importance ofengaging in policy dialogue not only with the Ministry of Education but also with the Ministry of Finance,which is responsible for distributing the funds to other ministries.
The EUD in Cambodia used a broad range of means to ensure accountability and transparency in its SBSprogramme. This was in order “to tackle the transparency and accountability issues form different sides,being aware, that, of course, it is not perfect and that there are probably some issues here and there.”The means were:
Policy dialogue as described above;
Technical assistance within the Ministry was mentioned in second place. The TA was workingdirectly with civil servants and was thus used as proxy of the EUD;
PFM and annual operation plans. Since 2007/2008 the education sector is using an annualoperations plan, which, according to the EUD “makes it much more transparent in terms of moneydisbursement”.
More specific indicators in the SBS programme were another means to track the disbursement ina better way. Especially process indicators are mentioned by the EUD. Thus, for the SBSprogramme 2011, in addition to three quantitative indicators, eight process indicators related to thecategories of the improvement of school management, public management and result basedmanagement, have also been introduced.
A big programme on good governance, which was not directly related to the education sector, buthad impacts on it, according to the EUD.
In the specific case of Somalia (Somalia is ranked last in the Transparency Perception Index and ECassistance is mainly delivered through project partners, e.g. local NGOs) accountability was addressedthrough technical agreements with the implementing partners. These agreements comprised the

Thematic global evaluation of European Commission support to the education sector in partner countries(Including basic and secondary education); Final Report Vol. IIb, December 2010; Particip GmbH
231
obligation to do financial monitoring by the project partners themselves or by an independent auditor. Ifpossible, EUD officers took over monitoring on the ground with the help of specially established fieldoffices, when the security situation allowed field visits.
In order to move away from a project approach and to provide assistance using a sector-wide approach,the Somalia Operations Unit stressed the fact that it has been crucial to develop capacity related to datacollection, filing management and other areas related to public finance management. In order to buildcapacity, it has been agreed with the authorities of Somalia to train their staff in the North of Somaliland.
As Zimbabwe is for the moment also in a special situation and just recovering from political and economiccrises, all monetary transfers go directly to fund holders, that is the decentralized level and the schoolcommittees. The problem seen by the EUD in Zimbabwe was that the monitoring is still weak and anevaluation system is still under development.
Focus Group 3
At first in the discussion, the participants highlighted a clear preference for PFM annual reports/ annualtracking of PFM and PEFA to tackle accountability issues in the education sector. Three out of four EUDsmentioned this means first.
In Paraguay, a PFM component was part of the GBS118, in which EC, IDB (Inter-American Bank) and theWorld Bank participated and a PEFA was implemented in 2006/2007. For the education SBS119 whichstarted in 2008 the 2nd PEFA is expected to start soon. Further the EUD in Paraguay stressed the factthat it will be important to learn from the last PEFA that will be to have a look at the weak points indicatedin the report and build on the improvements.
According to the EUD in Paraguay, it seemed as if SBS was a modality which is difficult to explain, to thegovernment, but also to other donors:
“We had a very long trouble with the process to make them (the government) understand the modalityand the instruction of this programme. We started with the current administration and we have (taken)much time to explain the modality and to (make them) confident (..).From the points of the donorswhich still feels like more than our business.”
As for El Salvador, the EUD highlighted that an annual tracking of public finance management took placefor the general budget support programme120 which included transparency issues and informationavailable to the public. In the past, the projects implemented in Ecuador had a positive support; “because,here in the country we have a tradition of being strict in terms of following procedures, to ask for annualaudits or monitoring. In the case of traditional or classical projects, the country has a tradition to be strictwith the timing of audits. It has been a good contribution to accountability.” In the case of the just startedSBS121 the tracking has not started yet.
As for Ecuador, the EUD stressed that besides the PFM annual report which is part of the duties relatedto budget support, the EUD also financed a civil society surveillance project which seemed to be verysuccessful122. The project had the objective of collecting, commenting on and publishing theachievements made within the education sector programme, with the result that “the Ministry of Educationfeels that this action is a part of its own account rendering system.”
In line with the culture of making financial information public, the general auditor in Ecuador is publishingall sector audits of the last years on its website and the disbursement of the fixed tranches of the SBS isrelated to the publication of audits and PFM reports.
The EUD Ecuador thought that due to the accessibility of information on different websites a lot ofimprovements have been achieved in the last years
Morocco, as the only non-Latin American country of this group, quoted “technical assistance” as the firstmeans of developing capacity in the day-to-day management of public expenditures at the regional level.The TA was part of a public administration reform programme and supported by the Education SBS.
In respect to civil society, the project evaluations of projects run until 2006 and financed through the SBS2006-2008, the EUD pointed out that the newly built schools had led to another image of the schools andencouraged the parents to participate more in school affairs and ask for more accountability.
118 Programma de Apoyo a la Lucha contra la Pobreza Focalizada, ALA/2006/018-053, € 24 million119 SBS for education, € 54 million120 Programa de alivio a la pobreza en El Salvador (PAPES), ALA/2005/017-587, € 35 million, decision year: 2005121 SBS for secondary education, start November 2009.122 Project under the decision 19030: “Civil society surveillance programme accompanying the SBS”, € 300.000,covering 83% of the project budget. Awarded on internal EUD Ecuador grant procedures,
Thematic global evaluation of European Commission support to the education sector in partner countries(Including basic and secondary education); Final Report Vol. IIb, December 2010; Particip GmbH
232
4.2.4.2 Conclusion
Four out of seven countries quoted a PFM and a related PEFA as the means to tackleaccountability issues (Cambodia, Ecuador, Paraguay, El Salvador)
Two out of seven named “Technical Assistance” as a means to develop capacities in themanagement of public expenditure (Morocco and Cambodia)
Cambodia mentioned close policy dialogue as a good means of ensuring targeted expenditures.
In order to ensure accountability and transparency in its SBS programme, the EUD in Cambodia used abroad range of means, e.g. PFM, policy dialogue, TA, but also more specific indicators in the SBSprogramme as well as a good governance project (though not related specifically to the education sector).
The EUD in Ecuador mentioned a civil society surveillance project which played an important role inrendering accounts to the wider public. Also the EUD in El Salvador and Morocco mentioned theimportance of civil society to enhance transparency.
A problem encountered was the problem of data collection and the lack of reliable data. This problem ismentioned in particular by the EUD in Zimbabwe and the Somalia Operation Unit.
Due to different aid delivery modalities and specific country contexts in the FG2, the focus group did notreveal common patterns on how accountability is tackled. However, despite the different means to ensureaccountability, all three countries of the FG2 did not see transparency as a major problem in theeducation sector and had found ways to ensure proper utilisation of funds, such as shown above.Zimbabwe and Cambodia also referred to the latest programme evaluations which did not raisetransparency as a major concern for the education sector.
Overall, and despite the fact that most countries ranked rather low on the TransparencyInternational Index, the EUDs were the majority of the opinion that transparency was not a majorproblem in the education sector.
4.2.5 Research question 4: Coordination, complementarity, synergy
This section focuses on the question whether the EC has significantly contributed to ensuring effectivecoordination between development partners and the government on education related issues. Theparticipants were asked to react on the following two statements:
The EC has significantly contributed to ensuring effective coordination between DPs and with thegovernment on education related issues.
The EC has not effectively coordinated its education support with development partners and withthe government.
4.2.5.1 Main findings
A broad majority of participants agreed with the first statement. According to that, the EUDs used differentmeans to contribute to an effective coordination. In most of the countries coordination between the EUDand Ministries of Education and/or DPs was ensured through working groups at different levels. The mostrecurrently quoted group types are:
Six countries have working groups at technical/administrative level, bringing together thegovernment and the EUD, and, in some cases other donors and/or civil society. These workinggroups meet on average once a month.
Five countries indicated also to having coordination groups at donor level. A specific donorcoordination group, gathering EU Member States (MS), is in place in Cambodia, the “division oflabour meetings (DoL)”; the EUD is the head of the education sector DoL, and also in Ecuador(Education Platform). Depending on the objectives of the groups (sector working groups or lessspecific coordination groups), meetings are held in different frequencies, once a month or everysecond month, for sectoral or thematic groups and less frequently for unspecific donorcoordination groups.
Focus Group 1
Within focus group 1, the participants agreed that good collaboration and complementarity with thegovernment’s actions exist.
The Ethiopian EUD spoke of a “very effective relationship between the development partners themselvesas well as between the development partners and the government.” In the framework of the Ethiopian

Thematic global evaluation of European Commission support to the education sector in partner countries(Including basic and secondary education); Final Report Vol. IIb, December 2010; Particip GmbH
233
PBS, supported by the World Bank, the UK, the Netherlands, Italy, Spain, Ireland, and the AfricanDevelopment Bank, to quote only the most important. The EC is one of the three biggest financial donorstogether with the World Bank and the UK Department for International Development (DfID). But, according tothe EUD, the EC played also a leading role when it comes to aid implementation. The EC has recentlyheld the chairmanship for the social accountability sub-group of the PBS coordination group andparticipates actively in the regular meetings of PBS donors123. It is worth to be highlighted that, accordingto the EUD, the education coordination group currently seemed to be the strongest technical workinggroup (including donors and the Ethiopian government with a shared chairmanship between the Ethiopiangovernment and the Finish Embassy) in which the EC is actively involved. The EUD stressed the fact thatdonors and government work closely together and “plan pretty much all our activity together, like for themoment the development of the new education programme and the education chapter of the next PRSP”.
The Ethiopian EUD was the only participant of the focus groups, mentioning joint review missions as amajor means of ensuring coordination.
According to the respective EUD, coordination was also addressed in an effective way in Papua NewGuinea, following to the principles of the Paris Declaration on Aid Effectiveness which were localised in2007 in the “PNG commitment on Aid Effectiveness”124. A round table of senior donors meet monthly todiscuss. In the education sector, the five or six donors gather together in the Development PartnerAdvisory Committee (DPAC) which meets monthly. The EC, which is the second biggest donor afterAusAid, has the co-chair of the DPAC group.
It is also interesting to mention that this committee has been created upon the demand of PNG’s Ministryof Education which wanted to see the development partners organised among each other. Today, themonthly meetings include also the Department of Education and “there is no issue discussed without theknowledge of the Department of Education”. The EUD stated that the Department of Education must beseen as being in the driver’s seat of the committee: they call the meeting, they inform about the issuesthey would like to discuss, the lay out the kind of assistance needed from the DPs, be it financial ortechnical assistance. Similar to the case of Ethiopia, the education sector in Papua New Guinea seemedto be the sector which is among the best coordinated in the country.
“I can say that in PNG it is the education sector which (..) has probably the best cooperation betweenall the development partners (..). In other departments (there are) on and off issues with thegovernment in terms of donor coordination but we do not have problems with donor coordinationbetween ourselves because we share the synergies even when we are working on our action fiches weshare what we are going to support, e.g. within the Universal Basic Education Plan which was signedby the government in November last year. So we are working with complementary activities and notduplicating our activities with other donors, especially with the activities of AusAid.”
Solely in Jordan the collaboration with other donors seem to be an area of concern. It is striking that thefirst issue that was mentioned by the Jordan EUD, highlighted the problematic cooperation with otherdonors. As the EC is the only donor using SBS, the coordination mechanism in place seemed not to fit tothe actual EC needs. According to the EUD:
“We are following the Paris Agenda, we are in line with the harmonization and coordination principles,the other donors are not following it. The others (donors) are participating in a platform that is calledERFKE, Education Reform for the Knowledge Economy which is a multi-donor lender platform that issupported by more than nine donors or lenders. There is coordination in place but (…) it is muchtailored and designed by the World Bank. We are articulated with the government, we are followinggovernment priorities, the other donors do it only to a certain extent.”
EC support to Madagascar mainly focused on GBS, which also includes education-related indicators.Despite this only indirect support to education, the EUD to Madagascar participated in “all thecoordination meetings every time, and even now there is a plan ‘d’action’, action plan, for the future, weparticipate in the drafting, the redrafting and the discussions very actively.” Here, it seemed, as if “otherdonors take us into consideration because they all hope that in the future we will give again supportdirectly or more directly to education.”
Focus Group 2
Participants in Focus Group 2 gave a clear statement relating to the existence of appropriate coordinationwithin the education sector.
In Zimbabwe, the EC has been the first donor to reengage in the education sector after the political crisis.Thus, the EC, together with DfID, facilitated the establishment of the current pool funding mechanism, the
123 the PBS group meets once a month.124 See http://www.pngecbp.com/PNGCommittmenttoAidEffectiveness.pdf

Thematic global evaluation of European Commission support to the education sector in partner countries(Including basic and secondary education); Final Report Vol. IIb, December 2010; Particip GmbH
234
so-called Transition Fund125, which, due to its nature, needs close coordination of all donors. Thecoordination mechanism for the education sector is the Education Transition Fund Steering Committeewhich oversees the decisions related to spending. The committee is managed by UNICEF, the ministry ofprimary and secondary education is participating. Beyond that, the Education Working Group gatherspartners, but more and more also NGOs and the Ministry of Education. Before for the crisis, the EC wasalmost the only donor to the education sector which were managed by the Zimbabwean government
Due to the specific situation of Somalia, all international aid coming in the country is coordinated througha coordination forum with a secretariat, established under the UN and based in Nairobi. The EUD Kenya,Somalia Operations Unit, is of the opinion that the EC has significantly contributed to this secretariat.
Beyond this international donor coordination mechanism, the particularity of Somalia is that the SomaliaOperations Unit has actively sought the consultation and dialogue more specifically with other EU MS. Inorder to do so, permanent working groups have been set up, one of them being the steady educationsector committee. When it comes to the collaboration with EU MS, the involvement of DfID is worthmentioning. From 2010 on DfID will channel their funding through the EC after five years of discussions.This new modality will be implemented on DfID’s own request and is seen as a “very strong signal” by theEUD. Currently, the Somalia Operation Unit is in discussion with DANDIDA in order to include them aspart of a consortium of a new capacity development project.
Taking into account the fragile situation of Somalia, the Operation Unit saw coordination as a crucial issueand accordingly “the issue of coordination has been taken very seriously”:
“..if you have a fragile situation and you have a desperate situation on the ground and you go to theauthorities and you ask them (..), is anybody doing something in this segment the answer will be no. (..)So if you don’t coordinate you are very easily falling into the trap of duplication and multiplication ofassistance.”
As for Cambodia, three main coordination mechanisms are in place:
First, there is a sectoral working group gathering EU Member States, the “division labour meeting”.In the education sector, the EC is lead for this working group which meets quarterly.
The second coordination mechanism is the Education Sector Working Group (ESWG) whichgathers all donors working in the sector. It is chaired by UNICEF with a co-chair UNESCO/EC.The ESWG meets once a month and was, according to the EUD a very effective group, wheremany donors were present. The EUD compared with the health working group, in which she wasalso participating and came to the conclusion that the education group was further ahead. Forexample, in 2010, the ESWG, together with the MoE, contracted an aid effectiveness advisor whois working directly in the Ministry126.
Lastly, the Joint Technical Working Group on Education gathers donors and the Ministry ofEducation. It is a forum for regular policy dialogues and coordination between the government andDPs/NGOs. The group is chaired by the Minister of Education and meets every two months.
The EUD considered the EC to be among the most important donors in the education sector. Eventhough EC’s financial contribution was not the highest, the EC has been a very active donor for a longtime. The representative also stressed that the EC is very much engaged in policy dialogue which let to avery close working relationship with the government.
Besides the close collaboration with the government, it is interesting to notice that the EUD in Cambodiaseemed actively pushing to make more donors using SBS as an aid modality. As the representative of theEUD to Cambodia emphasised:
“(..) even though it (Cambodia) is in the ranking considered as a very corrupt country and it is, I thinkthat SBS is still a good modality for supporting the education sector and we would like to haveespecially more EU Member States supporting us in this area. (..) Now for the new programme we arevery (happy that from) 2011 on Swedish SIDA will also do SBS, so it will be two of us doing SBS inCambodia. But it would also be nice to have the support of France”
Focus Group 3
Also in focus group 3, the majority of participants were in favour of the statement 1, i.e. underpinning thatEC has significantly contributed to ensuring effective coordination between DPs and with the governmenton education related issues.
125 The Education Transition and Reform Plan was installed in 2006 and financed under the decision FED/1999/014-701126 This TA position is jointly funded by multiple DPs to assist the Ministry of Education and Youth and the ESWG intranslating aid effectiveness agendas into concrete actions.

Thematic global evaluation of European Commission support to the education sector in partner countries(Including basic and secondary education); Final Report Vol. IIb, December 2010; Particip GmbH
235
For the EUD in Morocco, the EC has significantly contributed to coordination during the design of theeducation sector programme. The coordination was ensured together with the Ministry of Education aswell as with the development partners, with whom a memorandum of understanding has been developedleading to a joint programme with four other partners. Indeed, one of the seven components of the budgetsupport is “partner cooperation”. The EUD obliged the government to hold coordination meetings. Thisturned out to be very useful, as the government asked for coordination among the different donors. At themoment there are thematic working groups gathering donors. One specific group tackles educationissues and especially the coordination of TA to the government in this sector.
With its joint education support, Morocco is often presented as a good example of coordination betweendonors and government. For the EUD the two main reason for this were, firstly a very close relationshipwith the ministry which had trust in the work of the EC and secondly the considerable amount (90 millionEuros) which had a certain leverage effect regarding EC’s leading role, also in co-ordination, in thesector.
The Paraguay EUD also mentioned first of all the alignment to the national education policy, which iscertainly due to the fact that SBS is provided since the end of 2009. But the minister was still not verycommitted to donor cooperation, the main reason was that for him development cooperation is providedthrough loans, as this is the modality used by Asian Development Bank (ADB) and World Bank. The EUDstated that they hope to be able to improve coordination and complementarity through the budget supportmodality and thus being able to support education policies rather than projects. The EUD was confident tobe able to go into this direction, as the minister seemed to trust the development partners and the ECprogramme has got green light to start.
In Ecuador, in order to coordinate EC support with the governmental agenda, a political dialogue startedin 2008 which led to the implementation of sector round tables on the initiative of the government in 2009.These round tables include all donors and the government as well as civil society organisations. Also in2009, the EUD started to organise a platform gathering Member States and the EUD, following the ideasof the European Code of Conduct on Division of Labour and Complementarity127. The education platformseemed to be very active and managed to reach complementarity between different actions.
“We really manage to reach a complementarity between our different actions. Spain is thinking aboutalignment with our sector budget support programme in education, being through BS or throughaccompanying TA.”
Regarding harmonisation and alignment, Ecuador has been selected by the OECD-DAC as a focuscountry for issues relating to harmonisation and alignment, at the beginning of 2010128.
“(There is a) very strong awareness, I believe among the EU in particular of the necessity to achieveresults in relation to the Paris indicators regarding harmonization, alignment, coordination, greatercomplementarity and there is also a very strong awareness of the EU Code of Conduct on Division ofLabour and Complementarity.”
As for El Salvador, the situation is different in so far as the EUD has only been created in 2008. (beforemanaged by the EUD in Nicaragua). Direct in-country coordination only started by then. During the focusgroup, the EUD highlighted that the communication with the main donors within the education sector(USA, Japan and Spain) is good, as well as the relationship with the government. Moreover, the EUDinsisted on the need for the government to take on leadership in the coordination process with DPs. Yet,as there has been a change of government in 2009, the actual government seemed to have started ratherslow on this point, according to the EUD in El Salvador.
4.2.5.2 Conclusion
Alignment with the priorities of governments and national administrations
When it comes to coordination with the national governments a big majority of EUDs stated to be in-line with government priorities, to have a dialogue with the government or even contributeactively to the formulation of sector strategies and action plans. Exceptions were Somalia where
127 Communication from the Commission to the Council and the European Parliament of 28 February 2007 entitled"EU Code of Conduct on Division of Labour in Development Policy" [COM(2007) 72 final - Not published in theOfficial Journal]. With a view to improving the performance of European Union (EU) cooperation policy, theCommission proposed a voluntary Code of Conduct for better division of labour between the EU donors in developingcountries. The Code is based on eleven principles designed to reduce the administrative formalities, to use the fundswhere they are most needed, to pool aid and to share the work to deliver more, better and faster aid. See http://eur-lex.europa.eu/smartapi/cgi/sga_doc?smartapi!celexplus!prod!DocNumber&lg=en&type_doc=COMfinal&an_doc=2007&nu_doc=72128 A visit from the working parties has taken place from 22nd to23rd March 2010, chaired by Mr Koos Richelle.

Thematic global evaluation of European Commission support to the education sector in partner countries(Including basic and secondary education); Final Report Vol. IIb, December 2010; Particip GmbH
236
dialogue is only limited to one of the three Ministry of Education of the country and Zimbabwe wheredialogue had been suspended to some extent in the past.
The role of SBS for enhancing more effective cooperation
From the discussions it emerged Sector Budget Support has a considerable potential in order tosupport the development of an effective coordination with the government but also amongdonors. This potential seemed to have been valorised especially in Cambodia, Paraguay, Morocco andEcuador But also in countries which do not use Budget Support, the importance of the leadership roleof the government in the coordination process of aid delivery is stressed (e.g. by El Salvador andPapua New Guinea).
Coordination with development partners
All participating EUDs, except one, were of the opinion that the EC had contributed to ensure aneffective coordination between DPs and with the government on education related issues. TheEUD of El Salvador could not completely agree on the statement, due to the fact that the EUD had onlybeen created in 2008 and that there had been a change of government last year in El Salvador.
Ten out of the 12 EUDs interviewed found that coordination with other DPs can be classified as ‘effective’.
For the EUD in Fiji the reason for non-effectiveness/limited effectiveness in their case laid in the fact thatdifferent approaches in aid delivery were used. As a result responsibilities were divided and coordinationwas limited to an exchange of information.
Further, four participants stated that the EC had contributed to increasing the coordination among donorsin the education sector. (Madagascar, Papua New Guinea, Cambodia, Morocco).
Coordination with EU Member States
Only eight out of 12 EUDs mentioned specifically EU Member States as development partners, but onlythree of them refer to them as “EU Member States”. In the case of Somalia, DfID will channel the fundingthrough the EUD. Cambodia and Ecuador made efforts to reach a closer coordination of EU and MemberStates’ actions in aid delivery, which meant in the case of both countries to convince MS to use a SBSapproach.
4.2.6 Research question 5: Aid modalities
Under this section the participants were asked to react to the following two statements:
The project modality has been or is helpful to…
GBS/SBS and sector support programmes have been valuable means to strengthen educationservice delivery and to improve sector outcomes, due to...
To conclude this section the following question was asked to the participants:
Budget support is the EC’s preferred modality. From your experience, what are the constraints inintroducing and implementing budget support?
4.2.6.1 Main findings
Focus group 1
Project modality
The participants of this focus group agreed that the project approach is helpful to ensuring effectiveservice delivery. However, this statement rather referred to the delivery of services on the spot, e.g.infrastructure, provision of school equipment and building capacity on school level.
Fiji for example mentioned the successful management of complex education infrastructure provisionthrough a project approach. Also Madagascar highlighted the benefits of a project approach forconstruction activities which made it possible to act on a decentralised level and focus the intervention tothe needs of a remote and deprived population129.
This point has also been mentioned by the EUD in Ethiopia:
Issues raised by the EUD in Jordan complement situations where a project approach might be ‘helpful’:
129 This is likely to refer to the “Programme de formation en appui à la gestion des interventions de développement”(FORMGED)

Thematic global evaluation of European Commission support to the education sector in partner countries(Including basic and secondary education); Final Report Vol. IIb, December 2010; Particip GmbH
237
In situations where dialogue with the government is complicated
In situations where there is a lack of capacities and tools
In situations where the EC aims at testing innovative actions and implementing pilot projects
According to the EUD, in the case of Jordan which uses mainly SBS, the positive characteristics of theproject approach have been introduced through technical assistance.
The EUD in Papua New Guinea stated that the project modality has worked for a number of years nowand that the project are today well integrated within the government departments.
While participants raised a good number of issues that highlighted the usefulness of a project modality,they also pointed to a number of weaknesses of the modality:
The project modality did not enable the EUD taking discussion on a higher level and to tackleissues like quality and access. (Fiji)
The situation was comparable regarding sector coordination which has remained rather limited inthe project modality mode. (Fiji)
The project modality only ensured a limited direct access for government on detailed expendituresfor certain activities, given the fact that EC worked through it own procedures in such a case(PNG).
SBS/GBS or sector support programmes
Interestingly, the discussion on the use of budget support mainly focused on the constraints of thismodality.
For the Ethiopian EUD, which uses a multi donor trust fund, the ’protectoral of Basic Service DeliverySystem’ since 2010, the major constraints are:
Evaluation and monitoring. Reliability of reports produced by the government is conceived as amajor concern. The EUD tried to remedy this problem by joint review missions all over the countryand though a capacity strengthening programme with the central statistical authority. It isinteresting to notice that the EUD did not see distortion as a major problem. “On the wholedistortion of aid is a problem, of course, (..) as long as you are aware that this is a constraint it isnothing that cannot be overcome”.
Dissociation from the project: The reporting on the outcomes is difficult, as the EUD relays on thereporting of the government and thus has knowledge of the outcomes in the field only from time totime.
The Jordan EUD also mentioned the difficulties related to reporting and accountability. Moreover, andinterestingly, even though the lack of visibility of budget support actions is a fact, the EUD in Jordanraised the question whether this should be considered as a problem. “I think in the context of theneighbourhood areas this should be secondary and we shouldn’t really be so worried about the visibility.What is really important is the outcomes and the impact we have.”
As other participants before, the Madagascar EUD raised the issue of accountability and thought of anincreased external control towards supreme institutions and the parliament as a possible solution for thisproblem. Although Madagascar is for the moment in a situation of crisis, the EUD acknowledged theleverage effect that GBS had in the country and the effects on the quality of the political dialogue with thegovernment.
As both the EUDs in Fiji and Papua New Guinea do not apply a form of budget support, they had nothingto add to the discussion.
Focus group 2
Project modality
All participants of the FG 2 agreed that the project modality has clear disadvantages and that the longterm goal should be a sector wide approach. Thus, under specific circumstances, they emphasised thefact that it is the only approach possible.
Somalia Operation Unit: “The project modality is a modality which has very clear disadvantage, this iswidely documented. However, it is the only approach possible under very fragile circumstances (..) Soit is indeed helpful to bring assistance to those most disadvantaged in our partner countries. However,it is worth to stress again (that due to) the inbuilt deficiencies of the project approach, the principles ofthe sector wide approach should be (used). That’s what we are trying, and I think it has good results.”

Thematic global evaluation of European Commission support to the education sector in partner countries(Including basic and secondary education); Final Report Vol. IIb, December 2010; Particip GmbH
238
EUD Cambodia: “I would also add that it (the project modality) is probably helpful to reach very remoteareas and (..) to have very quick results (..), but it’s not the best way to do.”EUD Zimbabwe: “Yes under the current circumstances I think the pool funding mechanism we use isthe only one that can work.(..) Let’s put it this way, it’s good tool. Although, of course, in a differentcontext you would use different mechanisms.”
SBS/GBS or sector support programmes
The reaction on the statement concerning budget support differed in accordance to the experience withthis modality.
In the opinion of the EUD in Cambodia the most important positive contribution of SBS is the fact that itstrengthens the country system as well as the ownership of a sectoral policy.
“By strengthening country systems you strengthen as well education service delivery and this has a lotof impacts in the whole education sector”.
The EUD in Cambodia highlighted the fact that in order to implement SBS an effective policy dialoguebetween the EUD and the government is necessary. This becomes necessary because SBS is a modalitywhich is difficult to understand, especially in countries were capacities within the ministries are quite low,as it is the case in Cambodia.
“Making understand that you are doing sector budget support that you are not tracking the money butthat you are supporting the sector is a little bit abstract to really understand how it works. Here inCambodia many people are still doing project approach (..) and every department is keen to have likeits own development partner working for them because they might get salary top-ups.”
It is worth mentioning that the new EC SBS programme has been designed in-house by the EUDCambodia EUD staff in close collaboration with the MoE. In the opinion of the EUD, this six-monthprocess has strengthened the ownership by the MoE even more, it has enabled the different localstakeholders to better understand how SBS functions and lastly, it has shown to the MoE that thisprogramme is not a parallel action to the one of the ministry but a programme that fits into the Cambodianeducation programme.
According to the EUD, in order to build a trustful relationship, it is necessary to work very closely with theministry, which is a very time consuming task. But EUD staffs have often not the means and the time todo it due to a huge work load.
Another problematic point of the SBS modality mentioned by the EUD is the very slow and delayeddisbursement process of the variable trances.
“It’s quiet slow until we get all the documents from the Ministry of education AND from the Ministry ofEconomic and Finance. And then it has to be processed here in Cambodia. We are regionaliseddelegation that means it has to be processed in Bangkok before going to Brussels. To give you anexample from the program 2008/2010 there is a second variable tranche, we had started processing itin December 2009 and it is not yet paid.“
For the EUD in Zimbabwe the benefits of budget support lay in the cost effectiveness, especially at theintermediate central level. Further, the representative highlighted the importance of political dialogue at atechnical level in the education and health sectors in order to be able to get soon back to a sector supportprogramme, or in his words “we hope that soon normal aid modality will be implemented in Zimbabwe”.
Like in Zimbabwe budget support cannot be applied for the moment. But like his colleagues, the SomaliaOperation Unit believed that SBS strengthens the ownership of the government and reduces transactioncosts and thus improves aid efficiency. The EUD believed in SBS but was more critical towards GBS,because of the dangers of substitution effects.
Focus Group 3
Project modality
Within FG 3, only Morocco mentioned the project modality, as in the three Latin American countries, theprojects implemented in the education sector were rather small in the evaluation period.
For the EUD in Morocco a positive aspect of the project modality was that it allows to focus on a specificregion and thus to reach a specific population.
SBS/GBS or sector support programmes

Thematic global evaluation of European Commission support to the education sector in partner countries(Including basic and secondary education); Final Report Vol. IIb, December 2010; Particip GmbH
239
The problem seen from the EUD concerning SBS is the lack of visibility of the results and the difficulty toevaluate the support. But, through the means of TA130 which was financed in complementarity to the SBS,results could be seen and service delivery strengthened.
The EUD in Paraguay put the remark forward that the choice for one or another modality depends on thesituation of the country. In any case one aim of the financing should be the establishment of a sector wideapproach.
According to the EUD in Ecuador, the Sector Budget Support has been a helpful in several aspects,namely in order to:
achieve the principles of the Paris Declaration
deepen the policy dialogue
shift the focus of cooperation from micro to macro level
Even if the EC’s contribution was rather modest in terms of budget, the EUD was convinced that it hasbeen very helpful for the ministry as it was a funding source that could be used to start new programmes,e.g. a programme with the aim to finance part of the abolition of voluntary contribution of parents toschools. Hence the positive contribution of SBS to Ecuador, the EUD stressed the fact, that theimplementation of SBS requires a certain knowledge of the EUD staff, as it differs considerably from theproject modality.
Sector budget support is quite new in El Salvador. Even though it is not possible to draw long termconclusion, the EUD highlighted the fact that SBS has been important for the government of El Salvadorin order to consolidate its medium term plans, to follow up policies and to define strategic indicators to thesector. The EUD felt that these are “crucial contribution to the education sector (from which) we will seethe results, in the future”.
4.2.6.2 Conclusion
Project approach
The participants of all three focus groups found the project modality helpful for the following reasons:
Six out of 12 participants stated that interventions could be tailored to the needs of the population,especially in specific contexts such as: fragile states and in remote areas or to manage complexand technical provisions. (Zimbabwe, Cambodia, Somalia, Ethiopia, Madagascar, Fiji andMorocco)
It brings quick results (Cambodia) and visible outcomes (Fiji)
It can be useful to implement new and innovative approaches (Jordan)
It is helpful to create capacities and tools, especially also related to the provision of TA (Jordan)
The majority of the participants felt that the project modality has clear disadvantages and that thelong term goal should be a sector wide approach. Thus, under specific circumstances, theyemphasise the fact that sector wide approach is the only possible approach.
Budget support
Most of the participants were in favour of a sector approach, where possible SBS, due to the severalreasons:
When it comes to the relationship with the government:
It allows for more effective policy dialogue with the government. This was mentioned by five out of12 participants (Ecuador, Papua New Guinea, Madagascar, Ethiopia and Zimbabwe)
It gives more ownership to the government. This was mentioned three times (Ethiopia, Zimbabweand Somalia)
It brings the government to consolidate a medium term plan, to follow-up policies and to definestrategic indicators (El Salvador) and to shift the intervention of the EC from a micro to a macrolevel (Ecuador)
130 Assistance Technique pour le suivi du programme d''appui à la politique sectorielle ''''Soutien à l''Education deBase - Phase II'''', decision : Soutien à l'éducation de base (MAR/B7-4100/IB/96/0259)

Thematic global evaluation of European Commission support to the education sector in partner countries(Including basic and secondary education); Final Report Vol. IIb, December 2010; Particip GmbH
240
It is a flexible instrument that can be used to go for new approaches and innovative programmes(Paraguay)
When it comes to the relationship with other DP
A budget support modality allows the development of a better coordination between DPs(Zimbabwe and Somalia)
From a financial point of view:
GBS provides the “right budget” to the interventions (Madagascar)
It is a predictable and stable source of income (Ethiopia)
Considering these reasons, the Somalia Operation Unit representative spoke of budget support asa modality that “improves aid effectiveness”.
Yet, the participants stressed the weaknesses of a budget support modality:
The lack of control and visibility due to difficulties in evaluation and monitoring. This wasmentioned by four out of 12 participants (Morocco, Jordan, Madagascar and Ethiopia)
An approach that is difficult to understand, for the government but also for other developmentpartners and which requires a lot of time to explain and a trustful relationship with the government.(mentioned by Cambodia and Paraguay)
Insufficient time and appropriate training for EUD staff in order to explain and follow the budgetsupport in the county (Ecuador and Cambodia)
Slow disbursement procedures for the variable tranches of budget support (Cambodia)
In order to counterbalance the weaknesses of the sector budget support, Morocco and Jordanused targeted technical assistance to support the SBS, with good results, according to therespective EUDs.

Thematic global evaluation of European Commission support to the education sector in partner countries(Including basic and secondary education); Final Report Vol. IIb, December 2010; Particip GmbH
241
4.3 Appendices
4.3.1 List of participantsFG Country Name Function In the EUD
sinceMadagascar Serge Mihailov Officer for education and health 2004Jordan Abel Piqueras Candela Task manager 2007Ethiopia Elise Nalbandian Social Sector Project Manager 2008
Cathy Eminoni Head of Section Social Sectors 2006Papua NewGuinea Thomas Viot Economist 2008
FG 1
Fiji Fiona Ramsey Head of the Operational Sectiondealing with education
2010
Nesrine Talbi Programme officer 2009CambodiaMichelle Labeeu Head of operation 2008
Somalia Manfred Winnefeld TM for Somalia 2005
FG 2
Zimbabwe Paulo Barduagni In charge of the health sector 2007El Salvador Ricardo Cruz-Letona Local AgentMorocco Sandra Bareyre Gender and education focal
point to the programme officer2008
Paraguay Vera Valente Social development cooperationadviser; in charge of GBS onpoverty reduction and SBS tothe education sector
Donata von Sigsfeld In charge of educationprogramme
2005
FG 3
Ecuador
Helen Conefrey In charge of an institutionbuilding
2010

Thematic global evaluation of European Commission support to the education sector in partner countries(Including basic and secondary education); Final Report Vol. IIb, December 2010; Particip GmbH
242
4.3.2 Interview guide
Focus group on cross-checking evaluation findings and on conclusions on selected topics
In the framework of theThematic global evaluation of European Commission support
in the education sector in partner countries 2000-2007(including basic and secondary education)
Focus group protocol (interview guide)
Preamble
7 minutes
Thank you for agreeing to participate in this focus group meeting on "EC support to education sector” aspart of the worldwide evaluation of EC support to basic and secondary education.
I am Georg Ladj, and next to me sitting is Wim Biervliet. We are members of the team that, since May2009, works on this evaluation. Wim is one of the education sector experts on the team while I am theteam leader of the exercise. We are the moderators for this session, but want the interaction to flowamong you.
The purpose of this session is to get a clear appreciation / assessment from your side on how youperceive successes and, possibly, failures of EC support to education in your country, and the changes itmay have brought or supported.
Just a few words on the evaluation process so far:
We have gone through an inception phase where we tried to capture what exactly was spentwhere in support of education, i.e. which country, which sub-sector, what modality, etc.
We also devised a set of so-called Evaluation Questions that helped us focusing the exercise.
During the Desk Phase we started our analysis along these evaluation questions, identifying somesuccesses and bottlenecks, but also identifying which information was still missing to providemeaningful answers to the complex evaluation questions.
During the field phase which just recently ended we visited six countries – Bangladesh, Pakistan,Dominican Republic, Tunisia, Niger and South Africa. We collected evidence on our evaluationquestions and on some further specific issues we felt were of importance for the specific country.
We came back with still preliminary findings, and some first conclusions – both of which we wouldlike to kind of cross-check in this session.
Based on all this, we will draft a final report, and in autumn a dissemination seminar will take placein Brussels.
Some few additions on the evaluation as such:
The period covers 2000 to 2007. If, during the subsequent discussion, you refer to later years, wewould appreciate, if you could indicate that
The evaluation includes basic and secondary education (not TVET)
GBS support with a link to the education sector should be examined as well
You have been asked to participate as you have been involved, in one way or the other, in theprogrammes over the years. So you are the "experts".
Rules for the meeting
What are the rules for this meeting:
1. In a group interview like this it is really important that you express yourself openly.
2. There are no right or wrong answers.
3. We want to know what YOU think. So we will try not to talk too much, but rather listen, and let youtalk, guiding and supporting, to the extent necessary, the discussion process.
We hope technology works to an extent that we can communicate easily.
As you know, we only have two hours for the discussion, so we will keep you moving along a number ofissues. Let me get back to these issues in a minute.

Thematic global evaluation of European Commission support to the education sector in partner countries(Including basic and secondary education); Final Report Vol. IIb, December 2010; Particip GmbH
243
We are taping the session in order to ensure accuracy in writing up our report. We may from time to timehave to remind you to speak up, and to only talk one at a time, so that we can hear you clearly when wereview the session tapes.
Main research question
The purpose of the sessions is to get insight from you, on how you perceive successes, failures andconstraints of EC support to education in your respective country, as well as the changes it may havebrought about or supported. Thus the main research question is as follows:
To what extent has EC support to education, direct or indirect (e.g. through GBSsupport), contributed to improving education sector outcomes and impacts in thecountry?
Answers to this question will be obtained through a sequence of questions that you will be asked todiscuss. The main issues are the following:
1. Access issues
2. Service delivery, transparency and accountability
3. Coordination, complementarity, synergy
4. Aid modalities
We foresee roughly 15 minutes per topic, which is not a lot. This means that there might be situationswhere we simply have to stop the discussion and to continue with another issue in order to progress.
*Agenda for the video conferenceJuly 5
TimeallocationMinutes
Participant introduction 8
Introductory question 15
Access issues, primary and secondary 15
Service delivery 15
Transparency and accountability 10
Coordination, complementarity, synergy 15
Aid modalities 20
Final question 10
Total 108
Participant introduction
8 minutes
Let us start by introducing ourselves:
Name, Delegation and role/position there, on post since when
Major questions
1. Introductory question
What comes to your mind, when you think of EC support to the education sector in yourcountry, i.e. support to basic and secondary education?
What are the most striking characteristics and trends ?
Total minutes 15

Thematic global evaluation of European Commission support to the education sector in partner countries(Including basic and secondary education); Final Report Vol. IIb, December 2010; Particip GmbH
244
2. Access issues, primary and secondary
Which of the following statements is best corresponding to EC education sector support in your country?
EC support has …
1. significantly contributed to both improved access to and quality of basic educationin the country
2. significantly contributed to access to basic education but neglected quality aspects
3. not substantially contributed to increase access to basic education in the country,nor to improving quality
4. not really tackled secondary education issues including access and quality
Possibly to add in the discussion process: by which forms of support mainly? Sectorsupport and GBS, or through the project approach, in which areas. What about remoteareas? What about disadvantaged people?
Total minutes 15
3. Service delivery
What role EC support has played in creating conditions for effective service delivery?
Possibly to add: In the future, what role would you see force support to improve servicedelivery?
What role has TA played in capacity building, and what role should it play?
Total minutes 15
4. Transparency and accountability
Looking at the Transparency International Index as one source of information one finds the following (outof 180 countries):
Group 1*July 5
Rank** Group 2*July 5
Rank Group 3*July 5
Rank
8.30 – 10.30 11.00 – 13.00 hours 16.00 – 18.00 hours
Madagascar 99 Cambodia 158 El Salvador -
Jordan 49 Somalia 180 Morocco 89
Ethiopia 120 Zimbabwe 146 Paraguay 154
Papua New Guinea 154 Ecuador 146
Fiji -
** Corruption Perceptions Index 2009,http://www.transparency.org/policy_research/surveys_indices/cpi/2009/cpi_2009_table
Through what means did EC support tackle issues of transparency and accountability,especially related to the education sector?
Elements to possibly mention during the discussion: Audit, PETS, procurement systems,support to NGOs as watchdog. What worked best? What did not work, why?
Total minutes 10
5. Coordination, complementarity, synergyWhat would be your reactions to the following statements?
EC has significantly contributed to ensuring effective coordination between DPs and withthe government on education related issues.
Possibly to add: Has EC been a major player in that regard?
EC has not effectively co-ordinated its education support with DPs and with thegovernment, as ….
Total minutes 15
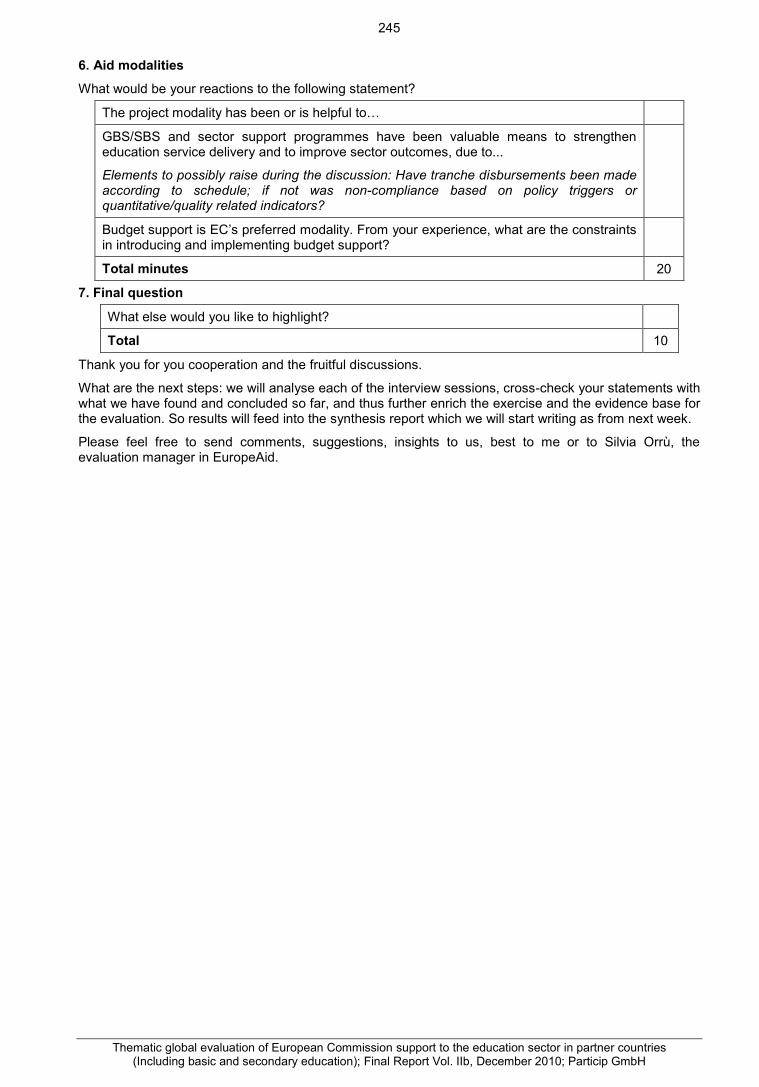
Thematic global evaluation of European Commission support to the education sector in partner countries(Including basic and secondary education); Final Report Vol. IIb, December 2010; Particip GmbH
245
6. Aid modalities
What would be your reactions to the following statement?
The project modality has been or is helpful to…
GBS/SBS and sector support programmes have been valuable means to strengtheneducation service delivery and to improve sector outcomes, due to...
Elements to possibly raise during the discussion: Have tranche disbursements been madeaccording to schedule; if not was non-compliance based on policy triggers orquantitative/quality related indicators?
Budget support is EC’s preferred modality. From your experience, what are the constraintsin introducing and implementing budget support?
Total minutes 20
7. Final question
What else would you like to highlight?
Total 10
Thank you for you cooperation and the fruitful discussions.
What are the next steps: we will analyse each of the interview sessions, cross-check your statements withwhat we have found and concluded so far, and thus further enrich the exercise and the evidence base forthe evaluation. So results will feed into the synthesis report which we will start writing as from next week.
Please feel free to send comments, suggestions, insights to us, best to me or to Silvia Orrù, theevaluation manager in EuropeAid.