STATISTICAL ANNEX - OECD
22
STATISTICAL ANNEX Sources and definitions The main source for the statistics in most of the tables is Part I1 of Labour Force Statistics, 1971-1991, OECD. Changes between 1991 and 1992 are estimated from several other sources: recent historical movements for the fifteen countries covered in Quarterly Labour Force Statistics, No. 2, 1993, OECD; projections published in OECD Economic Outlook, No. 53; and data specially supplied by national authorities (see the sources and notes of the tables). The data on employment, unemployment and the labour force are not always the same as the series used for policy analysis and forecasting by the OECD Economics Department, shown in Tables 1.2 and 1.3. Conventional signs .. Data not available . Decimal point I Break in series 185
-
Upload
khangminh22 -
Category
Documents
-
view
5 -
download
0
Transcript of STATISTICAL ANNEX - OECD

STATISTICAL ANNEX
Sources and definitions
The main source for the statistics in most of the tables is Part I1 of Labour Force Statistics, 1971-1991, OECD. Changes between 1991 and 1992 are estimated from several other sources: recent historical movements for the fifteen countries covered in Quarterly Labour Force Statistics, No. 2, 1993, OECD; projections published in OECD Economic Outlook, No. 53; and data specially supplied by national authorities (see the sources and notes of the tables).
The data on employment, unemployment and the labour force are not always the same as the series used for policy analysis and forecasting by the OECD Economics Department, shown in Tables 1.2 and 1.3.
Conventional signs
.. Data not available . Decimal point I Break in series
185

Men
Australia Austria Belgium Canada Denmark Finland France Germany Greece Ireland Italy Japan Luxembourg Netherlands New Zealand Norway Portugal Spain Sweden Switzerland United Kingdom United States North America OECD Europe1 Total OECDf
Women
I 1973-75 1975-79 1979-83 1983-90 1991 1992 1 1973-75 1975-79 1979-83 1983-90 1991 1992
2.0 1.7 2.0 4.6d -0.5 0.3 ~ -1.2 1.0 0.8 2.0 2.4 3.6
0.8 0.9 0.2 2.1 0.9 4.7 4.5 2.6 3.3 -0.6 -0.4
-0.5 3.6' 0.9 1.7 -0.2 2.0 -0.0' 1.9 0.5 -3.8 4:4 0.8 1.6 0.7 1 .o 1.4
1.6 1.1 4.1 1.8 -1.0 0.9 -0.0 1.7e 3.5 1:9
-0.3 0.6 -0.1 2.3d -3.0 -1.1 -1.1 0.8 0.9 0.5 1.8 1 .o -0.4 -0.4 -1.8 0.1 -0.4
Dependent employment France Germany Netherlands Spain United States
1.9 1.8 -0.6 1.6 -2.8 -1.2
0.7 -0.6' 0.9 0.3 -5.9 -7.6 -1.8 0.7' -1.7 1.2 -1.4
1821 1771 1720 1 667 I558 1539 1 540 1 542 1885 1804 1737 1699 1670 1573 1557
1591 1530 1433 1 423 2 032 1 946 1858 1847 1828
1836 1831 1791 1767 1754 1749 1737 1736
-0.4 -0.2 -0.7 -0.1 -0.3 -2.5 0.3 -0.5 0.9e 0.5 -0% -0.5 0.8 0.6 0.2 -0.2 1.5 -1.4 -0.4 -0.9
0.6 -0.1 0.0 0.1 0.5 -1.1 0.5 0.7 0.8 1 .o 1.7 1.1 1.0 -0.7 -0.7 2.3
2.1 0.2 -0.3 1.8d -1.8 -1.5 0.3 -0.8 2.2 1:3
0.9 1.1 -0.2 -0.2 -1.8 -0.4 -1.3" 0.3 0.4' 0.4 1.4 -0.2 -1.76 -1.8 1.0 -0.6 -3.3
1.0 -0.3 -0.6 0.5' -2.0 4 . 7 -2.8 -0.5 0.8 1.0 -0.5 -1.0 -0.2 -2.3 1.2 4 . 3 -3.3 -0.6 2.5 -0.3 1.7 -2.1 0.3 -0.4 2.4 -0.4 1.7 -2.2 0.2 -0.8 -0.2 -0.8 0.6 -3.4 -0.4 0.9 -0.3 1.1 -2.0
1.6 2.0 1.9 1 .o 1.6 2.4 2.7 1.3 1.6 1.5 013
-1.7 2.0 1.7 1.6 2.2 1 .o 4.6 1.5 1.8 3.3 2.9 2.7 4.0 5.4 411 5.2 2.7 0.8 1.5d -0.8 2.9 4.4 1.8 1.6
-1.5' 0.9 1.1' 2.2 -1.5 -1.3' -1.7 3.2
-1.9 0.6 2.0 1.8 1.5 1.2 -1.0 2.9 2.0 5.0 1.7 2.8 2.2 4.9 1.8 2.9 1.2 1.4 0.5 2.0 1.0 2.8 1.2 2.3
4.2 2.0 1.3 1.4'
0.0 -0.2 5.1 1.9 0:2
-1.4 -3.3 0.6
-2.2 -1.0 -0.5 0.9 -0.5 0.8 -1.1 -0.3
at Break in series between 1973 and 1974. bJ Break in series between 1975 and 1976. cJ Break in series between 1983 and 1983. dJ Break in series between 1985 and 1986. e j Break in series between 1986 and 1987. f, Above countries only.
Sources: OECD Labour Force Sratistics; Quarterly Labour Force Staristics
Table B. Average hours actually worked per person per yeara 1970 1973 I975 1979 1983 1990 1991 1992
Total employment Canada Finland France Italy Japan Norway Spain Sweden United States
1890 1865 1837 1794 1730 1733 1713 1709 1982 1915 1885 1859 1798 1756 1758 1728 1 962 1904 1 865 1813 1711 1669 1 667 1 666 1 969 1885 1841 1788 1764
1766 1 694 1653 1501 1471 1415 1 408 1417 2 148 2 052 1941 1931 1911
1641 1557 1516 1451 1453 1480 1 468 1 485 1886 1875 1833 1808 1788 1782 1771 1769
2 185 2 I 0 0 2 110 2 081 2 023
a) Includes pan-time work. Sources: Canada: Finland: France: Germany: Italy: Japan: Netherlands: Norway: Spain: Sweden: United States:
Data supplied by Statistics Canada. Data estimated from National Accounts data. Data supplied by INSEE on a National Accounts basis. Data supplied by the German Institut fur Arbeitsmarkt- und Berufsforschung. Data supplied by the Italian authorities (ISTAT). Secretariat estimates based on data from the Monthly Labour Survey of Establishments and the Labour Force Survey. Data are annual contractual hours on the basis of Labour Accounts data and were supplied by the national authorities (CBS). Data supplied by the Central Bureau of Statistics. Data estimated from the quarterly Labour Force Survey. Data estimated from National Accounts data. Data provided by the Bureau of Labor Statistics.
186
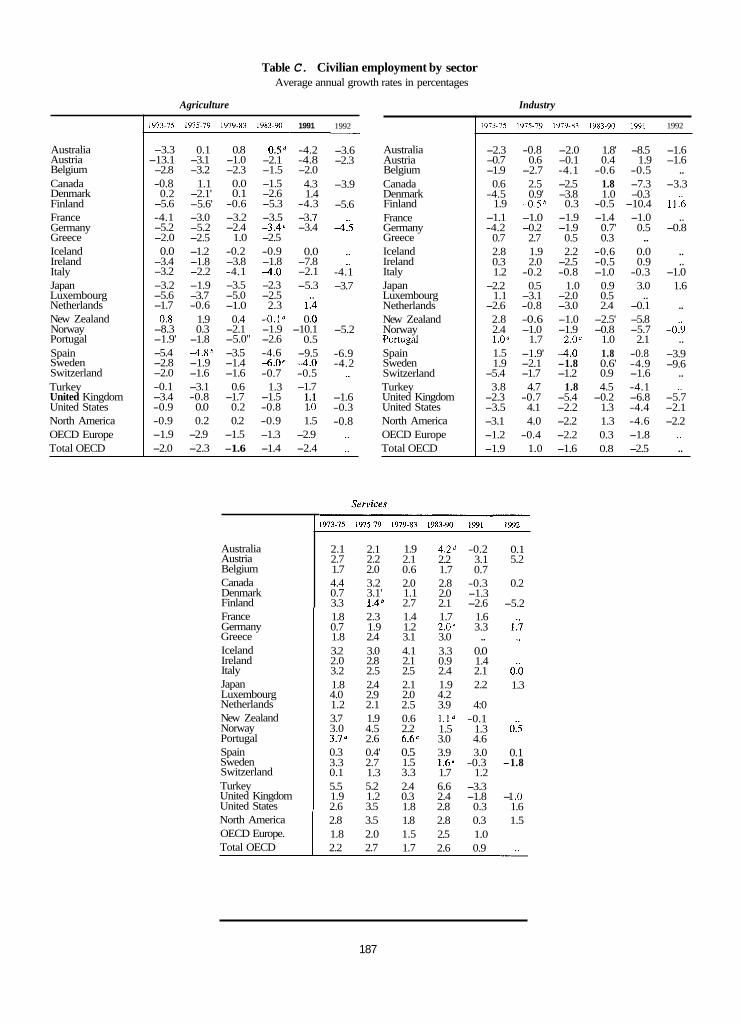
Table C. Civilian employment by sector Average annual growth rates in percentages
Agriculture Industry
Australia Austria Belgium Canada Denmark Finland
Australia Austria Belgium Canada Denmark Finland France Germany Greece Iceland Ireland
Japan Luxembourg Netherlands New Zealand Norway Portugal Spain Sweden Switzerland Turkey United Kingdom United States North America OECD Europe Total OECD
Italy
2.1 2.1 1.9 4.2' -0.2 2.7 2.2 2.1 2.2 3.1 1.7 2.0 0.6 1.7 0.7 4.4 3.2 2.0 2.8 -0.3 0.7 3.1' 1.1 2.0 -1.3 3.3 1.4b 2.7 2.1 -2.6
1~73.75 1975-79 1979-83 1~83.90
-3.3 0.1 0.8 0.5d -13.1 -3.1 -1.0 -2.1 -2.8 -3.2 -2.3 -1.5
North America OECD Europe. Total OECD
-0.8 1.1 0.0 -1.5 0.2 -2.1' 0.1 -2.6
-5.6 -5.6' -0.6 -5.3 -4.1 -3.0 -3.2 -3.5 -5.2 -5.2 -2.4 -3.4e -2.0 -2.5 1.0 -2.5
2.8 3.5 1.8 2.8 0.3 1.8 2.0 1.5 2.5 1.0 2.2 2.7 1.7 2.6 0.9
0.0 -1.2 -0.2 -0.9 -3.4 -1.8 -3.8 -1.8 -3.2 -2.2 -4.1 -4.0 -3.2 -1.9 -3.5 -2.3 -5.6 -3.7 -5.0 -2.5 -1.7 -0.6 -1.0 2.3
0.8 1.9 0.4 -0.1' -8.3 0.3 -2.1 -1.9 -1.9' -1.8 -5.0" -2.6 -5.4 -4.8' -3.5 -4.6 -2.8 -1.9 -1.4 -6.0e -2.0 -1.6 -1.6 -0.7 -0.1 -3.1 0.6 1.3 -3.4 -0.8 -1.7 -1.5 -0.9 0.0 0.2 -0.8 -0.9 0.2 0.2 -0.9 -1.9 -2.9 -1.5 -1.3 -2.0 -2.3 -1.6 -1.4
1991
-4.2 -4.8 -2.0 4.3 1.4
-4.3 -3 '7 -3.4
0.0 -7.8 -2.1 -5.3
1:i 0 .o
-10.1 0.5
-9.5 -4.0 -0.5 -1.7
1.1 1 .o 1.5
-2.9 -2.4
1992 - -3.6 -2.3
-3.9
-5.6
-43
-4.1 -3.7
-5.2
-6.9 -4.2
-1.6 -0.3 -0.8
Australia Austria Belgium Canada Denmark Finland France Germany Greece Iceland Ireland
Japan Luxembourg Netherlands New Zealand Norway Portugal Spain Sweden Switzerland Turkey United Kingdom United States North America OECD Europe Total OECD
Italy
1973-75 1975.79 1979-83 1~n3-90 IWI 1992
-2.3 -0.8 -2.0 1.8' -8.5 -1.6
-1.9 -2.7 -4.1 -0.6 -0.5 .. -0.7 0.6 -0.1 0.4 1.9 -1.6
0.6 2.5 -2.5 1.8 -7.3 -3.3 -4.5 0.9' -3.8 1.0 -0.3
1.9 -0.5' 0.3 -0.5 -10.4 -11:k -1.1 -1.0 -1.9 -1.4 -1.0 .. -4.2 -0.2 -1.9 0.7' 0.5 -0.8
0.7 2.7 0.5 0.3 .. 2.8 1.9 2.2 -0.6 0.0 ..
1.2 -0.2 -0.8 -1.0 -0.3 -1.0 0.3 2.0 -2.5 -0.5 0.9 ..
-2.2 0.5 1.0 0.9 3.0 1.6
-2.6 -0.8 -3.0 2.4 -0.1 .. 1.1 -3.1 -2.0 0.5 ..
2.8 -0.6 -1.0 -2.5' -5.8 2.4 -1.0 -1.9 -0.8 -5.7 -0:9 1.00 1.7 2.0= 1.0 2.1 .. 1.5 1.9
-5.4
-1.9' -4.0 1.8 -0.8 -3.9 -2.1 -1.8 0.6' -4.9 -9.6 -1.7 -1.2 0.9 -1.6 ..
3.8 4.7 1.8 4.5 -4.1 .. -2.3 -0.7 -5.4 -0.2 -6.8 -5.7 -3.5 4.1 -2.2 1.3 -4.4 -2.1 -3.1 4.0 -2.2 1.3 -4.6 -2.2 -1.2 -0.4 -2.2 0.3 -1.8 .. -1.9 1.0 -1.6 0.8 -2.5 ..
France Germany Greece Iceland Ireland Italy Japan Luxembourg Netherlands New Zealand Norway Portugal Spain Sweden Switzerland Turkey United Kingdom United States
1.8 2.3 1.4 1.7 1.6 0.7 1.9 1.2 2.0" 3.3 1.8 2.4 3.1 3.0 .. 3.2 3.0 4.1 3.3 0.0 2.0 2.8 2.1 0.9 1.4 3.2 2.5 2.5 2.4 2.1 1.8 2.4 2.1 1.9 2.2 4.0 2.9 2.0 4.2 1.2 2.1 2.5 3.9 4:0 3.7 1.9 0.6 1.1' -0.1 3.0 4.5 2.2 1.5 1.3 3.7a 2.6 6.6c 3.0 4.6 0.3 0.4' 0.5 3.9 3.0 3.3 2.7 1.5 1.6< -0.3 0.1 1.3 3.3 1.7 1.2 5.5 5.2 2.4 6.6 -3.3 1.9 1.2 0.3 2.4 -1.8 2.6 3.5 1.8 2.8 0.3
0.1 5.2
0.2
-5.2
0:O 1.3
0:5
0.1 -1.8
-1 .o 1.6 1.5
187

Table D. Size and composition of part-time employment, 1973-1992 Percentages
Australia 11.9 15.9 17.5 21.3 22.5 24.4 Austria 6.4 7.6 8.4 9.0 8.9 .. Belgium 3.8 6.0 8.1 10.9 11.8 Canada 9.7 12.5 15.4 15.4 16.4 16:8 Denmark .. 22.7 23.8 23.3 23.1 Finland 6.7 8.3 7.2 7.6 719 France 5:9 8.2 9.7 12.0 12.0 12.7 Germany 10.1 11.4 12.6 15.2 15.5 .. Greece 6.5 4.1 3.9 Ireland 5:i 6.6 8.1 8.4
614 5.3 4.6 4.9 5.5 514 13.9 15.4 16.2 19.2 20.0 20.5
I d Y Japan Luxembourg 5.8 5.8 6.3 7.0 7.5 .. Netherlands 16.6 21.4 I 33.2 34.3 New Zealand 1112 13.9 15.3 20.0 21.1 2116 Norway 20.8 25.3 29.0 I 26.6 26.7 26.9 Portugal 7.8 6.4 6.8 7.2 Spain 4.8 4.6 5.9 Sweden‘ 23:k 24:8 1 23.3 23.7 24.3 United Kingdom 16:O 16.4 19.4 21.7 22.2 23.2 United States 15.6 16.4 18.4 16.9 17.4 17.5
Part-time employment as a proportion of employment
79.4 78.7 78.0 78.1 76.3 75.1 85.8 87.8 88.4 89.1 89.7 82.4 88.9 84.0 88.6 89.3 68.4 72.1 71.3 71.0 70.5 7010
.. 86.9 84.7 75.7 75.5 74.7 71.7 67.8 65.2 64:3
8213 82.2 84.4 83.6 83.7 83.7 89.0 91.6 91.9 89.7 89.6
61.2 64.9 62.9 71:2 71.6 71.7 71.6
5813 61.4 64.8 67.2 65.4 67:9 70.0 70.1 72.9 70.7 69.9 69.3 87.5 87.5 88.9 81.8 83.3
76.4 77.3 I 70.4 70.1 7213 77.7 79.8 76.4 74.2 73:3 82.3 83.0 83.7 I 81.8 81.4 80.1
.. 80.4 .. 66.9 66.7 67.4 78.0 78.0 76.8
8715 86:k I 83.6 83.4 82.3 90:9 92.8 89.8 86.2 86.1 85.4 66.0 68.0 66.8 67.6 67.2 66.4
Men I Women
1973 1979 1983 1990 1991 1992 I 1973 1979 1983 1990 1991 1992
Australia Austria Belgium Canada Denmark Finland France Germany Greece Ireland Italy Japan Luxembourg Netherlands a
New Zealand Norway Portugal Spain Swedenc United Kingdom United States
3.7 5.2 6.2 8.0 9.2 1.4 1.5 1.5 1.6 1.5 1.0 1.0 2.0 2.0 2.1 4.7 5.7 7.6 8.1 8.8
5.2 6.6 10.4 10.5 3.2 4.5 4.4 5.1
1:; 2.4 2.6 3.4 3.4 1.8 1.5 1.7 2.6 2.7
3.7 2.2 2.2 2:i 2.7 3.4 3.6
3:; 3.0 2.4 2.4 2.9 6.8 7.5 7.3 9.5 10.1 1 .o 1 .o 1 .o 1.9 1.9 ~.
5.5 7.2 I 15.8 16.7 4:k 4.9 5.0 8.4 9.7 5.9 7.3 7.7 I 8.8 9.1
2.5 3.6 4.0 1.6 1.5
5:4 613 1 7.3 7.6 2:3 1.9 3.3 5.3 5.5 8.6 9.0 10.8 10.0 10.5
10.5
9:3
5:5 3.6
2:;
10:3
10.6
9.8 4.2 2.0 8.4 6.1
10.8
28.2 15.6 10.2 19.4
12.9 24.4
1410 25.1 18.4
2416 46.5
39.1 26.8
35.2 36.4 40.1 40.9 43.3 18.0 20.0 20.2 20.1 16.5 19.7 25.8 27.4 23.3 26.1 24.4 25.5 25:9 46.3 44.7 38.4 37.8 10.6 12.5 10.2 10.2 1014 16.9 20.0 23.6 23.5 24.5 27.6 30.0 33.8 34.3
12.1 7.6 7.2
10.6 9.4 9.6 10.4 10.5 27.8 29.8 33.4 34.3 34.8
i i i 15.5 17.6 17.8
. .
17.1 17.0 16.7 17.9 44.0 50.1 1 61.7 62.2 29.1 31.4 35.0 35.7 3519 50.9 63.3 I 48.2 47.6 47.1 16.5 .. 10.1 10.5 11.0
11.8 11.2 13.7 46:O 45:9 1 40.9 41.0 41.3 39.0 42.4 43.2 43.7 44.6 26.7 28.1 25.2 25.6 25.4
Part-time employment as a proportion of total employment I Women’s share in part-time employment
1973 1979 1983 1990 1991 1992 I 1973 1979 1983 1990 1991 1992
188

Table D. Size and composition of part-time employment, 1973-1992 (Cont.) Percentages
Austria: Data are based on averages of quarterly estimates from the Mikrozensus, Central Statistical Office of Austria, based on a usual hours criterion with a35 hour cut-off. They are salaried workers and persons in private households only. Persons working less than 13 hours per week are not considered employed in the Mikrozensus.
Canuda: Data are based on averages of monthly estimates from the Labour Force Survey published in The Labour Force, Statistics Canada, catalogue No. 71-001. Part- time is defined on the basis of total usual hours for all jobs, less than 35 for the years prior to 1975, less than 30 thereafter. Estimates were available for both definitions for 1975, and estimates for years prior to then have been adjusted using a ratio of new-to-old estimates calculated for 1975.
Data are based on averages of monthly estimates from the Labour Force Survey. Part-timers are persons who usually work less than 30 hours at their main job. Persons who did not indicate their working time (approximately 1-295 of the employed sample) have been grouped with fulldmers. Unpaid family workers who worked less than one-third of their normal working time are not considered employed.
Data are from the annual EnquPte sur l’emploi conducted in March of each year. Prior to 1975, unpaid family workers working less than 15 hours per week were not considered employed. Up to and including 1981, persons working less than 30 hours during the reference week were classified as part-timers, with the exception of persons without regubr employment and persons working short-time. From 1982 on, part-time work is defined on the basis of the respondent’s perception. No adjustments have been made for these breaks. Full-time employmen1 for men does not include conscripts.
Data are based on averages of monthly estimates from the Labour Force Survey and published in the Annual Report on the Labour Force Survey, Statistics Bureau, Management and Coordination Agency. Part-timers are persons who were at work and who worked less than 35 hours during the reference week. Original data show a series break in 1966-1967 as a result of changes in the survey. Estimates prior to 1967 have been chain-linked to those for later years using estimates available for 1967 on both the old- and new-series basis.
Data are from the annual Labour Force Survey (Arbeitskrachtentelling, conducted in odd-numbered years) up to 1985, replaced by the continuous Labour Force Survey (Enqutte Beroepsbevolking) from 1987 on. Interviews up to 1985 were conducted by local civil servants, and thereafter by a permanent trained interviewing staff. Part-timers are persons in the working population (i.e. persons at work, including self-employed and unpaid family workers) with less than 35 usual hours in the main job. The proportion of part-timers recorded by the Labour Force Survey increased substantially in 1987 relative to the 1985 survey. Estimates from the new and old surveys are not considered comparable.
Up to 1985, estimates are from the Quarterly Employment Survey (of establishments) and refer to the month of April up to 1979 and May thereafter. Figures were obtained from the Labour and Employment Gazette and from national authorities. The survey covers business establishments employing two or more persons in all industries except agriculture, hunting, fishing, waterfront work, seagoing work, and domestic service in private households. Working proprietors of businesses are considered full-timers. Work schedules of less than 30 hours per week are considered to be part-time. Coverage of total employment is estimated to be about 75 per cent (1988). Estimates of the proportion of part-time workers from this source were approximately 3 per cent lower for men and 6 per cent lower for women in 1988 than estimates from the Labour Force Survey (for which data are available only from 1986 on). From 1986 on, data are based on annual averages of quarterly estimates from the New Zealand Labour Force Survey. Part-time workers are persons who actually worked less than 30 hours in the reference week, except for persons who usually work 30 hours or more but did not work during the reference week, who are classified as full-timers. From April 1990 on, full-time and part- time status is based on usual hours worked. Persons who usually work 30 hours or more in the survey reference week are classified as full-timers, those who usually work less than 30 hours in the survey reference week are classified as part-timers. The definition was changed in April 1990 to reduce the seasonality that was occurring whith usual hours worked. National authorities provided figures from 1986 onwards using the new definition. Estimates prior to 1986 have been chain- linked to those for later years using a ratio of new-to-old estimates calculated for 1986.
Figures are averages of quarterly estimates from the Labour Force Survey and were obtained from Arbeidsmurked Statistikk, Central Bureau of Statistics, and from national authorities. Up to 1988, only data on actual hours were available, and part-time work was defined as work of less than 35 actual hours per week. From the second quarter 1988, data on usual hours are collected. On this basis, part-time work is defined as work of less than 37 usual hours, except for persons working 30 to 36 usual hours who state that their work is full-time. Data prior to 1987 exclude unpaid family workers working less than 10 hours per week, There is a break in series after 1987. Estimates prior to 1989 have been chain-linked to those for later years using a ratio of new-to-old estimates calculated for 1989.
Data are based on averages of monthly estimates from the Labour Force Survey and were obtained from Arbetskrafis Undersokningen (AKU), Central Bureau of Statistics. Part-timers are persons 16-64 who usually work less than 35 hours per week. Prior to 1975. persons usually working less than 35 hours for economic reasons were classified as full-time. The upper age limit for the survey’s working-age population changed from 74 to 64 in 1986. Accordingly, to ensure historical comparability, part-timers in the 65-74 age group have been excluded from the data for years prior to 1986. Due to a revision in the Labour Force Survey in 1987, there is a break in series after 1986.
Data are based on averages of monthly estimates from the Current Population Survey and were obtained from Labor Force Statistics Derived from the Current Population Survey, 1948-1987, Bureau of Labor Statistics, 1988. Persons whose usual working hours for all jobs total less than 35 hours per week are classified as part-time workers. Unpaid family workers working less than 15 hours per week are not considered employed.
Finland:
France:
Japan:
Netherlands:
New Zealand:
Nonvay:
Sweden:
United States:
189
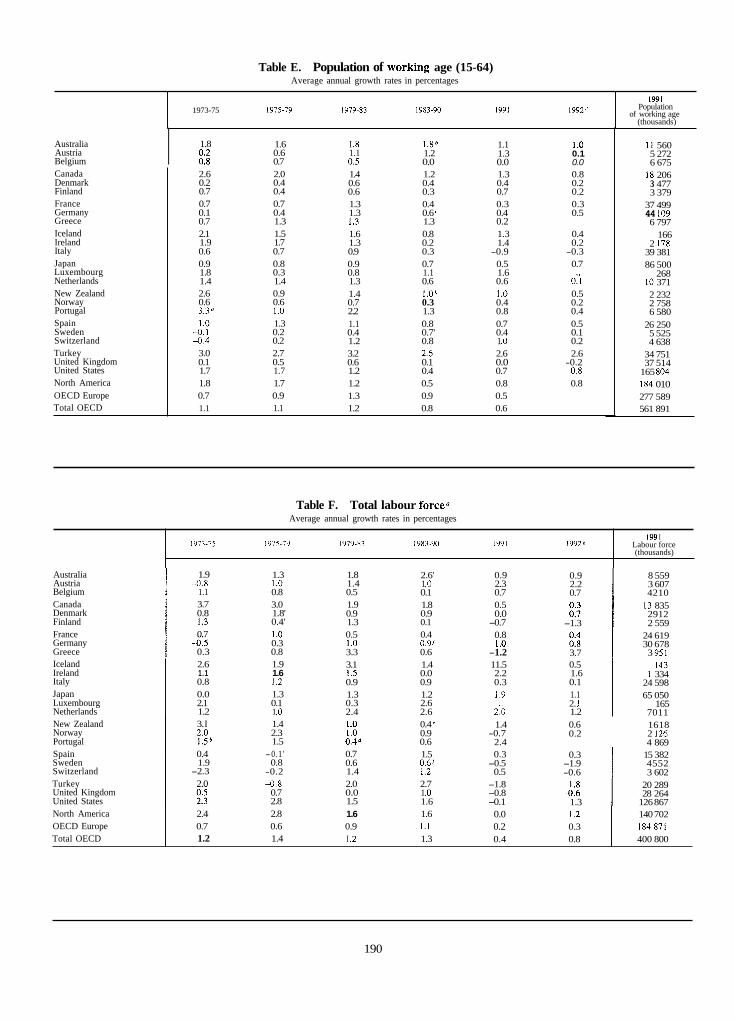
Table E. Population of working age (15-64) Average annual growth rates in percentages
1991 Population
of working age (thousands)
1973-75 1975-79 1979-83 1983-90 1991 1992'
Canada Denmark Finland France Germany Greece Iceland Ireland Italy Japan Luxembourg Netherlands New Zealand Norway Portugal Spain Sweden Switzerland Turkey United Kingdom United States North America OECD Europe Total OECD
Australia Austria Belgium
2.6 2.0 1.4 1.2 1.3 0.8 0.2 0.4 0.6 0.4 0.4 0.2 0.7 0.4 0.6 0.3 0.7 0.2 0.7 0.7 1.3 0.4 0.3 0.3 0.1 0.4 1.3 0.6 0.4 0.5 0.7 1.3 I .3 1.3 0.2 2.1 1.5 1.6 0.8 1.3 0.4 1.9 1.7 1.3 0.2 1.4 0.2 0.6 0.7 0.9 0.3 -0.9 -0.3 0.9 0.8 0.9 0.7 0.5 0.7 1.8 0.3 0.8 1.1 1.6
2.6 0.9 1.4 1.0b 1 .o 0.5 0.6 0.6 0.7 0.3 0.4 0.2 3.3a 1 .o 2.2 1.3 0.8 0.4 1 .o 1.3 1.1 0.8 0.7 0.5
-0 .1 0.2 0.4 0.7' 0.4 0.1 4 . 4 0.2 1.2 0.8 1 .o 0.2
3.0 2.7 3.2 2.6 2.6 2.6 0.1 0.5 0.6 0.1 0.0 -0.2 1.7 1.7 1.2 0.4 0.7 0.8 1.8 1.7 1.2 0.5 0.8 0.8 0.7 0.9 1.3 0.9 0.5 1.1 1.1 1.2 0.8 0.6
1.4 1.4 1.3 0.6 0.6 o:i
1.8 I :::
1973-75 1975-79 1979-83 1983-90 1991 19928
1.6 0.6 0.7
199 I Labour force (thousands)
I .8 1.1 0.5
2.6 1.9 3.1 1.4 11.5 0.5 1.1 1.6 I .5 0.0 2.2 1.6 0.8 I .2 0.9 0.9 0.3 0.1 0.0 1.3 1.3 1.2 I .9 1.1 2.1 0.1 0.3 2.6 2. I 1.2 1 .o 2.4 2.6 2:o 1.2
1.86 1.2 0.0
143 I 334
24 598 65 050
165 7011
1.1 1.3 0.0
North America OECD Europe Total OECD
1 .o 0.1 0.0
2.4 2.8 1.6 1.6 0.0 I .2 140 702 0.7 0.6 0.9 1.1 0.2 0.3 184 871 1.2 1.4 I .2 1.3 0.4 0.8 400 800
11 560 5 272 6 675
18 206 3 477 3 379
37 499 44 109 6 797
166 2 178
39 381 86 500
268 10 371 2 232 2 758 6 580
26 250 5 525 4 638
34 751 37 514
165 804 I84 010 277 589 561 891
Table F. Total labour forcea Average annual growth rates in percentages
Australia Austria Belgium Canada Denmark Finland France Germany Greece Iceland Ireland Italy Japan Luxembourg Netherlands New Zealand Norway Portugal Spain Sweden Switzerland
1.9 1.3 1.8 2.6' 0.9 0.9 8 559 1 4 . 8 1 .o 1.4 1 .o 2.3 2.2 I 3 607 1.1 0.8 0.5 0.1 0.7 0.7 4210 3.7 1 0.8 I .3
3.0 1.8' 0.4' 1 .o 0.3 0.8
1.9 0.9 1.3
1.8 0.9 0.1 0.4 0.9' 0.6
0.5 0.0
-0.7
13 835 ::? 1 2912 -1.3 2 559
0.5 1 .o 3.3
0.8 1 .o
-1.2
0.7
0.3
24 619 30 678
3.7 3 951
3. I I ?:$ 1.4 2.3 1.5
1 .o 1 .o 0.4d
0.4 0.9 0.6
1.4 -0.7
2.4
0.6 0.2
1618 2 126 4 869
0.4 1.9 1 -2.3
- 0.1' 0.8
-0.2
0.7 0.6 1.4 2.0 0.0 1.5
1.5 0.61 I .2
0.3 -0.5
0.5
0.3 15 382 -1.9 1 4552 -0.6 3 602
-0.8 0.7 2.8
2.7 1 .o 1.6
-1.8 -0.8 -0.1
Turkey 2.0 United Kingdom United States
20 289 28 264
1.3 126 867
190

1973-75 1975-79 1979-83 1~83.90 1991 1992
Australia Austria Belgium Canada Denmark Finland France Germany Greece
1991 Labour force (thousands)
0.8 -0.7 0.4
Australia Austria Belgium Canada Denmark Finland France Germany Greece Ireland Italy Japan
Netherlands New Zealand Norway Portugal Spain Sweden Switzerland United Kingdom United States North America OECD Europe/ Total OECDf
Luxembourg
1 .o 0.9
-0.1 1.9 0.1b O.Ob
1991 1973-75 1975-79 1979-83 1983.90 1991 1992 Labour force
(thousands)
4.0 2.0 2.6 4.0d 1.7 1.3 3 559 -0.9 1.2 1.3 1.8 2.5 3.7 1481
2.6 2.6 1.8 1.2 1.4 1763 5.6 4.7 3.4 2.8 1.1 0.4 6 197 1.6 4.1 2.1 1.1 0.9 1353 2.0 0.8 1.8 0.1 -0.8 -1.4 1 203 1.6 ' 2.3 I .4 1.1 1.6 I0 667 0.6 0.8 1.2 1.5* 2.3 2:i 12 608 2.0 1.1 6.5 1.8 2.6 2.2 3.2 0.8 4.1 429 1.9 3.4 1.9 2.0 0.5 0:9 9 075
-1.5 2.1 1.8 1.6 2.2 1.1 26 510 4.7 I .7 2.1 3.2 59 4.5 3.3 6.2 4.8 313 2 782 5.2 3.2 1.9 1.6d 1.7 703 3.2 4.3 2.1 1.8 0.2 0.0 963 1.5" 3.0 0.8' 1.3 4.3 2 128
-0.6 0.06 1.5 3.9 1.4 2:6 5 408 3.8 2. I 1.6 1 . 1 e -0.5 -1.8 2 183
-1.8 0.6 2.1 1.7 1.2 1 380 1.8 1.7 0.2 2.2 -1 .o -0:3 12 073 3.8 4.3 2.4 2.2 0.5 1.6 57 057 4.0 4.3 2.5 2.3 0.5 1.5 63 254 1.9 2.0 1.6 1.9 -1.2 65 555 2.1 2.8 2.0 2.0 0.1 159581
1.3 1.5
-0.3 0.9 0.1 0.8
-0.1 0.8 1.8 0.8 0.4 0.9
-0.5 0.7 0.6 0.2 0.2c 0.3
-0.2 1 .o
-0.2 0.9 0.9 0.4 0.7
1.86 0.4
-0.6
0.3 2.2 0.3 0.1
-0.8 -0.5
0.3 0.1
0.7 1.1
0.1
-1.1
-0:i
4 999 2 126 2 447 7 638 1 559 1 356
2.6 0.3
1 .o 0.7 0.1 0.6
0.2 -1.1 -0.4
0.2 0.0 0.6
-0.1
-0.1 0.5'
13 952 18 070
Ireland Italy
0.6 0.4 0.9
1.4 0.2 0.7
-0.4 0.3 0.9
1.2 0.2 1.7
904 15 523 38 540
-0:s 1.2 Japan
Luxembourg Netherlands New Zealand Norway Portugal Spain Sweden Switzerland United Kingdom United States North America OECD Europe/ Total OECDf
1.1 0.0 2.1
-0.6 0.1 0.6
2.3 1.4
-0.46
106 4 230
915 1:i 1.1
0.3
-0:s -2.0
1.4 1.5" 0.8
1 .o 0.5
-0.16
0.2 0.1 0.3
-1.5 1 .o
-0.2
1163 2 741 9 974
0.5 -2.5 -0.3
1.3 1.4
-0.1 0.6
-0.1 -0.6 0.1 1.8 1.8 0.0 0.8
0.3' 1 .o 0.2 1.1
-0.5 2 369 0.1
-0.6 -0.5
-0:s 1.1 1 .o 1.1
0.3 0.7
-0.5 -2.5 -1 .o
77 448 94 933
216 835 a) Break in series between 1973 and 1974. b) Break in series between 1975 and 1976. c ) Break in series between 1982 and 1983. d) Break in series between I985 and 1986. e) Break in series between 1986 and 1987. fi Above countries only.
Sources: OECD Labour Force Sraristics; Quarterly Labour Force Srutistics.
Table H. Total labour force - women Average annual growth rates in percentages
(I) Break in xnes between 1973 and 1974 b, Brcdk I n sencr berwren 1975 dnd 1976 (1 Break in serics between 1982 and IY83 di Brcdk in sene\ between 1985 and IY86 e , Hrrak ,n \rrtes between 19x6 m d 19x7 ., ~ ~~. ..... ~ ~ . . .. ~ .. ~ ~ . . fl Above countries only.
Sources: OECD Labour Force Sratistics; Quarterly Labour Force Statistics
191
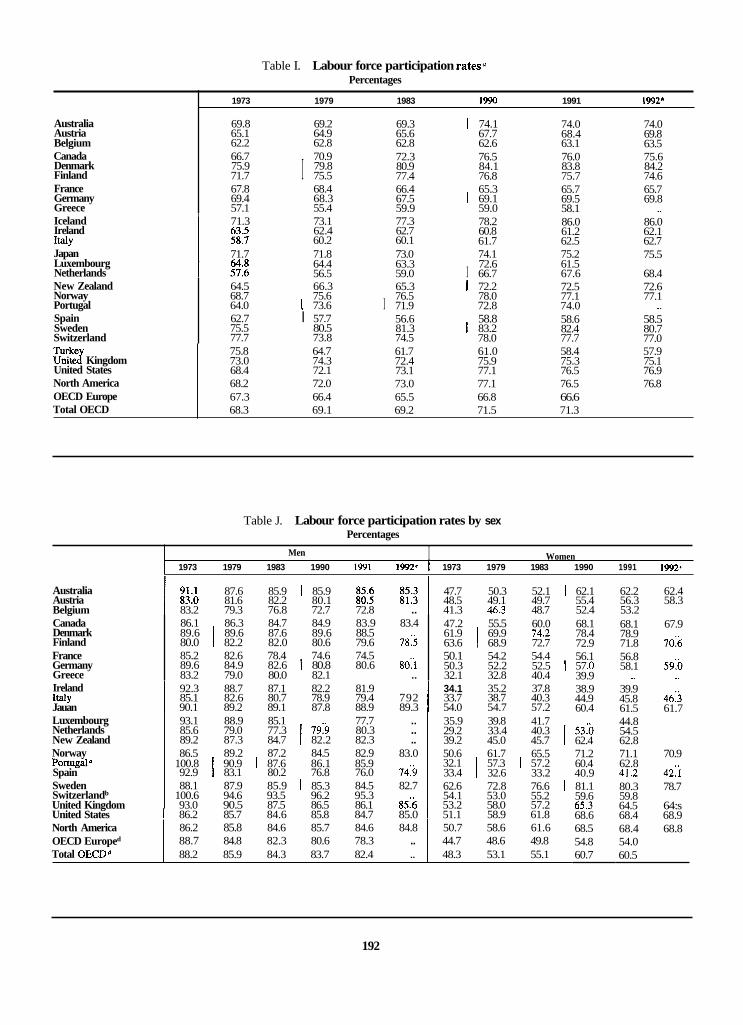
Table I. Labour force participation rates" Percentages
1973 1979 1983 1990 1991 19926
%B Kingdom United States North America OECD Europe Total OECD
Australia Austria Belgium Canada Denmark Finland France Germany Greece Iceland Ireland I d Y Japan Luxembourg Netherlands New Zealand Norway Portugal Spain Sweden Switzerland
75.8 64.7 61.7 61.0 58.4 57.9 73.0 74.3 72.4 75.9 75.3 75.1 68.4 72.1 73.1 77.1 76.5 76.9 68.2 72.0 73.0 77.1 76.5 76.8 67.3 66.4 65.5 66.8 66.6 68.3 69.1 69.2 71.5 71.3
69.8 69.2 65.1 64.9 62.2 62.8
86.1 86.3 84.7 84.9 83.9 83.4 89.6 89.6 87.6 89.6 88.5 80.0 1 82.2 82.0 80.6 79.6 78:5 85.2 82.6 78.4 74.6 74.5 89.6 84.9 82.6 I 80.8 80.6 80rl 83.2 79.0 80.0 82.1 ..
69.3 I 74.1 74.0 74.0 65.6 67.7 68.4 69.8 62.8 62.6 63.1 63.5 72.3 76.5 76.0 75.6 80.9 84.1 83.8 84.2 77.4 76.8 75.7 74.6
47.2 55.5 60.0 61.9 69.9 74.2 63.6 I 68.9 72.7 50.1 54.2 54.4 50.3 52.2 52.5 I 32.1 32.8 40.4
66.7 70.9 75.9 79.8 71.7 I 75.5
93.1 88.9 85.1 77.7 .. 85.6 79.0 77.3 7919 80.3 .. 89.2 87.3 84.7 I 82.2 82.3 .. 86.5 89.2 87.2 84.5 82.9 83.0
92.9 I 83.1 80.2 76.8 76.0 74:9 88.1 87.9 85.9 I 85.3 84.5 82.7
93.0 90.5 87.5 86.5 86.1 8516
100.8 90.9 I 87.6 86.1 85.9
100.6 94.6 93.5 96.2 95.3
67.8 68.4 69.4 68.3 57.1 55.4
35.9 39.8 41.7 29.2 33.4 40.3 39.2 45.0 45.7 I 50.6 61.7 65.5 32.1 57.3 I 57.2 33.4 I 32.6 33.2 62.6 72.8 76.6 I 54.1 53.0 55.2 53.2 58.0 57.2
66.4 65.3 67.5 I 69.1 59.9 59.0
North America OECD Europed
Total OECDd
65.7 69.5 58.1 86.0 61.2 62.5
86.2 85.8 84.6 85.7 84.6 84.8 50.7 58.6 61.6 88.7 84.8 82.3 80.6 78.3 .. 44.7 48.6 49.8 88.2 85.9 84.3 83.7 82.4 .. 48.3 53.1 55.1
65.7 69.8
71.3 I 56:::: 73.1 62.4 60.2
77.3 62.7 60.1
78.2 60.8 61.7
86.0 62.1 62.7 75.5
68.4 72.6 77.1
71.7 71.8 73.0 74.1 75.2 64.4 63.3 72.6 61.5 56.5 59.0 I 66.7 67.6
64.5 66.3 65.3 I 72.2 72.5 68.7 75.6 76.5 78.0 77.1 64.0 I 73.6 I 71.9 72.8 74.0 62.7 I 57.7 56.6 58.8 58.6 75.5 80.5 81.3 I 83.2 82.4 77.7 73.8 74.5 78.0 77.7
58.5 80.7 77.0
Table J. Labour force participation rates by sex Percentages
I Women Men 1973 1979 1983 1990 1991 1992' 1 1973 1979 1983 1990 1991 1992'
Australia Austria Belgium Canada Denmark Finland France Germany Greece Ireland I d Y Jauan
87.6 85.9 I 85.9 47.7 50.3 52.1 I 62.1 62.2 62.4 1 %A 81.6 82.2 80.1 k?: :::: 1 48.5 49.1 49.7 55.4 56.3 58.3 83.2 79.3 76.8 72.7 72.8 .. 41.3 46.3 48.7 52.4 53.2
68.1 78.4 72.9
68.1 67.9 78.9 71.8 70:6
56.1 57 .O 39.9
56.8 58.1 59%
92.3 88.7 87.1 82.2 81.9 34.1 35.2 37.8 1 85.1 82.6 80.7 78.9 79.4 792 1 33.7 38.7 40.3 90.1 89.2 89.1 87.8 88.9 89.3 54.0 54.7 57.2
38.9 44.9 60.4
53:o 62.4
39.9 45.8 46:3 61.5 61.7
Luxembourg Netherlands New Zealand Norway Portugal0 Spain Sweden Switzerlandb
United Kingdom United States
44.8 54.5 62.8
71.2 60.4 40.9
71.1 70.9 62.8 41.2 4 i i
81.1 59.6 65.3
80.3 78.7 59.8
68.4 68.9 64.5 64:s
I 86.2 85.7 84.6 85.8 84.7 85.0 I 51.1 58.9 61.8 68.6 68.5 54.8 60.7
68.4 68.8 54.0 60.5
192

Table K. Standardued unemployment rates in seventeen OECD countries Per cent of total labour force
1982 1987 1988 I989 1990 1991 1992
North America OECD Europe Total OECD
North America Canada United States
Japan Central and Western Europe
Belgium France GeIlllany Ireland Netherlands United Kingdom
Southern Europe Italy Portugal Spain
Finland Noway Sweden
Australia New Zealand
Nordic countries
orraniti
4 880 8 619 6 973 12 151 7 983 9 843 10 941 5 661 7 902 9 361 16618 14 506 15 401 17 135
1 1 329 I7 803 I7 907 31 092 24 540 27 592 30 604
9.7 I 10.9 9.5
6.4 8.8 6.1
5.7 7.7 5.4
5.4 7.5 5.2
5.7 7.0 7.7 8.1 10.2 11.2 5.4 6.6 7.3
I 2.4 2.8 2.5 2 3 2.1 2.1 2.2 7 5 8.0 9.4 5.5
14.7 8.3 7.2
6.9 7.2 8.9 4.9
13.4 7.5 6.8
7.4 7.1 9.4 4 4 .. .
14.9 7.0 8.7
8.1 7.8
10.2 4.8
16.1 6.8 9.9
8.4 I i0.9 11.0 7.0 5.7
15.6 20.1 19.1
13.6 13.2 12.4 11.6 11.4 I 12.5 in 9 101 5.0
16.9
. _._ 9.9 I 10.5 4.6 4.1 4.1
15.9 16.0 18.1 3.6 I 2.8 2.8 2.8 2.9 4.7 7 3 5.3 5.0 4.5 3.4 3.4 7.5 13.0 2.6 2.1 3.2 4.9 5.2 5.5 5.9 3.2 I 1.9 1.6 1.4 1.5 2.7 4.8
7.: 7.4 8.0 4.1
6.9 7.2 5.6
6 3 6.1 7.1
7.0 9.7 10.7 6.9 9.5 10.7 7.8 10.3 10.3
Total of above countries 8.2' I 7 3 I 6.7 6.2 6.1 6.8 I 7.5 I Note: In so far as it was possible the data have been adjusted to ensure comparability over time and to conform to the guidelines of the International Labour Office, All series in this table are
benchmarked to labour-force-survey-based estimates. In countries with annual surveys monthly estimates are obtained by interpolation/exmpolation and incorporating trends in administrative data series where available. The annual figures are then calculated by averaging the monthly estimates (for both unemployed and the labour force). For countries with monthly or quarterly surveys the annual estimates are obtained by averaging the monthly or quarterly estimates respectively. For several countries the adjustment procedure used is similar to that of the Bureau of Labor Statistics US Department of Labor. For EC countries the procedures are similar to those used in deriving the Comparable Unemployment Rates (CURS) of the Statistical Office of the European Communities. Minor differences may appear mainly because of different methods of calculating and applying adjustement factors and because EC estimates are based on the civilian labour force. Series adjusted or calculated by the OECD are marked by an asterisk(*). A break in a series is indicated by (I). See OECD Quarierly OIbour Force Sratisrics, No. 2. 1993. Sources:
Table L. Total unemployment Thousands
1973 1975 1979 1983 1990 1991 1992
Australia Austria Belgium Canada Denmark Finland France Germany Greece Iceland Ireland Italy Japan Luxembourg Netherlands New Zealand Norway Portugal Spain Sweden Switzerland
kingdom United States
106 279 378 687 I 587 821 940 33 53 65 135 1 I4 125 132 92 175 304 545 365 391 436
515 21 51
690 836 1 434 1109 1417 1557 121 157 312 242 265 285 51 I 143 138 88 193 328
593 901 I361 1 974 2 181 2 297 2 488
64 75 64 302 28 1 279 348 0 1 0 1 26 36 6 64 84 88 183 179 209 231
1 303 1 226 1 686 2 140 2 751 2 653 I 2799 680 loo0 1170 1 560 1 340 1 360 1 420
0 0 1 3 2 2 3 110 260 280 674 516 490 480
2 3 25 76 I 124 1 67 168 26 40 38 69 112 1 I6 126 90 I 178 344 I 355 220 199 187
273 1 074 876 2 258 I 1883 1 689 1 808
363 625 I 1129 2 351 2 443 2466 2 791 122 214 42 98
67 88 151 I 69 13 10 29 20
1923 2 120 1 492 2 014 1 482 1618 1 697 838 1 234 1 2984 I 1556 2 241 2 678
7 929 6 137 10717 6 874 8 426 9 384
193

Table M. Unemployed men Thousands
North America
Total OECDO OECD Europe"
Australia Austria Belgium Canada Denmark Finland France Germany Greece Ireland
Japan Luxembourg Netherlands New Zealand Norway Portugal Spain Sweden Switzerland United Kingdom United States
Italy
2 570 4 833 3 569 7 109 4 412 5 634 6 289 2 105 3 413 4 119 8 277 6 450 7 049 5 167 9 047 8 641 16 812 12 044 14 057
1973 1975 1979 1983 1990 1991 1992
51 139 198 430 I 338 495 578 13 26 28 70 63 71 74 48 84 113 253 143 159
North America OECD Europeu Total OECD"
295 391 449 849 613 817 909 159 121 129
29 29 76 54 124 203 10
2 309 3 785 3 405 5 042 3 571 4 208 4 652 1633 2 370 3 748 6 325 6 570 6 450 4 238 6 636 7 773 12 264 11 011 11 641
224 392 581 889 930 1 003 150 623 417 1273 I 968 898 983
603 556 724 938 1177 1 142 I 1226 440 660 740 950 770 780 820
39 41 31 148 107 53 66 66 140 138 156
0 0 1 1 1 1 88 197 178 403 228 226
1 2 15 46 I 74 99 11 21 18 37 66 68 76
267 471 1 759 1521 1167 1193 1385 52 32 44 79 I 36 71 133 0 10 5 18 11 25 53
698 888 I 2 145 I 1155 1 708 2 061 4 442 3 120 6 260 3 799 4 817 5 380
42 I 98 122 I 127 85 75 88
Table N. Unemployed women Thousands
Australia Austria Be 1 g i u m Canada Denmark Finland France Germany Greece Ireland Italy Japan Luxembourg Netherlands New Zealand Norway Portugal Spain Sweden Switzerland United Kingdom United States
I 1973 1975 1979 1983 1990 1991 1992
55 140 180 257 1 250 326 363 20 27 37 65 51 54 58 43 91 191 292 222 232
220 299 387 585 496 599 647 52 153 120 135 11
22 22 I :; 62 34 69 125 369 509 780 1 085 1251 1294 1 124 452 459 985 I 915 792 825 25 34 33 154 174 11 18 22 43 41 52
700 670 962 1 202 1574 1511 I 1572 1 240 340 430 610 570 590 600 0
22 1
0 63
1 15 19 19 32 46 48 50
96 154 I 370 830 1276 1273 1 405 48 I 80 222 I 228 135 124 99
46 36 44 72 I 33 51 82 0 3 4 11 9 17 45
81 140 346 I 839 I 400 533 617 2 089 3 486 3 018 4 457 3 075 3 609 4 005
194
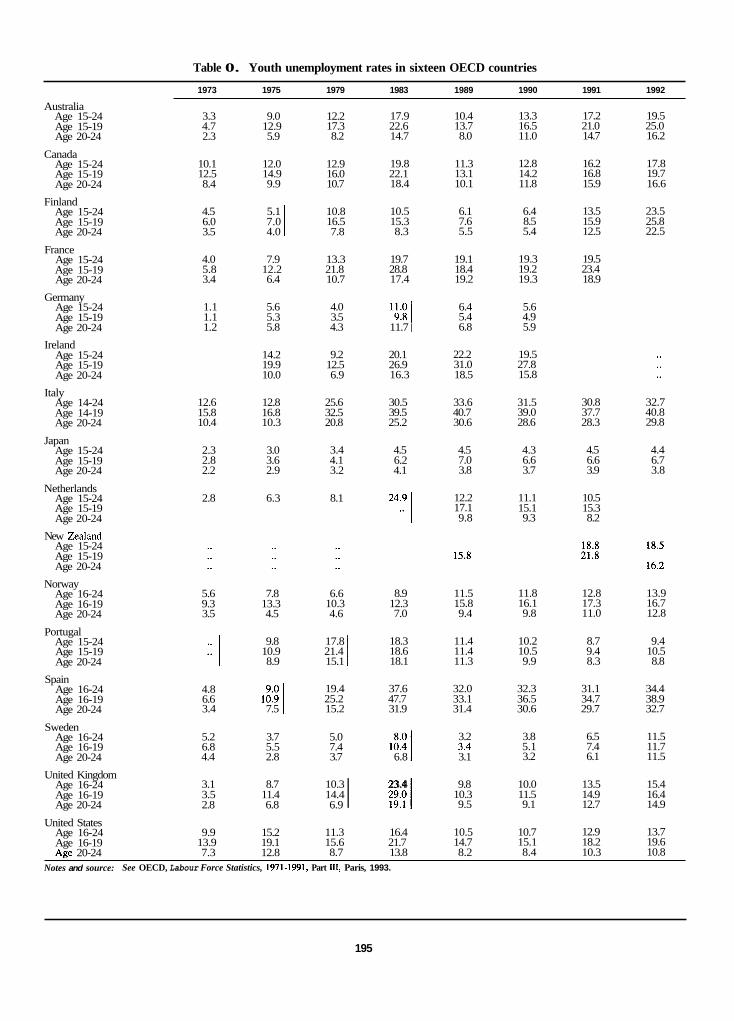
Table 0. Youth unemployment rates in sixteen OECD countries
Australia Age 15-24 Age 15-19 Age 20-24
Canada Age 15-24 Age 15-19 Age 20-24
Age 15-24 Age 15-19 Age 20-24
Age 15-24 Age 15-19 Age 20-24
Age 15-24 Age 15-19 Age 20-24
Age 15-24 Age 15-19 Age 20-24
Finland
France
Germany
Ireland
Italy Age 14-24 Age 14-19 Age 20-24
Age 15-24 Age 15-19 Age 20-24
Japan
Netherlands Age 15-24 Age 15-19 Age 20-24
New Zealand Age 15-24 Age 15-19 Age 20-24
Age 16-24 Age 16-19 Age 20-24
Age 15-24 Age 15-19 Age 20-24
Age 16-24 Age 16-19 Age 20-24
Age 16-24 Age 16-19 Age 20-24
United Kingdom Age 16-24 Age 16-19 Age 20-24
United States Age 16-24 Age 16-19 Age 20-24
Norway
Portugal
Spain
Sweden
1973 1975 1979 1983 1989 1990 1991 1992
3.3 9.0 12.2 17.9 10.4 13.3 17.2 19.5 4.7 12.9 17.3 22.6 13.7 16.5 21.0 25.0 2.3 5.9 8.2 14.7 8.0 11.0 14.7 16.2
10.1 12.0 12.9 19.8 11.3 12.8 16.2 17.8 12.5 14.9 16.0 22.1 13.1 14.2 16.8 19.7 8.4 9.9 10.7 18.4 10.1 11.8 15.9 16.6
4.5 5.1 10.8 10.5 6.1 6.4 13.5 23.5 6.0 7.0 I 16.5 15.3 7.6 8.5 15.9 25.8 3.5 4.0 7.8 8.3 5.5 5.4 12.5 22.5
4.0 7.9 13.3 19.7 19.1 19.3 19.5 5.8 12.2 21.8 28.8 18.4 19.2 23.4 3.4 6.4 10.7 17.4 19.2 19.3 18.9
1.1 5.6 4.0 1.1 5.3 3.5 1.2 5.8 4.3 11.7
6.4 5.6 5.4 4.9 6.8 5.9
14.2 9.2 20.1 22.2 19.5 19.9 12.5 26.9 31.0 27.8 10.0 6.9 16.3 18.5 15.8
12.6 12.8 25.6 30.5 33.6 31.5 30.8 32.7 15.8 16.8 32.5 39.5 40.7 39.0 37.7 40.8 10.4 10.3 20.8 25.2 30.6 28.6 28.3 29.8
2.3 3.0 3.4 4.5 4.5 4.3 4.5 4.4 2.8 3.6 4.1 6.2 7.0 6.6 6.6 6.7 2.2 2.9 3.2 4.1 3.8 3.7 3.9 3.8
":9 I 17.1 2.8 6.3 8.1
9.8
12.2 11.1 10.5 15.1 15.3 9.3 8.2
5.6 7.8 6.6 8.9 11.5 11.8 12.8 13.9 9.3 13.3 10.3 12.3 15.8 16.1 17.3 16.7 3.5 4.5 4.6 7.0 9.4 9.8 11.0 12.8
9.8 17.8 18.3 11.4 10.2 8.7 9.4 1: I 10.9 21.4 I 18.6 11.4 10.5 9.4 10.5
8.9 15.1 18.1 11.3 9.9 8.3 8.8
19.4 37.6 32.0 32.3 31.1 34.4 1;:: 1 25.2 47.7 33.1 36.5 34.7 38.9
4.8 6.6 3.4 7.5 15.2 31.9 31.4 30.6 29.7 32.7
3.2 3.8 6.5 11.5 5.1 7.4 11.7 3.2 6.1 11.5
5.2 3.7 5.0 6.8 5.5 7.4 4.4 2.8 3.7 6.8 3.1
3.1 8.7 10.3 23.4 9.8 10.0 13.5 15.4 10.3 11.5 14.9 16.4 I :;:':I 9.5 9.1 12.7 14.9
3.5 11.4 14.4 2.8 6.8 6.9
9.9 15.2 11.3 16.4 10.5 10.7 12.9 13.7 13.9 19.1 15.6 21.7 14.7 15.1 18.2 19.6 7.3 12.8 8.7 13.8 8.2 8.4 10.3 10.8
I
Notes and source: See OECD, Labour Force Statistics, 1971-1991, Part III, Paris, 1993.
195
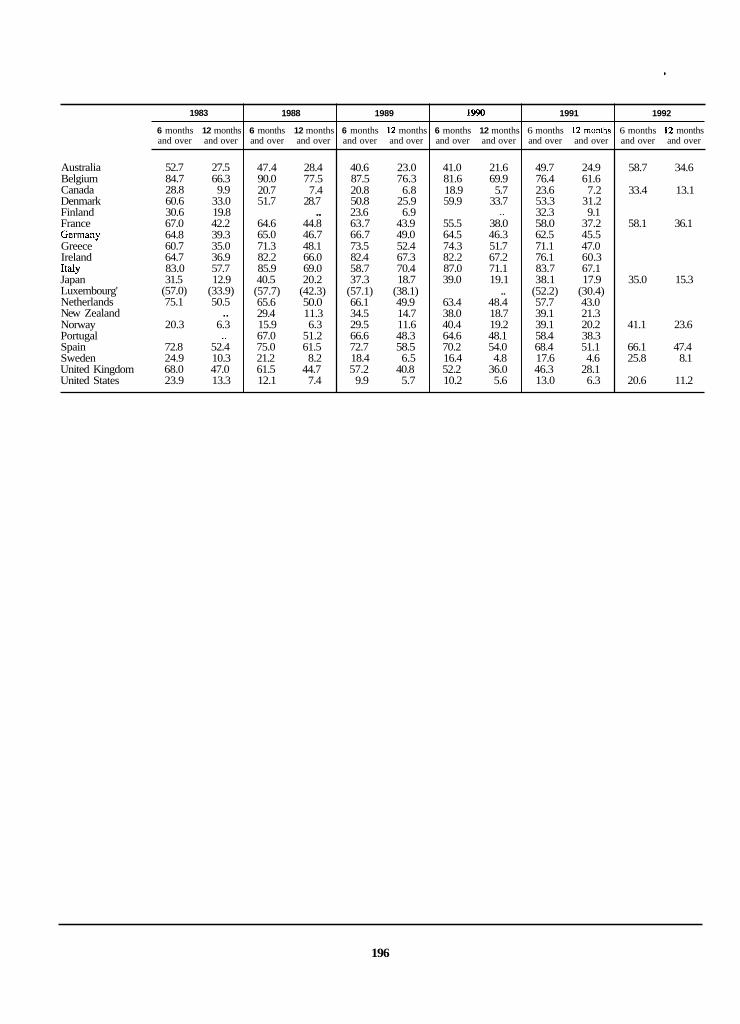
1983
6 months 12 months and over and over
1988 1989 1990 1991 1992
6 months 12 months 6 months 12 months 6 months 12 months 6 months 12 months 6 months 12 months and over and over and over and over and over and over and over and over and over and over
196
Australia 52.7 27.5 Belgium 84.7 66.3 Canada 28.8 9.9 Denmark 60.6 33.0 Finland 30.6 19.8 France 67.0 42.2 Germany 64.8 39.3 Greece 60.7 35.0 Ireland 64.7 36.9
83.0 57.7 31.5 12.9 Japan
Luxembourg' (57.0) (33.9) Netherlands 75.1 50.5 New Zealand .. Norway 20.3 6.3 Portugal .. Spain 72.8 52.4 Sweden 24.9 10.3 United Kingdom 68.0 47.0 United States 23.9 13.3
Italy
47.4 28.4 40.6 23.0 41.0 21.6 49.7 24.9 58.7 34.6 90.0 77.5 87.5 76.3 81.6 69.9 76.4 61.6 20.7 7.4 20.8 6.8 18.9 5.7 23.6 7.2 33.4 13.1 51.7 28.7 50.8 25.9 59.9 33.7 53.3 31.2
.. 23.6 6.9 .. 32.3 9.1 64.6 44.8 63.7 43.9 55.5 38.0 58.0 37.2 58.1 36.1 65.0 46.7 66.7 49.0 64.5 46.3 62.5 45.5 71.3 48.1 73.5 52.4 74.3 51.7 71.1 47.0 82.2 66.0 82.4 67.3 82.2 67.2 76.1 60.3 85.9 69.0 58.7 70.4 87.0 71.1 83.7 67.1 40.5 20.2 37.3 18.7 39.0 19.1 38.1 17.9 35.0 15.3 (57.7) (42.3) (57.1) (38.1) .. (52.2) (30.4) 65.6 50.0 66.1 49.9 63.4 48.4 57.7 43.0 29.4 11.3 34.5 14.7 38.0 18.7 39.1 21.3 15.9 6.3 29.5 11.6 40.4 19.2 39.1 20.2 41.1 23.6 67.0 51.2 66.6 48.3 64.6 48.1 58.4 38.3 75.0 61.5 72.7 58.5 70.2 54.0 68.4 51.1 66.1 47.4 21.2 8.2 18.4 6.5 16.4 4.8 17.6 4.6 25.8 8.1 61.5 44.7 57.2 40.8 52.2 36.0 46.3 28.1 12.1 7.4 9.9 5.7 10.2 5.6 13.0 6.3 20.6 11.2

1983
6 months 12 months 6 months 12 months 6 months 12 months 6 months 12 months 6 months 12 months 6 months 12 months and over and over and over and over I and over and over I and over and over and over and over I and over and over
1988 1989 1990 1991 1992
Australia Belgium Canada Denmark Finland France Germany Greece Ireland Italy Japan Luxembourg1 Netherlands New Zealand Norway Portugal Spain Sweden United Kingdom United States
56.1 28.8 81.7 60.3 31.1 11.2 54.3 27.8 32.0 20.7 62.4 39.0 65.8 40.7 51.6 24.7 69.3 42.8 79.8 54.7 35.3 16.5
(60.6) (36.8) 73.8 50.3
18.2 6.1
69.9 48.9 25.9 10.8 72.4 52.9 28.2 16.0
50.4 32.4 88.8 75.3 22.3 9.0 48.2 28.2
62.1 42.2 65.5 48.2 62.0 38.4 85.2 70.6 84.5 68.3 45.2 24.0
(66.7) (50.0) 67.6 56.0 34.4 13.6 18.2 9.1 62.4 45.1 70.0 55.5 22.7 8.3 69.9 54.8 14.6 9.4
44.9 28.0 84.8 74.7 22.2 8.0 46.0 22.6 23.7 7.9 59.9 41.6 68.1 52.3 63.1 42.2 85.1 71.9 84.2 68.2 44.2 23.3
(70.0) (50.0) 69.3 56.3 38.7 17.3 29.6 13.0 62.2 43.0 66.9 51.3 20.6 7.6 64.3 49.3 12.5 7.4
42.5 24.4 79.2 66.3 19.1 6.7 55.7 30.9
53.0 35.4 65.0 49.0 66.7 43.4 87.2 72.5 85.7 69.3 47.6 26.2
64.0 55.5 44.0 22.8 39.7 19.0 57.5 40.2 63.3 45.8 16.6 5.6 59.5 44.6 12.4 7.1
51.2 25.9 71.5 57.5 24.4 7.8 49.1 27.9 36.6 9.7 53.9 34.8 64.6 48.9 62.9 37.0 79.6 64.8 83.1 65.4 43.9 22.0
(66.7) (41.7) 62.3 50.2 13.0 24.2 37.6 18.8 53.8 33.3 61.7 42.7 18.4 3.9 50.8 32.2 15.1 7.6
61.4 37.7
30.1 12.5
54.8 33.7
40.0 20.0
38.9 22.6
59.0 38.3 26.8 8.4
23.0 12.8
Sources and notes See Table P.
Table R. Incidence of long-term unemployment from survey-based data among womena. b, c, d,
As a percentage of female unemployment
1983 I 1988 I 1989 I 1990 I 1991 I 1992
6 months 12 months 6 months 12 months 6 months 12 months 6 months 12 months 6 months 12 months 6 months 12 months and over and over and over and over I and over and over and over and over I and over and over and over and over
Australia Belgium Canada Denmark Finland France Germany Greece Ireland Italy Japan Luxembourg1 Netherlands New Zealand Norway Portugal Spain Sweden United Kingdom United States
47.0 25.3 87.0 70.9 25.4 7.9 67.5 38.6 29.1 19.0 70.5 44.8 63.7 37.7 69.4 44.7 55.4 25.0 85.4 59.9 23.1 5.1
(53.6) (31.1) 77.0 50.7
20.7 6.9
77.7 58.5 23.8 9.7 59.8 36.3 17.9 9.6
43.6 23.2 90.9 79.1 19.0 5.5 54.9 29.2
66.6 46.8 64.5 45.2 77.4 54.4 76.2 57.1 86.9 69.6 32.8 14.1
(50.0) (35.7) 63.7 44.6 23.0 8.4 18.2 6.1 70.3 55.3 80.2 67.7 19.7 8.1 49.1 29.5 9.0 5.1
35.2 16.9 89.3 77.2 19.2 5.3 55.5 29.0 23.5 5.9 66.5 45.6 65.5 45.9 80.0 58.8 77.1 58.2 86.7 71.9 28.1 12.5
(45.5) (18.2) 63.1 44.0 28.4 10.9 27.5 10.0 69.4 51.7 78.4 65.5 16.1 5.4 46.8 28.5 6.9 3.7
38.9 17.9 84.1 72.6 18.5 4.6 64.4 37.6
57.4 40.0 63.5 43.4 79.6 57.5 78.9 59.6 87.6 72.4 26.3 8.8
61.1 42.4 29.5 12.8 42.5 20.0 69.6 52.8 76.5 61.5 15.6 4.0 41.7 23.4 8.4 3.7
47.1 23.4 79.6 64.3 22.5 6.5 57.3 34.3 26.2 8.3 61.1 39.0 60.2 42.0 76.5 53.7 69.8 52.1 84.2 68.2 23.8 11.5
(36.4) (18.2) 53.7 36.7 33.5 17.2 41.3 22.1 61.1 41.3 74.6 58.8 16.7 3.7 38.7 21.1 10.2 4.7
54.2 29.4
26.3 9.4
60.8 38.1
28.1 8.8
43.0 24.2
73.1 56.2 24.1 7.6
17.3 9.1
Sources and notes: See Table P.
197

Austria"
a ) Data refer to averages of end-of-month figures and are based on persons aged 15 and over. h) Data refer to the wholly unemployed drawing benefits at end-June and are based on men aged 14-64 and women 14-59. c ) Data rerer to end-September and are based on persons aged 15-64. d) Data refer to April and are based on persons aged I5 and over. el Data refer to end-May and are based on persons aged 15-64 f ) Data refer to July and are based on men aged 16 and over, and women 16-64.
Sources: Austria: Bundesministeriuni fur Arbeit und Soziales, Arheitsmarkldulen. Belgium: Finland: Germany Ireland: Nethurlands: CBS, Socioal Maundstatistiek. United Kingdom:
Ministi-re de I'Emploi et du Travail. Kecensement annuel des chdmeurs complets indemnisks. Data were provided by the Ministry of Labour.
Bundesanstalt fur Arbeit, Amtliche Nachrichren der Bundesanstidt fur Arbeir. Central Statistics Office. Live Register - Half Yearly Age BJ Duration Anaiyis.
Department of Employment, Employmenr Ga;utle,
6 months 12 months and over and over
Table T. As a percentage of total registered male unemployment
6 months I2 months 1 6 months 12 nionthr 6 mmths 12 months 6 months 12 month\ 6 months 12 months and over and over 1 and over and over and over and over 1 and o+er and o%er 1 and over and over
1983 I 1988 I 19x9 1 1990 I 1991 I 1992
6 months and over
Austria" Belgium 73.9 Finland (' 30.0 Germany 55.5 Irelandd 53.5 Netherlands 69.4 United Kingdomi 61.5
6 months I2 months and over and over
12 months and over
23.2 13.0 78.3 62.6
6 months 12 months and over and over
23.3 13.4 75.4 61 7 22.5 7.3 49.4 32.5 66.3 49.1
58.9 41.5
6 months 12 months and over and over i 6 month\ 12 months
and over and oLer I
6 months 12 month? and over and over
23.5 13.1 74.1 59.0 17.0 3.1
65.3 49.7
51.5 34.1
26.0 14.6
20.0 2.7
27.0 15.4
35.1 9.6
63.8 46.6
Soirrces and notes: See Table S
Austria" Belgium * 81.4 68.7 Finlandn 31.7 13.6 Germany' 52.5 27.0 Irelandd 42.9 20.6 Netherlands 70.2 42.4 United Kingdom' 49.7 25.9
Sources and nores: See Table S
24.7 12.4 83.9 69.5 24.5 8.0 52.1 32.2 54.1 33.6 68.5 47.3 52.0 30.4
25.2 12.9 j 81.0 67.4
47.8 30.4 22.0
54 6 34.3
49.3 29.5
27.0 13.2 79.8 65.1 17.1 3.6
53.1 34.8
424 24.8
31.0 15.9
17.2 2.4
33.3 18.9
30. I 6.2
53.0 33.7

I
S
No. 1 AN ECONOMIC FRAMEWORK FOR THE EVALUATION OF C ILD CARE POLICY (1990 - Donald Verry) Also available in French
No. 2 HEALTH AND PENS
No. 3 WRONGFUL TERM1 ES AND ITS EFFECT ON THE E ~ ~ P L O Y M E N T
No. 4 STATISTICS OF ANNUAL E A R N I N ~ S IN OECD COUNTRIES (1990 - David Grubb)
No. 5 WAGE ~ I F ~ E R E N T ~ A L S , ENTRY AN GE~ERATION PROCESS IN GERMANY (1 990 - Tito Boeri)
No. 6 EQUAL PAY FOR WOR Countries (1991) Also avcrdable in French
OF ~ O M P - ~ R A ~ L E WORTH: The Experience of ~ n ~ ~ s t r i a l ~ s e d
NO. 7 THE LO~G-TEKM U N ~ M P L O Y E ~ AN ~ E A S U R E S TO ASSIST THEM (1992)
No. 8 E M ~ ~ O Y M E N ~ POLICIES FO Panel (1992)
Also available in French
Please include the fol!owing name on the mailing list: (write in capitals)
............................................................................
Organisation ......
............
..........................................................................................

ALSO AVAILABLE
Industry Training in Australia, Sweden and the United States (1993) (91 93 01 1) ISBN 92-64-13905-2
Labour Force Statistics. 1970-1990 (1992) (30 92 07 3) ISBN 92-64-03685-7
The Labour Market in the Netherlands (02 93 08 1) ISBN 92-64-13855-2
Labour Market Policies for the 1990s (81 90 01 1) ISBN 92-64-13363-1
(1993)
(1990)
FF130 f22.00 US$31.00 DM53
FF395 652.00 US$98.00 DM158
FF60 flO.OO US$14.00 DM25
FFllO €13.00 US$23.00 DM43
Prices charged at the OECD Bookshop. THE OECD CATALOGUE OF PUBLICATIONS and supplements will be sent free of charge
on request addressed either to OECD Publications Service, or to the OECD Distributor in your country.

MAIN SALES OUTLETS OF OECD PUBLICATIONS PRINCIPAUX POINTS DE VENTE DES PUBLICATIONS DE L’OCDE
ARGENTINA - ARGENTINE Documentation Franqaise IRELAND - IRLANDE Carlos Hirsch S.R.L. Galeria Giiemes, Florida 165, 4” Piso 75007 Paris Tel. 40.15.70.00 12 North Frederick Street 1333 Buenos Aires Tel. (1) 331.1787 y 331.2391 Gihert jeune ( ~ ~ ~ i ~ - & ~ ~ ~ ~ i ~ ) Dublin 1 Tel. 74.48.35n4.96.77
Telefax: ( 1 ) 331.1787 6. olace Saint-Michel Telefax: 74.84.16
29, quai Voltaire TDC Publishers - Library Suppliers
AUSTRALIA - AUSTRALIE D.A. Information Services 648 Whitehorse Road, P.0.B 163 Mitcham, Victoria 3132 Tel. (03) 873.441 1
Telefax: (03) 873.5679
AUSTRIA - AUTRICHE Gerold & Co. Graben 31 Wien I Tel. (0222) 533.50.14
BELGIUM - BELGIQUE Jean De Lannoy Avenue du Roi 202 B-1060 Bruxelles Tel. (02) 538.51.69/538.08.41
Telefax: (02) 538.08.41
CANADA Renouf Publishing Company Ltd. 1294 Algoma Road Ottawa, ON K1B 3W8
Stores: 61 Sparks Street Ottawa, ON KIP 5R1 21 1 Yonge Street Toronto, ON M5B 1M4
Les gditions La LibertC Inc. 3020 Chemin Sainte-Foy Sainte-Foy, PQ G1X 3V6
Tel. (613) 741.4333 Telefax: (613) 741.5439
Tel. (613) 238.8985
Tel. (416) 363.3171 Telefax: (416)363.59.63
Tel. (418) 658.3763 Telefax: (418) 658.3763
Federal Publications 165 University Avenue Toronto, ON M5H 3B8
Les Publications Fkdkrales 1185 Avenue de l’Universit6 Montrkal, PQ H3B 3A7
Tel. (416) 581.1552 Telefax: (416) 581.1743
Tel. (514) 954.1633 Telefax : (514) 954.1633
CHINA - CHINE China National Publications Import Export Corporation (CNPIEC) 16 Gongti E. Road, Chaoyang District P.O. Box 88 or 50 Beijing 100704 PR Tel. (01) 506.6688
Telefax: (01) 506.3101
DENMARK - DANEMARK Munksgaard Export and Subscription Service 35, Nvlrre Svlgade, P.O. Box 2148 DK-1016 Kvlbenhavn K Tel. (33) 12.85.70
Telefax: (33) 12.93.87
FINLAND - FINLANDE Akateeminen Kirjakauppa Keskuskatu 1, P.O. Box 128 00100 Helsinki Tel. (358 0) 12141
Telefax: (358 0) 121.4441
FRANCE OECD/OCDE Mail OrdersKommandes par correspondance: 2, rue Andr6-Pascal 75775 Paris Cedex 16 Tel. (33-1) 45.24.82.00 Telefax: (33-1) 45.24.81.76 or (33-1) 45.24.85.00
Telex: 640048 OCDE
75606 Paris Tel. 43.25.91.19 Lihrairie du Commerce International 10, avenue d’I6na 75016 Paris Tel. 40.73.34.60 Lihrairie Dunod Universitk Paris-Dauphine Place du Markchal de Lattre de Tassigny 75016 Paris Tel. 47.27.18.56 Lihrairie Lavoisier 11, rue Lavoisier 75008 Paris Tel. 42.65.39.95 Lihrairie L.G.D.J. - Montchrestien 20, rue Soufflot 75005 Paris Tel. 46.33.89.85 Lihrairie des Sciences Politiques 30, rue Saint-Guillaume 75007 Paris Tel. 45.48.36.02 P.U.F. 49, boulevard Saint-Michel 75005 Paris Tel. 43.25.83.40 Lihrairie de I’UniversitC 12a, rue Nazareth 131.00 Aix-en-F’rovence Tel. (16) 42.26.18.08 Documentation FranGaise 165, rue Garihaldi 69003 Lyon Tel. (16) ?8.63.32.23 Lihrairie Decitre 29, place Bellecour 69002 Lyon Tel. (16) 72.40.54.54
GERMANY - ALLEMAGNE OECD Publications and Information Centre August-Behel-Allee 6 D-W 5300 Bonn 2 Tel. (0228) 959.120
Telefax: (0228) 959.12.17
GREECE - GRECE Librairie Kauffmann Mavrokordatou 9 106 78 Athens Tel. 322.21.60
Telefax: 363.39.67
HONG-KONG Swindon Book Co. Ltd. 13-15 Lock Road Kowloon, Hong Kong Tel. 366.80.31
Telefax: 739.49.75
HUNGARY - HONGRIE Euro Info Service POB 1271 1464 Budapest Tel. (1) 111.62.16
Telefax : ( I ) 111.60.61
ICELAND - ISLANDE Mil Mog Menning Laugavegi 18, P6sth6lf 392 121 Reykjavik Tel. 162.35.23
INDIA - INDE Oxford Book and Stationery Co. Scindia House New Delhi 11OOOI Tel.(lI) 331.5896/5308
Tebfax: (1 1) 332.5993 17 Park Street Calcutta 700016 Tel. 240832
INDONESIA - INDONESIE
ISRAEL Electronic Publications only Publications Clectroniques seulement Sophist Systems Ltd. 71 Allenby Street Tel-Aviv 65 134 Tel. 3-29.00.21
Telefax: 3-29.92.39
ITALY - ITALIE Lihreria Commissionaria Sansoni Via Duca di Calahria 1/1 50125 Firenze Tel. (055) 64.54.15
Telefax: (055) 64.12.57 Via Bartolini 29 20155 Milano Tel. (02) 36.50.83
Editrice e Libreria Herder Piazza Montecitorio 120 00186 Roma Tel. 679.46.28
Telefax: 678.47.51
Lihreria Hoepli Via Hoepli 5 20121 Milano Tel. (02) 86.54.46
Telefax: (02) 805.28.86
Lihreria Scientifica Dott. Lucio de Biasio ‘Aeiou‘ Via Coronelli, 6 20146 Milano Tel. (02) 48.95.45.52
Telefax: (02) 48.95.45.48
JAPAN - JAPON OECD Publications and Information Centre Landic Akasaka Building 2-3-4 Akasaka, Minato-ku Tokyo 107 Tel. (81.3) 3586.2016
Telefax: (81.3) 3584.7929
KOREA - COREE Kyoho Book Centre Co. Ltd. P.O. Box 1658, Kwang Hwa Moon Seoul Tel. 730.78.91
Telefax: 735.00.30
MALAYSIA - MALAISE Co-operative Bookshop Ltd. University of Malaya P.O. Box 11 27, Jalan Pantai Baru 59700 Kuala Lumpur Malaysia Tel. 756.5OOO/756.5425
Telefax: 757.3661
MEXICO - MEXIQUE Revistas y Periodicos Intemacionales S.A. de C.V. Florencia 57 - 1004 Mexico, D.F. 06600 Tel. 207.81.00
Telefax : 208.39.79
NETHERLANDS - PAYS-BAS SDU Uitgeverij Christoffel Plantijnstraat 2 Posthus 20014 2500 EA’s-Gravenhage Voor hestellingen:
Tel. (070 3) 78.99.1 1 Tel. (070 3) 78.98.80
Telefax: (070 3) 47.63.51
NEW ZEALAND NOUVELLE-ZELANDE
OECD BookshopiLihrarie de I’OCDE : Pdii-Lipi Legislation Services 33, rue Octave-Feuillet P.O. Box 269/JKSMG/88 P.O. Box 12418 75016 Paris Tel. (33-1) 45.24.81.67 Jakarta 12790 Tel. 583467 Thorndon, Wellington Tel. (04) 496.5652
(33-1) 45.24.81.81 Telex: 62 875 Telefax: (04) 496.5698

Narvesen Info Center - NIC Bertrand Narvesens vei 2 P.O. Box 6125 Etterstad 0602 Oslo 6 Tel. (02) 57.33.00
Telefax: (02) 68.19.01
ISTAN Mirza Book Agency 65 Shahrah Quaid-E-Azam Lahore 54000 Tel. (42) 353.601
Telefax: (42) 231.730
international Book Center 5th Floor, Filipinas Life Bldg. Ayala Avenue Metro Manila Tel. 81.96.76
Telex 23312 RHP PH
TUGAL Livraria Portugal Rua do Carmo 70-74 Apart. 2681 I 1 17 Lishoa Codex Tel.: (01) 347.49.82/3/4/5
Telefax: (01 j 347.02.64
S I N G A P O ~ - SINGAPOUR Information Publications Pte. Ltd. 41, Kallang Pudding, No. 04-03 Singapore 1334 Tel. 741.5166
Telefax: 742.9356
S ~ A I N - ESPAGNE Mundi-Prensa Libras S.A. Caste116 37, Apartado 1223 Madrid 28001 Tel. (91) 431.33.99
Telefax: (91) 575.39.98
Libreria Inteinacional AEDOS Consejo de Ciento 391 08009 - Barcelona
Llihreria de la Generalitat Palau Moja Ramhla dels Esrudis, 11 8 08002 - Barcelona
Tel. (93) 488.34.92 Telefax: (93) 487.76.59
(Subscripcions) Tel. (93) 318.80.12 (Puhlicacions) Te!. (93) 302.67.23
Telefax: (93) 412.18.54
Centre for Policy Research d o Colombo Agencies Ltd. No. 300-304, Galle Road Colombo 3 Tel. (1 j 574240, 57355 1-2
Telefax: (1) 575394. 510711
SWEDEN - SUEDE Fritzes Fackhoksforetaget Box 16356 Regeringsgatan 12 103 27 Stockholm
Subscription Agency-Agence d’abonnements Wennergren-Williams AB P.O. Box 1305 171 25 Solna
Tel. (08) 690.90.90 Telefax: (08) 20.50.21
Tel. (08) 705.97.50 Tilefax : (08) 27.00.71
SWITZERLAND - SUISSE Maditec S.A. (Books and Periodicals - Livres et piriodiques) Chemin des Palettes 4 Case postale 2066 1020 Renens 1 Tel. ( 0 2 l j 635.08.65
Telefax: (021 j 635.07.80
Lihrdirie Payot S.A. 4, place Pipinet 1003 Lausanne Tel. (021) 341.33.48
Telefax: (021) 341.33.45
Lihrairie Unilivres 6, rue de Candolle 1205 Genbve Tel. (022) 320.26.23
Telefax: (022) 329.73.18
Subscription Agency - Agence d’ahonnement Dynapresst Marketing S.A. 38 avenue Vihert 1227 Carouge Tel.: (022) 308.07.89
Telefax : (022) 308.07.99
See also - Voir aussi : OECD Publications and Information Centre August-Behel-Allee 6 D-W 5300 Bonn 2 (Germany) Tel. (0228) 9.59.120
Telefax: (0228) 959.12.17
TAIWAN - FO1RIMOSE Good Faith Worldwide Int’l. Co. Ltd. 9th Floor, No. 118, Sec. 2 Chung Nsiao E. Road Taipei Tel. (02) 391.7396/391.7397
Telefax: (02) 394.9176
Suksit Siam Co. Ltd. 113, 1 15 Fuang Nakhon Rd. Opp. Wat Rajhopith Bangkok 10200 Tel. (662) 251.1630
Telefax: (662) 236.7783
TURKEY - TURQUIE Kiilriir Yayinlari ls-Turk Ltd. Sti. Atatiirk Bulvari No. 19l/Kat 13 KavakliderelAnkxa Dolmahahce Cad. No. 29 Besiktasflstanhul
Te:. 428.1 1.40 Ext. 2458
Tel. 250.71.88 Telex: 43482B
UNITED KINGDOM - ~OYAUME-UNI HMSO Gen. enquiries Posral orders only: P.O. Box 276, London SW8 5DT Personal Callers HMSO Bookshop 49 High Holhom, London WClV 6HB
Branches at: Belfast, Birmingham, Bristol, Edin- burgh, Manchester
Tel. (071) 873 0011
Telefax: (071) 873 8200
UNITED STATES - ETATS-UNIS OECD Publications and Information Centre 2001 L Street N.W., Suite 700 Washington, D.C. 20036-4910 Tel. (202) 785.6323
TeleEax: (202) 785.0350
VENEZUELA Libreria del Este Avda F. Miranda 52, Aptdo. 60337 Edificio Galipin Caracas 106 Tel. 951.1705/951.2307/951.l297
Telegram: Lihreste Caracas
Subscription to OECD periodicals may also he placed through main subscription agencies.
Les ahonnements aux publications periodiques de I’OCDE peuvent &re souscrits auprks des principales agences d’ahonnement.
Orders and inquiries from countries where Distribu- tors have not yet been appointed should he sent to: OECD Publications Service, 2 rue Andre-Pascal, 75175 Paris Cedex 16, France.
Les commandes provenant de pays ou I’OCDE n’a pas encore design6 de distrihuteur devraient stre adressies a : OCDE, Service des Publications, 2, rue Andri-Pascal, 75775 Paris Cedex 16, France.
04- 1993

OECD PUBLICATIONS, 2 rue Andrb-Pascal, 75775 PARIS C E D M 16
(81 93 04 1) ISBN 92-64-13938-9 - No 46615 1993 PRINTED IN FRANCE