Agricultural Landscapes Thematic Working Group Report
24
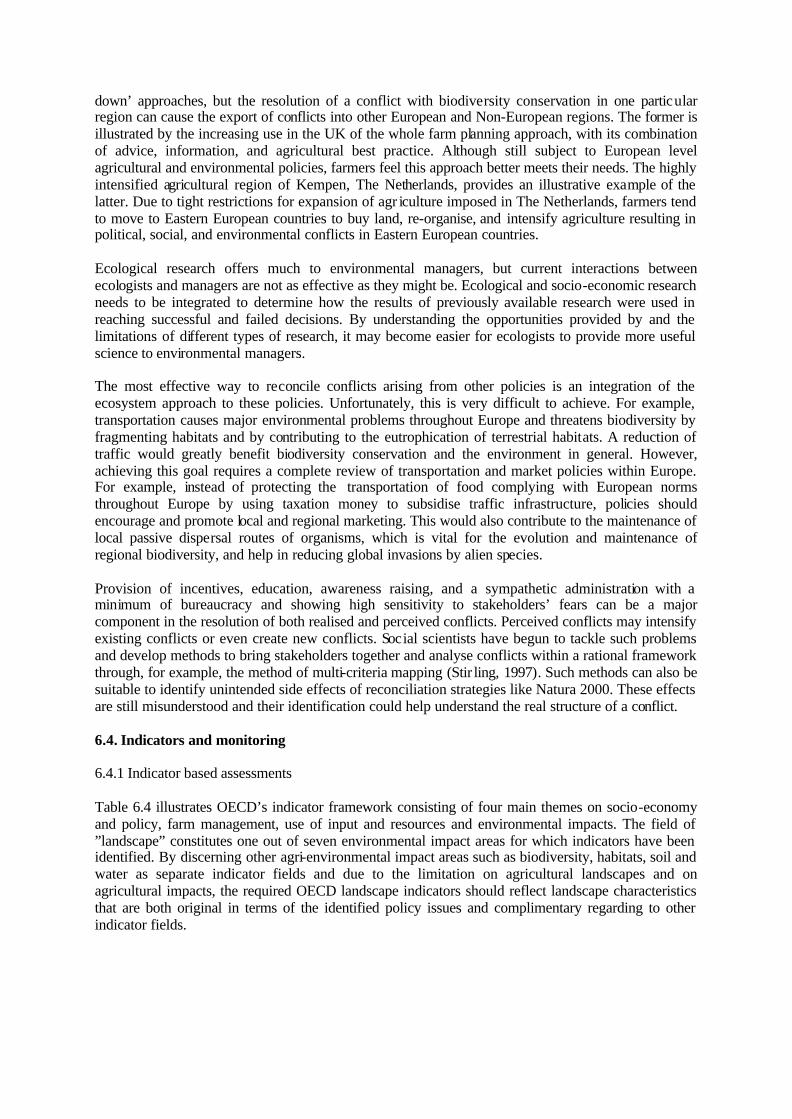
Agricultural Landscapes Thematic Working Group Report Klaus Henle, Didier Alard, Jeremy Clitherow, Paul Cobb, Les Firbank, Tiiu Kull, Robin Moritz, Heidrun Mühle, Dirk Wascher, Frank Wätzold and Juliette Young. 1 6.1. Introduction Agricultural landscapes cover about 43 % (137 million hectares) of the European Union. This is divided into arable land (nearly 76 million ha), permanent grassland (50 million ha), and permanent culture (11 million ha). Agricultural landscapes show a wide range of ecological conditions and can differ cons iderably in their biodiversity depending on abiotic factors, such as soil condition, water availability, climate, and slope, and management factors, such as type, intensity, and scale of use. Grasslands (see Chapter 7) are one of the most important habitats for biodiversity in agricultural landscapes, but extensively used vineyards, orchards, and old fields are also of considerable importance for a range of species, including many that have become very rare. 6.1.1 Historical review Through the expansion of agriculture, open areas increasingly replaced forests leading to a mosaic landscape composed of small settlements, farms, small pieces of fields and pastures, woods, hedges, orchards, and small stock watering places. This expansion from the Mediterranean and the Near East into Central and Northern Europe allowed many species to expand their ranges. The diversification of the landscape by traditional forms of agriculture was a relative slow process that lasted well into the 19 th and partly the 20 th century making agricultural landscapes not only an important part of European biodiversity but also a component of our cultural heritage. Species had time to adapt to these changes and traditional forms of agriculture provided a tremendous range of pathways for the passive local and regional dispersal of organisms allowing species to re-colonise areas in which they became extinct because of random factors, succession, or land use change (Poschlod & Bonn, 1998). The production of fertiliser developed by Liebig in the mid 19 th century as well as the application of new, high-performance machines, and advances in plant and animal breeding marked the beginning of a new age in agriculture. Then, following the Second World War, preventing hunger of the population was the most important aim of the European Community. This led the members of the European Economic Community to sign the Treaty of Rome in 1960, with the targets of increasing agricultural productivity, adapting the living conditions of the rural to the urban population, and stabilising the markets in Europe. The Common Agricultural Policy (CAP) was one of the biggest policy concerns of the European Community in its early days, and still dominates much of common EU policies. However, once the food production targets were reached, agricultural production became separated from securing nutrition and intensification continued with far reaching consequences. Intensification of productivity is imbedded into a network of driving forces and responses (Figure 6.1). It is caused by the strong influence of the agricultural lobby, focussed on a high productivity of farms and a high income of farmers. The modern form of agriculture is particularly characterised by its strive to achieve the largest possible short-term profit on the available area and is typified by a minimisation of labour input through the use of a wide range of machines on spacious, cleared agricultural areas with resulting negative ecological effects (Luedecke & Reusswig, 1999; Stoate & Boatman, 2001; WBGU). These include the loss of genetic diversity both for crops and animal production, caused by the farming of high productive varieties and magnified by the necessity to comply with European norms, the loss of biodiversity through the input of high doses of fertilisers and biocides, landscape clearing such as the cutting of woodlots, hedges, and alley trees or fruit trees on tracks, and the conversion of natural ecosystems into fields and intensively used pastures. Species have had to adapt to these changed landscapes and many endangered and threatened species in Europe are now those that depend 1 The authors acknowledge the help of Timo Goeschl, Davy McCracken, Peter Nowicki, Isabelle Poudevigne, Felix Rauschmayer, Irene Ring and Andreas Troumbis in the preparation of this chapter.
-
Upload
independent -
Category
Documents
-
view
0 -
download
0
Transcript of Agricultural Landscapes Thematic Working Group Report

Agricultural Landscapes Thematic Working Group Report Klaus Henle, Didier Alard, Jeremy Clitherow, Paul Cobb, Les Firbank, Tiiu Kull, Robin Moritz, Heidrun Mühle, Dirk Wascher, Frank Wätzold and Juliette Young.1
6.1. Introduction Agricultural landscapes cover about 43 % (137 million hectares) of the European Union. This is divided into arable land (nearly 76 million ha), permanent grassland (50 million ha), and permanent culture (11 million ha). Agricultural landscapes show a wide range of ecological conditions and can differ cons iderably in their biodiversity depending on abiotic factors, such as soil condition, water availability, climate, and slope, and management factors, such as type, intensity, and scale of use. Grasslands (see Chapter 7) are one of the most important habitats for biodiversity in agricultural landscapes, but extensively used vineyards, orchards, and old fields are also of considerable importance for a range of species, including many that have become very rare. 6.1.1 Historical review Through the expansion of agriculture, open areas increasingly replaced forests leading to a mosaic landscape composed of small settlements, farms, small pieces of fields and pastures, woods, hedges, orchards, and small stock watering places. This expansion from the Mediterranean and the Near East into Central and Northern Europe allowed many species to expand their ranges. The diversification of the landscape by traditional forms of agriculture was a relative slow process that lasted well into the 19th and partly the 20th century making agricultural landscapes not only an important part of European biodiversity but also a component of our cultural heritage. Species had time to adapt to these changes and traditional forms of agriculture provided a tremendous range of pathways for the passive local and regional dispersal of organisms allowing species to re-colonise areas in which they became extinct because of random factors, succession, or land use change (Poschlod & Bonn, 1998). The production of fertiliser developed by Liebig in the mid 19th century as well as the application of new, high-performance machines, and advances in plant and animal breeding marked the beginning of a new age in agriculture. Then, following the Second World War, preventing hunger of the population was the most important aim of the European Community. This led the members of the European Economic Community to sign the Treaty of Rome in 1960, with the targets of increasing agricultural productivity, adapting the living conditions of the rural to the urban population, and stabilising the markets in Europe. The Common Agricultural Policy (CAP) was one of the biggest policy concerns of the European Community in its early days, and still dominates much of common EU policies. However, once the food production targets were reached, agricultural production became separated from securing nutrition and intensif ication continued with far reaching consequences. Intensification of productivity is imbedded into a network of driving forces and responses (Figure 6.1). It is caused by the strong influence of the agricultural lobby, focussed on a high productivity of farms and a high income of farmers. The modern form of agriculture is particularly characterised by its strive to achieve the largest possible short-term profit on the available area and is typified by a minimisation of labour input through the use of a wide range of machines on spacious, cleared agricultural areas with resulting negative ecological effects (Luedecke & Reusswig, 1999; Stoate & Boatman, 2001; WBGU). These include the loss of genetic diversity both for crops and animal production, caused by the farming of high productive varieties and magnified by the necessity to comply with European norms, the loss of biodiversity through the input of high doses of fertilisers and biocides, landscape clearing such as the cutting of woodlots, hedges, and alley trees or fruit trees on tracks, and the conversion of natural ecosystems into fields and intensively used pastures. Species have had to adapt to these changed landscapes and many endangered and threatened species in Europe are now those that depend
1 The authors acknowledge the help of Timo Goeschl, Davy McCracken, Peter Nowicki, Isabelle Poudevigne, Felix Rauschmayer, Irene Ring and Andreas Troumbis in the preparation of this chapter.

on the gradually diminishing areas where traditional forms of agriculture still exist (Kaule, 1991; Sukopp et al., 1978).
Figure 6.1. Main conflicts between major stakeholders in the conservation of biodiversity in agricultural landscapes 6.1.2 Agriculture landscapes as socio-economic ecosystems At the beginning of last century, scientists such as zoologists, biologists, botanists, or hydrologists felt increasingly challenged to overcome their disciplinary boundaries by identifying and establishing inter-relations in a more integrated fashion. The two main outflows of these efforts were the concepts
Agricultural Policies: CAP / Agenda 2000 Biodiversity Action Plan Accession Negotiations OECD Indicators
Environmental Policies: Natura 2000 European Landscape Convention Convention for Biol. Diversity
Agricultural Sectors: European Farmer Association European Pesticide Assoc....
Conflicting Sectors: Environmental NGOs European Tourist Association...
Consumer Sector: Consumer Associations
National Farming Policy
National Environmental Policy
Farmstead
Output:
Food products Biodiversity Cultural Landscapes Rural tourism
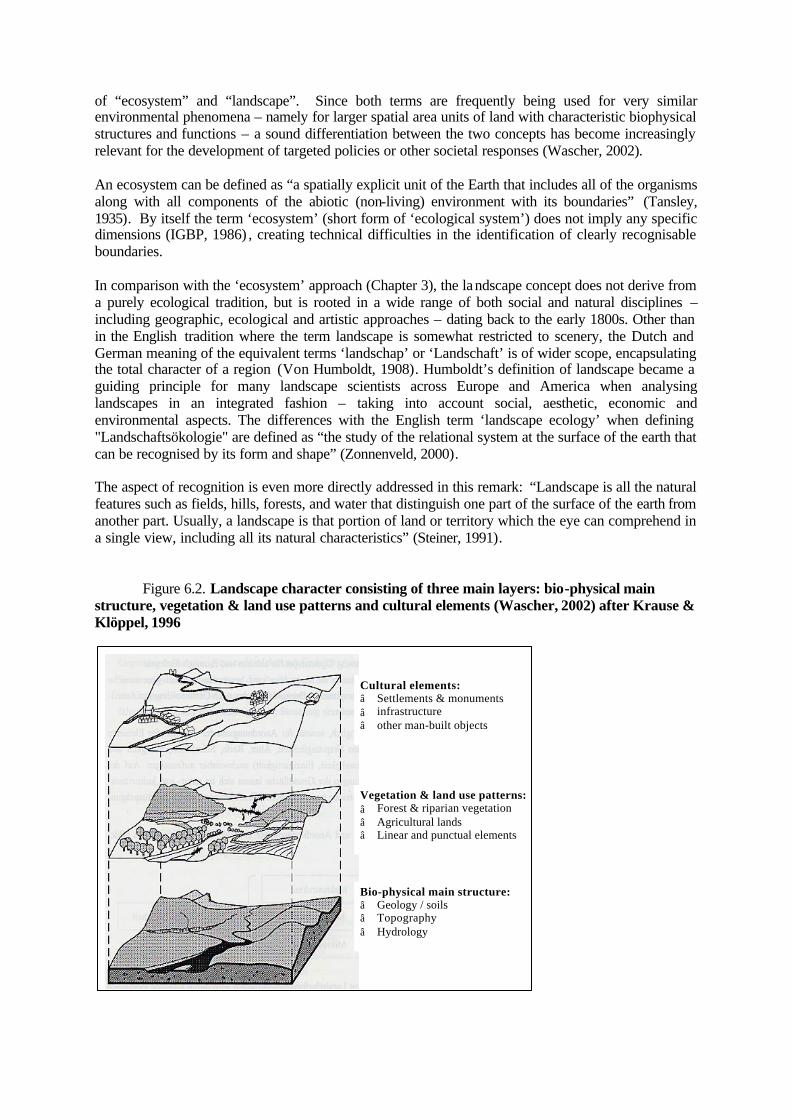
of “ecosystem” and “landscape”. Since both terms are frequently being used for very similar environmental phenomena – namely for larger spatial area units of land with characteristic biophysical structures and functions – a sound differentiation between the two concepts has become increasingly relevant for the development of targeted policies or other societal responses (Wascher, 2002). An ecosystem can be defined as “a spatially explicit unit of the Earth that includes all of the organisms along with all components of the abiotic (non-living) environment with its boundaries” (Tansley, 1935). By itself the term ‘ecosystem’ (short form of ‘ecological system’) does not imply any specific dimensions (IGBP, 1986) , creating technical difficulties in the identification of clearly recognisable boundaries. In comparison with the ‘ecosystem’ approach (Chapter 3), the landscape concept does not derive from a purely ecological tradition, but is rooted in a wide range of both social and natural disciplines – including geographic, ecological and artistic approaches – dating back to the early 1800s. Other than in the English tradition where the term landscape is somewhat restricted to scenery, the Dutch and German meaning of the equivalent terms ‘landschap’ or ‘Landschaft’ is of wider scope, encapsulating the total character of a region (Von Humboldt, 1908). Humboldt’s definition of landscape became a guiding principle for many landscape scientists across Europe and America when analysing landscapes in an integrated fashion – taking into account social, aesthetic, economic and environmental aspects. The differences with the English term ‘landscape ecology’ when defining "Landschaftsökologie" are defined as “the study of the relational system at the surface of the earth that can be recognised by its form and shape” (Zonnenveld, 2000). The aspect of recognition is even more directly addressed in this remark: “Landscape is all the natural features such as fields, hills, forests, and water that distinguish one part of the surface of the earth from another part. Usually, a landscape is that portion of land or territory which the eye can comprehend in a single view, including all its natural characteristics” (Steiner, 1991).
Figure 6.2. Landscape character consisting of three main layers: bio-physical main structure, vegetation & land use patterns and cultural elements (Wascher, 2002) after Krause & Klöppel, 1996
Bio-physical main structure:â Geology / soilsâ Topographyâ Hydrology
Vegetation & land use patterns:â Forest & riparian vegetationâ Agricultural landsâ Linear and punctual elements
Cultural elements:â Settlements & monumentsâ infrastructureâ other man-built objects

The visual aspects of landscapes have been taken up by OECD which defines agricultural landscapes as “the visible outcomes from the interaction between agriculture, natural resources and the environment, and encompass amenity, cultural, and other societal values” (OECD, 2001). More than other landscape definitions that have been developed during the last decades, the OECD approach is meant to provide the basis for an operational framework for landscape assessment at the international level with clear orientation towards political and economic targets. From this perspective, landscape functions and values are no longer considered to be by-products of coincidental bio-physical conditions and management regimes, but are interpreted as conscious societal demands towards the supplier or producer – namely the local farmer. The most adequate short formula that summarises such a point of view is to define agricultural landscapes as ‘socio-economic ecosystems’ (Wascher, 2002). With the increasing environmental awareness of the citizens of Europe and their politicians in the last decades, conflicts between agriculture, biodiversity, and the human environment have become increasingly apparent and have provoked a re-thinking of agricultural policies and practices. To address these and similar conflicts in other landscape types, the ecosystem approach2 has been developed (chapter 3). The ecosystem approach permits the one-dimensional aim of agriculture (i.e. food production) to be increasingly replaced by a multi-dimensional perspective incorporating social and ecological aspects. The political and socio-economic transition of Europe at the beginning of the 21st century provides opportunities and new challenges for the implementation of the ecosystem approach to reconcile conflicts between agriculture and biodiversity conservation. Some of the new accession countries to the European Union can contribute vast tracts of unfragmented semi-natural landscapes with high biodiversity conservation value to the European heritage. The challenges are to maintain these values while developing equal opportunities with new types of agricultural landscapes that consider regionally differentiated biological, cultural, and social identities, services and responsibilities for the citizens of Europe. To summarise, conflicts between agriculture and biodiversity take place at different temporal and spatial scales and options available for biodiversity conservation differ strongly among European regions (Meeus & Wijermans, 1990; Mücher et al., 2002). The aim of this chapter is (a) to identify sources of conflicts for biodiversity conservation in agricultural landscapes, (b) to develop conflict resolution strategies and (c) to identify suitable monitoring schemes. Case studies are presented to illustrate conflicts and conflict resolution strategies. Finally, we discuss research needs for understanding and resolving conflicts.
6.2. Identification of Conflicts Agricultural policies and practices are by far the most important sources of conflicts for biodiversity conservation in agricultural landscapes and will therefore be the prime focus of the report. 6.2.1 Conflicts caused by agricultural policies and practices There is increasing awareness that the causes of many environmental problems affecting European landscapes originate outside the region concerned. A global market economy, especially the impacts of the Common Agricultural Policy (CAP), Trans-European traffic networks (TENs), large-scale demographic and socio-economic changes, cross-boundary (e.g. air-borne) pollution as well as differences in landscape-related policy and planning mechanisms at the national level have left European landscape exposed to unprecedented trends and threats.
2 The ecosystem approach as identified within the framework of the Convention on Biological Diversity represents an approach to ecosystem management that has a clearly defined vision of desired future conditions. This approach is a distinctive process intended to integrate ecological, economic, and social factors and balance these three overall objectives of the CBD (CBDSecretariat (1998). UNEP/CBD/COP/4/Inf.9.).

As with biodiversity, a wide range of human activity can affect landscapes, even when only focusing on the agricultural sector. Table 6.1 presents some of the most frequently cited processes that can affect landscapes. Because landscapes and agriculture appear as being two aspects of the same issue, the term ‘conflict’ is only partially appropriate. This is because without the changes that are associated with agricultural activities, without cutting forest, introducing domestic plants and animals, and without shaping the land according to the production processes – there would not be the same European landscapes that are of public, scientific and policy interest. The definition of what is actually resulting in a conflict on today’s landscape is hence very much a discussion on threshold values, ecological carrying capacities, human perceptions and preferences with regard to landscape scenery, and future requirements assigned to landscapes (Wascher, 2000).
Table 6.1. Pressures on landscapes: relevance, reliability, feasibility and indicators. [ISU = Intensity Scale Unit; AU = Area Unit] (Wascher, 2000) Pressure / Driving force
Indicators Relevance Reliability Feasibility
Fragmentation 1 Length of roads/railways etc./AU.
The density of a road system is part of the fragmentation problem. In the case of agriculture, only agricultural infrastructure is relevant.
There are conflicting views on the impact of roads on landscape. In some countries, roads are interpreted as positive for providing access to landscapes.
Road data at European level is relatively coarse.
2 Rate of urbanisation along roads, rivers, lakes, coasts.
Gives good indication of landscape scenery.
cannot be directly related to agricultural activities;
European data will not suffice.
Loss of natural landscape character
1 Intensity of production/ hectare (in ISU/AU).
Can show impact on natural landscape aspects.
Production intensity can be high without that landscape needs to be negatively affected. Differs from case to case.
Areas of high production intensity can be identified.
2 Intensity of production/enterprise (in ISU/AU).
See above See above See above
3 Landscape character linked to forms of land management that are economically at risk.
An indirect (risk) indicator that identifies landscapes that are difficult to be maintained when exposed to
Depends a lot on interpretations of future trends, role of conservation schemes, subsidies and future sustainable
Requires detailed studies about landscape related production systems and region-specific socio-economic

exposed to economic competition.
sustainable land management. Hence a series of items with only little security; generalisations must be avoided.
economic dynamics.
5 Number of grasslands from total (%)
Only in cases where the presence of grasslands is typical for natural conditions and landscape character.
Interpretation of data requires good baseline data (how much grassland must be considered adequate); for many European Landscapes, grasslands are no or only one among other attributes.
For this indicator, a better differentiation of grassland types than currently available is required. CORINE land cover is only very basis.
6 Change of grassland into cropland (rate: AU/ year).
See above See above See above
7 Proportion of irrigated or drained farm land/AU
A valid indicator for intensification of land use and changes of natural conditions.
Good regional knowledge is required to apply this indicator well; e.g. in NL, wet soils have first been drained and are now artificially irrigated. This is entirely different from irrigation on naturally dry soils.
Data on irrigation is scarce but can be obtained in parts form FADN/FSS.
Loss of rural-cultural patterns
1 Abandonment of farmland (rate: AU/ year).
Farmland abandonment is a phenomenon throughout many European Landscapes; the indicator links to NL-3.
Any abandonment indicates severe land use problems; a reliable indicator.
Data on abandonment results from frequently from modeling. Factual data would be more useful.

2 loss of cultural landscape elements.
This is the equivalent to the state data on cultural identity.
Requires good assessment methodologies for what could be considered as reliable information.
Data needs to be gathered. No European information.
3 Change in land use patterns.
This is often quoted as being a useful indicator. It is therefore listed here.
Assessing and interpreting land use patterns is complex, region- and scale specific task. A general European-wide application of such an indicator lacks conceptual adequacy.
Can be performed on the base of CORINE land cover; however, requires strict region-oriented interpretation.
4 Change of farmland into urban land (rate: AU/year)
Gives good indication of landscape scenery.
Cannot be directly related to agricultural activities.
European data will not suffice.
5 Change of farmland into forest (rate: AU/year)
Gives good indication of landscape scenery and is equivalent to state indicator. With regard to the discussion on GHG, this could be an interesting set of data.
Can be considered as highly useful for assessing landscape changes. However, it is not a clear ‘pressure’ indicator, since forests can be desired (see example Denmark).
CORINE data and European forest data are available.
The case-by-case discussion in Table 6.1 provides some good first insights into the complex nature of conflicts. Any thorough examination of peoples’ landscape perception demonstrates that aesthetically appreciated landscapes are not necessarily ecologically stable or sustainable (see also Case Study 2, Section 6.6.2); neither are everyday landscapes that are considered as inconspicuous or even hostile ecologically unstable or unsustainable. Examples like the highly valued but extremely erosive Tuscany landscape, or the wide flat polder landscapes (despite the rather low diversity valuable for both scenery and ecology – depending on the management), demonstrate that one would be ill advised to link environmental condition strictly to aesthetic qualities. Processes in agriculture that create conflicts with biodiversity conservation can be grouped into three main types of processes (Figure 6.3), namely intensification, abandonment and scale of operation. The most important conflicts arising from these three processes are listed below (see also Table 6.2):

1. Intensification of agriculture: 1.1 Eutrophication, 1.2 Output of biocides, antibiotics, and endocrine substances, 1.3 Release of genetically modified organisms (GMOs), 1.4 Conversion of extensive land use into high intensity production areas; 2. Abandonment of agriculture: 2.1 Afforestation, 2.2 Conversion into built up areas (urban sprawl, commercial sites on the “green meadow”), 2.3 Conversion of habitat by succession, 2.4 Management of land for nature, 2.5 Loss of old varieties of cultivated species, 2.6 Loss of the cultural heritage of ancient agricultural landscapes and types of production systems; 3. Change in scale and organisation of agriculture: 3.1 Trend to monoculture 3.2 Loss of small-scale heterogeneity in landscape features, 3.3 Change and loss of passive dispersal routes for plants and animals (Loss and replacement of local pathways for species typical of the regional agricultural landscape by global invasions of common species).
The relative importance of these three processes differs among ecological regions and countries within Europe: Although throughout Europe nitrogen input and generally the input of agro-chemicals is one of the most important conflicts associated with the intensification of agriculture, the most serious conflict in Mediterranean countries and the new accession countries is often the conversion of extensive land use into high intensity production areas. In contrast, in Central and Eastern Europe, abandonment of agriculture and the fragmentation of valuable habitats are important sources of conflict.

Figure 6.3. Driving forces for the intensification of agriculture and its effect on the environment
Human Community - Impact of agricultural lobby - Agricultural policy - Population lifestyle
Intensification Productivity Increase
Biosphere - Degradation and loss of natural ecosystems - Loss of habitats and species - Increasing overharvesting of biological resources - Loss of varieties - Loss of genetic diversity
Hydrosphere - Loss of small ponds - Changing groundwater levels and impacts on local water
balance - Loss of riverine margins and buffer zones - Increasing freights of dissolved materials
Pedosphere - Compaction of soil - Soil erosion - Eutrophication - Contamination
Atmosphere : Reinforced greenhouse effects
Human Health
Economy: Downturn of traditional agriculture

Genetically modified organisms (GMOs) are an issue that is often hotly debated in the public arena. The public and politicians are concerned more about the ethical issues and threats to human health of GMOs than about the threats to biodiversity conservation. The main biodiversity related issue discussed in the public or political arena is the risk of transfer of genetic material to wild species and the threats posed to the receiving and other species by this transfer. The use of GMOs also carries another, probably more wide-reaching risk for biodiversity by allowing another step in the intensification of agriculture and in the use of herbicides (Firbank & Forcella, 2000; Watkinson et al., 2000). It seems likely that this new step of intensification may have consequences for biodiversity similar in extent to the wide-reaching consequences that followed the introduction of selective breeding of plants and animals in agriculture or the industrial production and use of agro-chemicals (Krebs et al., 1999; Watkinson et al., 2000). Figure 6. 4. Framework to assess and predict potential influences of main drivers of change on agricultural landscapes and their biodiversity as a basis for conflict identification and resolution
6.2.2. Conflicts created by non-agricultural policies Forestry, spatial planning, transportation, tourism, recreation and conservation policies are the major non-agricultural sources of conflict for biodiversity conservation in agricultural landscapes. In Table 6.3, we list the types of conflicts created by non-agricultural policies and reconciliation strategies that can be used for solving these conflicts. Many of these conflicts are similar to conflicts created by agricultural policies and practices but often require very different reconciliation strategies. The conflicts identified and discussed above will engage a wide range of stakeholders and are relevant both for biodiversity conservation in agricultural landscapes in general as well as for Natura 2000 sites. For the latter, conflicts on land allocation, corridors, and buffer zones are particularly strong and difficult to reconcile in intensively used agricultural landscapes and have caused much debate amongst stakeholders (as for example the ecological effects of corridors (Amler et al., 1999; Saunders & Hobbs, 1991; Simberloff & Cox, 1987)). Different policies on financial subsidies are a major reason
Strategic environmental assessment and monitoring
Main drivers of change
- Environmental forces - Socio-economic, political forces - Technological development
Agricultural practices - Intensification - Abandonment - Change of scale/resolution
Landscape and biodiversity changes
Landscapes: Loss of character, regional identity Habitats: Habitat loss or fragmentation, deterioration and disturbances Species: Species loss and population decline

why the Natura 2000 system fortifies conflicts in some countries but contributes to conflict resolution in others. In Table 6.2, we identify those strategies that can contribute to the resolution of the conflicts between agricultural policies and practice and biodiversity conservation. In Table 6.3, we list those strategies that can be used to reconcile biodiversity conservation in agricultural landscapes with other policies. Implementation of best practices will differ among habitats, species, ecological regions, and countries.
6. 3. Conflict resolution strategies
Table 6.2. Resolution strategies for the major conflicts between agriculture and biodiversity conservation
Resolution strategy Types of conflict
Intensification Abandonment Scale of operation
Fert
ilise
rs
Bio
cide
s, e
ndoc
rines
, an
tibio
tic s
ubst
ance
s
GM
Os
Con
vers
ion
of p
astu
re
Aff
ores
tatio
n
Urb
anis
atio
n
Succ
essi
on
Man
agem
ent f
or n
atur
e
Loss
of a
ncie
nt v
arie
ties
Loss
of c
ultu
ral h
erita
ge
Tren
d to
mon
ocul
ture
Smal
l-sc
ale
land
scap
e fe
atur
es
Dis
pers
al p
roce
sses
Strategic level Political & administrative framework
√ √ √ √ √ √ √ √ √ √
Legal regulations √ √ √ √ √ √ √ √ √ √
Incentive level Subsidies/compensation √ √ √ √ √ √ √ √ √ √ √ Marketing: healthy products; educate consumers; environmental labelling
√ √ √ √ √ √ √ √ √ √
Production of tradable environmental goods
√ √ √ √ √ √
Formal contracting √ √ √ √ √ √ √ Audit (self audit, external) √ √ √ √ √ √ Implementation level Buying land √ (√) (√) (√) (√) √ √ √ √ Training (extension personnel and farmers)
√ √ √ √ √ √ √
Identification & use of social links
√ √ (√) √ √ √ √ √
Process level (Performance enhancers)
Participatory approaches (mediation; communication among stakeholders
√ √ (√) √ √
Identification of goals & vested interests
√ √ √ √ √ √ √ √ √ √ √
Improve access to information √ √ √ √ √ √ √ √ Improving the role of science in conflict resolution
√ √ √ √ √ √

The first step that needs to be taken in the development of conflict resolution strategies is the identification of relevant stakeholders and their active involvement in the process. Whereas the identification and active participation of relevant stakeholder group is a prerequisite for the resolution of all types of conflicts identified in the previous chapter, resolution of the different generic types of conflicts require different combinations of conflict resolution strategies. Not all strategies are suitable for the resolution of all conflicts and conflicts cannot always be resolved with the use of a single conflict resolution strategy. Thus, best practice must integrate several conflict resolution strategies in such a way as to maximise the contribution of each resolution strategy. No matter what type of conflict, resolution can be achieved only if all stakeholders are involved in a fair and active participatory approach. The importance of considering the local, national, and European scale simultaneously in the search for conflict resolution strategies and in the implementation of current best practices needs to be emphasised. Agriculture is a human activity where local solutions may be more trusted than ‘top
Table 6.3. Conflicts with non-agricultural policies and resolution strategies for biodiversity conservation in agricultural landscapes. T: Transportation policies; S: Spatial planning policies; F: Forestry policies; C: Conservation policies; R: Recreational activities, including tourism. Resolution strategy Types of conflict
T: S
oil d
egra
datio
n
T: F
ragm
enta
tion
T:In
vasi
ons
of a
lien
spec
ies
T: D
istu
rban
ce d
ue to
ac
cess
to la
nd
T: N
-dep
ositi
on
S: U
rban
isat
ion
S. F
ragm
enta
tion
F: A
ffor
esta
tion
F: B
arrie
r for
tr
ansh
uman
ce
C: N
atur
a 20
00
C: I
napp
ropr
iate
go
als/
man
agem
ent
R: D
istu
rban
ce
Buying land √ √ Financial incentives, taxation √ √ √ √ √ √ √ Production of tradable environmental goods/services
√ √ √
Formal contracting √ √ √ Participatory approaches (mitigation; communication among stakeholders)
√ √ √ √ √ √ √
Marketing (healthy products; educate consumers)
√ √ √
Training of extension personnel
√ √ √ √ √ √ √
Environmental education √ √ √ √ Political & administrative framework
√ √ √ √ √ √ √
Identification of goals & vested interests
√ √ √ √ √ √
Identification & use of social links
√ √ √ √ √
Legal regulations √ √ √ √ √ √ √ √ √ Optimising spatial planning √ √ √ √ √ Improved technologies (√) √ √
down’ approaches, but the resolution of a conflict with biodiversity conservation in one particular region can cause the export of conflicts into other European and Non-European regions. The former is illustrated by the increasing use in the UK of the whole farm planning approach, with its combination of advice, information, and agricultural best practice. Although still subject to European level agricultural and environmental policies, farmers feel this approach better meets their needs. The highly intensified agricultural region of Kempen, The Netherlands, provides an illustrative example of the latter. Due to tight restrictions for expansion of agr iculture imposed in The Netherlands, farmers tend to move to Eastern European countries to buy land, re-organise, and intensify agriculture resulting in political, social, and environmental conflicts in Eastern European countries. Ecological research offers much to environmental managers, but current interactions between ecologists and managers are not as effective as they might be. Ecological and socio-economic research needs to be integrated to determine how the results of previously available research were used in reaching successful and failed decisions. By understanding the opportunities provided by and the limitations of different types of research, it may become easier for ecologists to provide more useful science to environmental managers. The most effective way to reconcile conflicts arising from other policies is an integration of the ecosystem approach to these policies. Unfortunately, this is very difficult to achieve. For example, transportation causes major environmental problems throughout Europe and threatens biodiversity by fragmenting habitats and by contributing to the eutrophication of terrestrial habitats. A reduction of traffic would greatly benefit biodiversity conservation and the environment in general. However, achieving this goal requires a complete review of transportation and market policies within Europe. For example, instead of protecting the transportation of food complying with European norms throughout Europe by using taxation money to subsidise traffic infrastructure, policies should encourage and promote local and regional marketing. This would also contribute to the maintenance of local passive dispersal routes of organisms, which is vital for the evolution and maintenance of regional biodiversity, and help in reducing global invasions by alien species. Provision of incentives, education, awareness raising, and a sympathetic administration with a minimum of bureaucracy and showing high sensitivity to stakeholders’ fears can be a major component in the resolution of both realised and perceived conflicts. Perceived conflicts may intensify existing conflicts or even create new conflicts. Social scientists have begun to tackle such problems and develop methods to bring stakeholders together and analyse conflicts within a rational framework through, for example, the method of multi-criteria mapping (Stir ling, 1997). Such methods can also be suitable to identify unintended side effects of reconciliation strategies like Natura 2000. These effects are still misunderstood and their identification could help understand the real structure of a conflict. 6.4. Indicators and monitoring 6.4.1 Indicator based assessments Table 6.4 illustrates OECD’s indicator framework consisting of four main themes on socio-economy and policy, farm management, use of input and resources and environmental impacts. The field of ”landscape” constitutes one out of seven environmental impact areas for which indicators have been identified. By discerning other agri-environmental impact areas such as biodiversity, habitats, soil and water as separate indicator fields and due to the limitation on agricultural landscapes and on agricultural impacts, the required OECD landscape indicators should reflect landscape characteristics that are both original in terms of the identified policy issues and complimentary regarding to other indicator fields.

Table 6.4. OECD Agri-environmental indicators (OECD, 1999) Agriculture in the Broader Economic, Social, Environmental and Policy Context
Farm Management and the Environment
The Use of Farm Inputs and Natural Resources
Environmental Impacts of Agriculture
Contextual Information and Indicators Farm Financial Resources
Farm management
Nutrient Use Pesticide Use and Risks Water Use
Soil Quality Water Quality Land Conservation Greenhouse Gases Biodiversity Wildlife Habitats Landscape
The indicator fields that have been proposed to assess agricultural landscapes in the context of OECD are:
1. The main components that are commonly associated with agricultural landscape structure (appearance);
2. The extent to which public/private management schemes have been introduced to maintain and restore these landscapes; and,
3. The value society places on landscapes and the costs for farmers of maintaining or enhancing them.
Table 6.5 demonstrates that the suggested approach is not restricted to ”Environmental Impact from Agriculture” – as suggested by the title – but are also assessing the role of legal and financial schemes in response to agricultural impacts on landscapes (response indicators). Only the indicators on landscape structure provide information that allow observing the impact of agriculture on these structures (state and impact indicators).
Table 6.5. OECD indicators for agricultural landscapes (OECD, 2001) 1. Landscape Structure 2. Landscape
Management 3. Landscape Value

1.1 Environmental features and land use patterns
1. Environmental features, encompassing mainly landscape habitats and ecosystems;
2. Land use patterns, including changes in agricultural land use patterns and distributions.
1.2 Man-made objects Key indicative man-made objects (cultural features) on agricultural land resulting from human activity.
2.1 The share of agricultural
land under public and private
schemes committed to landscape maintenance and enhancement.
3.1 The cost of
maintaining or enhancing landscape provision by agriculture.
3.2 The public valuation of agricultural landscapes .
The four main agri-environmental themes are not exclusive in terms of their objectives but that a certain amount of redundancy between the themes cannot only be tolerated but also is desired. The second landscape indicator field on management schemes, for instance, could be considered as being closely related to the second main theme on ”Farm Management and the Environment”. A closer look at those indicators (see Table 6.5) that have been proposed for ”Farm Management and the Environment” show indeed that they include soil and land management aspects – two topics that are also playing a distinctive role from the landscape perspective. Equally, the aspect of ‘costs of maintaining landscapes’ could also be associated with the economic context of agriculture. However, the selection of landscape-specific indicators for both landscape management and landscape structure are likely to resolve these apparent redundancies. An overview on existing national approaches in OECD countries offers the opportunity to examine the question, to which degree the different landscape indicator fields can actually be populated with national data and which methodological refinements have been developed to implement OECD landscape indicators. 6.4.2 Landscape monitoring strategies Monitoring in farmland areas is essential to see how and if conservation measures have been effective in achieving a certain agreed target. Within reconciliation action plans, three different types of monitoring strategies need to be developed to address the three components of biodiversity conservation: the intensity of the conflict among different groups of stakeholders, responses (the social and economic effects), and status (effects on biodiversity). The necessity of three types of monitoring arises from the fact that the conflict (which also requires monitoring) is often solved through a compromise between farming and biodiversity protection. To ensure the success of the reconciliation strategy the intended outcome for the farmer as well as the outcome for biodiversity has to be observed. The three levels of monitoring are as follows: Monitoring type I: Level of conflicts This level of monitoring addresses the intensity of conflicts among the different groups of stakeholders and how the conflict is affected by the chosen reconciliation strategy. Depending on the reconciliation strategy indicators may be considered based on the following:

• Customer satisfaction questionnaires, • Opinion polls through telephone and questionnaires, • Farmers participation in respective programmes, • Level of active participation of stakeholders and diversity of the participating stakeholders, • Attention of the conflict in dialogues among stakeholders, in the mass media, and the political
arena. Monitoring type II: Socio-economic effects This type of monitoring is necessary to evaluate whether the intended outcome of the reconciliation strategy for the farmers has been achieved. The choice of indicators for monitoring will be determined by the reconciliation strategy chosen. Possible indicators include:
• Level of farm income, • Sales of certain products, • Change in the distribution of farmers’ income, • Employment in the farming sector, • Number of leisure visitors. • Most of the data for these indicators may be obtained easily through (or minor adaptations) of
existing statistics. Monitoring type III: Environmental effects Monitoring biodiversity in agricultural landscapes and in other ecosystems through the abundance of indicator species is routine. However, the choice of appropriate indicator species in agricultural landscapes is more problematic and strongly depends on management targets. Typically, management actions and indicator species are chosen on the basis of public awareness rather than biological function. In many cases plants, soil based invertebrates, fungi, and microbes allow for a much faster indication of change than larger long-lived organisms with buffering capacities. Good indicators are abundant species typical to the habitat. In most cases, the monitoring of “red list” species is particularly unhelpful as these, by definition rare species, are prone to stochastic sampling errors during monitoring resulting from not finding existing individuals. As a consequence, changes in monitored population density and abundance may be more (or entirely) due to stochastic sampling processes rather than a reflection of landscape quality. Any indicating system must be independent of accidental correlations and stochastic processes and monitoring schemes should be developed within an experimental framework (Caughley & Gunn, 1996). Even then it will be extremely difficult and sometimes impossible to extract causal relationships between species abundance and other biotic and abiotic parameters in complex systems. Biological monitoring tools (indicator species) must therefore be tested for their feasibility to actually monitor the progress in reaching the biodiversity conservation target. This becomes less feasible for some individual species at larger scales, because of interactions with other aspects of their environment, such as climate. At national scales however, monitoring of plant communities and breeding birds have proved particularly valuable in helping to assess impacts of agricultural change for biodiversity (Chamberlain et al., 2000; Haines-Young, 2000). Monitoring is also possible at the landscape level by considering the landscape elements that are envisaged in the conservation targets. For example, the Countryside Stewardship Scheme in UK uses this approach in setting targets for key landscape elements, but has no requirement for a whole farm analysis. Compared with whole farm analysis and the monitoring of individual species this can be done with little cost and effort. This alone can however not substitute for estimating biodiversity with biological indicators to control the management effects for biodiversity conservation. While it is often possible for stakeholders to agree on characteristics of agricultural landscapes, and to define measurable indicators, it is impossible without conflicts or trade-offs to maximise all of the desirable characteristics of a given landscape. Since each form of agricultural practice or conservation strategy will favour some and disadvantage other organisms (Kaule, 1991) target systems need to be

developed in a hierarchical framework, from the European to the national, regional and local level (Reck et al., 1996; Walter et al., 1998). In agricultural landscapes, apparently small changes in the landscape can have big repercussions on species or people. For example, conversion of a wooded area to agriculture may drive bird species to local extinction through scarcity of food and nesting sites; the long-term addition of nutrients to the soil may result in certain plants species being out-competed and eliminated by more generalist species; a gradual loss of soil quality may cause economic loss. Thresholds are therefore needed for the maintenance of biodiversity and for achieving environmental goals in agricultural production systems. However, threshold points are difficult to identify since they differ among species/communities/habitats, agricultural production systems, agricultural landscapes, and regions. In principle, it is possible to establish thresholds beyond which long-term or irreversible harm will result, to people, species, and the environment. These thresholds give the boundaries for the sustainable management of the agricultural landscape. Yet they are not totally objective, as they depend upon the goals set for each particular landscape. For example, in intensive production landscape’s biodiversity goals will strongly differ from biodiversity goals for large tracks of extensively used agricultural land (Kaule, 1991; Walter et al., 1999). Furthermore, thresholds are very scale -dependent and what may be a sustainable solution for a farm, may be unsustainable at the level of the catchment, region, country or area. Regardless of the specific agricultural system, the region, and the geographic scale, the following types of thresholds need to be considered in conflicts: - Structural thresholds (landscape features, landscape heterogeneity, area requirements, connectivity); - Temporal thresholds (timing of agricultural practices); - Compositional thresholds in terms of communities and species that require different habitat types; - Functional thresholds in terms of ecosystem services. Although thresholds have been suggested for many specific agricultural systems, no generic framework seems to exist as yet. Indeed, the science of determining these thresholds may seem too imprecise to even allow such frameworks to be established. And yet even without high quality data about thresholds, the ideas and concepts of goals, indicators and thresholds can still be of great value in understanding and resolving biodiversity conflicts in agricultural landscapes. 6.5. Discussion and Conclusions A major challenge for implementing the ecosystem approach in agricultural landscapes across Europe is the assessment of the important variation among EU states and the development of tools that support European regions taking responsibility for biodiversity conservation by providing social, economic, and culturally fair development opportunities. The different spatial scales and levels of conflicts and their resolution also need to be stressed (Table 6.2). In terms of conflict resolution, choices must be made and acceptable trade-offs must be achieved. Trade-offs could mean a negative conflict resolution at one scale in order to achieve a positive resolution at other levels, even according to a given criterion (Wolf & Allen, 1995). Because of the hierarchical nature of the systems we are involved in, changes at one level of organisation (for agricultural activities, farms can be considered as a lower level and the community, an upper level) will affect the other levels (Van Mansvelt & Mulder, 1993). In the societal deployment of resources (energy resources, water resources, biological resources), a positive outcome of conflict resolution at one scale can be negative at another scale. Often, policy for collective good creates local dissatisfaction. In order to manage the complexity of sustainable agriculture, one approach would be to make the tradeoffs explicit at each decision level. As yet, no attempts exist to develop a consistent value and target system or conflict evaluation and reconciliation scheme across such scales within Europe although there are systems on the sub-national scale (Reck et al., 1996). Such systems should hold across different agricultural landscapes, regions, and habitats and will probably need a hierarchy of the value system. Furthermore, conflicts also have temporal dimensions that influence conflict resolution. This in turn will affect the view of stakeholders towards different conflict resolution strategies, usually in favour of quicker, local solutions, whatever the influence of the higher levels in

the process. Therefore, conflict resolution strategies need to take into account the different levels of conflicts and their resolution, the local, national, and European scale, and to seek solutions that will integrate a number of strategies, ideally from different levels. 6.6. Case studies 6.6.1. The Lizard candidate Special Area of Conservation, Cornwall, UK Background information concerning The Lizard cSAC Situated at the southernmost tip of the UK mainland, The Lizard is a coastal plateau of ultra-basic igneous rocks overlain in places with acidic loess. Due to the poor drainage and rocky nature of the ground, conditions for agriculture are poor and so relatively extensive areas of heathland and coastal grassland have survived agricultural improvement. Virtually all areas of these habitats are now protected by national and European conservation designations. Furthermore, in recognition of their importance, much land is also within The Lizard National Nature Reserve that is directly managed by English Nature, the Government’s nature conservation agency. The Lizard cSAC, with a total area of 3,088 hectares, has the following features of European interest:
• Mediterranean temporary ponds • Dry Atlantic coastal heaths with Erica vagans • European dry heaths • Hard oligo-mesotrophic waters with benthic vegetation of Chara spp. • Northern Atlantic wet heaths with Erica tetralix • Vegetated sea cliffs of the Atlantic and Baltic coasts
The designated areas are generally managed in conjunction with adjacent farmland, which itself consists of mainly agriculturally improved grassland with some arable land. The majority of these family owned farms are dairy and/or beef enterprises. Other major land uses involving heathland areas include a National Nature Reserve, a large Ministry of Defence airfield, and British Telecom’s Goonhilly Earth Station for international communications. Identification of conflicts caused by agricultural policies and practices concerning the Lizard cSAC 1. Intensification of agriculture. The area of heathland has itself fluctuated over the centuries depending on the varying efforts of farmers to plough up but then to later abandon their cultivations. Such temporary reductions in the extent of The Lizard’s heathlands have been documented during and since the Napoleonic Wars. There was a particularly marked decrease between 1962 and 1980 when heathland was once again ploughed up to create improved pastures for intensive grazing systems that were encouraged by the Common Agricultural Policy (CAP). Apart from these historical direct losses of heathland habitat and the usual consequences for their wildlife of habitat fragmentation, the intensification of agricultural practices of the newly created and existing adjacent farmland has not itself had a significant direct impact on the biodiversity value of the remaining semi-natural vegetation. Traditional regimes of temporary cultivation followed by abandonment and then extensive grazing with controlled winter burning have combined to maintain the Lizard heathlands free of trees and shrubs that, in many other parts of the country, are the major concern of heathland conservation managers. Indeed, the negative impact of changing land use practices has rather been of an indirect and subtle nature more closely associated with the issue of abandonment of traditional agricultural use, as described below. 2. Abandonment of agriculture and traditional uses. The heathlands were traditionally an essential part of the natural resources available to the local rural economy. In addition to grazing, they were extensively used for peat, turf, and gorse (Ulex europaeus) cutting for fuel until road and rail infrastructure was sufficiently developed to provide for the import of coal and other more convenient forms of domestic fuel. The subsequent abandonment has resulted in many areas becoming overgrown with tall stands of gorse in places, particularly where the number of grazing animals has also been

reduced. In recent decades, the CAP has encouraged the intensive production of meat and milk on agriculturally improved pastures and this has had both a direct impact on the heathlands through farmers abandoning their heathlands for grazing due to their relatively low productivity in addition to the following indirect consequences: A loss of traditional breeds of cattle from the farms, which were better able to forage on the heathland vegetation, in favour of modern breeds adapted to high productivity farming systems and which the farmers are now reluctant to allow onto the heathlands in case they lose condition. The heathlands becoming neglected and overgrown which itself has had two consequences. One is that there is a reduction in the more species rich, open heathland vegetation and a second is that these areas then become more prone to uncontrolled, intense spring and summer fires. If these fires are allowed to spread too far, they can damage the soil structure, destroy sensitive lichens and local populations of breeding ground nesting birds, invertebrates, and reptiles. Should a landowner wish to bring abandoned heathland back into a grazing regime, costs can be significantly increased. This is because it usually has to be preceded by a programme of improving infrastructure such as the provision of fencing, gates, stock handling facilities, and the provision of a water supply, most probably in combination with a scrub control programme for several years. The loss of traditional practices can, over time, have a fundamental impact on the way a local community perceives the value of heathlands, which, to some people at least, become viewed as ‘waste land’ of little obvious value. This change in culture can be difficult to overcome but does have to be tackled in order for heathlands to be effectively re-integrated into the socio-economic fabric of the local community. 3. Changes in scale and organisation of agriculture. The increasing confinement of farming activ ities to larger individual farm holdings, for reasons of improving animal welfare and with the modern transport of animals to the market place by road, these factors have contributed to the reduced usage of a network of ancient trackways which criss-cross the heathlands. These trackways, and associated ‘pinch-points’ where cattle funnel through gateways, are the main features where The Lizard’s cSAC’s Mediterranean Temporary Ponds are found. Their unique assemblages of specially adapted plants and animals require the continuation of stock movements to ensure they are suitably poached and rutted during periods of seasonal flooding. In recent times, some farm businesses on The Lizard have been scaled down and re-organised. This may occur for a number of reasons depending on the personal circumstances of the farmer. For example, one farmer has recently decided to farm only part time and so has had to reduce the size of his herd. He now specialises in a smaller number of suckler cows than before, with the calves being sold off early as stores (young beef animals). Now the stores are no longer raised on the farm which leaves the holding with few, if any, suitable stock that would, for a period of their lives at least, normally be turned out onto the nearby heathlands. Conflict resolution strategies employed on The Lizard cSAC 1. Buying land. The biodiversity value of The Lizard’s unique vegetation has long been recognised by English Nature (EN), the Government’s nature conservation agency. Since 1974, when the first 15 hectare area of land was purchased by EN to be declared as The Lizard National Nature Reserve, the land under EN’s management has since grown to 1900 hectares and there remains an active acquisition policy. Other nature conservation bodies are also purchasing land within the Lizard cSAC, with the National Trust favouring the highly scenic coastal sections as they can more easily draw on funds raised through subscriptions and appeals. In addition, the Cornwall Wildlife Trust has recently bought a large farm, that includes several hectares of The Lizard cSAC, assisted by the provision of substantial grant aid from the National Lottery Fund. The purchase and management of land on The Lizard cSAC by conservation bodies has been an extremely effective means of securing the direct and appropriate management of the land for the primary purpose of nature conservation and its study. Informal access by the visiting public is catered for and routes through sensitive areas can be carefully controlled. Furthermore, a co-operative and synergistic approach between the conservation organisations has enabled the substantial area now under their combined ownership to be managed in a more cost-effective way through the sharing of knowledge, experience and resources such as labour and machinery.

2. Financial incentives. A number of options are now available for landowners to assist them with the costs of managing their farmland for its historic, landscape, and nature conservation interest within The Lizard cSAC. These include the following: The nationally available Countryside Stewardship Scheme (CSS) which, in Cornwall, is actually targeted to coastal and heathland habitats and so directly benefits the main features of The Lizard cSAC. CSS provides landowners, on a whole farm basis, both with area based annual payments and contributions towards the costs of specific items such as fencing, gates, and water supply. EN also provides landowners with similar payments through its own Management Agreements. These are targeted specifically at land within the cSAC and can be very flexible enabling the piloting of new approaches to encouraging items such as the reintroduction of traditional farm breeds together with links to organic farming and local marketing. 3. Communication among stakeholders. English Nature staff liaise closely with the conservation partners on The Lizard and also with representatives of other statutory agencies and the local authorities, community organisations, the general public and the many private owners of land within The Lizard cSAC. These stakeholders have been notified of this proposed designation and, previously, of the national designation of the same land as Sites of Special Scientific Interest under the UK’s domestic legislation. Without this local and personalised communication there would be little chance of developing a constructive partnership approach to the long-term conservation of The Lizard cSAC. Such communication takes various forms including: Formal written consultations backed up by detailed and specifically tailored advice to explain the implications of the legislation and, where appropriate, provision of financial support to aid the management of the special wildlife features of the designated land. The holding of demonstration days on The Lizard NNR for farmers, advisers of agro-environment schemes, and other practitioners to discuss and explain the various techniques of land management for nature conservation. The provision of information leaflets, press releases, and popular publications on the flora, fauna, and geological interest of the area for people who live in and visit the area. 4. Legal regulations. The UK has had a long history of implementing legislation for nature conservation, starting with the passing of the Access to the Countryside and National Parks Act in 1949 and more recently with amendments to the 1981 Wildlife and Countryside. The main thrust of this legislation has been the notification, protection, and management of a national series of Sites of Special Scientific Interest. Therefore, the many landowners involved (approximately 25,000) have long been used to the issue of statutory designations and so the relatively recent proposals of the Habitats Directive for a network of Natura 2000 simply comes on top of an already well established system of both regulation and financial incentives. 5. Identification of vested interests. The Lizard cSAC occupies a large proportion of the landscape of what is a very popular place for tourists to visit and stay in. The local economy, with the falling fortunes of agriculture, has become increasingly dependent on the tourism industry. The heathlands and coasta l areas of the cSAC are intimately linked with the visitors enjoyment and understanding of The Lizard’s wildlife, scenery, and historic culture and local initiatives to help improve the socio-economic well being of the area depend heavily on its high quality environment. 6. Involvement of scientists. The Lizard has long been known and studied by scientists and the large amount of information available today is a direct result of their efforts. The Lizard cSAC is still actively studied by scientists who contribute their records to environmental bodies and the local records centre. EN is a science-based organisation and recognises that they have a central role to play in nature conservation and so the involvement of scientists to help us better understand wildlife and its management is actively encouraged by EN. An example of this collaborative approach is through a current partnership contract between EN and the University of Plymouth through which a PhD student is funded to study the little known ecology and management requirements of the unique Mediterranean temporary ponds on The Lizard cSAC.

6.6.2. Agriculture-Biodiversity related conflict in a Natural Regional Park (PNR): A case study in the Marais Poitevin. Introduction to Natural Regional Parks in France France contains many different rural landscapes unique in terms of their natural and cultural heritage. Over 430 “small agricultural areas” have been selected so far for biodiversity conservation although many are threatened by desertification, urban pressures, tourism and infrastructure. Very early on, it became clear that the protection of these areas was linked to the agricultural dynamics found there. As legislation for the protection of these areas (from 1930 to the latest 1993 “landscape” law) is insufficient, this led local councils in regions, counties and communes to work with the central government in an attempt to link the protection of their heritage with local development through the creation of Natural Regional Parks in 1967. The parks add to the wealth of the country through economic and social development as quality economic areas. The name “Parc Naturel Regional” is actually a label owned by the Ministry of the Environment. This label is therefore subject to specifications and has to adhere to certain development principles. Sustainable development is therefore central to the charter signed by all the municipalities involved in the project. The charter defines the development trends for the next 10 years and involves locally elected representatives as well as the state. An evaluation procedure every 10 years enables the charter to be revised if necessary. As well as being superb landscapes with important biodiversity resources, PNRs are above all rural environments where agricultural practices respectful of the environment and biodiversity are essential. Of the 40 French PNRs, 22 are natural reserves, 19 are voluntary natural reserves and 4 are Biosphere reserves (MAB UNESCO). PNRs aim to make agricultural and forestry practices compatible with the conservation of natural environments by establishing contracts with various managers. In the same way as the Territorial Exploitation Contracts (CTE) aimed to link agricultural projects with benefits to the country, the PNRs aim to favour agro- environmental measures. Natura 2000 is also ambitious in that 13% of all land covered by PNRs were recently selected under the Directive. The Marais Poitevin The Marias Poitevin PNR was created in 1979 and is often referred to as the “second humid zone in France after the Camargue”. It is the second largest Atlantic facing wintering site for marine migrating birds, is a recognised national and international Ramsar site and is a pilot zone under the “National humid zone plan” issued by the French government in 1995. The century old trend of repeatedly draining the area has not showed signs of slowing down since the area gained its new status. In the last 20 years for example, permanent grasslands have gone from 63,770 ha in 1979, to 46,500 ha in 1989, 28,540 ha in 1994 and 29,000 ha in 1997. Concomitantly, agricultural crops (mostly corn), have gone from 70,000 ha in 1979 to 93,000 ha in 1989 and 109,670 ha in 1997. In total, 50% of permanent grasslands have disappeared and the 1970 ratio of 1:1 between permanent grasslands and crops has now shifted to a ratio of 1:3. Also, irrigated areas have increased by 50% during the 1983 to 1993 period due to an irrigation policy supported by the local government and the state. The farmers gain directly from this policy and intensify drainage before sowing in the spring. Procedural dimension of the conflict This gradual habitat degradation is obviously not in line with the objectives of a PNR and also led to a deterioration of relationships between local stakeholders (conservationists, farmers, elected local government members…). All these factors led to the most important consequence and height of the conflict, the loss of the “Parc Naturel Regional” label in 1996. A report tried to make sense of why the situation had occurred and what the solutions might be (Simon, 1998). One of the main reasons for the conflict was the perception by non-specialists of the PNR simply as a landscape feature. This is due to the “Green Venice” part of the PNR, covering

barely a few thousand hectares of permanent grassland but representative of the tourist heart of the area. Agro-environmental measures and intensive drainage in other areas of the PNR do not seem to impact on people’s perceptions as much. The information conveyed by scientists was deemed vague to non-specialists and did not emphasize the interests and function of the humid zone, or possible scenarios if management continued in such an unsustainable way. Although the central government does lay down certain rules for such areas, a process of decentralisation leaves the local communities in charge of implementing the rules. Having said this, the drainage and irrigation policies were pushed by the state, with important financial support. The conservation of the water resources and biodiversity clashes with two important questions in regards to agriculture (the farms) and water management (local union). Substance dimension of the conflict The most important factor in maintaining biodiversity in this area is the agricultural exploitation of permanent grasslands in a wide an area as possible. Indicators like birds and plants all point to the importance of this factor. Buying of land with public funds and public management is not a feasible solution in an area covering thousands if not tens of thousands of hectares. One possible solution was contracts. Local agro-environmental operations (OLAE) affected 1,680 farmers on 23,000 hectares and represented a sum of 26 million Francs. They did manage to slow down the landscape dynamics, but could not be a long-term solution due to the vast scale and the diversity of the agricultural systems involved (especially with the imbalance of “meat” systems with prices going down, disease outbreaks and technical constraints versus “milk” systems where the price is guaranteed despite a few constraints and finally “corn” systems with level prices, subsidies and few constraints). The problem of tenant farming also complicates matters as tenancy rates and taxes are higher in the swamp area for historical reasons (used to be where the wealthiest farms where). The agricultural conclusion for the Marais Poitevin is the most paradoxical: the best systems from a biodiversity point of view (milking cows) are also worst from an economic point of view. There is clearly a conflict with agricultural interest, which looks for profitable solutions that are incompatible with biodiversity conservation. A complete change of direction is needed and is only possible with the appropriate external financial incentives including a reinforcement of CTE initiatives and a change in the CAP. Water management is also a major stake and as such a source of conflict. The only ways to reduce the amount of water used per hectare is to have irrigation quotas and maintain or reduce the total area of irrigated land. The only solution in the given landscape is a strong response from public authorities if the situation is to be reversed. The relationship dimension of the conflict This conflict has involved a number of stakeholders and has become a national example. Relationship conflicts quickly took over from the actual conflict sources, namely water and agriculture. The loss of symbols such as the PNR label and the condemnation of the Court of Justice for breaches against the EU Directive 79/409/CEE in regards to wild bird protection heightened tensions and exacerbated relationships. In and attempt to quieten things down a little and give back a symbol to the community, the mixed Union of the Marais Poitevin created the “Inter-regional Natural Park” to recall the old label, but without the guarantees of the latter. Conservationists, seeing that polit ical will was all but absent, decided to create their own study of water, independent of official authority. The “Organization for the Protection of the Marais Poitevin” now have their own website (http://www.marais-poitevin.org) and is a source of alternative data and analyses. After the paroxysm of 1995 and 1996, the “symbol” -seeking phase has died down and stakeholders seem ready to engage in talks again. Although the major conflicts (water and agriculture) are still just as present, communication and discussion can now start, even though the scale of conflicts will inevitably be an important issue. 6.7. References
Amler, K., Bahl, A., Henle, K., Kaule, G., Poschlod, P., & Settele, J. (1999) Populationsbiologie in der Naturschutzpraxis. Isolation, Flächenbedarf und Biotopansprüche von Pflanzen und Tieren. Ulmer, Stuttgart.
Caughley, G. & Gunn, A. (1996) Conservation Biology in Theory and Practice Blackwell Science, Cambridge.
CBDSecretariat (1998). UNEP/CBD/COP/4/Inf.9. Chamberlain, D.E., Fuller, R.J., Bunce, R.G.H., Duckworth, J.C., & Shrubb, M. (2000) Changes in the
abundance of farmland birds in relation to the timing of agricultural intensification in England and Wales. Journal of Applied Ecology, 37, 771-728.
Firbank, L.G. & Forcella, F. (2000) Genetically modified crops and farmland biodiversity. Science, 289, 1481-1482.
Haines-Young, R.H. (2000) Accounting for Nature: Assessing Habitats in the UK Countryside. DETR, London.
IGBP (1986) Definition and designation of Biosphere observatories for studying global change. In International Geosphere-Biosphere Programme, UNESCO, SCOPE/MAP Workshop.
Kaule, G. (1991) Arten- und Biotopschutz., 2nd edn. Ulmer, Stuttgart. Krebs, J.R., Wilson, J.D., Bradbury, R.B., & Siriwardena, G.M. (1999) The second Silent Spring?
Nature, 400, 611-612. Luedecke, M. & Reusswig, F. (1999) Das Dust-Bowl-Syndrom in Deutschland UFZ, Leipzig. Meeus, J.H.A. & Wijermans, M.P. (1990) Agricultural landscapes in Europe and their transformation.
Landscape and Urban Planning, 18, 289-352. Mücher, S., Klijn, J., Jongman, R., & Wascher, D.M. (2002). SEO- Project European Landscape
Character Mapping (in press). Alterra, Wageningen. OECD (1999) Environmental indicators for agriculture. Volume 2: Issues and design. In The York
Workshop, pp. 216, Paris. OECD (2001). Environmental Indicators for Agriculture. Volume 3: Methods and Results -.
Agriculture and Food Series., Paris. Poschlod, P. & Bonn, S. (1998) Changing dispersal processes in the central European landscape since
the last ice age: an explanation for the actual decrease of plant species richness in different habitats. Acta Bot. Neerl., 47, 27-44.
Reck, H., Walter, R., Osinski, E., Heinl, T., & Kaule, G. (1996) Räumlich differenzierte Schutzprioritäten für den Arten- und Biotopschutz in Baden-Württemberg (Zielartenkonzept). Gutachten im Auftrag des Landes Baden-Württemberg Institut für Landschaftsplanung und Ökologie, Stuttgart.
Saunders, D.A. & Hobbs, R.J. (1991) Nature Conservation 2: The Role of Corridors Surrey Beatty and Sons, Chipping Norton.
Simberloff, D. & Cox, J. (1987) Consequences and cost of conservation corridors. Conservation Biology, 1, 63-71.
Simon, G. (1998). Le Marais Poitevin: Rapport au Ministre de l'Amenagement du Territoire et de l'Environnement. Conseil Regional des Ponts et Chaussees.
Steiner, F. (1991) The Living Landscape: An ecological approach to landscape planning. McGraw Hill, New York.
Stirling, A. (1997). Multicriteria Mapping: mitigating the problems of environmental valuation? In Valuing Nature: Economics, Ethics, and Environment (ed J. Foster). Routledge, London.
Stoate, C. & Boatman, N.D. (2001) Ecological impacts of arable intensification in Europe. Journal of Environmental Management, 63, 337-365.
Sukopp, H., Trautman, W., & Korneck, D. (1978) Auswertung der Roten Liste der gefährdeten Farn- und Blütenpflanzen in der Bundesrepublik Deutschland für den Arten- und Biotopschutz. Schriftenreihe für Vegetationskunde 12.
Tansley, A.G. (1935) The use and abuse of vegetational concepts and terms. Ecology, 16, 284-307. Van Mansvelt, J.D. & Mulder, J.A. (1993) European features for sustainable development: A
contribution to the dialogue. Landscape and Urban Planning, 27, 67-90. Von Humboldt, A. (1908) Ansichten der Natur. Cotta. Walter, R., Reck, H., & Kaule, G. (1999). Auswahl von Arten für Planungen auf der Basis eines
regionalisierten Zielartenkonzeptes. In Populationsbiologie in der Naturschutzpraxis.

Isolation, Flächenbedarf und Biotopansprüche von Pflanzen und Tieren (eds K. Amler, A. Bahl, K. Henle, G. Kaule, P. Poschlod & J. Settele). Ulmer, Stuttgart.
Walter, R., Reck, H., Kaule, G., Lämmle, M., Osinski, E., & Heinl, T. (1998) Regionalisierte Qualitätsziele, Standards und Indikatoren für die Belange des Arten- und Biotopschutzes in Baden-Württemberg. Natur und Landschaft, 73, 9-25.
Wascher, D.M. (2000). Agri-environmental indicators for sustainable agriculture. Report from the EU Concerted Action Project FAIR5-PL97-3448. European Centre for Nature Conservation, Tilburg.
Wascher, D.M. (2002) Landscape Indicator Assessment: Steps towards a European Approach. In Frontis workshop, June 2002. Alterra Wageningen (in press).
Watkinson, A.R., Freckleton, R.P., Robinson, R.A., & Sutherland, W.J. (2000) Predictions of biodiversity response to genetically modified herbicide-tolerant crops. Science, 1Sept 2000, 1554-1557.
WBGU (1995) World in Transition: The Threat to Soils Economica Verlag, Bonn. Wolf, S.A. & Allen, T.F.H. (1995) Recasting alternative agriculture as a management model: The
value of adept scaling. Ecological Economics, 12, 5-12. Zonnenveld, I.S. (2000). Count your blessings? 25 years of landscape ecology. In From landscape
ecology to Landscape Science. Proceedings of the European Congress "Landscape Ecology: Things to do- Proactive thoughts for the 21st century" organised in 1997 by the Dutch Association for Landscape Ecology (WLO) on the occasion of its 25th anniversary. (eds J. Klijn & W. Vos), pp. 163. WLO, Wageningen.