India Scaling Up Agricultural Technologies For Smallholder ...
Upload
khangminh22Category
view
0download
0
Please do not remove this page
Coffee Markets, Smallholder Credit, andLandscape Change in the Bolaven PlateauRegion, LaosToro, Matthewhttps://scholarship.miami.edu/discovery/delivery/01UOML_INST:ResearchRepository/12355295160002976?l#13355508800002976
Toro. (2012). Coffee Markets, Smallholder Credit, and Landscape Change in the Bolaven Plateau Region,Laos [University of Miami].https://scholarship.miami.edu/discovery/fulldisplay/alma991031447480702976/01UOML_INST:ResearchRepository
Downloaded On 2022/08/26 05:10:19 -0400Free to read
Please do not remove this page

UNIVERSITY OF MIAMI
COFFEE MARKETS, SMALLHOLDER CREDIT, AND LANDSCAPE CHANGE IN THE BOLAVEN PLATEAU REGION, LAOS
By
Matthew Toro
A THESIS
Submitted to the Faculty of the University of Miami
in partial fulfillment of the requirements for the degree of Master of Arts
Coral Gables, Florida May 2012

©2012 Matthew Toro
All Rights Reserved

UNIVERSITY OF MIAMI
A thesis submitted in partial fulfillment of the requirements for the degree of
Master of Arts
COFFEE MARKETS, SMALLHOLDER CREDIT, AND LANDSCAPE CHANGE IN THE BOLAVEN PLATEAU REGION, LAOS
Matthew Toro Approved: ________________ _________________ Douglas O. Fuller, Ph.D. Terri A. Scandura, Ph.D. Associate Professor of Geography Dean of the Graduate School ________________ _________________ Juan Miguel Kanai, Ph.D. Gail Hollander, Ph.D. Assistant Professor of Geography Associate Professor of Geography Florida International University

TORO, MATTHEW (M.A., Geography)
Coffee Markets, Smallholder (May 2012) Credit, and Landscape Change in the Bolaven Plateau Region, Laos Abstract of a thesis at the University of Miami. Thesis supervised by Associate Professor Douglas O. Fuller. No. of pages in text. (151)
This thesis analyzes relationships between global coffee prices, international
development schemes, local trading and credit systems, and landscape dynamics in the
Bolaven Plateau region of southern Laos. The region is a complex and rapidly changing
resource space serving principally as the productive, socio-ecological base of the Lao
coffee commodity chain. Fieldwork conducted there in 2009 entailed in-depth interviews
and quasi-survey semi-structured interviews. These latter interviews yielded a database of
503 detailed loan/debt histories for 192 coffee smallholder households between 1987 and
2008. These data reveal a socio-economically exploitative cycle of coffee production,
chronic indebtedness, and poverty at the base of the chain. This cycle is shown to have
evolved as part of the legacy of the rural credit component of an otherwise highly
successful coffee chain development project implemented by the World Bank, and
concurrent with the most recent articulation of the global coffee crisis. This cycle serves
to maintain a particular set of labor-capital relations which impede the advancement of
visions for an alternative, more socio-economically and environmentally equitable Lao
coffee commodity chain. Land change detection with Landsat TM, ETM+, and ASTER
satellite imagery quantifies the pattern and extent of land-use/land-cover change in the
region between 1989 and 2008. These data reveal a sustained conversion of forested to
agricultural lands, among other notable landscape changes. These environmental

transformations correspond primarily to the workings of the Lao coffee chain, as
conditioned by the chain’s socio-economic relations. They also reflect the formation of
other, new commodity chains in the resource space. The development of these chains also
undermines the pursuit of an alternative Lao coffee network. The geographic
configuration of the Bolaven Plateau region therefore constrains the potentialities of the
Lao coffee commodity chain, while, reciprocally, the structure of the chain constrains the
lands and livelihoods of those bound to it.

iii
TABLE OF CONTENTS
LIST OF FIGURES v LIST OF IMAGES vi LIST OF MAPS viii LIST OF TABLES ix ABBREVIATIONS & ACRONYMS x CHAPTER I: INTRODUCTION 1 The Lao Coffee Network 1 The Lao Coffee Resource Space 7 Research Questions 11 Theoretical Framework 12 Methods and Data 22 Organization and Argument 24 CHAPTER II: HISTORICAL RESTRUCTURINGS OF THE LAO COFFEE CHAIN 25 French Colonialism and Crop Introduction 25 Wars, Regime Changes, and Sector Disruption 28 Socialist Experimentation and Agricultural Collectivization 31 Post-Socialist Transition and Market Liberalization 36 CHAPTER III: THE CONTEMPORARY STRUCTURE OF THE LAO COFFE
CHAIN 41 Global Coffee Chain Dynamics 41 The National Coffee Sector of Lao PDR 46 Lao Coffee and the Bolaven Plateau Region 50 Actors in the Lao Coffee Commodity Chain 54 CHAPTER IV: SOCIO-ECONOMIC DYNAMICS OF THE BOLAVEN PLATEAU
REGION 65 Ethnographic Methods and Data 65 Land-Tenure, Land-Use, Labor, Income 71 Coffee, Credit, Debt 73 The Evolution of Smallholder Credit Sources 92 Labor-Capital Relations in the Bolaven Plateau Region 96 CHAPTER V: SOCIO-ECOLOGICAL DYNAMICS OF THE BOLAVEN PLATEAU
REGION 97 Geospatial Methods and Data 97

iv
Regional Land-Use/Land-Cover Change 105 A Shifting Resource Space 111 CHAPTER VI: CONCLUSION 124 REFERENCES & DATA 130 APPENDICES 139 Map A1: Lao People’s Democratic Republic Upland Agriculture
Development Project Plateau des Bolovens Region 139 Map A2: Lao People’s Democratic Republic Upland Agriculture
Development Project 140 Map A3: Choropleth and cartogram of the quantity of coffee
produced in 2008 in each Lao PDR province 141 Map A4: Destinations and value of Lao coffee exports in 2002 142 Map A5: Destinations and value of Lao coffee exports in 2003 143 Map A6: Destinations and value of Lao coffee exports in 2004 144 Map A7: Destinations and value of Lao coffee exports in 2005 145 Map A8: Destinations and value of Lao coffee exports in 2006 146 Map A9: Destinations and value of Lao coffee exports in 2007 147 Map A10: Hydropower site and mines area map 2008 148 Map A11: Bolaven Plateau region screenshot from hydropower
site and mines area 2008 149 Map A12: Laos Project Yuqida Tenement Resource Areas &
Exploration Target 150 Map A13: Existing, under construction and planned/proposed
hydropower projects in the Lower Mekong Basin, September 2008 151

v
LIST OF FIGURES Figure 1: The global coffee commodity chain 16 Figure 2: Conversion of a nodal commodity chain structure to a spatial
commodity chain structure 18 Figure 3: Evolution of a nodal commodity chain structure 18 Figure 4: Evolution of a spatial commodity chain structure 19 Figure 5: Temporal transformation of a socio-ecological configuration 20 Figure 6: Integration of a dynamic spatial commodity chain structure and
a dynamic socio-ecological configuration 21 Figure 7: Reciprocity between a dynamic commodity chain structure and
a dynamic socio-ecological configuration 21 Figure 8: Relationship between the ICO composite indicator price and the
USD/LAK currency exchange rate, 1989-1999 39 Figure 9: Global coffee production by coffee type, 1959-2012 42 Figure 10: Coffee prices before, during, and after the global coffee crisis 45 Figure 11: Poverty rates in the agro-/eco-regions of Laos 53 Figure 12: Proportion of households sampled in each village to total
household sample (n=192) 70 Figure 13: Sampled public smallholder loans (n=125) in relation to the
global coffee price, 1989-2008 77 Figure 14: Average monthly interest rate of sampled public smallholder
loans (n=125) 79 Figure 15: Sampled public loans (n=289) in relation to the global coffee
price, 1989-2008 88 Figure 16: Average monthly interest rate of sampled trader loans (n=289) 89 Figure 17: Sampled family loans (n=89) in relation to the global coffee
price, 1989-2008 90 Figure 18: Average monthly interest rate of sampled family loans (n=89) 91 Figure 19: Quantity and type of all documented smallholder loans (n=503)
in relation to the global coffee price, 1989-2008 93 Figure 20: Labor-capital relations of the Bolaven Plateau region 96 Figure 21: Change in the total area of land-use/land-cover, ~1989-2008 109

vi
LIST OF IMAGES
Image 1: Coffee blooms on the Bolaven Plateau region, Laos 2 Image 2: A Lao villager carries a basket of freshly picked coffee cherries 3 Image 3: Lao villagers organize trays of wet-processed coffee for drying 4 Image 4: A smallholder farmer rakes her ground-drying coffee 6 Image 5: A southwest-facing vista from atop the Bolaven Plateau 8 Image 6: The destruction of Pakxong during the Second Indochina War 32 Image 7: A coffee smallholder highlights the differences between a few of
the coffee species grown in the Bolaven Plateau region 52 Image 8: Lao coffee smallholders chat among bags of coffee stored in their
home 55 Image 9: Ground-dried coffee being hulled (dry-process) 56 Image 10: A typical Lao coffee smallholder family 56 Image 11: A trader’s truck is parked to load coffee beneath a
comparatively affluent household balcony 58 Image 12: An PCADR-PAB-sponsored wet-processing station in a
Bolaven Plateau village (Ban Kapeu) with an active AGPC producers’ group 60
Image 13: Banners indicate PCADR-PAB-sponsorship of a wet-processing station in a Bolaven Plateau village (Ban Phoumako) with an active AGPC producers’ group 61
Image 14: Pakxe office headquarters of the Programme de Capitalisation pour l’Appui à la politique de Développement Rural (PCADR) – Point d’Application des Bolovens (PAB) 63
Image 15: Soukdavanh Bouadaphom records the responses of Lao wife and husband during a typical household interview session 70
Image 16: Soukdavanh Bouadaphom and the author interview a Lao father during a typical outdoor interview session 71
Image 17: A Lao smallholder farmer presents his Agriculture Promotion Bank loan booklet 76
Image 18: An extended Lao family displays an account booklet and several receipts for payments made on APB-issued loans 78
Image 19: Account booklet for Agriculture Promotion Bank public loan 80 Image 20: The Pakxong branch Agriculture Promotion Bank 81 Image 21: An agent of the Agriculture Promotion Bank comes to collect a
loan payment from a smallholder borrower 84 Image 22: Phongsavanh Bank, a private commercial bank in Pakxe 92 Image 23: A Lao youth manages fire for the sake of expanding his
family’s cultivable coffee area 110 Image 24: Smoke towers in the distance from a managed fire as young
coffee plantings grow in a new coffee plantation 110 Image 25: The author surveys a large swath of newly burned forest on the
Bolaven Plateau 111 Image 26: The author surveys a swath of newly burned scrubland / secondary
forest on the Bolaven Plateau 112

vii
Image 27: Sign outside the Dak Lak Rubber Company’s offices in Pakxe 113 Image 28: One-year-old coffee plantings grow in direct sunlight in the Dak
Lak Co. coffee plantation 114 Image 29: A plantation of rubber trees stretches far beyond what the eye
can see 115 Image 30: A south-facing view of the Houay Ho dam reservoir 117

viii
LIST OF MAPS Map 1: Laos and mainland Southeast Asia 9 Map 2: The Bolaven Plateau region: main topographic and
administrative features 10 Map 3: Destinations and value of Lao coffee exports in 2008 48 Map 4: Choropleth and cartogram of the area (ha) under coffee
production in 2008 in each Lao PDR province 51 Map 5: Smallholder coffee fieldwork villages in the Bolaven
Plateau region 68 Map 6: Bolaven Plateau region geospatial study area and
collected GPS waypoints 102 Map 7: Landsat TM-based land-use/land-cover in the Bolaven
Plateau region, ~1989 106 Map 8: Landsat ETM+-based land-use/land-cover in the
Bolaven Plateau region, ~2001 107 Map 9: ASTER-based land-use/land-cover in the Bolaven
Plateau region, ~2008 108 Map 10: SARCO mineral tenements in Laos (April 2008) 119 Map 11: Laos Project SARCO Tenements (December 2008) 120 Map 12: The Bolaven Plateau region resource space: coffee,
mines, and dams 122

ix
LIST OF TABLES
Table 1: Coffee production by the top-10 ranked producing countries + Laos 47
Table 2: Elevation, absolute location, and basic demographics of sampled fieldwork villages 67
Table 3: Households sampled in each village 69 Table 4: Tenure and use of lands by households within Bolaven
Plateau smallholder villages 72 Table 5: Household labor availability and income for Bolaven
Plateau smallholder villages 74 Table 6: Correlations between the quantity of smallholder loans
by loan type and the ICO composite indicator price, 1999-2008 94
Table 7: Correlations between the quantity of smallholder loans by loan type and the ICO composite indicator price, 2000-2008 95
Table 8: Satellite imagery data used in the analysis 98

x
ABBREVIATIONS & ACRONYMS
ADB Asian Development Bank AFD Agence Française de Développement (French Development Agency) AGPC Association des Groupements de Producteurs de Café du Plateau des
Bolovens (Association of Bolaven Plateau Coffee Producer Groups) AOI Area of Interest/Investigation APB Agriculture Promotion Bank ASTER Advanced Spaceborne Thermal Emission and Reflection Radiometer BOT Build, Operate, and Transfer CBL Central Bank of Laos CIRAD Centre de Coopération Internationale en Recherche Agronomique pour le
Développement (Center for International Cooperation in Agronomic Research for Development)
CNCL Conseil National du Café Laos (Lao National Coffee Council) CNMIM China Nonferrous Metals International Mining Company COMECON Council for Mutual Economic Assistance EROS Earth Resources Observation and Science ETM+ Enhanced Thematic Mapper Plus, Landsat FAO Food and Agriculture Organization FAQ fair average quality FIDP Forest Inventory Planning Department GIS Geographic Information System GoL Government of Laos GPS Global Positioning System ha hectare(s) ICO International Coffee Organization IDA International Development Association kg kilogram(s) km kilometer(s) LAK Lao kip (₭) LCA Lao Coffee Association LDB Lao Development Bank LPDAAC Land Processes Distributed Active Archive Center LPRP Lao People’s Revolutionary Party LSC Lao Service Corporation m meter(s) MAF Ministry of Agriculture and Forestry, Lao PDR masl meter(s) above sea level MOF Ministry of Finance, Lao PDR NASA National Aeronautics and Space Administration NBCA National Biodiversity Conservation Area NEM New Economic Mechanism PAB Point d’Application des Bolovens (Bolaven Application Point)

xi
PCADR Programme de Capitalisation pour l’Appui à la politique de Développement Rural (Capitalization Program for the Support of Rural Development Policy)
PDR People’s Democratic Republic, Lao PRCC-II Programme de Renforcement des Capacités Commerciales II (Program for
Trade Capacity Building II) SAFReC Southern Agriculture and Forestry Research Center SARCO Sino-Australian Resources Company SLACO Sino-Lao Aluminium Corporation Limited SLIE Societe Lao Import-Export (Lao Import-Export Company) SPSS Statistical Package for Social Science TM Thematic Mapper, Landsat TNC Transnational Corporation UADP Upland Agriculture Development Project USD United States dollar ($) USDA United States Department of Agriculture USGS United States Geological Survey UTM Universal Transverse Mercator UXO Unexploded Ordnance VLRJSC Viet-Lao Rubber Joint Stock Company VNIR Visible and Near Infrared WGS World Geodetic System µm micrometer(s)/micron(s)

1
CHAPTER I INTRODUCTION
The Lao Coffee Network
A commodity chain is “a network of labor and production processes whose end
result is a finished commodity” (Hopkins & Wallerstein 1986: 159, 1994: 17). The coffee
commodity chain emanating from the Lao People’s Democratic Republic (Lao PDR /
Laos) constitutes an inconspicuous strand of the global coffee chain. Lao coffee accounts
for a mere 0.25-0.30% of the coffee that circulates throughout the world (USDA 2012).
Nevertheless, for the approximately 15,000 smallholder producer households in the
Bolaven Plateau region for whom it is a first-order crop (Galindo & Sallée 2007: 8),
coffee, and the network through which it flows, is key to life.
Coffee Basics
Virtually all coffee that flows through the global coffee chain is either one of two
species: Coffea arabica (‘Arabica’) or Coffea canefora (‘Robusta’) (Daviron & Ponte
2005: 51, ICO 2012a). The coffee plant is a crop that does not bear any fruit until 2-5
years after being planted (Talbot 2004, Daviron & Ponte 2005). Arabica coffee comes
from relatively small and low-yielding trees (large bushes) with dark-green, oval-shaped
leaves (Boungnavong & Chounthavong 2001). They are grown optimally in cool
temperatures (15°-24° C) at 1000-2000 meters above sea level (masl) (ICO 2012a).
Robusta coffee comes from trees that are comparatively larger and higher-
yielding than Arabicas (Boungnavong & Chounthavong 2001, Winston et al. 2005). They
can grow up to 30 meters (m) tall (ICO 2012a), but are “usually topped periodically to
facilitate picking, and to stimulate the growth of side branches and flowering” (Talbot
2004: 33). Robusta trees are grown optimally in warmer temperatures (24°-30° C)

2
unsuitable to Arabica, at 0-800 masl (Daviron & Ponte 2005: 51). Robusta trees are
generally more resistant to pests and coffee leaf rust disease than their Arabica
counterparts (Daviron & Ponte 2005: 51).
Image 1: Coffee blooms on the Bolaven Plateau region, Laos. Source: Photograph by author, March 8, 2009.
Robusta also has twice the amount of caffeine of Arabica (Daviron & Ponte 2005:
53) and is known to produce a stronger, harsher, more bitter – i.e., more ‘robust’ – final
cup. Ultimately, most Robusta coffees are used in roasted coffee blends as a filler to
reduce the price of the blend (Daviron & Ponte 2005: 53). For these, and other, reasons,
Robusta is perceived as being a lower-quality product and is traded at substantially lower
prices than its Arabica counterpart. Most Arabicas enjoy the reputation of being high
quality products and correspondingly fetch greater value in the global coffee chain.

3
Physically, the fruit produced by both Arabica and Robusta trees is virtually
identical.1 Coffee cherries enclose two flat seeds – the coffee bean. The seeds are coated
by a thin mucilaginous coating/skin called ‘parchment’ (Talbot 2004, Daviron & Ponte
2005). Once the parchment is removed, one is left with green coffee beans. Both
parchment coffee (with the skin of the seed left intact) and green coffee can be stored for
several years under proper conditions without decomposing or losing their flavor
potential. Green coffee, however, is much lighter and less voluminous, making it the
preferred and most common form coffee takes as it is circulated through the global coffee
chain (Talbot 2004: 33).
Image 2: A Lao villager carries a basket of freshly picked coffee cherries. Source: Photograph by author, February 6, 2009.
1 According to the International Coffee Organization, Arabica seeds (beans) are more flat in shape while Robusta seeds (beans) are more oval in shape (ICO 2012a).

4
Coffee Processing Basics
In order for coffee cherries to be transformed into green coffee, they must
undergo primary processing. “The main goal of primary processing is the separation of
the bean from the skin and pulp of the cherry” (Daviron & Ponte 2005: 52). There are
two general modes of primary processing: the wet method and the dry method.
The Wet Method of Coffee Primary Processing
In the wet method of coffee primary processing, ripe (red) cherries are harvested
(i.e., picked from coffee bushes/trees) and pulped, typically within 24-hours. Pulping is
done in a machine that crushes the cherry and separates the less dense flesh of the fruit
from the denser seeds. The resultant parchment coffee is then soaked for a period,
Image 3: Lao villagers organize trays of wet-processed coffee for drying. Source: Photograph by author, February 3, 2009.

5
allowing the mucilage to ferment slightly, and eventually washed away (Talbot 2004:
33). This process is usually done in what is referred to as a ‘wet mill’, consisting of a
pulping machine, a fermentation tank, and a washing canal, although it is also often done
in a curing plant (Daviron & Ponte 2005: 52). After washing, wet processed coffee is
dried on clean racks elevated above the ground. This method also requires a careful
handling of coffee cherries and beans during and after harvesting (Galindo & Sallée
2007: 10). Wet method processing produces optimum coffee flavor and is typically
performed for Arabica coffees. Wet processed Arabicas are known in the coffee trade as
‘Mild Arabicas’(Daviron & Ponte 2005: 52).
The Dry Method of Coffee Primary Processing
In the dry method of coffee primary processing, ripe cherries are harvested and set
to dry in the sun. Eventually, the fruit dries to the point that the seed separates from the
outer layers. The dried fruit are then removed with a huller. Dry method processing
produces an inferior flavor (Talbot 2004: 33) and is typically performed for Robusta
coffees. Dry processed Arabicas are known in the coffee trade as ‘Hard Arabicas’ or
‘Natural Arabicas’ (Daviron & Ponte 2005: 52).
The Two Circuits of Lao Coffee Exports
Coffee exported from Laos goes through one of two circuits.2 The dominant, low-
quality circuit – that through which 99% of all Lao coffee flows – is the least lucrative for
the majority of actors occupying the early stages of the chain. This circuit is dominated
by poorly maintained, minimally processed, low-quality coffees, which generally capture
2 This is excluding the nominal circuit for Lao coffee involving domestic consumption, reflecting 0.5% of all Lao-origin coffee flows.

6
Image 4: A smallholder farmer rakes her ground-drying coffee. Drying coffee on the bare ground, or even on tarpaulins, as in the picture, often results in soil intermixing with the coffee, producing an inferior taste. Many, if not most, Lao coffee farmers process coffee via the dry method. Source: Photograph by author, February 22, 2009.
a very small percentage of the total value accrued along the chain. Nevertheless, a small
minority of actors at those early stages have positioned themselves to gain substantial
profits from this circuit. This advantage evolved out of a particular set of socio-economic,
and corresponding socio-ecologic, conditions in the Bolaven Plateau region. In order for
this circuit of the Lao coffee chain to persist, these regional conditions (or some variant
thereof) have to be perpetuated.
There is an alternative circuit for Lao coffee too. The premium circuit (that
through which only 0.5% of all Lao coffee flows) is the most lucrative for the majority of
actors occupying the early stages of the Lao coffee commodity chain. This circuit is
occupied by specialty and niche coffee products, which capture additional value along the

7
coffee chain by marketing better-maintained, more carefully processed, higher-quality
coffees, which fetch much higher prices on global markets. The advancement of this
circuit for Lao coffee requires its own set of socio-economic and socio-ecologic
conditions in the Bolaven Plateau region. In order to advance this alternative, premium
quality coffee chain, actors in the chain must struggle to transform these regional
conditions.
The Lao Coffee Resource Space
The Bolaven Plateau Region
Irrespective of any particular circuit, the resource space on which the Lao coffee
network is based is the Bolaven Plateau region. The region’s lands and people produce
95-99% of the coffee that brings the Lao coffee chain into existence. Referred to in Lao
language as Phou Phieng Bolaven, the plateau is centrally located between the Annamite
Mountain Range, which forms Laos’s border with Vietnam to the east, and the Mekong
River to the west, at about 15°N latitude, 106°E longitude (Map 1). From the generally
flat alluvial plains surrounding the plateau approximately 200-500 masl, the terrain rises
– sometimes gradually, sometimes abruptly – to a relatively flat surface ranging 800-
1450 masl in most areas (Map 2).
The plateau is widely acknowledged to be the most fertile land in all of Laos (WB
1989: 1, VT 2009b), and the most ideal place for coffee production in the country (Tulet
2009). According to some coffee industry experts, a unique combination of
biogeophysical variables (soil quality, temperature, rainfall, topography, solar radiation,
etc.) makes the region the most ideal place for growing coffee in all of peninsular
Southeast Asia (T&CA 2004). The reason for some of these favorable conditions is the

8
region’s geologic origins. Sixteen million years ago, a period of volcanic activity began
in the Southeast Asian peninsula. Intermittent eruptions resulted in the flow of lava
throughout the Khorat Basin (Robichaud et al. 2001: 101, SARCO 2008). Erosion
processes created a landscape characterized by plateaus, escarpments, and intervening
lowland plains. Among the features formed is the Bolaven Plateau, enriched with fertile
basaltic soils resulting from the lava flows (Robichaud et al. 2001: 101).
Image 5: A southwest-facing vista from atop the Bolaven Plateau. Source: Photograph by author, March 21, 2009.
A Rapidly Changing Resource Space
The Bolaven Plateau region now stands at an historical crossroads. While serving
as the productive, socio-ecological base of the increasingly dynamic Lao coffee chain, the

9
Map 1: Laos and mainland Southeast Asia. The Bolaven Plateau region is in southern Laos, primarily in the province of Champasak. The reference frame on this map indicates the spatial extent of the topographic and political map on the following page. Source: Map by author.

10
Map 2: The Bolaven Plateau region: main topographic and administrative features. Source: Map by author.

11
region is for the first time in history being reconfigured to serve other major commodity
chains. A rapid proliferation of land concessions has been and continues to be granted by
the Government of Laos (GoL) to transnational corporations (TNCs) seeking to capitalize
on the region’s myriad agriculture, forestry, hydropower, and mineral commodity chain
potentialities, effectively transforming the nature of the region. The socio-ecological
configurations emerging from these new chain formations are reciprocally transforming
the structure of the chain for which the region has been principally configured, that for
Lao coffee. The way these configurations evolve has profound implications for the
struggle over the future of the Lao coffee chain.
Research Questions
This research is motivated by the following questions.
(1) What are the historical structures of the Lao coffee chain vis-à-vis the
Bolaven Plateau region?
(2) What is the contemporary structure of the Lao coffee chain vis-à-vis
the Bolaven Plateau region.
(3) What are the socio-economic dynamics in the Bolaven Plateau region
associated with the current structure of the Lao coffee chain?
(4) What are the socio-ecologic dynamics in the Bolaven Plateau region
corresponding to the current structure of the Lao coffee chain?
(5) How is the structure of the Lao coffee chain conditioned by the
geographical configuration of the Bolaven Plateau region, while,
reciprocally, the configuration of the region is conditioned by the
structure of the chain?

12
Theoretical Framework
Commodity Chains
The commodity chains approach has its origins in world-systems theory, an
analytical framework inherently critical of states as meaningful units of analysis
(Wallerstein 2007). Indeed, the commodity chains approach “reformulates the basic
conceptual categories needed to analyze new patterns of global organization and change”
(Gereffi et al. 1994: 2). Fundamental to this reformulation is a shift toward analyzing, not
solely the state territorial units from which commodities flow, but the actual networks
through which they flow. The chain metaphor is intended to emphasize the linkages along
networks between “households, enterprises, and states […] within the world economy”
(Gereffi et al. 1994: 2). This proposition distinguishes the chains-/network-based
approach to commodity analysis from the more conventional state-based approach, which
focuses primarily on a given commodity sector of a particular state, or on the inter-state
trade of a particular commodity or grouping of commodities (cf., Grant 2000).
Commodity chains represent the production, circulation, and consumption networks of
the world economy.
Getting to the ‘Bottom’ of Commodity Chains
When Hopkins and Wallerstein first coined the term ‘commodity chains’ in 1977,
they described the concept as follows:
“take an ultimate consumable item and trace back the set of inputs that culminated in this item – the prior transformations, the raw materials, the transportation mechanisms, the labor inputs into each of the material processes, the food inputs into the labor” (Hopkins & Wallerstein 1977: 128).

13
If launched from this comprehensive conceptualization, commodity chain analysis would
involve following commodities through their entire material life-cycles, from the
production of natural resources, through the exchange of commodities, to the
consumption of goods, and possibly beyond. However, while nearly all analyses
employing a commodity chains perspective “nod toward the importance of raw material
inputs at the sources of the chain, there is very little systematic attention to this in most
research” (Smith & Mahutga 2009: 67). In the majority of commodity chain analyses, the
natural resource foundations of commodities – and, by extension, the socio-ecological
foundations of commodity chains – are conspicuously absent.
Recognition of the socio-ecological lacuna in commodity chains research has
prompted efforts to, as insisted by Smith (2005), “start at the beginning” of commodity
chains3. For example, drawing on earlier work (e.g., Bunker 1984), Smith and Mahutga
(2009) emphasize the importance of ‘modes of extraction’ in configuring commodity
chain structures, which in turn produce patterns in the evolving international division of
labor. Bunker (1984: 1019) himself forwarded this notion of ‘modes of extraction’ in
recognition of the fact that “commodities can emerge only from locally based extractive
and productive systems”, regardless of how global the commodity chains4 for those
commodities may be.
Echoing Bunker’s (1984) acknowledgement that all commodities have their
origins in natural resources, and that all natural resources have place-specific contexts,
3 This is despite Hopkins’ and Wallerstein’s original insistence to do the opposite: “We move backward rather than forward because we are interested in seeing the loci of the sources of value in a finished product and not the multiple uses to which raw materials are put” (Hopkins & Wallerstein 1986: 160) 4 Rather than use the term “commodity chains”, Bunker (1984: 1019) used the term “global exchange systems”. However, as Smith and Mahutga (2009: 68) write: “Although Bunker never explicitly used the term commodity chains, he came close at times in referring to ‘global chains of extraction and production’”.

14
Talbot (2009) states that all commodity chains are ‘rooted’5 in processes of material
resource extraction taking place in specific geographic locales. Moreover, because of the
more direct and easily discerned ‘rootedness’ of tropical – especially tropical agriculture
– commodity chains, these chains are more amenable to the incorporation of
environmental factors and impacts into the analysis (2009: 94-97). Importantly, Talbot
also argues that the unique ecological requirements of many tropical commodities
strongly influence the structure of the respective commodity chain itself (Talbot 2004,
2009). “One of the most important characteristics of tropical commodity chains is the
central role of ecology in the determination of their structures” (Talbot 2004: 39). As
Castree (2002) highlights:
[T]he materiality of natural entities in agriculture, forestry and fishing have posed serious historical barriers to capital accumulation, affecting both the technical and institutional organization to major economic sectors.
Despite this ostensibly increased appreciation of the material underpinnings of
commodity chains, though, few socio-ecologically sensitive analyses have actually
emerged in the literature. For example, notwithstanding Smith and Mahutga’s (2009: 70)
exhortations that analysts pay heed to modes of extraction – an approach stressing the
significance of the material, socio-natural interface (see, e.g., Gellert 2005) – their
analysis of multiple aggregated commodity networks offers no insight into any of the
social-ecological circumstances of extraction for the commodities in question.
5 Talbot (2009: 94-97) himself may have adopted the language/notion of ‘rootedness’ from Gereffi’s statement that “Global commodity chains (GCCs) are rooted in production systems that give rise to particular patterns of coordinated trade” (1994: 96, emphasis added).

15
Spatializing Commodity Chains (?)
An article by Leslie and Reimer (1999) titled, Spatializing commodity chains,
would seem to offer the most obvious solution to incorporating socio-ecological
considerations into work on commodity chains: spatialize the chains. At the crux of their
argument are three propositions they claim will aid analysts in conceiving of commodity
chains in “more explicitly spatial terms” (1999: 403): commodity chain narratives are
geographically constructed across scales, the symbolic meanings of commodities at the
consumption ends of chains are important, and factors such as gender and place should be
included in analyses (Leslie & Reimer 1999: 416). While these points are irrefutable,
they fall short of fostering conceptualizations of commodity chains in “more explicitly
spatial terms”, as the authors claim. Still, while the feat (mis-)advertised by the title of
their paper remains unaccomplished, the challenge itself warrants continued pursuit. An
explicitly spatialized reformulation of commodity chain analysis could indeed yield
powerful insights into the geographical workings of commodity chains.
To achieve this pursuit, this thesis integrates commodity chain analysis with
political ecology. The idea of such integration is by no means novel. Turner and Robbins
(2008: 300), for instance, allude to how political ecology would engage with a
commodity chains approach to examine a hypothetical alpine ecosystem under stress.
Furthermore, commodity chain analysis and political ecology share a common
intellectual heritage in Marxian materialism (Robbins 2004, Mann 2009); they both
recognize that geographical change is historically contingent (Topik 2009); they are both
sensitive to processes operating at multiple geographic scales (Neumann 2009); they both
focus on a multiplicity of actors and phenomena in producing geographic change

16
(Rindfuss, Prasartkul, et al. 2003, Zimmerer & Bassett 2003); and they both entail the use
of eclectic methodological techniques.
A Conceptual Model for Nodal Commodity Chain Analysis
Gereffi and Korzeniewicz (1994) suggest that commodity chains can be
represented schematically: “Specific processes or segments within a commodity chain
can be represented as boxes or nodes, linked together in networks” (Gereffi et al. 1994:
2). Talbot (2004: 32) depicts the coffee commodity chain in precisely this manner. In his
model (Figure 1), boxes represent the major types of actors in the chain while
transactions between these types of actors are represented by arrows indicating the linked
network. With Talbot’s schematic, one can trace the linkages between coffee producers at
Figure 1: The global coffee commodity chain. Source: Talbot (2004: 32).
the beginning, or bottom, of the chain all the way to coffee consumers at the end, or top,
of the chain. Between these termini, one can identify the various intermediate actors who

17
facilitate the flow of the coffee through the chain, including traders, exporters, state
agencies, large TNCs and smaller companies, among others. Ponte (2002: 1102) offers an
essentially identical schematic of the global coffee chain.6
A Conceptual Model for Spatial Commodity Chain Analysis
By organizing commodity networks into their respective nodes and links, these
models help analysts trace transactions between actors operating in different nodes. They
therefore provide a valuable heuristic for systematically disentangling the complexity of
commodity chains. However, while these models aid in identifying the relationships
between nodes in a network, they offer no information about the myriad socio-spatial
processes constituting those nodes. In other words, these models offer no clues as to the
social, political, economic, or environmental – in sum, the geographical – mechanisms
through which the actors in each node are linked to actors in other nodes. Transforming
these fundamentally nodal network models into fundamentally spatial network models
can help guide analysis on these mechanisms.
Figure 2a represents a generic (i.e., non-commodity-specific) and highly
abstracted version of a nodal commodity chain. The nodes in this network represent a
single step in the overall sequence of processes that produce a given commodity. Figure
2b represents the same abstracted commodity network as Figure 2a; however, the nodes
have been substituted by planes, intended to signify the material spaces through which
people interface with their environments to facilitate the various processes within the
chain (or the process of the chain itself).
6 Ponte’s (2002: 1102) model includes more arrows to represent the additional possible transactions connecting different actors in the network. Ponte’s model also incorporates text highlighting the physical forms coffee assumes as it moves through the commodity network: dried cherries or parchment coffee, green coffee, and roasted or instant coffee.

18
Figure 2: Conversion of a nodal commodity chain structure to a spatial commodity chain structure. Source: Author.
One must not forget, though, that commodity chains are temporally dynamic, i.e.,
prone to evolve. Figure 3 illustrates how a nodal commodity chain may be restructured
over time, with the links between each node shifting in relation to one another, or with
new nodes forming altogether as new processing stages develop (see, e.g., Talbot 2004:
11). Figure 3a represents the structure of a nodal commodity chain at a hypothetical
point in time (period X); Figure 3b represents the structure of the same chain at a
subsequent time (period Y); Figure 3c at a still later time (period Z).
Figure 3: Evolution of a nodal commodity chain structure. Source: Author.

19
The temporally dynamic commodity network depicted in Figure 3 can be spatialized in
the same way as done from Figure 1 to Figure 2. In Figure 4, the geographically inert
and anonymous nodes have been substituted for planes (spaces) representing the socio-
spatial configurations constituting each stage of the network. Figure 4 represents a fully
spatialized commodity chain whose structure is subject to change over the course of time.
Figure 4a represents period X; Figure 4b period Y; and Figure 4c period Z.
Figure 4: Evolution of a spatial commodity chain structure. Source: Author
While Figure 4 represents the evolution of a spatial commodity chain structure, it
fails to convey the dynamics taking place at each of the individual spaces contributing to
that structure. Surely, just as commodity networks are in constant flux, so too are the
spaces enabling these networks. By momentarily looking away from the network
structure and redirecting our focus on an individual space within that structure, we can
also (in an equally abstract and simplified manner) represent the socio-spatial/socio-
natural/socio-ecological 7 dynamism constituting the plane in question. Figure 5
7 These terms are used synonymously throughout this thesis. This reflects the author’s alignment with Peet’s (1998: 2) rhetorical questioning: “[W]hat is space but surface stretches of natural environment? And what are society-nature relations but (in part) the influence of spatio-natural forces, like gravity and the friction of distance, on human activities, and the return effects of social processes on the (natural) qualities of space?”

20
represents a chronology of three socio-ecological configurations. The spatial pattern of
the plane in Figure 5a evolves into a different pattern in Figure 5b; the pattern of the
plane in Figure 5b evolves yet again into a different pattern in Figure 5c. The patterns
abstracted in this spatial plane at each of the three periods (X, Y, Z) could correspond to
any set of socio-ecological processes characterizing the material nature of the place
represented by the plane.
Figure 5: Temporal transformation of a socio-ecological configuration. Source: Author.
The models thus far posited aim to evoke clearer notions of the spatiality of
networks. They also aim to evoke clearer notions of the materiality of processes
constituting space. Figures 4 and 5 help foster the notions that (spatial) commodity chains
are dynamic over time, and that the individual spaces constituting the chains are equally
dynamic. An integration of these models (Figure 6) helps convey the notion that the
evolution of a commodity chain structure may coincide with the evolution of a material,
socio-ecological configuration, especially if that configuration constitutes the space at the
base of the chain, or the resource space.
Figure 6 therefore highlights the simultaneity of changes in the structure of the
network and changes in the configuration of the space. However, as noted above, changes
in the structure of a network are conditioned by changes in the structure of the spaces
which constitute that network, and vice versa. In other words, while changes in
commodity chains and their constituent resource spaces may be simultaneous, they are

21
not, in fact, coincidental. To the contrary, changes in the structure of a commodity chain
are always partially, if not wholly, conditioned by changes at minimally one, but usually
Figure 6: Integration of a dynamic spatial commodity chain structure and a dynamic socio-ecological configuration. Source: Author.
multiple places along that chain, especially at the chain’s resource space, which functions
as its socio-ecological base. Likewise, changes in the geographical configuration of the
resource space are always at least partially, if not wholly, conditioned by changes in the
structure of the chain. Commodity chains and resource spaces are thus reflexive, mutually
conditioning, dialectical, reciprocal.
Figure 7: Reciprocity between a dynamic commodity chain structure and a dynamic socio-ecological configuration. Source: Author.

22
This reciprocity is modeled in Figure 7. The figure strives to illustrate how
changes in any one of the places embedded within a commodity network reverberate
through the transactions that link the spaces together at multiple scales. It attempts to
better convey the notion that, not only are commodity chains and resource spaces
inherently dynamic, but these dynamics are actually co-constitutive of one another.
Methods & Data
To answer the first and second research questions, regarding the historical and
contemporary structures of the Lao coffee chain, this study relies primarily on a synthesis
of reviews of various academic literatures, reports, and other miscellaneous secondary
sources. Historical data on international coffee prices, production, and exports is provided
by the International Coffee Organization (ICO) and United States Department of
Agriculture (USDA). Lao national coffee export data were collected during a 2009 visit
to the Lao Coffee Association (LCA) in Pakxe, the provincial capital of Champasak
province. Articles from the official English-language newspaper of Lao PDR, the
Vientiane Times, are used to capture the structures of the chain. Additionally, several
photographs are embedded within the text to aid in illustrating the text visually.
To answer the third, fourth, and fifth questions, regarding the socio-economic and
socio-ecological configurations of the Bolaven Plateau region – and their reciprocity –
this study relies primarily on two broad sets of applied methods: ethnography and
geospatial analysis.

23
Ethnography
The ethnographic component8 of the study was conducted in situ during the first
three months of 2009. Semi-structured and in-depth interviews were carried out with
various actors directly or indirectly related to the Lao coffee sector. These actors include
hundreds of smallholder coffee farmers; several seasonally-hired coffee wage-laborers;
coffee traders / collectors / informal loan-brokers; the director and staff of the Southern
Agriculture and Forestry Resource Center (SAFReC); an agronomy and coffee market
specialist directing the efforts of the French Development Agency (AFD) in southern
Laos; the president of the LCA (who happens to also be an entrepreneur and owner of
one of the most well-known coffee-based enterprises in the country); staff at the LCA;
the manager and personnel from the district branches of the national Agriculture
Promotion Bank (APB) and Lao Development Bank (LDB); and multiple provincial-,
district-, and village-level officials.
Geospatial Analysis
The geospatial component9 of this study consists of a land-use/land-cover change
analysis based on the classification and change detection of a three time-point series of
satellite images of the Bolaven Plateau region study area. This series spans an
approximately 20 year period between 1989 and 2008. Imagery was derived from three
satellite instruments: Landsat Thematic Mapper (TM), Enhanced Thematic Mapper Plus
(ETM+), and Advanced Spaceborne Thermal Emission and Reflection Radiometer
(ASTER).
8 A more detailed account of the ethnographic methods employed in this study can be found in Chapter IV. 9 A more detailed account of the geospatial methods employed in this study can be found in Chapter V.

24
The mixed methods data collection and analysis approach employed in this study
is intended to address the multiplicity of factors (Rindfuss, Walsh, et al. 2003)
contributing to the synergies between the Lao coffee commodity chain and the human-
environment relations of the Bolaven Plateau.
Organization and Argument
This chapter has thus far introduced the study. Chapter II explores how the
historical development of the Lao coffee chain has been inextricably intertwined with that
of the Bolaven Plateau region. Chapter III explicates the contemporary structure of, and
struggle for, the Lao coffee chain vis-à-vis the region. Chapter IV delves into the local-
level socio-economic dynamics constituting the base of chain. Chapter V explores some
of the corresponding regional socio-ecological outcomes related to those socio-economic
dynamics. Finally, Chapter VI addresses the final research question by synthesizing the
discoveries made in the preceding chapters into a single, coherent argument: The
geographical configuration of the Bolaven Plateau region constrains the potentialities of
the Lao coffee commodity chain, while, reciprocally, the structure of the chain constrains
the lands and livelihoods of those bound to it.

25
CHAPTER II HISTORICAL RESTRUCTURINGS OF THE LAO COFFEE COMMODITY
CHAIN
This chapter lays out a century-long periodization of the dual development trajectories of
the Lao coffee commodity chain and the socio-ecology of the Bolaven Plateau region. It
explains how the chain evolved in relation to the region. Four major periods are
delineated:
French Colonialism and Crop Introduction: ~1913-1945
Wars, Regime Changes, and Sector Disruption: ~1945-1975
Socialist Experimentation and Agricultural Collectivization: ~1975-
1988
Post-Socialist Transition and Market Liberalization: ~1988-2000
During each of these periods, the Lao coffee commodity chain conformed to the material
potentialities afforded to it by the material configurations of the Bolaven Plateau region.
French Colonial Era and Crop Introduction: ~1913-1945
The coffee plant probably entered Laos in 191310, twenty years after the country’s
formal integration into the French colonial empire. According to some accounts, colonists
selected plants from botanical gardens in Saigon11 to the northern Bolaven Plateau town
of Thateng (Jhai 2008, LMI 2008). Predicting correctly that the plateau’s rich volcanic 10 The most seemingly credible source, the one used here, is Fortunel (2007: 218-219). He cites the mention of coffee in the 1929 work by French colonial Commissioner J.J. Dauplay, Les Terres rouges du plateau des Boloven. In this work, Dauplay expresses pessimism about coffee planting experiments conducted in 1913 and 1916, which, by 1921, had survived, but were only about two feet tall. Multiple other sources make less supported claims on the date coffee was introduced to Laos. Galindo and Sallée (2007: 19) state: “The first coffee plantations in the Bolaven Plateau were set around 1920.” Another (Winston et al. 2005) states: The French first planted coffee in Lao PDR in the early 1900s.” Yet another (Duris et al. 2002: 70) writes: “Coffee [. . .] was introduced into Laos in around 1920.” A few sources offer a specific year: “Coffee was first introduced to the Bolaven Plateau in 1927 by French colonial authorities” (Oxfam 2006); “French colonists planted the first coffee trees in Laos around 1915” (Jhai 2008); “French colonists planted the first coffee trees in Laos around 1915, but the experiment failed. Another attempt was made in 1917” (LMI 2008). 11 Modern day Ho Chi Minh City.

26
soils and cool climate would support coffee production (BBC 2002, Oxfam 2006), the
French first brought the typica and bourbon varietals of Coffea Arabica (Arabica). It is
possible that they brought Coffea canefora (Robusta) and Coffea liberica (Liberica) too.12
Jean Jacques Dauplay, the French colonial Commissioner of Salavan from 1904
to 1921 was pivotal in establishing the colonial-era agricultural activities in the region. In
addition to coffee, he introduced cardamom and cabbage, among others (Fortunel 2007).
Coffee was set in plantations along roads built (Galindo & Sallée 2007: 19) by local
populations through forced labor (corvée) (Stuart-Fox 1997). While Commissioner
Dauplay was critical in the organization of agricultural activities in the Bolaven Plateau,
his time in the region was also occupied by efforts to end the first ever anti-French
insurgency in Laos, the so-called ‘Holy Man’s Revolt’ (Stuart-Fox 1997, Evans 2002),
also known as the ‘Révolte des Boloven’ (Fortunel 2007: 217). The revolt lasted 35 years;
only through its conclusion could the formation of a Lao coffee commodity chain begin
in earnest.
Early Lao Coffee Production
With the suppression of the revolt, the region finally enjoyed the stability needed
for farming (Fortunel 2007: 219). Coffee was the only crop the French were able to
cultivate in a plantation system. Despite the success of rubber cultivation in the
neighboring French-controlled territories of present-day Vietnam, it was tried only
experimentally in Laos, and never advanced during the period of colonial administration
(Stuart-Fox 1995). Coffee quickly spread to become the dominant crop on much of the
12 Winston et al. (2005) claim that, “Initially, Robusta, Arabica and Liberica species were planted.” The historical accounts of two coffee growing companies (Jhai 2008, LMI 2008) claim that both Arabicas and Robustas were planted by the French; however, they make no mention of Libericas. Galindo and Sallée claim that during colonial administration, “settlers grew exclusively [A]rabica trees of [b]ourbon and [t]ypica varieties” (2007: 19).

27
Bolaven Plateau, especially after the construction of a gravel road from Pakxe to Pakxong
in 1920 (Sallée 2007: 9). Also, an agriculture research and extension center focusing on
coffee propagation was constructed near Pakxong in 1930 (Fortunel 2007: 219, Galindo
& Sallée 2007: 19, Sallée 2007: 9).
Coffee production in French colonial plantations was most strongly concentrated
around this center. Seeds were disseminated throughout nearby villages free of charge
(Sallée 2007: 9), and households began to grow coffee in small gardens (Duris et al.
2002, Galindo & Sallée 2007: 19). Also, in 1937-1938, an apparently successful coffee
cooperative was set up by the French. The cooperative’s aggregate coffee collection
amounted to a third of all coffee produced in the Bolaven Plateau in 1939 (Fortunel 2007:
219). By the late-1930s and early-1940s, households at 800-1,200 masl began starting
their own small-scale (1-10 ha) plantations (Galindo & Sallée 2007: 19, Sallée 2007: 9).
With the seeds produced from the first generation of plants, households from more
remote villages began to start their own plots (Sallée 2007: 9).
During this time, coffee production on the Bolaven Plateau is reported by
different sources to have reached 5,000-10,000 ha (Fortunel 2007: 219, Galindo & Sallée
2007: 19), no less than 50% of which was maintained by Lao smallholders (Fortunel
2007: 219). All coffee produced during this period was processed via the ‘wet’ method,
which produces a higher quality final product. According to Stuart-Fox (1995: 135), 30
tons of coffee were exported in 1935.13 While most of the coffee produced during this
period was exported to France (where it was imported and perceived as a high-quality
product (Galindo & Sallée 2007: 19)), there was also a small local market at the time
13 It is unclear whether these 30 tons came from production sites exclusively on the Bolaven Plateau (Stuart-Fox 1995: 134), although it is quite probable, as no known source documents coffee production in other parts of the national Lao territory during this time.

28
(T&CA 2004), presumably to serve primarily the demands of French colonists and
secondarily to serve any domestic demand by the Lao themselves. At its height in the late
1930s, total coffee production reached 4,500-5,000 tons (Duris et al. 2002, Fortunel 2007,
Jhai 2008, LMI 2008).14
As Fortunel (2007: 219) and Sallée (2007: 9) point out, the French colonists who
first advanced coffee production in the region did not, in fact, come directly from France.
Rather, they were predominantly veteran French soldiers who had completed their
military tenure and retired civil servants who had served as colonial administrators. The
coffee pioneers of Laos were thus not well-financed industrialists and had little capital
with which to invest in production, unlike the first capitalist coffee planters of Vietnam
(Sallée 2007: 9). Thus, while the foundation for a Lao coffee commodity chain had been
established, the financial, labor, and technological limitations of the early 20th century
Bolaven Plateau region restricted development of that chain.
Wars, Regime Changes, and Sector Disruption: ~1945-1975
World War II
The initial progress made in developing the Lao coffee chain was significantly
disrupted by the Second World War. The consumption end of the chain in European,
primarily French, markets was dismantled as marine export routes became theaters of
warfare (T&CA 2004, Galindo & Sallée 2007: 19). The European coffee futures (in Le
Havre, Hamburg, and London) were closed down during the two world wars (Daviron &
Ponte 2005: 73). The production end of the chain on the Bolaven Plateau suffered
simultaneous disruption as Japan occupied Laos in 1945.
14 Data on the productive area and quantity of coffee produced during this period is admittedly sketchy at best.

29
Additionally, coffee leaf rust epidemics revealed the Arabica typica species’
vulnerability to the disease. Still more, frosts – especially those of the ‘Great Frost of
1949’ (LMI 2008) – presented further yield declines (Galindo & Sallée 2007, Jhai 2008).
From the 1950s onwards, varieties of more resistant Robusta and Liberica plants replaced
Arabica typica as the most dominant species (Duris et al. 2002: 70, Galindo & Sallée
2007, Jhai 2008). As foreign exports declined, so did supply, as coffee farmers were
forced to diversify their farms and increase the cultivation of food crops for their own
consumption (Galindo & Sallée 2007).
Coffee production did not cease completely, though. While farmers diversified
their farms, they also continued to grow coffee for the local market (T&CA 2004),
thereby shortening the Lao coffee chain. However, production for primarily domestic
consumption had implications for coffee quality, as the Lao market had much lower
product standards than its European counterparts (T&CA 2004). Furthermore, along with
the shift from Arabica typica to (mainly) Robusta came a decrease in crop maintenance,
as Robusta trees generally require less labor to maintain while nevertheless yielding
greater quantities. The end of formal French colonial occupation in 1953 also impacted
production. According to one source (Fortunel 2007: 219), only 400 ha of coffee were
planted on the Bolaven Plateau of 1955. Other sources claim that, by that same year,
production amounted to merely 1,500 tons (Duris et al. 2002, T&CA 2004, Jhai 2008).
The disruption of the Lao coffee chain continued as internal and external forces fought to
control the fate of the newly independent Lao state.

30
Lao Civil War & the Indochina Wars
It is difficult to separate the Lao Civil War (1953-1975) from the First Indochina
War (1946-1954) and Second Indochina War15 (1955-1975). The specific impacts of
these conflicts on the environment of the Bolaven Plateau are unclear. What is clear,
though, is that “heavy bombs, rockets, grenades, artillery munitions, mortars, anti-
personnel landmines, and improvised explosive devices” were used in abundance during
the civil war between the communists and royalists (UXO 2008). In even greater
abundance was the ordnance used by the United States military in its effort to stop the
movement of North Vietnamese weapons and supplies through the sections of the Ho Chi
Minh Trail running adjacent to, and sometimes traversing, Lao territory.
Indeed, one of Laos’s most notorious (and unfortunately true) distinctions is that
it is the most heavily bombed country – per capita – on the planet. Over half a million
aerial bombings were conducted by United States B52s and other military aircraft
between 1964-197316 (BBC 2001, UXO 2008, Brady 2011). Over two million tons of
ordnance – including more than 266 million sub-munitions released from cluster bombs –
were delivered by US forces during this time (UXO 2008). In total, the number of bombs
dropped on Laos during this period is greater than the number that fell over all of Europe
during World War II (BBC 2001). Strikingly, is estimated that up to 30% of all ordnance
released during this war never exploded. As the Lao National Unexploded Ordnance
Programme states: “Such unexploded ordnance (UXO) continues to remain in the ground,
maiming and killing people, and hindering socio-economic development and food
security” (UXO 2008).
15 In the United States of America, the Second Indochina War is typically referred to as the Vietnam War. 16 Sallée (2007: 10) suggests that the US bombing took place between 1970-1971.

31
With its proximity to the Ho Chi Minh Trail, the Bolaven Plateau was subjected
to heavy bombardment, especially during 1970-1971 (Sallée 2007: 10). Life for those
residing in the region was extremely hazardous (T&CA 2004). Many farmers, investors,
and others involved in the coffee chain fled from the region (and from Laos altogether) to
avoid the conflict (Galindo & Sallée 2007). Indeed, “the villagers were scattered and
evacuated to refugee camps in Pakxe”, which were eventually closed in 1976 (Sallée
2007: 10) Some sources claim that tons of UXO remain on the Bolaven Plateau (T&CA
2004, Jhai 2008). In light of the intensity of the bombing campaign adjacent to and in the
region, one can imagine that, apart from the sheer social, political, and economic
devastation, the degree of environmental destruction in the region was considerable (see,
e.g., Image 1). A TIME magazine news article wrote:
The American B-52s that bombed the sections of the Ho Chi Minh Trail that snuck into the Laotian jungle killed an untold number of civilians and contaminated many coffee fields with craters and unexploded ordinances.
Instability and the associated socio-ecological disfiguration of the Bolaven Plateau region
hindered further development of the Lao coffee chain.
Socialist Experimentation and Agricultural Collectivization: ~1975-1989
The Three Revolutions
Following their 1975 victory of the Lao Civil War, the communist Pathet Lao
established the Lao People’s Democratic Republic. The new government was eager to
carry out ‘three revolutions’ in production relations, science and technology, and
ideology and culture (Zasloff 1991). The productive revolution entailed the
nationalization and/or collectivization of private enterprises, including agricultural
enterprises, such as the production of coffee. The scientific and technological revolution

32
Image 6: The destruction of Pakxong during the Second Indochina War. This photograph reproduces a painting (official title and date unknown) by Lao artist Mr. Phaivanh Chanthavong on display at the Champasak Province Museum of History. The painting depicts an aerial bombardment of Pakxong – the capital of Pakxong district, and town core of the Bolaven Plateau region – during the Second Indochina War. Source: Photograph by author, 18 March 2009. Translation of artist’s name by Soukdavanh Bouadaphom.

33
was intended to apply new technologies to enhance efficiency and increase production.
The ideological and cultural revolution involved cultivating the consciousness of
Marxist--Leninist class struggle, raising education levels, and unifying the people of Laos
with a heightened national awareness (Zasloff 1991).Governing through its political party
incarnation, the Lao People’s Revolutionary Party (LPRP), the Pathet Lao centralized
control over macro-economic planning (WB 1989) in an effort to bring the country to a
state of socialist self-reliance. As Evans (1991: 89) explains, the goal of the revolutionary
regime in Laos was “to harness the unrealised potential surplus of the previous regime
and thereafter produce an ever-expanding investable actual surplus”. The implication is
that non-socialist (capitalist) regimes, being comparatively more oriented towards the
market, are unable to optimize resource allocation and exploitation (Evans 1991).
Agricultural Collectivization in the Bolaven Plateau Region
On the Bolaven Plateau of the mid- to late-1970s, new social and ecological
systems began to emerge on a landscape still recovering from the impacts of war. Settlers
from the lowlands started to reoccupy the abandoned lands of the region (Galindo &
Sallée 2007: 19). Via mandate from the Lao Ministry of Agriculture and Forestry (MAF),
state farms and agricultural cooperatives were established from 1981-1984 (WB 1989,
Galindo & Sallée 2007, Sallée 2007). The formation of these production and trading
cooperatives was seen as conducive to the mobilization of potential agricultural surpluses
while also serving to regulate the share of commodities (agricultural and non-
agricultural) consumed by farmers (WB 1989). “Furthermore, during this politically
volatile period, collectivisation not only promised greater control over consumption and
production, but greater political control over the population as well” (Evans 1991: 96).

34
According to Southeast Asianist Ian Baird, in the 1980s thousands of families
living in the lowlands of Khong District, and possibly others, were forced by the
government to make seasonal trips to the Bolaven Plateau to clear forest and grow
coffee.1718 These families would travel back and forth to the plateau during different
seasons, farming wet rice paddy in their Khong lowlands during the wet season and
developing coffee on the plateau during the dry season. The forced relocation was thus
not permanent; some families stayed in the Bolaven Plateau region while others
eventually abandoned the areas they had cultivated (Baird 2012).
In the 1989/1990 coffee season, the estimated harvestable coffee area in the
Bolaven Plateau was 17,000-20,000 ha (WB 1989, NSC 2006). The value of coffee
exports in 1987 amounted to approximately $8-9 million. Coffee production in the same
year was estimated at 4,000-5,000 tons (WB 1989).
Lao Coffee in the Socialist World System
From the rise of the LPRP in 1975 to the late-1980s/early-1990s, nearly all coffee
produced in Laos was sold and exported to countries which were either members of or
affiliated with the Council for Mutual Economic Assistance (COMECON), an
intergovernmental economic organization led by the Soviet Union and comprised of
Eastern bloc and other communist states. The price of coffee during this time was set
through negotiations between the central government, provincial trading companies, and
farmers (WB 1989: 27, Duris et al. 2002: 70). All coffee companies were required to sell
17 Dr. Ian Baird, currently at the University of Wisconsin, Madison, is a geographer specializing in, among other things, the socio-environmental history of Southeast Asia, especially southern Laos and northern Cambodia. He is “one of the world’s leading authorities on this region and its diverse populations” (Forster 2010). Baird’s expertise is highlighted here only to insist on the credibility of his claims, being as the history he revealed is undocumented in any published works known to the author. 18 Khong District, 80-140 kilometers south of Pakxe via the Mekong River, is the southernmost district of Champasak province, and thus the southernmost district in Laos.

35
a certain portion of all procured coffee to the national trading company of Lao PDR, the
Societe Lao Import-Export (SLIE), operating through the Lao Ministry of Commerce
(WB 1989: 23, 27). Lao officials bartered coffee with COMECON states at prices
negotiated every five years (WB 1989: 27). Trade negotiations were typically made on a
bilateral basis, and most arrangements were “to reimburse the COMECON debt with
former socialist countries” (Sallée 2007: 19).
Important to note is that payment of COMECON debt was based on coffee
quantity, rather than quality. State-controlled systems of coffee production in Lao PDR
were consequently geared toward the accumulation of greater volumes. From 1982-1987,
however, coffee exports stabilized (WB 1989: 3). Additionally, since there was little
profitability or other incentive for Lao coffee farmers to maintain their plots in ways that
produced higher quality coffee beans, cultivation, harvest, and processing methods were
simplified (Galindo & Sallée 2007: 19).
Less pruning and other maintenance activities were performed on coffee trees,
allowing them to grow to their natural heights; coffee cherries were picked prematurely
(prior to optimal ripeness); and the lower-quality-producing ‘dry’ method of initial
processing came to dominate the coffee production/processing culture of the Bolaven
Plateau region. Summarizing the state of the Lao coffee industry in 1989, a World Bank
report wrote: “[T]he coffee subsector is run down and needs to be rehabilitated” (WB
1989: 3). In these ways, the restructuring of the Lao coffee commodity chain away from
its traditional markets and toward the socialist world system impacted the socio-
ecological systems of the Bolaven Plateau region.

36
The period of socialist experimentation and agriculture collectivization represents
the first time in the history of the Lao coffee commodity chain that the structure of the
chain itself altered the configuration of the region, rather than the inverse. While the
Bolaven Plateau region had been constantly transformed by external or extra-local factors
(e.g., French colonial ambitions, superpower ideological battles, etc.), these factors had
never been precipitated by the political economic machinations embedded in the chain
itself. Heretofore, the chain’s structure was too embryonic to independently drive
changes in the geography of the region. During this period, however, the structure of the
Lao coffee network had been sufficiently developed to induce a transformation of its
resource space.
Post-Socialist Transition and Market Liberalization: ~1988-2000
The New Economic Mechanism
In 1986, just over a decade after the establishment of Lao PDR the LPRP
promulgated the New Economic Mechanism (NEM)19, and began to transition the Lao
state away from socialism (Rigg & Jerndal 1996: 150). The NEM is a complex,
multifaceted set of policy prescriptions involving significant macro-economic reversion
to capitalist markets. 20 Announcements to reform the Ministry of Agriculture and
Forestry, which had been responsible for the development of cooperatives and
supervision of state farms, came in 1988. According to a World Bank report, MAF
reform was
aimed at rationalizing and decentralizing [. . .] by merging departments, reducing centrally-based staff through transfer to provinces and
19 Some sources use different terms; e.g., the ‘New Economic Management System’(UNDP 1991), or the ‘New System of Economic Management’ (WB 1989). 20 A comprehensive overview of the policy prescriptions/implications of the NEM is provided by the United Nations Development Programme (UNDP 1991).

37
parastatals, and strengthening provincial and district agricultural services. MAF’s production responsibilities were reassigned to provincial agencies and autonomous parastatals, and its role redefined to focus on sectoral planning and coordination, provision of technical assistance to provincial and district agricultural services, and such core activities as research development. (WB 1989)
Along with the liberalization of the agricultural sector in Laos was the cessation of coffee
exports for the repayment of COMECON debt (Duris et al. 2002: 70).
The Upland Agriculture Development Project
Lao Coffee Chain Development
For the Bolaven Plateau region in particular, the period of post-socialist transition
was marked by implementation of the World Bank’s Upland Agriculture Development
Project (UADP). The UADP is a project devised, funded, and implemented by the World
Bank’s International Development Association (IDA). It was executed as an eight year
project (1990-1998)21 covering two target areas in Laos, one of which was the Bolaven
Plateau region 22 . The UADP aimed at “reducing rural poverty, expanding export
earnings, and improving food security, controlling soil erosion and strengthening key
agricultural institutions in upland farming areas” (WB 1989, 1998). Specifically, the
project’s principal beneficiaries were “farming families [. . .] involved in highland coffee
production [. . .]” (WB 1989: 8)
The UADP involved uprooting and replacing unproductive trees, and
approximately 5,500 ha of new plantings (WB 1989). It also involved a genetic
improvement component which included “the introduction and field testing of superior
[R]obusta and [A]rabica coffees from abroad to ensure optimal development of the
industry in the long term”. Moreover, it reintroduced to the region the wet method of
21 The UADP was planned initially as a five-year (1990-1995) project. 22 See Map A1. The other project area was the Vientiane Region; see Map A2.

38
coffee processing so as to “ensure cleaner coffee with lower processing losses”. New wet
processing plants with the capacity to perform the initial stages of coffee processing –
cleaning, pulping, hulling, drying – were established to serve Champasak (Pakxong
district) and Salavan (Laognam district) provinces, and smaller hand pulpers and hullers
were provided for select villages (WB 1989: 9-10). The UADP’s coffee biology, ecology,
and agricultural components were decidedly successful.
The UADP’s Rural Credit Component
The UADP also contained an unsuccessful rural credit component. The
component involved a total transfer of USD$1 from the IDA to the GoL’s Ministry of
Finance (MOF) 23. In 1994 and 1996, a total of USD$881,000 was transferred from the
MOF to the Central Bank of Laos (CBL) (WB 1998), and further on-lent to “commercial
banks in the [Bolaven Plateau region] project area, under subsidiary loan agreements
satisfactory to the [GoL] and IDA” (MOF 1991). The main commercial banking
institution was the state-operated Agriculture Promotion Bank, which then on-lent the
funds to smallholder coffee producers in the Bolaven Plateau region. The World Bank
reports that fiscally unsound policies at the CBL and the APB made successful
implementation of the rural credit component infeasible; it was cancelled in 199724. The
socio-economic impacts produced partially by the legacy of the UADP’s failed rural
credit component are explored in detail in Chapter IV.
23 At the time of the initial execution of the loan, the Ministry of Finance was known as the Ministry of Economy, Planning, and Finance (MOF 1991, WB 1992). 24 “A review mission in July 1996 found that: (a) the Bank of Laos maintains an interest structure for the agricultural production sub-sector that is negative in real terms and (b) the APM's operations are constrained by its limited power to mobilize funds and its lack of authority to set its interest rates. As the Bank was unable to engage the government in an effective dialogue on these issues, the rural credit component was cancelled in January 1997” (WB 1998: 32).

39
Additional Boosts to the Lao Coffee Chain
Implementation of the UADP also coincided with some fortuitous events in the
global coffee chain that further encouraged the progression of the Lao coffee chain. In
1994, the ICO’s composite indicator price25 rose dramatically due to frosts in Brazil that
reduced global supply. Following the Asian financial crisis of 1997, the value of the Lao
currency, the kip (LAK/₭), was significantly devalued in relation to the US dollar
(USD/$) (Figure 8), creating a profitable currency exchange rate for Lao coffee exporters.
Figure 8: Relationship between the ICO composite indicator price and the USD/LAK currency exchange rate, 1989-1999. Source: International Coffee Organization composite indicator price data from ICO (2012b). Currency exchange rate data from OANDA (2012).
25 The ICO’s composite indicator price is the “overall benchmark for the price of green coffee of all major origins and types, considered to be the best available measure of levels of green coffee transactions on a global basis” (ICO 2012c).

40
Coupled with the UADP’s coffee components, these additional boosts ensured that the
end of the 20th century marked a time of unprecedented prosperity for the people of the
Bolaven Plateau region’s coffee-based economy.

41
CHAPTER III THE CONTEMPORARY STRUCTURE OF THE LAO COFFEE CHAIN
This chapter describes the contemporary structure of the Lao coffee chain (from around
the early-2000s to the present). It presents the chain at multiple geographic scales,
beginning with global-level processes, moving ‘down’ to world-regional- and national-
level processes, and ultimately arriving at the local-level dynamics among the actors
producing the chain in the Bolaven Plateau region.
Global Coffee Commodity Chain Dynamics
The Rise of Robusta
The ratio of Robusta production to total global coffee output has steadily
increased since the first half of the twentieth century. With the introduction of coffee
production in several African colonies during the mid-20th century, the world harvest of
Robusta increased from nearly 0% in 1920 to about 27% at the end of the 1960s (Daviron
& Ponte 2005: 53). The 1980s marked a significant increase in Robusta production led by
Asian countries, especially Indonesia and India. The 1990s were marked by even more
remarkable jumps in Robusta production, led predominantly by Vietnam and Brazil
(Daviron & Ponte 2005: 53). The last half century has been marked by a near doubling of
the share of Robusta in world production (Figure 8). As Daviron and Ponte (2005: xvi)
point out: “[T]he international coffee market is awash in coffee of ‘low quality’, while
there is a dire shortage of ‘high quality’ coffee – and it is the latter that is generating sales
growth.”26
26 It should be noted that Robusta is not necessarily ‘low quality’ coffee, although it is generally produced as such, and is treated in the international marketplace as such.

42
Figure 9: Global coffee production by coffee type, 1959-2012. Source: Data compiled from USDA (2012). Production, Supply and Distribution Online. United States Department of Agriculture Foreign Agricultural Service. available at:http://www.fas.usda.gov/psdonline/psdQuery.aspx. The Disintegration of the International Coffee Agreement
In 1989, the last International Coffee Agreement (ICA) endowed with the
authority to establish export quotas for individual countries, and thereby regulate
international coffee prices, was disintegrated (Ponte 2002, Talbot 2004). While an active
ICA remains in existence today, it lacks the market intervention mechanisms contained in
the pre-1989 ICAs, effectively incapacitating the agreement as a raiser and stabilizer of
global coffee prices (Osorio 2002). The ICA is administered by the International Coffee
Organization (ICO), whose governing body consists of all ICO member states. (Laos is
not currently, and has never been, an ICO member; however, it applied for membership

43
in the late 1980s (WB 1989: 27), and its acceptance to the intergovernmental organization
appears imminent (VT 2009a, 2010c, 2010a)).
The first ICA was signed in 1962 by nearly all producing and consuming
countries at the time (Ponte 2002). It and subsequent agreements created a target price
band for coffee, as well as corresponding export quotas for each producing state. As
explained by Ponte (2002: 1104), under the ICA system, export quotas were relaxed
when the ICO composite indicator price rose above the target price; quotas were
tightened when the indicator price fell below the target price. There is general consensus
amongst coffee analysts that this system was successful in raising and stabilizing the
international coffee price (Ponte 2002: 1104). This success was permitted by the
participation of essentially all concerned state actors, at both ends of the global coffee
chain.
However, the ICA was far from a perfect system. Producing states would
squabble over prices, and some states would free-ride on the quotas of other states. The
quotas themselves were expensive to negotiate, so they remained relatively static. Also,
the entire quota system was undermined by the increased export and trade of coffee by
non-ICO states, often at prices lower than those mandated by the ICA system. Therefore,
ICO consuming member states – representing primarily the roasting companies within
those states – began to stray away from the ICA system, as they worried that the

44
strictness of the export quotas would allow their competitors to purchase from non-
member producing states at more favorable prices27 (Ponte 2002).
The Global Coffee Crisis
The term ‘global coffee crisis’ refers broadly to the highly disproportionate nature
of the global value chain for coffee (for a thorough explanation, see Talbot 2004). The
most recent articulation of the global coffee crisis began towards the end of the 1990s,
when the price of coffee on the world market dropped to levels that in many cases failed
to cover farmers’ costs of production. The five year period of sustained low prices
between 2000 and 2004 and the striking socio-economic impacts that resulted from this
period has come to epitomize what is meant by the term ‘global coffee crisis’ (Figure
10).
According to the ICO, in the early-1990s export earnings by coffee producing
states were $10-12 billion; retail sales of coffee (taking place predominantly in
‘developed’, more industrialized states) amounted to approximately $30 billion. By the
early-2000s, retail sales of coffee amounted to $70 billion (an increase of 133%), while
producing countries received only $5.5 billion (a decrease of at least 45%). The world
market price for coffee in the 1980s was $1.20/lb; in the early-2000s, it was about
$0.50/lb (the lowest in real terms for a century) (Osorio 2002:1).
27 Lao PDR is one of the non-member states which inadvertently undermined the ICA system. Up until the late-1980s, the only legitimate entities in Laos authorized to procure coffee at the farm level were those of the state. The majority of all coffee produced in Laos was procured by Societe Lao Import-Export (SLIE) for the interstate trade with the Soviet, Eastern bloc, and other communist states associated with the Council for Mutual Economic Assistance (COMECON). However, after meeting annual COMECON exchange quotas, the remainder of the coffee produced in Laos was sold to private exporters who somehow had managed to gain export licenses following the implementation of macro-economic liberalization policies. These exporters sold coffee to states outside the pre-1989 ICA, primarily via Thailand and Singapore (WB 1989: 27).

45
Figure 10: Coffee prices before, during, and after the global coffee crisis. Source: Coffee price data from ICO (2012b).
The crisis is attributed partially to the demise of the ICA system, which fostered
quotas for producing countries, thereby helping to balance global coffee supply with
global coffee demand (Osorio 2002). At the end of the 1990s, Vietnam surpassed both
Indonesia (in the 1998/1999 season) and Colombia (in 1999/2000) in coffee
production28, thereby making it the country with the second greatest output in the world,
only after Brazil, whose output far exceeds that of all other producing countries (Table
1).
The ICO summarizes the socio-economic impacts of the global coffee crisis on
coffee producers in three categories, depending on the costs of production and level of
technological inputs at the farm level:
28 Indonesia had occupied the number three position since 1981; Colombia had been number two since before the Second World War.

46
(1) where costs of production are low and technological development is
high, coffee farmers can still make a living, albeit with low rates of
return, which reverberate through rural economies in terms of reduced
consumption and increased unemployment;
(2) where coffee is a cash crop in an otherwise subsistence farm,
consumption of medicine, communications, and education is reduced;
(3) where farming households rely principally on coffee for income,
indebtedness typically increases and farmers are often forced to
abandon their farms and/or switch to alternative crops. (Osorio 2002)
The National Lao Coffee Sector of Lao PDR
Lao Coffee Export Geography
The contemporary geography of Lao coffee exports is irregular. It reflects the
legacies of both colonial- and socialist-era flows, as well as increasing regionalization,
whereby other Asian, including Southeast Asian, states import Lao coffee. Poland,
France, Belgium, Switzerland, Germany, and Romania are the commonest importers, but
countries as varied as Oman, the USA, Japan, and New Zealand, among others, also
receive Lao coffee. Poland, a former COMECON state, imports the largest quantity of
Lao coffee, and most consistently too. As Galindo and Sallée point out, exports to
Vietnam have increased dramatically in the last several years, but very little empirical
data on this phenomenon is available, so the ultimate use of Lao coffee in Vietnam (e.g.,

47
Table 1: Coffee production by the top-10 ranked producing countries + Laos. Source: Data compiled from USDA (2012). Production, Supply and Distribution Online. United States Department of Agriculture Foreign Agricultural Service. available at: http://www.fas.usda.gov/psdonline/psdQuery.aspx.
Coffee Production (1,000 60kg bags) in Annual Harvest
Rank (2008/2009) Country 2000/
2001 2001/ 2002
2002/ 2003
2003/ 2004
2004/ 2005
2005/ 2006
2006/ 2007
2007/ 2008
2008/ 2009
Percent of Total(2008/2009)
1 Brazil 34,100 35,100 53,600 33,200 43,600 36,100 46,700 39,100 53,300 39.75
2 Vietnam 15,333 12,833 11,167 15,000 14,500 16,335 19,500 18,000 16,980 12.66
3 Indonesia 6,495 6,160 6,800 7,250 8,450 9,450 7,500 8,000 10,000 7.46
4 Colombia 10,500 11,950 11,712 11,053 11,532 11,953 12,164 12,515 8,664 6.46
5 Mexico 4,800 4,200 4,350 4,300 4,000 4,200 4,500 4,350 4,550 3.39
6 India 5,020 5,010 4,588 4,508 4,672 4,617 4,665 4,660 4,375 3.26
7 Peru 2,824 2,550 2,760 2,870 3,550 2,420 4,400 2,800 4,000 2.98
8 Guatemala 4,564 3,530 3,802 3,671 3,817 3,715 4,050 4,110 3,980 2.97
9 Ethiopia 2,768 3,756 3,693 3,875 4,068 4,000 4,036 3,906 3,650 2.72
10 Honduras 2,821 3,098 2,496 2,968 2,575 3,204 3,460 3,642 3,225 2.40
World Total 117,521 111,518 127,102 110,750 121,262 116,721 131,819 122,153 134,103 84.06
29 Laos 392 430 537 464 385 300 420 355 350 0.26

48
Map 3: Destinations and value of Lao coffee exports in 2008. Source: Map by author; Lao PDR coffee export data provided by LCA (2009).

49
for re-exportation by Vietnamese companies, or for local consumption) is unknown)29
Map 3 illustrates the officially reported export geography of Lao coffee in 2008.30
Non-Existent Quality Standards for Lao Coffee
Most internationally traded coffee is classified according to its quality
characteristics. This is possible only when the exporting state has established export
standards, typically referred to as ‘fair average quality’ (FAQ). No such standards yet
exist in Lao PDR. The Lao Coffee Association – whose membership consists solely of
coffee exporters – is the main body that would be responsible for developing such
standards. As explained by Galindo and Sallée (Galindo & Sallée 2007: 11), most
exporters have specialized in the selling of coffee ([R]obusta and [A]rabica) without any
quality standards”.
Lao Coffee Price Penalty
Lao Robustas produced are especially desirable to international coffee buyers
because of their particularly low prices (Galindo & Sallée 2007). Partly because of the
non-existent quality standards, the overwhelming majority of Lao coffee suffers a price
penalty in the international marketplace. It is sold for approximately $100-150 per metric
ton (mt) less than the Robusta futures prices set in London. In addition to the lack of
quality export standards, this penalty is due also to the poor reputation of not only Lao
coffee itself, but also the reliability of Lao coffee exporters (Galindo & Sallée 2007: 8).
29 The relative ease with which Vietnamese traders can access Lao coffees, within the context of the ‘competition for coffee space’ occurring in the central Vietnamese highlands (see, e.g., Doutriaux et al. 2008), leads the present author to believe that Vietnamese traders use comparatively inexpensive Lao coffees in their own stocks for re-export. 30 See the Appendices for maps of the 2002-2007 Lao coffee export geographies.

50
Lao Coffee Production Geography
Nearly all (95-99%) coffee production in Lao PDR takes place in the four
southern provinces administering the Bolaven Plateau region: Champasak, Salavan,
Xekong, and Attapeu. Some production takes place outside of the region as well,
primarily in Luang Phrabang province (Map 4). Between 20 to 25 tons of coffee is
currently produced in the Bolaven Plateau region each year, generating US$33-50 million
for the Lao state (VT 2009b, 2012b). National production is dominated by Robusta,
which accounts for approximately 75%, with Arabica accounting for the remaining 2531
The GoL and other parties to bring the proportion of Arabica half Robusta (Winston et al.
2005). Coffea liberica (Liberica) is grown for commercial purposes in Laos, albeit
nominally and only in older plots (Winston et al. 2005) 32; it is likely that within the next
several years it will disappear entirely from the region.
Lao Coffee and the Bolaven Plateau Region
Coffee as a Poverty Reducer
Overall, the coffee economy of the Bolaven Plateau has been remarkably
successful in reducing the incidence of poverty in the region. According to estimates used
by Epprecht et al. (2008: 28), the region enjoys the lowest rate of poverty of any
comparable agro-/eco-region in the country (Figure 9). However, as described by one
Vientiane Times newspaper article:
31 One source estimates that Robusta production comprised 87 percent in 2007. A Food and Agriculture Organization (FAO-)sponsored source, indicating 2001 figures, claimed Robusta production comprised 88 percent of total production (Winston et al. 2005). Another source noted that Robusta output for the 1999/2000 season was 96 percent (Duris et al. 2002). An additional source stated that the figure was greater than 90 percent (T&CTJ 2002). Yet another source stated that it comprised 80 percent (Boungnavong & Chounthavong 2001). As for Arabica: one source stated that 25 percent of coffee production in Laos was of the Arabica species (Jhai 2008). 32 Coffea liberica and Coffea excelsa both grow in Laos. They were once considered separate species, but it has since been determined that they are too similar taxonomically to warrant distinction as separate species. Plants formerly classified as Coffea excelsa are now subsumed under the species Coffea liberica.

51
Map 4: Choropleth and cartogram of the area (ha) under coffee production in 2008 in each Lao PDR province. Although they represent the same data, these two maps visualize those data in very different ways. The cartogram distorts the geometric representation of the provinces by adjusting their sizes proportionate to their respective values for the variable in question: area (ha) under coffee production in 2008. Source: Maps by author; Lao PDR provincial coffee production data from NSC (2006). A similar choropleth and cartogram illustrating the total quantity (tons) of coffee produced in each province can be found in the Appendices (Map A3).

52
To the casual traveler, the residents of [the Bolaven Plateau33] appear to be wealthy. Their gardens are resplendent with the green and ripe red of coffee trees growing in the fertile soil of the Bolaven Plateau. [. . .] This image, however, is false; many families in the [region34] are still living below the poverty line. [. . .] It seems that some families have to work just a little bit harder, and are not benefiting from the developments taking place [. . .].
Image 7: A coffee smallholder highlights the differences between a few of the coffee species grown in the Bolaven Plateau region. From the reader’s perspective, the leaves he is holding represent the Robusta (left); Arabica, catimore dwarf variety (center); and Liberica (right) coffee species. Source: Photograph by author, February 3, 2009.
33 The article (VT 2007) was describing specifically a subset of the Bolaven Plateau population – ‘the residents of Thataeng district, Xekong’ – however, as will be shown in Chapter IV, this quote can be applied to many parts of the entire region. 34 Again, the article (VT 2007) referred specifically to the “district”, that is, Thateng district.

53
Figure 11: Poverty rates in the agro-/eco-regions of Laos. Source: Data adapted from the 2002-2003 Lao Expenditure and Consumption Survey, as reported in Epprecht (2008: 21).
The Rural-Urban Nexus
Pakxe, the provincial capital of Champasak, serves as the geographical nexus
between the source of coffee in the Bolaven Plateau (to the east), and the export gate of
that coffee on Laos’ border with Thailand (to the west). Coffee must travel over land
from small plots or industrial plantations on the Bolaven Plateau – where it is picked,
sorted, and usually minimally processed – to large factories either in Pakxe, or along the
road between Pakxong and Pakxe, where all other pre-export processing procedures are
performed. The coffee is then stored in warehouses before it is put on a truck and travels
through the Vongtao / Chong Mek border crossing between Laos and Thailand. It then
makes its way south to the international port outside of Bangkok where it is put on a ship
headed for its various international destinations.

54
The greatest concentration of the financial capital that stimulates the Lao coffee
sector is in Pakxe. Pakxe, and to a lesser extent the national capital of Vientiane, are the
places from which almost all financial capital flows to rural producers; the place to which
almost all coffee capital flows from rural producers; and the place where the most
substantial benefits gained through the early stages of the Lao coffee chain are enjoyed
by the coffee sector elite. Pakxe is the third most populous, and one of the most
historically and economically important cities in the country. Like all major Lao cities
(save for Louang Phrabang), Pakxe is located along the lowland banks of the Mekong
River. The production of coffee in the rural Bolaven Plateau region is one the primary
impetuses for the increasing rate of urbanization in Pakxe, as well as in the intermediary
sites of coffee trading and processing in the towns surrounding the plateau, namely
Laongam and Thateng. The most important town center serving as an intermediary site of
the Bolaven coffee supply chain is Pakxong, the only town located on the plateau itself.
Despite the important intermediary roles played by the towns of Laongam, Thateng, and
Pakxong, Pakxe remains the indisputable core from which control of the rural coffee
economy of the Bolaven Plateau emanates.
Actors in the Lao Coffee Commodity Chain
At its socio-ecological base of the Bolaven Plateau region, the Lao coffee network
operates through a chain of relationships between three main types of actors: producers,
traders, and exporters.
Lao Coffee Producers
Smallholder producers are the core of the Lao coffee sector. They are the
hundreds of coffee-farming families who inhabit most of the Bolaven Plateau region.

55
They consist primarily of those farming families holding less than five hectares of
productive coffee trees. Use of the term ‘producers’ here refers to those groups identified
by Galindo and Sallée (2007: 39) as:
[. . .] small-scale diversified coffee producers growing robusta and some arabica. Besides coffee, these farmers develop other crops (associated or not to coffee plantations) like vegetables, tea, fruit trees, etc. They have very little cattle and depend for a large part on coffee. They sell both processed and unprocessed coffee (especially [A]rabica) depending on their capability to process coffee (either in private or collective mills). A significant percentage makes pre-harvest loans.
as well as
[. . . ] small-scale diversified coffee producers that depend largely on coffee. These farmers have very little livestock (generally only poultry), and have very little acces to other sources of income besides coffee (high coffee-dependency). A significant percentage sells unprocessed coffee (especially [A]rabica cherries) and makes pre-harvest loans.
Image 8: Lao coffee smallholders chat among bags of coffee stored in their home. Source: Photograph by author, February 21, 2009.

56
Image 9: Ground-dried coffee being hulled (dry-process). Source: Photograph by author, February 22, 2009.
Image 10: A typical Lao coffee smallholder family. Note the ground-drying coffee behind the villagers. Source: Photograph by author, February 1, 2009.

57
Lao Coffee Traders
A diverse group of actors is encompassed by the term ‘traders’. Invariably,
though, all traders serve as intermediaries between producers and exporters – they buy
the product of the former and sell it to the latter. There is often more than one segment of
traders between producers and exporters along the chain. Traders typically purchase the
harvests of many farmers within a single village, or multiple villages, and aggregate the
collected bags of coffee so as to have greater leverage on the price they can fetch from
higher level traders, or wholesalers, or from exporters themselves. The majority of traders
work on behalf of wholesalers or exporters; a small, but gradually growing, group of
traders works independently.
Traders are also coffee smallholder producers too. A trader typically owns or has
access to a vehicle capable of transporting large quantities of bagged green beans
(typically a large Hyundai truck; see, e.g., Image 11). A trader also must have access to
dispensable cash capital. These two critical factors – access to a means of bulk transport
and access to cash – differentiate trader-producers from standard producers. Traders often
use the money capital of wholesalers and/or exporters to purchase coffee from
approximately 5-20 village coffee collecting territories (Duris et al. 2002: 71), as well as
to the administration of loans to their fellow smallholders.
Several small wholesale companies based primarily in Pakxe, Laognam, Pakxong,
and Thateng comprise a higher level of intermediary traders. Wholesale companies
typically have warehouses where coffee purchased from villages is stored before being
sold to exporters. Concurrent with the revitalization of the Lao coffee sector since the
early-1990s has been the expansion of the role of traders beyond their conventional

58
activities of purchasing, collecting, and reselling coffee; many traders are increasingly
focusing their activities on the brokering of pre-harvest extension loans. This issue is
covered extensively in the Chapter IV.
Image 11: A trader’s truck is parked to load coffee beneath a comparatively affluent household balcony. Source: Photograph by author, February 24, 2009.
Lao Coffee Exporters
Exporters in the Lao coffee commodity chain consist primarily of urban-based
elite who control virtually all financial capital in the sector. Through the Lao Coffee
Association (LCA), this group acts as a cartel that controls all official coffee exporting
activities for the country. The organization was created in 2004 by a decree by then-
Prime Minister Khamtai Siphandon intended to bolster the coffee industry through more
efficient export practices and data collection procedures (Galindo & Sallée 2007). At its

59
inception, the LCA consisted of 15 coffee exporting company members (Fortunel 2007:
224). As of March 2009, the organization consisted of 31 exporting companies (LCA
2008, VT 2010c), no more than a few of which are also involved in coffee roasting.
Dominant among all exporters is a single, vertically integrated company called Dao
Heuang which purchases the vast majority of all Bolaven Plateau coffee and is
responsible for 60-70 percent of all Lao coffee exports (Galindo & Sallée 2007), not to
mention a substantial portion of all Lao coffee products consumed domestically.
Most of the cash used to distribute high interest loans throughout the region
comes from the few dozen coffee exporting companies with membership in the Lao
Coffee Association. Despite the price penalty for Lao-origin coffees on the international
market, these companies’ exporting (and, in an increasing number of cases) processing,
roasting, and even café retailing activities undoubtedly position them in the most
lucrative segments of the commodity’s domestic value chain. As mentioned above, the
owners of these firms are primarily urban elite based in Pakxe; as such they hold deep
ties to the broader national elite based primarily in Vientiane. Some of these elite include
families who exiled themselves to France upon the declaration of the Lao People’s
Democratic Republic by the Pathet Lao in 1975 only to return several years later after the
new regime began to shift towards more neoliberal economic policies and former
political tensions had been eased.
Foreign Technical Aid Programs
PCADR-PAB
It is important to also note some of the foreign technical aid programs intended to
advance the Lao coffee chain active in the Bolaven Plateau region. Among the most

60
notable projects is the Capitalization Program for the Support of Rural Development
Policy - Bolaven Application Point (PCADR-PAB) 35 . Supported financially by the
French Development Agency (AFD)36 and the Center for International Cooperation in
Agronomic Research for Development (CIRAD) 37 , PCADR-PAB focused on the
improvement smallholders’ ability to produce, process, and market high-quality Arabica
and Robusta coffees. A main component of PAB’s approach involved sponsoring the
construction of wet-processing stations in participating villages, such as the one depicted
in Image 12.
Image 12: An PCADR-PAB-sponsored wet-processing station in a Bolaven Plateau village (Ban38 Kapeu) with an active AGPC producers’ group. Source: Photograph by author, March 20, 2009.
35 PCADR – Programme de Capitalisation pour l’Appui à la politique de Développement Rural; PAB – Point d’Application des Bolovens. 36 AFD – Agence Française de Développement. 37 CIRAD – Centre de Coopération Internationale en Recherche Agronomique pour le Développement. 38 In Lao language, ‘Ban’ means ‘village’.

61
As of early-2009, the PAB had established 53 village-based groups of coffee
producers, (known as ‘producers’ groups’) throughout Pakxong, Laognam, and Thateng
districts (Tulet 2009). A total of 2,625 smallholder families are associated with the
producers’ groups. According to one of the program’s reports (Pedregal 2008: 2):
The [producers’] groups were put together in order to produce and market high-quality coffee, aiming at improving producer incomes, as well as contributing to recognition of a local skills base and promoting environmental preservation.
Image 13: Banners indicate PCADR-PAB-sponsorship of a wet-processing station in a Bolaven Plateau village (Ban Phoumako) with an active AGPC producers’ group. Source: Photograph by author, February 3, 2009.
AGPC
Following the original Bolaven Application Point project, a secondary level
organization was formed, the Association of Bolaven Plateau Coffee Producer Groups

62
(AGPC) 39 . In addition to the original PAB goals of improving producers’ coffee
production and commercialization capacity, AGPC has the following additional functions
(Tulet 2009: 27, VT 2010b):
to assist producers in the pursuit of political representation at
provincial, national, and international levels;
to enhance the exportation capacity of producers;
to facilitate the entrance of producers into the national market for
roasted (value-added) coffee products;
to establish symbolic signs of coffee quality for marketization,
including, e.g., Fair Trade and organic certifications, as well as pursue
legal markers of geographic indication (Sallée 2007, Schüβler 2009).
The defining characteristic of the PCADR-PAB/AGPC programs has been its focus on
advancing the Lao coffee chain by extending technical assistance to, and improving the
lives of, smallholder coffee producers.
PRCC-II
The PCADR-PAB project ended in 2009. It has been followed by a second phase
project, the Program for Trade Capacity Building II (PRCC-II)40. Initiated in 2010, PRCC
II will expire in 2014. Through PRCC-II, the Association of Bolaven Plateau Coffee
Producer Groups program has remained active. Indeed, one of the main objectives of
PRCC-II is to enable the AGPC “to become an autonomous and professionally efficient
organization”. The overarching goal of PRCC-II is to “strengthen the capacities of all
actors of the Lao coffee supply chain” (Sibounheuang 2011). Perhaps the most important
39 AGPC – Association des Groupements de Producteurs de Café du Plateau des Bolovens. 40 PRCC-II – Programme de Renforcement des Capacités Commerciales II.

63
Image 14: Pakxe office headquarters of the Programme de Capitalisation pour l’Appui à la politique de Développement Rural (PCADR) - Point d’Application des Bolovens (PAB). Source: Photograph by author, March 27, 2009.
means by which PRCC-II has pursued this goals is through the creation of an
unprecedented government agency, the Lao National Coffee Council (CNCL)41, also
known as the Lao Coffee Board.
The Lao Coffee Board
The CNCL, the first-ever national Lao Coffee Board, was officially established
through a decree42 by the Prime Minister on June 25, 2010 (Saysana 2011, Sibounheuang
2011). While intended to enhance the operational capacities of all actors in the Lao coffee
chain through the perpetuation of PCADR-PAB activities (e.g., maintaining organic, Fair
Trade, and similar certifications, etc.), the programmatic emphasis of PRCC-II is on
41 CNCL – Conseil National du Café Laos. 42 Decree number 58 (Sibounheuang 2011).

64
bolstering the sustainability of the AGPC producers’ groups. In other words, the PRCC-II
approach to bolstering the Lao coffee chain as a whole is to target its resources on Lao
coffee smallholder producers.
This inherent emphasis on producers has prompted a certain degree of tension
between officials at PAB/AGPC and the Lao Coffee Association, an organization whose
conventional activities overwhelmingly reflect the interests of Lao coffee exporters.43
Some of this tension can be discerned in news articles published in the Vientiane Times.
For instance, in April 2010, the current president of the LCA, Mr. Sinouk Sisombat, was
quoted as saying:
The problem in the past has been that some growers formed their own collective groups and other groups processed coffee individually and these groups didn't work together with the [Lao Coffee A]ssociation
The collective groups to which Mr. Sisombat was referring are those organized by the
through the AGPC. Indeed, since early-/mid-2010 – when the CNCL was first being
developed – at least two Vientiane Times articles pertaining to the CNCL contained
language stressing how the Lao Coffee Association desired greater cooperation among all
Lao coffee chain actors (VT 2010c, 2010b). Prior to the development of the CNCL,
however, the LCA made no calls for such holistic engagement with non-exporting actors
in the chain, especially not with smallholder producers.
43 Indeed, many refer to the Lao Coffee Association as the ‘Lao Coffee Exporters Association’, as its membership consists only of coffee exporting companies.

65
CHAPTER IV SOCIO-ECONOMIC DYNAMICS OF THE BOLAVEN PLATEAU REGION
This chapter examines the dynamics among the three basic types of actors facilitating the
primary stages of the Lao coffee commodity chain: producers, traders, and exporters. It
scrutinizes the coffee-trading and credit-lending systems linking these actors. In-depth
and semi-structured interviews reaffirm previous reports (Thawaensimphet et al. 2003,
Galindo & Sallée 2007) that, in addition to coffee production, usury and chronic debt are
central features of life for smallholders in the region. Empirical data derived from
ethnographic methods also reveal relationships between the quantity and quality of
smallholder loans, the World Bank’s Upland Agriculture Development Project, and the
global coffee crisis. These data also aid in illuminating the mechanisms through which an
exploitative set of labor-capital/client-patron relations operate in the region.
Ethnographic Methods and Data
Semi-Structured Interviews
Between the months of January and March44 of 2009, ethnographic fieldwork was
conducted in the Bolaven Plateau Region. This portion of this project was possible only
through the aid of an indispensable Lao language translator and research assistant, Ms.
Soukdavanh Bouadaphom. 45 Smallholders from a total 192 coffee smallholder
households distributed throughout 10 Bolaven Plateau villages were interviewed for this
study46. The interviews were primarily semi-structured, yet entailed highly standardized
44 This period coincided with the annual Robusta harvest in the Bolaven Plateau region. 45 Ms. Bouadaphom translated my questions (from English to Lao) to the villagers as well as the villagers’ responses (from Lao to English) back to me. She also assisted with multiple translations of official government and corporate documents, and maintained her own records of all conducted interviews (so as to cross-reference with my own). Additionally, Ms. Bouadaphom provided critical cultural insights into Lao mores and norms, and provided essential guidance on innumerable logistical and planning issues. 46 Other fieldwork conducted by the author and Ms. Bouadaphom during this period for an interrelated, but separate, study is documented in Delang and Toro (2011).

66
(i.e., virtually uniform, quasi-survey) inquiry into each household’s domestic economy.
Through these standardized interviews, three main sets of information, intended to assess
regional socio-economic conditions, were gathered:
(1) tenure and use of lands by households within each village (e.g.,
number of hectares owned and cultivated by each household, type of
cultivation performed on each hectare, etc.);
(2) available labor and income of each household (e.g., number of people
residing in each household, worker-to-people ratio in each household,
annual household income, etc.); and
(3) comprehensive household experience with credit and debt via various
types of loans (e.g., amount of money borrowed annually, creditor
type, terms/conditions and associated interest rate of loan, etc.).
In this chapter, these quantitative data are presented and analyzed through the use of
descriptive statistics, the aid of graphs, and with simple correlations.
In-Depth Interviews
In numerous instances, the progression of a semi-structured interview began to
raise additional, more open-ended questions pertaining to a household’s (or individual’s)
particular experience with coffee production, borrowing, and debt. In these cases, the
course of the interview would deviate from the standard line of inquiry and include
questions tailored more towards the specifics of the information being relayed. What
resulted, then, are interviews of a more in-depth, qualitative nature. Some of the most
illuminating – and striking – information was relayed in the form of personal anecdotes

67
and excerpts. These qualitative data augment the contextual clarity of the quantitative
data.
Village Sample
The 10 villages sampled are located in the western/central zone of the Bolaven
Plateau region where smallholder coffee production is predominant. All sampled villages
are located at relatively high elevations (1002-1312 masl) in Pakxong district (Table 2,
Map 5). Villages were chosen through a non-random selection process based on two
criteria: (1) geographic variability, including accessibility of / distance to major roads,
and, by extension, to markets47; and (2) demographic variability, based on the total
number of persons and/or households in each village48. Ms. Bouadaphom and I traveled
to the villages on a rented motorbike. After determining whether the geographical and
demographic characteristics of a particular village warranted inclusion into the sample,
she and I would generally move through the village on foot.
Table 2: Elevation, absolute location, and basic demographics of sampled fieldwork villages. Source: GPS waypoint and socio-demographic data collected during author’s fieldwork; National Statistics Center Village GPS Points, with Basic Socio-Demographic and Socio-Economic Data (NSC 2008).
Village (Ban) Elevation (masl) Latitude Longitude Number of
Households Total
Population Number of
Women Number of Men
Lak 40 1002 15.1914 106.1443 195 1218 586 632
Nong Louang 1274 15.0962 106.2106 82 472 215 257
Phoumako 1312 15.1107 106.2249 46 261 129 132
Phou Oye 1301 15.1445 106.2479 93 505 250 255
Phanoundong 1034 15.0573 106.3850 186 1422 712 710
Houey Touey 1201 15.0786 106.2817 86 596 296 300
Thatsamek 1283 15.1156 106.2696 43 201 113 88
Nong Soung 1046 15.3508 106.3446 159 840 445 395
Kapeu 1165 15.2817 106.2016 160 960 473 487
Phoudin On 1089 15.2839 106.1524 62 362 185 177
Mean - - - 111 684 340 343
47 As perceived by the author and his Ms. Bouadaphom while in the field, based partially on rudimentary maps of the region, motorbike driving distances, and road conditions, among other factors. 48 As determined through initial inquiry with the village head(s) and/or other knowledgeable villagers prior to commencing the quasi-survey interviews.

68
Map 5: Smallholder coffee fieldwork villages in the Bolaven Plateau region. Source: Map by author.

69
Household Sample
The 192 households sampled from within the 10 villages were also selected non-
randomly, based primarily on the geographic distribution of households within each
village. Fifteen percent (15%) of the total number of households in each village was
chosen as the minimum acceptable sample size: no less than 15% of all households in a
particular village were interviewed; the maximum of households interviewed in any
village is 24%. Among the 10 villages, the average number of households is 111, with a
range of 152 (minimum=43; maximum=195); the average number of households sampled
in each village is 19 (17%) (Table 3).
Table 3: Households sampled in each village.
Village (Ban) Number of Households
Households Sampled
Percent of Households
Sampled Lak 40 195 34 17.44
Nong Louang 82 15 18.29
Phoumako 46 11 23.91
Phou Oye 93 18 19.35
Phanoundong 186 28 15.05
Houey Touey 86 15 17.44
Thatsamek 43 8 18.60
Nong Soung 159 24 15.09
Kapeu 160 25 15.63
Phoudin On 62 14 22.58
Mean 111.2 19.2 17.27
Figure 12 illustrates the proportion of households sampled from each village in relation
to the total household sample (n=192) for all villages. The 8 households sampled in Ban
Thatsamek account for the smallest proportion (4%); the 34 households sampled in Ban
Lak 40 account for the largest (18%).

70
Figure 12: Proportion of households sampled in each village to total household sample (n=192).
Image 15: Soukdavanh Bouadaphom records the responses of Lao wife and husband during a typical household interview session. Source: Photograph by author, February 2, 2009.

71
Image 16: Soukdavanh Bouadaphom and the author interview a Lao father during a typical outdoor interview session. Source: Photograph by Lao child (name unknown), February 24, 2009.
Land-Tenure, Land-Use, Labor, and Income
Land-Tenure and Land-Use
Land-tenure and land-use data derived from inquiry into sampled households’
agricultural lands indicate that households in the Bolaven Plateau region hold on average
4.76 ha of land, of which nearly all is productive (4.13 ha / 87 %). Ninety-four percent
(94%) of that productivity is concentrated on coffee cultivation. Robusta coffee occupies
on average 69% of coffee among sampled households; Arabica the other 31%. A small
average (6%) of productive smallholder lands is used for non-coffee agriculture, often for
vegetable gardens for subsistence purposes. Sampled villages have on average 0.64 ha of
forested or otherwise uncultivated land (constituting an average of 13% of all land owned
by the households). These tenure/use data are summarized in Table 4.

72
Table 4: Tenure and use of lands by households within Bolaven Plateau smallholder villages. Source: Primary data collected during author’s fieldwork.
Mean of 10-Village Sample of Bolaven Plateau Households (n=192)
Village (Ban) Arabica Coffee
Land (ha)
Robusta Coffee
Land (ha)
Total Coffee
Land (ha)
Other Agriculture Land (ha)
Total Productive Land (ha)
Coffee Land / Productive Land
Ratio
Forest or Uncultivated
Land (ha) Total
Land (ha) Coffee Land /
Total Land Ratio
Lak 40 1.00 3.37 4.37 0.03 4.40 0.99 0.09 4.49 0.97
Nong Louang 1.33 3.08 4.42 0.00 4.42 1.00 0.00 4.42 1.00
Phoumako 1.41 1.95 3.36 0.07 3.44 0.98 0.00 3.44 0.98
Phou Oye 2.22 2.94 5.17 0.06 5.22 0.99 0.75 5.97 0.87
Phanoundong 0.45 2.48 2.94 0.13 3.07 0.96 1.15 4.22 0.70
Houey Touey 1.06 1.55 2.61 0.15 2.76 0.95 0.75 3.51 0.74
Thatsamek 1.56 1.50 3.06 0.10 3.16 0.97 0.69 3.85 0.80
Nong Soung 0.40 0.97 1.37 1.29 2.65 0.51 1.04 3.70 0.37
Kapeu 1.64 2.98 4.62 0.17 4.79 0.96 1.08 5.87 0.79
Phoudin On 2.35 5.29 7.64 0.20 7.84 0.97 0.18 8.01 0.95
Mean of Means 1.22 2.67 3.89 0.25 4.13 0.94 0.63 4.76 0.82
73
Labor and Income
Labor and income data indicate that an average of 6 persons reside in each coffee
household. On average, approximately 3 of the persons residing in each household
actively contribute their labor to the farming activities of the household, meaning that
about half of the household members are available as agricultural workers. For each
hectare of productive coffee land, approximately 0.84 (~1) persons contribute to the
cultivation, maintenance, and harvest of that land. This ratio is slightly lower (0.79) when
looking at the number of agricultural workers in each household in relation to the total
number of productive hectares owned by that household.
Based on the household data reported for the 2008 harvest season, and using 2008
currency values , income for sampled households range from approximately ₭6.7 million
(~$780)49 in Ban Houey Touey to approximately ₭30.5 million (~$3,550)50 in Ban Phou
Oye. Average household income for sampled households in all villages is approximately
₭19 million (~$2,220). Income variability between villages is attributable partially to the
location of each household in relation to the road, and therefore market, network.
Villages located along major (paved) roads have better market access; these villages are
generally more exposed to and oriented toward coffee trading circuits in the Bolaven
Plateau region and beyond. Household labor and income data are summarized in Table 5.
Coffee, Credit, Debt
It has been established that coffee production is a central feature of smallholder
livelihoods in the Bolaven Plateau region. Credit and debt are also major elements of Lao
49 Or about $2.15/day ($785/year) for the entire household, which, in this particular village (Ban Thatsamek) averages about 6.73 people per household, or $0.32/person/day. 50 Or about $9.75/day ($3560/year) for the entire household, which, in this particular village (Ban Phou Oye) averages about 5.28 people per household, or $1.85/person/day.

74
Table 5: Household labor availability and income for Bolaven Plateau smallholder villages. Source: Primary data collected during author’s fieldwork.
Mean of 10-Village Sample of Bolaven Plateau Households (n=192)
Village (Ban) People in Household
Workers in Household
Worker/People Ratio
Worker / Coffee Land Ratio
Worker / Productive Land Ratio
Worker / Total Land Ratio
Income (2008
Harvest, LAK)
Income (2008
Harvest, USD)51
Lak 40 6.06 3.50 0.58 0.80 0.80 0.78 24,823,529₭ $2,894
Nong Louang 5.53 2.87 0.52 0.65 0.65 0.65 13,000,000₭ $1,516
Phoumako 6.27 3.91 0.62 1.16 1.14 1.14 14,181,818₭ $1,653
Phou Oye 5.28 3.11 0.59 0.60 0.60 0.52 30,527,778₭ $3,559
Phanoundong 6.54 3.04 0.46 1.03 0.99 0.72 13,571,429₭ $1,582
Houey Touey 6.73 2.80 0.42 1.07 1.01 0.80 6,733,333₭ $785
Thatsamek 6.00 3.38 0.56 1.10 1.07 0.88 9,625,000₭ $1,122
Nong Soung 4.96 3.04 0.61 2.23 1.15 0.82 14,416,667₭ $1,681
Kapeu 7.32 3.64 0.50 0.79 0.76 0.62 23,900,000₭ $2,786
Phoudin On 6.43 3.64 0.57 0.48 0.46 0.45 29,285,714₭ $3,414
Mean of Means 6.13 3.28 0.54 0.84 0.79 0.69 19,041,667₭ $2,219
51 The conversion of mean household income for the 2008 harvest from LAK to USD is based on historical currency exchange rates between January 1, 2008 and December 31, 2008. The average daily currency bid (sell) rate for USD/LAK during this period was: 8,577.41 (OANDA 2012).
75
coffee smallholder life (Duris et al. 2002, Thawaensimphet et al. 2003, Galindo & Sallée
2007, Tulet 2009).
Typology of Smallholder Loans
Bolaven Plateau smallholders have access to four main types of loans, classified
by creditor type:
formal loans from public institutions,
informal loans from private traders,
informal loans from family members, and
formal loans from private institutions.
One of the most fundamental features of this typology is that the predominance of
each creditor type has evolved over time: formal public loans were most prevalent in the
mid- and late-1990s; since the early-2000s, informal trader loans have become dominant,
and strikingly so; informal family loans began in the late-1990s, and have been steadily
increasing since then; formal private loans are a relatively new phenomenon and have
started to become common in the region only since the late-2000s. These four loan types
are presented in this order, and some of the reasons for this temporality explained.
Formal Loans from Public Institutions
Formal loans from public institutions refer primarily to loans issued by the
Agriculture Promotion Bank.52 The APB was established in Laos in 1993 as “a state-
owned policy bank, and has since been considered as the country development bank,
focusing on the agricultural sector. [. . .] APB is the main public instrument in rural
finance” (APB 2011). The Pakxong district branch opened in 1995.
52 In this work, formal loans from public institutions can also refer to loans issued by the Lao Development Bank, and Lao-Vietnamese Government Cooperation Bank.

76
Image 17: A Lao smallholder farmer presents his Agriculture Promotion Bank loan booklet. Many smallholder households possess such blue loan booklets documenting the details of their debt with the public bank. Source: Photograph by author, March 20, 2009.
Periods of heightened APB lending are documented for 1995, markedly so for
1998/1999, and for 2003 (Figure 13). The first two of these periods – 1995 and
1998/1999 – correspond roughly to fund disbursements as part of the rural credit
component of the World Bank’s Upland Agriculture Development Project: a tranche of
$200,000 was disbursed in November 1994, and another of $681,000 was disbursed in
January/February 1996. Proceeds from these two disbursements were used for sub-loans
to farmer groups in the Bolaven Plateau region provinces of Champasak, Salavan, and
Xekong (WB 1998). These funds were injected into the Lao coffee chain through a multi-
faceted lending scheme executed through the various district-level APB branches,
particularly that in Pakxong. The World Bank also reported the ‘demonstration effect’ its
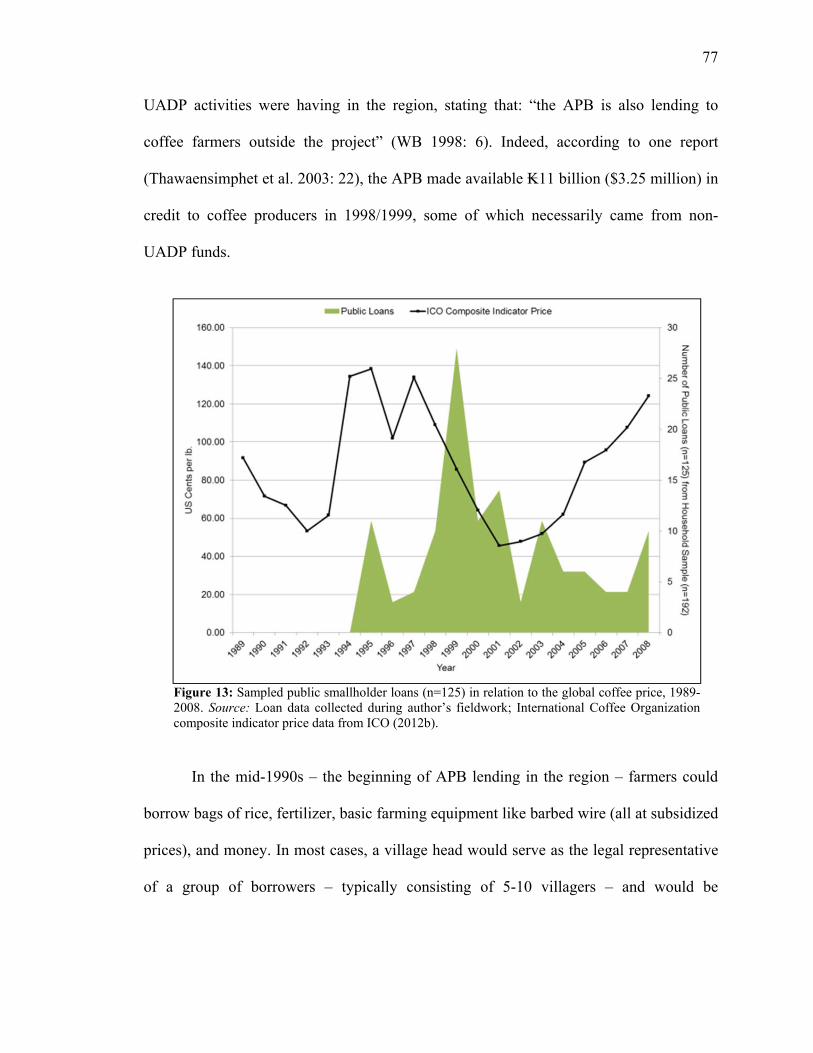
77
UADP activities were having in the region, stating that: “the APB is also lending to
coffee farmers outside the project” (WB 1998: 6). Indeed, according to one report
(Thawaensimphet et al. 2003: 22), the APB made available ₭11 billion ($3.25 million) in
credit to coffee producers in 1998/1999, some of which necessarily came from non-
UADP funds.
Figure 13: Sampled public smallholder loans (n=125) in relation to the global coffee price, 1989-2008. Source: Loan data collected during author’s fieldwork; International Coffee Organization composite indicator price data from ICO (2012b).
In the mid-1990s – the beginning of APB lending in the region – farmers could
borrow bags of rice, fertilizer, basic farming equipment like barbed wire (all at subsidized
prices), and money. In most cases, a village head would serve as the legal representative
of a group of borrowers – typically consisting of 5-10 villagers – and would be

78
responsible for assuring the bank that the represented villagers were credible borrowers.
No collateral was needed to enter into a loan with the bank during this early period.
Image 18: An extended Lao family displays an account booklet and several receipts for payments made on APB-issued loans. Source: Photograph by author, February 6, 2009.
Based on 125 public loans53 sampled from the comprehensive debt histories of
192 households, interest rates for public loans range from 6.50-39.00% per year (0.54-
3.30% per month). The average rate is 1.52% per month. These rates fluctuated
significantly during the period represented by the data, with rates being the highest in
1997, the same year coffee prices spiked (Figure 14).
53 These 125 public loans include 12 from the Lao Development Bank and one (1) from the Lao-Vietnamese Government Cooperation Bank. The other 112 came from the Agriculture Promotion Bank.

79
Controversial Interest Rates at the Agriculture Promotion Bank
A large number of Bolaven farmers who have borrowed from the bank claimed
that it charged an interest rate of 30% per year (2.5% per month) for its early loans. This
claim is common among interviewed farmers. They produced APB-issued account
booklets detailing the terms, conditions, balances, and payments of their loans with the
bank (see, e.g., Image 17, Image 18, and Image 19).
Figure 14: Average monthly interest rate of sampled public smallholder loans (n=125). Source: Loan data collected during author’s fieldwork; International Coffee Organization composite indicator price data from ICO (2012b).
During an interview with the manager of the Pakxong APB, he dismissed the
farmers’ claims as simply untrue. Upon further questioning, though, and after insisting
that I had seen many villagers’ loan booklets with 30% rates, he modified his position.
He explained that the rate of 30% was imposed only on those borrowers who were

80
actively engaged in trading activities. 54 When I correspondingly inquired about the
numerous claims by farmers that they had received rates of 14-30% per year from the
APB, the manager clarified:
The Agricultural Promotion Bank separates interest rates based on the types of activities for which the monies are used. . . . Rates of 30, 26, and 22 – which are very rare – apply only to traders and people in the service sector. Rates of 14, 12, and lower apply to farmers.
Image 19: Account booklet for Agriculture Promotion Bank public loan. Note the 30% interest rate for the ₭10.5 million loan. To maintain the borrower’s anonymity, information such as the dates and amounts of payments are concealed. Source: Photograph by author, February 9, 2009.
Complaints Against and Alleged Malpractice at the Agriculture Promotion Bank
Many farmers claim to have had bad experiences with the APB. For instance, one
farmer from Ban Lak 40 complained that he had been pressured by an APB official to
take a loan with the bank. He claimed that, although he did in fact need the money, he
54 Thawaensimphet et al. (2003: 11) confirm that the prior APB loan rate for “unharvested coffee” was indeed 30%. Their report also suggests that a rate of 30% no longer applies to producers borrowing against unharvested coffee, but rather only to “trade-related activities”.

81
was initially very reluctant to borrow from the bank because he feared he would be
unable to pay the interest. However, upon listening to the exhortations of a bank official –
who insisted that the price of coffee (which at the time was relatively high) would either
remain high or increase – he felt more comfortable to borrow from the bank. He went on
to say:
The way the bank works is not fair. When I took out the loan, the price of coffee was much higher, but now the price of coffee has dropped and it is more difficult to repay the loan. I thought they [the APB officials] knew more than me; I trusted them.
During the boom in coffee prices, it seems the APB provided many coffee growers with
highly optimistic market forecasts, despite the notorious volatility in the world market
price for coffee.
Image 20: The Pakxong branch Agriculture Promotion Bank. Source: Photograph by author, March 17, 2009.

82
Others complain about nepotism in the APB and how access to the bank’s credit
options is limited only to those who have friends or relatives working in the bank. A
woman from Ban Phou Oye protested:
You must know somebody in the bank in order to get a loan. It is very hard to get a loan if you do not know anybody in the bank. When the people from the bank come to get money from us [the village borrowers], then you should invite them into your home to come drink lao lao [rice whisky] and eat food. You should be very friendly with them so they can help you. They can make it easy for you [to get a loan].
Another farmer (who for the previous nine years had borrowed from a trader just as many
times) echoed this sentiment when he responded to my question about why he had never
tried to borrow from the APB: “I don’t know how to borrow from the APB. And I don’t
know anyone from the APB who can help me.” Another common smallholder complaint
against the APB is the claim that the bank employs extremely misleading and/or
complicated contracts and terms.
Agriculture Promotion Bank Restructuring and Retroactive Debt Collection
The most common complaint about the APB’s practices center on the bank’s
recently reformed debt collection policies. A 2009 interview with the branch manager of
the Pakxong district APB corroborates the implication made by many farmers that the
APB’s collection tactics had recently become more draconian. Because the vast majority,
if not all, early loans were made without collateral, the APB had no real enforcement
mechanism or bargaining power to ensure that borrowers repaid. Bank officials claim the
bank sustained severe financial losses as the number of defaulted loans began to grow.
Indeed, the APB itself reports that:
In 2002, a diagnostic study that included the first external audit of APB found that 88% of APB [loans] were non-performing. The bad financial situation resulted from a lack of profit orientation, poor lending

83
mechanisms, and weak provisioning. APB entered in 2003 in a formal phase of restructuring, including phasing out of policy and subsidised lending, adoption of market-based principles, improvement of lending policies, recapitalisation and strengthening of information systems and management capabilities (APB 2011).
According to the APB Pakxong branch manager, around 2007/2008, in
compliance with the instruction and authorization of the Central Bank of Laos and
provincial and district officials, the APB began a campaign to recuperate its losses by
proclaiming and asserting its authority to induce repayment by confiscating their property
titles. Many allege that APB officials would enter the villages and threaten families with
taking away their houses, land, vehicles, or some combination thereof. As of the first
quarter of 2009, this strategy has supposedly been successful. The Pakxong branch APB
manager claimed that the more aggressive collection policy has motivated the borrowers
of defaulted loans to finally begin to pay-off, or finish paying-off, their bad debts. He
went on to state that as of early 2009, approximately 70% of defaulted loans had now
been collected because of the new policy.
This claim is supported by borrowers on the other end of the new collection
policy too, but not in the same positive way. One farmer in Ban Lak 40 who had
borrowed from the APB in 1995, and failed to repay on time, grumbled:
When I first borrowed [from the APB], it was easy; they made it easy. But now they’ve made it so difficult because they come and put pressure on us by taking land titles. Now, in 2009, they take land titles for loans from 1995! . . . If they really want to help people, they mustn’t take such high collateral from us.
Sharing his own perspective on borrowing from the APB in the late-2000s, a farmer from
Ban Nong Louang commented: “It’s now difficult to borrow from the bank [APB]. We
must have collateral, but we are poor and don’t have enough.”

84
Image 21: An agent of the Agriculture Promotion Bank comes to collect a loan payment from a smallholder borrower. Source: Photograph by author, February 9, 2009.
Nearly all villagers who had ever borrowed from the APB were asked whether
they thought the public bank works – as it was created to work – for the benefit of the
people. The response of one rather indignant producer from Ban Lak 40 was:
They [the APB and its officials] say they want to help people but the way they ‘help’ us is by getting money from us. They don’t help people; they eat people!
Another producer from Ban Phoumako echoed the same sentiment (with a bit less
hyperbole): “The bank doesn’t help people for free. The bank helps people by first
helping itself.”
Thus, while the new collection policy may have been successful at collecting old
debt, it has been detrimental in its fostering of antagonism between the producers – in
whose interest the APB is intended to work – and the bank itself. While not all

85
respondents were uniform in their discontent with the bank’s policies and practices, there
is undoubtedly an overall trend of anti-APB sentiment among the majority of interviewed
coffee farmers.
Informal Loans from Private Traders
Between the months of January and March, when farmers are busy selling their
harvested coffee to various collectors and traders, there is generally no fear of immediate
financial insecurity. During this time, farmers earn highly anticipated cash payments for
the coffee they were able to produce and sell; this is when coffee-growing families earn
the overwhelming majority of their annual household incomes. As the year progresses,
though, the cash earned from the harvest disappears as it is gradually exchanged
primarily for food (rice), and secondarily school supplies and medicine. What results is a
“rice-gap period” coinciding with the end of the rainy season, from June to September
(Galindo & Sallée 2007: 48). Informal loans from traders are usually taken during these
months. Some farmers also borrow from traders in the months immediately preceding the
harvests, even as late as November, only after they have been able to properly evaluate
the anticipated size of their respective harvests, and are confident of their ability to repay
the amount borrowed.
I don’t want to borrow money. Who wants to borrow money? But if there’s no food, and if I can’t look for work because I’m too busy working my own land, what can I do? I must borrow from the traders (Interviewed Lao coffee smallholder, February 2009).
As explained by Galindo and Sallée (Galindo & Sallée 2007: 69), farmers often
sell ‘green coffee’55 (referring to the fact that the cherries are still green and growing on
55 In Lao language, ‘café khiaw’ (Galindo & Sallée 2007: 69).

86
the trees when the transaction is made) in return for cash as a pre-harvest loan. These pre-
harvest loans are executed in two main ways:
(1) farmers borrow money at an interest rate set by the trader/lender, and
“[t]here is a tacit agreement that farmers will sell most of their coffee
to the lender” (Galindo & Sallée 2007: 70).
(2) farmers borrow money and agree to repay in coffee (not with money),
at a pre-set price determined by the trader/lender. “The price is always
set below the market price at the moment of the selling (in most cases
it is half the market price)” (Galindo & Sallée 2007: 70).
When asked, most producers who actively borrow money every year say that they
strongly prefer entering into informal loan arrangements with traders than into formal
loans with the public APB. This is despite the extortionate interest rates imposed by
traders, which are significantly higher than those of the APB. Among the 289 trader loans
sampled from the 192 households, the average interest rate is 111.12% per year (9.26%
per month)56 (Figure 16).
Advantages to Borrowing from Traders
For most families, securing a loan from a trader is the fastest and simplest route to
securing the funds needed to pay for food and cover other critical domestic needs.
Typically no contract is signed, no collateral is required 57 , and no permission or
authorization from the village head is obtained. Perhaps the most important factor that
56 Comparably exorbitant rates have been confirmed in other sources too: “[N]early all small-scale producers can only access the informal loan sources, which usually have an [annual] interest rate of at least 100 percent” (Thawaensimphet et al. 2003: 24). “[F]armers can either reimburse in money (actually they reimburse while selling coffee, at market’s price and with monthly interest rates ranging from 15 to 25%) or in coffee, with no interest rate but with a selling price which is about half the average market price” (Sallée 2007) 57 Although, Galindo and Sallée (Galindo & Sallée 2007: 70) report that “[I]n some cases it happens that the buyer takes livestock or farmer’s assets (motorbike, etc.) as a guarantee.

87
makes traders a more preferred source of credit is their role as coffee collectors. Most
producers do not own the means of transportation necessary to independently move their
coffee out of their respective villages to access buyers (wholesalers and exporters).58
Because traders possess an appropriately large vehicle, they are typically the ones
responsible for transporting coffee to the nearest district capitals of Pakxong, Laognam,
or Thateng, or to Pakxe. Traders buy/collect other farmers’ bagged coffee and then sell
the aggregated loads to higher level traders (wholesalers) in one of these market centers,
or directly to an export company. Traders are thus essential in supporting the livelihoods
of farmers not solely because of their lending activities, but because they offer producers
an outlet through which to sell their coffee. They act as that critical link in the commodity
chain which moves coffee from growers to merchants. Moreover, producers borrow from
traders/collectors who often live in the same or a nearby village, so there is often a
preexisting, personal relationship between borrowers and lenders. “The collectors know
the farmers well and have longstanding links with the wholesalers and exporters for
whom they work” (Duris et al. 2002: 71).
Traders also offer producers an unmatched degree of expediency when providing
cash payment for coffee. When asked about his rationale for not selling to a producers’
group (at a much higher price per unit of coffee), one farmer from Ban Phoumako
responded:
This year I sold to a trader because I did not produce a lot [of high quality coffee], and I can get money much faster by selling to a trader. I know the price isn’t good, but if I sell to the [producers’] group, it will take such a long time [to receive payment]. I have to sell to the trader to get money quickly and buy medicine for my family.

88
The fact that those same traders offer reliable sources of loan monies provides a sense of
short-term security for farmers who, without access to such loans, struggle to pay for
basic necessities, especially during the off-harvest season. Additionally, not only can
traders offer cash payment for coffee quickly, but they can also provide cash for loans
just as quickly. In times of a medical emergency, or even for the sake of holding
important social functions (e.g., weddings), producers are dependent on fast cash from
traders. Farmers’ desperation to pay for domestic expenses and, more often than not,
maintain good informal credit leaves them willing to accept prices below those to which
an alternative, more lucrative strand of the Lao coffee commodity chain would otherwise
entitle them.
Figure 15: Sampled public loans (n=289) in relation to the global coffee price, 1989-2008. Source: Loan data collected during author’s fieldwork; International Coffee Organization composite indicator price data from ICO (2012b).

89
Figure 16: Average monthly interest rate of sampled trader loans (n=289). Source: Loan data collected during author’s fieldwork; International Coffee Organization composite indicator price data from ICO (2012b).
Almost all of those farmers interviewed said that this was their least preferred method of
repayment, but the only one at their disposal. As Galindo and Sallée (2007: 48)
summarize: “Thanks to credit, wholesalers have a certain security on coffee supply.
Loans are granted based on the trust between the wholesaler and the producer. This is
why their good knowledge of farmers is a key aspect.”
Loans from Family
The underlying prerequisite for borrowing from family members is that they have
available funds to offer to as loans in the first place, which is indeed quite rare. Informal
loans taken out with family members carry the least regular/systematic terms and
conditions. When such loans are taken out with family member, the terms of borrowing
are unpredictable, and typically not as altruistic as one might expect, considering the

90
source. Oftentimes, family members charge interest for the loans they grant, typically less
than, but sometimes rivaling, the rates offered by traders (Figure 18).
Figure 17: Sampled family loans (n=89) in relation to the global coffee price, 1989-2008. Source: Loan data collected during author’s fieldwork; International Coffee Organization composite indicator price data from ICO (2012b).
Loans from Private Institutions
A new type of loan source is expanding in Laos: formal loans from private
commercial banking institutions. During a visit to Ban Phoudin On, a group of about 10
men were gathered together in the home of the village head. Each individual in the group
was copying a hand-written contract template which each needed to personalize and
submit in order to apply for a loan from the just-opened Phongsavanh Bank in Pakxe
(Image 22).
As reported by the men in the group, Phongsavanh Bank had, prior to its grand
opening, sent representatives throughout various villages to distribute flyers promoting its

91
Figure 18: Average monthly interest rate of sampled family loans (n=89). Source: Loan data collected during author’s fieldwork; International Coffee Organization composite indicator price data from ICO (2012b)
new loan programs. The flyers highlighted the bank’s comparatively low interest rates of
15% per year. The farmers – most of whom still have outstanding debt with the APB
from the mid- and late-1990s, and most of whom have regularly borrowed from traders in
the preceding several years – expressed excitement about the bank’s advertised interest
rates. When compared with the lowest rates offered by trader loans (5-8% per month), the
prospect of private bank loans at 1.25% per month is enticing. Among the 192
households interviewed, none had ever taken out a formal loan with a private commercial
entity; hence, no quantitative data were collected on these types of loans.
As Lao PDR becomes increasingly engaged with the capitalist economy –
with all of the new legal and financial systems needed to facilitate market-based
transactions – a corresponding investment in the financial services sector will
inevitably follow. One would expect, then, that an increase in the number of

92
Image 22: Phongsavanh Bank, a private commercial bank in Pakxe. This photograph was taken shortly after the bank’s grand opening. Source: Photograph by author, March 26, 2009.
private commercial banking institutions will give way to greater competition amongst
such firms, thereby increasing the range of credit options available to smallholder coffee
farmers in the Bolaven Plateau region (and throughout the entire country more generally).
The current and future impacts of smallholder credit provision by private institutions in
the Bolaven Plateau (and in Laos as a whole) warrant further examination.
The Evolution of Smallholder Credit Sources
As illustrated by Figure 18, the market for credit – both formal and informal – is
expanding in the Bolaven Plateau region. The share of formal loans being taken out with
the Agriculture Promotion Bank and other public institutions has decreased since 2002
However, the proportion of informal loans granted by traders has increased exponentially

93
Figure 19: Quantity and type of all documented smallholder loans (n=503) in relation to the global coffee price, 1989-2008. Source: Loan data collected during author’s fieldwork; International Coffee Organization composite indicator price data from ICO (2012b). since 2002 as well. Loans brokered by coffee traders/collectors are overwhelmingly
dominant. Money lent by family members has also been on the rise since the late-1990s.
Informal Credit Substituting for Formal Credit
As described above, the greatest concentration of public loans from the
Agriculture Promotion Bank were issued in the mid- and late-1990s, corresponding with
the rural credit component of the World Bank’s Upland Agriculture Development
Project. According to the World Bank, the UADP was cancelled because “the AP[B]'s[59]
operations [were] constrained by its limited power to mobilize funds and its lack of
authority to set its interest rates” (WB 1998: 32). The APB’s mid- to late-2000s
59 There was an obvious typo in the World Bank’s 1998 Implementation Completion Report for the UADP, which, in this particular instance, erroneously abbreviated the Agriculture Promotion Bank as ‘APM’.

94
restructuring of its operations toward a more private-sector-based banking model suggest
that this may have indeed been the case. For whatever reason, it is clear that the rural
credit component of the UADP, as well as the APB’s non-UADP operations in the late-
1990s and early-2000s were generally unsuccessful for the bank. Perhaps the most
detrimental failure of the APB, though, was its fostering of antipathy and distrust among
the rural populations it is intended to serve.
Smallholder Credit and the Global Coffee Crisis
Also depicted by Figure 18 is the discernible relationship between the market for
smallholder credit in the Bolaven Plateau region and the global price for coffee. Simple
bivariate Pearson correlations were run in Statistical Package for Social Science (SPSS)
software to quantify the strength of this relationship. Significant positive correlations
were found between the ICO composite indicator price and the quantity of trader loans
(.868), family loans (.780), and total loans (.914) reflecting 1999-2008 (Table 6). These
correlations are slightly stronger from 2000-2008 (Table 7).60
Table 6: Correlations between the quantity of smallholder loans by loan type and the ICO composite indicator price, 1999-2008. Shaded correlations indicate significance at the 0.01 level (two-tailed).
60 Identical correlations were run for all preceding years represented in the loan/debt dataset (whose earliest loan observation was in 1989). However, only from 1998 forward were any significant correlations found. Correlations run with data for 1998-2008 found only trader loans (.669) and total loans (.692) as being statistically significant (at the 0.05 significance level) with the ICO composite indicator price.
Public Loans
Trader Loans
Family Loans
Total Loans
ICO Composite Indicator Price -.048 .868 .780
.914
Significance Level (Two-Tailed) .895 .001 .008 .000

95
Table 7: Correlations between the quantity of smallholder loans by loan type and the ICO composite indicator price, 2000-2008. Shaded correlations indicate significance at the 0.01 level (two-tailed).
Public Loans
Trader Loans
Family Loans
Total Loans
ICO Composite Indicator Price -.286 .961 .902
.944
Significance Level (Two-Tailed) .455 .000 .001 .000
These correlations indicate that a relationship – although an admittedly non-causal
relationship – exists between the global coffee crisis and its recession and its recession,
and the expansion of the smallholder credit market in the Bolaven Plateau region. Of the
three loan types for which quantitative data were collected – (1) formal formal loans from
public institutions, (2) informal loans from private traders, (3) and informal loans from
family members) – this relationship is strongest for informal loans brokered by traders.
These data suggest a particular evolution of smallholder credit in the Bolaven
Plateau region. Concurrent with and immediately following the introduction of rural
credit to the region via the Upland Agriculture Development Project, the Agriculture
Promotion Bank was the primary source of smallholder credit in the region. As the global
coffee crisis hit and farmers began to default on their APB loans – effectively losing their
access to formal sources of credit – they began to rely on alternative credit sources.
Recognizing the potential profitability of the newly established smallholder credit market,
Lao coffee exporters began to inject their own capital into the sector, enjoining coffee
traders to not only buy and collect coffee on their behalf, but to broker loans on their
behalf too. Even family members began to lend to each other. Smallholder credit has thus
evolved to be a central feature of life in the Bolaven Plateau region.

96
Labor-Capital Relations of the Bolaven Plateau Region
These data also suggest the operation of a class-based, patron-client dynamic
operating in the Bolaven Plateau region. The Lao coffee chain elite, exporters, gain their
capital through their oligopolistic dominance over the Lao coffee commodity, and
thereby control the early stages of the Lao coffee commodity chain. Exporters
systematically use this capital to underwrite loans brokered and administered by traders
to producers. In this way, exporters ensure regular control over annual coffee supplies for
export and maintain their relative prosperity as the main value-capturing agents in the
Figure 20: Labor-capital relations of the Bolaven Plateau region. Source: Author.
pre-export stages of the chain. Through this dynamic, exporters serve as patrons to their
client traders. These traders, in turn, serve as patrons to their client producers. These
exploitative labor-capital relations keep smallholder coffee producers in the Bolaven
Plateau region entangled in a web of coffee, credit, and debt.

97
CHAPTER V SOCIO-ECOLOGICAL DYNAMICS OF THE BOLAVEN PLATEAU REGION
This chapter examines the dynamics among the human actors producing the productive
base of the Lao coffee commodity chain, and the resource space from which that
commodity base is produced. A land-use/land-cover change analysis for the Bolaven
Plateau measures the extent and pattern of landscape change in the region over the last 20
years or so, coinciding with the neo-liberalization of the Lao state and recent expansion
of the Lao coffee chain. This analysis reveals the sustained conversion of forested lands
to accommodate expanded agricultural activities, attributable most to smallholder coffee
production. This analysis also highlights the establishment in the region of new
commodity chains. These chains correspond to new land-use configurations in the
resource space which pose challenges to, and conflict with, the historically dominant
smallholder coffee land-use system in the region.
Geospatial Methods and Data
Satellite Imagery
Sets of remotely sensed satellite imagery were acquired from three different
instruments: Landsat Thematic Mapper (TM), Enhanced Thematic Mapper Plus (ETM+),
and Advanced Spaceborne Thermal Emission and Reflection Radiometer (ASTER). Four
scenes of Landsat TM data; four scenes of Landsat ETM+ data; and six scenes of ASTER
data were collected. The Landsat TM and ETM+ scenes were gathered from the United
States Geological Survey (USGS) Earth Resources Observation Science (EROS) center;
the ASTER scenes from the National Aeronautics and Space Administration (NASA)
Land Processes Distributed Active Archive Center (LPDAAC). All data were acquired
after having already been geo-rectified by their respective distributors. The spatial

98
resolution for the TM, ETM+, and ASTER images is 28.5 m, 30 m, and 15 m,
respectively. All raw images were gathered in the World Geographic System (WGS)
1984 datum and subsequently projected to Universal Transverse Mercator (UTM) Zone
48N. Some of this information is summarized in Table 8.
Table 8: Satellite imagery data used in the analysis. PERIOD
REPRESENTED ACQUISITION
DATE INSTRUMENT PATH / ROW SPATIAL
RESOLUTION SOURCE
late-1980s (~1989)
1989-02-17 Landsat TM 125 / 049 28.5 m USGS EROS 1989-01-08 Landsat TM 125 / 050 28.5 m USGS EROS 1989-12-25 Landsat TM 126 / 049 28.5 m USGS EROS 1989-12-25 Landsat TM 126 / 050 28.5 m USGS EROS
early-2000s (~2001)
2000-11-25 Landsat ETM+ 125 / 049 30 m USGS EROS 2002-02-13 Landsat ETM+ 125 / 050 30 m USGS EROS 2000-11-29 Landsat ETM+ 126 / 049 30 m USGS EROS 2000-12-31 Landsat ETM+ 126 / 050 30 m USGS EROS
mid-/late-2000s (~2008)
2007-01-26 ASTER VNIR - 15 m NASA LPDAAC 2007-01-10 ASTER VNIR - 15 m NASA LPDAAC 2007-01-10 ASTER VNIR - 15 m NASA LPDAAC 2009-01-22 ASTER VNIR - 15 m NASA LPDAAC 2009-12-01 ASTER VNIR - 15 m NASA LPDAAC 2010-02-10 ASTER VNIR - 15 m NASA LPDAAC
Image Temporality
These image data correspond to the late-1980s, early-2000s, and late-2000s,
respectively, representing the Bolaven Plateau region over approximately 19 years. The
temporality of these first two observations – late 1980s, early-2000s – is intended to
correspond to environmental conditions in the region towards the end of the period of
socialist experimentation and agricultural collectivization (~1975-1988), and the end of
the initial phase of post-socialist transition and market liberalization (~1988-2000), as
described in Chapter II. The temporality of the last observation – late-2000s – is intended
to correspond to contemporary environmental conditions in the Bolaven Plateau region,
as described in Chapter III.
Study Area
The spatial extent of the study area for this analysis was set by visualizing the
maximum area covered by all three observations of satellite imagery, while ensuring that

99
the primary coffee producing areas in the Bolaven Plateau region – i.e., the districts of
Pakxong (Champasak province), Laognam (Salavan province), and Thateng (Xekong
province) were included in the area of interest/investigation (AOI) (Map 6). The total
area of the AOI is 963,876 ha (9638.76 sq. km).
Image Processing
Image Compositing
For the eight TM and ETM+ scenes, false color composite images were generated
using Idrisi (versions Andes and Taiga) geographic information system (GIS) software.
The false color images were generated by compositing Landsat spectral band 2 (green,
0.52-0.60 µm); band 3 (red, 0.63-0.69 µm), band 4 (near infrared (NIR), 0.76- 0.90 µm)
into the blue, green, and red image bands, respectively, using Idrisi’s image compositing
module. False color composites were also generated for the six ASTER scenes. Following
initial difficulties importing and handling the ASTER data in Idrisi, the ArcGIS (version
10.0) GIS software platform was used for all ASTER image processing procedures. Band
1 (green, 0.52-0.60 µm), band 2 (red, 0.63-0.69 µm), and band 3n61 (0.76-0.86 µm) from
the ASTER Visible and Near Infrared (VNIR) subsystem62 were composited together into
the blue, green, and red image bands, respectively. This was done using ArcGIS’s
composite bands tool. The Landsat and ASTER false color composites were used to
guide the digitization of vector geometry polygons. The polygons served as training sites
61 ASTER VNIR is the ‘nadir’ near infrared band, as opposed to ASTER VNIR band 3b, which is the ‘backward’ near infrared band. 62 ASTER collects data from 14 channels of the electromagnetic spectrum through three instrument sub-systems. The first sub-system (VNIR) covers the visible and near-infrared region of the spectrum; the second sub-system (SWIR) covers the short-wave region; the third (TIR) covers the thermal infrared region (Jensen 2007).

100
to sample raster pixels and guide the extraction of spectral signatures from the satellite
imagery.
Image Mosaicking
Each set of scenes associated with each of the three time-points was then
mosaicked. It is generally discouraged to classify mosaicked imagery. If the individual
images within a mosaic were acquired during different dates and times (as were the
imagery in question), it is generally preferable to classify each image separately, and then
subsequently mosaic the classified images 63 . However, due to extremely poor and
inconsistent results when attempting (over multiple iterations) to classify individual
images prior to mosaicking, it was decided to classify the images subsequent to
mosaicking. The Landsat imagery were mosaicked with the image mosaicking module in
Idrisi; the ASTER imagery with the mosaic to new raster tool in ArcGIS. In all cases, the
chosen mosaic overlap method was that which reduced or eliminated any portion of the
images containing cloud cover.
Extracting Spectral Signatures
Supervised, maximum-likelihood classification was performed on the image
mosaics. Groups of pixels from each image mosaic were sampled to serve as training
sites on which the spectral signatures guiding the maximum-likelihood classifications
would be based. Pixel sampling was guided partially, and when appropriate, by a dataset
of 209 waypoints collected in situ with a hand-held global positioning system (GPS) unit;
63 “Care must be taken when classifying a mosaicked image. If the separate images were acquired at different times, then it may be necessary to develop training sites for some landcovers for each time. For example, if you mosaic a May image and a July image, the signatures for a deciduous forest type might be quite different. You might treat each as a separate class, then collapse the classes after classification. Alternatively, you might classify each image, then mosaic the classified images” (Idrisi 2011).

101
this fieldwork was conducted during the first three months of 2009, concurrent with the
ethnographic fieldwork (Map 6). Training sites were also developed using land-
use/land-cover data for the AOI from the Forest Inventory Planning Department (FIPD
2002), as well as on interpretation of publically-available imagery provided by
GoogleEarth.
Determination and Descriptive Resolution of Land-Use/Land-Cover Classes
The presence of coffee trees is notoriously difficult to detect from non-coffee
forest cover through remote sensing methods. As noted by Cordero-Sancho and Sader
(2007: 1578) “The spectral response of forest and coffee crops in the reflected waveband
region (<3.0 µm) can be similar, because both cover types consist of woody species of
variable density and structure”. Indeed, even after incorporating a coffee environmental
stratification model, Cordero-Sancho and Sader were able to achieve only 65% overall
accuracy in their effort to differentiate coffee from forest in Costa Rica – the best yet
reported in published research (Cordero-Sancho & Sader 2007).
Coffee grown on the Bolaven Plateau can be found thriving in many degrees of
forest cover. At one extreme end of the spectrum, one can find 30-foot coffee trees
growing among/within thick patches of secondary forest (yet still being harvested,
although perhaps with less consistency and obviously without proper maintenance). On
the other end of the spectrum, one can find 1-2-foot high coffee bushes recently planted
in large swathes of cleared land, without any cover whatsoever. These are the extremes; it
is common to encounter many intermediary manners of hybrid coffee-forest covers.
Coffee production in the Bolaven Plateau region (especially for Robusta coffee, which
occupies no less than 75% of all coffee surfaces in the region) is particularly difficult to

102
Map 6: Bolaven Plateau region geospatial study area and collected GPS waypoints. Source: Map by author.

103
differentiate from forest, as many Robusta trees grow within relatively thick-shaded
secondary forest.
In their study examining the relationship between land-use/land-cover change in
the Western Ghats coffee growing region of southern India and global coffee prices
during the global coffee crisis, Ambinakudige and Choi (2009) assert:
Differentiating [coffee and forest] was not problematic in our study for two reasons. First, an extensive field survey in the study area helped us to distinguish forest patches (small in areal coverage) from coffee patches. Second, the government has planted forests with mostly teak trees in the study area. Teak is clearly separated from coffee patches in Landsat images.
While field research was conducted for the present research, it was not sufficient to
confidently differentiate coffee from forest throughout the entire study area. Also, while
teak is grown along with coffee in some part of the Bolaven Plateau region – especially in
the western parts of the plateau, near Bachiang and Laognam districts – this is not
widespread.
Land-Use/Land-Cover Classes
In light of these limitations, it was decided to classify the images with land-
use/land-cover classes that are relatively descriptively coarse; that is, in aggregated
categories that subsume other, more specific uses or covers. The following eight (8)
classes were chosen:
(1) forest;
(2) agriculture;
(3) rice;
(4) built;
(5) barren;
(6) water;
(7) cloud;
(8) grassland.

104
The ‘cloud’ class is not an actual land-use/land-cover class; rather, it is a pseudo-class
created to account for minimal cloud presence in some of the imagery. The selection of
these eight classes was based partially on the land-use and land-cover classification
system for use with remote sensor data as outlined by Anderson et al. (1976: 14-15).
Training polygons were digitized over image pixels representing each of these eight land
classes. Once a sufficient number of pixels was sampled for each class, spectral
signatures were extracted from all available bands from each set of images. In Idrisi (for
the Landsat imagery), this was done with the signature extraction module; in ArcGIS (for
the ASTER imagery), this was done with the create signatures tool.
Maximum Likelihood Classification
Thirteen separate (and tedious) iterations of polygon digitizing and spectral
signature development were required to produce acceptable land-use/land-cover maps.
The classification method used was that of Gaussian maximum likelihood. As Lillesand
and Kiefer (1994: 554) explain, the Gaussian maximum likelihood classifier operates
under the assumption that the distribution of classes to which the training data (in this
case vector polygons) corresponds is normally distributed, hence the descriptor
‘Gaussian’.64
Maximum likelihood classifications algorithmically compute the probability of a
particular image pixel belonging to a particular class. “After evaluating the probability
[of a pixel falling] in each category, the pixel would be assigned to the most likely class
(highest probability value) or be labeled ‘unknown’ if the probability values are all below
64 The term ‘Gaussian’, used to refer to normal statistical distributions, is derived from the German mathematician Karl Friedrich Gauss, to whom the discovery of the statistical phenomenon of normal distribution is attributed.

105
a threshold set by the analyst” (Lillesand & Kiefer 1994: 555). An equal class
membership probability was allotted for each of the six categories, excluding no
proportion of pixels in the classification process. The operation was run in Idrisi Andes
using the maximum likelihood classification module, and in ArcGIS with the tool by the
same name. Song et al. (2001: 232) assert that atmospheric correction is unnecessary
when multi-date composite imagery is placed in a single dataset and classified as if it
were a single image – as was done in the present study. For this reason, no atmospheric
correction procedures were performed.
Land-Use/Land-Cover Maps
These procedures produced three land-use/land-cover maps, one for ~1989 (Map
7), one for ~2001 (Map 8), and one for ~2008 (Map 9). To the author’s knowledge, these
are the first satellite imagery-based land use/cover classifications ever performed
exclusively for the Bolaven Plateau region.
Regional Land-Use/Land-Cover Change
The classified raster images were inputted into the Idrisi land change modeler
module to examine land-use/land-cover changes in the Bolaven Plateau region over the
represented period. This module allows for the generation of descriptive statistics based
on various raster overlay scenarios. For this study, the most important overlay scenario
was that which informed the extent of land-use/land-cover change over the approximately
19 year period covered by the images (Figure 21).

106
Map 7: Landsat TM-based land-use/land-cover in the Bolaven Plateau region, ~1989. Source: Map by author.

107
Map 8: Landsat ETM+-based land-use/land-cover in the Bolaven Plateau region, ~2001. Source: Map by author.

108
Map 9: ASTER-based land-use/land-cover in the Bolaven Plateau region, ~2008. Source: Map by author.

109
Figure 21: Change in the total area of land-use/land-cover, ~1989-2008.
Figure 21 reveals, among other landscape changes, a sustained conversion of
forested to agricultural lands. From ~1989 to ~2001, forested lands were reduced by
17.01%; from ~2001 to ~2008, they were reduced an additional 11.64%; if we look at the
change in land-use/-cover maps from ~1989 to ~2008, we find the loss of forest to
agricultural lands to be 24.49%. The majority of forest conversions are due to the
expansion of agriculture in the Bolaven Plateau region during the period analyzed. The
most dominant crop cultivated above 500 masl in the agriculture class is coffee.
However, some of the conversion of forest and other lands has been brought about by
other, incipient commodity chains in the resource space.

110
Image 23: A Lao youth manages fire to expand his family’s cultivable coffee area. Source: Photograph by author, February 3, 2009.
Image 24: Smoke towers in the distance from a managed fire as young coffee plantings grow in a new coffee plantation. Source: Photograph by author, February 8, 2009.

111
A Shifting Resource Space
The exploitation of the Bolaven Plateau resource space has recently begun to go
far beyond smallholder coffee production (Tulet 2009). Relatively new and historically-
geographically unprecedented commodity chains are being established in the region. The
introduction and/or aggressively expanded commodity networks correspond to new land-
use configurations in the region as a resource space. The most notable65, and socio-
environmentally transformative, types of commodity chains include:
Image 25: The author surveys a large swath of newly burned forest on the Bolaven Plateau. The landscape of the Bolaven Plateau region is extremely dynamic. Source: Photograph by Soukdavanh Bouadaphom, March 09, 2009.
65 Other important economic activities changing the socio-ecological configuration of the region include factory-based primary product processing (e.g., of coffee, rubber, and bauxite/alumina), ecotourism, and logging / timber extraction.

112
industrial (large-scale, plantation-style) agriculture,
hydroelectric power generation via dams, and
bauxite mineral extraction.
Image 26: The author surveys a swath of newly burned secondary forest / scrubland on the Bolaven Plateau. The regional landscape of the Bolaven Plateau is changing rapidly. Source: Photograph by Soukdavanh Bouadaphom, March 25, 2009.
Industrial Agriculture
Industrial Coffee Production
Large-area industrial agriculture plantations are increasingly being established in
the Bolaven Plateau region. Formerly, there was only one such large-area industrial
plantation in the region, that belonging to the largest coffee exporting company in the
country, Dao Heuang, located about 20 kilometers west of Pakxong on the major national
road (route 16-A). Now, however, there are a growing number of Vietnamese and

113
Singaporean coffee plantations in the region. Notable among the companies establishing
these coffee plantations is the Dak Lak Rubber Company, named after Vietnam’s Dak
Lak province, the principal coffee-growing province in the country’s Central Highlands.
Image 27: Sign outside the Dak Lak Rubber Company’s offices in Pakxe. Source: Photograph by author, March 17, 2009.
A 2009 interview conducted with an official from Dak Lak Rubber Co. at the
company’s Pakxe offices, the official indicated that there were approximately 250
hectares of coffee already planted on the plateau, and that the company intended to
expand its coffee holdings to about 500 total hectares, or possibly more, in the near
future. Dak Lak Rubber Co.’s coffee holdings are just one example of the growing
Vietnamese control over the resource space of the Bolaven Plateau. The Dak Lak coffee
plantations are additionally noteworthy because their establishment required the
acquisition of land that was either productive (i.e., with coffee trees actively maintained
and harvested) or semi-productive (i.e., with coffee growing under thick canopies of

114
secondary forest and irregularly maintained and harvested). Dak Lak Rubber Co.
appropriated these productive and semi-productive coffee lands from the residents of the
nearby smallholder coffee communities through official (i.e., government authorized)
means, resulting in mixed socioeconomic outcomes for the former Lao small-area land
owners.
Image 28: One-year-old coffee plantings grow in direct sunlight in the Dak Lak Co. coffee plantation. Source: Photograph by author, February 8, 2009.
Another noteworthy Vietnamese plantation was recently established in the central
part of the plateau. This coffee plantation, owned by the Vietnamese company Tin Nghia,
is located directly adjacent to those owned by the powerful Dao Heuang company.
Industrial Rubber Production
Along the lower elevations surrounding the plateau are a growing number of
rubber plantations, especially in Bachiang district, in the northeast corner of the region.

115
The company responsible for vast majority of rubber plantations in Bachiang is the Viet-
Lao Rubber Joint Stock Company (VLRJSC).
While actively establishing coffee plantations, Dak Lak Rubber Co. is, as its name
indicates, engaged primarily in developing rubber plantations, also mainly in Bachiang
district. The Dak Lak official interviewed confirmed that the company had by early 2009
established 7,500 ha of rubber. Notwithstanding the rubber holdings by Dak Lak, the
sheer expanse of rubber plantations in Bachiang owned by VLRJSC is nothing short of
remarkable (Image 29). Rows upon rows of rubber trees extend for distances far too
great to be captured from any single vantage point on the ground. Some of the
environmental impacts of the VLRJSC rubber plantations in Bachiang district include:
the loss of wildlife habitats (including aquatic and riparian habitats), intensified soil
Image 29: A plantation of rubber trees stretches far beyond what the eye can see. Source: Photograph by author, February 16, 2009.

116
erosion, increased stream and river sedimentation, possible water contamination by
chemical fertilizers, and amplified waste management issues in the affected villages.
Some of the social impacts of the these rubber plantations include significant loss of land
tenure and overall access to land, the loss of the subsistence- and revenue-generating
resources formerly available on those lost lands (e.g., non-timber forest products, fish,
etc.), the influx of external (i.e., non-local) wage laborers, and inadequate compensation
by VLRJSC for usurped lands. These environmental and social impacts are elaborated in
Obein (2007).
Hydropower Dams
Multiple hydropower dams have been built, or are planned for upcoming
construction, in the Bolaven Plateau region as well. One prominent example is the Houay
Ho dam, completed in 1998. This particular dam redirects water from the Houay Ho
stream and diverts it to the Xekong River. The overall project consists of a 150 megawatt,
76-meter-high dam and an approximately 35 sq km reservoir (Image 30). The reservoir is
conspicuous in the land-use/land-cover classification map for ~2001; it is absent in the
~1998 map. Following previous research on this dam’s transformation of socio-
environmental systems on the Bolaven Plateau region (IRN 1999a, Sayboualaven 2003,
Khamin 2008b), some of the deleterious social impacts of this project have been
examined by Delang and Toro (2011).
Apart from the Houay Ho dam, there are at least two other existing dams in the
region: Xeset 1 and Xeset 2. There are also several other dams planned for the various
water circuits on which the region’s human and non-human (floral and faunal)

117
Image 30: A south-facing view of the Houay Ho dam reservoir. Source: Photograph by author, March 3, 2009.
communities depend. These include the Xeset 3, Houay Lamphan Gnai, Xekong 3,
Xekong 4, Xenamnoy, Xekatam (Khamin 2008a), and Xepian Xenamnoi (IRN 1999b),
among others.
Bauxite Mineral Extraction and Alumina Processing
The GoL has also granted multiple land concessions to primarily a slew of
international, primarily Chinese, investors for the sake of exploiting the region’s
confirmed and potential bauxite mineral reserves (LNA 2007, SARCO 2008, VT 2008a,
2009c). One specific corporation, Sino Australian Resources Company (SARCO) – a
joint venture between the China Nonferrous Metals International Mining Company

118
(CNMIM) and the Australian Ord River Resources Corporation66 – has led the push to
transform the socio-ecological configuration of the region toward the mining sector.
According to Ord River Executive Chairman, John Towner, “The Lao Bolaven Plateau
has the potential to be one of the biggest bauxite deposits in the world” (Ord 2006).
SARCO has been engaged in resource definition drilling on behalf of an acquired
bauxite tenement held by a solely Chinese corporation called Yuqida Mining Group, Ltd.
This particular mineral concession, referred to as the ‘Yuqida 589’ tenement, is 589 sq
km in area. Moreover, the Yuqida site is only one of two already conceded tenements.
SARCO is also performing exploration and definition drilling on behalf of a Lao
corporation called Lao Service Incorporation Co., Ltd. in what is referred to as the ‘LSI
138’ tenement, (measuring 138 sq km, and consisting of two sub-tenements, ‘LSI-66’ and
‘LSI-72’).
To date, SARCO has mineral survey and exploration access to an already
contracted 727 sq km tenement area (589 sq km in the Yuqida tenement and 138 sq km in
the LSI tenement). Additionally, according to company statements made throughout
2008, the Chinese-Australian joint venture had an application for an additional 867 sq.
km area in its “final stages of approval” (Ord 2008b, 2008c). A May 2008 company
document asserted that SARCO was pursuing yet another 555 sq. km mineral concession
in the Bolaven Plateau region (Ord 2008b: 5). If the two additional tenement areas
(measuring 867 sq. km and 555 sq. km) are conceded to SARCO, the company will
control a mineral concession area totaling approximately 2,150 sq. km. The geomorphic
Bolaven Plateau proper – i.e., the relatively flat surface of the tableland – is
66 CNMIM holds a 51% share in SARCO; Ord River Resources holds a 49% share (Ord 2011, 2012b).

119
approximately 3,750-4,000 sq. km. 67 Thus, if the GoL concedes to SARCO these
additionally requested tenements, the company will have effective resource rights to a
space no less than 50% of the size of the plateau proper. Importantly, this figure excludes
any other existing or planned mineral concessions by other bauxite/alumina prospecting
companies operating in the region.
With regard to the 589 sq. km Yuqida tenement in particular, one finds that
between April and May of 2008, the areal demarcation of the tenement was altered and
expanded. The depiction of the Yuqida area in an April 2008 SARCO map (Map 10) is
Map 10: SARCO mineral tenements in Laos (April 2008). Note the red oval added by the author; it highlights the difference in the areal demarcation of the Yuqida tenement as depicted in this map and that depicted in Map 11. Source: (Ord 2008d).
67 If we delineate the Bolaven Plateau region as that area greater than 500 masl (i.e., the area used primarily for coffee cultivation), the region is approximately 4,800 sq. km.

120
Map 11: Laos Project SARCO Tenements (December 2008). Note the red oval added by the author; it highlights the difference in the areal demarcation of the Yuqida tenement as depicted in this map and that depicted in Map 10. Source: (Ord 2008a).
more irregularly shaped, ostensibly to reduce the encroachment onto smallholder coffee
lands in the central Bolaven Plateau region (or perhaps to the reduce the appearance of
such encroachment). However, in subsequent SARCO maps depicting the Yuqida
tenement in, e.g., May 2008 and December 2008 (Map 11), the tenement is larger, and
more clearly highlights the encroachment of the concession into lands actively cultivated
by Lao smallholder coffee farmers. Indeed, in a May 2008 presentation reporting some of
the progress made by SARCO on its Bolaven Plateau bauxite project, the company
acknowledged openly that: “Agriculture areas were found to cover most of the Yuqida
tenement with small areas of forest still left” (Ord 2008e).

121
Recognizing the imminent land-use conflicts between the emergent
bauxite/alumina commodity chain and the established coffee commodity chain, an
official with another bauxite/alumina investment company, the Lao Service Corporation
(LSC), was quoted as saying (VT 2008b):
We are happy to compensate for any losses in accordance with the current effective laws and regulations of Laos, such as investment promotion, mining and environment laws.
An employee from yet another company prospecting for bauxite/alumina in the Bolaven
Plateau region, the Sino-Lao Aluminium Corporation Limited (SLACO), acknowledged
that his company was planning to spend US$2-3 million to relocate families to
accommodate bauxite mining (VT 2008a).
According to an estimate made by SARCO, the company’s total estimated bauxite
resource on the Bolaven Plateau (i.e., in all its concession holdings) was 130 million tons
in December 2008 (Ord 2008f). This estimate was increased to 226 million tons in April
2012 (Ord 2012a). It is important to make note of these figures because, according to one
Vientiane Times article, once 300 million tons of bauxite is estimated to exist, SARCO
will gain the authority to initiate feasibility studies for a full-scale alumina refinery to be
built in the southeast of the Bolaven Plateau region, in Sanamxai district, in Attapeu
province (VT 2008c).
As depicted in Map 12, the existing and proposed mineral concessions are
predominantly in the southern and southeastern parts of the Bolaven Plateau. The new
tenement SARCO is hoping to acquire will be the first making significant leeway into the
northeastern part of the plateau. While most of the Bolaven Plateau region resource space
is dominated by smallholder coffee production (save for the region’s southeast), the

122
Map 12: The Bolaven Plateau region resource space: coffee, mines, and dams. Note: not all Lao villages in the Bolaven Plateau region are represented in this map; e.g., only 50 of the 53 AGPC villages are represented. Source: Map by author.

123
incipient land-uses associated with industrial agriculture, hydroelectric power, and
mineral extraction are beginning to fragment and reduce land-uses associated with
smallholder production. Regarding the most ominous of these new chains, that for
bauxite mineral extraction and alumina processing, an anonymous official from the Lao
Coffee Association was quoted in a recent Vientiane Times article (VT 2012a) as saying:
Land officials conducted a survey and discovered that the proposed bauxite mine would encroach onto about half of the land that is currently under coffee cultivation. [. . .] If the government does not limit the size of the area to be mined, I think about half of the coffee plantations will disappear.
A simple geographic reality underlies all commodity chains rooted in, or taking
root, in the Bolaven Plateau region: space is limited. Stated more precisely: resource
space is limited.

124
CHAPTER VI CONCLUSION
The historical-geographical trajectory of the Lao coffee commodity chain has
produced a particular set of reflexive socio-economic and socio-ecological relations in
the Bolaven Plateau region, the productive base of the chain. The rural credit component
of the World Bank’s Upland Agriculture Development Project was pivotal in
transforming regional socio-economic dynamics by introducing smallholder credit
mechanisms to the region. Growth in the smallholder credit market in the region was
found to be positively correlated to the global coffee price. As prices for coffee in the
global marketplace began their steady ascent, so too did the various forms of formal and
informal lending systems.
Despite the expansion of the Lao coffee chain brought about through on-going
liberalization and corresponding investment inflow, a fundamentally antagonistic set of
socio-political (power) relations between agents of capital (coffee exporters and their
trader intermediaries) and agents of labor (i.e., smallholder coffee farmers) came to
characterize the chain’s socio-economic base. Smallholder credit evolved to become one
of the critical mechanisms by which these antagonistic social relations have been
perpetuated.
While upward socio-economic mobility for some smallholders in the region does
exist, it often comes only through acting as clients on behalf of exporting patrons and
locking their fellow smallholders into an exploitative cycle of coffee, credit, and debt.
Smallholder coffee producers’ access to markets has become inextricably linked to the
execution of pre-harvest extension loans brokered by traders with the financial capital of
exporters.

125
Opportunities for upward mobility are thereby suppressed for the majority of Lao
coffee producers. These overlapping socio-economic/socio-political relations have thus
far undermined – yet not completely prevented – the development of a network for an
alternative, high-quality Lao coffee commodity. Foreign technical aid programs such as
PCADR-PAB and PRCC-II have striven to structure an alternative Lao coffee chain
toward the more lucrative markets for premium specialty and niche-market coffees,
which often carry value-adding certifications (e.g., Fair Trade, organic, shade grown,
etc.). Despite these endeavors, though, the Lao commodity chain has been structured
toward the markets for lower-quality coffees with essentially no unique geographic
identity. This is despite the fact that the Bolaven Plateau could, theoretically, produce
some of the best quality coffees in the world.
The lower-quality coffees that dominate the Lao coffee chain are produced by
smallholders compelled to produce greater quantities for the coffee-exporting oligopoly
whose market niche has been carved by focusing on lower quality products. As Galindo
and Sallée summarize (Galindo & Sallée 2007: 50):
The strategy of most Lao exporters consists in seeking a short term profit by selling coffee to the highest bidder. This has been possible thanks to an advantageous market frame, a sustained demand of this type of coffee in the international market, a quite permissive quality control system and very low transformation costs. The main consequence has been the setting up of a system that doesn’t reward coffee quality at all stages of coffee trade (from producer to exporter).
The common smallholder compulsion to produce greater quantities of coffees
rather than greater quality coffees is commonly attributable to producers’ desperation to
repay debts from previous years. In many instances, these debts were acquired originally

126
during the global coffee crisis, and have simply continued to be compounded year after
year.
While the low-quality/high-quantity market niche has proven to be relatively
lucrative for the coffee chain minority comprising the Lao coffee exporting elite, its
profitability is limited for the vast majority of the Lao coffee peasantry who toil at the
socio-ecological interface to bring the Lao coffee chain into existence. The socio-
economic relations of the Bolaven Plateau region thereby serve to perpetuate the status
quo of the Lao coffee chain within the broader global coffee network. Whether
intentional or not, Lao coffee exporters deny their coffee producing counterparts the
opportunity to pursue in earnest an alternative incarnation of the Lao coffee chain, one
which would bring enhanced socio-economic benefits to all involved actors.
Understanding the socio-economic/socio-political dynamics that characterize the
structure of the Lao coffee network is crucial to developing strategies to restructure the
network toward its full market potential.
As Dicken et al. (2001: 94) assert, though, “in addition to making points about
evolving power relations within networks, we must also acknowledge the power to
create, join or escape networks”. The analyses contained in the preceding chapters make
clear that in the case of the Lao coffee network, smallholder producers are limited by the
socio-economic structures embedded at the base of the chain to escape the fundamentally
exploitative status quo. The same class-based, client-patron dynamics denying producers
liberation from the status quo Lao coffee network are the same dynamics preventing the
creation of a more socio-economically equitable and socio-ecologically sustainable
alternative to that network.

127
All commodity chain networks are socio-spatially embedded throughout various,
increasingly globalized locales. Every commodity chain therefore effects real geographic
change in the places through which the industrial processes of the chain are carried out.
Identifying the socio-ecological transformations brought about by the Lao coffee
commodity chain – an agricultural (primary product) commodity network – is relatively
simple when compared to performing the same task for other, more synthetic and
industrially-processed chains (such as, say, those for telecommunications devices, which
entail the convergence of dozens of other constituent chains). Indeed, one need only look
directly at the resource space on which the Lao coffee chain is productively based in
order to discern how the socio-economic structure of the chain has impacted its socio-
ecological base.
The land-use/land-cover change analysis conducted for the Bolaven Plateau
region reveals the continued expansion of agricultural activities the Lao coffee
commodity chain’s primordial resource space. While the region is particularly fertile and
supports several different agricultural commodities, its exceedingly dominant land-use
has been configured to support smallholder coffee production. It is thus reasonable to
attribute the persistent conversion of forested to agriculture lands primarily to the land
management activities of smallholders coffee farmers. The sustained investment influx in
the Lao coffee sector and the increased viability of market-based channels for the
commercialization of Lao coffee over the last two decades has prompted smallholders to
attempt to capitalize on the increased profitability of their farming livelihoods. This has
resulted in the clearing of more forests and scrublands for coffee production.

128
One must not overlook, though, how the socio-economic dynamics embedded in
the Lao coffee chain condition the modes by which smallholder farmers interface with
their Bolaven Plateau resource space. For example, in a less usurious setting, one would
expect most Lao smallholders to invest their borrowed monies heavily in the purchase of
new, higher quality coffee seedlings, the expansion of coffee plots, the hiring of
additional seasonal laborers, etc. However, since many farmers regularly borrow money
to cover standard domestic expenses such as food, education, and medicine, the intensity
of agricultural expansion one might have otherwise expected to witness upon the
landscape has not occurred. Indeed, the most important interaction between the Bolaven
Plateau region’s coffee-based economy and its coffee-based ecology does not rest with
the way Lao coffee smallholders have radically altered regional environmental
conditions. Rather, it lies with the way Lao coffee smallholders have been unable to alter
their landscapes in ways that have brought security to their coffee smallholding way of
life. And, increasingly, this way of life is under threat by those wishing to exploit the
Bolaven Plateau region for its myriad other commodity chain potentialities.
Recently, as the Bolaven Plateau has been socio-spatially reconfigured to
accommodate new, non-smallholder coffee commodity chains, the prospects for moving
toward an alternative, more socio-ecologically just and sustainable Lao coffee chain seem
even more threatened. The class antagonism manifest in the Bolaven Plateau region has
thus far impeded the organization of a truly cohesive and united lobby representing all
actors in the Lao coffee chain. The newly established Lao National Coffee Council seems
to be the only body capable of organizing the producers, the true foundation of the chain,
to play a more active role in the future of their coffee commodity network, the future of

129
their coffee resource space. However, the CNCL is a politically fragile institution subject
to the hostility of those members of the Lao Coffee Association reluctant to relinquish
oligopolic control over the Lao coffee commodity chain. Only by unfettering the Lao
smallholder producers from their current socio-economic chains can a truly holistic Lao
coffee community be built. And only through such a community can the Lao coffee
commodity network be structured in such a way as to produce a socio-ecology in the
Bolaven Plateau region capable of supporting a truly vibrant Lao coffee commodity
chain. For, ultimately, the geographic configuration of the Bolaven Plateau region
constrains the potentialities of the Lao coffee commodity chain, while, reciprocally, the
structure of the chain constrains the lands and livelihoods of those bound to it.

130
REFERENCES & DATA
Coffee Leaf Rust. Farming: Maintaining. Coffee: All Ground Up! http://www.allgroundup.com/en/terms.html.
Ambinakudige, S. & J. Choi (2009) Global Coffee Market Influence on Land-Use and Land-Cover Change in the Western Ghats of India. Land Degradation & Development, 20, 327-335.
Anderson, J. R., E. E. Hardy, J. T. Roach & R. E. Witmer. 1976. A Land Use and Land Cover Classification System for Use with Remote Sensor Data. United States Geological Survey.
APB. 2011. About Us: Apb History. Agriculture Promotion Bank. http://apb.com.la/show.php?id=2.
Baird, I. 2012. Personal E-Mail Correspondence. 15 February.
BBC. 2001. Laos: 'Most-Heavily Bombed Place'. BBC News. 5 January. ed. S. Ingram.
BBC. 2002. Laos' Fresh Coffee Hopes. BBC News. 29 March. ed. S. Ingram. Paksong, Laos. http://news.bbc.co.uk/2/hi/asia-pacific/1900686.stm.
Boungnavong, K. & B. Chounthavong. 2001. The Coffee Industry of Lao and Prospects for a Speciality/Organic Coffee Industry. The First Asian Regional Round-Table on Sustainable, Organic and Speciality Coffee Production, Processing and Marketing. eds. K. Chapman & S. Subhadrabandhu. Chiang Mai, Thailand. http://www.fao.org/docrep/003/x6938e/x6938e05.htm#bm5.6.
Brady, B. 2011. In Laos, a Campaign to Resurrect Great Coffee. TIME. 11 September. The Bolaven Plateau: TIME Magazine. http://www.time.com/time/world/article/0,8599,2091782,00.html.
Bunker, S. G. (1984) Modes of Extraction, Unequal Exchange, and the Progressive Underdevelopment of an Extreme Periphery: The Brazilian Amazon, 1600-1980. American Journal of Sociology, 89, 1017-1064.
Cordero-Sancho, S. & S. A. Sader (2007) Spectral Analysis and Classification Accuracy of Coffee Crops Using Landsat and a Topographic-Environmental Model. International Journal of Remote Sensing, 28, 1577-1593.
Daviron, B. & S. Ponte. 2005. The Coffee Paradox: Global Markets, Commodity Trade and the Elusive Promise of Development. London: Zed Books Ltd.
Delang, C. O. & M. Toro (2011) Hydropower-Induced Displacement and Resettlement in the Lao Pdr. South East Asia Research, 19, 567-594.

131
Dicken, P., P. F. Kelly, K. Olds & H. W.-C. Yeung (2001) Chains and Networks, Territories and Scales: Towards a Relational Framework for Analysing the Global Economy. Global Networks, 1, 89-112.
Doutriaux, S., C. Geisler & G. Shively (2008) Competing for Coffee Space: Development-Induced Displacement in the Central Highlands of Vietnam. Rural Sociology, 73, 528-554.
Duris, D., P. Bonnal & A. Pilecki. 2002. The Coffee Commodity Chain in Laos, and Farmer Strategies. Recherche et caféiculture. 60-74. Montpellier: CIRAD-CP. http://www.cirad.fr/en/pdf/art-laos.pdf.
Epprecht, M., N. Minot, R. Dewina, P. Messerli & A. Heinimann. 2008. The Geography of Poverty and Inequality in the Lao Pdr. Swiss National Centre of Competence in Research (NCCR) North-South, Geographica Bernensia, and International Food Policy Research Institute (IFPRI).
Evans, G. 1991. Planning Problems in Peripheral Socialism: The Case of Laos. In Laos: Beyond the Revolution, eds. J. J. Zasloff & L. Unger, 84-132. Hong Kong: MacMillan.
Evans, G. 2002. A Short History of Laos: The Land in Between. Crows Nest, Australia: Allen & Unwin.
FIPD. 2002. Fipd Land Cover 2002 (Shapefile). UXO NRA.
Forster, S. 2010. Geography Professor Hired to Study Hmong and Other Southeast Asian Uplands Groups. University of Wisconsin-Madison News. 3 March. Madison, WI: Board of Regents of teh University of Wisconsin System. http://www.news.wisc.edu/17761.
Fortunel, F. (2007) Le Plateau Des Boloven Et La Culture De Café, Entre Division Interne Et Intégration Régionale. L'Espace Geographique, 3, 215-228.
Galindo, J. & B. Sallée. 2007. Participative Analysis of Coffee Supply Chain in Lao Pdr. November. Groupe de Travail Café (GTC).
Gellert, P. K. (2005) For a Sociology of 'Socionature': Ontology and the Commodity-Based Approach. Rural Sociology and Development, 10, 65-91.
Gereffi, G. & M. Korzeniewicz. 1994. Commodity Chains and Global Capitalism. Westport, CT: Praeger Publishers.
Gereffi, G., M. Korzeniewicz & R. P. Korzeniewicz. 1994. Introduction: Global Commodity Chains. In Commodity Chains and Global Capitalism, eds. G. Gereffi & M. Korzeniewicz, 1-14. Westport, CT: Praeger Publishers.

132
Gerrefi, G. 1994. The Organization of Buyer-Driven Global Commodity Chains: How U.S. Retailers Shape Overseas Production Networks. In Commodity Chains and Global Capitalism, eds. G. Gereffi & M. Korzeniewicz, 95-122. Westport, CT: Praeger Publishers.
Grant, R. 2000. The Economic Geography of Global Trade. In A Companion to Economic Geography, eds. E. Sheppard & T. J. Barnes, 411-431. Malden, MA: Blackwell.
Hopkins, T. K. & I. Wallerstein (1977) Patterns of Development of the Modern World-System. Review, 1, 111-145.
Hopkins, T. K. & I. Wallerstein (1986) Commodity Chains in the World-Economy Prior to 1800. Review, 10, 157-170.
Hopkins, T. K. & I. Wallerstein. 1994. Commodity Chains in the Capitalist World-Economy Prior to 1800: "Commodity Chains: Construct and Research" and "Conclusions About Commodity Chains". In Commodity Chains and Global Capitalism, eds. G. Gereffi & M. Korzeniewicz, 17-20 and 48-50. Westport, CT: Praeger.
ICO. 2012a. About Coffee: Botanical Aspects. http://www.ico.org/botanical.asp.
ICO. 2012b. Historical Price Data, 1980-2011. International Coffee Organization.
ICO. 2012c. About Statistics. International Coffee Organization. http://www.ico.org/about_statistics.asp.
Idrisi. 2011. Idrisi Taiga Mosaic Module Help
IRN. 1999a. Power Struggle: The Impacts of Hydro-Development in Laos. Berkeley: International Rivers Network.
IRN. 1999b. Xe Pian - Xe Namnoi Hydropower Project. In Power Struggle: The Impacts of Hydro-Development in Laos. International Rivers Network
Jensen, J. R. 2007. Remote Sensing of the Environment: An Earth Resource Perspective. Upper Saddle River, NJ: Pearson Prentice Hall.
Jhai. 2008. A History of Lao Coffee. Jhai Coffee Farmers Co-op. http://jhaicafe.com/historyoflaocoffee.html.
Khamin, N. 2008a. Case Study Ten: Xekatam Hydropower Project. Power Surge: The Impacts of Rapid Dam Development in Laos. 76-70. Berkeley: International Rivers.

133
Khamin, N. 2008b. Case Study Nine: Houay Ho Hydropower Project. Power Surge: The Impacts of Rapid Dam Development in Laos. 73-75. Berkeley: International Rivers.
LCA. 2008. Lao Coffee Association Member List. Pakxe: Lao Coffee Association.
LCA. 2009. Exports of Lao Coffee, 2002-2008. Pakxe: Lao Coffee Association.
Leslie, D. & S. Reimer (1999) Spatializing Commodity Chains. Progress in Human Geography, 23, 401-420.
Lillesand, T. & R. Kiefer. 1994. Remote Sensing and Image Interpretation. Toronto: John Wiley and Sons.
LMI. 2008. The Lao Coffee Story. Lao Mountain, Inc. http://laomountain.com/laocoffeehistory.html.
LNA. 2007. Biggest Bauxite Mine under Feasibility in Southern Laos. 21 February. Laos News Agency (KPL).
Mann, G. (2009) Should Political Ecology Be Marxist? A Case for Gramsci's Historical Materialism. Geoforum, 40, 335-344.
MOF. 1991. Upland Agriculture Development Project (Ida Credit 2079--La [Letter to the World Bank from Mr. Khamphoui Keoboualapha on Behalf of the Lao Pdr Ministry of Economy, Planning, and Finance]. 18 October. The World Bank. http://www.worldbank.org/projects/P004195/upland-agriculture-development-project?lang=en.
MRC. 2008. Existing, under Construction and Planned/Proposed Hydropower Projects in the Lower Mekong Basin, September 2008 [Draft 1:400,000 Map]. Mekong River Commission.
Neumann, R. P. (2009) Political Ecology: Theorizing Scale. Progress in Human Geography, 33, 398-406.
NSC. 2006. Statistical Yearbook: Production of Coffee. National Statistics Centre of the Lao PDR, Ministry of Agriculture and Forestry. http://www.nsc.gov.la/Statistics/Selected%20Statistics/Agriculture/Coffee.htm.
NSC. 2008. Village Gps Points, with Basic Socio-Economic and Socio-Demographic Attributes [Shapefile]. National Statistics Centre of the Lao PDR, Ministry of Agriculture and Forestry.
OANDA. 2012. Historical Currency Rates. OANDA Corporation. www.oanda.com/currency/historical-rates/.

134
Obein, F. 2007. Assessment of the Environment and Social Impacts Created by the Vlrc Industrial Rubber Plantation and Proposed Environmental and Social Plans. 6 May. Earth Systems Lao / Agence Française de Développement.
Ord. 2006. Australian Resource Company Pioneers a New Aluminum Industry in Laos. 23 October. Sydney: Ord River Resources. http://www.ord.com.au/ASX%20Announcements/Announcement%20-%20Laos%20Bolaven%20Plateau%20Bauxite%20Project.pdf.
Ord. 2008a. [Map Extracted from] 38% Increase to 130 Mt [Million Tons] of Bauxite in Total Indicated Resource Estimate for Bolaven Plateau Bauxite Exploration. 4 December. Sydney: Ord River Resources. http://www.ord.com.au/ASX%20Announcements/041208%20-%20Announcement%20of%2038%20percent%20Increase%20to%20130%20MT%20of%20Bauxite.pdf.
Ord. 2008b. Ord River Resources Limited Corporate Presentation. May. Sydney: Ord River Resources. http://www.ord.com.au/ASX%20Announcements/080507%20-%20Announcement%20-%20Coporate%20presentation%20to%20brokers%20and%20investors.pdf.
Ord. 2008c. Significant Steps in the Bolaven Plateau Bauxite Project in Laos. 13 March. Sydney: Ord River Resources. http://www.ord.com.au/ASX%20Announcements/130308%20-%20Announcement%20-%20Press%20Release%20re%20Bolaven%20Plateau%20Bauxite%20Project.pdf.
Ord. 2008d. Maiden Resource Statement for Ord Jv Company Sarco Bolaven Plateau Bauxite Exploration. 11 April. Sydney: Ord River Resources. http://www.ord.com.au/ASX%20Announcements/110408%20-%20Announcement%20-%20Maiden%20Resource%20Statement%20for%20ORD%20JV%20Company%20SARCO.pdf.
Ord. 2008e. Bolaven Bauxite Project Progress. 15 May. Sydney: Ord River Resources. http://www.ord.com.au/ASX%20Announcements/200508%20-%20Announcement%20-%20Bolaven%20Bauxite%20Project%20Progress.pdf.
Ord. 2008f. 38% Increase to 130 Mt [Million Tonnes] of Bauxite in Total Indicated Resource Estimate for Bolaven Plateau Bauxite Exploration. 4 December. Sydney: Ord River Resources. http://www.ord.com.au/ASX%20Announcements/041208%20-%20Announcement%20of%2038%20percent%20Increase%20to%20130%20MT%20of%20Bauxite.pdf.
Ord. 2011. Quarterly Activity Statement - September Quarter 2011. 31 October. Sydney. http://www.ord.com.au/ASX%20Announcements/2011/2011_10_31_Sep_ORD_Quarter_Activities.pdf.

135
Ord. 2012a. Upgrade of Jorc Resource to 226 Mt Including 69 Mt in Measured Category. 2 April. Sydney: Ord River Resources. http://www.ord.com.au/ASX%20Announcements/2012/2012_04_02_SARCO_JORC_Resource_Upgrade.pdf.
Ord. 2012b. Quarterly Activity Statement - March Quarter 2012. 30 April. Sydney. http://www.ord.com.au/ASX%20Announcements/2012/ORD_Qtly_Rpt_2012.03.31.pdf.
Osorio, N. 2002. The Global Coffee Crisis: A Threat to Sustainable Development. 21 August. London: International Coffee Organization. http://www.ico.org/documents/globalcrisise.pdf.
Oxfam. 2006. Dignity in a Coffee Cup. Oxfam News Magazine. Oxfam Australia. http://www.oxfam.org.au/oxfamnews/december_2006/dignity-in-a-coffee-cup.html.
Pedregal, V. D. 2008. Etude Socio-Economique Des Organisations De Productuers De Cafe Mises En Place Dans Le Cadre Du Pab-Pcadr: Propositions De Strategie Generale Et D'amelioration [Main Text in English]. 31 October.
Peet, R. 1998. Modern Geographical Thought. Malden, MA: Blackwell Publishers Inc.
Ponte, S. (2002) The 'Latte Revolution'? Regulation, Markets and Consumption in the Global Coffee Chain. World Development, 30, 1099-1122.
Rigg, J. & R. Jerndal. 1996. Plenty in the Context of Scarcity: Forest Management in Laos. In Environmental Change in South-East Asia, eds. M. J. G. Parnwell & R. L. Bryant, 145-162. London: Routledge.
Rindfuss, R. R., P. Prasartkul, S. J. Walsh, B. Entwisle, Y. Sawangdee & J. B. Vogler. 2003. Household-Parcel Linkages in Nang Rong, Thailand, Challenges of Large Samples. In People and the Environment: Approaches for Linking Household and Community Surveys to Remote Sensing and Gis, eds. J. Fox, R. R. Rindfuss, S. J. Walsh & V. Mishra, 131-172. Boston: Kluwer Academic Publishers.
Rindfuss, R. R., S. J. Walsh, V. Mishra, J. Fox & G. P. Dolcemascolo. 2003. Linking Household and Remotely Sensed Data: Methodological and Practical Problems. In People and the Environment: Approaches for Linking Household and Community Surveys to Remote Sensing and Gis, eds. J. Fox, R. R. Rindfuss, S. J. Walsh & V. Mishra, 1-30. Boston: Kluwer Academic Publishers.
Robbins, P. 2004. Political Ecology: A Critical Introduction. Malden, MA: Blackwell.
Robichaud, W., C. W. Marsh, S. Southammakoth & S. Khounthikoummane. 2001. Review of the National Protected Area System of Lao Pdr. Vientiane: Lao-Swedish Forestry Programme.

136
Sallée, B. 2007. Support Program on the Establishment of Geographical Indications in Laos: Feasibility Study on Bolovens Coffee. Ministry of Agriculture and Forestry Programme of Capitalisation in Support of Rural Development Policy (PCADR) Boloven Application Point (PAB).
SARCO. 2008. Bolaven Bauxite Project Progress to 15 May 2008.
Sayboualaven, P. 2003. Hydroelectric Dams and the Forgotten People of the Boloven Plateau (Unpublished Paper).
Saysana, V. 2011. Promoting Organic and Fair Trade Certification in the Lao Pdr Coffee Sector: Benefits and Challenges for Farmers and Local Economies [Master's Thesis]. Oklahoma State University.
Schüβler, L. (2009) Protecting 'Single-Origin Coffee' within the Global Coffee Market: The Role of Geographical Indications and Trademarks. The Estey Center Journal of International Law and Trade Policy, 10, 149-185.
Sibounheuang, V. 2011. Prcc Café Lao Ii [Swr Anr Presentation]. 14 November. Programme de Renforcement des Capacités Commerciales II.
Smith, D. A. 2005. Starting at the Beginning: Extractive Economies as the Unexamined Origins of Global Commodity Chains. In Nature, Raw Materials, and Political Economy, eds. P. Ciccanell, D. A. Smith & G. Seidman. New York: Elsevier.
Smith, D. A. & M. C. Mahutga. 2009. Trading up the Commodity Chain?: The Impact of Extractive and Labor-Intensive Manufacturing Trade on World-System Inequalities. In Frontiers of Commodity Chain Research, ed. J. Bair, 63-82. Stanford: Stanford University Press.
Song, C., C. E. Woodcock, K. C. Seto, M. P. Lenney & S. A. Macomber (2001) Classification and Change Detection Using Landsat Tm Data: When and How to Correct Atmospheric Effects? Remote Sensing of Environment, 75, 230-244.
Stuart-Fox, M. (1995) The French in Laos, 1887-1945. Modern Asian Studies, 29, 111-139.
Stuart-Fox, M. 1997. A History of Laos. New York: Cambridge University Press.
T&CA (2004) A Romance with Café Lao. Tea & Coffee Asia.
T&CTJ (2002) World News: Laos Exports Are Growing and Quality Is Up. Tea & Coffee Trade Journal, 176.
Talbot, J. M. 2004. Grounds for Agreement: The Political Economy of the Coffee Commodity Chain. Lanham: Rowman & Littlefield.

137
Talbot, J. M. 2009. The Comparative Advantages of Tropical Commodity Chain Analysis. In Frontiers of Commodity Chain Research, ed. J. Bair, 93-109. Stanford: Stanford University Press.
Thawaensimphet, l., P. Vongphasuk, S. Sidavong & B. Naphaivanh. 2003. A Study on Local Trading Systems and Their Effects on Coffee Prices in the Bolaven Plateau--Lao People's Democratic Republic. Vientiane: Oxfam-CAA and Oxfam America.
Topik, S. 2009. Historicizing Commodity Chains: Five Hundred Years of the Global Coffee Commodity Chain. In Frontiers of Commodity Chain Research, ed. J. Bair, 37-62. Stanford: Standford University Press.
Tulet, J.-C. 2009. Development Trends Analysis on the Boloven Plateau. Pakxe: Ministry of Agriculture and Forestry, Programme of Capitalisation in Support of Rural Development Policy (PCADR) Boloven Application Point (PAB), French Development Agency.
Turner, B. L. & P. Robbins (2008) Land-Change Science and Political Ecology: Similarities, Differences, and Implications for Sustainability Science. Annual Review of Environmental and Resources, 33, 295-316.
UNDP. 1991. The Economy of Laos: An Overview. In Laos: Beyond the Revolution, eds. J. J. Zasloff & L. Unger, 67-83. Hong Kong: MacMillan.
USDA. 2012. Production, Supply and Distribution Online. United States Department of Agriculture Foreign Agricultural Service. http://www.fas.usda.gov/psdonline/psdQuery.aspx.
UXO. 2008. The Unexploded Ordnance (Uxo) Problem. Lao National Unexploded Ordnance Programme. http://www.uxolao.org/uxo%20problem.html.
VT. 2007. Bolaven Families Fall through Development Gap. 22 December. Vientiane.
VT. 2008a. Bauxite to Be Mined in Southern Provinces. 7 July. Vientiane: Vientiane Times.
VT. 2008b. Investors Eye Bauxite Investment in Champassak. Vientiane Times. 18 April. Vientiane.
VT. 2008c. Work to Start on Attapeu Aluminum Processing Plants. 24 September. Vientiane: Vientiane Times.
VT. 2009a. Laos Prepares for World Coffee Membership. 12 August. Vientiane: Vietiane Times.
VT. 2009b. Bolaven Bauxite Mine Not to Affect Coffee Growers. 20 May. Vientiane.

138
VT. 2009c. Bauxite Developer to Build Processing Plant. 12 May. Vientiane: Vientiane Times.
VT. 2010a. Laos to Join World Coffee Organization. 20 January. Vientiane: Vientiane Times.
VT. 2010b. New Factory to Improve Quality of Lao Coffee. 6 May. Vientiane: Vientiane Times.
VT. 2010c. Lao Coffee Scaling New Heights. 08 April. Vientiane: Vientiane Times.
VT. 2012a. Bauxite Mine Poses Challenges for Bolaven Coffee Growers. 26 April. Vientiane: Vientiane Times.
VT. 2012b. Laos Brews up Improvements to Coffee Industry. 25 April. Vientiane: Vientiane Times.
Wallerstein, I. 2007. World-Systems Analysis: An Introduction. Durham, NC: Duke University Press.
WB. 1989. Staff Appraisal Report Lao People's Democratic Republic Upland Agriculture Development Project. 7 November. The World Bank. http://www.worldbank.org/projects/P004195/upland-agriculture-development-project?lang=en.
WB. 1992. Development Credit No. 2079 Upland Agriculture Development Project -- Amendment to Development Credit Agreement, Approval #1 [Letter to the Lao Pdr Ministry of Economy, Planning, and Finance] 22 January. The World Bank. http://www.worldbank.org/projects/P004195/upland-agriculture-development-project?lang=en.
WB. 1998. Implementation Completion Report Lao People's Democratic Republic Upland Agriculture Development Project (Credit 2079-La). 30 November. The World Bank. http://www.worldbank.org/projects/P004195/upland-agriculture-development-project?lang=en.
Winston, E., J. O. d. Laak, T. Marsh, H. Lempke & K. Chapman. 2005. Arabica Coffee Manual for Lao-Pdr. August. Bangkok: FAO Regional Office for Asia and the Pacific. http://www.fao.org/docrep/008/ae939e/ae939e00.htm#Contents.
Zasloff, J. J. 1991. Political Constraints on Development in Laos. In Laos: Beyond the Revolution, eds. J. J. Zasloff & L. Unger, 3-40. Hong Kong: MacMillan.
Zimmerer, K. S. & T. J. Bassett. 2003. Political Ecology: An Integrative Approach to Geography and Environment-Development Studies. New York: The Guilford Press.

139
APPENDICES
Map A1: Lao People’s Democratic Republic Upland Agriculture Development Project Plateau des Bolovens Region. Source: WB (1989: 101). Staff Appraisal Report Lao People's Democratic Republic Upland Agriculture Development Project. The World Bank.

140
Map A2: Lao People’s Democratic Republic Upland Agriculture Development Project. Source: WB (1989: 99). Staff Appraisal Report Lao People's Democratic Republic Upland Agriculture Development Project. The World Bank.

141
Map A3: Choropleth and cartogram of the quantity of coffee produced in 2008 in each Lao PDR province. Although they represent the same data, these two maps visualize those data in very different ways. The cartogram distorts the geometric representation of the provinces by adjusting their sizes proportionate to their respective values for the variable in question: quantity (tons) of coffee produced in 2008. Source: Maps by author; Lao PDR provincial coffee production data from NSC (2006).

142
Map A4: Destinations and value of Lao coffee exports in 2002. Source: Map by author; Lao PDR coffee export data provided by LCA (2009).

143
Map A5: Destinations and value of Lao coffee exports in 2003. Source: Map by author; Lao PDR coffee export data provided by LCA (2009).

144
Map A6: Destinations and value of Lao coffee exports in 2004. Source: Map by author; Lao PDR coffee export data provided by LCA (2009).

145
Map A7: Destinations and value of Lao coffee exports in 2005. Source: Map by author; Lao PDR coffee export data provided by LCA (2009).

146
Map A8: Destinations and value of Lao coffee exports in 2006. Source: Map by author; Lao PDR coffee export data provided by LCA (2009).

147
Map A9: Destinations and value of Lao coffee exports in 2007. Note the inclusion of Australia and New Zealand. Source: Map by author; Lao PDR coffee export data provided by LCA (2009).

148
Map A10: Hydropower site and mines area map 2008. Source: Unknown (plausibly from the Lao PDR Ministry of Mines and Dams).

149
Map A11: Bolaven Plateau region screenshot from hydropower site and mines area 2008. Source: Unknown (plausibly from the Lao PDR Ministry of Mines and Dams).

150
Map A12: Laos Project Yuqida Tenement Resource Areas & Exploration Target. Source: [Map extracted from] 38% Increase to 130 MT [million tons] of Bauxite in Total Indicated Resource Estimate for Bolaven Plateau Bauxite Exploration. 4 December. Sydney: Ord River Resources (Ord 2008a).

151
Map A13: Existing, under construction and planned/proposed hydropower projects in the Lower Mekong Basin, September 2008. Source: Mekong River Commission (MRC 2008).

Copyright © 2022 FDOKUMEN