Determinants of food insecurity among smallholder farmer ...
Upload
khangminh22Category
view
0download
0
ASSESSING SUSTAINABILITY OF SMALLHOLDER DAIRY AND
TRADITIONAL CATTLE MILK PRODUCTION SYSTEMS IN TANZANIA
CELESTIN MUNYANEZA
A THESIS SUBMITTED IN FULFILLMENT OF THE REQUIREMENTS FOR
THE DEGREE OF DOCTOR OF PHILOSOPHY OF SOKOINE UNIVERSITY OF
AGRICULTURE. MOROGORO, TANZANIA.
2018

ii
ABSTRACT
Sustainability of smallholder dairy and traditional cattle milk production systems in
developing countries, including Tanzania, is limited by a number of constraints such as
low cow productivity, shortage of feed, limited access to inputs and outputs markets and
degradation of natural resources. Efforts have been made to improve the sustainability, but
the improvement is hindered by lack of knowledge on how to ensure sustainability of the
production systems particularly at the farm level. To contribute to the efforts being made
to address these issues, this study aimed at assessing sustainability of smallholder dairy
and traditional cattle milk production systems in Tanzania. The study was conducted in
four districts located in Morogoro and Tanga Regions. In the context of this study, a
smallholder dairy production system refers to a system with dairy farms which have up to
five dairy cows, where majority are crossbreeds of local and pure exotic breeds and milk is
considered the main source of income. Meanwhile, a traditional cattle milk production
system consists of cattle farms keeping mainly indigenous cattle and milk is not
considered the main source of income.
The first step of the study involved identifying relevant indicators for assessing
sustainability of smallholder dairy as well as traditional cattle milk producing farms. The
systems were further categorised into Rural production to Rural consumption (R-to-R) and
Rural production to Urban consumption (R-to-U) systems. Whereby R-to-R refer to rural
farmers sold milk to rural consumers and R-to-U to rural producers predominantly selling
milk to urban consumers. A two-round Delphi approach involving 44 diverse experts and
stakeholders was used in identifying the sustainability indicators. The second step
involved developing a milk production farm sustainability assessment tool based on a set
of fifteen most relevant of the identified indicators. The indicators were selected from the

iii
previously identified indicators according to data availability and cost. The tool was used
to assess sustainability of 431 randomly selected farms in the study districts. The data
were collected through interview of the farmers using a pre-tested questionnaire
administered to the selected farms. Individual indicators of sustainability were measured,
normalized using mini-max approach, weighted using factor analysis and aggregated into
economic, social, environmental and overall sustainability indices using linear
aggregation. The sustainability performance indicator and index scores were ranked from
0 to 1 and grouped into three categories of sustainability indicator / index scores namely
weak (< 0.33), medium (0.33 ≤ and < 0.66) and high (≥ 0.66). Then, the sustainability
mean performance indicators and indices were compared between the R-to-R systems and
the R-to-U systems using a two-tailed Student’s t-test. The third step involved analysis of
the relationships between the farm and milk producers’ organisations (POs) sustainability
performances. The differences between farm sustainability mean performance indicators
and indices for PO-member farmers and non-PO-member farmers were analysed using a
two-tailed Student’s t-test. The sustainability of POs was assessed using an existing tool,
“Producers’ Organisation Sustainability Assessment tool (POSA)”, which is based on a set
of six economic and organizational dimensions. The relationships between farm and PO
sustainability performance indicators were established using Pearson correlation analysis.
The correlation coefficients (r) were categorized as weak (r < 0.3), moderate (0.3 ≤ r <
0.5) and strong (r ≥ 0. 5). Lastly, the study analysed the determinants of smallholder dairy
and traditional cattle milk production farm sustainability. Descriptive statistics were
analysed to understand the socio-economic characteristics of milk production farms. Then
the socio-economic characteristics were compared between R-to-R systems and R-to-U
systems using two-tailed Student’s t-test and chi-square for the means and proportions
respectively. The double censored Tobit regression model was applied to analyse the
determinants of farm sustainability.

iv
The Delphi technique refined an initial set of 57 indicators to a final set of 29 relevant
indicators. The relevant indicators included 18 economic, seven environmental and four
social indicators. Specifically, the key economic indicators were milk hygiene, cow
productivity, income per litre of milk and access to milk market. Social indicators included
participation in organizations, women’s empowerment and the education level of the farm
manager; while environmental indicators were water conservation and access to water.
Results from the farm sustainability assessment show that the economic mean score (0.27
± 0.20), social mean score (0.32 ± 0.27), environmental mean score (0.31 ± 0.22) and
overall mean score (0.30 ± 0.15) of farm sustainability indices were weak. The economic,
social and overall sustainability mean performance index scores were significantly higher
in the R-to-U systems than in the R-to-R systems (p < 0.05), implying better sustainability
of R-to-U systems than R-to-R systems. The overall farm sustainability mean performance
index, and its economic and social dimensions scores were significantly higher (p < 0.05)
in PO-member farmers than in non-PO-member farmers. The “access to dairy production
inputs and services” dimension of POs presented strong positive correlations with the
overall farm sustainability performance index and its economic dimension (r = 0.58 and
0.67 respectively; p < 0.01). Similarly, the “access to dairy production inputs and
services” of POs showed strong correlations (r = 0.70; p < 0.01) with cow productivity
performance indicator. The farmers in R-to-U systems had significantly (p < 0.05) smaller
land and herd size than in R-to-R system. Stall feeding system was the determinant factor
(β = 0.256; p < 0.01) of economic sustainability. The determinant factors for social
sustainability were stall feeding system (β = 0.165; p < 0.01), age of household head (β =
0.003; p < 0.05) and acquiring credit (β = 0.190; p < 0.01). The factor influencing
environmental sustainability was stall feeding system (β = 0.098; p < 0.01). The factors
influencing the overall sustainability were stall feeding system (β = 0.161; p < 0.01), the
age of the household head (β = 0.001; p < 0.01) and acquiring credit (β = 0.081; p < 0.01).

v
From the results of the study, it is concluded that a large number of existing indicators like
greenhouse gas emissions could be considered less relevant in the context of Tanzania’s
smallholder dairy and traditional cattle system than in other contexts. The study showed
that 29 out of 57 sustainability indicators assessed were relevant to the studied system. The
indicators identified here demonstrate the importance of matching any set of indicators to
the characteristics of the specific production system being examined. The study provided a
tool and framework for assessing sustainability of milk production farms in smallholder
dairy and traditional cattle milk production systems in Tanzania using a set of 15 most
relevant sustainability indicators out of the selected 29 indicators. The most relevant
economic indicators were milk hygiene and cow productivity; social indicators were
participation in organizations and women’s empowerment; environmental indicators were
access to water and water conservation. Regarding the level of sustainability of the milk
production farms, the results showed that the sustainability performances of smallholder
dairy and traditional cattle milk production farms in the selected districts were weak,
particularly in R-to-R system. Producers’ organisation sustainability performances,
particularly its provision of dairy inputs, have strong positive relationship with farm
sustainability performances, particularly the farm economic dimension. Indeed, stall
feeding and access to credit tend to improve farm sustainability.
From the results of the study, continued private and public investments in the non-
traditional dairy areas and promotion of market linkages to urban areas where milk
demand is stronger, is recommended not only for immediate improvement of livelihoods
but also for sustainability considerations. Indeed, intensive dairy systems should be
encouraged for higher sustainability of milk production and this could be possible by
improving access to inputs and embedded services. The developed framework can be used
by farmers, policy and decision makers to enable them identify key strengths and
weaknesses and make respective decision towards sustainable milk production during
implementation of dairy improvement programs.
vi
DECLARATION
I, CELESTIN MUNYANEZA, do hereby declare to the Senate of Sokoine University of
Agriculture that, this thesis is my own original work done within the period of registration
and that it has neither been submitted nor is being concurrently submitted for a degree
award in any other institution.
……………………………………… ………………………………
Celestin Munyaneza Date
(PhD. Candidate)
The above declaration is confirmed by:
……………………………………… ………………………………
Prof. Lusato R. Kurwijila Date
(1st supervisor)
……………………………………… ………………………………
Prof. Ntengua S.Y. Mdoe Date
(2nd supervisor)
……………………………………… ………………………………
Dr. Isabelle Baltenweck Date
(3rd supervisor)

vii
COPYRIGHT
No part of this thesis may be reproduced, stored in any retrieval system, or transmitted in
any form or by any means, without prior written permission of the author or Sokoine
University of Agriculture in that behalf.

viii
ACKNOWLEDGEMENTS
This thesis would not have been possible without active guidance and help of God and
several individuals who in one way or another contributed their valuable assistance in the
preparation and completion of this journey. It is a great pleasure to express my deepest
gratitude for their support.
I thank the International Livestock Research Institute (ILRI) and DAAD for funding this
study. ILRI thanks all donors and organizations who globally supported its work through
their contributions to the CGIAR system.
I wish to express my sincere appreciation to my main supervisor Prof. Lusato Kurwijila
for accepting to supervise this work, providing professional guidance and his availability
from the very early stage of this journey.
I also gratefully acknowledge Prof. Ntengua S.Y. Mdoe for supervising my work, his
encouragement, and valuable and constructive advice which led to the accomplishment of
the toughest tasks during my journey.
Many thanks to my ILRI supervisor Dr. Isabelle Baltenweck for her guidance and
thoroughly providing direction towards the accomplishment of this work.
I thank Dr. Edgar Twine for providing the milestone for this work and his valuable advice
towards excellency in this work. His involvement has triggered and nourished my
intellectual maturity that I will continue to benefit from, for a long time to come.

ix
I want to express my utmost gratitude to Prof. G., Mlay for his support which reshaped my
work.
Many thanks to Dr. N., Madala and Dr., S. H., Mbaga for their warm welcome and
assistance during my first days of stay at Sokoine University of Agriculture. I also thank
Prof. S.K., Mutayoba. Her active assistance will stay unforgettable.
The study has been participatory involving various experts and stakeholders. I thank the
Sokoine University of Agriculture academic staff, the livestock officers, NGO workers
and the farmers who provided valuable information which made the study possible.
I finally wish to acknowledge my Uncle Dr. M., Binyange, brothers and closest friend
Josiane Iragena for their valuable support which made this happen.
x
DEDICATION
This thesis is dedicated to my uncle incomparable Martin Binyange for his invaluable
support, my brothers Jean d’Amour Ngiramahoro and JMV Ngiramahirwe, and my best
friend Josiane Iragena for their support and encouragement during the study period.

xi
TABLE OF CONTENTS
ABSTRACT ........................................................................................................................ ii
DECLARATION ............................................................................................................... vi
COPYRIGHT ................................................................................................................... vii
ACKNOWLEDGEMENTS ............................................................................................ viii
DEDICATION ..................................................................................................................... x
TABLE OF CONTENTS .................................................................................................. xi
LIST OF TABLES ......................................................................................................... xvii
LIST OF FIGURES ........................................................................................................ xix
LIST OF APPENDICES ................................................................................................... xx
LIST OF ABBREVIATIONS AND SYMBOLS .......................................................... xxi
CHAPTER ONE .................................................................................................................. 1
1.0 INTRODUCTION ......................................................................................................... 1
1.1 Background of the Study ................................................................................................. 1
1.2 Problem Statement and Justification of the Research ..................................................... 5
1.3 Study Objectives ........................................................................................................... 10
1.3.1 Overall objectives ................................................................................................. 10
1.3.2 Specific objective ................................................................................................. 10
1.4 Research questions ........................................................................................................ 10
1.5 Research Hypothesis ..................................................................................................... 11
1.6 Organization of the Thesis ............................................................................................ 11
CHAPTER TWO ............................................................................................................... 12
2.0 LITERATURE REVIEW ........................................................................................... 12
2.1 Sustainability Concept ................................................................................................... 12
2.1.1 Sustainability definitions ...................................................................................... 12

xii
2.1.2 Sustainability dimensions ..................................................................................... 12
2.1.3 Sustainability of milk production system ............................................................. 14
2.2 Sustainability Assessment and Sustainability Indicators .............................................. 16
2.2.1 Sustainability assessment ..................................................................................... 16
2.2.2 Sustainability indicators ....................................................................................... 16
2.2.3 Rationale for the choice of sustainable indicators ................................................ 18
2.2.4 Indicators’ presentation ........................................................................................ 20
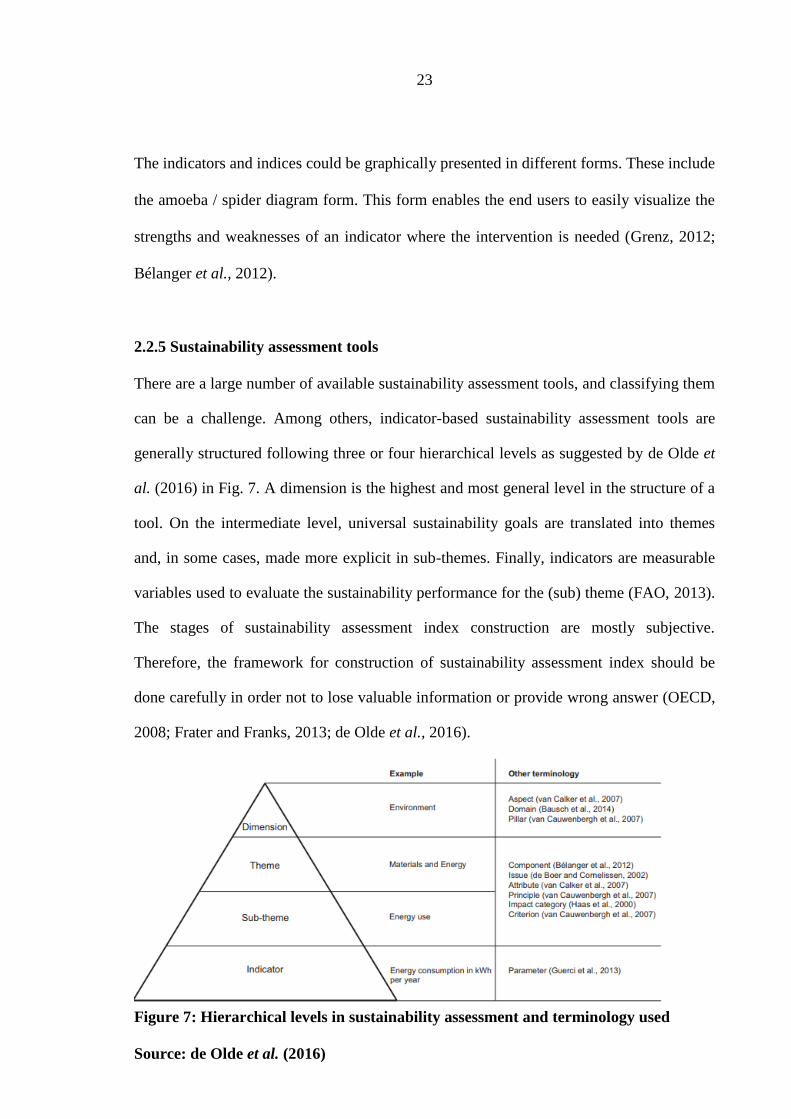
2.2.5 Sustainability assessment tools ............................................................................ 23
2.2.6 Test and validation of sustainability assessment tool ........................................... 24
2.3 Assessment of Sustainability of Smallholder Dairy and Traditional Cattle Milk
Production Farms in Tanzania ....................................................................................... 25
2.3.1 Sustainability issues in smallholder and traditional cattle milk production
systems in Tanzania ............................................................................................. 25
2.3.2 Indicators of Sustainability at Smallholder Milk Producer Farm Level in
Tanzania ............................................................................................................... 26
2.3.3 Tools for Assessing Sustainability at Smallholder Farm Lever in Tanzania ....... 27
2.4 Relationships between Indicators of Sustainability Relevant to Milk Producers’
Organizations and Farm Level ...................................................................................... 28
2.4.1 Effect of farmers’ organization membership on farm sustainability
performances ........................................................................................................ 28
2.4.2 Sustainability of farmers’ organization ................................................................ 30
2.4.3 Assessing sustainability of milk producers organization ..................................... 30
2.5 Factors Influencing Sustainability ................................................................................. 34
CHAPTER THREE .......................................................................................................... 36
3.0 RESEARCH METHODOLOGY ............................................................................... 36
3.1 Study Location .............................................................................................................. 36

xiii
3.2 Sampling Procedures and Sample Size ......................................................................... 39
3.2.1 Selection of household ......................................................................................... 39
3.2.2 Selection of the respondents for the Delphi survey .............................................. 42
3.3 Data Collection .............................................................................................................. 42
3.4 Data Collection at Experts Level .................................................................................. 43
3.4.1 Selection of initial set of indicators ...................................................................... 44
3.4.2 Delphi survey ....................................................................................................... 45
3.5 Data Collection at Farm Level ...................................................................................... 46
3.6 Data Collection at PO Level .......................................................................................... 47
3.7 Data Analysis ................................................................................................................ 48
3.7.1 Procedure for sustainability assessment ............................................................... 48
3.7.1.1 Rationale for indicators selection ........................................................... 49
3.7.1.2 Framework for measuring indicators ...................................................... 51
3.7.1.2 Normalization of indicators .................................................................... 55
3.7.1.3 Weighting and aggregation of indicators into sustainability indices ...... 57
3.7.1.4 Test of the Developed Sustainability Assessment Tool.......................... 59
3.7.2 Framework for Assessing Farm Sustainability .................................................... 59
3.7.3 Assessment of PO Sustainability Performances ................................................... 60
3.7.4 Descriptive statistics ............................................................................................. 61
3.7.5 Comparison of different production systems ....................................................... 62
3.7.6 Relationship between PO and farm sustainability ................................................ 63
3.7.7 Determinants of farm sustainability ..................................................................... 63
CHAPTER FOUR ............................................................................................................. 67
4.0 RESULTS ..................................................................................................................... 67
4.1 Indicators for Assessing Sustainability of Milk Production Farms in Tanzania ........... 67
4.1.1 Characteristics of respondents .............................................................................. 67

xiv
4.1.2 Sustainability indicators ....................................................................................... 68
4.2 Sustainability Performances of Smallholder Dairy and Traditional Cattle Milk
Producer Farms ............................................................................................................. 72
4.2.1 Sustainability index and sub-indices .................................................................... 72
4.2.2 Economic indicators ............................................................................................. 73
4.2.3 Social indicators ................................................................................................... 77
4.2.4 Environmental indicators ..................................................................................... 77
4.2.5 Framework for assessing farm sustainability in Tanzania ................................... 78
4.3 Relationship between Farm Level Milk Production Sustainability Performances
and Producers’ Organization Sustainability Dimensions .............................................. 79
4.3.1 Farm sustainability performances in PO-Members and non-PO-Members ......... 79
4.3.2 PO characteristics ................................................................................................. 80
4.3.3 Producers’ organization sustainability performances........................................... 81
4.3.4 Correlations between overall farm and PO sustainability performance
indicators .............................................................................................................. 82
4.3.5 Correlations between farm economic and PO sustainability indicators ............... 84
4.3.6 Correlation between social farm and PO sustainability performance
indicators .............................................................................................................. 86
4.3.7 Correlation between farm environmental and PO sustainability indicators ......... 88
4.3.8 Producers’ organization level factors influencing farm sustainability ................. 89
4.4 Determinants of Smallholder Dairy and Traditional Cattle Milk Producer Farm
Sustainability ................................................................................................................. 89
4.4.1 Socio-economic characteristics of the households ............................................... 89
4.4.2 Determinants of farm sustainability ..................................................................... 91
CHAPTER FIVE ............................................................................................................... 92
5.0 DISCUSSION .............................................................................................................. 92

xv
5.1 Indicators for Assessing Sustainability of Milk Production Farms in Tanzania ........... 92
5.2 Framework for Assessing Sustainability of Smallholder Dairy and Traditional
Cattle Milk Producer Farms .......................................................................................... 98
5.2.1 Framework development ...................................................................................... 98
5.2.2 Sustainability performances of smallholder dairy and traditional cattle
milk producer farms ............................................................................................. 99
5.2.2.1 Overall farm sustainability ....................................................................... 99
5.2.2.2 Economic sustainability ......................................................................... 100
5.2.2.3 Social indicators ..................................................................................... 101
5.2.2.4 Environmental indicators ....................................................................... 102
5.3 Relationship between Farm Level Milk Production Sustainability Performances
and Producers’ Organization Sustainability Dimensions ............................................ 103
5.3.1 Farm sustainability Performances in PO-members and non-PO-members ........ 103
5.3.2 Producers’ organization characteristics .............................................................. 103
5.3.3 Producers’ organization sustainability performances......................................... 103
5.3.4 Correlations between overall farm and PO sustainability performance
indicators ............................................................................................................ 104
5.3.5 Economic dimension .......................................................................................... 105
5.3.6 Social dimension ................................................................................................ 107
5.3.7 Environmental dimension .................................................................................. 108
5.3.8 Producers’ organization level factors influencing farm sustainability ............... 108
5.4 Determinants of Smallholder Dairy and Traditional Cattle Milk Producer Farm
Sustainability ............................................................................................................... 109
5.4.1 Socio-economic characteristics of the households ............................................. 109
5.4.2 Determinants of farm sustainability ................................................................... 109

xvi
CHAPTER SIX ................................................................................................................ 113
6.0 CONCLUSIONS AND RECOMMENDATIONS .................................................. 113
6.1 Conclusions ................................................................................................................. 113
6.2 Recommendations ....................................................................................................... 114
6.2.1 Promoting use of the milk production sustainability assessment tool ............... 114
6.2.2 Improvement of economic, social and environmental sustainability ................. 114
6.2.5 Improvement of PO sustainability ...................................................................... 116
6.2.6 Contribution of the Study and Suggestions for Further Research ...................... 116
REFERENCES ................................................................................................................ 117
APPENDICES ................................................................................................................. 149

xvii
LIST OF TABLES
Table 1: Number of farm household per village type ......................................................... 41
Table 2: Selected indicators for assessing sustainability of milk production farms in
Tanzania ................................................................................................................. 49
Table 3: Reference values for the selected indicators ......................................................... 57
Table 4: Weight of sustainability indicators ....................................................................... 58
Table 5: Dimensions and sub-dimensions for producers’ organizations sustainability
assessment tool (POSA) ........................................................................................ 60
Table 6: Description and measurement of socio-economic independent and dependent
variables ................................................................................................................. 65
Table 7: Description and measurement of PO level independent and dependent
variables ................................................................................................................. 65
Table 8: Categorical distribution of respondents ................................................................ 67
Table 9: “Initial set” of indicators for assessing sustainability in Morogoro and
Tanga Regions ....................................................................................................... 68
Table 10: List of accepted indicators for assessing sustainability of milk production
farm in Morogoro and Tanga .............................................................................. 70
Table 11: List of accepted indicators for assessing sustainability of milk production
farm in Morogoro and Tanga, according to respondents’ groups ........................ 72
Table 12: Farm sustainability index and sub-index performances ...................................... 73
Table 13: Economic sustainability performances by milk market channel ........................ 75
Table 14: Social sustainability performances ...................................................................... 77
Table 15: Environmental performances .............................................................................. 78
Table 16: Farm sustainability performances in PO-members and non-PO-members
(normalized values) ............................................................................................. 80

xviii
Table 17: PO characteristics ................................................................................................ 81
Table 18: PO sustainability performances (scores) ............................................................. 82
Table 19: Correlations between PO overall sustainability performance index and farm
sustainability performance indicators ................................................................. 84
Table 20: Correlation between farm economic and PO sustainability performance
indicators ............................................................................................................. 85
Table 21: Correlations between farm social and PO sustainability indicators .................... 87
Table 22: Correlation between farm environmental and PO sustainability performance
indicators ............................................................................................................. 88
Table 23: Producers’ organization level factors influencing farm sustainability ................ 89
Table 24: Socio-economic characteristics of the households .............................................. 90
Table 25: Tobit regression analysis results of the determinants of sustainability ............... 91

xix
LIST OF FIGURES
Figure 1: Sustainability Dimensions ..................................................................................... 3
Figure 2: Graphical representation of sustainability using a Venn diagram. ...................... 14
Figure 3: Graphical representation of sustainability using concentric circles .................... 14
Figure 4: Schematic presentation of an indicator’s integrative definition. ......................... 18
Figure 5: From raw data to composite indicators: an illustration ....................................... 22
Figure 6: Relationships between Indicators, Users and the Level of Analysis ................... 22
Figure 7: Hierarchical levels in sustainability assessment and terminology used .............. 23
Figure 8: Flowchart for framework of indicators validation ............................................... 25
Figure 9: Organizational Sustainability framework ............................................................ 31
Figure 10: The DPOBE Model for Organizational Sustainability ...................................... 33
Figure 11: Livestock farming systems in Morogoro and Tanga Region ............................. 38
Figure 12: A two Round Delphi Survey Technique ............................................................ 44
Figure 13: Interview with typical smallholder farmer in Lushoto District, 2016 ............... 47
Figure 14: Framework for milk production farm sustainability assessment ....................... 48
Figure 15: Farmers discussing the results from PO sustainability assessment in Kilosa
District, 2016 ..................................................................................................... 61
Figure 16: Feed conservation in Lushoto District ............................................................... 76
Figure 17: Death of calves due do shortage of feed and water during the dry season in
Mvomero District .............................................................................................. 76
Figure 18: Framework for assessing sustainability of smallholder dairy and
traditional cattle milk production systems using a set of 15 indicators ............ 79

xx
LIST OF APPENDICES
Appendix 1: Monitored Household ‘Types’ ..................................................................... 149
Appendix 2: Questionnaire for Selection of Relevant On-Farm Milk Production
Sustainability Assessment Indicators (1st Round) ........................................ 150
Appendix 3: Questionnaire for Selection of Relevant On-Farm Milk Production
Sustainability Assessment Indicators (2nd Round) ....................................... 154
Appendix 4: Farm questionnaire ....................................................................................... 158
Appendix 5: Determination of indicator weights using principal components
analysis ......................................................................................................... 174
Appendix 6: Farm questionnaire for data collection measuring sustainability
indicators ...................................................................................................... 177
Appendix 7: Reasons for including / including the indicators identified through the
Delphi technics in the final set used in the framework for assessing
sustainability ................................................................................................ 183
Appendix 8: Producers’ Organization Sustainability Assessment Tool (POSA).............. 184
Appendix 9: Relevant indicators for assessing sustainability of milk production
farm in Morogoro and Tanga Regions ......................................................... 191
xxi
LIST OF ABBREVIATIONS AND SYMBOLS
CAP Common Agricultural Policy
CAP Common Agricultural Policy of the EU
EAAE European Association of Agricultural Economists
EADD East African Dairy Development
ESA Economic and Social Affairs
EU European Union
FADN Farm Accountancy Data Network
FAO Food and Agriculture Organization
IDEA Indicateurs de Durabilité des Exploitations Agricoles
IDF International Dairy Federation
IFSA International Farming System Association
ILRI International Livestock Research Institute
INRA Institut Nationale de la Recherche Agronomique
LITA Livestock Training Agencies
NGO Non-Governmental Organization
oC Degree Centigrade
OECD Organisation for Economic Cooperation and Development
Pg Page
PO Milk Producers’ Organization
POSA Producers’ Organizations Sustainability Assessment tool
RISE Response-Inducing Sustainability Evaluation
R-to-R Rural Production to Rural Consumption
R-to-U Rural Production to Urban Consumption
SHG Self-Help Group

xxii
SUA Sokoine University of Agriculture
TALIRI Tanzania Livestock Research Institute
TZS Tanzanian Shilings
URT United Republic of Tanzania
USAID United States Agency for International Development
WP World Population

1
CHAPTER ONE
1.0 INTRODUCTION
1.1 Background of the Study
The dairy sector plays an important role not only in human nutrition, but also as a source
of livelihoods for poor farmers and other stakeholders in developing countries, including
Tanzania. Milk and other dairy products have a great potential in contributing to human
nutrition and health due to their high nutritional value (Dugdill et al., 2013). Milk
production, particularly when practiced as a business generates income and employment
for a large number of poor families, which contribute to poverty reduction. Furthermore,
the milk sector promotes the economic and social roles of women in communities (Bayer
and Kapunda, 2006). When integrated with crop farming, dairying provides organic
manure which positively contributes to soil fertility as well as better crop yield. The use of
organic fertilizer contributes to reduction of excessive use of chemical fertilizers which
could lead to several environmental problems including water pollution (Rasul and Thapa,
2004).
The demand for milk and other dairy products is expected to increase. The demand will be
driven by the expected increase in world human population, urbanization and income
(Gerosa and Skoet, 2012). Projections have shown that the world population is expected to
rise to 9.1 billion by 2050 (Godfray et al., 2010). In Tanzania, it is projected that the
human population will rise up to 138 million and 303 million in 2050 and 2100,
respectively (United Nations, Department of Economic and Social Affairs, Population
Division, 2017). The increase in population will be associated with increased food
consumption including milk and other dairy products (Gerosa and Skoet, 2012).

2
Concomitant to the increase in human population, income and urbanization in developing
countries will be associated with high purchasing power and preference for food of higher
quality including milk and meat, which will catalyse the increase in milk and dairy
products demand (Gerosa and Skoet, 2012). Hence, the world milk production will need to
grow by 2% per year in order to meet the increased demand (Hemme et al., 2010).
Extensive efforts have been made to increase milk production including upgrading the
genetic potential of milk production cattle and better animal nutrition (FAO-IDF, 2011;
Hume et al., 2011). Meanwhile, cattle rearing could have negative effects on the
environment such as the degradation of natural resources and contribution to greenhouse
gas emissions (Steinfeld, 2006; Gerosa and Skoet, 2012). Moreover, socio-economic
negative effects of dairy sector have been reported. For example, dairy cows could
transmit some diseases to human when hygienic standards are not met (Lupindu et al.,
2012; Dhanashekar et al., 2013). The search for pasture and water could generate
competition between cattle and crop farming activities which could result into severe
conflicts between livestock farmers and crop farmers, which sometimes result in economic
and human losses (Benjaminsen et al., 2009). In addition to the aforementioned
constraints, Zvinorova et al. (2013) report that some dairy farms are not economically
viable as their revenue does not cover the cost of their activities. Green (2012) argues that
when the farm is not profitable, its sustainability is compromised since the farmers likely
leave dairy production to another activity which is more profitable, particularly when the
farm is not financed by off-farm income. Hence, sustainable agriculture, including milk
production, is among the priorities for the policy makers and other stakeholders in order to
feed the growing world population within finite means, particularly land (Herrero and
Thornton, 2013; Miller and Auestad, 2013).

3
Despite the efforts which has been made, there is no agreement on the practical definition
of sustainable agriculture. The World Commission on Environment and Development
(1987) defines sustainability as a “development which meets the needs for the present
without compromising the ability of future generations to meet their own needs”. This
definition is not precise enough as it does not provide clear information on the practical
and specific form of sustainability. As a consequence, the concept of sustainability has
many practical meanings which differ across space and time, and among individuals
(Robinson, 2004; White, 2013). This vagueness has resulted into a large number of
sustainability definitions (Rigby and Cáceres, 2001; Diazabakana et al., 2014). In spite of
this large number of definitions, it is generally agreed that sustainability is manifested in
three interlinked dimensions, “economic, social and environment” (European
Commission, 2001; van Calker et al., 2005; van Cauwenbergh et al., 2007; Fauzi et al.,
2010) whereby sustainability is the intersection of the three dimensions (Fig. 1).
Figure 1: Sustainability Dimensions
(Source: Fauzi et al., 2010)
Economic
SocialEnvironment
Sustainability

4
Sustainability should be measured in order to be operational. Sustainability assessment
using the indicators is suggested as the pathway towards operationalization of the
sustainability concept. Waas et al. (2014) define sustainability assessment as any process
aiming to: “contribute to a better understanding of the meaning of sustainability and its
contextual interpretation (interpretation challenge)”; “integrate sustainability issues into
decision-making by identifying and assessing (past and / or future) sustainability impacts
(information-structuring challenge)”; “foster sustainability objectives (influence
challenge)”.
Participating in farmers’ organizations has been suggested to be among the best
mechanisms for improving farm sustainability performances, particularly in developing
countries (Mojo et al., 2015; Iyabano et al., 2016). This is mainly due to the fact that a
large number of the rural farming households are geographically scattered in remote rural
areas with limited access to infrastructure and information which constrains access to
services, inputs and outputs markets at individual farm level. Farmers’ organizations could
alleviate the constraints by improving bargaining power which enables easy access to
production inputs and embedded services, including more efficient extension services, to
enhance productivity and participating in more valuable output markets (Salokhe, 2016).
Indeed, farmers’ organizations provide a platform where farmers could discuss their
challenges and opportunities, share skills, knowledge and experience on good farming
practices (Verhofstadt and Maertens, 2015).
Farm level sustainability performances could be influenced by a number of social-
economic factors such as household characteristics (Manda et al., 2016; Gómez-Limón
and Sanchez-Fernandez, 2010; Umanath, 2015). Understanding the factors is therefore

5
crucial to guide any intervention toward sustainability improvement (OECD, 2008;
Dabkienė, 2015). Moreover, factors which influence sustainability could vary from one
place / farm type to another (Gómez-Limón and Sanchez-Fernandez, 2010; Umanath and
Rajasekar, 2015; Li et al., 2016).
1.2 Problem Statement and Justification of the Research
Smallholder dairy and traditional cattle milk production systems have potential role in
alleviating poverty and improving the livelihoods of the poor farmers in developing countries,
including Tanzania (Urassa and Raphael, 2002; Bayer and Kapunda, 2006). The long-term
viability of these systems in the future, in the competitive context requires that these
smallholder dairy production and traditional cattle milk production systems are sustainable
in environmental, social, and economic terms (Fadul-Pacheco et al., 2013). However,
various studies have shown that, in Tanzania, smallholder dairy and traditional cattle milk
production farms face a large number of issues, classified into economic, social and
environmental, which hinder their sustainability (Leonard et al., 2016; Ogle, 2001;
Benjaminsen et al., 2001; Lupindu et al., 2012; Nkya et al., 2005).
Some examples of the issues which could constrain sustainability of smallholder dairy and
traditional cattle milk production systems in Tanzania have been reported. Regarding the
economic aspects, Tanzania’s milk production is mainly for subsistence. A large
proportion (90%) of produced milk is consumed at the point of the production while only
10% is sold (Rural Livelihood Development Company, 2010). The subsistence form of
production is driven by many factors such as low yield of milk due to poor genetic
potential of the dominant indigenous cattle, scarcity of forage and water, poor knowledge
on dairy husbandry and limited access to inputs as well as milk markets, which are more

6
pronounced in traditional cattle keeping than in smallholder dairy systems (Urassa and
Raphael, 2002; Nkya et al., 2007; Nell et al., 2014; Leonard et al., 2016). This is
consistent with Green (2012) who argues that some farmers in Tanzania exit dairy farm
activities due to low profitability, searching for other activities which are more profitable.
In addition to that, the subsistence nature of milk production has repercussions on milk
availability where the estimated consumption of milk per annum per capita is still low (43
litres) compared to 200 litres as recommended by the FAO (URT, 2010).
Besides, social issues which could constraint Tanzania’s milk production sustainability
have been reported. Some examples are marginalization of women (Kimaro et al., 2013),
low education level among the cattle farmers (Baker et al., 2015), recurrent conflicts
between livestock keepers and crop farmers which sometimes result in loss of wealth and
lives (Benjaminsen et al., 2009; Mwamfupe, 2015). Issues related to environmental
sustainability like land degradation and insecure land tenure have been also reported to
constrain sustainability of milk production systems in Tanzania (Ogle, 2001; Lugoe, 2011;
Mwamfupe, 2015). The constraints need to be systematically addressed in order to have
sustainable smallholder dairy and traditional cattle milk production systems in Tanzania.
Tanzania’s livestock vision aims to transform milk production from subsistence to a
modern and sustainable level (URT, 2015). To meet the national vision, an assessment of
the progress made in improving the sustainability of dairy production systems is
necessary. In this regard, a number of measurable indicators to monitor the interventions
towards modernization and sustainability of Tanzania’s milk production have been
established (URT, 2010). These indicators include “the number of staff trained” and
“number of communities allocated land for grazing” among others. The indicators are set

7
at a higher level, particularly at country level. Hence, they could have limitations since
aggregation at country level could hide large difference between farms (Gómez-Limón
and Sanchez-Fernandez, 2010).
Numerous tools for assessing sustainability of milk production farm level have been
developed. Many of the tools have been developed specifically for the European context
(Van Calker et al., 2005; Zahm et al., 2008; Paracchini et al., 2015), while others are
specific for the Asian context, particularly in India (Chand et al., 2015; Singh et al., 2016).
The existing tools might not be adaptable to Tanzania’s context. For instance, van Calker
et al. (2005) developed a dairy farm sustainability assessment model in Germany which
covered the three aspects of sustainability, but they attached less importance on the
economic aspect, which is important for Tanzania’s context. Some tools are deemed to be
universal (Urutyan and Thalmann, 2011; FAO, 2013). In this case, Urutyan and Thalmann
(2011) in Kenya and China used Response Induced Sustainability Evaluation (RISE)
developped in Switzerland. Another option is to adapt the existing tools to the context
being studied. For instence, the tool IDEA (Indicateur de durabilite des exploitations
agricoles) was developed in France and adapted to the Mexican context (Salas-Reyes et
al., 2015). However, evidence from a large number of studies including the study by
Fadul-Pacheco et al. (2013) in Mexico, among others, have shown that using the tool in
other contexts different from the original one could provide misleading results since some
indicators are deemed out of the context being evaluated. For example, Fadul-Pacheco et
al. (2013) used IDEA tool, developed in France, in Mexico; however, they removed some
indicators like “Enhancement of landscape” refering to European Common Agricultural
Policy (CAP) of the Eurropean Union which are not applicable in Mexico.

8
According to de Olde et al. (2016), developers of sustainability assessment tools make
judgment during the stages of tool development namely defining sustainability and
selecting, measuring, weighting and aggregating indicators depending on the context being
considered, and this judgement could be different for the adopter of the tools. For
example, Kamalia et al. (2017) found that perception of the relative importance of
sustainability indicators and dimensions of an agricultural system by the stakeholders
varied significantly between Argentina and Brazil. This mismatch implies that using a
predetermined tool without adaptation to the prevailing system could be misleading. The
adaptation should be performed on almost all stages of sustainability assessment tool
development, namely, the sustainability definition and indicators selection, measurement,
weighting and aggregation. Meanwhile, Frater and Franks (2013) suggest assessing
sustainability according to the context being studied by involving key stakeholders.
Some works on milk production sustainability assessment using locally identified
indicators have been done in Tanzania including HADO (Dodoma Soil Conservation)
(Ogle, 2001). However, the assessments did not provide good results due to overlooking
some local aspects such as involving all key stakeholders, particularly the farmers in the
key stages of sustainability assessment namely the selection and monitoring of indicators,
and resulted in failure of environmental conservation program (Ogle, 2001). Currently, the
literature shows that there is no appropriate tool for assessing sustainability of milk
production farms in Tanzania. Thus, it is necessary to develop a tool for assessing
sustainability of milk production farms in Tanzania, using rigorously selected
sustainability indicators.
Farmers’ organizations could be among the solutions for the problems encountered by
poor farmers, especially in relation to access to milk markets and inputs and services in
9
developing countries, including in Tanzania (Ogutu et al., 2014). However, the available
literature shows that Tanzania’s farmers’ organizations present some weaknesses. For
example, the organizations members do not have business and marketing skills, which
prevent them from efficiently exploiting the collective action (Uliwa and Fischer, 2004).
In addition, Ogutu et al. (2014) report that a large number of formed milk producers’
organization, particularly through projects interventions, are not sustainable since they
likely collapse as soon as the projects phase out. Currently, little has been done on the
assessment of milk producers’ organization sustainability performances and their
relationships with farm sustainability performances. This shows a need for assessing
sustainability performance of farmers’ organizations in Tanzania, and also analyse the
relationships between the producers organisations’ sustainability performances and the
sustainability performances of milk production at the farm level.
Milk production farm sustainability in Tanzania could be influenced by numerous factors.
One obvious instance is the number of cattle per unit area which could be the source of
land degradation caused by overgrazing. Currently, there are no empirical studies on
factors which could influence the economic, social and environmental sustainability
performance indices in Tanzania. Thus, this study was set to analyse key factors
influencing the sustainability of milk production farms in Tanzania.
The assessment of sustainability of milk production farms using rigorously selected
indicators could enable the farmers and the other stakeholders in the milk value chain to
monitor progress of their interventions towards sustainability. Knowledge of the
relationships between sustainability indicators at farm level and at POs level will provides
insights on how the POs could be leveraged to improve farm level sustainability. In
10
addition, the insights on factors influencing sustainability could be used to direct public
and private interventions towards improving farm and PO sustainability.
1.3 Study Objectives
1.3.1 Overall objectives
To assess the sustainability of smallholder dairy and traditional cattle milk production
systems in Tanzania.
1.3.2 Specific objective
Specific objectives were to:
i. Establish relevant indicators for assessing the sustainability of smallholder dairy
and traditional cattle milk producer farms in the selected areas of Tanzania;
ii. Assess sustainability of smallholder dairy and traditional cattle milk producer
farms;
iii. Establish the relationships between the sustainability indicators relevant at
smallholder dairy and traditional cattle milk producer farm level and those relevant
at milk producers’ organization level in Tanzania;
iv. Analyse the factors influencing the sustainability performances of smallholder
dairy and traditional cattle milk producer farms in Tanzania.
1.4 Research Questions
i. What are the relevant sustainability indicators of smallholder dairy and traditional
cattle milk producer farms in the study area?
ii. What are sustainability performances of smallholder dairy and traditional cattle
milk producer farms in the selected districts?

11
iii. What are the relationships between sustainability indicators relevant at smallholder
dairy and traditional cattle milk production farm level and those relevant at
producers’ organization level in the study area?
iv. What are the factors influencing specific sustainability performances of
smallholder dairy and traditional cattle milk producer farms in the study area?
1.5 Research Hypothesis
i. There is no relationship between sustainability indicators relevant at smallholder
dairy and traditional cattle milk production farm level and those relevant at
producers’ organization level in the study area.
ii. Socio-economic characteristics do not significantly influence specific sustainability
performances of smallholder dairy and traditional cattle milk producer farms in the
study area.
1.6 Organization of the Thesis
This thesis is divided into five chapters. Chapter One consists of the introduction which
includes the background describing the context in which the problem was observed,
problem statement and justification of the study. It also includes the objectives of the study
and respective research questions and hypotheses. Chapter Two covers the literature
review relating to the study. Chapter Three covers the research methodology used to
answer the research questions. Particularly, it describes the location and geographical
description of the study area, the sampling procedures and sample size, data collection
approaches used in the study and data processing and analysis. Chapter Four presents
results. Chapter Five discusses the results. Chapter Six presents the major conclusions
drawn from the results obtained and presented with respect to the four research questions
and the hypothesis. It also provides recommendations to improve milk production farm
sustainability.

12
CHAPTER TWO
2.0 LITERATURE REVIEW
2.1 Sustainability Concept
2.1.1 Sustainability definitions
A clear understanding of the operational definition of “sustainability concept” is the
starting point for any sustainability program (Zahm et al., 2008; Urutyan and Thalmann,
2011). Although the essence of the concept of sustainability is clear, its practical definition
is still subjective among individuals (Seghezzo, 2009). The word sustainable has its roots
in Latin word subtenir, meaning ‘to hold up’ or ‘to support from below’. Indeed, the term
“sustainability” is considered a synonym of “sustainable development”; and its widely
known definition as provided by the World Commission on Environment and
Development (1987) is “the development which meets the needs of the present without
compromising the ability of future generations to meet their own needs.” This definition
has been criticised for its vagueness and subjectivity by many individuals. For example,
the major difficulty is defining the term “need” since what some individuals consider to be
“needs”, others may consider it as other things like simply “desires” (Robinson, 2004; Cox
and Ziv, 2005). This ambiguity implies that what is considered as sustainable to one
individual could be considered as moderately or non-sustainable to another individual.
Meanwhile, Seghezzo (2009) shows other weaknesses of the sustainability definition
provided by the World Commission on Environment and Development such as being more
essentially anthropocentric, over estimating the importance of the economy, neglecting the
space and time aspects and disregarding personal aspects.
2.1.2 Sustainability dimensions
Sustainability is represented by dimensions also called aspects, domains or pillars (van
Cauwenbergh et al., 2007; Bausch et al., 2014; van Calker et al., 2007, respectively).

13
Three basic dimensions commonly known as the ‘triple bottom line’ of economy,
environment, and society are the mostly used to represent sustainability. Besides the three
basic dimensions of sustainability, other dimensions have been added. One example is
good “governance” or “institutional” dimension which is added in the framework for
Sustainability Assessment of Food and Agriculture systems (SAFA) which is deemed to
be universal as suggested by FAO (2013). Meanwhile, Seghezzo (2009) proposes an
alternative sustainability triangle formed by ‘Place’, ‘Permanence’, and ‘Persons’ (the new
three Ps) in order to better understand the sustainability concept.
Graphical representations of sustainability dimensions have been used to help to
communicate the integration of sustainability dimensions and make the sustainability
concept more tangible (Lozano, 2008). Two of the most used sustainability representations
are: (1) the Venn diagram where the union created by the overlap among the three
components of economy, environment and society are designed to represent sustainability
as presented in Fig. 2 (Lozano, 2008); (2) the three concentric circles where the inner,
middle and outer circles represent the economic, social and the environmental aspects,
respectively as presented in Fig. 3 (Waney et al., 2014; Gary et al., 2005 cited by Nguyen
(2012)). The concentric graphical representation implies that the environment is ultimate
setting within which societal structures are built, and society itself is more fundamental than
the economic constructions that humans design and implement (Gary et al., 2005) cited by
Nguyen (2012). Some authors propose other graphical representations such as the one with
embedded circles but no concentricity or common middle point (Mebratu, 1998).

14
Figure 2: Graphical representation of
sustainability using a Venn
diagram.
(Source: Lozano (2008)
Figure 3: Graphical representation of
sustainability using
concentric circles
(Source: Source: Lozano (2008)
2.1.3 Sustainability of milk production system
An agriculture which continually provides food and other resources to a growing world
population is of crucial importance for human existence and hence for any human activity.
However, there are a great number of social, economic and environmental problems that
threaten this ability of agriculture to fulfil human needs now and in the future. These
problems include climate change, high rate of biodiversity loss, land degradation through
soil erosion, compaction, salinization and pollution, depletion and pollution of water
resources, side effects on human and animal health (Steinfeld, 2006; Swai, 2011; Gerber et
al., 2013; Velten et al., 2015). Therefore, there is growing emphasis on sustainable
agriculture in concerning with the adverse social, environmental and economic impacts of
conventional agriculture (Hansen, 1996).
The idea of a sustainable agriculture has gained importance since the publication of the
Brundtland Report in 1987. Yet, similarly to the concept of sustainability, the definition of

15
of sustainable agriculture is still very vague and ambiguous in its meaning (Lichtfouse et
al., 2010), which renders its practical use difficult (Velten et al., 2015). Many definitions
of sustainable agriculture exist with different focusses: at least 70 definitions can be
identified in the literature (Zhen and Routray, 2003). Landais (1998) and Lichtfouse et al.
(2009) suggest that a sustainable agricultural system should sustain itself (in three
dimensions) over a long period of time; this is possible if it is economically viable,
environmentally safe and socially fair. For a farm, the contribution to sustainable
agriculture often involves three functions namely: (1) the production of goods and services
(economic function); (2) the management of natural resources (ecological function); and
(3) the contribution to rural dynamics (social function) (Latruffe et al., 2016). The
American Society of Agronomy defines sustainable agriculture as a system that, “over the
long term, enhances environmental quality and the resource base on which agriculture
depends; provides for basic human food and fibre needs; is economically viable; and
enhances the quality of life for farmers and society as a whole” (American Society of
Agronomy, 1989).
More specifically, Devendra (2001) described sustainable milk production farming system
as the one which is efficient in resources management without negative impact on the
environment, profitable, contributes to employment creation and improving livelihood of
the poor. Nguyen (2012) argues that most definitions of sustainable agriculture are
fundamentally similar. According to Weil (1990), a sustainability definition should be
general enough in order to accommodate the wide range of agricultural situations in which
it will be applied, yet specific enough to provide criteria by which the sustainability of
alternative systems may be judged.

16
The concept of sustainable agriculture emphasizes on different aspects of agriculture in the
context of different countries and regions. For example, in developed countries, the main
sustainability issues are diversification away from a limited range of commodities and the
satisfaction of environmental pressure groups, particularly with respect to large losses of
nutrients and the quantities of pesticides currently used (Zhen and Routray, 2003). In
developing countries, the imperative is to maintain food production, while preserving the
underlying resource base (Zhen and Routray, 2003).
2.2 Sustainability Assessment and Sustainability Indicators
2.2.1 Sustainability assessment
Sustainability should be assessed in order to know the situation and guide interventions for
its improvement (Häni et al., 2003; Urutyan and Thalmann, 2011; Bond et al., 2012).
Sustainability assessment enables decision-makers and other stakeholders decide what
actions they should take and should not take in an attempt to improve sustainability
(Devuyst, 2001).
Nguyen (2012) suggests that in the field, especially in farming systems, sustainability is an
extremely complex measure. Therefore, operationalizing sustainability on the ground involves
considering numerous aspects, variously identified as physical, environmental, social, cultural
and / or economic. This complexity leads to the need for integrated and interdisciplinary
assessments that can consider the sum of its parts. According to Poveda and Lipsett (2011),
sustainability assessments are practical undertakings in evaluation and decision making
with expected participation by stakeholders.
2.2.2 Sustainability indicators
Sustainability assessment is made possible by using the most relevant indicators which
cover the economic, social and environmental aspects of sustainability (Zahm et al., 2008;

17
FAO, 2013; Chand et al., 2015). Practically, sustainability assessment consists of dividing
the economic, social and environmental sustainability dimensions into relevant attributes,
which could be termed “issues” / “principles” / “criteria”, then monitor the attributes using
measurable indicators (de Boer and Cornelissen, 2002; van Calker et al., 2005; van
Cauwenbergh et al., 2007). An attribute is described as a feature that can either negatively
(constraints) or positively (opportunities) influence the respective dimension of
sustainability (van Calker et al., 2005).
The indicators provide information on other variables which are difficult to access and
serve as a tool for decision making by showing whether the process is not deviating from
the desired situation (Gras et al., 1989). When specific indicators are selected, it is
possible to say whether certain trends are steady, going up or going down (Pretty, 1995).
An indicator could have many meanings such as a variable, a parameter, a measure, a
value, metrics, a measuring instrument, an index, a piece of information, representation, a
proxy (Waas et al., 2014). An indicator can also be defined from “system” and “technical”
perspectives. From a system perspective, Bell and Morse (2003) define an indicator as “an
operational representation of an attribute (quality, characteristic and property) of a
system”. From a technical perspective, Gallopin, (1997) cited by Borin et al. (2006)
defines an indicator as a “variable” or an aggregation / function of a number of variables.
Therefore, the integrative definition of an indicator becomes: “the operational
representation of an attribute (quality, characteristic and property) of a given system, by a
quantitative or qualitative variable (for example numbers, graphics, colours, symbols) (or
function of variables), including its value, related to a reference value (Waas et al., 2014).
Fig. 4 shows the schematic presentation of an indicator’s integrative definition.

18
Figure 4: Schematic presentation of an indicator’s integrative definition.
Source: Waas et al. (2014)
An indicator shows, among others, the extent to which the value of interest is close to the
reference or desired value (Sauvenier et al., 2005; Waas et al., 2014). The indicator should
be compared to the reference value in order to be meaningful (Waas et al., 2014).
According to van Cauwenbergh et al. (2007), the reference values could be either relative
or absolute. The absolute reference values include threshold value and target value while
the relative reference values include the regional average, between sector comparison and
trend.
2.2.3 Rationale for the choice of sustainable indicators
Selection of a set of relevant indicators is among the most critical stages of sustainability
assessment. It influences the conclusion from the sustainability assessment as well as the
results from its intervention (Ogle, 2001). A large number of indicators for assessing
sustainability have emerged (Rigby and Cáceres, 2001; de Olde et al., 2016 ). Due to the
lack of specific meaning of the concept of sustainability, the indicators could be viewed as
relevant or otherwise depending on the individuals (Hayati et al., 2010; Frater and Franks,
2013). Indeed, an indicator could change its dimension according to the context. One

19
example is the animal welfare which is considered more economic for the farmer and
more social for the consumer (Atanasov and Popova, 2010).
There exist several methodologies for sustainability indicators selection. The two widely
known methodologies for selecting sustainability indicators are “top-down” / “expert-
driven” and “bottom-up” / “stakeholder-driven” and these methodologies are also referred
to “reductionist” and “conversational”, respectively (Bell et al., 2001). Top-down
approaches are characterized by quantitative indicators, which are developed by a group of
experts and with explicit, clearly stated methodologies (Singh et al., 2012). On the
contrary, bottom-up approaches use qualitative indicators which are developed by (local)
stakeholders and with implicit, no clearly defined methodologies (Bell et al., 2001; Singh
et al., 2012). Top-down sustainability indicators are developed by experts and are
“scientifically rigorous” but such methodologies fail to engage local stakeholders, whereas
the opposite is true for bottom-up methodologies (Ogle, 2001; Reed, 2006).
Various examples of approaches have been used during the selection of the relevant
indicators. During the selection of relevant indicators, some studies use participatory
methods while others use hierarchical methods (van Cauwenbergh et al., 2007; van
Calker, 2005; Zahm, 2008; Majewsk, 2013). For example, Arandia et al. (2011) proposed
establishing indicators using several phases during selection of indicators: Literature
review search, drafting initial list of specific indicators and valuation of the information by
the experts. Indicators can also be identified by farmers, advisors and teachers of
agriculture schools using questionnaires (Elsaesser et al., 2013). Alternatively, Ghozlane
(2006) and Fadul-Pacheco et al. (2013) suggested an adaptation of existing indicators to
the context being considered.

20
Selection of sustainability indicators using participatory approach should assure that all
opinions from the respondents are properly integrated. Hence, the Delphi technique has
been suggested as among the most objective approaches (Parent et al., 2010; Bélanger et
al., 2012). The Delphi technique is used to generate the most reliable agreement on a
subjective topic by extracting and integrating a group of diverse opinions from different
individuals through a series of questionnaires with controlled feedbacks (Linstone and
Turoff, 2002; Grisham, 2009). The Delphi technique can be conducted remotely and is
characterized by four main features: “anonymity, iteration, controlled feedback and
statistical aggregation of group response”. These features enable respondents to provide
their opinions without bias due to the fear from social pressure by peers or society which
could occur during face to face meetings.
The indicators to be selected should have a certain number of criteria. They should be “(i)
relevant; this is related to the appropriateness of the indicator to the context and scale, and
also includes a quality / accuracy aspect; (ii) practicable, which consists of measurability,
quantification and compatibility of the data with the selected aggregation method, and
transferability to other farm types; (iii) valuable for the end user; this relates to the
appropriateness of the indicator to stakeholders’ expectations in terms of clarity,
comprehension and policy relevance” (Lebacq et al., 2013).
2.2.4 Indicators’ presentation
Indicators should be presented as a set instead of single indicators (Latruffe et al., 2016).
Lebacq et al. (2013) suggest three criteria for selecting a set of indicators: (1) parsimony,
i.e. indicators should be as few as possible and not redundant; (2) consistency, i.e. all
necessary indicators are in the set; and (3) sufficiency i.e. that is to say that the set is

21
exhaustive in the sense that it embraces all sustainability objectives. Atanasov and Popova
(2010) suggest that the indicators must not be too many so as to simplify the interpretation
specifically for those who are not experts, particularly the farmers. Although they provide
more detail, too many indicators are difficult to handle, confusing and some of the
indicators could be redundant (van Cauwenbergh et al., 2007). When oversimplified, the
set of indicators could fail to measure what they are supposed to measure (Dale and
Beyeler, 2001). Hence, the choice of the number of indicators depends on the objective of
the end user and the capacity of handling these indicators (Marchand et al., 2014).
Indicators may be difficult to interpret when they are presented separately. Therefore, the
indicators could be aggregated into indices (Chand 2015; Latruffe et al., 2016; Paracchini
et al., 2016). The individual indicators are constructed from raw data. Then, the composite
indicators are the result of aggregation of individual indicators. The composite indicators
enable to simplify the information, hence, be understood while the individual indicators
and the data enable to better understand the details. On contrary, the non-aggregators
question the aggregation since it could be dangerous due to mixing apple and oranges
(Latruffe et al., 2016). Fig. 5 shows, with examples, how composite indicators are made
from raw data.

22
Figure 5: From raw data to composite indicators: an illustration
Source: Latruffe et al. (2016)
The preference of level of aggregation varies with the group of individuals (Fig. 6).
Policy-makers and the public are more interested in the highest aggregation level while the
scientists are mostly interested in the details at the bottom and up to the data. Farmers are
interested in the moderate aggregation level (Sauvenier et al., 2005; Bélanger et al., 2015).
Figure 6: Relationships between Indicators, Users and the Level of Analysis
Source: Bélanger et al. (2015)
23
The indicators and indices could be graphically presented in different forms. These include
the amoeba / spider diagram form. This form enables the end users to easily visualize the
strengths and weaknesses of an indicator where the intervention is needed (Grenz, 2012;
Bélanger et al., 2012).
2.2.5 Sustainability assessment tools
There are a large number of available sustainability assessment tools, and classifying them
can be a challenge. Among others, indicator-based sustainability assessment tools are
generally structured following three or four hierarchical levels as suggested by de Olde et
al. (2016) in Fig. 7. A dimension is the highest and most general level in the structure of a
tool. On the intermediate level, universal sustainability goals are translated into themes
and, in some cases, made more explicit in sub-themes. Finally, indicators are measurable
variables used to evaluate the sustainability performance for the (sub) theme (FAO, 2013).
The stages of sustainability assessment index construction are mostly subjective.
Therefore, the framework for construction of sustainability assessment index should be
done carefully in order not to lose valuable information or provide wrong answer (OECD,
2008; Frater and Franks, 2013; de Olde et al., 2016).
Figure 7: Hierarchical levels in sustainability assessment and terminology used
Source: de Olde et al. (2016)

24
Marchand et al. (2014) identify two types of indicator-based sustainability assessment
tools: full sustainability assessment (FSA) tools and rapid sustainability assessment (RSA)
tools. The RSA tools are quick and more oriented toward communicating and learning.
They are therefore more suitable for use by a larger group of farmers. The RSA tools can
help to raise awareness, trigger farmers to become interested in sustainable farming, and
highlight areas of good or bad performance. If and when farmers increase their
commitment to on-farm sustainability, they can gain additional insight by using a FSA
tool which provides more details.
2.2.6 Test and validation of sustainability assessment tool
The developed tool must be tested and adjusted before application. A tool might work
theoretically but faces difficulties during its application. For example, de Odle et al.
(2016) in Denmark reported that the farmers expressed a hesitation to apply the outcomes
of some existing tools, even the tool “Response-Inducing Sustainability Evaluation”
(RISE) which is deemed to be universal, in their decision making and management.
Therefore, a sustainability assessment tool needs to be tested and validated before being
used. van Der Werf and Petit (2002) suggest some reasons for validating a sustainability
assessment tool: the first reason is that a tool may provide wrong information due to the
objective not appropriate with respect to the purpose. The second is that the tool may be
difficult to use due to a very complicated method, too expensive or requires data that
cannot be available. Therefore Bockstaller et al. (2009) and Bélanger et al. (2012) propose
a methodology for validation of sustainability assessment tool which takes into account
scientific soundness, feasibility and utility of the tool. Meanwhile, Bockstaller and
Girardin (2003) suggest three types of validation: design validation, output validation and
end user validation as described in Fig. 8. After the test and validation, the indicators which

25
do not comply with the requirements (if any) should be adapted or removed to come up with
the refined tools which are easy to use and comprehended.
Figure 8: Flowchart for framework of indicators validation
Source: Adapted from Bockstaller and Girardin (2003).
2.3 Assessment of Sustainability of Smallholder Dairy and Traditional Cattle Milk
Production Farms in Tanzania
2.3.1 Sustainability issues in smallholder and traditional cattle milk production
systems in Tanzania
Assessing sustainability of Tanzania’s smallholder dairy and traditional cattle milk
production systems is crucial in order to maintain their existence. In the context of
Tanzania, smallholder dairy farms are relatively small in size having 1 – 5 cows per
household under zero grazing while in the traditional system, milk is mainly produced by
indigenous cattle which are kept for multiple objectives (meat and milk especially)
(Njombe et al., 2011). The traditional system is characterised by low productivity
(Leonard et al., 2016); and due to the remoteness and poor infrastructure, inadequate
collection of milk and marketing constitute the largest bottlenecks (Njombe et al., 2011).
Other issues like conflicts between crop farmers and cattle farmers, shortage of feed and
water have been reported in the traditional cattle keeping systems (Benjaminsen et al.,
2009; Leonard et al., 2016). Meanwhile, issues like land degradation and shortage of feed
Definition of validation
Purpose of the indicator
QuestionType of
validationMethod
"well founded"
Is it scientifically
sound?
Design validity
Consultation with experts
"Achieve the overall
objectives"
Supply reliable
information
Does it inform about the reality?
Output validation
Consultation with Experts
Decision aid tool
Is it usefull?End user validation
Consultation with end-users

26
have been reported in smallholder dairy systems (Ogle, 2001; Nkya et al., 2005;
Benjaminsen et al., 2009). In this regard, it is important to determine the level of
sustainability and formulate respective policy and advice in order to improve the
sustainability of smallholder dairy and traditional cattle milk production farms in
Tanzania.
2.3.2 Indicators of Sustainability at Smallholder Milk Producer Farm Level in
Tanzania
Smallholder milk producer and traditional cattle milk producer farms in Tanzania require
specific sustainability indicators to monitor their performance. Many indicators for
sustainability at dairy farm level have been identified, particularly for smallholder dairy
farms. In smallholder milk production systems, Devendra (2001) identified a set of
sustainability indicators such as education level and return on asset, among others. In
India, Chand et al. (2015) provided attributes and indicators for sustainability assessment
of smallholder dairy farms. They include, for example, cost of milk production and capital
productivity for the economic dimension, women empowerment measure for social
dimension and enteric methane emissions for the environmental dimension. However, the
choice of appropriate indicators for smallholder dairy and traditional cattle milk
production farms is still a challenge as some of the indicators are specific to the context,
the same as the sustainability concept (Hayati et al., 2010). For example, proportion of
dung production used for fuel indicator used by Chand et al. (2015) for assessing
sustainability of smallholder dairy farm is not relevant in the context of Tanzania since
dung is not commonly used as fuel. In Tanzania, Ogle (2001) also reports a set of
indicators which were used to monitor degraded ecosystem rehabilitation in Dodoma
Region in order to lead to its sustainability. Those are namely biophysical indicators (cow

27
performance data, feed supply and feeding strategies, crop yields and manure utilization),
socio-economic indicators (labor inputs, economic indicators like net profits from the sale
of milk, changes in wealth distribution, nutritional status of children and gender issues).
However, the set of indicators presents some incompleteness for holistically assessing
sustainability of milk production farm since it overlooks the environmental indicators.
Indeed, the indicators selection procedure did not include the opinions from all
stakeholders including the farmers (Ogle, 2001).
2.3.3 Tools for Assessing Sustainability at Smallholder Farm Lever in Tanzania
Several studies aiming to address issues which hinder milk production sustainability have
been conducted in Tanzania. However, issues related to economic, social and
environmental sustainability of milk production systems have been addressed in separate
studies. Some examples are the studies which dealt with feed and manure management,
water pollution, milk quality, farm profitability and conflicts between livestock keepers
and crop farmers (Lupindu et al., 2015; Morris et al., 2015; Leonard et al., 2016; Mdegela
et al., 2009). However, the studies are not sufficient as they do not perform holistic
assessment which covers the three dimensions of sustainability.
A large number of integrated sustainability assessment tools involving milk producer
farmers exist in developed countries and less so in developing countries. These tools could
be used in other areas including Tanzanian smallholder dairy and traditional cattle milk
production farms. However, the tools may manifest some incompatibilities as the farming
systems and interests by the stakeholders are not the same. This could be explained by
many factors like the indicators not being adapted to the context, scoring and aggregation
method, time requirement and data input (de Olde et al., 2016). Fadul-Pacheco (2014)
28
suggest adapting the tool to the context being studied by excluding / modifying the
indicators which are not compatible with the context. Therefore, the developers of the
sustainability assessment tools should pay attention on all stages since they are the ones
make value judgements and assumptions about the working definition of sustainability,
sustainability level to be considered, the indicators to be selected, how the indicators are
measured and aggregated, etc.(Gasparatos, 2010; De Olde et al., 2016). For this reason,
developing an accurate sustainability assessment tool requires specific weight and
reference values adapted to Tanzania’s context using experts and stakeholders’
involvement, instead of using the existing tools with predetermined indicators and
weights.
2.4 Relationships between Indicators of Sustainability Relevant to Milk Producers’
Organizations and Farm Level
2.4.1 Effect of farmers’ organization membership on farm sustainability
performances
Farmers’ organizations are an effective mechanism to improve sustainable performances
among farmers through improving some key indicators of farm sustainability. Organized
farmers can carry out many activities together such as milk collection and marketing,
having easy access to credit, inputs and services. According to Rahman and Jancy (2015),
farmers’ organizations improve socio-economic status of the members and positively
influence knowledge gain and adoption of technologies in the farms. Yadav et al. (2016)
show that at individual level, farmers’ organizations are capable of improving the capacity
building of members in terms of enhancing confidence, participation in training
programmes and extension activities. In economic terms, farmer groups are able to
increase income, enhance saving habits, improve repayment of loan and facilitate capital

29
formation (Yadav et al., 2016; Agbonlahor et al., 2012). In Nigeria, Agbonlahor et al.
(2012) showed that farmers’ organizations are attractive since they enhance access to farm
inputs procurements and access to market information, cooperative credits and thrift,
social networking and multipurpose commercial activities.
Although it is known that farmers’ organization improve some of the farm sustainability
indicators, they could also have negative effects on other parameters / indicators of farm
sustainability. For example, Francesconi (2012) in Ethiopia showed that cooperative
membership has a positive impact on milk production and productivity, but have also a
negative impact on milk quality in terms of butter fat. In fact, cooperatives promote high
yielding crossbred cows which produce larger volumes of milk with lower fat and protein
content compared to the indigenous zebus, characterised by the production of small
volumes of milk with high density of nutrients. Indeed, Mojo et al. (2015) suggests that
famers’ organizations negatively affect environmental performances, contrary to the
expectation, particularly in coffee farming. This is due to the fact farmers intensify
production activities to comply with the urge made to reverse the low productivity of
coffee and respond to the impeding market demands of cooperatives, which actually
propel the process of resource degradation.
Other issues related to poor performances at farmers’ organizations level which have
negative impact on farm performances have been reported. For example, Shiferaw (2009)
argues that that poor performances such as lag to payment for deliveries makes farmers’
organizations less attractive marketing channels for the poor. Mujawamariya et al. (2013)
in Rwanda shows that despite their possible opportunities offered by the farmers’
organizations, the members prefer to sell their produce to traders rather than to their

30
organization because of their long-standing relationship with the traders. In fact, the
personal contacts of farmers with traders reduce certain transaction costs such as payment
in time and easy provision of credit. This seems to secure the farmers’ commitment to the
traders rather than to the cooperatives which show less flexibility towards the farmers’
daily needs.
2.4.2 Sustainability of farmers’ organization
A farmers’ organization should be sustainable in order to continue to exist while helping
its members. However, a large number of producers’ organizations in developing
countries, including Tanzania, are not sustainable since they either stay static for a long
time without helping their members or dissolve, particularly the ones created through
mobilization by donors (Bayer and Kapunda, 2006; Ogutu et al., 2014). Some of the major
reasons for the failure include poor management, conflicts among members, lack of funds,
dependence on external support and poor marketing skills (Holloway et al., 2000; van der
Walt, 2005; Nyang et al., 2010). According to Joseph and Coblentz (2002),
“organizational sustainability represents an ongoing process rather than a state of
perfection. It is like a plant: it will grow and prosper if watered and cared for, but wither
quickly if it is not”. “Furthermore, organizations are like a body: if one part is ill, the rest
will not function like it should. If too many parts fail at once or in quick succession, the
body dies”. Therefore, farmers’ organizations need to be sustainable in order to efficiently
continue supporting their members without merely depending on external support which
are mostly ephemeral.
2.4.3 Assessing sustainability of milk producers organization
Sustainability of milk producers’ organization should be assessed in order to guide the
interventions towards its improvement. In India, Rahman (2011) analysed sustainability of

31
dairy farmers’ organizations using organizational and financial sustainability indicators.
The organisational sustainability indicators were the frequency of meeting, attendance in
group meeting, books maintained by the groups, drop-out rates and the reasons for such
dropouts. The financial sustainability indicators were the rate and periodicity of savings,
utilization of savings, credit-deposit ratio and repayment performance. However, Hubbard
et al. (2006) and Terry (2013) suggest that a framework for assessing sustainability of an
organization should not be primarily economic, but it should also consider the impact on
the society and environment so as it could continue to exist. Therefore, the Triple Bottom
Line (TBL) approach is more improved during the assessment of organization’s
sustainability since it adds the social and environment measures to the economic measures
(Hubbard, 2006; Cella-De-Oliveira 2013). Similarly, Baumgartner and Ebner (2010) use
the three sustainability dimensions for assessing organizational sustainability: Economic
Organizational Sustainability (EcOS), Environmental Organizational Sustainability
(EnOS), and Social Organizational Sustainability (SOS) as presented in Fig. 9. The theory
behind the TBL is that an organization should take into account its performance in relation
to that wider group of stakeholders (such as communities and governments) who are
affected by the organization’s activities, rather than just the narrower group of
stakeholders (such as employees, suppliers and customers) who are directly impacted
through transactional relationships (Hubbard et al., 2006).
Figure 9: Organizational Sustainability framework
Source: adapted from Cella-de-oliveira (2013)

32
In order to assess sustainability of an organization using TBL, Cella-de-Oliveira (2013)
proposes an extensive list of 19 economic, 32 social and 23 environmental indicators for
assessing organizational sustainability. Some examples are generation of adequate capital
pay outs to the shareholders and not gaining economic advantage by illicit means for the
economic organizational sustainability dimension; the organization possesses
environmental policies tied to its strategic planning, management and processes and
monitoring programs of environmental performance exist and its results are considered in
the future planning for the environmental organizational sustainability dimension; frequent
training opportunities and other activities that promote the development of its
collaborators and conducts satisfaction surveys among its collaborators, and its results are
considered for changes for the social organizational sustainability dimension.
According to Santos et al. (2013), improving sustainability using financial, environmental
and social dimensions according to the TBL approach does not guarantee itself an
effective sustainability of organizations. Therefore, DPOBE Model was suggested for
assessing organizational sustainability (Fig.10). This model suggests that organizational
sustainability is represented by five pillars that are considered as the most important to
assure the organizational sustainability. Those are direction, posture, organization,
behaviour and evaluation. Trying to upgrade this theoretical model and its empirical
applications, some of authors have proposed a quantitative application in order to
determine the global sustainability robustness of organizations with the measure of the
sustainability strength in each one of the pillars (Santos et al., 2012).

33
Figure 10: The DPOBE Model for Organizational Sustainability
Source: López et al. (2010; 2011) cited by Santos et al. (2013)
Sustainability assessment approach for an organization should be specific to the context,
particularly for milk production systems which vary extremely from one to another. In this
regard, the East African Dairy Development Project (EADD) has developed a tool, “the
Producers Organisation Sustainability Assessment tool (POSA)”, to assess producers’
organisation sustainability (Mutinda et al., 2015; Baltenweck et al., 2016). The EADD is a
regional industry development program which has the goal of helping families living on
small 1-5 acre farms lift themselves out of poverty through more profitable production
and marketing of milk. The tool was used in Kenya and Uganda. The tool considers an
organization to be sustainable “if it can adjust its business practices to respond to external
shocks (such as a changing milk price) and internal shocks (such as corruption among the
leadership)” (Baltenweck et al., 2016). The POSA tool covers organizational and
economic dimensions and suggests that sustainability is represented by six dimensions.
The assessment produces a score on each dimension: the higher the score, the more
sustainable the organization. The tool enables to classify the organizations into five stages
according to their sustainability scores. Where; Stage I implies that a PO may have an

34
interim board, have not held elections, have no staff, etc. while Stage V implies that a PO
has a well-established board with regular and documented meetings; it is profitable and the
financial management is in order; it is able to handle fluctuations in milk supply, etc.
(Baltenweck et al., 2016).
A large number of empirical studies suggesting the importance of farmers’ organizations
in improving farm performances which result into their sustainability include the studies
by Mojo et al. (2015) and Chagwiza et al. (2016). Other studies including the study by
Baltenweck et al. (2016) enable to analyse the sustainability performances at PO level.
However, there is no empirical study on to the relationship between sustainability
indicators available at farm level and those relevant at producers’ organizations level.
Hence, there is a need for information on how sustainability of farmers’ organizations
influences sustainability of smallholder milk production farm.
2.5 Factors Influencing Sustainability
The sustainability performance indices could have relationships with other factors like
social and economic factors (Haileslassie et al., 2016; Li et al., 2016). For example,
Gómez-Limón and Sanchez-Fernandez (2010) in Spain, using double censored Tobit
regression, suggest that farm sustainability has a positive relationship with farm size,
proportion of the farmer's income derived from agriculture and participation in
cooperatives; but negative relationship with the age of the farm owner. Similarly,
Dabkiene (2015), using multivariate regression analysis, show that the overall farm
sustainability has negative relationship with farmer’s age. Using Anova, Dabkienė (2015)
suggests that the economic and social sub-indices values were greater in farmer’s age
category under 35 years old and the value of environmental sub-index was greater in the

35
age category of farmer’s over 65 years old. In China, Li et al. (2015) show that non-
farming income has a positive relationship with economic dimension of farm sustainability
and negative relationship with social dimension of farm sustainability. The distance to
market shows a negative relationship with the social farm sustainability dimension.
Indeed, Li et al. (2015) show the age of the head of household has significant positive
effects on the economic and environmental farm sustainability dimensions, but a negative
effect on the social farm sustainability dimension. Education attainment, information
sources, attitude, and awareness were the major determinants of use of sustainable
agricultural land management practices in Nigeria (Simon et al., 2013). Education, number
of training and extension contact had positive and significant contribution towards
sustainability of a dairy farm in India (Rahman, 2011). Since sustainability is context
specific, the factors influencing sustainability might be contextual as well. This implies
that it is crucial to analyse the determinant of farm sustainability in the context being
studied.

36
CHAPTER THREE
3.0 RESEARCH METHODOLOGY
3.1 Study Location
The study was conducted in Kilosa and Mvomero districts of Morogoro Region and
Handeni and Lushoto districts of Tanga Region. Morogoro Region is located between
latitude 5o 58’ and 10o 00’ to the South of the Equator and longitude 35o 25’ and 35o 30’ to
the East, and covers a total area of 72 939 km2 (URT, 1997a). Tanga Region is located
between 4o and 6 o Southern of the Equator and 37o-39o 10' East and occupies an area of
27 348 km2 (URT, 1997b). The annual rainfall varies from 600 mm to 1 200 mm for
Morogoro Region. In Tanga Region, the amount of rainfall is above 750 mm in most
districts. The average temperature is almost regularly around 25oC in most parts of
Morogoro Region. In Tanga, the temperature varies from 20oC to 28oC during cool months
and from 26o to 32o in the hot months. In the two regions, cattle keeping is the second most
important economic activity after crop production.
Cattle keeping in Kilosa and Handeni districts are dominated by pastoralists and agro
pastoralists who raised indigenous cattle and less than 1% improved dairy breeds is kept
by smallholder dairy farmers. These production systems represent “mostly pre-commercial
rural production for rural consumption systems (R-to-R)” (ILRI, 2014a) due to the
remoteness and bad status of infrastructure. Indeed, a large proportion of the produced
milk is consumed locally and often excess left for the calves due to lack of market access,
especially during the rainy season. In Mvomero and Lushoto districts, zero-grazing
systems with improved dairy breeds make up 5% and 24% of production respectively and
represent more “commercial rural production for urban consumption systems (R-to-U)”
(ILRI, 2014a).

37
The study area covered the villages piloted by the project “More milk by and for the poor:
Adapting dairy market hubs for pro-poor smallholder value chains in Tanzania (More
Milk in Tanzania). In the context of the project, a dairy market hub is a connection point
for all agents in a dairy value chain; and it is formed by creating mutually beneficial
business linkages between a group of farmers and dairy value chain actors. The linkages
should ease farmers’ access to inputs and output markets to increased milk supply. The
project aimed to achieve inclusive growth, reduced poverty and vulnerability among
people with dairy-dependent livelihoods in the selected rural areas in Tanzania. The
project was primarily targeted at pre-commercial, marginalized smallholder cattle-keeping
men and women who do not currently participate fully in dairy value chains. For this
purpose, 30 milk producers’ organisations (POs) were established and monitored in the 30
randomly selected villages (one PO per village) in order to help the farmers to better
access dairy inputs, outputs markets, and other embedded services (ILRI, 2014b).
The pro-poor approach that was central to the project is a departure from most
development efforts to date in Tanzanian dairy. Following a national dairy sector situation
study, sites that show potential for the pro-poor approach were screened through GIS-
based spatial mapping of various socio-economic and bio-physical data, followed by
consultation with stakeholders. The GIS-based spatial mapping mainly relied on the
following data: socio-economic data (human population and poverty, market access and
consumption), livestock density and livestock production systems. Other criteria also
mapped and considered were: biomass use / feed requirements, production (represented by
bovine milk production and surplus – deficit areas), spatial distribution of bovine nitrogen
excretion, distribution of bovine CO2 emissions, length of pasture and crop growing

38
period, and relevant trends (projections of consumption of different animal products, feed
surplus / deficits, and growth in livestock numbers) (ILRI, 2014b).
The following districts were selected since they have the potential for the pro-poor
approach: Kilosa and Handeni districts that represent mostly pre-commercial rural
production for rural consumption; and Mvomero and Lushoto districts that represent
relatively more commercial rural production for urban consumption. Urban consumption
centres have been defined as those markets with over 50 000 inhabitants (ILRI, 2014b).
The study districts with their respective milk production systems are shown in Fig. 11.
Key:
R-to-R = Rural production milk sales mostly to rural consumers (pre-commercial)
R-to-U = Rural production milk sales mostly to urban consumers (more commercial)
Figure 11: Livestock farming systems in Morogoro and Tanga Region
Source: ILRI (2014a)

39
3.2 Sampling Procedures and Sample Size
3.2.1 Selection of household
The households were randomly selected from the intervention villages of the project More
Milk in Tanzania in Kilosa and Mvomero districts of Morogoro Region and Handeni and
Lushoto districts of Tanga Region. District (Handeni, Kilosa, Lushoto and Mvomero) and
Hub Type (chilling plant / milk trader) were used as the two main stratification factors to
ensure sufficient households in each District x Hub Type combination. Therefore, 8
‘types’ of households, plus cattle-keeping households in non-project villages were
obtained (Appendix 1).
The project evaluated and compared changes in indicators according to the level of
participation of households in the hub, in terms of: sales of milk to the hub, access of
inputs and services from the hub and membership of producers’ organisations (PO). At the
start of the project, milk sales to hub and access of inputs and services from the hub were
zero as an initial project activity is creation of the hub. However, producers’ organisations
(PO) were already in existence in some project villages and hence this is the only factor
which was used to stratify the sample. In stratifying by PO membership we ensure
sufficient and equal (most efficient) replication to enable comparisons of indicators for
members versus non-members of POs is ensured. To provide the counter-factual group of
households who have no access or opportunity to participate in the project, non-project
villages have been identified and were included in the survey. There was one ‘control’
village representing each district.
The sample size was calculated using More Milk in Tanzania project (MoreMilkIT) baseline
survey data as detailed in ILRI (2014a). Key variable to be considered was the gross margin

40
from dairy per household per year (USD). The following formula was used to calculate sample
size per household type:
N = 2 ×(𝑍𝛼
2+𝑍𝛽 )
2
𝛿2
𝑑2 Equation 1
Where: n (sample size per type of household) = 5, Zα/2 (number of units of standard deviation
at significance level α) = 1.96, Zβ (number of units of standard deviation related to a desired
power) = 0.84, σ (A priori estimate of population standard deviation of gross margin per
household per year) = USD 874.71/year and d = (change / difference in gross margin from
mean from current) = USD 1600/ year. The sample was adjusted using the Equation 2:
DEFF = 1+ δ (n–1) = 1.1; adjusted n = Unadjusted n x Deff = 6 Equation 2
Where; DEFF (Design effect) = 1.1, δ (Intra-class correlation for the statistic in question) =
0,099 and n (Average size of the cluster) = 2.
A sample size of 461 households cattle farmers’ households were randomly selected in
four districts (154, 105, 98 and 104 households in Lushoto, Handeni, Mvomero and Kilosa
districts respectively). The households were randomly selected from 30 project villages
and 4 non project villages in the selected districts. Within each district, a stratified random
sampling (based on farmer group membership) was used to ensure we minimum number
households of group members is obtained. The household lists for all villages were
combined into one list of group members and one of non-members of group. Finally, the
required number of households was randomly selected from each list. Among the selected
households, 158 were members of the project POs while 303 were not member of the
project POs. The number of farm households per type of village is presented in Table 1.

41
Table 1: Number of farm household per village type
District
Village type Group membership Total
number of
cattle Village type Number of
villages
Group
members
Non-group
members
Total
households
Lushoto Project villages 8 47 87 134 1 326
Non-project village 1
20 20
Lushoto Total 9 47 107 154 1 326
Handeni Project villages 8 41 46 87 1 343
Non-project village 1
18 18
Handeni Total 9
64 105 1 343
Mvomero Project villages 7 39 39 78 3 424
Non-project village 1
20 20
Mvomero Total 8
59 98 3 424
Kilosa Project villages 7 31 53 84 538
Non-project village 1
20 20
Kilosa Total 8
73 104 538
Overall Total 34 158 303 461 6 631
Although the study targeted a sample of 461 households, only 431 households
participated. The rest of the households did not respond. According to milk market
channel, the households that participated include 191 and 240 households in rural
production to rural consumption (R-to-R) and rural production to urban consumption (R-
to-U) systems, respectively; while according to the number of graded breeds, the farms
include 275 traditional cattle farms and 156 smallholder dairy farms in order to know
whether dairy systems which have been promoted through milk production intensification
are more sustainable than traditional systems. Some households moved between levels of a
factor during the period between the households’ recruitment and survey. For example,
households might join or leave a PO. Indeed, some farmers in non-project villages
participated in other organizations while others (28 respondents) did not provide
information about PO membership during the data collection period. Among the 423
households of which the PO-membership status was known, 181 households were
members of POs while 242 households were not members of any PO. Among the
household members of POs, 136 households were members of the project POs.

42
3.2.2 Selection of the respondents for the Delphi survey
The study used the Delphi approach to identify relevant indicators for assessing
sustainability in the study context. The Delphi approach is used to generate the most
reliable agreement on a subjective topic by extracting and integrating a group of opinions
from different individuals through a series of questionnaires with controlled feedbacks
(Linstone and Turoff, 2002). The Delphi approach was preceded by selection of key
respondents from the study area. Unlike in household surveys, there is no conventional
sample size for the Delphi technique. Okoli and Pawlowski (2004) suggest that 10-18
respondents are necessary for credible results. This study used a sample of 44 respondents.
In each sector of respondents, a list of potential candidates for the Delphi survey was
developed, then the respondents were randomly selected from the list. The respondents
were selected based on their background and experience in dairy sector, their availability
and willingness to participate in the survey and provide information when needed. The
respondents included academic experts from Sokoine University of Agriculture (SUA) in
all departments dealing with the dairy production; researchers from Tanzania Livestock
Research Institute (TALIRI-Tanga); Livestock extension officers at Ward, District,
Regional and Ministry levels in the study area; NGO workers (Heifer International and
FAIDA-Mali); farmers (Extensive, semi-intensive and intensive systems); farmer trainers
from Livestock Training Agencies (LITA Buhuri, Morogoro and Dar es Salam).
3.3 Data Collection
The data were collected at three levels in order to achieve the study objectives. The levels
are namely the expert and stakeholder level, household level and PO level.

43
3.4 Data Collection at Experts Level
To address the first objective “Establish relevant indicators for assessing sustainability of
smallholder dairy and traditional cattle milk producer farms in the selected areas of
Tanzania”, literature review and consultation with experts and stakeholders, including the
local farmers in each selected district and system, using the Delphi approach were used as
presented in Fig. 12.

44
Figure 12: A two Round Delphi Survey Technique
Source: Adapted from Harmsen et al. (2015)
3.4.1 Selection of initial set of indicators
An initial list of sustainability indicators was developed through literature review and
discussion with experts. Literature review was conducted to identify the key attributes
within economic, social and environmental dimensions of sustainability, an attribute being
Round Experts and stakeholders
Preparation
1st round
2nd round
Calculate mean score and standard
deviation
Collate the indicators into the final list of
relevant indicators
Delphi panel
Identification of potential
indicators through literature
review
Develop the first
round questionnaire
Score each of the
indicators and add other
indicators
Review individual rating in
view of group response
Calculate mean score and
standard deviation and
develop second round
questionnaire
response
Final list of
relevant
indicators
− Produce the initial list of indicators
− Identify experts and stakeholders

45
a feature that can influence negatively (constraints) or positively (opportunities) each
aspect of sustainability (van Calker et al., 2005). Then, measurable indicators were
identified for each attribute. The literature review was coupled with discussions with 15
individual experts, mostly academic personnel, on the identified attributes and indicators,
whereby they proposed additional attributes and indicators. The exercise generated a long
list of indicators which were termed as “initial set”. Then, a two round Delphi approach
with key experts and stakeholders from the study area was used to identify relevant
indicators for assessing sustainability.
3.4.2 Delphi survey
The Delphi survey was conducted in two rounds, each with a specific questionnaire. The
first round questionnaire was developed based on the initial set of indicators. The
questionnaire included two types of questions namely close-ended questions and open-
ended questions (Appendix 2): (1) in close-ended questions where the respondent was
requested to score the indicators in the “initial set” according to their relevance using 5-
point Likert scale (1 = indicator is not important and 5 = indicator is highly important); (2)
in open-ended questions the respondent was requested to add other indicators he / she
thought were relevant and score them using the same scale as in the first set of questions.
Thereafter, the first round questionnaire was pre-tested and refined. During the first round
survey, the respondents were consulted to judge the relevance of all possible indicators
through the pre-tested questionnaire. After filling and returning the first round
questionnaires, the “initial set” and added indicators were compiled; thereafter, the mean
and standard deviation scores were calculated for each indicator. Indicators which did not
meet the criteria of a “good indicator” such as measurability, as previously defined were
excluded from the list, while indicators with similar meanings were merged. The first

46
round survey yielded a long list of all possible indicators applicable in the study area,
which was used for the subsequent second round.
The second round aimed to confirm the responses from the first round in order to get a
consensus. An individual questionnaire was constructed for each respondent who
participated in the first round (Appendix 3). Each questionnaire for the second round
included the results from the first round (the individual, group mean and standard
deviation scores). The respondents were requested to reassign the scores to all the
indicators according to their relevance using the same scale as in the first round. After
collecting the filled questionnaires, the mean and standard deviation scores were
calculated. The standard deviation was used to measure the consensus. Thus, the survey
was terminated as there was at least reasonable consensus (standard deviation score of
each indicator ≤ 1.49) on the relevance of all indicators as described by Henning and
Jordaan (2016). The cut-off point was chosen in order to have a reasonable number of
indicators. The threshold score was subjectively set at 4 in order to have a reasonable
number of relevant indicators. The indicators which scored more than 4 points were
accepted.
3.5 Data Collection at Farm Level
The indicators and indices were calculated using both primary and secondary data. The
primary data were collected through a survey at the household level using a pre-tested
structured questionnaire administered by the researcher (Fig. 13 and Appendix 4). The
primary data consisted of socio-economic and environmental data. Secondary data were
collected to complement primary data in order to calculate sustainability indicators and
indices. Secondary data mostly consisted of the data on women’s empowerment indicator
collected from a survey conducted by the International Livestock Research Institute (ILRI)

47
project and the reference values from the literature, particularly for risk to water quality
indicator.
Figure 13: Interview with typical smallholder farmer in Lushoto District, 2016
3.6 Data Collection at PO Level
The data at PO level were collected through interview with PO key informants and
consultation of important PO documents using Producers’ organizations sustainability
assessment tool (POSA). The necessary PO documents were, for example, PO organogram
/ structure, copies of strategic plans, business plans, annual operating plans and / or other
documents related to vision, mission and plan of activities, policy documents, PO
constitution / bylaws, documents relating to key dairy production, services and inputs
access and market access strategies, plans and projected sustainability performance
(breeding, feed, animal health, milk quality, other), up to date progress records/ reports
and previous assessment reports.

48
3.7 Data Analysis
3.7.1 Procedure for sustainability assessment
The study focused on developing and testing a milk production sustainability assessment
tool. The tool was developed using guidelines of OECD (OECD, 2008) for constructing a
composite indicator and tested it on milk production farms in the study area. Five main
stages were as follows (Fig. 14): 1. Selection of relevant indicators, 2. Measurement of
indicators, 3. Normalization of indicators, 4. Aggregation of indicators into sustainability
indices and 5. Testing the developed tool.
Figure 14: Framework for milk production farm sustainability assessment
Source: Adapted from Gómez-Limón and Sanchez-Fernandez (2010); Vitunskiene
and Dabkiene (2016)
Prevailing contexts Other contexts
Existing tools/indicators
Irrelevant indicators Relevant indicators
Not easy to measure Threshold Raw value
Normalized indicator
Weighed indicators
Sustainability sub-index
Sustainability assessment index
Misleading indicators Refined tool
Intervention→ Sustainability change
Other factors→ Sustainability change
Indicators selection:
− Literature
− Consultation with
experts and
stakeholders
Aggregation: Linear aggregation
Testing: Farm survey
Measurement: Literature
Normalization: Mini-Max
Weighting: Factor Analysis
Application of the tool
Other interfering factors
Local indicators
Irrelevant

49
3.7.1.1. Rationale for indicators selection
A set of relevant indicators was derived from literature review, and consultation with
experts and stakeholders using the Delphi technique. The relevant indicators previously
obtained through the Delphi technique (the first objective) were thoroughly screened so as
to remain with 15 that satisfy the main criteria of a good indicator, namely, easy to
implement, relevant for end user, comprehensibility and data availability as described by
Parent et al. (2010). The selected indicators and their respective attributes are shown in
Table 2.
Table 2: Selected indicators for assessing sustainability of milk production farms in
Tanzania
Dimension Attribute/Issue Measurable Indicator
Economic
Profitability 1. Income per litre of milk
Productivity 2. Cow productivity
3. Labour productivity
Feed availability 4. Feed conservation
Animal health 5. Animal diseases control (Vaccination and parasite control)
Animal genetics 6. Breeding system
Forage self-sufficiency 7. Forage self-sufficiency
Social
Knowledge 1. Participation in farmer trainings
2. Education level of the farm manager
Farmers’ organization 3. Participation in organizations
Gender equality 4. Women’s empowerment
Environment
Land ownership 1. Land ownership
Water quantity 2. Access to water
Water quality 3. Distance between manure disposal and water source/way
Land degradation 4. Erosion control
(a) Economic indicators
Income from milk was used to assess profitability as it ought to be among the major farm
outputs in the studied systems. The income should be generated efficiently through better
use of factors of production. Therefore, two indicators, “labour productivity” and “cow
productivity”, were used to determine the farm productivity. Use of artificial
insemination technology was used as economic indicator since it is among the most
50
effective way for upgrading the genetics of predominant indigenous cattle in the study
area, thus, increased cow productivity. Sustainable increase in milk production through
improved genetics cannot be made possible without feed being available the whole year
round and at low cost. Therefore, “feed conservation” and “forage self-sufficiency”
indicators were used to assess the seasonal feed fluctuation and dependence on external
forage supply. Animal health was used as economic indicator, due to the economic loss
that it could create if animals suffered ill-health.
(b) Social indicators
Farmers need knowledge and skills for a good management of farm activities. The farmer
could get this knowledge through formal or informal education and training. Hence, two
indicators “participation in training” and “education level” were used to assess
knowledge acquisition. “Participation in organizations” was selected as it allows the
farmers to have a bargaining power, which enable them to easily get input and services,
especially in the case of the remote area. In the study area, women are among the main
actors of dairy value chain. However, they do not have enough access to the main
resources and decision making over use of income. This situation made “women’s
empowerment” an important social indicator.
(c) Environmental indicators
Livestock keeping activity is land demanding. Therefore, land ownership was used as a
relevant indicator. Milk production farming could have negative impact on soil, including
soil erosion. We used “erosion control” as a relevant indicator. Availability of water was
used as crucial environmental indicator as farming is not possible without available water
the whole year. On the other hand, the cattle can contaminate water by manure, especially

51
when the manure is stored near the water way. Therefore, the distance between manure
store and water way was used as proxy for assessing water quality.
3.7.1.2 Framework for measuring indicators
The most relevant indicators were assigned respective measurements. The measurements
were designed considering their data availability and cost as suggested by Parent et al.
(2010). Some indicators were measured directly while others were measured indirectly
using a proxy or an adapted index. Moreover, some indicators were measured using the
existing indices which were adapted to the study context. The indicators whose data were
difficult to obtain were removed and eventually remain with 15 indicators instead of 29
previously selected (the first objective).
(a) Economic indicators
Income from milk production was measured through gross margin (GM) per litre of
milk (l) as a proxy. The gross income was calculated by deducting the variable costs (VC)
related to milk production from the milk revenues (MR) over the quantity of milk (QM)
during the study period. The main variable costs in the studied systems include feed,
labour, drugs and vet service cost:
𝐺𝑟𝑜𝑠𝑠 𝑀𝑎𝑟𝑔𝑖𝑛 𝑝𝑒𝑟 𝑙𝑖𝑡𝑟𝑒 𝑜𝑓 𝑚𝑖𝑙𝑘 (𝑇𝑠ℎ/𝑙) =∑(𝑀𝑅−𝑉𝐶)
𝑄𝑀 Equation 3
Where, QM (l) = Sum of all quantity of milk produced; MR (TZS) =∑ QM × milk price;
VC=∑ Variable costs (Cost of feed, labour, drugs and cost ofvet service )
Cow productivity was calculated by dividing the average quantity of milk produced per
day (QM/d) by the average number of milking cows over one year (NC):
𝐶𝑜𝑤 𝑝𝑟𝑜𝑑𝑢𝑐𝑡𝑖𝑣𝑖𝑡𝑦 (𝑙/𝑐𝑜𝑤/𝑑𝑎𝑦) =𝑄𝑀/𝑆𝑡𝑢𝑑𝑦 𝑝𝑒𝑟𝑖𝑜𝑑
𝑁𝐶 Equation 4
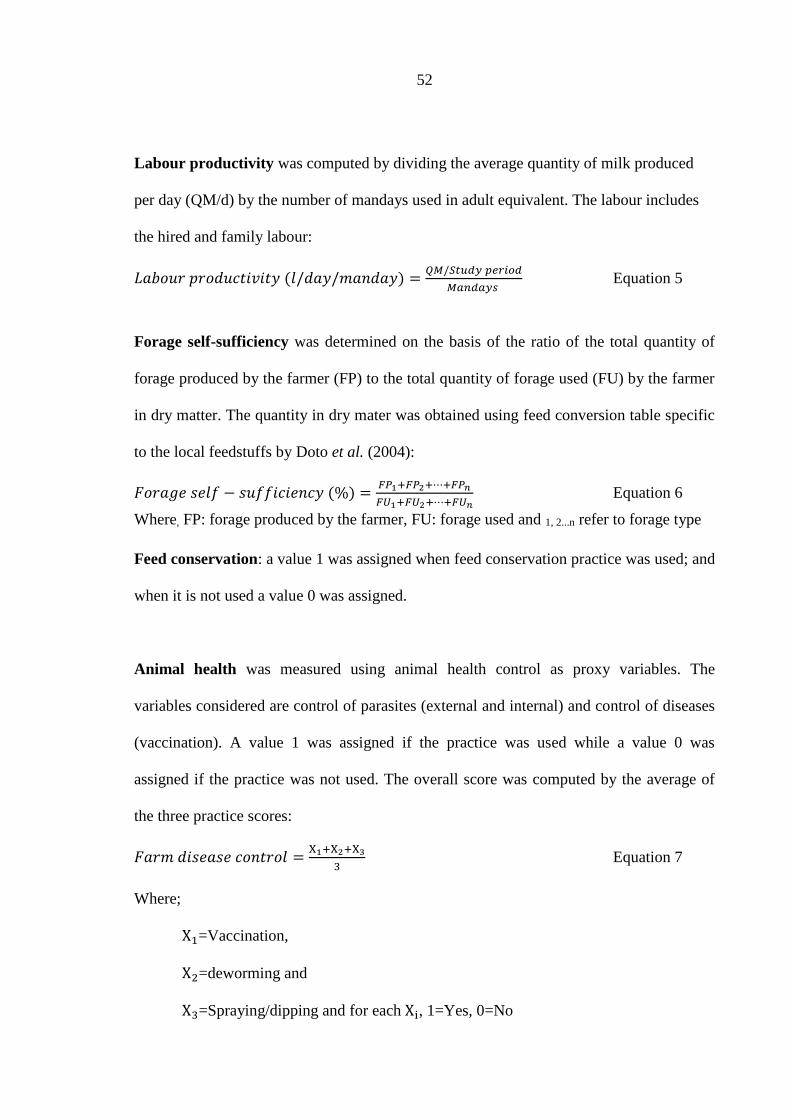
52
Labour productivity was computed by dividing the average quantity of milk produced
per day (QM/d) by the number of mandays used in adult equivalent. The labour includes
the hired and family labour:
𝐿𝑎𝑏𝑜𝑢𝑟 𝑝𝑟𝑜𝑑𝑢𝑐𝑡𝑖𝑣𝑖𝑡𝑦 (𝑙/𝑑𝑎𝑦/𝑚𝑎𝑛𝑑𝑎𝑦) =𝑄𝑀/𝑆𝑡𝑢𝑑𝑦 𝑝𝑒𝑟𝑖𝑜𝑑
𝑀𝑎𝑛𝑑𝑎𝑦𝑠 Equation 5
Forage self-sufficiency was determined on the basis of the ratio of the total quantity of
forage produced by the farmer (FP) to the total quantity of forage used (FU) by the farmer
in dry matter. The quantity in dry mater was obtained using feed conversion table specific
to the local feedstuffs by Doto et al. (2004):
𝐹𝑜𝑟𝑎𝑔𝑒 𝑠𝑒𝑙𝑓 − 𝑠𝑢𝑓𝑓𝑖𝑐𝑖𝑒𝑛𝑐𝑦 (%) =𝐹𝑃1+𝐹𝑃2+⋯+𝐹𝑃𝑛
𝐹𝑈1+𝐹𝑈2+⋯+𝐹𝑈𝑛 Equation 6
Where, FP: forage produced by the farmer, FU: forage used and 1, 2...n refer to forage type
Feed conservation: a value 1 was assigned when feed conservation practice was used; and
when it is not used a value 0 was assigned.
Animal health was measured using animal health control as proxy variables. The
variables considered are control of parasites (external and internal) and control of diseases
(vaccination). A value 1 was assigned if the practice was used while a value 0 was
assigned if the practice was not used. The overall score was computed by the average of
the three practice scores:
𝐹𝑎𝑟𝑚 𝑑𝑖𝑠𝑒𝑎𝑠𝑒 𝑐𝑜𝑛𝑡𝑟𝑜𝑙 =X1+X2+X3
3 Equation 7
Where;
X1=Vaccination,
X2=deworming and
X3=Spraying/dipping and for each Xi, 1=Yes, 0=No
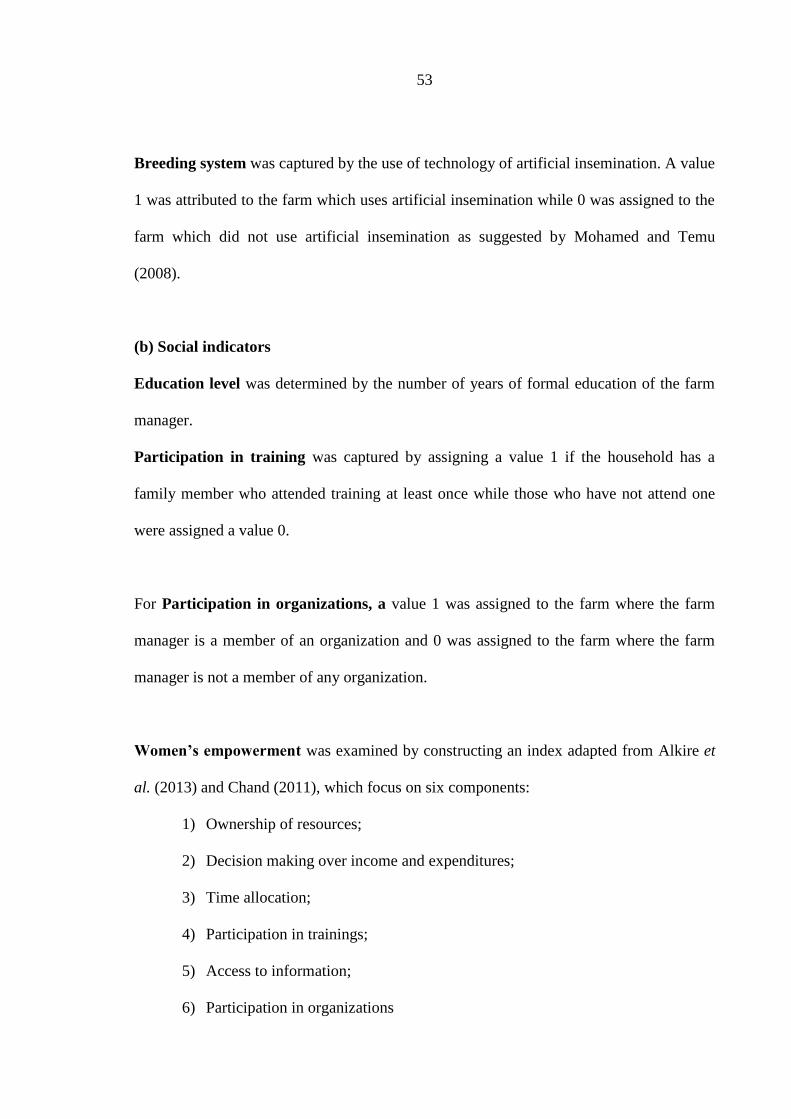
53
Breeding system was captured by the use of technology of artificial insemination. A value
1 was attributed to the farm which uses artificial insemination while 0 was assigned to the
farm which did not use artificial insemination as suggested by Mohamed and Temu
(2008).
(b) Social indicators
Education level was determined by the number of years of formal education of the farm
manager.
Participation in training was captured by assigning a value 1 if the household has a
family member who attended training at least once while those who have not attend one
were assigned a value 0.
For Participation in organizations, a value 1 was assigned to the farm where the farm
manager is a member of an organization and 0 was assigned to the farm where the farm
manager is not a member of any organization.
Women’s empowerment was examined by constructing an index adapted from Alkire et
al. (2013) and Chand (2011), which focus on six components:
1) Ownership of resources;
2) Decision making over income and expenditures;
3) Time allocation;
4) Participation in trainings;
5) Access to information;
6) Participation in organizations

54
The women’s empowerment indicator was computed by the mean average of all
components scorers by adapting procedure by Chand (2011) and Yasmin and Ikemoto
(2015):
𝑊𝑜𝑚𝑒𝑛′𝑠 𝑒𝑚𝑝𝑜𝑤𝑒𝑟𝑚𝑒𝑛𝑡 =X1+X2+X3+X4+X5+X6
Cn Equation 8
Where;
X1= Ownership of resources,
X2= decision making over income and expenditures,
X3= time allocation
X4= participation in training,
X5=access to information,
X6= participation in organizations and
Cn= number of components.
Each component was quantified as follows:
• Ownership of resources: It was computed by averaging land ownership, cattle
ownership and access to credit. Where, access to credit was determined by giving a
value 1 if the woman has access to credit and a value 0 if the woman did not have
access to credit. Livestock ownership and land ownership was calculated by the
ratio of quantity of item owned by the women either alone or jointly to all
respective quantity of items owned by the household.
• Decision making over income and expenditures was determined by four sub-
components: decision in using income from livestock and crops, and decision
making in major and minor expenditure. Decision making was measured by giving
a value 1 if the women decide alone, 0.5 if women decide conjointly with men and
0 if they are not consulted in the decision making. The overall decision was
measured by the average for the four sub-components.
• Time allocation productive and domestic workload: a value 1 was assigned if a
woman worked less than 10.5 hours the day before the survey, and 0 value was

55
assigned if a woman worked more than 10.5 hours as suggested by Alkire et al.
(2013).
• Participation in trainings was captured by assigning a value 1 if at least one
woman member of household has attended at least one training and 0 value if no
woman has not attended any training.
• Access to information: a value 1 was assigned if the woman had access to
livestock information and a value 0 was assigned to those without access to
information.
• Participation in organizations: A value 1 was assigned to the farm of which at
least one woman is a member of any organization and 0 was assigned to the farm
where there is no woman participating in organizations.
(c) Environmental indicators
Soil erosion control was captured by assigning a value 1 if the farmer used erosion control
method and a value 0 when he/she did not use.
Water availability: a value 1 was assigned to a farm with access to water throughout the
year and 0 was assigned to a farm that experienced a shortage of water at least once.
Water quality was determined using the distance between manure storage and water way
as proxy for quality.
Land ownership was measured by attributing a value 1 if the household owned a land
with title and a value 0 was assigned to the farms without land or with land without title.
3.7.1.2 Normalization of indicators
The normalization of indicators aimed at generating dimensionless indicators to enable
their aggregation into sub-indices and an overall index. Mini-max procedure was used as

56
described by the OECD (2008). The approach consists of subtracting the minimum value
from the observed value, and dividing by the difference between the maximum and
minimum values. Minimum and maximum thresholds were either obtained from the
literature, computed from the sample, or assigned by experts depending on the availability
of information. For the thresholds computed from the sample, the maximum was the
average of the top 10% highest value while the minimum was the average of the lowest
10% as suggested by Chand et al. (2015). For indicators with positive association with
sustainability, the following formula was used:
𝐼𝑖𝑗 =𝑋𝑖𝑗−𝑀𝑖𝑛𝑋𝑖𝑗
𝑀𝑎𝑥𝑋𝑖𝑗−𝑀𝑖𝑛𝑋𝑖𝑗 Equation 9
Where;
Iij = Normalized value of the indicator;
Xij= Actual value of the indicator I in sub-Index j;
MinXij = The minimum (lowest) value of the indicator Xij;
Max = the maximum (highest) value of the indicatorXij.
For the indicators which have negative association with sustainability, the formula (1- Iij)
was used. The Table 3 shows the reference values for the selected indicators.

57
Table 3: Reference values for the selected indicators
Dimension Selected indicator Reference values
Economic
1. Income per litre of milk Min: Average of the 10% lowest values
Max: Average of the 10% highest values
2. Cow productivity Min: Average of the 10% lowest values
Max: Average of the 10% highest values
3. Labour productivity Min: Average of the 10% lowest values
Max: Average of the 10% highest values
4. Forage self sufficiency Min=0
Max=1
5. Animal genetics Min=0
Max=1
6. Feed conservation Min=0
Max=1
7. Animal health Min=0
Max=1
Social
1. Participation in farmer
trainings
Min=0
Max=1
2. Education level of the farm
manager
Min=0
Max=7
3. Participation in organizations Min=0
Max=1
4. Women’s empowerment Max=1
Min=0
Environment
1. Land ownership Min=0
Max=1
2. Water availability Min=0
Max=1
3. Distance between manure
disposal and water /way
Min=0m
Max=10m
4. Erosion control Min=0
Max=1
3.7.1.3 Weighting and aggregation of indicators into sustainability indices
The normalized indicators were aggregated into sub-indices (Economic, social and
environmental sub-indices), and the sub-indices were aggregated into one overall
sustainability index (SI). The individual indicators were assigned weights using Factor
Analysis as suggested by (OECD, 2008). In fact, the individual indicators with the highest
factor loading were grouped into intermediate composites and were aggregated by
attributing a weight of each equals the proportion of explained variance in the data set
(Appendix 5). The economic, social and environmental dimensions were assigned equal

58
weight (1/3) by assuming that the sustainability dimensions are equally important as
suggested by Meul et al. (2008). The weight for each indicator according to the results
from factor analysis is given in Table 4.
Table 4: Weight of sustainability indicators
Dimension Weight Indicator Weight
Economic 1/3 1. Income from milk production 0.13
2. Cow productivity 0.31
3. Labour productivity 0.11
4. Percentage of grown fodder 0.16
5. Animal health 0.11
6. Use of artificial insemination technology 0.03
7. Feed conservation program 0.15
Social 1/3 1. Education level 0.14
2. Participation in trainings 0.35
3. Participation in farmers’ organizations 0.37
4. Women’s empowerment 0.14
Environment 1/3 1. Erosion control
2. Distance between manure storage/disposal and the
water way
3. Water availability through the year
4. Land ownership
0.01
0.43
0.18
0.38
The linear aggregation was used to consolidate individual indicators into respective sub-
indices and the overall index. The aggregation was performed as follows:
− Sub-Indexj = ∑ WijIijnj=1 and Equation 10
For i=1, 2, 3…..n; j=1, 2 and 3
− SI =∑ 0.33n=3j=1 Sub − Indexj. Equation 11
Where;
Sub-Indexj: sustainability sub-index for dimension j (1=economic, 2=social and
3=environmental Sub-Index);
Iij Normalized value of indicator I in sub-index j;
Wij denotes the weight of the indicator i for the sub index j and with ∑ Wj = 1n=j ;
SI= overall sustainability index.

59
3.7.1.4 Test of the developed sustainability assessment tool
The tool was tested on 431 households sampled in the study area. The farms were
classified according to milk marketing channel and the number of graded cattle. The
sustainability performance indicator and index scores were ranked from 0 to 1 and
grouped into three categories of sustainability indicator / index scores namely weak (<
0.33), medium (0.33 ≤ and < 0.66) and high (≥ 0.66) as suggested by Vitunskiene and
Dabkiene (2016).
3.7.2 Framework for assessing farm sustainability
The framework for assessing sustainability was developed based on the most relevant and
representative set of indicators, out of the set of the indicators generated by the
consultation with experts and stakeholders. The most relevant indicators were selected
based on the criteria of an ideal indicator namely practicality (easy to implement and
comprehensible immediately) and usefulness (adapted to the objectives and relevant for
users) as suggested by Parent et al. (2010). The indicators which are difficult to measure at
farm level, expensive in terms of their measurability or whose data are difficult to get were
dropped out. The set of indicators was checked for parsimony: selected indicators are not
redundant and are few in number to ensure readability and manageability as proposed by
Bossel (1999) and Binder (2010). Indeed, the sustainability indicators were narrowed
down in order to perform a rapid sustainability assessment (RSA) as suggested by
Marchand et al. (2014). The RSA suggests that the data for calculating the selected
indicators are easily available at low cost. Therefore, the indicators which are difficult to
measure and / or of which the data are difficult to obtain or time consuming were
withdrawn from the set of indicators to be used in the framework. More details on how the
indicators considered as relevant by experts and stakeholders were narrowed down to have

60
the manageable set and the respective questionnaire on farm data collection are presented
in Appendices 6 and 7, respectively.
3.7.3 Assessment of PO sustainability performances
Producers’ organization (PO) sustainability assessment was carried out using milk
Producers’ Organisation Sustainability Assessment tool (POSA). The tool, developed by
ILRI and partners within the EADD project (Mutinda et al., 2015; Baltenweck et al.,
2016), has six dimensions which cover production and business/marketing aspects. Each
dimension is made of basic sub-dimensions and each sub-dimension is also an aggregation
of measurable indicators (Table 5).
Table 5: Dimensions and sub-dimensions for producers’ organizations sustainability
assessment tool (POSA)
PO sustainability performance
Dimension Sub-dimension
Financial health Net Profit Margin
Business units lost
Liquidity
Capital structure
Engagement with output buyers Milk quality
Market reliability
Suppliers
Effective and transparent leadership
and management
Representation participation
Effective supervision
Effective management
Access to dairy production inputs
and services
Feed and feeding
Genetics
Health
Extension
Financial services
Relations with external environment Partnership actors
Social responsibility
Member loyalty Patronage
Member investment
Ownership
Member loyalty programs
Source: adapted from Mutinda et al. (2015)

61
The results for indicator and index scores were ranked from zero to one, where 0 is the
lowest performance and 1 is the highest performance. The overall PO sustainability
performance scores were categorized into four stages namely stage I (0 - 0.19), stage II
(0.2 - 0.39) stage III (0.4 - 0.59) and stage IV (≥ 0.6). The POs at stage I may have an
interim board, have not held elections, have no staff, etc. while the POs at stage IV are
regarded as on the way to independence (Baltenweck et al., 2016). The details on
indicators scoring, aggregation, presentation and interpretations are provided in Appendix
8. Fig. 15 shows the PO-members discussing the results of their PO after sustainability
assessment exercise.
Figure 15: Farmers discussing the results from PO sustainability assessment in
Kilosa District, 2016
3.7.4 Descriptive statistics
Descriptive statistics were computed to determine the means, standard deviations, frequencies
and percentages depending on the nature of the data being used for each objective. For the
first objective, means and frequencies were used to analyse the respondents’

62
characteristics. In addition, the mean and standard deviation scores for each indicator were
computed to analyse the relevance of indicators and measure the consensus between the
respondents on the relevance of the indicators, respectively. The indicators were
considered relevant if the mean score is equal or above 4 points. The consensus was
considered reasonable if the standard deviation score of each of the indicators ≤ 1.49 as
described by Henning and Jordaan (2016).
For the second objective, the mean and standard deviation scores were used to describe
farm sustainability performances.
For the third objective, means and frequencies were used to understand the producers’
organization (PO) characteristics. The mean scores were used to understand farm
sustainability performances within PO members and non-PO members. In order to achieve
the fourth objective, descriptive statistics were computed using frequencies and means to
describe farm socio-economic characteristics.
3.7.5 Comparison of different production systems
The sustainability mean performance scores (indicators, dimensions and sustainability
indices) for all dimensions (Economic, social and environmental dimensions) were
compared between the farming systems (Rural production to rural consumption and Rural
production to urban consumption systems; traditional cattle system and smallholder dairy
farms) / PO-member farmers and non-PO-member farmers using two-tailed Student’s t-
test. The socio-economic characteristics were compared between R-to-R system and R-to-
U system using two-tailed Student’s t-test and chi-square for the means and proportions
respectively. The difference between means / frequencies was considered significant for p
Value < 0.05.

63
3.7.6 Relationship between PO and farm sustainability
Correlation analysis was used to establish the relationships between PO and farm
sustainability performance indicators and indices. The purpose of the relationships was to
understand whether farm and PO sustainability performances vary together. Pearson’s
correlation coefficient (r) was used to analyse the strength of the relationships. The
relationships were grouped into three categories depending on their strengths namely weak
(0 ≤ r < 0.3), moderate (0.3 ≤ r < 0.5) and strong (0.5 ≤ r ≤ 1). The correlations were
considered statistically significant if p-value < 0.05.
3.7.7 Determinants of farm sustainability
The double censored Tobit regression model was employed to identify the determinants of
farm sustainability. The model was used since the sustainability indices (dependent
variable) can vary from 0 to 1. Two analysis were performed: the analysis of the influence
of PO dimension performances on farm sustainability and socio-economic determinants of
farm sustainability for the third and the fourth objectives, respectively. For each objective,
we used four separate Tobit regressions models respectively for the economic, social,
environmental and overall sustainability performance indices. Each model in these cases
can be expressed as follows (Tobin, 1958):
𝑦𝑖∗ = β𝑋𝑖 + ɛi i=1, 2, 3 ...N,
𝑦𝑖 = {𝑦𝑖
∗ 0 < 𝑦𝑖∗ ≤ 1
0 0 > 𝑦𝑖∗ 𝑜𝑟 𝑦𝑖
∗ > 1
Where, N is the number of observations, yi is the dependent variable (economic, social,
environmental and overall sustainability indices), xi is a vector of independent variables, β
is a vector of estimable parameters, and εi is a normally and independently distributed
error term with zero mean and constant variance σ2 and 𝑦𝑖∗ is the latent variable.

64
The social economic independent variables used in the model are x1 = CREDIT, x2 = SEX,
x3 = AGE, x4 = FARMSIZE, x5= HERDSIZE, x6=HHSIZE, x7=FEEDING, x8=
DISTANCE, x9=MARITAL. The PO independent variables used in the model are x1 = FH,
x2 = EOB, x3 = ET, x4 = ADPIS, x5= REE, x6= ML.
The age of the household head was used as explanatory variable since it is associated with
experience and endowment of resources which enable to adopt new technology towards
sustainable agriculture (Arellanes and Lee 2003). On the other hand, the more advanced
age is associated with lag in new technology implementation (Dabkienė 2015). It was
hypothesised that women lag behind in implementing new technology and other
sustainable practices compared to men, as they have lower access to information and
resources. Landholding is important since the farmers with a large parcel of land may be
able to spare a portion for feed cultivation which improve economic sustainability (by the
definition used here). A large herd could have negative effect on sustainability especially
when the farmer does not have enough land. Household size is crucial in terms of labour
availability. Access to credit could influence the adoption of new technology and access to
production factors such as inputs and services, especially for the poor farmers who are
resource constrained. Grazing could have negative impact on natural resources, low
adoption of new technology and social impact like conflicts with crop farmers especially
in the case of land scarcity. It was hypothesized that the unmarried, especially widows are
marginalized, which could have negative impact on farm sustainability. The independent
and dependant variables are described in Table 6.

65
Table 6: Description and measurement of socio-economic independent and
dependent variables
Variables Description Measurement Expected
sign
Independent variables
AGE Age of household head Years +/-
SEX Gender of household head Binary variable (Binary:1 = female; 0 = male) -
FARMSIZE Size of land owned by household Acres +
HERDSIZE Number of cattle owned by household Number of heads of cattle - MARITAL Marital status of household head Binary variable (1 = Married; 0 = Otherwise) +
HHSIZE Number of people in a household Adult equivalent +
FEEDING Type of cattle feeding system Binary variable (1 = Intensive; 0 = Extensive) +
CREDIT Household received credit in last 6 months Binary variable (1 = Yes; 0 = No) +
DISTANCE Distance of household from nearest trading
centre Km -
Dependant variables
ECONOMIC The farm is economical viable Index N/A
SOCIAL The farm is socially acceptable Index N/A
ENVIRONMENT The farm is environmental friendly Index N/A
OVERALL
SUSTAINABILITY The farm is sustainable Index N/A
N/A: Not applicable
For the PO sustainability dimensions, we used all sustainability dimensions at PO as
dependant variables. We assumed that all variables would have a positive effect on farm
sustainability performance indices. The Description of PO level independent and
dependent variables is shown in Table 7.
Table 7: Description and measurement of PO level independent and dependent
variables
Independent variable Description Expected sign
FH Financial health +
EOB Engagement with output buyers +
ET Effective and transparent leadership and management +
ADPIS Access to dairy production inputs and services +
REE Relations with external environment +
ML Member loyalty +
Dependant variables
ECONOMIC The farm is economical viable N/A
SOCIAL The farm is socially acceptable N/A
ENVIRONMENT The farm is environmental friendly N/A
OVERALL
SUSTAINABILITY The farm is sustainable N/A
N/A: Not applicable
For both farm level and PO level studies, two statistics software were used for data
analysis depending on the type of analysis. For descriptive statistics, comparison of means

66
and correlations were computed using IBM-SPSS-statistics 20 computer software
package. The both social economic determinant of farm sustainability and effect of
producers’ organization sustainability dimensions on far sustainability performance
indices were analysed using Stata software (Stata version 13, Lakeway Drive College,
Texas, USA).

67
CHAPTER FOUR
4.0 RESULTS
4.1 Indicators for Assessing Sustainability of Milk Production Farms in Tanzania
4.1.1 Characteristics of respondents
This study used 44 respondents to develop a more robust set of indicators. The categorical
distribution of the respondents is shown in Table 8. The respondents comprised academic
experts from Sokoine University of Agriculture (SUA), researchers from Tanzania
Livestock Research Institute (TALIRI-Tanga), livestock extension officers at Ward,
District, Regional and Ministry levels in the study area, NGO workers (Heifer
International and FAIDA-Mali), farmers from the study area (extensive, semi-intensive
and intensive systems) and farmer trainers from Livestock Training Agencies (LITA
Buhuri, Morogoro and Dar es Salam). The majority of respondents were livestock officers,
followed by the academic staff members. One quarter were female. The experience of the
respondents was reasonably evenly distributed except the small proportion of respondents
that had above 30 years of experience within dairy sector.
Table 8: Categorical distribution of respondents (n=44)
Category Frequency
Sector
Academic department staff member 11
LITA instructor and trainer 5
Farmer (extensive, semi-intensive and intensive systems) 8
Government livestock field officers 14
NGO (FAIDA-MALI and Heifer International) 2
Researcher 4
Gender
Male 32
Female 12
Experience in dairy production (Years)
Below 10 14
11 to 20 11
21 to30 14
Over 30 5

68
4.1.2 Sustainability indicators
Results of literature review and discussions with individual experts are summarized in
Table 9. The exercise generated a long list of indicators termed “initial set” of 57
indicators which comprised 28 economic, 13 social and 16 environmental indicators.
Table 9: “Initial set” of indicators for assessing sustainability in Morogoro and
Tanga Regions
Economic (n=28) Environmental (n=16) Social (n=13)
(1) Source of capital 1
(2) income per litre of milk2
(3) Benefit-cost ratio 4
(4) Cost of milk production 5
(5) Capital productivity5
(6) Labour productivity 8
(7) Feed productivity 5
(8) Cow productivity 19
(9) Source of feed 11
(10) Source of labour 12
(11) Access to credit 13
(12) Off-farm income 11
(13) Access to milk Markets 13
(14) Keeping written records 14
(15) Access to input market*
(16) Access to milk storage and
logistics*
(17) Access to value addition*
(18) Cost of hired labour*
(19) Vaccination program 14
(20) Prophylactic treatment program 14
(21) Prevention measures of entry of
disease 14
(22) Animal living environment 15
(23) Animal-Based welfare 16
(24) Education level of the farm
manager11
(25) Milk hygiene 11
(26) Breeding system5
(27) Percentage of improved breeds in
the farm*
(28) Breeding facilities*
(1) Proportion of manure used 5
(2) Type of floor surface for
manure storage 10
(3) Covering manure store 10
(4) Runoff flowing into the
manure storage area 10
(5) Manure storage runoff 10
(6) Greenhouse Gas emission 5
(7) Livestock stocking density 11
(8) Land ownership3
(9) Distance from water
source/way*
(10) Animal access to water
body*
(11) Soil conservation and
erosion*
(12) Percentage of improved
breeds
(13) Water conservation/
Harvesting*
(14) Grazing on formally
demarcated land*
(15) Animal farm/Backyard
production*
(16) Water Use Efficiency*
(1) Age of the farm
manager 18
(2) Working time 11
(3) Off days from work 12
(4) Workload distribution 5
(5) Gender equality 13
(6) Work sharing 5
(7) Participation in farmer’
training 17
(8) Participation in
farmers’ organization 13
(9) Ownership of the farm
*
(10) Benefit from farmers’
organization*
(11) Cattle bandits control*
(12) Distance between living
house and manure
disposal*
(13) Protection during
manure handling*
1(Van Cauwenbergh et al., 2007); 2(Elsaesser et al., 2013); 3(Atanga et al., 2013); 4(Roy and Chan, 2012);
5(Chand et al., 2015); 6(Meul et al., 2008); 7(Sauvenier et al., 2005); 8(van Der Meulen et al., 2013);
9(Slavickiene and Slavickiene, 2014); 10(Rufino et al., 2007); 11 (Lebacq et al., 2013); 12(Arandia et al.,
2011); 13(Smith et al., 2015); 14(FAO-IDF, 2011); 15(Bekhouche-Guendouz, 2011); 16(Meul et al., 2012);
17(Majewski, 2013);18(Danttsis et al., 2010); 19(van Calker et al., 2005); 20(Alkire et al., 2013); * Indicators
proposed by academic experts.

69
The Delphi exercise yielded a final set of 29 considered most relevant indicators, which
comprised 18 economic, four (4) social and seven (7) environmental indicators. The most
relevant indicators were also grouped into 16 attributes which consist of nine (9)
economic, three (3) social and four (4) environmental attributes. The response rate was
98.7% for the first round and 88.4 % for the second round. The mode of highest standard
deviation score used to measure the consensus decreased from 1.5 for the first round to 1.4
for the second round. The results for the first and second rounds for indicators which
scored 4 and above in the second round are presented in Table 10, while the results for all
the indicators are presented in Appendix 9.

70
Table 10: List of accepted indicators for assessing sustainability of milk production
farm in Morogoro and Tanga
Aspect Attribute/Issue
(n=16)
Measurable Indicator(n=29) 1st round 2nd round
SD 𝐗 SD 𝐗
Economic Profitability (1) Income per litre of milk 1.0 4.4 0.8 4.5
Efficiency
(2) Cow productivity 1.0 4.4 0.6 4.6
(3) Feed productivity 1.2 4.1 0.8 4.3
(4) Labour productivity 0.9 3.9 0.7 4.0
Feed availability (5) Feed conservation* 0.0 5 0.9 4.1
Access to market (6) Access to milk market 0.9 4.5 0.6 4.7
(7) Access to input market 1.2 4.1 0.8 4.3
Keeping farm
record
(8) Farm record keeping 1.2 4.1 1.1 4.3
Milk quality and
safety
(9) Milk hygiene 0.9 4.5 0.5 4.8
Animal health and
welfare
(10) Vaccination as recommended 1.0 4.4 0.8 4.5
(11) Prophylactic treatment as
recommended
0.8 4.3 0.6 4.4
(12) Prevention measures of entry of
disease onto the farm
1.0 4.1 0.8 4.4
(13) Use of drugs as recommended* 0.9 4.1 0.8 4.2
(14) Animal living environment condition 0.9 4.1 0.8 4.2
(15) Availability of vet service* 0.8 4.1 0.7 4.3
Animal genetics (16) Breeding system 0.7 4.1 0.8 4.3
Independence (17) Source of capital 1.1 3.9 1.0 4.1
(18) Source of feed 1.1 4.0 1.0 4.1
Social Knowledge
(1) Participation in farmer training 1.2 3.8 1.0 4.1
(2) Education level of the farm manager 1.2 3.9 1.0 4.0
Farmers’
organization
(3) Participation in organization 1.1 4.0 0.9 4.0
Gender equality (4) Women empowerment 1.0 4.1 0.9 4.1
Environment Land ownership (1) Land ownership 1.0 4.3 0.7 4.5
Water quantity (2) Water conservation/ Harvesting 1.1 4.3 0.8 4.6
(3) Access to water* 0.0 5 0.7 4.6
Water quality
(4) Animal access to water body 1.4 4.0 0.7 4.4
(5) Distance between manure disposal
and water source/way
1.1 4.1 0.8 4.3
Land degradation (6) Livestock stocking density 1.5 3.9 1.1 4.1
(7) Soil conservation and erosion 1.3 4.0 1.3 4.0
*Indicators added by the respondents; Cut-off point: Mean ≥ 4.0; X̅: Mean; SD: Standard deviation
The relevance of some indicators was higher than others. For economic aspects, milk
hygiene (4.8 points) was the most relevant indicator followed by access to milk markets
(4.7 points), cow productivity (4.6 points) and income per litre of milk (4.5 points). For
environmental indicators, the most relevant indicators were access to water (4.6 points),
water conservation (4.6 points) and land ownership (4.5 points). For social indicators, the
most relevant indicators were participation in farmer training (4.1 points), women’s

71
empowerment (4.1 points) and education level (4.0 points). However, some indicators like
age of the farmer, day-off from work, greenhouse gas emissions, manure management and
protection during manure handling among others were scored at very low or zero
importance by the respondents.
Results from the second round show that the relevance of some indicators varies among
the respondents’ categories. The indicators which were considered relevant by at least one
group of respondents, per each indicator, were 40. Most of the economic indicators were
accepted by all groups of respondents. For social aspects, the farmers accepted more
indicators than other groups (six social indicators). The groups of technical personnel
(livestock officers and trainers) accepted only women’s empowerment and participation in
organization as relevant social indicators while the group of academics and researchers
accepted education level of the farm manager and participation in farmers’ training as
relevant. For environment aspects, farmers selected fewer indicators compared to other
groups. The accepted indicators according to respondents’ categories are presented in
Table 11.

72
Table 11: List of accepted indicators for assessing sustainability of milk production
farm in Morogoro and Tanga, according to respondents’ groups
Aspect Indicator (40) Ac+Re Farmer Lo+Tr
�̅� SD �̅� SD �̅� SD
Economic
(1) Net income per litre of milk 4.4 0.8 4.7 0.8 4.3 1.1 (2) Capital productivity 4.1 0.9 4.3 0.8 3.9 0.9
(3) Labour productivity 4.0 0.6 4.0 0.6 4.2 0.8
(4) Feed productivity 4.1 1.0 4.7 0.5 4.3 0.7
(5) Cow productivity 4.8 0.6 4.7 0.5 4.7 0.5
(6) Source of Capital (Own capital/Total capital) 4.2 0.9 3.9 1.3 4.0 1.2 (7) Source of feed (Feed from own farm/Total feed used) 4.1 1.2 4.1 0.9 3.8 0.9
(8) Access to input market (Feed, vet drug, etc…) 4.2 0.7 4.9 0.4 4.3 1.0
(9) Access to milk Markets 4.9 0.4 4.9 0.4 4.3 0.8 (10) Access to milk storage and logistics 4.0 1.1 4.6 0.8 4.2 0.9
(11) Access to value addition 4.0 1.0 3.3 1.0 3.7 1.3
(12) Access to credit (Dairy) 4.1 1.0 4.3 0.5 4.0 1.1 (13) Proportion of income from off-farm activities 3.9 1.0 4.0 0.6 3.6 1.1
(14) Having a vaccination programme as recommended 4.3 1.0 4.9 0.4 4.6 0.8
(15) Prophylactic treatment program in place 4.3 0.8 4.9 0.4 4.4 0.7 (16) Prevention measures of entry of disease onto the farm 4.3 1.0 4.6 0.5 4.4 0.8
(17) Animal welfare 3.9 1.0 4.3 0.8 4.5 0.7
(18) Breeding system (AI/ Natural breeding) 4.1 1.0 4.0 0.6 4.6 0.7 (19) Conservation of feed during the dry season 4.6 0.7 4.8 0.4 4.2 0.8
(20) Farm record keeping 4.2 1.0 4.2 1.3 4.3 1.3 (21) Separation of seek animals in the farm 3.5 0.8 4.4 0.8 3.8 0.5
(22) Use of drugs as recommended 3.8 1.0 4.6 0.5 4.1 1.0
(23) Observation of withdrawal period 3.9 1.0 4.4 0.5 3.9 1.1 (24) Availability of vet service 4.2 0.6 4.4 0.8 4.3 0.9
(25) Milk hygiene 4.8 0.4 4.6 0.8 4.8 0.6
Social
(1) Education level of the farm manager 4.3 0.8 4.1 0.9 3.3 1.2
(2) Working time (number of hours/day) 3.9 0.8 4.6 0.8 3.5 1.2 (3) Workload distribution 3.7 0.9 4.3 1.0 3.6 1.4
(4) Women’s Empowerment index 3.8 1.2 4.4 0.8 4.3 0.8
(5) Work sharing (Share between male and female) 3.8 1.3 4.4 0.8 3.6 1.2 (6) Participation in farmer’ training 4.3 0.9 4.3 0.8 3.6 1.2
(7) Participation in farmers organization 3.7 0.9 4.4 0.8 4.0 1.0
Environment
(1) Distance from water source/way 4.2 0.9 4.3 0.8 4.3 0.9 (2) Animal access to water source (river. pound etc.) 4.5 0.8 4.3 0.8 4.6 0.5
(3) Livestock stocking density 4.4 0.8 3.6 1.5 4.2 1.1
(4) Soil conservation and erosion 3.9 1.2 3.3 1.9 4.4 0.8 (5) Access to water 4.7 0.6 5.0 0.0 4.3 0.7
(6) Land ownership 4.5 0.7 4.4 0.5 4.4 1.0
(7) Water conservation/ Harvesting 4.7 0.9 4.3 0.5 4.5 0.9 (8) Animal farm/Backyard production (Existence of real farm) 4.2 0.8 3.6 1.3 3.7 1.4
Where, X̅: mean score; SD: Standard deviation; Ac: Academic, Re: Researcher, Lo: Livestock officer; Tr: Farmer trainer
4.2 Sustainability Performances of Smallholder Dairy and Traditional Cattle Milk
Producer Farms
4.2.1 Sustainability index and sub-indices
Results for the overall sustainability performance index and sub-index scores are
summarized in Table 12. The sustainability performance indicator and index scores were
ranked from 0 to 1 and grouped into three categories namely weak (< 0.33), medium
(0.33 ≤ and < 0.66) and high (≥ 0.66) sustainability indicator / index scores. The overall
sustainability mean score shows weak sustainability (0.30±0.15). The social sub-index

73
presented the highest mean score (0.32 ± 0.27), followed by the environmental (0.31 ±
0.22), and the economic was the lowest (0.27 ± 0.20).
The overall sustainability mean score was moderate (0.35 ± 0.16) in R-to-U system and
significantly higher (p < 0.05) than in R-to-R system which was in non-sustainable range
(0.24 ± 0.12). Indeed, the overall sustainability mean score was moderately sustainable in
smallholder dairy system and significantly higher (p < 0.05) than in traditional cattle
keeping system (0.40 ± 0.15 and 0.24 ± 0.12 respectively). All sustainability sub-index
mean scores were in the weak range in R-to-R system and moderately sustainable range in
R-to-U system. The economic and social mean scores were significantly higher (p < 0.05)
in R-to-U system than in R-to-R system. The economic, social and environmental
sustainability mean scores were in moderate range in smallholder dairy system and
significantly higher (p<0.05) than in traditional cattle keeping system which was in weak
range.
Table 12: Farm sustainability index and sub-index performances
System Economic Social Environment Overall
Mean±SD N Mean±SD N Mean±SD N Mean±SD N
Milk market channel
R-to-R 0.15±0.11 191 0.26±0.26 191 0.29±0.23 191 0.24±0.12 191
R-to-U 0.37±0.20 240 0.36±0.27 240 0.33±0.20 240 0.35±0.16 240
Significance *** *** ns ***
Number of improved cattle
TCS 0.18±0.13 275 0.26±0.25 275 0.28±0.23 275 0.24±0.12 275
SHD 0.43±0.19 156 0.41±0.28 156 0.37±0.18 156 0.40±0.15 156
Significance *** *** *** ***
Total 0.27±0.20 431 0.32±0.27 431 0.31±0.22 431 0.30±0.15 431
*p < 0.05; **p < 0.01; ***p < 0.001; ns not significant; R-to-R: Rural production to rural
consumption (pre-commercial); R-to-U: Rural production to urban consumption (more
commercial); TCS: Traditional cattle system; SHD: Smallholder dairy system
4.2.2 Economic indicators
Table 13 shows the results for economic sustainability mean scores in each milk
production system. The majority of economic indicators (four out of seven) presented
74
mean scores below 0.33 (weak). Income presented the highest mean score (0.35±0.29),
followed by feed conservation (0.34±0.47) while forage self-sufficiency indicator
presented the lowest score (0.17±0.37).

75
Table 13: Economic sustainability performances by milk market channel
System Income
Cow
productivity
Labour
productivity
Forage self
sufficiency Animal health Breeding system
Feed
conservation
Mean±SD N Mean±SD N Mean±SD N Mean±SD N Mean±SD N Mean±SD N Mean±SD N
Milk market channel
R-to-R 0.27±0.26 97 0.16±0.14 162 0.21±0.24 191 0.00±0.00 191 0.35±0.30 191 0.15±0.36 191 0.14±0.34 191
R-to-U 0.41±0.30 121 0.41±0.31 155 0.24±0.30 240 0.30±0.45 240 0.32±0.28 240 0.35±0.48 240 0.50±0.50 240
Significance *** *** ns *** ns *** ***
Number of improved cattle
TCS 0.30±0.28 145 0.18±0.19 230 0.26±0.29 275 0.02±0.15 275 0.35±0.31 275 0.13±0.33 275 0.17±0.38 275
SHD 0.44±0.30 73 0.53±0.28 87 0.17±0.25 156 0.42±0.49 156 0.30±0.26 156 0.50±0.50 156 0.64±0.48 156
Significance *** *** *** *** ns *** ***
Total 0.35±0.29 218 0.28±0.27 317 0.23±0.28 431 0.17±0.37 431 0.33±0.29 431 0.26±0.44 431 0.34±0.47 431 *p < 0.05; **p < 0.01; ***p < 0.001; ns not significant; R-to-R: Rural production to rural consumption (pre-commercial); R-to-U: Rural production to urban consumption (more
commercial); TCS: Traditional cattle system; SHD: Smallholder dairy system

76
Economic performance indicators varied with production systems. More than one half
(four) of the economic indicator mean scores were moderate in R-to-U system against one
indicator (animal health) in R-to-R system. Indeed, five economic indicator mean scores
were moderate in smallholder dairy system while only the animal health mean score was
moderate in traditional cattle keeping system. The majority (four of seven) of economic
indicator mean scores were significantly higher (p < 0.05) in R-to-U system than in R-to-
R. Feed conservation, use of artificial insemination, percentage of grown fodder indicator
mean scores were more than two times higher in R-to-U system than in R-to-R system.
Indeed, the results showed that the farmers in R-to-R system do not use forage from their
own farms. Animal health indicator mean score was slightly higher in R-to-R system
(0.35±0.30) than R-to-U system (0.32 ± 0.28). Fig. 16 and Fig. 17 show feed conservation
in Lushoto and death of calves due do shortage of feed and water during the dry season in
Mvomero District respectively.
Figure 16: Feed conservation in
Lushoto District
Figure 17: Death of calves due do
shortage of feed and water
during the dry season in
Mvomero District

77
Five indicators mean scores in smallholder dairy system were significantly higher (p <
0.05) than in traditional cattle system. However, labour productivity mean score was
significantly higher (p < 0.05) in traditional cattle system than in smallholder dairy system
(0.26 ± 0.29 and 0.17 ± 0.25, respectively).
4.2.3 Social indicators
Table 14 presents the results for social sustainability performances. The education level,
participation in organization and women’s empowerment mean scores were moderately
sustainable. The participation in farmer groups presented the highest mean score (0.43 ±
0.50), while participation in trainings presented the lowest mean score (0.16 ± 0.36). R-to-
U system presented significantly higher (p < 0.05) mean scores than R-to-R system for all
indicators, except participation in training where the mean score was higher as well, but
the difference was not significant (p > 0.05). Indeed, all social indicator mean scores were
significantly higher (p < 0.05) in smallholder dairy system than in traditional cattle
system.
Table 14: Social sustainability performances
System Education level
Participation in
trainings
Participation in
farmer groups
Women’s
empowerment
Mean±SD N Mean±SD N Mean±SD N Mean±SD N
Milk market channel
R-to-R 0.33±0.29 191 0.15±0.35 191 0.33±0.47 185 0.31±0.17 143
R-to-U 0.45±0.27 240 0.17±0.37 240 0.50±0.50 238 0.41±0.18 204
Significance *** ns *** ***
Number of improved cattle
TCS 0.34±0.31 275 0.12±0.33 275 0.36±0.48 267 0.32±0.17 212
SHD 0.51±0.22 156 0.22±0.42 156 0.54±0.50 156 0.45±0.18 135
Significance *** ** *** ***
Total 0.40±0.29 431 0.16±0.36 431 0.43±0.50 423 0.37±0.18 347
*p < 0.05; **p < 0.01; ***p < 0.001; ns not significant; R-to-R: Rural production to rural consumption (pre-
commercial); R-to-U: Rural production to urban consumption (more commercial); TCS: Traditional cattle system;
SHD: Smallholder dairy system
4.2.4 Environmental indicators
The results for environmental performances are presented in Table 15. One half of the
indicators presented average scores higher than 0.33 (moderately to highly sustainable).

78
Availability of water presented the highest mean score (highly sustainable), followed by
the distance between manure storage/disposal and water way (moderately sustainable).
Land ownership presented the lowest mean score in environmental indicators (weak).
Rural Production to Urban consumption (R-to-U) system presented far higher mean score
with significant difference (p < 0.05) than R-to-R system in erosion control mechanism.
Indeed, erosion control, risk to water quality and water quantity indicator mean scores
were significantly higher (p < 0.05) in smallholder dairy system than in traditional cattle
system.
Table 15: Environmental performances
Category Erosion control Risk to water quality Water quantity Land ownership
Mean±SD N Mean±SD N Mean±SD N Mean±SD N
Milk market channel
R-to-R 0.08±0.29 12 0.61±0.37 9 0.73±0.44 191 0.08±0.27 191
R-to-U 0.49±0.51 49 0.66±0.37 51 0.80±0.40 240 0.05±0.23 240
Significance ** ns ns ns
Improved cattle
TCS 0.22±0.42 32 0.49±0.37 29 0.68±0.47 275 0.08±0.27 275
SHD 0.62±0.49 29 0.81±0.29 31 0.92±0.27 156 0.04±0.21 156
Significance ** *** *** ns
Total 0.41±0.50 61 0.65±0.36 60 0.77±0.42 431 0.06±0.25 431
*p < 0.05; **p < 0.01; ***p < 0.001; ns not significant; R-to-R: Rural production to rural consumption (pre-
commercial); R-to-U: Rural production to urban consumption (more commercial); TCS: Traditional cattle system;
SHD: Smallholder dairy system
4.2.5 Framework for assessing farm sustainability in Tanzania
The study generated a framework for assessing sustainability of smallholder dairy and
traditional cattle milk production farm in the context of Tanzania. The framework is
composed of a set of fifteen most relevant and representative indicators. These indicators
were selected out of the 29 identified relevant indicators based mainly on their
measurability and data availability. The indicators were grouped in three dimensions:
seven indicators for the economic dimension, four indicators for the social dimension and
four indicators for the environmental dimension. The economic, social and environmental

79
dimensions are aggregated into the overall farm sustainability index. Fig. 18 illustrates the
structure of the framework.
Figure 18: Framework for assessing sustainability of smallholder dairy and
traditional cattle milk production systems using a set of 15 indicators
4.3 Relationship between Farm Level Milk Production Sustainability Performances
and Producers’ Organization Sustainability Dimensions
4.3.1 Farm sustainability performances in PO-Members and non-PO-Members
Table 16 shows farm sustainability performances mean scores in PO-member farmers and
non-PO-member farmers. The overall farm sustainability mean performance index score
as well as economic and social mean performance dimension scores were significantly (p
< 0.05) higher in PO-members than in non-PO-members. Similarly, a number of indicators
1. Milk income
2. Cow productivity
3. Labour productivity
4. Forage self-sufficiency
5. Animal health
6. Use of artificial
insemination
7. Feed conservation
Economic
sustainability
index
1. Education
2. Participation in trainings
3. Participation in
organizations
4. Women’s empowerment
Social
sustainability
index
Overall
sustainability
index
1. Erosion control
2. Water quality
3. Water availability
4. Land ownership
Environmental
sustainability
index
Indicator Overall
sustainability
High (≥ 0.66)
Medium (0.33 ≤ and < 0.66)
Weak (< 0.33)
Overall
sustainability
Scores
High (≥ 0.66)
Medium (0.33 ≤ and < 0.66)
Weak (< 0.33)
High (≥ 0.66)
Medium (0.33 ≤ and < 0.66)
Weak (< 0.33)
High (≥ 0.66)
Medium (0.33 ≤ and < 0.66)
Weak (< 0.33)
Dimension Dimension
sustainability cores

80
showed significantly higher mean performance scores in PO-member farmers than non-
PO-member farmers; these indicators include cow productivity, forage self-sufficiency,
use of artificial insemination for the economic dimension; women’s empowerment and
participation in trainings for social dimension, and erosion control for environmental
dimension.
Table 16: Farm sustainability performances in PO-members and non-PO-members
(normalized values)
Dimension Farm indicator Non-PO-Member PO-Member Total
N Mean±SD N Mean±SD N Mean±SD
Economic Milk income 106 0.34±0.28 107 0.38±0.30 213 0.36±0.29 ns
Cow productivity 179 0.24±0.26 131 0.33±0.29 423 0.28±0.27**
Labour productivity 242 0.22±0.27 181 0.24±0.29 423 0.23±0.28 ns
Forage self-sufficiency 242 0.10±0.30 181 0.26±0.43 423 0.17±0.37***
Animal health 242 0.32±0.30 181 0.34±0.29 423 0.33±0.29 ns
Use of artificial
insemination 242 0.22±0.41 181 0.33±0.47 423 0.27±0.44**
Feed conservation 242 0.35±0.48 181 0.34±0.48 423 0.35±0.48 ns
Sub-Total 242 0.25±0.18 181 0.32±0.21 423 0.28±0.20***
Social Education 242 0.38±0.29 181 0.43±0.28 423 0.40±0.29 ns
Participation in trainings 242 0.07±0.25 181 0.29±0.45 423 0.16±0.37***
Participation in
organizations 242 0±0 181 1±0 243 0.43±0.50NA
Women’s empowerment 187 0.35±0.19 154 0.40±0.18 341 0.37±0.18*
Sub-total 242 0.12±0.10 181 0.59±0.17 423 0.32±0.27***
Environment Erosion control 30 0.27±0.45 29 0.59±0.50 59 0.42±0.50*
Water quality 27 0.60±0.39 31 0.72±0.32 58 0.66±0.36 ns
Water availability 242 0.76±0.43 181 0.79±0.41 423 0.77±0.42 ns
Land ownership 242 0.08±0.28 181 0.04±0.21 423 0.07±0.25 ns
Sub-total 242 0.31±0.23 181 0.32±0.20 423 0.31±0.22 ns
Overall sustainability 242 0.22±0.11 181 0.41±0.14 423 0.30±0.15***
*p < 0.05; **p < 0.01; ***p < 0.001; ns not significant; NA not applicable
4.3.2 PO characteristics
Table 17 shows the PO characteristics. The POs had on average 60 members. POs in
Lushoto District had the highest average number of members per PO while Mvomero
District had the lowest number of members per PO (90.63 ± 32.82 and 43.29 ± 12.05

81
members per PO respectively). The proportion of women was 47.54%. The highest
proportion of women was observed in Mvomero District POs (54.13%) while the lowest
proportion was observed in Lushoto District (44.41%). The average age of POs after
registration was two years (2.16 ± 0.78). POs in Mvomero District showed the smallest
average age after registration which was less than two years (1.77 ± 0.15) while POs in
Lushoto District showed the highest average age after registration (2.44 ± 1.30 years).
Table 17: PO characteristics
Characteristics
District Total
(n=30) Lushoto
(n=8)
Handeni
(n=8) Kilosa (n=7)
Mvomero
(n=7)
Member per group
Mean±SD 90.63±32.8
2 53.38±23.27 50.57±16.47 43.29±12.05 60.30±28.92
Minimum 54 26 36 30 26
Maximum 156 82 77 59 156
Sex
Proportion of men (%) 55.59 52.93 51.13 45.87 52.46
Proportion of women (%) 44.41 47.07 48.87 54.13 47.54
Age of the PO (years after
registration)
Mean±SD 2.44±1.30 2.15±0.39 2.12±0.61 1.77±0.15 2.16 ±0.78
Minimum 1.73 1.76 1.61 1.62 1.61
Maximum 5.64 3.01 3.38 1.98 5.64
4.3.3 Producers’ organization sustainability performances
PO sustainability means performances scores are shown in Table 18. The overall PO
sustainability mean performance index score was 0.22 ± 0.17. The relations with external
environment dimension of PO had the highest mean performance score (0.46±0.41) of all
the dimensions, followed by member loyalty (0.33 ± 0.21) and “effective and transparent
leadership and management” (0.29 ± 0.17) dimensions while the engagement with outputs
buyers and the financial health dimension had the lowest mean scores (0.06 ± 0.21 and
0.13 ± 0.26 respectively). The member investment and partnership with actors PO
sustainability performance sub-dimension had the highest mean score (0.55 ± 0.55 and
0.53 ± 0.51 respectively), while all sub-dimensions for the engagement with outputs

82
buyers and profit (number of business units lost) sub-dimensions for financial health had
the lowest mean scores (< 0.1). Lushoto District had the best overall sustainability mean
performance index score (0.41 ± 0.18), followed by Handeni District (0.20 ± 0.10)
whereas Mvomero District (0.10 ± 0.05) had the worst followed by Kilosa District (0.20 ±
0.12). Lushoto District had the highest mean score for financial health performance
dimension (0.20 ± 0.37) whereas Mvomero and Handeni districts had the worst mean
scores (0).
Table 18: PO sustainability performances (scores)
PO sustainability performance District
Total (n=30) Dimension
Sub-dimension
Handeni
(n=8)
Kilosa
(n=7)
Lushoto
(n=8)
Mvomero
(n=7)
Mean ±SD Mean ±SD Mean ±SD Mean ±SD Mean ±SD
Financial health Net Profit Margin 0.00 0.00 0.19 0.26 0.33 0.47 0.00 0.00 0.13 0.30
Business units lost 0.00 0.00 0.29 0.49 0.00 0.00 0.00 0.00 0.07 0.25
Liquidity 0.00 0.00 0.00 0.00 0.38 0.52 0.00 0.00 0.10 0.31
Capital structure 0.00 0.00 0.43 0.53 0.29 0.42 0.00 0.00 0.18 0.37
Sub Total 0.00 0.00 0.24 0.32 0.26 0.37 0.00 0.00 0.13 0.26
Engagement with
output buyers
Milk quality 0.00 0.00 0.00 0.00 0.25 0.46 0.00 0.00 0.07 0.25
Market reliability 0.00 0.00 0.02 0.05 0.18 0.33 0.00 0.00 0.05 0.18
Suppliers 0.00 0.00 0.04 0.09 0.20 0.38 0.00 0.00 0.06 0.21 Sub Total 0.00 0.00 0.02 0.06 0.20 0.37 0.00 0.00 0.06 0.21
Effective and
transparent
leadership and
management
Representation
participation 0.45 0.39 0.55 0.24 0.66 0.22 0.45 0.15 0.53 0.27
Effective supervision 0.05 0.07 0.06 0.16 0.07 0.08 0.04 0.07 0.06 0.10
Effective management 0.26 0.24 0.11 0.16 0.65 0.23 0.00 0.00 0.27 0.31
Sub Total 0.25 0.23 0.26 0.14 0.44 0.09 0.18 0.07 0.29 0.17
Access to dairy
production inputs
and services
Feed and feeding 0.10 0.15 0.03 0.08 0.58 0.27 0.17 0.14 0.23 0.28
Genetics 0.25 0.27 0.00 0.00 0.66 0.35 0.00 0.00 0.24 0.35
Health 0.38 0.44 0.07 0.19 0.75 0.27 0.14 0.38 0.35 0.42
Extension 0.75 0.35 0.05 0.13 0.96 0.12 0.24 0.37 0.52 0.45 Financial services 0.00 0.00 0.07 0.12 0.31 0.28 0.04 0.09 0.11 0.20
Sub Total 0.25 0.13 0.04 0.05 0.61 0.21 0.13 0.14 0.27 0.26
Relations with
external
environment
Partnership actors 0.88 0.35 0.29 0.49 0.88 0.35 0.00 0.00 0.53 0.51
Social responsibility 0.38 0.52 0.43 0.53 0.50 0.53 0.14 0.38 0.37 0.49
Sub Total 0.66 0.34 0.35 0.38 0.71 0.36 0.06 0.16 0.46 0.41
Member loyalty Patronage 0.27 0.23 0.00 0.00 0.50 0.33 0.00 0.00 0.21 0.29
Member investment 0.63 0.32 0.52 0.42 0.59 0.33 0.45 0.39 0.55 0.35
Ownership 0.38 0.35 0.29 0.39 0.13 0.23 0.14 0.24 0.23 0.31
Member loyalty programs 0.31 0.37 0.14 0.38 0.56 0.32 0.14 0.38 0.30 0.39
Sub Total 0.41 0.19 0.24 0.22 0.46 0.20 0.19 0.10 0.33 0.21
PO overall sustainability 0.20 0.10 0.16 0.12 0.41 0.18 0.10 0.05 0.22 0.17
4.3.4 Correlations between overall farm and PO sustainability performance
indicators
The correlations between PO and overall farm sustainability performance indicators are
shown in Table 19. The overall farm sustainability performance index showed a moderate
positive correlation (r = 0.49; p < 0.01) with the PO overall sustainability performance

83
index. Similarly, all of the PO sustainability performance dimensions and the majority of
their sub-dimensions had weak to strong positive correlations (0 < r < 1; p < 0.05) with the
overall farm sustainability performance index. The overall farm sustainability performance
index had strong correlations with “access to dairy production inputs and services” and
“effective and transparent leadership and management” (r = 0.58 and 0.51 respectively; p
< 0.01) sustainability performance dimensions of POs. All sub-dimensions of “access to
dairy production inputs and services” sustainability performance (excluding the financial
service) and effective management for “effective and transparent leadership and
management” dimensions of POs showed strong positive correlations (r > 0.5; p ≤ 0.01)
with the overall farm sustainability performance index.

84
Table 19: Correlations between PO overall sustainability performance index and
farm sustainability performance indicators
PO sustainability performance Overall farm
sustainability Dimension Sub-dimension
Financial health 1. Profit-Net Profit Margin 0.38**
2. Business units lost -0.16
3. Liquidity 0.43**
4. Capital structure 0.24**
Sub Total 0.32**
Engagement with output
buyers
1. Milk quality 0.31**
2. Market reliability 0.31**
3. Suppliers 0.30**
Sub Total 0.30**
Effective and transparent
leadership and management
1. Representation participation 0.25**
2. Effective supervision 0.15
3. Effective management 0.54**
Sub Total 0.51**
Access to dairy production
inputs and services
1. Feed and feeding 0.52**
2. Genetics 0.50**
3. Health 0.54**
4. Extension 0.51**
5. Financial services 0.42**
Sub Total 0.58**
Relations with external
environment
1. Partnership actors 0.31**
2. Social responsibility 0.10
Sub Total 0.26**
Member loyalty 1. Patronage 0.28**
2. Member investment 0.01
3. Ownership -0.16
4. Member loyalty programs 0.22*
Sub Total 0.17*
PO overall sustainability 0.49**
**Correlation is significant at the 0.01 level
*Correlation is significant at the 0.05 level
4.3.5 Correlations between farm economic and PO sustainability indicators
Table 20 shows the relationships between farm economic performance dimension and its
indicators and PO sustainability performance dimensions and their sub-dimensions. The
farm economic dimension had strong correlations (r = 0.67; p < 0.05) with “access to dairy
inputs and services sustainability performance dimension of PO”. Furthermore, all sub-
dimensions of “access to dairy production inputs and services” sustainability performance
dimension, except “the extension sub-dimension”, and the “effective management” sub-
dimension of the “effective and transparent leadership and management” sustainability

85
performance dimension of PO had strong positive correlations (r > 0.5; p < 0.01) with
“farm economic sustainability” performance dimension. On the contrary, PO “business
units lost” sub-dimension of “financial health sustainability” performance dimension
showed a weak negative correlation with the “farm economic” sustainability performance
dimension (r = -0.23; p < 0.01).
Table 20: Correlation between farm economic and PO sustainability performance
indicators
PO sustainability performances Farm economic performance
Dimensions Sub-dimension
Inco
me
An
ima
l h
ea
lth
Co
w
pro
du
cti
vit
y
La
bo
ur
pro
du
cti
vit
y
Fo
ra
ge s
elf
-
suff
icie
ncy
Use
of
arti
fici
al
inse
min
ati
on
Feed
co
nse
rv
ati
on
Eco
no
mic
Financial health Profit-Net Profit Margin -.099 -0.08 0.25* -0.22* 0.44** 0.17* 0.38** 0.36**
Business units lost -0.06 0.02 -0.21* -0.14 -.17 -0.20* -0.06 -0.23**
Liquidity -0.12 -0.05 0.36** -0.19* 0.50** 0.25** 0.42** 0.45**
Capital structure -0.08 -0.07 0.10 -0.23** 0.30** 0.06 0.29** 0.21*
Sub Total -0.10 -0.06 0.18 -0.24** 0.38** 0.12 0.35** 0.29**
Engagement
with output
buyers
Milk quality -0.12 -0.03 0.35** -0.16 0.41** 0.21* 0.35** 0.37**
Market reliability -0.13 -0.02 0.33** -0.16 0.40** 0.19* 0.35** 0.36**
Suppliers -0.14 -0.01 0.32** -0.17* 0.38** 0.18* 0.35** 0.35**
Sub Total -0.13 -0.02 0.33** -0.17 0.40** 0.19* 0.35** 0.36**
Effective and
transparent
leadership and
management
Representation participation 0.27 -0.15 0.16 -0.13 0.18* 0.10 0.19* 0.21*
Effective supervision 0.00 0.14 0.01 -0.13 .08 0.07 0.24** 0.16
Effective management -0.06 -0.15 0.43** -0.34** 0.58** 0.34** 0.48** 0.50**
Sub Total 0.12 -0.15 0.34** -0.31** 0.47** 0.28** 0.46** 0.46**
Access to dairy
production
inputs and
services
Feed and feeding 0.20 -0.12 0.68** -0.16 0.53** 0.37** 0.51** 0.66**
Genetics 0.01 -0.17* 0.58** -0.24** 0.53** 0.40** 0.43** 0.56**
Health 0.27 -0.09 0.71** -0.16 0.49** 0.35** 0.44** 0.65**
Extension 0.10 -0.08 0.48** -0.27** 0.44** 0.35** 0.39** 0.48**
Financial services -0.054 -0.09 0.54** -0.17 0.50** 0.30** 0.39** 0.50**
Sub Total 0.13 -0.13 0.70** -0.23** 0.58** 0.41** 0.51** 0.67**
Relations with
external
environment
Partnership actors -0.10 -0.09 0.18 -0.35** 0.32** 0.33** 0.17* 0.18*
Social responsibility -0.13 -0.13 0.04 -0.24** 0.21* 0.18* 0.16 0.08
Sub Total -0.14 -0.13 0.14 -0.36** 0.32** 0.31** 0.20* 0.16
Member loyalty Patronage 0.01 -0.18* 0.36** -0.23** 0.28** 0.35** 0.25** 0.29**
Member investment 0.22* -0.08 0.13 -0.10 -.06 0.18* -0.11 -0.02
Ownership 0.11 -0.07 0.03 0.12 -0.21* -0.10 -0.17* -0.14
Member loyalty programs -0.06 -0.15 0.18 -0.19* 0.26** 0.26** 0.27** 0.22*
Sub Total 0.10 -0.20* 0.29** -0.19* 0.13 0.32** 0.12 0.17
PO overall sustainability 0.00 -0.12 0.49** -0.29** 0.53** 0.34** 0.47** 0.51**
**Correlation is significant at the 0.01 level
*Correlation is significant at the 0.05 level
Some farm sustainability performance indicators namely cow productivity, forage self-
sufficiency, use of artificial insemination and feed conservation had moderate to strong
correlations (0.3 < r < 1; p < 0.05) with the overall sustainability performance index of
PO. Moreover, cow productivity, forage self-sufficiency and feed conservation showed
moderate to strong correlations (0.5 < r < 1; p < 0.05) with “access to dairy production
inputs and services” performance dimension of PO.

86
Cow productivity was strongly positively correlated (0.5 < r < 1; p < 0.01) with all sub-
dimensions for “access to dairy production inputs and services” dimension of PO.
Similarly, forage self-sufficiency farm sustainability performance indicator was strongly
positively correlated (0.5 < r < 1; p < 0.01) with feed and feeding, genetics and financial
service sub-dimensions for “access to dairy production inputs and services”, liquidity sub-
dimension for financial health and effective management sub-dimension for “effective and
transparent leadership and management” dimension. Farm feed conservation sustainability
performance dimension was strongly positively correlated (r > 0.5; p < 0.01) with feed and
feeding sub-dimension for “access to dairy production inputs and services” dimension of
PO sustainability performance. On the other hand, the farm use of artificial insemination
and cow productivity sustainability indicators were weakly and negatively (r = -0.20 and -
0.21 respectively; p < 0.05) correlated with PO business units lost sub-dimension for
financial health of PO performance dimension.
Income and animal health performance indicators showed non-significant correlations (p >
0.05) with the PO overall sustainability performance index and the majority of its
dimensions and sub-dimensions. Indeed, labour productivity indicated weak negative
correlations (-0.3 < r < 0; p < 0.5) with PO overall sustainability performance index and
most of its dimensions and sub-dimensions.
4.3.6 Correlation between social farm and PO sustainability performance indicators
Table 21 shows the correlations between PO sustainability performance and social farm
sustainability indicators. There was no significant correlation between farmer social
sustainability performance dimension and overall farm sustainability (r = 0.06, p > 0.05).
Farmer education performance indicator showed moderate positive and weak positive
correlation (r= 0.33 p < 0.01) with the overall PO sustainability performance index.

87
Similarly, education presented weak to moderate positive correlation (0 < r < 0.3; p <
0.05) with engagement with output buyers, “access to dairy production inputs and
services”, “relations with external environment” and “effective and transparent leadership
and management” PO performance dimensions and most of their sub-dimensions.
Table 21: Correlations between farm social and PO sustainability indicators
PO performance indicator Farm social performance indicator
Dimensions Sub-dimension Education Training Women’s
empowerment Social
Financial health Profit-Net Profit Margin 0.22* -0.07 0.06 0.00
Business units loss -0.17 0.00 -0.12 -0.04
Liquidity 0.28** -0.07 0.12 0.03
Capital structure 0.11 -0.10 0.03 -0.05
Sub Total 0.17 -0.08 0.05 -0.02
Engagement with output buyers Milk quality 0.26** -0.17* 0.15 -0.07
Market reliability 0.25** -0.16 0.14 -0.07
Suppliers 0.24** -0.16 0.15 -0.06
Sub Total 0.25** -0.16 0.15 -0.07
Effective and transparent leadership and
management
Representation participation 0.10 0.10 0.10 0.15
Effective supervision 0.17* -0.03 -0.01 0.01
Effective management 0.33** 0.06 0.23* 0.18*
Sub Total 0.29** 0.09 0.19* 0.20*
Access to dairy production inputs and
services
Feed and feeding 0.31** -0.02 0.31** 0.08
Genetics 0.30** 0.05 0.21* 0.14
Health 0.33** -0.02 0.33** 0.09
Extension 0.37** 0.11 0.24* 0.22*
Financial services 0.28** -0.14 0.21* -0.03
Sub Total 0.37** 0.00 0.31** 0.12
Relations with external environment Partnership actors 0.21* 0.15 0.06 0.19*
Social responsibility 0.19* -0.16 0.06 -0.08
Sub Total 0.24** 0.01 0.07 0.09
Member loyalty Patronage 0.16 0.05 0.25** 0.14
Member investment 0.08 -0.04 0.00 -0.01
Ownership -0.06 -0.01 0.04 -0.02
Member loyalty programs 0.14 -0.12 0.12 -0.03
Sub Total 0.15 -0.05 0.17 0.04
PO overall sustainability 0.33** -0.06 0.22* 0.06
**Correlation is significant at the 0.01 level
*Correlation is significant at the 0.05 level
Women’s empowerment indicator was correlated with PO sustainability performance
index (r = 0.22, p < 0.05). Indeed, women’s empowerment indicator showed weak positive
correlations with “access to dairy production inputs and services” sustainability PO
performance dimension and its sub-dimensions and effective management sub-dimension
for “effective and transparent leadership and management” PO performance dimension.
However, training and social dimensions show non-significant correlations (p > 0.05) with
PO sustainability performance index and most of its dimensions and sub-dimensions.

88
4.3.7 Correlation between farm environmental and PO sustainability indicators
The correlations between environmental performance indicators and PO components are
shown in Table 22. The environmental farm sustainability performance dimension showed
moderate and positive correlations (0 < r < 0.5; p < 0.05) with PO overall sustainability
performance index and all its dimensions and the majority of their sub-dimensions, except
member loyalty. Similarly, water availability and land ownership farm sustainability
performance indicators showed weak positive correlations (r = 0.26 and 0.18 respectively;
p ≤ 0.05) with overall PO sustainability performance index. Moreover, water quality
showed strong correlations with the overall PO sustainability performance index and the
majority of its dimensions and sub-dimensions (r > 0.5; p < 0.01).
Table 22: Correlation between farm environmental and PO sustainability
performance indicators
PO dimensions and sub-dimensions Farm environmental performance
Dimensions Sub-dimension
Erosion
control
Water
qualit
y
Water
availability
Land
ownershi
p
Environme
nt
Financial
health
Profit-Net Profit Margin 0.14 0.59** 0.13 0.16 0.38**
Business units reported loss .c .c 0.10 -0.07 -0.04
Liquidity 0.15 0.60** 0.11 0.15 0.37**
Capital structure 0.05 0.58** 0.15 0.13 0.30**
Sub Total 0.12 0.60** 0.15 0.14 0.34**
Engagement
with output
buyers
Milk quality -0.11 0.44* 0.09 0.18* 0.31**
Market reliability -0.11 0.44* 0.10 0.18* 0.31**
Suppliers -0.09 0.43* 0.11 0.15 0.29**
Sub Total -0.10 0.44* 0.10 0.17 0.30**
Effective and
transparent
leadership and
management
Representation participation 0.29 0.00 0.25** -0.01 0.14
Effective supervision -0.09 0.08 0.06 0.07 0.13
Effective management 0.13 0.59** 0.28** 0.17 0.41**
Sub Total 0.24 0.42* 0.32** 0.11 0.36**
Access to dairy
production
inputs and
services
Feed and feeding 0.08 0.40* 0.12 0.14 0.28**
Genetics 0.06 0.55** 0.15 0.17 0.30**
Health 0.07 0.55** 0.27** 0.15 0.32**
Extension 0.23 0.52** 0.35** 0.11 0.32**
Financial services -0.17 0.43* 0.14 0.25** 0.34**
Sub Total 0.07 0.52** 0.24** 0.187* 0.36**
Relations with
external
environment
Partnership actors 0.15 0.60** 0.29** 0.12 0.25**
Social responsibility -0.11 0.44* 0.15 0.13 0.19*
Sub Total 0.05 0.57** 0.27** 0.15 0.26**
Member
loyalty
Patronage 0.30 0.44* 0.19* -0.01 0.14
Member investment 0.04 -0.20 0.24** 0.06 0.06
Ownership 0.09 -0.136 0.15 -0.18* -0.15
Member loyalty programs 0.04 0.65** 0.16 0.04 0.24**
Sub Total 0.31 0.52** 0.30** -0.02 0.14
PO overall sustainability 0.07 0.55** 0.26** 0.18* 0.39**
**Correlation is significant at the 0.01 level (2-tailed)
*Correlation is significant at the 0.05 level cCan not be computed because at least one of the variables is constant

89
4.3.8 Producers’ organization level factors influencing farm sustainability
The results from regression show that PO financial health sustainability performance
dimension had a positive and significant effect on the overall farm sustainability
performance index (β = 0.116; p < 0.05). Access to dairy production inputs and services
PO sustainability performance had a positive and significant effect on the economic (β
=0.636; p < 0.001) and the environmental (β = 0.223; p < 0.05) farm sustainability
performance dimension. However, the engagement with output buyers had a negative
effect on the economic (β = -0.242; p < 0.05) and social farm sustainability performance
dimensions (β = -0.235; p < 0.05). Indeed, relations with external environment had a
negative effect on the economic sustainability (β =-0.107; p < 0.05); member loyalty had a
negative influence on the overall farm sustainability (β =-0.129; p < 0.05). Table 23
presents the results from regression.
Table 23: Producers’ organization level factors influencing farm sustainability
Explanatory variables
Dependent variables
Overall Economic Social Environment
Β SE Β SE Β SE β SE
Financial health 0.116* 2.94 0.144ns 0.08 0.012ns 0.10 0.188ns 0.12
Engagement with output buyers -0.204** 1.21 -0.242 * 0.09 -0.235* 0.12 -0.127 ns 0.14 Effective and transparent leadership and
management
0.152ns 2.57 0.121ns 0.13 0.231 ns 0.17 0.167 ns 0.21
Access to dairy production inputs and services 0.339*** 1.45 0.636*** 0.07 0.170 ns 0.10 0.223 * 0.12 Relations with external environment -0.006ns 0.59 -0.107* 0.05 0.058ns 0.05 0.0152ns 0.07
Member loyalty -0.129* 0.79 -0.135ns 0.07 -0.175 ns 0.11 -0.060 ns 0.13
CONSTANT 0.318** 2.31 0.171*** 0.03 0.548*** 0.04 0.206*** 0.05
Observation 330 136 136 136 LR Chi2 77.12 102.40 14.38 25.79
Prob. > chi2(9) *** *** *** ***
Log Likelihood 120.45 66.08 44.82 -6.42
Pseudo R2 -0.4708 -3.44 -0.19 0.67
*p < 0.05; **p < 0.01; ***p < 0.001; ns not significant
4.4 Determinants of Smallholder Dairy and Traditional Cattle Milk Producer Farm
Sustainability
4.4.1 Socio-economic characteristics of the households
Socio-economic characteristics of the sample households are shown in Table 24. The
average household size was 4 persons (in adult equivalent) and ranked from 1 to 9

90
persons. The average age of the household heads was 49 years and varied from 20 to 87
years, mostly men (89%) and married (88%). The households owned, on average, 12 acres
of land which varied from 0.25 to 160.5 acres. The farmers owned on average 25.8 heads
of cattle which varied from 1 to 271 heads of cattle. More than a half of the total number
of households (63 %) exclusively practised grazing system while the reminders either
stall-fed their cattle with or without some grazing. The average distance from household to
trading centre was 3.3 Km and varied from 0.01 to 40 Km. A small number of surveyed
households acquired credit (8%).
The farmers in R-to-R system had significantly (p < 0.05) larger land than in R-to-U
system (15.34 ± 18.47 and 9.88 ± 22.34 acres respectively). Similarly, the farmers in R-to-
R system had significantly (p < 0.05) larger herd than in R-to-U system (31.56 ± 38.48 and
21.10 ± 45.17 heads of cattle respectively). The proportion of farmers practicing either
stall feeding system or stall feeding system with some grazing was significantly (p < 0.05)
higher in R-to-U system than in R-to-R system (66.30% and 0.67% respectively).
Table 24: Socio-economic characteristics of the households
Variable Milk market channel Total (N=330)
Sig R-to-R (n=149) R-to-U (n=181)
Mean ± SD, Min and Max Mean ± SD Min Max Mean ± SD Min Max Mean ± SD Min Max
AGE (Year) 49.91±14.09 22.00 87.00 49.11±12.20 20.00 80.00 49.47±13.07 20.00 87.00 ns
FARMSIZE (Acre) 15.34±18.47 0.25 113.00 9.88±22.34 0.25 160.50 12.35±20.83 0.25 160.50 *
HERDSIZE(Head of cattle) 31.56±38.48 1.00 230.00 21.10±45.17 1.00 271.00 25.82±42.54 1.00 271.00 *
HHSIZE (Adult equivalent) 4.32±1.50 0.80 9.10 4.11±1.37 1.00 9.40 4.20±1.43 0.80 9.40 ns
DISTANCE (Km) 3.59±5.43 0.01 40.00 2.93±3.17 0.01 15.00 3.23±4.34 0.01 40.00 ns
Frequency
CREDIT No 136(91.3%) 169(93.37%) 305(92.42%) ns Yes 13(8.7%) 12(6.63%) 25(7.58%)
SEX Male 137(91.95%) 158(87.29%) 295(89.39%) ns
Female 12(8.05%) 23(12.71%) 35 (10.61%)
FEEDING Grazing 148(99.33%) 61(33.70%) 209(63.33%) ***
Stall feeding 1(0.67%) 120(66.30%) 121(36.67%)
MARITAL Married 15(10.07%) 24(13.26%) 291(88.18%) ns Otherwise 134(89.93)% 157(86.74%) 39(11.82%)
*p < 0.05; **p < 0.01; ***p < 0.001; ns not significant; R-to-R: Rural production to rural consumption (pre-commercial);
R-to-U: Rural production to urban consumption (more commercial)

91
4.4.2 Determinants of farm sustainability
Table 25 shows the determinants of sustainability of milk production farm in the study
area. Six variables out of nine, namely, sex, feeding system, farm size, distance between
the household and the nearest trading centre, age of the household head and acquisition of
credit showed significant effects on at least one of the economic, social, environment and
overall sustainability performance indices. The feeding system showed positive effects on
the farm economic (β = 0.256; p < 0.01), social (β = 0.165; p < 0.01), environmental (β =
0.098; p < 0.01) sustainability and overall farm sustainability (β = 0.161; p < 0.01) as well.
Similarly, acquiring credit exhibited positive effects on the social sustainability (β = 0.190;
p < 0.01) and overall farm sustainability performances (β =0.081; p< 0.01). Farm size
showed positive effect on the economic (β = 0.001; p < 0.1) and environmental (β = 0.01;
p < 0.1) sustainability. The age of the household head showed a positive effect on the
overall farm sustainability (β = 0.01; p < 0.05) as well as the social (β = 0.05; p < 0.1) and
environmental (β = 0.003; p < 0.1) sustainability. Indeed, sex of the household head
showed a positive effect on environmental sustainability (β = 0.143; p < 0.1). However,
the distance between farm and the nearest trading centre showed a negative effect on farm
economic sustainability performance (β = -0.004; p < 0.1).
Table 25: Tobit regression analysis results of the determinants of sustainability
Explanatory variables
Dependent variables
Overall Economic Social Environment
β SE β SE β SE β SE
CREDIT 0.081*** 0.03 0.018 ns 0.03 0.190*** 0.06 0.060 ns 0.05
SEX 0.054 ns 0.04 0.072 ns 0.05 -0.043 ns 0.09 0.143* 0.09
AGE 0.001** 0.00 0.001 ns 0.00 0.003** 0.00 0.002* 0.00
FARMSIZE 0.001 ns 0.00 0.001* 0.00 0.000 ns 0.00 0.001* 0.00
HERDSIZE 0.000 ns 0.00 0.000 ns 0.00 0.001 ns 0.00 0.000 ns 0.00
HHSIZE 0.004 ns 0.01 0.000 ns 0.01 0.012 ns 0.01 0.001 ns 0.01
FEEDING 0.161*** 0.02 0.256*** 0.02 0.165*** 0.03 0.098*** 0.03
DISTANCE -0.002 ns 0.00 -0.004* 0.00 -0.002 ns 0.09 -0.002 ns 0.08
MARITAL 0.016 ns 0.04 0.041 ns 0.05 -0.062 ns 0.00 0.075 ns 0.00
CONSTANT 0.122** 0.05 0.097 ns 0.06 0.116 ns 0.11 0.061 ns 0.10
Observation 330 330 330 330
LR Chi2 111.25 168.24 39.98 25.75
Prob. > chi2(9) *** *** *** ***
Log Likelihood 201.30 131.81 -55.47 -73.18
Pseudo R2 -0.3818 -1.7638 0.2649 0.1496
*p < 0.1; **p < 0.05; ***p < 0.01; ns not significant; β: coefficient; SE: Standard error

92
CHAPTER FIVE
5.0 DISCUSSION
5.1 Indicators for Assessing Sustainability of Milk Production Farms in Tanzania
In the context of this research, sustainability was defined using three components:
economic, social and environmental. A preliminary survey generated a comprehensive list
of 57 potential indicators of all aspects of sustainability from which, after a second survey
using a Delphi technique, a refined set of 29 emerged. Comparison with previous literature
(Chand et al., 2015; Meul et al., 2008; Sauvenier et al., 2005; Van Der Meulen et al.,
2013), the indicators identified in this research fall into three categories: those which are
common across multiple comparable analyses; those which, though common, are viewed
in a different light in the Tanzanian responses reported here and those which are
uncommon or unique to this analysis. These comparisons provide a picture of the current
milk value chain in Tanzania and may point towards its future.
Hugé et al. (2010) suggest that the Delphi technique is not a tool for decision making or
deducing definitive answers but it is of assistance in identifying all possible factors and
potential solutions. In this regard, some authors use focus group discussions to
complement Delphi technique (Roy et al., 2013). A number of other limitations are
important in interpreting the results of this analysis. The validity of the Delphi technique
depends on the expertise of the contributors. For the current research, the spread of
experience of the respondents within the dairy sector was diverse and fairly evenly
distributed from those relatively new to the sector to others with more than 30 years’
experience. Gender bias of the sample was significant, three quarters of the respondents
being male although women are major actors in the milk production chain. Eight of 44
93
respondents were farmers, while the remainder had academic or more technical
backgrounds.
The selection of indicators using a participatory approach generates a set of indicators
suitable for the prevailing situation. Meanwhile, it can generate a large number of highly
correlated indicators. Although these issues were taken into account during the selection
process by merging the indicators with possible correlation to avoid biases, inconsistences
could persist. Authors like Paracchini et al. (2015) and Vitunskiene and Dabkiene (2016)
have suggested further correlation analysis to exclude strongly correlated indicators while
Yigitcanlar and Dur (2010) suggested weighting indicators to correct overlapping biases
before using them.
Finally, the Delphi technique rejects opinions offered by a small proportion of participants
even if they are relevant (Chu and Hwang 2008). Such rejected indicators could be
important in the future, particularly with factors such as environmental sustainability
which gain importance with time (Hai et al., 2009) as society becomes more sensitive to
environmental issues.
The results from stakeholder’s opinions showed that most relevant indicators were
economic (18 economic indicators against 4 social and 7 environmental indicators). The
proportion of economic indicators is higher than in integrated sets used by Paracchini et al.
(2015) and Zahm et al. (2008) among others. Prioritization of economic indicators could
be justified by the subsistence nature of milk production systems in the study area, where
milk is produced in low quantity and difficult to access the market (Leonard et al., 2016).
Income per litre of milk was among the most relevant profitability indicators. This is in

94
agreement with Roy et al. (2014) who argue that income is a fundamental indicator for
measuring farm viability. In fact, to be viable milk production farm must cover the cost of
production and produce surplus to economically sustain itself (Zahm et al., 2008).
Moreover, the alternative, the use of off-farm resources to finance farm activities, is not
possible for those farmers with limited resources (Zvinorova et al., 2010). Green (2012)
reported that in Tanzania some farmers exit dairy farm activities due to low of
profitability, searching for other activities which are more profitable.
A number of key indicators, though present both in our results and in the published
literature, were nevertheless viewed differently. Atanasov and Popova (2010) categorized
milk quality as social, van Calker et al. (2005) viewed animal health and welfare as social
while Chand et al. (2015) considered animal genetics as environmental. In the Tanzanian
results, although the respondents considered animal health and welfare, milk quality and
animal genetics as important, they were all regarded as economic criteria. This perception
of the overwhelming importance of economic criteria can be explained by the current
nature of milk production in Tanzania which is dominated by the subsistence farming
systems (Rural Livelihood Development Company, 2010). Most milk is consumed by its
producers or local communities and only 10% is sold in commercial markets, that is,
production is largely pre-commercial. Milk production in Tanzania is constrained by poor
genetic quality of dominant livestock which result in low milk yield, animal diseases
responsible for economic loss and low milk quality which hinder its commercialization
(URT, 2006). Thus animal genetics, milk quality and animal health and welfare are all
seen primarily through the potential economic benefits their improvement could deliver.
Similarly milk hygiene was considered the most important economic indicator (4.8
points). Poor milk quality could have a negative impact on public health (Atanasov and

95
Popova 2010). In Tanzania, poor microbiological quality and presence of drug residues
have been reported (Mdegela et al., 2009; Ngasala et al., 2015). A farm with milk of low
quality is less likely to be economically sustainable as such milk is rejected by the market
(Ndungu et al., 2016). This was probably the reason that milk quality was regarded as
primarily an economic factor.
Women’s empowerment is a common indicator of social sustainability (Chand et al.,
2015). For example, Moses et al. (2016) reported that in Kenya, women’s access to dairy
income, control of dairy assets, knowledge and technology have a significant positive
impact on household commercial activity and thus its sustainability. Our results confirm
this assessment. Unfortunately, URT (2010) reported that women do not have enough
access to resources and decision making on the use of income, even though they are the
main actors of milk value chain. This situation makes women’s empowerment indicators
more relevant in the context of this study compared to others where gender was not
considered as an issue.
The existence of farmers’ organisations and participation in training are other commonly
used social indicators. Participation in training was identified among the most relevant
social factors as it was by Sharghi et al. (2010) in Iran and Roy et al. (2014) in
Bangladesh. Farmers need appropriate knowledge and skills in farm management to
efficiently use farm resources (Smith and McDonald, 1998), particularly in the study
context dominated by traditional cattle farmers, with limited knowledge in dairy
management. Only 55% of the farmers received extension services (URT, 2012). Training
was not taken into account in some other sets of sustainability indicators as in Chand et al.
(2015) in India. The respondents’ consensus indicated that participation in farmers’

96
organizations is an important indicator of farm sustainability as suggested in Tanzania by
Tumusiime and Matotay (2014). Farmers’ organizations can be a way to reduce
constraints which hinder sustainable milk production in developing countries. It is difficult
to get access to inputs and other services individually but by joining farmers’
organizations, farmers gain bargaining power which enables them to get inputs at lower
cost, and access credit and other services; moreover, the organizations are also important
for social networking (Kalra et al., 2013), which is the case in our study.
It is striking that, of the five top ranked indicators of environmental sustainability, four are
to do with water availability and quality. Milk production is not sustainable without access
to water the whole year round. Poor yield is expected during shortage of water specifically
in the dry season as has been reported in Tanzania (Morris et al., 2015). Respondents
identified water conservation among the most relevant environmental indicators. Ideally,
the farmer could ensure that the water is available throughout the year by conserving the
rainy season water (Devendra, 2001). The use of rain water as an alternative water source
was proposed by Meul et al. (2008) as relevant indicator. The practicability of such
approaches would have to be assessed under local conditions. For an increase in milk
production to be genuinely sustainable, it should have little or no negative effects on water
quality. Livestock can contaminate water with pharmaceutical products, parasites, viruses
and biochemical oxygen demanding organic substances (Burkholder et al., 2007; Strokal
et al., 2016). Nitrate (Calker et al., 2005) and bacteriological count have been suggested as
indicators of water quality (Smith et al., 2015). Although more precise, these indicators
are difficult to measure. The most relevant current indicators which could influence the
water quality were “distance between the manure storage and water way/source” and
“direct access of animal to water source”. Morris et al. (2015) reported a case in Tanzania

97
where the farmers were urged to water cattle using troughs instead of letting them access
the water source directly, to avoid water contamination.
Given the importance attached to economic factors, it is curious that access to land was
identified as the most important indicator of environmental sustainability, rather than an
economic one. Baker et al. (2015) reported that access to land is among the major
constraints to milk production in Tanzania. Few farmers allocate land for livestock pasture
while other farmers depend on public grazing land; indeed, some farmers practise grazing
in urban against the by-laws of the city (Gillah et al., 2013). Lack of ownership in using
communal land was also reported to be a source of conflicts between crop and livestock
farmers and negatively affects incentives to sustainable land use, which results in land
degradation in Tanzania (Lugoe, 2011).
In the list of environmental indicators, some were noticeable by their absence. Indicators
considered relevant by other studies such as greenhouse gas emissions and manure use
(Chand et al., 2015) were rejected by the respondents as not relevant in this study context.
Our finding is in agreement with Nuntapanich (2011) in Thailand who also did not include
greenhouse gas emissions in sustainability indicators milk production. Indeed, Lopez-
Ridaura et al. (2005) argue that indicators relevant in one context may not be relevant in
another context. Some indicators ranked surprisingly low. The two indicators of land
degradation, namely stocking density and soil conservation were ranked sixth and seventh
in the list. This variation in relevance could be explained by the local context of
sustainability indicators (Gafsi and Favreau, 2010). Alternatively, it may be that given the
current nature of the milk supply chain in Tanzania, environmental factors are simply seen
as less pressing than expansion of production.

98
Some indicators were viewed differently among different groups of respondents. Most of
economic indicators were accepted by all the groups of respondents. For social indicators,
the farmers expressed more interest than the other groups that accepted only two of the
seven indicators for each. For environmental indicators, the farmers showed less interest
than other groups where they considered only four out of seven indicators. van Calker
(2005) has suggested selection of indicators of concern to individual groups of
respondents. Although perceptions of sustainability vary among individuals, a compromise
among the diversity of experts and stakeholders is necessary to avoid failure in
sustainability improvement such as was observed by Ogle (2001).
5.2 Framework for Assessing Sustainability of Smallholder Dairy and Traditional
Cattle Milk Producer Farms
5.2.1 Framework development
The framework was developed to assess sustainability of milk production farms in the
context of smallholder dairy and traditional cattle production farms in Tanzania. The
developed tool provided a framework for assessing sustainability of smallholder dairy and
traditional cattle milk production farms. It is unique and more locally adapted compared to
the existing ones. The developed framework may be used to assess milk production farm
sustainability in Tanzania more objectively compared to the existing performance
measurements. Besides measuring, the framework synthesizes the sustainability
performances to express them into more meaningful forms through normalization and
aggregation of individual indicators into indices contrary to the simple presentation of raw
sustainability indicator performances as reported by Ogle (2001) in Tanzania.
The developed framework differs from the existing frameworks found in the literature,
such as the one used by chand et al. (2016) and FAO (2013), in terms of the nature and

99
number of individual indicators, the number of dimensions, and distribution of indicators
within dimensions and weights of indicators. These differences are explained by the
context specific of sustainability concept. Hence, using a framework which is not adapted
to the study contexts could results into failure in sustainability improvement program.
The number of indicators used in this framework is fewer than the number of indicators
provided by the experts and stakeholders. This could be explained by the fact that the
developed framework is for rapid sustainability assessment (RSA) on contrary to full
sustainability assessment (FSA) which provides more details with a large number of
indicators as suggested by Marchand (2014). If and when framework users increase their
commitment to on-farm sustainability, they can gain additional insight by using an FSA
tool.
5.2.2 Sustainability performances of smallholder dairy and traditional cattle milk
producer farms
5.2.2.1 Overall farm sustainability
The results showed that the overall sustainability mean score was low and significantly
higher in R-to-U system than in R-to-R system. These findings reflect the current situation
of sustainability as it has been reported through a series of studies about milk production
issues in Tanzania (Nkya et al., 2007; Baker et al., 2015). The difference could be
explained by the dominance of traditional cattle keeping system in R-to-R system
compared to R-to-U system. In fact, the traditional cattle keeping system is less developed
and characterised by a larger number of constraints to its sustainability compared to the
smallholder dairy farming system in the study area. Some of the constraints are shortage of
water, conflict between pastoralists and crop farmers, low cow productivity and inefficient

100
milk marketing system (Leonard et al., 2016).
5.2.2.2 Economic sustainability
The results showed that the income mean score was moderate and the situation was
significantly more severe in R-to-R system than in R-to-U system. The results could be
attributed to various up and downstream factors like inefficiency of milk market system,
low cow productivity and farm management. The farmers usually sell their milk to the
nearest buyers (vendors and local consumers) who pay more than other buyers along the
marketing channel like milk processors and collection centres but the nearest buyers have
a limited buying capacity which could be overloaded during the rainy season; hence, the
remaining milk is either sold at low price to the other milk buyers or consumed at home
(ILRI, 2014b; Leonard et al., 2016; Cadilhon et al., 2016). Indeed, the potential buyers are
the ones who make decision on milk price (Cadilhon et al., 2016). The limited milk
market affects more R-to-R system due to the remoteness vs. the potential milk buyer; and
this remoteness could explain the significant difference between the two systems.
A number of farmers did not use artificial insemination. Moreover, the use of artificial
insemination was lower in R-to-R system compared to R-to-U system. Previous studies
show that the main reasons for not using artificial insemination are, among others, the high
cost of artificial insemination service, low pregnancy rate, the unavailability of the service
(Mangesho et al., 2013; ILRI, 2014b). Indeed, a number of traditional cattle farmers prefer
a large number of indigenous cattle as asset (Sikira et al., 2013). This preference could
justify the significant mean difference between the two studied systems.
A large number of the farmers strongly depend on external inputs in terms of forage and
did not conserve feed. The situation was poorer in R-to-R system where the forage is

101
exclusively from off-farm supply. The dependence on external forage supply could be the
result of low adoption of forage cultivation and conservation technology. The reasons for
not cultivating fodder are, among others, lack of knowledge of fodder cultivation
technology, large number of cattle specifically for pastoralists (Sikira et al., 2013; ILRI,
2014b) and mainly because off farm feed is available and at low cost (only cost of person
in charge of grazing the animals).
5.2.2.3 Social indicators
Participation in farmers’ organizations was moderate. The reason could be attributed to
lack of farmers’ organization in the study area as reported by (Nkya et al., 2007; Sikira et
al., 2013). Participation in organisations was significantly higher in R-to-U system than R-
to-R system. A number of reasons could explain the difference in participation in
organisations. The farmers’ organisations in R-to-U system are strong and linked with a
number of actors of the milk value chain (Cadilhon et al., 2016) which is an incentive for
the farmers to join them compared to the organisations in R-to-R particularly in Mvomero
which are weak and can not influence prices (Leonard et al., 2016). In addition, the
farmers’ organizations could be less active due to the mobility of the pastoralists in R-to-R
system compared to R-to-U system.
The results showed that some women were disempowered. The situation was significantly
more pronounced in R-to-R system than in R-to-U system. These findings are supported
by Sikira et al. (2013) and Baker et al. (2015) who reported that women make the decision
over only milk. Meanwhile, other decisions on more important activities and assets
(livestock and crops) are mostly made by men in extensive systems especially pastoralists;

102
contrary to the intensive system, where the decision over all activities on all production
assets is mostly made jointly by men and women.
5.2.2.4 Environmental indicators
Long term land ownership is among the determinant for sustainable land use (Shrestha and
Ligonja, 2015). However, land ownership showed the lowest score among environmental
indicators. Similarly, the issue of land shortage or tenure insecurity was reported by Baker
et al. (2015) and is also among the main sources of conflicts between cattle farmers and
farmers in Tanzania (Lugoe, 2011).
The results showed that a number of farmers do not control erosion, especially in R-to-R
system. Results from this study corroborate with the results of Morris et al. (2015) who
reported the case of erosion in Tanga region especially in farmers who do not use methods
against erosion like establishing terraces. The predisposition to erosion risk and the
farming system could be the reason of the difference in two studied systems. R-to-U
system includes high risk zones like Lushoto, which motivate the farmers to adopt erosion
control practices. Indeed, pastoralists in R-to-R system are less involved in crop farming,
thus, soil prevention practices like establishing terraces is not frequent as they are not
needed.
Surprisingly, availability of water was good in both R-to-R system and R-to-U system in
spite of several reports on water shortage in Tanzania such as by Forbes and Kepe (2014).
The situation could be explained by the fact that the study was conducted in the period
which covers the pick rainfall period.

103
5.3 Relationship between Farm Level Milk Production Sustainability Performances
and Producers’ Organization Sustainability Dimensions
5.3.1 Farm sustainability Performances in PO-members and non-PO-members
The overall farm sustainability mean performance index score and most of its dimensions
and mean performance indicators were significantly higher in PO-members than non-
members. These findings also confirm the finding of the studies by Mojo et al. (2015) and
Chagwiza et al. (2016) that organization facilitate access to production inputs and output
markets and other services which result in improved farm economic viability with socially
acceptable and environmentally friendly practices.
5.3.2 Producers’ organization characteristics
POs in Lushoto District were the oldest and presented the highest average number of
member per PO. This could be explained by the presence of high proportion of
smallholder dairy farmers, which motivates the farmers to join and build strong POs,
unlike the other districts with high proportion of traditional cattle and some
transhumance,. POs in Mvomero District presented the highest proportion of women. This
could be explained by the fact that Mvomero District is dominated by traditional cattle
keeping where women are in charge of milk. Thus, they join POs in order to sell their
milk.
5.3.3 Producers’ organization sustainability performances
The overall PO sustainability mean performance index was ranked in Stage II. This
implies that a number of POs did not reach the stage of maturity to graduate (Stage IV).
Results from this study are in line with findings by Tumusiime and Matotay (2014) who
also reported poor performances of POs in Tanzania. Similarly, the engagement with

104
output buyer and financial health PO sustainability performance dimensions were among
the weakest PO sustainability performance dimensions. This situation could be due to the
low knowledge on business and marketing as it has been reported in Tanzania by Uliwa
and Fischer (2004). Although a number of trainings has been conducted during the PO
monitoring, Barham and Chitemi (2009) disclosed that low level of education of the
members in the study area does not allow absorbing and implementing the outcomes from
the trainings fully. Indeed, Trebbin (2014) in Ethiopia suggests that most of the
organizations promoted by NGOs lack business skills to develop reliable market linkages.
A number of POs were newly established. However, Kaganzi et al. (2009) and Kamdem
(2012) in Cameroon and Uganda, respectively, suggest two up to five years of monitoring
to achieve sustainability especially in strengthening management and leadership and in
establishing market linkages. The business unit made loss could be explained by the fact
that during the early stage, the POs were overambitious by conducting many activities
which are beyond their capacity, hence, they had to give up some in order to be efficient.
The weak financial health sustainability performance is probably due to the fact that the
farmers were expecting to get external supports from the donors/government instead of
generating their own financial resources.
5.3.4 Correlations between overall farm and PO sustainability performance
indicators
The overall PO sustainability performance index showed a significant moderate positive
correlation with the overall farm sustainability performance index. This result confirms
that an effective PO could be a vehicle of sustainable agriculture practice at farm level as
reported by Iyabano et al. (2016) and Mojo et al. (2017). Moreover, the overall farm
sustainability performance index showed strong positive correlations with PO “access to

105
dairy production inputs and services” dimension and most of its sub-dimensions and
effective management of “effective and transparent leadership and management”. This
strong correlation implies that a good provision of inputs and services to the PO members,
together with a good effective management could influence positively the overall farm
sustainability performance. The overall farm sustainability performance indices are
aggregation of indicators. Therefore, their lower level of aggregation is crucial to
understand more precisely the relationships.
5.3.5 Economic dimension
The farm economic sustainability performance dimension showed a strong positive
correlation with overall sustainability performance index and access to dairy production
inputs and service sustainability performance dimension of PO. The strong positive
correlations could explain the importance of PO in alleviating the economic challenges of
milk production in the study area, namely, low productivity due to poor genetic potential
of the dominant indigenous cattle breeds, shortage of feed, shortage of outputs market and
poor farm management skills which have been reported in the study area (Nkya et al.,
2007; Baker et al., 2015; Leonard et al., 2016).
There were positive correlations between “access to dairy production inputs and services”
PO sustainability performance dimension and most of its sub-dimensions and cow
productivity, forage self-sufficiency, feed conservation and use of artificial insemination.
This implies that POs could play an important role in improving cow productivity by
facilitating access to artificial insemination to improve the genetic potential of cattle breed,
inputs and health services and provide training, extension and information for better farm
management including forage cultivation and feed conservation technologies. Similar
106
results have been reported by Chagwiza et al. (2016) in Ethiopia who found that PO has a
positive impact on the similar farm performance indicators and suggested that PO could be
a pathway that leads to intensification through using improved cows and their associated
requirements as facilitated by PO.
The inputs and services provided by PO supports increased output, which requires better
market. This could explain the positive correlations between engagements with outputs
buyers dimension and all its sub-dimensions and farm economic performance dimension
and cow productivity and feed conservation farm sustainability performance indicator.
Results from this study are in line with Jera and Ajayi (2008) in Zimbabwe who found that
access to dairy output market is a driver for the adoption of feed technology namely forage
cultivation and conservation. Evidence in Uganda showed that increase in production
without access to market does not provide incentive for the PO-members due to the fact
that it generates oversupply at the farm level (Kaganzi et al., 2009).
Activities of PO such as linking the organization to market and provision of inputs which
result in increased farm performances need mobilization of financial resources to make
them more readily available. This could explain the number of positive correlations
between PO financial health and its sub-dimensions and economic dimension and almost
the entire set of cow productivity, feed conservation, and use of artificial insemination and
forage self-sufficiency indicators. Results of the study are supported by Sonam and
Martwanna (2011) who suggest that a sustainable PO should be profitable and have
liquidity instead of depending on external support.
Efficient inputs and services supply and creation of linkages with milk buyers require
good management, which could explain the correlations between PO “effective and

107
transparent leadership and management” dimension and mostly effective management
sub-dimension and cow productivity, feed conservation, forage self-sufficiency and use of
artificial insemination indicators as well as the economic dimension of PO sustainability
performances. Leadership is important to link the members with better markets, especially
higher markets which need a lot of attention and good management of resources (Kaganzi
et al., 2009). Moreover, some PO can go far successfully but end up collapsing due to
poor financial management (Kaganzi et al., 2009).
Surprisingly, there were non-significant correlations between income (gross margin per
litre of sold milk) and almost all PO performance dimensions and their sub-dimensions.
The lack of significant correlation could be due to the fact that the milk processors linked
to PO provide reliable market but low price and delay in payment compared to middlemen
and neighbours as reported by the farmers during the survey and Cadilhon et al. (2016);
Leonard et al. (2016).
There was a negative relationship between labour productivity and the overall PO
sustainability. This could be explained by the fact that POs favour intensification which is
labour demanding (Chagwiza et al., 2016). Moreover, the study was conducted in the
rainy season where feed and water are available at very low cost, especially, in
predominantly traditional systems with poor performing POs compared to the
predominantly smallholder dairy system with better performing POs.
5.3.6 Social dimension
There was a positive correlation between social sustainability farm performance
dimension and overall PO sustainability performance index. Similarly, evidence in
Tanzania shows that education has a positive effect on PO marketing due to the fact that
the farmers with good education level are more responsive to trainings (Barham et al.,

108
2009). Also Kamdem (2012) in Cameroun suggest that education level is crucial for PO
success in business.
Women’s empowerment was positively correlated with PO overall sustainability, “access
to dairy production inputs and services” PO sustainability performance dimension and all
its sub-dimensions. These positive correlations could be explained by the fact that women
are in charge of milk, especially in extensive systems.
5.3.7 Environmental dimension
The organization was mostly meant for marketing purpose. However, there were a number
of positive correlations between environmental performance dimension and its indicators
and PO overall performance, most of its dimensions and their sub-dimensions. These
correlations imply that there are positive associations between farm environmental and PO
sustainability performances. This could be explained by the fact that PO favour
intensification which in the study area has positive impact on the environment. Our results
corroborate with results by Iyabano et al. (2016) who observed that farmers in
organization had practices which are environmental friendly in their farm. Meanwhile,
Mojo et al. (2015) in Ethiopia found that PO could have negative impact on the
environment due to the benefit it provides which results in overexploitation of natural
resources.
5.3.8 Producers’ organization level factors influencing farm sustainability
The results from the regression show that PO financial health sustainability performance
dimension had a positive and significant effect on the overall farm sustainability
performance index. This positive effect could be explained by the fact that financial means
enable the organization to run its activities, thus better help its member than the

109
organization with less financial means. Access to dairy production inputs and services PO
sustainability performance had a positive and significant effect on the economic and the
environmental farm sustainability performance dimension. This could be explained by the
fact that the more the farmers get access to inputs and services, the more the economic
sustainability of their farms is improved. However, the engagement with output buyers
showed a negative effect on the economic. The negative effect could due to the fact that
the milk processors linked to PO provide reliable market but low price and delay in
payment compared to middlemen and neighbours as reported by the farmers during the
survey, Cadilhon et al. (2016) and Leonard et al. (2016).
5.4 Determinants of Smallholder Dairy and Traditional Cattle Milk Producer Farm
Sustainability
5.4.1 Socio-economic characteristics of the households
The farmers in R-to-U system had significantly smaller land and herd size than in R-to-R
system. This difference could be explained by the fact that R-to-U system included a large
number of smallholder dairy farmers particularly in Lushoto District while the R-to-R
system encompass a large number of traditional cattle farmers with a large proportion of
indigenous cattle herd particularly in Kilosa District (Leonard et al., 2016).
5.4.2 Determinants of farm sustainability
Feeding system showed a positive influence on the economic, social, environment and
overall farm sustainability performance indices. This implies that stall feeding is
associated with improved economic, social, environmental and overall sustainability. This
could be due to the fact that stall feeding is associated with a number of practices which
could improve a number of the economic, social and environmental sustainability

110
performance indicators. In fact, stall feeding is among the strategy to improve
productivity, especially in smallholder dairy farming systems compared to the extensive
systems in the study area. Improved milk yield generated by stall feeding is associated
with the need for milk and input markets as well as other embedded services which could
be incentives for participation in organizations. In stall feeding, the feed must be available
the whole year round, which is an incentive to forage cultivation. Furthermore, the forage
cultivation is important in soil and water conservation (Lebacq et al., 2015).
The economic and environmental sustainability increased with farm size. This could be
due to the fact that the farmers with adequate land more likely spare land for fodder
cultivation and use crop residues from their own farms which also could result in
increased milk (Lanyasunya et al., 2006). Similarly in Zimbabwe, Chakoma (2012) reports
that land shortage is a constraint for adopting sustainable forage production. Therefore, the
farmers with inadequate or without land will likely get feed from off-farm sources or
practice grazing system which faces more economic sustainability issues like low cow
productivity and responsible for environmental sustainability issues like overuse of natural
resources compared to the stall feeding systems. Moreover, possession of large land
implies that farmers have financial means which enable them adoption of economically
and environmentally sustainable agriculture.
Acquiring credit had a significant positive influence on the social sustainability
performances. The positive influence of credit on social sustainability performances
implies that acquiring credit enhances social sustainability indicators such as participation
in organization, education level of the household head and women’s empowerment. Our
results corroborate with results by Asante et al. (2011) in Ghana and Tolno et al. (2015);
Olila (2014) in Kenya who found that access to credit is an incentive to social integration

111
like participation in organizations. Taj et al. (2012) in India suggest that acquiring credit
enables increased milk production and improve education. Indeed, Mani (2015) in India
observed that acquiring credit has a positive influence on women’s empowerment.
The results showed positive and significant effect of sex of household head on the
environmental sustainability. This implies that female headed household are more likely to
practice environmentally friendly farming practice. Similarly, Kizza et al. (2016) in
Uganda found that women are more involved in water and soil conservation activities than
their male counterparts. However, our results differ from the results of Atinkut et al.
(2017) who report that in Ethiopia men use sustainable agriculture practice as they have
more access to land than women. This difference could be explained by the fact that, in
spite of scarce resources including land, the women are mostly attracted by smallholder
dairy farming and adopt stall feeding practice which is more environmentally friendly
compared to grazing system in the study area (Kaliba et al., 1997). Indeed, women have
less managerial skills on large cattle herd rearing than men.
Age of household head had significant effect of overall, social and environmental
sustainability. This implies that the older the household head, the more sustainable is the
farm. These findings corroborate with Li et al. (2016) in China who suggest that older
farmers have more assets compared to the younger farmers which enable them to use
environmentally and social sustainable practices. Similarly, Atinkut et al. (2017) argue
that the old farmers are likely to use sustainable agriculture practices due to their
experience. Mgbada (2016) in Nigeria found that the older farmers are conservative and
do not introduce new technology which is not environmentally friendly. For the social
sustainability, these results are in line with those of Francesconi and Ruben (2012) and

112
Chagwiza et al., 2016) in Ethiopia who found that older farmers are more likely to join
farmers’ organizations, which is among key indicators of farm social sustainability.
However, these results differ from what was reported by Gómez-Limón and Sanchez-
Fernandez (2010) in Spain who found a negative effect of the household manager age on
the overall farm sustainability due to the fact that the young are not likely to abandon the
farm, and use more sustainable practices. Li et al. (2016) in China suggest that in spite
more assets possession and experience, the older farmers have shorter life expectancy
compared to young, which has a negative effect on social sustainability. This discrepancy
could be more explained by Van Passel et al. (2006) who suggest that sustainability
increases with age but decreases at the advanced age. This effect of age on social
sustainability performances could vary with the context of farming systems the same way
as sustainability is context specific.
Distance to trading centre showed a negative impact on the economic sustainability.
Similar results were reported in China (Li et al., 2016). This could be due to the fact that
households dwelling near the trading centre have more access to inputs and outputs
markets and other services, which result in increased economic sustainability
performances, including productivity and income compared to the farmers in the remote
areas.

113
CHAPTER SIX
6.0 CONCLUSIONS AND RECOMMENDATIONS
6.1 Conclusions
The first objective was to identify indicators for assessing sustainability of smallholder
dairy and traditional cattle milk production farm. The study showed that a large number of
existing indicators like greenhouse gas emissions could be considered less relevant in the
context of Tanzania’s smallholder dairy and traditional cattle system than in other
contexts. Therefore, the study showed that the set of only 29 out of 57 sustainability
indicators were relevant to the studied system. The most relevant economic indicators
were milk hygiene and cow productivity; social indicators were participation in
organizations and women’s empowerment; environmental indicators were access to water
and water conservation. The indicators identified here demonstrate the importance of
matching any set of indicators to the characteristics of the specific production system
being examined.
Regarding the level of sustainability of the milk production farms, the results showed that
the overall farm sustainability performances and its economic, social and environmental
dimensions were in weak range. The economic, social and overall sustainability
performances were moderate in rural production to urban consumption systems and non-
sustainable in rural production to rural consumption system.
Regarding the third objective “to establish the relationships between farm and PO
sustainability”, it is concluded that participating in POs has a positive effect on farm
sustainability performances, especially the economic and social sustainability performance
dimensions. Access to dairy production inputs and services at PO level has strong positive
114
relationships with the farm economic sustainability dimension performance and related
“cow productivity, forage self-sufficiency and feed conservation” indicators.
The fourth objective aimed to analyse the factors influencing milk production farm
sustainability. The results showed that the key factors of milk production farm
sustainability were the stall feeding system, acquiring credit, distance to trading centre and
farm size.
6.2 Recommendations
6.2.1 Promoting use of the milk production sustainability assessment tool
Sustainability is dynamic and varies among individuals, which implies that the developed
tool is not static. Therefore, the tool may be improved based on the objectives and the
dynamics of sustainability in order to stay adapted to the context being studied. Indeed, the
framework used in this study should be easily applied to other milk production farming
systems by modifying some of its components especially in developing countries where
farming systems are heterogeneous.
6.2.2 Improvement of economic, social and environmental sustainability
The overall PO sustainability performance and its “dairy production inputs and service
provision” dimension significantly vary with the farm economic sustainability. Therefore,
building sustainable POs should be used as a strategy to improve farm sustainability
especially in case of dairy inputs and services (eg. training, artificial insemination, credit
and feed) provision which are difficult to access at individual level.
The stall feeding system showed a positive effect on farm economic, social and
environmental sustainability. Therefore, the stall feeding system should be encouraged

115
where applicable in order to improve economic, social and environmental sustainability.
This is possible by supporting farmers in access to graded cows, training the farmers on
dairy cow management, facilitate access to inputs and service provision and access to
reliable milk market.
Access to credit has a positive effect on social and economic farm sustainability.
Therefore, access to credit through POs should be improved in order to enhance social and
economic sustainability and alleviate the issue of collateral.
The more the distance to trading centre increase, the more the economic sustainability is
likely to decrease. Hence, active POs should be used to alleviate issues like access to
inputs and services and limited markets which are encountered by the farmers in the
remote areas.
The older household heads are likely to have more socially sustainable farms than
younger. Therefore, there should be a specific program targeting the younger farmers such
as providing them with dairy services such as credit and training in order to make dairy
farming attractive within young generations.
Women household heads are likely to have more environmental sustainable farms than
men. Hence, women should be encouraged to practice dairy farming, which is possible
through facilitating access to capital especially graded breeds and embedded inputs and
services including credit. Moreover, a program should be implemented to sensitise male
headed households on environmentally sustainable farming practices.

116
6.2.5 Improvement of PO sustainability
The results showed that a number of POs were weak. Therefore, the POs in the study area
should be strengthened in order to be sustainable, particularly in inputs and service
provision and effective transparent leadership and management. The transparent
leadership and management could be acquired via PO training on organisational skills.
Indeed, the PO could be assisted in making strong linkages with inputs suppliers and
reliable milk markets, and generating their own income.
6.2.6 Contribution of the Study and Suggestions for Further Research
Improving sustainability of Tanzania’s milk production needs a good understanding of its
sustainability status. This study contributes to the existing knowledge on sustainability
assessment by developing a locally adapted tool and framework for assessing economic,
environmental and social sustainability at individual milk producer farm level and
sustainability at the level of producer organization. However, in this study only a rapid
sustainability assessment was undertaken at the farm level using indicators with data
readily available, while indicators, such as milk hygiene and use of drugs as
recommended, which are difficult to measure due to their cost and data availability were
dropped out. Therefore, a detailed study for complete sustainability assessment that would
provide more insight on the sustainability of milk production in smallholder dairy and
traditional cattle production systems in Tanzania is recommended. Moreover, further
studies need to be conducted at higher level, especially at village and country levels in
order to properly cover the features which are not covered at the farm level, like
overgrazing and allocation of land for livestock in traditional cattle keeping systems.
117
REFERENCES
Agbonlahor, M. U., Enilolobo, O. S., Sodiaya, C. I., Akerele, D. and Oke, J. T. (2012).
Accelerating Rural Growth through Collective Action: Groups’ Activities and
Determinants of Participation in South-western Nigeria Journal of Rural Social
Sciences 27(1): 114 – 136.
Alkire, S., Meinzen-Dick, R., Peterman, A., Quisumbing, A., Seymour, G. and Vaz, A.
(2013). The women’s Empowerment in Agriculture Index. World Development
52: 71 – 91.
American Society of Agronomy (1989). Decision Reached on Sustainable Agriculture.
Agronomy News, Madison, Wisconsin. 15pp.
Arandia, A., Intxaurrandieta, J. M., Mangado, J. M., Santamaría, P., Icaran, C., Lopez, E.,
Del Hierro, O., Pinto, M., Ruiz, R., Nafarrate, L. (2011). Incorporating Social
and Environmental Indicators in Technical and Economic Advisory
Programmes in Livestock Farming. In: Economic, Social and Environmental
Sustainability in Sheep and Goat Production Systems. (Edited by Bernués, A.,
Boutonnet, J. P., Casasús, I., Chentouf, M., Gabiña, D., Joy, M., López-Francos,
A., Morand-Fehr, P. and Pacheco, F.), Zaragoza: CIHEAM / FAO / CITA-
DGA, Rome, Italy. pp. 9 – 15.
Arellanes, P. and Lee, D. R. (2003). The Determinants of Adoption of Sustainable
Agriculture Technologies: Evidence from the Hillsides of Honduras. In:

118
Proceedings of the 25th International Conference of Agricultural Economists. 16
- 22 August 2003, Durban, South Africa. 693–699 pp.
Asante, B. O, Afari-sefa, V., Sefa, V. A. and Sarpong, D. B. (2011). Determinants of
Small Scale Farmers’ Decision to Join Farmer Based Organizations in Ghana.
African Journal of Agricultural Research 6(10): 2273 – 2279.
Atanasov, D. and Popova, B. (2010). Approaches to Selection and Integration of
Indicators for Sustainable Development of Agriculture. Trakia Journal of
Sciences 8(3): 133 – 139.
Atanga, N. L., Treydte, A. C. and Birner, R. (2013). Assessing the Sustainability of
Different Small-scale Livestock Production Systems in the Afar Region,
Ethiopia. Land 2: 726 - 755.
Atinkut, H. B., Bedri, A. K., Sentayehu, A. K. and Warren, D. (2017). Farmers’
Investment on Sustainable Agricultural Practices : Evidence from Amhara
Farmers’ Investment on Sustainable Agricultural Practices : Evidence from
Amhara Region, Ethiopia. American Journal of Life Sciences 5(2): 38 - 45.
Baker, D., Cadilhon, J. and Ochola, W. (2015). Identification and Analysis of Smallholder
Producers Constraints: Applications to Tanzania and Uganda. Development in
Practice 25(2): 204 – 220.
Baltenweck, I., Omondi, I., Waithanji, E., Kinuthia, E. and Odhiambo, M. (2016). Dairy
Value Chains in East Africa: Why so Few Women? In: A Different Kettle of
Fish? Gender Integration in Livestock and Fish Research (Edited by Pyburn, R.
and Eerdewijk, A. V.), LM Publishers, Volendam. pp. 137- 146.

119
Baumgartner, R. J. and Ebner, D. (2010). Corporate Sustainability Strategies:
Sustainability Profiles and Maturity Levels. Sustainable Development 18: 76–
89.
Bausch, J. C., Bojórquez-Tapia, L. and Eakin, H. (2014). Agro-environmental
sustainability assessment using multicriteria decision analysis and system
analysis. Sustain. Sci. 2014; 1 – 17.
Bayer, W. and Kapunda, L. B. (2006). Dairy Cattle for Poverty Alleviation in Southern
Tanzania. In: Proceedings of the Conference on International Agricultural
Research for Development. 11 - 13 October 2006, Bonn, Germany. [http://www.
tropentag.de/2006/ abstracts/full/415.pdf/] site visited on 10/1/2017.
Bekhouche-Guendouzj, N. (2011). Assessment of the sustainability of dairy cattle farms of
Mitidja and Annaba sheds. PhD thesis for Award of Degree of Doctorate of
Agronomy at INA El Harrach, French, 308pp.
Bélanger, V., Vanasse, A., Parent, D., Allard, G. and Pellerin, D. (2012). Development of
Agri-Environmental Indicators to Assess Dairy Farm Sustainability in Quebec,
Eastern Canada. Ecological Indicators 23: 421 – 430.
Bélanger, V., Vanasse, A., Parent, D., Allard, G. and Pellerin, D. (2015). DELTA: An
Integrated Indicator-Based Self-Assessment Tool for the Evaluation of Dairy
Farms Sustainability in Quebec, Canada, Agroecology and Sustainable Food
Systems 39(9): 1022 – 1046.
Bell, S. and Morse, S. (2001). Breaking through the Glass Ceiling: Who really cares about
sustainability indicators? Local Environ 6: 291–309.

120
Bell, S. and Morse, S. (2003). Measuring Sustainability, Learning from Doing. Earthscan
Publications Ltd., London. 218pp.
Benjaminsen, T. A., Maganga, F. P. and Abdallah, J. M. (2009). The Kilosa Killings:
Political Ecology of a Farmer-herder Conflict in Tanzania. Development and
Change 40(3): 423 – 445.
Binder, C. R, Feola, G. and Steinberger, J. K. (2010). Considering the normative, systemic
and procedural dimensions in indicator-based sustainabil- ity assessments in
agriculture. Environ Impact Asses 30: 71 – 81.
Bockstaller, C. and Girardin, P. (2003). How to Validate Environmental Indicators.
Agricultural Systems 76: 639 – 653.
Bockstaller, C., Guichard, L., Keichinger, O., Girardin, P., Galan, M. B. and Gaillard, G.
(2009). Comparison of Methods to Assess the Sustainability of Agricultural
Systems. A Review. Agronomy for Sustainable Development 29 (1): 223 - 235.
Bond, A., Morrison-Saunders, A. and Poper, J. (2012). Sustainability Assessment: the
State of the Art. Impact Assessment and Project Appraisal 30(1): 53 – 62.
Borin, P., Claro, D. O. and Pensa, U. (2006). Sustainability Indicators : A Tool to Evaluate
and Monitor the Impacts of Agri-Chains on Sustainability. XIII SIMPEP, 6 - 8
November 2006, Bauru, Brasil.
Bossel, H. (1999). Indicators for Sustainable Development : Theory , Method. A Report to
the Balaton Group. The International Institute for Sustainable Development

121
(IISD), Manitoba, Canada. 124pp.
Burkholder, J., L. Bob, W., Peter, H., Susan, K., Dana, T., Peter, S. and Michael, W.
(2007). Impacts of waste from concentrated animal feeding operations on water
quality. Environmental Health Perspectives 115: 308 – 312.
Cadilhon, J. J., Diep, P. N. and Maass, B. L. (2016). The Tanga Dairy Platform: Fostering
Innovations for more Efficient Dairy Chain Coordination in Tanzania.
International Journal of Food System Dynamics 7(2): 81 – 91.
Cella-de-Oliveira, F. A. (2013). Indicators of Organizational Sustainability: A Proposition
From Organizational Competences. International Review of Management and
Business Research 2(4): 962 - 979.
Chagwiza, C., Muradian, R. and Ruben, R. (2016). Cooperative Membership and Dairy
Performance among Smallholders in Ethiopia. Food Policy 59: 165 – 173.
Chakoma, I. C. (2012). Sustainable Forage Production Strategies for Small Scale
Livestock Production in Zimbabwe. International Journal of Agriculture
Innovations and Research 1(3): 85 – 90.
Chand, P. (2011). Assessment of Women Empowerment in Dairying : A Study of Semi-
Arid Rajasthan. Indian J.Dryland Agric. Res. and Dev. 26 (2): 28 – 32.
Chand, P., Sirohi, S. and Sirohi, S. K. (2015). Development and Application of an
Integrated Sustainability Index for Small-Holder Dairy Farms in Rajasthan,
India. Ecological Indicators 56: 23 – 30.

122
Chu, C. H. and Hwang, G. J. (2008). A Delphi-based Approach to Developing Expert
Systems with The Cooperation of Multiple Experts. Expert Systems with
Applications 34(4): 2826 - 2840.
Covarrubias, K., Nsiima, L. and Zezza, A. (2012). Livestock and Livelihoods in Rural
Tanzania. A Descriptive Analysis of The 2009 National Panel Survey. Joint
paper of the World Bank, FAO, AU-IBAR, ILRI and the Tanzania Ministry of
Livestock and Fisheries Development with support from the Gates Foundation:
Dar Es Salaam, Tanzania. 51pp.
Cox, W. and Ziv, J. C. (2005). Dimensions of Sustainability. People, Land, Environment
and Transport Infrastructures Reliability and Development. [http://www.
publicpurpose.com/bari.pdf] site visited on 10/9/2018.
Dabkiene, V. (2015). Factors Affecting the Farm Sustainability in Lithuania. The Economy
of Agro-Industrial Complex 4: 93 - 100.
Dale, V. H. and Beyeler, S. C. (2001). Challenges in the Development and Use of
Ecological Indicators. Ecological Indicators 1(1): 3 – 10.
Danttsis, T., Douma, C., Giourga, C., Loumou, A. and Polychronaki, E. (2010). A
Methodological Approach to Assess and Compare the Sustainability Level of
Agricultural Plant Production Systems. Ecological Indicators 10(2): 256 – 263.
De Boer, I. J. M. and Cornelissen, A. M. G. (2002). A Method Using Sustainability
Indicators to Compare Conventional and Animal-Friendly Egg Production
Systems. Poultry Science 81: 173 – 181.

123
de Olde, E. M., Oudshoorn, F. W., Sorensen, C. A. G., Bokkers, E. A. M. and De Boer, I.
J. M. (2016). Assessing Sustainability at Farm-Level: Lessons Learned From a
Comparison of Tools in Practice. Ecological Indicators 66: 391 – 404.
Devendra, C. (2001). Smallholder dairy production systems in developing countries:
characteristics, potential and opportunities for improvement–review. Asian-
Australasian Journal of Animal Sciences 14 (1): 104 - 113.
Devuyst, D. (2011). Introduction to Sustainability Assessment at the Local Level. In: How
Green Is the City? Sustainability Assessment and the Management of Urban
Environments (Edited by Devuyst, D.), Columbia University Press, New York.
pp. 1 - 41.
Dhanashekar, R., Akkinepalli, S. and Nellutla, A. (2013). Milk-Borne Infections. An
Analysis of their Potential Effect on the Milk Industry. GERMS 2(3): 1 – 9.
Diazabakana, A., Latruffe, L., Bockstaller, C., Desjeux, Y., Finn, J., Kelly, E., Ryan, M.
and Uthes, S. (2014). A Review of Farm Level Indicators of Sustainability with
a Focus on CAP and FADN. [http://www.flint-fp7.eu/downloads/
reports/FLINT%20WP1%20_D1_2.pdf] site visited on 10/9/2017.
Doto, S. P., Kimambo, A. E., Mgheni, D. M., Mtenga, L. A., Laswai, G. H., Kurwijila, L.
R., Pereka, A. E., Kombe, R. A., Weisbjerg, M. R., Hvelplund, T., Madsen, J.
and Petersen, P. H. (2004). Tanzania Feedstuff Table for Ruminants. Enreca and
Aslip Projects, Dar es Salaam, 71pp.

124
Dugdill, B., Anthony, B., Joe, P. and Scholten, B. A. S. (2013). Dairy Industry
Development Programmes: Their Role in Food and Nutrition Security and
Poverty Reduction. In: Milk and Dairy Products in Human Nutrition. (Edited by
Muehlhoff, E., Bennett, A., Phelan, J. and McMahon, D.), FAO, Roma. pp. 313
– 354.
Elsaesser, M., Herrmann, K. and Jilg, T. (2013). The DAIRYMAN-Sustainability-Index
(DSI) as a possible tool for the evaluation of sustainability of dairy farms in
Northwest-Europe. Dairyman–Report No 3. Agricultural Center Baden-
Wuerttemberg for cattle production, grassland management, dairy processing,
wildlife research and fisheries (LAZBW), Aulendorf, Germany. 120pp.
European Commission (2001). A Framework for Indicators for the Economic and Social
Dimensions of Sustainable Agriculture and Rural Development. [https://ec.
europa.eu/agriculture/publi/reports/sustain/index_en.pdf] site visited on
10/09/2017.
Fadul-Pacheco, L., Wattiaux, M. A., Espinoza-Ortega, A., Sánchez-Vera, E. and Arriaga-
Jordán, C. M. (2013). Evaluation of Sustainability of Smallholder Dairy
Production Systems in the Highlands of Mexico During the Rainy Season.
Agroecology and Sustainable Food Systems 37 (8): 882–901.
FAO (2013). Sustainability Assessment of Food and Agriculture Systems. Guidelines
Version 3.0. FAO, Rome. 255pp.
FAO-IDF (2011). Guide to Good Dairy Farming Practice, Animal Production and Health
Guidelines No. 8. FAO, Rome. 40pp.

125
Fauzi, H., Svensson, G. and Rahman, A. A. (2010). “Triple Bottom Line” as “Sustainable
Corporate Performance”: A Proposition for the Future. Sustainability 2: 1345 -
1360.
Fischer, E. and Qaim, M. (2012). Linking Smallholders to Markets: Determinants and
Impacts of Farmer Collective Action in Kenya. World Development 40(6):
1255.
Forbes, B. and Kepe, T. (2014). Smallholder Farmers’ Attitudes toward the Provision of
Drinking Water for Dairy Cows in Kagera, Tanzania. Tropical Animal Health
and Production 47: 415–421.
Francesconi, G. N. and Ruben, R. (2012). The Hidden Impact of Cooperative Membership
on Quality Management: A Case Study from the Dairy Belt of Addis Ababa.
Journal of Entrepreneurial and Organizational Diversity 1(1): 85 – 103.
Frater, P. and Franks, J. (2013). Measuring Agricultural Sustainability at the Farm Level:
A Pragmatic Approach. International Journal of Agricultural Management 2(4):
207 – 225.
Gafsi, M. and Favreau, J. L. (2010). Appropriate Method to Assess the Sustainability of
Organic Farming Systems. In: the 9th European IFSA Symposium. 4-7 July
2010. Vienna, Austria. 912-921pp.
Gallopin, G. C. (1997). Indicators and their use: Information for Decision-Making. In:
Sustainability Indicators, Report of the Project on Indicators of Sustainable
Development (Edited by Moldan, B., Billharz, S.), John Wiley & Sons:
Chichester, UK. pp. 13 - 27.

126
Gasparatos, A. (2010). Embedded Value Systems in Sustainability Assessment Tools and
their Implications. J. Environ. Manage 91: 1613 – 1622.
Gerber, P. J., Steinfeld, H., Henderson, B., Mottet, A., Opio, C., Dijkman, J., Falcucci, A.
and Tempio, G. (2013). Tackling Climate Change through Livestock – A Global
Assessment of Emissions and Mitigation Opportunities. Food and Agriculture
Organization of the United Nations (FAO), Rome. 116pp.
Gerosa, S. and Skoet, J. (2012). Milk Availability: Trends in Production and Demand and
Medium-Term Outlook. ESA Working Paper. No. 12-01. FAO, Rome. 40pp.
Ghozlane, F., Yakhlef, H., Allane, M. and Bouzida, S. (2006). Evaluation de la Durabilite
des Exploitations Bovines Laitieres de la Wilaya de Tizi-Ouzou (Algerie)
(Evaluation of the Sustainability of Dairy Farms in the Tizi-Ouzou Wilaya
(Algeria). Mediterranean Journal of Economics, Agriculture and Environment
5(4): 48 – 52.
Gillah, K. A., Kifaro, G. C. and Madsen, J. (2013). A Description of Management and
Production Levels of Cross Bred Dairy Cattle in Dar es Salaam and Morogoro
Urban and Peri Urban Areas. Academia Journal of Agricultural Research 1(8):
131 - 144.
Godfray, H. C. J., Beddington, J. R., Crute, I. R., Haddad, L., Lawrence, D., Muir, J. F.,
Pretty, J., Robinson, S., Thomas, S. M. and Toulmin, C. (2010). Food Security:
The Challenge of Feeding 9 billion people. Science 327: 812 – 818.

127
Gómez-Limón, J. A. and Sanchez-Fernandez, G. (2010). Empirical Evaluation of
Agricultural Sustainability Using Composite Indicators. Ecological Economics
69(5): 1062 – 1075.
Gras, R., Benoit, M., Deffontaines, J. P., Duru, M., Lafarge, M., Langlet, A. and Osty, P.
L. (1989). Le fait technique en agronomie. Activite Agricole, Concepts et
Methodes d´Etude (The technical fact in agronomy. Agricultural Activity,
Concepts and Methods of Study). Institut National de la Recherche
Agronomique– Ed. L'Harmattan, Paris. 184pp.
Green, M. (2012). Understanding Rural Transformation in Tanzania. Policy brief No.35.
REPOA, Dar es Salaam, Tanzania. 4pp.
Grenz, J. (2012). RISE (Response-Inducing Sustainability Evaluation), version 2.0. Bern
University of Applied Science, Bern. 5pp.
Grisham, T. (2009). The Delphi Technique: a Method for Testing Complex and
Multifaceted Topics. International Journal of Managing Projects in Business
2(1): 112 – 130.
Hai, L. T., Hai1, P. H., Khoa, N. T and Hens, L. (2009). Indicators for Sustainable
Development in the Quang Tri Province. Vietnam. Journal of Human Ecology
27(3): 217 - 227.
Haileslassie, A. Craufurd, P. Thiagarajah, R. Kumar, S. Whitbread, A. Rathor, A.
Blummel, M. Ericsson, P. and Reddy, K. (2016). Empirical Evaluation of
Sustainability of Divergent Farms in the Dryland Farming Systems of India.
Ecological Indicators 60 (2016): 710 – 723.

128
Häni, F., Braga, F., Stämpfli, A., Keller, T., Fischer, M. and Porsche, H. (2003). RISE, a
Tool for Holistic Sustainability Assessment at the Farm Level. International
Food and Agribusiness Management Review 6(4): 78 – 90.
Hansen, J. W. (1996). Is Agricultural Sustainability a Useful Concept? Agricultural
Systems 50: 117-143.
Harmsen, A. M. K., Geeraedts, L. M. G., Giannakopoulos, G., Terra, F., Christiaans M.,
Mokkink, H. M. T. and Bloemers, F. W. (2015). Protocol of the DENIM Study:
a Delphi-Procedure on the Identification of Trauma Patients in Need of Care by
Physician-Staffed Mobile Medical Teams in the Netherlands. Scandinavian
Journal of Trauma, Resuscitation and Emergency Medicine 23(15): 1 - 7.
Hayati, D., Zahra, R. and Ezatollah, K. (2010). Measuring Agricultural Sustainability.
Sustainable Agriculture Reviews 5: 73 – 100.
Hemme, T. and Otte, J. (2010). Status and Prospects for Smallholder Milk Production-A
Global Perspective. Food and Agriculture Organization, Rome. 182pp.
Henning, J. I. F. and Jordaan, H. (2016). Determinants of financial sustainability for farm
credit applications-a Delphi Study. Sustainability 8(1): 1 - 15.
Herrero, M. and Thornton, P. K. (2013). Livestock and Global Change : Emerging Issues
for Sustainable Food Systems. Proceedings of the National Academy of
Sciences 110(52): 1 – 4.
Holloway, G., Nicholson, C., Delgado, C., Staal, S. and Ehui, S. (2000).
Agroindustrialization through Institutional Innovation: Transaction Costs,

129
Cooperatives and Milk-Market Development in The East-African Highlands.
Agricultural Economics 23: 279 - 288.
Hubbard, G. (2006). Sustainable Organization Performance: Towards A Practical
Measurement System. Monash Business Review 2(3): 1 - 19.
Hugé, J., Le Trinh, H., Hai, P. H., Kuilman, J. and Hens, L. (2010). Sustainability
Indicators for Clean Development Mechanism Projects in Vietnam
Environment. Development and Sustainability 12(4): 561 - 571.
Hume, D. A., Whitelaw, C. B. A. and Archibald, A. L. (2011). The Future of Animal
Production: Improving Productivity and Sustainability. The Journal of
Agricultural Science 149: 9 – 16.
ILRI (2014a). More milk in Tanzania (MoreMilkiT) Phase 2: Adapting Dairy Market
Hubs for Pro-poor Smallholder Value Chains in Tanzania (‘Maziwa Zaidi’
project). [https://cgspace.cgiar.org/bitstream/handle/10568/348 50/moreMilkIt
_brochure .pdf?sequence=1] site visite on 20/5/2016.
ILRI (2014b). The Moremilkit Project: Baseline Report. [https://moremilkit.wikispaces.
com/file/view/MoreMilkIT+Baseline+report.pdf] site visited on 28/04/2016.
Ishaq, M. N., Xia, L. C., Rasheed, R., Ahmad, Z. and Abdullah, M. (2016). Alternative
Milk Marketing Channels and Dairy Performance of Smallholders in Pakistan:
A Case of South Region of Punjab Province. Sarhad Journal of Agriculture
32(4): 304 – 315.
Iyabano, A., Faure, G. and Klerkx, L. (2016). Farmers Organisations Position in the

130
Development of Sustainable Agriculture Practices in Burkina Faso. In: The
proceedings of Solidarity in a competing world — fair use of resources. 19-21
September 2016, Tropentag, Vienna.
Jera, R. and Ajayi, O. C. (2008). Logistic modelling of smallholder livestock farmers’
adoption of tree-based fodder technology in Zimbabwe. Agrekon 47(3): 379 –
392.
Joseph, B. and Coblentz, B. A. (2002). Organizational Sustainability: The Three Aspects
that Matter. [http://www.rocare.org/docs/Organizational%20 Sustainability%
20by %20Joe %20COBLENTZ%202002-02.pdf ] site visited on 3/4/2017.
Kaganzi, E., Ferris, S., Barham, J., Abenakyo, A., Sanginga, P. and Njuki, J. (2009).
Sustaining Linkages to High Value Markets through Collective Action in
Uganda. Food Policy 34(1): 23 – 30.
Kaliba, A. R. M., Featherstone, A. M. and Norman, D. W. (1997). A Stall-Feeding
Management for Improved Cattle in Semiarid Central Tanzania: Factors
Influencing Adoption. Agricultural Economics 17(2–3): 133 – 146.
Kalra, R. K., Anil, B., Tonts, M. and Siddique, K. H. M. (2013). Self-Help Groups in
Indian Agriculture: A Case Study of Farmer Groups in Punjab, Northern India.
Agroecology and Sustainable Food Systems 37(5): 509 -5 30.
Kamalia, F. P., Borgesb, J. A. R., Meuwissena, M. P. M. and de Boerc, I. J. M. (2017).
Sustainability Assessment of Agricultural Systems: The Validity of Expert
Opinion and Robustness of a Multi-Criteria Analysis. Agricultural systems 157:
118 - 128.

131
Kamdem, C. B. (2012). ‘The Determinants of Marketing Efficiency of Cocoa Farmers’
Organization in Cameroon. International Business Research 5(9): 158 – 171.
Kimaro, E. G., Lyimo-Macha, J. G. and Jeckoniah, J. N. (2013). Gender Roles in Small
Holder Dairy Farming: Pertinent Issues on Access and Control over Dairy
Farming Resources in Arumeru District, Tanzania. [http://www.lrrd.org/lrrd25/
5/kim a25082.htm] site visited on 3/4/2015.
Kizza, C. L., Majaliwa, J. G. M., Gabiri, R., Zizinga, A., Sebuliba, E., Nampijja, J. and
Tenywa, M. M. (2016). Soil and Nutrient Losses and Role of Gender in Land
Degradation in Southwestern Uganda. In:Climate Change And Multi-
Dimentional Sustainability In African Agriculture. Sokoine University of
Agriculture, Morogoro, Tanzania. 185 – 240 pp.
Landais, É. (1998). Agriculture durable : Les Fondements d’un Nouveau Contrat Social?
(Sustainable Agriculture: Fondations of a New Social contract?). Le courrier de
l’Environnement de l’INRA 33: 23–40.
Lanyasunya, T. P., Rong, W. H., Mukisira, E. A. and Abdulrazak, S. A. (2006).
Performance of Dairy Cows in Different Livestock Production Systems on
Smallholder Farms in Bahati Division, Nakuru District, Kenya. Pakistan
Journal of Nutrition 5(2): 130 – 134.
Latruffe, L., Diazabakana, A., Bockstaller, C., Desjeux, Y., Finn, J., Kelly, E., Ryan, M.
and Uthes, S. (2016). Measurement of Sustainability in Agriculture: A Review
of Indicators. Studies in Agricultural Economics 118 (3): 123 - 130.

132
Lebacq, T., Baret, P. V. and Stilmant, D. (2013). Sustainability Indicators for Livestock
Farming. A Review. Agronomy for Sustainable Development 33: 311 – 327.
Lebacq, T., Baret, P. V. and Stilmant, D. (2015). Role of Input Self-Sufficiency in The
Economic and Environmental Sustainability of Specialised Dairy Farms.
Animal : An International Journal of Animal Bioscience 9(3): 544 – 52.
Leonard, A., Gabagambi, D. M., Batamuzi, E. K., Karimuribo, E. D. and Wambura, R. M.
(2016). A Milk Marketing System for Pastoralists of Kilosa District in
Tanzania: Market Access, Opportunities and Prospects. International Journal of
Agricultural Marketing 3(1): 090 - 096.
Li, Q., Amjath-Babu, T. S., Zander, P., Liu, Z. and Müller, K. (2016). Sustainability of
Smallholder Agriculture in Semi-Arid Areas under Land Set-aside Programs: A
Case Study from China’s Loess Plateau. Sustainability 8: 1 – 17.
Lichtfouse, E., Navarrete, M., Debaeke, P., Souchère, V., Alberola, C. and Josiane, M.
(2009). Agronomy for Sustainable agriculture. A Review. Agronomy for
Sustainable Development. Springer Verlag/EDP Sciences/INRA, 29 (1): 1 - 6.
Linstone, H. A. and Turoff, M. (eds.) (2002). The Delphi Method - Techniques and
applications, The delphi method - Techniques and applications. Addison-
Wesley, London. 616pp.
Lopez-Ridaura, S. L, Van Keulen, H. Van Ittersum, M. K. and Leffelaar, P. A. (2005).
Multiscale Methodological Framework to Derive Criteria and Indicators for
Sustainability Evaluation of Peasant Natural Resource Management Systems.
Environment, Development and Sustainability 7: 51 – 69.

133
Lozano, D. (2008). Envisioning Sustainability Three-Dimensionally. Journal of Cleaner
Production 16: 1838 – 1846.
Lugoe, F. (2011). Aligning and Harmonizing the Livestock and Land Policies of Tanzania.
The Economic and Social Research Foundation Discussion Paper. No. 35, Dar
es Salaam, Tanzania. 37pp.
Lupindu, A. M., Ngowi, H. A., Dalsgaard, A., Olsen, J. E. and Msoffe, M. P. L. (2012).
Current Manure Management Practices and Hygiene Aspects of Urban and Peri-
Urban Livestock Farming in Tanzania. Livestock Research for Rural
Development 24(9). Article #167. [http://www.lrrd.org/lrrd24/9/lupi24167.htm]
site visited on 9/12/2016.
Majewski, E. (2013). Measuring and Modelling Farm Level Sustainability. Visegrad
Journal on Bioeconomy and Sustainable Development 2(1): 2 – 10.
Manda, J., Alene, A. D., Gardebroek, C., Kassie, M. and Tembo, G. (2016). Adoption and
Impacts of Sustainable Agricultural Practices on Maize Yields and Incomes:
Evidence from Rural Zambia. Journal of Agricultural Economics 67(1): 130 –
153.
Mangesho, W., R. Loina, J. Bwire, B.L. Maass, and B. Lukuyu. (2013). Report of a
Livestock Feed Assessment in Lushoto District , Tanga Region , the URT.
International Center for Tropical Agriculture (CIAT), Nairobi, Kenya. 14pp.
Mani, M. V. (2015). Impact of Agriculture Credit in Tamil Nadu–From Farmers
Perspective. Nbr e-Journal 1(1): 1 – 18.

134
Marchand, F., Debruyne, L., Triste, L., Gerrard, C., Padel, S. and Lauwers, L. (2014). Key
Characteristics for Tool Choice in Indicator-Based Sustainability. Ecology and
Society 19 (3): 47.
Mdegela, R. H, R. Ryoba, E. D. Karimuribo, E. J. Phiri, T. Løken, O. Reksen, E. Mtengeti,
N.A. Urio. 2009. Prevalence of Clinical and Subclinical Mastitis and Quality of
Milk in Smallholder Dairy Farms in Tanzania. Journal of the South African
Veterinary Association 80(3): 163 – 168.
Mebratu, D. (1998). Sustainability and sustainable Development: Historical and
Conceptual Review. Environmental Impact Assessment Review 18: 493 – 520.
Meul, M., S. Van Passel, D. Fremaut and Haesaert, G. (2012). Higher Sustainability
Performance of Intensive Grazing Versus Zero-Grazing Dairy Systems.
Agronomy for Sustainable Development 32(3): 629 – 638.
Meul, M., V. P. Steven, N. Frank, D. Joost, R. Elke, M. Annelies and V. H. Annelies.
(2008). MOTIFS: A Monitoring Tool for Integrated Farm Sustainability.
Agronomy for Sustainable Development 28 (2): 321 – 332.
Mgbada, J. U. (2016). Sustainable Agricultural Practices and Its Determinants in South-
East Nigeria. Journal of Advanced Agricultural Technologies 3(3): 170 – 174.
Miller, G. D. and Auestad, N. (2013). Towards a Sustainable Dairy Sector: Leadership in
Sustainable Nutrition. International Journal of Dairy Technology 66(3): 307 –
316.

135
Mohamed, K. S. and Temu, A. E. (2008). Access to Credit and Its Effect on the Adoption
of Agricultural Technologies: The Case of Zanzibar. Savings and Development
32: 45 – 89.
Mojo, D., Fischer, C. and Degefa, T. (2015). Social and Environmental Impacts of
Agricultural Cooperatives: Evidence from Ethiopia. International Journal of
Sustainable Development & World Ecology 22(5): 1350 – 4509.
Mojo, D., Fischer, C. and Degefa, T. (2017). Determinants and Economic Impacts of
Coffee Farmer Cooperatives in Ethiopia. Journal of Rural Studies 50: 84 – 94.
Morris, J., Fraval, S., Githoro, E., Ran, Y. and Mugatha, S. (2015). Comprehensive
Livestock Environmental Assessment for Improved Nutrition, a Secured
Environment and Sustainable Development along Livestock and Aquaculture
Value Chains Project. Stockholm Environment Institute Working Paper,
Stovkholm. 30pp.
Kembe, M. A., Omondi, C. O. and Waga, G. G. (2016). The Influence of Socio-Cultural
Characteristics on Commercialization of Smallholder Dairy Value Chain
Development in Uasin Gishu County, Kenya. Journal of Geography and
Regional Planning 9(8): 164 – 175.
Mujawamariya, G., D’Haese, M. and Speelman, S. (2013). Exploring Double Side-Selling
in Cooperatives, Case Study of Four Coffee Cooperatives in Rwanda. Food
Policy 39: 72 – 83.
Mutinda, G., Ndwiga, J., Kinuthia, E., Kariuki, J., Omondi, I. and Baltenweck, I. (2015).
Producer Organization Assessment (POSA)—User’s Facilitators Manual. East

136
African Dairy Development (EADD) and International Livestock Reasearch
Institute, Nairobi, Kenya. 23pp.
Mwamfupe, D. (2015). Persistence of Farmer-Herder Conflicts in Tanzania. International
Journal of Scientific and Research Publications 5(2): 1 - 8.
Ndungu, T. W., Muliro, P. S., Omwamba, M., Oosterwijk, G. and Jansen, A. (2016).
Quality control of raw milk in the smallholder collection and bulking enterprises
in Nakuru and Nyandarua Counties, Kenya. African Journal of Food Science
10(5): 70 - 78.
Nell, A. J., Schiere, H. and Bol, S. (2014). Quick Scan Dairy Sector Tanzania.
[http://edepot.wur.nl/334382] site visited on 10/9/2017.
Ngasala, J. B., Nonga, H. E. and Mtambo, M. M. A. (2015). Assessment of Raw Milk
Quality and Stakeholders’ Awareness on Milk-Borne Health Risks in Arusha
City and Meru District, Tanzania. Tropical Animal Health and Production 47
(5): 927 – 932.
Nguyen, T. L. (2012). Sustainability Assessment of Vegetable Cultivation Systems in the
Red River Delta, Vietnam. A Dissertation for Award Degree of PhD degree,
Universität zu Berlin, Berlin, Germany. 188pp.
Njombe, A. P., Msanga. Y., Mbwambo, N. and Makembe, N. (2011). The Tanzania Dairy
Industry: Status, Opportunities and Prospects. A paper presented to the 7th
African Dairy Conference and Exhibition at MovenPick Hotel, Dar es
Salaam.18pp.
137
Nkya, R., Kessy, B. M., Lyimo, Z. C., Msangi, B. S. J., Turuka, F. and Mtenga, K. (2007).
Constraints on Smallholder Market Oriented Dairy Systems in the North Eastern
Coastal Region of Tanzania. Tropical Animal Health and Production 39 (8):
627 – 636.
Nuntapanich, P. (2011). Community Base Participation for Establishing the Indicators of
Sustainability in Dairy Cattle Production System of Small Holders: A Case
Study in Sisaket Province, Northeast Thailand. Journal of Applied Sciences
Research 7(11): 1702 - 1708.
Nyang, M. N., Webo, C. and Roothaert, R. L. (2010). The Power of Farmers
Organisations in Smallholder Agriculture in East Africa. A Review of 5 Project
Initiatives of The Maendeleo Agricultural Technology Fund. FARM-Africa
Working Paper. No. 13, London. 36pp.
OECD (2008). Handbook on Constructing Composite Indicators: Methodology and User
Guide, Methodology. Organisation for Economic Co-operation and
Development, Paris. 160pp.
Ogle, R. B. (2001). The Need For Socio-Economic and Environmental Indicators to
Monitor Degraded Ecosystem Rehabilitation: A Case Study from Tanzania.
Agriculture, Ecosystems and Environment 87 (2): 151 – 157.
Ogutu, C., Kurwijila, L. and Omore, A. (2014). Review of successes and failures of dairy
value chain development interventions in Tanzania. Nairobi, Kenya: ILRI.
40pp.

138
Okoli, C. and Pawlowski, S. D. (2004). The Delphi Method as a Research Tool: An
Example, Design Considerations and Applications. Information and
Management 42(1): 15 - 29.
Olila, D. O. (2014). Economic evaluation of factors affecting farmers participation in
development groups : A case of Trans-Nzoia County, Kenya. Journal of
Agricultural Economics, Extension and Rural Development 2(6): 74 – 81.
Paracchini, M. L., Bulgheroni, C., Borreani, G., Tabacco, E., Banterle, A., Bertoni, D.,
Rossi, G., Parolo, G., Origgi, R. and De Paola, C. (2015). A Diagnostic System
to Assess Sustainability at a Farm Level: The SOSTARE Model. Agricultural
Systems 133: 35 – 53.
Parent, D., Bélanger, V., Vanasse, A., Allard, G. and Pellerin, D. (2010). Method for the
Evaluation of Farm Sustainability in Quebec , Canada : The Social Aspect. In:
9th European IFSA Symposium, 4-7 July 2010, Vienna, Austria. 922–930. pp.
Poveda, C. A and Lipsett, M. G. (2011). A Review of Sustainability Assessment and
Sustainability/Environmental Rating Systems and Credit Weighting Tools.
Sustainable Development 4: 36 - 55.
Pretty, J. N. (1995). Participatory Learning for Sustainable Agriculture. World
Development 23(8): 1247 – 1263.
Rahman, S. and Gupta, J. (2015). Knowledge and Adoption Level of Improved Dairy
Farming Practices of SHG Members and Non-Members in Kamrup District of
Assam, India. Indian Journal of Animal Research 49 (2): 234 – 240.

139
Rahman, S. (2011). Sustainability of Dairy-Based Self Help Groups (SHGS) In Assam: an
Exploratory Study. In; Kamrup District. Thesis for Award Degree of Doctorate
Submitted to the National Dairy Research Institute, Karnal at Deemed
University. 148pp.
Rasul, G. and Thapa, G. B. (2004). Sustainability of Ecological and Conventional
Agricultural Systems in Bangladesh: An Assessment Based on Environmental,
Economic and Social Perspectives. Agricultural Systems 79: 327 – 351.
Reed, M. S., Fraser, E. D. G. and Dougill, A. J. (2006). An Adaptive Learning Process for
Developing and Applying Sustainability Indicators with Local Communities.
Ecological Economics 59: 406 – 418.
Rigby, D. and Cáceres, D. (2001). Organic Farming and the Sustainability of Agricultural
Systems. Agricultural Systems 68(1): 21 – 40.
Robinson, J. B. (2004). Squaring the Circle : Some Thoughts on the Idea of Sustainable
Development. Ecological Economics 48: 369 – 384.
Roy, R. and Chan, N. W. (2012). An assessment of Agricultural Sustainability Indicators
in Bangladesh: Review and Synthesis. Environmentalist 32: 99 – 110.
Roy, R., Chan, N. W. and Ahmed, Q. N. (2014). A Delphi Study to Determine
Sustainability Factors: The Case of Rice Farming in Bangladesh. Journal of
Sustainability Science and Management 9(1): 56 - 68.

140
Roy, R., N. Chan, W. and Rainis, R. (2013). Development of Indicators for Sustainable
Rice Farming in Bangladesh: A Case Study with Participative Multi-
Stakeholder Involvement. World Applied Sciences Journal 22 (5): 672 – 682.
Rufino, M. C., Tittonell, P., van Wijk, M. T., Castellanos-Navarrete, A., Delve, R. J., de
Ridder, N. and Giller. K. E. (2007). Manure as a Key Resource within
Smallholder Farming Systems: Analysing Farm-Scale Nutrient Cycling
Efficiencies with the Nuances framework. Livestock Science 112: 273–287.
Rural Livelihood Development Company (2010). Survey on Dairy Products Market in
Tanzania. Final Re Leonard port. NIRAS, Dar es Salaam, Tanzania. 64pp.
Sakthi, P. R., Nain, M. S., Singh, R., Kumar, S. and Chahal, V. P. (2015). Farmers’
Producer Organisation in Reducing Transactional Costs: A study of Tamil Nadu
Mango Growers Federation (TAMAFED). Indian Journal of Agricultural
Sciences 85 (10): 1303 – 1307.
Salas-Reyes, I. G., Arriaga-Jordan, C. M., Rebollar-Rebollar, S., García-Martínez, A. and
Albarrán-Portillo, B. (2015). Assessment of the Sustainability of Dual-Purpose
Farms by the IDEA Method in the Subtropical Area of Central Mexico.
Tropical Animal Health and Production 47(6): 1187 – 1194.
Salokhe, S. (2016). Farmers Producer Organization for Effective Linkage of Small
Producers with Market. International Journal of Applied Research 2(10): 142 –
146.
Santos, J. R., Anunciação, P. F. and Svirina, A. (2012). A Tool to Measure Organizational
Sustainability Strength. Journal of Business Management 7: 105 - 117.

141
Sauvenier, X., Valckx J., Van Cauwenbergh, N., Wauters, E., Bachev, H., Biala, K.,
Bielders, C., Brouckaert, V., Franchois, L., Garcia-Cidad, V., Goyens, S.,
Hermy, M., Mathijs, E., Muys, B., Reijnders, J., Vanclooster, M., Van der
Veken, S. and Peeters, A. (2005). Framework for Assessing Sustainability
Levels in Belgian Agricultural Systems – SAFE. Final Scientific Report. Belgian
Science Policy Office, Brussels, Belgium. 116 pp.
Seghezzo, L. (2009). The Five Dimensions of Sustainability. Environmental Politics
18(4): 539 – 556.
Sharghi, T., Sedighi, H. and Eftekhar, A. R. (2014). Effective Factors in Achieving
Sustainable Agriculture. American Journal of Agricultural and Biological
Sciences 5(2): 235 - 241.
Shiferaw, B. (2009). Leveraging Institutions for Collective Action to Improve Markets for
Smallholder Producers in Less-Favored Areas. Afjare 3(1): 1 - 18.
Shrestha, R. P. and Ligonja, P. J. (2015). Social Perception of Soil Conservation Benefits
in Kondoa Eroded Area of Tanzania. International Soil and Water Conservation
Research. 3(3): 183 - 195.
Sikira, A. N., Ndanu, H., Laswai, G. and Nandonde, S. W. (2013). Rapid appraisal of
dairy value chains in Morogoro and Tanga regions in Tanzania. International
Livestock Research Institute, Nairobi, Kenya. 75pp
Simon, B. P., Garba, A. and Bunu, G. M. (2013). Determinants of Sustainable Agricultural

142
Land Management Practices Among Arable Crop Farmers in Northern Part of
Taraba State, Nigeria. ARPN Journal of Science and Technology 3(7): 726 -
730.
Singh, P. K., Sankhala, G., Singh, A. and Prasad, K. (2016). Sustainability of Gangatiri
cattle rearing. Indian Journal of Animal Sciences 86 (8): 936 – 939.
Slavickiene, J. and A. Savickiene. (2014). Comparative Analysis of Farm Economic
Viability Assessment Methodologies. European Scientific Journal edition 10:
1857 – 7881.
Smith, A., Thorne, P. and Snapp, S. (2015). Measuring sustainable intensification in
smallholder agroecosystems: A review. International Livestock Research
Institute, Nairobi, Kenya. 47pp.
Smith, C. S. and, Mc Donald, G. T. (1998). Assessing the Sustainability of Agriculture at
the Planning Stage. Journal of Environmental Management 52 (1): 15 – 37.
Sonam, T. and Martwanna, N. (2011). Smallholder Dairy Farmers’ Group Development in
Bhutan: Strengthening Rural Communities through Group Mobilization. Khon
Kaen AGR. J. 8(1): 154 – 174.
Steinfeld, H., Gerber, P., Wassenaar , T., Castel,V., Rosales, M. and de Haan, C. (2006).
Livestock’s Long Shadow: Environmental Issues and Options. FAO, Rome,
390pp.

143
Strokal, M., Ma., L., Bai, Z., Luan, S., Kroeze, C., Oenema, O., Velthof, G. and Zhang, F.
(2016). Alarming Nutrient Pollution of Chinese Rivers as a Result of
Agricultural Transitions. Environmental Research Letters 11: 1 - 10.
Swai, E. S. and Schoonman, L. (2011). Microbial Quality and Associated Health Risks of
Raw Milk Marketed in the Tanga Region of Tanzania. Asian Pacific Journal of
Tropical Biomedicine 1(3): 217 – 222.
Taj, S., Bashir, A., Shahid, R. and Shah, H. (2012). Livestock Development through
Micro-Credit: A Hope for Poor Resource Women in Rural Areas of Faisalabad,
Punjab. Journal of Agriculture Research 50(1): 135 - 143.
Terry, W. (2013). Organizational Sustainability: What is It, and Why Does it Matter?
Review of Enterprise and Management Studies 1(1): 38 - 49.
Tobin, J. (1958). Estimation of Relationships for Limited Dependent Variables.
Econometrica 26(1): 24 - 36.
Tolno, E, Kobayashi, H., Ichizen, M., Esham, M. and Balde, B. S. (2015). Economic
Analysis of the Role of Farmers’ Organizations in Enhancing Smallholder
Potato Farmers’ Income in Middle Guinea. Journal of Agricultural Science
7(3): 123 - 137.
Trebbin, A. (2014). Linking Small Farmers to Modern Retail through Producer
Organizations - Experiences with Producer Companies in India. Food Policy 45:
35 – 4.

144
Tumusiime, E. and Matotay, E. (2014). Agriculture Sustainability, Inclusive Growth, and
Development Assistance: Insights from Tanzania. Journal of Sustainable
Development 7(4): 181 – 190.
Uliwa, P. and Fischer, D. (2004). Assessment of Tanzania’s Producer Organizations
Experience and environment, USAID Tanzania. Economic growth office.
USAID Tanzania Economic Growth Office (unpublished). 56pp.
Umanath, M. and Rajasekar, D. D. (2015). Evaluvation of Sustainability of Agriculture
and Its Determinants at Farm Level in Peryar-Vaigai Irrigation System of Tamil
Nadu, India’. Indian Journal of Social Research 56(1): 147 - 155.
United Nations, Department of Economic and Social Affairs, Population Division (2017).
World Population Prospects: The 2017 Revision, Key Findings and Advance
Tables. Working Paper No. ESA/P/WP/248, United Nations, Department of
Economic and Social Affairs, Population Division, New York. 46pp.
Urassa, J. K. and Raphael, E. (2002). The contribution of small scale dairy farming to
community welfare: a case study of Morogoro Municipality. [http://citeseerx.ist.
psu.edu/viewdoc/summary?] site visited on 10/9/2017.
URT (1997a). Morogoro Region - Socio-economic Profile. The planning commission and
regional commissioner's office Morogoro, Dar es Salaam, Tanzania. 233pp.
URT (1997b). Tanga Region - Socio-economic Profile. The planning commission and
regional commissioner's office Tanga, Dar es Salaam, Tanzania. 233pp.
URT (2006). National Livestock Policy. Ministry of Livestock and Fisheries Development,
Dar es Salaam, Tanzania. 45pp.

145
URT (2010). Livestock Sector Development Strategy. Ministry of Livestock and Fisheries
Development, Dar es Salaam, Tanzania. 79pp.
URT (2012). National Sample Census of Agriculture-Smallholder Agriculture-Volume III:
Livestock Sector. National report. The National Bureau of Statistics, Zanzibar,
Tanzania. 176pp.
URT (2015). Tanzania Livestock Modernisation Initiative. Ministry of Livestock and
Fisheries Development, Dar es Salaam, Tanzania. 40pp.
Urutyan, V. and Thalmann, C. (2011). Assessing Sustainability at Farm Level Using RISE
Tool: Results from Armenia. In: The EAAE 2011 Congress Change and
Uncertainty Challenges for Agriculture, Food and Natural Resources. 30
August – 2 September 2011, Zurich, Switzerland.
van Calker, K. J., Berentsen, P. B. M., de Boer, I. J. M., Giesen, G. W. J. and Huirne, R.
B. M. (2007). Modelling Worker Physical Health and Societal Sustainability at
Farm Level: An Application to Conventional and Organic Dairy Farming. Agr.
Syst. 94: 205 – 219.
Van Calker, K. J., Berentsen, P. B. M., Giesen, G. W. J. and Huirne, R. B. M. (2005).
Identifying and Ranking Attributes that Determine Sustainability in Dutch Dairy
Farming. Agriculture and Human Values 22(1): 53 – 63.
van Cauwenbergh, N., K., Biala, C., Bielders, V., Brouckaert, L., Franchois, V. G., Cidad,
M., Hermy, E., Mathijs, B., Muys, J., Reijnders, X., Sauvenier, J., Valckx, M.,
Vanclooster, V., Veken, E., Wauters and Peeters, A., (2007). SAFE- A

146
Hierarchical Framework for Assessing the Sustainability of Agricultural
Systems. Agriculture, Ecosystems & Environment 120(2 – 4): 229 – 242.
van der Meulen, H. A. B., Dolman, M. A., Jager, J. H. and Venema, G. S. (2013).
Measuring the Impact of Farm Size on Sustainability of Dutch Dairy Farm. In:
19th International Farm Management Congress’. Warsaw University of Life
Sciences: Poland. pp. 1–7.
Van der Walt, J. (2005). The resuscitation of the Cooperative sector in South Africa. Paper
presented at the International Co-operative Alliance XXI International
Cooperative Research Conference. 11-14 August 2005, Cork, Ireland. 104–109
pp.
van Der Werf, H. M. G. and Petit, J. (2002). Evaluation of the Environmental Impact of
Agriculture at the Farm Level: A Comparison of Twelve Indicator-Based
Methods. Agriculture, Ecosystems and Environment 93(1): 131 – 145.
van Passel, S., Mathijs, E. and van Huylenbroeck, G. (2006). Explaining Differences in
Farm Sustainability : Evidence from Flemish Dairy farms. International
Association of Agricultural Economists Conference, Gold Coast, Australia. 12-
18, August, 2006. 1–16 pp.
Velten, S., Leventon, J., Jager, N. and Newig, J. (2015). What Is Sustainable Agriculture?
A Systematic Review. Sustainability 7: 7833 - 7865.
Verhofstadt, E. and Maertens, M. (2015). Can Agricultural Cooperatives Reduce Poverty?
Heterogeneous Impact of Cooperative Membership on Farmers’ Welfare in
Rwanda. Applied Economic Perspectives and Policy 37(1): 86 – 106.

147
Vitunskiene, V. and Dabkiene, V. (2016). Framework for Assessing the Farm Relative
Sustainability: A Lithuanian Case Study. Agric. Econ – Czech 62 (3): 134 – 148
Waas, T., Hugé, J., Block, T., Wright, T., Benitez-Capistros, F. and Verbruggen, A.
(2014). Sustainability Assessment and Indicators: Tools in a Decision-Making
Strategy for Sustainable Development. Sustainability 6(9): 5512 – 5534.
Waney, N. F. L., Soemarno, Yuliaty, Y. and Polii, B. (2014). “Developing Indicators of
Sustainable Agriculture at Farm Level. Journal of Agriculture and Veterinary
Science 7 (2): 42 – 53.
Weil, R. (1990). Defining and Using the Concept of Sustainable Agriculture. Journal of
Agronomy Education 19(2): 126 - 130.
White, M. A. (2013). Sustainability: I know it when I See It. Ecological Economics 86:
213 – 217.
World Commission on Environment and Development (1987). Report of the World
Commission on Environment and Development: Our Common Future (The
Brundtland Report). Oxford University Press, Oxford. 318 pp.
Yadav, R., Sagar, M. P., Tripathi, H., Kumar, P., Balaraju, B. L., Sinha, S. K. and Ramesh
N. (2016). Study of Performance of Women Based Self Help Groups at
Individual Level in Rewari District of Haryana. Haryana Vet 55 (2): 206 – 9.
Yasmin, S. and Ikemoto, Y. (2015). Women’s Empowerment through Small-Scale Dairy
Farming in Selected Areas of Bangladesh. Asian Social Science 11 (26): 290 –
301.

148
Yigitcanlar, T. and Dur, F. (2010). Developing a Sustainability Assessment Model: the
Sustainable Infrastructure, Land-use, Environment and Transport Model.
Sustainability 2: 321 - 340.
Zahm, F., Viaux, P., Vilain, L., Girardin, P. and Mouchet, C. (2008). Assessing Farm
Sustainability with the IDEA Method - From the Concept of Agriculture
Sustainability to Case Studies on Farms. Sustainable Development 16(4): 271 –
281.
Zhen, L. and Routray, J. K. (2003). Operational Indicators for Measuring Agricultural
Sustainability in Developing Countries. Environnemental Management 32 (1)34
– 46.
Zvinorova, P. I., Halimani, T. E., Mano, R. T. and Ngongoni, N. T. (2013). Viability of
smallholder dairying in Wedza, Zimbabwe. Tropical Animal Health and
Production 45(4): 1007 – 1015.
Zvinorova, P. I., Ngongoni, N. T. and Mano, R. T. (2010). Financial Viability and
Acceptability of Specific Packages of Dairy Production and Marketing
Innovations in Wedza, Zimbabwe. Paper Presented at the Second RUFORUM
Biennial Meeting. 20 – 24 September, Entebbe, Uganda. 1699 - 1702pp.

149
APPENDICES
Appendix 1: Monitored Household ‘Types’
Location Milk Sales to
hub?
Access of inputs &
services from the
hub?
Membership of
PO?
Household
‘type’
Project
Villages
No No No 1
Yes No No 2
No Yes No 3
No No Yes 4
Yes Yes No 5
Yes No Yes 6
No Yes Yes 7
Yes Yes Yes 8
Non-project
villages No No Yes / No 9
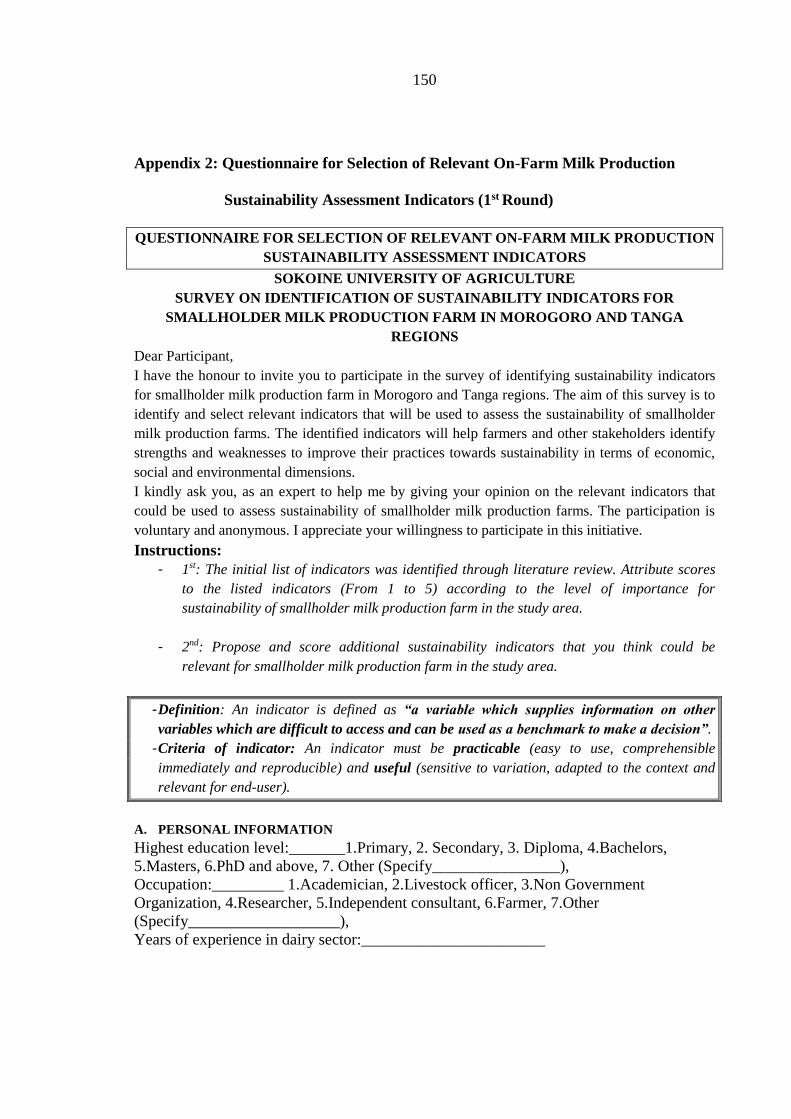
150
Appendix 2: Questionnaire for Selection of Relevant On-Farm Milk Production
Sustainability Assessment Indicators (1st Round)
QUESTIONNAIRE FOR SELECTION OF RELEVANT ON-FARM MILK PRODUCTION
SUSTAINABILITY ASSESSMENT INDICATORS
SOKOINE UNIVERSITY OF AGRICULTURE
SURVEY ON IDENTIFICATION OF SUSTAINABILITY INDICATORS FOR
SMALLHOLDER MILK PRODUCTION FARM IN MOROGORO AND TANGA
REGIONS
Dear Participant,
I have the honour to invite you to participate in the survey of identifying sustainability indicators
for smallholder milk production farm in Morogoro and Tanga regions. The aim of this survey is to
identify and select relevant indicators that will be used to assess the sustainability of smallholder
milk production farms. The identified indicators will help farmers and other stakeholders identify
strengths and weaknesses to improve their practices towards sustainability in terms of economic,
social and environmental dimensions.
I kindly ask you, as an expert to help me by giving your opinion on the relevant indicators that
could be used to assess sustainability of smallholder milk production farms. The participation is
voluntary and anonymous. I appreciate your willingness to participate in this initiative.
Instructions:
- 1st: The initial list of indicators was identified through literature review. Attribute scores
to the listed indicators (From 1 to 5) according to the level of importance for
sustainability of smallholder milk production farm in the study area.
- 2nd: Propose and score additional sustainability indicators that you think could be
relevant for smallholder milk production farm in the study area.
- Definition: An indicator is defined as “a variable which supplies information on other
variables which are difficult to access and can be used as a benchmark to make a decision”.
- Criteria of indicator: An indicator must be practicable (easy to use, comprehensible
immediately and reproducible) and useful (sensitive to variation, adapted to the context and
relevant for end-user).
A. PERSONAL INFORMATION
Highest education level:_______1.Primary, 2. Secondary, 3. Diploma, 4.Bachelors,
5.Masters, 6.PhD and above, 7. Other (Specify________________),
Occupation:_________ 1.Academician, 2.Livestock officer, 3.Non Government
Organization, 4.Researcher, 5.Independent consultant, 6.Farmer, 7.Other
(Specify___________________),
Years of experience in dairy sector:_______________________

151
B. IDENTIFICATION OF RELEVANT INDICATORS
- Please, rate the listed indicators using a 5-point Likert Scale:
➢ 5. Highly important,
➢ 4. Important,
➢ 3. Moderately important,
➢ 2. Least important and
➢ 1. Not important
- You may add to the bottom of each table other indicators that have not been mentioned in
this table that might also be relevant.
I. ECONOMIC INDICATORS
Attribute Measurable Indicator Importance
1 2 3 4 5
Profitability
1. Net farm income from milk production per household man day
2. Net income per litre of milk
3. Benefit-cost ratio
Production cost 4. Cost of milk production
5. Cost of hired labour
Efficiency
6. Capital productivity
7. Labour productivity
8. Feed productivity
9. Cow productivity
10. Water Use Efficiency (On-Farm and irrigation of fodder crop )
Independence (source of
input)
11. Source of Capital (Own capital/Total capital)
12. Source of feed (Feed from own farm/Total feed used)
13. Source of labour (Use of own labour)
Access to market
14. Access to input market (Feed, vet drug, etc…)
15. Access to milk Markets
16. Access to milk storage and logistics
17. Access to value addition
Access to capital(dairy) 18. Access to credit
Off-farm income 19. Proportion of income from off-farm activities
Animal health
20. Having a vaccination programme as recommended
21. Prophylactic treatment program in place: Deworming and Dipping
22. Prevention measures of entry of disease onto the farm (eg. Quarantine)
23. Keep written health records
Animal welfare 24. Animal living environment condition
25. Animal-Based welfare (Health, Physical appearance and behaviour)
Genetic
26. Number of improved breeds in the farm/Total animal
27. Breeding system (AI/ Natural breeding)
28. Breeding facilities
Add and rate other indicators you think are relevant 1 2 3 4 5
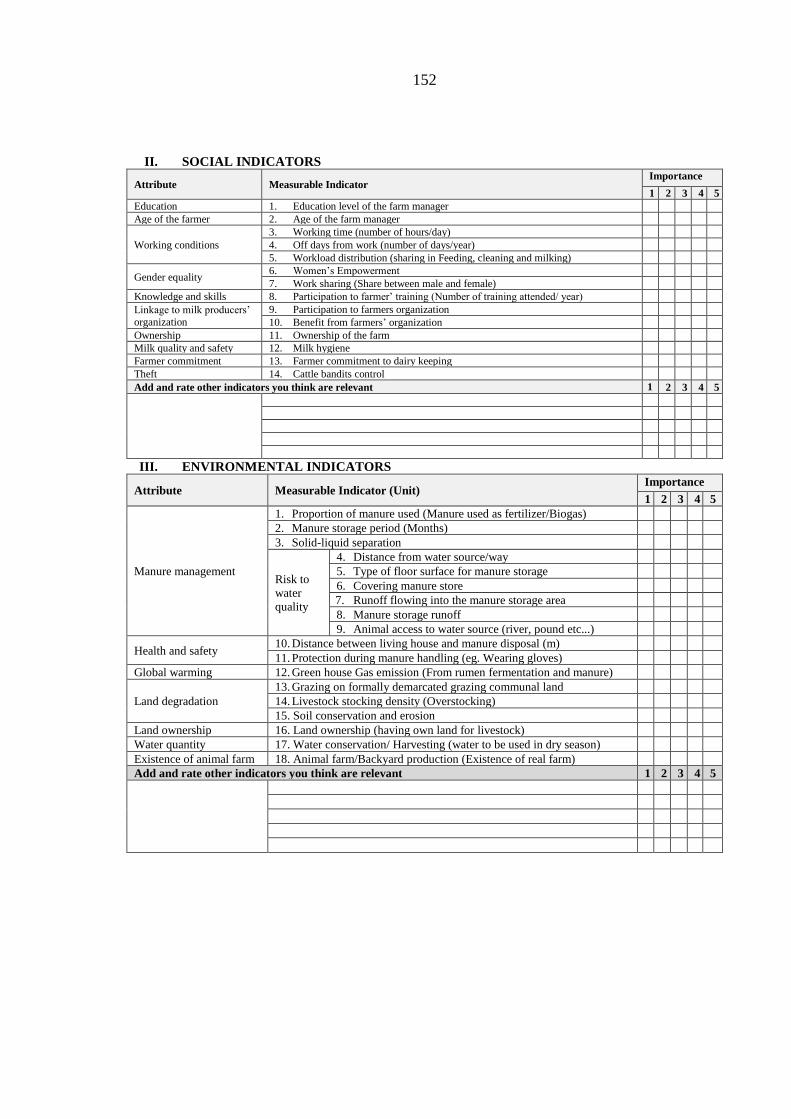
152
II. SOCIAL INDICATORS
Attribute Measurable Indicator Importance
1 2 3 4 5
Education 1. Education level of the farm manager
Age of the farmer 2. Age of the farm manager
Working conditions
3. Working time (number of hours/day)
4. Off days from work (number of days/year)
5. Workload distribution (sharing in Feeding, cleaning and milking)
Gender equality 6. Women’s Empowerment
7. Work sharing (Share between male and female)
Knowledge and skills 8. Participation to farmer’ training (Number of training attended/ year)
Linkage to milk producers’
organization
9. Participation to farmers organization
10. Benefit from farmers’ organization
Ownership 11. Ownership of the farm
Milk quality and safety 12. Milk hygiene
Farmer commitment 13. Farmer commitment to dairy keeping
Theft 14. Cattle bandits control
Add and rate other indicators you think are relevant 1 2 3 4 5
III. ENVIRONMENTAL INDICATORS
Attribute Measurable Indicator (Unit) Importance
1 2 3 4 5
Manure management
1. Proportion of manure used (Manure used as fertilizer/Biogas)
2. Manure storage period (Months)
3. Solid-liquid separation
Risk to
water
quality
4. Distance from water source/way
5. Type of floor surface for manure storage
6. Covering manure store
7. Runoff flowing into the manure storage area
8. Manure storage runoff
9. Animal access to water source (river, pound etc...)
Health and safety 10. Distance between living house and manure disposal (m)
11. Protection during manure handling (eg. Wearing gloves)
Global warming 12. Green house Gas emission (From rumen fermentation and manure)
Land degradation
13. Grazing on formally demarcated grazing communal land
14. Livestock stocking density (Overstocking)
15. Soil conservation and erosion
Land ownership 16. Land ownership (having own land for livestock)
Water quantity 17. Water conservation/ Harvesting (water to be used in dry season)
Existence of animal farm 18. Animal farm/Backyard production (Existence of real farm)
Add and rate other indicators you think are relevant 1 2 3 4 5

153
C. General comment:
.................................................................................................................................................
.................................................................................................................................................
.................................................................................................................................................
.................................................................................................................................................
.................................................................................................................................................
.................................................................................................................................................
.................................................................................................................................................
.................................................................................................................................................
.................................................................................................................................................
.................................................................................................................................................
.................................................................................................................................................
.................................................................................................................................................
.................................................................................................................................................
.................................................................................................................................................
.................................................................................................................................................
.................................................................................................................................................
.................................................................................................................................................
.................................................................................................................................................
.................................................................................................................................................
.................................................................................................................................................
.................................................................................................................................................
.................................................................................................................................................
.................................................................................................................................................
.................................................................................................................................................
....................................................

154
Appendix 3: Questionnaire for Selection of Relevant On-Farm Milk Production
Sustainability Assessment Indicators (2nd Round)
QUESTIONNAIRE FOR SELECTION OF RELEVANT ON-FARM MILK PRODUCTION
SUSTAINABILITY ASSESSMENT INDICATORS
SOKOINE UNIVERSITY OF AGRICULTURE
SURVEY ON IDENTIFICATION OF SUSTAINABILITY INDICATORS FOR
SMALLHOLDER MILK PRODUCTION FARM IN MOROGORO AND TANGA
REGIONS (2nd Round)
Dear Expert,
I have the honour to invite you to participate in the second round of the survey for identifying
sustainability indicators for smallholder milk production farm in Morogoro and Tanga regions.
The aim of this survey is to identify and select relevant indicators that will be used to assess the
sustainability of smallholder milk production farms. The identified indicators will help farmers and
other stakeholders identify strengths and weaknesses to improve their practices towards
sustainability in terms of economic, social and environmental dimensions.
Instructions:
As you will notice, this round 2 is similar to round 1. Here is how it will proceed:
1. You are asked to review and rate the exact same as you did in round 1.
2. For each indicator, you are provided with your individual round one rating. You will then
compare your round 1 rating with the rating assigned by the group. To perform this
comparison, you will use from round 1, two statistical tendency (Median: Me and mean: �̅�)
and statistical dispersion (Standard deviation: SD).
3. You are invited to either keep the same rating by indicating your previous choice in this
new round, or revise your previous rating by choosing a new response after comparing
your rating with the rating of the group.
4. You are also requested to rate the indicators proposed by experts according to their
importance, the same as you did in the first round.
Thank you again for your participation
- Definition: An indicator is defined as “a variable which supplies information on other
variables which are difficult to access and can be used as a benchmark to make a decision”.
- Criteria of indicator: An indicator must be practicable (easy to use, comprehensible
immediately and reproducible) and useful (sensitive to variation, adapted to the context and
relevant for end-user).
A. PERSONAL INFORMATION
Participant number

155
B. IDENTIFICATION OF RELEVANT INDICATORS
Use 5-point Likert Scale to re-rate each indicator after comparison between your rating and the rating of the
group from round 1:
➢ 5. Highly important.
➢ 4. Important.
➢ 3. Moderately important.
➢ 2. Least important and
➢ 1. Not important.
I. ECONOMIC INDICATORS
Sta
nd
ard
devia
tion
Gro
up
Med
ian
Gro
up
mean
You
r rati
ng i
n
rou
nd
1
Imp
orta
nce
Attribute/Issue Measurable Indicator SD Me x̅ Xi 1 2 3 4 5
Profitability
1. Net farm income from milk production per household man day 0.7 4.5 4.1 3
2. Net income per litre of milk 1.0 5.0 4.4 5
3. Benefit-cost ratio 1.1 4.0 4.1 4
Production cost 4. Cost of milk production 1.0 4.5 4.3 4
5. Cost of hired labour 1.1 4.0 3.8 2
Efficiency
6. Capital productivity 0.9 4.0 4.1 5
7. Labour productivity 0.9 4.0 3.9 4
8. Feed productivity 1.2 4.5 4.1 2
9. Cow productivity 1.0 5.0 4.4 5
10. Water Use Efficiency (On-Farm and irrigation of fodder crop ) 1.4 3.5 3.5 2
Independence (source
of input)
11. Source of Capital (Own capital/Total capital) 1.1 4.0 3.9 3
12. Source of feed (Feed from own farm/Total feed used) 1.1 4.0 4.0 3
13. Source of labour (Use of own labour) 0.9 4.0 3.7 2
Access to market
14. Access to input market (Feed, vet drug. etc…) 1.2 4.0 4.1 4
15. Access to milk Markets 0.9 5.0 4.5 5
16. Access to milk storage and logistics 1.0 4.5 4.2 5
17. Access to value addition 1.3 4.0 3.7 5
Access to capital 18. Access to credit (Dairy) 1.1 4.0 4.0 5
Off-farm income 19. Proportion of income from off-farm activities 1.0 3.0 3.6 2
Animal health
20. Having a vaccination programme as recommended 1.0 5.0 4.4
21. Prophylactic treatment program in place: Deworming and Dipping 0.8 5.0 4.3 2
22. Prevention measures of entry of disease onto the farm 1.0 4.5 4.1 3
23. Keep written health records 1.2 4.0 4.1 3
Animal welfare 24. Animal living environment condition 0.9 4.0 4.1 2
25. Animal-Based welfare (Health. Physical appearance and behaviour) 0.9 4.0 3.9 2
Genetic
26. Number of improved breeds in the farm/Total animal 0.9 4.0 4.1 3
27. Breeding system (AI/ Natural breeding) 1.1 4.0 4.1 3
28. Breeding facilities 1.1 4.0 3.6 3
Proposed indicators1
29. Access to water
30. Identification of animals (Ear tags)
31. Conservation of feed during the dry season
32. Ability to invest
33. Calf mortality
34. Farm record keeping
35. Seasonal feeding programs
36. Separation of seek animals in the farm
37. Use of drugs as recommended by Tanzania food and drug authority
38. Observation of withdrawal period
39. Availability of vet service
1 The indicators were proposed by experts during the first round. You are requested to score them according
to their importance. the same as you did in the first round.

156
II. SOCIAL INDICATORS
Sta
nd
ard
devia
tion
Gro
up
Med
ian
Gro
up
mean
You
r rati
ng i
n
rou
nd
1
Imp
orta
nce
Attribute/Issue Measurable Indicator SD Me x̅ Xi 1 2 3 4 5
Education 1. Education level of the farm manager 1.2 3.5 3.9 3
Age 2. Age of the farm manager 1.3 3.0 3.3 4
Working conditions
3. Working time (number of hours/day) 1.2 4.0 3.8
4. Off days from work (number of days/year) 1.2 4.0 3.4 1
5. Workload distribution 1.2 3.5 3.8 2
Gender equality 6. Women’s Empowerment index2 1.0 4.0 4.1
7. Work sharing (Share between male and female) 1.2 4.0 3.9 3
Knowledge and skills 8. Participation to farmer’ training 1.2 4.0 3.8
Linkage to milk producers’
organization
9. Participation to farmers organization 1.1 4.0 4.0 3
10. Benefit from farmers’ organization 1.2 4.5 3.9 3
Ownership 11. Ownership of the farm 0.9 4.0 4.1 4
Milk quality and safety 12. Milk hygiene 0.9 5.0 4.5 4
Farmer commitment 13. Farmer commitment to dairy keeping 1.0 5.0 4.4 5
Theft 14. Cattle bandits control 1.0 5.0 4.1 5
Proposed indicator3 15. Reliable and trustworthy worker - - - -
III. ENVIRONMENTAL INDICATORS
S
tan
da
rd
dev
iati
on
Gro
up
Med
ian
Gro
up
mea
n
Yo
ur
ra
tin
g
Imp
orta
nce
Attribute Measurable Indicator SD Me x̅ Xi 1 2 3 4 5
Waste management
19. Proportion of manure used (fertilizer/Biogas) 1.2 4.0 3.7 3
20. Manure storage period (Months) 1.2 3.0 3.3 3
21. Solid-liquid separation 1.3 3.0 2.8
Risk to
water
quality
1. Distance from water source/way 1.1 4.0 4.1 5
2. Type of floor surface for manure storage 1.2 4.0 3.3 2
3. Covering manure store 1.2 4.0 3.2
4. Runoff flowing into the manure store 1.2 3.0 3.3 2
5. Manure storage runoff 1.3 4.0 3.5 1
6. Animal access to water source (river. pound etc.) 1.4 4.0 4.0 5
Health and safety 7. Distance between living house and manure disposal (m) 1.2 4.0 3.7 3
8. Protection during manure handling (eg. Wearing gloves) 1.2 4.0 3.3 1
Global warming 9. Green house Gas emission 1.2 3.0 3.2
Land degradation
10. Grazing on formally demarcated grazing communal land 1.4 3.5 3.6 3
11. Livestock stocking density (Overstocking) 1.5 5.0 3.9 3
12. Soil conservation and erosion 1.3 5.0 4.0
Land ownership 13. Land ownership (having own land for livestock) 1.0 4.0 4.3 5
Water quantity 14. Water conservation/ Harvesting 1.1 5.0 4.3 5
Existence of farm 15. Animal farm/Backyard production (Existence of real farm) 1.3 4.0 3.7 5
Proposed indicator4
16. Topographic manoeuvre - - -
2 Production. resources. income leadership and time
3 and 4.The indicators were proposed by experts during the first round. You are requested to score them
according to their importance. the same as you did in the first round.

157
General comment:
.................................................................................................................................................
.................................................................................................................................................
.................................................................................................................................................
.................................................................................................................................................
.................................................................................................................................................
.................................................................................................................................................
.................................................................................................................................................
.................................................................................................................................................
.................................................................................................................................................
.................................................................................................................................................
.................................................................................................................................................
.................................................................................................................................................
.................................................................................................................................................
.................................................................................................................................................
.................................................................................................................................................
.................................................................................................................................................
.................................................................................................................................................
.................................................................................................................................................
.................................................................................................................................................
.................................................................................................................................................
.................................................................................................................................................
.................................................................................................................................................
.................................................................................................................................................
.................................................................................................................................................
....................................................

158
Appendix 4: Farm questionnaire
1. Farm level sustainability
More Milk in Tanzania (MoreMilkiT)
Project Monitoring Survey – August2016
Household Monitoring Questionnaire (Jan-July2016)
International Livestock Research Institute (ILRI)
Sokoine University of Agriculture (SUA)
A. General Identification
A.1 Household ID (to be used in subsequent surveys)
GPS Coordinates
Latitude (N/S):
Longitude (W/E):
Distance of household from nearest trading center (km)
A.2Date of interview (DD/MM/YY)
A.3Enumerator name
A.4Respondent name
A.5 Respondent sex (0= Male; 1 = Female)
A.6Relationship to household head (1 = Head; 2 = Spouse; 3 = Son;
4 = Daughter; 5 = Other (specify)
A.7Village
A.8 Farmer group name (if any)
A.9District

159
B. Household composition and demographics
A household includes all members of a common decision making unit (usually within one residence) that
share income and resources. Include workers or servants as members of the households.
B.1 Household Register
ID
code
Name
Sex
0 =
Male
1 =
Female
Age
in
Years
Relation
to head
See
code
below
Marital
status
See
code
below
Years of
schooling
Months
living
at
home
in last
12
months
Occupation
(more than
one
occupation
allowed)
Is the
household
member
knowledgeable
about the
household’s
production
activities and
resources
0=No, 1=Yes
B1 B2 B3 B4 B5 B6 B7 B8 B9 B10
Code for B5: 1 = Head; 2 = Spouse; 3 = Son; 4 = Daughter; 5 = Other (specify)
Code for B6: 1 = Single; 2 = Married; 3 = Separated; 4 = Divorced; 5 = Widowed
Code for B9: 1 = Crop farming; 2 = Livestock & poultry keeping (incl. sales); 3 = Trading in livestock and
livestock products (not own); 4 = Trading in agricultural products (excluding livestock!) (not own produce);
5 = Formal Salaried employee (e.g. civil servant, domestic work); 6 = Business – trade / services (non-
agric.); 7 = Not working / unemployed; 8 = Old/Retired; 9 = Infant (<6 years) 10 = Student/ pupil;
11 = Disabled; 12 = Other (specify)
C. Agricultural Assets: Value, Ownership and Access
a. Land
Plot ID Plot Description /
Name
Size of this plot
(acres)
Tenure system
(code)
If plot is
owned,**who
owns (code)
If rented, rent value
(TZS/year)
1
2
3
4
Plot description code Tenure system Plot owner
1. = Homestead
2. = Cash crop
3. = Food crop
4. = Fodder crop
5. = Grazing land
1. = Owned with title
2. = Owned without title
3. = Communal/public
4. = Rented in
5. = Rented out
1. = HH head
2. = Spouse
3. = Joint (HH head & spouse)
4. = Other male
5. = Other female
6= Others (specify) _______________
** Ownership means the one who decides on how the land is used
a. Livestock
6. How have the numbers of cattle changed over the last six months (increased, static, decreased)
7. Why have these changes in numbers taken place?
8. Cattle owned - enter details for each cattle separately

160
Cattle type
(codes) Breed (0 = local; 1
= exotic/cross)
Number
owned by male
Number
owned by
female
Number
owned
jointly
Total number
owned by
household
Cattle type code
1. Bulls (> 3 years)
2. Castrated adult males
(oxen> 3 years)
3. Immature males (<3 years)
4. Cows (calved at least once)
5. Heifers(female ≥1yr,have
not calved)
6. Female calves (between 8
weeks &<1yr)
7. Male calves (between 8 weeks
&<1yr)
8. Pre weaning males (<8 weeks)
9. Pre weaning males (<8 weeks)
** Ownership means the one who decides on purchase and sale of respective animal and the use of proceeds
from that animal
b. Cattle Exit: Has any cattle exited the household in the last six (6) months? (0=No, 1=Yes)
If yes, enter details for each cattle exit in last six (6) months - enter details for each cattle separately
Months Cattle
Exit
Type of Exit Cattle
type
(code)
Breed (0 =
local; 1 =
exotic/cross)
If Sold
Average
price of
cattle
Who decided on how
the money was used?
Months Type of Exit
Cattle type codes
Who receives and
decides how money
is used
1. Jan 2016
2. Feb 2016
3. Mar 2016
4. Apr 2016
5. May 2016
6.Jun 2016
1.Sale
2.Death
3.Given as a gift
4.Stolen
5.Slauthered for
home
consumption
6.Culling
7.TemporaryTran
sfered
1. Bulls (> 3 years)
2. Castrated adult males (oxen> 3 years)
3. Immature males (<3 years)
4. Cows (calved at least once)
5. Heifers(female ≥1yr,have not calved)
6. Female calves (between 8 weeks &<1yr)
7. Male calves (between 8 weeks &<1yr)
8. Pre weaning males (<8 weeks)
9. Pre weaning males (<8 weeks)
1. HH male
2. HH female
3. Joint HH (male
& female)
4. Non-household
member
5. Other
(specify)_____
____________
________
i. Cattle Entry: Have you added any cattle to your herd in the last six (6) months? (0=No,
1=Yes)
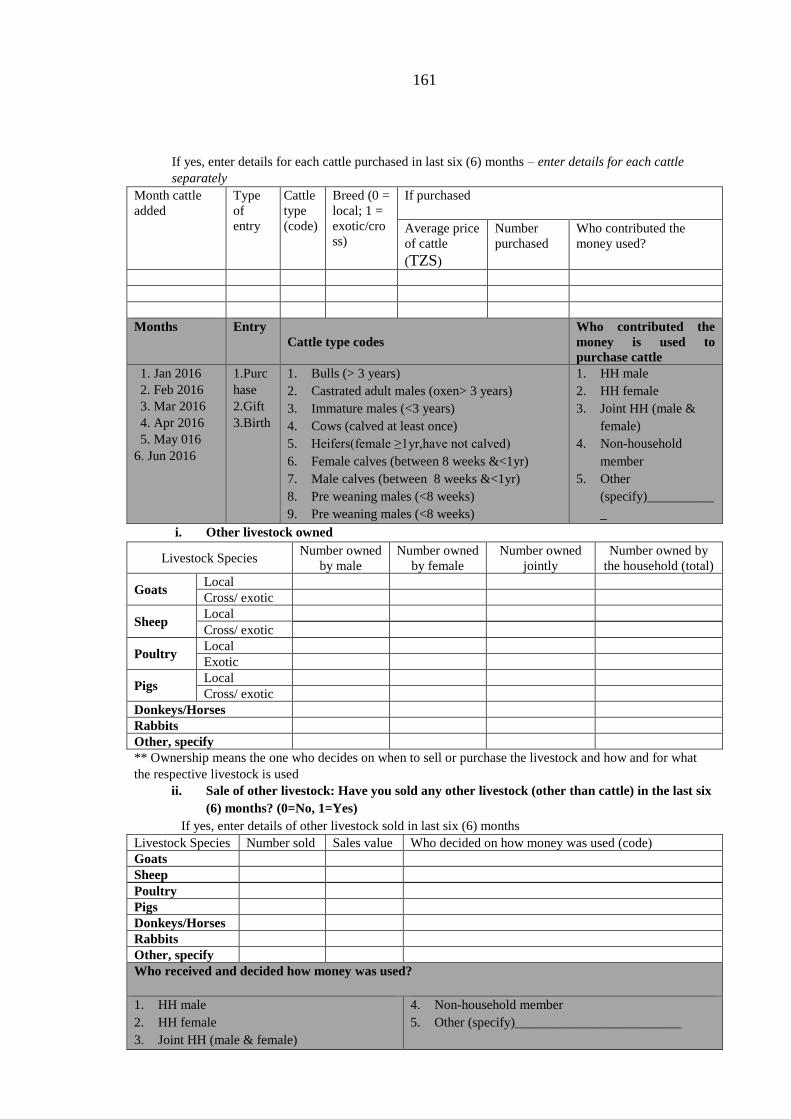
161
If yes, enter details for each cattle purchased in last six (6) months – enter details for each cattle
separately
Month cattle
added
Type
of
entry
Cattle
type
(code)
Breed (0 =
local; 1 =
exotic/cro
ss)
If purchased
Average price
of cattle
(TZS)
Number
purchased
Who contributed the
money used?
Months Entry
Cattle type codes
Who contributed the
money is used to
purchase cattle
1. Jan 2016
2. Feb 2016
3. Mar 2016
4. Apr 2016
5. May 016
6. Jun 2016
1.Purc
hase
2.Gift
3.Birth
1. Bulls (> 3 years)
2. Castrated adult males (oxen> 3 years)
3. Immature males (<3 years)
4. Cows (calved at least once)
5. Heifers(female ≥1yr,have not calved)
6. Female calves (between 8 weeks &<1yr)
7. Male calves (between 8 weeks &<1yr)
8. Pre weaning males (<8 weeks)
9. Pre weaning males (<8 weeks)
1. HH male
2. HH female
3. Joint HH (male &
female)
4. Non-household
member
5. Other
(specify)__________
_
i. Other livestock owned
Livestock Species Number owned
by male
Number owned
by female
Number owned
jointly
Number owned by
the household (total)
Goats Local
Cross/ exotic
Sheep Local
Cross/ exotic
Poultry Local
Exotic
Pigs Local
Cross/ exotic
Donkeys/Horses
Rabbits
Other, specify
** Ownership means the one who decides on when to sell or purchase the livestock and how and for what
the respective livestock is used
ii. Sale of other livestock: Have you sold any other livestock (other than cattle) in the last six
(6) months? (0=No, 1=Yes)
If yes, enter details of other livestock sold in last six (6) months
Livestock Species Number sold Sales value Who decided on how money was used (code)
Goats
Sheep
Poultry
Pigs
Donkeys/Horses
Rabbits
Other, specify
Who received and decided how money was used?
1. HH male
2. HH female
3. Joint HH (male & female)
4. Non-household member
5. Other (specify)_________________________

162
iii. Purchase of other livestock: Have you purchased any other livestock (other than cattle)
in the last six (6) months? (0=No, 1=Yes)
iv. (Enter details of other livestock purchased in last six (6) months - enter details for each cattle
separately)
Livestock Species Number purchased Sales value
(TZS)
Who contributed the money used
(code)
Goats
Sheep
Poultry
Pigs
Donkeys/Horses
Rabbits
Other, specify
Who contributed the money used to purchase livestock?
1. HH male
2. HH female
3. Joint HH (male & female)
4. Non-household member
5. Other
(specify)_____________________
____
D. Milk Production: Supply, Input use and Technology Adoption
d. Milk production
a. Have you been milking any cows in the last six months? [__] 1=Yes; 0 = No
b. If yes, please enter details for average milk production for10cows milked during the last six (6)
months.
cow 1 cow 2 cow 3
Average milk production per day (AMD)
Milk production at calving (morning and evening milk)
Milk production at peak (if known) (morning and evening milk)
Milk production yesterday (morning and evening milk)
Milk production at late lactation (morning and evening milk)
Lactation length (number of months cow is milked between 2 calvings)
When did the cow calve down (give birth)? (MM/YY)
Breeding method used for the last calving [1=Own bull 2=Other bull 3= AI]
Number of services (repeats) before conception for this service
Months when milk was produced in the last six (6) months (please tick)
Jul 2014 Aug 2014 Sep 2014 Oct 2014 Nov 2014 Dec 2014
c. Milk production
Month milk
produced
Number of
cows milked
Average volume
produced per day
Average selling price
Months
1. Jan 2016
2. Feb 2016
3. Mar 2016
4. Apr 2016
5. May 016
6. Jun 2016
d. Use of milk for yesterday’s/last milk production
Months milk utilized Category of yesterday milk production Quantity (liters)
Liters used/consumed by household
Liters of fresh milk sold (morning and evening milk)
Liters lost due to spoilage/spillage on farm
Months
1. Jan 2016
2. Feb 2016
3. Mar 2016
4. Apr 2016
5. May 016
6. Jun 2016

163
e. Sale of fresh milk for yesterday’s/last sale milk production(if litres sold~=0)
Morning milk Evening milk
Buyer
1
Buy
er 2
Buyer 3 Buyer 1 Buyer 2 Buyer
3
Type of buyer (code)
Name of buyer
Gender of buyer 1 = |Female; 0 = Male
Quantity sold to buyer (liters)
Price received (TZS/liter)
Who decides on how money from buyer is
used?
Inputs/goods/services received from buyer
Distance to buying point
Who transports
Transport cost if any
Payment method
Months when milk was sold in the last six (6) months (please tick)
Jan 2016 Feb 2016 Mar 2016 April 2016 May 2016 June 2016
Buyer Who receives and
decides how money
is used?
Inputs or goods on
credit
Who transports Payment
1. = Individual
consumers
2. = Private milk-
traders
3. = Dairy co-op/
group with
chilling plants
4. = Dairy co-op/
group without
chilling plants
5. = Privatively
owned chilling
plants
6. = Other
(specify)_____
__
1. HH male
2. HH female
3. Joint HH (male
& female)
4. Non-household
member
5. Other
(specify)_____
___
1. = None
2. = Buyer
provided access
to feed on
credit
3. = Buyer
provided access
to animal
health services
on credit
4. = Buyer
provided access
to breeding
services on
credit
5. = Buyer
provided access
to household
goods on credit
6. = Other
(specify) _____
1. = Farmer
2. = Hired
transport,
organised by
farmer
3. = Hired
transport,
organised by
Coop/
FG/trader
4. = other,
(specify)____
_____
1. = cash, no
delay in
payment
2. = at end of
month, no
delay
3. = at end of
month, has
experienced
delay
4. =Bank/Mobil
e banking
5. =SACCO
6. =Other
(specify)___
___
f. Sale of fermented milk yesterday/last sale if aside by household for fermentation is ~=0
Morning milk Evening milk
Buye
r 1
Buyer 2 Buyer
3
Buye
r 1
Buyer 2 Buyer 3
Buyer (code)
Buyer name
Quantity sold to buyer (liters)
Price received (TZS/liter)
Who receives and decides how money is
used
Inputs/goods/services received from buyer
Distance to buying point
Who transports
Transport cost if any

164
Payment method
Months when milk was sold in the last six (6) months (please tick)
Jan 2016 Feb 2016 Mar 2016 April 2016 May 2016 June 2016
Buyer Who receives and
decides how money
is used?
Inputs or goods
on credit
Who transports Payment
1. = Individual
consumers
2. = Private milk-
traders
3. = Dairy co-op/
group with
chilling plants
4. = Dairy co-op/
group without
chilling plants
5. = Privatively
owned chilling
plants
6. = Other
(specify)_____
__
1. = HH male
2. = HH female
3. = Joint HH
(male & female)
4. = non-household
member
5. = Other
(specify)_______
__
1. = None
2. = Buyer
provided
access to
feed on
credit
3. = Buyer
provided
access to
animal
health
services on
credit
4. = Buyer
provided
access to
breeding
services on
credit
5. = Buyer
provided
access to
household
goods on
credit
6. = Other
(specify)
_____
1. = Farmer
2. = Hired
transport,
organised by
farmer
3. = Hired
transport,
organised by
Coop/
FG/trader
4. = other,
(specify)____
_____
1. = cash, no
delay in
payment
2. = at end of
month, no
delay
3. = at end of
month, has
experienced
delay
4. =Bank/Mobil
e banking
5. =SACCO
6. =Other
(specify)____
__
E. Input Use, Costs and Technology Adoption
e. Feeding system
Type of cattle Rainy season (code) Dry season (code)
Local (if breed in C2=Local)
Cross and/or grade (if breed in C2=Cross)
Feeding system code
1. = Only grazing (free-range or tethered)
2. = Mainly grazing with some stall feeding
3. = Mainly stall feeding with some grazing
4. = Only stall feeding (zero grazing)
5. = On transhumance, some animals
6. = On transhumance, all animals
f. Water for cattle
Watering
point
For off farm watering
distance to watering
point
For on-farm
watering; source of
water
Do you have
enough water for
your animals
throughout the year
[1=yes; 0=No]
If surface water, do
you let animals
access to water
source (river)
directly[1=yes;
0=No]
Watering
point
Distance to watering
point
Source of water

165
1. Off-
farm
2. On-
farm
3. Both
1. <1 kms
2. 1-2 kms
3. 3-4 kms
4. 5-7 kms
5. 8+ kms
1. = No irrigation
2. = Ground water
3. = Surface water, i.e. dam, river or lake
4. = Piped water
5. = other _____
g. Grown fodder
1. Besides grazing/harvested grass from forest/roadside/farm, do you currently grow
any improved fodder? [__] 1= Yes; No =0
2. If yes, please provide the following details for each fodder type grown.
Months
fed
Grown fodder type fed
Quantity fed per day in last (6)
months
Any treatment before
feeding? (code)
Cattle fed (code) Unit Quantity
Months Fodder type/pasture Cattle fed
1. Jan 2016
2. Feb 2016
3. Mar 2016
4. Apr 2016
5. May 016
6. Jun 2016
1. = Napier grass
2. = Planted grasses e.g. Rhodes grass
3. = Fodder maize
4. = Fodder shrubs (Calliandra, Sesbania,
Lucaenia)
5. = Other fodder legumes (Desmodium,
lucern, vetch)
= Other (specify) [__]
1. = All
2. = Cows only
3. = Lactating cows only
4. = Calves only
5. = Other (specify)
___________
Measurement unit Treatment
1. Kg
2. Tones
3. Bales
4. Handcart/wheelbarrow
5. Standar sack
6. Other (specify) _________________
1. = No treatment
2. = Stored standing
3. = Cut and stored loose
4. = Chopped using panga
5. = Hand chopped using chaff
cutter
6. = Motorized chopping using a
pulverizer
7. = Ensiled in situ without
additives
8. = Chopped and ensiled with
additives (urea, molasses etc.)
9. = Chemical treatment
10. = Other (specify)
_____________________
3. If no, what are the possible reasons for not growing fodder? [__]; [__]; [__]
Reasons for not growing improved fodder
1. = Lack of land
2. = Lack of knowledge on how to grow fodder
3. = I have enough forage for my cattle
4. = Lack of labour to undertake fodder
production
5. = No reason
6. = Other (specify) ___________________
h. Purchased fodder
1. Have you been purchasing fodder to feed cattle in the last six months (since
September last year to now)? [__] Yes = 1; No = 0
2. If yes, in which of the last six (6) months did you purchase fodder? Tick
accordingly
3. For each month selected above please enter the following details.
Month when
purchased
Fodder
type
Cattle type
fed?
Monthly cost during months when
purchased
Where purchased?

166
Unit Qnty Price/unit (code)
Fodder type Cattle fed
1. Jan 2016
2. Feb 2016
3. Mar
2016
4. Apr
2016
5. May 016
6. Jun 2016
1. = Napier grass
2. = Planted grasses e.g. Rhodes grass
3. = Fodder maize
4. = Fodder shrubs (Calliandra, Sesbania,
Lucaenia)
5. = Other fodder legumes (Desmodium, lucern,
vetch)
6. = Other (specify)__________________
1. = All
2. = Cows only
3. = Lactating cows only
4. = Calves only
5. = Other (specify) ___________
Measurement unit Where purchased?
1. Kg
2. Tones
3. Bales
4. Handcart/wheelbarrow
5. Standard sack
6. Other (specify) _________________
1. = Other farmers
2. = Market, trader
3. = Supplier affiliated to farmer
group
4. = Other (specify) __________
i. Crop residues
1. Do you use crop residues? [__] Yes = 1; No = 0
2. If yes, in which of the last six (6) months did you use crop residues?
3. For every month selected above please enter the following details.
Crop
residue
Cattle
type fed?
Source: 1=Own
farm; 2=Other
farm;
3=Purchased
If purchased
Month(s) used Monthly cost during
months when purchased
Where
purchased?
(code)
Unit Qnty Price/unit
Months Crop residues Animal fed
1. Jan 2016
2. Feb 2016
3. Mar2016
4. Apr 2016
5. May 016
6. Jun 2016
1. = Green/dry maize stovers and
thinning
2. = Cereal(wheat, barley, rice etc.)
straws and millet, sorghum stalks
3. = Legumes (beans, cowpeas, soya
etc.)
4. = Root and tubers peelings (potato,
cassava, bananas etc)
5. = Crop by products (sweet potato
vines, cassava leave etc.)
6. = Other (specify) ________________
0. = All
1. = Cows only
2. = Lactating cows only
3. = Calves only
4. = Other (specify) ___________
Measurement unit Where purchased?
1. Kg
2. Tones
3. Bales
4. Handcart/wheelbarrow
5. Standard sack
6. Other (specify) _________________
1. = Other farmers
2. = Market, trader
3. = Supplier affiliated to
farmer group
4. = Other (specify)
__________
j. Concentrates
1. Do you use concentrates? [__] Yes = 1; No = 0
2. If yes, in which of the last six (6) months did you use concentrates?
3. For every month selected above please enter the following details.
Month(s)
used
Concentrate Cattle type
fed?
Source: 1=Own
farm; 2=Other
farm;
If purchased
Monthly cost during months
when purchased
Where
purchased?

167
3=Purchased (code)
Unit Qnty Price/unit
months Concentrate type Cattle fed
1. Jan
2016
2. Feb
2016
3. Mar
2016
4. Apr
2016
5. May
016
6. Jun
2016
1. = Commercial dairy meal
2. = Mineral blocks
3. = Bran (Maize, wheat)
4. = Maize germ
5. = Oilseed by-product (Sesame seed, cotton seed, copra,
sunflower etc.)
6. =Agro industrial byproducts (vegetable waste, brewer’s waste
etc.)
7. = Other (specify) ____________________
1. = All
2. = Cows only
3. = Lactating cows
only
4. = Calves only
5. = Other (specify)
___________
Measurement unit Where purchased?
1. Kg
2. Tones
3. Bales
4. Handcart/wheelbarrow
5. Standard sack
6. Other (specify) _________________
1. = Agro vet
shop
2. = Other
farmers
3. = Market,
trader
4. = Posho mills
(Mashineyakus
aga
g. Have you experienced a shortage of feeds in the last six months [1=yes 0=No]
h. Do you practice feed conservation for the dry season [1=yes 0=No]
i. Is it enough to cover for the six months [1=yes 0=No]
7. Breeding services and expenses
Months Own bull
service
Other bull
service
AI service
How many times have you used this
service
What is the average cost per service?
Which are your preferred breeding
methods? (Tick as accordingly)
Reasons for preference [___] [___] [___] [___] [___] [___]
If you wanted to breed/serve your cow can
you find and use this method? (0= NO;
1=YES)
If yes, How many times have you used this
service in the last six (6) months?
Reasons for use /non-use of method *** [___] [___] [___] [___] [___] [___]
How many different service providers can
you access for this type of service
Who are the providers that you can access
What is the distance from your farm to the
service providers/bull owner?
Provider 1.
[__]
Provider 2.
[__]
Provider 3.
[__]
Provider 1.
[__]
Provider 2.
[__]
Provider 3.
[__]
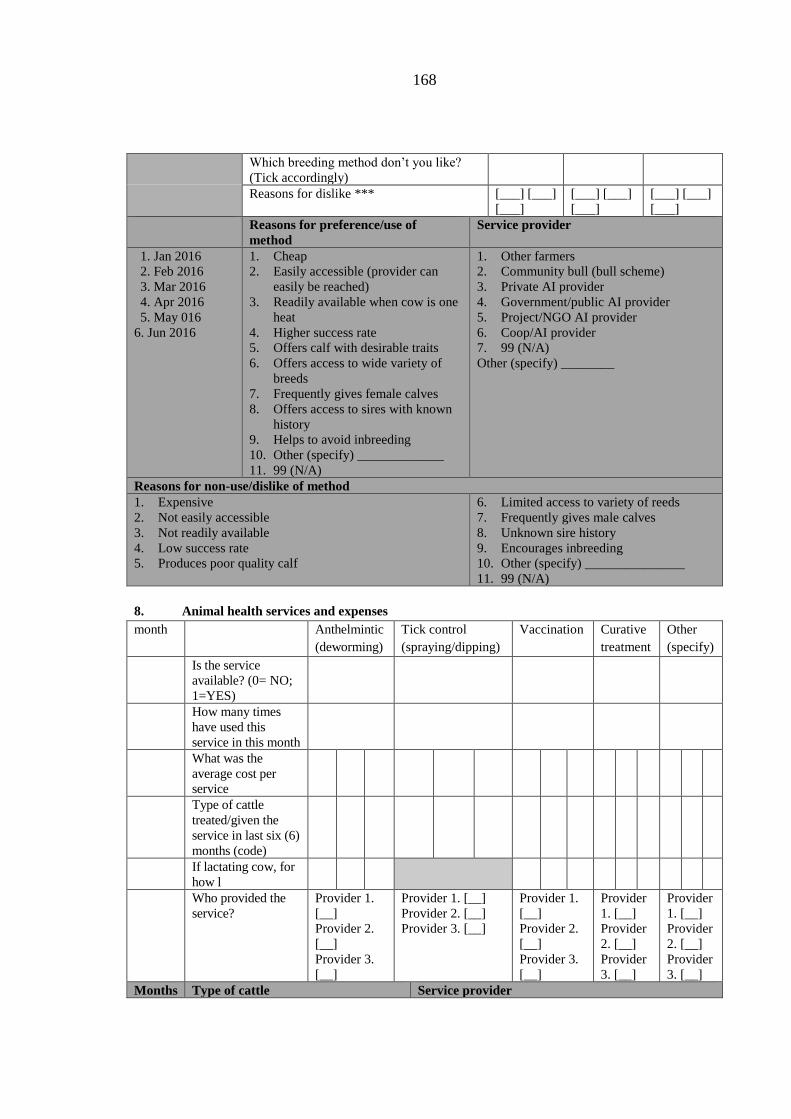
168
Which breeding method don’t you like?
(Tick accordingly)
Reasons for dislike *** [___] [___]
[___]
[___] [___]
[___]
[___] [___]
[___]
Reasons for preference/use of
method
Service provider
1. Jan 2016
2. Feb 2016
3. Mar 2016
4. Apr 2016
5. May 016
6. Jun 2016
1. Cheap
2. Easily accessible (provider can
easily be reached)
3. Readily available when cow is one
heat
4. Higher success rate
5. Offers calf with desirable traits
6. Offers access to wide variety of
breeds
7. Frequently gives female calves
8. Offers access to sires with known
history
9. Helps to avoid inbreeding
10. Other (specify) _____________
11. 99 (N/A)
1. Other farmers
2. Community bull (bull scheme)
3. Private AI provider
4. Government/public AI provider
5. Project/NGO AI provider
6. Coop/AI provider
7. 99 (N/A)
Other (specify) ________
Reasons for non-use/dislike of method
1. Expensive
2. Not easily accessible
3. Not readily available
4. Low success rate
5. Produces poor quality calf
6. Limited access to variety of reeds
7. Frequently gives male calves
8. Unknown sire history
9. Encourages inbreeding
10. Other (specify) _______________
11. 99 (N/A)
8. Animal health services and expenses
month Anthelmintic
(deworming)
Tick control
(spraying/dipping)
Vaccination Curative
treatment
Other
(specify)
Is the service
available? (0= NO;
1=YES)
How many times
have used this
service in this month
What was the
average cost per
service
Type of cattle
treated/given the
service in last six (6)
months (code)
If lactating cow, for
how l
Who provided the
service?
Provider 1.
[__]
Provider 2.
[__]
Provider 3.
[__]
Provider 1. [__]
Provider 2. [__]
Provider 3. [__]
Provider 1.
[__]
Provider 2.
[__]
Provider 3.
[__]
Provider
1. [__]
Provider
2. [__]
Provider
3. [__]
Provider
1. [__]
Provider
2. [__]
Provider
3. [__] Months Type of cattle Service provider

169
1. Jan
2016
2. Feb
2016
3. Mar
2016
4. Apr
2016
5.
May
016
6. Jun
2016
1. = All
2. = Cows only
3. = Lactating cows only
4. = Calves only
5. = Other (specify)___________
1. = Self/ Neighbour with professional advice
2. = Self/ Neighbour without professional advice
3. = Animal health service provider/para-vet
4. = Government veterinarian5= Project/ NGO staff
5. = Coop/ group staff
6. = Agro-vet shop
7. = Community dip
8. = Other (specify) __________________
F. Labour use and expenses
4. Monthly labour: Have you employed any monthly labourer(s)in the last six (6) months (between
January and now)? (0=No 1=Yes), if yes, enter the following details
Months Name of labourer Gender of
labourer
0 = Male
1 = Female
Average
working
hours per
day on
dairy
Monthly wage
1
2
3
Months
1. Jan 2016
2. Feb 2016
3. Mar 2016
4. Apr 2016
5. May 016
6. Jun 2016
5. Casual labour: Have you employed any casual labourer(s)in the last six (6) months (between
January and now)? (0=No 1=Yes), if yes, enter the following details:-
Months Name of
labourer
Gender of labourer
0 = Male
1 = Female
Average working
hours per day on
dairy
Total Amount
paid
1
2
3
Months
1. Jan 2016
2. Feb 2016
3. Mar 2016
4. Apr 2016
5. May 016
6. Jun 2016
6. Household labour: Employed household labour in the last six (6) months (since September to
now)? (0=No 1=Yes), if yes, enter the following details:
Type of Activity
Household Freq.
(code) Adult Males Adult Females Children (< 15 yrs)
No.
people Hrs/person/day
No.
people Hrs/person/day
No.
people
Gender
M/F Hrs/person/day
1. Grazing
2. Feeding (+
collecting &
preparation)
3. Fodder/feed
production on farm
4. Providing water to
the animals
5. Cleaning of animal
shed/shelter
6. Collection of Farm
Yard Manure
(FYM)
7. Milking and milk
processing
8. Selling milk
9. Selling animals/
animal products
(except milk)
10. Crop production

170
11. Other: [
]
Frequency of activity code
1. [___] per day 2. [___] per week 3. [________] per
month 4. [_____] per year
G. Participation in Farmer Group and Dairy Market Hub
a. Do any household member belong to a Farmer Group?: (0=No 1=Yes), if YES, Enter details
below:-
Who is a
member
of a group
Group name Type of
group
When did the HH join
the group? (mm/yyyy)
Two (2) main function that this
group performs for you
HH male
HH
female
Type of groups (main function) Main functions of group to HH member
1. Social/ welfare & community development
groups
2. Savings and credit groups/Sacco
3. Agricultural producer groups
4. Livestock producer groups
5. Agricultural marketing groups
6. Livestock marketing groups
7. Other (specify) ______________________
1. Provides access to milk market
2. Provides access to inputs and services for dairy
3. Provides training/ advisory for dairy
4. Provides access to market for crops
5. Provides access to inputs and services for crops
6. Provides training/ advisory for crops
7. Provides ways to save money and get credit
8. Social functions and networking
9. Other (specify) ________________
(include all household members who belong to a group. Membership in more than one group is possible)
b. For farmer group affiliated to the dairy management hub
a. Dairy management hub
Does household member hold position of responsibility in the group? 1=Yes; 0=No
Gender of household member who holds position of responsibility in group 1=M; 0=F
How did you learn about the group?
How many times has the HH participated in group meetings in the last six months
Learn about the group
1. Other group member
2. Household member
3. Heifer/Faida Mali
4. District livestock officer
5. Local government representative
6. Other (specify) __________________
Dairy Training
a. Have you ever attended any training about dairying during the last six months (1=yes; 2=No)
If yes how many times in the last six months [______]
b. Participation in Dairy Market Hub
i. For each of the following services received, indicate the service provider, mode of engagement and
the payment mode used. (More than one service provider allowed for every service type; hence
more than one type of engagement and payment mode also allowed).
Service Service provider
(code)
Mode of engagement (code) Payment mode (code)
1. Feed supply
2. Other input supply
3. Animal healthcare
4. Breeding service
5. Extension advice
6. Milk purchase

171
7. Milk transport
8. Credit provision
9. Savings services
10. Other (specify)
________
Service provider Mode of engagement Payment mode
1. Agro-vet/input supplier
2. Vet/AHA
3. Milk trader
4. Milk transporter
5. Chilling plant
6. Extension officer
7. SACCO
8. Microfinance
9. Bank
10. Community/NGO staff
11. Other (specify) ______________
1. Individually
2. Through group linked to
BDS__________(Specify
farmer group)
1. Cash
2. Credit
3. Check-off
ii. For each serviceand service provider selected above, please provide the frequency and value of
transaction for the last six (6) months.
Jul Aug Sep Oct Nov Dec
Freq TZS Freq TZS Freq TZS Freq TZS Freq TZS Freq TZS
Feed supply
Other input
supply
Animal
healthcare
Breeding services
Extension advice
Milk purchase
Milk transport
Credit provision
Savings
Others (specify)
_________
H. Credit: Access and Utilization
a. Has any household member been in need of credit in the last 6 months? 0 = No; 1 = Yes [__]
b. Has any member of your household received credit in the last 6 months? 0 = No; 1 = Yes [__]
c. If yes, enter details for all loans/credit obtained by any household member in last six (6) months
Who
received
credit?
(code)
Source
of
credit
Reason
for
credit
Amount
received
(TZS)
Repayment
period (months).
If period is not
specified, use 99
Interest
charged
on loan
Did the loan
require collateral?
0 = No; 1 = Yes
Type of
collateral
Who received
credit?
Source of credit Reason for credit Type of
collateral
1. HH male
2. HH female
3. Joint HH (male
& female)
4. Non-household
member
1. Local micro-credit
bank
2. Relative
3. Friend
4. Input supplier
5. Milk
1. HH expenditure (food,
education, health etc.)
2. Investment in crop
production
3. Investment in livestock
production
1. Livestock
2. Land
3. HH item
4. Crop
harvest
5. Milk sales

172
5. Other
(specify)_____
__
trader/transporter
6. Milk processor
7. Other (specify)
______
4. Purchase of fixed assets
(e.g., land)
5. Repay another loan
6. Other (specify) ________
6. Other
(specify)
_________
I. Household Income
i. Crop income
1. Crop revenue: For all crops harvested in the last six (6) months, please enter the following
details.
Crops Total
Output
Units
(code)
Quantity consumed
by household
Quantity
sold
Average price/unit
(TZS)
A. Potatoes
B. Maize C. Beans
D. Tomatoes E. Onions
F. Vegetables
G. Yams H. Tea
I. Coffee J. Bananas
K. Other (specify)
_______
Measurement units
1. Kgs
2. Standard sack
3. Bunches
4. Pieces
5. Other (specify) _________________
Cost of producing crops: For all crops planted in the last six (6) months, please enter the following details.
Crop Land
rent
Cost of inputs for all plots (TZS)
Seeds Fertilizer Manure Pesticide Machinery for
land preparation
Other (specify)
____________
Potatoes
Maize Beans
Tomatoes
Onions Vegetables
Yams Tea
Coffee Bananas
Other
(specify)
ii. Income from cattle products (products other than milk) and services
1. Sale of cattle products other than dairy products: Do you sell cattle products other than milk and
other dairy prducts? (0=No 1=Yes), if YES, enter details below:-
Number sold in
last six (6)
months
Unit
(code a)
Average price
per unit*
Who received and decided how
money was used? (code)
Manure
Hides and Skins
Others (specify)
__________
Units Who receives and decides how money is used

173
1. Piece
2. Kgs
3. Other (specify) ______________
1. HH male
2. HH female
3. Joint HH (male & female)
4. Non-household member
5. Other (specify)____________________
2. Sale of cattle services: Do you sell cattle services? (0=No 1=Yes), if YES, enter details below:-
Services No of services in
last six (6) months
Revenue
received
Who received and decided how money
was used? (code)
Bull services
Draft power
Other (specify)
__________
Who receives and decides how money is used
1. HH male
2. HH female
3. Joint HH (male & female)
4. Non-household member
5. Other (specify)____________________
3. Other income sources: Any other income source(s) in the last 6 months? (0=No 1=Yes), if
YES, enter details below:-
Income Source Did anyone in the
household earn income
from source in last six (6)
months?
(0 = no, 1 = yes)
Who mainly
earns income
from this
source? (code)
Total HH income
in last six (6)
months
H. Trading in livestock and livestock
products (not own produce)
I. Trading in milk, feeds and other
livestock products (not own produced)
J. Trading in agricultural products
(excluding livestock!) (not own
produce)
K. Formal salaried employment (non-
farming, e.g. civil servant, private
sector employee, domestic work in
other home)
L. Business – Trade or services (non-
agricultural)
M. Working on other farms (including
herding)
N. Sale of products of natural resources
(forest and sea/rivers products)
O. Pensions
P. Rent out land / sharecropping (cash
value of share crop or rent)
Q. Remittances
R. Other (specify)
______________________
Who earns/controls money from this source
1. HH male
2. HH female
3. Joint HH (male & female)
4. Non-household member
5. Other (specify)____________________

174
Appendix 5: Determination of indicator weights using principal components analysis
I. Economic sustainability
1. Rotated factor loadings
Factor analysis/correlation Number of obs = 218
Method: principal factors Retained factors = 3
Rotation: orthogonal varimax (Kaiser off) Number of params = 18
Rotated factor loadings (pattern matrix) and unique variances
-----------------------------------------------------------
Variable | Factor1 Factor2 Factor3 | Uniqueness
-------------+------------------------------+--------------
Ec1 | 0.2740 0.4679 0.1287 | 0.6894
Ec2 | 0.7313 0.1770 0.0383 | 0.4324
Ec3 | 0.0119 0.0354 0.4433 | 0.8021
Ec4 | 0.5280 0.0477 -0.1364 | 0.7004
Ec6 | -0.1566 -0.4425 0.1408 | 0.7598
Ec7 | 0.4818 0.1637 -0.2288 | 0.6887
Ec8 | 0.5143 -0.0070 0.0238 | 0.7349
-----------------------------------------------------------
2. Eigenvalues
3. Calculation of indicator weights
Indicator Squared factor loading
Squared factor
loading/explained variability Normalize
d weight Factor1 Factor2 Factor3 Factor1 Factor2 Factor3
Income from milk production 0.08 0.22 0.02 0.05 0.46 0.05 0.13
Cow productivity 0.53 0.03 0.00 0.36 0.07 0.00 0.31 Labour productivity 0.00 0.00 0.20 0.00 0.00 0.64 0.11
Percentage of grown fodder 0.28 0.00 0.02 0.19 0.00 0.06 0.16 Animal health 0.08 0.20 0.02 0.05 0.41 0.06 0.11
Use of artificial insemination technology 0.23 0.03 0.05 0.16 0.06 0.17 0.03
Feed conservation program 0.26 0.00 0.00 0.18 0.00 0.00 0.15 Expl.Var 1.47 0.48 0.31 - - - -
Expl./Tot 0.65 0.21 0.14 - - - -
-.5
0.5
11.5
Eig
en
valu
es
0 2 4 6 8Number
Scree plot of eigenvalues after factor

175
II. Social sustainability
1. Rotated factor loadings
Factor analysis/correlation Number of obs = 341
Method: principal factors Retained factors = 2
Rotation: orthogonal varimax (Kaiser off) Number of params = 6
Rotated factor loadings (pattern matrix) and unique variances
-------------------------------------------------
Variable | Factor1 Factor2 | Uniqueness
-------------+--------------------+--------------
Soc1 | 0.0759 0.2755 | 0.9184
Soc2 | 0.4349 0.0227 | 0.8104
Soc3 | 0.4504 0.1125 | 0.7845
Soc4 | 0.1490 0.2763 | 0.9015
2. Eigenvalues
1. Calculation of indicator weights
Indicator Squared factor loading Squared factor loading/explained variability
weight Factor1 Factor2 Factor1 Factor2
Education level 0.01 0.08 0.01 0.46 0.14
Participation in training 0.19 0.00 0.45 0.00 0.35
Participation in farmer group 0.20 0.01 0.48 0.08 0.37
Women’s empowerment 0.02 0.08 0.05 0.46 0.14
Education level 0.42 0.17 1.00
Expl.Var 0.42 0.17 Expl./Tot 0.72 0.28
-.2
0.2
.4.6
Eig
en
valu
es
1 2 3 4Number
Scree plot of eigenvalues after factor

176
III. Environmental sustainability
1. Rotated factor loadings
Factor analysis/correlation Number of obs = 57
Method: principal factors Retained factors = 2
Rotation: orthogonal varimax (Kaiser off) Number of params = 6
Rotated factor loadings (pattern matrix) and unique variances
-------------------------------------------------
Variable | Factor1 Factor2 | Uniqueness
-------------+--------------------+--------------
Env1 | 0.0245 0.0725 | 0.9941
Env2 | 0.4918 0.0022 | 0.7581
Env3 | 0.3217 0.0183 | 0.8961
Env4 | -0.4593 -0.0102 | 0.7890
-------------------------------------------------
1. Eigenvalues
1. Calculation of indicators
Indicator
Squared factor loading Squared factor
loading/explained variability weight
Factor1 Factor
2 Factor1 Factor2
Erosion control 0.00 0.01 0.00 0.92 0.01
Distance between manure storage/disposal and
the water way 0.24 0.00 0.43 0.00 0.43
Water availability through the year 0.10 0.00 0.19 0.06 0.18
Land owned with title 0.21 0.00 0.38 0.02 0.38
Expl.Var 0.56 0.01 1.00
Expl./Tot 0.99 0.01
-.2
0.2
.4.6
Eig
en
valu
es
1 2 3 4Number
Scree plot of eigenvalues after factor

177
Appendix 6: Farm questionnaire for data collection measuring sustainability
indicators
F. General Identification
A.1 Household ID (to be used in subsequent surveys)
A.2 GPS Coordinates Latitude (N/S):
Longitude (W/E):
A.3Date of interview (DD/MM/YY)
A.4 Respondent sex (0= Male; 1 = Female)
A.5 Years of schooling
A.6 Participation in farmer groups (Yes/No)
A.7 Participation in farmer trainings (Yes/No)
A.8 District
G. Agricultural Assets: Value, Ownership and Access
b. Land
Plot ID Plot Description /
Name
Size of this plot
(acres)
Tenure system (code) If plot is owned,**who owns (code)
1
2
3
4
Code
Plot description code Tenure system Plot owner
6. = Homestead
7. = Cash crop
8. = Food crop
9. = Fodder crop
10. = Grazing land
6. = Owned with title
7. = Owned without title
8. = Communal/public
9. = Rented in
10. = Rented out
9. = HH head
10. = Spouse
11. = Joint (HH head & spouse)
12. = Other male
13. = Other female
6= Others (specify) _______________
** Ownership means the one who decides on how the land is used
c. Cattle owned - enter details for each cattle separately
Cattle type
(codes)
Breed (0 = local; 1 =
exotic/cross)
Number owned
by male
Number owned
by female
Number
owned jointly
Total number owned
by household
Code
10. Bulls (> 3 years)
11. Castrated adult males (oxen> 3
years)
12. Immature males (<3 years)
13. Cows (calved at least once)
14. Heifers(female ≥1yr,have not
calved)
15. Female calves (between 8
weeks &<1yr)
16. Male calves (between 8 weeks
&<1yr)
17. Pre weaning males (<8 weeks)
18. Pre weaning males (<8 weeks)
** Ownership means the one who decides on purchase and sale of respective animal and the use of proceeds from that
animal
H. Milk Production: Supply, Input use and Technology Adoption
a. Milk production
1. Have you been milking any cows in the last six months? [__] 1=Yes; 0 = No
2. If yes, please enter details for average milk production the cows milked during the last six (6) months.
Month milk produced Number of cows milked Average volume produced per day
Months
1. Jan 2016
2. Feb 2016
3. Mar 2016
4. Apr 2016
5. May 016
6. Jun 2016
d. Use of milk
Months milk
utilized
Category milk production Quantity
(liters)
Average price received
(TZS/liter)
Liters used/consumed by household
Liters of fresh milk sold (morning and evening milk)
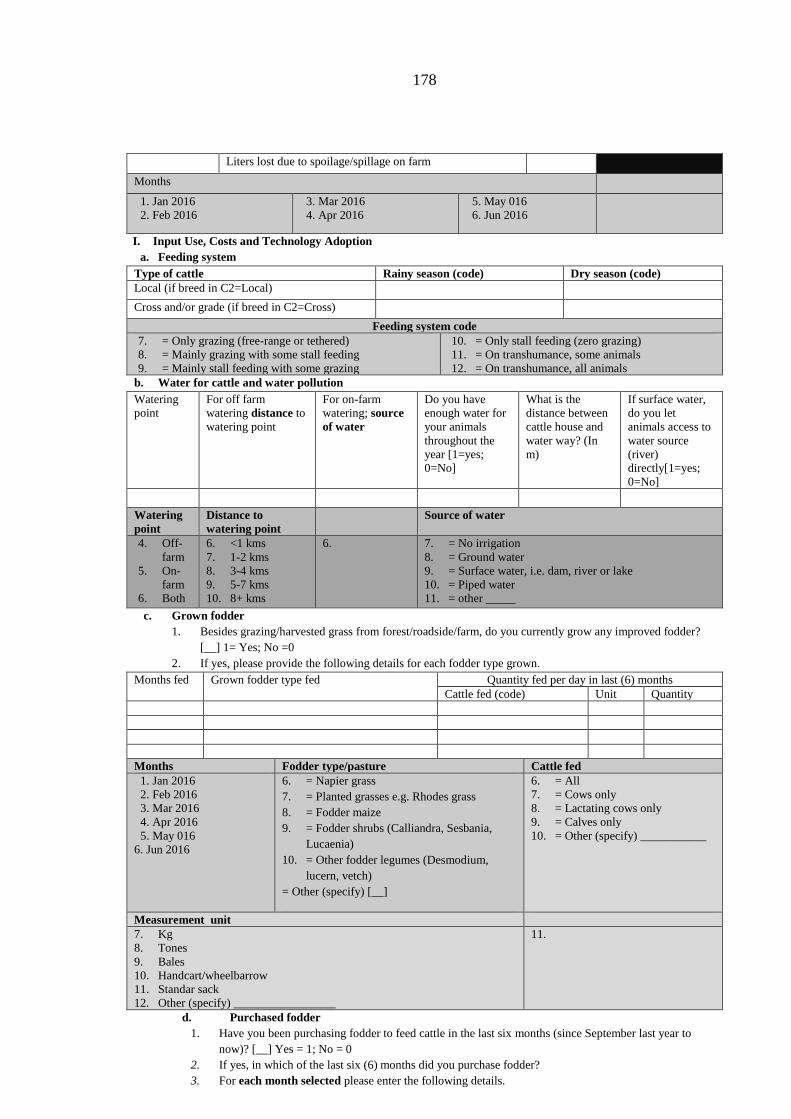
178
Liters lost due to spoilage/spillage on farm
Months
1. Jan 2016
2. Feb 2016
3. Mar 2016
4. Apr 2016
5. May 016
6. Jun 2016
I. Input Use, Costs and Technology Adoption
a. Feeding system
Type of cattle Rainy season (code) Dry season (code)
Local (if breed in C2=Local)
Cross and/or grade (if breed in C2=Cross)
Feeding system code
7. = Only grazing (free-range or tethered)
8. = Mainly grazing with some stall feeding
9. = Mainly stall feeding with some grazing
10. = Only stall feeding (zero grazing)
11. = On transhumance, some animals
12. = On transhumance, all animals
b. Water for cattle and water pollution
Watering
point
For off farm
watering distance to
watering point
For on-farm
watering; source
of water
Do you have
enough water for
your animals
throughout the
year [1=yes;
0=No]
What is the
distance between
cattle house and
water way? (In
m)
If surface water,
do you let
animals access to
water source
(river)
directly[1=yes;
0=No]
Watering
point
Distance to
watering point
Source of water
4. Off-
farm
5. On-
farm
6. Both
6. <1 kms
7. 1-2 kms
8. 3-4 kms
9. 5-7 kms
10. 8+ kms
6. 7. = No irrigation
8. = Ground water
9. = Surface water, i.e. dam, river or lake
10. = Piped water
11. = other _____
c. Grown fodder
1. Besides grazing/harvested grass from forest/roadside/farm, do you currently grow any improved fodder?
[__] 1= Yes; No =0
2. If yes, please provide the following details for each fodder type grown.
Months fed Grown fodder type fed
Quantity fed per day in last (6) months
Cattle fed (code) Unit Quantity
Months Fodder type/pasture Cattle fed
1. Jan 2016
2. Feb 2016
3. Mar 2016
4. Apr 2016
5. May 016
6. Jun 2016
6. = Napier grass
7. = Planted grasses e.g. Rhodes grass
8. = Fodder maize
9. = Fodder shrubs (Calliandra, Sesbania,
Lucaenia)
10. = Other fodder legumes (Desmodium,
lucern, vetch)
= Other (specify) [__]
6. = All
7. = Cows only
8. = Lactating cows only
9. = Calves only
10. = Other (specify) ___________
Measurement unit
7. Kg
8. Tones
9. Bales
10. Handcart/wheelbarrow
11. Standar sack
12. Other (specify) _________________
11.
d. Purchased fodder
1. Have you been purchasing fodder to feed cattle in the last six months (since September last year to
now)? [__] Yes = 1; No = 0
2. If yes, in which of the last six (6) months did you purchase fodder?
3. For each month selected please enter the following details.

179
Month when
purchased
Fodder type Cattle type fed? Monthly cost during months when purchased
Unit Qnty Price/unit
Month Fodder type
1. Jan 2016
2. Feb 2016
3. Mar 2016
4. Apr 2016
5. May 016
6. Jun 2016
7. = Napier grass
8. = Planted grasses e.g. Rhodes grass
9. = Fodder maize
10. = Fodder shrubs (Calliandra, Sesbania, Lucaenia)
11. = Other fodder legumes (Desmodium, lucern, vetch)
12. = Other (specify:__________________)
Measurement unit Cattle fed
1. Kg
2. Tones
3. Bales
4. Handcart/wheelbarrow
5. Standard sack
6. Other (specify) _________________
7. = All
8. = Cows only
9. = Lactating cows only
10. = Calves only
11. = Other (specify
e. Crop residues
1. Do you use crop residues? [__] Yes = 1; No = 0
2. If yes, in which of the last six (6) months did you use crop residues?
3. For every month selected above please enter the following details.
Month(s) used Crop
residue
Cattle type
fed?
Source: 1=Own farm; 2=Other
farm; 3=Purchased
If purchased
Monthly cost during months
when purchased
Unit Qnty Price/unit
Months Crop residues Measurement unit Animal fed
1. Jan
2016
2. Feb
2016
3.
Mar2016
4. Apr
2016
5. May
016
6. Jun
2016
1. = Green/dry maize stovers and
thinning
2. = Cereal(wheat, barley, rice etc.)
straws and millet, sorghum stalks
3. = Legumes (beans, cowpeas,
soya etc.)
4. = Root and tubers peelings
(potato, cassava, bananas etc)
5. = Crop by products (sweet potato
vines, cassava leave etc.)
6. = Other (specify)________
7. Kg
8. Tones
9. Bales
10. Handcart/wheelbarrow
11. Standard sack
12. Other (specify)
_________________
5. = All
6. = Cows only
7. = Lactating cows only
8. = Calves only
9. = Other (specify)
___________
f. Concentrates
1. Do you use concentrates? [__] Yes = 1; No = 0
2. If yes, in which of the last six (6) months did you use concentrates?
3. For every month selected above please enter the following details.
Month(s)
used
Concentrate Cattle type
fed?
Source: 1=Own farm;
2=Other farm; 3=Purchased
If purchased
Monthly cost during months when
purchased
Unit Qnty Price/unit
Months Concentrate type Measurement unit Cattle fed
1. Jan 2016
2. Feb 2016
3. Mar 2016
4. Apr 2016
5. May 016
6. Jun 2016
8. = Commercial dairy meal
9. = Mineral blocks
10. = Bran (Maize, wheat)
11. = Maize germ
12. = Oilseed by-product (Sesame seed,
cotton seed, copra, sunflower etc.)
13. =Agro industrial byproducts
(vegetable waste, brewer’s waste
etc.)
7. Kg
8. Tones
9. Bales
10. Handcart/wheelbarro
w
11. Standard sack
12. Other (specify)
______________
6. = All
7. = Cows only
8. = Lactating cows
only
9. = Calves only
10. = Other (specify)
___________

180
14. = Other (specify)____________
j. Do you practice feed conservation for the dry season ………….[1=yes 0=No]
k. Breeding services and expenses
Months Own bull
service
Other bull
service
AI service
How many times have you used this service
What is the average cost per service?
Service provider
1. Jan 2016
2. Feb 2016
3. Mar 2016
4. Apr 2016
5. May 016
6. Jun 2016
8. Other farmers
9. Community bull (bull scheme)
10. Private AI provider
11. Government/public AI provider
12. Project/NGO AI provider
13. Coop/AI provider
14. 99 (N/A)
Other (specify) ________
l. Animal health services and expenses
Month Anthelmintic
(deworming)
Tick control
(spraying/dipping)
Vaccination Curative
treatment
Is the service available? (0= NO;
1=YES)
How many times have used this
service in this month
What was the average cost per
service
Months
1. Jan 2016
2. Feb 2016
3. Mar 2016
4. Apr 2016
5. May 016
6. Jun 2016
F. Labour use and expenses
7. Monthly labour: Have you employed any monthly labourer(s)in the last six (6) months (between January
and now)? (0=No 1=Yes), if yes, enter the following details
Months Name of labourer Gender of
labourer
0 = Male
1 = Female
Average
working
hours per day
on dairy
Monthly wage
1
2
3
Months
1. Jan 2016
2. Feb 2016
3. Mar 2016
4. Apr 2016
5. May 016
6. Jun 2016
8. Casual labour: Have you employed any casual labourer(s)in the last six (6) months (between January and
now)? (0=No 1=Yes), if yes, enter the following details:-
Months Name of
labourer
Gender of labourer
0 = Male
1 = Female
Average working
hours per day on
dairy
Total Amount
paid
1
2
3
Months
1. Jan 2016
2. Feb 2016
3. Mar 2016
4. Apr 2016
5. May 016
6. Jun 2016
9. Household labour: Employed household labour in the last six (6) months (since September to now)? (0=No
1=Yes), if yes, enter the following details:
Type of Activity
Household Freq.
(code) Adult Males Adult Females Children (< 15 yrs)
No.
people Hrs/person/day
No.
people Hrs/person/day
No.
people
Gender
M/F Hrs/person/day

181
12. Grazing
13. Feeding (+ collecting
& preparation)
14. Fodder/feed
production on farm
15. Providing water to the
animals
16. Cleaning of animal
shed/shelter
17. Collection of Farm
Yard Manure (FYM)
18. Milking and milk
processing
19. Selling milk
20. Selling animals/
animal products
(except milk)
21. Crop production
22. Other: [
]
Frequency of activity code
1. [___] per day 2. [___] per week 3. [________] per month 4. [_____] per year
G. Participation in Farmer Group
iii. Do any household member belong to a Farmer Group?: (0=No 1=Yes)
[____________]
c. Have you ever attended any training about dairying during the last six months (0=No 1=Yes) [____________]
I. Soil conservation
e. Do you practice any erosion control ……….[1=yes 0=No]
J. Women’s empowerment in livestock index
a. Daily time allocation
3.1: please record a log of the activities for the indivdual in the last typical week day. Identify a typical day be asking
‘was yesterday a typical/usual day? If no, ask if the day before yeseterday was a typical day until you identify a typical
day. Then ask ‘at what time did you wake up? What did you do? For how long?’ record all activities that take more than
15 minues in the right (1 hour) time intervals. More activities (maximum 4 activities) can be marked for each hour by
checking the corresponding box. “Now I’d like to ask you about how you spent your time during the (day that was
identified at a ‘typical day’). This will be a detailed accounting. We’ll begin from the moment you woke up until
the moment you went to sleep .
Activity hours
Revenue generating activities 4-
5am
5-
6a
m
6-
7a
m
7-
8a
m
… 11am-
12pm
12pm
-1pm
1pm
-
2pm
… 9pm-
4am
Work as employed
Own business work (e.g. having a shop,
work as daily labourer etc.)
Livestock farming
Crop farming
Cooking (e.g. processing or cooking
milk, meat or vegetables for sale)
Marketing farm products
Weaving, sewing, etc.
Traveling (to sell)
Social activity (e.g. Vicoba)
Other
Non-revenue generating activities
Sleeping and resting
Eating and drinking
Personal care (e.g. bathing, dressing
etc.)
Education (e.g. school, trainings etc.)
Livestock farming (e.g. milking,
feeding, breeding, washing, watering
etc)
Crop farming (e.g. planting, weeding,
harvesting, storing, hoeing, fertilizing

182
b. Decision making on hh expenditure
“Now I have some questions about making decisions about various aspects of household life.”
ACTIVITY Who makes the following decisions?
(Code below, multiple select)
C Major household expenditures (such as a large sofa set, car etc)
E Minor household expenditures (such as oil for lamps, clothes for self
and family)
1=MYSELF
2=PARTNER/SPOUSE/HUSBAND
3=BOYS
4=GIRLS
5=OTHER MALE HOUSEHOLD MEMBERS
6=OTHER FEMALE HOUSEHOLD MEMBERS
7=A WOMAN OUTSIDE THE HOUSEHOLD
8=A MAN OUTSIDE THE HOUSEHOLD
9=SOCIETY
c. Decision MAKING ON HH INCOME
“Now I have some questions about making decisions about household management of income”
Income source(s) Who decides how to manage the household income from the following sources?
(Code below, multiple select)
Livestock
Crop
1=MYSELF
2=PARTNER/SPOUSE/HUSBAND
3=BOYS
4=GIRLS
5=OTHER MALE HOUSEHOLD MEMBERS
6=OTHER FEMALE HOUSEHOLD MEMBERS
7=A WOMAN OUTSIDE THE HOUSEHOLD
8=A MAN OUTSIDE THE HOUSEHOLD
9=SOCIETY
10=NOT APPLICABLE
d. Access to training and information
1. ACCESS TO TRAINING
Did you take any training in the last year? (Y/N) [ ]
2. ACCESS TO INFORMATION
Do you receive new information to improve your livestock work in the past year? (Y/N) [ ]
a. Group membership
Did you participate in any training in the last year? (Y/N) [ ]
etc)
Shopping
Getting services (e.g. banking, vet,
doctor, paying bills, Mpesa services
etc)
Weaving, sewing etc.
Cooking (e.g. processing or cooking
milk, meat or vegetables for family
consumption)
Domestic work (e.g. fetching water,
wood, cleaning house etc.)
Care for children (e.g. feeding,
supporting with homework, washing,
preparing special food etc.)
Care for adults or elderly (e.g. help
sick, wash them, feed them, give them
medicines, prepare special food etc.)
Travelling and commuting
Watching TV, listening to radio
Exercising (e.g. sports)
Social or religious activities (e.g.
visiting friends and family, attending
ceremonies etc.)
Other
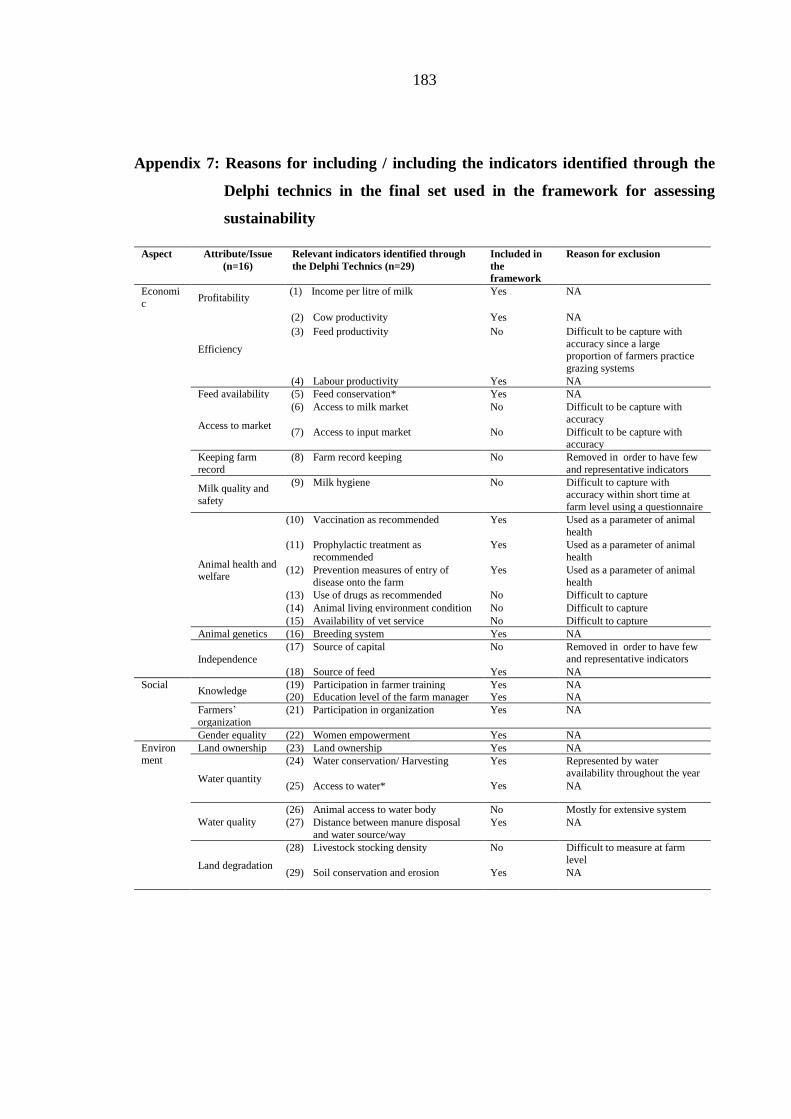
183
Appendix 7: Reasons for including / including the indicators identified through the
Delphi technics in the final set used in the framework for assessing
sustainability
Aspect Attribute/Issue
(n=16)
Relevant indicators identified through
the Delphi Technics (n=29)
Included in
the
framework
Reason for exclusion
Economi
c Profitability
(1) Income per litre of milk Yes NA
Efficiency
(2) Cow productivity Yes NA
(3) Feed productivity No Difficult to be capture with
accuracy since a large proportion of farmers practice
grazing systems
(4) Labour productivity Yes NA
Feed availability (5) Feed conservation* Yes NA
Access to market
(6) Access to milk market No Difficult to be capture with
accuracy
(7) Access to input market No Difficult to be capture with accuracy
Keeping farm
record
(8) Farm record keeping No Removed in order to have few
and representative indicators
Milk quality and
safety
(9) Milk hygiene No Difficult to capture with accuracy within short time at
farm level using a questionnaire
Animal health and welfare
(10) Vaccination as recommended Yes Used as a parameter of animal
health
(11) Prophylactic treatment as
recommended
Yes Used as a parameter of animal
health
(12) Prevention measures of entry of
disease onto the farm
Yes Used as a parameter of animal
health
(13) Use of drugs as recommended No Difficult to capture
(14) Animal living environment condition No Difficult to capture
(15) Availability of vet service No Difficult to capture
Animal genetics (16) Breeding system Yes NA
Independence
(17) Source of capital No Removed in order to have few and representative indicators
(18) Source of feed Yes NA
Social Knowledge
(19) Participation in farmer training Yes NA
(20) Education level of the farm manager Yes NA
Farmers’
organization
(21) Participation in organization Yes NA
Gender equality (22) Women empowerment Yes NA
Environment
Land ownership (23) Land ownership Yes NA
Water quantity
(24) Water conservation/ Harvesting Yes Represented by water availability throughout the year
(25) Access to water* Yes NA
Water quality
(26) Animal access to water body No Mostly for extensive system
(27) Distance between manure disposal
and water source/way
Yes NA
Land degradation
(28) Livestock stocking density No Difficult to measure at farm
level
(29) Soil conservation and erosion Yes NA

184
Appendix 8: Producers’ Organization Sustainability Assessment Tool (POSA)
NB: Enter data in the white cells only!!
Note: this from only applies to farmers group with some 'business'. Farmers groups not doing
any business are not assessed
SECTION I: BASIC DATA PO Type
Private businesses are assessed with the
other form
Country
Tanzania
Tanza
nia
Cooperati
ve
Village Kwemashai
Name of farmer group
Type of services provided any two specify
Associati
on
Organisation form Association
Date of assessment
(dd/mm/yyyy)
Name & title of reviewer
Name & title of data validator
SECTION II:PO
SUSTAINABILITY DATA
Dimension Sub-Dimension Indicator
Enter
Data
Source
Maxim
um
Score
Rating Scale Scores
Enter/sel
ect PO
Value
PO
Scor
e
Enter
Comments/Notes
Financial
health
Profitability What is the
group Net
Profit Margin
(Net Profit
after interest
and
tax/sales*100
%)?
3.0
>5% 3.0
0.0
No Milk bulking or
any other Business
2 to 5% 2.0
0 to 2% 1.0
How many
individual
business units
reported losses
for 2
consecutive
years or more?
2.0
One or more 0.0
0.0
No Milk bulking or
any other Business
None
2.0
Liquidity What is the
group current
Ratio (Current
assets/current
liabilities)?
2.0
>=1 2.0
0.0
<1 0.0
Capital
structure
What
proportion of
stakeholders
equity is used
to finance the
business? Debt
Equity ratio =
(Total
liabilities/stake
holder
equity*100%)
3.0
>=41% 0.0
0.0
31 to 40% 1.0
21 to 30% 2.0
<21% 3.0
Sub-Total 10.0 0.0
Engageme
nt with
milk
market- if
farmers
group is in
milk
business
Suppliers What is the
proportion of
registered
members
marketing
milk through
the group
(average
monthly milk
suppliers/total
registered
members*100
%)?
3.0
>50% 3.0
0
No Milk bulking or
any other Business
31-50% 2.0
21-30% 1.5
11-20% 1.0
<11% 0.0
What is the
proportion of
female
suppliers
supplying milk
to the group
(average
monthly
female
suppliers/
average
monthly milk
2.0
>=30
&<=70% 2.0
0.0
No Milk bulking or
any other Business
20-29% 1.5
10-19% 1.0
<10% 0.0

185
suppliers*100
%)?
What is the
annual milk
supply
variance
(average
volumes of top
three months
less average
volumes of
bottom three
months/averag
e volumes of
top three
months*100%)
?
3.0
<25% 3.0
0
26-40% 2.0
41-50% 1.0
>50% 0.0
Milk quality What is the
proportion of
milk rejected
by the buyer(s)
annually (total
annual volume
of milk
rejected by
buyers/ total
annual amount
of milk sold
*100%)?
3.0
<1% 3.0
0.0
1-2% 2.0
>2% 0.0
Market
reliability
Group has
signed
contracts with
buyers
(Contracts
specifies
period,
minimum
volume and
price)
3
All three 3.0
0
Any two 2.0
One 1.0
None 0.0
Does the group
consistently (at
least 9 months
in a year) meet
minimum milk
volume
requirements
as per the
supply
contract?
4.0
>=9 Months 4.0
0.0
Between 6 and
9 months 3.0
< 6months 2.0
No contract 0.0
Sub-Total 18.0 0.0
Effective
and
transparen
t
leadership
and
manageme
nt
Representation
and
participation
Does the group
conduct
Annual
General
Meeting
(AGM) where:
(i)elections are
held if due,
(ii)presentation
of audited
financial
report, (iii)
presentation of
annual
workplan and
budget take
place?
3.0
All three
covered 3.0
Any two
covered 2.0
elections held after
four years,
presentations of
financial reports,
work plans discussed
Any two
covered 2.0
None covered 0.0
What is the
proportion of
women in
BOD (Number
of women in
BOD/ total
BOD
membership*1
00%)?
2.0
>=30 and
<=70% 2.0
36 2.0
four out of 11 <30 and >70% 0.0
What is the
proportion of
youth (<=35
years) in BOD
(Number of
youth in BOD/
total BOD
membership*1
00%)?
2.0
>=30 and
<=70% 2.0
36
2.0
<30 and >70% 0.0
Effective Group Are internal 5.0 All four 5.0 None 0.0

186
supervision and
control
audits
conducted
annually
covering all
internal
management
systems (HR,
finance,
procurement,
quality) by
either
supervisory
committee or
internal
auditor and the
findings
implemented?
covered covered
Any three
covered 3.0
Two or less
covered 1.0
None covered 0.0
Have the
current BoD
members
completed at
least
secondary
level education
(O-level)?
2.0
100% 2.0
0 0.0
none
50-99% 1.0
<50% 0.0
Effective Group
management
Does the
Group prepare
and review
separate
annual and
monthly
financial
reports for all
its business
units?
2.0
Annual and
monthly 2.0
Annual
only 1.0
Annual only 1.0
None 0.0
Has the Group
hired key
professional
staff as per the
organogram (
e.g manager,
production,
finance,
quality)?
1.5
100% filled 1.5
100%
filled 1.5
At least 75% 1.0
Below 75% 0.0
What is the
voluntary staff
turnover ratio
over the past
12 months
(Number of
staff who left
the Group
during the year
divided by the
total staff
compliment at
the beginning
of the year
*100%)?
1.5
>2 and >20% 0.0
0.0
<=2 and
<=20% 1.5
Sub-total 19.0 8.5
Access to
dairy
inputs and
services
Dairy feeds and
feeding
Does the group
operate a feed
store(s) and/or
has it
contracted
private
supplier(s)?
1.0
Yes 1.0
No 0.0
No 0.0
Does the group
stock/contract
private
suppliers of
quality
(nutrition,
viability e.t.c)
fodder
planting
material
(seeds,
cuttings and
splits)?
1.0
Yes 1.0
No 0.0
No 0.0
Does the group
promote feed
processing,
pasture
improvement
and water
availability
1.0
Yes 1.0
Yes 1.0
No 0.0

187
technologies
(financial
linkages,
education and
training,
demonstration,
production)?
Does the group
contract or
negotiate with
feed suppliers
for dry season
feed?
1.0
Yes 1.0
No 0.0
No 0.0
What is the
proportion of
members using
group
facilitated feed
services (total
members using
group
facilitated feed
services/ total
members*100
%)?
1.0
>=30% 1.0
0.0
>10<30% 0.5
<10% 0.0
Genetics Does the group
have a semen
bank/ AI
satellite centre
or have a link
with an
external semen
supplier?
1.0
Yes 1.0
Yes 1.0 no semen bank at the
group but linked to
AI provider, the price
is still high. The
service provider is far No 0.0
What is the
proportion of
members using
group
facilitated AI
services (total
members using
group
facilitated AI
services/ total
members
*100%)?
1.0
>=30% 1.0
0 0.0
>10<30% 0.5
<10% 0.0
Herd Health Does the group
operate drug
store(s) or has
it contracted a
private
dealer(s)?
1.0
Yes 1.0
Yes 1.0
No 0.0
What is the
proportion of
members using
group
facilitated AH
services (total
members using
group
facilitated AH
services/ total
members
*100%)?
1.0
>=30% 1.0
0.0
>10<30% 0.5
<10% 0.0
Extension
structure
Does the group
have an
functional
extension unit
(internally or
externally
resourced)?
2.0
Yes 2.0
Yes 2.0
No 0.0
Does the group
conduct/collab
orates on
periodic on-
farm surveys
and are the
findings used
for decision
making
(covering
dairy
production and
farmer
satisfaction
with group
services)?
1.0
Yes 1.0
Yes 1.0
No 0.0
Financial Does the group 2.0 Four or more 2.0 Any 1.5 mainly on drugs and

188
services have a
functional
check off
system for
dairy inputs
and services is
in place
offering:
Feeds,
breeding,
animal health
and dairy
equipment?
Any Three 1.5 Three Extension
1 to 2 1.0
None 0.0
Does the group
have
FSA/SACCO
or linkage with
financial
service
provider(s)
offering
diversified and
suitable
financial
services (Asset
financing,
savings, credit,
livestock
insurance,
financial
literacy e.t.c)?
2.0
Four or more 2.0
None 0.0
Any Three 1.5
One or Two 1.0
None 0.0
Total 16.0 7.5
Relationshi
p with
external
environme
nt
Partnership with
actors
Does the group
work
(mutually
beneficial
partnerships)
with other
actors
(public/private
) to improve
its business
operating
environment?
2.0
Yes 2.0
Yes 2.0
during the site visits ,
the trainings we also
invite the villagers to
attend the traings No 0.0
Corporate social
responsibility
Does the group
have a
functional
corporate
social
responsibility
(CSR)
program for
promotion of
social
cohesion?
1.5
Yes 1.5
Yes 1.5
tey contribute to the
community indirectly
by contributing to the
community No 0.0
Total 3.5 3.5
Member
loyalty
Patronage What is the
general trend
of active milk
suppliers or
users of group
services for the
last three
years?
1.5
Increasing 1.5
Decreasi
ng 0.0
started with 156
members, but the
numbers have been
decreasing due to
misconception that
they will get free
cows from the project
Static 1.0
Decreasing 0.0
What is the
proportion of
active
members using
Group check
off facility
(total active
suppliers using
check off
facility/ total
active
suppliers
*100%)?
1.5
>60% 1.5
0.0
41-60% 1.0
21-40% 0.7
10-20% 0.5
<10% 0.0
Member
investment
What is the
proportion of
members who
are fully paid
up
shareholders
(fully paid up
shareholders/
total
members*100
1.0
>60% 1.0
55 0.7 intially 156 members
thought they will get
cows, and had joined
to get cows only 65
left with an active
base of 39
41 to 60% 0.7
21 to 40% 0.5
<=20% 0.0
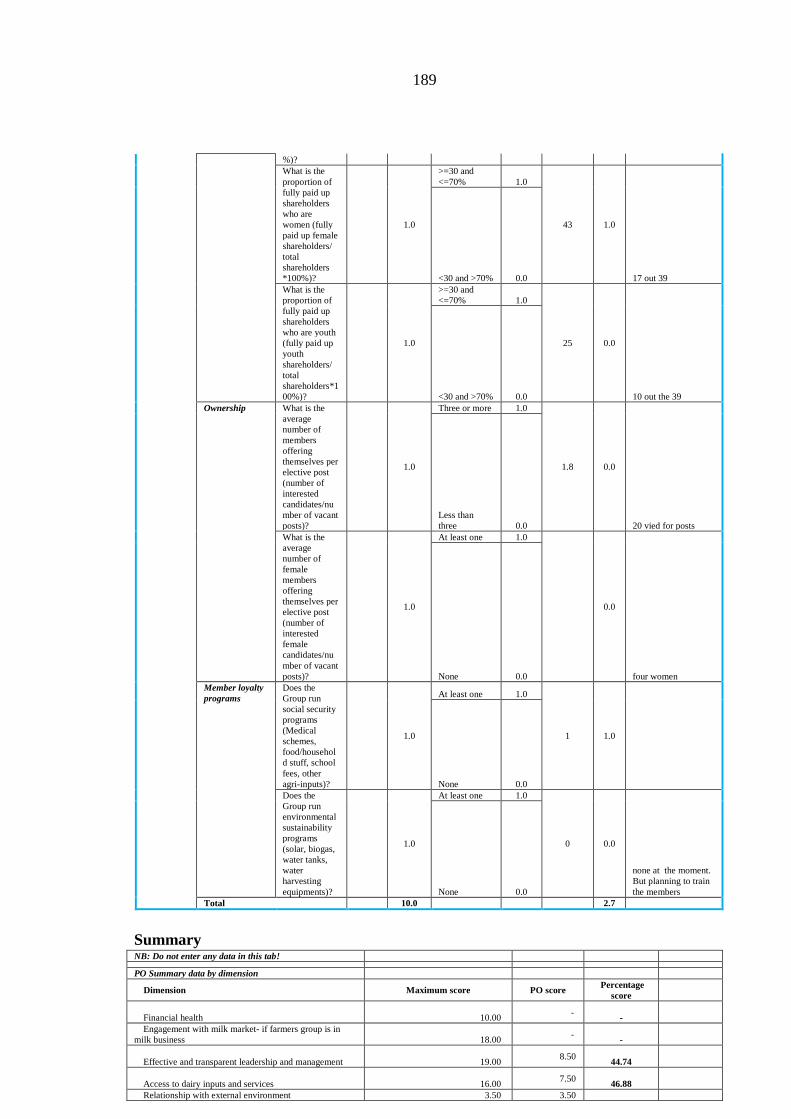
189
%)?
What is the
proportion of
fully paid up
shareholders
who are
women (fully
paid up female
shareholders/
total
shareholders
*100%)?
1.0
>=30 and
<=70% 1.0
43 1.0
17 out 39 <30 and >70% 0.0
What is the
proportion of
fully paid up
shareholders
who are youth
(fully paid up
youth
shareholders/
total
shareholders*1
00%)?
1.0
>=30 and
<=70% 1.0
25 0.0
10 out the 39 <30 and >70% 0.0
Ownership What is the
average
number of
members
offering
themselves per
elective post
(number of
interested
candidates/nu
mber of vacant
posts)?
1.0
Three or more 1.0
1.8 0.0
20 vied for posts
Less than
three 0.0
What is the
average
number of
female
members
offering
themselves per
elective post
(number of
interested
female
candidates/nu
mber of vacant
posts)?
1.0
At least one 1.0
0.0
four women None 0.0
Member loyalty
programs
Does the
Group run
social security
programs
(Medical
schemes,
food/househol
d stuff, school
fees, other
agri-inputs)?
1.0
At least one 1.0
1 1.0
None 0.0
Does the
Group run
environmental
sustainability
programs
(solar, biogas,
water tanks,
water
harvesting
equipments)?
1.0
At least one 1.0
0 0.0
none at the moment.
But planning to train
the members None 0.0
Total 10.0 2.7
Summary NB: Do not enter any data in this tab!
PO Summary data by dimension
Dimension Maximum score PO score Percentage
score
Financial health 10.00 -
-
Engagement with milk market- if farmers group is in
milk business 18.00 -
-
Effective and transparent leadership and management 19.00 8.50
44.74
Access to dairy inputs and services 16.00 7.50
46.88
Relationship with external environment 3.50 3.50

190
100.00
Member loyalty 10.00 2.70
27.00
Total PO score 76.50 22.20
29.02
Stage Stage II
Stage intervals
Stage Score Range PO Score
Stage I
0-
20
Stage II
21-
40 29.02
Stage III
41-
60
Stage IV
61-
80
Stage V
81-
100
PO Summary data by sub-dimension
Dimension Sub-dimension
Maximum
score PO Score
Percent
score
Financial health
Profitability
3.00
Profitability
2.00
Liquidity 2.00
Capital structure
3.00
Total
10.00
Engagement with milk market- if farmers group is in milk
business Milk quality
3.00
Market reliability
7.00
Suppliers
8.00
Total
18.00
Effective and transparent leadership and management
Representation and participation
7.00
6.00
85.71
Effective Group supervision and
control
7.00
Effective Group management
5.00
2.50
50.00
Total
19.00
8.50
44.74
Access to dairy inputs and services Dairy feeds and feeding
5.00
1.00
20.00
Genetics
2.00
1.00
50.00
Herd health
2.00
1.00
50.00
Extension structure
3.00
3.00
100.00
Financial services
4.00
1.50
37.50
Total
16.00
7.50
46.88
Relationship with external environment
Partnership with actors
2.00
2.00
100.00
Corporate social responsibility
1.50
1.50
100.00
Total
3.50
3.50
100.00
Member loyalty Patronage
3.00
- -
Member investment
3.00
1.70
56.67
Ownership
2.00
- -
Member loyalty programs
2.00
1.00
50.00
Total
10.00
2.70
27.00
PO Total
76.50
22.20
29.02

191
Appendix 9: Relevant indicators for assessing sustainability of milk production farm
in Morogoro and Tanga Regions
Aspect Attribute/Issue
(n=16) Measurable Indicator (n=41)
1st round 2nd round Status
Consensus
level SD Mean SD Mean
Economic Profitability (1) Income per litre of milk 1.0 4.4 0.8 4.5 Accepted High
Efficiency (2) Cow productivity 1.0 4.4 0.6 4.6 Accepted High
(3) Feed productivity 1.2 4.1 0.8 4.3 Accepted High
(4) Labour productivity 0.9 3.9 0.7 4.0 Accepted High
Feed availability (5) Feed conservation* 0.0 5 0.9 4.1 Accepted High
Access to market (6) Access to input market 0.9 4.5 0.6 4.7 Accepted High
(7) Access to milk market 1.2 4.1 0.8 4.3 Accepted High
Keeping farm record (8) Farm record keeping 1.2 4.1 1.1 4.3 Accepted Reasonable
Milk quality and safety (9) Milk hygiene 0.9 4.5 0.5 4.8 Accepted High
Animal health and
welfare
(10) Vaccination as recommended 1.0 4.4 0.8 4.5 Accepted High
(11) Prophylactic treatment as
recommended
0.8 4.3 0.6 4.4 Accepted High
(12) Prevention measures of entry
of disease onto the farm
1.0 4.1 0.8 4.4 Accepted High
(13) Use of drugs as recommended* 0.9 4.1 0.8 4.2 Accepted High
(14) Calf mortality* 0.9 3.9 0.9 3.9 Rejected High
(15) Animal living environment
condition
0.9 4.1 0.8 4.2 Accepted High
(16) Availability of vet service* 0.8 4.1 0.7 4.3 Accepted High
Animal genetics (17) Breeding system 0.7 4.1 0.8 4.3 Accepted High
Independence (18) Source of capital 1.1 3.9 1.0 4.1 Accepted High
(19) Source of feed 1.1 4.0 1.0 4.1 Accepted High
(20) Source of labour 0.9 3.7 1.0 3.6 Rejected High
Off-farm income (21) Off-farm income 1.0 3.6 0.9 3.8 Rejected High
Identification of animals (22) Identification of animals * 1.4 4 0.9 3.9 Rejected High
Social Knowledge (1) Education level of the farm
manager
1.2 3.9 1.0 4.0 Accepted High
(2) Participation in farmer training 1.2 3.8 1.0 4.1 Accepted High
Working conditions (3) Working time 1.2 3.8 1.0 3.9 Rejected High
(4) Workload distribution 1.2 3.8 1.1 3.8 Rejected Reasonable
Farmers’ organization (5) Participation in organization 1.1 4.0 0.9 4.0 Accepted High
Gender equality (6) Women empowerment 1.0 4.1 0.9 4.1 Accepted High
(7) Work sharing 1.2 3.9 1.1 3.8 Rejected Reasonable
Health and safety (8) Distance between living house
and manure disposal*
1.2 3.7 1.2 3.7 Rejected Reasonable
Environment Land ownership (1) Land ownership 1.0 4.3 0.7 4.5 Accepted High
Water quantity (2) Water conservation/ Harvesting 1.1 4.3 0.8 4.6 Accepted High
(3) Access to water* 0.0 5 0.7 4.6 Accepted High
Water quality (4) Animal access to water body 1.4 4.0 0.7 4.4 Accepted High
(5) Distance from water
source/way
1.1 4.1 0.8 4.3 Accepted High
(6) Manure storage runoff 1.3 3.5 1.3 3.5 Rejected Reasonable
Land degradation (7) Livestock stocking density 1.5 3.9 1.1 4.1 Accepted Reasonable
(8) Soil conservation and erosion 1.3 4.0 1.3 4.0 Accepted Reasonable
(9) Grazing on formally
demarcated land
1.4 3.6 1.4 3.5 Rejected Reasonable
Farm existence (10) Animal farm/Backyard
production
1.3 3.7 1.1 3.8 Rejected Reasonable
Manure management (11) Proportion of manure used 1.2 3.7 1.2 3.7 Rejected Reasonable
*Indicators added by the respondents; Cut-off point: Mean score ≥ 4.0; Indicators not listed in
table those mean score was less than 3.5
Copyright © 2022 FDOKUMEN