Analysing and exploring land use decisions by smallholder ...
Upload
independentCategory
view
2download
0
USE OF METABOLIC PROFILES IN DAIRY CATTLE IN TROPICAL ANDSUBTROPICAL COUNTRIES ON SMALLHOLDER DAIRY FARMS
D.A. WHUAKERDepartment of Veterinary Clinical Studies,University of Edinburgh, XA9952128Easter Bush, Roslin, Midlothian, United Kingdom
W.J. GOODGERDepartment of Medical Sciences,School of Veterinary Medicine,University of Wisconsin-Madison,Madison, Wisconsin, United States of America
M. GARCIALa Molina, Lima, Peru
B.M.A.O. PERERAAnimal Production and Health Section,Joint FAO/IAEA Division of Nuclear Techniquesin Food and Agriculture,International Atomic Energy Agency,Vienna
F. WnTWERInstituto de Ciencias Clinicas,Facultad de Ciencias Veterinarias,Universidad Austral de Chile,Valdivia, Chile
Abstract
USE OF METABOLIC PROFILES IN DAIRY CATTLE IN TROPICAL AND SUBTROPICALCOUNTRIES ON SMALLHOLDER DAIRY FARMS.
Metabolic profile testing has generally been used as part of a multi-disciplinary approach fordairy herds in temperate climates. Our goal was to evaluate the effectiveness of the technique foridentifying constraints on productivity in small herds in environments less favourable for milkproduction. Metabolites tested were chosen for stability in the sample after collection of blood, easeof analysis and practical knowledge of the meaning of the results. Blood levels of five differentmetabolites in low producing dairy cows belonging to smallholders in tropical and subtropicalenvironments were measured. The study involved 13 projects with 80 cows in each, carried out in sixLatin American, six Asian and one southern European country. Data was also collected on feeding,body condition (BCS) and weight change, parasitism and reproduction. In Chile, Mexico, Paraguay,Philippines, Uruguay and Venezuela globulin levels were high in more than 17% of cows sampled oneach occasion. Globulin levels were also high in Turkey and Viet Nam on one or more occasions. InParaguay 49% of cows had high globulin levels at 2-3 months after calving. These results suggest thatinflammatory disease was present to a potentially important degree, although this was not alwaysinvestigated and not always taken into account. In all countries except Mexico and Venezuela high (3-hydroxybutyrate (BHB) levels before calving in many cows highlighted the presence of condition lossin late pregnancy, an important potential constraint on productivity and fertility. Fewer cows showedhigh BHB levels in lactation where change in BCS and weight was more sensitive for measuringnegative energy balance. Urea concentrations were only found to be low in small numbers of cowssuggesting that dietary protein shortages were not common. Albumin values were low mainly in cows
87
where globulin values were high and so did not generally provide additional information. Theexception was in China where pregnant yaks over winter had high BHB and low albumin valuessuggesting that they were seriously underfed. This observation stimulated a successful nutritionalintervention in the following winter. Inorganic phosphate values were within the reference range inmost countries most of the time suggesting, contrary to expectation, that this mineral was notcommonly a constraint. The use of metabolic profile testing proved valuable in drawing attention toimportant potential constraints on productivity in dairy cows in tropical and subtropical environmentsand in confirming those which were not.
1. INTRODUCTION
Metabolic profiles in dairy cows were used initially in Britain in the 1960's [1]. Successwas limited for a number of reasons, the main one being the expectation that all biochemicalconcentrations in bovine blood would reflect nutritional intake and status at all times [2].However practical value was found in the approach as an aid to nutritional management [3]. Inthe late 1970's the approach was reassessed and re-instituted culminating in a programme forfarmers looking at health and productivity using metabolic profile blood analysis as anintegral part of the package [4] and involving a multi-disciplinary approach. This programmehas developed in the light of practical experience into a system used by around 250 dairyfarmers in Britain each year from herds of average size of 130 cows producing lactationsaveraging over 6000 L each. The system depends on a team approach involving farmer,veterinarian and agricultural adviser. The blood testing part, if useful information is to beobtained, also depends critically on following a set of firm criteria for selection of smallgroups of typical cows within each herd, on timing of testing in relation to concentrate feeds,feed changes and stage of lactation, and on the collection of other data about the cows such asbody weight and condition, productivity and feeding. These details have been described [5].Others [6, 7] have also developed the metabolic profile approach along similar lines as an aidto the management and nutrition of dairy cattle in temperate climates. The successfulapproach has been to look, following specific times of nutritional change, at metabolite levelsin strictly defined small representative groups of cows within each herd in conjunction withinformation on body condition and weight, milk performance and feeding. Comparison withoptimum values, the degree of variation from them and comparisons between groups withinherds have allowed information about nutritional constraints on productivity to be madeavailable to farmers more quickly and more specifically than by any other means. Simple dataon the incidence of disease - essential for decisions to be made on control and preventiveapproaches - have been collected as well. The challenge of the FAO/IAEA Co-ordinatedResearch Project (CRP) entitled "Development of Supplementation Strategies for Milk-Producing Animals in Tropical and Subtropical Environments" on smallholder farms was tostudy if a similar approach could be adapted to be of use in subtropical and tropicalenvironments for identifying any factors which were constraints on productivity and to clarifythose that were not; with the additional problems that the farms were located in areas of greatfluctuation in nutrient availability, where groups of cows are not available on blood samplingoccasions, where genetic variation is wide and where production levels are generally lower.
2. METERIALS AND METHODS
Studies under the CRP were initiated in 13 countries - Brazil, Chile, China, Indonesia,Mexico, Paraguay, Philippines, Sri Lanka, Thailand, Turkey, Uruguay, Venezuela and VietNam. Guidelines commencing with a field survey of a minimum of one year on prevailingcattle production systems were set down. Data were stored in a computer database specificallydesigned for these studies. Printed data sheets resembling computer on-screen forms were
88
used in data collection in the field. In each case 80 cows from representative farms of similartype were selected avoiding animals which were untypical and/or experiencing clinicalproblems. Cows were usually crosses between local native and European breeds such asHolsteins. In China the animals used were yaks, Bos grunniens, which provide milk, meat andwool. Blood sampling for metabolite analysis was carried out between 1-2 weeks beforecalving and between 10-20 days and 2-3 months after calving. Cows were assessed once amonth for body condition score (BCS) on a scale from 1-5 [8, 9]. Body weight wasdetermined by heart girth measurement using a weighband pulled to a constant tension of 5kg. Milk yield was recorded monthly. Calves, if suckling, were weighed.at birth and monthlyuntil weaning. Assessments of feed intake, content and type were made monthly. All feeds(pastures and supplements) were analysed for dry matter, 48 hour degradability, organicmatter, nitrogen and ash. Similar concentrates were pooled. Milk samples were collected oncea week from 2-4 weeks calved until pregnancy was confirmed by rectal examination. Milksamples were preserved with sodium azide and the milk fat subsequently removed. The fat-free portion was kept frozen at -20°C until radioimmunoassay (RIA) was carried out forprogesterone level using the FAO/IAEA Solid-Phase RIA Kit [10]. Cyclic activity wasdeemed to have started at the first of two consecutive samplings where progesterone wasabove 3 nmol/L. Gastro-intestinal parasitic infestation was also assessed in some of theprojects from faecal samples collected at three month intervals.
Blood metabolites to be analysed were chosen on the grounds of stability aftercollection, ease of analysis and known relevance to likely nutritional constraints. |3-hydroxybutyrate (BHB) level was used as a measure of energy balance. Urea level was usedto assess protein intake. Albumin and globulin values were measured to assess long termprotein status, as well as the presence of chronic inflammatory disease. Inorganic phosphatelevels in blood provided an indication of dietary phosphate intake and haemoglobin wasmeasured to assess the presence of anaemia. Reference values for metabolites were taken fromWhitaker et al. [5]. Blood samples were collected into vacutainers containing lithium/heparinanti-coagulant and transported in a cool box to the laboratory. Samples were centrifugedwithin 24 hours and plasma subsequently removed. If analysis was not carried outimmediately, plasma was stored at -20°C. Analysis was carried out on batches of plasmasamples using kits provided by the FAO/IAEA Agriculture and Biotechnology Laboratory,Seibersdorf, and manually operated colorimeters. The methods used were: BHB using an endpoint UV enzymatic (3-HBDH) NAD dependent method, urea by Urease-Berthelot, totalprotein by Biuret, albumin by Bromo Cresol Green, globulin by the difference between totalprotein and albumin, phosphorus by Molybdate and hemoglobin by Drabkin-Cyanmethemoglobin.
Guidelines were provided on an individual basis for each study on the preparation of thedata for analysis. The database included background data on the farm and cows, productiveparameters at the time of sampling, metabolite results, haemoglobin levels, milk fatpercentage, body weight and condition score and reproductive events. The database, whichcontained this data in six separate files, was organised into query files in dBase 4a. Thequeries allowed two or more portions of the data files to be merged. They allowed the creationof calculated fields, the addition of fields to existing files and the indexing of resulting filesfor efficient organising of the data for analysis. The analysis that is reported in this paper wascompleted using the Systat 5b statistical programme. It was limited to calculating the mean andstandard deviation for each metabolite at three different stages of lactation. The percentage ofvalues outside the reference range was calculated assuming a normal distribution, such that68.3, 95.4 and 99.7% were within one, two and three standard deviations respectively.
" Ashton Tate, Torrance, Californiab SPSS Inc, Chicago, Illinois
89

3. RESULTS
In order to maintain a reasonable length to this paper no attempt has been made here topresent or discuss feed analysis, milk yield, weight or body condition score data collected inthese studies. These details can be found in the individual country reports presented elsewhere
Mean and standard deviation of BHB and inorganic phosphate values obtained areshown in Table I. Values for urea, albumin and globulin are in Table II. There was somevariation in the number of cows blood sampled in each country, with the minimum samplesize being 40 cows. In assessing metabolite values the mean is sometimes important but thevariation from it, particularly the number of samples outside the reference ranges is morerelevant for interpretation [5]. This is shown as percentages in Figures la, lb, lc, Id and le.
Chile
China
Paraguay
Philippines
Sri Lanka
Thailand
Turkey
Uruguay
Viet Nam
mam
KBS59m •
• • • • • • • M B
D 2-3- months post-calving
• 1 month post-calving
H Pre-calving
20 40 60
Percentage of cases
80 100
FIG. la. Percentage offi-hydroxybutyrate values in blood plasma of dairy cows outside referencerange (> 0.6 mmol/L precalving; > 1.0 mmol/L postcalving [5]).
Chile
Paraguay
Sri Lanka
Thailand
Turkey
Viet Nam
• • • • •
•B
i
KB
D2-3- months post-calving
• 1m onth post-calving
• Pre-calving
20 40 60
Percentage of cases
80 100
FIG.lb. Percentage of urea values in blood plasma of dairy cows outside reference range (< 3.6mmol/L [5].
90

Chile W^KmBBIr
China H m B B
Mexico ^ • ' • • • l ^
1Paraguay ^ ^ ^ ^ ^ ^ W
Sri Lanka b — W
Venezuela F^^^^^
1
•
^ ^ ^ ^ ^ ^ ^ ^ ^Viet Nam ^ ^ ^ ^ ^ ^ ^ ^ ^ ^ ^ ™
• I
i
D 2-3-months post-calving
• 1 month post-calving
• Pre-calving
20 40 60
Percentage of cases
80 100
FIG. 1c. Percentage of albumin values in blood plasma of dairy cows outside reference range(<30g/L [5].
Chile
Mexico
Paraguay
-"hilippines
Turkey
Uruguay
Venezuela
Viet Nam
—a• G2-3- months post-calving
• 1 month post-calving
• Pre-calving
20 40 60
Percentage of cases
80 100
FIG. Id. Percentage of globulin values in blood plasma of dairy cows outside reference range (> 50g/L[5].
In nine countries, BHB was above the reference value in over one third of cows bloodsampled before calving (Figure la). This implies that negative energy balance in latepregnancy was widespread. In the Philippines there was a significant positive correlationbetween pre-calving BHB levels, BCS loss and body weight loss and interval from calving toconception. Paraguay showed a relationship between BHB pre-calving and calving to firstservice interval as well as better fertility in cows with higher BCS at calving. In five countriesBHB was above the reference value for lactating cows at one month calved in considerablepercentages of them (Figure la). The figures were highest in Sri Lanka and Thailand, whereBCS decrease and weight loss after calving was particularly marked. Half of the cows tested
91
in Sri Lanka still had high BHB values at 2-3 months after calving. In Turkey, some of thehighest individual BHB values were recorded at one month after calving together with markedBCS loss and some clinical cases of ketosis.
Chile
China
Thailand
Viet Nam
D 2-3-months post-calving
• 1 month post-calving
• Pre-calving
20 40 60
Percentage of cases
SO 100
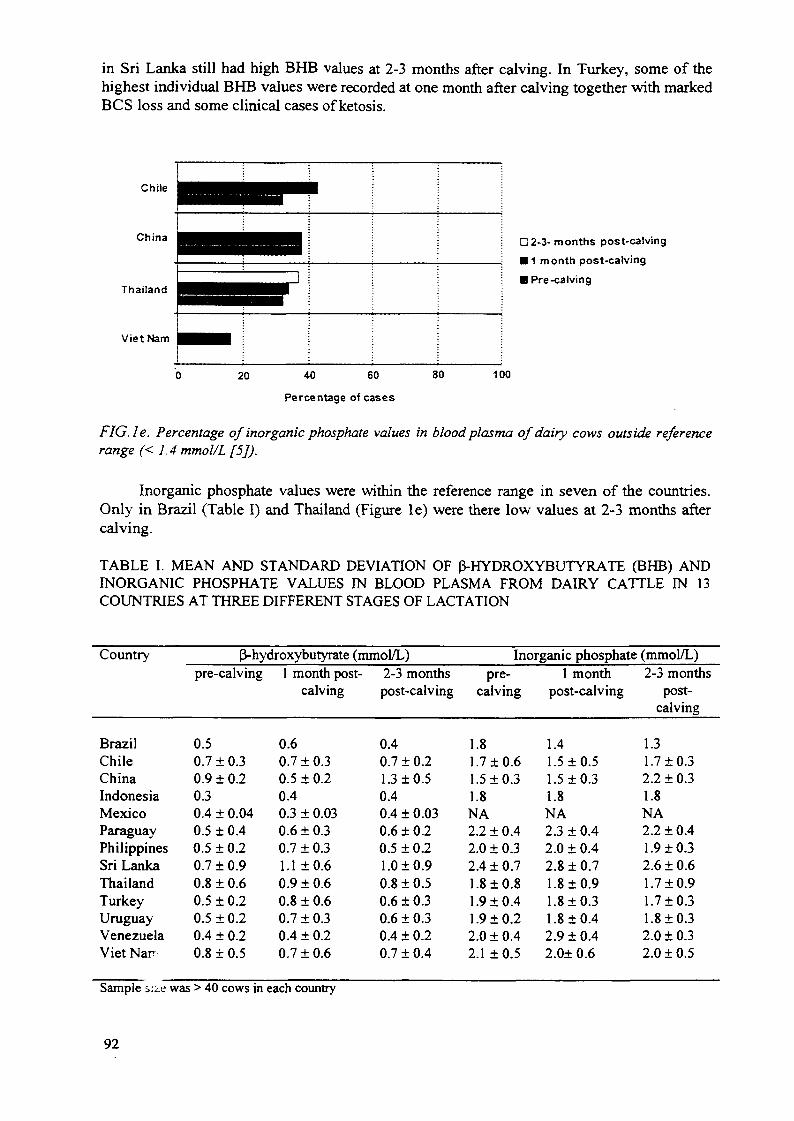
FIG.le. Percentage of inorganic phosphate values in blood plasma of dairy cows outside referencerange (< 1.4 mmol/L [5]).
Inorganic phosphate values were within the reference range in seven of the countries.Only in Brazil (Table I) and Thailand (Figure le) were there low values at 2-3 months aftercalving.
TABLE I. MEAN AND STANDARD DEVIATION OF p-HYDROXYBUTYRATE (BHB) ANDINORGANIC PHOSPHATE VALUES IN BLOOD PLASMA FROM DAIRY CATTLE IN 13COUNTRIES AT THREE DIFFERENT STAGES OF LACTATION
Country
BrazilChileChinaIndonesiaMexicoParaguayPhilippinesSri LankaThailandTurkeyUruguayVenezuelaViet Narr
{3-hydroxybutyrate (mmol/L)pre-calving
0.50.7 ± 0.30.9 ± 0.20.30.4 ± 0.040.5 ± 0.40.5 ± 0.20.7 ± 0.90.8 ± 0.60.5 ± 0.20.5 ± 0.20.4 ± 0.20.8 ± 0.5
1 month post-calving
0.60.7 ±0.30.5 ± 0.20.40.3 ± 0.030.6 ± 0.30.7 ± 0.31.1 ±0.60.9 ± 0.60.8 ± 0.60.7 ± 0.30.4 ± 0.20.7 ± 0.6
2-3 monthspost-calving
0.40.7 ±0.21.3 ±0.50.40.4 ± 0.030.6 ±0.20.5 ±0.21.0 ±0.90.8 ± 0.50.6 ±0.30.6 ± 0.30.4 ± 0.20.7 ± 0.4
Inorganic phosphate (mmol/L)pre-
calving
1.81.7 ±0.61.5 ±0.31.8NA2.2 ± 0.42.0 ± 0.32.4 ± 0.71.8 ±0.81.9 ±0.41.9 ±0.22.0 ± 0.42.1 ±0.5
1 monthpost-calving
1.41.5 ±0.51.5 ±0.31.8NA2.3 ± 0.42.0 ± 0.42.8 ±0.71.8 ±0.91.8 ±0.31.8 ±0.42.9 ±0.42.0± 0.6
2-3 monthspost-
calving
1.31.7 ±0.32.2 ± 0.31.8NA2.2 ± 0.41.9 ±0.32.6 ± 0.61.7 ±0.91.7 ±0.31.8 ±0.32.0 ± 0.32.0 ± 0.5
Sample s:/.e was > 40 cows in each country
92
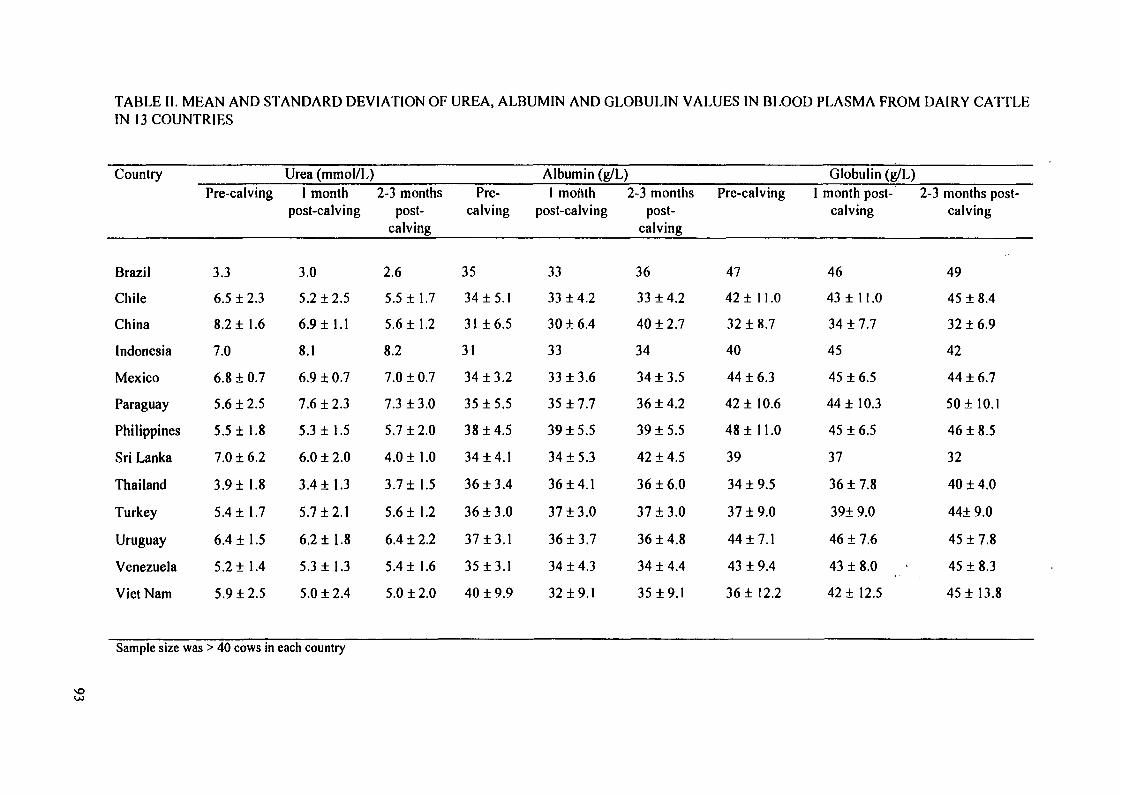
TABLE II. MEAN AND STANDARD DEVIATION OF UREA, ALBUMIN AND GLOBULIN VALUES IN BLOOD PLASMA FROM DAIRY CAITLEIN 13 COUNTRIES
Country
Brazil
Chile
China
Indonesia
Mexico
Paraguay
Philippines
Sri Lanka
Thailand
Turkey
Uruguay
Venezuela
Viet Nam
Pre-calving
3.3
6.5 ±2.3
8.2 ±1.6
7.0
6.810.7
5.6 ±2.5
5.5 ±1.8
7.0 ±6.2
3.9 ± 1.8
5.4 ±1.7
6.4 ± 1.5
5.2 ±1.4
5.9 ±2.5
Urea (mmol/L)1 month
post-calving
3.0
5.2 ±2.5
6.9 ±1.1
8.1
6.9 + 0.7
7.6 ± 2.3
5.3 ±1.5
6.0 ±2.0
3.4 ±1.3
5.7 ±2.1
6.2 ±1.8
5.3 ±1.3
5.0 ± 2.4
2-3 monthspost-
calving
2.6
5.5 ± 1.7
5.6 ±1.2
8.2
7.0 ± 0.7
7.3 ±3.0
5.7 ±2.0
4.0+1.0
3.7 ±1.5
5.6 ±1.2
6.4 ± 2.2
5.4 ±1.6
5.0 ±2.0
Pre-calving
35
34± 5.1
31 ±6.5
31
34 ±3.2
35 ±5.5
38 ±4.5
34 ±4.1
36 ±3.4
36 ±3.0
37 ±3.1
35 ± 3.1
40 ± 9.9
Albumin (g/L)1 moiith
post-calving
33
33 ± 4.2
30 ± 6.4
33
33 ±3.6
35 ±7.7
39 ±5.5
34 ±5.3
36 ±4.1
37 ±3.0
36 ±3.7
34 ± 4.3
32 ±9.1
2-3 monthspost-
calving
36
33 + 4.2
40 ± 2.7
34
34 ±3.5
36 ± 4.2
39 ±5.5
42 ± 4.5
36 ± 6.0
37 ±3.0
36 ±4.8
34 ± 4.4
35 ± 9.1
Pre-calving
47
42 ± 11.0
32 ± 8.7
40
44 ± 6.3
42 ±10.6
48 ±11.0
39
34 ±9.5
37 ± 9.0
44 + 7.1
43 ± 9.4
36 ± 12.2
Globulin (g/L)1 month post-
calving
46
43 ± 11.0
34 ± 7.7
45
45 ± 6.5
44 ±10.3
45 ± 6.5
37
36 ±7.8
39± 9.0
46 ± 7.6
43 ±8.0 •
42 ± 12.5
2-3 months post-calving
49
45 ± 8.4
32 ± 6.9
42
44 ± 6.7
50± 10.1
46 ± 8.5
32
40 ± 4.0
44± 9.0
45 ±7.8
45 ±8.3
45 ± 13.8
Sample size was > 40 cows in each country
In six countries (Chile, Mexico, Paraguay, Philippines, Uruguay and Venezuela)globulin values were high on all three sampling occasions in more than 17% of cows (FigureId). In Chile more than 25% of cows had high globulin values in every period and inParaguay so did nearly 50% by 2-3 months after calving. In a further two countries (Turkeyand Viet Nam) there was a similar percentage of high values on one or more occasions. Theseresults indicate the presence of significant chronic inflammatory disease in at least eight out ofthe thirteen countries. In Thailand, one of the countries without raised globulin results, meanhaemoglobin values of 8.9, 8.4 and 7.5 g/dL at the three sampling occasions respectively,suggested the. presence of blood parasitic disease as well - such as babesiosis or theileriosis. Inseven countries, albumin values were below the reference level in 16 to 49% of samples(Figure lc). In disease situations when globulin values go up albumin often goes down. Thiswas probably the explanation in Chile, Mexico, Paraguay, Venezuela and Viet Nam. Albuminlevels can also be affected by dietary protein supply but urea levels were only significantlylow in cattle in Viet Nam (Figure lb) of the seven countries where albumin was low. In VietNam therefore, dietary protein shortage was the more likely cause of low albumin levels.
Urea levels were low in up to 29% of cows tested in Viet Nam and up to 55% inThailand (Figure lb) and the group mean was below the reference range in Brazil (Table II).Only in these countries therefore was it likely that low dietary protein was a constraintproductivity. In four countries the mean urea value exceeded 6.7 mmol/L (Table II), the levelbelieved by Butler et al. [12] to be detrimental to fertility. Until the controversial question ofthe possible depressing influence of high blood urea on fertility is resolved, the significance ofthese results is uncertain but interestingly conception rates above 50% were reported inIndonesia where the highest blood urea values were seen.
Yaks in China were unlikely to be similar to other cattle in these studies and weretherefore given some separate consideration. Yaks calve in the spring and a large part ofpregnancy is during a long non-lactating period in the winter. If they do not become pregnantagain during the short summer breeding season, they stop lactating in the autumn and startagain the following summer. This second lactation produces about half the milk of onefollowing a calving. Their blood metabolite values showed high BHB levels before calving(Figure la) and a high percentage with low albumin results (Figure lc) but normal globulinlevels (Figure Id). This suggests considerable under-nutrition during the winter. Albuminvalues were still poor at one month after calving but were all within the reference range by 2-3months after calving. With the restoration of better nutritive status during the summer, BHBvalues were satisfactorily low at one month after calving but were high again later in lactation.This may have been due to seasonal change in grazing availability. Based on the metaboliteresults in late pregnancy, a trial was conducted to assess the value of supplementary feedingfrom December to April. Yaks were either fed no supplement (n = 41), oat hay (n = 30) orbarley straw (n = 33). In the following summer pregnancy rates were 54, 77 and 73%,respectively. The supplemented animals produced more milk per day, lactated for 29 and 25days longer, respectively and lost less weight. Unfortunately metabolite results were notavailable. Blood testing was not continued due to the great practical difficulty of obtainingsamples.
4. DISCUSSION
The use of metabolic profiles was pioneered in temperate climates in cows producingrelatively large amounts of milk and often under considerable nutritional stress. Cows have anability to adapt their output and their biochemistry to the food available. This applies inparticular to situations where energy supply is inadequate. Cows can experience a severe
94
energy constraint, adapt their output and end up a few weeks later much thinner, with lowmilk yield but also with BHB, glucose and non-esterified fatty acid levels in blood withinoptimum ranges because energy balance has been re-established. Even in temperate climateswith high producing cows it has been found necessary to control the timing of blood testswithin the productive cycle to identify periods of significant negative energy balance throughblood metabolite levels [5]. Frequent body condition scoring can provide the sameinformation but it does require frequency to measure change whereas the blood test -strategically timed - can provide the same information from one measurement.
Even in conditions in temperate climates with blood tests carried out on groups of cowswithin herds at similar stages of production and with careful timing within feeding season, itbecame apparent that other information than just metabolite values was essential to deriveconsistently useful and practical information for the benefit of farm productivity [4, 5]. Itbecame clear that the technique was most useful as an aid to management. It can provideinformation either not available by other means, not available with the same precision byother means or not available early enough within a season or calving pattern to enable helpfuladjustments to be made for the benefit of the majority of a herd. It is not unusual to find thatthe information derived from a metabolic profile is already suspected at the farm and by itsadvisers beforehand but is not being acted upon for a range of reasons, including a lack ofconviction. It is also common to find that the suspicions on the farm before the metabolicprofile is carried out are incorrect. So the value of confirming what constraints are not present(negative results) may be as important as those which are, because this allows intervention tobe precisely directed. In a research programme negative results are often considered torepresent failure and are rarely published. But they may be of just as much value to theadvance of scientific knowledge and its practical application.
In temperate climates assessment of metabolite values is made by looking at the groupmeans within each herd and the individual variations within the group. In parallel, level ofproduction, stage of lactation, BCS, body weight and feeding are taken into account. Thisallows judgements to be arrived at about the reasons for the individual variations in metabolitelevels. Comparisons are also made between groups within the herd at the time of the samplingadding to the strength of any conclusions. In this CRP, blood sampling of groups of cows atsimilar stages of production within a herd at the same time was not possible because farmersowned too few cows. But data were collected over time to assess changes both within andbetween measures representing nutrition, reproduction and production. Representative farmsof the smallholder type with similar nutritional management were included and the criteria forselecting cows within their productive cycle and within season were followed. With the datafrom BCS, body weight and milk yield as well, it has still been possible to use metaboliteresults in the CRP in a similar way to identify some constraints and demonstrate the absenceof some others.
The metabolite results in isolation showed that negative energy balance was present incows in late pregnancy in nine out of the 13 countries. With the non-lactating period intendedto be one of restoration of reserves and with the evidence that late pregnancy nutrition andBCS at calving can influence subsequent fertility [13, 14], interventions with supplementaryfeeding for a relatively short period before calving should be considered. Blood testing forBHB levels can be used as a means of identifying the presence of the risk and monitoring theeffectiveness of intervention. BCS change can provide similar information but it requiresmore than one visit whereas cows blood sampled two weeks before expected calving need tobe seen only once. With smaller percentages of high BHB values found in cows after calvingthere is a strong indication that it is the late pregnancy period which presents the bestopportunity for intervention.
95
The small number of projects where low urea levels was found, indicates the lesserimportance of dietary protein as a primary constraint compared to energy. The exceptionswere Brazil, Thailand and Viet Nam. In Brazil, protein may have been a primary constraint asBHB values were mainly within the reference range. But in Thailand and Viet Nam the largepercentage of cows with high BHB results, showing that dietary energy was constrainingas well, imply that the cows were short of food rather than a particular nutrient. The samejudgement applies to the yaks in winter and to the cows in Sri Lanka based on highpercentages of high BHB and low albumin results.
Measuring albumin level seems, with the exception of the yaks, to nave provided theleast useful information directly. But the assessment of globulin level, the difference betweentotal protein and albumin, has been very useful. With many of these above the reference rangein so many countries it is clear that disease was widespread and needs further investigation. Insome cases such as Chile, the cause of the high globulin and low albumin values was believedto be infection with Fasciola hepatica and treatments were initiated. But in many countriesthe presence of disease was not investigated before or after metabolite testing. So thesignificance of disease was not determined even though nutritional intervention strategieswere planned. This illustrates the need for research to take a broader view of potentialconstraints in case there is one not identified, such as disease, which prevents cowsresponding to supplementary feeding as anticipated.
Only a few countries showed low inorganic phosphate levels, suggesting that lowdietary phosphate levels were not widespread. In most cases where there were low values theywere only just below the reference range. In Thailand this may have indicated an inadequatetotal food intake as suggested by the BHB and urea results. In Brazil the only really lowphosphate figures were found at 2-3 months after calving which were just below the referencerange. This coincided with low urea values and may have been a reflection of the pastureavailability.
Yaks are untypical of the rest but the metabolite testing can be judged as being useful inthat it identified a period of specific nutritional constraint which, when action was taken,produced a productive and reproductive response. In spite of the practical difficulties in bloodsampling yaks, one sampling can be used to demonstrate an important point. Quite a largepercentage of yaks had low phosphate results in late pregnancy and at one month after calving(Figure le). The response to winter feeding with supplementary forage was such that lowdietary phosphate was unlikely to have been a primary constraint. These low blood phosphatelevels may be within the reference range for yaks. This illustrates that the blood sampling hadthe additional advantage of providing some needed base line data in this species.
The collection of blood required the presence of a trained person and in some studiesthere was some reluctance by farmers to allow it. This may have been partly because of lackof experience with the method of sampling, which can be undertaken without distressing thecow in any way according to the skill of the sampler and the effectiveness of the restraint ofthe cow. Since it is easier to collect milk samples, in the future metabolite testing might bedone on milk if methods of analysis are satisfactorily developed. But that approach would bevery limited compared to these studies because it would not reveal the main findings, thepresence of energy problems before calving and widespread chronic inflammatory disease.
5. CONCLUSIONS
Metabolite testing provided useful information showing the presence of poor energybalance before calving and the presence of disease and so helped to direct attention towardsareas of fruitful further investigations. It also provided information of a negative butnevertheless useful nature in demonstrating the rarity of dietary shortages of protein and
96
inorganic phosphate. But there were a few instances of shortages of these, nutrients as well, tobe identified. To make sure that important constraints are not overlooked and that otherconstraints are not erroneously assumed to be present, metabolite testing should continue to beused sporadically as part of multi-disciplinary dairy cow development programmes.
ACKNOWLEDGEMENTS
This work was all carried out with the support and encouragement of the AnimalProduction and Health Section, Joint FAO/IAEA Division, International Atomic EnergyAgency, Vienna, Austria. We would like to acknowledge also the enthusiasm, interest and co-operation of the participants in the CRP from Brazil, Chile, China, Indonesia, Mexico,Paraguay, Philippines, Sri Lanka, Thailand, Turkey, Uruguay, Venezuela and Viet Nam.
REFERENCES
[I] PAYNE, J. M., DEW, SALLY M., MANSTON, R., The use of a metabolic profile testin dairy herds, Vet. Rec. 87 (1970) 150-158.
[2] PARKER, B.N.J., BLOWEY, R., Investigations into the relationship of selected bloodcomponents to nutrition and fertility of the dairy cow under commercial conditions, Vet.Rec. 98 (1976) 394-404.
[3] BLOWEY, R., A practical application of metabolic profiles, Vet. Rec. 97 (1975) 324-327.
[4] KELLY, J.M., WHITAKER, D.A., SMITH, E.J., A dairy herd health and productivityservice, Br. Vet. J. 144 (1988) 470-481.
[5] WHITAKER, D.A., KELLY, J.M., EAYRES, H.F. Use and interpretation of metabolicprofiles in dairy cows, Department of Veterinary Clinical Studies, University ofEdinburgh (1995).
[6] BERTONI, G., CAPPA, V., II profilo metabolico nella vacca produzione di latte,Biochim. Clin. 8 (1984) 131-133.
[7] WITTWER, F., BOHMWALD, H., CONTRERAS, P., PHIL, M., FILOZA, J., Analisisde los resultados de perfiles metabolicos obtenidos en rebafios lecheros, Chile Arch.Med. Vet. 19 (2) (1987) 35-45.
[8] ANONYMOUS, Condition scoring-dairy cows, Advisory leaflet 100, East of ScotlandCollege of Agriculture, Edinburgh (1976).
[9] EDMONDSON, A., LEAN, I., WEAVER, L., FARVERJ., WEBSTER, G., A bodycondition scoring chart for Holstein dairy cows, J. Dairy Sci. 72 (1989) 68-78.
[10] PLAIZIER, J.C.B., "Validation of the FAO/IAEA RIA kit for the measurement ofprogesterone in skim milk and blood plasma", Improving the Productivity ofIndigenous African Livestock, IAEA-TECDOC-708, IAEA, Vienna (1993) 151-156.
[II] PREVENTIVE VETERINARY MEDICINE 38 (1999) (in press).[12] BUTLER, W.R., CALAMAN, J.J., BAM, S.W., Plasma and milk urea nitrogen in
relation to pregnancy rates in lactating dairy cattle, J. Anim. Sci. 74 (1996) 858-865.[13] WHITAKER, D.A., SMITH, E.J., DA ROSA, G.O., KELLY, J.M., Some effects of
nutrition and management on the fertility of dairy cattle, Vet. Rec. 133 (1993) 61-64.[14] WRIGHT, LA., RHIND, S.M., WHYTE, T.K., SMITH, A.J., Effects of body condition
at calving and feeding level after calving on LH profiles and the duration of the post-partum anoestrus period in beef cows, Anim. Prod. 55 (1992) 41-46.
97
Copyright © 2022 FDOKUMEN