Smallholder Crop Type Mapping and Rotation Monitoring in ...
18
Citation: Ren, T.; Xu, H.; Cai, X.; Yu, S.; Qi, J. Smallholder Crop Type Mapping and Rotation Monitoring in Mountainous Areas with Sentinel-1/2 Imagery. Remote Sens. 2022, 14, 566. https://doi.org/ 10.3390/rs14030566 Academic Editor: David M Johnson Received: 16 December 2021 Accepted: 21 January 2022 Published: 25 January 2022 Publisher’s Note: MDPI stays neutral with regard to jurisdictional claims in published maps and institutional affil- iations. Copyright: © 2022 by the authors. Licensee MDPI, Basel, Switzerland. This article is an open access article distributed under the terms and conditions of the Creative Commons Attribution (CC BY) license (https:// creativecommons.org/licenses/by/ 4.0/). remote sensing Article Smallholder Crop Type Mapping and Rotation Monitoring in Mountainous Areas with Sentinel-1/2 Imagery Tingting Ren 1,2 , Hongtao Xu 2 , Xiumin Cai 1 , Shengnan Yu 1 and Jiaguo Qi 1,3, * 1 Asia Hub, Nanjing Agricultural University, Nanjing 210095, China; [email protected] (T.R.); [email protected] (X.C.); [email protected] (S.Y.) 2 Inner Mongolia Academy of Agricultural and Animal Husbandry Sciences, Hohhot 010031, China; [email protected] 3 Center for Global Change & Earth Observations, Michigan State University, East Lansing, MI 48823, USA * Correspondence: [email protected]; Tel.: +86-136-9327-8045 Abstract: Accurate and timely crop type mapping and rotation monitoring play a critical role in crop yield estimation, soil management, and food supplies. To date, to our knowledge, accurate mapping of crop types remains challenging due to the intra-class variability of crops and labyrinthine natural conditions. The challenge is further complicated for smallholder farming systems in mountainous areas where field sizes are small and crop types are very diverse. This bottleneck issue makes it difficult and sometimes impossible to use remote sensing in monitoring crop rotation, a desired and required farm management policy in parts of China. This study integrated Sentinel-1 and Sentinel-2 images for crop type mapping and rotation monitoring in Inner Mongolia, China, with an extensive field-based survey dataset. We accomplished this work on the Google Earth Engine (GEE) platform. The results indicated that most crop types were mapped fairly accurately with an F1-score around 0.9 and a clear separation of crop types from one another. Sentinel-1 polarization achieved a better performance in wheat and rapeseed classification among different feature combinations, and Sentinel-2 spectral bands exhibited superiority in soybean and corn identification. Using the accurate crop type classification results, we identified crop fields, changed or unchanged, from 2017 to 2018. These findings suggest that the combination of Sentinel-1 and Sentinel-2 proved effective in crop type mapping and crop rotation monitoring of smallholder farms in labyrinthine mountain areas, allowing practical monitoring of crop rotations. Keywords: crop type mapping; crop rotation; Sentinel-1; Sentinel-2; Google Earth Engine; Inner Mongolia 1. Introduction Since the advent of satellite remote sensing, land cover classification has been an essential and active topic in land use science and agriculture [1,2]. With the increasing earth observation capabilities, many regional or global land cover products have been produced, such as GLC2000 [3], GlobeLand30 [4], and FROM-GLC10/30 [1,5]. These products contain cropland class but lack specific information on crop types [6,7]. In agricultural applications, accurate and timely crop type classification is vital for global food security, farming policy- making, and international food trading [8]. It is also a prerequisite for crop rotation, an emerging farming policy in China to prevent long-term land degradation [9]. Accurate crop type mapping is challenging due to spectral similarities and intra-class variability induced by crop diversity, environmental conditions, and farm practices [9–11]. Numerous satellites with various temporal and spatial resolutions have been launched in the past decades, such as Landsat, Sentinel, and Moderate Resolution Imaging Spectrora- diometer (MODIS). These satellite images could be categorized into low, medium, high, and very high spatial resolutions according to their pixel sizes in the range of large than 100 m, 10–100 m, 1–10 m, and less than 1 m, respectively [12,13]. Remote Sens. 2022, 14, 566. https://doi.org/10.3390/rs14030566 https://www.mdpi.com/journal/remotesensing
-
Upload
khangminh22 -
Category
Documents
-
view
0 -
download
0
Transcript of Smallholder Crop Type Mapping and Rotation Monitoring in ...
�����������������
Citation: Ren, T.; Xu, H.; Cai, X.; Yu,
S.; Qi, J. Smallholder Crop Type
Mapping and Rotation Monitoring in
Mountainous Areas with
Sentinel-1/2 Imagery. Remote Sens.
2022, 14, 566. https://doi.org/
10.3390/rs14030566
Academic Editor: David M Johnson
Received: 16 December 2021
Accepted: 21 January 2022
Published: 25 January 2022
Publisher’s Note: MDPI stays neutral
with regard to jurisdictional claims in
published maps and institutional affil-
iations.
Copyright: © 2022 by the authors.
Licensee MDPI, Basel, Switzerland.
This article is an open access article
distributed under the terms and
conditions of the Creative Commons
Attribution (CC BY) license (https://
creativecommons.org/licenses/by/
4.0/).
remote sensing
Article
Smallholder Crop Type Mapping and Rotation Monitoring inMountainous Areas with Sentinel-1/2 ImageryTingting Ren 1,2, Hongtao Xu 2, Xiumin Cai 1, Shengnan Yu 1 and Jiaguo Qi 1,3,*
1 Asia Hub, Nanjing Agricultural University, Nanjing 210095, China; [email protected] (T.R.);[email protected] (X.C.); [email protected] (S.Y.)
2 Inner Mongolia Academy of Agricultural and Animal Husbandry Sciences, Hohhot 010031, China;[email protected]
3 Center for Global Change & Earth Observations, Michigan State University, East Lansing, MI 48823, USA* Correspondence: [email protected]; Tel.: +86-136-9327-8045
Abstract: Accurate and timely crop type mapping and rotation monitoring play a critical role in cropyield estimation, soil management, and food supplies. To date, to our knowledge, accurate mappingof crop types remains challenging due to the intra-class variability of crops and labyrinthine naturalconditions. The challenge is further complicated for smallholder farming systems in mountainousareas where field sizes are small and crop types are very diverse. This bottleneck issue makes itdifficult and sometimes impossible to use remote sensing in monitoring crop rotation, a desiredand required farm management policy in parts of China. This study integrated Sentinel-1 andSentinel-2 images for crop type mapping and rotation monitoring in Inner Mongolia, China, with anextensive field-based survey dataset. We accomplished this work on the Google Earth Engine (GEE)platform. The results indicated that most crop types were mapped fairly accurately with an F1-scorearound 0.9 and a clear separation of crop types from one another. Sentinel-1 polarization achieved abetter performance in wheat and rapeseed classification among different feature combinations, andSentinel-2 spectral bands exhibited superiority in soybean and corn identification. Using the accuratecrop type classification results, we identified crop fields, changed or unchanged, from 2017 to 2018.These findings suggest that the combination of Sentinel-1 and Sentinel-2 proved effective in croptype mapping and crop rotation monitoring of smallholder farms in labyrinthine mountain areas,allowing practical monitoring of crop rotations.
Keywords: crop type mapping; crop rotation; Sentinel-1; Sentinel-2; Google Earth Engine; Inner Mongolia
1. Introduction
Since the advent of satellite remote sensing, land cover classification has been anessential and active topic in land use science and agriculture [1,2]. With the increasing earthobservation capabilities, many regional or global land cover products have been produced,such as GLC2000 [3], GlobeLand30 [4], and FROM-GLC10/30 [1,5]. These products containcropland class but lack specific information on crop types [6,7]. In agricultural applications,accurate and timely crop type classification is vital for global food security, farming policy-making, and international food trading [8]. It is also a prerequisite for crop rotation, anemerging farming policy in China to prevent long-term land degradation [9].
Accurate crop type mapping is challenging due to spectral similarities and intra-classvariability induced by crop diversity, environmental conditions, and farm practices [9–11].Numerous satellites with various temporal and spatial resolutions have been launched inthe past decades, such as Landsat, Sentinel, and Moderate Resolution Imaging Spectrora-diometer (MODIS). These satellite images could be categorized into low, medium, high,and very high spatial resolutions according to their pixel sizes in the range of large than100 m, 10–100 m, 1–10 m, and less than 1 m, respectively [12,13].
Remote Sens. 2022, 14, 566. https://doi.org/10.3390/rs14030566 https://www.mdpi.com/journal/remotesensing
Remote Sens. 2022, 14, 566 2 of 18
In the early 21st century, most crop type mapping mainly relied on low spatial res-olution data, such as MODIS and AVHRR [14]. However, small and fragmented cropfields with an area smaller than 2.56 hectares are widely distributed globally, and theyappear on satellite imagery as mixed pixels of different crop types [15,16]. After 2008,the freely available Landsat imagery was widely used in crop type mapping with 30 mspatial resolution [9,17]. The launch of 10 m Sentinel-2 satellite with high temporal res-olution resulted in further improvements in crop type mapping [18,19] and crop fieldboundary delineation [20]. Mazarire et al. [21] demonstrated the potential of Sentinel-2imagery with machine learning algorithms for mapping crop types in a heterogeneousagriculture landscape. Ibrahim et al. [22] performed crop type mapping and croppingsystem mapping with phenology and spectral-temporal metrics derived from Sentinel-2imagery. Because optical imagery is limited due to weather conditions, Sentinel-1 imagerywas considered a substitution for crop type mapping [23,24]. Although the combination ofSentinel-1 and Sentinel-2 has been applied for crop type classification, their potential formapping smallholder farming systems, particularly in mountainous areas, has not beenthoroughly tested [25]. The inability to accurately map crop types in small farm fieldshinders subsequent crop rotation assessment.
With abundant satellite image resources, a number of classification algorithms havebeen developed to map crop types, including phenology-based [26], decision tree (DT) [27],support vector machine (SVM) [28,29], random forest (RF) [24,30], convolutional neuralnetwork (CNN) [8,31], and other methods. These algorithms can be categorized into super-vised and unsupervised methods according to the dependency on training data [32]. Thephenology-based approaches rely on time series data and can be considered a particularcase in mapping crops such as winter wheat [26] or paddy rice [7,10]. Although unsuper-vised algorithms do not require ground-truthing training data, they are rarely used for croptype mapping due to the low accuracy [33,34]. At present, supervised algorithms are stillthe mainstream for crop type mapping, even though they rely extensively on ground truthdata [25]. Among supervised classification algorithms, the random forest was recognizedas one of the most efficient, accurate, and robust methods for crop type mapping, accordingto previous studies [35–39].
In addition to classification algorithm development in the past decades, effort wasalso made to enhance classification efficiency for timely mapping crop types. The advent ofcloud-based platforms such as Google Earth Engine (GEE) enables efficient crop type map-ping at large spatial scales [40]. For example, GEE has been successfully applied to croplandextraction [6,41–43], crop intensity mapping [44,45], crop type classification [23,46,47], andother land use or land cover change analyses [48,49]. However, few studies focused oncrop type mapping for smallholder farmlands with this powerful platform and subsequentcrop rotation analyses. For example, Liu et al. [50] only focused on small farmland parcelsbut did not further discriminate crop types. Although Jin et al. [23] performed smallholdermaize mapping in Kenya and Tanzania, crop area changes or rotations across years werenot explored.
The smalllholder farms, particularly in mountainous areas, often have complex crop-ping patterns, varying from year to year due to various reasons such as economic shocksand land use policies changes [50,51]. In addition to the crop pattern complexity, weatherconditions present another problem in crop type mapping with optical satellite images,particularly in mountainous areas where clouds often persist for an extended time period,especially in the growing season [52]. It is thus essential to develop alternatives to mapcrop types reliably and efficiently for complex smallholder farmlands.
Although efforts on land cover classification have made significant progress overthe past half a century, it remains challenging for accurate and timely mapping of croptypes. Most existing crop-type products have a 30 m resolution, such as the croplanddata layer (CDL) [53] and the Agriculture and Agri-Food Canada Annual Crop Inventory(AAFC/ACI) [54], and thus are not suitable for crop rotation assessments in smallholderareas. Machine learning algorithms have been widely used for crop type mapping, but
Remote Sens. 2022, 14, 566 3 of 18
the input features are still uncertain and vary greatly depending on geographic regions,crop types and climate conditions [8,23,46].Because of these challenges in mapping croptypes in complex smallholder farmlands, crop type rotations these areas are rarely reported,especially over large areas [55].
This study presented an approach for crop type mapping and subsequent rotationmonitoring in the northeast of China by integrating Sentinel-1 and Sentinel-2 images in 2017and 2018. The objectives of this study were to: (a) compare crop mapping algorithms, withdifferent spectral features and vegetation indices from Sentinel-2 images, and polarizationsfrom Sentinel-1 images to determine optimal feature combinations; (b) map primary croptypes (soybean, corn, wheat, and rapeseed) of smallholder farmlands; and (c) describe thecrop type dynamics and assess crop rotation between 2017 and 2018.
2. Data and Methods2.1. Study Area
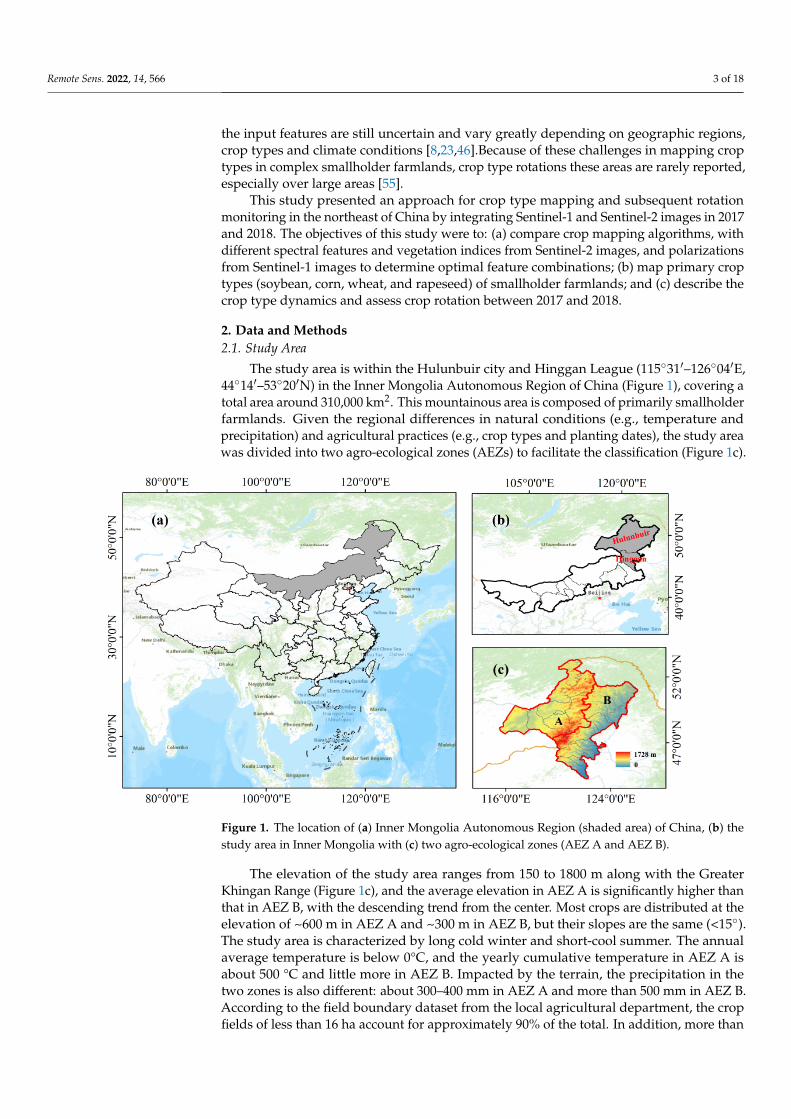
The study area is within the Hulunbuir city and Hinggan League (115◦31′–126◦04′E,44◦14′–53◦20′N) in the Inner Mongolia Autonomous Region of China (Figure 1), covering atotal area around 310,000 km2. This mountainous area is composed of primarily smallholderfarmlands. Given the regional differences in natural conditions (e.g., temperature andprecipitation) and agricultural practices (e.g., crop types and planting dates), the study areawas divided into two agro-ecological zones (AEZs) to facilitate the classification (Figure 1c).
Remote Sens. 2022, 14, x FOR PEER REVIEW 4 of 19
Figure 1. The location of (a) Inner Mongolia Autonomous Region (shaded area) of China, (b) the study area in Inner Mongolia with (c) two agro-ecological zones (AEZ A and AEZ B).
The main crop types in the study area include wheat, rapeseed, soybean, and corn [57–59]. Based on multiple-year field surveys (Figure 4) and historical studies [58,59], we found that wheat and rapeseed are mainly distributed in AEZ A, while soybean and corn are mostly in AEZ B. Limited rice fields could also be found in AEZ B. Therefore, in AEZ A, we focused on wheat and rapeseed crops, and in AZE B we focused on soybean, corn, and rice. From a management perspective, the local government has installed a crop rotation policy to improve crop production and land degradation prevention, which requires farmers to plant different crops each year [60]. Some farmers comply with the policy, but some do not because of various management and economic reasons [61].
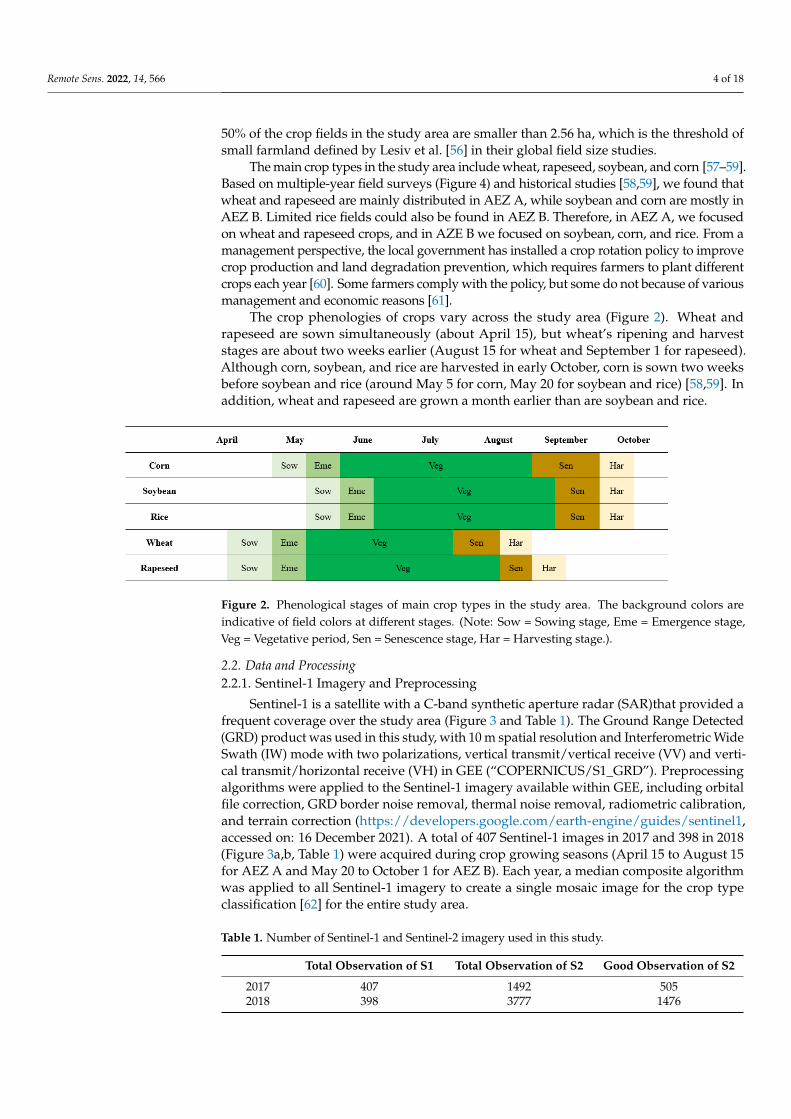
The crop phenologies of crops vary across the study area (Figure 2). Wheat and rapeseed are sown simultaneously (about April 15), but wheat’s ripening and harvest stages are about two weeks earlier (August 15 for wheat and September 1 for rapeseed). Although corn, soybean, and rice are harvested in early October, corn is sown two weeks before soybean and rice (around May 5 for corn, May 20 for soybean and rice) [58,59]. In addition, wheat and rapeseed are grown a month earlier than are soybean and rice.
Figure 2. Phenological stages of main crop types in the study area. The background colors are indicative of field colors at different stages. (Note: Sow = Sowing stage, Eme = Emergence stage, Veg = Vegetative period, Sen = Senescence stage, Har = Harvesting stage.).
2.2. Data and Processing 2.2.1. Sentinel-1 Imagery and Preprocessing
Figure 1. The location of (a) Inner Mongolia Autonomous Region (shaded area) of China, (b) thestudy area in Inner Mongolia with (c) two agro-ecological zones (AEZ A and AEZ B).
The elevation of the study area ranges from 150 to 1800 m along with the GreaterKhingan Range (Figure 1c), and the average elevation in AEZ A is significantly higher thanthat in AEZ B, with the descending trend from the center. Most crops are distributed at theelevation of ~600 m in AEZ A and ~300 m in AEZ B, but their slopes are the same (<15◦).The study area is characterized by long cold winter and short-cool summer. The annualaverage temperature is below 0°C, and the yearly cumulative temperature in AEZ A isabout 500 °C and little more in AEZ B. Impacted by the terrain, the precipitation in thetwo zones is also different: about 300–400 mm in AEZ A and more than 500 mm in AEZ B.According to the field boundary dataset from the local agricultural department, the cropfields of less than 16 ha account for approximately 90% of the total. In addition, more than
Remote Sens. 2022, 14, 566 4 of 18
50% of the crop fields in the study area are smaller than 2.56 ha, which is the threshold ofsmall farmland defined by Lesiv et al. [56] in their global field size studies.
The main crop types in the study area include wheat, rapeseed, soybean, and corn [57–59].Based on multiple-year field surveys (Figure 4) and historical studies [58,59], we found thatwheat and rapeseed are mainly distributed in AEZ A, while soybean and corn are mostly inAEZ B. Limited rice fields could also be found in AEZ B. Therefore, in AEZ A, we focusedon wheat and rapeseed crops, and in AZE B we focused on soybean, corn, and rice. From amanagement perspective, the local government has installed a crop rotation policy to improvecrop production and land degradation prevention, which requires farmers to plant differentcrops each year [60]. Some farmers comply with the policy, but some do not because of variousmanagement and economic reasons [61].
The crop phenologies of crops vary across the study area (Figure 2). Wheat andrapeseed are sown simultaneously (about April 15), but wheat’s ripening and harveststages are about two weeks earlier (August 15 for wheat and September 1 for rapeseed).Although corn, soybean, and rice are harvested in early October, corn is sown two weeksbefore soybean and rice (around May 5 for corn, May 20 for soybean and rice) [58,59]. Inaddition, wheat and rapeseed are grown a month earlier than are soybean and rice.
Remote Sens. 2022, 14, x FOR PEER REVIEW 4 of 19
Figure 1. The location of (a) Inner Mongolia Autonomous Region (shaded area) of China, (b) the study area in Inner Mongolia with (c) two agro-ecological zones (AEZ A and AEZ B).
The main crop types in the study area include wheat, rapeseed, soybean, and corn [57–59]. Based on multiple-year field surveys (Figure 4) and historical studies [58,59], we found that wheat and rapeseed are mainly distributed in AEZ A, while soybean and corn are mostly in AEZ B. Limited rice fields could also be found in AEZ B. Therefore, in AEZ A, we focused on wheat and rapeseed crops, and in AZE B we focused on soybean, corn, and rice. From a management perspective, the local government has installed a crop rotation policy to improve crop production and land degradation prevention, which requires farmers to plant different crops each year [60]. Some farmers comply with the policy, but some do not because of various management and economic reasons [61].
The crop phenologies of crops vary across the study area (Figure 2). Wheat and rapeseed are sown simultaneously (about April 15), but wheat’s ripening and harvest stages are about two weeks earlier (August 15 for wheat and September 1 for rapeseed). Although corn, soybean, and rice are harvested in early October, corn is sown two weeks before soybean and rice (around May 5 for corn, May 20 for soybean and rice) [58,59]. In addition, wheat and rapeseed are grown a month earlier than are soybean and rice.
Figure 2. Phenological stages of main crop types in the study area. The background colors are indicative of field colors at different stages. (Note: Sow = Sowing stage, Eme = Emergence stage, Veg = Vegetative period, Sen = Senescence stage, Har = Harvesting stage.).
2.2. Data and Processing 2.2.1. Sentinel-1 Imagery and Preprocessing
Figure 2. Phenological stages of main crop types in the study area. The background colors areindicative of field colors at different stages. (Note: Sow = Sowing stage, Eme = Emergence stage,Veg = Vegetative period, Sen = Senescence stage, Har = Harvesting stage.).
2.2. Data and Processing2.2.1. Sentinel-1 Imagery and Preprocessing
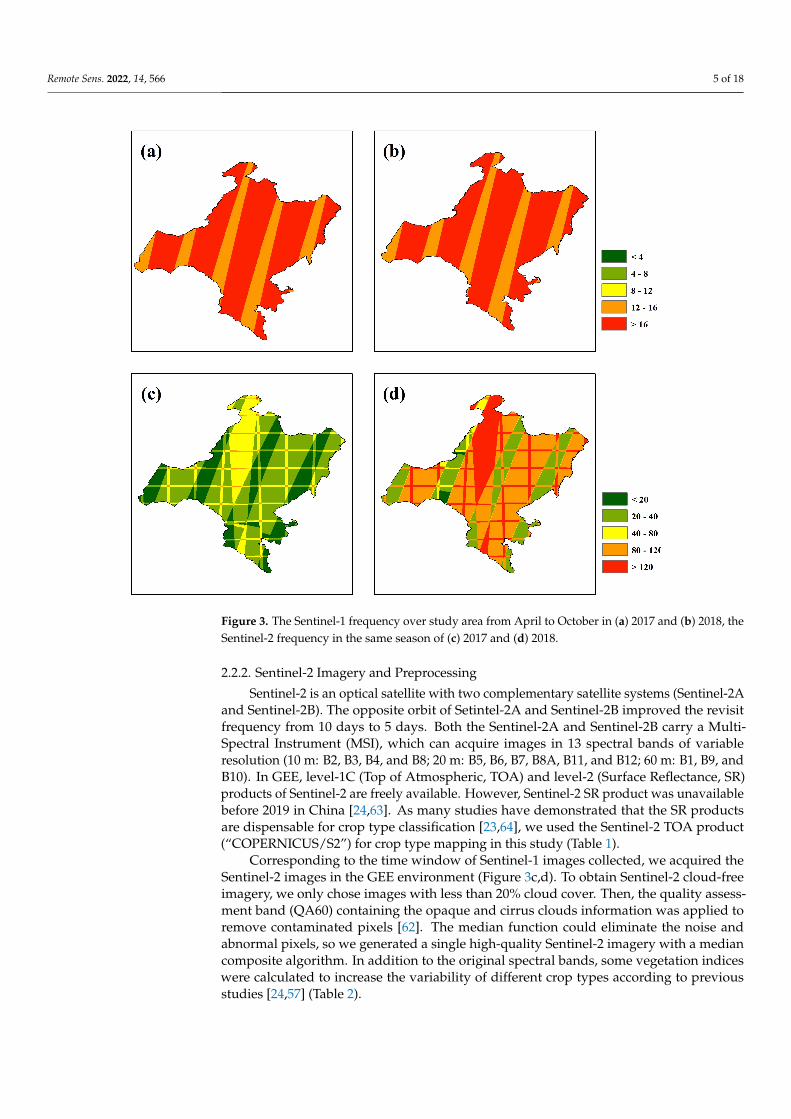
Sentinel-1 is a satellite with a C-band synthetic aperture radar (SAR)that provided afrequent coverage over the study area (Figure 3 and Table 1). The Ground Range Detected(GRD) product was used in this study, with 10 m spatial resolution and Interferometric WideSwath (IW) mode with two polarizations, vertical transmit/vertical receive (VV) and verti-cal transmit/horizontal receive (VH) in GEE (“COPERNICUS/S1_GRD”). Preprocessingalgorithms were applied to the Sentinel-1 imagery available within GEE, including orbitalfile correction, GRD border noise removal, thermal noise removal, radiometric calibration,and terrain correction (https://developers.google.com/earth-engine/guides/sentinel1,accessed on: 16 December 2021). A total of 407 Sentinel-1 images in 2017 and 398 in 2018(Figure 3a,b, Table 1) were acquired during crop growing seasons (April 15 to August 15for AEZ A and May 20 to October 1 for AEZ B). Each year, a median composite algorithmwas applied to all Sentinel-1 imagery to create a single mosaic image for the crop typeclassification [62] for the entire study area.
Table 1. Number of Sentinel-1 and Sentinel-2 imagery used in this study.
Total Observation of S1 Total Observation of S2 Good Observation of S2
2017 407 1492 5052018 398 3777 1476
Remote Sens. 2022, 14, 566 5 of 18
Remote Sens. 2022, 14, x FOR PEER REVIEW 5 of 19
Sentinel-1 is a satellite with a C-band synthetic aperture radar (SAR)that provided a frequent coverage over the study area (Figure 3 and Table 1). The Ground Range Detected (GRD) product was used in this study, with 10 m spatial resolution and Interferometric Wide Swath (IW) mode with two polarizations, vertical transmit/vertical receive (VV) and vertical transmit/horizontal receive (VH) in GEE (“COPERNICUS/S1_GRD”). Preprocessing algorithms were applied to the Sentinel-1 imagery available within GEE, including orbital file correction, GRD border noise removal, thermal noise removal, radiometric calibration, and terrain correction (https://developers.google.com/earth-engine/guides/sentinel1, accessed on: 16 December 2021). A total of 407 Sentinel-1 images in 2017 and 398 in 2018 (Figure 3a,b, Table 1) were acquired during crop growing seasons (April 15 to August 15 for AEZ A and May 20 to October 1 for AEZ B). Each year, a median composite algorithm was applied to all Sentinel-1 imagery to create a single mosaic image for the crop type classification [62] for the entire study area.
Figure 3. The Sentinel-1 frequency over study area from April to October in (a) 2017 and (b) 2018, the Sentinel-2 frequency in the same season of (c) 2017 and (d) 2018.
2.2.2. Sentinel-2 Imagery and Preprocessing Sentinel-2 is an optical satellite with two complementary satellite systems (Sentinel-
2A and Sentinel-2B). The opposite orbit of Setintel-2A and Sentinel-2B improved the revisit frequency from 10 days to 5 days. Both the Sentinel-2A and Sentinel-2B carry a Multi-Spectral Instrument (MSI), which can acquire images in 13 spectral bands of variable resolution (10 m: B2, B3, B4, and B8; 20 m: B5, B6, B7, B8A, B11, and B12; 60 m: B1, B9, and B10). In GEE, level-1C (Top of Atmospheric, TOA) and level-2 (Surface
Figure 3. The Sentinel-1 frequency over study area from April to October in (a) 2017 and (b) 2018, theSentinel-2 frequency in the same season of (c) 2017 and (d) 2018.
2.2.2. Sentinel-2 Imagery and Preprocessing
Sentinel-2 is an optical satellite with two complementary satellite systems (Sentinel-2Aand Sentinel-2B). The opposite orbit of Setintel-2A and Sentinel-2B improved the revisitfrequency from 10 days to 5 days. Both the Sentinel-2A and Sentinel-2B carry a Multi-Spectral Instrument (MSI), which can acquire images in 13 spectral bands of variableresolution (10 m: B2, B3, B4, and B8; 20 m: B5, B6, B7, B8A, B11, and B12; 60 m: B1, B9, andB10). In GEE, level-1C (Top of Atmospheric, TOA) and level-2 (Surface Reflectance, SR)products of Sentinel-2 are freely available. However, Sentinel-2 SR product was unavailablebefore 2019 in China [24,63]. As many studies have demonstrated that the SR productsare dispensable for crop type classification [23,64], we used the Sentinel-2 TOA product(“COPERNICUS/S2”) for crop type mapping in this study (Table 1).
Corresponding to the time window of Sentinel-1 images collected, we acquired theSentinel-2 images in the GEE environment (Figure 3c,d). To obtain Sentinel-2 cloud-freeimagery, we only chose images with less than 20% cloud cover. Then, the quality assess-ment band (QA60) containing the opaque and cirrus clouds information was applied toremove contaminated pixels [62]. The median function could eliminate the noise andabnormal pixels, so we generated a single high-quality Sentinel-2 imagery with a mediancomposite algorithm. In addition to the original spectral bands, some vegetation indiceswere calculated to increase the variability of different crop types according to previousstudies [24,57] (Table 2).
Remote Sens. 2022, 14, 566 6 of 18
Table 2. The vegetation indices used in this study and the corresponding formula.
VIs Full Name Formula Reference
EVI Enhanced Vegetation Index 2.5× (NIR− Red)/(NIR + 6× Red− 7.5× Blue + 1) [65]LSWI Land Surface Water Index (NIR − SWIR1)/(NIR + SWIR1) [66]NDVI Normalized Difference Vegetation Index (NIR − Red)/(NIR + Red) [67]NDYI Normalized Difference Yellow Index (Green − Blue)/(Green + Blue) [68]REP Red Edge Position 705 + 35 × (0.5 × (RE3 + Red) − RE1)/(RE2 − RE1) [69]
Note: SWIR1, NIR, RE3, RE2, RE1, Red, Green, and Blue are TOA reflectance of B11, B8, B7, B6, B5, B4, B3, B2 inTable 2. MSI sensor, respectively.
2.2.3. Cropland Layer Mask
In the study area, the proportion of cropland is much less than that of the forest,grassland, and other land cover types. To avoid the interference of non-cropland covertypes, we first masked out the non-cropland cover types before implementing crop typeclassification. The cropland extent product (https://search.earthdata.nasa.gov/, accessedon: 16 December 2021), Global Food Security-support Analysis Data at 30 m (GFSAD30),developed by Teluguntla et al. [41], was used to mask out croplands. The product obtainedmore than 94% overall accuracy over China with an independent ground truth data valida-tion. Although it was produced by the Landsat-7/8 imagery around 2015, it could also beused for cropland masks in 2017 and 2018 as the change of cropland is negligible withinseveral years [44,45] in the study area.
2.3. Crop Type Reference Data
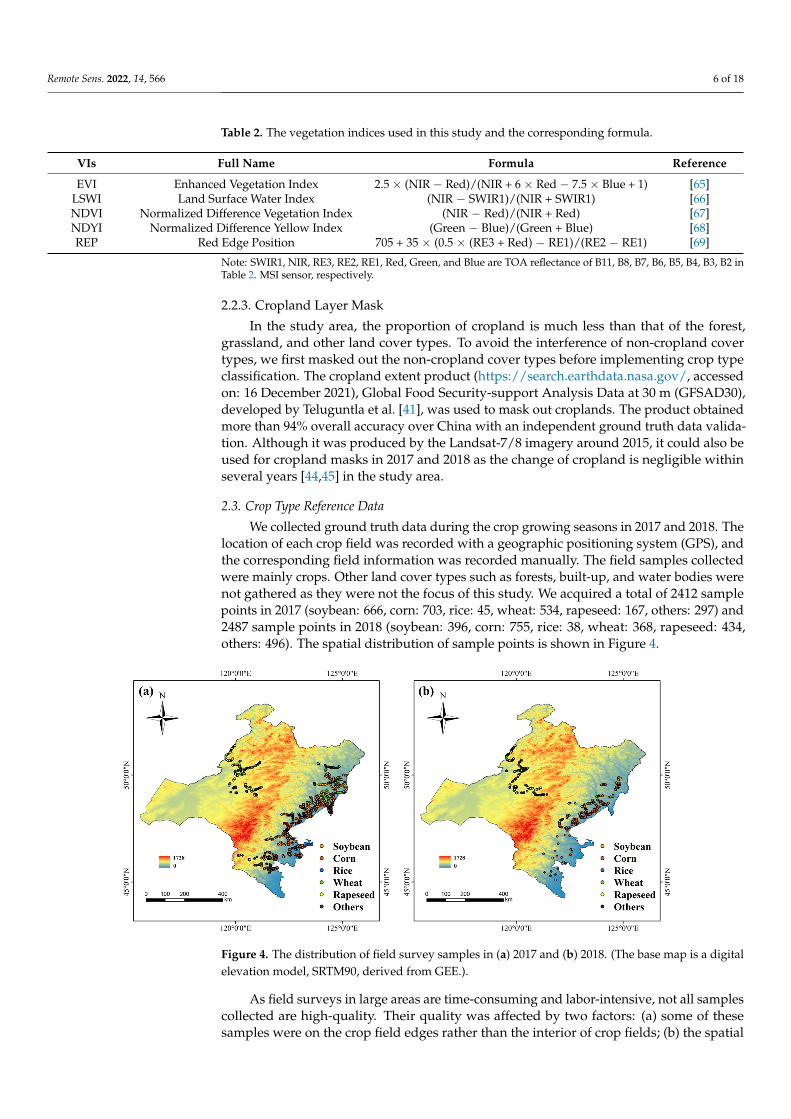
We collected ground truth data during the crop growing seasons in 2017 and 2018. Thelocation of each crop field was recorded with a geographic positioning system (GPS), andthe corresponding field information was recorded manually. The field samples collectedwere mainly crops. Other land cover types such as forests, built-up, and water bodies werenot gathered as they were not the focus of this study. We acquired a total of 2412 samplepoints in 2017 (soybean: 666, corn: 703, rice: 45, wheat: 534, rapeseed: 167, others: 297) and2487 sample points in 2018 (soybean: 396, corn: 755, rice: 38, wheat: 368, rapeseed: 434,others: 496). The spatial distribution of sample points is shown in Figure 4.
Remote Sens. 2022, 14, x FOR PEER REVIEW 7 of 19
2412 sample points in 2017 (soybean: 666, corn: 703, rice: 45, wheat: 534, rapeseed: 167, others: 297) and 2487 sample points in 2018 (soybean: 396, corn: 755, rice: 38, wheat: 368, rapeseed: 434, others: 496). The spatial distribution of sample points is shown in Figure 4.
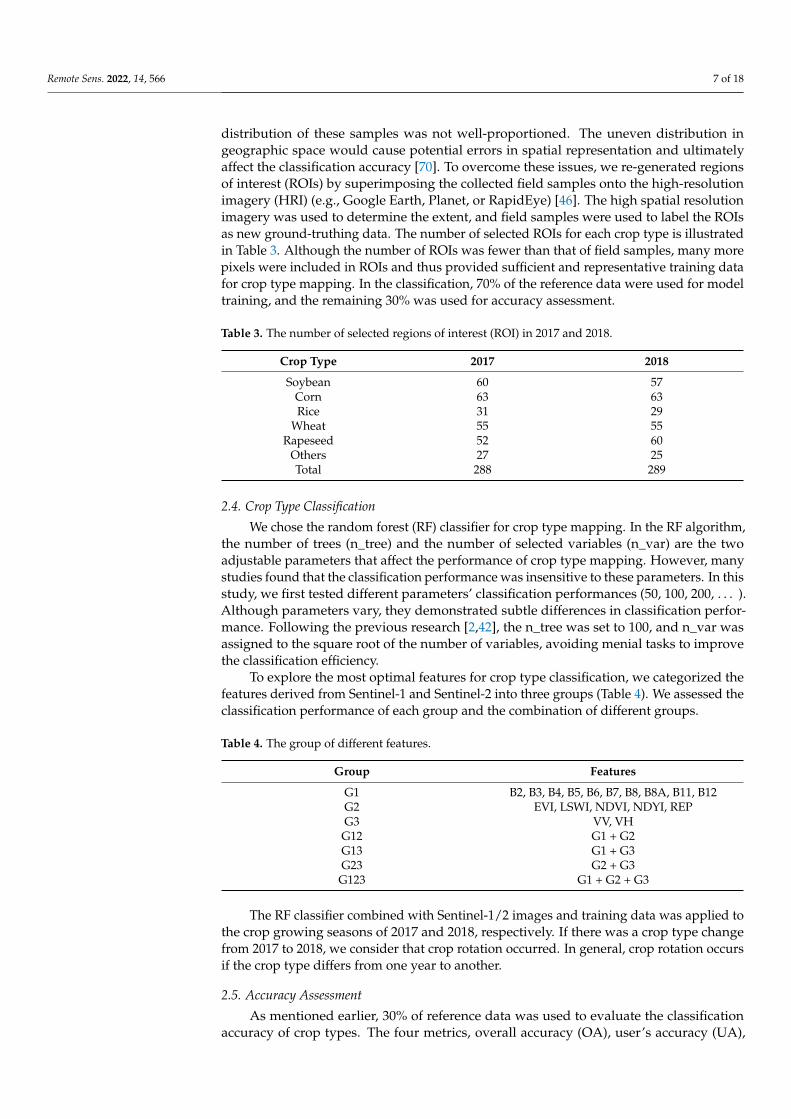
As field surveys in large areas are time-consuming and labor-intensive, not all samples collected are high-quality. Their quality was affected by two factors: (a) some of these samples were on the crop field edges rather than the interior of crop fields; (b) the spatial distribution of these samples was not well-proportioned. The uneven distribution in geographic space would cause potential errors in spatial representation and ultimately affect the classification accuracy [70]. To overcome these issues, we re-generated regions of interest (ROIs) by superimposing the collected field samples onto the high-resolution imagery (HRI) (e.g., Google Earth, Planet, or RapidEye) [46]. The high spatial resolution imagery was used to determine the extent, and field samples were used to label the ROIs as new ground-truthing data. The number of selected ROIs for each crop type is illustrated in Table 3. Although the number of ROIs was fewer than that of field samples, many more pixels were included in ROIs and thus provided sufficient and representative training data for crop type mapping. In the classification, 70% of the reference data were used for model training, and the remaining 30% was used for accuracy assessment.
Figure 4. The distribution of field survey samples in (a) 2017 and (b) 2018. (The base map is a digital elevation model, SRTM90, derived from GEE.).
Table 3. The number of selected regions of interest (ROI) in 2017 and 2018.
Crop type 2017 2018 Soybean 60 57
Corn 63 63 Rice 31 29
Wheat 55 55 Rapeseed 52 60
Others 27 25 Total 288 289
2.4. Crop Type Classification We chose the random forest (RF) classifier for crop type mapping. In the RF
algorithm, the number of trees (n_tree) and the number of selected variables (n_var) are the two adjustable parameters that affect the performance of crop type mapping. However, many studies found that the classification performance was insensitive to these parameters. In this study, we first tested different parameters' classification performances
Figure 4. The distribution of field survey samples in (a) 2017 and (b) 2018. (The base map is a digitalelevation model, SRTM90, derived from GEE.).
As field surveys in large areas are time-consuming and labor-intensive, not all samplescollected are high-quality. Their quality was affected by two factors: (a) some of thesesamples were on the crop field edges rather than the interior of crop fields; (b) the spatial
Remote Sens. 2022, 14, 566 7 of 18
distribution of these samples was not well-proportioned. The uneven distribution ingeographic space would cause potential errors in spatial representation and ultimatelyaffect the classification accuracy [70]. To overcome these issues, we re-generated regionsof interest (ROIs) by superimposing the collected field samples onto the high-resolutionimagery (HRI) (e.g., Google Earth, Planet, or RapidEye) [46]. The high spatial resolutionimagery was used to determine the extent, and field samples were used to label the ROIsas new ground-truthing data. The number of selected ROIs for each crop type is illustratedin Table 3. Although the number of ROIs was fewer than that of field samples, many morepixels were included in ROIs and thus provided sufficient and representative training datafor crop type mapping. In the classification, 70% of the reference data were used for modeltraining, and the remaining 30% was used for accuracy assessment.
Table 3. The number of selected regions of interest (ROI) in 2017 and 2018.
Crop Type 2017 2018
Soybean 60 57Corn 63 63Rice 31 29
Wheat 55 55Rapeseed 52 60
Others 27 25Total 288 289
2.4. Crop Type Classification
We chose the random forest (RF) classifier for crop type mapping. In the RF algorithm,the number of trees (n_tree) and the number of selected variables (n_var) are the twoadjustable parameters that affect the performance of crop type mapping. However, manystudies found that the classification performance was insensitive to these parameters. In thisstudy, we first tested different parameters’ classification performances (50, 100, 200, . . . ).Although parameters vary, they demonstrated subtle differences in classification perfor-mance. Following the previous research [2,42], the n_tree was set to 100, and n_var wasassigned to the square root of the number of variables, avoiding menial tasks to improvethe classification efficiency.
To explore the most optimal features for crop type classification, we categorized thefeatures derived from Sentinel-1 and Sentinel-2 into three groups (Table 4). We assessed theclassification performance of each group and the combination of different groups.
Table 4. The group of different features.
Group Features
G1 B2, B3, B4, B5, B6, B7, B8, B8A, B11, B12G2 EVI, LSWI, NDVI, NDYI, REPG3 VV, VH
G12 G1 + G2G13 G1 + G3G23 G2 + G3G123 G1 + G2 + G3
The RF classifier combined with Sentinel-1/2 images and training data was applied tothe crop growing seasons of 2017 and 2018, respectively. If there was a crop type changefrom 2017 to 2018, we consider that crop rotation occurred. In general, crop rotation occursif the crop type differs from one year to another.
2.5. Accuracy Assessment
As mentioned earlier, 30% of reference data was used to evaluate the classificationaccuracy of crop types. The four metrics, overall accuracy (OA), user’s accuracy (UA),
Remote Sens. 2022, 14, 566 8 of 18
producer’s accuracy (PA), and F1-score (Equation (1)), derived from the confusion matrixwere applied.
F1− scorei =2× PAi ×UAi
PAi + UAi(1)
where F1− scorei represents the F1-Score of class i. PAi and UAi represent the PA and UAof class i.
3. Results3.1. Sentinel Features in Crop Classification
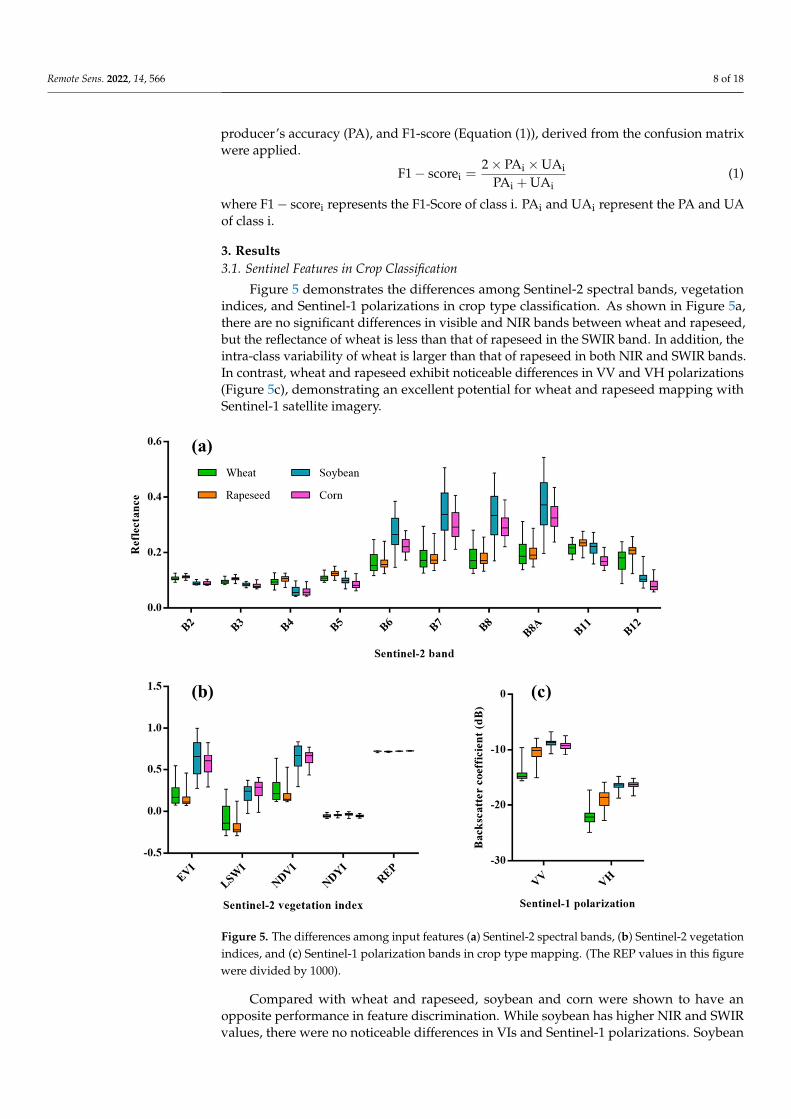
Figure 5 demonstrates the differences among Sentinel-2 spectral bands, vegetationindices, and Sentinel-1 polarizations in crop type classification. As shown in Figure 5a,there are no significant differences in visible and NIR bands between wheat and rapeseed,but the reflectance of wheat is less than that of rapeseed in the SWIR band. In addition, theintra-class variability of wheat is larger than that of rapeseed in both NIR and SWIR bands.In contrast, wheat and rapeseed exhibit noticeable differences in VV and VH polarizations(Figure 5c), demonstrating an excellent potential for wheat and rapeseed mapping withSentinel-1 satellite imagery.
Remote Sens. 2022, 14, x FOR PEER REVIEW 9 of 19
Figure 5. The differences among input features (a) Sentinel-2 spectral bands, (b) Sentinel-2 vegetation indices, and (c) Sentinel-1 polarization bands in crop type mapping. (The REP values in this figure were divided by 1000).
3.2. Classification Accuracy Assessment Figure 6 illustrates the classification performance with different feature combinations
in 2017 and 2018 over the two AEZs. In AEZ A, among three individual feature combinations (Sentinel-2 spectral bands, vegetation indices, and Sentinel-1 polarizations), Sentinel-1 polarizations exhibited good stability across different years (about 0.8 of OA). Sentinel-2 spectral bands alone also achieved an OA of ~80% in 2017, but it only had an OA of about 60% in 2018, which suggests uncertainty of Sentinel-2 bands in wheat and rapeseed classification. The performance of vegetation indices in wheat and rapeseed classification was the same as Sentinel-2 bands, but its OA was low.
Combining all features can achieve a high OA (82.43% in 2017, 86.98% in 2018), but the combination of Sentinel-2 spectral and Sentinel-1 polarizations makes a better performance for both years (85.97% and 88.07%). This combination also achieved a high OA (92.91% and 89.36%) in AEZ B. The high accuracy (92.99% and 88.71%) obtained by the Sentinel-2 bands alone suggests spectral bands derived from optical satellites play an essential role in soybean and rapeseed (crops distributed in AEZ A) mapping. The mapping of soybean and corn (crops distributed in AEZ B) was more accurate than the wheat and rapeseed due to the higher classification accuracy demonstrated in AEZ B.
Figure 5. The differences among input features (a) Sentinel-2 spectral bands, (b) Sentinel-2 vegetationindices, and (c) Sentinel-1 polarization bands in crop type mapping. (The REP values in this figurewere divided by 1000).
Compared with wheat and rapeseed, soybean and corn were shown to have anopposite performance in feature discrimination. While soybean has higher NIR and SWIRvalues, there were no noticeable differences in VIs and Sentinel-1 polarizations. Soybean
Remote Sens. 2022, 14, 566 9 of 18
and corn have higher values than wheat and rapeseed in all features except visible andSWIR bands. There was no significant difference in vegetation indices between wheat andrapeseed, and between soybean and corn (Figure 5b). It seems then that optical imageryhas better performance in soybean and corn discrimination, and SAR features have betterpotential in wheat and rapeseed identification.
3.2. Classification Accuracy Assessment
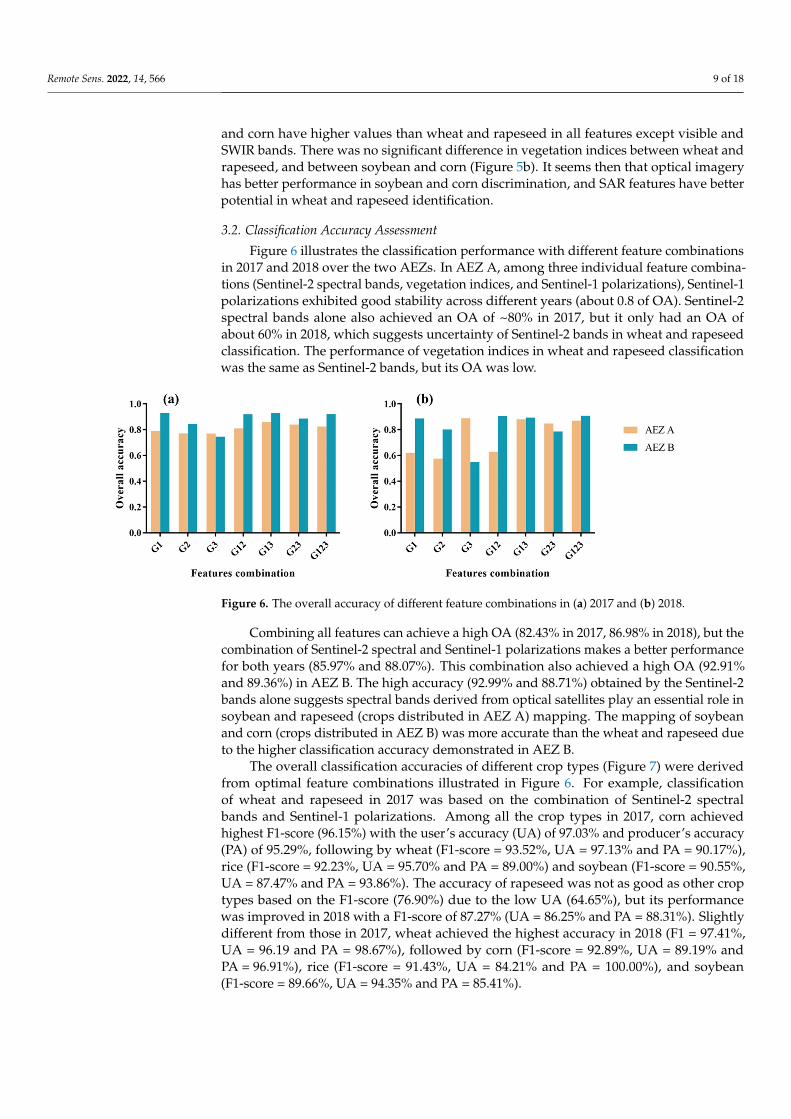
Figure 6 illustrates the classification performance with different feature combinationsin 2017 and 2018 over the two AEZs. In AEZ A, among three individual feature combina-tions (Sentinel-2 spectral bands, vegetation indices, and Sentinel-1 polarizations), Sentinel-1polarizations exhibited good stability across different years (about 0.8 of OA). Sentinel-2spectral bands alone also achieved an OA of ~80% in 2017, but it only had an OA ofabout 60% in 2018, which suggests uncertainty of Sentinel-2 bands in wheat and rapeseedclassification. The performance of vegetation indices in wheat and rapeseed classificationwas the same as Sentinel-2 bands, but its OA was low.
Remote Sens. 2022, 14, x FOR PEER REVIEW 10 of 19
Figure 6. The overall accuracy of different feature combinations in (a) 2017 and (b) 2018.
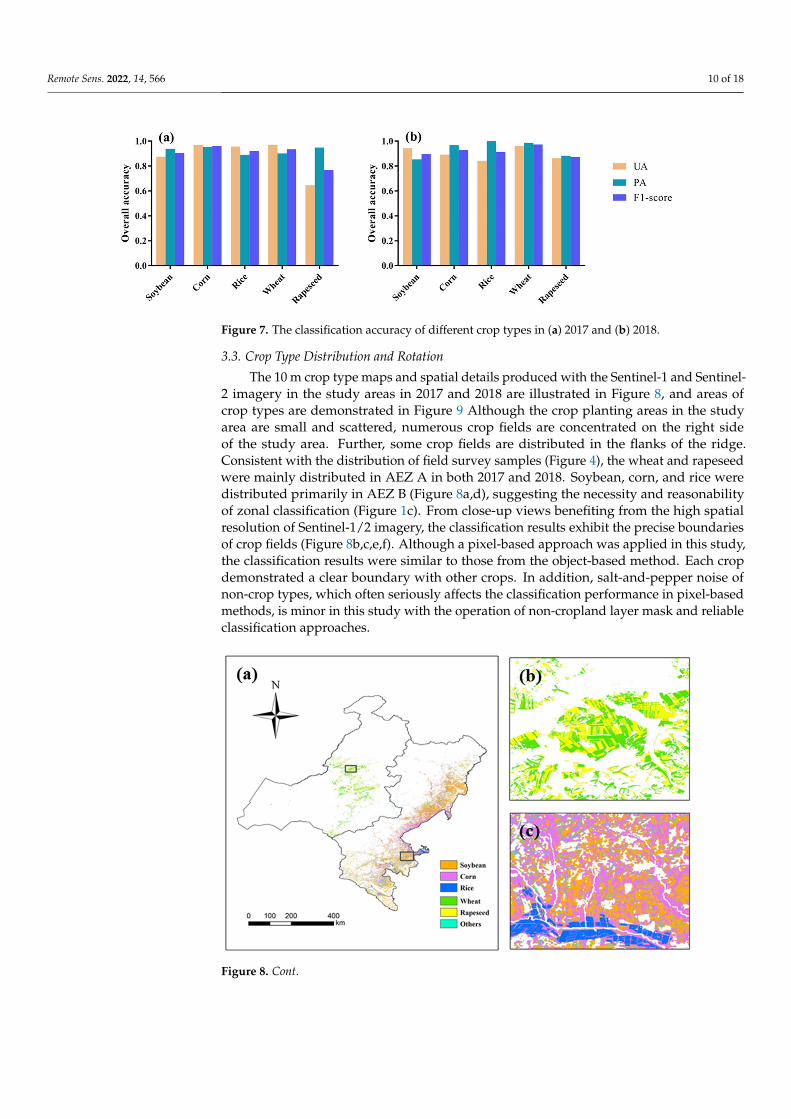
The overall classification accuracies of different crop types (Figure 7) were derived from optimal feature combinations illustrated in Figure 6. For example, classification of wheat and rapeseed in 2017 was based on the combination of Sentinel-2 spectral bands and Sentinel-1 polarizations. Among all the crop types in 2017, corn achieved highest F1-score (96.15%) with the user’s accuracy (UA) of 97.03% and producer’s accuracy (PA) of 95.29%, following by wheat (F1-score = 93.52%, UA = 97.13% and PA = 90.17%), rice (F1-score = 92.23%, UA = 95.70% and PA = 89.00%) and soybean (F1-score = 90.55%, UA = 87.47% and PA = 93.86%). The accuracy of rapeseed was not as good as other crop types based on the F1-score (76.90%) due to the low UA (64.65%), but its performance was improved in 2018 with a F1-score of 87.27% (UA = 86.25% and PA = 88.31%). Slightly different from those in 2017, wheat achieved the highest accuracy in 2018 (F1 = 97.41%, UA = 96.19 and PA = 98.67%), followed by corn (F1-score = 92.89%, UA = 89.19% and PA = 96.91%), rice (F1-score = 91.43%, UA = 84.21% and PA = 100.00%), and soybean (F1-score = 89.66%, UA = 94.35% and PA = 85.41%).
Figure 7. The classification accuracy of different crop types in (a) 2017 and (b) 2018.
3.3. Crop Type Distribution and Rotation The 10 m crop type maps and spatial details produced with the Sentinel-1 and
Sentinel-2 imagery in the study areas in 2017 and 2018 are illustrated in Figure 8, and areas of crop types are demonstrated in Figure 9 Although the crop planting areas in the study area are small and scattered, numerous crop fields are concentrated on the right side of the study area. Further, some crop fields are distributed in the flanks of the ridge. Consistent with the distribution of field survey samples (Figure 4), the wheat and rapeseed were mainly distributed in AEZ A in both 2017 and 2018. Soybean, corn, and rice were distributed primarily in AEZ B (Figure 8a,d), suggesting the necessity and reasonability of zonal classification (Figure 1c). From close-up views benefiting from the high spatial resolution of Sentinel-1/2 imagery, the classification results exhibit the precise
Figure 6. The overall accuracy of different feature combinations in (a) 2017 and (b) 2018.
Combining all features can achieve a high OA (82.43% in 2017, 86.98% in 2018), but thecombination of Sentinel-2 spectral and Sentinel-1 polarizations makes a better performancefor both years (85.97% and 88.07%). This combination also achieved a high OA (92.91%and 89.36%) in AEZ B. The high accuracy (92.99% and 88.71%) obtained by the Sentinel-2bands alone suggests spectral bands derived from optical satellites play an essential role insoybean and rapeseed (crops distributed in AEZ A) mapping. The mapping of soybeanand corn (crops distributed in AEZ B) was more accurate than the wheat and rapeseed dueto the higher classification accuracy demonstrated in AEZ B.
The overall classification accuracies of different crop types (Figure 7) were derivedfrom optimal feature combinations illustrated in Figure 6. For example, classificationof wheat and rapeseed in 2017 was based on the combination of Sentinel-2 spectralbands and Sentinel-1 polarizations. Among all the crop types in 2017, corn achievedhighest F1-score (96.15%) with the user’s accuracy (UA) of 97.03% and producer’s accuracy(PA) of 95.29%, following by wheat (F1-score = 93.52%, UA = 97.13% and PA = 90.17%),rice (F1-score = 92.23%, UA = 95.70% and PA = 89.00%) and soybean (F1-score = 90.55%,UA = 87.47% and PA = 93.86%). The accuracy of rapeseed was not as good as other croptypes based on the F1-score (76.90%) due to the low UA (64.65%), but its performancewas improved in 2018 with a F1-score of 87.27% (UA = 86.25% and PA = 88.31%). Slightlydifferent from those in 2017, wheat achieved the highest accuracy in 2018 (F1 = 97.41%,UA = 96.19 and PA = 98.67%), followed by corn (F1-score = 92.89%, UA = 89.19% andPA = 96.91%), rice (F1-score = 91.43%, UA = 84.21% and PA = 100.00%), and soybean(F1-score = 89.66%, UA = 94.35% and PA = 85.41%).
Remote Sens. 2022, 14, 566 10 of 18
Remote Sens. 2022, 14, x FOR PEER REVIEW 10 of 19
Figure 6. The overall accuracy of different feature combinations in (a) 2017 and (b) 2018.
The overall classification accuracies of different crop types (Figure 7) were derived from optimal feature combinations illustrated in Figure 6. For example, classification of wheat and rapeseed in 2017 was based on the combination of Sentinel-2 spectral bands and Sentinel-1 polarizations. Among all the crop types in 2017, corn achieved highest F1-score (96.15%) with the user’s accuracy (UA) of 97.03% and producer’s accuracy (PA) of 95.29%, following by wheat (F1-score = 93.52%, UA = 97.13% and PA = 90.17%), rice (F1-score = 92.23%, UA = 95.70% and PA = 89.00%) and soybean (F1-score = 90.55%, UA = 87.47% and PA = 93.86%). The accuracy of rapeseed was not as good as other crop types based on the F1-score (76.90%) due to the low UA (64.65%), but its performance was improved in 2018 with a F1-score of 87.27% (UA = 86.25% and PA = 88.31%). Slightly different from those in 2017, wheat achieved the highest accuracy in 2018 (F1 = 97.41%, UA = 96.19 and PA = 98.67%), followed by corn (F1-score = 92.89%, UA = 89.19% and PA = 96.91%), rice (F1-score = 91.43%, UA = 84.21% and PA = 100.00%), and soybean (F1-score = 89.66%, UA = 94.35% and PA = 85.41%).
Figure 7. The classification accuracy of different crop types in (a) 2017 and (b) 2018.
3.3. Crop Type Distribution and Rotation The 10 m crop type maps and spatial details produced with the Sentinel-1 and
Sentinel-2 imagery in the study areas in 2017 and 2018 are illustrated in Figure 8, and areas of crop types are demonstrated in Figure 9 Although the crop planting areas in the study area are small and scattered, numerous crop fields are concentrated on the right side of the study area. Further, some crop fields are distributed in the flanks of the ridge. Consistent with the distribution of field survey samples (Figure 4), the wheat and rapeseed were mainly distributed in AEZ A in both 2017 and 2018. Soybean, corn, and rice were distributed primarily in AEZ B (Figure 8a,d), suggesting the necessity and reasonability of zonal classification (Figure 1c). From close-up views benefiting from the high spatial resolution of Sentinel-1/2 imagery, the classification results exhibit the precise
Figure 7. The classification accuracy of different crop types in (a) 2017 and (b) 2018.
3.3. Crop Type Distribution and Rotation
The 10 m crop type maps and spatial details produced with the Sentinel-1 and Sentinel-2 imagery in the study areas in 2017 and 2018 are illustrated in Figure 8, and areas ofcrop types are demonstrated in Figure 9 Although the crop planting areas in the studyarea are small and scattered, numerous crop fields are concentrated on the right sideof the study area. Further, some crop fields are distributed in the flanks of the ridge.Consistent with the distribution of field survey samples (Figure 4), the wheat and rapeseedwere mainly distributed in AEZ A in both 2017 and 2018. Soybean, corn, and rice weredistributed primarily in AEZ B (Figure 8a,d), suggesting the necessity and reasonabilityof zonal classification (Figure 1c). From close-up views benefiting from the high spatialresolution of Sentinel-1/2 imagery, the classification results exhibit the precise boundariesof crop fields (Figure 8b,c,e,f). Although a pixel-based approach was applied in this study,the classification results were similar to those from the object-based method. Each cropdemonstrated a clear boundary with other crops. In addition, salt-and-pepper noise ofnon-crop types, which often seriously affects the classification performance in pixel-basedmethods, is minor in this study with the operation of non-cropland layer mask and reliableclassification approaches.
Remote Sens. 2022, 14, x FOR PEER REVIEW 11 of 19
boundaries of crop fields (Figure 8b,c,e,f). Although a pixel-based approach was applied in this study, the classification results were similar to those from the object-based method. Each crop demonstrated a clear boundary with other crops. In addition, salt-and-pepper noise of non-crop types, which often seriously affects the classification performance in pixel-based methods, is minor in this study with the operation of non-cropland layer mask and reliable classification approaches.
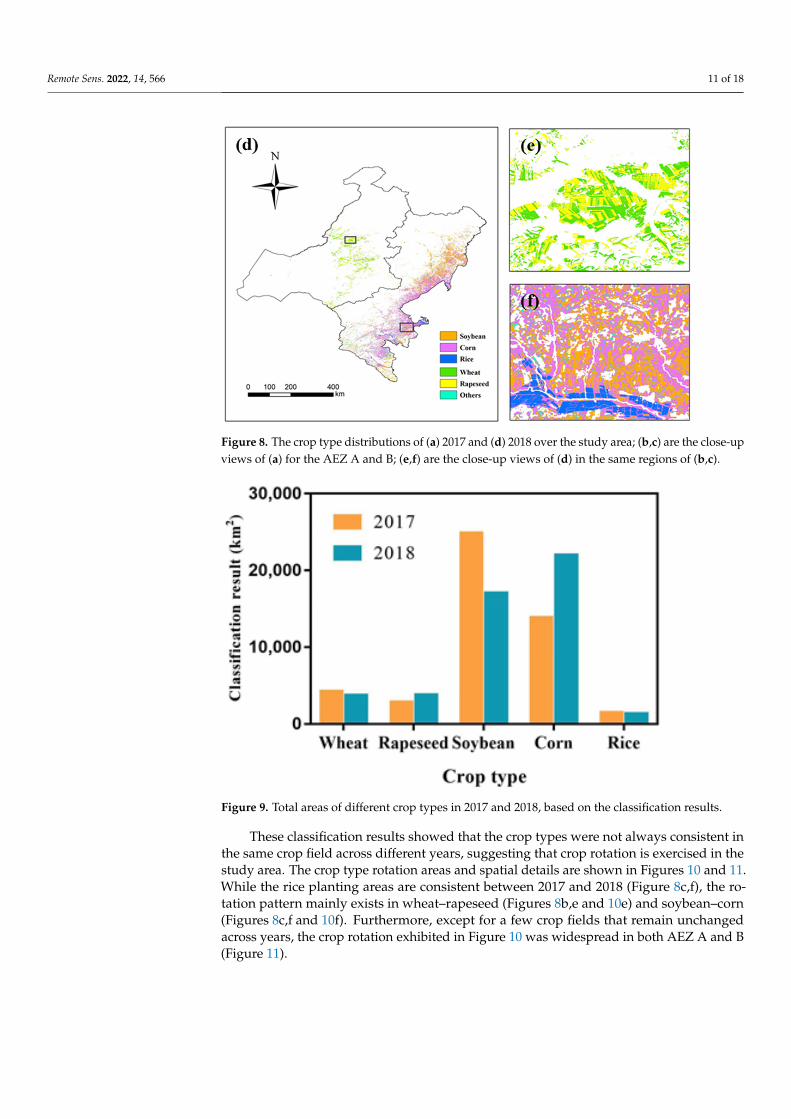
Figure 8. The crop type distributions of (a) 2017 and (d) 2018 over the study area; (b,c) are the close-up views of (a) for the AEZ A and B; (e,f) are the close-up views of (d) in the same regions of (b,c).
Figure 8. Cont.
Remote Sens. 2022, 14, 566 11 of 18
Remote Sens. 2022, 14, x FOR PEER REVIEW 11 of 19
boundaries of crop fields (Figure 8b,c,e,f). Although a pixel-based approach was applied in this study, the classification results were similar to those from the object-based method. Each crop demonstrated a clear boundary with other crops. In addition, salt-and-pepper noise of non-crop types, which often seriously affects the classification performance in pixel-based methods, is minor in this study with the operation of non-cropland layer mask and reliable classification approaches.
Figure 8. The crop type distributions of (a) 2017 and (d) 2018 over the study area; (b,c) are the close-up views of (a) for the AEZ A and B; (e,f) are the close-up views of (d) in the same regions of (b,c).
Figure 8. The crop type distributions of (a) 2017 and (d) 2018 over the study area; (b,c) are the close-upviews of (a) for the AEZ A and B; (e,f) are the close-up views of (d) in the same regions of (b,c).
Remote Sens. 2022, 14, x FOR PEER REVIEW 12 of 19
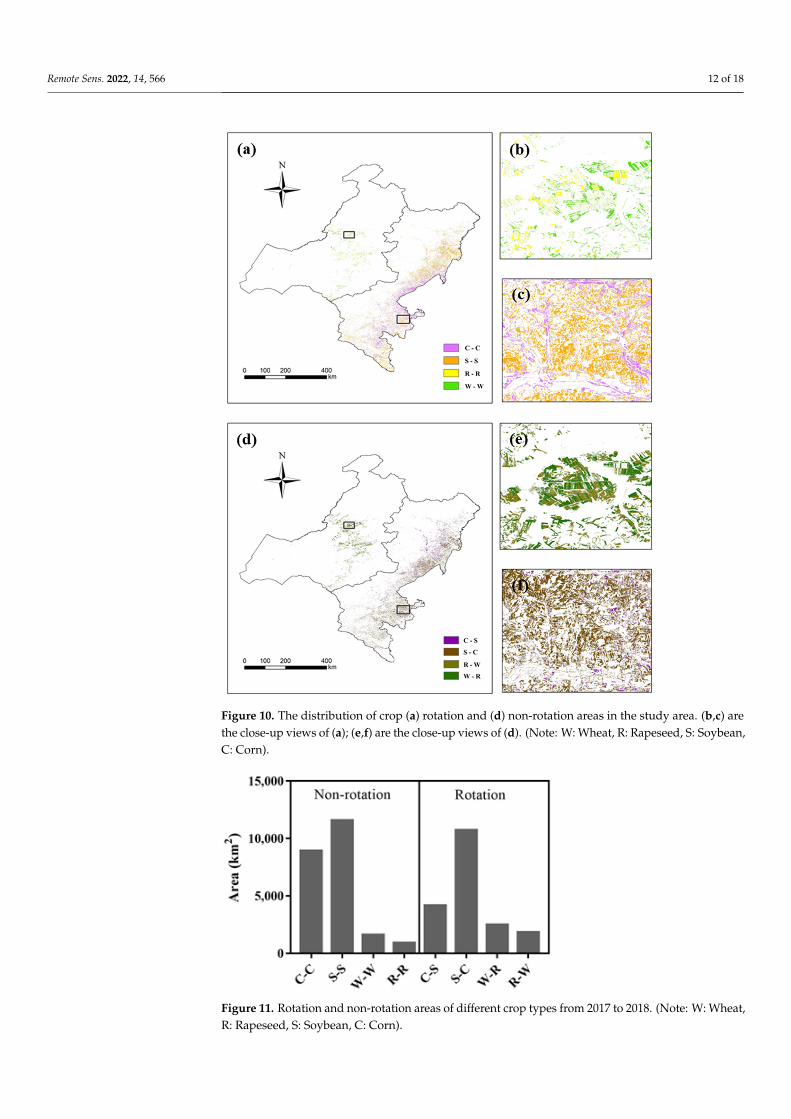
Figure 9. Total areas of different crop types in 2017 and 2018, based on the classification results.
These classification results showed that the crop types were not always consistent in the same crop field across different years, suggesting that crop rotation is exercised in the study area. The crop type rotation areas and spatial details are shown in Figures 10 and 11. While the rice planting areas are consistent between 2017 and 2018 (Figure 8c,f), the rotation pattern mainly exists in wheat–rapeseed (Figures 8b,e and 10e) and soybean–corn (Figures 8c,f and 10f). Furthermore, except for a few crop fields that remain unchanged across years, the crop rotation exhibited in Figure 10 was widespread in both AEZ A and B (Figure 11).
Figure 9. Total areas of different crop types in 2017 and 2018, based on the classification results.
These classification results showed that the crop types were not always consistent inthe same crop field across different years, suggesting that crop rotation is exercised in thestudy area. The crop type rotation areas and spatial details are shown in Figures 10 and 11.While the rice planting areas are consistent between 2017 and 2018 (Figure 8c,f), the ro-tation pattern mainly exists in wheat–rapeseed (Figures 8b,e and 10e) and soybean–corn(Figures 8c,f and 10f). Furthermore, except for a few crop fields that remain unchangedacross years, the crop rotation exhibited in Figure 10 was widespread in both AEZ A and B(Figure 11).
Remote Sens. 2022, 14, 566 12 of 18Remote Sens. 2022, 14, x FOR PEER REVIEW 13 of 19
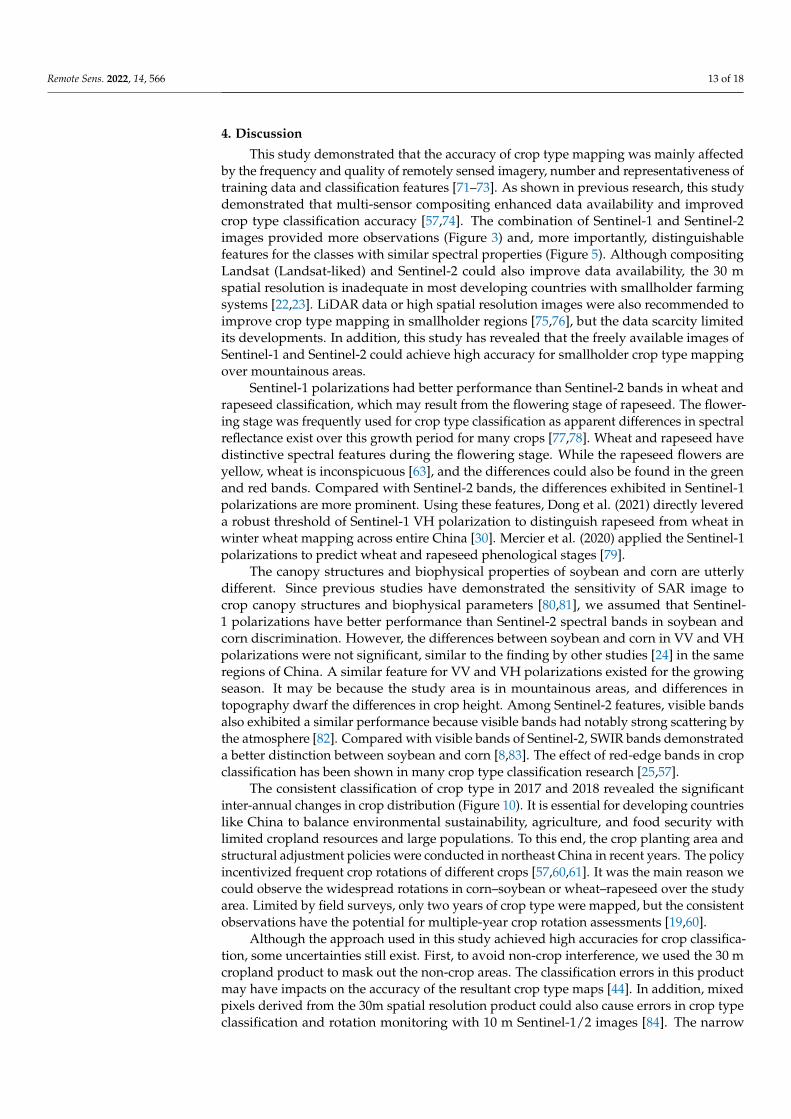
Figure 10. The distribution of crop (a) rotation and (d) non-rotation areas in the study area. (b,c) are the close-up views of (a); (e,f) are the close-up views of (d). (Note: W: Wheat, R: Rapeseed, S: Soybean, C: Corn).
Figure 10. The distribution of crop (a) rotation and (d) non-rotation areas in the study area. (b,c) arethe close-up views of (a); (e,f) are the close-up views of (d). (Note: W: Wheat, R: Rapeseed, S: Soybean,C: Corn).
Remote Sens. 2022, 14, x FOR PEER REVIEW 14 of 19
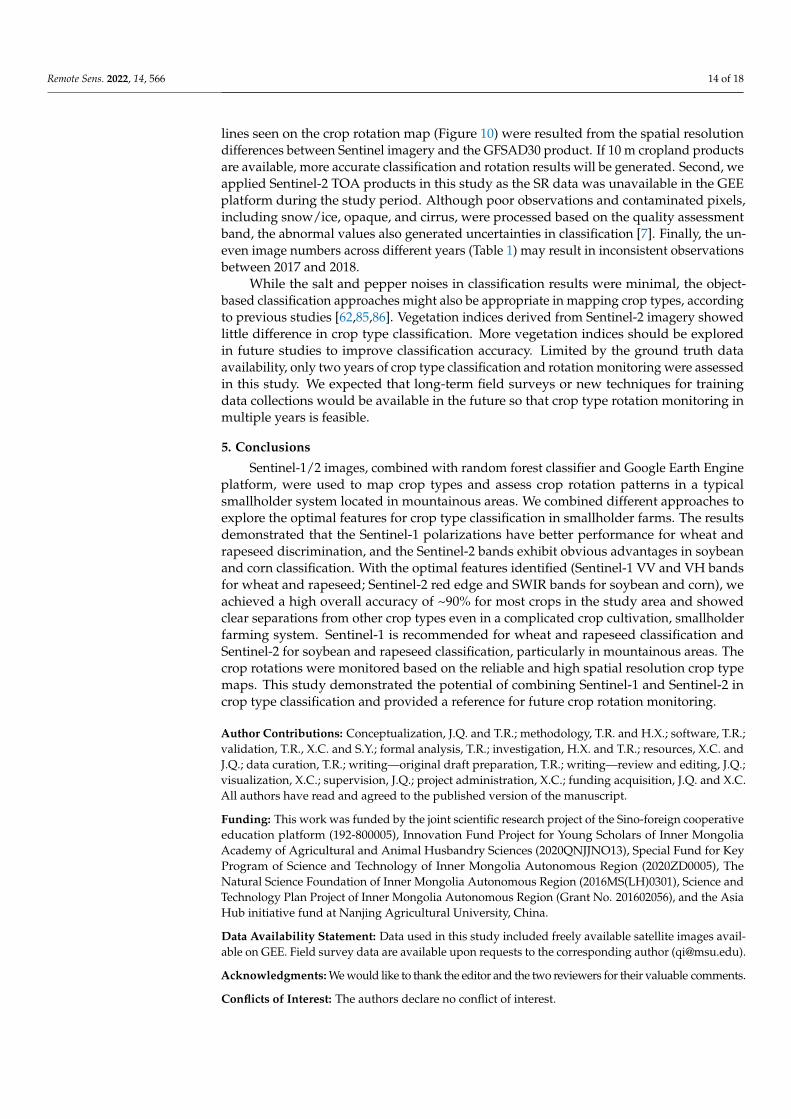
Figure 11. Rotation and non-rotation areas of different crop types from 2017 to 2018. (Note: W: Wheat, R: Rapeseed, S: Soybean, C: Corn).
4. Discussion This study demonstrated that the accuracy of crop type mapping was mainly affected
by the frequency and quality of remotely sensed imagery, number and representativeness of training data and classification features [71–73]. As shown in previous research, this study demonstrated that multi-sensor compositing enhanced data availability and improved crop type classification accuracy [57,74]. The combination of Sentinel-1 and Sentinel-2 images provided more observations (Figure 3) and, more importantly, distinguishable features for the classes with similar spectral properties (Figure 5). Although compositing Landsat (Landsat-liked) and Sentinel-2 could also improve data availability, the 30 m spatial resolution is inadequate in most developing countries with smallholder farming systems [22,23]. LiDAR data or high spatial resolution images were also recommended to improve crop type mapping in smallholder regions [75,76], but the data scarcity limited its developments. In addition, this study has revealed that the freely available images of Sentinel-1 and Sentinel-2 could achieve high accuracy for smallholder crop type mapping over mountainous areas.
Sentinel-1 polarizations had better performance than Sentinel-2 bands in wheat and rapeseed classification, which may result from the flowering stage of rapeseed. The flowering stage was frequently used for crop type classification as apparent differences in spectral reflectance exist over this growth period for many crops [77,78]. Wheat and rapeseed have distinctive spectral features during the flowering stage. While the rapeseed flowers are yellow, wheat is inconspicuous [63], and the differences could also be found in the green and red bands. Compared with Sentinel-2 bands, the differences exhibited in Sentinel-1 polarizations are more prominent. Using these features, Dong et al. (2021) directly levered a robust threshold of Sentinel-1 VH polarization to distinguish rapeseed from wheat in winter wheat mapping across entire China [30]. Mercier et al. (2020) applied the Sentinel-1 polarizations to predict wheat and rapeseed phenological stages [79].
The canopy structures and biophysical properties of soybean and corn are utterly different. Since previous studies have demonstrated the sensitivity of SAR image to crop canopy structures and biophysical parameters [80,81], we assumed that Sentinel-1 polarizations have better performance than Sentinel-2 spectral bands in soybean and corn discrimination. However, the differences between soybean and corn in VV and VH polarizations were not significant, similar to the finding by other studies [24] in the same regions of China. A similar feature for VV and VH polarizations existed for the growing season. It may be because the study area is in mountainous areas, and differences in
Figure 11. Rotation and non-rotation areas of different crop types from 2017 to 2018. (Note: W: Wheat,R: Rapeseed, S: Soybean, C: Corn).
Remote Sens. 2022, 14, 566 13 of 18
4. Discussion
This study demonstrated that the accuracy of crop type mapping was mainly affectedby the frequency and quality of remotely sensed imagery, number and representativeness oftraining data and classification features [71–73]. As shown in previous research, this studydemonstrated that multi-sensor compositing enhanced data availability and improvedcrop type classification accuracy [57,74]. The combination of Sentinel-1 and Sentinel-2images provided more observations (Figure 3) and, more importantly, distinguishablefeatures for the classes with similar spectral properties (Figure 5). Although compositingLandsat (Landsat-liked) and Sentinel-2 could also improve data availability, the 30 mspatial resolution is inadequate in most developing countries with smallholder farmingsystems [22,23]. LiDAR data or high spatial resolution images were also recommended toimprove crop type mapping in smallholder regions [75,76], but the data scarcity limitedits developments. In addition, this study has revealed that the freely available images ofSentinel-1 and Sentinel-2 could achieve high accuracy for smallholder crop type mappingover mountainous areas.
Sentinel-1 polarizations had better performance than Sentinel-2 bands in wheat andrapeseed classification, which may result from the flowering stage of rapeseed. The flower-ing stage was frequently used for crop type classification as apparent differences in spectralreflectance exist over this growth period for many crops [77,78]. Wheat and rapeseed havedistinctive spectral features during the flowering stage. While the rapeseed flowers areyellow, wheat is inconspicuous [63], and the differences could also be found in the greenand red bands. Compared with Sentinel-2 bands, the differences exhibited in Sentinel-1polarizations are more prominent. Using these features, Dong et al. (2021) directly levereda robust threshold of Sentinel-1 VH polarization to distinguish rapeseed from wheat inwinter wheat mapping across entire China [30]. Mercier et al. (2020) applied the Sentinel-1polarizations to predict wheat and rapeseed phenological stages [79].
The canopy structures and biophysical properties of soybean and corn are utterlydifferent. Since previous studies have demonstrated the sensitivity of SAR image tocrop canopy structures and biophysical parameters [80,81], we assumed that Sentinel-1 polarizations have better performance than Sentinel-2 spectral bands in soybean andcorn discrimination. However, the differences between soybean and corn in VV and VHpolarizations were not significant, similar to the finding by other studies [24] in the sameregions of China. A similar feature for VV and VH polarizations existed for the growingseason. It may be because the study area is in mountainous areas, and differences intopography dwarf the differences in crop height. Among Sentinel-2 features, visible bandsalso exhibited a similar performance because visible bands had notably strong scattering bythe atmosphere [82]. Compared with visible bands of Sentinel-2, SWIR bands demonstrateda better distinction between soybean and corn [8,83]. The effect of red-edge bands in cropclassification has been shown in many crop type classification research [25,57].
The consistent classification of crop type in 2017 and 2018 revealed the significantinter-annual changes in crop distribution (Figure 10). It is essential for developing countrieslike China to balance environmental sustainability, agriculture, and food security withlimited cropland resources and large populations. To this end, the crop planting area andstructural adjustment policies were conducted in northeast China in recent years. The policyincentivized frequent crop rotations of different crops [57,60,61]. It was the main reason wecould observe the widespread rotations in corn–soybean or wheat–rapeseed over the studyarea. Limited by field surveys, only two years of crop type were mapped, but the consistentobservations have the potential for multiple-year crop rotation assessments [19,60].
Although the approach used in this study achieved high accuracies for crop classifica-tion, some uncertainties still exist. First, to avoid non-crop interference, we used the 30 mcropland product to mask out the non-crop areas. The classification errors in this productmay have impacts on the accuracy of the resultant crop type maps [44]. In addition, mixedpixels derived from the 30m spatial resolution product could also cause errors in crop typeclassification and rotation monitoring with 10 m Sentinel-1/2 images [84]. The narrow
Remote Sens. 2022, 14, 566 14 of 18
lines seen on the crop rotation map (Figure 10) were resulted from the spatial resolutiondifferences between Sentinel imagery and the GFSAD30 product. If 10 m cropland productsare available, more accurate classification and rotation results will be generated. Second, weapplied Sentinel-2 TOA products in this study as the SR data was unavailable in the GEEplatform during the study period. Although poor observations and contaminated pixels,including snow/ice, opaque, and cirrus, were processed based on the quality assessmentband, the abnormal values also generated uncertainties in classification [7]. Finally, the un-even image numbers across different years (Table 1) may result in inconsistent observationsbetween 2017 and 2018.
While the salt and pepper noises in classification results were minimal, the object-based classification approaches might also be appropriate in mapping crop types, accordingto previous studies [62,85,86]. Vegetation indices derived from Sentinel-2 imagery showedlittle difference in crop type classification. More vegetation indices should be exploredin future studies to improve classification accuracy. Limited by the ground truth dataavailability, only two years of crop type classification and rotation monitoring were assessedin this study. We expected that long-term field surveys or new techniques for trainingdata collections would be available in the future so that crop type rotation monitoring inmultiple years is feasible.
5. Conclusions
Sentinel-1/2 images, combined with random forest classifier and Google Earth Engineplatform, were used to map crop types and assess crop rotation patterns in a typicalsmallholder system located in mountainous areas. We combined different approaches toexplore the optimal features for crop type classification in smallholder farms. The resultsdemonstrated that the Sentinel-1 polarizations have better performance for wheat andrapeseed discrimination, and the Sentinel-2 bands exhibit obvious advantages in soybeanand corn classification. With the optimal features identified (Sentinel-1 VV and VH bandsfor wheat and rapeseed; Sentinel-2 red edge and SWIR bands for soybean and corn), weachieved a high overall accuracy of ~90% for most crops in the study area and showedclear separations from other crop types even in a complicated crop cultivation, smallholderfarming system. Sentinel-1 is recommended for wheat and rapeseed classification andSentinel-2 for soybean and rapeseed classification, particularly in mountainous areas. Thecrop rotations were monitored based on the reliable and high spatial resolution crop typemaps. This study demonstrated the potential of combining Sentinel-1 and Sentinel-2 incrop type classification and provided a reference for future crop rotation monitoring.
Author Contributions: Conceptualization, J.Q. and T.R.; methodology, T.R. and H.X.; software, T.R.;validation, T.R., X.C. and S.Y.; formal analysis, T.R.; investigation, H.X. and T.R.; resources, X.C. andJ.Q.; data curation, T.R.; writing—original draft preparation, T.R.; writing—review and editing, J.Q.;visualization, X.C.; supervision, J.Q.; project administration, X.C.; funding acquisition, J.Q. and X.C.All authors have read and agreed to the published version of the manuscript.
Funding: This work was funded by the joint scientific research project of the Sino-foreign cooperativeeducation platform (192-800005), Innovation Fund Project for Young Scholars of Inner MongoliaAcademy of Agricultural and Animal Husbandry Sciences (2020QNJJNO13), Special Fund for KeyProgram of Science and Technology of Inner Mongolia Autonomous Region (2020ZD0005), TheNatural Science Foundation of Inner Mongolia Autonomous Region (2016MS(LH)0301), Science andTechnology Plan Project of Inner Mongolia Autonomous Region (Grant No. 201602056), and the AsiaHub initiative fund at Nanjing Agricultural University, China.
Data Availability Statement: Data used in this study included freely available satellite images avail-able on GEE. Field survey data are available upon requests to the corresponding author ([email protected]).
Acknowledgments: We would like to thank the editor and the two reviewers for their valuable comments.
Conflicts of Interest: The authors declare no conflict of interest.
Remote Sens. 2022, 14, 566 15 of 18
References1. Gong, P.; Wang, J.; Yu, L.; Zhao, Y.; Zhao, Y.; Liang, L.; Niu, Z.; Huang, X.; Fu, H.; Liu, S.; et al. Finer resolution observation and
monitoring of global land cover: First mapping results with Landsat TM and ETM+ data. Int. J. Remote Sens. 2013, 34, 2607–2654.[CrossRef]
2. Zhang, X.; Liu, L.; Chen, X.; Gao, Y.; Xie, S.; Mi, J. GLC_FCS30: Global land-cover product with fine classification system at 30 musing time-series Landsat imagery. Earth Syst. Sci. Data Discuss. 2020, 12, 1625–1648. [CrossRef]
3. Bartholomé, E.; Belward, A.S. GLC2000: A new approach to global land cover mapping from Earth observation data. Int. J.Remote Sens. 2005, 26, 1959–1977. [CrossRef]
4. Chen, J.; Chen, J.; Liao, A.; Cao, X.; Chen, L.; Chen, X.; He, C.; Han, G.; Peng, S.; Lu, M.; et al. Global land cover mapping at 30 mresolution: A POK-based operational approach. ISPRS J. Photogramm. Remote Sens. 2015, 103, 7–27. [CrossRef]
5. Gong, P.; Liu, H.; Zhang, M.; Li, C.; Wang, J.; Huang, H.; Clinton, N.; Ji, L.; Li, W.; Bai, Y.; et al. Stable classification with limitedsample: Transferring a 30-m resolution sample set collected in 2015 to mapping 10-m resolution global land cover in 2017. Sci.Bull. 2019, 64, 370–373. [CrossRef]
6. Xiong, J.; Thenkabail, P.S.; Gumma, M.K.; Teluguntla, P.; Poehnelt, J.; Congalton, R.G.; Yadav, K.; Thau, D. Automated croplandmapping of continental Africa using Google Earth Engine cloud computing. ISPRS J. Photogramm. Remote Sens. 2017, 126, 225–244.[CrossRef]
7. Dong, J.; Xiao, X.; Menarguez, M.A.; Zhang, G.; Qin, Y.; Thau, D.; Biradar, C.; Moore, B., III. Mapping paddy rice planting area innortheastern Asia with Landsat 8 images, phenology-based algorithm and Google Earth Engine. Remote Sens. Environ. 2016, 185,142–154. [CrossRef]
8. Cai, Y.; Guan, K.; Peng, J.; Wang, S.; Seifert, C.; Wardlow, B.; Li, Z. A high-performance and in-season classification system offield-level crop types using time-series Landsat data and a machine learning approach. Remote Sens. Environ. 2018, 210, 35–47.[CrossRef]
9. Zhong, L.; Gong, P.; Biging, G.S. Efficient corn and soybean mapping with temporal extendability: A multi-year experiment usingLandsat imagery. Remote Sens. Environ. 2014, 140, 1–13. [CrossRef]
10. Qiu, B.; Li, W.; Tang, Z.; Chen, C.; Qi, W. Mapping paddy rice areas based on vegetation phenology and surface moistureconditions. Ecol. Indic. 2015, 56, 79–86. [CrossRef]
11. Wardlow, B.D.; Egbert, S.L.; Kastens, J.H. Analysis of time-series MODIS 250 m vegetation index data for crop classification in theUS Central Great Plains. Remote Sens. Environ. 2007, 108, 290–310. [CrossRef]
12. Aksoy, S.; Yalniz, I.Z.; Tasdemir, K. Automatic Detection and Segmentation of Orchards Using Very High Resolution Imagery.IEEE Trans. Geosci. Remote Sens. 2012, 50, 3117–3131. [CrossRef]
13. Jia, K.; Liang, S.; Zhang, N.; Wei, X.; Gu, X.; Zhao, X.; Yao, Y.; Xie, X. Land cover classification of finer resolution remote sensingdata integrating temporal features from time series coarser resolution data. ISPRS J. Photogramm. Remote Sens. 2014, 93, 49–55.[CrossRef]
14. Wardlow, B.D.; Egbert, S.L. Large-area crop mapping using time-series MODIS 250 m NDVI data: An assessment for the U.S.Central Great Plains. Remote Sens. Environ. 2008, 112, 1096–1116. [CrossRef]
15. Fritz, S.; See, L.; McCallum, I.; You, L.; Bun, A.; Moltchanova, E.; Duerauer, M.; Albrecht, F.; Schill, C.; Perger, C.; et al. Mappingglobal cropland and field size. Glob. Chang. Biol. 2015, 21, 1980–1992. [CrossRef]
16. Lobell, D.B.; Asner, G.P. Cropland distributions from temporal unmixing of MODIS data. Remote Sens. Environ. 2004, 93, 412–422.[CrossRef]
17. Foerster, S.; Kaden, K.; Foerster, M.; Itzerott, S. Crop type mapping using spectral–temporal profiles and phenological information.Comput. Electron. Agric. 2012, 89, 30–40. [CrossRef]
18. Zhang, H.; Du, H.; Zhang, C.; Zhang, L. An automated early-season method to map winter wheat using time-series Sentinel-2data: A case study of Shandong, China. Comput. Electron. Agric. 2021, 182, 105962. [CrossRef]
19. Dong, Q.; Chen, X.; Chen, J.; Zhang, C.; Liu, L.; Cao, X.; Zang, Y.; Zhu, X.; Cui, X. Mapping Winter Wheat in North ChinaUsing Sentinel 2A/B Data: A Method Based on Phenology-Time Weighted Dynamic Time Warping. Remote Sens. 2020, 12, 1274.[CrossRef]
20. Waldner, F.; Diakogiannis, F.I. Deep learning on edge: Extracting field boundaries from satellite images with a convolutionalneural network. Remote Sens. Environ. 2020, 245, 111741. [CrossRef]
21. Mazarire, T.T.; Ratshiedana, P.E.; Nyamugama, A.; Adam, E.; Chirima, G. Exploring machine learning algorithms for mappingcrop types in a heterogeneous agriculture landscape using Sentinel-2 data. A case study of Free State Province, South Africa. S.Afr. J. Geomat. 2020, 9, 333–347.
22. Ibrahim, E.S.; Rufin, P.; Nill, L.; Kamali, B.; Nendel, C.; Hostert, P. Mapping Crop Types and Cropping Systems in Nigeria withSentinel-2 Imagery. Remote Sens. 2021, 13, 3523. [CrossRef]
23. Jin, Z.; Azzari, G.; You, C.; Di Tommaso, S.; Aston, S.; Burke, M.; Lobell, D.B. Smallholder maize area and yield mapping atnational scales with Google Earth Engine. Remote Sens. Environ. 2019, 228, 115–128. [CrossRef]
24. You, N.; Dong, J. Examining earliest identifiable timing of crops using all available Sentinel 1/2 imagery and Google Earth Engine.ISPRS J. Photogramm. Remote Sens. 2020, 161, 109–123. [CrossRef]
25. Pott, L.P.; Amado, T.J.C.; Schwalbert, R.A.; Corassa, G.M.; Ciampitti, I.A. Satellite-based data fusion crop type classification andmapping in Rio Grande do Sul, Brazil. ISPRS J. Photogramm. Remote Sens. 2021, 176, 196–210. [CrossRef]
Remote Sens. 2022, 14, 566 16 of 18
26. Qiu, B.; Luo, Y.; Tang, Z.; Chen, C.; Lu, D.; Huang, H.; Chen, Y.; Chen, N.; Xu, W. Winter wheat mapping combining variationsbefore and after estimated heading dates. ISPRS J. Photogramm. Remote Sens. 2017, 123, 35–46. [CrossRef]
27. Tian, H.; Huang, N.; Niu, Z.; Qin, Y.; Pei, J.; Wang, J. Mapping Winter Crops in China with Multi-Source Satellite Imagery andPhenology-Based Algorithm. Remote Sens. 2019, 11, 820. [CrossRef]
28. Xu, X.; Ji, X.; Jiang, J.; Yao, X.; Tian, Y.; Zhu, Y.; Cao, W.; Cao, Q.; Yang, H.; Shi, Z.; et al. Evaluation of One-Class Support VectorClassification for Mapping the Paddy Rice Planting Area in Jiangsu Province of China from Landsat 8 OLI Imagery. Remote Sens.2018, 10, 546. [CrossRef]
29. Zhang, X.; Yang, G.; Xu, X.; Yao, X.; Zheng, H.; Zhu, Y.; Cao, W.; Cheng, T. An assessment of Planet satellite imagery forcounty-wide mapping of rice planting areas in Jiangsu Province, China with one-class classification approaches. Int. J. RemoteSens. 2021, 42, 7610–7635. [CrossRef]
30. Dong, J.; Fu, Y.; Wang, J.; Tian, H.; Fu, S.; Niu, Z.; Han, W.; Zheng, Y.; Huang, J.; Yuan, W. Early-season mapping of winter wheatin China based on Landsat and Sentinel images. Earth Syst. Sci. Data 2020, 12, 3081–3095. [CrossRef]
31. Zhong, L.; Hu, L.; Zhou, H. Deep learning based multi-temporal crop classification. Remote Sens. Environ. 2019, 221, 430–443.[CrossRef]
32. Egorov, A.V.; Hansen, M.C.; Roy, D.P.; Kommareddy, A.; Potapov, P.V. Image interpretation-guided supervised classificationusing nested segmentation. Remote Sens. Environ. 2015, 165, 135–147. [CrossRef]
33. Sharma, R.; Ghosh, A.; Joshi, P.K. Decision tree approach for classification of remotely sensed satellite data using open sourcesupport. J. Earth Syst. Sci. 2013, 122, 1237–1247. [CrossRef]
34. Waldner, F.; Canto, G.S.; Defourny, P. Automated annual cropland mapping using knowledge-based temporal features. ISPRS J.Photogramm. Remote Sens. 2015, 110, 1–13. [CrossRef]
35. Kluger, D.M.; Wang, S.; Lobell, D.B. Two shifts for crop mapping: Leveraging aggregate crop statistics to improve satellite-basedmaps in new regions. Remote Sens. Environ. 2021, 262, 112488. [CrossRef]
36. Song, Q.; Hu, Q.; Zhou, Q.; Hovis, C.; Xiang, M.; Tang, H.; Wu, W. In-Season Crop Mapping with GF-1/WFV Data by CombiningObject-Based Image Analysis and Random Forest. Remote Sens. 2017, 9, 1184. [CrossRef]
37. He, Y.; Wang, C.; Chen, F.; Jia, H.; Liang, D.; Yang, A. Feature Comparison and Optimization for 30-M Winter Wheat MappingBased on Landsat-8 and Sentinel-2 Data Using Random Forest Algorithm. Remote Sens. 2019, 11, 535. [CrossRef]
38. Kpienbaareh, D.; Sun, X.; Wang, J.; Luginaah, I.; Bezner Kerr, R.; Lupafya, E.; Dakishoni, L. Crop Type and Land Cover Mappingin Northern Malawi Using the Integration of Sentinel-1, Sentinel-2, and PlanetScope Satellite Data. Remote Sens. 2021, 13, 700.[CrossRef]
39. Palchowdhuri, Y.; Valcarce-Diñeiro, R.; King, P.; Sanabria-Soto, M. Classification of multi-temporal spectral indices for crop typemapping: A case study in Coalville, UK. J. Agric. Sci. 2018, 156, 24–36. [CrossRef]
40. Gorelick, N.; Hancher, M.; Dixon, M.; Ilyushchenko, S.; Thau, D.; Moore, R. Google Earth Engine: Planetary-scale geospatialanalysis for everyone. Remote Sens. Environ. 2017, 202, 18–27. [CrossRef]
41. Teluguntla, P.; Thenkabail, P.S.; Oliphant, A.; Xiong, J.; Gumma, M.K.; Congalton, R.G.; Yadav, K.; Huete, A. A 30-m landsat-derived cropland extent product of Australia and China using random forest machine learning algorithm on Google Earth Enginecloud computing platform. ISPRS J. Photogramm. Remote Sens. 2018, 144, 325–340. [CrossRef]
42. Phalke, A.R.; Özdogan, M.; Thenkabail, P.S.; Erickson, T.; Gorelick, N.; Yadav, K.; Congalton, R.G. Mapping croplands of Europe,Middle East, Russia, and Central Asia using Landsat, Random Forest, and Google Earth Engine. ISPRS J. Photogramm. RemoteSens. 2020, 167, 104–122. [CrossRef]
43. Oliphant, A.J.; Thenkabail, P.S.; Teluguntla, P.; Xiong, J.; Gumma, M.K.; Congalton, R.G.; Yadav, K. Mapping cropland extent ofSoutheast and Northeast Asia using multi-year time-series Landsat 30-m data using a random forest classifier on the GoogleEarth Engine Cloud. Int. J. Appl. Earth Obs. Geoinf. 2019, 81, 110–124. [CrossRef]
44. Liu, L.; Xiao, X.; Qin, Y.; Wang, J.; Xu, X.; Hu, Y.; Qiao, Z. Mapping cropping intensity in China using time series Landsat andSentinel-2 images and Google Earth Engine. Remote Sens. Environ. 2020, 239, 111624. [CrossRef]
45. Zhang, M.; Wu, B.; Zeng, H.; He, G.; Liu, C.; Tao, S.; Zhang, Q.; Nabil, M.; Tian, F.; Bofana, J.; et al. GCI30: A global dataset of30-m cropping intensity using multisource remote sensing imagery. Earth Syst. Sci. Data Discuss. 2021, 13, 4799–4817. [CrossRef]
46. Ni, R.; Tian, J.; Li, X.; Yin, D.; Li, J.; Gong, H.; Zhang, J.; Zhu, L.; Wu, D. An enhanced pixel-based phenological feature for accuratepaddy rice mapping with Sentinel-2 imagery in Google Earth Engine. ISPRS J. Photogramm. Remote Sens. 2021, 178, 282–296.[CrossRef]
47. Ge, S.; Zhang, J.; Pan, Y.; Yang, Z.; Zhu, S. Transferable deep learning model based on the phenological matching principle formapping crop extent. Int. J. Appl. Earth Obs. Geoinf. 2021, 102, 102451. [CrossRef]
48. Duan, Q.; Tan, M.; Guo, Y.; Wang, X.; Xin, L. Understanding the Spatial Distribution of Urban Forests in China Using Sentinel-2Images with Google Earth Engine. Forests 2019, 10, 729. [CrossRef]
49. Jia, M.; Wang, Z.; Mao, D.; Ren, C.; Wang, C.; Wang, Y. Rapid, robust, and automated mapping of tidal flats in China using timeseries Sentinel-2 images and Google Earth Engine. Remote Sens. Environ. 2021, 255, 112285. [CrossRef]
50. Liu, W.; Wang, J.; Luo, J.; Wu, Z.; Chen, J.; Zhou, Y.; Sun, Y.; Shen, Z.; Xu, N.; Yang, Y. Farmland Parcel Mapping in MountainAreas Using Time-Series SAR Data and VHR Optical Images. Remote Sens. 2020, 12, 3733. [CrossRef]
51. Burke, M.; Lobell, D.B. Satellite-based assessment of yield variation and its determinants in smallholder African systems. Proc.Natl. Acad. Sci. USA 2017, 114, 2189–2194. [CrossRef] [PubMed]
Remote Sens. 2022, 14, 566 17 of 18
52. Wang, Y.-C.; Feng, C.-C.; Vu Duc, H. Integrating Multi-Sensor Remote Sensing Data for Land Use/Cover Mapping in a TropicalMountainous Area in Northern Thailand. Geogr. Res. 2012, 50, 320–331. [CrossRef]
53. Boryan, C.; Yang, Z.; Mueller, R.; Craig, M. Monitoring US agriculture: The US Department of Agriculture, National AgriculturalStatistics Service, Cropland Data Layer Program. Geocarto Int. 2011, 26, 341–358. [CrossRef]
54. Fisette, T.; Davidson, A.; Daneshfar, B.; Rollin, P.; Aly, Z.; Campbell, L. Annual Space-Based Crop Inventory for Canada: 2009–2014.In Proceedings of the IEEE Geoscience and Remote Sensing Symposium, Quebec, QC, Canada, 13–18 July 2014; pp. 5095–5098.
55. Conrad, C.; Lamers, J.P.A.; Ibragimov, N.; Löw, F.; Martius, C. Analysing irrigated crop rotation patterns in arid Uzbekistan bythe means of remote sensing: A case study on post-Soviet agricultural land use. J. Arid Environ. 2016, 124, 150–159. [CrossRef]
56. Lesiv, M.; Laso Bayas, J.C.; See, L.; Duerauer, M.; Dahlia, D.; Durando, N.; Hazarika, R.; Kumar Sahariah, P.; Vakolyuk, M.;Blyshchyk, V.; et al. Estimating the global distribution of field size using crowdsourcing. Glob. Chang. Biol. 2018, 25, 174–186.[CrossRef]
57. You, N.; Dong, J.; Huang, J.; Du, G.; Zhang, G.; He, Y.; Yang, T.; Di, Y.; Xiao, X. The 10-m crop type maps in Northeast Chinaduring 2017–2019. Sci. Data 2021, 8, 41. [CrossRef]
58. Yu, L.; Wulantuya; Li, J.; Yu, W.; Dun, H. Multi-source remote sensing data feature optimization for different crop extraction inDaxing’Anling along the foothills. J. North Agric. 2020, 48, 119–128. (In Chinese with English Abstract).
59. Yu, L.; Wulantuya; Wulan; Bao, J. Study on the main crop identification method based on SAR-C in the west of Great KhinganMountains. J. North. Agric. 2017, 45, 108–113. (In Chinese with English Abstract).
60. Yang, L.; Wang, L.; Huang, J.; Mansaray, L.R.; Mijiti, R. Monitoring policy-driven crop area adjustments in northeast China usingLandsat-8 imagery. Int. J. Appl. Earth Obs. Geoinf. 2019, 82, 101892. [CrossRef]
61. Liu, S.; Zhang, P.; Liu, W.; He, X. Key Factors Affecting Farmers’ Choice of Corn Reduction under the China’s New AgriculturePolicy in the ‘Liandaowan’ Areas, Northeast China. Chin. Geogr. Sci. 2019, 29, 1039–1051. [CrossRef]
62. Ghorbanian, A.; Kakooei, M.; Amani, M.; Mahdavi, S.; Mohammadzadeh, A.; Hasanlou, M. Improved land cover map of Iranusing Sentinel imagery within Google Earth Engine and a novel automatic workflow for land cover classification using migratedtraining samples. ISPRS J. Photogramm. Remote Sens. 2020, 167, 276–288. [CrossRef]
63. Yang, G.; Yu, W.; Yao, X.; Zheng, H.; Cao, Q.; Zhu, Y.; Cao, W.; Cheng, T. AGTOC: A novel approach to winter wheat mapping byautomatic generation of training samples and one-class classification on Google Earth Engine. Int. J. Appl. Earth Obs. Geoinf. 2021,102, 102446. [CrossRef]
64. Song, C.; Woodcock, C.E.; Seto, K.C.; Lenney, M.P.; Macomber, S.A. Classification and change detection using Landsat TM data:When and how to correct atmospheric effects? Remote Sens. Environ. 2001, 75, 230–244. [CrossRef]
65. Huete, A.; Didan, K.; Miura, T.; Rodriguez, E.P.; Gao, X.; Ferreira, L.G. Overview of the radiometric and biophysical performanceof the MODIS vegetation indices. Remote Sens. Environ. 2002, 83, 195–213. [CrossRef]
66. Bocai, G. NDWI—A normalized difference water index for remote sensing of vegetation liquid water from space. Remote Sens.Environ. 1996, 58, 257–266.
67. Rouse, J.; Haas, R.; Schell, J.; Deering, D. Monitoring Vegetation Systems in the Great Plains with ERTS. NASA Spec. Publ. 1974,351, 309.
68. Sulik, J.J.; Long, D.S. Spectral considerations for modeling yield of canola. Remote Sens. Environ. 2016, 184, 161–174. [CrossRef]69. Guyot, G.; Frederic, B.; Jacquemoud, S. Imaging spectroscopy for vegetation studies. Imaging Spectrosc. 1992, 2, 145–165.70. Friedl, M.A.; Brodley, C.E.; Strahler, A.H. Maximizing land cover classification accuracies produced by decision trees at continental
to global scales. IEEE Trans. Geosci. Remote Sens. 1999, 37, 969–977. [CrossRef]71. Huang, H.; Wang, J.; Liu, C.; Liang, L.; Li, C.; Gong, P. The migration of training samples towards dynamic global land cover
mapping. ISPRS J. Photogramm. Remote Sens. 2020, 161, 27–36. [CrossRef]72. Zhong, L.; Hu, L.; Yu, L.; Gong, P.; Biging, G.S. Automated mapping of soybean and corn using phenology. ISPRS J. Photogramm.
Remote Sens. 2016, 119, 151–164. [CrossRef]73. Hao, P.; Di, L.; Zhang, C.; Guo, L. Transfer Learning for Crop classification with Cropland Data Layer data (CDL) as training
samples. Sci. Total Environ. 2020, 733, 138869. [CrossRef] [PubMed]74. Maskell, G.; Chemura, A.; Nguyen, H.; Gornott, C.; Mondal, P. Integration of Sentinel optical and radar data for mapping
smallholder coffee production systems in Vietnam. Remote Sens. Environ. 2021, 266, 112709. [CrossRef]75. Prins, A.J.; Van Niekerk, A. Crop type mapping using LiDAR, Sentinel-2 and aerial imagery with machine learning algorithms.
Geo-Spat. Inf. Sci. 2021, 24, 215–227. [CrossRef]76. Delrue, J.; Bydekerke, L.; Eerens, H.; Gilliams, S.; Piccard, I.; Swinnen, E. Crop mapping in countries with small-scale farming: A
case study for West Shewa, Ethiopia. Int. J. Remote Sens. 2012, 34, 2566–2582. [CrossRef]77. Chen, B.; Jin, Y.; Brown, P. An enhanced bloom index for quantifying floral phenology using multi-scale remote sensing
observations. ISPRS J. Photogramm. Remote Sens. 2019, 156, 108–120. [CrossRef]78. D’Andrimont, R.; Taymans, M.; Lemoine, G.; Ceglar, A.; Yordanov, M.; van der Velde, M. Detecting flowering phenology in oil
seed rape parcels with Sentinel-1 and -2 time series. Remote Sens. Environ. 2020, 239, 111660. [CrossRef]79. Mercier, A.; Betbeder, J.; Baudry, J.; Le Roux, V.; Spicher, F.; Lacoux, J.; Roger, D.; Hubert-Moy, L. Evaluation of Sentinel-1 & 2 time
series for predicting wheat and rapeseed phenological stages. ISPRS J. Photogramm. Remote Sens. 2020, 163, 231–256.80. Inoue, Y.; Sakaiya, E.; Wang, C.Z. Capability of C-band backscattering coefficients from high-resolution satellite SAR sensors to
assess biophysical variables in paddy rice. Remote Sens. Environ. 2014, 140, 257–266. [CrossRef]

Remote Sens. 2022, 14, 566 18 of 18
81. Mattia, F.; Le Toan, T.; Picard, G.; Posa, F.I.; D’Alessio, A.; Notarnicola, C.; Gatti, A.M.; Rinaldi, M.; Satalino, G.; Pasquariello, G.Multitemporal C-band radar measurements on wheat fields. IEEE Trans. Geosci. Remote Sens. 2003, 41, 1551–1560. [CrossRef]
82. Song, X.-P.; Potapov, P.V.; Krylov, A.; King, L.; Di Bella, C.M.; Hudson, A.; Khan, A.; Adusei, B.; Stehman, S.V.; Hansen, M.C.National-scale soybean mapping and area estimation in the United States using medium resolution satellite imagery and fieldsurvey. Remote Sens. Environ. 2017, 190, 383–395. [CrossRef]
83. Defourny, P.; Bontemps, S.; Bellemans, N.; Cara, C.; Dedieu, G.; Guzzonato, E.; Hagolle, O.; Inglada, J.; Nicola, L.; Rabaute, T.; et al.Near real-time agriculture monitoring at national scale at parcel resolution: Performance assessment of the Sen2-Agri automatedsystem in various cropping systems around the world. Remote Sens. Environ. 2019, 221, 551–568. [CrossRef]
84. Ozdogan, M.; Woodcock, C.E. Resolution dependent errors in remote sensing of cultivated areas. Remote Sens. Environ. 2006, 103,203–217. [CrossRef]
85. Su, T.; Zhang, S. Object-based crop classification in Hetao plain using random forest. Earth Sci. Inf. 2021, 14, 119–131. [CrossRef]86. Tang, Z.; Wang, H.; Li, X.; Li, X.; Cai, W.; Han, C. An Object-Based Approach for Mapping Crop Coverage Using Multiscale
Weighted and Machine Learning Methods. IEEE J. Sel. Top. Appl. Earth Obs. Remote Sens. 2020, 13, 1700–1713. [CrossRef]