determinants nof smallholder commericilization of horticultural crops
10
Vol. 9(3), pp. 310-319, 16 January, 2014 DOI: 10.5897/AJAR2013.6935 ISSN 1991-637X ©2014 Academic Journals http://www.academicjournals.org/AJAR African Journal of Agricultural Research Full Length Research Paper Determinants of smallholder commercialization of horticultural crops in Gemechis District, West Hararghe Zone, Ethiopia Aman Tufa* 1 , Adam Bekele 2 and Lemma Zemedu 3 1 Department of Agricultural Economics, Hawassa University, P. O. Box 5, Hawassa, Ethiopia. 2 Department of Agricultural Economics, Ethiopian Institute of Agricultural Research, Ethiopia. 3 Department of Agricultural Economics, Haramaya University, P.O.BOX 138 Dire Dawa, Ethiopia. Accepted 4 December, 2013 Transforming the subsistence-oriented production system into a market-oriented production system as a way to increase the smallholder farmer’s income and reduce rural poverty has been in the policy spotlight of many developing countries, including Ethiopia. However, there are no adequate studies in Ethiopia, particularly, in study area of West Hararghe zone that focusing on the determinants of smallholder commercialization in horticultural crops. This study has identified household level determinants of the output side commercialization decision and level of commercialization in horticultural crops in Gemechis district, West Hararghe zone, Oromia National Regional State of Ethiopia. The study used cross-sectional data obtained from a sample of 160 smallholder horticultural farmers selected randomly from four peasant associations in the district. A double hurdle model was applied to analyze the determinants of the commercialization decision and level of commercialization. In first hurdle, the result of Probit Regression Model revealed that, gender, distance to the nearest market, and cultivated land played a significant role in smallholder commercialization decision. In the second hurdle, the result of Truncated Regression Model revealed that, household education, household size, access to irrigation, cultivated land, livestock, and distance to the nearest market were the key determinants of the level of commercialization. Synthesis of double hurdle model result showed that farm size and distance to the nearest market were cross-cutting determinants of smallholder horticultural crops commercialization. The study recommends the need for designing appropriate intervention mechanisms focusing on the abovementioned factors so as to improve the performance of horticultural crops commercialization. Key words: Smallholder, commercialization, market participation, double hurdle. INTRODUCTION Ethiopia is one of the Sub-Saharan Africa countries which liberalized their economies and developed poverty reduction strategies that underpin market-led strategies for broad based agricultural development and economic growth. Agricultural development is viewed as a means to improve the living standards of smallholders and general economic growth. In Ethiopia the agricultural sector contributes about 43% of the Gross Domestic Product *Corresponding author. E-mail: [email protected].
-
Upload
independent -
Category
Documents
-
view
3 -
download
0
Transcript of determinants nof smallholder commericilization of horticultural crops
Vol. 9(3), pp. 310-319, 16 January, 2014 DOI: 10.5897/AJAR2013.6935
ISSN 1991-637X ©2014 Academic Journals
http://www.academicjournals.org/AJAR
African Journal of Agricultural
Research
Full Length Research Paper
Determinants of smallholder commercialization of horticultural crops in Gemechis District, West Hararghe
Zone, Ethiopia
Aman Tufa*1, Adam Bekele2 and Lemma Zemedu3
1Department of Agricultural Economics, Hawassa University, P. O. Box 5, Hawassa, Ethiopia.
2Department of Agricultural Economics, Ethiopian Institute of Agricultural Research, Ethiopia.
3Department of Agricultural Economics, Haramaya University, P.O.BOX 138 Dire Dawa, Ethiopia.
Accepted 4 December, 2013
Transforming the subsistence-oriented production system into a market-oriented production system as a way to increase the smallholder farmer’s income and reduce rural poverty has been in the policy spotlight of many developing countries, including Ethiopia. However, there are no adequate studies in Ethiopia, particularly, in study area of West Hararghe zone that focusing on the determinants of smallholder commercialization in horticultural crops. This study has identified household level determinants of the output side commercialization decision and level of commercialization in horticultural crops in Gemechis district, West Hararghe zone, Oromia National Regional State of Ethiopia. The study used cross-sectional data obtained from a sample of 160 smallholder horticultural farmers selected randomly from four peasant associations in the district. A double hurdle model was applied to analyze the determinants of the commercialization decision and level of commercialization. In first hurdle, the result of Probit Regression Model revealed that, gender, distance to the nearest market, and cultivated land played a significant role in smallholder commercialization decision. In the second hurdle, the result of Truncated Regression Model revealed that, household education, household size, access to irrigation, cultivated land, livestock, and distance to the nearest market were the key determinants of the level of commercialization. Synthesis of double hurdle model result showed that farm size and distance to the nearest market were cross-cutting determinants of smallholder horticultural crops commercialization. The study recommends the need for designing appropriate intervention mechanisms focusing on the abovementioned factors so as to improve the performance of horticultural crops commercialization. Key words: Smallholder, commercialization, market participation, double hurdle.
INTRODUCTION Ethiopia is one of the Sub-Saharan Africa countries which liberalized their economies and developed poverty reduction strategies that underpin market-led strategies for broad based agricultural development and economic
growth. Agricultural development is viewed as a means to improve the living standards of smallholders and general economic growth. In Ethiopia the agricultural sector contributes about 43% of the Gross Domestic Product
*Corresponding author. E-mail: [email protected].
(GDP), 80% of employment, and 90% of export (Demese et al., 2010). Smallholder farmers account for the majority of the rural population and more than 85% of the rural population relies on agricultural production for its livelihood. However, in agriculture-based economies the smallholder agricultural production is characterized by low output, poor access to land, and poor access to inputs, poor irrigation system, little access to know-how (risk management, technology, and skill), low level of market orientation, poor infrastructure and institutional factors (Leggese and Burton, 2004; MoFED, 2005; Bezabih and Hadera, 2007; Moti, 2007; CSA, 2008/2009; Tilaye, 2010).
Recently, the governments of developing countries have sought to promote diversification of production and exports away from the traditional commodities in order to accelerate economic growth, expand employment opportunities, and reduce rural poverty (Solomon et al., 2010). Market oriented production can allow households to increase their income by producing output with higher returns to land and labor and using the income generated from sales to purchase goods for consumption (Schneider and Gugerty, 2010). Similarly, in Ethiopia, the current policy environment and in its Growth and Transformation Plan (GTP) launched for the period 2010 and 2011 up to 2014 to 2015, the Ethiopian Government attempts to promote production and marketing of high value agricultural products with a view to increase competitiveness in domestic, regional, and international markets.
In addition, the shift in the paradigm of strategy for food security from food production oriented to improving food access through improving household income and promoting market oriented production has opened the window for engagement of smallholder farmers in market oriented production (MoFED, 2010).
Nowadays, horticultural crops is becoming attractive for many poor farmers around the world thus worldwide production of fruit and vegetable crops has grown faster than that of cereal crops (Lumpkin et al., 2005). Horticultural crops play a significant role in developing country both in income and social spheres for improving income and nutrition status. Farmers involved in horticultural production usually earn much higher farm incomes as compared to cereal producers and per capital farm income has been reported up to five times higher. In addition, horticultural products are considered to be income-boosting alternatives to basic grains for smallholder farmers, and they contribute to increasing employment opportunities (World Bank, 2004).
In Ethiopia, the importance of horticulture to the livelihoods of the rural populations in the country accentuates its role as a crop whose production and marketing could be a potential pathway of improving rural livelihoods. Horticulture production in Ethiopia is undertaken dominantly by smallholder farmers, few private sectors and its overall contribution to the economy
Tufa et al. 311 of the country is limited. The number of small-scale producers engaged in horticulture production is estimated at around 6.0 million (CSA, 2008/2009). The production estimate of fruit and vegetables, including root crops, is 2.16 million tons (9.2% of total national peasant crop production of the season) constituting about 351 thousand tons of fruits (16%), 600 thousand tons of vegetables (28%), and 1.2 million tons of root crops (56%). This volume is produced on 356 thousand hectares (2.4% of total cultivated land in 2008/09) of peasant holdings.
For most Ethiopian smallholders, fruit and vegetable cultivation is not the main activity rather it is considered supplementary to the production of main crops and the cultivation is on a very small plot of land and is managed by a household. This low priority for horticultural crops cultivation was mainly due to the traditional food consumption habits that favor grain crops and livestock products in most parts of the country resulting in weak domestic market demand for horticultural products. Horticulture production is an important source of income for smallholder farmers and demand for the products is raising in both domestic and international markets thus increase smallholder farmers’ participation in the market (Dawit et al., 2004; Bezabih and Hadera, 2007; Yilma, 2009).
Although there is a wealth of literature on smallholder commercialization in Ethiopia, it is mainly on grain crops and livestock and livestock product however market participation of the smallholder horticultural crops farmers in the country is still limited. Accordingly, various empirical studies pointed out that, in Ethiopia, smallholder commercialization determined by institutional factors, infrastructural and market related factors, household resource endowments, and household specific characteristics (Pender and Dawit, 2007; Berhanu et al., 2009; Goitom, 2009; Adam et al., 2010; Berhanu and Moti, 2010).
In Ethiopia, particularly eastern and western Hararghe zones have good potential in horticultural crops production for which smallholder farming have diversified from staple food subsistence production into more market oriented and higher value commodities. Despite this production potentials and importance of horticultural crops for the country as well as the study area, there has been limited study with regard to the status and level of smallholder commercialization of horticultural crops and implications of the challenges on decision making.
Smallholder access to markets for higher-value agricultural products is recognized as a vital opportunity to enhance and diversify the livelihoods of lower-income farm households and reduce rural poverty more generally (World Bank, 2008). Past studies, have not addressed the study area. To the best of my knowledge, there is little empirical evidence on factors governing smallholder horticultural crops commercialization in developing countries, particularly, in Ethiopia. Therefore, improvements
312 Afr. J. Agric. Res.
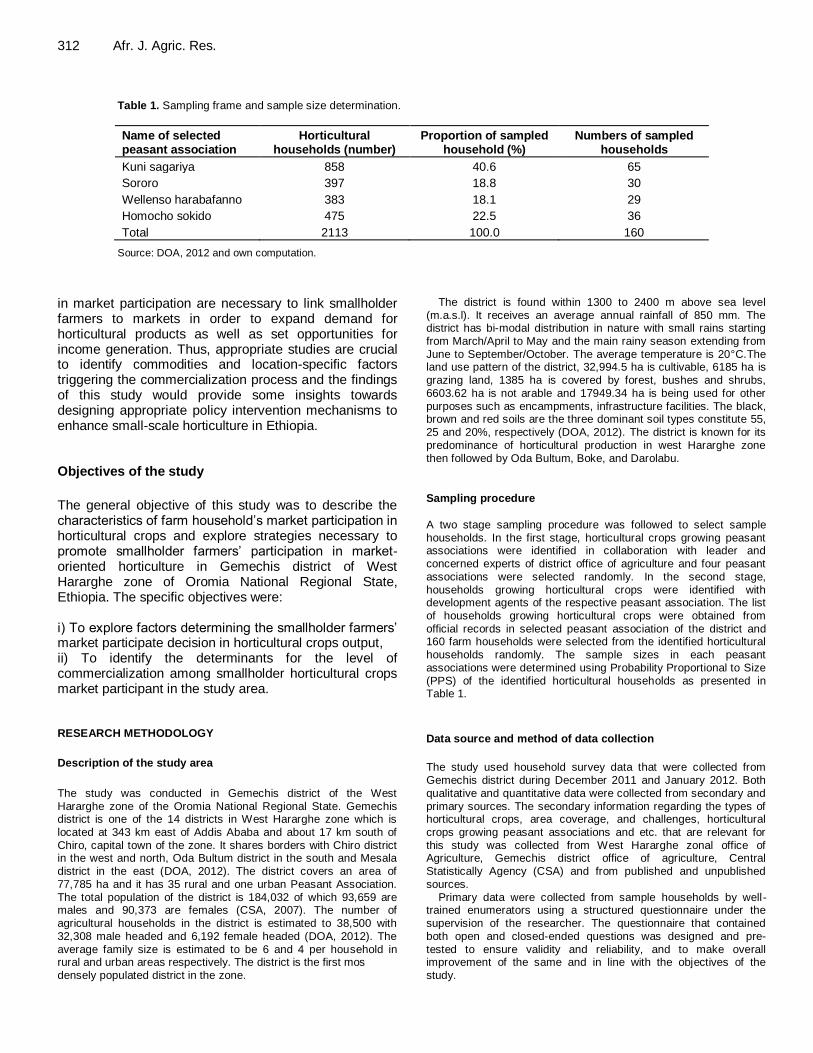
Table 1. Sampling frame and sample size determination.
Name of selected peasant association
Horticultural households (number)
Proportion of sampled household (%)
Numbers of sampled households
Kuni sagariya 858 40.6 65
Sororo 397 18.8 30
Wellenso harabafanno 383 18.1 29
Homocho sokido 475 22.5 36
Total 2113 100.0 160
Source: DOA, 2012 and own computation.
in market participation are necessary to link smallholder farmers to markets in order to expand demand for horticultural products as well as set opportunities for income generation. Thus, appropriate studies are crucial to identify commodities and location-specific factors triggering the commercialization process and the findings of this study would provide some insights towards designing appropriate policy intervention mechanisms to enhance small-scale horticulture in Ethiopia. Objectives of the study
The general objective of this study was to describe the characteristics of farm household’s market participation in horticultural crops and explore strategies necessary to promote smallholder farmers’ participation in market-oriented horticulture in Gemechis district of West Hararghe zone of Oromia National Regional State, Ethiopia. The specific objectives were: i) To explore factors determining the smallholder farmers’ market participate decision in horticultural crops output, ii) To identify the determinants for the level of commercialization among smallholder horticultural crops market participant in the study area. RESEARCH METHODOLOGY
Description of the study area
The study was conducted in Gemechis district of the West Hararghe zone of the Oromia National Regional State. Gemechis district is one of the 14 districts in West Hararghe zone which is
located at 343 km east of Addis Ababa and about 17 km south of Chiro, capital town of the zone. It shares borders with Chiro district in the west and north, Oda Bultum district in the south and Mesala district in the east (DOA, 2012). The district covers an area of 77,785 ha and it has 35 rural and one urban Peasant Association. The total population of the district is 184,032 of which 93,659 are males and 90,373 are females (CSA, 2007). The number of agricultural households in the district is estimated to 38,500 with 32,308 male headed and 6,192 female headed (DOA, 2012). The
average family size is estimated to be 6 and 4 per household in rural and urban areas respectively. The district is the first mos densely populated district in the zone.
The district is found within 1300 to 2400 m above sea level (m.a.s.l). It receives an average annual rainfall of 850 mm. The district has bi-modal distribution in nature with small rains starting from March/April to May and the main rainy season extending from June to September/October. The average temperature is 20°C.The land use pattern of the district, 32,994.5 ha is cultivable, 6185 ha is grazing land, 1385 ha is covered by forest, bushes and shrubs,
6603.62 ha is not arable and 17949.34 ha is being used for other purposes such as encampments, infrastructure facilities. The black, brown and red soils are the three dominant soil types constitute 55, 25 and 20%, respectively (DOA, 2012). The district is known for its predominance of horticultural production in west Hararghe zone then followed by Oda Bultum, Boke, and Darolabu.
Sampling procedure
A two stage sampling procedure was followed to select sample households. In the first stage, horticultural crops growing peasant associations were identified in collaboration with leader and concerned experts of district office of agriculture and four peasant associations were selected randomly. In the second stage, households growing horticultural crops were identified with development agents of the respective peasant association. The list
of households growing horticultural crops were obtained from official records in selected peasant association of the district and 160 farm households were selected from the identified horticultural households randomly. The sample sizes in each peasant associations were determined using Probability Proportional to Size (PPS) of the identified horticultural households as presented in Table 1.
Data source and method of data collection
The study used household survey data that were collected from Gemechis district during December 2011 and January 2012. Both qualitative and quantitative data were collected from secondary and primary sources. The secondary information regarding the types of horticultural crops, area coverage, and challenges, horticultural
crops growing peasant associations and etc. that are relevant for this study was collected from West Hararghe zonal office of Agriculture, Gemechis district office of agriculture, Central Statistically Agency (CSA) and from published and unpublished sources.
Primary data were collected from sample households by well-trained enumerators using a structured questionnaire under the supervision of the researcher. The questionnaire that contained both open and closed-ended questions was designed and pre-
tested to ensure validity and reliability, and to make overall improvement of the same and in line with the objectives of the study.

Econometric model specification
Econometric models were used to assess the household characteristics, resource endowments, market access and institutional factors that are hypothesized to determine the
smallholder farmers decision to participate (or not) in output markets and the level of market participation. The double hurdle model was applied to analyze determinants of horticultural crops commercialization in terms of output market participation. This double hurdle model involves two-step estimation procedure. In first stage, probit model was used to explore factors governing market participation decision for a given reference period which is referred to as commercialization decision in this study.
The probit model Standard probit model to assess the household market-entry decision and its specification is given below following Wooldridge (2002), the decision to commercialize can be modeled as a:
(1)
where, yi* is a latent (unobservable) variable representing households’ discrete decision whether or not to participate in the horticultural product market; xi is a vector of independent variables hypothesized to affect household’s decision to participate in the
market; β is a vector of parameters to be estimated; yi is a discrete response variable for status of households’ participation in the market which takes value of 1 if the household participates in the market and 0 if the horticultural households reported no sale. Probit model was estimated using maximum likelihood estimation using STATA Version 11. Maximum likelihood estimates are consistent, asymptotically normal, and asymptotically efficient.
In the second stage, Truncated Regression Model was employed
to explore the determinants of the value of horticultural crops that are marketed which is referred to as the level of commercialization in this study. Truncated regression
A truncated regression fits a regression model on a sample drawn from a restricted part of the population. Under the normality
assumption of the whole population, the error terms in a truncated regression model have a truncated normal distribution, which is a normal distribution that has been scaled upward so that the distribution integrates to one over the restricted range. The intensity of commercialization is modeled as a regression truncated at zero:
(2)
where, zi is the intensity of commercialization which depends on latent variable zi* being greater than zero and conditional to the decision to commercialize yi; γ is parameter to be estimated. Truncation reduces variance compared to the variance in the untruncated distribution. As the result, the truncated regression model with the lower left truncation equal to 0 was used to determine factors influencing sales value of horticultural product (Table 2).
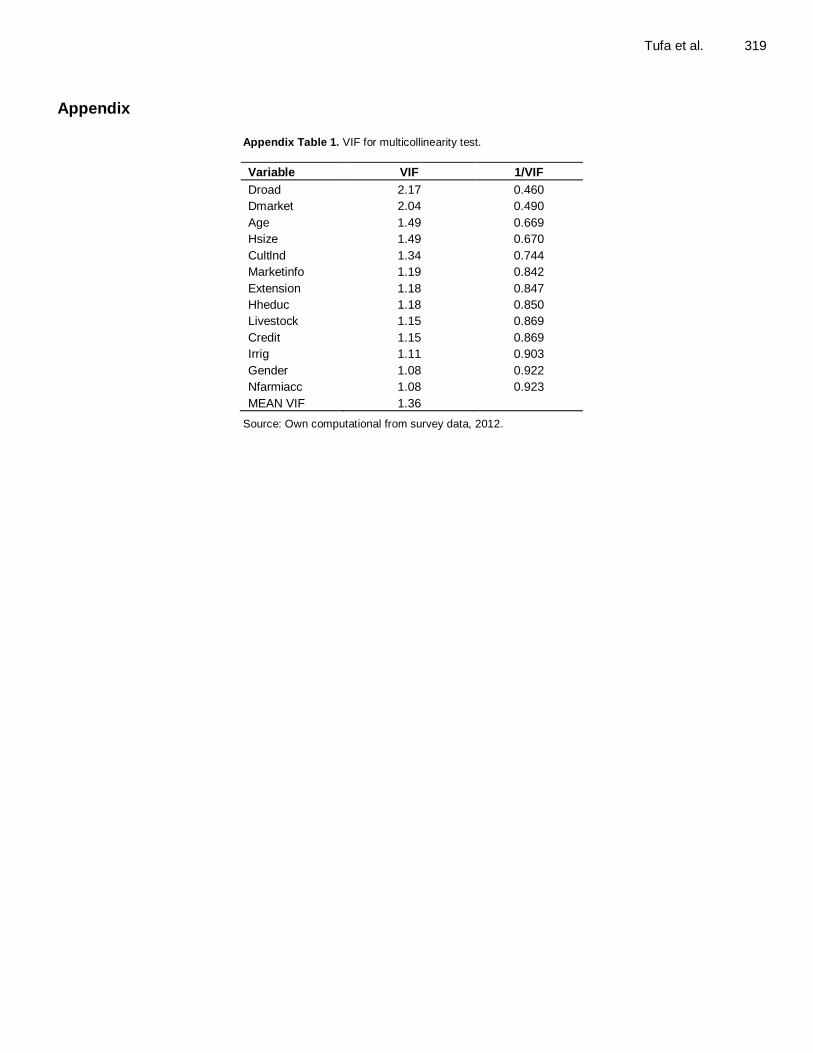
Tufa et al. 313 RESULTS AND DISCUSSION The results of descriptive statistics analysis indicated that, about 80% of the respondents sold their output while the rest 20% did not sell horticultural products. On average the value of horticultural products sold per sample horticultural household head was estimated to be about ETB 4, 603.56. The mean age of the sample respondents was about 39 years with the youngest being 20 and the oldest 65 years. The average number of family size for the sample respondents were about 6. The average land size allotted under horticultural crops per sample household head was about 1.68 timad while the mean livestock possession was about 3.72 TLU. The average distance to all-weather roads and distance to the nearest market was estimated to be 1.3 and 1.48 walking respectively (Table 3). Results of econometric model analysis In a survey data set a researcher should expect to encounter many problems. The problems of multicollinearity and heteroscedasticity are very common in cross-section data. Data should be cleared before it is used for purposes of analysis. While fitting important variables in the models a test for multicollinearity problem among variables was performed using VIF and there was no serious problem as indicated in appendix Table 1. In estimating the preferred model, robust method was employed in order to correct the possible problem of heteroscedasticity. Outliers were checked using the box plot graph so that there were no serious problems of outlier and no data get lost due to outliers.
Determinants of household commercialization decision The result of probit model estimation for the determinants of the probabilities of household to sell horticultural outputs or not are presented in Table 4. The decision to participate in the horticultural products market was estimated by maximum likelihood method. Marginal effect was used as a useful measure to explain the result as coefficients of the probit model are difficult to interpret since they measure the change in the unobservable y* associated with a change in one of the explanatory variables (that is, not partial effects). The model chi-square tests applying appropriate degrees of freedom indicate that, the overall goodness-of-fit of the probit model are statistically significant at 1% probability level.
Pseudo R2 values indicate that, the independent
variables included in the regression explain 22% variations in the likelihood to sale horticultural outputs. The result of probit estimation shows that, the likelihood of household participation in horticultural crop market as a seller was influenced by household gender, cultivated
2.4.1. The Probit Model
Standard probit model to assess the household market-entry decision and its specification is
given below following Wooldridge (2002), the decision to commercialize can be modeled as
a:
yi*=xiβ+εiεi ̴̴N(0,1) (1)
yi = 1 if y*i>0
0 if y*i ≤ 0
where, yi* is a latent (unobservable) variable representing households’ discrete decision
whether or not to participate in the horticultural product market; xi is a vector of
independent variables hypothesized to affect household’s decision to participate in the
market; β is a vector
2.4.2. Truncated Regression
A truncated regression fits a regression model on a sample drawn from a restricted part of
the population. Under the normality assumption of the whole population, the error terms in
a truncated regression model have a truncated normal distribution, which is a normal
distribution that has been scaled upward so that the distribution integrates to one over the
restricted range.
The intensity of commercialization is modeled as a regression truncated at zero:
Z*i=xiγ+µi, µi̴̴̴Ν(0,δ2) (2)
Zi = z*i if z*i> 0 and yi=1
0 otherwise
where, zi is the intensity of commercialization which depends on latent variable zi* being
greater than zero and conditional to the decision to commercialize yi; γ is parameter to be
estimated.Truncation reduces variance compared to the variance in the untruncated
314 Afr. J. Agric. Res.
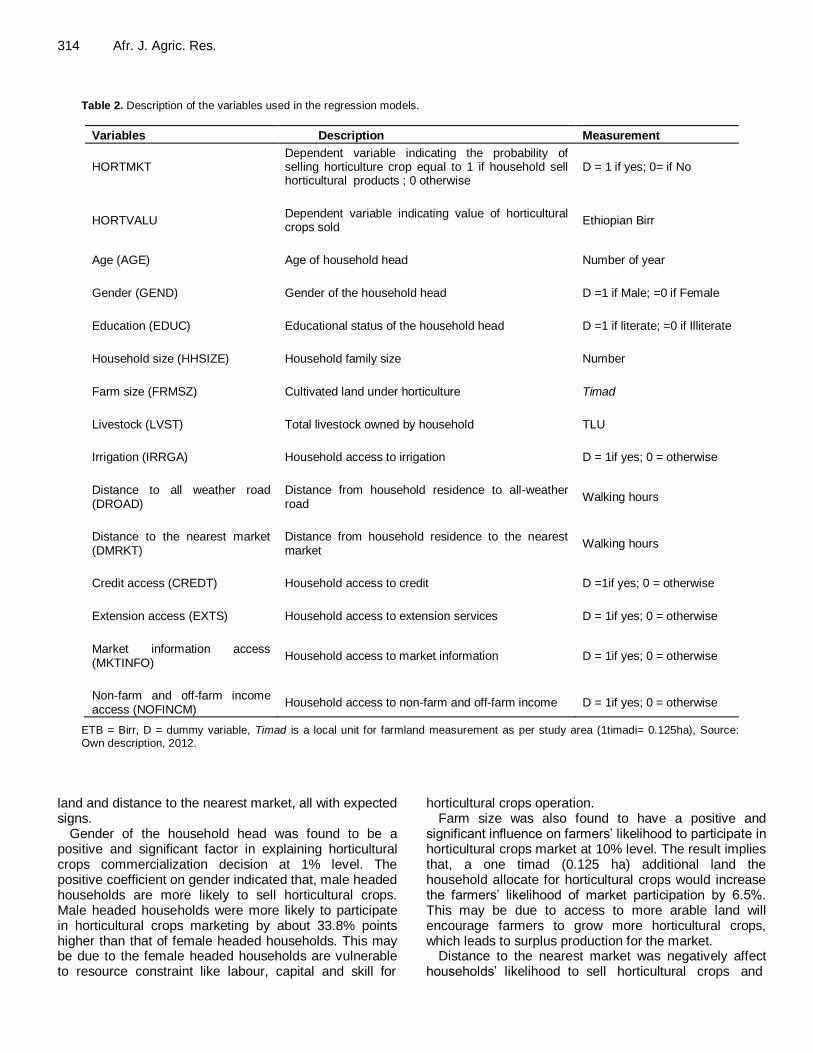
Table 2. Description of the variables used in the regression models.
Variables Description Measurement
HORTMKT Dependent variable indicating the probability of selling horticulture crop equal to 1 if household sell horticultural products ; 0 otherwise
D = 1 if yes; 0= if No
HORTVALU Dependent variable indicating value of horticultural crops sold
Ethiopian Birr
Age (AGE) Age of household head Number of year
Gender (GEND) Gender of the household head D =1 if Male; =0 if Female
Education (EDUC) Educational status of the household head D =1 if literate; =0 if Illiterate
Household size (HHSIZE) Household family size Number
Farm size (FRMSZ) Cultivated land under horticulture Timad
Livestock (LVST) Total livestock owned by household TLU
Irrigation (IRRGA) Household access to irrigation D = 1if yes; 0 = otherwise
Distance to all weather road (DROAD)
Distance from household residence to all-weather road
Walking hours
Distance to the nearest market (DMRKT)
Distance from household residence to the nearest market
Walking hours
Credit access (CREDT) Household access to credit D =1if yes; 0 = otherwise
Extension access (EXTS) Household access to extension services D = 1if yes; 0 = otherwise
Market information access (MKTINFO)
Household access to market information D = 1if yes; 0 = otherwise
Non-farm and off-farm income access (NOFINCM)
Household access to non-farm and off-farm income D = 1if yes; 0 = otherwise
ETB = Birr, D = dummy variable, Timad is a local unit for farmland measurement as per study area (1timadi= 0.125ha), Source: Own description, 2012.
land and distance to the nearest market, all with expected signs.
Gender of the household head was found to be a positive and significant factor in explaining horticultural crops commercialization decision at 1% level. The positive coefficient on gender indicated that, male headed households are more likely to sell horticultural crops. Male headed households were more likely to participate in horticultural crops marketing by about 33.8% points higher than that of female headed households. This may be due to the female headed households are vulnerable to resource constraint like labour, capital and skill for
horticultural crops operation. Farm size was also found to have a positive and
significant influence on farmers’ likelihood to participate in horticultural crops market at 10% level. The result implies that, a one timad (0.125 ha) additional land the household allocate for horticultural crops would increase the farmers’ likelihood of market participation by 6.5%. This may be due to access to more arable land will encourage farmers to grow more horticultural crops, which leads to surplus production for the market.
Distance to the nearest market was negatively affect households’ likelihood to sell horticultural crops and
Tufa et al. 315
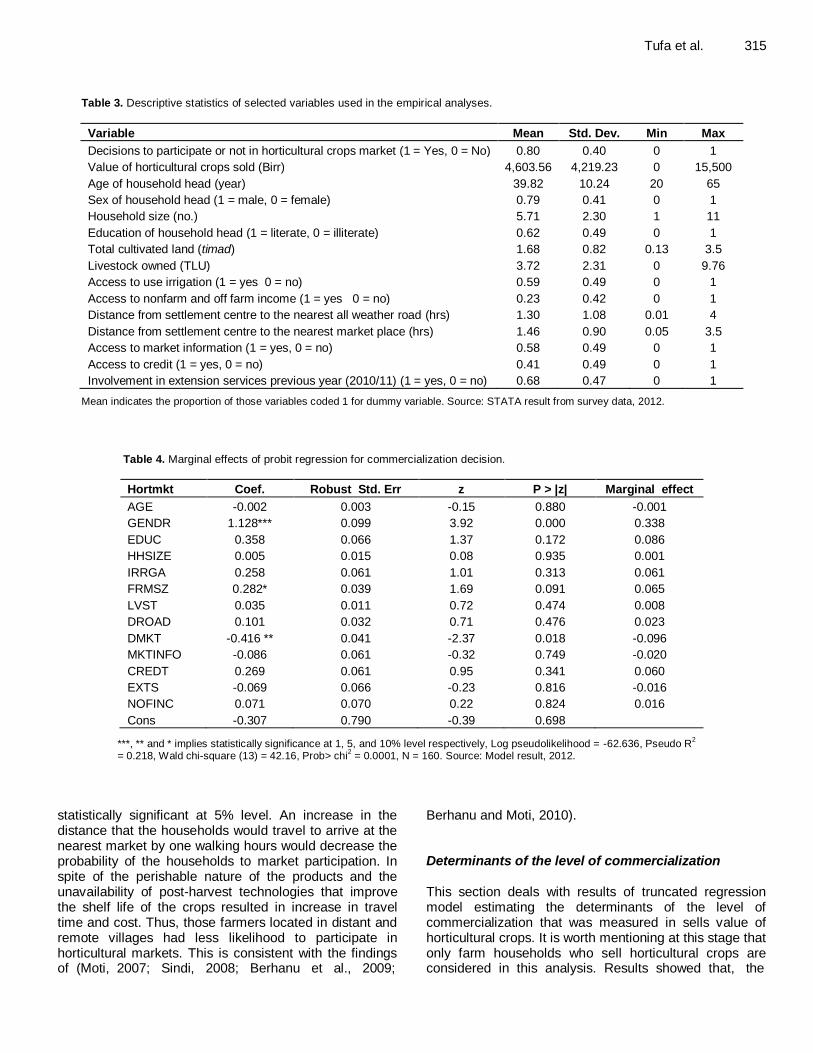
Table 3. Descriptive statistics of selected variables used in the empirical analyses.
Variable Mean Std. Dev. Min Max
Decisions to participate or not in horticultural crops market (1 = Yes, 0 = No) 0.80 0.40 0 1
Value of horticultural crops sold (Birr) 4,603.56 4,219.23 0 15,500
Age of household head (year) 39.82 10.24 20 65
Sex of household head (1 = male, 0 = female) 0.79 0.41 0 1
Household size (no.) 5.71 2.30 1 11
Education of household head (1 = literate, 0 = illiterate) 0.62 0.49 0 1
Total cultivated land (timad) 1.68 0.82 0.13 3.5
Livestock owned (TLU) 3.72 2.31 0 9.76
Access to use irrigation (1 = yes 0 = no) 0.59 0.49 0 1
Access to nonfarm and off farm income (1 = yes 0 = no) 0.23 0.42 0 1
Distance from settlement centre to the nearest all weather road (hrs) 1.30 1.08 0.01 4
Distance from settlement centre to the nearest market place (hrs) 1.46 0.90 0.05 3.5
Access to market information (1 = yes, 0 = no) 0.58 0.49 0 1
Access to credit (1 = yes, 0 = no) 0.41 0.49 0 1
Involvement in extension services previous year (2010/11) (1 = yes, 0 = no) 0.68 0.47 0 1
Mean indicates the proportion of those variables coded 1 for dummy variable. Source: STATA result from survey data, 2012.
Table 4. Marginal effects of probit regression for commercialization decision.
Hortmkt Coef. Robust Std. Err z P > |z| Marginal effect
AGE -0.002 0.003 -0.15 0.880 -0.001
GENDR 1.128*** 0.099 3.92 0.000 0.338
EDUC 0.358 0.066 1.37 0.172 0.086
HHSIZE 0.005 0.015 0.08 0.935 0.001
IRRGA 0.258 0.061 1.01 0.313 0.061
FRMSZ 0.282* 0.039 1.69 0.091 0.065
LVST 0.035 0.011 0.72 0.474 0.008
DROAD 0.101 0.032 0.71 0.476 0.023
DMKT -0.416 ** 0.041 -2.37 0.018 -0.096
MKTINFO -0.086 0.061 -0.32 0.749 -0.020
CREDT 0.269 0.061 0.95 0.341 0.060
EXTS -0.069 0.066 -0.23 0.816 -0.016
NOFINC 0.071 0.070 0.22 0.824 0.016
Cons -0.307 0.790 -0.39 0.698
***, ** and * implies statistically significance at 1, 5, and 10% level respectively, Log pseudolikelihood = -62.636, Pseudo R2
= 0.218, Wald chi-square (13) = 42.16, Prob> chi2 = 0.0001, N = 160. Source: Model result, 2012.
statistically significant at 5% level. An increase in the distance that the households would travel to arrive at the nearest market by one walking hours would decrease the probability of the households to market participation. In spite of the perishable nature of the products and the unavailability of post-harvest technologies that improve the shelf life of the crops resulted in increase in travel time and cost. Thus, those farmers located in distant and remote villages had less likelihood to participate in horticultural markets. This is consistent with the findings of (Moti, 2007; Sindi, 2008; Berhanu et al., 2009;
Berhanu and Moti, 2010). Determinants of the level of commercialization This section deals with results of truncated regression model estimating the determinants of the level of commercialization that was measured in sells value of horticultural crops. It is worth mentioning at this stage that only farm households who sell horticultural crops are considered in this analysis. Results showed that, the
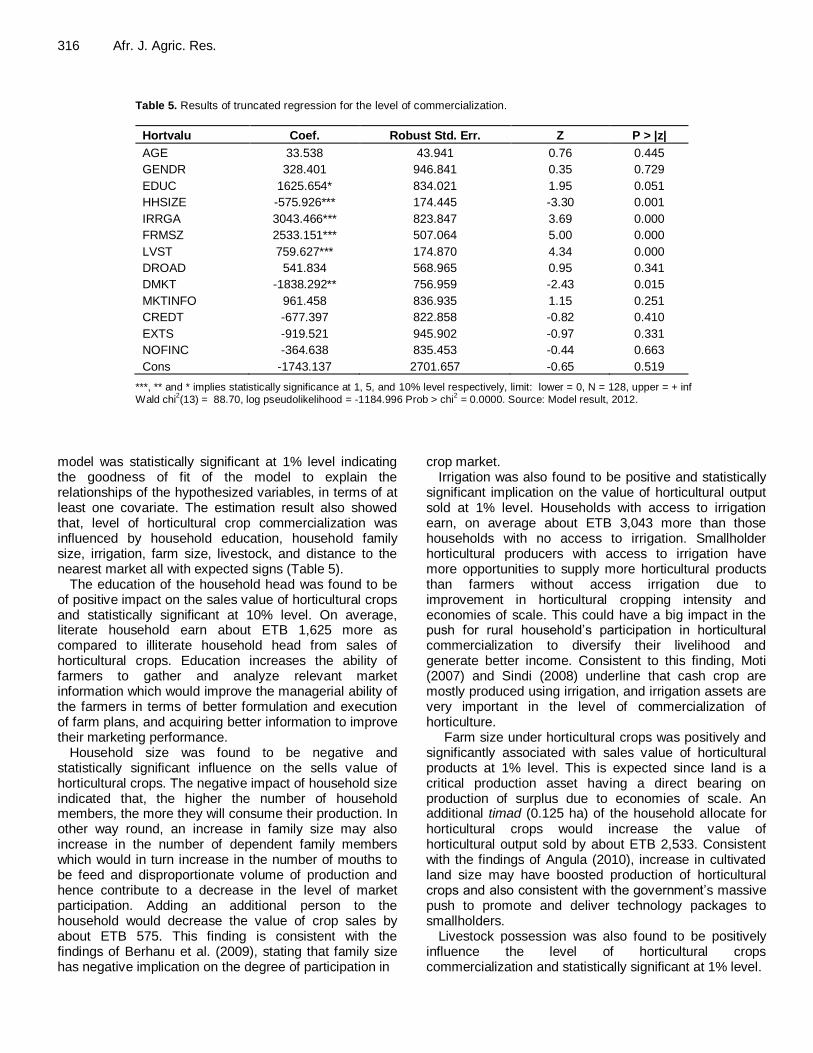
316 Afr. J. Agric. Res.
Table 5. Results of truncated regression for the level of commercialization.
Hortvalu Coef. Robust Std. Err. Z P > |z|
AGE 33.538 43.941 0.76 0.445
GENDR 328.401 946.841 0.35 0.729
EDUC 1625.654* 834.021 1.95 0.051
HHSIZE -575.926*** 174.445 -3.30 0.001
IRRGA 3043.466*** 823.847 3.69 0.000
FRMSZ 2533.151*** 507.064 5.00 0.000
LVST 759.627*** 174.870 4.34 0.000
DROAD 541.834 568.965 0.95 0.341
DMKT -1838.292** 756.959 -2.43 0.015
MKTINFO 961.458 836.935 1.15 0.251
CREDT -677.397 822.858 -0.82 0.410
EXTS -919.521 945.902 -0.97 0.331
NOFINC -364.638 835.453 -0.44 0.663
Cons -1743.137 2701.657 -0.65 0.519
***, ** and * implies statistically significance at 1, 5, and 10% level respectively, limit: lower = 0, N = 128, upper = + inf
Wald chi2(13) = 88.70, log pseudolikelihood = -1184.996 Prob > chi
2 = 0.0000. Source: Model result, 2012.
model was statistically significant at 1% level indicating the goodness of fit of the model to explain the relationships of the hypothesized variables, in terms of at least one covariate. The estimation result also showed that, level of horticultural crop commercialization was influenced by household education, household family size, irrigation, farm size, livestock, and distance to the nearest market all with expected signs (Table 5).
The education of the household head was found to be of positive impact on the sales value of horticultural crops and statistically significant at 10% level. On average, literate household earn about ETB 1,625 more as compared to illiterate household head from sales of horticultural crops. Education increases the ability of farmers to gather and analyze relevant market information which would improve the managerial ability of the farmers in terms of better formulation and execution of farm plans, and acquiring better information to improve their marketing performance.
Household size was found to be negative and statistically significant influence on the sells value of horticultural crops. The negative impact of household size indicated that, the higher the number of household members, the more they will consume their production. In other way round, an increase in family size may also increase in the number of dependent family members which would in turn increase in the number of mouths to be feed and disproportionate volume of production and hence contribute to a decrease in the level of market participation. Adding an additional person to the household would decrease the value of crop sales by about ETB 575. This finding is consistent with the findings of Berhanu et al. (2009), stating that family size has negative implication on the degree of participation in
crop market. Irrigation was also found to be positive and statistically
significant implication on the value of horticultural output sold at 1% level. Households with access to irrigation earn, on average about ETB 3,043 more than those households with no access to irrigation. Smallholder horticultural producers with access to irrigation have more opportunities to supply more horticultural products than farmers without access irrigation due to improvement in horticultural cropping intensity and economies of scale. This could have a big impact in the push for rural household’s participation in horticultural commercialization to diversify their livelihood and generate better income. Consistent to this finding, Moti (2007) and Sindi (2008) underline that cash crop are mostly produced using irrigation, and irrigation assets are very important in the level of commercialization of horticulture.
Farm size under horticultural crops was positively and significantly associated with sales value of horticultural products at 1% level. This is expected since land is a critical production asset having a direct bearing on production of surplus due to economies of scale. An additional timad (0.125 ha) of the household allocate for horticultural crops would increase the value of horticultural output sold by about ETB 2,533. Consistent with the findings of Angula (2010), increase in cultivated land size may have boosted production of horticultural crops and also consistent with the government’s massive push to promote and deliver technology packages to smallholders.
Livestock possession was also found to be positively influence the level of horticultural crops commercialization and statistically significant at 1% level.

The positive coefficient of livestock possession implies that an increase in livestock possession by one TLU would increase the value of horticultural outputs the household sold by about ETB 759. One reason could be that, livestock provides manures as manure is the main nutrient used by farmers for crop production in study area and livestock are the main source for this nutrient, the increase in the number of livestock owned would improve the horticultural crops productivity and hence increases the marketable surpluses. This is consistent with the findings of Solomon et al. (2010) which suggest that farmers with more livestock tend to have higher market integration.
Distance to the nearest market was again found to be negatively and statistically significant influence on the value of horticultural output sold at 5% level. The shorter the time taken to reach the nearest market would result to a greater degree of commercialization of horticultural crops. Distance to market was negatively affecting the value of horticultural product sold possibly because of the increased transaction costs associated with marketing of the farmers’ agricultural produce. This implies that the location of farmers in respect of potential markets is an important factor in encouraging farmers to increase their sales. This result is in conformity with the findings of Berhanu and Moti (2010) and Solomon et al. (2010), which found that being closer to market, enhance market participation. CONCLUSIONS AND IMPLICATIONS
Transforming the subsistence-oriented production system into a market-oriented production system as a way to increase the smallholder farmer’s income and reduce rural poverty has been in the policy spotlight of many developing countries, including Ethiopia. There is need to deliberately improve the smallholder commercialization decision as well as the level of commercialization in order to facilitate stable incomes and sustainable livelihoods. This study has identified household level determinants of the output side commercialization decision and the level of commercialization in horticultural crops in Gemechis district, West Hararghe zone, Oromia National Regional State, Ethiopia.
Some relevant policy implications can be drawn from the findings of this study that can help to design appropriate intervention mechanisms to improve the smallholder commercialization of horticultural crops in the study area. The fact that distance to the market places has become important determinants of farmers participation in the marketing of horticultural crops suggests the role of policies geared towards improving physical access to market places could yield positive results towards improving commercialization of smallholder farmers of horticultural crops. As a result, improving rural infrastructure in developing market infrastructure in the form of establishing produce
Tufa et al. 317 collection points across rural areas would assist poor farmers for faster delivery of farm produces especially perishable commodities of horticultural crops.
Gender is significant factor in determining commercialization decision. Therefore, policies should aim at supporting the female headed households by way of proving inputs, knowledge about the horticultural crops. As a result increasing women access to assets, institutional services, and market access and market information is required to boost their production and productivity in horticultural crops and improve their market participation of horticultural crops. Household size is an important determinant of the level of horticultural crop commercialization. Therefore, interventions aimed at promoting family planning amongst farm communities are required to advance the commercialization process in agriculture through increased productivity of family labour. On the other hand, provision of rural employment opportunities is essential to reduce high dependence by households on farm output only. This is a critical step in generating more marketable surplus.
Farm size and irrigation was positive implication on households’ market participation of horticultural crops. The size of land allocated for horticultural crops affected the smallholder commercialization of horticultural crops positively and significantly. However, increasing the size of landholding cannot be an option to increase horticultural crops supply since land is a finite resource. Therefore, intervention aims to increase productivity of horticultural crops per unit area of land through proper utilization of land resource in the district. Increasing the productivity of horticultural crops per unit area of land through promoting and delivering technology packages to smallholders that would increase productivity of smallholders and enables them to link up with crops output market would be a better alternative for smallholder commercialization. This intensification of agricultural production should be supported with small scale irrigation development to increase the cropping intensity as to enhance the comparative advantage of smallholders in the production of horticultural crops.
Livestock possession is also an important determinant of the sales value of horticultural crops which calls for enhancing the livestock assets of the household as it provides manures for the farm, means of transportation of their products to the market, and provide financial liquidity for the farmers. The education of the household head also plays a prominent role in the intensity of horticultural crop sales, thus, the policies should aim in upgrading the knowledge of the household head through training.
REFERENCES
Adam B, Belay K, Belaineh L, Tesfaye L (2010). Effect of crop commercial orientation on productivity of smallholder farmers in drought-prone areas of the Central Rift Valley of Ethiopia. J. Rural
Dev. 33(4):105-128. Angula M (2010). Determinants of sustainable coffee marketing channel
choice and supply response among organic and certified smallholder

318 Afr. J. Agric. Res. farmers: Evidence from Uganda. A thesis submitted in partial
fulfillment of the requirements for the degree of Master of Science of Agricultural, food and resource economics. Michigan State University.
Berhanu G, Moti J (2010). Commercialization of smallholders: Is market participation enough? Contributed Paper presented at the Joint 3rd African Association of Agricultural Economists (AAAE) and 48th
Agricultural Economists Association of South Africa (AEASA) Conference, Cape Town, South Africa, September 19-23, 2010.
Berhanu G, Moti J, Hoekstra D (2009). Smallholders, institutional
services, and commercial transformation in Ethiopia. Agric. Econ. 40:773-787.
Bezabih E, Hadera G (2007). Constraints and opportunities of
horticulture production and marketing in eastern Ethiopia. Dry Lands Coordination Group Report. Grensen 9b. Norway. pp. 46-90.
CSA (Central Statistical Agency) (2008/2009). Statistical report on area
and production of crops. Addis Ababa, Ethiopia. CSA (Central Statistical Agency) (2007). Summary and statistical report
of the 2007 population and housing census: Population Size by Age
and Sex. Dawit A, Abera D, Lemma D, Chemdo A (2004). Domestic vegetable
seed production and marketing. Research Report EARO, Ethiopia.
5:17. Demese C, Berhanu A, Mellor J (2010). Federal Democratic Republic of
Ethiopian, Ministry of Agriculture and Rural Development draft report
on Ethiopia’s Agriculture Sector Policy and Investment Framework: Ten Year Road Map (2010-2020). May, 2010, Addis Ababa, Ethiopia.
DOA (District Office of Agriculture) (2012). Reports of Gemechis district
office agriculture, 2012. Goitom A (2009). Commercialization of smallholder farming in Tigrai,
Ethiopia: Determinants and welfare outcomes. MSc. Thesis, the
University of Agder, Kristiansand, Norway. Lumpkin TA, Weinberger K, Moore S (2005). Increasing income through
fruits and vegetable production: Opportunities and challenges.
Marrakech, Morocco. P. 10. MoFED (Ministry of Finance and Economic Development) (2010).
Growth and Transformational Plan (GTP 2010-2015). Addis Ababa.
MoFED (Ministry of Finance and Economic Development) (2005).
Ethiopia: Building on progress: A plan for accelerated and sustained development to end poverty (PASDEP 2005/06-2009/10). Addis
Ababa. Moti J (2007). Econometric analysis of horticultural production and
marketing in Central and Eastern Ethiopia. PhD Thesis, Wageningen
University. Pender J, Dawit A (2007). Determinants of smallholder
commercialization of food crops: Theory and evidence from Ethiopia.
Discussion P. 75. IFPRI, Washington, DC, USA. Schneider K, Gugerty MK (2010). The impact of export-driven cash
crops on smallholder households. Evans School of Public Affairs,
University of Washington. August 17, 2010, EPAR Brief P. 94. Sindi JK (2008). Kenya’s domestic horticulture subsector: what drives
commercialization decisions by rural households? MSc. Thesis,
Michigan State University. Solomon A, Bekele S, Franklin S (2010). Does technology adoption
promote commercialization? Evidence from Chickpea Technologies
in Ethiopia. Tilaye B (2010). How to involve smallholder farmers in commercial
agriculture/horticulture. Ethiopian horticulture producers and
exporters association, Ethiopia, Addis Ababa. Wooldridge J (2002). Econometric analysis of cross section and panel
data.MIT Press, USA.
World Bank (2008). World development report: Agriculture for development. Washington DC, USA.
World Bank (2004). Opportunities and challenges for developing high-
value agricultural exports in Ethiopia. Report No. I, Confidential Draft, April 9, 2004.
Yilma T (2009). United Nations conference on trade and development.
Expert meeting of LDCs in preparation for the 4th United Nations Conference on the Least Developed Countries, Case study on Ethiopia.
Tufa et al. 319
Appendix
Appendix Table 1. VIF for multicollinearity test.
Variable VIF 1/VIF
Droad 2.17 0.460
Dmarket 2.04 0.490
Age 1.49 0.669
Hsize 1.49 0.670
Cultlnd 1.34 0.744
Marketinfo 1.19 0.842
Extension 1.18 0.847
Hheduc 1.18 0.850
Livestock 1.15 0.869
Credit 1.15 0.869
Irrig 1.11 0.903
Gender 1.08 0.922
Nfarmiacc 1.08 0.923
MEAN VIF 1.36
Source: Own computational from survey data, 2012.