Crop Production
92
United States Department of Agriculture National Agricultural Statistics Service Cr Pr 2-1 (05) Crop Production 2004 Summary January 2005
-
Upload
khangminh22 -
Category
Documents
-
view
0 -
download
0
Transcript of Crop Production
United StatesDepartment ofAgriculture
NationalAgriculturalStatisticsService
Cr Pr 2-1 (05)
Crop Production2004 Summary
January 2005
Crop Production 2004 Summary Agricultural Statistics BoardJanuary 2005 1 NASS, USDA
Corn for grain production is estimated at 11.8 billion bushels, up less than 1 percent from the November forecastand up 17 percent from the 10.1 billion bushels produced in 2003. The average U.S. grain yield is estimated at160.4 bushels per acre, 0.2 bushels above the November forecast and up 18.2 bushels from 2003. Both productionand yield estimates are the largest on record. The previous record for both was set last year when production wasestimated at 10.1 billion bushels and yield was 142.2 bushels per acre.
Sorghum for grain production in 2004 is estimated at 455 million bushels, down 4 percent from the Novemberforecast but 11 percent above 2003. Area harvested for grain is estimated at 6.52 million acres, down 16 percentfrom 2003. Average grain yield, at 69.8 bushels per acre, is 17.1 bushels above the 2003 average yield.
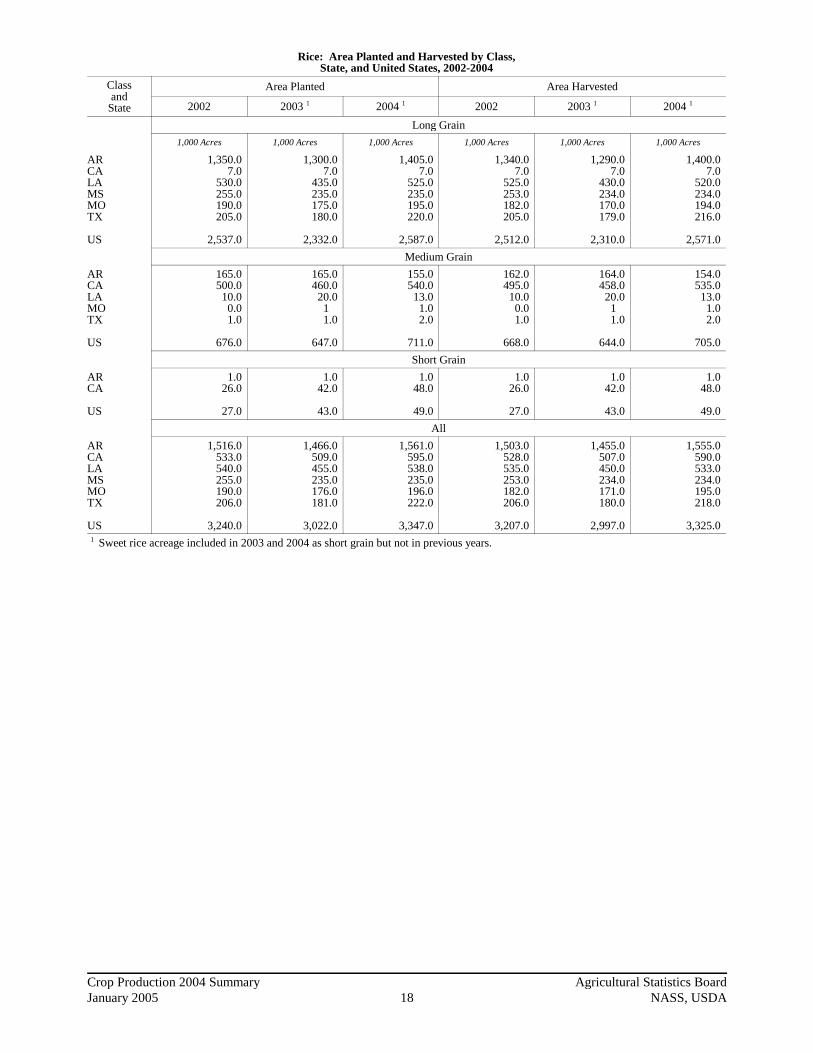
Rice production in 2004 totaled a record high 231 million cwt, up 15 percent from 2003 and up 1 percent from theNovember forecast. Area for harvest, at 3.33 million acres, is up 11 percent from 2003. The average yield for allU.S. rice is estimated at 6,942 pounds per acre, 272 pounds above the 2003 yield. This all rice yield is the higheston record and the fifth consecutive year a new record high yield has been established. The adoption of higheryielding rice varieties by producers continues to drive the increase in yields.
Soybean production in 2004 totaled 3.14 billion bushels, the largest U.S. soybean crop in history. This is downslightly from the November forecast but 28 percent above the 2003 level. The average yield per acre is estimated ata record high 42.5 bushels, 0.1 bushel below the November forecast, but 8.6 bushels above the 2003 final yield.
All cotton production is estimated at record high 23.0 million bales, up less than 1 percent from last month and26 percent more than last year’s production. Yield is expected to average a record high 846 pounds per acre, up116 pounds per acre from a year ago. Harvested area, at 13.1 million acres, is down 1 percent from December but9 percent above 2003.
This report was approved on January 12, 2005.
Secretary ofAgriculture
Ann M. Veneman
Agricultural Statistics BoardChairpersonRich Allen

Crop Production 2004 Summary Agricultural Statistics BoardJanuary 2005 2 NASS, USDA
Contents
PagePrincipal Crops . . . . . . . . . . . . . . . . . . . . . . . . . . . 3
Grains & HayBarley . . . . . . . . . . . . . . . . . . . . . . . . . . . . . . 11Corn for Grain . . . . . . . . . . . . . . . . . . . . . . . . . 4 Ears Per Acre . . . . . . . . . . . . . . . . . . . . . . . . 7Corn for Silage . . . . . . . . . . . . . . . . . . . . . . . . 6Forage . . . . . . . . . . . . . . . . . . . . . . . . . . . . . . 28Hay, Alfalfa . . . . . . . . . . . . . . . . . . . . . . . . . 24Hay, All . . . . . . . . . . . . . . . . . . . . . . . . . . . . . 22Hay, Other . . . . . . . . . . . . . . . . . . . . . . . . . . . 26Haylage . . . . . . . . . . . . . . . . . . . . . . . . . . . . . 29Oats . . . . . . . . . . . . . . . . . . . . . . . . . . . . . . . . 10Proso Millet . . . . . . . . . . . . . . . . . . . . . . . . . . 21Rice . . . . . . . . . . . . . . . . . . . . . . . . . . . . . . . . 18Rye . . . . . . . . . . . . . . . . . . . . . . . . . . . . . . . . 20Sorghum for Grain . . . . . . . . . . . . . . . . . . . . . 8Sorghum for Silage . . . . . . . . . . . . . . . . . . . . . 9Wheat, All . . . . . . . . . . . . . . . . . . . . . . . . . . . 12Wheat, By Class . . . . . . . . . . . . . . . . . . . . . . 16Wheat, Durum . . . . . . . . . . . . . . . . . . . . . . . . 16 Head Population . . . . . . . . . . . . . . . . . . . . . 17Wheat, Other Spring . . . . . . . . . . . . . . . . . . . 17 Head Population . . . . . . . . . . . . . . . . . . . . . 17Wheat, Winter . . . . . . . . . . . . . . . . . . . . . . . . 14
OilseedsCanola . . . . . . . . . . . . . . . . . . . . . . . . . . . . . . 31Flaxseed . . . . . . . . . . . . . . . . . . . . . . . . . . . . 37Peanuts . . . . . . . . . . . . . . . . . . . . . . . . . . . . . 31Mustard Seed . . . . . . . . . . . . . . . . . . . . . . . . 37Rapeseed . . . . . . . . . . . . . . . . . . . . . . . . . . . . 37Safflower . . . . . . . . . . . . . . . . . . . . . . . . . . . . 37Soybeans . . . . . . . . . . . . . . . . . . . . . . . . . . . . 34 Pods with Beans per 18 Square Feet . . . . . 36Sunflower . . . . . . . . . . . . . . . . . . . . . . . . . . . 32
PageCotton, Tobacco & Sugar Crops
Cotton . . . . . . . . . . . . . . . . . . . . . . . . . . . . . . 38Cottonseed . . . . . . . . . . . . . . . . . . . . . . . . . . 40Sugarbeets . . . . . . . . . . . . . . . . . . . . . . . . . . . 46Sugarcane . . . . . . . . . . . . . . . . . . . . . . . . . . . 47Tobacco, by Class and Type . . . . . . . . . . . . . 42Tobacco, by States . . . . . . . . . . . . . . . . . . . . 41
Dry Beans, Peas & LentilsDry Edible Beans . . . . . . . . . . . . . . . . . . . . . 48Lentils . . . . . . . . . . . . . . . . . . . . . . . . . . . . . . 57Dry Edible Peas . . . . . . . . . . . . . . . . . . . . . . . 58Austrian Winter Peas . . . . . . . . . . . . . . . . . . . 58Wrinkled Seed Peas . . . . . . . . . . . . . . . . . . . . 57
Potatoes & Miscellaneous CropsPotatoes . . . . . . . . . . . . . . . . . . . . . . . . . . . . . 59Sweet Potatoes . . . . . . . . . . . . . . . . . . . . . . . 64Coffee . . . . . . . . . . . . . . . . . . . . . . . . . . . . . . 68Ginger Root . . . . . . . . . . . . . . . . . . . . . . . . . . 68Hops . . . . . . . . . . . . . . . . . . . . . . . . . . . . . . . 66Maple Syrup . . . . . . . . . . . . . . . . . . . . . . . . . 68Mint Oil . . . . . . . . . . . . . . . . . . . . . . . . . . . . 65Taro . . . . . . . . . . . . . . . . . . . . . . . . . . . . . . . . 68
Alaska . . . . . . . . . . . . . . . . . . . . . . . . . . . . . . . . . 69
Crop Comments . . . . . . . . . . . . . . . . . . . . . . . . . 78Crop Summary . . . . . . . . . . . . . . . . . . . . . . . . . . 70Information Contacts . . . . . . . . . . . . . . . . . . . . . 89Weather Summary . . . . . . . . . . . . . . . . . . . . . . . 74
Crop Production 2004 Summary Agricultural Statistics BoardJanuary 2005 3 NASS, USDA
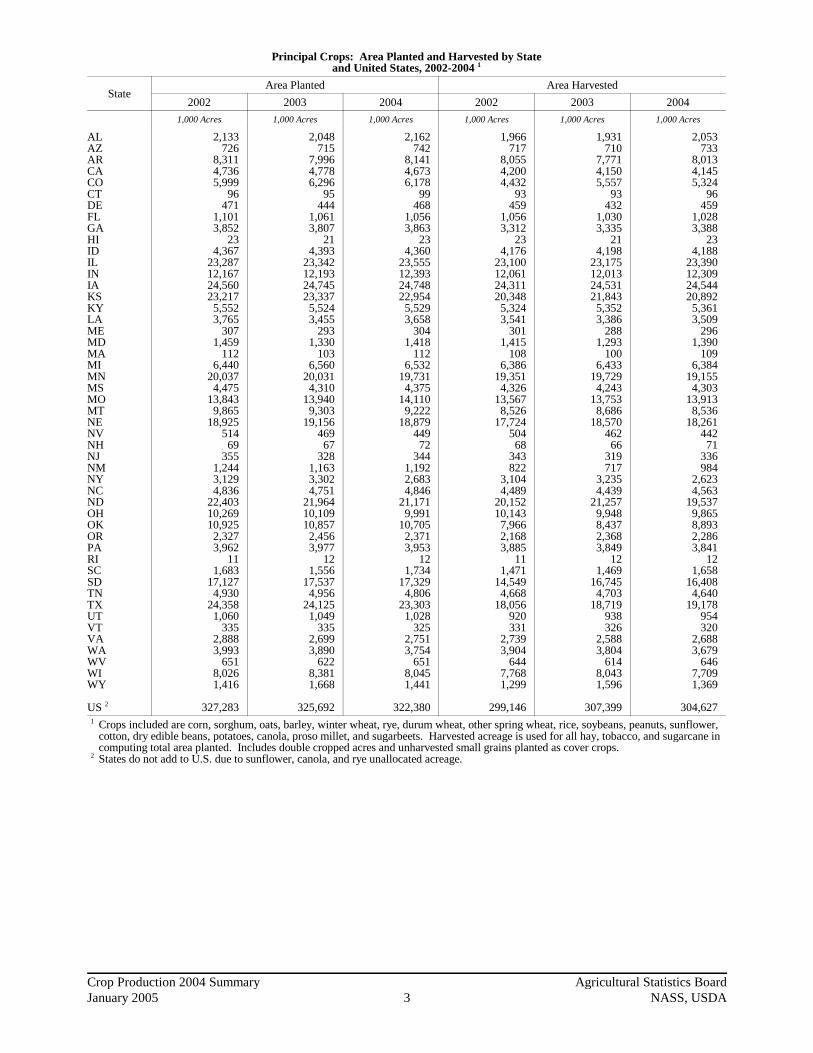
Principal Crops: Area Planted and Harvested by Stateand United States, 2002-2004 1
StateArea Planted Area Harvested
2002 2003 2004 2002 2003 2004
1,000 Acres 1,000 Acres 1,000 Acres 1,000 Acres 1,000 Acres 1,000 Acres
ALAZARCACOCTDEFLGAHIIDILINIAKSKYLAMEMDMAMIMNMSMOMTNENVNHNJNMNYNCNDOHOKORPARISCSDTNTXUTVTVAWAWVWIWY
US 2
2,133726
8,3114,7365,999
96471
1,1013,852
234,367
23,28712,16724,56023,217
5,5523,765
3071,459
1126,440
20,0374,475
13,8439,865
18,92551469
3551,2443,1294,836
22,40310,26910,925
2,3273,962
111,683
17,1274,930
24,3581,060
3352,8883,993
6518,0261,416
327,283
2,048715
7,9964,7786,296
95444
1,0613,807
214,393
23,34212,19324,74523,337
5,5243,455
2931,330
1036,560
20,0314,310
13,9409,303
19,15646967
3281,1633,3024,751
21,96410,10910,857
2,4563,977
121,556
17,5374,956
24,1251,049
3352,6993,890
6228,3811,668
325,692
2,162742
8,1414,6736,178
99468
1,0563,863
234,360
23,55512,39324,74822,9545,5293,658
3041,418
1126,532
19,7314,375
14,1109,222
18,87944972
3441,1922,6834,846
21,1719,991
10,7052,3713,953
121,734
17,3294,806
23,3031,028
3252,7513,754
6518,0451,441
322,380
1,966717
8,0554,2004,432
93459
1,0563,312
234,176
23,10012,06124,31120,3485,3243,541
3011,415
1086,386
19,3514,326
13,5678,526
17,724504
68343822
3,1044,489
20,15210,1437,9662,1683,885
111,471
14,5494,668
18,056920331
2,7393,904
6447,7681,299
299,146
1,931710
7,7714,1505,557
93432
1,0303,335
214,198
23,17512,01324,53121,8435,3523,386
2881,293
1006,433
19,7294,243
13,7538,686
18,570462
66319717
3,2354,439
21,2579,9488,4372,3683,849
121,469
16,7454,703
18,719938326
2,5883,804
6148,0431,596
307,399
2,053733
8,0134,1455,324
96459
1,0283,388
234,188
23,39012,30924,54420,892
5,3613,509
2961,390
1096,384
19,1554,303
13,9138,536
18,26144271
336984
2,6234,563
19,5379,8658,8932,2863,841
121,658
16,4084,640
19,178954320
2,6883,679
6467,7091,369
304,627 1 Crops included are corn, sorghum, oats, barley, winter wheat, rye, durum wheat, other spring wheat, rice, soybeans, peanuts, sunflower,
cotton, dry edible beans, potatoes, canola, proso millet, and sugarbeets. Harvested acreage is used for all hay, tobacco, and sugarcane incomputing total area planted. Includes double cropped acres and unharvested small grains planted as cover crops.
2 States do not add to U.S. due to sunflower, canola, and rye unallocated acreage.

Crop Production 2004 Summary Agricultural Statistics BoardJanuary 2005 4 NASS, USDA
Corn: Area Planted for All Purposes and Harvested for Grainby State and United States, 2002-2004
StateArea Planted for All Purposes Area Harvested for Grain
2002 2003 2004 2002 2003 2004
1,000 Acres 1,000 Acres 1,000 Acres 1,000 Acres 1,000 Acres 1,000 Acres
ALAZARCACOCT 1
DEFLGAIDILINIAKSKYLAME 1
MDMA 1
MIMNMSMOMTNENV 1
NH 1
NJNMNYNCNDOHOKORPARI 1
SCSDTNTXUTVT 1
VAWAWVWIWY
US
20060
265545
1,20032
18075
340190
11,1005,400
12,2003,2501,160
58029
51022
2,2507,200
5502,800
658,400
41590
1401,020
7801,2303,250
24048
1,4002
3204,450
6902,050
5795
50013050
3,65080
78,894
22047
365530
1,08030
17075
340190
11,2005,600
12,3002,9001,170
52028
48020
2,2507,200
5502,900
688,100
41580
1301,000
7401,4503,300
23051
1,4502
2404,400
7101,830
5510047013048
3,75085
78,603
22053
320540
1,20031
16070
335230
11,7505,700
12,7003,1001,210
42028
49020
2,2007,500
4602,950
708,250
41586
125980820
1,8003,350
25058
1,4002
3154,650
6801,830
5595
50017048
3,60090
80,930
18028
255150720
16737
29045
10,9005,220
11,8502,6001,070
540
425
2,0006,700
5302,700
137,350
7049
460680995
2,970190
20840
2603,250
6101,790
16
3257030
2,90035
69,330
19022
350140890
16239
29050
11,0505,390
11,9002,5001,080
500
410
2,0306,650
5302,800
177,700
6148
440680
1,1703,070
19030
890
2153,850
6201,650
13
3307027
2,85050
70,944
19527
305150
1,040
15332
28075
11,6005,530
12,4002,8801,140
410
425
1,9207,050
4402,880
157,950
7258
500740
1,1503,110
20028
980
2954,150
6151,680
12
36010529
2,60051
73,632 1 Area harvested for grain not estimated.

Crop Production 2004 Summary Agricultural Statistics BoardJanuary 2005 5 NASS, USDA
Corn for Grain: Yield and Production by Stateand United States, 2002-2004
StateYield Production
2002 2003 2004 2002 2003 2004
Bushels Bushels Bushels 1,000 Bushels 1,000 Bushels 1,000 Bushels
ALAZARCACOCT 1
DEFLGAIDILINIAKSKYLAME 1
MDMA 1
MIMNMSMOMTNENV 1
NH 1
NJNMNYNCNDOHOKORPARI 1
SCSDTNTXUTVT 1
VAWAWVWIWY
US
88.0185.0134.0170.0150.0
84.096.0
110.0155.0135.0121.0163.0116.0104.0121.0
74.0
117.0157.0120.0105.0140.0128.0
61.0175.0
97.083.0
114.089.0
130.0160.0
68.0
47.095.0
107.0113.0142.0
68.0190.0105.0135.0119.0
129.3
122.0190.0140.0160.0135.0
123.082.0
129.0140.0164.0146.0157.0120.0137.0134.0
123.0
128.0146.0135.0108.0140.0146.0
113.0180.0121.0106.0112.0156.0125.0170.0115.0
105.0111.0131.0118.0155.0
115.0195.0115.0129.0129.0
142.2
123.0180.0140.0175.0135.0
152.090.0
130.0170.0180.0168.0181.0150.0152.0135.0
153.0
134.0159.0136.0162.0143.0166.0
143.0180.0122.0117.0105.0158.0150.0170.0140.0
100.0130.0140.0139.0155.0
145.0200.0131.0136.0131.0
160.4
15,8405,180
34,17025,500
108,000
14,0283,552
31,9006,975
1,471,500631,620
1,931,550301,600111,280
65,340
31,450
234,0001,051,900
63,600283,500
1,820940,800
4,2708,575
44,62056,440
113,430264,330
24,7003,200
57,120
12,220308,750
65,270202,270
2,272
22,10013,3003,150
391,5004,165
8,966,787
23,1804,180
49,00022,400
120,150
19,9263,198
37,4107,000
1,812,200786,940
1,868,300300,000147,960
67,000
50,430
259,840970,900
71,550302,400
2,3801,124,200
6,8938,640
53,24072,080
131,040478,920
23,7505,100
102,350
22,575427,350
81,220194,700
2,015
37,95013,6503,105
367,6506,450
10,089,222
23,9854,860
42,70026,250
140,400
23,2562,880
36,40012,750
2,088,000929,040
2,244,400432,000173,280
55,350
65,025
257,2801,120,950
59,840466,560
2,1451,319,700
10,29610,44061,00086,580
120,750491,380
30,0004,760
137,200
29,500539,500
86,100233,520
1,860
52,20021,000
3,799353,600
6,681
11,807,217 1 Not estimated.

Crop Production 2004 Summary Agricultural Statistics BoardJanuary 2005 6 NASS, USDA
Corn for Silage: Area Harvested, Yield, and Productionby State and United States, 2002-2004
StateArea Harvested Yield Production
2002 2003 2004 2002 2003 2004 2002 2003 2004
1,000 Acres 1,000 Acres 1,000 Acres Tons Tons Tons 1,000 Tons 1,000 Tons 1,000 Tons
ALAZARCACOCTDEFLGAIDILINIAKSKYLAMEMDMAMIMNMSMOMTNENVNHNJNMNYNCNDOHOKORPARISCSDTNTXUTVTVAWAWVWIWY
US
1531
539015029103140
1401151402703208510268018
240400157049
4504
141890
55075
1802502926
5402
1587065
1304091
1556019
73040
7,122
2024
83859028
52845
1351101503302808010256517
210475108049
3004
141880
55055
2201702420
55027
47060
1204191
1356019
88034
6,583
1025
538511028
63345
15011014023017065
5256017
265400155051
2304
141366
47075
2151903030
4002
1245055
1104290
1356518
95037
6,103
12.025.014.026.018.018.014.018.017.026.015.016.019.010.016.012.017.012.019.015.017.015.013.022.010.520.019.511.024.014.012.07.0
10.019.023.011.516.512.06.5
15.018.521.016.011.526.016.516.018.0
14.4
12.028.015.026.021.017.516.019.017.026.015.019.020.011.018.016.018.016.019.016.014.015.010.524.013.023.019.515.023.017.516.06.8
19.018.022.014.518.015.08.5
17.018.021.018.517.525.015.516.022.0
16.3
17.027.017.026.022.521.517.017.016.026.520.020.519.515.017.512.019.520.022.018.016.014.014.522.016.522.021.020.025.017.019.0
8.717.019.025.018.020.016.011.019.023.022.019.520.026.017.014.022.0
17.6
18077570
10,1402,700
522140558680
3,6401,7252,2405,1303,2001,360
120442960342
3,6006,800
225910
1,0784,725
80273198
2,1607,700
9001,2602,500
551598
6,21033
1805,655
9752,405
8401,4561,7831,560
31411,680
720
102,293
240672120
10,0101,890
49080
532765
3,5101,6502,8506,6003,0801,440
160450
1,040323
3,3606,650
150840
1,1763,900
92273270
1,8409,625
8801,4963,230
432440
7,97536
1053,9951,0202,160
8611,6842,3631,500
29514,080
748
107,378
170675
8510,010
2,475602102561720
3,9752,2002,8704,4852,5501,138
60488
1,200374
4,7706,400
210725
1,1223,795
88294260
1,6507,9901,4251,8713,230
570750
7,20040
1924,9501,0452,530
9241,7552,7001,690
30613,300
814
107,336

Crop Production 2004 Summary Agricultural Statistics BoardJanuary 2005 7 NASS, USDA
Corn for Grain: Objective Yield Data
The National Agricultural Statistics Service conducted an Objective Yield survey in 10 corn producing Statesduring 2004. Randomly selected plots in corn for grain fields were visited monthly from August through harvest toobtain specific counts and measurements. Data in this table are rounded actual field counts from this survey.
Corn for Grain: Number of Ears per Acre,Selected States, 2000-2004
State Month 2000 2001 2002 2003 2004
Number Number Number Number Number
IL
IN
IA
KS 1
MN
MO 2
NE All
NE Irrigated
NE Non-Irrigated
OH
SD 2
WI
SepOctNovFinal
SepOctNovFinal
SepOctNovFinal
SepOctNovFinal
SepOctNovFinal
SepOctNovFinal
SepOctNovFinal
SepOctNovFinal
SepOctNovFinal
SepOctNovFinal
SepOctNovFinal
SepOctNovFinal
25,50025,45025,45025,450
24,50024,55024,65024,650
26,00025,60025,65025,650
27,35027,35027,25027,250
22,80022,75022,70022,750
26,50026,35026,35026,350
17,55017,50017,50017,500
24,45024,25023,95024,100
26,10025,50025,55025,550
25,65025,55025,55025,550
25,50025,35025,40025,400
25,45025,35025,25025,250
27,50026,75026,70026,700
22,20021,95022,05022,050
25,55025,35025,35025,350
18,05017,80018,00018,000
25,55025,25025,15025,100
26,10026,10026,10026,100
25,05025,05025,00025,000
23,90023,65023,65023,650
25,95025,80025,80025,800
26,55026,15026,10026,100
21,65021,25021,20021,200
25,80025,70025,65025,650
16,70015,95015,95015,950
23,70022,40022,35022,350
25,95025,05025,25025,250
26,70026,70026,65026,650
25,35025,40025,35025,350
26,70026,55026,60026,600
28,30028,65028,60028,600
22,95022,65022,60022,600
26,55026,35026,30026,300
18,30017,85017,80017,800
25,50025,70025,75025,750
26,15026,30026,25026,250
27,35027,40027,40027,400
26,20025,95026,05026,050
27,35027,55027,50027,500
25,35025,40025,40025,400
29,00029,25029,15029,200
24,40024,25024,25024,250
23,65024,00024,05024,050
26,55026,70026,65026,650
19,10019,80020,00020,000
25,95026,00026,00026,050
21,95022,70022,70022,700
25,60027,15026,80026,800
1 Field counts began in 2004. 2 Field counts began in 2004 after being discontinued in 1996.

Crop Production 2004 Summary Agricultural Statistics BoardJanuary 2005 8 NASS, USDA
Sorghum: Area Planted for All Purposes and Harvested for Grain,Yield, and Production by State and United States, 2002-2004
StateArea Planted for All Purposes Area Harvested for Grain
2002 2003 2004 2002 2003 2004
1,000 Acres 1,000 Acres 1,000 Acres 1,000 Acres 1,000 Acres 1,000 Acres
ALAZARCACODEGAILKSKYLAMDMSMONENMNCOKPASCSDTNTXVA
US
1015
24017
3502
5580
3,80012
1805
8020045017017
43011
722030
3,2008
9,589
1017
22518
2702
55110
3,55033
1706
7521566014018
30015
727045
3,2009
9,420
10206028
2802
4585
3,2001585
520
15055014017
27012
725020
2,2105
7,486
76
23011901
3076
3,00010
1654
77190320
7012
30033
9026
2,4004
7,125
66
21010
1601
38105
2,90032
1653
73210500
6214
25055
15040
2,8503
7,798
66
5612
1801
2582
2,9001380
418
1454159214
24045
15017
2,0502
6,517
Yield Production
2002 2003 2004 2002 2003 2004
Bushels Bushels Bushels 1,000 Bushels 1,000 Bushels 1,000 Bushels
ALAZARCACODEGAILKSKYLAMDMSMONENMNCOKPASCSDTNTXVA
US
40.070.077.080.020.045.040.083.045.075.081.040.081.085.050.035.042.045.048.030.034.080.051.045.0
50.6
45.090.082.090.027.070.047.082.045.095.085.065.084.077.062.027.050.037.087.052.045.082.054.070.0
52.7
43.095.084.090.030.083.047.0
109.076.080.065.084.079.0
108.081.046.052.060.083.052.042.090.062.068.0
69.8
280420
17,710880
1,80045
1,2006,308
135,000750
13,365160
6,23716,15016,0002,450
50413,500
14490
3,0602,080
122,400180
360,713
270540
17,220900
4,32070
1,7868,610
130,5003,040
14,025195
6,13216,17031,0001,674
7009,250
435260
6,7503,280
153,900210
411,237
258570
4,7041,0805,400
831,1758,938
220,4001,0405,200
3361,422
15,66033,615
4,232728
14,400332260
6,3001,530
127,100136
454,899
Crop Production 2004 Summary Agricultural Statistics BoardJanuary 2005 9 NASS, USDA
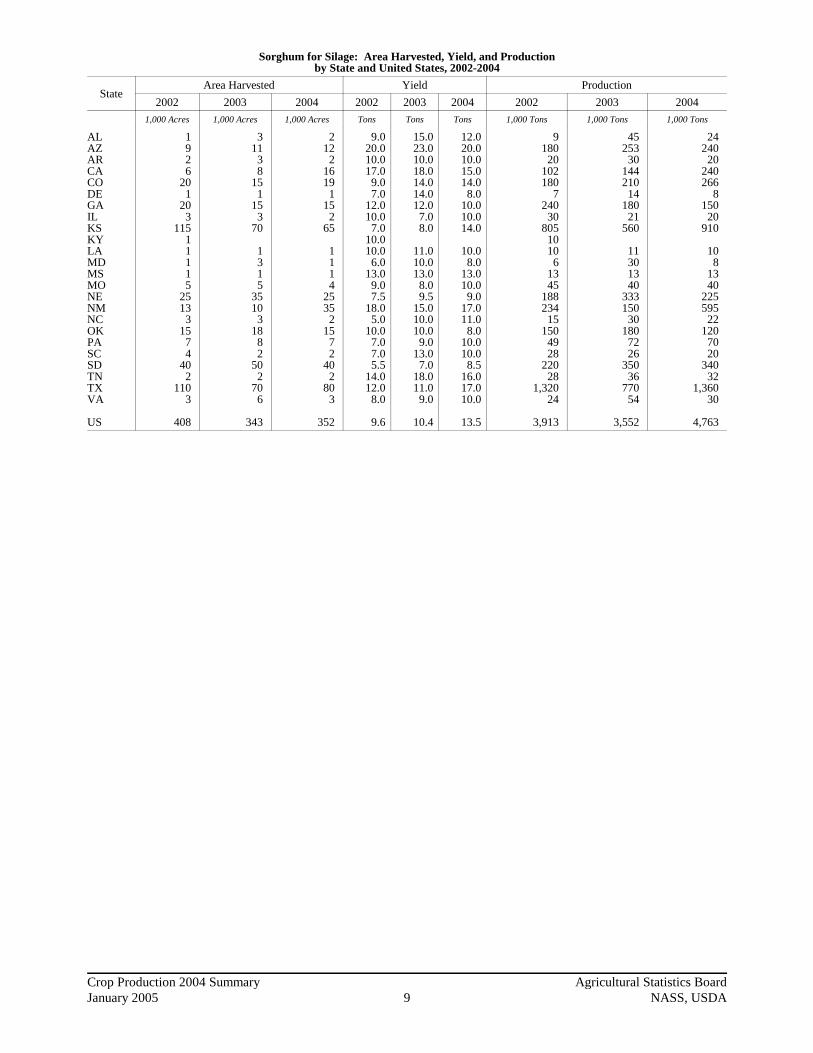
Sorghum for Silage: Area Harvested, Yield, and Productionby State and United States, 2002-2004
StateArea Harvested Yield Production
2002 2003 2004 2002 2003 2004 2002 2003 2004
1,000 Acres 1,000 Acres 1,000 Acres Tons Tons Tons 1,000 Tons 1,000 Tons 1,000 Tons
ALAZARCACODEGAILKSKYLAMDMSMONENMNCOKPASCSDTNTXVA
US
1926
201
203
11511115
2513
315
74
402
1103
408
311
38
151
153
70
1315
3510
318
82
502
706
343
212
21619
115
265
1114
2535
215
72
402
803
352
9.020.010.017.09.07.0
12.010.07.0
10.010.06.0
13.09.07.5
18.05.0
10.07.07.05.5
14.012.08.0
9.6
15.023.010.018.014.014.012.07.08.0
11.010.013.08.09.5
15.010.010.09.0
13.07.0
18.011.09.0
10.4
12.020.010.015.014.0
8.010.010.014.0
10.08.0
13.010.0
9.017.011.0
8.010.010.0
8.516.017.010.0
13.5
918020
102180
724030
8051010
61345
18823415
1504928
22028
1,32024
3,913
45253
30144210
14180
21560
11301340
333150
30180
7226
35036
77054
3,552
24240
20240266
8150
20910
108
1340
225595
22120
7020
34032
1,36030
4,763

Crop Production 2004 Summary Agricultural Statistics BoardJanuary 2005 10 NASS, USDA
Oats: Area Planted and Harvested, Yield and Production by Stateand United States, 2002-2004
StateArea Planted 1 Area Harvested
2002 2003 2004 2002 2003 2004
1,000 Acres 1,000 Acres 1,000 Acres 1,000 Acres 1,000 Acres 1,000 Acres
CACOGAIDILINIAKSMEMIMNMOMTNENYNCNDOHOKORPASCSDTXUTWAWIWY
US
2606590
1256520
2901402880
42065
1351757565
670708570
14050
4707506032
43070
4,995
2601001001206025
2201402790
35030
1202208555
620807060
14040
4206256535
38060
4,597
2407590905525
2201203480
31026
1051406555
490655050
13040
3806806020
34050
4,085
328
25254514
175602765
2653550556525
300552030
11525
120140
413
25015
2,058
351530255015
130702675
2651845907022
360602520
11020
230140
615
23023
2,220
252025203512
140403265
1901340555025
220501520
11020
170160
87
21015
1,792
StateYield Production
2002 2003 2004 2002 2003 2004
Bushels Bushels Bushels 1,000 Bushels 1,000 Bushels 1,000 Bushels
CACOGAIDILINIAKSMEMIMNMOMTNENYNCNDOHOKORPASCSDTXUTWAWIWY
US
82.050.060.070.073.062.076.052.085.064.056.051.046.043.064.055.042.061.037.084.061.046.045.044.085.065.060.050.0
56.4
80.065.056.065.089.070.083.065.078.070.071.067.044.073.063.059.059.066.036.075.059.056.068.045.082.050.067.048.0
65.0
85.055.050.072.070.075.072.043.075.068.070.050.060.068.065.070.064.063.037.0
100.055.055.082.040.078.088.065.053.0
64.7
2,624400
1,5001,7503,285
86813,3003,1202,2954,160
14,8401,7852,3002,3654,1601,375
12,6003,355
7402,5207,0151,1505,4006,160
340845
15,000750
116,002
2,800975
1,6801,6254,4501,050
10,7904,5502,0285,250
18,8151,2061,9806,5704,4101,298
21,2403,960
9001,5006,4901,120
15,6406,300
492750
15,4101,104
144,383
2,1251,1001,2501,4402,450
90010,080
1,7202,4004,420
13,300650
2,4003,7403,2501,750
14,0803,150
5552,0006,0501,100
13,9406,400
624616
13,650795
115,935 1 Includes area planted in preceding fall.

Crop Production 2004 Summary Agricultural Statistics BoardJanuary 2005 11 NASS, USDA
Barley: Area Planted and Harvested, Yield, andProduction by State and United States 2002-2004
StateArea Planted 1 Area Harvested
2002 2003 2004 2002 2003 2004
1,000 Acres 1,000 Acres 1,000 Acres 1,000 Acres 1,000 Acres 1,000 Acres
AZCACODEIDKSKYMEMDMIMNMTNENVNJNYNCNDOHORPASDUTVAWAWIWY
US
461308525
73089
284314
1901,180
644
1125
1,6007
7870807075
3505585
5,008
321008525
75099
284315
1901,150
654
1520
2,0507
7075754575
3205590
5,348
401108029
68015
9234214
1301,000
643
1423
1,6005
7565705055
2504590
4,527
40757223
71077
273913
150930
423
1017
1,3006
6860453441
3403565
4,123
30588221
72088
273614
170850
433
1314
1,9806
6065553545
3103575
4,727
38757726
65012
8223912
115830
322
1015
1,4804
6655504040
2453075
4,021
Yield Production
2002 2003 2004 2002 2003 2004
Bushels Bushels Bushels 1,000 Bushels 1,000 Bushels 1,000 Bushels
AZCACODEIDKSKYMEMDMIMNMTNENVNJNYNCNDOHORPASDUTVAWAWIWY
US
110.071.0
104.083.077.037.065.080.082.051.041.042.032.097.070.047.060.045.055.053.074.035.064.077.056.047.072.0
55.0
118.064.0
109.059.066.057.075.065.057.056.075.040.050.080.045.050.056.060.058.064.061.053.080.062.047.055.093.0
58.9
110.054.0
118.080.092.028.077.065.073.051.068.059.054.0
105.063.053.064.062.050.073.062.063.086.074.070.055.092.0
69.4
4,4005,3257,4881,909
54,670259455
2,1603,198
6636,150
39,060128194210470
1,02058,500
3303,6044,4401,5752,1763,157
19,0401,6454,680
226,906
3,5403,7128,9381,239
47,520456600
1,7552,052
78412,75034,000
200240135650784
118,800348
3,8403,9652,9152,8002,790
14,5701,9256,975
278,283
4,1804,0509,0862,080
59,800336616
1,4302,847
6127,820
48,970162210126530960
91,760200
4,8183,4103,1503,4402,960
17,1501,6506,900
279,253 1 Includes area planted in preceding fall.
Crop Production 2004 Summary Agricultural Statistics BoardJanuary 2005 12 NASS, USDA
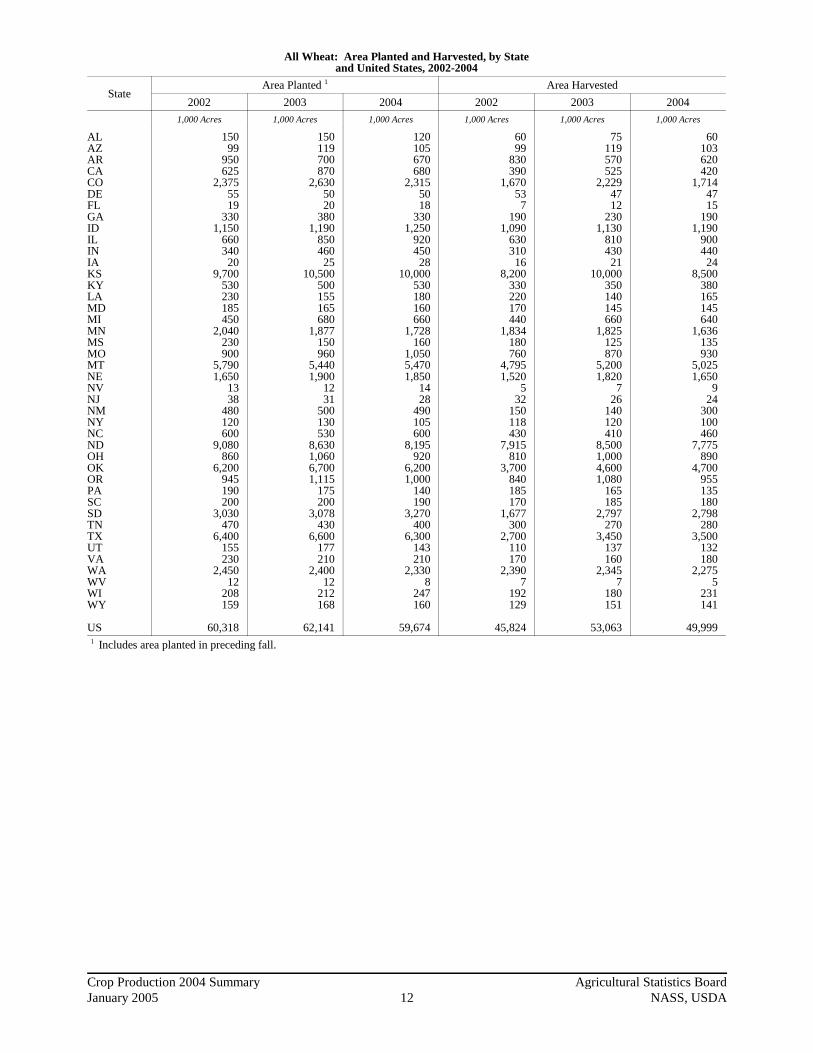
All Wheat: Area Planted and Harvested, by Stateand United States, 2002-2004
StateArea Planted 1 Area Harvested
2002 2003 2004 2002 2003 2004
1,000 Acres 1,000 Acres 1,000 Acres 1,000 Acres 1,000 Acres 1,000 Acres
ALAZARCACODEFLGAIDILINIAKSKYLAMDMIMNMSMOMTNENVNJNMNYNCNDOHOKORPASCSDTNTXUTVAWAWVWIWY
US
15099
950625
2,3755519
3301,150
66034020
9,700530230185450
2,040230900
5,7901,650
1338
480120600
9,080860
6,200945190200
3,030470
6,400155230
2,45012
208159
60,318
150119700870
2,6305020
3801,190
85046025
10,500500155165680
1,877150960
5,4401,900
1231
500130530
8,6301,0606,7001,115
175200
3,078430
6,600177210
2,40012
212168
62,141
120105670680
2,3155018
3301,250
92045028
10,000530180160660
1,728160
1,0505,4701,850
1428
490105600
8,195920
6,2001,000
140190
3,270400
6,300143210
2,3308
247160
59,674
6099
830390
1,670537
1901,090
630310
168,200
330220170440
1,834180760
4,7951,520
532
150118430
7,915810
3,700840185170
1,677300
2,700110170
2,3907
192129
45,824
75119570525
2,2294712
2301,130
810430
2110,000
350140145660
1,825125870
5,2001,820
726
140120410
8,5001,0004,6001,080
165185
2,797270
3,450137160
2,3457
180151
53,063
60103620420
1,7144715
1901,190
90044024
8,500380165145640
1,636135930
5,0251,650
924
300100460
7,775890
4,700955135180
2,798280
3,500132180
2,2755
231141
49,999 1 Includes area planted in preceding fall.

Crop Production 2004 Summary Agricultural Statistics BoardJanuary 2005 13 NASS, USDA
All Wheat: Yield and Production, by Stateand United States, 2002-2004
StateYield Production
2002 2003 2004 2002 2003 2004
Bushels Bushels Bushels 1,000 Bushels 1,000 Bushels 1,000 Bushels
ALAZARCACODEFLGAIDILINIAKSKYLAMDMIMNMSMOMTNENVNJNMNYNCNDOHOKORPASCSDTNTXUTVAWAWVWIWY
US
40.095.446.081.522.870.035.042.071.949.053.053.033.052.040.066.067.034.040.044.023.133.081.657.026.058.042.027.362.028.041.153.037.026.447.029.032.661.054.348.060.019.2
35.0
42.0100.1
50.069.535.141.041.046.074.965.069.061.048.062.041.037.068.057.849.061.027.446.078.442.030.053.036.037.368.039.049.643.039.042.350.028.041.446.059.441.068.327.1
44.2
48.096.753.086.227.458.045.045.085.559.062.055.037.054.050.059.064.054.853.052.034.537.0
106.747.026.053.050.039.462.035.058.649.044.046.049.031.044.455.063.152.055.626.6
43.2
2,4009,444
38,18031,80038,1003,710
2457,980
78,41030,87016,430
848270,600
17,1608,800
11,22029,48062,4207,200
33,440110,735
50,160408
1,8243,9006,844
18,060216,095
50,220103,600
34,5009,8056,290
44,24714,10078,3003,590
10,370129,770
33611,5162,471
1,605,878
3,15011,91228,50036,51078,1601,927
49210,58084,66052,65029,6701,281
480,00021,7005,7405,365
44,880105,482
6,12553,070
142,33083,720
5491,0924,2006,360
14,760317,090
68,000179,400
53,5407,0957,215
118,39113,50096,6005,6777,360
139,345287
12,3004,095
2,344,760
2,8809,963
32,86036,20046,880
2,726675
8,550101,710
53,10027,280
1,320314,500
20,5208,2508,555
40,96089,605
7,15548,360
173,16561,050
9601,1287,8005,300
23,000306,650
55,180164,500
55,9806,6157,920
128,61013,720
108,5005,8569,900
143,500260
12,8523,750
2,158,245
Crop Production 2004 Summary Agricultural Statistics BoardJanuary 2005 14 NASS, USDA
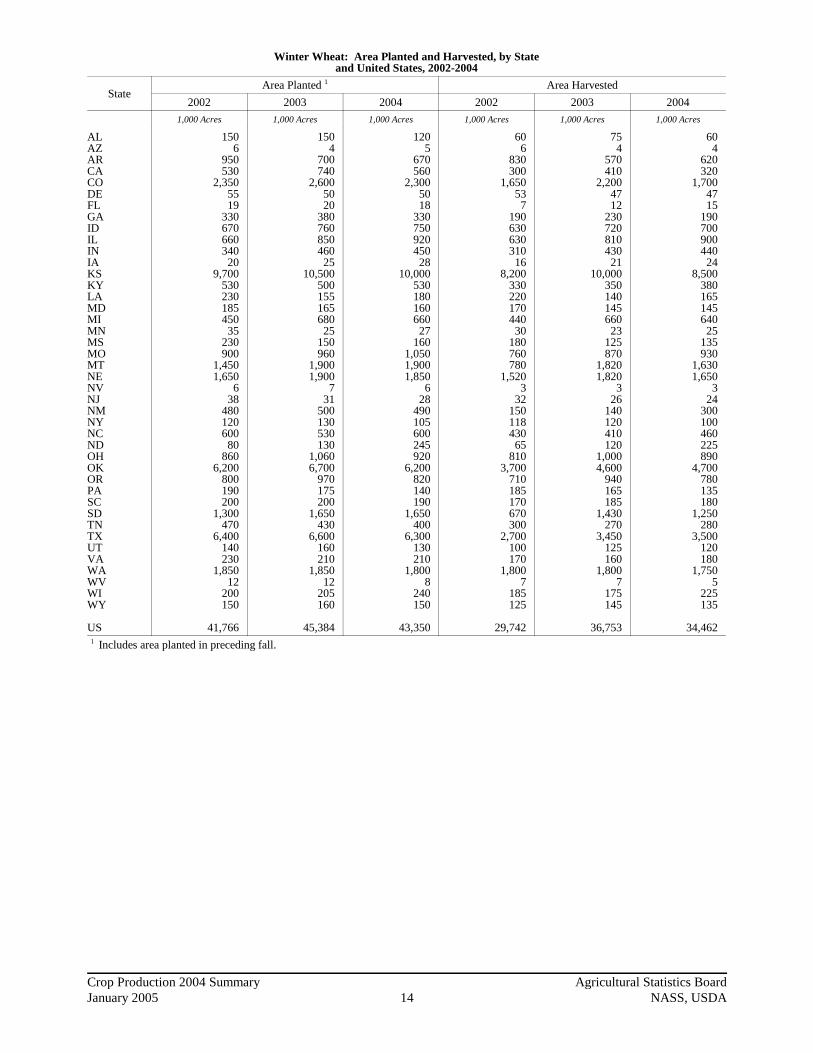
Winter Wheat: Area Planted and Harvested, by Stateand United States, 2002-2004
StateArea Planted 1 Area Harvested
2002 2003 2004 2002 2003 2004
1,000 Acres 1,000 Acres 1,000 Acres 1,000 Acres 1,000 Acres 1,000 Acres
ALAZARCACODEFLGAIDILINIAKSKYLAMDMIMNMSMOMTNENVNJNMNYNCNDOHOKORPASCSDTNTXUTVAWAWVWIWY
US
1506
950530
2,3505519
33067066034020
9,70053023018545035
230900
1,4501,650
638
48012060080
8606,200
800190200
1,300470
6,400140230
1,85012
200150
41,766
1504
700740
2,6005020
38076085046025
10,50050015516568025
150960
1,9001,900
731
500130530130
1,0606,700
970175200
1,650430
6,600160210
1,85012
205160
45,384
1205
670560
2,3005018
33075092045028
10,00053018016066027
1601,0501,9001,850
628
490105600245920
6,200820140190
1,650400
6,300130210
1,8008
240150
43,350
606
830300
1,650537
190630630310
168,200
330220170440
30180760780
1,5203
32150118430
65810
3,700710185170670300
2,700100170
1,8007
185125
29,742
754
570410
2,2004712
230720810430
2110,000
350140145660
23125870
1,8201,820
326
140120410120
1,0004,600
940165185
1,430270
3,450125160
1,8007
175145
36,753
604
620320
1,7004715
19070090044024
8,50038016514564025
135930
1,6301,650
324
300100460225890
4,700780135180
1,250280
3,500120180
1,7505
225135
34,462 1 Includes area planted in preceding fall.

Crop Production 2004 Summary Agricultural Statistics BoardJanuary 2005 15 NASS, USDA
Winter Wheat: Yield and Production, by Stateand United States, 2002-2004
StateYield Production
2002 2003 2004 2002 2003 2004
Bushels Bushels Bushels 1,000 Bushels 1,000 Bushels 1,000 Bushels
ALAZARCACODEFLGAIDILINIAKSKYLAMDMIMNMSMOMTNENVNJNMNYNCNDOHOKORPASCSDTNTXUTVAWAWVWIWY
US
40.086.046.076.022.070.035.042.077.049.053.053.033.052.040.066.067.036.040.044.028.033.086.057.026.058.042.033.062.028.042.053.037.030.047.029.032.061.058.048.061.019.0
38.2
42.0103.0
50.061.035.041.041.046.080.065.069.061.048.062.041.037.068.042.049.061.037.046.083.042.030.053.036.049.068.039.051.043.039.043.050.028.041.046.065.041.069.027.0
46.7
48.090.053.085.027.058.045.045.090.059.062.055.037.054.050.059.064.040.053.052.041.037.0
110.047.026.053.050.044.062.035.061.049.044.045.049.031.043.055.067.052.056.026.0
43.5
2,400516
38,18022,80036,3003,710
2457,980
48,51030,87016,430
848270,600
17,1608,800
11,22029,4801,0807,200
33,44021,84050,160
2581,8243,9006,844
18,0602,145
50,220103,600
29,8209,8056,290
20,10014,10078,3003,200
10,370104,400
33611,2852,375
1,137,001
3,150412
28,50025,01077,0001,927
49210,58057,60052,65029,6701,281
480,00021,7005,7405,365
44,880966
6,12553,07067,34083,720
2491,0924,2006,360
14,7605,880
68,000179,400
47,9407,0957,215
61,49013,50096,6005,1257,360
117,000287
12,0753,915
1,716,721
2,880360
32,86027,20045,900
2,726675
8,55063,00053,10027,280
1,320314,500
20,5208,2508,555
40,9601,0007,155
48,36066,83061,050
3301,1287,8005,300
23,0009,900
55,180164,500
47,5806,6157,920
56,25013,720
108,5005,1609,900
117,250260
12,6003,510
1,499,434

Crop Production 2004 Summary Agricultural Statistics BoardJanuary 2005 16 NASS, USDA
Durum Wheat: Area Planted, Harvested, Yield, and Productionby State and United States, 2002-2004
StateArea Planted Area Harvested
2002 2003 2004 2002 2003 2004
1,000 Acres 1,000 Acres 1,000 Acres 1,000 Acres 1,000 Acres 1,000 Acres
AZCAMNMTNDSD
US
9395
5590
2,10030
2,913
115130
2640
2,00028
2,915
100120
1570
1,75020
2,561
93904
5651,950
7
2,709
115115
2630
1,98027
2,869
99100
1545
1,60018
2,363
Yield Production
2002 2003 2004 2002 2003 2004
Bushels Bushels Bushels 1,000 Bushels 1,000 Bushels 1,000 Bushels
AZCAMNMTNDSD
US
96.0100.0
35.023.025.021.0
29.5
100.0100.0
58.023.029.523.0
33.7
97.090.055.033.033.025.0
38.0
8,9289,000
14012,99548,750
147
79,960
11,50011,500
11614,49058,410
621
96,637
9,6039,000
5517,98552,800
450
89,893
Wheat: Production by Class, United States, 2002-2004 1
YearWinter Spring
TotalHardRed
SoftRed White Hard
Red White Durum
1,000 Bushels 1,000 Bushels 1,000 Bushels 1,000 Bushels 1,000 Bushels 1,000 Bushels 1,000 Bushels
200220032004
620,3281,070,996
856,211
320,968380,435380,305
195,705265,290262,918
351,439499,674525,467
37,47831,72843,451
79,96096,63789,893
1,605,8782,344,7602,158,245
1 Wheat class estimates are based on the latest varietal acreage survey data available.

Crop Production 2004 Summary Agricultural Statistics BoardJanuary 2005 17 NASS, USDA
Other Spring Wheat: Area Planted, Harvested, Yield, and Productionby State and United States, 2002-2004
StateArea Planted Area Harvested
2002 2003 2004 2002 2003 2004
1,000 Acres 1,000 Acres 1,000 Acres 1,000 Acres 1,000 Acres 1,000 Acres
COIDMNMTNVNDORSDUTWAWIWY
US
25480
2,0003,750
76,900
1451,700
15600
89
15,639
30430
1,8502,900
56,500
1451,400
17550
78
13,842
15500
1,7003,000
86,200
1801,600
13530
710
13,763
20460
1,8003,450
25,900
1301,000
10590
74
13,373
29410
1,8002,750
46,400
1401,340
12545
56
13,441
14490
1,6102,850
65,950
1751,530
12525
66
13,174
Yield Production
2002 2003 2004 2002 2003 2004
Bushels Bushels Bushels 1,000 Bushels 1,000 Bushels 1,000 Bushels
COIDMNMTNVNDORSDUTWAWIWY
US
90.065.034.022.075.028.036.024.039.043.033.024.0
29.1
40.066.058.022.075.039.540.042.046.041.045.030.0
39.5
70.079.055.031.0
105.041.048.047.058.050.042.040.0
43.2
1,80029,90061,20075,900
150165,200
4,68024,000
39025,370
23196
388,917
1,16027,060
104,40060,500
300252,800
5,60056,280
55222,345
225180
531,402
98038,71088,55088,350
630243,950
8,40071,910
69626,250
252240
568,918
All Spring Wheat: Head Population
The National Agricultural Statistics Service conducted objective yield surveys in three spring wheat producingStates during 2004. Randomly selected plots in wheat fields were visited monthly from August through harvest toobtain specific counts and measurements. Data in this table are actual field counts from this survey.
All Spring Wheat: Heads per Square Foot,Selected States, 2000-2004
Cropand
State2000 2001 2002 2003 2004
Number Number Number Number Number
Other Spring
MN
MT
ND
Durum
ND
Final
Final
Final
Final
52.5
27.4
46.6
24.2
49.1
22.9
41.2
23.3
50.6
24.0
40.0
23.7
55.9
25.0
43.0
24.3
55.0
26.9
46.7
27.2
Crop Production 2004 Summary Agricultural Statistics BoardJanuary 2005 18 NASS, USDA
Rice: Area Planted and Harvested by Class,State, and United States, 2002-2004
Classand
State
Area Planted Area Harvested
2002 2003 1 2004 1 2002 2003 1 2004 1
Long Grain
1,000 Acres 1,000 Acres 1,000 Acres 1,000 Acres 1,000 Acres 1,000 Acres
ARCALAMSMOTX
US
1,350.07.0
530.0255.0190.0205.0
2,537.0
1,300.07.0
435.0235.0175.0180.0
2,332.0
1,405.07.0
525.0235.0195.0220.0
2,587.0
1,340.07.0
525.0253.0182.0205.0
2,512.0
1,290.07.0
430.0234.0170.0179.0
2,310.0
1,400.07.0
520.0234.0194.0216.0
2,571.0
Medium Grain
ARCALAMOTX
US
165.0500.0
10.00.01.0
676.0
165.0460.0
20.011.0
647.0
155.0540.0
13.01.02.0
711.0
162.0495.0
10.00.01.0
668.0
164.0458.0
20.011.0
644.0
154.0535.0
13.01.02.0
705.0
Short Grain
ARCA
US
1.026.0
27.0
1.042.0
43.0
1.048.0
49.0
1.026.0
27.0
1.042.0
43.0
1.048.0
49.0
All
ARCALAMSMOTX
US
1,516.0533.0540.0255.0190.0206.0
3,240.0
1,466.0509.0455.0235.0176.0181.0
3,022.0
1,561.0595.0538.0235.0196.0222.0
3,347.0
1,503.0528.0535.0253.0182.0206.0
3,207.0
1,455.0507.0450.0234.0171.0180.0
2,997.0
1,555.0590.0533.0234.0195.0218.0
3,325.0 1 Sweet rice acreage included in 2003 and 2004 as short grain but not in previous years.

Crop Production 2004 Summary Agricultural Statistics BoardJanuary 2005 19 NASS, USDA
Rice: Yield and Production by Class,State, and United States, 2002-2004
Classand
State
Yield Production
2002 2003 1 2004 1 2002 2003 1 2004 1
Long Grain
Pounds Pounds Pounds 1,000 Cwt 1,000 Cwt 1,000 Cwt
ARCALAMSMOTX
US
6,4306,4005,5006,4006,0507,100
6,260
6,6006,9005,8706,8006,1306,600
6,451
6,9007,3005,3606,9006,8006,750
6,569
86,162448
28,87516,19211,01114,555
157,243
85,140483
25,24115,91210,42111,814
149,011
96,600511
27,87216,14613,19214,580
168,901
Medium Grain
ARCALAMOTX
US
6,5008,3005,250
06,100
7,815
6,7007,8405,7806,3006,600
7,481
7,0008,8005,0006,9005,500
8,325
10,53041,085
5250
61
52,201
10,98835,9071,156
6366
48,180
10,78047,080
65069
110
58,689
Short Grain
ARCA
US
6,0005,600
5,615
6,0006,300
6,293
6,0006,600
6,588
601,456
1,516
602,646
2,706
603,168
3,228
All
ARCALAMSMOTX
US
6,4408,1405,5006,4006,0507,100
6,578
6,6107,7005,8706,8006,1306,600
6,670
6,9108,6005,3506,9006,8006,740
6,942
96,75242,98929,40016,19211,01114,616
210,960
96,18839,03626,39715,91210,48411,880
199,897
107,44050,75928,52216,14613,26114,690
230,818 1 Sweet rice yield and production included in 2003 and 2004 as short grain but not in previous years.

Crop Production 2004 Summary Agricultural Statistics BoardJanuary 2005 20 NASS, USDA
Rye: Area Planted and Harvested, Yield and Production by Stateand United States, 2002-2004
StateArea Planted 1 Area Harvested
2002 2003 2004 2002 2003 2004
1,000 Acres 1,000 Acres 1,000 Acres 1,000 Acres 1,000 Acres 1,000 Acres
GANDOKSD
Oth Sts 2
US
24010
28015
810
1,355
27018
26020
780
1,348
25025
30020
785
1,380
357
6510
146
263
50157014
170
319
2520
11011
154
320
Yield Production
2002 2003 2004 2002 2003 2004
Bushels Bushels Bushels 1,000 Bushels 1,000 Bushels 1,000 Bushels
GANDOKSD
Oth Sts 2
US
16.030.020.027.0
28.4
24.7
16.050.022.048.0
28.7
27.1
24.039.018.059.0
29.9
26.9
560210
1,300270
4,148
6,488
800750
1,540672
4,872
8,634
600780
1,980649
4,606
8,615 1 Includes area planted in preceding fall. 2 Other States include IL, KS, MI, MN, NE, NY, NC, PA, SC, TX, and WI.

Crop Production 2004 Summary Agricultural Statistics BoardJanuary 2005 21 NASS, USDA
Proso Millet: Area Planted, Harvested, Yield, and Productionby State and United States, 2002-2004
StateArea Planted Area Harvested
2002 2003 2004 2002 2003 2004
1,000 Acres 1,000 Acres 1,000 Acres 1,000 Acres 1,000 Acres 1,000 Acres
CONESD
US
250170100
520
320200210
730
370160180
710
115100
60
275
285170165
620
330135130
595
Yield Production
2002 2003 2004 2002 2003 2004
Bushels Bushels Bushels 1,000 Bushels 1,000 Bushels 1,000 Bushels
CONESD
US
10.512.021.0
13.3
19.019.017.0
18.5
24.025.029.0
25.3
1,2081,2001,260
3,668
5,4153,2302,805
11,450
7,9203,3753,770
15,065
Crop Production 2004 Summary Agricultural Statistics BoardJanuary 2005 22 NASS, USDA
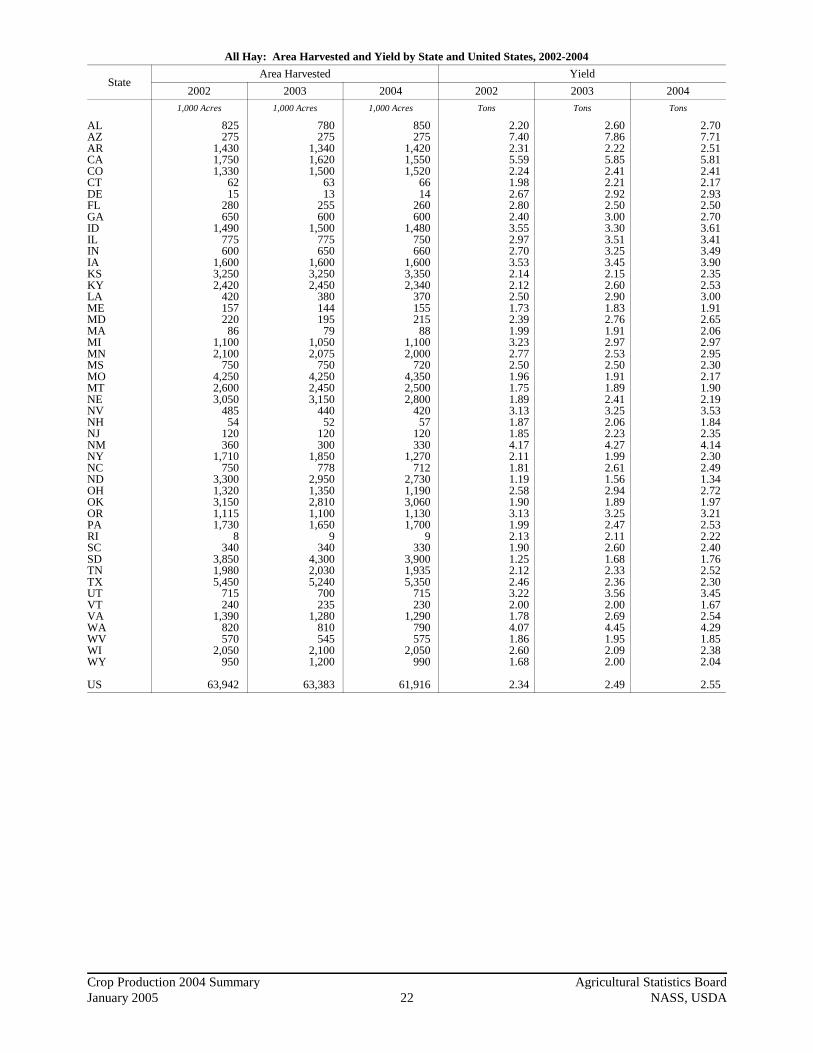
All Hay: Area Harvested and Yield by State and United States, 2002-2004
StateArea Harvested Yield
2002 2003 2004 2002 2003 2004
1,000 Acres 1,000 Acres 1,000 Acres Tons Tons Tons
ALAZARCACOCTDEFLGAIDILINIAKSKYLAMEMDMAMIMNMSMOMTNENVNHNJNMNYNCNDOHOKORPARISCSDTNTXUTVTVAWAWVWIWY
US
825275
1,4301,7501,330
6215
280650
1,490775600
1,6003,2502,420
42015722086
1,1002,100
7504,2502,6003,050
48554
120360
1,710750
3,3001,3203,1501,1151,730
8340
3,8501,9805,450
715240
1,390820570
2,050950
63,942
780275
1,3401,6201,500
6313
255600
1,500775650
1,6003,2502,450
38014419579
1,0502,075
7504,2502,4503,150
44052
120300
1,850778
2,9501,3502,8101,1001,650
9340
4,3002,0305,240
700235
1,280810545
2,1001,200
63,383
850275
1,4201,5501,520
6614
260600
1,480750660
1,6003,3502,340
37015521588
1,1002,000
7204,3502,5002,800
42057
120330
1,270712
2,7301,1903,0601,1301,700
9330
3,9001,9355,350
715230
1,290790575
2,050990
61,916
2.207.402.315.592.241.982.672.802.403.552.972.703.532.142.122.501.732.391.993.232.772.501.961.751.893.131.871.854.172.111.811.192.581.903.131.992.131.901.252.122.463.222.001.784.071.862.601.68
2.34
2.607.862.225.852.412.212.922.503.003.303.513.253.452.152.602.901.832.761.912.972.532.501.911.892.413.252.062.234.271.992.611.562.941.893.252.472.112.601.682.332.363.562.002.694.451.952.092.00
2.49
2.707.712.515.812.412.172.932.502.703.613.413.493.902.352.533.001.912.652.062.972.952.302.171.902.193.531.842.354.142.302.491.342.721.973.212.532.222.401.762.522.303.451.672.544.291.852.382.04
2.55

Crop Production 2004 Summary Agricultural Statistics BoardJanuary 2005 23 NASS, USDA
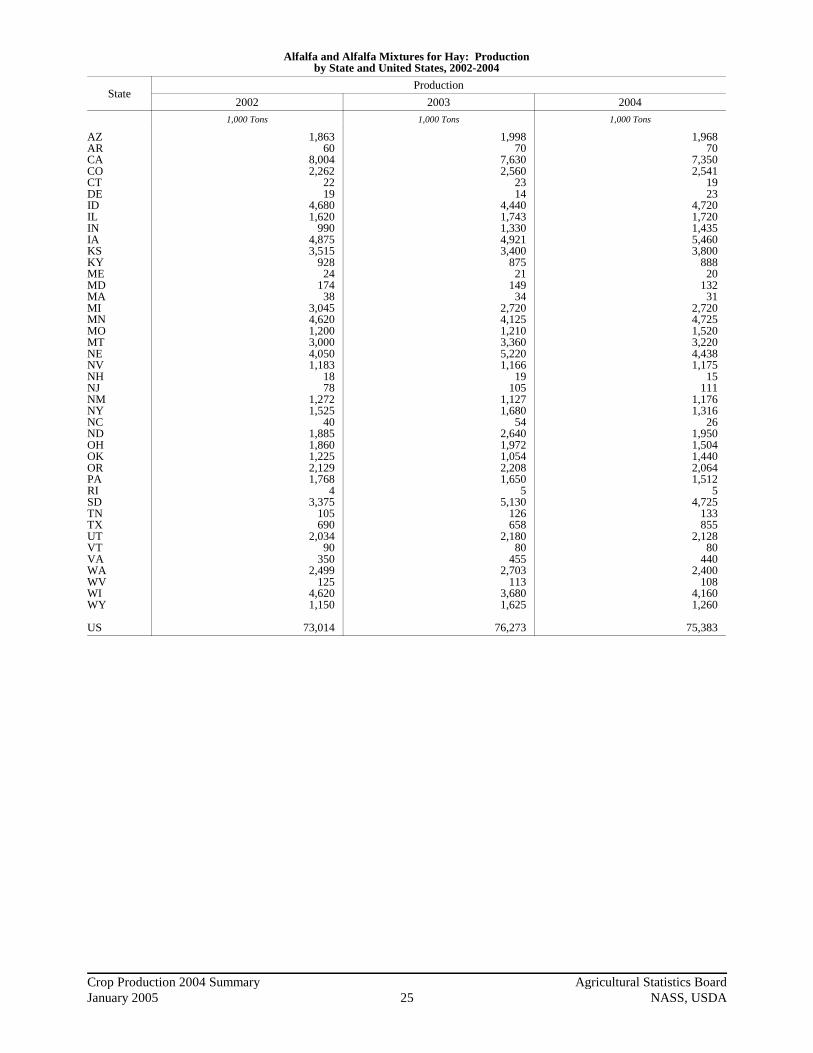
All Hay: Production by State and United States, 2002-2004
StateProduction
2002 2003 2004
1,000 Tons 1,000 Tons 1,000 Tons
ALAZARCACOCTDEFLGAIDILINIAKSKYLAMEMDMAMIMNMSMOMTNENVNHNJNMNYNCNDOHOKORPARISCSDTNTXUTVTVAWAWVWIWY
US
1,8152,0343,3039,7742,977
12340
7841,5605,2882,3031,6205,6456,9655,1281,050
271526171
3,5515,8101,8758,3234,5405,7501,519
101222
1,5003,6151,3543,9203,4005,9853,4933,448
17646
4,8154,200
13,4102,304
4802,4753,3361,0615,3401,600
149,467
2,0282,1622,9749,4853,610
13938
6381,8004,9502,7232,1105,5157,0006,3751,102
264539151
3,1205,2451,8758,1224,6357,6001,429
107267
1,2813,6802,0304,5983,9745,3043,5724,070
19884
7,2104,726
12,3882,490
4703,4453,6031,0634,3802,395
157,585
2,2952,1193,5709,0003,666
14341
6501,6205,3502,5602,3036,2407,8805,9281,110
296570181
3,2705,8951,6569,4204,7606,1431,481
105282
1,3652,9161,7763,6663,2326,0303,6244,296
20792
6,8704,883
12,2952,469
3843,2723,3921,0624,8802,016
157,774
Crop Production 2004 Summary Agricultural Statistics BoardJanuary 2005 24 NASS, USDA
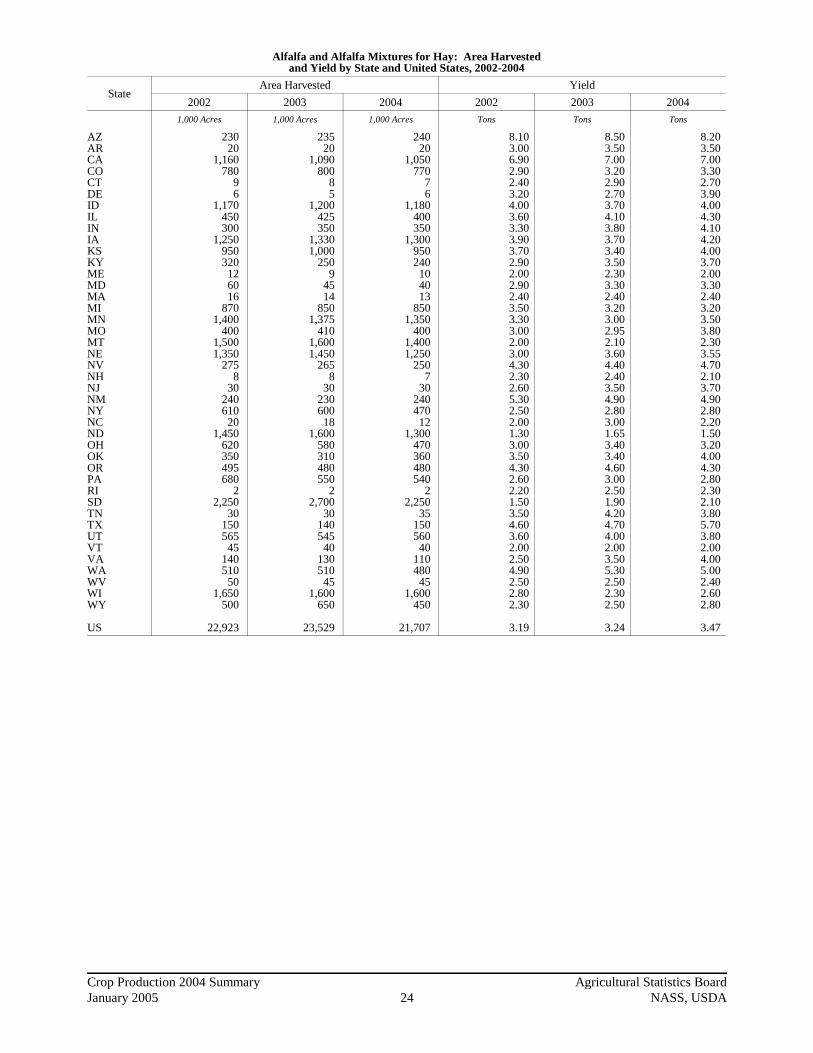
Alfalfa and Alfalfa Mixtures for Hay: Area Harvestedand Yield by State and United States, 2002-2004
StateArea Harvested Yield
2002 2003 2004 2002 2003 2004
1,000 Acres 1,000 Acres 1,000 Acres Tons Tons Tons
AZARCACOCTDEIDILINIAKSKYMEMDMAMIMNMOMTNENVNHNJNMNYNCNDOHOKORPARISDTNTXUTVTVAWAWVWIWY
US
23020
1,160780
96
1,170450300
1,250950320126016
8701,400
4001,5001,350
2758
3024061020
1,450620350495680
22,250
3015056545
14051050
1,650500
22,923
23520
1,090800
85
1,200425350
1,3301,000
2509
4514
8501,375
4101,6001,450
2658
3023060018
1,600580310480550
22,700
3014054540
13051045
1,600650
23,529
24020
1,050770
76
1,180400350
1,300950240104013
8501,350
4001,4001,250
2507
3024047012
1,300470360480540
22,250
3515056040
11048045
1,600450
21,707
8.103.006.902.902.403.204.003.603.303.903.702.902.002.902.403.503.303.002.003.004.302.302.605.302.502.001.303.003.504.302.602.201.503.504.603.602.002.504.902.502.802.30
3.19
8.503.507.003.202.902.703.704.103.803.703.403.502.303.302.403.203.002.952.103.604.402.403.504.902.803.001.653.403.404.603.002.501.904.204.704.002.003.505.302.502.302.50
3.24
8.203.507.003.302.703.904.004.304.104.204.003.702.003.302.403.203.503.802.303.554.702.103.704.902.802.201.503.204.004.302.802.302.103.805.703.802.004.005.002.402.602.80
3.47
Crop Production 2004 Summary Agricultural Statistics BoardJanuary 2005 25 NASS, USDA
Alfalfa and Alfalfa Mixtures for Hay: Productionby State and United States, 2002-2004
StateProduction
2002 2003 2004
1,000 Tons 1,000 Tons 1,000 Tons
AZARCACOCTDEIDILINIAKSKYMEMDMAMIMNMOMTNENVNHNJNMNYNCNDOHOKORPARISDTNTXUTVTVAWAWVWIWY
US
1,86360
8,0042,262
2219
4,6801,620
9904,8753,515
92824
17438
3,0454,6201,2003,0004,0501,183
1878
1,2721,525
401,8851,8601,2252,1291,768
43,375
105690
2,03490
3502,499
1254,6201,150
73,014
1,99870
7,6302,560
2314
4,4401,7431,3304,9213,400
87521
14934
2,7204,1251,2103,3605,2201,166
19105
1,1271,680
542,6401,9721,0542,2081,650
55,130
126658
2,18080
4552,703
1133,6801,625
76,273
1,96870
7,3502,541
1923
4,7201,7201,4355,4603,800
88820
13231
2,7204,7251,5203,2204,4381,175
15111
1,1761,316
261,9501,5041,4402,0641,512
54,725
133855
2,12880
4402,400
1084,1601,260
75,383
Crop Production 2004 Summary Agricultural Statistics BoardJanuary 2005 26 NASS, USDA
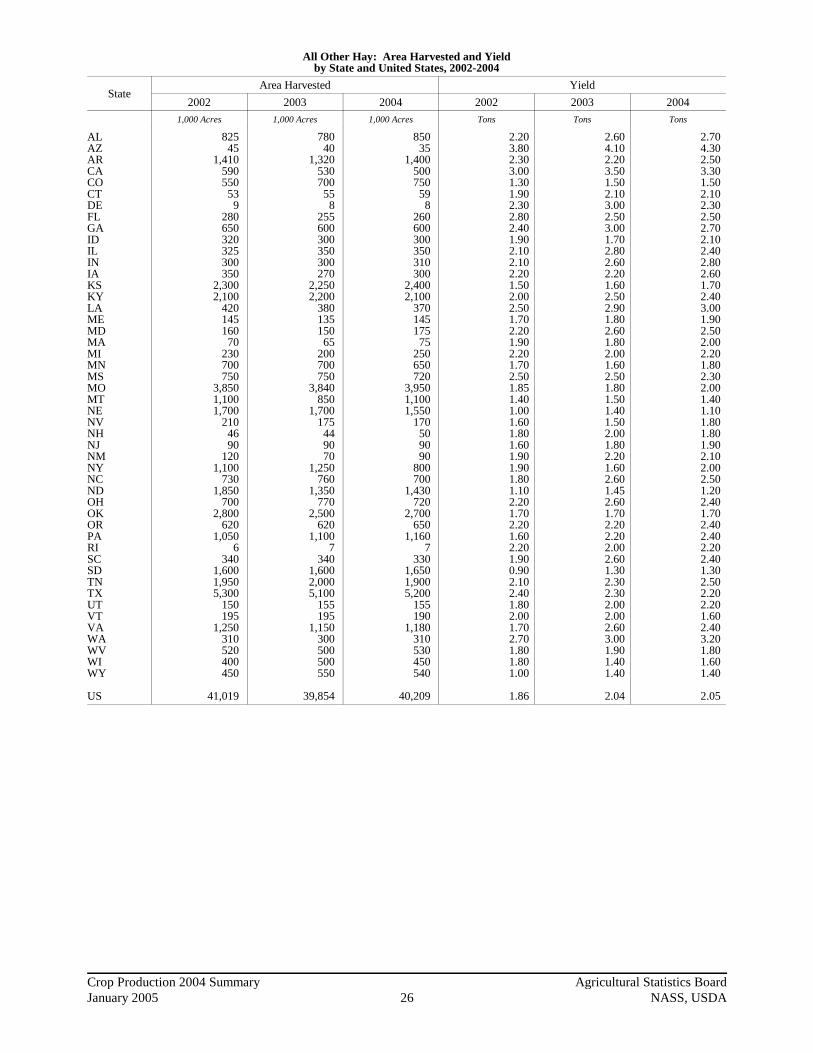
All Other Hay: Area Harvested and Yieldby State and United States, 2002-2004
StateArea Harvested Yield
2002 2003 2004 2002 2003 2004
1,000 Acres 1,000 Acres 1,000 Acres Tons Tons Tons
ALAZARCACOCTDEFLGAIDILINIAKSKYLAMEMDMAMIMNMSMOMTNENVNHNJNMNYNCNDOHOKORPARISCSDTNTXUTVTVAWAWVWIWY
US
82545
1,41059055053
9280650320325300350
2,3002,100
42014516070
230700750
3,8501,1001,700
2104690
1201,100
7301,850
7002,800
6201,050
6340
1,6001,9505,300
150195
1,250310520400450
41,019
78040
1,32053070055
8255600300350300270
2,2502,200
38013515065
200700750
3,840850
1,700175449070
1,250760
1,350770
2,500620
1,1007
3401,6002,0005,100
155195
1,150300500500550
39,854
85035
1,40050075059
8260600300350310300
2,4002,100
37014517575
250650720
3,9501,1001,550
170509090
800700
1,430720
2,700650
1,1607
3301,6501,9005,200
155190
1,180310530450540
40,209
2.203.802.303.001.301.902.302.802.401.902.102.102.201.502.002.501.702.201.902.201.702.501.851.401.001.601.801.601.901.901.801.102.201.702.201.602.201.900.902.102.401.802.001.702.701.801.801.00
1.86
2.604.102.203.501.502.103.002.503.001.702.802.602.201.602.502.901.802.601.802.001.602.501.801.501.401.502.001.802.201.602.601.452.601.702.202.202.002.601.302.302.302.002.002.603.001.901.401.40
2.04
2.704.302.503.301.502.102.302.502.702.102.402.802.601.702.403.001.902.502.002.201.802.302.001.401.101.801.801.902.102.002.501.202.401.702.402.402.202.401.302.502.202.201.602.403.201.801.601.40
2.05

Crop Production 2004 Summary Agricultural Statistics BoardJanuary 2005 27 NASS, USDA
All Other Hay: Production by Stateand United States, 2002-2004
StateProduction
2002 2003 2004
1,000 Tons 1,000 Tons 1,000 Tons
ALAZARCACOCTDEFLGAIDILINIAKSKYLAMEMDMAMIMNMSMOMTNENVNHNJNMNYNCNDOHOKORPARISCSDTNTXUTVTVAWAWVWIWY
US
1,815171
3,2431,770
71510121
7841,560
608683630770
3,4504,2001,050
247352133506
1,1901,8757,1231,5401,700
33683
144228
2,0901,3142,0351,5404,7601,3641,680
13646
1,4404,095
12,720270390
2,125837936720450
76,453
2,028164
2,9041,8551,050
11624
6381,800
510980780594
3,6005,5001,102
243390117400
1,1201,8756,9121,2752,380
26388
162154
2,0001,9761,9582,0024,2501,3642,420
14884
2,0804,600
11,730310390
2,990900950700770
81,312
2,295151
3,5001,6501,125
12418
6501,620
630840868780
4,0805,0401,110
276438150550
1,1701,6567,9001,5401,705
30690
171189
1,6001,7501,7161,7284,5901,5602,784
15792
2,1454,750
11,440341304
2,832992954720756
82,391

Crop Production 2004 Summary Agricultural Statistics BoardJanuary 2005 28 NASS, USDA
Forage Production
Forage production is the sum of all dry hay production and haylage/greenchop production after converting thehaylage/greenchop production to a dry equivalent basis (13 percent moisture) by multiplying the green weight(weight at harvest) by .4943. The conversion factor (.4943) is based on the assumption that one ton of dry hay is.87 ton of dry matter, one ton of haylage is .45 ton dry matter and one ton of greenchop is .25 ton dry matter. Thetotal haylage/greenchop production is assumed to be comprised of 90 percent haylage and 10 percent greenchop. Therefore, the conversion factor used to adjust haylage/greenchop production to a dry equivalent basis =((.45*.9)+(.25*.1))/.87 = .4943. The factors assumed here may vary by State and can be adjusted. Adjustmentswould result in a slightly different conversion factor.
All Forage: Area Harvested and Yield by State (Dry Equivalent),and Production, 2002-2004 1
StateArea Harvested Yield
2002 2003 2004 2002 2003 2004
1,000 Acres 1,000 Acres 1,000 Acres Tons Tons Tons
MIMNNYPAVTWAWVWI
1,2602,3902,1201,950
380862591
3,050
1,2102,2652,3101,930
350855558
3,000
1,3512,1251,6801,980
365845594
3,000
3.482.912.592.393.084.201.893.31
3.192.702.612.743.434.602.052.92
3.223.142.922.842.994.431.883.19
Production
2002 2003 2004
1,000 Tons 1,000 Tons 1,000 Tons
MIMNNYPAVTWAWVWI
4,3896,9535,4884,6621,1723,6231,119
10,103
3,8556,1176,0275,2821,1993,9371,1428,760
4,3476,6814,9045,6241,0923,7471,1159,571
1 All Forage production is the sum of the following dry equivalents: alfalfa hay harvested as dry hay, all other hay harvested as dry hay, alfalfahaylage and greenchop, all other hay haylage and greenchop; after converting alfalfa and all other haylage and greenchop to a dry equivalentbasis.
All Alfalfa Forage: Area Harvested and Yield by State (Dry Equivalent),and Production, 2002-2004 1
StateArea Harvested Yield
2002 2003 2004 2002 2003 2004
1,000 Acres 1,000 Acres 1,000 Acres Tons Tons Tons
MIMNNYPAVTWAWVWI
1,0201,650
900860100519
532,500
1,0001,525
95076590
51748
2,400
1,0911,450
70072090
48749
2,450
3.773.433.113.123.374.912.513.62
3.413.233.733.464.045.302.773.20
3.413.753.563.463.585.022.593.48
Production
2002 2003 2004
1,000 Tons 1,000 Tons 1,000 Tons
MIMNNYPAVTWAWVWI
3,8425,6582,7982,685
3372,549
1339,049
3,4124,9263,5392,644
3642,739
1337,684
3,7165,4372,4922,489
3222,444
1278,532
1 All alfalfa forage production is the sum of alfalfa harvested as dry hay; and alfalfa haylage and greenchop production after converting it to a dryequivalent basis.

Crop Production 2004 Summary Agricultural Statistics BoardJanuary 2005 29 NASS, USDA
All Haylage and Greenchop: Area Harvested and Yield by State(Green Weight), and Production, 2002-2004 1
StateArea Harvested Yield
2002 2003 2004 2002 2003 2004
1,000 Acres 1,000 Acres 1,000 Acres Tons Tons Tons
MIMNNYPAVTWAWVWI
280340660470225
6530
1,550
270340660440190
6435
1,700
3672256504402158532
1,600
6.056.805.405.226.228.943.976.22
5.505.197.195.577.76
10.554.575.21
5.947.076.196.116.678.473.315.93
Production
2002 2003 2004
1,000 Tons 1,000 Tons 1,000 Tons
MIMNNYPAVTWAWVWI
1,6942,3123,5642,4551,399
581119
9,635
1,4861,7644,7482,4511,474
675160
8,860
2,1791,5904,0232,6881,433
720106
9,490 1 Includes all types of forage harvested as haylage or greenchop. Forage harvested as dry hay and corn and sorghum silage/greenchop are not
included.
Alfalfa Haylage and Greenchop: Area Harvested and Yield by State(Green Weight), and Production, 2002-2004 1
StateArea Harvested Yield
2002 2003 2004 2002 2003 2004
1,000 Acres 1,000 Acres 1,000 Acres Tons Tons Tons
MIMNNYPAVTWAWVWI
260300510320
7515
61,400
250300470335
70128
1,500
32520034029570156
1,450
6.207.005.905.806.656.702.906.40
5.605.408.006.008.206.005.105.40
6.207.207.006.707.006.006.306.10
Production
2002 2003 2004
1,000 Tons 1,000 Tons 1,000 Tons
MIMNNYPAVTWAWVWI
1,6122,1003,0091,855
499101
178,960
1,4001,6203,7602,010
5747241
8,100
2,0151,4402,3801,977
4909038
8,845 1 Includes only alfalfa and alfalfa mixtures that were harvested as haylage or greenchop. Alfalfa harvested as dry hay is not included.

Crop Production 2004 Summary Agricultural Statistics BoardJanuary 2005 30 NASS, USDA
New Seedings of Alfalfa and Alfalfa mixtures: Area Seededby State and United States, 2002-2004
StateArea Seeded
2002 2003 2004
1,000 Acres 1,000 Acres 1,000 Acres
AZARCACOCTDEIDILINIAKSKYMEMDMAMIMNMOMTNENVNHNJNMNYNCNDOHOKORPASDTNTXUTVTVAWAWVWIWY
US
305
16080
11
1705325
20513035
291
12536045
12022022
11
2285
2110845544
110250
62555111575
750025
3,282
256
1106511
1305050
180130
35242
130300
35120230
2611
18105
2105
905545
100230
425407
14605
55030
3,119
305
130100
11
1204050
1705530
251
13522535
10517017
13
1775
185753544
120200
43050101570
350028
2,793
Crop Production 2004 Summary Agricultural Statistics BoardJanuary 2005 31 NASS, USDA
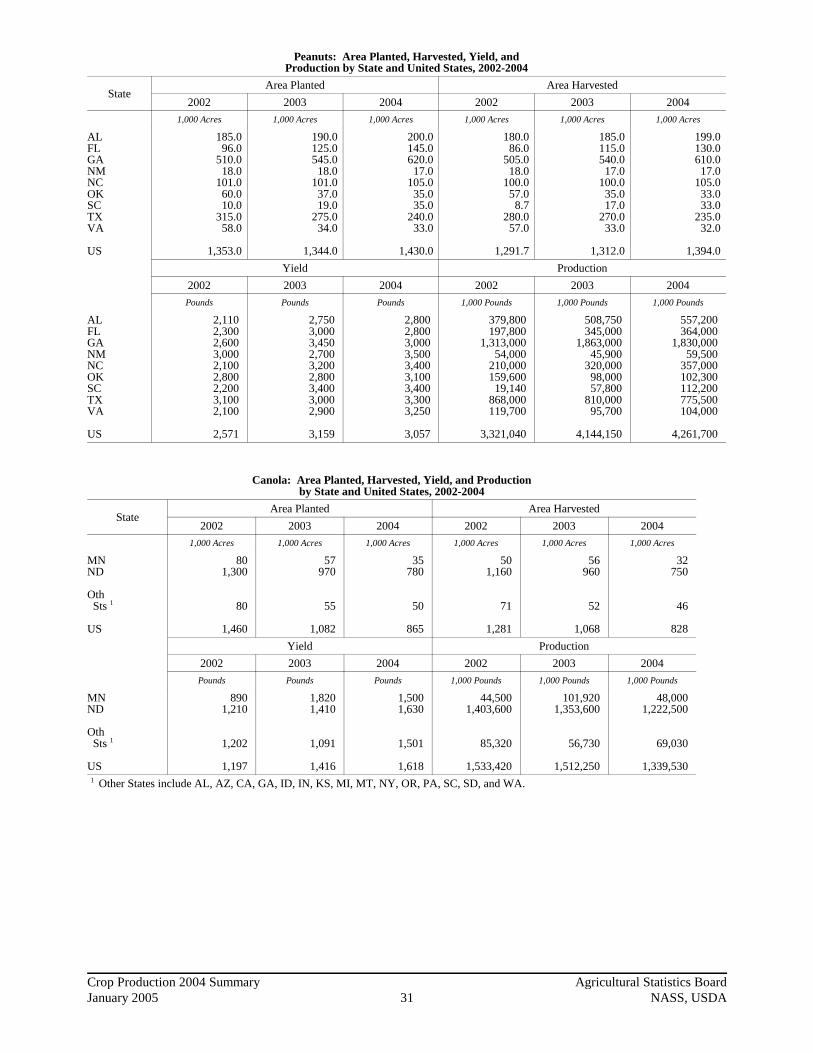
Peanuts: Area Planted, Harvested, Yield, andProduction by State and United States, 2002-2004
StateArea Planted Area Harvested
2002 2003 2004 2002 2003 2004
1,000 Acres 1,000 Acres 1,000 Acres 1,000 Acres 1,000 Acres 1,000 Acres
ALFLGANMNCOKSCTXVA
US
185.096.0
510.018.0
101.060.010.0
315.058.0
1,353.0
190.0125.0545.0
18.0101.0
37.019.0
275.034.0
1,344.0
200.0145.0620.0
17.0105.0
35.035.0
240.033.0
1,430.0
180.086.0
505.018.0
100.057.0
8.7280.0
57.0
1,291.7
185.0115.0540.0
17.0100.0
35.017.0
270.033.0
1,312.0
199.0130.0610.0
17.0105.0
33.033.0
235.032.0
1,394.0
Yield Production
2002 2003 2004 2002 2003 2004
Pounds Pounds Pounds 1,000 Pounds 1,000 Pounds 1,000 Pounds
ALFLGANMNCOKSCTXVA
US
2,1102,3002,6003,0002,1002,8002,2003,1002,100
2,571
2,7503,0003,4502,7003,2002,8003,4003,0002,900
3,159
2,8002,8003,0003,5003,4003,1003,4003,3003,250
3,057
379,800197,800
1,313,00054,000
210,000159,600
19,140868,000119,700
3,321,040
508,750345,000
1,863,00045,900
320,00098,00057,800
810,00095,700
4,144,150
557,200364,000
1,830,00059,500
357,000102,300112,200775,500104,000
4,261,700
Canola: Area Planted, Harvested, Yield, and Productionby State and United States, 2002-2004
StateArea Planted Area Harvested
2002 2003 2004 2002 2003 2004
1,000 Acres 1,000 Acres 1,000 Acres 1,000 Acres 1,000 Acres 1,000 Acres
MNND
Oth Sts 1
US
801,300
80
1,460
57970
55
1,082
35780
50
865
501,160
71
1,281
56960
52
1,068
32750
46
828
Yield Production
2002 2003 2004 2002 2003 2004
Pounds Pounds Pounds 1,000 Pounds 1,000 Pounds 1,000 Pounds
MNND
Oth Sts 1
US
8901,210
1,202
1,197
1,8201,410
1,091
1,416
1,5001,630
1,501
1,618
44,5001,403,600
85,320
1,533,420
101,9201,353,600
56,730
1,512,250
48,0001,222,500
69,030
1,339,530 1 Other States include AL, AZ, CA, GA, ID, IN, KS, MI, MT, NY, OR, PA, SC, SD, and WA.
Crop Production 2004 Summary Agricultural Statistics BoardJanuary 2005 32 NASS, USDA
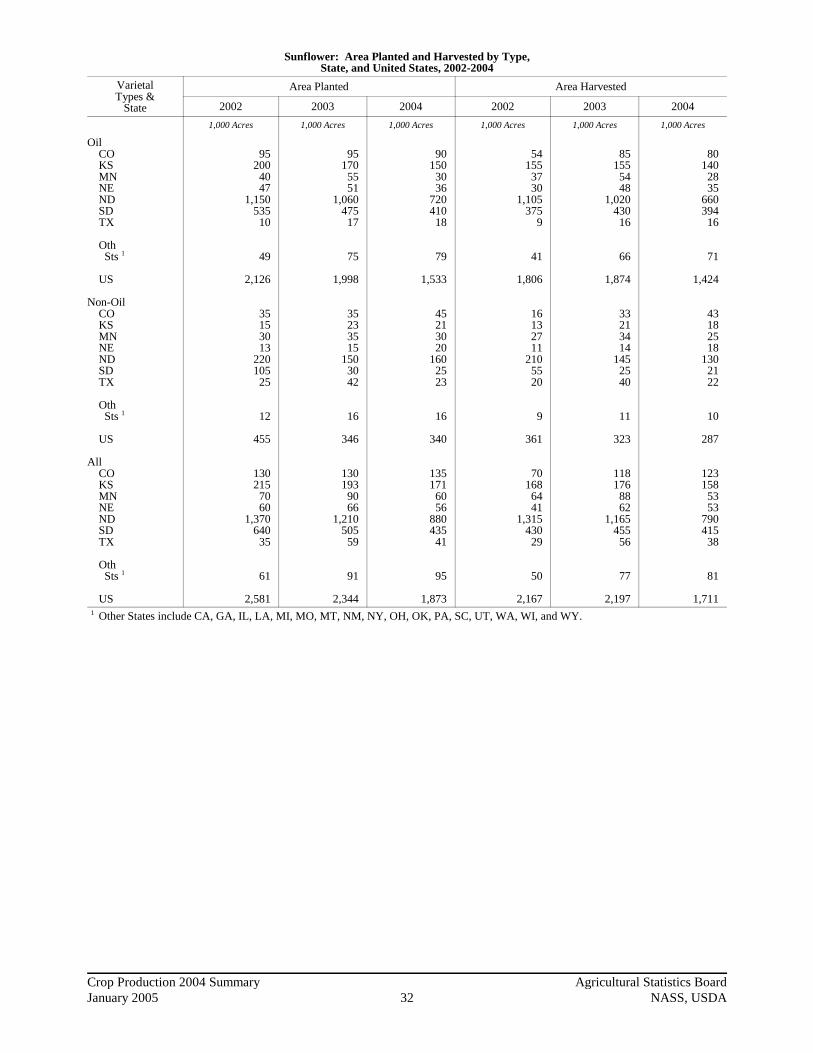
Sunflower: Area Planted and Harvested by Type,State, and United States, 2002-2004
VarietalTypes &
State
Area Planted Area Harvested
2002 2003 2004 2002 2003 2004
1,000 Acres 1,000 Acres 1,000 Acres 1,000 Acres 1,000 Acres 1,000 Acres
Oil CO KS MN NE ND SD TX
Oth Sts 1
US
Non-Oil CO KS MN NE ND SD TX
Oth Sts 1
US
All CO KS MN NE ND SD TX
Oth Sts 1
US
95200
4047
1,150535
10
49
2,126
35153013
220105
25
12
455
130215
7060
1,370640
35
61
2,581
951705551
1,06047517
75
1,998
35233515
1503042
16
346
1301939066
1,21050559
91
2,344
90150
3036
720410
18
79
1,533
45213020
1602523
16
340
135171
6056
880435
41
95
1,873
54155
3730
1,105375
9
41
1,806
16132711
2105520
9
361
70168
6441
1,315430
29
50
2,167
851555448
1,02043016
66
1,874
33213414
1452540
11
323
1181768862
1,16545556
77
2,197
80140
2835
660394
16
71
1,424
43182518
1302122
10
287
123158
5353
790415
38
81
1,711 1 Other States include CA, GA, IL, LA, MI, MO, MT, NM, NY, OH, OK, PA, SC, UT, WA, WI, and WY.
Crop Production 2004 Summary Agricultural Statistics BoardJanuary 2005 33 NASS, USDA
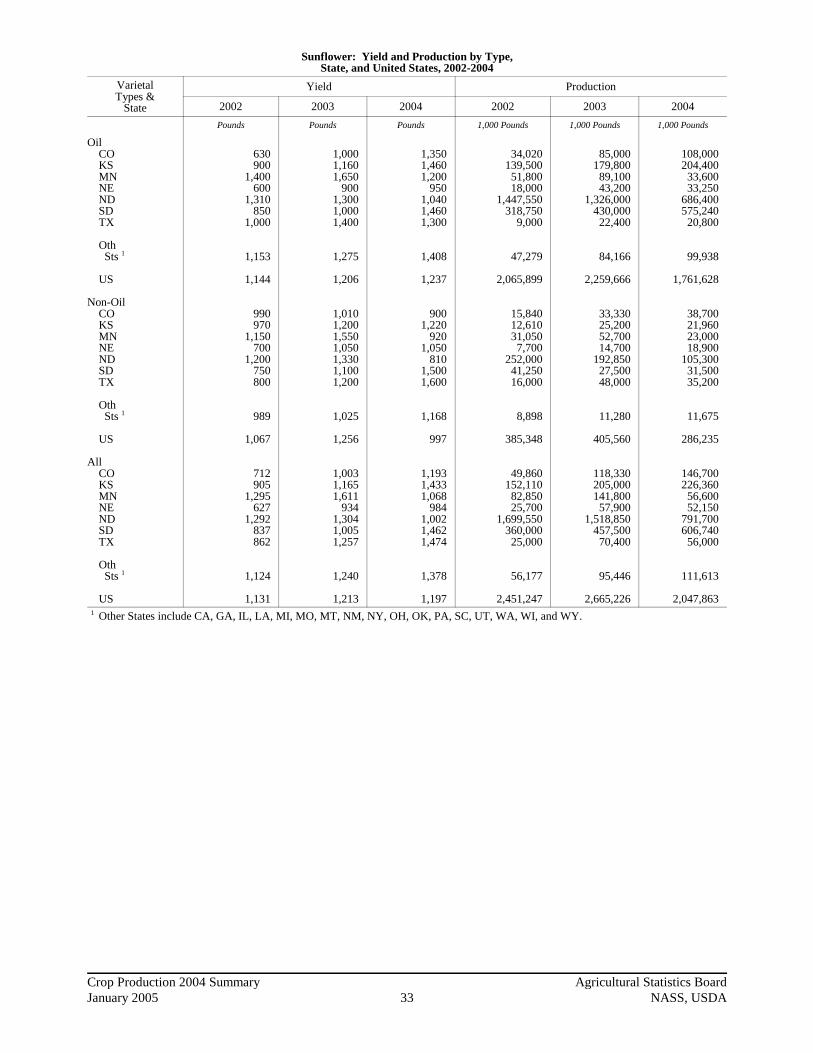
Sunflower: Yield and Production by Type,State, and United States, 2002-2004
VarietalTypes &
State
Yield Production
2002 2003 2004 2002 2003 2004
Pounds Pounds Pounds 1,000 Pounds 1,000 Pounds 1,000 Pounds
Oil CO KS MN NE ND SD TX
Oth Sts 1
US
Non-Oil CO KS MN NE ND SD TX
Oth Sts 1
US
All CO KS MN NE ND SD TX
Oth Sts 1
US
630900
1,400600
1,310850
1,000
1,153
1,144
990970
1,150700
1,200750800
989
1,067
712905
1,295627
1,292837862
1,124
1,131
1,0001,1601,650
9001,3001,0001,400
1,275
1,206
1,0101,2001,5501,0501,3301,1001,200
1,025
1,256
1,0031,1651,611
9341,3041,0051,257
1,240
1,213
1,3501,4601,200
9501,0401,4601,300
1,408
1,237
9001,220
9201,050
8101,5001,600
1,168
997
1,1931,4331,068
9841,0021,4621,474
1,378
1,197
34,020139,500
51,80018,000
1,447,550318,750
9,000
47,279
2,065,899
15,84012,61031,050
7,700252,000
41,25016,000
8,898
385,348
49,860152,110
82,85025,700
1,699,550360,000
25,000
56,177
2,451,247
85,000179,800
89,10043,200
1,326,000430,000
22,400
84,166
2,259,666
33,33025,20052,70014,700
192,85027,50048,000
11,280
405,560
118,330205,000141,800
57,9001,518,850
457,50070,400
95,446
2,665,226
108,000204,400
33,60033,250
686,400575,240
20,800
99,938
1,761,628
38,70021,96023,00018,900
105,30031,50035,200
11,675
286,235
146,700226,360
56,60052,150
791,700606,740
56,000
111,613
2,047,863 1 Other States include CA, GA, IL, LA, MI, MO, MT, NM, NY, OH, OK, PA, SC, UT, WA, WI, and WY.

Crop Production 2004 Summary Agricultural Statistics BoardJanuary 2005 34 NASS, USDA
Soybeans for Beans: Area Planted and Harvestedby State and United States, 2002-2004
StateArea Planted Area Harvested
2002 2003 2004 2002 2003 2004
1,000 Acres 1,000 Acres 1,000 Acres 1,000 Acres 1,000 Acres 1,000 Acres
ALARDEFLGAILINIAKSKYLAMDMIMNMSMONENJNYNCNDOHOKPASCSDTNTXVAWVWI
US
1702,950
19010
16010,600
5,80010,450
2,7501,310
800490
2,0507,2001,4405,0504,700
100145
1,3702,6704,750
280405435
4,2501,160
23049018
1,540
73,963
1702,920
18013
19010,300
5,45010,600
2,6001,250
760435
2,0007,5001,4405,0004,550
90140
1,4503,1504,300
270380430
4,2501,150
20050016
1,720
73,404
2103,200
21019
2809,9505,550
10,2002,8001,3101,100
5002,0007,3001,6705,0004,800
105175
1,5303,7504,450
320430540
4,1501,210
29054019
1,600
75,208
1552,880
1859
14010,5505,770
10,4002,5401,290
660470
2,0407,1001,3705,0004,580
97144
1,2902,6304,720
260390415
4,0901,120
205460
171,520
72,497
1602,890
17812
18010,2605,370
10,5502,4801,240
740430
1,9907,4501,4304,9504,500
88138
1,4003,0504,280
245375420
4,2001,120
185480
151,670
72,476
1903,150
20817
2709,9005,520
10,1502,7101,300
990495
1,9807,0501,6404,9604,750
103172
1,5003,5704,420
290425530
4,1201,180
27053018
1,550
73,958

Crop Production 2004 Summary Agricultural Statistics BoardJanuary 2005 35 NASS, USDA
Soybeans for Beans: Yield and Productionby State and United States, 2002-2004
StateYield Production
2002 2003 2004 2002 2003 2004
Bushels Bushels Bushels 1,000 Bushels 1,000 Bushels 1,000 Bushels
ALARDEFLGAILINIAKSKYLAMDMIMNMSMONENJNYNCNDOHOKPASCSDTNTXVAWVWI
US
24.033.525.033.023.043.041.548.023.033.032.023.038.543.532.034.038.524.032.024.033.032.026.026.017.031.031.028.023.037.044.0
38.0
36.038.536.030.033.037.038.032.523.043.534.037.027.532.039.029.540.534.035.030.029.038.526.041.028.027.542.029.034.041.028.0
33.9
35.039.542.034.031.050.552.049.041.044.033.043.038.033.538.045.046.542.039.034.023.047.030.046.028.034.041.032.039.046.035.0
42.5
3,72096,4804,625
2973,220
453,650239,455499,200
58,42042,57021,12010,81078,540
308,85043,840
170,000176,330
2,3284,608
30,96086,790
151,0406,760
10,1407,055
126,79034,7205,740
10,580629
66,880
2,756,147
5,760111,265
6,408360
5,940379,620204,060342,875
57,04053,94025,16015,91054,725
238,40055,770
146,025182,250
2,9924,830
42,00088,450
164,7806,370
15,37511,760
115,50047,0405,365
16,320615
46,760
2,453,665
6,650124,425
8,736578
8,370499,950287,040497,350111,110
57,20032,67021,28575,240
236,17562,320
223,200220,875
4,3266,708
51,00082,110
207,7408,700
19,55014,840
140,08048,380
8,64020,670
82854,250
3,140,996

Crop Production 2004 Summary Agricultural Statistics BoardJanuary 2005 36 NASS, USDA
Soybeans: Objective Yield Data
The National Agricultural Statistics Service is conducting objective yield surveys in 11 soybean producing Statesduring 2004. Randomly selected plots in soybean fields are visited monthly from August through harvest to obtainspecific counts and measurements. Data in this table are actual field counts from this survey.
Soybeans: Pods with Beans per 18 Square Feet,Selected States, 2000-2004
State Month 2000 2001 2002 2003 2004
Number Number Number Number Number
AR 1 2
IL
IN
IA
KS 3
MN
MO
NE
ND 3
OH
SD 3
SepOctNovFinal
SepOctNovFinal
SepOctNovFinal
SepOctNovFinal
SepOctNovFinal
SepOctNovFinal
SepOctNovFinal
SepOctNovFinal
SepOctNovFinal
SepOctNovFinal
SepOctNovFinal
2,6781,8591,835
2,1621,9962,0202,021
1,9171,7861,7841,784
1,8301,6741,6601,660
1,6071,5091,5071,507
1,9741,7691,7821,793
1,7951,6171,6191,619
1,8931,6251,6851,697
2,2601,8671,817
2,0411,9321,9321,932
2,0031,8821,8801,869
1,8091,7781,7871,796
1,4921,4331,4751,475
1,4241,7321,8741,921
1,9611,9322,0032,048
1,8011,8341,7851,785
1,9521,7851,7951,802
1,7731,6771,6801,680
1,9881,8281,8671,867
1,6881,7851,7391,715
1,4271,6091,6811,705
1,5481,5171,5871,592
1,5931,4951,4991,492
1,8001,6061,6341,634
1,7861,6921,5821,582
1,7491,6291,6471,647
1,5821,4171,4401,440
1,1441,4551,5471,523
1,7271,6421,6361,636
1,7911,8981,7641,752
2,4462,4832,511
2,0701,9231,9431,947
1,9091,8661,9171,917
1,7721,7311,7371,741
1,4821,5881,6391,636
1,4871,4061,4461,435
1,7981,9431,9982,038
1,8351,8361,8951,895
1,1141,1481,2431,242
1,8081,8731,8401,837
1,2481,3321,3021,308
1 September data not available due to plant immaturity. 2 Field counts began in 2004 after being discontinued in 2002. 3 Field counts began in 2004.

Crop Production 2004 Summary Agricultural Statistics BoardJanuary 2005 37 NASS, USDA
Flaxseed: Area Planted, Harvested, Yield, and Productionby State and United States, 2002-2004
StateArea Planted Area Harvested
2002 2003 2004 2002 2003 2004
1,000 Acres 1,000 Acres 1,000 Acres 1,000 Acres 1,000 Acres 1,000 Acres
MNMTNDSD
US
517
75012
784
817
56010
595
320
49010
523
415
6804
703
717
5559
588
319
4859
516
Yield Production
2002 2003 2004 2002 2003 2004
Bushels Bushels Bushels 1,000 Bushels 1,000 Bushels 1,000 Bushels
MNMTNDSD
US
16.013.017.011.0
16.9
23.013.018.016.0
17.9
17.018.020.515.0
20.3
64195
11,56044
11,863
161221
9,990144
10,516
51342
9,943135
10,471
Other Oilseeds: Area Planted, Harvested, Yield,and Production by Crop, United States, 2002-2004
CropArea Planted Area Harvested
2002 2003 2004 2002 2003 2004
1,000 Acres 1,000 Acres 1,000 Acres 1,000 Acres 1,000 Acres 1,000 Acres
RapeseedSafflowerMustard Seed
3.4219.0191.0
1.3222.0110.0
8.7175.0
73.0
3.1185.0175.0
1.2213.0107.0
7.8159.0
68.7
Yield Production
2002 2003 2004 2002 2003 2004
Pounds Pounds Pounds 1,000 Pounds 1,000 Pounds 1,000 Pounds
RapeseedSafflowerMustard Seed
1,2941,435
655
9491,290
723
1,3941,105
819
4,010265,550114,590
1,139274,755
77,372
10,875175,765
56,290

Crop Production 2004 Summary Agricultural Statistics BoardJanuary 2005 38 NASS, USDA
Cotton: Area Planted and Harvested by Type, State,and United States, 2002-2004
Typeand
State
Area Planted Area Harvested
2002 2003 2004 2002 2003 2004
1,000 Acres 1,000 Acres 1,000 Acres 1,000 Acres 1,000 Acres 1,000 Acres
Upland AL AZ AR CA FL GA KS LA MS MO NM NC OK SC TN TX VA
US
Amer-Pima AZ CA NM TX
US
All AL AZ AR CA FL GA KS LA MS MO NM NC OK SC TN TX VA
US
590.0215.0960.0480.0120.0
1,450.080.0
520.01,170.0
380.054.0
940.0200.0290.0565.0
5,600.0100.0
13,714.0
8.3210.0
7.118.5
243.9
590.0223.3960.0690.0120.0
1,450.080.0
520.01,170.0
380.061.1
940.0200.0290.0565.0
5,618.5100.0
13,957.9
525.0215.0980.0550.094.0
1,300.090.0
525.01,110.0
400.053.0
810.0180.0220.0560.0
5,600.089.0
13,301.0
2.5150.0
6.120.0
178.6
525.0217.5980.0700.094.0
1,300.090.0
525.01,110.0
400.059.1
810.0180.0220.0560.0
5,620.089.0
13,479.6
550.0240.0910.0560.0
89.01,290.0
85.0500.0
1,110.0380.0
68.0730.0220.0215.0530.0
5,850.082.0
13,409.0
3.0215.0
10.621.0
249.6
550.0243.0910.0775.0
89.01,290.0
85.0500.0
1,110.0380.0
78.6730.0220.0215.0530.0
5,871.082.0
13,658.6
540.0213.0920.0477.0105.0
1,360.068.0
495.01,150.0
368.050.0
920.0180.0200.0530.0
4,500.098.0
12,174.0
8.2209.0
7.118.3
242.6
540.0221.2920.0686.0105.0
1,360.068.0
495.01,150.0
368.057.1
920.0180.0200.0530.0
4,518.398.0
12,416.6
510.0213.0945.0545.0
92.01,290.0
80.0510.0
1,090.0390.0
38.0770.0170.0218.0530.0
4,350.085.0
11,826.0
2.4149.0
6.020.0
177.4
510.0215.4945.0694.0
92.01,290.0
80.0510.0
1,090.0390.0
44.0770.0170.0218.0530.0
4,370.085.0
12,003.4
540.0238.0900.0557.0
87.01,280.0
80.0490.0
1,100.0378.0
64.0725.0200.0214.0525.0
5,350.081.0
12,809.0
3.0214.0
10.520.5
248.0
540.0241.0900.0771.0
87.01,280.0
80.0490.0
1,100.0378.0
74.5725.0200.0214.0525.0
5,370.581.0
13,057.0
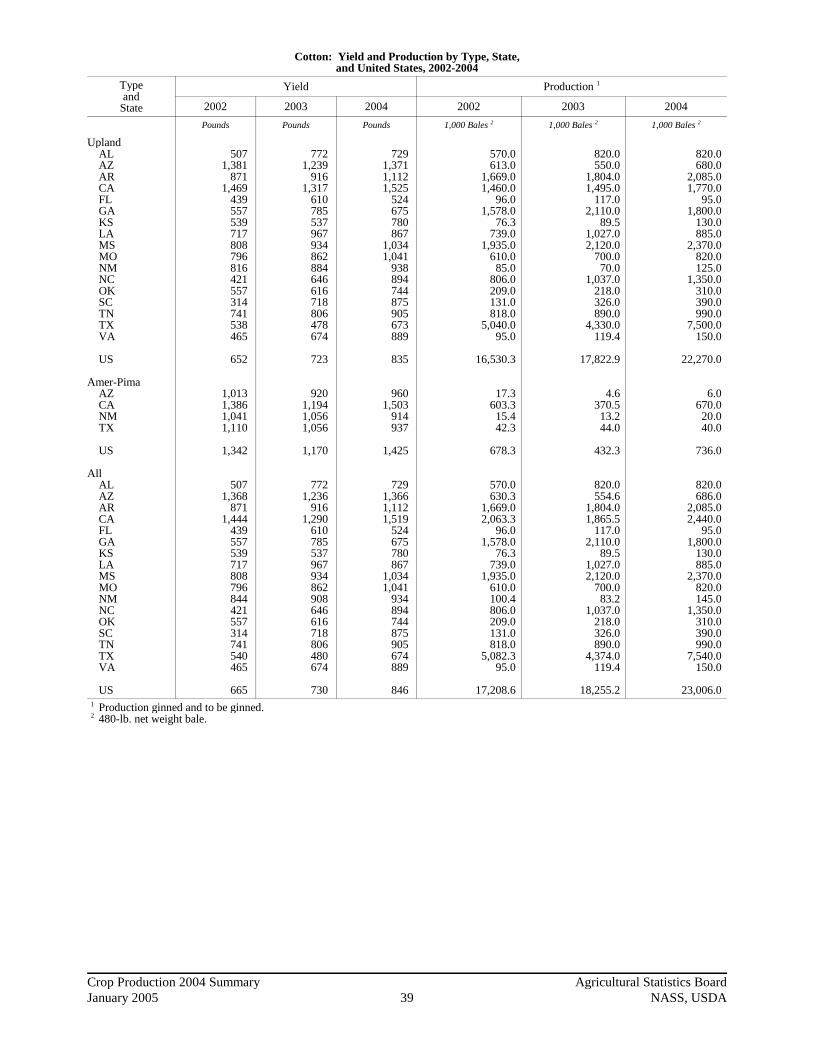
Crop Production 2004 Summary Agricultural Statistics BoardJanuary 2005 39 NASS, USDA
Cotton: Yield and Production by Type, State,and United States, 2002-2004
Typeand
State
Yield Production 1
2002 2003 2004 2002 2003 2004
Pounds Pounds Pounds 1,000 Bales 2 1,000 Bales 2 1,000 Bales 2
Upland AL AZ AR CA FL GA KS LA MS MO NM NC OK SC TN TX VA
US
Amer-Pima AZ CA NM TX
US
All AL AZ AR CA FL GA KS LA MS MO NM NC OK SC TN TX VA
US
5071,381
8711,469
439557539717808796816421557314741538465
652
1,0131,3861,0411,110
1,342
5071,368
8711,444
439557539717808796844421557314741540465
665
7721,239
9161,317
610785537967934862884646616718806478674
723
9201,1941,0561,056
1,170
7721,236
9161,290
610785537967934862908646616718806480674
730
7291,3711,1121,525
524675780867
1,0341,041
938894744875905673889
835
9601,503
914937
1,425
7291,3661,1121,519
524675780867
1,0341,041
934894744875905674889
846
570.0613.0
1,669.01,460.0
96.01,578.0
76.3739.0
1,935.0610.0
85.0806.0209.0131.0818.0
5,040.095.0
16,530.3
17.3603.3
15.442.3
678.3
570.0630.3
1,669.02,063.3
96.01,578.0
76.3739.0
1,935.0610.0100.4806.0209.0131.0818.0
5,082.395.0
17,208.6
820.0550.0
1,804.01,495.0
117.02,110.0
89.51,027.02,120.0
700.070.0
1,037.0218.0326.0890.0
4,330.0119.4
17,822.9
4.6370.5
13.244.0
432.3
820.0554.6
1,804.01,865.5
117.02,110.0
89.51,027.02,120.0
700.083.2
1,037.0218.0326.0890.0
4,374.0119.4
18,255.2
820.0680.0
2,085.01,770.0
95.01,800.0
130.0885.0
2,370.0820.0125.0
1,350.0310.0390.0990.0
7,500.0150.0
22,270.0
6.0670.0
20.040.0
736.0
820.0686.0
2,085.02,440.0
95.01,800.0
130.0885.0
2,370.0820.0145.0
1,350.0310.0390.0990.0
7,540.0150.0
23,006.0 1 Production ginned and to be ginned. 2 480-lb. net weight bale.

Crop Production 2004 Summary Agricultural Statistics BoardJanuary 2005 40 NASS, USDA
Cottonseed: Production by State and United States, 2002-2004
StateProduction
2002 2003 2004 1
1,000 Tons 1,000 Tons 1,000 Tons
ALAZARCAFLGAKSLAMSMONMNCOKSCTNTXVA
US
195.0232.4627.0731.0
29.0544.0
28.0271.0697.0218.0
35.5272.0
81.044.0
291.01,855.0
33.0
6,183.9
327.0216.8689.0680.0
37.0732.0
34.2365.0773.0274.0
31.6349.0
79.0109.0311.0
1,616.041.0
6,664.6
293.0255.0795.0871.0
31.0621.0
50.0321.0862.0309.0
51.0454.0120.0129.0352.0
2,846.051.0
8,411.0 1 Estimates based on 3-year average lint-seed ratio.

Crop Production 2004 Summary Agricultural Statistics BoardJanuary 2005 41 NASS, USDA
Tobacco: Area Harvested, Yield, and Productionby State and United States, 2002-2004
StateArea Harvested Yield
2002 2003 2004 2002 2003 2004
Acres Acres Acres Pounds Pounds Pounds
CTFLGAINKYMDMAMONCOHPASCTNVAWVWI
US
2,0004,600
26,5004,000
111,1001,2001,1601,400
168,3005,5003,400
30,50034,90030,000
1,3001,450
427,310
2,1804,400
27,0004,200
111,6501,1001,2501,400
159,7005,3003,700
30,00031,14025,110
1,2001,820
411,150
2,3404,000
23,0004,200
114,8001,1001,2201,450
156,5005,6004,000
27,00031,26029,7901,3001,500
409,060
1,6582,6002,0001,9502,0071,5001,6032,2302,0671,7502,0041,9502,0442,1471,4502,632
2,039
1,3612,5002,2001,9502,0161,4501,3982,0201,8781,6502,1302,1002,1081,5461,3002,338
1,952
1,6622,4502,0302,0502,0431,7001,6302,3002,2471,9602,0252,2502,1742,2751,3002,390
2,159
Production
2002 2003 2004
1,000 Pounds 1,000 Pounds 1,000 Pounds
CTFLGAINKYMDMAMONCOHPASCTNVAWVWI
US
3,31511,96053,000
7,800222,991
1,8001,8593,122
347,9209,6256,815
59,47571,33164,407
1,8853,817
871,122
2,96611,00059,4008,190
225,0421,5951,7482,828
299,9958,7457,880
63,00065,63238,8181,5604,255
802,654
3,8899,800
46,6908,610
234,5001,8701,9893,335
351,63010,976
8,10060,75067,97067,787
1,6903,585
883,171

Crop Production 2004 Summary Agricultural Statistics BoardJanuary 2005 42 NASS, USDA
Tobacco: Area Harvested by Class, Type, State,and United States, 2002-2004
Class and TypeArea Harvested
2002 2003 2004
Acres Acres Acres
Class 1, Flue-cured Type 11, Old Belts NC VA US Type 12, Eastern NC Belt NC Type 13, NC Border & SC Belt NC SC US Type 14, GA-FL Belt FL GA US Total 11-14Class 2, Fire-cured Type 21, VA Belt VA Type 22, Eastern District KY TN US Type 23, Western District KY TN US Total 21-23Class 3, Air-cured Class 3A, Light Air-cured Type 31, Burley IN KY MO NC OH TN VA WV US Type 32, Southern MD Belt MD PA US Total 31-32
43,00022,00065,000
98,000
21,00030,50051,500
4,60026,50031,100
245,600
730
2,4505,0007,450
2,400390
2,79010,970
4,000103,000
1,4006,3005,500
29,0007,2001,300
157,700
1,2001,3002,500
160,200
40,00018,00058,000
94,000
20,00030,00050,000
4,40027,00031,400
233,400
550
2,6005,2007,800
2,500400
2,90011,250
4,200103,000
1,4005,7005,300
25,0006,5001,200
152,300
1,1001,3002,400
154,700
43,00023,00066,000
89,000
19,40027,00046,400
4,00023,00027,000
228,400
720
2,7005,3008,000
2,500420
2,92011,640
4,200106,000
1,4505,1005,600
25,0006,0001,300
154,650
1,1002,2003,300
157,950
--continued

Crop Production 2004 Summary Agricultural Statistics BoardJanuary 2005 43 NASS, USDA
Tobacco: Yield and Production by Class, Type, State,and United States, 2002-2004 (continued)
Class and TypeYield Production
2002 2003 2004 2002 2003 2004
Pounds Pounds Pounds 1,000 Pounds 1,000 Pounds 1,000 Pounds
Class 1, Flue-cured Type 11, Old Belts NC VA US Type 12, Eastern NC Belt NC Type 13, NC Border & SC Belt NC SC US Type 14, GA-FL Belt FL GA US Total 11-14Class 2, Fire-cured Type 21, VA Belt VA Type 22, Eastern District KY TN US Type 23, Western District KY TN US Total 21-23Class 3, Air-cured Class 3A, Light Air-cured Type 31, Burley IN KY MO NC OH TN VA WV US Type 32, Southern MD Belt MD PA US Total 31-32
2,2252,3402,264
2,020
2,1351,9502,025
2,6002,0002,0892,094
2,015
3,1603,1103,126
3,6503,5503,6363,182
1,9501,9152,2301,5001,7501,8301,5751,4501,861
1,5001,8501,6821,859
1,7701,6901,745
1,955
1,9152,1002,026
2,5002,2002,2421,957
1,525
3,0802,9803,013
3,5303,3503,5053,067
1,9501,9252,0201,2501,6501,9001,1501,3001,850
1,4502,0001,7481,848
2,3502,4002,367
2,250
2,2002,2502,229
2,4502,0302,0922,261
1,900
3,1003,1003,100
3,7003,3003,6423,162
2,0501,9502,3001,5001,9601,9501,8501,3001,932
1,7001,8001,7671,929
95,67551,480
147,155
197,960
44,83559,475
104,310
11,96053,00064,960
514,385
1,471
7,74215,55023,292
8,7601,385
10,14534,908
7,800197,245
3,1229,4509,625
53,07011,340
1,885293,537
1,8002,4054,205
297,742
70,80030,420
101,220
183,770
38,30063,000
101,300
11,00059,40070,400
456,690
839
8,00815,49623,504
8,8251,340
10,16534,508
8,190198,275
2,8287,1258,745
47,5007,4751,560
281,698
1,5952,6004,195
285,893
101,05055,200
156,250
200,250
42,68060,750
103,430
9,80046,69056,490
516,420
1,368
8,37016,43024,800
9,2501,386
10,63636,804
8,610206,700
3,3357,650
10,97648,75011,100
1,690298,811
1,8703,9605,830
304,641
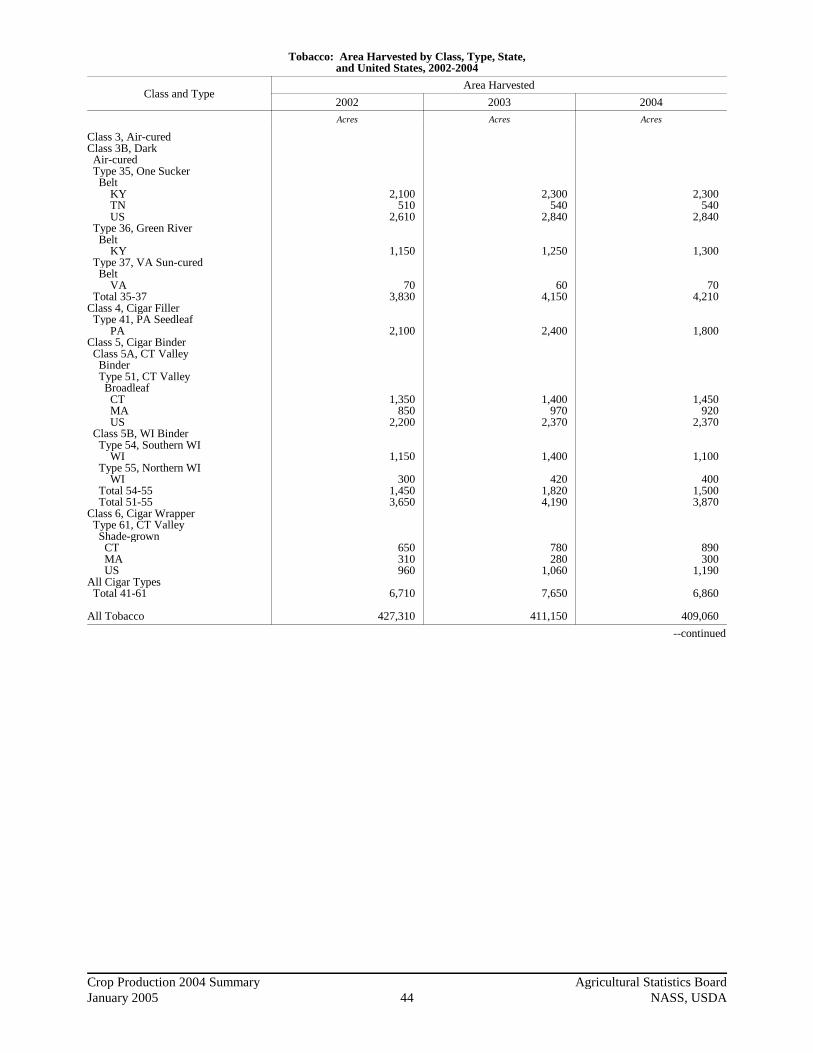
Crop Production 2004 Summary Agricultural Statistics BoardJanuary 2005 44 NASS, USDA
Tobacco: Area Harvested by Class, Type, State,and United States, 2002-2004
Class and TypeArea Harvested
2002 2003 2004
Acres Acres Acres
Class 3, Air-curedClass 3B, Dark Air-cured Type 35, One Sucker Belt KY TN US Type 36, Green River Belt KY Type 37, VA Sun-cured Belt VA Total 35-37Class 4, Cigar Filler Type 41, PA Seedleaf PAClass 5, Cigar Binder Class 5A, CT Valley Binder Type 51, CT Valley Broadleaf CT MA US Class 5B, WI Binder Type 54, Southern WI WI Type 55, Northern WI WI Total 54-55 Total 51-55Class 6, Cigar Wrapper Type 61, CT Valley Shade-grown CT MA USAll Cigar Types Total 41-61
All Tobacco
2,100510
2,610
1,150
703,830
2,100
1,350850
2,200
1,150
3001,4503,650
650310960
6,710
427,310
2,300540
2,840
1,250
604,150
2,400
1,400970
2,370
1,400
4201,8204,190
780280
1,060
7,650
411,150
2,300540
2,840
1,300
704,210
1,800
1,450920
2,370
1,100
4001,5003,870
890300
1,190
6,860
409,060
--continued
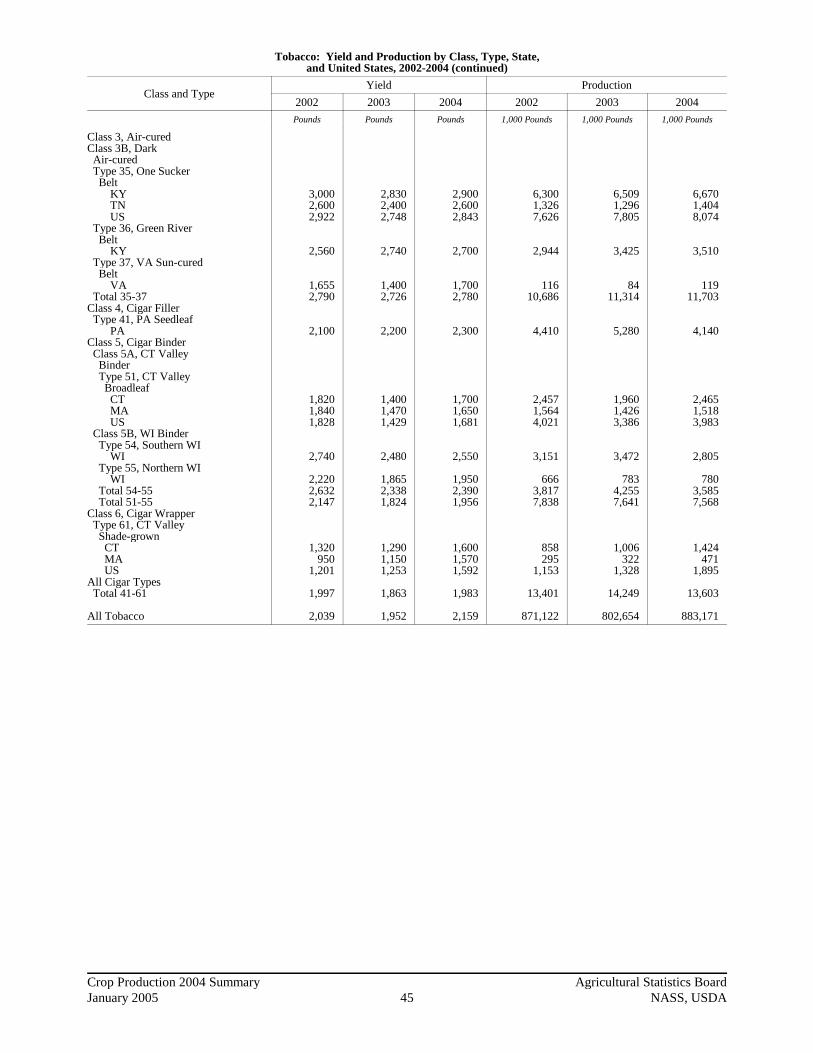
Crop Production 2004 Summary Agricultural Statistics BoardJanuary 2005 45 NASS, USDA
Tobacco: Yield and Production by Class, Type, State,and United States, 2002-2004 (continued)
Class and TypeYield Production
2002 2003 2004 2002 2003 2004
Pounds Pounds Pounds 1,000 Pounds 1,000 Pounds 1,000 Pounds
Class 3, Air-curedClass 3B, Dark Air-cured Type 35, One Sucker Belt KY TN US Type 36, Green River Belt KY Type 37, VA Sun-cured Belt VA Total 35-37Class 4, Cigar Filler Type 41, PA Seedleaf PAClass 5, Cigar Binder Class 5A, CT Valley Binder Type 51, CT Valley Broadleaf CT MA US Class 5B, WI Binder Type 54, Southern WI WI Type 55, Northern WI WI Total 54-55 Total 51-55Class 6, Cigar Wrapper Type 61, CT Valley Shade-grown CT MA USAll Cigar Types Total 41-61
All Tobacco
3,0002,6002,922
2,560
1,6552,790
2,100
1,8201,8401,828
2,740
2,2202,6322,147
1,320950
1,201
1,997
2,039
2,8302,4002,748
2,740
1,4002,726
2,200
1,4001,4701,429
2,480
1,8652,3381,824
1,2901,1501,253
1,863
1,952
2,9002,6002,843
2,700
1,7002,780
2,300
1,7001,6501,681
2,550
1,9502,3901,956
1,6001,5701,592
1,983
2,159
6,3001,3267,626
2,944
11610,686
4,410
2,4571,5644,021
3,151
6663,8177,838
858295
1,153
13,401
871,122
6,5091,2967,805
3,425
8411,314
5,280
1,9601,4263,386
3,472
7834,2557,641
1,006322
1,328
14,249
802,654
6,6701,4048,074
3,510
11911,703
4,140
2,4651,5183,983
2,805
7803,5857,568
1,424471
1,895
13,603
883,171

Crop Production 2004 Summary Agricultural Statistics BoardJanuary 2005 46 NASS, USDA
Sugarbeets: Area Planted, Harvested, Yield, and Productionby State and United States, 2002-2004 1
StateArea Planted Area Harvested
2002 2003 2004 2002 2003 2004
1,000 Acres 1,000 Acres 1,000 Acres 1,000 Acres 1,000 Acres 1,000 Acres
CACOIDMIMNMTNENDOHORWAWY
US
50.243.9
212.0179.0505.0
58.057.0
265.01.9
11.34.0
40.0
1,427.3
50.828.6
208.0179.0492.0
51.745.3
259.02.0
10.04.0
35.0
1,365.4
49.536.0
195.0165.0486.0
53.749.8
256.01.8
13.03.8
36.4
1,346.0
49.539.5
210.0177.0476.0
55.942.0
258.01.8
11.04.0
36.0
1,360.7
50.127.4
207.0178.0487.0
51.542.4
255.01.99.84.0
33.7
1,347.8
49.033.5
192.0163.0470.0
52.147.5
246.01.6
12.63.8
35.6
1,306.7
Yield Production
2002 2003 2004 2002 2003 2004
Tons Tons Tons 1,000 Tons 1,000 Tons 1,000 Tons
CACOIDMIMNMTNENDOHORWAWY
US
39.620.124.318.118.619.618.118.620.627.435.018.3
20.4
39.123.529.219.120.625.420.320.424.230.740.322.3
22.8
39.325.028.621.120.921.722.119.721.531.637.922.8
22.9
1,960794
5,1033,2048,8541,096
7604,799
37301140659
27,707
1,959644
6,0443,400
10,0321,308
8615,202
46301161752
30,710
1,926838
5,4913,4399,8231,1311,0504,846
34398144812
29,932 1 Related to year of intended harvest except for overwintered spring planted beets in CA.

Crop Production 2004 Summary Agricultural Statistics BoardJanuary 2005 47 NASS, USDA
Sugarcane: Area Harvested, Yield, and Productionby State and United States, 2002-2004
StateArea Harvested Yield 1
2002 2003 2004 2002 2003 2004
1,000 Acres 1,000 Acres 1,000 Acres Tons Tons Tons
For Sugar FL HI LA TX
US
For Seed FL HI LA TX
US
For Sugar and Seed FL HI LA TX
US
442.021.3
465.043.6
971.9
19.01.4
30.00.9
51.3
461.022.7
495.044.5
1,023.2
419.019.9
450.041.7
930.6
19.01.4
40.01.3
61.7
438.021.3
490.043.0
992.3
403.021.5
430.042.7
897.2
17.01.6
35.01.3
54.9
420.023.1
465.044.0
952.1
38.399.028.339.1
34.9
38.135.528.330.0
32.2
38.395.128.338.9
34.7
39.3102.0
26.239.7
34.3
40.237.326.240.2
31.1
39.397.726.239.7
34.1
33.896.024.040.0
30.9
37.337.024.038.0
28.8
33.991.924.039.9
30.8
Production 1
2002 2003 2004
1,000 Tons 1,000 Tons 1,000 Tons
For Sugar FL HI LA TX
US
For Seed FL HI LA TX
US
For Sugar and Seed FL HI LA TX
US
16,9292,109
13,1601,705
33,903
72450
84927
1,650
17,6532,159
14,0091,732
35,553
16,4672,030
11,7901,655
31,942
76452
1,04852
1,916
17,2312,082
12,8381,707
33,858
13,6212,064
10,3201,708
27,713
63459
84049
1,582
14,2552,123
11,1601,757
29,295 1 Net tons.

Crop Production 2004 Summary Agricultural Statistics BoardJanuary 2005 48 NASS, USDA
Dry Edible Beans: Area Planted and Harvested by CommercialClass, State, and Total, 2002-2004 1
Classand
State
Area Planted Area Harvested
2002 2003 2004 2002 2003 2004
1,000 Acres 1,000 Acres 1,000 Acres 1,000 Acres 1,000 Acres 1,000 Acres
Large Lima - CA
Baby Lima - CA
Navy ID MI MN NE ND OR SD WY
Total
Great Northern ID MI MN NE ND WA WY
Total
Small White ID OR WA
Total
Pinto CA CO ID KS MI MN MT NE NM ND OR SD TX UT WA WY
Total
19.0
21.5
5.485.067.02.9
180.0
4.01.0
345.3
3.13.01.2
77.85.81.52.0
94.4
2.00.50.8
3.3
76.035.819.09.5
25.013.580.78.5
515.01.33.25.51.8
10.527.0
832.3
19.6
14.5
3.140.036.01.0
75.00.51.61.0
158.2
3.58.01.3
84.28.00.93.5
109.4
1.90.50.3
2.7
0.569.029.012.011.021.09.7
50.010.0
410.01.71.91.05.67.0
24.5
663.9
15.1
11.3
4.455.040.01.8
81.00.51.90.5
185.1
2.61.0
44.02.5
1.0
51.1
2.1
0.7
2.8
65.026.29.07.0
18.010.857.06.0
415.01.92.2
5.35.5
22.0
650.9
18.2
21.0
5.384.060.02.7
151.0
3.90.8
307.7
3.03.01.0
67.74.91.51.6
82.7
1.90.50.8
3.2
57.035.016.09.5
23.012.976.08.5
460.01.32.84.50.3
10.525.0
742.3
19.0
14.1
3.038.035.0
1.071.0
0.51.50.9
150.9
3.48.01.2
79.17.80.93.4
103.8
1.80.50.3
2.6
0.564.028.211.010.520.0
9.748.510.0
397.01.51.80.55.27.0
23.8
639.2
14.6
10.9
4.154.033.0
1.767.0
0.51.80.4
162.5
2.61.0
40.02.3
0.9
46.8
2.1
0.7
2.8
59.025.8
8.56.5
16.010.652.0
6.0354.0
1.82.2
4.85.2
21.3
573.7
See footnote(s) at end of table. --continued

Crop Production 2004 Summary Agricultural Statistics BoardJanuary 2005 49 NASS, USDA
Dry Edible Beans: Yield and Production by CommercialClass, State, and Total, 2002-2004 1 (continued)
Classand
State
Yield per Acre 2 Production 2
2002 2003 2004 2002 2003 2004
Pounds Pounds Pounds 1,000 Cwt 1,000 Cwt 1,000 Cwt
Large Lima - CA
Baby Lima - CA
Navy ID MI MN NE ND OR SD WY
Total
Great Northern ID MI MN NE ND WA WY
Total
Small White ID OR WA
Total
Pinto CA CO ID KS MI MN MT NE NM ND OR SD TX UT WA WY
Total
1,840
2,390
2,2501,9301,8802,5201,550
2,4602,250
1,751
2,1702,0001,2001,9001,5102,2001,750
1,884
2,0002,4002,250
2,125
2,2502,3801,6001,9301,4002,2502,2501,8001,5602,3102,610
6401,6702,8102,180
1,777
1,940
2,300
2,3701,5601,7502,3001,6401,6001,6002,220
1,666
2,3201,6802,0802,2001,7602,2202,300
2,135
2,1702,0002,000
2,115
1,2001,6102,3002,1001,4301,6502,1502,1001,8601,4802,0002,1101,600
3102,3002,210
1,635
2,030
2,360
2,3901,8001,0002,400
9702,0001,8302,500
1,318
2,2301,600
2,0701,260
2,330
2,032
2,380
2,290
2,357
1,5202,3001,8001,7101,0002,3802,3002,6001,0102,0002,500
3002,9402,250
1,362
334
501
1191,6201,128
682,340
9618
5,389
656012
1,286743328
1,558
381218
68
1,282833256183322290
1,709153
7,184307329
5295544
13,188
369
325
7159261223
1,1648
2420
2,514
7913425
1,7431372078
2,216
3910
6
55
61,031
649231150329209
1,019186
5,8643038
816
161526
10,453
297
257
98970330
41650
103310
2,142
5816
82729
21
951
50
16
66
895593153111160252
1,196156
3,5613655
14153479
7,814 1 Missing data are included in "Other" class to avoid disclosure of individual operations or no data were reported. 2 Clean basis.

Crop Production 2004 Summary Agricultural Statistics BoardJanuary 2005 50 NASS, USDA
Dry Edible Beans: Area Planted and Harvested by CommercialClass, State, and Total, 2002-2004 1
Classand
State
Area Planted Area Harvested
2002 2003 2004 2002 2003 2004
1,000 Acres 1,000 Acres 1,000 Acres 1,000 Acres 1,000 Acres 1,000 Acres
Light Red Kidney CA CO ID MI MN NE NY WA
Total
Dark Red Kidney CA ID MI MN NY ND WI
Total
Pink CA ID MN ND WA
Total
Small Red ID MI MN ND WA
Total
Cranberry CA ID MI
Total
6.010.01.3
15.07.6
14.015.01.5
70.4
2.51.48.5
42.02.07.07.7
71.1
10.88.99.06.1
34.8
10.711.02.8
6.4
30.9
1.72.5
20.0
24.2
5.07.01.0
16.010.014.014.1
67.1
0.90.99.0
27.01.15.06.0
49.9
0.910.68.58.54.3
32.8
9.019.01.5
3.7
33.2
1.51.9
12.0
15.4
4.66.01.8
15.07.39.0
12.0
55.7
1.21.67.0
30.01.55.05.0
51.3
0.211.06.26.85.0
29.2
8.415.51.64.73.0
33.2
2.11.99.5
13.5
6.08.01.3
14.57.4
13.714.71.5
67.1
2.51.48.0
39.02.05.17.6
65.6
10.68.67.86.1
33.1
10.511.02.5
6.4
30.4
1.72.5
19.0
23.2
4.96.01.0
15.59.4
13.913.4
64.1
0.90.99.0
26.01.14.65.9
48.4
0.910.3
8.07.74.3
31.2
8.819.0
1.3
3.7
32.8
1.51.9
12.0
15.4
4.05.01.8
14.56.98.7
11.6
52.5
1.11.56.5
26.41.54.74.9
46.6
0.210.8
5.96.44.9
28.2
8.215.0
1.44.42.9
31.9
1.71.69.0
12.3
See footnote(s) at end of table. --continued
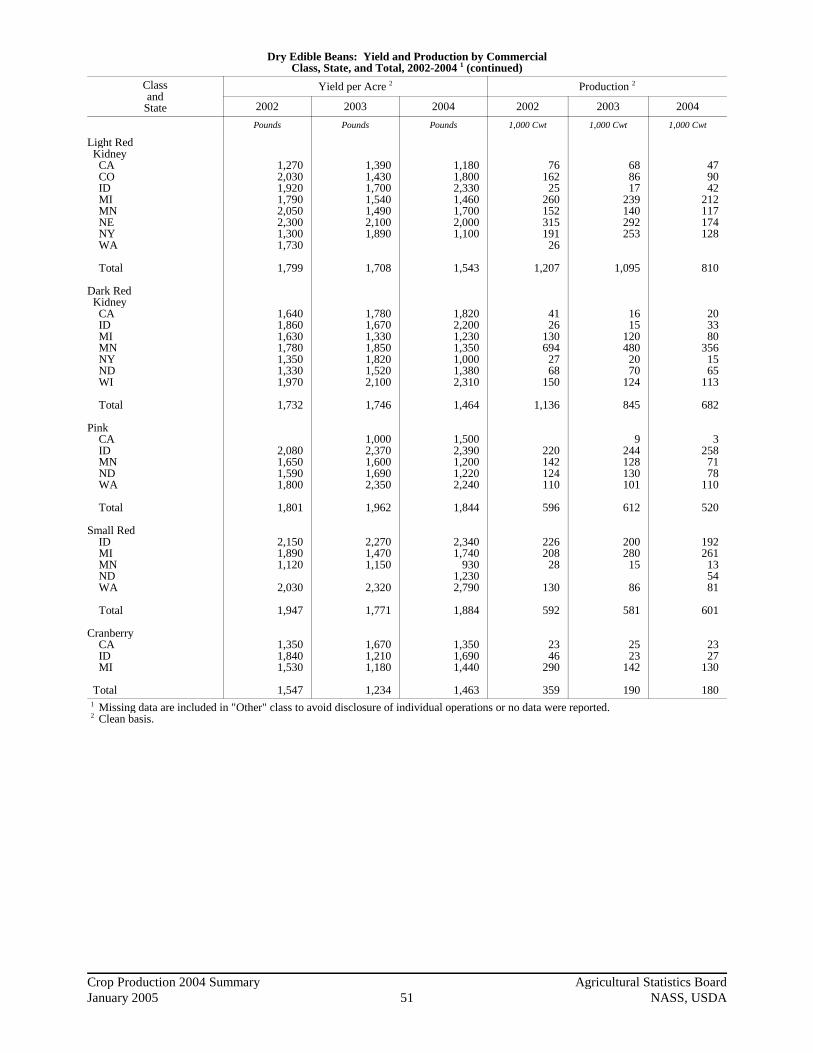
Crop Production 2004 Summary Agricultural Statistics BoardJanuary 2005 51 NASS, USDA
Dry Edible Beans: Yield and Production by CommercialClass, State, and Total, 2002-2004 1 (continued)
Classand
State
Yield per Acre 2 Production 2
2002 2003 2004 2002 2003 2004
Pounds Pounds Pounds 1,000 Cwt 1,000 Cwt 1,000 Cwt
Light Red Kidney CA CO ID MI MN NE NY WA
Total
Dark Red Kidney CA ID MI MN NY ND WI
Total
Pink CA ID MN ND WA
Total
Small Red ID MI MN ND WA
Total
Cranberry CA ID MI
Total
1,2702,0301,9201,7902,0502,3001,3001,730
1,799
1,6401,8601,6301,7801,3501,3301,970
1,732
2,0801,6501,5901,800
1,801
2,1501,8901,120
2,030
1,947
1,3501,8401,530
1,547
1,3901,4301,7001,5401,4902,1001,890
1,708
1,7801,6701,3301,8501,8201,5202,100
1,746
1,0002,3701,6001,6902,350
1,962
2,2701,4701,150
2,320
1,771
1,6701,2101,180
1,234
1,1801,8002,3301,4601,7002,0001,100
1,543
1,8202,2001,2301,3501,0001,3802,310
1,464
1,5002,3901,2001,2202,240
1,844
2,3401,740
9301,2302,790
1,884
1,3501,6901,440
1,463
7616225
26015231519126
1,207
4126
1306942768
150
1,136
220142124110
596
22620828
130
592
2346
290
359
688617
239140292253
1,095
1615
120480
2070
124
845
9244128130101
612
200280
15
86
581
2523
142
190
479042
212117174128
810
203380
3561565
113
682
3258
7178
110
520
192261
135481
601
2327
130
180 1 Missing data are included in "Other" class to avoid disclosure of individual operations or no data were reported. 2 Clean basis.
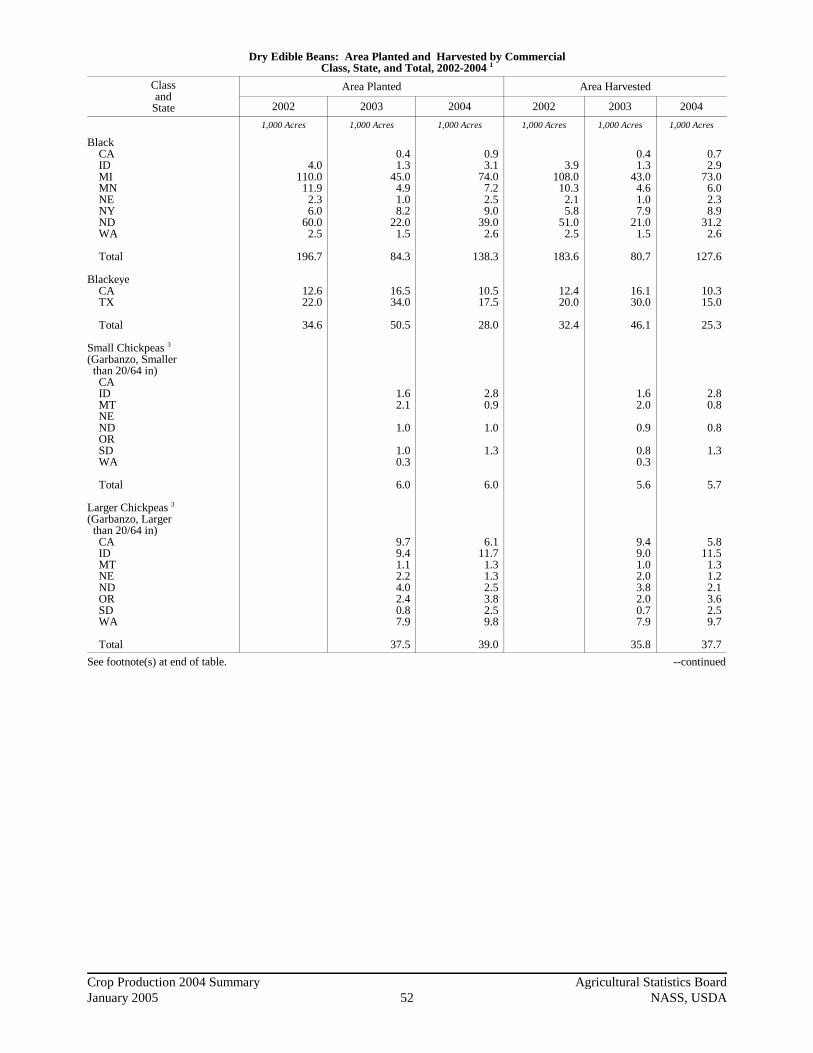
Crop Production 2004 Summary Agricultural Statistics BoardJanuary 2005 52 NASS, USDA
Dry Edible Beans: Area Planted and Harvested by CommercialClass, State, and Total, 2002-2004 1
Classand
State
Area Planted Area Harvested
2002 2003 2004 2002 2003 2004
1,000 Acres 1,000 Acres 1,000 Acres 1,000 Acres 1,000 Acres 1,000 Acres
Black CA ID MI MN NE NY ND WA
Total
Blackeye CA TX
Total
Small Chickpeas 3
(Garbanzo, Smaller than 20/64 in) CA ID MT NE ND OR SD WA
Total
Larger Chickpeas 3
(Garbanzo, Larger than 20/64 in) CA ID MT NE ND OR SD WA
Total
4.0110.011.9
2.36.0
60.02.5
196.7
12.622.0
34.6
0.41.3
45.04.91.08.2
22.01.5
84.3
16.534.0
50.5
1.62.1
1.0
1.00.3
6.0
9.79.41.12.24.02.40.87.9
37.5
0.93.1
74.07.22.59.0
39.02.6
138.3
10.517.5
28.0
2.80.9
1.0
1.3
6.0
6.111.7
1.31.32.53.82.59.8
39.0
3.9108.0
10.32.15.8
51.02.5
183.6
12.420.0
32.4
0.41.3
43.04.61.07.9
21.01.5
80.7
16.130.0
46.1
1.62.0
0.9
0.80.3
5.6
9.49.01.02.03.82.00.77.9
35.8
0.72.9
73.06.02.38.9
31.22.6
127.6
10.315.0
25.3
2.80.8
0.8
1.3
5.7
5.811.5
1.31.22.13.62.59.7
37.7
See footnote(s) at end of table. --continued

Crop Production 2004 Summary Agricultural Statistics BoardJanuary 2005 53 NASS, USDA
Dry Edible Beans: Yield and Production by CommercialClass, State, and Total, 2002-2004 1 (continued)
Classand
State
Yield per Acre 2 Production 2
2002 2003 2004 2002 2003 2004
Pounds Pounds Pounds 1,000 Cwt 1,000 Cwt 1,000 Cwt
Black CA ID MI MN NE NY ND WA
Total
Blackeye CA TX
Total
Small Chickpeas 3
(Garbanzo, Smaller than 20/64 in) CA ID MT NE ND OR SD WA
Total
Larger Chickpeas 3
(Garbanzo, Larger than 20/64 in) CA ID MT NE ND OR SD WA
Total
1,9501,8801,3501,8101,5701,3502,280
1,699
2,5201,150
1,676
1,7501,9201,5801,7002,0001,8001,3202,270
1,565
2,4501,300
1,703
1,000900
1,560
1,1301,000
1,071
900900400700
1,5801,2001,1401,020
997
1,4301,9701,770
9502,0001,040
8002,580
1,466
2,580850
1,557
1,2501,750
1,000
1,460
1,333
1,9801,2501,4601,1701,6201,2501,2801,180
1,371
762,030
1393891
68957
3,120
313230
543
725
6807820
142277
34
1,263
395390
785
1618
14
93
60
85814
1460248
81
357
1057
1,290574693
25067
1,870
266128
394
3514
8
19
76
115144
1914344532
114
517 1 Missing data are included in "Other" class to avoid disclosure of individual operations or no data were reported. 2 Clean basis. 3 Estimates began in 2003.

Crop Production 2004 Summary Agricultural Statistics BoardJanuary 2005 54 NASS, USDA
Dry Edible Beans: Area Planted and Harvested by CommercialClass, State, and Total, 2002-2004 1
Classand
State
Area Planted Area Harvested
2002 2003 2004 2002 2003 2004
1,000 Acres 1,000 Acres 1,000 Acres 1,000 Acres 1,000 Acres 1,000 Acres
Chickpeas, All (Garbanzo) CA ID MT NE ND OR SD WA
Total
Other CA CO ID KS MI MN MT NE NY ND OR SD TX WA WY
Total
18.517.012.7
8.64.0
10.314.4
85.5
10.26.01.02.08.03.60.77.32.04.64.03.5
10.00.82.0
65.7
9.711.03.22.25.02.41.88.2
43.5
7.54.01.8
10.04.80.12.61.66.51.92.7
15.01.61.0
61.1
6.114.52.21.33.53.83.89.8
45.0
8.04.02.4
6.04.7
4.41.52.51.81.12.53.41.5
43.8
18.016.69.6
6.23.55.8
14.4
74.1
9.25.01.01.58.03.20.52.82.04.03.23.58.00.81.6
54.3
9.410.6
3.02.04.72.01.58.2
41.4
7.33.01.8
10.04.50.12.51.66.21.52.7
13.51.60.9
57.2
5.814.3
2.11.22.93.63.89.7
43.4
7.73.02.3
5.54.4
4.11.52.11.61.12.53.01.4
40.2
See footnote(s) at end of table. --continued

Crop Production 2004 Summary Agricultural Statistics BoardJanuary 2005 55 NASS, USDA
Dry Edible Beans: Yield and Production by CommercialClass, State, and Total, 2002-2004 1 (continued)
Classand
State
Yield per Acre 2 Production 2
2002 2003 2004 2002 2003 2004
Pounds Pounds Pounds 1,000 Cwt 1,000 Cwt 1,000 Cwt
Chickpeas, All (Garbanzo) CA ID MT NE ND OR SD WA
Total
Other CA CO ID KS MI MN MT NE NY ND OR SD TX WA WY
Total
1,6001,280
760
1,470770430
1,010
1,162
2,0201,5002,1001,6001,5301,530
7001,7501,2001,4002,4201,910
7002,0002,130
1,584
900920730700
1,5701,2001,1301,020
1,007
1,0301,7002,110
1,3801,4002,0001,6001,9401,3501,8002,000
8502,0602,330
1,350
1,9801,2501,5701,1701,4501,2501,3401,180
1,366
1,6201,8002,220
1,3601,050
1,900730
1,0001,5602,270
4802,2702,210
1,547
288212
73
912725
145
861
186752124
122494
4924567767561634
860
8597221474241784
417
755138
138632
4031842754
1153321
772
115179
3314424551
114
593
1255451
7546
7811212525126831
622 1 Missing data are included in "Other" class to avoid disclosure of individual operations or no data were reported. 2 Clean Basis.

Crop Production 2004 Summary Agricultural Statistics BoardJanuary 2005 56 NASS, USDA
Dry Edible Beans: Area Planted and Harvested, Yield, and Productionby State and United States, 2002-2004 1
StateArea Planted Area Harvested
2002 2003 2004 2002 2003 2004
1,000 Acres 1,000 Acres 1,000 Acres 1,000 Acres 1,000 Acres 1,000 Acres
CACOIDKSMIMNMTNENMNYNDORSDTXUTWAWIWY
US
92.092.095.021.0
270.0170.0
26.9185.0
8.525.0
790.09.8
21.037.51.8
44.57.7
32.0
1,929.7
77.080.075.012.0
170.0115.013.0
155.010.025.0
540.07.08.0
50.05.6
27.56.0
30.0
1,406.1
60.075.080.09.0
190.0115.0
13.0120.0
6.024.0
560.08.09.0
20.05.3
30.05.0
25.0
1,354.3
89.070.093.017.5
265.0155.0
23.0165.0
8.524.5
690.08.5
16.032.50.3
44.57.6
29.0
1,738.9
75.073.073.011.0
165.0110.0
12.8148.0
10.024.0
520.06.07.5
44.05.2
27.55.9
29.0
1,346.9
57.067.078.0
8.5185.0100.0
12.7110.0
6.023.5
475.07.58.9
17.54.8
29.04.9
24.0
1,219.3
Yield per Acre 2 Production 2
2002 2003 2004 2002 2003 2004
Pounds Pounds Pounds 1,000 Cwt 1,000 Cwt 1,000 Cwt
CACOIDKSMIMNMTNENMNYNDORSDTXUTWAWIWY
US
1,9802,1702,0501,6001,8501,7201,6002,1001,8001,3601,5401,7201,630
9701,6701,8701,9702,150
1,743
1,8401,6002,0502,1001,5001,7001,8202,1301,8601,8601,5001,6501,7701,170
3101,9102,1002,220
1,670
2,0401,5502,1001,8001,7001,1502,2402,1602,6001,0501,0001,5501,840
800300
2,1002,3102,250
1,460
1,7621,5191,907
2804,9032,666
3673,465
153333
10,626146261315
5830150624
30,312
1,3801,1681,497
2312,4751,870
2333,151
186446
7,80099
13351316
525124645
22,492
1,1631,0391,638
1533,1451,150
2852,376
156247
4,750116164140
14609113541
17,799 1 Excludes beans grown for garden seed. 2 Clean Basis.

Crop Production 2004 Summary Agricultural Statistics BoardJanuary 2005 57 NASS, USDA
Lentils: Area Planted, Harvested, Yield, and Productionby State and United States, 2002-2004
StateArea Planted Area Harvested
2002 2003 2004 2002 2003 2004
1,000 Acres 1,000 Acres 1,000 Acres 1,000 Acres 1,000 Acres 1,000 Acres
IDMTNDWA
US
68.025.053.080.0
226.0
68.030.055.093.0
246.0
72.078.0
100.095.0
345.0
66.022.047.080.0
215.0
66.026.054.091.0
237.0
70.072.094.093.0
329.0
Yield Production
2002 2003 2004 2002 2003 2004
Pounds Pounds Pounds 1,000 Cwt 1,000 Cwt 1,000 Cwt
IDMTNDWA
US
1,200750
1,0501,400
1,196
9501,0501,1701,000
1,030
1,1001,4001,3701,200
1,271
792165494
1,120
2,571
627273632910
2,442
7701,0081,2881,116
4,182
Wrinkled Seed Peas: Production by Stateand United States, 2002-2004
StateProduction
2002 2003 2004
1,000 Cwt 1,000 Cwt 1,000 Cwt
IDWA
US
157442
599
163510
673
174725
899
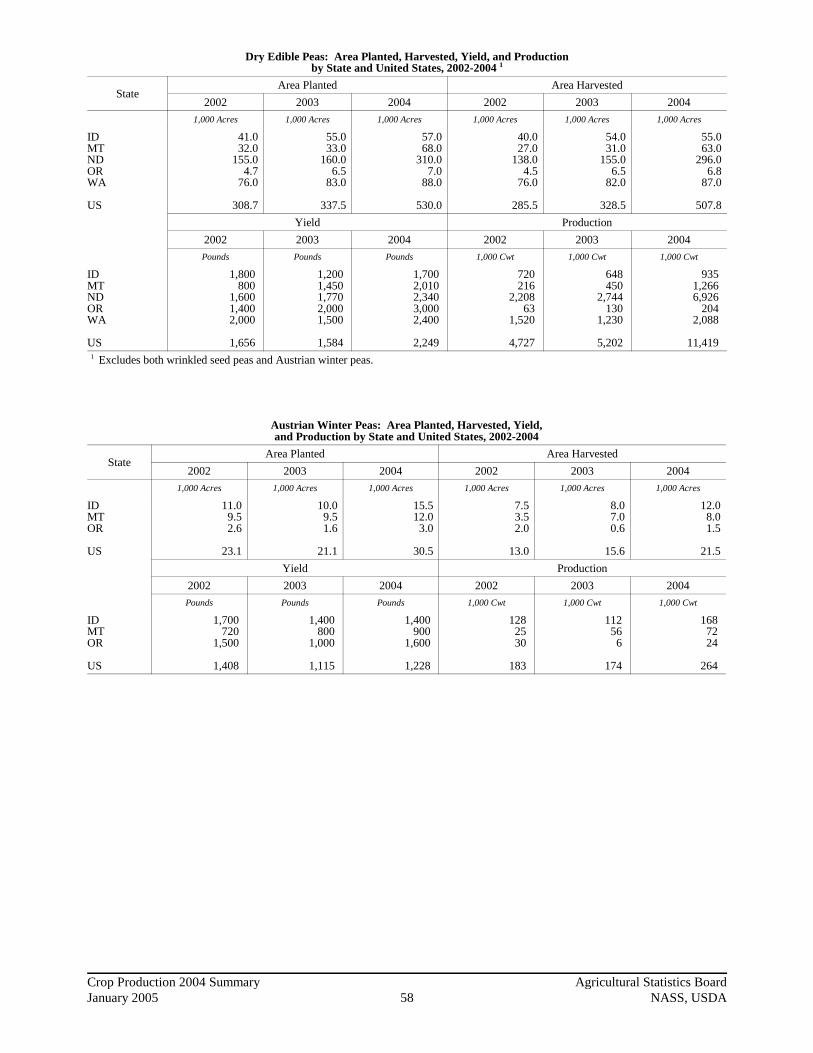
Crop Production 2004 Summary Agricultural Statistics BoardJanuary 2005 58 NASS, USDA
Dry Edible Peas: Area Planted, Harvested, Yield, and Productionby State and United States, 2002-2004 1
StateArea Planted Area Harvested
2002 2003 2004 2002 2003 2004
1,000 Acres 1,000 Acres 1,000 Acres 1,000 Acres 1,000 Acres 1,000 Acres
IDMTNDORWA
US
41.032.0
155.04.7
76.0
308.7
55.033.0
160.06.5
83.0
337.5
57.068.0
310.07.0
88.0
530.0
40.027.0
138.04.5
76.0
285.5
54.031.0
155.06.5
82.0
328.5
55.063.0
296.06.8
87.0
507.8
Yield Production
2002 2003 2004 2002 2003 2004
Pounds Pounds Pounds 1,000 Cwt 1,000 Cwt 1,000 Cwt
IDMTNDORWA
US
1,800800
1,6001,4002,000
1,656
1,2001,4501,7702,0001,500
1,584
1,7002,0102,3403,0002,400
2,249
720216
2,20863
1,520
4,727
648450
2,744130
1,230
5,202
9351,2666,926
2042,088
11,419 1 Excludes both wrinkled seed peas and Austrian winter peas.
Austrian Winter Peas: Area Planted, Harvested, Yield,and Production by State and United States, 2002-2004
StateArea Planted Area Harvested
2002 2003 2004 2002 2003 2004
1,000 Acres 1,000 Acres 1,000 Acres 1,000 Acres 1,000 Acres 1,000 Acres
IDMTOR
US
11.09.52.6
23.1
10.09.51.6
21.1
15.512.03.0
30.5
7.53.52.0
13.0
8.07.00.6
15.6
12.08.01.5
21.5
Yield Production
2002 2003 2004 2002 2003 2004
Pounds Pounds Pounds 1,000 Cwt 1,000 Cwt 1,000 Cwt
IDMTOR
US
1,700720
1,500
1,408
1,400800
1,000
1,115
1,400900
1,600
1,228
1282530
183
112566
174
1687224
264

Crop Production 2004 Summary Agricultural Statistics BoardJanuary 2005 59 NASS, USDA
Potatoes: Area Planted, Harvested, Yield, and Productionby Seasonal Group, State, and United States, 2002-2004
SeasonalGroup and
State
Area Planted Area Harvested
2002 2003 2004 2002 2003 2004
1,000 Acres 1,000 Acres 1,000 Acres 1,000 Acres 1,000 Acres 1,000 Acres
Winter 1
CA FL
Total
Spring 2
AZ CA FL Hastings Other FL NC TX
Total
9.06.8
15.8
7.819.029.021.57.5
19.512.5
87.8
8.56.1
14.6
7.619.030.021.58.5
19.013.0
88.6
13.05.7
18.7
6.217.524.818.26.6
17.011.0
76.5
9.06.7
15.7
7.819.028.321.0
7.319.012.0
86.1
8.55.8
14.3
7.619.028.620.38.3
17.012.5
84.7
13.05.5
18.5
6.217.524.518.0
6.513.510.5
72.2
Yield Production
2002 2003 2004 2002 2003 2004
Cwt Cwt Cwt 1,000 Cwt 1,000 Cwt 1,000 Cwt
Winter 1
CA FL
Total
Spring 2
AZ CA FL Hastings Other FL NC TX
Total
270265
268
270405261275220170170
261
310240
282
275440280280280175240
288
250285
260
285475313320295200210
314
2,4301,776
4,206
2,1067,6957,3815,7751,6063,2302,040
22,452
2,6351,392
4,027
2,0908,3608,0085,6842,3242,9753,000
24,433
3,2501,568
4,818
1,7678,3137,6785,7601,9182,7002,205
22,663 1 Carried forward from earlier estimate. 2 2004 revised.

Crop Production 2004 Summary Agricultural Statistics BoardJanuary 2005 60 NASS, USDA
Potatoes: Area Planted and Harvested by Seasonal Group,State, and United States, 2002-2004
SeasonalGroup and
State
Area Planted Area Harvested
2002 2003 2004 2002 2003 2004
1,000 Acres 1,000 Acres 1,000 Acres 1,000 Acres 1,000 Acres 1,000 Acres
Summer AL CA CO DE IL KS MD MO NJ NM TX VA
Total
Fall CA CO ID 10 SW Co Other ID IN ME MA MI MN MT NE NV NM NY ND OH OR Malheur Other OR PA RI SD 1
UT 1
WA WI
Total
US
2.77.36.44.16.53.04.57.02.62.58.86.5
61.9
8.371.6
375.027.0
348.02.9
64.53.3
46.562.010.522.07.64.0
22.5118.0
4.550.08.0
42.012.50.51.10.8
162.084.0
1,134.1
1,299.6
3.07.56.53.76.52.84.78.02.81.99.07.0
63.4
8.366.3
360.025.0
335.03.8
66.03.0
46.060.010.723.58.34.0
22.2117.0
4.542.85.8
37.013.00.61.01.0
163.081.0
1,106.0
1,272.6
2.37.06.53.35.03.54.76.92.31.2
10.46.0
59.1
7.665.0
355.025.0
330.03.4
63.52.6
43.047.010.722.06.74.0
20.0105.0
3.737.05.2
31.812.00.5
160.071.0
1,039.7
1,194.0
2.77.36.34.06.42.94.45.42.62.38.36.3
58.9
8.371.5
373.027.0
346.02.8
64.03.2
45.557.010.421.8
7.64.0
22.0102.0
4.449.8
8.041.811.5
0.51.10.8
162.082.0
1,105.2
1,265.9
1.87.26.43.66.12.74.67.12.71.98.46.2
58.7
8.365.7
358.025.0
333.03.7
65.52.7
45.558.010.623.28.04.0
21.7112.0
4.342.65.8
36.812.50.61.01.0
162.080.0
1,090.9
1,248.6
1.37.06.43.14.83.44.66.22.21.09.65.0
54.6
7.664.3
353.025.0
328.03.2
62.02.5
42.044.010.621.6
6.74.0
19.2101.0
3.637.0
5.231.811.0
0.5
159.070.0
1,022.8
1,168.1 1 Estimates discontinued in 2004.

Crop Production 2004 Summary Agricultural Statistics BoardJanuary 2005 61 NASS, USDA
Potatoes: Yield and Production by Seasonal Group,State, and United States, 2002-2004
SeasonalGroup and
State
Yield Production
2002 2003 2004 2002 2003 2004
Cwt Cwt Cwt 1,000 Cwt 1,000 Cwt 1,000 Cwt
Summer AL CA CO DE IL KS MD MO NJ NM TX VA
Total
Fall CA CO ID 10 SW Co Other ID IN ME MA MI MN MT NE NV NM NY ND OH OR Malheur Other OR PA RI SD 1
UT 2
WA WI
Total
US
190360360250310340250240275320400220
304
520390358455350260265255305330310395350400250230205501400520185235300305570375
374
362
185385360240360380240265250280420250
320
425360344465335250260265330385315420415400300245255493415505270285340335575410
376
367
175380365260415400260310270340440240
345
510360374490365350310320325430335430430430270265300534470545240350
590435
401
391
5132,6282,2681,0001,984
9861,1001,296
715736
3,3201,386
17,932
4,31627,885
133,38512,285
121,100728
16,960816
13,87818,810
3,2248,6112,6601,6005,500
23,460902
24,9363,200
21,7362,128
118330244
92,34030,750
413,581
458,171
3332,7722,304
8642,1961,0261,1041,882
675532
3,5281,550
18,766
3,52823,652
123,18011,625
111,555925
17,030716
15,01522,330
3,3399,7443,3201,6006,510
27,4401,097
20,9912,407
18,5843,375
171340335
93,15032,800
410,588
457,814
2282,6602,336
8061,9921,3601,1961,922
594340
4,2241,200
18,858
3,87623,148
131,97012,250
119,7201,120
19,220800
13,65018,920
3,5519,2882,8811,7205,184
26,7651,080
19,7752,444
17,3312,640
175
93,81030,450
410,023
456,362 1 Estimates discontinued in 2004.

Crop Production 2004 Summary Agricultural Statistics BoardJanuary 2005 62 NASS, USDA
Potatoes: Area Planted and Harvested by Stateand United States, 2002-2004
StateArea Planted Area Harvested
2002 2003 2004 2002 2003 2004
1,000 Acres 1,000 Acres 1,000 Acres 1,000 Acres 1,000 Acres 1,000 Acres
ALAZCACODEFLIDILINKSMEMDMAMIMNMOMTNENVNJNMNYNCNDOHORPARISD 1
TXUT 1
VAWAWI
US
2.77.8
43.678.04.1
35.8375.0
6.52.93.0
64.54.53.3
46.562.07.0
10.522.07.62.66.5
22.519.5
118.04.5
50.012.50.51.1
21.30.86.5
162.084.0
1,299.6
3.07.6
43.372.83.7
36.1360.0
6.53.82.8
66.04.73.0
46.060.08.0
10.723.58.32.85.9
22.219.0
117.04.5
42.813.00.61.0
22.01.07.0
163.081.0
1,272.6
2.36.2
45.171.53.3
30.5355.0
5.03.43.5
63.54.72.6
43.047.06.9
10.722.06.72.35.2
20.017.0
105.03.7
37.012.00.5
21.4
6.0160.0
71.0
1,194.0
2.77.8
43.677.8
4.035.0
373.06.42.82.9
64.04.43.2
45.557.0
5.410.421.8
7.62.66.3
22.019.0
102.04.4
49.811.5
0.51.1
20.30.86.3
162.082.0
1,265.9
1.87.6
43.072.1
3.634.4
358.06.13.72.7
65.54.62.7
45.558.0
7.110.623.2
8.02.75.9
21.717.0
112.04.3
42.612.5
0.61.0
20.91.06.2
162.080.0
1,248.6
1.36.2
45.170.73.1
30.0353.0
4.83.23.4
62.04.62.5
42.044.06.2
10.621.66.72.25.0
19.213.5
101.03.6
37.011.00.5
20.1
5.0159.0
70.0
1,168.1 1 Estimates discontinued in 2004.

Crop Production 2004 Summary Agricultural Statistics BoardJanuary 2005 63 NASS, USDA
Potatoes: Yield and Production by Stateand United States, 2002-2004
StateYield 1 Production
2002 2003 2004 2002 2003 2004
Cwt Cwt Cwt 1,000 Cwt 1,000 Cwt 1,000 Cwt
ALAZCACODEFLIDILINKSMEMDMAMIMNMOMTNENVNJNMNYNCNDOHORPARISD 2
TXUT 2
VAWAWI
US
190270391388250262358310260340265250255305330240310395350275371250170230205501185236300264305220570375
362
185275402360240273344360250380260240265330385265315420415250361300175245255493270285340312335250575410
367
175285401360260308374415350400310260320325430310335430430270412270200265300534240350
320
240590435
391
5132,106
17,06930,1531,0009,157
133,3851,984
728986
16,9601,100
81613,87818,8101,2963,2248,6112,660
7152,3365,5003,230
23,460902
24,9362,128
118330
5,360244
1,38692,34030,750
458,171
3332,090
17,29525,956
8649,400
123,1802,196
9251,026
17,0301,104
71615,01522,3301,8823,3399,7443,320
6752,1326,5102,975
27,4401,097
20,9913,375
171340
6,528335
1,55093,15032,800
457,814
2281,767
18,09925,484
8069,246
131,9701,9921,1201,360
19,2201,196
80013,65018,920
1,9223,5519,2882,881
5942,0605,1842,700
26,7651,080
19,7752,640
175
6,429
1,20093,81030,450
456,362 1 Derived 2 Estimates discontinued in 2004.
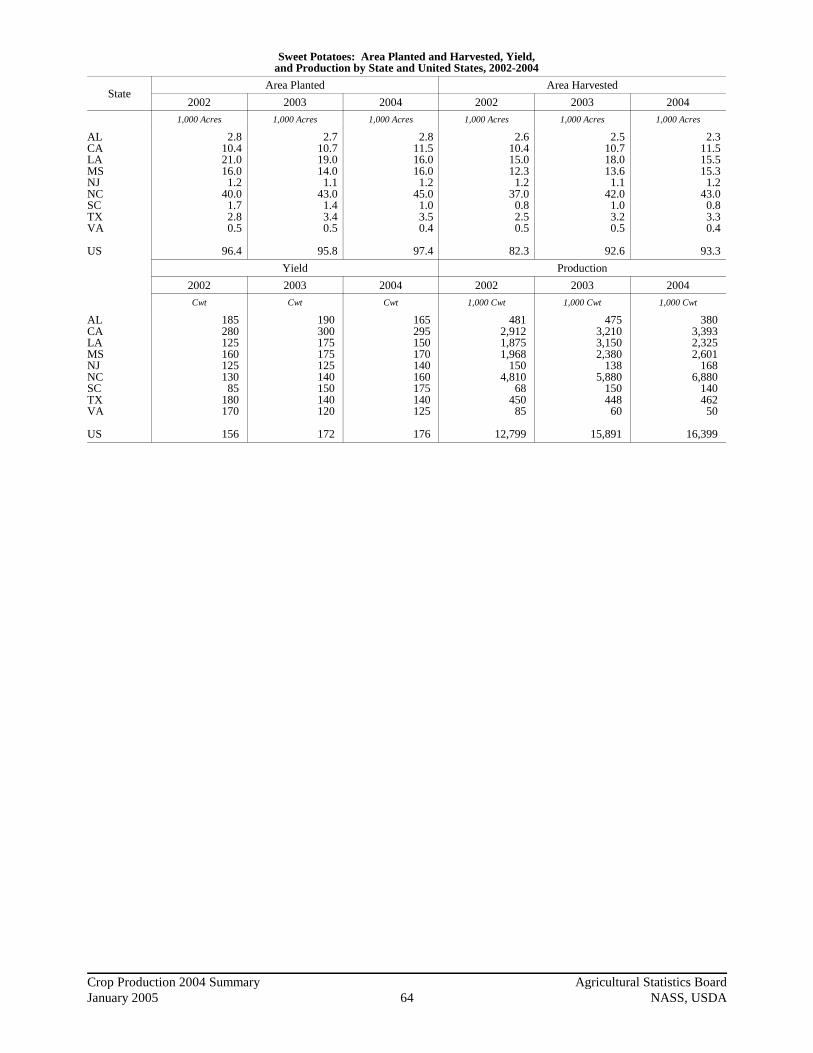
Crop Production 2004 Summary Agricultural Statistics BoardJanuary 2005 64 NASS, USDA
Sweet Potatoes: Area Planted and Harvested, Yield,and Production by State and United States, 2002-2004
StateArea Planted Area Harvested
2002 2003 2004 2002 2003 2004
1,000 Acres 1,000 Acres 1,000 Acres 1,000 Acres 1,000 Acres 1,000 Acres
ALCALAMSNJNCSCTXVA
US
2.810.421.016.01.2
40.01.72.80.5
96.4
2.710.719.014.01.1
43.01.43.40.5
95.8
2.811.516.016.01.2
45.01.03.50.4
97.4
2.610.415.012.3
1.237.0
0.82.50.5
82.3
2.510.718.013.6
1.142.0
1.03.20.5
92.6
2.311.515.515.31.2
43.00.83.30.4
93.3
Yield Production
2002 2003 2004 2002 2003 2004
Cwt Cwt Cwt 1,000 Cwt 1,000 Cwt 1,000 Cwt
ALCALAMSNJNCSCTXVA
US
18528012516012513085
180170
156
190300175175125140150140120
172
165295150170140160175140125
176
4812,9121,8751,968
1504,810
68450
85
12,799
4753,2103,1502,380
1385,880
150448
60
15,891
3803,3932,3252,601
1686,880
14046250
16,399
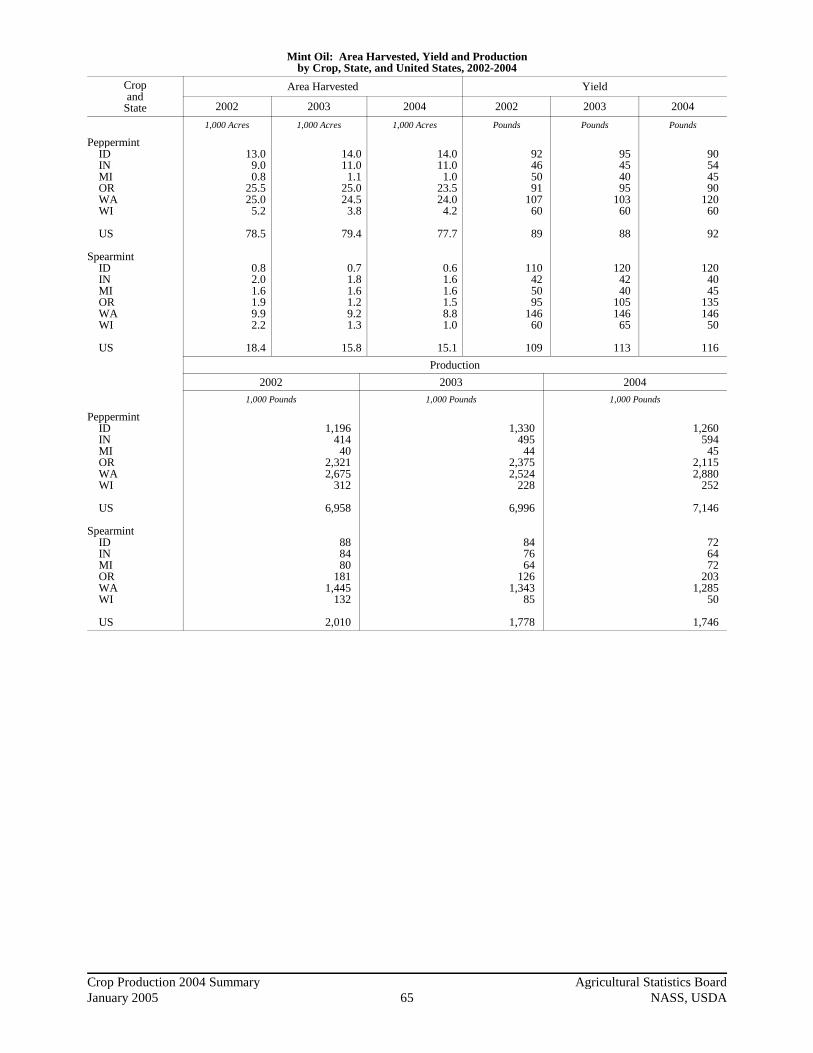
Crop Production 2004 Summary Agricultural Statistics BoardJanuary 2005 65 NASS, USDA
Mint Oil: Area Harvested, Yield and Productionby Crop, State, and United States, 2002-2004
Cropand
State
Area Harvested Yield
2002 2003 2004 2002 2003 2004
1,000 Acres 1,000 Acres 1,000 Acres Pounds Pounds Pounds
Peppermint ID IN MI OR WA WI
US
Spearmint ID IN MI OR WA WI
US
13.09.00.8
25.525.05.2
78.5
0.82.01.61.99.92.2
18.4
14.011.01.1
25.024.53.8
79.4
0.71.81.61.29.21.3
15.8
14.011.0
1.023.524.0
4.2
77.7
0.61.61.61.58.81.0
15.1
92465091
10760
89
110425095
14660
109
95454095
10360
88
1204240
10514665
113
90544590
12060
92
1204045
135146
50
116
Production
2002 2003 2004
1,000 Pounds 1,000 Pounds 1,000 Pounds
Peppermint ID IN MI OR WA WI
US
Spearmint ID IN MI OR WA WI
US
1,19641440
2,3212,675
312
6,958
888480
1811,445
132
2,010
1,33049544
2,3752,524
228
6,996
847664
1261,343
85
1,778
1,260594
452,1152,880
252
7,146
726472
2031,285
50
1,746
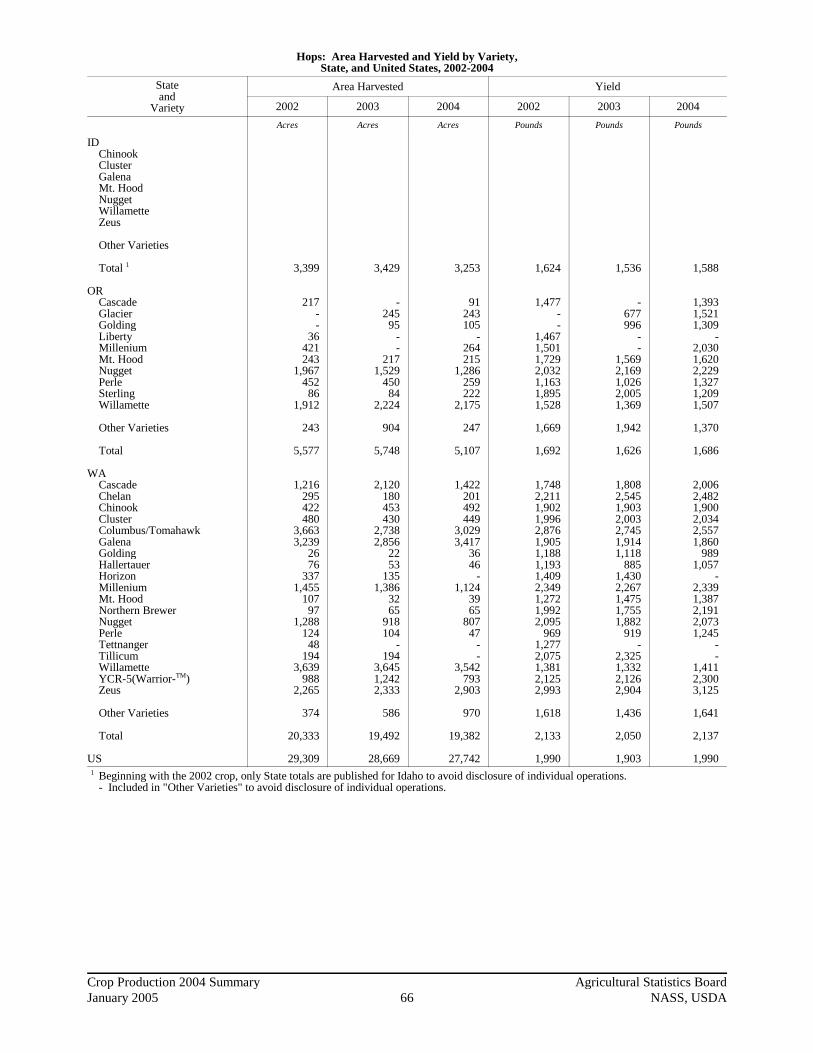
Crop Production 2004 Summary Agricultural Statistics BoardJanuary 2005 66 NASS, USDA
Hops: Area Harvested and Yield by Variety,State, and United States, 2002-2004
Stateand
Variety
Area Harvested Yield
2002 2003 2004 2002 2003 2004
Acres Acres Acres Pounds Pounds Pounds
ID Chinook Cluster Galena Mt. Hood Nugget Willamette Zeus
Other Varieties
Total 1
OR Cascade Glacier Golding Liberty Millenium Mt. Hood Nugget Perle Sterling Willamette
Other Varieties
Total
WA Cascade Chelan Chinook Cluster Columbus/Tomahawk Galena Golding Hallertauer Horizon Millenium Mt. Hood Northern Brewer Nugget Perle Tettnanger Tillicum Willamette YCR-5(Warrior-TM) Zeus
Other Varieties
Total
US
3,399
217 - -
36421243
1,967452
861,912
243
5,577
1,216295422480
3,6633,239
2676
3371,455
10797
1,288124
48194
3,639988
2,265
374
20,333
29,309
3,429
-245
95 - -
2171,529
45084
2,224
904
5,748
2,120180453430
2,7382,856
2253
1351,386
3265
918104
-194
3,6451,2422,333
586
19,492
28,669
3,253
91243105
-264215
1,286259222
2,175
247
5,107
1,422201492449
3,0293,417
3646 -
1,1243965
80747 - -
3,542793
2,903
970
19,382
27,742
1,624
1,477 - -
1,4671,5011,7292,0321,1631,8951,528
1,669
1,692
1,7482,2111,9021,9962,8761,9051,1881,1931,4092,3491,2721,9922,095
9691,2772,0751,3812,1252,993
1,618
2,133
1,990
1,536
-677996
- -
1,5692,1691,0262,0051,369
1,942
1,626
1,8082,5451,9032,0032,7451,9141,118
8851,4302,2671,4751,7551,882
919 -
2,3251,3322,1262,904
1,436
2,050
1,903
1,588
1,3931,5211,309
-2,0301,6202,2291,3271,2091,507
1,370
1,686
2,0062,4821,9002,0342,5571,860
9891,057
-2,3391,3872,1912,0731,245
- -
1,4112,3003,125
1,641
2,137
1,990 1 Beginning with the 2002 crop, only State totals are published for Idaho to avoid disclosure of individual operations.
- Included in "Other Varieties" to avoid disclosure of individual operations.

Crop Production 2004 Summary Agricultural Statistics BoardJanuary 2005 67 NASS, USDA
Hops: Production by Variety, State,and United States, 2002-2004
Stateand
Variety
Production
2002 2003 2004
1,000 Pounds 1,000 Pounds 1,000 Pounds
ID Chinook Cluster Galena Mt. Hood Nugget Willamette Zeus
Other Varieties
Total 1
OR Cascade Glacier Golding Liberty Millenium Mt. Hood Nugget Perle Sterling Willamette
Other Varieties
Total
WA Cascade Chelan Chinook Cluster Columbus/Tomahawk Galena Golding Hallertauer Horizon Millenium Mt. Hood Northern Brewer Nugget Perle Tettnanger Tillicum Willamette YCR-5(Warrior-TM) Zeus
Other Varieties
Total
US
5,519.6
320.5 - -
52.8631.9420.1
3,996.9525.7163.0
2,921.5
405.6
9,438.0
2,125.6652.2802.6958.1
10,534.86,170.3
30.990.7
474.83,417.8
136.1193.2
2,698.4120.261.3
402.65,025.52,099.56,779.1
605.3
43,379.0
58,336.6
5,266.3
-165.8
94.6 - -
340.43,316.4
461.8168.4
3,045.0
1,755.2
9,347.6
3,833.0458.1862.1861.3
7,515.85,466.4
24.646.9
193.13,142.1
47.2114.1
1,727.795.6 -
451.14,855.12,640.56,775.0
841.5
39,951.2
54,565.1
5,165.0
126.8369.6137.4
-536.0348.4
2,866.0343.8268.4
3,277.2
338.4
8,612.0
2,852.5498.9934.8913.3
7,745.26,355.6
35.648.6 -
2,629.054.1
142.41,672.9
58.5 - -
4,997.81,823.99,071.9
1,591.9
41,426.9
55,203.9 1 Beginning with the 2002 crop, only State totals are published for Idaho to avoid disclosure of individual operations.
- Included in "Other Varieties" to avoid disclosure of individual operations.
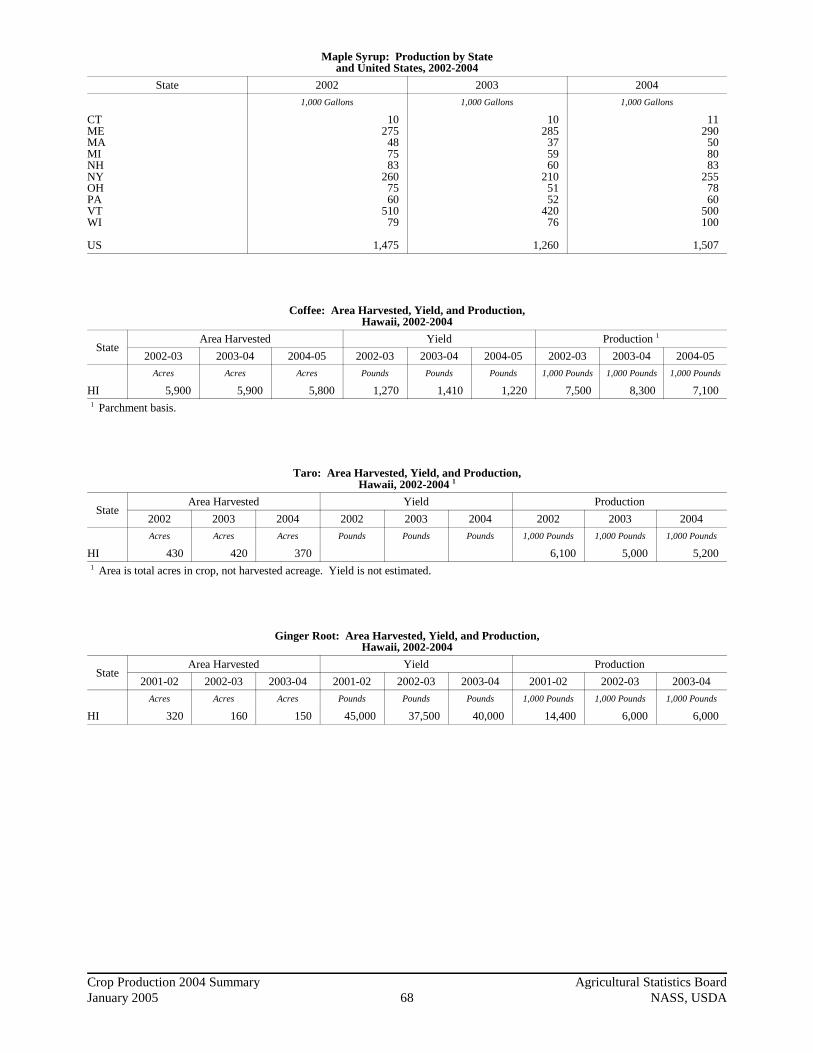
Crop Production 2004 Summary Agricultural Statistics BoardJanuary 2005 68 NASS, USDA
Maple Syrup: Production by Stateand United States, 2002-2004
State 2002 2003 2004
1,000 Gallons 1,000 Gallons 1,000 Gallons
CTMEMAMINHNYOHPAVTWI
US
10275
487583
2607560
51079
1,475
10285375960
2105152
42076
1,260
11290
508083
2557860
500100
1,507
Coffee: Area Harvested, Yield, and Production,Hawaii, 2002-2004
StateArea Harvested Yield Production 1
2002-03 2003-04 2004-05 2002-03 2003-04 2004-05 2002-03 2003-04 2004-05
Acres Acres Acres Pounds Pounds Pounds 1,000 Pounds 1,000 Pounds 1,000 Pounds
HI 5,900 5,900 5,800 1,270 1,410 1,220 7,500 8,300 7,100 1 Parchment basis.
Taro: Area Harvested, Yield, and Production,Hawaii, 2002-2004 1
StateArea Harvested Yield Production
2002 2003 2004 2002 2003 2004 2002 2003 2004
Acres Acres Acres Pounds Pounds Pounds 1,000 Pounds 1,000 Pounds 1,000 Pounds
HI 430 420 370 6,100 5,000 5,200 1 Area is total acres in crop, not harvested acreage. Yield is not estimated.
Ginger Root: Area Harvested, Yield, and Production,Hawaii, 2002-2004
StateArea Harvested Yield Production
2001-02 2002-03 2003-04 2001-02 2002-03 2003-04 2001-02 2002-03 2003-04
Acres Acres Acres Pounds Pounds Pounds 1,000 Pounds 1,000 Pounds 1,000 Pounds
HI 320 160 150 45,000 37,500 40,000 14,400 6,000 6,000

Crop Production 2004 Summary Agricultural Statistics BoardJanuary 2005 69 NASS, USDA
Alaska: Area Planted and Harvested, Yield,and Production, 2002-2004
StateArea Planted for All Purposes Area Harvested
2002 2003 2004 2002 2003 2004
Acres Acres Acres Acres Acres Acres
OatsBarleyAll HayPotatoes
3,0004,200
910
2,7004,000
930
2,2004,600
870
1,2003,800
23,000850
1,2003,500
22,000800
1,3004,200
21,000810
Yield Production
2002 2003 2004 2002 2003 2004
Oats, BuBarley, "All Hay, TonsPotatoes, Cwt
40.039.21.13181
28.338.61.32210
31.534.51.33219
48,000149,000
26,000154,000
34,000135,000
29,000168,000
41,000145,000
28,000177,000

Crop Production 2004 Summary Agricultural Statistics BoardJanuary 2005 70 NASS, USDA
Crop Summary: Area Planted and Harvested, United States, 2003-2004(Domestic Units) 1
CropArea Planted Area Harvested
2003 2004 2003 2004
1,000 Acres 1,000 Acres 1,000 Acres 1,000 Acres
Grains & Hay Barley Corn for Grain 2
Corn for Silage Hay, All Alfalfa All Other Oats Proso Millet Rice Rye Sorghum for Grain 2
Sorghum for Silage Wheat, All Winter Durum Other Spring
Oilseeds Canola Cottonseed Flaxseed Mustard Seed Peanuts Rapeseed Safflower Soybeans for Beans Sunflower
Cotton, Tobacco & Sugar Crops Cotton, All Upland Amer-Pima Sugarbeets Sugarcane Tobacco
Dry Beans, Peas & Lentils Austrian Winter Peas Dry Edible Beans Dry Edible Peas Lentils Wrinkled Seed Peas
Potatoes & Misc. Coffee (HI) Ginger Root (HI) Hops Peppermint Oil Potatoes, All Winter Spring Summer Fall Spearmint Oil Sweet Potatoes Taro (HI) 3
5,348.078,603.0
4,597.0730.0
3,022.01,348.09,420.0
62,141.045,384.0
2,915.013,842.0
1,082.0
595.0110.0
1,344.01.3
222.073,404.0
2,344.0
13,479.613,301.0
178.61,365.4
21.11,406.1
337.5246.0
1,272.614.688.663.4
1,106.0
95.8
4,527.080,930.0
4,085.0710.0
3,347.01,380.07,486.0
59,674.043,350.0
2,561.013,763.0
865.0
523.073.0
1,430.08.7
175.075,208.0
1,873.0
13,658.613,409.0
249.61,346.0
30.51,354.3
530.0345.0
1,194.018.776.559.1
1,039.7
97.4
4,727.070,944.0
6,583.063,383.023,529.039,854.0
2,220.0620.0
2,997.0319.0
7,798.0343.0
53,063.036,753.0
2,869.013,441.0
1,068.0
588.0107.0
1,312.01.2
213.072,476.0
2,197.0
12,003.411,826.0
177.41,347.8
992.3411.2
15.61,346.9
328.5237.0
5.90.2
28.779.4
1,248.614.384.758.7
1,090.915.892.60.4
4,021.073,632.0
6,103.061,916.021,707.040,209.0
1,792.0595.0
3,325.0320.0
6,517.0352.0
49,999.034,462.0
2,363.013,174.0
828.0
516.068.7
1,394.07.8
159.073,958.0
1,711.0
13,057.012,809.0
248.01,306.7
952.1409.1
21.51,219.3
507.8329.0
5.80.2
27.777.7
1,168.118.572.254.6
1,022.815.193.3
0.4 1 Data are the latest estimates available, either from the current report or from previous reports. Current year estimates are for the full
2004 crop year. 2 Area planted for all purposes. 3 Acreage is total acres in crop, not harvested acreage.

Crop Production 2004 Summary Agricultural Statistics BoardJanuary 2005 71 NASS, USDA
Crop Summary: Yield and Production, United States, 2003-2004(Domestic Units) 1
Crop UnitYield Production
2003 2004 2003 2004
1,000 1,000
Grains & Hay Barley Corn for Grain Corn for Silage Hay, All Alfalfa All Other Oats Proso Millet Rice 2
Rye Sorghum for Grain Sorghum for Silage Wheat, All Winter Durum Other Spring
Oilseeds Canola Cottonseed 3
Flaxseed Mustard Seed Peanuts Rapeseed Safflower Soybeans for Beans Sunflower
Cotton, Tobacco & Sugar Crops Cotton, All 2
Upland 2
Amer-Pima 2
Sugarbeets Sugarcane Tobacco
Dry Beans, Peas & Lentils Austrian Winter Peas 2
Dry Edible Beans 2
Dry Edible Peas 2
Lentils 2
Wrinkled Seed Peas 3
Potatoes & Misc. Coffee (HI) Ginger Root (HI) Hops Peppermint Oil Potatoes, All Winter Spring Summer Fall Spearmint Oil Sweet Potatoes Taro (HI) 3
Bu"Ton"""Bu"CwtBu"TonBu"""
LbTonBuLb"""BuLb
Bale""Ton"Lb
Cwt""""
Lb"""Cwt""""LbCwtLb
58.9142.2
16.32.493.242.0465.018.5
6,67027.152.710.444.246.733.739.5
1,416
17.9723
3,159949
1,29033.9
1,213
730723
1,17022.834.1
1,952
1,1151,6701,5841,030
1,41037,500
1,90388
367282288320376113172
69.4160.417.62.553.472.0564.725.3
6,94226.969.813.543.243.538.043.2
1,618
20.3819
3,0571,3941,10542.5
1,197
846835
1,42522.930.8
2,159
1,2281,4602,2491,271
1,22040,000
1,99092
391260314345401116176
278,28310,089,222
107,378157,585
76,27381,312
144,38311,450
199,8978,634
411,2373,552
2,344,7601,716,721
96,637531,402
1,512,2506,664.610,51677,372
4,144,1501,139
274,7552,453,6652,665,226
18,255.217,822.9
432.330,71033,858
802,654
17422,492
5,2022,442
673
8,3006,000
54,565.16,996
457,8144,027
24,43318,766
410,5881,778
15,8915,000
279,25311,807,217
107,336157,774
75,38382,391
115,93515,065
230,8188,615
454,8994,763
2,158,2451,499,434
89,893568,918
1,339,5308,411.010,47156,290
4,261,70010,875
175,7653,140,9962,047,863
23,006.022,270.0
736.029,93229,295
883,171
26417,79911,4194,182
899
7,1006,000
55,203.97,146
456,3624,818
22,66318,858
410,0231,746
16,3995,200
1 Data are the latest estimates available, either from the current report or from previous reports. Current year estimates are for the full2004 crop year.
2 Yield in pounds. 3 Yield is not estimated.
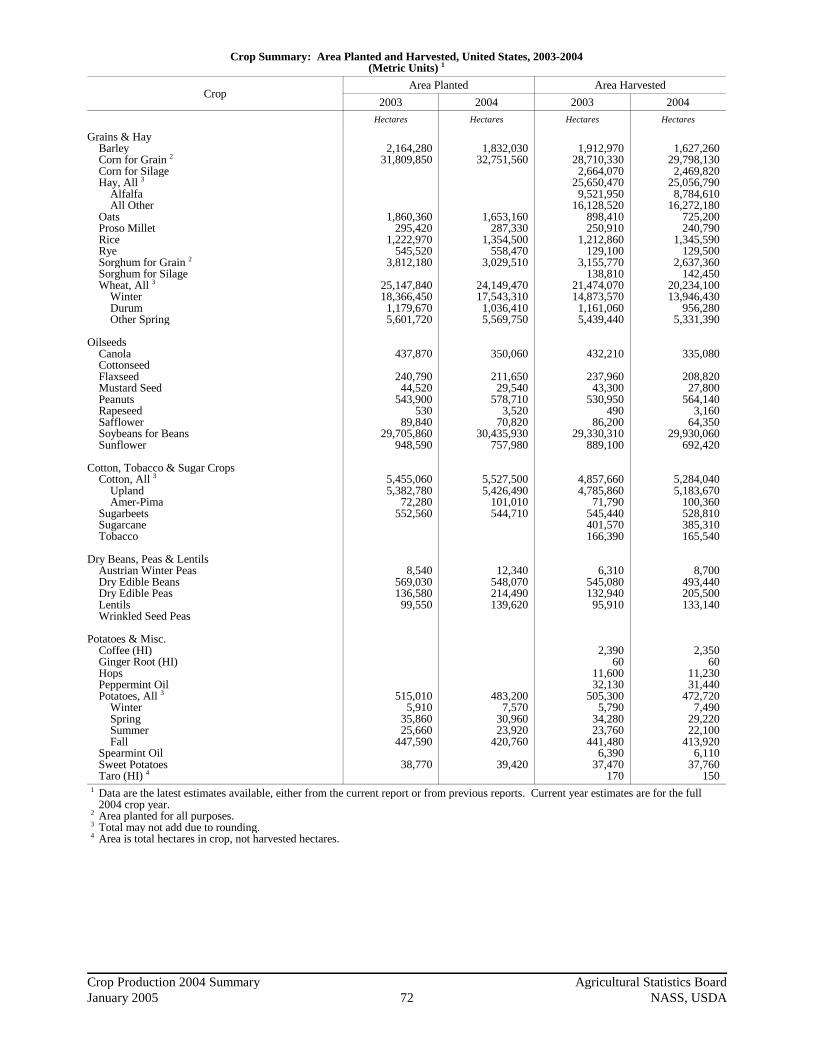
Crop Production 2004 Summary Agricultural Statistics BoardJanuary 2005 72 NASS, USDA
Crop Summary: Area Planted and Harvested, United States, 2003-2004(Metric Units) 1
CropArea Planted Area Harvested
2003 2004 2003 2004
Hectares Hectares Hectares Hectares
Grains & Hay Barley Corn for Grain 2
Corn for Silage Hay, All 3
Alfalfa All Other Oats Proso Millet Rice Rye Sorghum for Grain 2
Sorghum for Silage Wheat, All 3
Winter Durum Other Spring
Oilseeds Canola Cottonseed Flaxseed Mustard Seed Peanuts Rapeseed Safflower Soybeans for Beans Sunflower
Cotton, Tobacco & Sugar Crops Cotton, All 3
Upland Amer-Pima Sugarbeets Sugarcane Tobacco
Dry Beans, Peas & Lentils Austrian Winter Peas Dry Edible Beans Dry Edible Peas Lentils Wrinkled Seed Peas
Potatoes & Misc. Coffee (HI) Ginger Root (HI) Hops Peppermint Oil Potatoes, All 3
Winter Spring Summer Fall Spearmint Oil Sweet Potatoes Taro (HI) 4
2,164,28031,809,850
1,860,360295,420
1,222,970545,520
3,812,180
25,147,84018,366,450
1,179,6705,601,720
437,870
240,79044,520
543,900530
89,84029,705,860
948,590
5,455,0605,382,780
72,280552,560
8,540569,030136,580
99,550
515,0105,910
35,86025,660
447,590
38,770
1,832,03032,751,560
1,653,160287,330
1,354,500558,470
3,029,510
24,149,47017,543,310
1,036,4105,569,750
350,060
211,65029,540
578,7103,520
70,82030,435,930
757,980
5,527,5005,426,490
101,010544,710
12,340548,070214,490139,620
483,2007,570
30,96023,920
420,760
39,420
1,912,97028,710,330
2,664,07025,650,470
9,521,95016,128,520
898,410250,910
1,212,860129,100
3,155,770138,810
21,474,07014,873,570
1,161,0605,439,440
432,210
237,96043,300
530,950490
86,20029,330,310
889,100
4,857,6604,785,860
71,790545,440401,570166,390
6,310545,080132,94095,910
2,39060
11,60032,130
505,3005,790
34,28023,760
441,4806,390
37,470170
1,627,26029,798,130
2,469,82025,056,790
8,784,61016,272,180
725,200240,790
1,345,590129,500
2,637,360142,450
20,234,10013,946,430
956,2805,331,390
335,080
208,82027,800
564,1403,160
64,35029,930,060
692,420
5,284,0405,183,670
100,360528,810385,310165,540
8,700493,440205,500133,140
2,35060
11,23031,440
472,7207,490
29,22022,100
413,9206,110
37,760150
1 Data are the latest estimates available, either from the current report or from previous reports. Current year estimates are for the full2004 crop year.
2 Area planted for all purposes. 3 Total may not add due to rounding. 4 Area is total hectares in crop, not harvested hectares.

Crop Production 2004 Summary Agricultural Statistics BoardJanuary 2005 73 NASS, USDA
Crop Summary: Yield and Production, United States, 2003-2004(Metric Units) 1
CropYield Production
2003 2004 2003 2004
Metric Tons Metric Tons Metric Tons Metric Tons
Grains & Hay Barley Corn for Grain Corn for Silage Hay, All 2
Alfalfa All Other Oats Proso Millet Rice Rye Sorghum for Grain Sorghum for Silage Wheat, All 2
Winter Durum Other Spring
Oilseeds Canola Cottonseed 3
Flaxseed Mustard Seed Peanuts Rapeseed Safflower Soybeans for Beans Sunflower
Cotton, Tobacco & Sugar Crops Cotton, All 2
Upland Amer-Pima Sugarbeets Sugarcane Tobacco
Dry Beans, Peas & Lentils Austrian Winter Peas Dry Edible Beans Dry Edible Peas Lentils Wrinkled Seed Peas 3
Potatoes & Misc. Coffee (HI) Ginger Root (HI) Hops Peppermint Oil Potatoes, All 2
Winter Spring Summer Fall Spearmint Oil Sweet Potatoes Taro (HI) 3
3.178.93
36.565.577.274.572.331.037.481.703.31
23.212.973.142.272.66
1.59
1.120.813.541.061.452.281.36
0.820.811.31
51.0876.49
2.19
1.251.871.771.15
1.5842.03
2.130.10
41.1031.5632.3335.8342.19
0.1319.23
3.7410.0639.43
7.784.592.321.427.781.694.38
30.332.902.932.562.90
1.81
1.270.923.431.561.242.861.34
0.950.941.60
51.3568.97
2.42
1.381.642.521.42
1.3744.83
2.230.10
43.7929.1935.1838.7144.93
0.1319.70
6,058,900256,278,04097,411,680
142,958,71069,193,70073,765,010
2,095,710259,680
9,067,180219,310
10,445,9003,222,320
63,813,91046,721,490
2,630,03014,462,390
685,9506,046,020
267,12035,100
1,879,750520
124,63066,777,820
1,208,930
3,974,6003,880,480
94,12027,859,64030,715,460
364,080
7,8901,020,220
235,960110,77030,530
3,7602,720
24,7503,170
20,766,100182,660
1,108,260851,210
18,623,960810
720,8002,270
6,080,020299,917,130
97,373,580143,130,170
68,386,31074,743,860
1,682,790341,670
10,469,730218,830
11,554,9704,320,920
58,737,80040,807,910
2,446,49015,483,410
607,6007,630,330
265,98025,530
1,933,0704,930
79,73085,483,900
928,900
5,008,9704,848,720
160,25027,153,85026,575,980
400,600
11,970807,350517,960189,690
40,780
3,2202,720
25,0403,240
20,700,230218,540
1,027,980855,380
18,598,330790
743,8502,360
1 Data are the latest estimates available, either from the current report or from previous reports. Current year estimates are for the full2004 crop year.
2 Production may not add due to rounding. 3 Yield is not estimated.
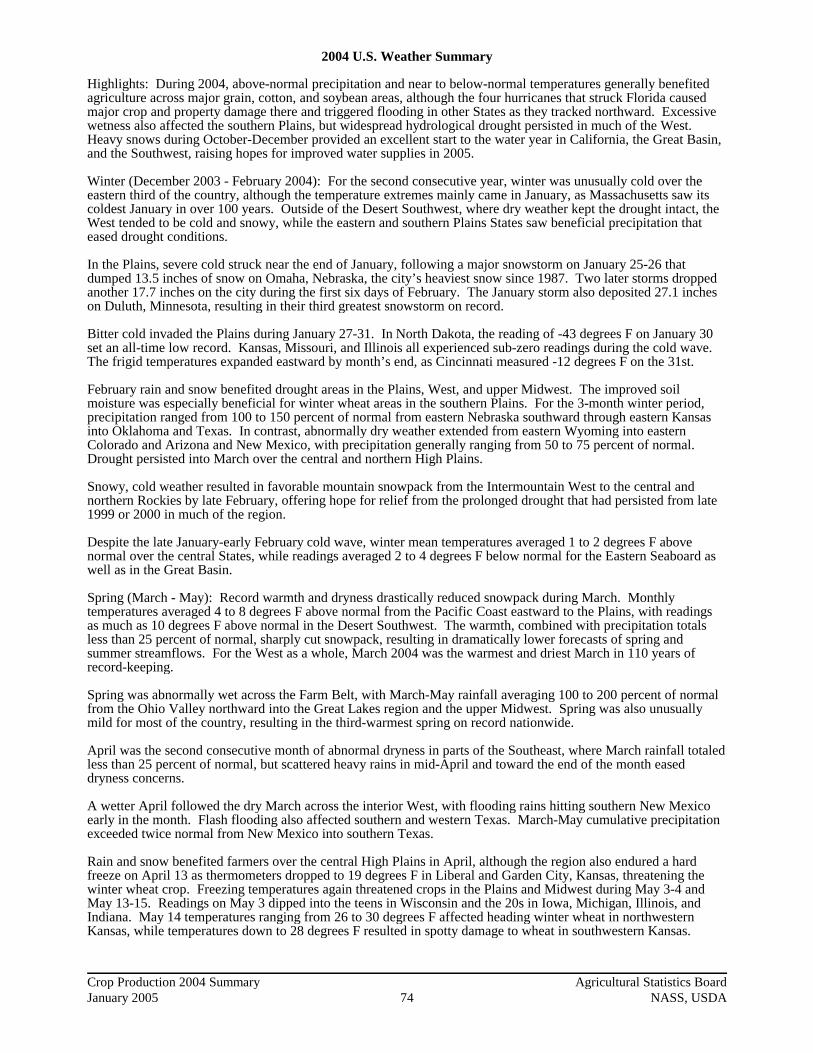
Crop Production 2004 Summary Agricultural Statistics BoardJanuary 2005 74 NASS, USDA
2004 U.S. Weather Summary
Highlights: During 2004, above-normal precipitation and near to below-normal temperatures generally benefitedagriculture across major grain, cotton, and soybean areas, although the four hurricanes that struck Florida causedmajor crop and property damage there and triggered flooding in other States as they tracked northward. Excessivewetness also affected the southern Plains, but widespread hydrological drought persisted in much of the West. Heavy snows during October-December provided an excellent start to the water year in California, the Great Basin,and the Southwest, raising hopes for improved water supplies in 2005.
Winter (December 2003 - February 2004): For the second consecutive year, winter was unusually cold over theeastern third of the country, although the temperature extremes mainly came in January, as Massachusetts saw itscoldest January in over 100 years. Outside of the Desert Southwest, where dry weather kept the drought intact, theWest tended to be cold and snowy, while the eastern and southern Plains States saw beneficial precipitation thateased drought conditions.
In the Plains, severe cold struck near the end of January, following a major snowstorm on January 25-26 thatdumped 13.5 inches of snow on Omaha, Nebraska, the city’s heaviest snow since 1987. Two later storms droppedanother 17.7 inches on the city during the first six days of February. The January storm also deposited 27.1 incheson Duluth, Minnesota, resulting in their third greatest snowstorm on record.
Bitter cold invaded the Plains during January 27-31. In North Dakota, the reading of -43 degrees F on January 30set an all-time low record. Kansas, Missouri, and Illinois all experienced sub-zero readings during the cold wave. The frigid temperatures expanded eastward by month’s end, as Cincinnati measured -12 degrees F on the 31st.
February rain and snow benefited drought areas in the Plains, West, and upper Midwest. The improved soilmoisture was especially beneficial for winter wheat areas in the southern Plains. For the 3-month winter period,precipitation ranged from 100 to 150 percent of normal from eastern Nebraska southward through eastern Kansasinto Oklahoma and Texas. In contrast, abnormally dry weather extended from eastern Wyoming into easternColorado and Arizona and New Mexico, with precipitation generally ranging from 50 to 75 percent of normal. Drought persisted into March over the central and northern High Plains.
Snowy, cold weather resulted in favorable mountain snowpack from the Intermountain West to the central andnorthern Rockies by late February, offering hope for relief from the prolonged drought that had persisted from late1999 or 2000 in much of the region.
Despite the late January-early February cold wave, winter mean temperatures averaged 1 to 2 degrees F abovenormal over the central States, while readings averaged 2 to 4 degrees F below normal for the Eastern Seaboard aswell as in the Great Basin.
Spring (March - May): Record warmth and dryness drastically reduced snowpack during March. Monthlytemperatures averaged 4 to 8 degrees F above normal from the Pacific Coast eastward to the Plains, with readingsas much as 10 degrees F above normal in the Desert Southwest. The warmth, combined with precipitation totalsless than 25 percent of normal, sharply cut snowpack, resulting in dramatically lower forecasts of spring andsummer streamflows. For the West as a whole, March 2004 was the warmest and driest March in 110 years ofrecord-keeping.
Spring was abnormally wet across the Farm Belt, with March-May rainfall averaging 100 to 200 percent of normalfrom the Ohio Valley northward into the Great Lakes region and the upper Midwest. Spring was also unusuallymild for most of the country, resulting in the third-warmest spring on record nationwide.
April was the second consecutive month of abnormal dryness in parts of the Southeast, where March rainfall totaledless than 25 percent of normal, but scattered heavy rains in mid-April and toward the end of the month easeddryness concerns.
A wetter April followed the dry March across the interior West, with flooding rains hitting southern New Mexicoearly in the month. Flash flooding also affected southern and western Texas. March-May cumulative precipitationexceeded twice normal from New Mexico into southern Texas.
Rain and snow benefited farmers over the central High Plains in April, although the region also endured a hardfreeze on April 13 as thermometers dropped to 19 degrees F in Liberal and Garden City, Kansas, threatening thewinter wheat crop. Freezing temperatures again threatened crops in the Plains and Midwest during May 3-4 andMay 13-15. Readings on May 3 dipped into the teens in Wisconsin and the 20s in Iowa, Michigan, Illinois, andIndiana. May 14 temperatures ranging from 26 to 30 degrees F affected heading winter wheat in northwesternKansas, while temperatures down to 28 degrees F resulted in spotty damage to wheat in southwestern Kansas.
Crop Production 2004 Summary Agricultural Statistics BoardJanuary 2005 75 NASS, USDA
A front extending across the northern States set up the conditions for excessive rainfall and numerous severeweather outbreaks in the Corn Belt during May. Midwestern downpours in mid- to-late May slowed or stoppedsoybean and final corn planting due to widespread lowland flooding. Cool weather hampered summer cropdevelopment in the upper Midwest, one of the few areas of the country that saw below-normal temperatures thisspring.
On May 29-30, a massive outbreak of severe thunderstorms led to about 1,200 reports of hail, tornadoes, anddamaging winds across the Midwest. The final month’s total of 526 tornadoes nationally was just 17 short of theall-time monthly record set in May 2003.
Dry weather allowed drought to persist in the central and northern High Plains, as spring precipitation averaged lessthan 75 percent of normal from southeastern Montana into western Kansas, with amounts less than one-half ofnormal in southeastern Montana, eastern Wyoming, and western Nebraska.
Summer (June - August): Abundant rains kept soil moisture high across the South, East, and much of the Midwest,while summer temperatures ranked among the lowest on record across the Plains, Midwest, and interior South. Toomuch rain in the East, partly due to Hurricanes Charley and Gaston and Tropical Storm Bonnie, caused crop diseaseand quality concerns.
Summer temperatures averaged 4 degrees F below normal across the western Corn Belt and upper Midwest, andaround 2 degrees F below normal elsewhere east of the Rockies. This resulted in the coolest summer across theMidwest and nationwide since 1992. Summer 2004 was also the Corn Belt’s wettest since 1998 and the wettestnationwide since 1993. In sharp contrast, a persistent ridge maintained warm and dry conditions over Alaska,which notched its warmest summer on record, as statewide temperatures averaged nearly 5 degrees F above normal. This was also one of Alaska’s driest summers, and the heat and dryness resulted in a record number of acres burnedby wildfires this year (around 6.5 million).
In the West, rainfall tended to be above normal in the northern Great Basin and northern Rockies but below normalin the Southwest and Colorado River Basin. Outside of the Northwest, which experienced its third warmestsummer, the West’s temperatures averaged near or slightly above normal.
Despite cool weather, crop development remained ahead of the normal pace across much of the Midwest, with theexception being the northwestern Corn Belt, where the persistent coolness resulted in pronounced crop developmentdelays. Abundant moisture and lack of sustained heat resulted in overall favorable growing conditions for the CornBelt, resulting in record corn and soybean production.
The tropical storm season got off to a slow start, with no named tropical storms developing by late July. Finally,Alex became the first named storm of the season on August 1, passing within about 10 miles of Cape Hatteras onAugust 3 as a category-2 hurricane. In the Gulf of Mexico, Bonnie moved into the Florida Panhandle as a minimaltropical storm on August 12.
The next 6 weeks made history as four hurricanes struck Florida, the first time since 1886 that any State hasexperienced four hurricanes in a single season. The storms destroyed 25,000 homes and damaged another40,000 and caused considerable crop losses. The storms also brought severe weather, tornadoes, and flooding tomany other States across the Southeast.
Hurricane Charley made landfall in southwestern Florida as a category-4 storm on August 13, causing massiveproperty damage in Punta Gorda and Port Charlotte. The storm continued northeastward, resulting in a swath ofdestruction across the State, including the Orlando area. Charley came ashore again in South Carolina onAugust 14 with 80-mph winds. Preliminary damage estimates of 14 billion dollars made this the second costliesttropical cyclone in U.S. history, behind Andrew in 1992.
Hurricane Gaston struck the coast of South Carolina on August 29 as a minimal hurricane. Gaston movednortheastward over North Carolina and across the Delmarva Peninsula on the 30th, triggering widespread floodingacross the Carolinas and Virginia as rainfall totals reached as high as 12 inches.
Autumn (September - November): The seemingly relentless hurricane season continued, as Hurricane Francesmade landfall on Florida’s east coast as a category-2 storm on September 5. The storm hit the coast near Sewall’sPoint, continued west-northwestward across the central peninsula to the northeastern Gulf of Mexico, made landfallagain near St. Marks, Florida as a tropical storm, and then moved northward through the eastern United States. Thedamage costs reached $9 billion, and the storm was blamed for six deaths.
Ivan tracked northward through the Gulf of Mexico and struck the Gulf Shores, Alabama area as a category-3hurricane on September 16, causing considerable damage to northwest Florida before moving northeastward andemerging off the Delmarva Peninsula on September 19. Ivan brought widespread severe weather to the East,

Crop Production 2004 Summary Agricultural Statistics BoardJanuary 2005 76 NASS, USDA
including tornadoes as far north as Maryland. Ivan’s remains eventually returned to the Gulf of Mexico andre-intensified to tropical storm strength before making a second landfall over Louisiana on the 24th. Ivan wasblamed for 26 direct U.S. deaths and $13 billion in damages, making this storm the third costliest in U.S. history.
Jeanne made landfall on Florida’s east coast as a category-3 hurricane on September 25 very close to where Francesstruck the coast just 20 days earlier. Jeanne proceeded northward as a tropical storm through the Florida peninsula,weakening to a tropical depression over Georgia. This was the third hurricane to affect the major citrus andvegetable areas on the Florida peninsula.
Matthew came ashore in Louisiana as a weak tropical storm on October 10, causing minimal damage.
All told, six hurricanes and three tropical storms struck the United States in 2004. The total damage estimates ofaround $40 billion made this the costliest tropical storm season on record.
In October, two major Pacific storms struck the West. The first storm buffeted the region with rain and snowduring October 19-22, and a second bout of storminess struck a few days later. The first storm delivered lowlandflooding and heavy mountain snows to California and points eastward. The Sierra Nevada picked up 2 to 3 feet ofsnow. In Nevada, the 9.78 inches measured on October 20 near Las Vegas set a new 24-hour State record. In Utah,several feet of snow blanketed the mountains.
Persistent southerly flow of moist air brought huge rainfall totals to the southern Plains and lower MississippiValley during November, causing major flooding in east Texas. Lufkin, Texas saw 16.23 inches in the first fourweeks of the month. The San Antonio River at Goliad, Texas crested 15.42 feet above flood stage onNovember 27. The late-month storm system causing the flooding in east Texas tracked northeastward to southernIllinois on the 24th, spreading heavy rain and severe weather across the South and snow over the Midwest. Morethan 75 tornadoes struck from Texas to the southern Atlantic States during November 22-24.
Texas recorded its second wettest summer since such records began in 1895 and its third wettest autumn. The wetautumn on the southern High Plains stressed livestock, threatened the quality of open-boll cotton, and hamperedsummer crop harvesting.
December: A cold snap brought freezing temperatures to California crop areas at the end of November and duringearly December. Bakersfield, California recorded freezes on 6 consecutive mornings fromNovember 29-December 4, setting or tying records each day. Large parts of the West measured temperaturesaveraging 10 to 18 degrees F below normal for the week ending December 4.
In the eastern half of the country, one of the coldest December air masses in recent years invaded the United Stateson December 19-21, bringing sub-zero wind chills to the Midwest and Northeast and freezing temperatures as farsouth as northern Florida. Daytime temperatures in the major cities across the Midwest barely climbed into theteens on December 19, and struggled to exceed 0 degrees F in upstate New York on the next day.
A major storm system brought heavy snow on December 22-23 from Texas to the Great Lakes, with up to 20 inchesor more of snow in Indiana and Ohio. Arctic air followed the storm, resulting in widespread sub-zero cold onChristmas morning across the Plains and the Midwest. Denver saw -9 degrees F on the 25th, and Clevelandmeasured a record -17 degrees F.
A low in the Gulf of Mexico brought snow to southern Texas as far south as the Rio Grande Valley on ChristmasEve. Up to a foot fell in Victoria, and the 1.5 inches measured in Brownsville was their first measurable snow since1895.
A series of Pacific storms began to hammer California and the interior West on Dec. 27-31, burying the SierraNevada with massive snowfalls and inundating the valleys with heavy rains. Downtown Los Angeles recorded8.15 inches of rain during the last 5 days of December, and 8 feet of snow buried the Tahoe ski areas. The stormscaused flooding in California and Arizona, but the increased mountain snowpack across the Southwest and GreatBasin eased drought concerns.
2004 Annual Crop Summary
April: Warm, dry conditions across the Corn Belt, combined with ample precipitation in March, provided nearlyideal planting conditions for summer crops. By month’s end, 63 percent of the Nation’s corn crop had beenplanted, 23 percentage points ahead of the 5-year average, while growers in the central Corn Belt were over30 points ahead of their normal pace. Planting of small grains also advanced well ahead of normal, with 68 percentof the spring wheat crop, 63 percent of the barley crop, and 77 percent of the oat crop planted by month’s end. Cotton planting progressed slightly ahead of normal with mostly dry conditions in the major producing areas,

Crop Production 2004 Summary Agricultural Statistics BoardJanuary 2005 77 NASS, USDA
though some growers delayed planting due to insufficient moisture in the Southeast. Rice, sorghum, and sugarbeetplanting progress also advanced ahead of the normal pace, while peanuts lagged slightly behind the 5-year average.
May: Planting of summer crops continued to advance rapidly through the first half of the month as warm, dryconditions prevailed in the Corn Belt and Southeast. By mid-month, 92 percent of the Nation’s corn acreage hadbeen planted, compared with 77 percent for the 5-year average. Planting was nearly complete in the western CornBelt and Southeast and was ahead of normal in all States. Plantings of soybeans and small grains were also wellahead of the normal pace, while cotton, rice, and sorghum plantings were slightly ahead of normal. Aftermid-month, however, heavy rainfall slowed planting progress in the Corn Belt. Nevertheless, planting progress formost crops finished the month ahead of the normal pace. Emergence of summer crops advanced rapidly in mostareas under mostly warm, though often wet, conditions. However, in the upper Midwest, temperatures averagedbelow normal for the month, slowing crop development. Emergence of corn and soybeans began to slip behindnormal in the northern Corn Belt. Meanwhile, a hard freeze in the northern and central Great Plains aroundmid-month only minimally damaged the winter wheat crop.
June: Heavy rainfall limited fieldwork and flooded some fields in the Corn Belt and Delta, but most of the summercrop acreage had already been planted. In the Corn Belt and Great Plains, below-normal temperatures prevailed,slowing crop development. Heading of spring wheat, barley, and oats began to fall behind the normal pace, despiteahead-of-normal planting and emergence. Corn silking and soybean blooming, however, remained slightly ahead ofnormal nationwide, while cotton, sorghum, and rice development lagged slightly behind normal. Winter wheatharvest progressed rapidly during the month, reaching 51 percent complete by June 27, ten points ahead of the5-year average.
July: Below-normal temperatures slowed crop development across the Great Plains, Corn Belt, Ohio Valley, Delta,and interior areas of the Southeast. Due to early planting and emergence, corn and soybean development in mostStates advanced ahead of normal, but in the northern Great Plains and northern Corn Belt, the lack of heat unitsseverely hampered growth. Winter wheat harvest slowed during the month and finished slightly behind normal,while harvest of other small grains started slowly. Meanwhile, the cotton crop developed at a normal pacenationwide, though Texas’ crop began to lag behind as a result of cool, wet conditions. Rice heading progressedwell, finishing the month slightly ahead of normal, while sorghum heading and coloring slipped slightly behind the5-year average.
August: Hurricane Charley was the first of 4 hurricanes to strike Florida this year, causing considerable damage tocitrus crops. For neighboring States in the Southeast and up the Atlantic Coast, however, the heavy rainfall fromCharley, as well as Hurricane Alex and Tropical Storm Bonnie, were generally beneficial to cotton and peanutcrops in the area. Elsewhere, below-normal temperatures continued to prevail across the Corn Belt and GreatPlains, further delaying crop development, particularly in the northernmost areas of the regions. On August 29,corn denting was 3 weeks behind the normal pace in North Dakota and 2 weeks behind in Minnesota. Small grainharvest fell well behind normal, with spring wheat trailing the normal harvest pace by 25 points, barley by14 points, and oats by 8 points. Opening of cotton bolls was also hindered by cool weather in the Delta, whereprogress trailed the normal pace by a week. Sorghum and rice development also trailed the normal nationwidepace.
September: Hurricanes Frances and Jeanne came ashore 3 weeks apart in nearly identical locations along Florida’sAtlantic Coast, dealing two more blows to the State’s already-hard-hit citrus crops. Between these two damagingstorms, another hurricane, Ivan, hit the Gulf Coast of Florida and Alabama. The 3 storms followed similar pathsthrough the Atlantic Coast States, weakening in strength but dumping heavy rainfall on vulnerable open-boll cottonfields in the Southeast. In the northern Corn Belt and northern Great Plains, where a cool summer had limiteddevelopment of summer crops, above-normal temperatures prevailed during the month. However, corn maturationin that area remained well behind normal at month’s end, with North Dakota and Minnesota lagging by 73 pointsand 56 points, respectively. Soybean harvest had begun in all States, but trailed behind the 5-year average pace inthe upper Midwest, again due to delayed development during the summer. Sorghum coloring and maturationslipped to a week behind normal, while harvest fell 2 weeks behind. Development and harvest of the cotton cropalso trailed the normal pace, mostly due to cool conditions in Texas. The rice harvest, however, advanced rapidlywith warm, dry weather in all growing areas. Meanwhile, planting and emergence of the 2005 winter wheat cropprogressed ahead of normal. Spring wheat, barley, and oat growers also struggled to complete their harvest aftercool summer weather severely delayed maturation.
October: Warm but rainy conditions prevailed across the Corn Belt, Ohio Valley, Delta, and Great Plains, furtherdelaying harvest of summer crops. Soybean harvest trailed the normal pace by 5 days nationwide, while cornharvest was over a week behind. North Dakota producers lagged 2 weeks behind on soybean harvest and 3 weeksbehind on corn. Harvest of cotton and sorghum continued to trail behind normal in the southern Great Plains, dueto persistent rainfall and earlier developmental delays. Winter wheat planting was hindered by rainfall, but endedthe month at the average pace, while emergence remained ahead of normal. The affects of the cool summer on thesunflower crop became apparent, with harvest only 25 percent complete at month’s end, compared to the 5-year

Crop Production 2004 Summary Agricultural Statistics BoardJanuary 2005 78 NASS, USDA
average of 76 percent. The sugarbeet harvest advanced rapidly during the month as cool weather permitted piling,but progress at month’s end trailed slightly behind normal. The peanut harvest was also slightly behind normal.
November: Except for the West Coast, Southwest, and southern High Plains, temperatures averaged above normalfor the month. In the Corn Belt, moderate rainfall caused only minor harvest delays. However, heavy rainfall in thesouthern Great Plains severely hampered harvest activities, particularly for sorghum and cotton. The corn harvestwas 95 percent complete nationwide by month’s end, but continued to lag well behind normal in the northern GreatPlains and adjacent areas of the Corn Belt, with North Dakota growers trailing their average pace by over 4 weeks. Meanwhile, soybean growers had harvested 95 percent of their acreage by November 21, slightly behind normal. Three-fourths of the cotton crop had been harvested by month’s end, 10 points behind normal, with producers in thesouthern Great Plains lagging 3 to 4 weeks behind. The sunflower harvest began the month at 25 percent complete,over 50 points behind normal, but progressed rapidly during the month to 92 percent complete. Winter wheatplanting was slightly behind normal, but emergence remained slightly ahead of normal.
December: Warm, dry conditions prevailed across the Corn Belt and Great Plains, encouraging final harvest ofsummer crops. However, some corn and soybean fields in the northernmost areas and some cotton fields in thesouthern Plains remained unharvested at year’s end. Temperatures averaged below normal in the Delta andSoutheast, with historic snowfall along the western Gulf Coast on Christmas morning. In the Ohio Valley andcentral Atlantic Coast States, heavy snow during the week prior to Christmas disrupted holiday travel. At month’send, snow accumulation in the northern Great Plains, northern Rocky Mountains, and Pacific Northwest was wellbelow normal, leaving winter wheat vulnerable to extremely cold weather.
Corn: U.S. grain production is estimated at 11.8 billion bushels, up less than 1 percent from the Novemberforecast and up 17 percent from 2003. The average U.S. grain yield is estimated at 160.4 bushels per acre,0.2 bushels above the November forecast and up 18.2 bushels from 2003. Both production and yield estimates arethe largest on record. The previous record for both was set last year when production was estimated at 10.1 billionbushels and yield was 142.2 bushels per acre. Across the U.S., record high yields were achieved in 24 of the41 States in the corn for grain estimating program. With the exception of Wisconsin, yields in the Corn Belt Statesreached record highs as weather conditions were mostly favorable throughout the growing season.
Planted area totaled 80.9 million acres, up 3 percent from last year. Corn planted area is either up or unchanged inall but 13 States. Area harvested for grain, at 73.6 million acres, is up 4 percent from 2003. Farmers harvested6.10 million acres for silage, a 7 percent decrease from last year. However, the number of acres abandoned thisyear increased to 1.20 million acres, up 11 percent from the 1.08 million acres abandoned in 2003. The biggestincrease in abandonment occurred in North Dakota. Cool, wet summer conditions combined with early freezes inAugust and September prevented the crop in many areas from fully developing and maturing to the point that wasneeded for producers to harvest.
Corn silage production is estimated at 107 million tons, down fractionally from the 2003 level. Silage areadecreased due to better growing conditions in many States causing more acres to be harvested for grain and feweracres cut for silage. The drop in acres was offset by an increase in yield with 17.6 tons per acre realized in 2004. This is 1.3 tons above last year’s yield of 16.3 tons per acre.
Planting conditions during the Spring were good as growers were able to progress ahead of a normal pace for thattime of year. Planting progress slowed after mid-May as heavy rains soaked Corn Belt fields but progress remainedahead of the normal pace. The rapid planting progress and warm conditions also spurred emergence during themonth of May. However, in the upper Midwest, temperatures averaged below normal during May which slowedcrop development.
Throughout most of July, temperatures were below normal with above-normal precipitation. In the Great Plains,moderate to heavy precipitation caused some flooding in the central and southern parts of the region, while theDakotas remained mostly dry. Due to early planting and emergence, development in most States advanced ahead ofnormal, but in the northern Great Plains and northern Corn Belt, the lack of heat units hampered growth.
During August, below-normal temperatures prevailed, particularly in the northernmost areas where cropdevelopment progressed behind the normal pace. Along the Atlantic Coast, temperatures also averaged belownormal, while Tropical Storm Bonnie and Hurricanes Alex and Charley brought abundant rainfall to most coastalareas. Moderate precipitation and below-normal temperatures prevailed across the Delta while much neededrainfall was received in the Rocky Mountains.
In the northern Corn Belt and northern Great Plains, where a cool summer hampered crop development, progressfailed to gain ground despite above-normal temperatures being prevalent during September. Maturation in that areaalso remained well behind normal at month’s end. Harvest completion by the end of September was behind thenormal pace nationwide, particularly in the northern Corn Belt and northern Great Plains. Wet field conditions inthe central and southern Great Plains also hampered fieldwork.

Crop Production 2004 Summary Agricultural Statistics BoardJanuary 2005 79 NASS, USDA
In addition to developmental delays from the unusually cool summer, persistent rainfall during October hamperedfieldwork, particularly in the Corn Belt and northern Great Plains. By month’s end, harvest was lagging evenfurther behind the normal pace. At the end of November, nearly all of the corn had been harvested, but progresscontinued to lag well behind normal in the northern Great Plains and adjacent areas of the Corn Belt.
The 2004 corn objective yield data showed a record high ear count per acre for the combined 10 Objective YieldStates (Illinois, Indiana, Iowa, Kansas, Minnesota, Missouri, Nebraska, Ohio, South Dakota, and Wisconsin). The2004 ear count is 3 percent above the previous record high set in 2003.
Sorghum: Grain production in 2004 is estimated at 455 million bushels, down 4 percent from the Novemberforecast but 11 percent above 2003. Area harvested for grain is estimated at 6.52 million acres, down 16 percentfrom 2003. Average grain yield, at 69.8 bushels per acre, is down 2.1 bushels from the previous forecast but17.1 bushels above the 2003 average yield. Grain yields are down from the previous forecast due to wet conditionsduring November that slowed maturity and delayed harvest in much of the Great Plains.
Silage production is estimated at 4.76 million tons, up 34 percent from 2003. Area cut for silage is 352,000 acres,3 percent higher than the previous year. Silage yields averaged 13.5 tons per acre, up 3.1 tons per acre from lastyear.
Kansas led the Nation in area planted for all purposes and grain production, while Texas led the Nation for silageproduction. Seventeen of the 24 estimating States had grain yields greater than or equal to last year. Largeincreases in acreage harvested for silage occurred in California and New Mexico, as some producers replaced cornwith sorghum which requires less water. The largest increases in silage yields were in Kansas and Texas, up 6 tonsper acre from last year.
By the end of October, harvest was complete in Arkansas and Louisiana, but was behind normal in all of theremaining States. In Kansas, as a result of rainfall and wet field conditions during the middle of October, only52 percent of the crop was harvested, well behind the 5-year average of 80 percent. By the end of November, thecrop was only 85 percent harvested, compared to 96 percent for the 5-year average. Harvest in Texas also laggedbehind normal as cooler temperatures and above normal precipitation in October hindered progress. At the end ofNovember, the crop was 82 percent harvested, well behind the 5-year average of 93 percent.
Oats: The 2004 production of oats is estimated at 116 million bushels, down 20 percent from last year and downless than 1 percent from the Small Grains 2004 Summary. The estimated yield is 64.7 bushels per acre, down0.3 bushel from a year ago. Record high yields are estimated in South Dakota and Washington. Harvested area is1.79 million acres, 19 percent below last year. This is the smallest acreage harvested for grain on record,continuing a steady downward trend. Compared with last year, area harvested for grain declined 75,000 acres inMinnesota, 140,000 acres in North Dakota, and 60,000 acres in South Dakota. All updates to the SmallGrains 2004 Summary were previously published in the November 2004 Crop Production report.
During April, much of the Corn Belt and Great Plains regions experienced favorable weather conditions andadequate soil moisture, allowing planting to progress ahead of normal. In the Ohio and upper Mississippi Valleys,planting continued at a rapid pace through month’s end. By April 25, the major oat-producing States had61 percent of the acreage planted compared with 40 percent for the 5-year average.
The northern Great Plains received frequent showers around mid-May which provided much-needed moisture forthe emerging crop. However, below normal temperatures slowed crop development slightly. In the Corn Belt,beneficial rains allowed for adequate growth and development. By the end of May, 92 percent had emergedcompared with 87 percent for the 5-year average. During June, cooler weather in the northern Great Plains began toslow crop development, while in the Corn Belt lower temperatures did not have much of an adverse effect on thecrop.
During July, fields entered the heading stage and matured at a near normal pace in all States except Minnesota,where cool weather caused progress to lag. By August 1, harvest had begun in all States, but was behind normaldue to continued cool weather and areas of thunderstorms. By the end of the month favorably drier conditionsallowed harvest to advance to near normal levels, except in Minnesota and North Dakota. On September 5, harvestwas 90 percent complete in Minnesota and 79 percent complete in North Dakota, compared with 97 percent and87 percent for their respective 5-year averages. Elsewhere, harvest was virtually complete.
In Minnesota, harvest was virtually complete by the middle of September, and in North Dakota harvest continuedthrough the first week of October. Both States concluded harvest about two weeks later than normal.
Barley: Production is estimated at 279 million bushels, unchanged from the November 1 Crop Production reportbut up slightly from last year’s estimate. Average yield per acre, at 69.4 bushels, is the same as in November but10.5 bushels above 2003. The area harvested for grain is estimated at 4.02 million acres, 15 percent below a year

Crop Production 2004 Summary Agricultural Statistics BoardJanuary 2005 80 NASS, USDA
ago. Nationally, harvested area is the smallest since 1894 but yield is a new record high, 6.9 bushels above theprevious record of 62.5 bushels set in 1992. Record State yields were set in Colorado, Idaho, Montana, Nebraska,and South Dakota.
This year’s barley crop got an early start in the five major-producing States, with planting and emergence advancingwell ahead of the 5-year average. However, as below-normal temperatures prevailed across the northern GreatPlains and northern Corn Belt throughout the summer, development lagged behind the normal pace. On August 29,harvest was 61 percent complete, 29 points behind last year and 14 points behind normal. With maturity delayed bythe cool summer conditions, Minnesota growers had harvested just 50 percent of their acreage, 37 points behindnormal, while North Dakota producers, with 57 percent of their acreage harvested, trailed the normal pace by21 points. Harvest progressed rapidly in September, reaching 96 percent complete by September 26, but remained2 points behind the 5-year average.
All Wheat: Production of all wheat totaled 2.16 billion bushels in 2004, fractionally below the Small Grains 2004Summary and 8 percent below 2003. Grain area is 50.0 million acres, down 6 percent from last year. The U.S.yield is 43.2 bushels per acre, down 1.0 bushel from a year ago. All updates to the Small Grains 2004 Summarywere previously published in the November 2004 Crop Production report.
Winter Wheat: The 2004 winter wheat production is estimated at 1.50 billion bushels. This is unchanged fromthe Small Grains 2004 Summary but 13 percent below last year’s crop. The U.S. yield is 43.5 bushels per acre,3.2 bushels below last year’s final yield. Acreage for grain is estimated at 34.5 million acres, 6 percent below 2003. Planted area is 43.4 million acres, down 4 percent from the previous year.
Hard Red Winter (HRW) harvested acreage was down significantly from last year in the central Great Plains andMontana due to fewer planted acres and higher than normal abandonment. Dry spring conditions led to loweryields in all Plains States, except Texas, South Dakota, and Montana. Timely rains in South Dakota and Montanaresulted in better yields than in 2003. Yields in Texas rebounded from below average levels last year. Overall,HRW production totals 856 million bushels, down 20 percent from last year.
Soft Red Winter (SRW) producing States’ yields improved significantly from poor yields last year in the South andalong the Atlantic coast. Yields declined from very good levels last year in most other States. Overall, SRWproduction is down fractionally from 2003 and totals 380 million bushels.
White Winter production, at 263 million bushels, is down 1 percent from last year. Improved yields more thanoffset lower acreage in the Pacific Northwest (Idaho, Oregon, and Washington). Excellent irrigated and non-irrigated yields in Idaho resulted in a State level yield equal to the record high set in 2000.
Other Spring Wheat: Production in 2004 is estimated at 569 million bushels, down 1 percent from the SmallGrains 2004 Summary but up 7 percent from 2003. Harvested area is 13.2 million acres, 2 percent lower than lastyear. The U.S. yield is a record high 43.2 bushels per acre, 3.7 bushels better than last year and 1.4 bushels higherthan the previous record set in 1992. All updates to the Small Grains 2004 Summary were previously published inthe November 2004 Crop Production report.
Dry spring conditions resulted in timely seeding of the crop. Early planting combined with timely rains resulted inrapid emergence. Crop development slowed throughout the summer due to cool temperatures and frequentprecipitation, especially in Minnesota, North Dakota, and Montana. Cool, damp weather continued into August andSeptember, delaying harvest progress. As of September 26, only 88 percent of the crop was harvested, 10 pointsbehind the 5-year average.
Yields were better than last year in all States except Minnesota and Wisconsin, with large increases in most States. Objective yield survey data showed very high plant populations and weight per head in Minnesota, North Dakota,and Montana. Timely rains in eastern Idaho resulted in very good dryland yields.
Durum Wheat: Production for 2004 totaled 89.9 million bushels, down 1 percent from the Small Grains 2004Summary and 7 percent less than last year. Grain area harvested totaled 2.36 million acres, 18 percent below a yearago. The U.S. yield is estimated at 38.0 bushels per acre, 4.3 bushels above 2003. North Dakota’s Durum harvestwas only 42 percent complete as of September 12, more than 2 weeks behind the 5-year average and 3 weeksbehind last year. Wet weather continued to slow harvest progress throughout September and October. As ofNovember 7, ninety-six percent of the crop was harvested, 4 weeks behind normal. All updates to the SmallGrains 2004 Summary were previously published in the November 2004 Crop Production report.
Rice: Production of rice in 2004 totaled a record high 231 million cwt, up 15 percent from 2003 and up 1 percentfrom the November forecast. Area for harvest, at 3.33 million acres, is up 11 percent from 2003. The average yieldfor all U.S. rice is estimated at 6,942 pounds per acre, 272 pounds above the 2003 yield. This all rice yield is the

Crop Production 2004 Summary Agricultural Statistics BoardJanuary 2005 81 NASS, USDA
highest on record and the fifth consecutive year a new record high yield has been established. The adoption ofhigher yielding rice varieties by producers continues to drive the increase in yields.
Arkansas, California, Mississippi, and Missouri established new record high yields. Delta State producersexperienced an excellent year for rice production with the exception of Louisiana, which experienced a cloudy, coolearly growing season. California also experienced a near ideal growing season.
Long grain rice yielded 6,569 pounds per acre across the Nation with U.S. production at 169 million cwt. Mediumgrain rice yielded 8,325 pounds per acre in 2004 with production at 58.7 million cwt. Short grain rice averaged6,588 pounds per acre and production totaled 3.23 million cwt.
Rye: Production for 2004 is estimated at 8.62 million bushels, unchanged from the Small Grains 2004 Summarybut down fractionally from last year. Harvested area totaled 320,000 acres, up 1,000 from 2003. The U.S. yield, at26.9 bushels per acre, is down 0.2 bushel from last year. Oklahoma leads the Nation in production and recordedtheir largest crop on record. South Dakota set a new record high yield, breaking last year’s record by 11 bushels peracre.
Proso Millet: Total 2004 proso millet production is estimated at 15.1 million bushels, up 32 percent from the 2003production of 11.5 million bushels. Yields are also higher in 2004 with the average yield estimated at 25.3 bushelsper acre, up 6.8 bushels per acre from last year. Planted area for the 2004 crop is 710,000 acres, 3 percent belowlast year and harvested area totaled 595,000 acres, down 4 percent from 2003. Increased acreage in Colorado wasmore than offset by decreases in Nebraska and South Dakota.
Conditions for growing proso millet were generally favorable in 2004. Producers in Colorado increased theirplanted acreage from last year as they were encouraged by precipitation at the beginning of June. Also, growersthere benefitted from an extended growing season as plantings as late as July were realized in fields where winterwheat failed. However, growers in Nebraska and South Dakota decreased their acreage from 2003 as droughtconditions prevailed during the planting season in most areas where proso millet is grown. Rainfall during thegrowing season in all three States was better than the last two years which allowed yields to return to more normallevels.
All Hay: Production of dry hay for 2004 is estimated at 158 million tons, down 5 percent from the October 1forecast but up fractionally from the 2003 total. Area harvested, at 61.9 million acres, is up less than 1 percent fromthe October forecast but down 2 percent from 2003. The average yield, at 2.55 tons per acre, is down 0.14 ton fromOctober but up 0.06 ton from the previous year.
Alfalfa and Alfalfa Mixtures: Hay production in 2004 totaled 75.4 million tons, down 3 percent from the October1 forecast and down 1 percent from 2003. Harvested area, at 21.7 million acres, is 2 percent below October and8 percent below the previous year. Yields averaged 3.47 tons per acre, down 0.01 ton from the October forecast butup 0.23 ton from the 2003 yield.
Area harvested in 2004 is the lowest since 1952. With the exception of the Southwest and the southern GreatPlains, most other States had lower acreage harvested than in 2003. South Dakota harvested 450,000 fewer acresand North Dakota harvested 300,000 acres less than last year as relatively high levels of hay stocks from theprevious crop year limited the area harvested for dry hay. Yields increased from last year across most of the GreatPlains and Corn Belt as weather conditions throughout the growing season were favorable. Sufficient moisture inthe spring favored early season development, while frequent precipitation during the summer months aided growth.
All Other Hay: Production in 2004 totaled 82.4 million tons, down 7 percent from the October 1 forecast but up1 percent from the 2003 total. Area for harvest, at 40.2 million acres, is up 2 percent from the October forecast and1 percent above last year. The average yield is estimated at a record high 2.05 tons per acre, up 0.01 ton from lastyear.
Harvested acreage increased in most of the Great Plains States and adjacent areas of the central Corn Belt. InMontana and North Dakota, higher than normal small grain acres were cut for hay. Record yields were establishedin Arkansas, Louisiana, Missouri, Pennsylvania, Tennessee, and Washington. Yields in much of the central CornBelt increased from last year as mild summer temperatures and adequate rainfall throughout the growing seasonprovided for ideal growing conditions. Yields are also higher than last year in the Intermountain West and PacificNorthwest region, as growers in Washington are harvesting an increasing area of higher yielding Timothy hay forexport.
Forage: Eight States participate in the forage estimation program, which measures annual production of foragecrops, with an emphasis on total alfalfa production. Acres, yield, and production are reported for haylage andgreenchop together, and for total forage production. Haylage and greenchop production is converted to 13 percent

Crop Production 2004 Summary Agricultural Statistics BoardJanuary 2005 82 NASS, USDA
moisture and combined with dry hay production to derive the total forage production. Wisconsin, the leading State,harvested 1.60 million acres of all haylage and greenchop in 2004, of which 1.45 million was alfalfa and alfalfamixtures. All haylage and greenchop acreage in Wisconsin is down 6 percent from last year.
New Seedings of Alfalfa and Alfalfa Mixtures: Growers seeded 2.79 million acres of alfalfa and alfalfa mixturesduring 2004. This is down 10 percent from the 2003 seeded acreage of 3.12 million acres. The new seedings ofalfalfa and alfalfa mixtures will normally be harvested for the first time in the year following planting.
Peanuts: Production of peanuts in 2004 totaled 4.26 billion pounds, up 3 percent from last year’s crop and up1 percent from the November 1 forecast. Planted area for the U.S., at 1.43 million acres, is up 6 percent from 2003. Harvested area totaled 1.39 million acres, up 6 percent from 2003. The U.S. yield per harvested acre averaged3,057 pounds, down 102 pounds from 2003. Record high yields were set in New Mexico, North Carolina,Oklahoma, South Carolina, and Virginia.
Production in the Southeast States (Alabama, Florida, Georgia, and South Carolina) totaled 2.86 billion pounds, up3 percent from 2003. Area planted in the region totaled 1.00 million acres, up 14 percent from 2003. Harvestedacres, at 972,000, were up 13 percent from 2003. The average yield for the Southeast area is 2,946 pounds per acre,292 pounds below last year.
Production from the Virginia-North Carolina area totaled 461 million pounds, up 11 percent from 2003. Plantedacres, at 138,000, are up 2 percent from 2003. Harvested acres, at 137,000, are up 3 percent from 2003. Theaverage yield per harvested acre in the Virginia-North Carolina region, at 3,365 pounds, is up 239 poundsfrom 2003.
The Southwest peanut crop (New Mexico, Oklahoma, and Texas) totaled 937 million pounds, down 2 percentfrom 2003. Planted acres, at 292,000, are down 12 percent from 2003. Harvested acres, at 285,000, are down11 percent from 2003. Yields in the tri-State area averaged 3,289 pounds per acre, 326 pounds above 2003.
Canola: Production in 2004 is 1.34 billion pounds, down 11 percent from 2003. The canola yield, at 1,618 poundsper acre, is up 203 pounds from last year and is the highest yield on record, surpassing the previous record set in1998 by 170 pounds. Area planted to canola is estimated at 865,000 acres, 20 percent below last year’s acreage. Harvested area, at 828,000 acres, is down 22 percent from 2003. As the leading State, North Dakota production isestimated at 1.22 billion pounds, down 10 percent from last year. Despite record high yields in North Dakota, theproduction decrease is a result of substantially lower planted and harvested acreage from last year.
Sunflower: The 2004 sunflower production totaled 2.05 billion pounds, 23 percent below the 2003 production anddown 16 percent from 2002. The U.S. average yield per acre, at 1,197 pounds, decreased 16 pounds from 2003. Planted area, at 1.87 million acres, is 20 percent below last year. Acreage harvested decreased 22 percent from lastyear to 1.71 million acres.
Production in North Dakota, the leading State, is estimated at 792 million pounds, down 48 percent from 2003. Theyield per acre, at 1,002 pounds, is down 302 pounds from last year. Planted and harvested acres decreased from2003 by 27 and 32 percent, respectively.
U.S. production of oil type sunflower varieties, at 1.76 billion pounds, decreased 22 percent from 2003. Harvestedacres are down 24 percent from the previous year but the yield increased by 31 pounds.
Production of non-oil sunflower varieties, at 286 million pounds, decreased 29 percent from last year. Acreageharvested of non-oil varieties is down 11 percent from 2003 and the average yield declined 259 pounds from lastyear to 997 pounds per acre.
Soybeans: Production in 2004 totaled 3.14 billion bushels, the largest U.S. soybean crop in history. This is downslightly from the November forecast but 28 percent above the 2003 level. The average yield per acre is estimated ata record high 42.5 bushels, 0.1 bushel below the November forecast, but 8.6 bushels above the 2003 final yield. Planted area for the Nation, at 75.2 million acres, is up 2 percent from 2003. Soybean growers harvested a total of74.0 million acres, up 2 percent from last year.
Yields are up dramatically from last year across most of the U.S., due to adequate moisture and mild temperaturesduring the growing season, especially at critical stages of soybean development. From New Jersey westwardthrough the Corn Belt to Kansas, and south along the Atlantic Coast, a total of fourteen States established newrecord high yields. In the Delta and Southeast, yields are either at record highs or only two bushels or less belowlast year’s record breaking yields. However, yields in Minnesota, Wisconsin, and the Dakotas are far from record-breaking, though only North Dakota yields actually declined from 2003.

Crop Production 2004 Summary Agricultural Statistics BoardJanuary 2005 83 NASS, USDA
Planting of the 2004 soybean crop started off ahead of normal across the U.S. and made excellent progress untilmid-May. Wet weather slowed planting progress and cool temperatures slowed crop development from the Deltanorthward through the Great Plains and Mississippi Valley. Some Minnesota and Wisconsin producers struggledwith saturated ground well into June, but most farmers in other areas finished planting ahead of normal as soilsdried out and summer began.
Below-normal temperatures dominated the U.S. most of the summer, slowing plant development at times. Adequate precipitation and short warm spells provided generally favorable conditions and proved beneficial duringthe critical reproductive stages of development. In the northern Corn Belt and adjacent areas of the Great Plains,where planting was late, the crop struggled to mature in the cool, damp weather throughout the growing season. The only major drought concerns on the soybean crop were in Georgia prior to the onset of an active hurricaneseason.
A cold snap during mid-August brought an early widespread frost across North Dakota, areas of Minnesota and asfar south as northern Iowa. This had a negative impact on the soybean crop, especially those late planted, immaturefields that were just setting or beginning to fill pods.
September brought above-normal temperatures and continued favorable soil moisture conditions across most of thegrowing region, including the Corn Belt, making for excellent conditions during the pod-fill stage. As theSoutheast and Atlantic Coast States were enduring one tropical storm or hurricane after another, the soybean cropflourished.
A season-ending freeze the first week of October in the northern Great Plains, Corn Belt, and Ohio Valley endedplant growth and promoted maturation. Though about normal, the freezing temperatures came too soon for the late-maturing soybeans in North Dakota, Minnesota, and Wisconsin. As of October 3, leaf drop in these States was still13, 14, and 22 percent behind their respective 5-year averages. During the first half of October, harvest progressedat or ahead of normal across most of the Nation, except in the northern growing areas. Rains lingered during therest of October from the eastern Great Plains across most of the Corn Belt, through the Tennessee Valley, and downthe Atlantic Coast, slowing harvest. By October 31, thirteen of the eighteen major soybean producing States werebehind their normal harvest pace, with some producers having to go into late November to finish harvest.
Final pod counts from the Objective Yield survey were considerably higher than last year in Illinois, Indiana, Iowa,Missouri, Nebraska, and Ohio while counts in Minnesota were just below last year’s level.
Flaxseed: Production of flaxseed in 2004 totaled 10.5 million bushels, down fractionally from the previous year. The average U.S. yield is estimated at 20.3 bushels per acre, up 2.4 bushels from 2003. Planted area for the 2004crop is estimated at 523,000 acres, down 12 percent from 2003. Harvested area, at 516,000 acres, is also 12 percentbelow 2003.
In North Dakota, the leading flaxseed State, production totaled 9.94 million bushels, down slightly from 2003. Growers planted 490,000 acres, a decrease of 12 percent from the previous year. The average yield in NorthDakota is estimated at 20.5 bushels per acre, up 2.5 bushels from last year. Planting began in late April, ahead ofthe average pace, as dry, warm conditions allowed growers to make good progress. However, heavy springtimerains in the northern areas of the State delayed planting progress. By May 30, seventy-four percent of the crop wasplanted, compared to the 5-year average of 83 percent. Wet, cool conditions during the growing season delayeddevelopment and the crop matured behind normal. Harvest began the middle of August and was completed wellbehind both last year and the average.
Other Oilseeds: Safflower production, at 176 million pounds, decreased 36 percent from 2003. Safflower growersplanted an estimated 175,000 acres, a decrease of 21 percent from 2003, while harvested area is estimated at159,000 acres, down 25 percent from the previous year. The yield for safflower, at 1,105 pounds per acre,decreased 185 pounds from 2003.
Mustard seed production declined 27 percent from last year to 56.3 million pounds. Planted area of mustard seed,at 73,000 acres, is down 34 percent and harvested area, at 68,700 acres, is down 36 percent from 2003. Mustardseed yields averaged 819 pounds per acre, 96 pounds above a year ago.
Rapeseed production, on the other hand, increased sharply to 10.9 million pounds, up from only 1.14 millionpounds in 2003. Growers planted an estimated 8,700 acres of rapeseed in 2004 and harvested 7,800 acres, up7,400 and 6,600 acres, respectively. Rapeseed averaged 1,394 pounds per acre in 2003, up 445 pounds from 2003.
Cotton: Upland cotton production is estimated at a record high 22.3 million bales, up slightly from theDecember 1 forecast and 25 percent more than last year’s production. The U.S. yield for upland cotton is also arecord high, at 835 pounds per acre, up 17 pounds from the December forecast and 112 pounds more than 2003. Harvested area, at 12.8 million acres, decreased 1 percent from last month but is 8 percent above last year. Upland
Crop Production 2004 Summary Agricultural Statistics BoardJanuary 2005 84 NASS, USDA
planted area is estimated at 13.4 million acres, down 1 percent from the September estimate but less than 1 percentabove last season. Data from the combined 7 Objective Yield States show higher boll counts and weights than anyof the previous six seasons.
Alabama and Georgia experienced drought conditions early in the growing season. However, by mid-June, all ofthe Southeastern States were ahead of their normal planting pace. Consequently, crop development was ahead ofnormal pace through July. During the months of August and September, six Hurricanes (Alex, Charley, Frances,Gaston, Ivan, and Jeanne) crossed over different regions of the Southeast. No major damage was reported in thenortheastern areas, while the other regions encountered plants that were blown over and twisted and cotton that wasknocked out of the bolls. The damage to the crop was not as severe as previously forecasted, which resulted inAlabama and Georgia increasing harvested acres 5,000 and 20,000 from the September forecast, respectively. LateSeptember and early October temperatures were above normal allowing the crop to mature and growers to makesignificant harvest progress. Objective yield data for Georgia show the highest average boll counts in the 7-yeardata series and above average boll weights. North Carolina boll counts remain above average, while showing ahigher average boll weights than the previous 6 years.
Producers in the majority of the Delta States planted their crop on time despite scattered showers disruptingfieldwork activities. Louisiana overcame persistent rainfall during the peak planting season. Below normaltemperatures delayed development during the growing season. Harvest was behind normal pace due to a lategrowing season compounded by showers saturating fields. Objective yield boll counts and average boll weights inMississippi are above average. Louisiana’s boll counts and weight per boll are slightly above average. Boll countsin Arkansas are slightly above the 15-year average but boll weights are higher than any of the previous 15 years.
Texas growers began the planting season at an above average pace. Rains during the end of June benefitted drylandcotton in the Panhandle and the moisture allowed producers to proceed with planting. Late-planted acres receivedbeneficial rainfall during the month of August. Showers and below normal temperatures switched from beingbeneficial early in the growing season to delaying progress and maturation later in the season. Growers wereconcerned that the delayed cotton crop would be unable to finish boll setting, while muddy conditions hinderedequipment from entering fields. During the month of December, fields dried allowing growers to make significantprogress harvesting their crop. Objective yield measurements show the Texas boll counts and average boll weightsas the highest in the 15-year data series.
Some Arizona and California upland cotton growers began planting during early-spring, due to above normaltemperatures. Despite the favorable weather, some growers delayed planting and waited for more traditionalplanting dates due to erratic spring weather in the prior years. This resulted in variable cotton growth anddevelopment. The continued warm weather conditions in June and July promoted crop development ahead of the5-year average. In the San Joaquin Valley, harvest started the last week of September. However, rain arrived inmid-October and delayed harvest for many growers. By the end of December, harvest was virtually completeexcept in Arizona where it was delayed by frequent scattered showers. Data from objective yield measurementsshow California boll counts are the second highest in the last 15 years, surpassed only by 2002. Boll weights arebelow the 15-year average, but the highest since 1998.
American-Pima production is estimated at 736,000 bales, up 16,000 bales from the December forecast and up70 percent from last year's output. The U.S. Pima yield is estimated at 1,425 pounds per harvested acre, up59 pounds from last month and 255 pounds more than last year’s yield. Producers planted 249,600 acres of Pimacotton in 2004, up 40 percent from 2003. The increase in planted acreage led to a similar increase in harvestedacreage.
All cotton ginnings totaled 18,993,000 running bales prior to January 1, compared with 16,882,550 running balesginned to the same date last year and 15,654,000 running bales in 2002.
Cottonseed: Production for 2004, based on a 3-year average lint-seed ratio, is expected to total 8.41 million tons,up 26 percent from last year’s production of 6.66 million tons.
Tobacco: U.S. tobacco production in 2004 totaled 883 million pounds, virtually unchanged from the October 1forecast but 10 percent above 2003. Growers harvested 409,060 acres in 2004, down less than 1 percent from theprevious forecast and 1 percent below last year. Yield per acre averaged 2,159 pounds, a 3 pound increase from theOctober forecast and up 207 pounds from 2003.
Flue-cured production is estimated at 516 million pounds, an increase of 1 percent from the October 1 forecast and13 percent above last year. Harvested acres totaled 228,400, down less than 1 percent from the previous forecastand 2 percent below 2003. Flue-cured yields averaged 2,261 pounds, an increase of 24 pounds from the Octoberforecast and 304 pounds above 2003. While hurricanes and heavy rains hit many of the flue-cured States during theharvest season, disease and damage were limited.
Crop Production 2004 Summary Agricultural Statistics BoardJanuary 2005 85 NASS, USDA
Burley production totaled 299 million pounds in 2004, down 1 percent from the October 1 forecast but up 6 percentfrom last year. Growers harvested 154,650 acres in 2004, up less than 1 percent from the previous forecast and2 percent above last year. Yield per acre averaged 1,932 pounds, down 26 pounds from the October forecast but82 pounds above last year. In Kentucky, the top burley producing State, wet conditions made the tobacco heavyfor those harvesting early. However, dry weather during September and October reduced leaf weight and delayedstripping.
Sugarbeets: Production is estimated at 29.9 million tons, 1 percent above the November 1 forecast but 3 percentbelow last year’s production. Growers in the 12 sugarbeet-producing States harvested 1.31 million acres, 1 percentbelow the November estimate and 3 percent below last year’s 1.35 million acres. Yield is estimated at 22.9 tons peracre, 0.5 ton above November and 0.1 ton above the 2003 yield.
Sugarbeet planting progressed well ahead of normal in the 4 major sugarbeet-producing States, due to warmweather in most growing areas. However, a late freeze in May forced some growers in the northern Great Plainsand adjacent areas of the Corn Belt to replant. Toward the end of the season in the Red River Valley, flooding andfrost damage caused above-normal abandonment. Harvest progressed behind normal in most areas, partly due tocool weather during the summer slowing crop development and partly due to warm weather preventing pilingtoward the end of the season.
Sugarcane: Production of sugarcane for sugar and seed is estimated at 29.3 million tons, 3 percent below theDecember forecast and 13 percent below last year’s 33.9 million tons. Area harvested and to be harvested for sugarand seed is estimated at 952,100 acres for the 2004 crop year, down 1 percent from December and 4 percent belowlast year. Yield is estimated at 30.8 tons per acre, 0.8 ton below last month, 3.3 tons below 2003, and the lowestnationwide yield since 1947.
In Florida, where 4 hurricanes affected the sugarcane-producing areas around Lake Okeechobee, expected yield was33.9 tons per acre, down 2.1 tons from December and the lowest since 1996. Louisiana’s crop, adversely affectedby heavy rainfall in June and muddy harvest conditions, yielded 24.0 tons per acre, the lowest since 1993.
Dry Beans: U.S. dry edible bean production is estimated at 17.8 million cwt for 2004, down 2 percent from theDecember forecast and 21 percent below last year. Harvested acreage is estimated at 1.22 million acres, down lessthan 1 percent from the last forecast and 9 percent below 2003. The average U.S. yield is estimated at 1,460 poundsper acre, a decrease of 19 pounds from the December forecast and 210 pounds below a year ago. Production isbelow a year ago in 12 of the 18 producing States. Most notable is a 39 percent decrease from last year in bothMinnesota and North Dakota where frost in mid-August severely damaged the crop. Production is down from ayear ago for large lima, baby lima, navy, great northern, pinto, light red kidney, dark red kidney, pink, cranberry,and blackeye. Production increased from last year for small white, small red, black, and small and large chickpeas.
Production in North Dakota is estimated at 4.75 million cwt, 39 percent below 2003. The average yield, at1,000 pounds per acre, is down 500 pounds from last year. Yields are down because of the mid-August frost. Harvested acres, at 475,000, decreased 9 percent. Harvest was essentially complete by mid-November, a monthbehind average due to a late maturing crop.
In Nebraska, production is estimated at 2.38 million cwt, 25 percent below last year. Harvested area, at110,000 acres, is 26 percent below 2003, while yield of 2,160 pounds per acre is 30 pounds above last season. Thisis a record high yield. Irrigation water was adequate and growing conditions were good. Minnesota growersproduced 1.15 million cwt of dry beans, 39 percent below last year. The average yield, at 1,150 pounds per acre, isdown 550 pounds from the previous year. Lower yields were due to an early frost and very wet conditions innorthwest Minnesota. Production in California decreased 16 percent due to fewer harvested acres. Heavy rains inlate October and early November delayed harvest and caused some operators to abandon some acres. Production inTexas, New York, and Kansas decreased 73 percent, 45 percent, and 34 percent, respectively, while both Wyomingand New Mexico decreased 16 percent from last year. Colorado is 11 percent below last year, Utah is 12 percentlower, and Wisconsin is down 9 percent from a year ago.
In Michigan, production is estimated at 3.15 million cwt, up 27 percent from the previous year. The average yield,at 1,700 pounds per acre, increased 200 pounds. Growing conditions were near optimal and harvest was completedahead of normal. Idaho production is expected to be 9 percent above the previous year, at 1.64 million cwt. Wetweather this fall delayed harvest for some farmers. Production in South Dakota increased 23 percent, Montana22 percent, Oregon 17 percent, and Washington 16 percent.
Lentils: Production of lentils in Idaho, Montana, North Dakota, and Washington is estimated at 4.18 million cwtfor 2004, up 2 percent from the November 1 forecast and 71 percent above 2003. Planted area, at 345,000 acres,remains unchanged from the previous forecast but is 40 percent above the previous season. Harvested area, at
Crop Production 2004 Summary Agricultural Statistics BoardJanuary 2005 86 NASS, USDA
329,000 acres, is 2 percent above the November 1 forecast and 39 percent above last year. Average yield per acre,at 1,271 pounds, is 3 pounds above November’s forecast and 241 pounds above last year.
Montana’s production, at 1.01 million cwt, is more than triple a year ago. Harvested area is 177 percent above the2003 acreage, while average yield increased by 350 pounds to 1,400. This yield increase is due to ideal growingconditions. During April to mid May, Montana experienced 80 degree temperatures with very limited moisture. During July and August, the State had cooler temperatures with much needed precipitation. North Dakota’sproduction, at 1.29 million cwt, doubled from 2003. Above normal daytime temperatures and dry conditions thelast week of April and the first week in May allowed producers to plant early season crops ahead of the 5-yearaverage pace. Below normal temperatures and mostly adequate soil moisture in the lentil growing area, during mostof the growing season, promoted excellent growing conditions. Production in Washington, at 1.12 million cwt, isup 23 percent from 2003. Idaho’s production, at 770,000 cwt, is 23 percent above last year.
Wrinkled Seed Peas: Growers of wrinkled seed peas in Idaho and Washington produced 899,000 cwt in 2004, up34 percent from 2003 production of 673,000 cwt and 50 percent above 2002. Production in Idaho, at 174,000 cwt,is up 7 percent from 2003. Production in Washington, at 725,000 cwt, increased 42 percent from the 2003production of 510,000 cwt.
Dry Edible Peas: Production of dry edible peas in Idaho, Montana, North Dakota, Oregon, and Washington isestimated at 11.4 million cwt for 2004, up 5 percent from the November 1 forecast and 120 percent above 2003. Area harvested, at 507,800 acres, is 1 percent above the previous forecast and 55 percent above last year. Averageyield, at 2,249 pounds per acre, increased 86 pounds from the November 1 forecast and is 665 pounds above 2003.
Production is up from the previous year for all the major producing States. Production increased 44 percent inIdaho and 57 percent in Oregon. North Dakota’s production is 6.93 million cwt, 152 percent above 2003. Thislarge increase is due to record high yields and more harvested acres. Below normal temperatures and adequate soilmoisture supplies in the dry pea growing area during most of the growing season promoted excellent growingconditions. Harvest conditions were aided by dry and above normal temperatures during the end of September. Montana’s production, at 1.27 million cwt, is more than double 2003. Producers are reporting better yields thisseason due to ideal growing conditions. Montana received warm temperatures with very limited moisture duringApril to mid May. During July and August, the State experienced cooler temperatures and adequate rainfall. Washington’s production increased 70 percent from 2003. Dry pea yields, at 2,400 pounds per acre, have been thebest since 1993, when yields equaled this seasons output. Newer upright varieties have some producers realizingyields close to two tons per acre. Processors have been reporting excellent quality with little to no bleachingproblems.
Austrian Winter Peas: Production of Austrian winter peas in Idaho, Montana, and Oregon for the 2004 season isestimated at 264,000 cwt, down 3 percent from the November 1 forecast but 52 percent above 2003. Areaharvested, at 21,500 acres, is unchanged from the previous forecast but 38 percent above last season. Averageyield, at 1,228 pounds per acre, decreased 37 pounds from the November 1 forecast but is 113 pounds above 2003. Idaho’s Austrian winter pea crop is up 50 percent from 2003 when production was adversely affected by heat stress. Drought in the primary pea growing area of Montana forced a number of growers to graze or cut their fields forhay.
Winter Potatoes: The final 2004 winter potato production is estimated at 4.82 million cwt, up 38 percent from theApril forecast and 20 percent above 2003. Harvested area of 18,500 acres is 32 percent above the April 1 forecastand 29 percent more than last year. The average yield of 260 cwt per acre is up 10 cwt from the April forecast but22 cwt below 2003. California's production, at 3.25 million cwt, is 53 percent above the April forecast and23 percent greater than last season. Florida's production, at 1.57 million cwt, is 14 percent above the previousforecast and up 13 percent from a year ago.
Spring Potatoes: Production for 2004 is revised to 22.7 million cwt, up 19 percent from the May forecast but7 percent below 2003. Harvested area totaled 72,200 acres, down 15 percent from a year ago. The average yield of314 cwt per acre increased 26 cwt from 2003 and is a record high, 14 cwt above the previous record set in 1999.
Spring potato production in Texas decreased 26 percent from 2003 and 15 percent in Arizona. Production in NorthCarolina is down 9 percent from the previous year and Florida’s crop is 4 percent below 2003. California’s cropdecreased 1 percent from last year. Record high yields in California partially offset an 8 percent decrease inharvested acres.
Summer Potatoes: Growers produced 18.9 million cwt of summer potatoes in 2004, up 2 percent from theSeptember forecast and less than 1 percent increase from a year ago. Harvested area, at 54,600 acres, is down7 percent from last year. The average yield of 345 cwt per acre is 25 cwt above last year’s record high yield of320 cwt.

Crop Production 2004 Summary Agricultural Statistics BoardJanuary 2005 87 NASS, USDA
Summer production increased 33 percent from last year in Kansas, 20 percent in Texas, 8 percent in Maryland,2 percent in Missouri, and 1 percent in Colorado. Production decreased 36 percent from 2003 in New Mexico,32 percent in Alabama, and 23 percent in Virginia. New Jersey’s production dropped 12 percent from last year,Illinois producers grew 9 percent less, production in Delaware is down 7 percent, and California productiondecreased 4 percent.
Fall Potatoes: Production of fall potatoes for 2004 is estimated at 410 million cwt, virtually unchanged from boththe December forecast and last year for comparable States. South Dakota and Utah were dropped from the programstarting in 2004. Area harvested, at 1.02 million acres, is down less than 1 percent from December and 6 percentbelow last year. The average yield is estimated at 401 cwt per acre, 2 cwt above December and 25 cwt above lastyear. This is a record high yield, 9 cwt above the previous record set in 2000.
Western States’ production is estimated at 281 million cwt, unchanged from the December forecast but up 3 percentfrom last year for comparable States. Acreage harvested, at 642,200 acres, decreased 3 percent from last year, butthe average yield of 437 cwt per acre is up 23 cwt from 2003. Record high yields in Idaho increased production7 percent from the previous year. Favorable growing conditions during the season contributed to the good size andquality of the tubers. Production in Washington is up 1 percent from last year. Colorado’s production decreased2 percent as more acres were abandoned due to higher disease rates and water management issues. Oregon growersharvested 19.8 million cwt of potatoes, down 6 percent from last year. This decrease is due to a 13 percentreduction in harvested acres but yields are estimated to be 41 cwt above last season. California’s production is up10 percent from last year. Ideal weather and excellent soil conditions increased yields 85 cwt from 2003 to 510 cwtper acre, more than offsetting the 8 percent decrease in harvested acres. Growers in Montana produced 6 percentmore potatoes than in 2003. Nevada’s production decreased 13 percent. New Mexico production is 8 percentabove last season.
Central States’ production is estimated at 101 million cwt, virtually unchanged from the December forecast butdown 7 percent from last year for comparable States. Harvested area, estimated at 285,400 acres, is down 1 percentfrom December and 13 percent below a year ago. Average yields, at 355 cwt per acre, are up 6 cwt from Decemberand 20 cwt above a year ago. Production in Michigan is 9 percent below 2003. Minnesota’s production is down15 percent from last year. A record high yield of 430 cwt per acre does not make up for the 24 percent decrease inharvested acres. Due to very wet spring conditions, producers planted less potato acreage and reported higher ratesof abandonment in Minnesota and Michigan. However, moderate summer temperatures led to good yields. Growers in North Dakota had a 2 percent decrease from last season. North Dakota also had a record high yield of265 cwt per acre, 20 cwt above the previous record set in 2003. Indiana’s production increased 21 percent from lastyear. Wisconsin growers experienced a record high yield of 435 cwt per acre, 25 cwt above last year. However,production decreased 7 percent due to fewer harvested acres. Nebraska growers also had a record high yield of430 cwt but production decreased 5 percent. Ohio’s production decreased 2 percent.
Eastern States’ production is estimated at 28.0 million cwt, up less than 1 percent from the December forecast and1 percent above last year. Area for harvest totaled 95,200 acres, unchanged from last month but 8 percent belowlast year. Average yield, at 294 cwt per acre, is up 1 cwt from December and 24 cwt above last season. Heavyrains late in the season drowned-out low lying fields in Maine, New York, and Pennsylvania, resulting in qualityproblems and higher rates of abandonment. Record high yields in Maine and Massachusetts more than offset lowerharvested acres. Maine growers had a 13 percent increase in production from last year. Massachusetts productionis up 12 percent from a year ago. Rhode Island producers experienced a 2 percent increase in production from2003. New York production decreased 20 percent from 2003. Pennsylvania growers had a 22 percent decreasefrom last year.
All Potatoes: Total 2004 U.S. potato production from all four seasons is estimated at 456 million cwt, down lessthan 1 percent from both the 2003 and 2002 crops. Harvested area, at 1.17 million acres, is down 6 percent fromlast year and 8 percent lower than two years ago. The average yield, at 391 cwt per acre, is 24 cwt above last yearand 29 cwt above 2002. This is a record high yield, 10 cwt above the old record set in 2000. By season, fall andsummer production are virtually unchanged from the previous year, spring is down 7 percent, and winter is up20 percent from 2003.
Sweet Potatoes: Production of sweet potatoes in 2004 is estimated at 16.4 million cwt, up 3 percent from lastseason and 28 percent above 2002. This is the largest production of sweet potatoes in the U.S. since 1962, when17.1 million cwt were produced. Growers harvested 93,300 acres, up 1 percent from last year. Yield per acre, at176 cwt, is up 4 cwt from the record high yield in 2003. Production increased 22 percent in New Jersey, 17 percentin North Carolina, 9 percent in Mississippi, 6 percent in California, and 3 percent in Texas. Good growingconditions with sufficient rainfall in these States contributed to an excellent crop. Production decreased 26 percentin Louisiana, 20 percent in Alabama, 17 percent in Virginia, and 7 percent in South Carolina. Extremely wetconditions and saturated fields in Louisiana and Alabama resulted in reduced production and lower crop quality.

Crop Production 2004 Summary Agricultural Statistics BoardJanuary 2005 88 NASS, USDA
Peppermint Oil: Production of peppermint oil in 2004 is estimated at 7.15 million pounds, up 2 percent from lastyear. Harvested area is estimated at 77,700 acres, down 2 percent from 2003. Growers in Michigan, Oregon, andWashington decreased their acreage 9 percent, 6 percent, and 2 percent, respectively. Wisconsin producersincreased their acreage 11 percent, while Idaho and Indiana harvested acreage remained unchanged. The U.S.average yield is 92 pounds of oil per acre, up 4 pounds from last year. Production in Washington is up 14 percentand average yield is at 120 pounds per acre, a record high for the State. The Pacific Northwest experiencedfavorable growing conditions this season.
Spearmint Oil: Spearmint oil production is estimated at 1.75 million pounds for 2004, down 2 percent from lastyear and 13 percent below 2002. Harvested area is estimated at 15,100 acres, down 4 percent from last year and18 percent below 2002. Average yield is estimated at 116 pounds of oil per acre, up 3 pounds from last year and7 pounds above 2002. Most of the major spearmint producing States reduced acreage from 2003 to 2004. Somemint growers cited low prices as the reason for the drop in spearmint acres.
Hops: Production for Idaho, Oregon, and Washington in 2004 totaled 55.2 million pounds, up 1 percent from the2003 crop of 54.6 million pounds but 5 percent below the 2002 production of 58.3 million pounds. Washington’s2004 production increased 4 percent from the previous year. Production in Idaho and Oregon dropped 2 percentand 8 percent, respectively. Acreage declined in all three States in 2004. Washington showed a 1 percent acreagedecrease, Idaho is down 5 percent, and Oregon is down 11 percent. However, yields improved over a year ago inall three States. Washington, with 2,137 pounds per acre, is up 87 pounds from last year. In Idaho, yields averaged1,588 pounds per acre, 52 pounds more than a year ago. Oregon’s average yield increased 60 pounds, to1,686 pounds per acre in 2004.
Washington growers produced 75 percent of the U.S. hop crop for 2004. Zeus, Columbus/Tomahawk, Galena, andWillamette are the leading varieties in Washington, accounting for 68 percent of the State’s hop crop. In Oregon,Willamette and Nugget are the major varieties, accounting for 71 percent of the hops harvested.
Maple Syrup: The 2004 U.S. maple syrup production totaled 1.51 million gallons, up 20 percent from 2003 and2 percent above 2002. Compared to 2003, maple syrup production increased in all States and is at the highest levelsince 1996.
Vermont led all States in production with 500,000 gallons, an increase of 19 percent from last season. Vermontsyrup production accounted for 54 percent of New England’s production and 33 percent of the total United Statesproduction. Maine was second with 290,000 gallons, up 2 percent from 2003. New York’s production, at255,000 gallons, increased 21 percent from last year.
In Massachusetts and New Hampshire, production was up 35 percent and 38 percent, respectively, from last season. In Connecticut, production increased 10 percent from last year. Production was also up 36 percent in Michigan,53 percent in Ohio, 15 percent in Pennsylvania, and 32 percent in Wisconsin compared to 2003.
Production increases were attributed to increased yield per tap in all States, combined with more taps set in mostStates. In several States, cold temperatures were reported early in the season but temperatures returned to favorablelevels, with mild days and cool nights increasing sap flow.
Coffee: Hawaii coffee production is estimated at 7.10 million pounds (parchment basis) for the 2004-05 season,down 14 percent from the previous crop year. Harvested area is estimated at 5,800 acres, down 2 percent from the2003-04 season. Coffee production from the islands of Kauai, Maui, Molokai, and Oahu is forecast at 4.10 millionpounds for the 2004-05 season, down 5 percent from last season. Hawaii island is forecast to harvest 3.00 millionpounds, down 25 percent from the previous season. Heavy spring rains and windy conditions hampered flowersurvival and slowed fruit development in the Kona area. A wet winter is expected to result in a smaller crop butprolonged harvest season.
Taro: Hawaii taro production for crop year 2004 is estimated at 5.20 million pounds, up 4 percent from last yearbut the second lowest total production on record. Area harvested, at 370 acres, is down 50 acres from 2003. Majortaro producing areas were once again infested with Apple snails, which feed on taro plants and provide an infectionpoint for diseases. Taro production was also affected by taro Pocket Rot disease, a new species of Phytophthorathat infects the corm. This low production level can be directly attributed to these pests.
Ginger Root: Hawaii ginger root production for the 2003-04 season is 6.00 million pounds, unchanged from theprevious season. Harvested acreage is 150 acres, 6 percent below from a year ago. Average yield, at40,000 pounds per harvested acre, is 7 percent above the previous season but is the second lowest average yield inthe past 10 seasons. Abundant precipitation during the main harvesting periods resulted in an increase in disease,which kept production at a low level.

Crop Production 2004 Summary Agricultural Statistics BoardJanuary 2005 89 NASS, USDA
Information Contacts
Listed below are the commodity specialists in the Crops Branch of the National Agricultural Statistics Service tocontact for additional information.
Joe Prusacki, Chief (202) 720-2127
Field Crops SectionGreg Thessen, Head (202) 720-2127Lance Honig - Wheat, Rye (202) 720-8068Darin Jantzi - Corn, Proso Millet, Flaxseed (202) 720-9526Troy Joshua - Cotton, Cotton Ginnings (202) 720-5944Dennis Koong - Hay, Oats, Sorghum (202) 690-3234Jason Lamprecht - Soybeans, Other Oilseeds (202) 720-7369Mark R. Miller - Peanuts, Rice (202) 720-7688Brian Young - Crop Weather, Barley, Sugar Crops (202) 720-7621
Fruit, Vegetable & Special Crops SectionJim Smith, Head (202) 720-2127Leslie Colburn - Berries, Grapes, Maple Syrup, Tobacco (202) 720-7235Debbie Flippin - Austrian Winter Peas, Dry Edible Peas, Lentils, Mint, Mushrooms, Peaches, Pears, Wrinkled Seed Peas (202) 720-3250Jorge Garcia-Pratts - Citrus, Tropical Fruits (202) 720-5412Rich Holcomb - Floriculture, Nursery, Nuts (202) 720-4215Terry O’Connor - Apples, Apricots, Cherries, Cranberries,
Plums, Prunes (202) 720-4288Kim Ritchie - Hops (360) 902-1940Cathy Scherrer - Dry Beans, Potatoes, Sweet Potatoes (202) 720-4285Biz Wallingsford - Fresh and Processing Vegetables, Onions,
Strawberries (202) 720-2157

ACCESS TO REPORTS!!
For your convenience, there are several ways to obtain NASS reports, data products, and services:
INTERNET ACCESS
All NASS reports are available free of charge on the worldwide Internet. For access, connect to the Internet and go to theNASS Home Page at: www.usda.gov/nass/. Select “Today’s Reports” or Publications and then Reports Calendar orPublications and then Search, by Title or Subject.
E-MAIL SUBSCRIPTION
All NASS reports are available by subscription free of charge direct to your e-mail address. Starting with the NASS HomePage at www.usda.gov/nass/, click on Publications, then click on the Subscribe by E-mail button which takes you to thepage describing e-mail delivery of reports. Finally, click on Go to the Subscription Page and follow the instructions.
- - - - - - - - - - - - - - - - - - - - - - - - - - - - - - - - -
PRINTED REPORTS OR DATA PRODUCTS
CALL OUR TOLL-FREE ORDER DESK: 800-999-6779 (U.S. and Canada)Other areas, please call 703-605-6220 FAX: 703-605-6900
(Visa, MasterCard, check, or money order acceptable for payment.)
- - - - - - - - - - - - - - - - - - - - - - - - - - - - - - - - - -
ASSISTANCE
For assistance with general agricultural statistics or further information about NASS or its products or services, contactthe Agricultural Statistics Hotline at 800-727-9540, 7:30 a.m. to 4:00 p.m. ET, or e-mail: [email protected].
The United States Department of Agriculture (USDA) prohibits discrimination in all its programs on the basis of race,color, national origin, gender, religion, age, disability, political beliefs, sexual orientation, and marital or family status. (Not all prohibited bases apply to all programs.) Persons with disabilities who require alternative means forcommunication of program information (braille, large print, audiotape, etc.) should contact the USDA’s TARGET Centerat 202-720-2600 (voice and TDD).
To file a complaint of discrimination, write USDA, Director, Office of Civil Rights, Room 326-W, Whitten Building,1400 Independence Avenue, SW, Washington, D.C., 20250-9410, or call 202-720-5964 (voice or TDD). USDA is anequal opportunity provider and employer.

Science, Markets, Policy–What’s Ahead?
Count on USDA’s Outlook Forum 2005 for thelatest farm and commodity prospects and insighton news shaping the outlook for agriculture.
Outlook sessions will feature USDA’s first 2005forecasts for planting, production, trade and prices andspeakers on market developments.
The program will feature the science-agricultureconnection. Today as never before, science is crossingpaths with farming, farm policy and the marketplace.Topics include managing risks from BSE and AvianInfluenza; prospects for energy prices, ethanol andco-products; early debate over the next Farm Bill; newdietary guidelines; the future of the North Americanmarketplace; WTO talks and the bio-safety protocol.
Attendees will receive new USDA long-term commodityprojections to 2014. USDA agencies will demonstratenew e-government tools for better service.
Networking opportunities abound at this popular event. Register online today. For program updates, send yourname and e-mail address to [email protected].
www.usda.gov/oce/forum [email protected]