Investment options for integrated water-livestock- crop production in sub-Saharan Africa
52
Investment options for integrated water-livestock- crop production in sub-Saharan Africa By D. Peden, A. Freeman, A. Astatke, A. Notenbaert With contributions from: W. Ayalneh, I. Baltenweck, A. El Wakeel, B. Fadlalla, R. Elzaki, H. Faki, B. Mati, K. Sonder and A.Workalemahu Ground water supports production and marketing of livestock in Sudan (photo by D. Peden) Kenyan farmer feeds his livestock irrigated vegetables rejected for export (photo by B. Mati) A contribution by the International Livestock Research Institute (ILRI) and the International Water Management Institute (IWMI) As chapter # 4 of Investment in Agricultural Water Management in Sub-Saharan Africa: Diagnosis of Trends and Opportunities For a collaborative program of NEPAD, African Development Bank, FAO, IFAD and the World Bank INTERNATIONAL LIVESTOCK RESEARCH INSTITUTE Working Paper 1 February 2006 ISBN 92-9146-183-0
-
Upload
independent -
Category
Documents
-
view
3 -
download
0
Transcript of Investment options for integrated water-livestock- crop production in sub-Saharan Africa

ILRI: February 2006 1
Investment options for integrated water-livestock-crop production in sub-Saharan Africa
By
D. Peden, A. Freeman, A. Astatke, A. Notenbaert
With contributions from:
W. Ayalneh, I. Baltenweck, A. El Wakeel, B. Fadlalla, R. Elzaki, H. Faki, B. Mati, K. Sonder and A.Workalemahu
Ground water supports production and marketing of livestock in Sudan (photo by D. Peden)
Kenyan farmer feeds his livestock irrigated vegetables rejected for export (photo by B. Mati)
A contribution by the International Livestock Research Institute (ILRI) and the International Water Management Institute (IWMI)
As chapter # 4 of
Investment in Agricultural Water Management in Sub-Saharan Africa: Diagnosis of Trends and Opportunities
For a collaborative program of NEPAD, African Development Bank, FAO, IFAD and the World Bank
INTERNATIONAL LIVESTOCK RESEARCH INSTITUTE Working Paper 1 February 2006
ISBN 92-9146-183-0

ILRI: February 2006 1
4 Investment options for integrated water-livestock-crop
production in sub-Saharan Africa D. Peden, A. Freeman, A. Astatke, A. Notenbaert
ACKNOWLEDGEMENTS This study was undertaken as one thematic component of a Collaborative Program on trends and opportunities for investments in agricultural water management in sub-Saharan Africa. Partners in the collaboration were: the African Development Bank, the World Bank, the International Fund for Agricultural Development, the Food and Agriculture Organization of the United Nations, and the International Water Management Institute (IWMI). The authors are grateful to the program Steering Committee for guiding the work conducted and the Working Group for providing feedback on earlier reports. They also thank the International Livestock Research Institute (ILRI) for providing additional support including spatial data for this study and expertise for reviewing this report. The authors additionally thank the consultants and staff from ILRI and its partner institutions who greatly assisted with the case studies: Wagnew Ayalneh, Isabelle Baltenweck, Ahmed El Wakeel, Raga Elzaki, Babo Fadlalla, Hamid Faki, Bancy Mati, Kai Sonder and Assegid Workalemahu. Finally, the authors thank Doug Merrey of the International Water Management Institute and Shirley Tarawali, International Livestock Research Institute for their encouragement and helpful suggestions during the course of this study. ILRI acknowledges funding provided by the African Development Bank channeled through IWMI.
© 2006 ILRI (International Livestock Research Institute, PO Box 30709, Nairobi, Kenya)

ILRI: February 2006 2
Table of Contents ACKNOWLEDGEMENTS.......................................................................................................1 LIST OF TABLES.....................................................................................................................3 LIST OF FIGURES ...................................................................................................................4 SYNTHESIS..............................................................................................................................4 SOMMAIRE EXÉCUTIF..........................................................................................................6 INTRODUCTION .....................................................................................................................8 METHODOLOGY ....................................................................................................................9
Stratification of Africa .........................................................................................................10 Ranking priorities of countries and WLDs for investments in water and livestock ............11 Case studies..........................................................................................................................12
DEVELOPMENT CONTEXT ................................................................................................13 Human population and income growth................................................................................13 Demand for livestock products ............................................................................................14 Increased demand for water .................................................................................................15 Degradation and conservation of water and land resources ................................................15 Livestock in Africa and their use of and impact on agricultural water................................16 Conflict – impact of agricultural water development on pastoralists ..................................17
SPATIAL ANALYSES OF LIVESTOCK AND WATER.....................................................17 Overview of Water-livestock Domains in Africa ................................................................18 Livestock and human populations within WLDs by country ..............................................21 Livestock and human populations within WLDs by country ..............................................22 Priority countries and WLDs for water-livestock investment .............................................22 Correlation of agricultural intensification, human populations and livestock density ........30 Water for drinking and feed production ..............................................................................31 Inter-WLD boundaries .........................................................................................................33 Summary of spatial analyses of water and livestock ...........................................................34
WATER LIVESTOCK INVESTMENT OPTIONS................................................................34 Mixed large-scale irrigation with good market access, high human population .................35 Mixed crop-livestock rainfed production with good market access, high human population, and low available surplus water........................................................................37 Other mixed crop-livestock rainfed WLDs .........................................................................39 Livestock-dominant rainfed production with bad market access, low human population and low available surplus water, and other livestock WLDs.............................39
POTENTIAL FOR RETURNS ON INVESTMENT ..............................................................41 Sudan’s Gezira irrigation system.........................................................................................42 Awash River basin, Ethiopia ...............................................................................................43 Dairy production in four irrigated systems of Kenya ..........................................................45 Profitability – a summary of selected cases.........................................................................45
RECOMMENDATIONS.........................................................................................................46 REFERENCES ........................................................................................................................49

ILRI: February 2006 3
LIST OF ACRONYMS
ILRI International Livestock Research Institute IWMI International Water Management Institute TLU Tropical livestock unit SSA Sub-Saharan Africa FAO United Nations Food and Agricultural organization FARA Forum for Agricultural Research in Africa GDP Gross domestic product IRWR Internally renewable water resource MDG Millennium development goals NI Natural inflow WLD Water-livestock investment domain
LIST OF TABLES Table 1: Tropical Livestock Unit (TLU) equivalent for livestock species used in this
study with poultry and swine not included and where one TLU equals 250 kg live animal weight...................................................................................................................10
Table 2: Case studies showing links (“X”) to major production systems...............................13 Table 3: Annual growth rates (%) of population, urban population, and GDP ......................14 Table 4: Production Growth Per Capita in Developing Countries, 1975-2001. .....................14 Table 5: Projected trends in meat and milk consumption and production, 1993-2020. .........14 Table 6: List of African countries showing area and % cover of water-livestock
investment domains (WLDs) and the human population in 2000 living within them.....21 Table 7: Human and livestock populations in WLDs within African countries ranked in
decreasing order by TLU* ...............................................................................................23 Table 8: African countries having WLDs ranked according to importance for key
livestock and human demographic indicators..................................................................24 Table 9: Africa-wide summary of the most important 16 WLDs first classified by
production system and within these ranked according to overall priority from highest to lowest importance. ..........................................................................................25
Table 10: Association of livestock with large-scale irrigation A based on large-scale Africa-wide spatial analyses ............................................................................................27
Table 11: TLU density (TLU/km2) for all WLDs summarized by human population, market access, and available discretionary water for each production system................30
Table 12: Estimated water required for producing feed to meet maintenance requirements* of livestock in the major livestock producing countries and WLDs in Africa. ..............................................................................................................................32
Table 13: Estimated water required for producing feed to meet maintenance requirements* of livestock in the sixteen major WLDs in Africa. ..................................33
Table 14: Experience and investment options: Mixed large-scale irrigation, good market access, and high human population. ................................................................................36
Table 15: Experience and investment options: Mixed rainfed agriculture with good market access, high human population and low available discretionary water. ..............38
Table 16: Experience and investment options for Livestock-dominant rainfed areas, bad market access, low human population and low available discretionary water ................40

ILRI: February 2006 4
Table 17: Enterprise budget showing additional costs and returns arising from inclusion of dairy, sheep and goat production on tenants’ farms in the Gezira irrigation system of Sudan ...........................................................................................................................42
Table 18: Sources of income for tenant households in the Gezira irrigation systems of Sudan................................................................................................................................43
Table 19: Comparison of profitability of maize production alone with maize combined with milk production in the Awash River Basin of Ethiopia...........................................44
Table 20: Discounted returns on investments for small holder dairying based on irrigated fodder compared to original rainfed land use in Kenya...................................................45
LIST OF FIGURES Figure 1: Livestock-related threat of degradation of land and water resources in 2000
and projected to 2030 indicating areas where extra care may be needed to ensure that livestock keeping practices do not cause lower than expected returns on investments in agricultural water. ....................................................................................16
Figure 2: Simplified classifications of agriculture production systems, market access, available discretionary water and human population density used to generate water-livestock investment domains (WLDs)............................................................................19
Figure 3: Sixteen water-livestock investment domains identifying where carefully targeted opportunities may exist for investing in integrated agricultural water and livestock development in Africa. .....................................................................................20
Figure 4: Spatial analyses reveal some of Africa’s highest livestock densities (Table 11) occur in and around large-scale irrigations systems. .......................................................26
Figure 5: Distribution of mixed rainfed (MR) crop-livestock WLDs in Africa. ....................28 Figure 6: Distribution of Livestock-dominated WLDs in Africa where grazing practices
are most prevalent. ...........................................................................................................29 Figure 7: Comparison of net incomes from smallholder crop and dairy production based
on irrigated farming in four communities in Kenya [NM = New Mutaro; O1 and O2 = two farmers in Ontulili; Mw = Mwireri; Em = Emening; Is = Mashambani] ..............46
SYNTHESIS The world has embarked on millennium development goals that include eradicating poverty and hunger and ensuring environmental sustainability. This paper focuses on enhancing returns on investments in agricultural water through effective integration of livestock production. It suggests that multi-sectoral approaches to investment in water, soil, crop and livestock will have greater development impact and profitability than developing water and livestock independently in the same areas.
In African agriculture, livestock are important, and demand for livestock products is growing rapidly particularly in urban areas – a process driven by urban population growth buoyed up by increasing discretionary income. Great opportunities exist for Africa’s poor livestock herders and farmers to engage in this rapidly expanding market, to increase their income and to climb out of poverty. But increased animal production results in heightened demands for agricultural water.
African livestock use about 200 billion m3/year of rain and irrigated water most of which (99%) is depleted through transpiration in the process of producing feed. This water exceeds that estimated by FAO for agricultural water withdrawal in sub-Saharan Africa but assumes that water is explicitly accounted for as transpiration cost of producing plant material for feed. Where increased use of crop residues for feed increases, water use efficiency will be reduced because the water used is usually factored into the cost of crop production. Understanding and managing livestock use of water

ILRI: February 2006 5
resources and improving livestock water productivity is therefore vital for better management of agricultural water in Africa.
Livestock in Africa number about 250 million Tropical Livestock Units (TLU = 250 kg of live animal weight and include cattle, sheep, goats, equines and camels but in this paper exclude swine, fish and poultry). Animal production takes place on about half of Africa’s 30 million km2. About a third of Africa’s stock of animals resides in Sudan and Ethiopia with another third in Nigeria, South Africa and other East African countries (Kenya, Tanzania, Somalia, and Uganda). These are countries where priority must be given to integrating livestock development with investments in agricultural water. Evidence suggests that animal numbers and densities along with their demand for water will increase following development of agricultural water resources.
Africa’s livestock producing area of about 16 million km2 was classified into water-livestock investment domains (WLD) made up of three basic productions systems: livestock-dominated grazing lands; mixed crop-livestock rainfed production; and mixed large-scale irrigation systems. Mixed rainfed systems include small-scale irrigation carried out by households and communities. Large-scale irrigation systems have Africa’s highest livestock densities followed by mixed rainfed systems and then by livestock-dominated grazing systems. The mixed rainfed crop-livestock systems have the largest numbers of animals while the livestock-dominated systems cover the greatest land area. Each system presents unique agricultural water investment opportunities.
Case studies showed that irrigation farmers and labourers benefit from livestock keeping. In Kenya, Sudan and Ethiopia, smallholder dairying based on irrigated forage and crop residue was profitable and compared favourably with production of many cash crops. In Gezira, Sudan, 90% of the residents keep animals and about 36% of tenants' income comes from selling them and animal products. In Ethiopia, livestock in smaller community based irrigations systems are essential for providing farm power. In areas with good market access, there is great opportunity to take advantage of abundant crop residues to produce animal products as a profitable complementary activity to irrigated crop production. Irrigation is one approach to intensification of agriculture that is a response to growing demand for food for increasing human populations. Thus, irrigation development will likely coincide geographically with opportunities for poor livestock keepers to supply the rapidly increasing demand for livestock products especially in urban areas. Planning for and making use of irrigated crop residues will be an important source of feed needed to support increased production of animal products and may significantly increase the return on investments in water resources.
Mixed crop-livestock rainfed systems with good access to markets have the prospect of benefiting from increasing demand for high value food products including milk and meat. In both Kenya and Ethiopia, smallholder dairy producers realized significant increases and stability in year-round income through use of agricultural water to quench their cows’ thirst. Whether piped or harvested, provision of drinking water on a continuous basis reduced labour costs of fetching water, increased conversion efficiency of both irrigated rainfed forages and crop residues, and increased milk production and animal growth resulting in increased family income. Building on the principle that crop residues are by-products of crop production, it follows that their use as feed increases the return on investments in both rainfed and irrigated crop production. This study suggests that in planning irrigation, effort be made to assess and valuate the role of livestock in household enterprises and to understand how returns on investments in agricultural water development will enhance or reduce returns from various livestock enterprise options.
Livestock-dominated production often takes place relatively far from markets where there are limited livelihood alternatives. Investments in irrigation open up two opportunities for enhancing traditional herding practices. The Gezira and other nearby irrigation schemes are part of a complex market chain that enables distant herders to engage in the market because crop residues produced in the schemes are used to fatten animals after they lose weight during the long trek to the market centre in Khartoum. In planning large-scale irrigation, more equitable sharing of benefits arising from investments can be achieved through inclusion of pastoralist stakeholders in the planning process. Such action may catalyze scheme designs that enable herders to access water during dry seasons and take advantage of crop residues as feed. Without such planning, water development may deprive herders of access to feed and water resources. In addition, investments in strategically located and

ILRI: February 2006 6
well-managed watering sites in rangeland areas with surplus feed can help offset pastoralists’ loss of resources resulting from expanded irrigation and rainfed cropping elsewhere.
Apart from numerous opportunities to increase returns on investment in agricultural water through systematic integration of livestock and water development in irrigated, mixed rainfed and livestock-dominant production systems, multi-sectoral approaches to meeting the MDG goal of ensuring environmental sustainability are needed. Improved integrated management of water, soil, crops and livestock through measures such as conservation tillage, terracing and manure management may result in increase soil moisture for crop growth and reduced siltation of downstream irrigation infrastructure. Integration of water and livestock management will be particularly helpful in highland mixed rainfed farming systems. In all systems, better veterinary care can increase profitability of animals produced with agricultural water and reduce related human health risks.
Economic analyses from the Gezira irrigation system of Sudan, the Awash River basin of Ethiopia, and irrigation systems in Laikipia, Kenya, demonstrate that including animal production within irrigation systems can be profitable for farming households. Revenues generated are not simply due to use of crop residues, crop by-products and irrigated fodder. Rather, converting these low value feeds into high valued animal provided greater income and returns on investments than enterprises based on crops alone. In addition, farmers valued the diversification of income sources, the opportunity for year-round income, and manure that helps maintain soil fertility.
This study concludes that integrated investments in water and livestock development can avoid lost opportunities to increases beneficial returns, result in more equitable sharing of benefits, lead to more sustainable outcomes, and can increase overall net returns on investments made in agricultural water. Livestock are one of the major assets that households accumulate as a result of their efforts to climb out poverty. Investments in agricultural water designed to reduce poverty will be more successful if irrigation planning also helps secure and safeguard their animal assets. Failure to take into account needs of livestock keepers and their animals may reduce investment returns, have negative environmental impact and result in enhanced transmission of zoonotic diseases to people.
SOMMAIRE EXECUTIF Le titre: Quels investissements dans les systèmes de production intégrés eau –
élevage – agriculture en Afrique Subsaharienne Le monde entier s’est engagé sur la voie des objectifs de développement du millénaire, qui comprennent entre autres l’éradication de la pauvreté et de la faim dans le respect de l’environnement. Ce document a pour thème les investissements permettant d’intégrer les domaines de l’eau agricole et de l’élevage. Il soutient que les approches plurisectorielles des investissements en matière de gestion de l’eau, des sols, des cultures et de l’élevage génèreront des bénéfices supérieurs à ceux résultant d’approches sectorielles. L’élevage est essentiel à l’agriculture en Afrique et la demande de produits d’origine animale augmente rapidement surtout en zone urbaine –un phénomène dû à la croissance démographique stimulée par l’augmentation constante des revenus. Les éleveurs et les fermiers pauvres d’Afrique ont la réelle possibilité de tirer profit de ces marchés en expansion rapide, de voir leurs revenus augmenter et de sortir de la pauvreté. Mais l’augmentation de la production animale se traduit par des besoins croissants en eau agricole. En Afrique, l’élevage consomme annuellement environ 200 m3 d’eau de pluie ou d’irrigation par unité de gros bovin ; la quasi- totalité de cette eau (99%) est perdue par évaporation lors de la production du fourrage. Ce volume est supérieur à la quantité d’eau prélevée pour l’agriculture en Afrique subsaharienne telle qu’estimée par la FAO parce que, en termes économiques, l’eau comptabilisée est celle qui est transpirée dans le processus de production du fourrage uniquement. Lorsque des résidus de culture sont utilisés pour l’alimentation du bétail, la quantité d’eau consommée est bien inférieure car elle est généralement comptabilisée dans le coût de production de la céréale produite. Pour une gestion améliorée de l’eau agricole en Afrique, il est essentiel de bien comprendre

ILRI: February 2006 7
et de bien gérer l’utilisation de cette eau par l’élevage et d’augmenter la productivité de l’eau dans ce secteur. L’Afrique compte environ 250 million d’unités de bétail tropical (UBT= 250 kg de poids vif) à savoir les bovins, les moutons, les chèvres, les chevaux et les chameaux mais ce document n’inclus pas les porcs, les poissons et les volailles). La production animale s’étend sur la moitié environ des 30 millions de km2 du continent. A peu près un tiers des animaux se trouve au Soudan et en Ethiopie et un autre tiers au Nigeria, en Afrique du Sud et dans certains pays d’Afrique de l’Est (Kenya, Tanzanie, Somalie, Ouganda). Dans ces pays, l’intégration des systèmes d’élevage aux investissements en matière d’eau agricole doit être une priorité. Les faits montrent que le nombre et la densité des animaux ainsi que leurs besoins en eau augmenteront suivant l’utilisation des ressources en eau agricole. La zone de production animale de l’Afrique, qui couvre 16 millions de km2 a été repartie en Water-livestock investment domains(WLD), composés de trois principaux systèmes de production : les zones à prédominance de pâturage ; les systèmes de production agricole pluviale avec élevage associé et les systèmes dominés par la grande irrigation. Les petits périmètres irrigués gérés par les foyers et les communautés font partie des systèmes de production agricole pluviale avec élevage associé. Les grands périmètres irrigués ont les plus grandes densités de bétail ; ensuite viennent les zones de production mixtes d’agriculture et élevage et les zones à prédominance de pâturage. Les animaux sont plus nombreux dans les zones de production agricole et animale alors que les zones à prédominance d’élevage sont plus étendues. Chaque système offre de réelles possibilités d’investissement en matière d’eau agricole. Des études de cas ont montré que les agriculteurs qui pratiquent l’irrigation et les salariés agricoles tirent profit de l’élevage. Au Kenya, la petite production laitière qui utilise la luzerne s’est avérée rentable. Dans la Gezira, au Soudan, 90% des habitants élèvent des animaux et environ 30% du revenu des agriculteurs provient de la vente de ces derniers et aussi des produits d’origine animale. En Ethiopie, l’élevage sur les petits périmètres irrigués gérés par les communautés est important pour la traction animale. Dans les zones où l’accès au marché est facile, il serait avantageux de mettre à profit les quantités considérables de résidus des cultures pour la production de produits animaux, une activité rentable complémentaire à la culture irriguée. L’irrigation est un moyen qui permet d’intensifier l’agriculture afin de répondre aux besoins grandissants en nourriture des populations qui augmentent de plus en plus. Ainsi, il y a de fortes chances que dans les endroits où l’irrigation est utilisée, les éleveurs pauvres acquièrent la capacité de satisfaire les besoins croissants de produits animaux, en particulier ceux des zones urbaines. L’utilisation des résidus des cultures irriguées pourrait constituer une part importante de nourriture pour les animaux, ce qui est nécessaire à la production croissante de produits d’origine animale et pourrait augmenter de façon sensible la rentabilité des investissements dans le domaine des ressources en eau. Les systèmes de production mixte, culture pluviale et élevage, bénéficiant d’un accès facile aux marchés ont la possibilité de tirer profit du besoin croissant de produits alimentaires de qualité tels que le lait et la viande. Au Kenya comme en Ethiopie, les petits producteurs laitiers ont vu leurs revenus annuels augmenter de façon sensible et atteindre une certaine stabilité grâce à l’utilisation de l’eau agricole pour étancher la soif de leurs vaches. Qu’il s’agisse d’eau courante ou d’eau récoltée, l’approvisionnement continu en eau potable a réduit le coût de la main d’œuvre qui était prévue pour aller en chercher, et augmenté la production de lait et le nombre des animaux, ce qui a pour résultat une augmentation du revenu familial. Partant du principe que les résidus de cultures sont des sous produits agricoles, leur utilisation comme fourrage permet d’augmenter la rentabilité des investissements dans le domaine de la production agricole pluviale et irriguée. Cette étude donne à entendre qu’en mettant au point un système d’irrigation, il est important d’évaluer le rôle de l’élevage dans l’entreprise familiale et de comprendre à quel point la rentabilité des investissements dans le domaine de l’eau agricole renforcera ou réduira les revenus provenant des différents types de systèmes d’élevage.

ILRI: February 2006 8
La production agricole à prédominance d’élevage se fait souvent assez loin des marchés où les modes de subsistance sont limités. Il y a deux possibilités d’améliorer les pratiques traditionnelles de l’élevage grâce aux investissements dans le domaine de l’irrigation. Les périmètres irrigués de Gezira et des zones environnantes font partie d’une chaîne complexe de marchés permettant aux éleveurs de prendre part au marché car les résidus de cultures en provenance de ces périmètres sont utilisés pour engraisser les animaux qui ont maigri pendant leur long acheminement vers le marché de Khartoum. Une répartition équitable des bénéfices provenant des investissements est possible grâce à l’intégration des acteurs ruraux au processus d’aménagement lors de la mise en place des grands périmètres irrigués. Une telle démarche pourrait favoriser la conception des périmètres irrigués, ce qui permettrait aux éleveurs de disposer d’eau en saison sèche et d’utiliser les résidus des cultures comme fourrage. Sans ce type d’aménagement, l’utilisation de l’eau pour l’irrigation peut priver les éleveurs de fourrage et de ressources en eau. De plus, le fait d’investir au niveau des sites d’irrigation ayant un emplacement stratégique et qui sont bien gérés dans les zones de pâturage ou il existe un surplus de fourrage peut contribuer à compenser la perte des ressources des éleveurs due à l’irrigation intensive et à l’agriculture pluviale dans les autres régions. En plus des nombreuses possibilités d’améliorer la rentabilité des investissements dans le domaine de l’eau agricole grâce à l’intégration systématique de l’élevage et de l’utilisation de l’eau aux systèmes de production agricole irriguée, pluviale avec élevage associé, il est nécessaire d’adopter des approches plurisectorielles visant à atteindre les Objectifs de Développement du Millénaire relatifs au respect de l’environnement . Une meilleure gestion commune de l’eau, des sols, des cultures et de l’élevage par des moyens tels que les techniques de labour améliorées, le système des terrasses et la gestion de la matière organique, permet d’obtenir des sols plus humides favorables aux cultures et peut réduire l’envasement des canaux d’irrigation en aval. L’intégration de la gestion de l’eau et de l’élevage serait particulièrement utile dans les systèmes de production agricole pluviale avec élevage associé en région montagneuse. Dans tous les systèmes, de meilleurs soins vétérinaires permettraient d’augmenter la rentabilité des animaux produits grâce à l’eau agricole et de réduire les risques pour la santé des humains. Les analyses économiques à partir du système d'irrigation de Gezira au Soudan, du basin de la rivière Awash en Ethiopie et des systèmes d'irrigation à Laikipia, Kenya démontrent que l'intégration de la production animale au sein des systèmes d'irrigation peut être profitable pour les familles paysanes. Les revenus générés ne sont pas simplement dûs à l'utilisation des résidus de récolte, des sous-produits et du fourage irrigué. Plutôt, la conversion de ces aliments de faible valeur en produits animaux de grande valeur tel que le lait offre souvent un revenu et des marges bénéficaires plus grands que dans les entreprises basées seulement sur l'agriculture irriguée. En plus, les paysans apprécient la diversification des sources de revenu, l'opportunité d'un revenu étalé sur toute l'année et la fumure qui contribue au maintien de la fertilité du sol. Cette étude montre enfin que l’investissement dans les domaines de l’eau et de l’élevage permet de maintenir les capacités d’augmenter la rentabilité, d’obtenir une répartition équitable des bénéfices ainsi que des résultats plus durables. Le bétail constitue l’un des principaux biens que les familles amassent dans leur lutte pour sortir de la pauvreté. L’investissement dans le domaine de l’eau agricole conçu pour réduire la pauvreté serait plus efficace si la politique d’irrigation contribuait aussi à protéger les ressources animales. Si les besoins des éleveurs et de leurs animaux ne sont pas pris en considération, cela peut entraîner une baisse de la rentabilité des investissements, avoir une incidence négative sur l’environnement et causer une augmentation de la transmission des maladies d’origine animale aux humains.
INTRODUCTION 4.1 Crops, livestock and people depend on agricultural water. SIWI, IFPRI, IUCN and IWMI (2005)
state that a balanced human diet of 3000 kcal/day requires three to four m3 of water per day or 70 times that needed for household use. However, SIWI also states that water requirements to produce one kg of grain-fed beef and poultry require at least 15 m3 and about 5 m3 respectively, but grains, pulses, and root crops require less than two m3/kg produced. Such figures have led many policy-makers and investors to conclude that animal production should be discouraged because it uses too much water in a water scarce world. Given the need for agricultural water

ILRI: February 2006 9
development in Africa to produce more food and to contribute to poverty reduction, there is need to ensure that livestock keeping contributes to these two development goals rather than constraining them. This paper examines opportunities for making investments in agricultural water in Sub-Saharan Africa (SSA) more effective through integration of livestock keeping and production practices into agricultural water management. The intent is to increase overall returns on investments in agricultural water and to ensure sustainability of water resources developed for agricultural purposes. The premise is that in poor African household enterprises, crops and livestock are both integral components on which human wellbeing depends and that investments in agricultural water to enhance yield and profitability of crops will affect and be affected by livestock keeping within the farming systems.
4.2 Agricultural water is vital for livestock, but poorly managed animals can degrade water
resources. Domestic animals provide food for people, manure, traction and transport essential to farm production, income generation through sale of animal products, and a means to help overcome drought and seasonal food deficits. They provide an effective livelihood-based pathway out of poverty for the rural poor, particularly in areas having good access to markets (Thornton et al., 2002). Evidence suggests that integrating investments in agricultural water with livestock will benefit both sectors and lead to overall improvements in livelihoods and decreased poverty. Ignoring this option often leads to lost opportunities for benefits, contamination of agricultural water resources, degradation of irrigation infrastructure and conflict especially between pastoralists and farmers.
4.3 Sub-Saharan Africa will undergo dramatic and dynamic changes over the next 20 to 30 years.
Driving this change are two major forces. First, the human population will increase by more than 50%, and much of this growth will concentrate in urban areas. Second, the global development community is committed to achieving the MDGs of halving poverty and hunger levels and ensuring environmental sustainability by 2015. Structural change associated with rapid increases in livestock production and demand provides good opportunities for reducing poverty and hunger through increased investments in livestock development, but this will require substantial quantities of agricultural water to produce feed. Ensuring that currently poor farmers and herders benefit from this development process rather than lose access to water resources requires investments in agricultural water that enable an optimal mix of crop and livestock based enterprises. Effective and sustainable integrated water, soil, crop and livestock management of what the ECA (2001) calls the population-agriculture-environment nexus is needed.
4.4 This paper focuses on opportunities to enhance investment returns in agricultural water through
integration of livestock into production systems by considering three issues. The first is the development context of the dynamic livestock sector including the anticipated rapid growth in demand for animal products that are transforming the livestock sector and placing increased demand on agricultural water resources. The second is a continent-wide spatial analysis of the current and projected distribution of livestock with implications for related pressure on water resources and investment options that better integrate agricultural water and livestock development. Thirdly, this paper suggests a set of water-livestock investment strategies and options that can help guide planners toward more effective use of water and more beneficial animal production.
METHODOLOGY 4.5 This report is the outcome and summary of a literature review and a series of case studies (Peden
et al., 2004), GIS-based spatial analyses of livestock, water and people and in Africa, and synthesis to highlight key issues and generate suggested strategies and options for agricultural water investment to help improve the impact of both water and livestock development on poverty reduction in Africa.
4.6 Agricultural water is a loosely defined term. Lacking a generally accepted definition, this paper follows the spirit of the description given by the journal, Agricultural Water Management, that states: “The scope includes such diverse aspects as irrigation and drainage of cultivated areas,

ILRI: February 2006 10
collection and storage of precipitation water in relation to soil properties and vegetation cover; the role of ground and surface water in nutrient cycling, water balance problems, exploitation and protection of water resources, control of flooding, erosion and desert creep, water quality and pollution both by, and of, agricultural water, effects of land uses on water resources, water for recreation in rural areas, and economic and legal aspects of water use. Basic soil-water-plant relationships (are) considered only as far as is relevant to agricultural water management.” We have explicitly accepted that livestock are major users of agriculture water.
4.7 To develop a brief Africa-wide overview of livestock interactions with agricultural water, we combined individual species into tropical livestock units (TLU) where one TLU is 250 kg of live animal weight, and each individual has been assigned a TLU value Table 1 (FAO, 2004). The data presented refer collectively to cattle, sheep, goats, equines and camels. They do not include swine and poultry partly because of lack of good data. In future, these two will, nevertheless become more important in meeting projected and rapidly rising urban demand for meat. Both of these species also hold promise for reducing poverty near market centres because poor farmers can acquire a few animals and raise them profitably in almost landless households.
Table 1: Tropical Livestock Unit (TLU) equivalent for livestock species used in this study with poultry and swine not included and where one TLU equals 250 kg live animal weight.
Species TLU/head Species TLU/head Species TLU/head Cattle 1.0 Horse 0.8 Camel 1.4
Sheep or goat 0.11 Donkey 0.5 Mule 0.7 Note: Assuming the average person weighs, 60 kg then one person equals about 0.25 TLU.
Stratification of Africa 4.8 Based on available datasets for Africa, a stratification of Sub-Saharan Africa into water-livestock
investment domains (WLD) was developed. WLDs represent the overlay or cartographic intersection of farming system types, physical access to markets, water availability and the human population in 2000. This stratification forms a framework for identifying opportunities for investments in integrated water-livestock development. Because cartographic data used in theses analyses were available for all of Africa, we did not limit the spatial analyses to Sub-Saharan Africa, the focus for this investment study.
4.9 The farming systems description differentiates between livestock-dominant production (grazing areas) with little or no cropping and mixed crop-livestock systems that can be sub-divided into rainfed and irrigated areas. Public domain data from diverse sources and available at ILRI were used and these data are available for future use. Physical market access for SSA was described by cost-distance analysis, and it represents the physical access to towns with a population of more than 50,000 in the year 2000. The physical access in terms of weighted time units was calculated on the basis of land cover, slopes and transport routes. An additional travel time cost was taken into account at national boundaries, since these act as barriers to travel.
4.10 The human population estimates to 2030 were based on 2004 figures from the Centre for International Earth Science Information Network to match country-level projections according to the UN medium estimates, but with some spatial modelling within countries, to take account of market demand.
4.11 For water availability, river basin values from the FAO Atlas of Water Resources and Irrigation in Africa were used. The values for Internally Renewable Water Resource (IRWR) and Natural Inflow (NI) were added up and combined into a “Discretionary Surface Water” raster dataset. IRWR represents the sub-basins contribution to the overall runoff of the major basin and is actually the difference between precipitation and actual evapotranspiration or the "surplus" rainfall that either infiltrates to recharge aquifers or runs off into rivers. It is calculated using a model that takes into account precipitation, reference evapotranspiration, and soil moisture

ILRI: February 2006 11
storage capacity. This so-called “surplus” was then routed through the river basins and natural inflow calculated.
4.12 Making the stratification useful required limiting the number of WLD classes, and this in turn requires simplifying the number categories in the input spatial data sets. An expert working group agreed on the following classes for input data, but we recognized that these are somewhat subjective choices:
• Farming systems: a) rainfed agriculture highly dominated by livestock with little or no cropping; b) mixed crop-livestock production in rainfed areas, and c) mixed crop-livestock production in mixed large-scale irrigation schemes. Mixed large-scale irrigation was defined as pixels from the spatial data that had more than 10% of the land as irrigated command areas within livestock producing areas only. Small-scale household and community based irrigation and some mid-size irrigation systems will fall under the mixed rainfed crop-livestock system. Thus, these analyses may differ from the recently published IWMI Global Map of Irrigated Area, 1999 (IWMI 2004) that singles out some areas classified as irrigation mosaic.
• Market access: a) “Good” with travel time the nearest market centre less than 60 weighted time units and b) “bad” with travel time greater than 60.
• Human population density: a) “High” or greater than 50 people/km2, and “low” with less than 50 people/km2.
• Discretion water availability: a) “High” with more than 300 mm/year equivalence, and “low” with less than 300 mm/year equivalence.
Ranking priorities of countries and WLDs for investments in water and livestock 4.13 With these four criteria and classes, there are 24 possible WLD. Consultation with peers
reached a consensus that six factors could be feasibly used to assess the importance of the WLDs in terms of the potential benefit that would come from integrating investments in agricultural water with livestock development. These are:
• The extent of land area for each WLD, • The number of TLU, • The density of TLU calculated by dividing the Number of TLU by the extent of land area
for each WLD, • The human population size LU, • The human population growth rate estimated by back-calculating rates that would bring
about the projected change in population from to 2000 to 2030, and • The number of poor livestock keepers classified as poor according to the World Bank poverty
rate; i.e., they fall below their home country-defined poverty line (Thornton et al, 2002). 4.14 Fifty African countries were ranked six times, once for each of the foregoing criteria. An overall
ranking was obtained by calculating the simple sum of the six ranks. We recognize that other criteria could have been chosen and that weightings on each criterion could have been assigned, but this was not done because there was no clear advantage for doing so. Similarly, the WLDs were also ranked according the same criterion and procedure. We also recognized that many livestock live outside the defined WLD areas especially in urban environments. This study did not address the issues of urban agriculture in detail, but it is growing in importance.
4.15 Stratifying Africa has some limitation. Country-country differences in data collection, accuracy and precision vary. The results will be most reliable at describing trends over large areas. For small areas, results should be used with caution and there will be a need for more detailed local assessments prior to making specific investments. This study integrates livestock across Africa using the TLU concept, but this masks the fact there are significant within species, inter-breed variation in animal weights and the nature of their use of and impact on water resources. This study did not look at wildlife producing areas or include wildlife in TLU estimates.

ILRI: February 2006 12
Case studies 4.16 The case studies are described in detail in Peden et al. (2004). They were conducted in Ethiopia,
Sudan and Kenya, countries that contain areas representing all major WLD (Table 2), have about one third of Africa’s domestic animals and include a wide range of agro-ecologies and production systems. Thus, they go along way toward representing the range of many of conditions found in the WLDs. Nevertheless, investors and development personnel are advised to assess local conditions, issues and priorities as part of future planning processes.

ILRI: February 2006 13
Table 2: Case studies showing links (“X”) to major production systems
Relevant production system * Mixed crop-livestock Livestock-
dominant Urban
Location Case study
Irrigated Rainfed Ethiopia - Afar Pastoralists’ emergency relief X Ethiopia - Awash Fasciolosis & irrigation X X X Ethiopia - Borana Plateau Wealth savings X Ethiopia - Rift Valley Households & community X Ethiopia - Tigray Water harvesting & livestock X X X Ethiopia -Koka Siltation: Koka dam X X X Kenya - multi-district Water for dairying X X Kenya -Laikipia New Mutaro irrigation X X Sudan - Gezira Gezira large-scale irrigation X X X Sudan - Khartoum Urban livestock X X Sudan - Khordofan & Darfur Rain-fed livestock X X * Although most case studies were conducted in specific sites or production systems, lessons learned are often
relevant to other production systems and WLDs because animals may move from one to another. Nevertheless, individual production systems may have unique roles to play in the market chain for animals and livestock products that span two or more WLDs.
Note: Case study details, except Ethiopia Rift Valley and Kenya - New Mutaro are given in Peden et al. (2004).
DEVELOPMENT CONTEXT 4.17 Human population growth in Africa drives increasing demand for food production meaning that
the latter must grow at a rate of 6% per year from now until 2030 to provide for not only the future increase in mouths to feed, but also to overcome current food shortages (FARA 2003). Achieving food security requires yield increases of 62%, higher cropping intensities of 13%, and expansion of cropland by 25% (FAO 2003). Historically, most agricultural water development strategies to feed the future population ignored the important roles livestock play in contributing high quality food products to human diets and in providing animal power for crop production that enhances food security. Frequently, they also overlook the need to mitigate the negative impact of irrigation development on pastoralists’ livelihoods caused by loss of vital dry season watering and grazing areas. Similarly, livestock development has given little attention to its use of and impact on water resources. This section highlights key issues of human demography, increasing demand for livestock products, the impact of livestock-related degradation of land and water resources and the use of water by livestock in Africa.
Human population and income growth 4.18 The number of people in Africa continues to grow at about 2.5% per year (Table 3) (World
Bank, 2004) and at this rates doubles every 16 years while GDP is increasing at 3.2 %/year. The SSA urban population growth rate is about 5% per annum, and the number of urban dwellers has increased from 23% in 1980 to 34% in 2000 (World Bank, 2004). To meet growing urban demand for food, production of vegetables, melons and livestock products (Table 4), is rising rapidly. Income growth, particularly among the rising urban middle class, correlates with changing consumption patterns that are driving the demand for high value products including processed foods such as meat, milk, and other dairy products. On the supply side, liberalization of agricultural trade and globalization drive changes in the agri-food economy with easier access to imported foods. The rapid rise of supermarkets in developing countries, including many areas in sub-Saharan Africa, also provides new opportunities for poor rural and peri-urban people to participate in dynamic markets (Weatherspoon and Reardon, 2003).

ILRI: February 2006 14
Table 3: Annual growth rates (%) of population, urban population, and GDP
Rural + urban Urban GDP Region 1975-1984
1985-1994
1995-2004
1975-1979
1980-1990
1990-2002
1975-1984
1985-1994
1995-2004
Africa – All 2.9 2.7 2.4 4.5 4.5 4.1 3.3 2.0 3.5 Sub-Saharan Africa 3.0 2.8 2.5 5.0 4.9 4.7 2.3 1.7 3.2 Source: The World Bank’s African Development Indicators, 2004
Table 4: Production Growth Per Capita in Developing Countries, 1975-2001.
Crops % Per annum
Livestock products
% Per annum
Cereals 0.4 Milk 1.7 Vegetables & melons 3.4 Pork 4.0 Poultry 5.9 Source: FAO Data files 2003
Demand for livestock products 4.19 Livestock production, particularly poultry and pork, has had one of the fastest growth rates in the
agricultural sector in developing countries over the past 25 years (Table 4). By 2020, livestock will comprise about 30% of the value of global agricultural output making it one of the most important agricultural sectors in financial terms (de Haan et al., 2001). Projections of trends in the livestock sub-sector (Table 5) suggest that by 2020 consumption of meat will grow by 3.5% per annum and milk by 3.8% per annum in SSA (Delgado et al., 1999) while production will grow by 3.4 and 4.0% respectively. At this high rate of growth, per capita consumption in SSA will still be only about one third of the level expected in developed countries and remain below that anticipated for other developing areas of Asia and Latin America. Projected production trends predict that annual growth of meat production will increase by 3.4 % and milk production by 4.0 % (Delgado et al., 1999) (Table 4).
Table 5: Projected trends in meat and milk consumption and production, 1993-2020. Projected % annual growth 1993-2020
Total in 2020 (Million metric tons)
Per capita in 2020 (Kg/year)
Region
Meat Milk Meat Milk Meat Milk Consumption: W. Asia & N. Africa 2.8 3.0 15 51 24 80 Sub-Saharan Africa 3.5 3.8 12 31 11 30 Developing world 2.8 3.3 188 391 30 62 Developed world 0.6 0.2 115 262 83 189 World 1.8 1.7 303 654 39 85 Production: W. Asia & N. Africa 2.5 2.6 11 46 18 72 Sub-Saharan Africa 3.4 4.0 11 31 10 30 Developing world 2.7 3.2 183 401 29 63 Developed world 0.7 0.4 121 371 87 267 World 1.8 1.6 303 772 39 100 Source: Delgado et al., 1999

ILRI: February 2006 15
Increased demand for water 4.20 The anticipated rapid increase in consumer demand that will motivate increased supply of animal
products to urban markets and lead to correspondingly great increases in water use by the livestock sub-sector. Managing this demand for additional water for livestock products dictates a need to integrated livestock development with investments in agricultural water development.
Degradation and conservation of water and land resources 4.21 Environmental degradation is both a cause and a result of poverty in Africa. Major concerns
include loss of arable and grazing land, declining soil productivity, loss of biodiversity, pollution and depletion of fresh water resources. “Because of poverty, many farmers are incapable of making intensive agriculture that requires significant inputs or to undertake other soil improvement investments. The only alternative for them is to use the soil until it is completely degraded. … The degraded environment produces less food, makes biomass fuel scarcer, reduces ecosystem resilience, and renders people malnourished and more susceptible to diseases” (ECA 2001). Annual cropping is a primary cause of land and water degradation, especially in high rainfall mountainous areas prone to excessive run-off, soil loss and sedimentation (Hurni, 1989). Soil lost from farmers’ fields in Ethiopia’s Awash River basin reduced electrical generation capacity of the country’s largest integrated water development scheme by 30% (Berhe, 2004 and Eyasu, 2003)) and irrigation potential is threatened. Sudan’s Gezira irrigation scheme has experienced serious decline in irrigation capacity due to siltation (Peden et al., 2004). Poor animal husbandry aggravates land and water degradation especially where limited feed constrains animal production and farmers feed too much crop residue to their animals thereby decreasing the positive affect residues have on soil and water conservation. Figure 1 qualitatively describes livestock-related risk based on the convergence of slope, soil texture, annual rainfall, tree-cover, and estimated livestock densities for 2000 and 2030. Serious land degradation is most likely to occur in Sudan, Nigeria and higher elevations of East Africa, especially Ethiopia.
4.22 Well-planned integration of livestock with water resource development can mitigate the impacts of livestock-related land degradation. For example, land degradation adjacent to irrigation infrastructure contributes to the degradation of and reduced returns on investments. Better upslope management of soil reduces downslope siltation and damage to irrigation infrastructure by reducing run-off and soil erosion and increasing infiltration and retaining soil. An integrated approach to land and water management will not only improve upslope rainfed production, but also protect downslope agricultural water. The key is to minimize exposure of the soil to erosive rainfall. Conservation tillage, terracing and maintaining vegetative ground cover soil organic matter can greatly help. Limiting animal grazing on crop stubble and limiting removal of crop residue for consumption by zero-grazed animals can also contribute to soil and water conservation. Conservation tillage enables retention of water in farmers’ fields and increases on-farm production. It also reduces the demand for animal power, and thus the number of oxen farmers need. With fewer animals required, demand for animal feed is less. Much of the manure that animals produce could also be returned to the soil to help retain moisture, but farming households need alternative energy sources. Providing socially acceptable and affordable fuel can enable soil and water conservation that will have many benefits including protection of downslope agricultural water resources. Opportunities exist in mixed rainfed crop-livestock systems to integrate investments in development of agricultural water and crop and livestock production more efficiently and beneficially than isolated separate investment in these individual agricultural sub-sectors.

ILRI: February 2006 16
Figure 1: Livestock-related threat of degradation of land and water resources in 2000 and projected to 2030 indicating areas where extra care may be needed to ensure that livestock keeping practices do not cause lower than expected returns on investments in agricultural water. [Source: ILRI, 2004]
4.23 Land-use is dynamic as one form of agriculture replaces another. In planning the expansion of
irrigation, there is great need to factor into financial feasibility studies the costs imposed on displaced livestock keepers and the damage that livestock keeping can subsequently do to water resources (Peden et al., 2004). Not doing so will likely reduce overall returns on such investments.
Livestock in Africa and their use of and impact on agricultural water 4.24 Livestock production typically makes up about 10-30% of African agricultural GDP
(OAU/IBAR, 2003) and more than half in some African countries (e.g., Sudan and Somalia). This excludes the non-market value animals provide such as traction and transport that are essential for producing food crops and moving them to markets and consumers. With the human population in Africa expected to grow by more than 50% over the next 20 years, investments to increase food production must correspondingly follow. Livestock products make up an important and rapidly increasing share of diets in Africa (Table 5), and water is a vital input for animal production. Already, food production uses more than 70% of managed water in developing countries. Achieving a 50% increase in food production with the same amount of water is not possible without increasing water use efficiency. Because of the current importance and the higher rate of growth of livestock production, there is a great need to factor livestock production into planning for water resource development. Most of the scientific literature on water use by livestock in Africa focuses on drinking water (Seleshi et al., 2003; Peden et al., 2003), but this amounts to about one percent of the water animals require. In contrast water used to produce feed can account for up to 99% of the water used by animals. A few studies (e.g., Goodland and Pimental, 2000) consider the feed dimension of water use, but this usually focuses on industrialize livestock production in developed countries and is not relevant to the currently African context. As countries become more industrialized, livestock can use up to half of all agricultural water, and there is growing interest in using waste water for feed production. A crucial knowledge gap exists in understanding the role of livestock in overall water use and the efficiency of water use in livestock production. Animal production needs to be part of the solution and not the problem.

ILRI: February 2006 17
4.25 Assuming that agricultural water is allocated specifically for the purpose of producing animal feed, then total livestock use of water will be as much as 100 times greater than that needed for drinking alone (Peden et al., 2003). In grazing systems, feed production depends on rainwater that is often unavailable directly to meet other human needs although its use by animals may affect ground water recharge, flooding and important ecosystem services and hydrology. However, crop residues are produced as by-products of crop production, and their use as animal feed does not require much, if any, additional water in excess of what the crop alone would have used. A key challenge and opportunity for adding value to investments in rain and irrigation water is to develop strategies of how, when and where to produce animal feed derived from crop residues. Increasing use of crop residues for animal feed and shifting feed sourcing to land unsuitable for rainfed crop production may be part of the solution. Experience from northern Ethiopia demonstrates that farmers often choose to plant low-value maize rather than high-value cash crops such as tomatoes because they also place high value on having quality crop residue to feed to their animals. In some cases, farmers choose to irrigate high quality forage crops such as alfalfa because of high demand for dairy products and opportunities to fatten sheep or cattle make the enterprise profitable. The trade-offs between using irrigation water for forage production and food crops must be considered including selection of crops that have high value as animal feed the potential for marketing of animals and animal products. Furthermore, strategic investments in watering points for livestock can help spread grazing pressure to areas where feed production does compete with human food production. Balanced and selected investment in water supply for livestock drinking may complement investment in water development for production of human food and animal feed.
4.26 Apart from the importance of animal production in African agriculture and food production, poorly managed livestock contribute to water contamination, degradation and depletion. Undesirable interactions of livestock with water resources aggravate the unacceptably low health standards of many Africans. Part of the solution to improved planning, development and management of water in Africa may be achieved through investment in better livestock keeping practices that are consistent with maximizing sustainable return on investments in future water resource development. Livestock grazing and watering along the edges of water bodies such as rivers and dams leads to removal of riparian vegetation, increased sedimentation, contamination of domestic water with zoonotic parasites and may create environments more favourable for mosquitoes that transmit several serious diseases especially malaria. However, there are often relatively simple ways to alleviate some of these threats. For example, Atwill et al. (2002) showed that three-metre wide buffer strips were 99.9% effective in filtering Cryptosporidium from agricultural run-off suggesting that this simple investment in water management could greatly reduce a ubiquitous human parasite that is a significant factor in people’s capacity to cope with HIV.
Conflict – impact of agricultural water development on pastoralists 4.27 As “pastoralists migrate they move over large areas of grazing land. They may use land and a
water source once a year and return the next year to find that it has been taken over by farmers who have viewed the land as unused”). “In mixed villages where pastoralists are in a minority, … pastoralists are often excluded from … development activities”. … “It is very clear that livelihoods and land use impact strongly on water projects, and without a very good understanding of all the issues, implementers of interventions can actually make things worse for marginalized, vulnerable people” (WaterAid, 2003). Africa-wide, experience shows that investments in agricultural water development often lead to conflict because the needs of livestock keepers were not addressed.
SPATIAL ANALYSES OF LIVESTOCK AND WATER 4.28 Dynamic changes are taking place related to continued human population growth, urbanization,
rapid increases in demand for livestock products, and increasing competition for the water and land resources on which livestock production and human well being depend. Given the twin challenges of ensuring that development investment contributes to poverty reduction and that overall benefits exceed financial and other costs, strategic targeting of locations and options for

ILRI: February 2006 18
investment is needed. This is true for investments in agricultural water and livestock sector development. Taking a continent-wide approach to understanding opportunities for effective improvements in water development that takes into account the reality that livestock are present in and around many irrigation systems and that livestock elsewhere depend on significant amounts of water requires an analyses of where livestock are important and where access to water they need is limited. Key criteria selected to assess the potential for investment in agricultural water to promote livestock sector growth were the population (size, density and distribution), the distribution of key livestock production systems, market access and the available discretionary water (Figure 2).
4.29 Human population density is one of the most important correlates of livestock keeping – domestic animals are numerous wherever there are many rural people in Africa. High and low human densities were defined as greater and less than 50 people/km2 respectively.
4.30 Livestock production systems occur in a broad band extending from Senegal eastward to Somalia and south to South Africa and again westward to Namibia and Angola. Significant populations also occur in North Africa along the shores of the Western Mediterranean, along the Egyptian Nile, and in Madagascar. There are four basic production systems. These are:
• Extensive livestock-dominated areas where there is little opportunity for crop production, • Mixed rainfed crop-livestock agriculture where livestock form an integral part of African
livelihood strategies and provide diverse benefits in terms of goods and services, • Mixed large-scale irrigated areas that are cover a small area in Africa but are often have high
animal densities. • Urban or industrial livestock production that is not addressed in detail in this paper.
About half of Africa’s land area is not suitable for livestock production especially in extremely dry areas of the Sahara and humid regions of the Congo Basin where animal disease is problematic.
4.31 Profitable investment in agricultural water and livestock depends on access to markets. Thus market access was chosen as a criterion for defining WLDs. “Good (market) access” refers to good physical access to market centres having at least 50,000 people but modulated by physical barriers such as national boundaries that restrict the passage of goods and people. Market access was calculated on the basis of land cover, slopes, and transport routes. The national boundaries were considered to act as significant barriers to travel and as such integrated into the calculations.
4.32 High and low available discretionary surface water refers to greater and less than 300 mm of rainfall equivalence respectively and is based on the sum of the Internally Renewable Water Resource Natural Inflow extracted (FAO, 2004). This available discretionary water is indicative of the potential for developing agricultural water from surface supplies, but does not take into account options for using ground water.
4.33 The cartographic intersection of human population, livestock production systems, market access and available water resulted in identification of an initial Africa-wide set of water-livestock investment domains (WLDs) shown in Figure 3. The following paragraphs describe how these WLDs are distributed in Africa and suggest domains where better integration of water and livestock development may warrant high priority and areas where this may be less important.
Overview of Water-livestock Domains in Africa 4.34 Africa encompasses about 50 countries including the offshore ones of Madagascar and Comoros
(Table 6). The total area is about 30 million km2, but only 54% or about 16 million km2 appear to be important for livestock production. About 627 million people, about 80% of Africa’s population in 2000, resided in these WLDs (Figure 3). Some animals reside within non-WLD areas because producers can import feed. Sudan, South Africa, Ethiopia and Nigeria contain about a quarter of Africa livestock producing land and are the most important in terms of area devoted to livestock production. Western Sahara does not include any area considered suitable for livestock production while the Comoros was so small it has been excluded from further consideration.

ILRI: February 2006 19
Figure 2: Simplified classifications of agriculture production systems, market access, available discretionary
water and human population density used to generate water-livestock investment domains (WLDs). In some WLDs, opportunities may exist for integrated investment and development that will be more effective and provide greater returns than is likely from investing in agricultural water alone to support crop production. Good and poor market access refers to physical access to markets based on travel time. Areas not included in the farming systems include Forest, mountain, wetlands, and some industrialized agricultural and urban areas. Livestock may exist outside of the “farming systems”, but these will be supported largely by import of animal feed. Mixed irrigated systems are defined in GIS terms as pixels that have at least 10% of their area occupied by irrigated fields (command area) and that also contain significant livestock production. Some irrigated land in Africa does not fall within livestock areas while many small to mid-sized irrigation systems, particularly those supported by water harvesting will fall under mixed rainfed crop-livestock systems.

ILRI: February 2006 20
Figure 3: Sixteen water-livestock investment domains identifying where carefully targeted opportunities may exist for investing in integrated agricultural water and livestock development in Africa. High and low discretionary surface water refers to greater and less than 300 mm of rainfall equivalence respectively. “LS”, “MR”, and “MI” refer to livestock-dominant, mixed rainfed crop-livestock and mixed irrigated production systems respectively. “Good (market) access” refers to good physical access to markets having a population of at least 50,000 people but modulated by physical barriers such as national boundaries that restrict the passage of goods and people. High population refers to areas with average human densities exceeding 50 people/km2. Market access was calculated on the basis of land cover, slopes, and transport routes. The national boundaries were considered to act as significant barriers to travel and as such integrated into the calculations.

ILRI: February 2006 21
Table 6: List of African countries showing area and % cover of water-livestock investment domains (WLDs) and the human population in 2000 living within them. WLDs are ranked from top left to lower right according the total area described by a WLD.
WLD area 2000 Human pop. in WLDs
WLD area 2000 Human pop. in WLDs
Country
Million km2
% of country
Millions % of country
Country
Millionkm2
% of Country
Millions % of country
Sudan 1.442 57 23.572 76 Ghana 0.206 86 14.692 74 South Africa 1.126 92 36.725 84 Uganda 0.191 79 20.473 85 Ethiopia 0.992 87 55.5 88 Senegal 0.18 91 7.049 72 Nigeria 0.854 94 100.243 87 Mauritania 0.141 14 1.071 40 D.R. Congo 0.744 32 25.048 49 Egypt 0.119 12 60.69 83 Angola 0.74 59 7.374 56 Benin 0.112 96 4.749 77 Namibia 0.681 82 1.405 73 Congo 0.104 30 1.634 49 Chad 0.651 51 7.425 92 Malawi 0.077 65 10.059 84 Tanzania 0.621 66 25.064 69 Eritrea 0.073 61 3.055 84 Zambia 0.618 82 8.941 85 Gabon 0.072 27 0.28 22 Mali 0.602 48 10.523 92 Liberia 0.062 65 1.649 54 Mozambique 0.583 74 12.985 71 Tunisia 0.062 40 7.088 74 Somalia 0.566 89 7.787 88 Togo 0.056 98 3.907 87 Botswana 0.559 97 1.53 99 S. Leone 0.053 73 2.845 64 C. Afr. Rep. 0.552 89 2.726 76 Libya 0.037 2 2.076 39 Kenya 0.507 87 23.434 74 Lesotho 0.03 100 2.004 100 Niger 0.459 39 10.466 94 G. Bissau 0.027 78 0.847 71 Madagascar 0.453 76 11.543 72 Burundi 0.021 79 5.524 85 Zimbabwe 0.378 96 11.443 91 Rwanda 0.02 80 6.421 82 Cameroon 0.3 64 12.007 80 Swaziland 0.014 82 0.742 81 Burkina Faso 0.274 99 11.461 99 Eq. Guinea 0.009 32 0.14 31 Ivory Coast 0.264 82 11.307 68 Gambia 0.009 80 0.801 61 Guinea 0.228 93 7.132 88 Djibouti 0.007 32 0.416 68 Algeria 0.223 10 20.493 67 Comoros 0 10 0.042 6 Morocco 0.209 51 21.253 71 W. Sahara 0 0 0.001 0 Sub-total within WLDs 16.305 54 625.642 78 Sub-total within non-WLD areas 13.673 46 180.058 22 Africa-wide total 29.978 100 805.700 100
Livestock and human populations within WLDs by country 4.35 Table 7 summarizes the estimated human and livestock population (TLUs) by country within the
WLDs and excludes consideration of the non-WLD areas. The WLDs have a total stock of about 250 million TLUs, and a third of these (80 million TLU) are found in Sudan and Ethiopia alone while 60% are found within Sudan, Ethiopia, Nigeria, Tanzania, Somalia, South Africa and Kenya. The human population within the WLDs is about 627 million people and this will rise to about 1.1 billion by 2030. Forty-three percent (273 million people) live within the WLDs of the seven countries having the highest animal stocking level. Africa wide, there are about 140 million poor livestock keepers (defined by Thornton et al., 2002) in the WLDS and about half of these are also found in the seven countries having the highest stocking rates. With the exception of South Africa, these seven countries all have high human population growth rates

ILRI: February 2006 22
with Nigeria and Ethiopia expected grow at 2.4 and 2.0 %/year and to reach about 183 and 113 million people to feed by 2030. All the human and animal population figures in Table 7 refer only to people and livestock residing within the WLDs and do not take into account 180 million Africans who dwell elsewhere (Table 6).
Livestock and human populations within WLDs by country 4.36 Table 7 summarizes the estimated human and livestock population (TLUs) by country within the
WLDs and excludes consideration of the non-WLD areas. The WLDs have a total stock of about 250 million TLUs, and a third of these (80 million TLU) are found in Sudan and Ethiopia alone while 60% are found within Sudan, Ethiopia, Nigeria, Tanzania, Somalia, South Africa and Kenya. The human population within the WLDs is about 627 million people and this will rise to about 1.1 billion by 2030. Forty-three percent (273 million people) live within the WLDs of the seven countries having the highest animal stocking level. Africa wide, there are about 140 million poor livestock keepers (defined by Thornton et al., 2002) in the WLDS and about half of these are also found in the seven countries having the highest stocking rates. With the exception of South Africa, these seven countries all have high human population growth rates with Nigeria and Ethiopia expected grow at 2.4 and 2.0 %/year and to reach about 183 and 113 million people to feed by 2030. All the human and animal population figures in Table 7 refer only to people and livestock residing within the WLDs and do not take into account 180 million Africans who dwell elsewhere (Table 6).
Priority countries and WLDs for water-livestock investment 4.37 Numerous subjective criteria exist by which countries could be ranked in terms of priority for
investment within the WLDs. We used six shown in Table 7. They include extent of the WLDs with in the country (km2), TLU population, TLU density, human population in 2000, estimated human population growth rate from 2000 to 2030, and the number of poor livestock keepers in 2000. Collectively, these criteria take cognizance of the current importance of livestock-based livelihoods and the development challenge of meeting the needs of hundreds of millions of people, most of whom are poor and many of whom are poor livestock keepers. Priorities must also balance the absolute number of poor (that tend be greatest in large countries) with the human density that can be very high in small countries. The possible rankings for individual criteria range from 1 to 48 for the highest to lowest rank or importance respectively. The overall ranking is based on the simple sum of these 6 individual criteria (Table 8). Countries with large animal populations and high animal densities have the highest demands for water for livestock. Ethiopia, Nigeria and Sudan top this priority list. However, some countries of lower priority may have important local areas where water-livestock investment may be warranted. Nevertheless, investments in agricultural water in these countries may realize increased benefits by pursuing opportunities to enhance impacts and returns through integrating animal requirements for water and the impacts livestock may have on water resources. The countries at the top of this list are likely to be ones where investments in agricultural water can most benefit from including provision for the presence and production of livestock.
4.38 The same ranking criteria used for prioritizing countries (Table 8) were used to establish relative
importance of the WLDs on an African-wide basis. With two classes each of market access (good or bad), human population density (high or low) and available discretionary water (high or low) along with three basic livestock production systems, there are 24 possible combinations that can be used to describe the water-livestock development regions for Africa (Figures 2 and 3). We have called these WLDs. Sixteen WLDs contain more than 96% each of the land area, population, poor livestock keepers and TLUs and tend to have relatively high animal densities. (Table 9). This paper does not address the other 8 WLDs because the Africa-wide spatial analyses used herein are not sufficiently reliable to reliably assess very small areas.

ILRI: February 2006 23
Table 7: Human and livestock populations in WLDs within African countries ranked in decreasing order by TLU*
Countries with WLDs
TLU (Millions)
WLD Area (km2)
WLD density (TLU/km2)
WLD People 2000 (Millions)
Human pop. growth
(%/year) A
Poor Livestock Keepers 2000
(Millions)B
Sudan 45.937 1.442 31.9 23.572 1.6 6.040Ethiopia 34.405 0.992 34.7 55.500 2.4 16.140 Nigeria 19.539 0.854 22.9 100.243 2.0 22.310 Tanzania 15.709 0.621 25.3 25.064 1.6 7.680 Somalia 14.545 0.566 25.7 7.787 3.4 3.110 South Africa 13.153 1.126 11.7 36.725 -0.1 8.690 Kenya 12.449 0.507 24.6 23.434 1.0 5.700 Mali 8.112 0.602 13.5 10.523 3.2 3.050 Chad 7.569 0.651 11.6 7.425 2.7 3.310 Burkina Faso 6.874 0.274 25.1 11.461 3.0 3.570 Madagascar 6.266 0.453 13.8 11.543 2.5 4.020 Zimbabwe 5.388 0.378 14.3 11.443 0.0 1.750 Niger 5.292 0.459 11.5 10.466 3.5 4.520 Uganda 5.108 0.191 26.8 20.473 3.4 5.020 Cameroon 4.769 0.300 15.9 12.007 1.3 3.320 Morocco 4.532 0.209 21.7 21.253 1.1 0.000 Senegal 3.803 0.180 21.2 7.049 2.0 1.890 Egypt 3.669 0.119 30.9 60.690 1.6 0.000 Angola 3.159 0.740 4.3 7.374 2.6 2.050 Botswana 2.867 0.559 5.1 1.530 0.0 0.650 Namibia 2.659 0.681 3.9 1.405 0.8 0.750 Zambia 2.517 0.618 4.1 8.941 1.2 4.610 C. African. Rep. 2.440 0.552 4.4 2.726 1.5 1.000 Algeria 2.436 0.223 10.9 20.493 1.2 0.000 Eritrea 2.262 0.073 30.9 3.055 2.6 0.960 Ghana 1.677 0.206 8.2 14.692 1.7 3.070 Tunisia 1.608 0.062 25.8 7.088 0.9 0.000 Guinea 1.385 0.228 6.1 7.132 2.1 1.750 Lesotho 1.119 0.030 36.8 2.004 -0.8 0.740 Benin 1.074 0.112 9.6 4.749 2.2 0.950 Ivory Coast 0.813 0.264 3.1 11.307 1.2 2.750 Democratic R 0.811 0.744 1.1 25.048 2.5 6.320 Rwanda 0.775 0.020 38.3 6.421 1.9 1.930 Malawi 0.746 0.077 9.7 10.059 1.9 3.040 Mauritania 0.709 0.141 5.0 1.071 2.5 0.130 Mozambique 0.586 0.583 1.0 12.985 1.3 3.450 Swaziland 0.532 0.014 37.4 0.742 0.3 0.230 Guinea Bissau 0.451 0.027 17.0 0.847 3.1 0.240 Togo 0.405 0.056 7.2 3.907 2.1 0.970 Burundi 0.354 0.021 16.5 5.524 2.5 1.240 Sierra Leone 0.335 0.053 6.3 2.845 2.2 1.290 Djibouti 0.319 0.007 46.2 0.416 1.6 0.070 Gambia 0.247 0.009 28.7 0.801 1.5 0.110 Liberia 0.049 0.062 0.8 1.649 2.9 0.470 Libya 0.049 0.037 1.3 2.076 1.4 0.000 Congo 0.032 0.104 0.3 1.634 2.9 0.290 Gabon 0.019 0.072 0.3 0.280 1.5 0.160 Eq. Guinea 0.003 0.009 0.3 0.140 2.3 0.040 WLD TOTAL 249.555 16.305 15.3 625.642 1.9 139.380 * See section 4.6.4; One TLU (Tropical livestock unit) is 250 kg of live animal weight and integrates the numbers of cattle, sheep, goats, equines, camels into one index. A) Human population growth rates are those estimated to prevail from 2000 to 2030. B) Livestock keepers are classified as poor according to the World Bank poverty rate (i.e., they fall below their home country-defined poverty line; see Thornton et al, 2002).

ILRI: February 2006 24
Table 8: African countries having WLDs ranked according to importance for key livestock and human demographic indicators.
Integrated ranking* Extent of WLD area
TLU TLU Density
Human Pop. 2000
Human pop. growth
No. of poor livestock keepersA Country Rank
Sudan Sudan Djibouti Nigeria Somalia Nigeria Ethiopia 1 S. Africa Ethiopia Swaziland Ethiopia Niger Ethiopia Nigeria 2 Ethiopia Nigeria Rwanda Egypt Uganda S. Africa Sudan 3 Nigeria Tanzania Lesotho Uganda G. Bissau Tanzania Somalia 4 D.R. Congo Somalia Ethiopia D.R. Congo Mali D.R. Congo Tanzania 5 Angola S. Africa Sudan Tanzania B. Faso Sudan Uganda 6 Namibia Kenya Egypt Sudan Congo Kenya B. Faso 7 Chad Mali Eritrea S. Africa Liberia Uganda Mali 8 Tanzania Chad Gambia Kenya Chad Zambia Niger 9 Zambia B. Faso Uganda Morocco Angola Niger Chad 10 Mali Madagascar Tunisia Algeria Eritrea Madagascar Madagascar 11 Mozambique Zimbabwe Somalia Niger Madagascar B. Faso S. Africa 12 Somalia Niger Tanzania B. Faso Burundi Mozambique Kenya 13 Botswana Uganda B. Faso Mali D.R. Congo Cameroon D.R. Congo 14 C.A.R. Cameroon Kenya Ghana Mauritania Chad Angola 15 Kenya Morocco Nigeria Madagascar Ethiopia Malawi Cameroon 16 Niger Senegal Morocco Somalia Eq. Guinea Somalia Senegal 17 Madagascar Egypt Senegal Mozambique Benin Mali Egypt 18 Zimbabwe Angola G. Bissau Cameroon Senegal Ghana Eritrea 19 Cameroon Botswana Burundi Malawi Gambia Ivory Coast Zambia 20 B. Faso Namibia Cameroon Ivory Coast Nigeria Angola Ghana 21` Ivory Coast Zambia Zimbabwe Chad Togo Rwanda Morocco 22 Guinea C.A.R. Madagascar Angola Guinea Senegal Zimbabwe 23 Algeria Algeria Mali Senegal Malawi Guinea Malawi 24 Morocco Eritrea S. Africa Zambia Gabon Zimbabwe Rwanda 25 Ghana Ghana Chad Guinea Rwanda S. Leone Guinea 26 Uganda Tunisia Niger Burundi Djibouti Burundi Mozambique 27 Senegal Guinea Algeria Rwanda Ghana C.A.R. Benin 28 Mauritania Lesotho Malawi Zimbabwe Tanzania Eritrea Burundi 29 Egypt Benin Benin Benin Sudan Togo C.A.R. 30 Benin Ivory Coast Ghana Tunisia Egypt Benin Ivory Coast 31 Congo D.R. Congo Togo Togo Libya Namibia Algeria 32 Malawi Rwanda S. Leone Eritrea C.A.R. Lesotho G. Bissau 33 Eritrea Malawi Guinea C.A.R. Mozambique Botswana Namibia 34 Gabon Mauritania Botswana Congo Morocco Liberia Botswana 35 Tunisia Mozambique Mauritania Liberia Cameroon Congo Togo 36 Liberia Swaziland C.A.R. S. Leone Ivory Coast G. Bissau Mauritania 37 Togo G. Bissau Angola Libya Algeria Swaziland Tunisia 38 S. Leone Togo Zambia Mauritania Zambia Gabon Lesotho 39 Libya Burundi Namibia G. Bissau Namibia Mauritania Gambia 40 Lesotho S. Leone Ivory Coast Namibia Kenya Gambia Congo 41 G. Bissau Djibouti Libya Lesotho Tunisia Djibouti Djibouti 42 Burundi Gambia D.R. Congo Botswana S. Leone Eq. Guinea Liberia 43 Rwanda Liberia Mozambique Gambia Swaziland Egypt Swaziland 44 Swaziland Libya Liberia Swaziland Botswana Libya Sierra Leone 45 Gambia Congo Eq. Guinea Djibouti Zimbabwe Morocco Gabon 46 Eq. Guinea Gabon Congo Gabon S. Africa Algeria Libya 47 Djibouti Eq. Guinea Gabon Eq. Guinea Lesotho Tunisia Eq. Guinea 48 * Overall integrated ranking is based on the simple sum of the individual ranks for each criterion. A) Livestock keepers are classified as poor according to the World Bank poverty rate (i.e., they fall below their home country-defined poverty line; see Thornton et al , 2002).

ILRI: February 2006 25
Table 9: Africa-wide summary of the most important 16 WLDs first classified by production system and within these ranked according to overall priority from highest to lowest importance.
Production system
Market access
Human pop. density
Avail. Discr. water
Rank Area (km2) (Millions)
TLU (Millions)
TLU per Km2
Human Pop. 2000 (Millions)
Est. % human growth
No. Poor Livestock Keepers (Millions) D
Good High Low 13 0.067 3.06 45.8 31.5 1.3 0.19 Good High High 14 0.028 2.14 75.4 36.04 1.6 0.03 Mixed
irrigated Sub-total 0.095 5.20 54.6 67.53 1.5 0.22
Good High Low 1 1.360 46.28 34.0 218.15 1.8 29.23 Good High High 3 0.580 12.41 21.4 99.41 2.1 15.31 Good Low Low 4 1.708 30.89 18.1 43.40 1.7 23.89 Bad High Low 5 0.246 9.02 36.7 27.01 2.0 6.47 Bad Low Low 7 1.469 17.03 11.6 19.50 1.8 13.16 Bad High High 8 0.151 5.31 35.2 16.94 2.2 4.01
Good Low High 10 0.593 8.02 13.5 16.15 1.9 9.39 Bad Low High 11 0.731 5.42 7.4 11.70 2.1 8.36
Mixed rainfed
Sub-total 6.838 134.38 19.7 452.27 1.9 109.82 Bad Low Low 2 5.323 53.46 10.0 32.24 2.2 13.75
Good Low Low 6 1.774 28.12 15.8 24.00 1.8 7.05 Bad Low High 9 1.387 9.71 7.0 13.77 2.2 4.63
Good Low High 12 0.457 6.22 13.6 7.88 2.0 1.88 Good High Low 15 0.114 3.62 31.8 13.59 1.6 0.60 Good High High 16 0.034 1.75 51.2 5.08 1.9 0.20
Livestock-dominant
Sub -total 9.090 102.88 11.3 1.77 2.0 1.77 Eight marginal WLDs with minimal SSA-wide importance >16 0.283 7.09 19.9 104.08 1.3 27.43 WLD sub-total 16.305 249.56 15.3 625.65 1.9 139.24 Others 13.673 31.82 2.3 180.06 1.7 10.44 TOTAL 29.978 281.38 9.4 805.70 1.8 149.82 *) WLDs are ranked with highest ones at the top of the Table with ranking based on the simple sum of rank scores for each criterion. #) Physical market access: “Good” if travel time to market is less than 60 weighted time units but conditioned by transportation networks, terrain and permeability of national boundaries. A) Human population density: “High” if > 50 and “Low” if < 50 people/km2. B) Available discretionary surplus water: “High” if > 300 mm and “Low” if < than 300 mm rainfall equivalent. C) See section 4.8.5. The top ten WLDs dominate in terms of the land area covered and the numbers of people and poor livestock keepers, and TLU numbers and density within them. D) Livestock keepers are classified as poor according to the World Bank poverty rate (i.e., they fall below their home country-defined poverty line; see Thornton et al , 2002).
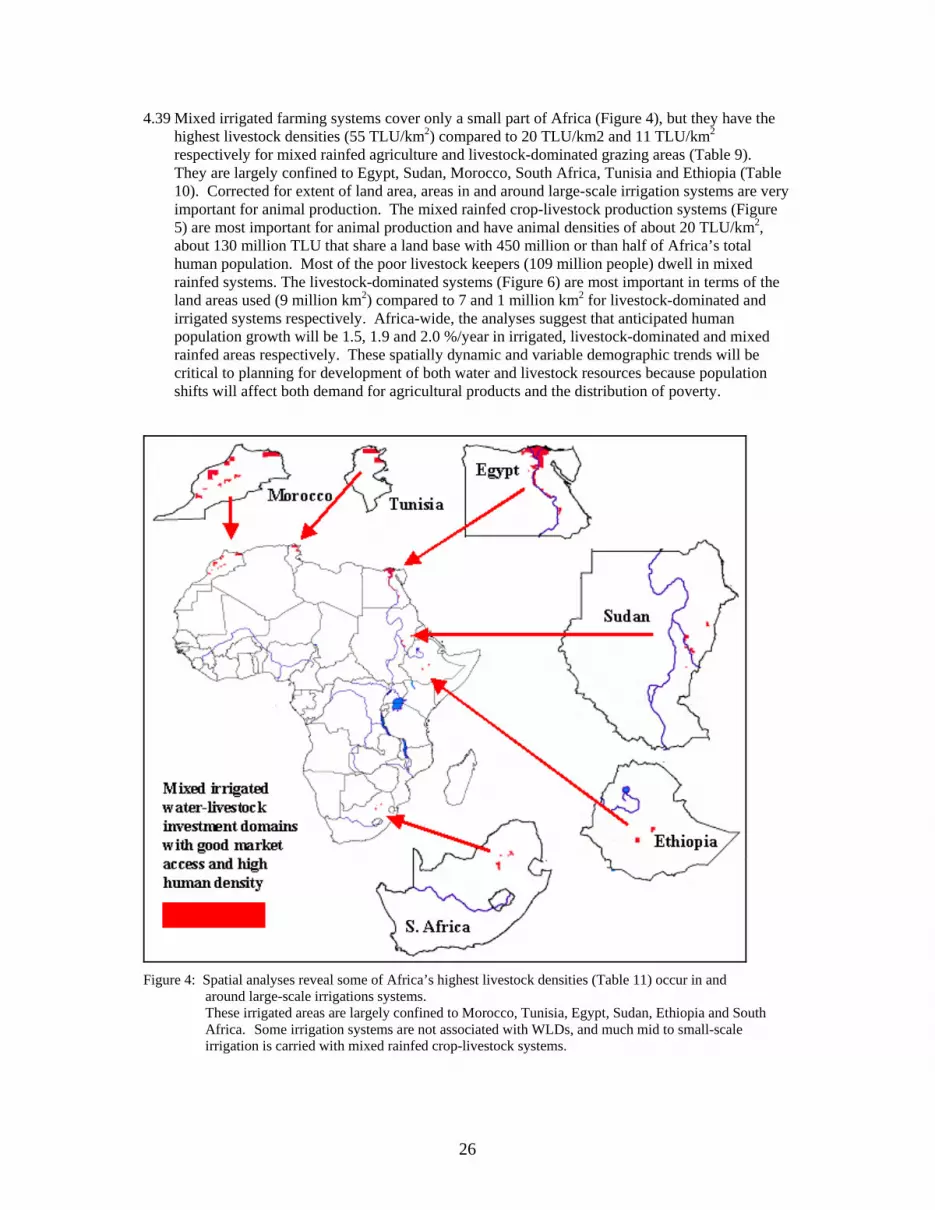
26
4.39 Mixed irrigated farming systems cover only a small part of Africa (Figure 4), but they have the
highest livestock densities (55 TLU/km2) compared to 20 TLU/km2 and 11 TLU/km2 respectively for mixed rainfed agriculture and livestock-dominated grazing areas (Table 9). They are largely confined to Egypt, Sudan, Morocco, South Africa, Tunisia and Ethiopia (Table 10). Corrected for extent of land area, areas in and around large-scale irrigation systems are very important for animal production. The mixed rainfed crop-livestock production systems (Figure 5) are most important for animal production and have animal densities of about 20 TLU/km2, about 130 million TLU that share a land base with 450 million or than half of Africa’s total human population. Most of the poor livestock keepers (109 million people) dwell in mixed rainfed systems. The livestock-dominated systems (Figure 6) are most important in terms of the land areas used (9 million km2) compared to 7 and 1 million km2 for livestock-dominated and irrigated systems respectively. Africa-wide, the analyses suggest that anticipated human population growth will be 1.5, 1.9 and 2.0 %/year in irrigated, livestock-dominated and mixed rainfed areas respectively. These spatially dynamic and variable demographic trends will be critical to planning for development of both water and livestock resources because population shifts will affect both demand for agricultural products and the distribution of poverty.
Figure 4: Spatial analyses reveal some of Africa’s highest livestock densities (Table 11) occur in and
around large-scale irrigations systems. These irrigated areas are largely confined to Morocco, Tunisia, Egypt, Sudan, Ethiopia and South Africa. Some irrigation systems are not associated with WLDs, and much mid to small-scale irrigation is carried with mixed rainfed crop-livestock systems.

27
Table 10: Association of livestock with large-scale irrigation A based on large-scale Africa-wide spatial analyses
Country Market access
Human density
Area (Thousand
km2)
TLUX 1000 TLU per km2
No. People 2000
(Thousands)
Poor Animal Keepers
(Thousands) Egypt Good Low 54 758 14.0 1,019 0 Good High 37 2,567 68.6 54,174 0 Good Low + High 91 3,324 36.4 55,193 0 Bad Low 20 5 0.2 41 0 Bad High <1 0 0.0 26 0 Bad Low + High 20 5 0.2 68 0 Country total 111 3,329 30.0 55,260 0 Sudan Good Low 43 2,893 68.0 674 178 Good High 8 557 71.5 1,021 33 Good Low + High 0 0 - 0 0 Bad Low 16 602 38.6 131 48 Bad High 0 0 0.0 0 0 Bad Low + High 16 602 38.6 131 48 Country total 177 7,381 41.7 57,086 260 Morocco Good Low 14 30 2.2 310 0 Good High 28 839 30.1 4,144 0 Good Low + High 0 0 0.0 0 0 Bad Low 15 71 4.7 265 0 Bad High 3 61 18.1 206 0 Bad Low + High 18 132 7.1 471 0 Country total 60 1,001 16.7 4,925 0 S. Africa Good Low 35 296 8.5 455 237 Good High 7 142 21.8 4,439 93 Good Low + High 41 438 10.6 4,894 330 Bad Low 8 27 3.4 5 5 Bad High <1 1 23.3 21 <1 Bad Low + High 8 28 3.5 26 5 Country total 49 466 9.5 4,921 335 Tunisia Good Low 3 26 10.2 91 0 Good High 10 414 40.1 2,782 0 Good Low + High 13 440 34.2 2,873 0 Bad Low <1 <1 0.1 1 0 Bad High 0 0 0.0 0 0 Bad Low + High <1 0 0.0 1 0 Country total 13 440 33.9 2,875 0 Ethiopia Good Low 0 0 - 0 0 Good High 5 681 131.0 957 103 Good Low + High 5 681 131.0 957 103 Bad Low 0 0 0 0 Bad High 1 109 113.2 141 20 Bad Low + High 1 109 113.2 141 20 Country total 6 790 128.2 1,098 123 Algeria B Country total <1 1 8.4 13 0 TOTAL 305 10,079 33.00 70,918 718 A) GIS analyses at the continental scale defined large-scale irrigation as pixels having at least 10% of the land areas
under irrigation. This picks up key countries but leaves out smaller schemes known to exist in countries such as Uganda and Kenya. These data are valid for assessing continent-wide trends, but more detailed study is needed at local and regional levels.
B) Algeria’s irrigation area in Africa-wide data sets was negligible and details were not included in this table.

28
Figure 5: Distribution of mixed rainfed (MR) crop-livestock WLDs in Africa. High and low discretionary surface water refers to greater and less than 300 mm of rainfall equivalent respectively. Good and poor market access are greater and less than 60 travel time equivalents (minutes) respectively. High and low human densities are greater and less than 50 people/km2 respectively. These WLDs have been extracted from the map shown in Figure 3. These eight WLDs contain about 134 million TLU with the “low” surface water areas most likely to benefit most from integrated water-livestock development.

29
Figure 6: Distribution of Livestock-dominated WLDs in Africa where grazing practices are most prevalent. High and low discretionary surface water refers to greater and less than 300 mm of rainfall equivalent respectively. Good and poor market access are greater and less than 60 travel time equivalents (minutes) respectively. High and low human densities are greater and less than 50 people/km2 respectively. These WLDs have been extracted from the map shown in Figure 3. These eight WLDs contain about 103 million TLU. Some of these areas could benefit from strategic provision of drinking water as part of irrigation development, and herders maybe at risk if irrigation development restricts traditional uses of pastoralists’ dry season water and feed resources.

30
Correlation of agricultural intensification, human populations and livestock density
4.40 Spatial analyses for WLDs in Africa build on data shown in Table 9 to highlight the fact that in Africa the highest animal densities are associated with irrigation (Table 11). Average densities were 11.3 19.7, and 54.6 TLU/km2 in livestock dominant, mixed rainfed and mixed irrigated systems respectively when estimated using 16 priority WLDs (Table 10). Because irrigation occupies a small fraction of the land area of Africa, the percent of the continental herd in irrigated areas is small. However, stakeholders planning to invest in agricultural water need to take into account evidence that either livestock numbers will increase in and around irrigated areas, or they will already be present and therefore affected by irrigation development. The highest animal densities (75.4 TLU/km2) occur in irrigated areas with good access to market and high human population densities. The lowest estimated densities (9.7 TLU/km2) were in livestock-dominant and mixed rainfed production systems with poor market access and low human population densities. This suggests a convergence of factors leading to increased animal numbers where there is likely to be the greatest potential for a positive return on investments in irrigation. Given the central role of livestock in livelihoods for many poor African, investments in agricultural water will need to ensure that interactions between livestock and water development contribute to improved lives for the poor.
4.41 In the three production systems, animal densities were higher in WLDs with good market access compared to poor access and in high human density ones compared to low density WLDs (Table 11). Continent wide, there were 22 TLU/km2 in WLDs with good market access compared to 11 TLU/km2 in poor market access areas. WLDs, Animal densities were 33 and 12 TLU/km2 in WLDs with high and low human densities respectively. These analyses confirm that animals are or tend to become more numerous and dense in areas with intensified agriculture. To the extent that irrigation represents a high degree of intensification, livestock production and herd sizes will likely be greater in areas with irrigation development.
Table 11: TLU density (TLU/km2) for all WLDs summarized by human population, market access, and available discretionary water for each production system
Production system Criteria Criteria class Mixed irrigated Mixed rainfed Livestock
dominant
Weighted mean*
Bad 14.0 A 14.1 9.7 10.9 Market access
Good 38.7 23.0 16.7 21.8 High 45.1 31.2 38.8 33.0 Human population
density Low 26.1 A 13.6 10.9 12.1 High 54.9 15.2 9.5 13.8 Available
discretionary water Low 16.3 21.6 12.1 16.1 Weighted mean 32.4 19.7 11.3 * Means weighted according total area covered by the criteria in the left hand column. A) Irrigated area within with bad market access and low population was so small that comparison with other
cells in table may not be very reliable.

31
Water for drinking and feed production 4.42 Most assessments of livestock use of water have focused on drinking water (e.g., Seleshi et al.,
2003 and King 1983), and typically livestock use about 25 l/TLU/day. In practice, water intake by animals varies greatly and depends on many factors including prevailing weather, activity levels, amount of feed consumed, lactation, and salinity of water. Water consumption can double, and it is common in planning for water needs of livestock in Africa to budget for 50 l/TLU/day. Wherever, animals must trek long distances to find drinking water, herders reduce watering frequency to every 2 or three days. Resulting water stress reduces animal production. Providing continuous water increases animal growth, efficiency of feed conversion, and milk production (Stahl et al 2001; Muli, 2000). In the context of investing in irrigation development, providing infrastructure to supply drinking water will increase animal feed conversion efficiency and thus animal productivity. In turn, this can lead to higher rates of return on the relatively small additional investment in drinking water that becomes part of an integrated irrigation development strategy.
4.43 Agricultural water used for feed production is much greater than drinking water consumed by animals. As a baseline, livestock ingest about 2% of their live body weight (5 kg/TLU/day) in terms of dry matter intake to meet basic maintenance requirements in a thermo-neutral setting. This does not include additional energy demands associated with thermoregulation, reproduction, parasite infection, growth, and walking. With all of these included, food intake can double to about 10 kg/day/TLU of dry feed (Sonder et al., 2005). Assuming that one m3 of transpired water generates 4 kg of dry feed; water for feed production will vary between the maintenance levels of about 450 to about 900 m3/year or about 1200 to 2400 l/day. Thus the transpiration depleted in using animal feed is about 50 times greater than what animals drink.
4.44 Transpiration is not the only form of depleted water associated with feed production. Water evaporates from plant and soil surfaces. Some estimates suggest that evaporation can be up to six times more than transpiration, particularly in heavily grazed areas with little vegetative cover (Sonder et al., 2005 and Palmer, 2000). In irrigated and rainfed pastures, it is important to maintain complete vegetative cover to ensure that as much water as possible is depleted through productive transpiration rather than non-productive evaporation. A key requirement is to limit grazing pressure to levels that does not reduce plant cover.
4.45 Integrating livestock production into investment planning for agricultural water development can significantly help reduce water-related constraints to feed production, particularly in mixed rainfed and irrigated production systems where that contain the majority of Africa’s domestic animals. Water used to produce crops, in many cases leaves behind crop residues. Using crop residues for animal feed requires little or no extra water than that required by the crop alone. In areas where there is good market access, planning investments in agricultural water can integrate the value of livestock and livestock products that will be generated by the use of crop residues for feed – an additional and valued outcome of some irrigation systems. The scientific literature lacks information on the relative amounts of crop residue and other feed crops animals consume in Africa’s diverse production systems, and more research on this is needed. Understanding this will be needed to fully assess the efficiency with which domestic animals use agricultural water and to come up with investment strategies to maximize the return on investments in it.
4.46 To maximize the animal productivity made possible by production of crop residues and by-products in irrigated and rainfed systems, an integrated approach may require effort to increase the nutritional value of these feed resources through measures such as improved feed storage, silage, and application of urea to increase feed digestibility (Elzaki 2005; Merghani 2005).
4.47 In many areas of Africa, livestock are used for traction and transport and thus essential for crop production. On heavy clay soils, humans cannot easily plough their land. The cost of fuel-dependent machines is prohibitive particularly in areas without access to markets. Animals also provide manure that helps replenish soil fertility. Without these services, crop production suffers. Water drunk or used for feed by animal is actually a vital input for crop production.

32
Agricultural investment planning that does not satisfy the water requirements of farmers’ animals may limit returns because of failure to meet farmers’ needs for animal-based inputs to crop production.
4.48 Tables 12 and 13 respectively summarize water requirements for producing livestock feed in major animal producing countries and in the top 16 WLDs shown in Figure 3. Across the WLDs, water for feed amounts to at least 112 m3/year to maintain cattle, sheep, goats, camels and equines and could be as high as 224 billion m3/year to enable maximum animal production. On this basis, Sudan, Ethiopia, Nigeria, and Tanzania are likely to be the largest consumers of water for livestock in Africa using up to 21, 15, 9 and 7 billion m3/year respectively. Livestock in mixed large-scale irrigated, mixed rainfed and livestock-dominated areas require about 2.3, 60, and 46 billion m3/year to satisfy feed production to meet animal maintenance needs. This can double to more than 200 billion m3/year if animals are producing well, an amount about twice the reported sub-Saharan Africa water withdrawal of 97 billion m3 for agriculture and three times greater than that for irrigation (FAO, 2004). Because most of this water is “consumed” on rainfed lands, many professionals involved in developing agricultural water see this as being irrelevant to them. However, the impact of grazing over large areas can have major impacts on hydrology at watershed and river basin scales and thereby affect the quality, quantity and distribution of seasonal flows of water elsewhere. In addition, using relatively small amounts of water made available from within irrigation, water harvesting and ground-water systems for watering animals and for feed production has the effect of leveraging more efficient use of adjacent rainfed pasture production thereby reducing animal related demands for feed from irrigated and rainfed croplands.
Table 12: Estimated water required for producing feed to meet maintenance requirements* of livestock in the major livestock producing countries and WLDs in Africa.
Country TLU (Millions)
Water for maintenance* feed
Country
TLU (Millions)
Water for maintenance* feed
(Billion m3) Sudan 46 21 Somalia 15 7 Ethiopia 34 15 South Africa 13 6 Nigeria 20 9 Kenya 12 6 Tanzania 16 7 Mali 8 4 Sub-total 171 77 Remaining Countries 86 39 TOTAL within WLDs 250 112 Total transpired if water used is double maintenance level 224
* Maintenance feed is the minimum required to meet basic metabolic needs but excludes energy required for keeping warm or cool, walking, working, growth, reproduction and lactation. Actual feed consumed may be up to double maintenance levels. Water needed to produce maintenance feed is about 450 m3/year/TLU.
4.49 Water used for feed production can come from either rainfed or irrigated feed production. Three
important strategies can reduce this demand for water. These are de-stocking, importing feed (virtual water) and using crop residue for feed. From a production perspective, many African livestock are poor producers so that more are kept than would otherwise be necessary. Experience in diverse systems suggests that replacing larger numbers of poor producing animals with more productive ones could lead to reduced demand for and use of water. In some water-scarce areas, importing animal feed may be more beneficial than locally producing feed. As noted, water consumed in feed production accounts for most the water used by livestock in Africa. In mixed rainfed crop-livestock systems, Farmers already use much residue for feed in mixed systems, and may have reduced water consumption for animal production accordingly by a significant but as yet un-quantified amount. Perhaps, the prime opportunity for integrating livestock development with investments in agricultural water lies in maximizing the value added

33
that comes from supplemental crop production with production of high value and marketable animal products using crop residues for which little or no additional water is needed.
4.50 The average person weighs about 65 kg, but this varies according to many factors such as the number of children and nutrition in the population. Thus, one average person is equivalent to approximately 0.25 TLU so that Africa’s population of 627 million people in WLDs is approximately 155 million TLU or only about 60% of the livestock TLUs. Because livestock feed is less digestible than most human foods, people’s food intake requirements are less than that of animals. Assuming that agricultural water (rain and irrigation water) is allocated to production of animal feed and human food separately, more water will be used to satisfy animal dietary needs than human requirements. Thus, it is not surprising that maintaining Africa’s domestic animals requires at least as much water as that withdrawn for human food production.
Table 13: Estimated water required for producing feed to meet maintenance requirements* of livestock in the sixteen major WLDs in Africa.
Production system
Market access
Human population
density
Available discretionary
water
TLU (Millions)
Water for maintenance*
feed (Billion m3)
Good High Low 3.06 1.4 Good High High 2.14 1.0
Mixed irrigated
Sub-total 5.20 2.3
Good High Low 46.28 20.8 Good High High 12.41 5.6 Good Low Low 30.89 13.9 Bad High Low 9.02 4.1 Bad Low Low 17.03 7.7 Bad High High 5.31 2.39
Good Low High 8.02 3.6 Bad Low High 5.42 2.4
Mixed rainfed
Sub-total 134.38 60.5 Bad Low Low 53.46 24.1
Good Low Low 28.12 12.7 Bad Low High 9.71 4.4
Good Low High 6.22 2.8 Good High Low 3.62 1.6 Good High High 1.75 0.8
Livestock-dominated
Sub -total 102.88 46.3
TOTAL 242.46 109.1 Total transpired if water used is double maintenance level 218.2 * Maintenance feed is the minimum required to meet basic metabolic needs but excludes energy required for
keeping warm or cool, walking, working, growth, reproduction and lactation. Actual feed consumed may be up to double maintenance levels. Water needed to produce maintenance feed is about 450 m3/year/TLU.
Inter-WLD boundaries 4.51 Integrated planning must recognize that WLDs are not isolated islands. Rather they interact, and
the boundaries between them are dynamic zones of change. This is particularly true given that livestock, unlike crops, move. They can spend part of their lives in one WLD and then move to another as in the case of the market chain linking pastoralist Western Sudan to the Gulf States (Salih, 1985 and Peden et al., 2004). In addition, a particular location may evolve through agricultural intensification from a livestock-dominant, to mixed rainfed and, where feasible, finally to large-scale irrigation. The transition process creates conflict in which marginalized

34
herders often lose access to their traditional livelihoods. Many cultural and socio-economic differences aggravated by inappropriate or inequitable land and water management policy can help sustain this conflict. Integrating the needs of livestock keepers with irrigation development or expansion of rainfed agriculture may identify and enable win-win options for multi-stakeholder use of sensitive areas subject to competing demands for water resources.
Summary of spatial analyses of water and livestock 4.52 About 250 million TLU of African livestock depend on water. Domestic animals are most dense
in areas with high human populations and particularly so in and around large-scale irrigation schemes. These animals have multiple purposes and are highly valued. Integrating animal water requirements into investments in agricultural water development will likely result in increased returns particularly in areas with good access to markets and where improvements in irrigated and rainfed farming produce crop residues that can enable additional value added production. In areas with good market access, investment opportunities may focus on improving cash income and profitability as a means to bring the poor out of poverty. In areas with poor market access, investments may have to put more emphasis on the sustainability of subsistence livelihoods. Some livestock-dominant grazing land that has low discretionary surface water may have ground water that could sustain well-managed livestock drinking. Across Africa, livestock use more internally renewable water than people do for agriculture especially when taking into account the amount of water used to produce animal feed. Based on preceding analyses of WLDs, the following section outlines some options that can promote better-integrated water and livestock development and provide greater overall returns to investments in agricultural water.
WATER LIVESTOCK INVESTMENT OPTIONS 4.53 Spatial analyses of water and livestock in Africa identified countries and regions where livestock
are important. Wherever they are numerous, animals depend on either rainfed or irrigated agricultural production. In terms of land area covered, the number of people, the number or poor livestock keepers and the TLU density, mixed rainfed crop livestock production systems are most important. The extensive livestock-dominated grazing lands of Africa are second in importance. Although in terms of land area covered, large-scale irrigation systems are least important, animal densities associated with them are the highest found in Africa suggesting that investments in irrigation are already sustaining significant livestock-based livelihoods. The tables that follow suggest investment options and strategies that draw on case studies (Peden et al., 2004) with specific reference to highest ranking WLDs for each of the irrigated, mixed rainfed and livestock dominant systems. Because livestock are not stationary, often moving from one WLD to another, and because of the anticipated expansion of cultivated area in Africa, the individual WLDS are inter-related. Investments or development in one will affect others driving a need for spatially integrated water and livestock development.
4.54 The recommendations made in this study are based on Africa-wide analyses and an overview of selected case studies. Integrating future investments in agricultural water and livestock development will require full community and household involvement to ensure that sweeping generalizations do not result in top-down imposition of development options on farmers.

35
Mixed large-scale irrigation with good market access, high human population 4.55 From a livestock perspective, irrigated WLDs are important because they often have good market
access and a high human population (Tables 9 and 14 and Figure 4) who demand animal products. These areas have many of the ingredients necessary for effective marketing of livestock products and have some of Africa’s highest livestock densities. The irrigation systems provide crop residues for feed that can support many animals outright or supplement grazing carried out in nearby areas. Evidence from Sudan and Kenya suggests that poor farmers and labourers increase and stabilize year-round income by inclusion of animals in their production systems. Also, animal often provide power needed for crop production and transport of crops to markets. There is a great opportunity to increase the profitability and sustainability of irrigation schemes by integrating livestock development and management within future investments to construct new irrigation schemes or rehabilitate old one. In developing irrigation, inclusion of non-irrigator stakeholders such as pastoralist has the potential reduce conflict and promote more equitable outcomes for all.
4.56 Key investment strategies and options include: • Assessing the potential contributions of farm animals to farming income and prosperity. • Providing drinking water at strategically located places to improve animal production,
make more efficient use of feed resources, reduce any animal-caused damage to irrigation infrastructure, and reduce contamination of community water resources. This option opens up opportunities for greatly increased milk production adding profitability to smallholders’ farm income.
• Providing appropriate veterinary services to prevent transmission of important water borne-diseases such as Fasciolosis that retard animal production and zoonoses such as cryptosporidium jeopardize human health.
• Considering the option of including irrigated feed or dual-purpose food-feed crops to provide animal feed. This includes crops such grains that provide food for people as well as leguminous rotational fallows that at one time re-build soil fertility and provide feed while at other times produced marketable crops. This feed can either be sold directly to external livestock keepers or sustain production of farmers’ draught and dairy animals. Farmers may also have the option of using irrigated residues for fattening animals for sale in nearby markets or establishing small ruminant or poultry production enterprises that can augment family income and nutrition. High quality feed produced under irrigation may enable farmers to make better use of nearby lesser quality feed so that combined use of irrigated and non-irrigated feed may lead to overall gains in animal production.
• Taking advantage of and valuing the potential of manure to replenish soil fertility. In some cases, evidence suggests that because animals resident in irrigations schemes also graze in adjacent lands, there is a net inflow of nutrients in the form of manure that can be applied to farmers’ irrigated fields.
• Collaborating with up-stream and up-slope users of natural resources (water, soil, vegetation, and animals) to establish mechanisms to stabilize water in-flow for irrigation schemes to reduce the risk of siltation of irrigation infrastructure. This will include, but not be restricted to livestock keeping stakeholders. Encouraging water users associations to expand their mandates to include management of non-water natural resources such as adjacent non-irrigated grazing land or forming partnerships with other stakeholder groups may be required.
• Assessing the potential beneficial and negative impact that irrigations rehabilitation and development will have on pastoralists who have traditionally used the areas or could do so in future.
• Considering the role that cattle in irrigated systems can contribute to mitigating the scourge of malaria through zooprophylaxy, the phenomenon whereby mosquitoes prefer to bit cattle more than people resulting in reduced malaria transmission (e.g., Aschwanden, 2005).

36
Table 14: Experience and investment options: Mixed large-scale irrigation, good market access, and high human population.
Priority countries
Experience Agricultural water investment options and strategies
Egypt, Morocco, Tunisia, Sudan, Ethiopia, & South Africa Case studies: Gezira, Sudan Koka dam, Ethiopia Irrigated dairying, Laikipia, Kenya
• Contains highest livestock densities in Africa. • High human population and good market access encourages livestock. In
Gezira, livestock products make up about 30% of tenants income, and 90% of the residents own animals.
• Livestock usually not considered in planning and development of irrigation infrastructure. Watering facilities often not included. Animals damage canals while attempting to drink from them.
• Irrigation often established in traditional pastoral areas. Herders’ access to dry season grazing and watering reserves frequently lost, and conflict generated. However, distant pastoralists may benefit if irrigation-produced crop residues close to market centres can help fatten animals and increase their selling price after they make the a long trek to sell their animals.
• Irrigation farmers and laborers increase holdings of livestock as assets and sources of animal power, nutrition & cash income.
• Animal diseases such as Fasciolosis & Crypotosporidum may increase particularly in dryland areas if animals have direct access to water bodies.
• Poor upstream land management causes siltation of reservoirs and canals accompanied by dry season water shortages and wet season flooding, and it also reduces irrigation capacity.
• Poor animal health and lack of adequate standards for food safety often limits market access.
• Animals often graze outside command areas and can bring manure into the irrigation system and contribute to soil fertility replenishment.
• Water users associations (or other community based institutions) lack capacity and mandate to undertake communal grazing and water management needed for effective collective action.
• Investment planning for large scale irrigation development or rehabilitation may realize greater sustainability and profitability by including livestock products as one of the output options and by better managing animals that will normally be kept in and around the schemes whether planned for or not. Considering livestock as one option from among a menu of livelihood choices will help avoid mistakes of the past. Not doing so opens up the high likelihood of experiencing future lost opportunities. However, each case must be judged on its own merit.
• Apart from meeting needs of irrigation farmers and laborers, irrigation development planning requires an assessment of the likely benefits and impact on pastoralists and their livelihoods.
• Provision of migration corridors and drinking water sites and adopting measures such as fencing that separate animals from canals and water bodies to reduce contamination and sedimentation.
• Provision of veterinary health services and marketing programs for livestock products. • Enable water users associations to develop strategies to limit livestock numbers,
allocate command area production to contribute to feed production (perhaps through use of crop residues rather than irrigated feed), and contribute to non-command area management necessary for livestock housing and supplementary grazing.
• Support better upstream land and water management particularly in Ethiopia and Sudan (Figure 3) to reduce sedimentation and flooding during dry seasons and improved water supply in dry seasons.
• Strategic planning to balance opportunities for feed export with opportunities for value added animal production.
• Large-scale irrigation can be part of a market chain also involving pastoral and urban systems and urban and international markets. Gezira, Sudan, is a good example of irrigation-produced crop residues enabling cattle from the remote western pastoral lands to reach urban and international markets.

37
Mixed crop-livestock rainfed production with good market access, high human population, and low available surplus water 4.57 This mixed crop-livestock rainfed system is the most important in Africa in terms of the 218
million people present with 29 million poor livestock keepers and high TLU numbers (46 million) and density (34 million TLU/km2) (Tables 9 and 15 and Figure 5). Farmers value domestic animals for many reasons. They are a store of assets, provide animal power and manure and enable increased enhanced year-round nutrition and, particularly in areas with good market access, income. Lack of feed typically constrains animal production, while farmers’ chore of taking animals long distances for watering further limits production. In efforts to feed animals, farmers often allow their animals to eat too much crop residue greatly aggravating land degradation that is closely associated with mixed rainfed crop-livestock farming systems. Much mixed rainfed farming is subject to chronic and periodic water stress making it necessary to investment in water development and conservation. In addition to constraints to animal production, farmers face many challenges in improving farm productivity. Such areas demand effective integrations of water, soil, crop, and livestock management given the shared goal of contributing to poverty reduction. Collaborative investments in this mixed crop-livestock system with good market access may provide one of the best opportunities to promote poverty reduction in Africa.
4.58 Key investment strategies and options include: • Collaborative and integrated promotion of community water harvesting. The case studies
clearly demonstrated that household and community water harvesting systems encourage animal production. In most cases, harvested water will not be used in large amounts for growing animal feed, but production of specialized high quality fodder can enable animals to make better use of low quality feed grown on adjacent rainfed lands.
• Supply of continuously available drinking water for livestock. Typically, 50 l/TLU/day is sufficient. With continuously available drinking water, farmers eliminate the time consuming chore of fetching water and the production-reducing stress animals experience from long treks. Farmers have demonstrated a willingness in Ethiopia to re-allocate their time to more productive and profitable activities such as converting low value perishable milk into high valued and more durable products such as butter. With less stress on animals, growth and milk production increase potentially enhancing farm income.
• Establishing watering points for animals that are physically separated from community and household reservoirs. Drinking troughs impose little additional cost to establishment of water harvesting systems, but confer many benefits to farmers including reduced contamination of domestic water, reduced transmission of water-borne livestock and zoonotic diseases, and reduce sedimentation caused by grazing and trampling on riparian vegetation.
• Promotion of conservation tillage especially upslope from agricultural water infrastructure. Benefits include increased and crop production, reduced need for so many draught animals, reduced run-off and infiltration, soil moisture and nutrient retention. Included here is the need to retain at least 20% of the crop residue in the fields as ground cover and mulch and to encourage use of manure for soil fertility replenishment rather than for fuel.
• Establishment of local institutions to manage common up-slope grazing and cultivated land to limit overstocking and downslope siltation.
• Along with the common priority of helping make farm inputs such as fertilizer and pesticides available for crop production, provision of veterinary services and drugs can similarly ensure overall increased productivity of farming enterprises based on developed agricultural water.
• Promotion of market opportunities for all products of mixed crop-livestock systems including high value animal products along with more traditional cash crops.

38
Table 15: Experience and investment options: Mixed rainfed agriculture with good market access, high human population and low available discretionary water. Priority countries
Experience Agricultural water investment options and strategies
Ethiopia, Kenya, Tanzania, S. Africa & Uganda Case studies: Water harvesting, Tigray Highland dairying, Kenya Koka Dam, Ethiopia Sasakawa water harvesting Ethiopia Irrigated dairying, Laikipia, Kenya
• This is the most important WLD in terms of the need for household and community water harvesting and irrigation systems (that are not included in the mixed large-scale irrigation systems), the 38 countries containing the WLD, and the numbers of people and poor livestock keepers and second most important for TLUs. Ethiopia clearly dominates this WLD with Kenya, Tanzania and South Africa also being important particularly in vulnerable steep land farming. With few NGO exceptions, integrated planning for water and livestock development has been lacking.
• Typical of mixed rainfed systems, TLU density is much higher than in livestock dominant systems. • Annual cropping associated with excessive animal consumption of crop residue causes much run-off and soil
loss and reduces ground water recharge. This reduces agricultural production in the WLD and also in different ones downstream such as irrigation in Gezira. Conservation tillage reduces the need for oxen and among other water savings greatly enable a reduction in the demand for household animal feed production.
• Household use much labour and subject animals to production-reducing stress associated with long treks to drinking water. Water harvesting freed up much labour and enabled farmers to apply human resources to more intensive farming, producing multiple crops, and value added processing of milk products (butter) increasing cash income from less than 50 to more than 1500 US$/year. Continent-wide, government sponsored community and household water harvesting projects have often ignored peoples’ demand for animals, their potential for increasing profitability, and their likely negative impact related to contamination of ponds and dams and degradation of adjacent riparian vegetation and soils.
• Feed shortages constrain farm production and livelihoods. Increasing human and animal densities requires alternatives to grazing for providing feed, and use of dual-purpose food-feed crops is common.
• Many bovines provide essential farm power. • Water-borne and zoonotic diseases are common around community based and household water harvesting
systems. • Farmers often give priority to feed dairy production as income generating and poverty reduction strategy.
Community-based irrigated alfalfa in Laikipia, Kenya has been profitable in sustaining market oriented milk production. Provision of drinking water for smallholder dairy production increased milk production per cow by 60%. Household water harvesting providing domestic water and enabling drip irrigation also was a key to establishing commercially viable milk production of 20 litres/cow/day compared to less than one before adopting water harvesting.
• With few exceptions, community based irrigation systems have ignored the potential benefits of animal production and the negative impacts of poorly managed animals on water resources. Without drinking troughs, animals enter dams and ponds and contaminate water and cause land and water degradation.
• Water harvesting systems that integrated livestock production and management were more productive, profitable and sustainable than those that ignored domestic animals.
• Experience from smaller irrigation systems in Laikipia, Kenya, demonstrates that dairy production in areas with good market access provides year-round profitable income that compares favorably with irrigated production of French beans, onions and tomatoes even when milk prices are depressed.
• Encourage conservation tillage and other measures to reduce soil loss and run-off in order to improve soil moisture and ground water re-charge and to reduce sedimentation of downstream water bodies including reservoirs and irrigation canals.
• Encourage zero-grazing systems to reduce livestock related land degradation particularly in the East African highlands (Figure 1).
• Promote use of dual-purpose food feed crops. • Provide livestock 25 m3 of drinking water as close
as practical or possible to households for each dairy in order improve animal productivity (20 litres milk/day) and farm enterprise profitability.
• Limit animal numbers and encourage use of more productive ones in order to reduce feed consumption and implied water use and to enable restored water holding capacity of soil through application of increased manure and organic matter.
• Encourage improved veterinary care for livestock especially for water-borne diseases and particularly in association with investments in water harvesting for agriculture.
• While dairying in areas with good market access often appears to profitable, economies of scale dictate that farmers may need encouragement to form dairy cooperatives to realize full benefits from provision of drinking water for animals.
• Investments in agricultural water can be better optimized by assessing the feasibility of assessing the feasibility of producing crops that the have high quality residue that can provide feed for domestic animals. This feed can either support production of animal products for the market or provide the “fuel” that animals use in proving transport and farm power services.

39
Other mixed crop-livestock rainfed WLDs 4.59 About 75% of Africa’s poor livestock keepers dwell in mixed crop-livestock rainfed areas.
Many of these reside in areas with poor access to markets. For them, marketing is not an option. However, animal keeping does provide a means to procure household nutrition and obtained limited cash beyond the end of the growing season. Furthermore in many crop production systems, livestock provide manure, traction and transport, without which farmers could not feed their families. In any subsistence or market oriented farming system where water scarcity constrains agricultural production, one of the most important water saving strategies will be to encourage water demand management approaches involving animal keeping. Chief among these is promotion of dual-purpose food-feed crops (rainfed or irrigated) that essentially provide animal feed without further use of water. Second, there is great need to encourage measures such as improved veterinary services, zero-grazing and watering, and improved nutrition and breeds that increase per animal productivity and reduce demands on farm labour.
Livestock-dominant rainfed production with bad market access, low human population and low available surplus water, and other livestock WLDs
4.60 In terms of the total number of TLUs (53 million) and the vast area of land covered (5 million km2), the single most important WLD in Africa is the livestock dominant regions with poor market access, low human densities and low available discretionary water (Tables 9 and 16 and Figure 6). There are few options for profitable investments in agricultural water. Water scarcity is the primary livelihood constraint. Traditionally, inhabitants have sustained themselves through nomadic lifestyles that meant shifting from one place to another in search of feed and water – a livelihood system well adapted to relatively dry and drought prone parts of Africa (e.g., WaterAid, 2003). Dry season watering spots and grazing reserves have been important for survival. Often, these occur adjacent to expanding mixed rainfed farming systems, and increasingly, they have been “developed” by turning them into large-scale irrigation schemes. Land-use changes in these dry season reserves has made pastoralists more vulnerable to drought and brought them into conflict with crop farmers. Appeals from the Government of Sudan emphasize the need to develop strategically placed groundwater based watering facilities that can enable pastoralists take advantage of large rangeland areas that are currently unusable because of lack of drinking water for animals.

40
Table 16: Experience and investment options for Livestock-dominant rainfed areas, bad market access, low human population and low available discretionary water
Priority countries
Experience Agricultural water investment options and strategies
Sudan, Somalia, Ethiopia, Chad, & Kenya Case studies: Pastoralism, Sudan Borana Plateau, Ethiopia
• Scarcity of livestock drinking water is a major constraint to animal production and forces migration to dry season reserves that increasingly have been taken over for irrigation and mixed crop-livestock production driving herders into conflict. In such areas feed is often relatively abundant but remains ineffectively used.
• Livestock numbers are often at or above optimal carrying capacity reducing animal productivity. Many animals kept as a counter-productive drought coping strategy making drought impact severe and probable animal mortality high. Community based management to limit herd sizes lacking.
• Herders’ need to move animals to dry season water and feed reserves brings them into conflict with rainfed and irrigation farmers who have expanded cultivation.
• Access to markets frequently depends on lengthy migration that can cause substantial weight loss and lower market value.
• Complex market chains link animal production to urban and irrigation systems and eventual market opportunities.
• Water-borne human and animal diseases are common around watering points, and effective community management of water resources is often weak.
• Construct strategically placed drinking watering points particularly in drought and conflict prone areas of north and western Sudan that overlay substantive but unmapped aquifers where there is known to be surplus feed. This intervention must include drinking water arrangements that keep animals from contaminating ground water. Communities much also establish mechanisms to prevent excessive herd sizes that lead to degradation of land resources particularly around the watering points.
• Watering points and grazing reserves along trekking routes that are part of the market chain can help overcome market access constraints by reducing animal weight loss.
• Control and prevention of animal diseases particularly around watering points can raise animal productivity and make livestock products more acceptable in the market place.
• Much of the anticipated expansion of rainfed and irrigated croplands may come at the expense of pastoralists’ traditional access to natural resources. To avoid future conflict, investments need to include negotiations to ensure socially acceptable changes to their livelihoods.
• Promote socially acceptable institutions that “insure” pastoralists’ assets as an alternative drought cropping strategy and reduce their incentive and need to allow herds to build to levels that exceed carrying capacity. This strategy will take demand-side management approach to reducing their need for rainfed feed production.

41
4.61 Key investment strategies and options include:
• Provision of well-managed dry season watering sites for livestock in areas where there is a year-round feed surplus. Such measures must be accompanied by effective community based mechanisms to ensure that livestock numbers do exceed the carrying capacity of land areas opened to increased grazing and heavily used areas immediately adjacent to the water source.
• Provision of animal health services to increase per animal productivity making de-stocking more feasible and profitable – a measure that it is critical where animals come into sustained contact with agricultural water and where animal products must meet high health and food safety standards.
• Promotion and development of innovative market chains that connect distant grazing lands with urban and international markets. This implies linking these areas with market centres and providing feed to fatten animals after the long trek to the market. Sudan’s experience includes establishment of recognized migration routes with water and feed reserves along the way. Linking irrigated areas such as Gezira through use of irrigated crop residues to fatten animals implies that well-planned investments in irrigation can help enable pastoralist to market animal products even though they live in areas with poor access to markets.
• Inclusion of pastoralists’ needs as legitimate stakeholders during planning, construction and rehabilitation of large-scale irrigations systems. Experience across Africa demonstrates that herders risk loss of access to traditional dry-season watering and grazing areas as result of investments in irrigation and the expansion of rainfed crop production – a situation that commonly leads to conflict. Yet, there are great opportunities to mitigate this problem by planning irrigation systems so that herders can access drinking water and by enabling herders’ animals to take advantage of crop residues as feeds.
• Promotion of socially acceptable alternative savings and drought risk avoidance measures that could enable pastoralists to reduce herd sizes. Such measures would reduce pressure on feed resources and evaporative loss of water enabling increased feed production that could contribute to accumulation of feed reserves for use in drought years and regeneration of biodiversity, recharge of ground water and carbon sequestration.
4.62 Some livestock-dominated have better access to markets and high discretionary available water, but they cover relatively small areas. They are likely among the most vulnerable to encroachment from crop producers and irrigators. Increasingly, herders will need to continue an already started trend of adopting the hybrid livelihood of agro-pastoralism. The implication is that investments in planning for agricultural water development will need to include these herders in the planning process as full stakeholders having an opportunity to benefit.
POTENTIAL FOR RETURNS ON INVESTMENT Previous discussion highlights diverse interactions between agricultural water development and livestock keeping. These include the reality that livestock are already associated with irrigation development, that livestock use much water for feed, that providing small amounts of drinking water greatly increases investment returns on production of irrigated and rainfed feeds, that livestock management practices affect the sustainability of water resources development, that expansion of rainfed and irrigated crop production can impose real costs and human suffering by displacing livestock keepers from their tradition natural resources bases, and that integrated planning results in more effective use of agricultural water. However, there is also need to examine the potential for increasing profitability arising from the integration of livestock production into water resources development and the allocation of agricultural water for animal production. This is an important but neglected issue. The following paragraphs build on some of the case studies listed in Table 2 and highlight some lessons learned from Sudan’s Gezira Irrigation System and adjacent rainfed croplands, Ethiopia’s Awash River Basin, and New Mutaro (and three other) irrigated systems in Kenya.

42
Sudan’s Gezira irrigation system 4.63 Elzaki (2005) used linear programming and enterprise budgets to assess profitability of various
strategies for integrating livestock production into the already established Gezira irrigation system. These include present practices and alternative possibilities. Dairy production was most profitable (Table 17) giving tenants a net gross margin of USD 829 in the production year, 2001-2002. Animal production in total provided about 36% of total farm household income in the same years (Table 18). Linear programming identified livelihood allocations strategies involving increased animal production that would lead to further increases in profitability of irrigation systems that. Elzaki’s analyses (2005) confirmed that “the integration of fodder in the rotation will increase income and provide animal feed and hence increases milk production”. She specifically highlights the need for improved feed sourcing strategies within irrigation systems and the importance of maximizing animal productivity in irrigation systems through improved veterinary care. She further shows that “unclear and contradicting policy of the Gezira Scheme management and the conflict between the animal keepers and the crop farmers” is the main constraint facing improved returns in the irrigation system.
Table 17: Enterprise budget showing additional costs and returns arising from inclusion of dairy, sheep and goat production on tenants’ farms in the Gezira irrigation system of Sudan
Item USA Dollars Dairy
cattle Sheep Goats
Revenues: Milk sales 550 60 72 Livestock sales 661 275 181 Fat sales 13 4 0 Wool reruns 0 1 0 Total revenues 1,224 339 253 Replacement costs 26 16 20 Herd net of replacement 158 39 13 Enterprise revenue (Gross output) 1,066 300 240 Enterprise expenses: Cakes feed 38 10 10 Crops residues 21 2 3 Grain feed 112 15 14 Concentrates feed 21 0 0 Total costs of feed 379 27 26 Medicine + veterinary services 14 2 2 Labour (Shepherd+ milking labour) 21 27 25 Miscellaneous 6 2 2 Total variable costs 232 58 56 Gross margin 834 243 184 Fixed costs 4 2 2 Net gross margin 829 241 182 Source: Elzaki (2005) with exchange rate of 252 SDD/USD used.
4.64 Merghani (2005) demonstrated that in areas near Gezira, that the profitability of livestock
production using both irrigated and rainfed crop residues can be greatly enhanced by introducing simple technologies such as silage that increase their nutritional value and baling that reduces the costs of transporting feeds to animals. In irrigated areas, these technologies have been shown to decrease milk production from about USD 0.40 to about USD 0.25 per litre of milk and the

43
revenues generated from crop residues can be as much as four times the income derived from the grain. While Merghani’s study focused on livestock production rather than water development, the results suggest that integrating investments in agricultural water with improved animal production can result in greatly enhanced profitability of water resources development.
Table 18: Sources of income for tenant households in the Gezira irrigation systems of Sudan
Source of Income USD/year Net income as % of total
costs
Net income as % of total farm income
Crops: Total returns 3245 `
Total costs 2112 Net crop income 1133 54 47.3 Vegetables: 0 Total returns 2034 Total costs 1663 Net vegetables income 371 22 15.5 Livestock: Milk returns 6461 Fats and wool returns 168 Animals sold 1129 Total returns 7759 Total costs 6905 Net livestock income 854 12 35.6 Farm income 2358 88 98.5 Off-farm income 37 1.5 Total income 2395 100.0 Source: Elzaki (2005) with exchange rate of 252 SDD/USD used.
Awash River basin, Ethiopia 4.65 Although maize is still a minor crop in Ethiopia, residue and grain respectively contributed 35%
and 65% to this grain’s profitability country-wide in the years 1995 to 2001 (CSA 2001 and Gebremedhin et al. 2004), and most residue is used for animal feed. Building on studies (Ayalneh 2004) of community based irrigation in the Awash River basin, Ayalneh developed enterprise budgets to show the additional profitability arising from the integration of milk and irrigated maize production in very poor farming households (Table 16). Under present conditions, milk production is very low averaging only about one litre per cow per day. With improved animal husbandry, yields could increase more than ten fold. However, even with these very low milk yields and notwithstanding the complexity of partitioning use of residues from both irrigated and non-irrigated components of the farm into diverse animal products (see notes in Table 19), milk production appears to contribute to increased returns over costs largely though enabling farmers to increase the total benefits derived from residue. For irrigated production based on maize without dairying, residue contributed about 27.41 USD/hectare or 19% of the total return on investment of 297 USD/ha.

44
Table 19: Comparison of profitability of maize production alone with maize combined with milk production in the Awash River Basin of Ethiopia
Item Unit Maize and residue only Maize plus milk production Quantity
(Unit/ha) Price
(USD/unit) Value/Cost (USD/ha)
Quantity (Unit/ha)
Price (USD/unit)
Value/Cost (USD/ha)
Variable cost - maize production Seed kg 50 0.14 7.06 50 0.14 7.06 Fertilizer-DAP kg 62 0.49 30.59 62 0.49 30.59 Fertilizer- Urea kg 43 .025 10.59 43 .025 10.59 Pesticide Litre. 0.5 11.17 6.47 0.5 11.17 6.47 Labor Person-days 51 1.18 60.00 51 1.18 60.00 Animal traction oxen days 15 2.35 35.29 15 2.35 35.29 Added variable cost - milk prod. Feed an salt - - 0 - - 0.59 Labour Person-days - - 0 37 0.76 25.76 Veterinary drugs - - 0 - - 1.76 Total variable cost 150.00 178.12 Outputs Grain kg 2280 0.12 268.24 2280 0.12 268.24 Maize residue kg 4651 0.01 27.41 4651 - - Milk attributed to maize residue litre 0 445 0.18 78.59 Total revenue 295.65 346.82 Returns over total cost 123814
5.65 168.71
% contribution of residue to profitability 19% 47% Even at a very low production level of one litre/day/cow, milk can still make up a very significant portion of the profitability of maize production even after including the value of residue in non-dairy farming. Increasing milk yields through improved housing and watering, feed, breeds, and veterinary care can increase yields to 15 litres per day or more giving great scope for increased profitability. Detailed enterprise budgets would need to be developed for each situation. Exchange rate used was 8.5 ETB/USD. Note. Investment cost of irrigation structures is not included since
they are covered by the government or NGOs. Because the government owns land, no fixed costs are assigned to the land.
Source: Small-scale irrigation Comprehensive survey data, March, 2004; Maize residue price estimated from feed survey study conducted by ILRI in 2002.
Assumptions for milk production: 1) 70% of maize residue can be used as feed, and all feed is used for dairy production; 2) 20% of the feed is refused by cow; 3) Local cows lactate for 270 days per year; 4) Milk yield is very low but typical of Ethiopia at 1 litre/cow/day; 5) Labour to look after cow requires 1/10 of day at 6 Ethiopian Birr/day for 365 days per year; 6) 54 % of the total required feed required comes from straw (Gebremedhin, 2004); 7) If all feed is used for dairy production, the household may still have to find addition feed resources to support oxen considered essential for crop production in Ethiopia.

45
4.66 By adding dairying to the irrigated production system, net returns over cost increased from about 147 USD/ha to about 169 USD/ha with residue and value added milk making up about 47% of net return. Give the extremely low level of animal productivity, there appears to be ample scope for increasing the profitability of irrigated systems by introducing husbandry practices that can boost milk production.
Dairy production in four irrigated systems of Kenya 4.67 Mati (2005) assessed four irrigated areas in Kenya to compare two agricultural enterprise
strategies: Net profitability under rainfed range livestock and crop production and Net profitability of dairy production based on production of irrigated feed.
Table 20 shows profitability of converting two rangeland and two rainfed farming systems into irrigated fodder production that farmers use for valued added dairy production. In all cases, incremental increases in net returns were substantial ranging from about 600 to 2200 USD/ha. The ratio of dairy to original net returns was higher for the two rangeland communities than for the two rainfed cropping systems. Mati’s (Figure 7) also shows that net returns from dairy production compared favorably with those from crops such as French beans, onions, cabbage, baby corn and water melon, but the highest net returns resulted from production of snow peas and tomatoes.
4.68 Apart from profitability, farmers appear to select livestock over some higher valued commodities such as tomatoes and snow peas for several reasons that investment planners need to recognize. Dairying enables year round income generation and appears to suffer less from high variations in market prices than horticultural crops and helps diversify sources of revenue. Dairy cattle also provide manure that farmers require in continuously cultivated irrigated crop land. Furthermore, livestock also consume food crops that farmers could not send to market so that surplus does not go to waste.
Table 20: Discounted returns on investments for small holder dairying based on irrigated fodder
compared to original rainfed land use in Kenya
Incremental income from adopting irrigation-based dairy
production
Study area and original rainfed land use
Gross income
(USD/ha)
Fixed plus
variable costs
(USD/ha)
Net returns
from milk production (USD/ha)
Net returns before
investment (USD/ha)
(USD/ha) Ratio of dairy to original net returns
New Mutaro (range) 1,081 450 631 23 608 26.4
Mashambani (range) 1,656 544 1,113 13 1,100 84.6
Ontulili/Mwireri (rainfed crops) 2,241 763 1,479 82 1,397 17.0
Emening (rainfed crops) 3,438 1,031 2,406 113 2,293 20.2
Source: Mati (2005)
Profitability – a summary of selected cases 4.69 The foregoing cases studies represent only a few of many possible enterprise strategies for
integrating livestock into irrigation development for the purpose of increasing overall profitability of investments in agricultural water. However, in all cases, farmers already are choosing to integrate livestock production into irrigation development because they can realize extra income and increased profits while having a more stable year-round distribution of revenues. Dairying particularly compares favourable with net revenues from many irrigated

46
crops. Planners need to recognize that net returns from irrigation includes more than just the crop and crop residue production because farmers also benefit from value added enterprises associated with converting low value residues into high valued animal products. To maximize the potential added valued net residues derived from irrigation-based livestock enterprises, planners need to consider providing improved veterinary care and measures to increase feed conversion efficiencies of crop residues and byproducts. Finally, these general conclusions should not replace conducting detailed enterprise assessments of profitability when specific investments in agricultural water are being contemplated.
Seasonal incomes (4 months) per hectare for some irrigated enterprises
0
1,000
2,000
3,000
4,000
5,000
6,000
7,000
8,000
9,000
Snow pe
as
French
beans
Onions (
NM)
Tomato
es
Cabbage
Baby corn
Water m
elons
Onions (
Is)
Dairy (N
M-mean
)
Dairy (O
1)
Dairy (O
2)
Dairy (M
w)
Dairy (E
m)
Dairy (Is
)
Enterprise
Seas
onal
inco
me/
ha (U
SD)
Figure 7: Comparison of net incomes from smallholder crop and dairy production based on irrigated farming in four communities in Kenya [NM = New Mutaro; O1 and O2 = two farmers in Ontulili; Mw = Mwireri; Em = Emening; Is = Mashambani]
RECOMMENDATIONS Experience from across Africa suggests that livestock keepers have been largely marginalized as stakeholders in investments in developing agricultural water. Investment planning having the motive to contribute to poverty reduction in SSA through profitable and beneficial development of agricultural water should undertake to include in the planning process livestock keepers and farmers who could benefit from the advantages that water development brings as well as who are at risk of losing access to their traditional natural resources endowments.
4.70 Africa-wide, evidence suggests that livestock use more water for feed than people do for food.
This water comes from both rainfed and irrigated production. The primary option for reducing water used in livestock feed is to shift to animal consumption of crop residue – a practice widely used by African farmers. This implies that there is need for:
• Policy and practice related to allocation, development and use of water in Africa must take into account and plan for water used by domestic animals.

47
• Promotion of increased use of dual purpose food-feed crops, a practice that can greatly reduce animal use of water, to the extent that irrigation development and water harvesting intensifies agricultural development in water constrained areas.
4.71 Large-scale irrigation systems have the highest livestock densities in Africa. Evidence suggests
that demand for livestock products will grow faster than the demand for grains and at about the same rate as for horticultural crops. Irrigation planning has tended to ignore the profit and income potential of animal products, but in areas where market access is good, great opportunities exist.
• Irrigation planning must consider water allocation for livestock feed, allocation of land for crops and livestock, access to animal drinking water, and expanding mandates of water users’ associations to cover necessary collective action for animal keeping, health and marketing.
• Irrigation planning will benefit from provision of drinking water to zero grazed milk cows – an approach that has been shown to significantly increase per animal milk production and profitability of smallholder dairying.
• Irrigation planning will benefit from taking measures such as conservation tillage and zero grazing to reduce up-slope and up-stream land degradation including both improved annual crop and animal management that causes sedimentation and sub-optimal irrigation capacity of irrigation infrastructure.
• Irrigation planners must recognize that livestock are often kept or rented to provide manure for soil fertility maintenance and animal power for traction and transport, and adequate provision of water and water-dependent feed will be necessary unless human labour or tractors replace them.
• Development institutions must recognize that many animals are kept as an asset savings and drought coping mechanism in the absence of access to secure alternatives. Development planners can take pressure of land and water resources if they can encourage the development of socially acceptable savings and insurance institutions that will benefit poor livestock keepers.
• Irrigation planning needs to engage in area-wide integrated development planning in order to avoid causing harm to pastoralists who traditionally depended on irrigated areas as dry season grazing and watering places. Great opportunity exists to help avoid future conflict – one of Africa’s persistent challenges. For example, the Gezira scheme of Sudan enables feed production from crop residues that form an essential link in the market chain extending from grazing areas of the west to distant international markets.
4.72 Mixed crop-livestock rainfed systems have more of Africa’s domestic animals than any other
production system, and limited feed constrains production and livelihoods. Particularly in areas lacking in water but with good market access, investments in agricultural water such as water harvesting systems can be expected. Smallholder farmers will greatly benefit from integrated water and livestock development. Livestock provide many goods and services and serve as primary means by which rural poor people accumulate wealth and climb out of poverty. But low rates of animal production are common. In many cases, animals must walk long distances to watering sites – a process that reduces their productivity and requires much household labour. A number of suggestions can help improve productivity and profitable livestock keeping through integrated water and livestock development:
• Agricultural water investment planning for mixed livestock systems should conduct an assessment of the potential for encouraging smallholder dairy production. Where deemed appropriate, design of water supply infrastructure should include provision of about 25 m3/year of water for each improved milk cow – an action that will free up much labour, increase per animal productivity, and make much better use of rainfed produced crop residue. Where possible, drinking water should be continuously available for maximum production.

48
• Given that much of the future investment in water harvesting will take place in these mixed rainfed systems, water harvesting systems design should include drinking troughs that are physically separated from water reservoirs and barriers to keep animals out of them to avoid contamination, sedimentation and the transmission of human and animal water-borne diseases.
• Because animals with access to water harvesting are at risk from water-borne diseases such as Fasciolosis (Asrat, 2004), integrated disease and vector control may help increase profitability and marketability of animals and animal products. In the case of Fasciolosis, curative drugs provided a 1000% return on their purchase costs as a result of increased animal productivity.
• Investment planning can benefit from adoption of water demand management approaches related to livestock use of agricultural water resulting in improved animal productivity through better animal health, zero grazing, zero watering, nutrient management, judicious de-stocking and conservation tillage that will enable more irrigation and rain water to be used for non-livestock purposes, and this must include provision to retain adequate vegetative ground cover and soil organic matter essential for soil productivity. A key tool for achieving this will be selection and use of dual-purpose food-feed crops.
• Just as small-scale irrigation (water harvesting) often fails because of poor marketing of cash crops, the same is true for smallholder dairying. Use of agricultural water to promote production of animal products for markets may require active efforts to improve market infrastructure, access to it and marketing organization that facilitate farmers’ access.
4.73 Livestock-dominant production systems are not areas where irrigation normally exists, but pastoralists remain at risk from encroachment from both rainfed and irrigated farming. Thus investment planning needs to address the immediate needs of livestock keepers as well as measures to ensure that herders do not suffer future marginalization and disenfranchisement from access to water and other resources.
• Significant violent conflict in Africa is rooted in the competition between crop farmers expansion into traditional dry season grazing areas long used by herders. Integration planning involving livestock keepers as stakeholders can help mitigate potential conflict by ensuring that the share in benefits. Options may include access to drinking water, provision of migration corridors, and mechanisms to ensure that crop residues or feed reserves can be set aside to meet pastoralists.
• With full participation by pastoralist stakeholders, there is great opportunity to develop watering points using extensive ground water resources. This must be accompanied by development and functioning of effective community based institutions that will limit use of these watering sites. This requires putting limits on animal numbers and allowing land adjacent to the watering sites to regenerate vegetation.
• Because much of the livestock-dominant land in Africa is far from markets, poverty-focused planning using area-wide integration will enable herders engage in market chains that can span great distances from remote areas to distant markets in urban areas or abroad.
4.74 Livestock market chains often extend across multiple countries and production systems with agricultural water used in each location to support drinking and feed production necessary for animal production. In developing agricultural water resources, planners need to look beyond the local environment to understand how profitability and sustainability of investments in water resources will affect and be affected by livestock production in more distant areas. Doing so can greatly enhance the overall value of such investments and help insure more equitable and wide-spread sharing of benefits.

49
REFERENCES Ashwanden C. Sponging cattle with insecticide halves malaria incidence in study. Bull. World
Health Organ. 2001, 79(8): 797-797.
Asrat M. 2004. Infection prevalence of ovine Fasciolosis in irrigation scheme along the Awash River basin and strategic anthelmentic treatment trial in a selected area in the upper stream. MSc Thesis submitted to Addis Ababa University.
Atwill E, Hou L, Karle B, Harter T, Tate K and Dahlgren R. (2002). Transport of Cryptosporidium parvum Oocysts through vegetated buffer strips and estimated filtration efficiency. Applied and Environmental Microbiology. 2002 (Nov):5517-5527.
Ayalneh A. 2004. Socio Economic and Environmental Impact Assessment of Community Based Small-Scale Irrigation In the Upper Awash Basin. A Case Study of Four Community Based Irrigation Schemes. M.Sc. Thesis, Addis Ababa University, Ethiopia.
Berhe K. 2004. Land use and land cover changes in the central highlands of Ethiopia: The case of Yerer Mountain and its surroundings. MSc Thesis, Addis Ababa University.
CSA (Ethiopian Central Statistics Authority). 2001. Output price Addis Ababa Market (7 years average), (1995-2001). Sample Survey 189, 200, 227, and 245.
de Haan, C. T. Schillhorn van Veen, B. Brandenburg, J Gauthier, F. le Gall, R. Mearns and M. Simeon. 2001. Livestock development. Implications for Rural Poverty, the Environment and Global Food Security. Directions in Development. The World Bank, Washington D.C.
Delgado C, Rosegrant M, Steinfeld H, Ehui S, and Courbois C. 1999. Livestock to 2020: The Next Food Revolution. Food, Agriculture, and the Environment Discussion Paper 28. IFPRI/FAO/ILRI (International Food Policy Research Institute/Food and Agriculture Organization/International Livestock Research Institute), Washington, DC.
ECA (Economic Commission for Africa). 2001. State of the Environment of Africa. Addis Ababa: ECA. 96 pp.
Elzaki R. 2005. The feasibility of integration of livestock production in irrigated agriculture in Sudan (Case study: the Gezira Scheme). Ph.D. thesis. University of Khartoum. 196 pp.
Eyasu E. 2003. Case Studies - Genetic Diversity, Coffee and Soil Erosion in Ethiopia, Proceeding of the Roles of Agriculture Project International Conference (20-22 October 2003, Rome, Italy)
FAO. 2003. AQUASTAT Regional Distribution of Water Withdrawals for Africa, http://www.fao.org/waicent/faoinfo/agricult/agl/aglw/aquastat/regions/africa/index3.
FAO. 2004. Aquastat. www.fao.org/ag/agl/aquastat
FARA (Forum for Agricultural Research in Africa). 2003. Securing the future for Africa's children: Building Sustainable Livelihoods through Integrated Agricultural Research for Development. Sub-Saharan Africa, Challenge Program Proposal. Johannesburg: FARA. http://www.fara-africa.org/files/SSA%20CP%20Volume%203.pdf
Food and Agricultural Organization (FAO). 2004. Tropical Livestock Units (TLU). Livestock, environment and development initiative web page – Virtual livestock centre web page: http://lead.virtualcenter.org/en/dec/toolbox/Mixed1/TLU.htm.
Gegremedhin, B. Fernandez- Rivera, S., Peden, D and Solomon Gebresselassie S. 2004. Crop residue as feed in the Ethiopian highlands: Results from maize-based crop-livestock mixed system. Unpublished. 26pp (paper prepared for a workshop).
Goodland R. and Pimental D. 2000. Environmental sustainability and integrity in natural resource systems. In: Pimental D., Westra L. and Noss R. (eds.), Ecological integrity. Island Press, Washington, DC, USA.

50
Hurni H. 1990. Degradation and conservation of soil resources in the Ethiopian Highlands. in Messerli B, and Hurni H. (eds.). African mountains and highlands. Problems and perspectives. African Mountains Association (AMA), Marceline, Missouri. p. 51-63
IWMI. 2004. IWMI global map of irrigation, 1999. http://www.iwmidsp.org/iwmi/SearchData/ReadFolder.asp?fPath=/dsp2/rs-gis-data/Global/
King J. 1983. Livestock water needs in pastoral Africa in relation to climate change and forage. ILCA Research Report 7. Addis Ababa: ILCA.
Mati B. 2005. Enterprise budget and investment study of livestock under irrigated systems in Kenya. Unpublished report completed under contract by the author International Livestock Research Institute. 18 pp.
Muli A. 2000. Factors affecting amount of water offered to dairy cattle in Kiambu District and their effects on productivity. BSc thesis, University of Nairobi (Range Management) Nairobi.
Merghani T. 2005. Utilization of agricultural byproducts for animal feeds in Sudan. Ph.D. thesis. University of Khartoum. (Thesis under review with expected completion in 2005.
OAU/IBAR (Organization for African Unity/Inter-African Bureau for Animal Resources). 2003. Strategies to promote livestock production, trade and marketing in Africa. Policy Briefing Paper No. 4. OAU/IBAR.
Palmer A 2000. Grazing Capacity Information System. Agicultural Research Council-Range & forage Institute, Grahmstown, South Africa: [http://www.ru.ac.za/institutes/rgi/gssa/gcis/rscourse.htm]
Peden D, Astatke A, Baltenweck I, Sonder K, Tadesse G, Workalemahu A, Asrat M, Berhe M, El Wakeel A, Faki H and Fadlalla B. 2004. Case studies for livestock and water. In IWMI (2000) Case Studies: Full report. Unpublished document. Colombo: IWMI.
Peden D, Tadesse G and Mammo M. 2003. Improving the water productivity of livestock: An opportunity for poverty reduction. In McCornick P, Kamara A, Tadesse G. (eds) Integrated water and land management research and capacity building priorities for Ethiopia: Proceedings of a MoWR/EARO/IWMI/ILRI international workshop, 2-4 Dec. 2002. Addis Ababa: ILRI.
Salih M. 1985. Pastoralists in town: some recent trends in pastoralism in the north west of Omadurman District. Paper 20b Pastoral Development Network, ODI, London, Agricultural Administration Unit.
Seleshi Z, Tegegne A and Tsadik T. 2003. Water resources for livestock in Ethiopia: Implications for research and development. In McCornick P, Kamara A, Tadesse G. (eds) Integrated water and land management research and capacity building priorities for Ethiopia: Proceedings of a MoWR/EARO/IWMI/ILRI international workshop, 2-4 Dec. 2002. Addis Ababa: ILRI.
SIWI, IFPRI, IUCN, IWMI. 2005. Let it reign: The new water paradigm for global food security. Final report to CSD-13. Stockholm: Stockholm International Water Institute (SIWI). 40 pp.
Sonder K, Astatke A, El Wakeel A, Molden D, and Peden D. 2005. Strategies for increasing livestock water productivity in water stressed agricultural systems. Submitted to the journal, Agricultural water management.
Stahl S, Owango M, Muriuki G, Lukuyu B, Musembi F, Bwana O, Muriuki K, Gichungu G, Omore A, Kenyanjui B, Njubi D, Baltenweck I, and Thorpe W. 2001. Dairy systems characterization of the greater Nairobi milk shed. SDP Research Report Ministry of Agric and Rural Dev., Kenya Agric. Research Institute and International Livestock Research Institute. 68p.

51
Thornton P, Kruska R, Henninger N, Kristjanson P, Reid R, Atieno F, Odero A, Ndegwa T. 2002. Mapping poverty and livestock in the developing world. Nairobi: ILRI. 118 pp.
WaterAid. 2003. Social conflict and water: lessons from northeast Tanzania. WaterAid discussion paper. London: WaterAid. 4 pp.
Weatherspoon, D.D and T. Reardon. 2003. “The Rise of Supermarkets in Africa: implications for agrifood systems and the rural poor,” Development Policy Review, May, 21(3): 333-355.
World Bank. 2004. African development indicators. Washington: World Bank. 424 pp.