When Capital Inflows Come to a Sudden Stop: Consequences and Policy Options
Upload
khangminh22Category
view
1download
0
International Institute for Labour Studies
—
r
NEW APPROACHES TO POVERTYANALYSIS AND POLICY - III
C
'A• —'A
The poverty agenda: Trendsand policy options
0Edited by Gerry Rodgers
2 and Roiph van der HoevénInC).CCCa
0
Ct
- .1.i-±L*_i -132
tin A CONTRIBUTION TO THE WORLD SUMMIT FOB SOCIAL DEVELOPMENT

International Institute for Labour Studies
NEW APPROACHES TO POVERTYANALYSIS AND POLICY - III
The poverty agenda: Trendsand policy options
Edited by Gerry Rodgersand Roiph van der Hoeven
A CONTRIBUTION TO TIlE WORLD SUMMIT FOR SOCIAL DEVELOPMENT

Copyright © International Labour Organization (International Institute for Labour Studies) 1995
Short excerpts from this publication may be reproduced without authorization, on condition thatthe source is indicated. For rights of reproduction or translation, application should be made tothe Editor, International Institute for Labour Studies, P.O. Box 6, CH-121 1 Geneva 22.
ISBN 92-9014-569-2
First published 1995
The responsibility for opinions expressed in signed articles, studies and other contributions restssolely with their authors, and publication does not constitute an endorsement by the InternationalInstitute for Labour Studies of the opinions expressed in them.
Copies can be ordered directly from: ILO Publications, International Labour Office, CH-121 IGeneva 22 (Switzerland).

Contents
Preface iii
1 Introduction: Poverty reduction and developmentstrategy, by Roiph van der Hoeven and Gerry Rodgers 1
Part I: Patterns of poverty 9
2 Poverty and inequality in developing countries:A review of evidence, by Hamid Tabatabai 11
3 Rural institutions and poverty in Asiaby Rizwanul Islam 33
4 Changing poverty and employment patternsunder crisis in Africa, by Vali Jamal 59
5 Coping with austerity: Poverty and inequalityin Latin America, by Nora Lustig 89
Part II: Structural change and structural adjustment 127
6 Poverty in Eastern Europe: The latest manifestationof global polarization, by Peter Townsend 129
7 Labour market, urban poverty and adjustment:New challenges and policy options,by Ricardo Infante 153
8 Structural adjustment, poverty and macro-economicpolicy, by Roiph van der Hoeven 177

Acknowledgements
Many people were involved in the production of this monograph.First, we should like to thank the authors, who were extremely cooperativein reworking the papers they wrote for the Poverty Symposium in a moreappropriate form following the discussions at the meeting. We should alsolike to thank participants in the Symposium who, either in public or inprivate, commented upon the contributions.
We have been greatly assisted in the preparation of this monograph bya number of colleagues and friends who deserve to be singled out. José B.Figueiredo not only provided comments but also addressed the many issueswhich seem trivial but the negligence of which could cause problems. Aj itBhalla provided many useful comments during the production process andalso gave editorial advice. Carmen Ruppert retyped and corrected many ofthe contributions, which were edited by Caroline Hartnell. Hazel Cecconicopy edited, formatted and proof-read the papers and did the graphic work.This joint effort has resulted in what we hope is a pleasant but penetratingtext.

Preface
Fifty years ago the ILO adopted its Declaration of Philadelphia whichwas to serve as its postwar charter. The Declaration affirmed that povertyanywhere constitutes a danger to prosperity everywhere; that labour is nota commodity; and that freedom of expression and of association areessential to sustained progress. The task for the international communitywas to carry on the "war against want", both within nations and by con-certed international effort.
The fight against poverty and for social justice lies at the heart of allthe ILO's concerns. It runs through the ILO's work in such areas asemployment, social security, minimum legal provisions for the conditionsof work and for relationships within the world of work; and in the broadergovernance of civil society itself.
The attempt to integrate normative social policies with macro-economic strategies and with institutional change is the essential hallmarkof ILO action against poverty. The ILO 's approach has three character-istics. First, poverty is not viewed as merely residual or incidental, but asrelated to the structure and functioning of economic and social institutions.Poverty cannot be understood solely in terms of jobs, but in terms of thesocial context in which such jobs are embedded. Secondly, the poor havealways been viewed as potential social actors rather than as targets forpolicy. The emphasis on the organization of social actors and theirparticipation in development reflects the tripartite dynamic of the ILO.Thirdly, domestic anti-poverty action has always been set within theexternal environment. The ILO 's concern in the 1 950s and 1 960s withgrowth and balance of payments constraints, and in the 1 980s witheconomic stabilization and structural adjustment, are examples of thisperspective. It is challenged by the process of globalization at thebeginning of the new millenium.
In the last 50 years, per capita income has tripled, but incomedisparities have doubled. Seven hundred and fifty million people indeveloping countries are either unemployed or under-employed, a goodproportion of them living in conditions of absolute poverty. In thedeveloped economies, 35 million people are unemployed, and the share ofprecarious, low-quality jobs is continuing to grow. Growth has not led tothe automatic eradication of poverty; neither is poverty afflicting solely

iv THE POVERTY AGENDA: TRENDS AND POLICY OPTIONS
those without work. The social dilemmas of transition in Eastern andCentral Europe, and the problems of Africa, have all served to bring theissue of poverty to the forefront of global agendas.
On the occasion of the 50th anniversary of the Declaration ofPhiladelphia, the International Institute for Labour Studies reviewed theILO's experience in this field, to identify options for future strategies. Thesymposium on "Poverty: New approaches to analysis and policy",organized by the Institute on 22-24 November 1993, brought contributionsfrom a broad spectrum of opinion, including academic researchers, ILOstaff, members of the ILO's constituencies and those concerned with theformulation of anti-poverty policies. The intention was to exploreinnovations, both in the analysis of the problem and in the design ofpolicy, and to bring researchers together with practitioners in identifyingpromising avenues for future ILO work.
The symposium reviewed past and current ILO research and policyapproaches to poverty, and examined recent trends and new options whichhave emerged in the theoretical and empirical literature. It analyseddifferent aspects of anti-poverty policies: macro-economic and sectoralpolicies; labour market policies; policies to promote social coherenceincluding social security and other forms of social protection; and theorganization and representation of the poor.
The main contributions to this symposium are being published in threemonographs. Monograph I comprises a critical review of ILO' s actionagainst poverty, including a broad analysis of research issues, a biblio-graphy of ILO publications, and a summary of discussions in thesymposium. Monograph II includes papers on the relationship betweenlabour market policies and poverty. It evaluates in particular the potentialimpact of minimum wages, training, and labour market regulation on theincidence of poverty. Monograph III examines macro-economic andstructural adjustment policies in terms of their contribution to povertyeradication in different parts of the world.
Many at the ILO and at the Institute have contributed to this work.Their names appear in each monograph, and their contribution is gratefullyacknowledged. I would, however, like to make particular mention of myformer colleague, Mr. Gerry Rodgers, whose vision and commitment made
the symposium possible.
January 1995 Padmanabha GopinathDirector of the International Institute
for Labour Studies

1 Introduction: Poverty reductionand development strategy
Roiph van der Hoeven1 and Gerry Rodgers2
I. A concern with poverty is back on the agenda
The last decade of the twentieth century has seen a revival of concernwith the extent and persistence of poverty. International agencies,governments and non-governmental organizations, each with their distinctvocabularies and approaches, are all paying more attention to poverty. Theink of this introduction will be barely dry before poverty is discussed asone of the three major themes of the World Summit on Social Develop-ment in Copenhagen in March 1995, where a large number of heads ofstates and their advisors will join together to discuss national and inter-national action in relation to employment, poverty and social exclusion.
What is behind "the return of poverty" to the development agenda?Of course, there is a cycle, in which issues return to fashion from time totime. Unsuccessful attempts to deal with major social problems lead todisillusionment and abandonment of the issues concerned, before a newgeneration takes up the challenge. No doubt there is some element of truthin this explanation; but more fundamental factors are also involved.
First, despite (or perhaps because of) the disappearance of povertyfrom the priority policy agenda in the 1980s, poverty itself by no meansdisappeared. On the contrary, as the various contributions in this volumeshow, the number in poverty, both absolute and relative, has increased inthe majority of regions in the world. The growth of the numbers of thepoor is itself forcing the issue back onto the policy agenda, especially aspoverty is increasingly perceived as inter-related with politically visiblesocial problems such as endemic violence in many cities, widespread
International Labour Office, Geneva.2 International Institute for Labour Studies, ILO, Geneva.

2 THEPOVERTYAGENDA: TRENDS AND POLICY OPTIONS
groups of street children vulnerable to abuse and marginalization, thepressure of migration on infrastructure and growing social tensions.
Second, there is increasing anxiety about the shape of future develop-ment in industrialized societies. In these countries the experiences of the1 980s have contradicted the conventional wisdom of a linear developmentpattern in which countries would gradually grow out of poverty. In manycountries — the United States and the United Kingdom are notableexamples — increasing income inequality in the 1980s, often linked tounequal educational attainment and differential access to certain segmentsof the labour market, has resulted in increased poverty, with a growingrealization that for a substantial number of households it will be impossibleto escape from the poverty trap without help. And an even more precarioussituation prevails in Eastern Europe, where systems of social protectionhave collapsed along with the Communist regimes, pushing many familiesbelow the poverty threshold, with little hope for improvement for years tocome.
Third, in a geopolitical sense, the disappearance of "east-west" rivalryhas allowed domestic concerns to come to the forefront of policy discus-sions. However, an increased concern with poverty and a more prominentplace on the political agenda does not necessarily mean that pro-poorpolicies — whatever they may include — will receive priority. Especiallyin industrialized countries, but also in some of the higher incomedeveloping countries, there has grown up, in Gaibraith's words, "a cultureof contentment": as long as the majority of the population experiencessome advancement in their level of living, no domestic measures to changeinstitutions and policies in favour of the poor will be taken, unless externalor internal pressures become too great. But in many societies, in the Northas well as in the South, this moment may not be far off.
This volume explores the pattern of poverty and the design of policyagainst poverty in this new context. It offers an assessment of the maintrends in poverty in different regions of the world, and sets these withinthe broader context of development patterns and the macro-economicenvironment. Each contribution highlights the role played by macro-economic policy, with a particular stress on the effects of stabilization andstructural adjustment on inequality and poverty. Most of the chapters, andin particular the last two, draw conclusions about the ways in whichdevelopment policy can be restructured with a view to rendering economicadjustment and growth compatible with the elimination of poverty.

INTRODUCTION: POVERTY REDUCTION AND DEVELOPMENT STRATEGY 3
II. Trends in poverty and policy experiences
Although, as the chapters of this volume show, it is difficult togeneralize, it is nevertheless possible to highlight some general character-istics of trends in poverty.
At one end of the spectrum there has been a large increase of povertyin many low-income economies. In most cases the increase in povertyappears to be associated with a general economic decline or standstill. Itis a moot point whether or not the adjustment policies which were imple-mented in the 1980s have prevented an even more rapid decline; but in anycase progress has been limited and many more households have becomepoorer.
In other cases increased poverty is not so much the outcome of inade-quate growth performance as of institutional changes which turn against thepoor. In many cases the main objective of institutional change is toimprove efficiency, but the result is nevertheless to put the poor in a moreprecarious situation.
The relative importance of these patterns varies from one region of theworld to another, as illustrated by the various chapters in this volume.
Townsend (Chapter 6) demonstrates that changes in labour marketpolicies, social security arrangements and labour market regulations, com-pounded by insufficient growth, have led to greater inequalities and to apersistence of poverty in various industrialized countries. This is parti-cularly marked in countries which have gone through periods of sharpderegulation and the weakening of institutions which promote the interestsof the poor, such as the United Kingdom and the United States. But thewidening of inequality in industrialized countries is not restricted to thesetwo countries alone: European countries which have followed the modelof concertation have also witnessed increases in inequality.
Trends in Latin America, as reported by Lustig in Chapter 5, showa mixed picture. In the 1980s poverty increased widely because of ageneral economic decline, in turn a consequence of the debt crisis and thesubsequent stabilization policies. In recent years, however, the patternshave been varied. Some countries pursued growth through deregulation,while others preserved a number of institutions (such as minimum wage-fixing machinery and various elements of social security) in order toprotect the poor. As van der Hoeven shows in Chapter 8, countries whichdid protect the poor through institutional policies did not show a poorergrowth performance.
Asia no doubt displays the widest spectrum of experiences, as Islam'sdiscussion of rural poverty (Chapter 3) amply demonstrates. In most East

4 THE POVERTY AGENDA: TRENDS AND POLICY OPTIONS
Asian countries the numbers in poverty diminished quickly, mainly as aconsequence of rapid growth. Views on the reasons for this economicsuccess are varied, but there is general agreement that important factorsincluded a respect for basic macro-economic rules, an egalitarian patternof income distribution and fairly active state intervention in investment andtrade. Other Asian countries show a more varied pattern. Lower GDPgrowth, inappropriate institutions, regulations and practices and veryunequal access to productive resources all contributed to the failure ofmany poor households to gain access to a larger share of the slowlygrowing production. However, in some countries with relatively insuf-ficient aggregate macro-economic performance, rural institutions providedsome support mechanisms for the poor.
Poverty in Africa has increased on a massive scale, as Jamal demon-strates (Chapter 4). Slow or negative growth and growing inequality inaccess to resources has sharply increased the numbers in poverty, and thecharacteristics of the poor have changed (a more rapid increase in urbanpoverty than in rural poverty) along with structural changes in theeconomies concerned. However, the policies which failed to promotegrowth in Africa did not in themselves have a strong bias against the poor.Poverty increased mainly because of increased vulnerability of manyhouseholds as a result of declines in production and deterioration in labourmarket conditions — sometimes in catastrophic fashion, as sources oflivelihood disappeared and traditional forms of exchange and solidaritywere undermined by absolute shortfalls in resources.
So the trend and causes of poverty have varied greatly from oneregion of the world to another. But, with the possible exception of EastAsia, the tendency has been for concern with poverty to increase. As aresult, there is now an almost universal acceptance of the importance ofpoverty alleviation as a central objective of social and economic policy.
In order to put the policy options in a proper perspective, it is usefulto reflect on past efforts to make poverty alleviation a central objective ofdevelopment planning, notably during the 1970s, when a concern withpoverty played an important role in the formulation of development strate-gies such as "redistribution with growth" and "the basic needs approach".As Tabatabai illustrates in Chapter 2, a basic premise of these strategies,based on the then fashionable global models, was that to achieve a sub-stantial decrease in the numbers in poverty, economic growth of the orderof 8-10 per cent per annum was required. It was argued that such highgrowth rates could not be maintained for long time periods, so thatredistributive policies were also needed for poverty alleviation. Policies tosatisfy basic human needs, often combined with proposals for a better

INTRODUCTION: POVERTY REDUCTION AND DEVELOPMENT STRATEGY 5
redistribution of resources worldwide through the establishment of a NewInternational Economic Order, dominated the development debate by theend of the 1970s. In Volume I of this series of monographs, a generalreview of ILO action against poverty lists a number of reasons for thefailure of the basic needs approach as a coordinated attack on poverty. Oneimportant reason was the effect of debt crisis and the application of short-term stabilization policies at the beginning of the 1980s to counteract thedeclining flow of international resources for developing countries. Thebasic needs approach had paid little attention to trade and internationalfinancial aspects; a growth of exports and sufficient international capitalwere assumed. A second reason was that those promoting basic needspolicies incorrectly assumed the presence of a benevolent and efficientstate, an assumption which this approach had in common with most otherdevelopment strategies.
The combination of inadequate external resources and the fragilepolitical power base, especially in times of great financial uncertainty, wasoften fatal for those attempting to maintain or introduce a basic needsstrategy. In countries having to face serious financial crisis, expenditureson basic needs could not be maintained. Even where the capital constraintswere much weaker, as in some oil-exporting developing countries, moststates failed to allocate adequate resources to basic needs provisioning. Inmost cases it became more difficult for the poor to exercise pressure andto build up more countervailing power.
III. Policy options: The present situation
Important lessons can be learnt from the experience with the basicneeds approach. First, poverty policies cannot be disassociated fromadjustment policies (of which the ultimate aim is to restore balance in theeconomy, through internal equilibrium and growth); second, povertypolicies should be associated with policies for structural change which givepoorer families a greater command over natural, financial and humanresources in order to participate directly in sustained growth. It may alsobe observed that the premise of the basic needs strategy — that sustainedgrowth rates of 8-10 per cent per annum were not possible, so thatredistributive policies were also called for — has not been universallycorrect. A small group of countries has managed to average such highgrowth rates for long periods. The Republic of Korea's average annualgrowth rate of GDP over the 1980s amounted to 9.7 per cent and that ofChina over the same period amounted to 9.5 per cent. Such growth was

6 THE POVERTY AGENDA: TRENDS AND POLICY OPTIONS
certainly not uniform or even egalitarian, but resulted nevertheless insubstantially reducing the number of people living in poverty.
Faced with the need to reconcile poverty policies with structuraladjustment (and coping with effects of globalization) as well as with theneed for structural economic change, what policy options do the authorsof the chapters of this volume offer?
In discussing these a first issue to underscore is that, as noted above,causes of poverty have been different, in different countries and continents.Any temptation to propose uniform (and often grandiose) policy optionsshould therefore be strongly resisted. Second, and related to the argumentabove, any discussion on policy options in the 1990s should take intoconsideration whether the adjustment experiences in the 1980s have led to"new forms" of poverty and whether such new forms of poverty needspecial policy action or not.
In Africa (as Jamal argues in Chapter 4) poverty has reached anextraordinary level. Onto the existing layer of poverty a new layer hasbeen superposed, which consists mainly of the urban poor, some of whommany years ago might have been considered as belonging to a labour ari-stocracy, but who now often have to eke out a living in informal sectoractivities and subsistence farming. Wages have widely dropped to or belowefficiency levels and, in combination with frequent devaluations (especiallyfor countries outside the CFA franc zone), have in US dollar terms fallenmuch below the levels in other continents. However, despite these lowwages, employment growth has not been forthcoming, contributing greatlyto increased poverty.
In order to combat poverty, African economies need to be relaunchedinto growth, which should clearly be fed by increased exports, startingwith agricultural commodities, including new and non-traditional products,and as rapidly as possible, diversifying towards labour-intensive manu-facturing exports. As Jamal argues, structural adjustment policies haveoften not or not yet contributed to such a revival of growth and diversi-fication. The policy components of adjustment packages, as well as theadequacy of the net resource flows if they are to provide for a restartingof the economy, have therefore to be seriously questioned. Althoughgrowth thus should dominate the agenda, special poverty concerns must bebuilt in, through boosting human capital investment, land redistribution,support for labour-intensive manufacturing both for domestic and exportmarkets, as well as protection and assistance to vulnerable groups such asfemale-headed households.
Islam, in his analysis of poverty in Asia (Chapter 3), advocates inparticular policy options related to rural institutions. As his analysis

INTRODUCTION: POVERTY REDUCTION AND DEVELOPMENT STRATEGY 7
indicates, growth in Asian countries has been a necessary condition forpoverty alleviation but not a sufficient one. He notes that in most Asiancountries, unlike in other continents, planning and policy-making was moreconsciously aimed at poverty alleviation in the 1980s than in the 1960s or1970s. Furthermore, the newly-industrializing countries made a great dentin the poverty problem by emphasizing labour-intensive exports in a stablemacro-economic climate, following a policy of land redistribution andadequate remuneration for farmers at an earlier stage. Other countries inthe continent have used various rural institutions to counter growingpoverty trends. Sometimes technological change has helped. For instance,certain entrenched institutions such as tenancy and unequal land distributionare usually considered as impediments to growth and alleviation of ruralpoverty; however, these relationships are changing with the introductionof new technologies in agriculture, and can be remoulded in the directionof poverty reduction. Although these issues are complex, Islam suggeststhat policy options have to be found which, while contributing toresponsible macro-economic objectives, may create economic incentivesand promote social change in ways which overcome some of the remainingconstraints posed by rural institutions.
The turbulent experiences of the 1980s reversed the earlier decliningtrend in poverty in Latin America, and to some extent changed itscharacter. For example, poverty in Latin America has become more urbanthan rural, warranting a partial reconsideration of the policy options of thepast. Lustig (Chapter 5) argues forcefully that adjustment and stabilizationpolicies have caused additional poverty, although to an extent which variesin the countries of the region, but equally acknowledges that a failure toadjust would have also led to an increase in poverty. However, importantlessons are to be learnt from the experience of the 1980s. First, hardly anyLatin American country was able to protect the poor from the crisis sincefew appropriate policy instruments were available. The poor often sufferedmost from inflation, for instance. Second, adjustment policies oftenremoved a number of policy instruments such as large subsidies for basicconsumption goods and direct price control, which were used in the pastin anti-poverty programmes. Lustig argues that much more could havebeen done in the past to arrest and reverse the increase in poverty. In thecurrent situation of a return to growth in Latin America, there is someprospect of a gradual reduction in poverty, especially given the widespreadsuccesses in bringing inflation under control, but the process of trickle-down is far too slow and would also not protect the poor against any futureshocks. What is more, the structural economic changes which are neededto achieve growth in a competitive global economy appear to promote new

8 THE POVERTY AGENDA: TRENDS AND POLICY OPTIONS
forms of poverty by excluding increasing numbers from the formal labourmarket.
Policies have therefore to be sought which can provide the poor withbetter integration in economic development through education, improvedaccess to social infrastructure, legal measures against sexual and racialdiscrimination, all such measures in combination with a progressive taxsystem and universal access to social security and social assistance.Another set of important policy options to which Lustig alludes are thoserelated to the urban labour market, since this is where most of the poor arenow located. This issue is pursued by Infante (Chapter 7), who stressesthat adjustment policies should recognize more explicitly the social costs,and that these costs should be distributed more equitably. Emphasis has tobe given not only to the creation of jobs, but also to the quality of jobs. Inthis respect adequate social spending and access by the poor to socialservices are not only a buffer in times of shock but should also be seen asan investment in the future. Furthermore, experiences in several countrieswith income and minimum wage policies have demonstrated that, underconditions of relative macro-economic stability, these can provide powerfulinstruments to reduce poverty without jeopardizing employment creationin the medium and long run.
Through all these different analyses of policy options runs theacceptance of greater integration of developing countries in the worldmarket system. Townsend (Chapter 6) argues that such integration willonly result in poverty alleviation if national institutions and policies forredistribution are replicated at an international level. He is ratherpessimistic about the outcome because, within the industrialized countriesthemselves, such institutions and policies are in decline, which bodes ill fortheir replication at the international level.
Van der Hoeven's final chapter brings the various arguments onmacro-economic policies, structural adjustment and poverty alleviationtogether, and argues that in many countries macro-economic policies havefailed to give due attention to poverty alleviation; more could have beendone in both fiscal and monetary policy. This has been partially the resultof the separate levels of decision-making for economic and social policies,and the priority given in adjustment programmes to economic objectives.He argues, however, that not all the burden of poverty alleviation can beplaced on macro-economic policies, but that institutional changes andchanges in political attitudes, which are discussed in other chapters, and inthe other volumes in this series, are also required in order to achieve theoften urgently-needed policy reversals.

Part I:Patterns of poverty


2 Poverty and inequality in developingcountries: A review of evidence
Hamid Tabatabai1
This chapter reviews recent empirical evidence on the extent ofpoverty and inequality in the developing world and changes which havetaken place since 1970. The focus is on a description of differences acrossmajor developing countries and regions. The inherent difficulties in thequantification of poverty and income inequality and their comparisonacross countries and over time are widely debated and well known. Whilesome of these difficulties will be noted briefly, as appropriate, it is not ourintention to dwell on them. The aim is rather to examine the best empiricalevidence that is now available at the level of regions and individualcountries. In particular, we shall attempt a comparison of estimates fromdifferent sources as a means of ascertaining the robustness of thepropositions about the levels of poverty and inequality and their trendsover time.
L Poverty
In an important study carried out in the mid- 1970s, the ILO estimatedthat developing countries would need a long-term economic growth rate of7 to 8 per cent per annum, accompanied by substantial income redistribu-tion policies, if they were to meet the basic needs of the poorest people intheir societies by the end of the century [ILO, 1976, p. 42]. Such a rate ofgrowth implies a sustained annual rise of about 4-5 per cent in per capitaterms. This target did not appear unrealistic at the time. Developingcountries as a whole had indeed achieved a GNP per capita growth rate of4.3 per cent per annum during the preceding period of 1965-73. Subse-
Development Policies Branch, Development and Technical Cooperation Department,International Labour Office.

12 THEPOVERTY AGENDA: TRENDS AND POLICY OPTIONS
quentdevelopments, however, witnessed a trend decline in this rate to 2.6
per cent during 1973-80 and only 1.5 per cent during 1980-90. This sharpdeceleration in economic growth was characterized by vast regionaldifferences as both South and East Asian countries managed to actuallyincrease their trend rate of growth in the 1980s, while other developingregions suffered a drastic decline in their growth performance. In LatinAmerica and sub-Saharan Africa per capita income in fact dropped sig-nificantly in the 1980s.2
The above trends and the regional disparities associated with themhave had differential effects on the evolution of poverty over the past twodecades. Direct evidence on poverty is available from different sourceswhich do not always tell the same story. But the considerable amount ofwork devoted to the generation of better distributional statistics and theimprovement of the methodology of poverty estimation has helped to yieldestimates that are now more reliable than in the past. We shall rely on themost recent estimates and consider their consistency and comparability overtime and across countries and regions.
This chapter relies mainly on the most common measure of poverty,the headcount index or poverty incidence, which refers to the percentageof households or individuals below a given poverty line. This is a crudemeasure that ignores much of the informational content of the original dataon which it is based and lacks certain properties that are widely regardedas desirable for a poverty measure. It does, however, have the advantageof simplicity. Most poverty data, furthermore, are available as incidencefigures, although other measures of poverty are becoming increasinglypopular. In practice, however, it appears to matter little which specificpoverty measure is used, particularly in the inter-country analysis oftrends .
2 The growth rates are based on World Bank data. This paragraph draws on Chs. 1 and2 of Singh & Tabatabai [1993], which may be consulted for further details.
The headcount ratio is, for example, insensitive to the extent of shortfall in incomebelow the poverty line or to the distribution of income or expenditure among the poor, andoverly sensitive to the exact choice of the poverty line if there is a significant concentrationof population around it. Several other measures have therefore been developed over the pasttwo decades that are considerably more attractive. They are, however, less intuitive andmay not be easily understood by the non-specialist. These measures, for example the Senindex and the FGT index [Foster et al., 1984], have now become standard measures thatmost poverty studies use alongside the headcount ratio. Despite their theoretical appeal,however, these more complex measures appear to make little difference in practice as theyare often highly correlated with one another and with the headcount index. For example,using the results of Psacharopoulos et al. [1993] which provides estimates of the headcountindex, the poverty gap, and the FGT index for 1989 for 18 Latin American countries, both

POVERTY AND INEQUALITY/N DEVELOPING COUNTRIES 13
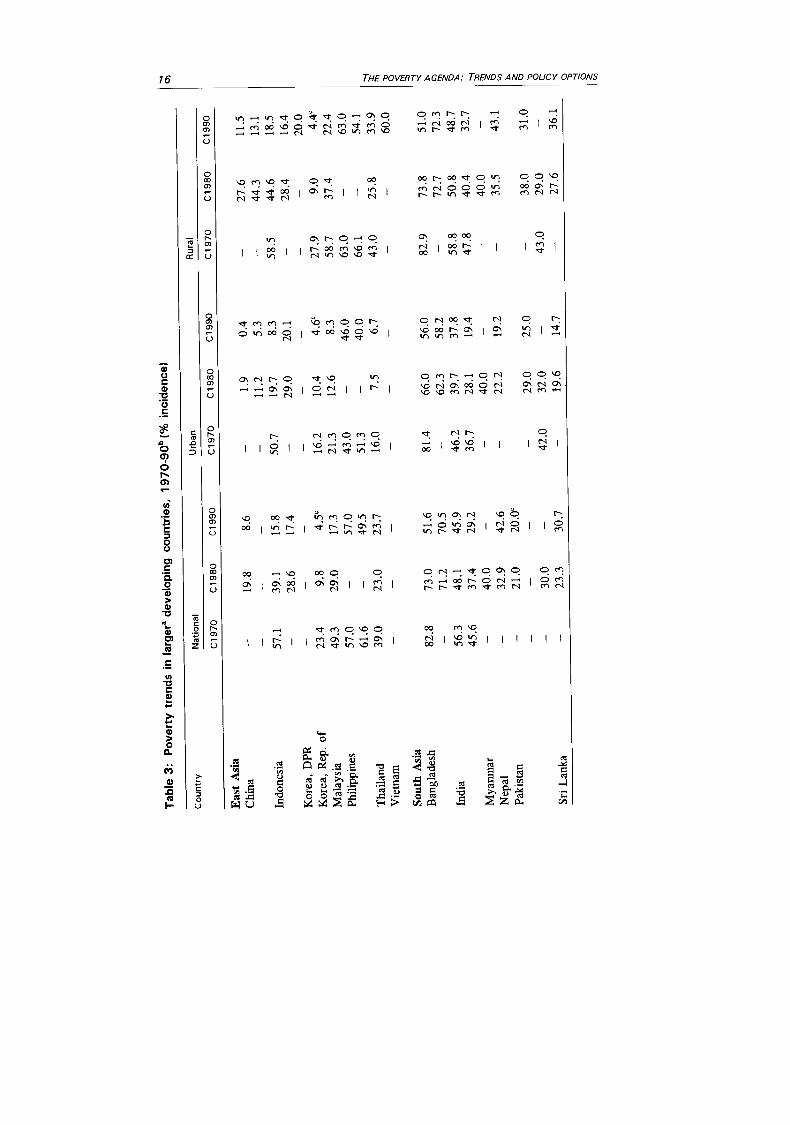
Tables 1 to 3 present the main estimates of poverty incidence used inthis chapter. The first two tables relate to the extent and evolution ofpoverty in the major regions of the developing world over the past twodecades. These regional estimates come from different sources and arebased on different samples of countries, methodologies and regionalclassifications. They are, however, complementary and, taken together,provide a reasonably consistent picture that highlights several key factsabout the changing state of poverty in the developing world over the pasttwo decades. The regional evidence is supplemented by data in Table 3which concern developing countries with a population of at least 10 millionin 1990. The list is confined to the larger countries to limit the size of thetable but also to focus attention on countries that dominate the pattern ofchanges in regional aggregates in the first two tables.4 Estimates areprovided, as available, for three points in time: around reference years1970, 1980 and 1990.
Before proceeding with an analysis of what the data show, it is useful
to begin with a preliminary observation on data availability. A glance atTable 3 gives a fairly accurate picture of the availability of poverty statis-tics in the developing world. Time-series data on poverty incidence, andits urban/rural breakdown, are available for almost all larger countries inAsia and Latin America for the period since 1970. The main exceptions area few centrally-planned economies in these regions (North Korea, Vietnamand Cuba). By contrast, there are no more than a couple of countries in theMiddle East and North Africa, and none in sub-Saharan Africa, for whichsimlar types of data are at present available. This disparity in dataavailability implies that, while regional estimates of poverty for Asia and
the Pearson and Spearman rank correlation coefficients are at least 0.95for all pairs ofindices at either of the two poverty lines for which the estimates are available.
Regional aggregates are normally weighted by population and are not much affectedby the exclusion of smaller countries. Poverty data, particularly time series data, are alsomore scarce for smaller countries.
Most of the poverty data for this study are extracted from Tabatabai & Fouad [1993].This compendium provides some 1,350 observations on the incidence of rural, urban,national and regional poverty in 120 developing countries and various developing regionsfor the period 1960-92. These data are assembled from a large number of sources and arein most cases accompanied by information such as the reference year, the poverty line andthe method of estimation as available. The estimates in this compendium are in almost allcases based on data from household income or expenditure surveys that cover the bulk ofthe population of interest at each level (national, urban or rural). They are also all basedon some concept of absolute poverty, with the poverty line expressed in monetary terms.Poverty incidence in most cases refers to the percentage of the poor in the population, notin the total number of households.

Tab
le 1
: P
over
ty in
cide
nce
by d
evel
opin
g re
gion
, 19
85 a
nd
1990
Reg
ion
Yea
r C
umul
ativ
e %
of
popu
latio
n u
(S/p
erso
n/m
onth
, 19
85 P
PP
)
nder
eac
h co
nsu
mpt
ion
leve
l M
emo
item
(W
orld
B
ank s ,
1992
)
%
No.
(m
) $2
1 $3
0.42
$4
0 $5
0 $6
0
40 c
ount
ries
, ex
trap
olat
ion
1985
19
90
17.9
33
.3
17.6
33
.1
46.5
46
.0
57.5
56
.5
65.9
64
.4
30.5
29
.7
1 05
1 11
33
Eas
t Asi
a 19
85
1990
4.
9 15
.7
4.9
14.7
29
.9
26.8
43
.7
39.1
54
.6
49.3
13
.2
11.3
18
2 16
9
Sout
h A
sia
1985
19
90
37.0
61
.1
33.6
59
.0
75.3
74
.6
84.1
84
.0
89.5
89
.5
51.8
49
.0
532
562
Lat
in A
mer
ica
1985
19
90
13.2
23
.1
17.2
27
.8
32.0
37
.0
40.1
45
.2
47.0
52
.1
22.4
25
.5
87
108
Sub-Saharan Africa
1985
1990
33.3
53.5
34.5
54.4
67.1
67.1
75.8
75.5
81.6
81.1
47.6
47.8
184
216
Mid
dle
Eas
t & N
orth
Afr
ica
1985
19
90
1.3
4.5
0.5
2.5
10.6
7.
0 18
.9
13.3
28
.0
20.5
30
.6
33.1
60
73
Sou
rces
: C
hen
et a
l [1
993,
Tab
les
2 an
d 3]
; W
o rid
Ban
k [1
992]
.
1 0, 0 C)

POVERTY AND INEQUALITY/N DEVELOPING COUNTRIES 15
Table 2: Trends in absolute poverty in developing countries, 1970-85(exci. China)
Region Incidence of poverty No. of poor(%) Millions
1970 1985 1970 1985
All developing countriesTotal 52 44 944 1156Rural 59 49 767 850Urban 35 32 177 306
AsiaTotal 56 43 662 737Rural 61 47 552 567Urban 42 34 110 170
Latin AmericaTotal 40 36 116 146Rural 62 45 75 57Urban 25 32 41 89
AfricaTotal 46 49 166 273Rural 50 58 140 226Urban 32 29 26 47
Source: United Nations [1989, Table 24, p. 39].
Latin America are reasonably robust, those for sub-Saharan Africa and forthe Middle East and North Africa are likely to be quite imprecise. Thisfact should be borne in mind in comparing poverty statistics inter-regionally or over time.6
6Aggregate estimates such as those in Tables 1 and 2 usually involve extrapolation
from a sample of countries for which the necessary data are available to other countries forwhich they are not. The resulting group estimate may therefore be imprecise. It is unfor-tunately not common in the literature to report the precision of point estimates of poverty.A notable exception is contained in Ravallion et al. [199 lal. They describe the proceduresused to arrive at the regional estimates of poverty incidence for 1985 published in WorldBank [19901 and provide the 95 per cent confidence interval for each. The interval tendsto be smaller for regions for which the sample countries cover a larger part of the regionalpopulation, and vice versa. For East Asia, for example, where 97 per cent of the populationwas covered, the confidence interval was extremely narrow, from 21.1 to 21.5 per cent fora point estimate of2l .3 per cent. This implies that the point estimate is extremely accurate.By contrast, the 95 per cent confidence interval for sub-Saharan Africa, where only 6 percent of the regional population was covered, was extremely wide, from 18.6 to 75.7 per centfor a point estimate of 46.9 per cent. The estimate for the Middle East and North Africaregion was almost equally imprecise [ibid., pp. 354-355]. One implication of such impreci-sion is that differences in the estimated incidence may not be statistically significant. Thisdepends not only on the size of the difference, but also on the variability of the estimates.
Tab
le 3
: P
over
ty tr
ends
in
larg
era
deve
lopi
ng c
ount
ries,
197
090b
% in
cide
nce)
Cou
ntry
N
atio
nal
Urb
an
C19
70
C19
80
C19
90
C1970
C1980
C1990
C1970
C1980
Cl 990
Eas
t Asi
a 19
.8
8.6
—
1.9
0.4
—
27.6
11
.5
Chi
na
—
15.8
—
50.7
11
.2
19.7
5.
3 8.
3
—
58.5
44
.3
44.6
13
.1
18.5
In
done
sia
57.1
—
39.1
28
.6
17.4
—
29
.0
20.1
—
28
.4
16.4
20
.0
Kor
ea, D
PR
9.8
4•5C
16
.2
10.4
4.
6c
27.9
9.
0 44
C
Kor
ea, R
ep.
Mal
aysi
a Ph
ilipp
ines
of
49.3
57
.0
61.6
29.0
—
—
23.0
17.3
57
.0
49.5
23
.7
21.3
43
.0
51.3
16
.0
12.6
—
— 7.5
8.3
46.0
40
.0
6.7
58.7
63
.0
66.1
43
.0
37.4
—
—
25.8
22.4
63
.0
54.1
33
.9
Tha
iland
39
.0
—
—
—
—
—
—
60.0
V
ietn
am
—
—
Sout
h A
sia
73.0
51
.6
81.4
66
.0
56.0
82
.9
73.8
51
.0
Ban
glad
esh
—
71.2
48
.1
70.5
45
.9
—
46.2
62.3
39
.7
58.2
37
.8
—
58.8
72
.7
50.8
72
.3
48.7
In
dia
56.3
45
.6
37.4
40
.0
29.2
—
36.7
—
28.1
40
.0
19.4
—
47.8
—
40
.4
40.0
32
.7
—
Mya
nmar
N
epal
Pa
kist
an
—
—
—
32.9
21
.0
42.6
20
.0'
—
—
22.2
29.0
19.2
25.0
—
—
35.5
38.0
43.1
31.0
—
30.0
—
42
.0
32.0
19
.6
—
14.7
43.0
—
29.0
27
.6
—
36.1

Cou
ntry
N
atio
nal
Urb
an
Rur
al
C19
70
C19
80
C19
90
C1970
C1980
C1990
C1970
C1980
C1990
Latin A
mer
ica
& t
he C
arib
bean
A
rgen
tina
8.0
10.4
15
.5
5.0
8.5
14.6
19
.0
19.0
19
.7
Bra
zil
49.0
45
.1
45.3
35
.0
33.5
37
.7
73.0
68
.2
65.9
39
.3
24.4
35
.9
—
17.0
24
.0
—
26.5
26
.5
—
34.1
40
.9
Chi
le
17.0
—
40
.0
12.0
—
—
25
.0
—
—
Col
ombi
a 45
.0
42.3
41
.6
38.0
39
.7
40.2
54
.0
47.7
44
.5
41.0
24
.0
25.0
0
—
—
13.0
8.
0 C
uba
35.0
E
cuad
or
—
51.0
—
40
.0
—
—
65.0
M
exic
o 34
.0
29.9
20
.0
23.3
—
49
.0
42.9
—
16
.6
22.6
Pe
ru
50.0
52
.9
59.9
28
.0
38.4
52
.3
68.0
79
.7
72.1
V
enez
uela
25
.0
25.0
32
.2
20.0
19
.5
29.7
36
.0
43.0
42
.2
Sub-
Saha
ran
Afr
ica
Ang
ola
65.0
C
amer
oon
—
30.0
—
—
15
.0
—
40.0
C
ôte
d'Iv
oire
—
28
.0
—
—
30.0
—
26
.0
—
—
31.0
—
—
—
—
Eth
iopi
a —
64
.0
—
60.0
—
65
.0

Tab
le 3
: P
over
ty t
rend
s in
lar
gera
dev
elop
ing
coun
trie
s, 1
9709
0b(%
in
cide
nce)
(co
ntd.
)
Sub
-sah
aran
A
fric
a (c
ontd
.)
Gha
na
Ken
ya
Mad
agas
car
Moz
ambi
que
Nig
eria
Su
dan
Tan
zani
a, U
R
Uga
nda
Zai
re
Mid
dle
Eas
t and
Nor
th A
fric
a A
fgha
nist
an
Alg
eria
E
gypt
Ir
an
Iraq
M
oroc
co
Saud
i Ara
bia
Syri
a T
urke
y Y
emen
—
44.0
—
44.0
—
50
.0
—
—
55.0
—
38
.0
—
—
30.0
32
.0
—
30.0
33
.8c
54.0
28
.2
—
43.0
34
.0
—
59.0
—
10.0
—
—
50.0
—
—
—
40.0
—
33
.0
—
15.0
—
18.0
—
—
20.0
—
—
30.4
34
.0c
34.0
15
.4
—
38.0
28
.0
28.0
—
37.0
—
43.3
—
54
.0
—
55.0
—
50
.0
—
40.0
—
75
.0
—
27.0
—
80.0
—
36.0
50.9
29
.7
68.0
41
.4
—
40.0
45
.0
45.0
—
60.0
Cou
ntry
N
atio
nal
Urb
an
C19
70
C19
80
C19
90
C19
70
C19
80
Rur
al
C19
90
C19
70
C19
80
C19
90
25.0
70.0
33.0
25.0
33
.7
32.0
14.0
30.0
1
Cou
ntry
N
atio
nal
Urb
an
C19
70
C19
80
C19
90
C1970
C1980
Rur
al
C19
90
C1970
C1980
C1990
Cen
tral
and
Eas
tern
Eur
ope
Hun
gary
Po
land
Y
ugos
lavi
a
—
13.8
13
.8
—
11.1
22
.7
—
17.2
23
.8
Not
es:
With
a p
opul
atio
n of
ten
mill
ion
or m
ore
in 1
990.
Fo
r sev
eral
cou
ntri
es,
alte
rnat
ive
estim
ates
fro
m d
iffe
rent
sou
rces
are
pro
vide
d in
row
s whe
n si
gnif
ican
t dif
fere
nces
exi
st a
mon
g th
em ab
out t
he e
xten
t
of p
over
ty o
r its
cha
nges
. T
he d
ata
in e
ach
row
of t
he ta
ble
are
gene
rally
fro
m th
e sa
me
sour
ce a
nd t
ime
seri
es a
nd a
re t
hus
com
para
ble.
T
hose
in
diff
eren
t ro
ws,
how
ever
, m
ay n
ot be
com
para
ble,
eith
er a
cros
s co
untr
ies
or w
ithin
the
sam
e co
untr
y as
dif
fere
nt s
ourc
es t
end
to u
se d
iffe
rent
pov
erty
lines
and
met
hods
, to
men
tion
only
the
two
mos
t com
mon
sou
rces
for
dis
crep
ancy
. Si
nce o
ur m
ain
focu
s is
on
tren
ds ra
ther
than
on
a co
mpa
riso
n of
poin
t est
imat
es e
ither
with
in o
r be
twee
n co
untr
ies,
the
lack
of c
ompa
rabi
lity
acro
ss r
ows
is n
ot a
maj
or c
once
rn.
C R
efer
s to
198
4.
Sour
ces:
Tab
atab
ai &
Fou
ad [1
9931
and
, fo
r mos
t L
atin
Am
eric
an c
ount
ries
, Ps
acha
ropo
ulos
et a
l. [1
993]
.
tO

20 THEPOVERTY AGENDA: TRENDS AND POLICY OPTIONS
The most recent and probably the best estimates of the extent ofpoverty and its distribution across developing regions are provided inTable 1. The widely-quoted figures of World Bank [1992] appear in thelast two columns of the table and the rest of the table represents an updatedset of estimates by World Bank staff which uses a larger sample ofcountries7 and provides estimates of the incidence for different povertylines ranging from $21 to $60 per person per month in 1985 purchasingpower parities (PPP) 8 The lowest figure represents approximately thepoverty line of India. The next lowest ($30.42) is more representative ofthe poverty lines in developing countries and corresponds to the dollar-a-day poverty line (370 PPP dollars per person per year at 1985 prices) thatwas used by the World Bank [1992]. Higher poverty lines may be moreappropriate for middle-income countries and the highest figure of 60 PPPdollars per person per month has been used by another recent World Bankstudy on poverty and income distribution in Latin America [Psacharopouloset al., 1993].
According to the World Bank, the total number of poor people in thedeveloping world was a little over 1.1 billion in 1990 (Table 1, lastcolumn). This total represents nearly one-third of the population ofdeveloping countries and is based on the dollar-a-day poverty line. Thecorresponding poverty gap, i.e. the average income shortfall of the poor,is estimated at just under 10 per cent of the poverty line [World Bank,1992]. One-half of the poor is in South Asia and another 15 per cent inEast Asia. Sub-Saharan Africa accounts for 19 per cent of the poor, LatinAmerica for 10 per cent, and the Middle East and North Africa for theremaining 6 per cent. The high share of South Asia is due largely to thesize of its population but the incidence of poverty in this region is also thehighest of any developing region, with roughly 60 per cent of the
The World Bank's first set of regional estimates in this series was for 1985 and wasbased on a sample of 22 countries [World Bank, 19901. A new set of estimates referringto 1985 and 1990 was based on a larger sample of 31 countries [World Bank, 1992]. Chenet al. [19931 increase the sample size further to 40 developing countries for whichcomparable data could be assembled. For 18 of these, survey data were available for twoperiods during 1980-91. For details of the samples and the methodology of World Bankestimates, see, in addition to the above references, Chan [1990], Ravallion et al. [1991a1,and Ravallion et al. [1991b].
8Country-specific poverty lines usually reflect local conditions and differ substantially
concerning real purchasing power from one country to another [World Bank, 1990, Figure2.1, p. 27; Ravallion et al., 1991a1. Even in a single country, poverty lines may differ inreal terms over time as incomes rise. International comparisons of poverty, therefore, relyincreasingly on purchasing power parity conversion factors to ensure that the same povertyline is used in all countries.

POVERTY AND INEQUALITY IN DEVELOPING COUNTRIES 21
population living below the poverty line of $30.42 per person per year in1985 PPP dollars ($370 per year). Poverty affects over one-half of thepopulation in sub-Saharan Africa, about a quarter in Latin America andsome 15 per cent in East Asia.
A comparison of estimates for 1985 and 1990 shows little overallchange in recent years, suggesting that the number of poor in developingcountries has grown roughly in line with the growth of population, i.e.about 2 per cent a year. This conclusion remains valid regardless of thepoverty line used. The relative ranking of the regions by povertyincidence, however, is subject to some slight variation depending on theexact choice of the poverty line. South Asia had the highest rate of povertyof any region (except for sub-Saharan Africa at the lowest poverty line in1990), followed by sub-Saharan Africa. The region with the lowestincidence is East Asia (except for Latin America at the higher poverty linesin 1985). Poverty appears to have fallen in East and South Asia and risenin Latin America and sub-Saharan Africa between 1985 and 1990. In viewof the imprecision of point estimates for sub-Saharan Africa, theirdifference over time is probably insignificant but for Latin America itappears to reflect a real rise in poverty in the latter half of the 1980s. Thisis corroborated by other estimates (see below).9
Evidence on trends over a longer period since 1970 may be found inTables 2 and 3 where urban/rural breakdown is also provided. The detailsof the methodology underlying the estimates of the United Nations inTable 2 are not available and in Table 3 they vary by country.
Table 2 shows that, while the number of those living in absolutepoverty in developing countries (excluding China) rose by about one-fifthbetween 1970 and 1985, the incidence of poverty dropped from 52 per centto 44 per cent. The improvement was greater in the rural than in the urbansector. Nevertheless, because of the higher incidence of rural poverty andthe higher share of the rural sector in total population, the bulk of the poor(nearly three-quarters of the total) still live in rural areas. Only in Latin
The Middle East and North Africa region has been ignored in these comparisonsbecause of the inconsistency between the results of different World Bank estimates. Usingthe dollar-a-day poverty line, it may be seen in Table 1 that, while Chen et al. [1993]arrive at figures below 5 per cent for this region, the World Bank [1992] estimates exceed30 per cent for both 1985 and 1990. The source of this discrepancy is not clear but it maybe due, at least in part, to the variability inherent in small samples. The sample for thisregion covered less than a quarter of its population while this share was about a third insub-Saharan Africa, more than 80 per cent in Latin America and more than 90 per cent inEast and South Asia.

22 THE POVERTY AGENDA: TRENDS AND POLICY OPTIONS
America is the share of the population in the rural sector comparativelylow (around a quarter).
The decline in the incidence of poverty is unlikely to have beenuniform throughout the period since 1970. Much of it probably occurredduring the 1970s before the world economic crisis began. It is only in Asiathat the sustained growth of agricultural and non-agricultural sectors intothe 1980s is likely to have permitted a continued reduction in povertylevels in both urban and rural areas. Elsewhere, poverty intensifiedalthough, given the differential performance of major sectors, this wasmore true of the urban than rural areas. Africa is the only region in whichrural poverty is estimated as having risen between 1970 and 1985.
Table 2 also reveals two broad trends that appear now to haveestablished themselves as long-term trends: the Africanization and theurbanization of poverty. In 1970, some 17.6 per cent of the total numberof poor people in developing countries (excluding China) were in Africa;by 1985 this share had increased to 23.6 per cent. The two main causativefactors were the more rapid growth of population in Africa relative to therest of the developing countries and the region's poorer economic perform-ance. Prospects appear to be equally grim for the future. According toWorld Bank estimates, sub-Saharan Africa requires a minimum rate ofgrowth in aggregate consumption of 4.7 per cent a year to achieve areduction in the number of the poor. The actual rate of growth during1980-90 was only 0.8 per cent and the projected rate for 1993-2000 is 3.3per cent per annum, a shortfall of 1.4 percentage points. By contrast, theprojected rate of consumption growth exceeds the minimum required rateby 5.3 percentage points for East Asia and the Pacific, by 1.5 percentagepoints for Latin America and the Caribbean, and by 1.6 percentage pointsfor South Asia [World Bank, 1993, Table 2, p. 6]. Thus, while it isprojected that the number of poor in all developing regions will fall in thecoming years, the ranks of the poor in sub-Saharan Africa are expected toswell.
The urbanization of poverty is also increasing. The share of the urbanareas in the total number of poor people in developing countries rose from18.8 per cent in 1970 to 26.5 per cent in 1985. The rapid growth of theurban population, fuelled by rural-to-urban migration, is, of course, a keyfactor in explaning this trend but the faster growth of the urban economyacted to some extent as a compensatory factor in periods when theeconomy flourished. With the onset of the crisis, however, the industrialoutput in most low- and middle-income countries (which is concentratedin cities) suffered generally greater setbacks in the 1980s than agriculture,the main livelihood of the rural population. This urbanization of poverty

POVERTY AND INEQUALITY/N DEVELOPING COUNTRIES 23
should not be seen as an argument in favour of the intensification of theurban bias. It is rooted in the development problems of the rural areas andaddressing the latter would reduce pressure for rural-to-urban migrationand contribute to the alleviation of urban poverty. It should also be notedthat amenities in urban areas are generally better than in rural areas, anadvantage that is not captured by the poverty statistics that rely only onincome or expenditure data.
Associated with the trend towards the urbanization of poverty, butdistinct from it, is the tendency towards an equalization of povertyincidence in rural and urban areas of the developing world. The ruralincidence has of course always been higher in all developing countries and,a fortiori, at the level of aggregates. This continues to be the case.However, there has been a tendency towards convergence of these rates.As figures in Table 2 show, the difference between the rural and urbanincidence fell from 24 to 17 percentage points between 1970 and 1985 forthe developing countries as a whole (excluding China). Regionalexperiences appear to have been diverse, however, with Asia and parti-cularly Latin America conforming to this trend but Africa experiencing thecontrary. It does not appear that factors related to the economic crisisexplain the overall trend and regional differences in this regard althoughthey did play a part, particularly in Latin America. However, this is notthe case in Africa.
The data in Tables 1 to 3 also permit a number of observations aboutregional experiences. In East Asia, the available evidence points to ageneral tendency for the incidence of poverty to decline during the pasttwo decades, in both urban and rural areas. This is perhaps best seen fromdata on individual countries in Table 3 although the regional tables sub-stantiate it as well. Trend data on a few countries are lacking (North Koreaand Vietnam) or are somewhat inconsistent (the Philippines). But foralmost all other larger countries shown in the table the decline has beensteady and fairly rapid. Both urban and rural areas shared in thisimprovement. The incidence of urban poverty in East Asian countries isnow generally below 10 per cent and that of rural poverty is below 20 percent.
The situation in South Asia is mixed. The long-term downwardpoverty trend in India is by now widely recognized, although the patternof its fluctuations and pace remain in dispute. Much the same appears toapply to Pakistan. In Bangladesh, most sources report a rapid reduction inpoverty in the 1980s but Ravallion [1990] has questioned this conclusionon the grounds that the poverty line used, notably by the BangladeshBureau of Statistics, does not remain constant in real terms over time and

24 THE POVERTY AGENDA: TRENDS AND POLICY OPTIONS
that the growth of mean consumption is exaggerated by the householdexpenditure surveys. His estimates, reported in the second row, find onlya slight decline in the urban areas. In Nepal and Sri Lanka, evidencegenerally points to an upward long-term trend in poverty.
What is rather significant in the overall Asian experience, in contrastto that of other regions, is that poverty alleviation efforts have becomeincreasingly more effective over the past three decades, being leastsuccessful in the 1 960s and most successful in the 1 980s, at least as far asrural areas are concerned. This pattern of improvement is linked to thegrowth performance of the region but not in a simple way. Based on ananalysis of the experience of individual countries since 1960, Islam [1990]argues that growth as such is neither necessary nor sufficient as a meansof reducing poverty. It is rather sustained growth of a type that emphasizesemployment generation that seems to trickle down to the poor. Dis-enchanted with the growth processes of the type pursued in the 1960s,which failed to benefit the poor, many Asian countries began subsequentlyto modify their strategies to emphasize broad-based and labour-intensiveproduction, particularly in the export sector.
In Latin America, the evidence points to some reduction of poverty inthe 1970s but much of that gain appears to have evaporated during the1980s as most countries witnessed a rise, or an insignificant change, inpoverty incidence. Time series data from both the ILO and the EconomicCommission for Latin America and the Caribbean (ECLAC) suggest thatthe incidence of poverty in Latin America declined from 40 per cent in1970 to 33-35 per cent in 1980 [ILO/PREALC, 1988; ECLAC, 1990].This improvement, however, was largely nullified in the 1 980s. In a recentstudy that uses the same methodology as that of the World Bank but ahigher poverty line than the ILO and ECLAC, Psacharopoulos et al. [1993]have estimated that the head-count index for Latin America rose from 26.5per cent in 1980 to 31.0 per cent in 1989, with a poverty line of 60 dollarsin 1985 PPP. The corresponding figures for urban areas were 16.8 and22.0 per cent and for the rural sector 45.1 and 53.4 per cent. Thedeterioration in the 1980s occurred in both urban and rural areas, althoughperhaps relatively less in the latter. The pattern of improvement in the1970s and deterioration in the 1980s revealed above is consistent with theestimates given in Tables 1 and 2.
Country level estimates for sub-Saharan Africa and the Middle Eastand North Africa are sparse and, except in a couple of cases, confined toobservations relating to a single year. They thus provide no indication asto the pattern of changes over time. The regional estimates in Tables 1 and2 do provide some evidence on trends which suggests a slight increase in

POVERTY AND INEQUALITY/N DEVELOPING COUNTRIES 25
poverty incidence in sub-Saharan Africa over the past two decades, andalso in the Middle East and North Africa in the second half of the 1 980s.In view of the imprecision of the estimates, however, not much importanceshould be attached to the differences over time. As a result, the trends inpoverty in these two regions can only be discerned indirectly, by a con-sideration of such indicators as the growth rates of GNP per capita, realwages and agricultural output, the evolving situation of employment andvarious social indicators on which data may be available. A broad rangeof income and employment-related indicators suggests that the povertysituation in sub-Saharan Africa has been deteriorating for almost twodecades and in the Middle East and North Africa considerable improve-ment in several countries in the 1970s was halted, or even reversed, in the1980s)°
II. Inequality
Poverty and inequality are not the same thing and the concept of"absolute poverty" is in part an attempt to differentiate between the twonotions more clearly. But even an "absolute" poverty line is really notquite so absolute after all, as suggested by the positive correlation betweenthe level of national poverty line and the average income of the country
'° While the evidence related to income and employment trends in sub-Saharan Africapoints unambiguously to a deterioration for nearly two decades, there is sharp controversyas to whether other social indicators (life expectancy, nutritional status, calorieconsumption, child mortality, morbidity, school enrolment, etc.) confirm or contradict thistrend. In a recent study concerned with the evolution of the state of welfare in LatinAmerica and sub-Saharan Africa in the 1980s, Berg et al. [1993] contend that: "... by mostavailable measures of human welfare the 1 980s have not witnessed a general deteriorationin the condition of the poor in Latin America and Africa. Compared with the 1970s, in the1980s Latin Americans on average probably consumed more calories, suffered less mal-nutrition, lived longer, were more fully immunized against infectious diseases, and sawmore of their infants and young surviving to adulthood. And in most countries of the regionaccess to primary education did not decline, though real public spending per pupil did fall.Much the same can be said about Africans. Personal consumption fell more there than inLatin America and calorie consumption did not evolve so favorably. But child mortalityrates continued to fall throughout the continent, life expectancy continued to increase,immunization spread even more dramatically than in LAC (Latin America and theCaribbean), and school enrolments continued to rise [Berg et al., 1993, p. 5 (emphasis inthe original)]. The evidence in this study and the interpretations of the authors deservecareful scrutiny. It may be pointed out, however, that different social indicators refer todifferent dimensions of a complex reality and their changes need not always be consistent,particularly in the short run. The weakness of the underlying data and the lags involvedfurther complicate any comparison.

26 THE POVERTY AGENDA: TRENDS AND POLICY OPTIONS
[World Bank, 1990, P. 27]. The concept of relative poverty, however, isclosely and explicitly linked to the distribution of income and a considera-tion of poverty trends can be informed by a concurrent examination oftrends in inequality, both at the national level and internationally.
The evidence on income (or expenditure) inequality and its changesin developing countries is rather more limited than on poverty and refers,more often than not, to the nation as a whole, with no breakdown intourban and rural sectors. It is not altogether clear why this should be thecase since distributional data are available when poverty is being estimatedand the calculation of measures of inequality poses fewer problems thanpoverty estimation. The explanation probably lies in the greater concernwith the lot of the less privileged members of the society than with theirposition relative to the richer sections of the population. Be that as it may,distributional statistics are becoming more widely available and it is usefulto consider what they show.
Unlike our review of poverty statistics, no major attempt has beenmade here to assemble a comprehensive set of distributional data fromsecondary sources. However, several compilations are readily available,mostly from the World Bank. Table 4 is based on data in the various issuesof the World development report and in several other works of the WorldBank staff which constitute inputs to it. This table, which resemblesTable 3 in that it is confined to developing countries with a population ofat least 10 million in 1990, reports the Gini coefficients of income (orexpenditure) distribution for three periods around the reference years 1970,1980 and 1990. The comparability of data across countries may be doubt-ful, but, as before, our concern is mainly with trends and limitingourselves to the World Bank data avoids some other problems of com-parability that could arise when data are taken from diverse sources.
The data in Table 4 permit several observations. The first is thatinequality in the distribution of income or expenditure tends to be morepronounced within Latin American countries than within countries in anyother region. The Gini coefficients in Latin America are typically in therange 0.5-0.6, with the richest 20 per cent of the population having anaverage income that is 10-15 times higher than that of the poorest 40 percent. In East and South Asia, the Gini coefficient is more likely to fall inthe range 0.3-0.4 and the income ratio of the richest 20 per cent relativeto the poorest 40 per cent tends to be closer to 5 than 10. (In OECDcountries this ratio is usually less than 5.) The countries in the Middle Eastand North Africa tend to fall in between although the number of observa-tions is small. The observations on sub-Saharan African countries are alsofew but they suggest considerable differences, an indication perhaps of the

POVERTY AND INEQUALITY IN DEVELOP!NG COUNTRIES 27
Table 4: Distributional trends in larger developing countries,b 1970-90 (Ginicoefficient)
Country C1970 C1980 C1990
East AsiaChina 0.33 0.36Indonesia 0.34 0.33Korea, Rep. of 0.33 0.39 0.34Malaysia 0.50 0.51 0.48Philippines 0.46 0.41Thailand 0.42 0.44
South AsiaBangladesh 0.28 0.30 0.29India 0.40 0.32 0.32Nepal 0.30Pakistan 0.37 0.31Sri Lanka 0.35 0.41 0.51Latin America & the CaribbeanBrazil 0.61 0.59 0.63Chile 0.45 0.57Colombia 0.51Mexico 0.56 0.52 0.55Peru 0.57 0.47Venezuela 0.49 0.43 0.44Sub-Saharan AfricaCôte d'Ivoire 0.35Ethiopia 0.32Ghana 0.37Kenya 0.57 0.56Senegal 0.53Sudan 0.44Tanzania, UR 0.42 0.59Uganda 0.33Zambia 0.43Zimbabwe 0.55Middle East and North AfricaAlgeria 0.39Egypt 0.40Iran 0.43 0.43Morocco 0.39 0.39Turkey 0.49Central and Eastern EuropeHungary 0.28 0.23Poland 0.27Yugoslavia 0.32 0.33 0.39Note: • With a population of ten million or more in 1990. b Countries for which no figures are available are
excluded.Sources: World Bank, World development report (various issues); Chan [1990]: Chen ci al. [1993]; Psacharopoulos
et al. [1993]; van Ginneken & Park [1984]; and, for Iran, Statistical Center of Iran [1990].
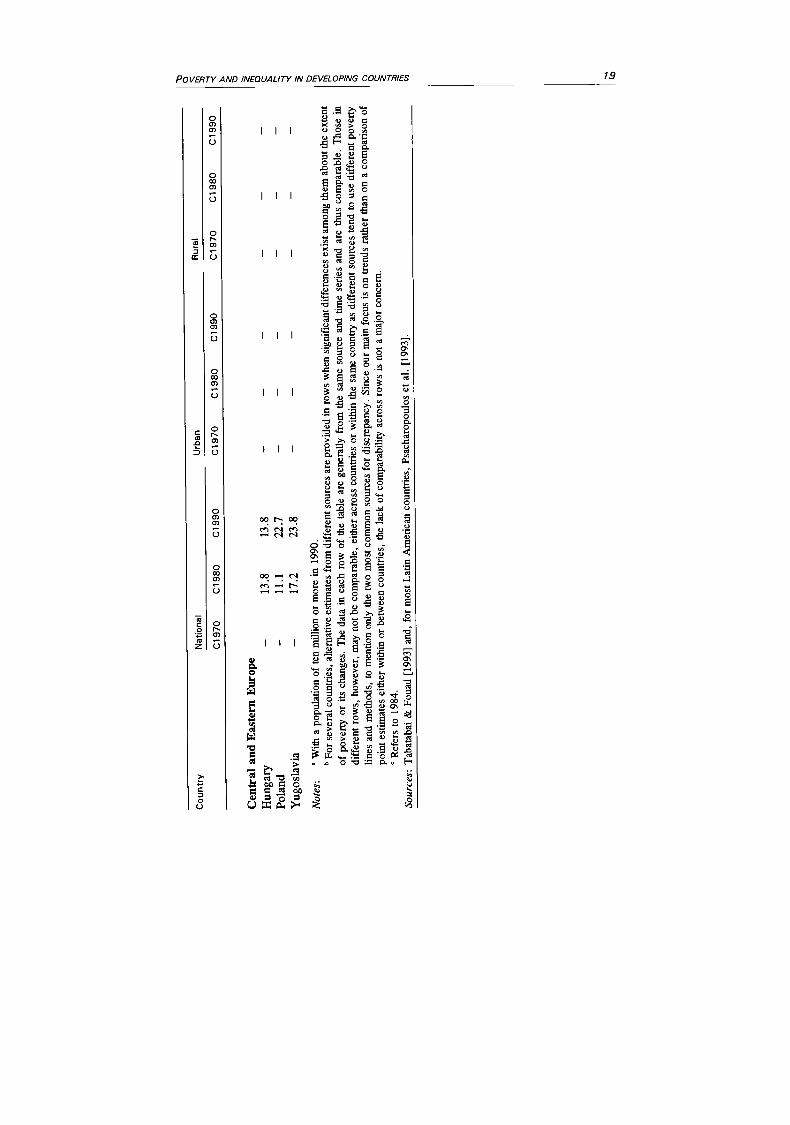
28 THEPOVERTY AGENDA: TRENDS AND POLICY OPTIONS
diversity of economic structures within the region. Although the tableincludes only three countries from Central and Eastern Europe, theirexperience is probably representative of the situation in the region ingeneral, before their recent transition to a market economy. Theseeconomies were characterized by a high degree of equality in the distri-bution of income, unmatched in virtually any developing country.
It is somewhat more difficult to make valid generalizations abouttrends at the regional level because of sparsity of time series, particularlyduring the 1970s. Only in Asia and Latin America is it possible to discernsome tentative conclusions. In Asia, the Gini coefficients changed little inmost countries during the 1970s and 1980s and the number of cases whereinequality increased significantly is matched by a similar number ofsignificant improvements. The case of Sri Lanka is notable for the sharpand consistent deterioration over the two decades when the coefficient rosefrom 0.35 to 0.51.
In Latin America income distribution improved slightly during the1970s in the three countries for which data are available (Brazil, Mexicoand Venezuela). This weak trend was halted or reversed in the 1980s.Significant changes appear to have occurred over the period of two decadesin Chile where income distribution became considerably more unequal andin Peru where the opposite appears to have happened. Assessing the trendsin the 1980s based on a sample of 12 countries for which observations attwo points in time were available, Psacharopoulos et al. [1993] find a risein income inequality in the majority of cases. (The data in the samplesometimes referred only to the urban sector or to the capital city alone.)The share in total income of the bottom 20 per cent of the population wentdown in all countries whose Gini coefficients increased, and it went up inall countries whose Gini coefficients decreased [ibid., p. 20]. Combinedwith the downward trend in average income, greater income inequalityleads to an accentuation of poverty, as observed earlier.
In the struggle for social justice it is not just the extent of disparitieswithin but also among countries that is of concern. In recent years severalattempts have been made to quantify the extent of income inequality in theworld as a whole and its evolution over the past three decades. Table 5reports alternative estimates from two authoritative sources which usedifferent methodologies and thus highlights the pitfalls involved inassessing the evolution of international inequality.
The more striking estimates are from the United Nations DevelopmentProgramme (UNDP) which reveal that the disparities in income betweenthe rich and the poor is startlingly wide and growing steadily. In 1960,

POVERTY AND INEQUALITY/N DEVELOPING COUNTRIES 2.9
Table 5: Distribution of world income by population groups, 1960-90
Year Qi Q2 Q3 Q4 Q5 Q5/Q1 Gini coeff.
UNDP (using dollar exchange rates)1960 2.3 70.2 30.5 (0.69)a1970 2.3 73.9 32.1 (0.71)1980 1.7 76.3 44.9 (0.79)1989 1.4 1.9 2.3 11.7 82.7 59.1 0.69 (0.87)
BIS, including China (PPP dollars)1960 5.0 6.2 7.3 17.9 63.7 12.7 0.521969 4.2 5.2 6.0 18.5 66.1 15.7 0.551979 3.3 5.9 7.0 18.9 64.9 19.7 0.551987 3.4 6.1 10.6 17.1 62.7 18.4 0.521990 3.4 6.0 11.5 16.3 62.8 18.5 0.52
BIS, excluding China (PPP dollars)1960 3.9 4.9 9.6 23.3 58.3 14.9 0.511969 3.3 4.0 8.8 24.8 59.1 17.9 0.531979 2.6 3.7 9.3 25.8 58.6 22.5 0.541987 2.9 3.6 8.8 22.0 62.7 21.6 0.551990 2.9 3.7 8.4 20.4 64.6 22.3 0.56Note: Gin! coefficients are calculated assuming uniform distribution within quintiles. Coefficients in parentheses
are UNDP estimates and appear to be in error. Correct figure could only be estimated for 1989 for whichdistribution in quintiles is available.
Sources: UNDP [1992, inside cover and pp. 34-36]; Bank for International Settlements [1993, p. 61], based on datafrom Summers & Heston [1991], IMF International financial statistics, World Bank World tables and BISestimates.
countries with the richest 20 per cent of the world population accounted for70 per cent of the global GNP, which is 30 times higher than the share ofcountries with the poorest 20 per cent of the world population. By 1989,their share had grown to 83 per cent, or almost 60 times higher than thatof the poorest 20 per cent who received only 1.4 per cent of world income(Table 5). These figures actually understate the extent of inequality amongpeople since they are based on average income of countries and ignoreinequalities within nations. If these were taken into account, UNDPestimates that the richest 20 per cent of the world population receives wellover 150 times the share of the poorest 20 per cent [UNDP, 1992, p. 34].Table 5 also reports the Gini coefficients as estimated by UNDP. How-ever, these appear to be based on erroneous calculations (hence theparentheses). The corrected coefficient for 1989 (the only year for whichit could be calculated on the basis of distribution of income by quintile andon the assumption of equal distribution within each quintile) is 0.69 which,although considerably lower than the 0.87 reported by UNDP, stillsuggests that income is distributed far more unequally in the world than in

30 THE POVERTY AGENDA: TRENDS AND POLICY OPTIONS
any single country, even one with the most inegalitarian distribution of
income (cf. Table 4).The UNDP estimates above are based on national GNP figures con-
verted into dollars at the prevailing exchange rates. A more satisfactoryapproach in making international comparisons uses real purchasing powerparities (PPP) for conversion and the second and third sections of Table 5
report estimates based on this approach. Theseestimates, furthermore, aregiven for the world as a whole but also after excluding China. They reveal
a rather lower degree of inequality than the above UNDP estimatesalthough it remains considerable. Whether or not China is included, theseestimates also suggest growing inequalities in the 1960s and 1970s, if oneconsiders the ratio of share of the richest 20 per cent to that of the poorest20 per cent (Q5!Q1), but some decline or a levelling off duringthe 1980saccording to whether China is included or not. The influence of China is
particularly evident if one considers the trends in the Gini coefficients.Without China, the Gini coefficient has been rising steadily throughout the
past three decades, from 0.51 in 1960 to 0.56 in 1990. With China, acertain decline is noticeable during the 1980s as a result of the remarkable
growth of the Chinese economy since the late 1970s (reflected in the sharp
increase in the share of the middle quintile from 7.0 to 11.5 per cent
between 1979 and 1990).
IlL Conclusions
The main conclusions of this chapter may be summarized as follows:
(a) For a reasonable poverty line of a dollar-a-day per person (at the 1985
PPP exchange rates), it is estimated that about one-third of thepopulation of developing countries lives in poverty. The incidence ofpoverty is now highest in South Asia and in sub-Saharan Africa (50-60 per cent of the population), and lowest in East Asia (about 15 per
cent).
(b) The incidence of poverty in developing countries as a whole hasgenerally tended to decline over the past two decades although the
pace of the decline has not been sufficiently fast to prevent thenumber of the poor from rising steadily. The situation variesconsiderably by region. The overall tendency is largely influenced bythe steady improvement in most Asian countries, particularly those inEast Asia. In Latin America, the small gains registered in the 1970swere soon lost in the wake of the economic crisis in the 1980s.Trend

POVERTY AND INEQUALITY IN DEVELOPING COUNTRIES 31
data on poverty in sub-Saharan Africa are not sufficiently ample oraccurate to discern its evolution in this region directly but a host ofproxy indicators of income point to a deterioration in the povertysituation.
(c) Although most of the poor live in Asia, particularly in South Asia,there is an unmistakable trend towards the Africanization ofpoverty,with the share of sub-Saharan Africa in the total number of thepoorrising steadily. However, the incidence of poverty in this region isstill somewhat lower than that in South Asia.
(d) Poverty is still concentrated mostly in rural areas in all regionsexceptLatin America where the number of rural and urban poor is nowroughly equal. Most Latin Americans, however, live in the urbanareas and rural poverty incidence is still higher than urban incidence.There is a broad but weak trend towards a convergence of povertyincidence in urban and rural areas of most regions.
(e) Income distribution statistics are less readily available than thestatistics of poverty. The World Bank data at the national level,considered in this chapter, do not allow solid generalizations.Experiences vary by region and in different time periods. In the worldas a whole, however, while different sources provide differentestimates of the extent of inequality in the distribution of income, theyagree that this distribution has tended to become increasingly moreunequal since 1960.
Bibliographical references
Bank for International Settlements. 1993. 63rd Annual Report. 14 June. Basle.
Berg, E. et at. 1993. Structural adjustment and the poor in the 1980s: Trends in socialconditions in Latin America and Africa. Report prepared for the US Agency forInternational Development. Bethesda, Maryland, Development Alternatives, Inc.
Chan, E. 1990. "A compendium of data on poverty and income distribution". Backgroundpaper for the World development reportl99O mimeo. Washington, DC, World Bank.
Chen, S. et al. 1993. "Is poverty increasing in the developing world?"Policy ResearchWorking Paper WPS 1146. Washington, DC, World Bank.
Economic Commission for Latin America and the Caribbean (ECLAC). 1990. Magnitudde la pobreza en America Latina en los años ochenta. LC/L.533, 31 May. Santiagode Chile.

32 THE POVERTY AGENDA: TRENDS AND POLICY OPTIONS
Foster, J. et a!. 1984. "A class of decomposable poverty measures", in Econometrica,Vol. 52, No. 3, May, pp. 76 1-766.
Ginneken, W. van; Park, J. (eds.). 1984. Generating internationally comparable incomedistribution estimates. Geneva, ILO.
ILO. 1976. Employment, growth and basic needs: A one-world problem. Geneva.
ILO/PREALC. 1988. Meeting the social debt. Santiago de Chile.
Islam, R. 1990. "Rural poverty, growth and macroeconomic policies: The Asianexperience", in International Labour Review, Vol. 129, No. 6, pp. 693-714.
Psacharopoulos, G. et a!. 1993. Poverty and income distribution in Latin America: Thestory of the 1980s. June. Washington, DC, World Bank.
Ravallion, M. 1990. "The challenging arithmetic of poverty in Bangladesh", in BangladeshDevelopment Studies (Dhaka), Vol. 18, No. 3, September, pp. 35-53.
Ravallion, M. et al. 1991a. "Quantifying absolute poverty in the developing world", inReview of Income and Wealth (New Haven), Series 37, No. 4, December, pp. 345-361.
Ravallion, M. et al. 1991b. "Quantifying the magnitude and severity of absolute povertyin the developing world". PRE Working Paper 587. Washington, DC, World Bank.
Statistical Center of Iran. 1990. "Morouri bar shakhes'haye nabarabariye tozieh daramaddar kolle keshvar, manategh shahri va manategh roustaiee: 1361-68" (A review ofindicators of income inequality at the national, urban and rural levels: 1982-89)",mimeo. Teheran. Internal publication (in Farsi).
Singh, A.; Tabatabai, H. (eds.). 1993. Economic crisis and Third World agriculture.Cambridge, Cambridge University Press.
Summers, R.; Heston, A. 1991. "The Penn World Table (Mark 5): An expanded set ofinternational comparisons, 1950-88", in Quarterly Journal of Economics (Cambridge),Vol. 106, No. 2, May, pp. 327-368.
Tabatabai, H.; Fouad, M. 1993. The incidence of poverty in developing countries: An ILOcompendium of data. Geneva, ILO.
UNDP. 1992. Human development report. New York, Oxford University Press.
United Nations. 1989. Report on the world social situation. New York.
World Bank. 1990. World development report. New York, Oxford University Press.
—. 1992. World development report. New York, Oxford University Press.
—. 1993. Implementing the World Bank's strategy to reduce poverty: Progress andchallenges. New York, Oxford University Press.

3 Rural institutions andpo verty in A s/a
Rizwanul Islam1
I. Introduction
The growth performance of a number of Asian countries during thelast two decades has been quite impressive. Many of them have alsoachieved success (albeit in varying degrees) in alleviating poverty over thisperiod. And yet, Asia as a whole has the dubious distinction of being thecontinent which nurtures the largest concentration of poor people. Esti-mates at the beginning of the current decade range anywhere from 800million to about one billion persons who are living below the poverty linein the region; and half of that number may be said to be living under fairlyabject conditions of absolute poverty.
Poverty can be conceptualized and measured in various ways; and theextensive research done in the last couple of decades on definition,estimation and analysis of poverty incidence is still in the process ofevolution. Measures of poverty range from the simple head-count ratio(11CR) to the more sophisticated measures which are distributionallysensitive, in the sense of assigning higher weights to those among the poorwho are further away from the poverty line — thereby capturing notmerely the incidence, but also the intensity of poverty. Even for measuresbased on 11CR, the poverty line can be specified in different ways.
Fashion in development economics has changed several times in thelast three decades; and with that has changed the prescriptions for andexplanations of poverty alleviation. During the 1960s, the focus ofattention was growth; and the prescription was that rapid economic growthwill lead to increases in incomes of the poor. The disappointing per-formance in alleviating poverty despite respectable rates of growthachieved by many countries during the 1960s led to a rethinking of
'Director, South Asia Multidisciplinary Advisory Team (SAAT), International LabourOffice, New Delhi.

34 THE POVERTY AGENDA: TRENDS AND POLICY OPTIONS
strategies; high growth was no longer considered adequate for the purposeof eradicating poverty. Indeed, many thought that factors contributing tohigh growth could even be harmful to the poor. Strategies of "redistri-bution with growth", "basic needs satisfaction", etc. were the products ofsuch soul-searching in the early 1970s. By the 1980s, however, growthwas back to its throne; and it is now being regarded by many as a neces-sary condition for alleviating poverty.
An earlier study by the present author [Islam, 1990] analysed the roleof macro-economic policies in shaping up the rates and patterns of growthin ways so that the poor can also benefit in the process. That study,however, does not provide an understanding of the process of poverty atthe micro level and the role that can be played by factors other than macropolicies. This warrants an analysis of the role of institutions in under-standing the process of poverty and its alleviation. And since poverty inAsia is primarily a rural phenomenon, the present chapter intends toexamine the role of rural institutions in the poverty process in rural areas.
The chapter starts by providing a broad overview of trends in ruralpoverty in Asia (Section II). Since the major purpose of the chapter is notto provide alternative measures of poverty, this overview is based onsimple head-count ratios, and provides a picture of broad trends only,rather than estimates of the incidence of poverty. Links between poverty,economic growth and macro-economic policies are also analysed and abrief description of the profiles of the poor are provided in this section.The third section analyses the role of institutions in the process of povertyin rural areas. Some concluding observations are made in the fourthsection.
II. The record on alleviation of rural poverty in Asia:An overview
1. Trends in rural poverty2
While there is no universally accepted indicator of welfare, theconcept of poverty line is now widely used to quantify the magnitude ofabsolute poverty and to assess the degree of success in alleviating theproblem. Poverty lines that are used in the literature are, however, mostlycountry-specific and thus are not suitable for inter-country comparisons of
2 This section, as well as Section 11.2, is based on Islam [1990].

RURAL INSTITUTIONS AND POVERTY/N As/A 35
levels of absolute poverty or welfare. Other indicators like life expectancy,educational attainment, etc. can be more useful for the latter purpose.
Use of the poverty line indicator points to considerable differences inperformance between countries and between sub-periods within countries.Although studies using different methodologies sometimes come up withconflicting results concerning the trend in poverty in a single country andover a single sub-period, a review of such studies can provide at leastbroad indication of the direction of performance.
Most studies on Bangladesh [e.g. Khan, 1977a; Ahmad & Hossain,1985; Muqtada, 1986; Islam & Muqtada, 1986; Rahman & Haque, 1988]agree that the incidence of rural poverty increased between the early 1960sand the early and mid-1970s.3 There is also a broad consensus about thedeterioration in performance during the 1 970s. What happened in the1980s is, however, less clear. While some studies point towards asubstantial reduction in the incidence of poverty between 1981-82 and1985-86 [e.g. World Bank, 1987; Raliman & Haque, 1988] others contendthat, given the absence of any fundamental change in the policy regime, itis difficult to understand how this could have been achieved, and that sucha result could at least partly be explained by an underestimation of income(and hence an overestimation of poverty) that characterizes the householdsurvey of 198 1-82 [see for example, Osmani, 1989; BIDS 1990]. Develop-ments that have taken place in the rural economy (particularly in the labourmarket) during the 1980s should, however, provide support for thehypothesis of some improvement in the real income of the rural poor. Forexample, indices of real wages for unskilled labour in agriculture andsmall-scale rural construction increased between 1980-86 [World Bank,1 989a]. There was, of course, a short-term reversal of the performanceduring the late 1980s, particularly because of the devastating floods of1987 and 1988. In fact real wages in agriculture in both these years werelower than the level achieved in 1986 — although it was still higher thanthe levels of the early 1980s [World Bank, 1989a]. Also, the incidence ofpoverty increased between 1985-86 and 1988-89. The level of poverty in1988-89 was, however, lower than in the early 1980s [Hossain & Sen,1992]. Thus, the declining trend in poverty does not seem to be in doubt.
Lack of time series data on China makes it difficult to draw any firmconclusions regarding that country's performance in poverty alleviation inthe 1960s and 1970s. There are, however, studies contending that extremeforms of poverty (in the sense of inadequate food, clothing and shelter)
One exception is Alamgir [1978].
36 THE POVERTY AGENDA: TRENDS AND POLICY OPTIONS
which existed in pre-Revolution China had by and large disappeared duringthis period — although the vast rural population admittedly was leading anaustere life by the standards of the developed world [Khan, 1977b; Ghose,1987]. Precise quantification of the magnitude and trend in rural povertyin the 1980s is also made difficult by the confusion that exists regardingthe definition of poverty line. There is, however, not much doubt that theincidence of rural poverty has shown a discernible downward trend during1978-86 [Mukhopadhyay, 1990; Burki, 1990].
As far as India is concerned, research on poverty has attracted a lotof attention and a large number of studies exist — the results of which areoften conflicting. Ahluwalia's study [1984], for example, indicates that theincidence of rural poverty increased in the 1 960s and declined in the1 970s. Gupta and Datta [1984] uses a different poverty line and comes upwith an exactly opposite result — improvement in the 1960s and a deterio-ration in the 1970s. Using the same poverty line, Rao [1985] indicatesimprovement during the period 1977-78 to 1983-84. World Bank [1989b],on the other hand, indicates consistent reduction in the incidence of povertyduring the 1970s as well as the 1980s. It seems that, although there areconflicting results regarding trends in the 1 960s and the 1970s, there is notmuch disagreement about India's success in poverty alleviation during the1980s5 — although lively debates have taken place on the degree ofsuccess and the contributing factors.
On Indonesia also, there are conflicting results depending on thepoverty line that is used. One set of estimates using a poverty line basedon per capita expenditure expressed in terms of a rice equivalent providesthe following picture. In Java, the percentage of the rural populationclassified as "poor" continued to increase during the 1960s and the 1970sand declined in the 1980s . In the other islands, the percentage remainedroughly unchanged between 1964-65 and 1980 and declined thereafter.What is worth noting is that the percentage classified as "very poor"declined consistently and substantially over this entire period in Java aswell as other islands. Studies using poverty line based on the notion of percapita expenditure on a package of basic needs items indicate a decline inthe incidence of rural poverty for Indonesia as a whole during the 1970s
"It should be noted, of course, that China was hit by a disastrous famine during 1958-61.
ILO-ARTEP [1993] also confirms this.
Palmer [1977] and Lee [19841 provide support to the view regarding the 1960s and1970s, respectively.

RURAL INSTITUTIONS AND POVERTY IN AS/A 37
and the 1980s. Various World Bank reports and estimates by the CentralBureau of Statistics also come up with similar trends, although figures forindividual years vary considerably between the studies. A recent study[Tjondronegoro et a!., 1992] also indicates a secular decline in theincidence of absolute poverty during 1976-87.
On Malaysia, Lee [1977] indicates an increase in rural povertybetween the late 1950s and 1970. There was, however, a reversal of thistrend during the 1970s as indicated by Fredericks [1985]. The experienceof the 1980s is, however, mixed; while the situation worsened during1980-83, it recovered during 1983-85 [ibid.].
Lack of time-series data on Nepal makes it difficult to draw any firmconclusion regarding trends in poverty. Islam [1984a], after analysing datafrom various sources, came to the conclusion that the incidence of ruralpoverty must have increased during the 1 960s and the first half of the1970s. Estimates based on surveys conducted in 1976-77 (by the NationalPlanning Commission) and 1984-85 (by Nepal Rastra Bank) indicate acontinuation of the deteriorating trend during that period — evenaccounting for problems of comparability due to differences in samples andmethodologies of the two surveys [Bajracharya & Bajracharya, 1989].
On Pakistan also there are a number of studies on rural poverty, andmost of them [e.g. Naseem, 1977; Irfan & Amjad, 1984] agree that thesituation worsened during the 1960s. The trend was, however, reversed inthe 1970s and an improvement occurred during 1969-70/1979 [Irfan &Amjad, 1984]. The positive performance continued in the 1980s and afurther decline in the incidence of rural poverty took place during 1979-1984/85 [Malik, 1989]. During 1984-85 to 1987-88, there was anotherremarkable decline in rural poverty [Malik, 1992].
In the Philippines, the level of rural poverty remained unchangedduring the period 1965-71 [Mangahas, 1985]. World Bank [1980] indicatesa worsening of the situation during 1971-75. For the period 1971-85, thereare different estimates. While official (NEDA) estimates indicate adeteriorating trend, World Bank figures indicate no change. Balisacan[1992] reports a decline in rural poverty and an increase in urban povertyduring 1971-85. For 1985-88, he reports the opposite.7
In the context of Sri Lanka, the issue of poverty alleviation andstandard of living has been debated a great deal. Studies using the conceptof poverty line, however, indicate that the incidence of rural poverty
' Recent official estimates indicate an improvement between 1985 and 1989. See Burki[1990].

38 THE POVERTY AGENDA: TRENDS AND POLICY OPTIONS
declined in the 1960s [Fields, 1980] but increased in the 1970s[Wickramasekara, 1985]. There is also evidence of an increasingmalnutrition between 1975-76 and 1980-82, and more importantly, asubstantial decline in calorie intake among the poorer sections of thepopulation — notably the poorest 30 per cent [Sahn, 19871. Results fromthe Consumer Finance Surveys of 1978-79 and 1986-87 indicate that theincidence of poverty in rural areas increased substantially during thisperiod [van Ginneken, 1990]. A World Bank report [1989c] mentions thatin recent years, underemployment has risen substantially, and unemploy-ment is now at an estimated 18-20 per cent of the workforce (which ishigher than the figures for 1978-79 and 1980-81 reported by Bhalla andGlewwe [1986]. Moreover, data on agricultural wages provided by thisreport seem to indicate that during 1983-87, they have not been able tokeep pace with the increase in food prices. In the face of rising unemploy-ment and underemployment and no increase in real wages in agriculture,it is only natural that the incidence of rural poverty has increased.8
Thailand is one country on which there is very little disagreementabout trends in rural poverty during the 1960s and 1970s. While theincidence of rural poverty declined consistently during both the decades,[Meesook, 1976; Islam, 1 984b; Jitsuchon, 1990], the performance duringthe 1980s has been mixed. There was a reversal in the impressive down-ward trend for the first time during 1980-85. While the measure for 1988indicates that the trend of worsening poverty has been reversed, the inci-dence of rural poverty in that year remained higher than in 1980[Jitsuchon, 1990].
Based on the above, Table 1 provides a summary picture of theperformance of ten Asian countries in alleviating rural poverty during thelast three decades. It seems from this table that the performance was worstin the 1 960s when four out of the ten countries surveyed showed a clearlydeteriorating trend and one showed no improvement. There was clearimprovement in only three countries. On the other hand, the best per-formance was achieved during the 1980s when five countries achievedclear improvement and two more reversed the short-term deteriorationexperienced in the early 1 980s. Only two out of the ten countries surveyedshowed a clearly deteriorating trend in the 1980s.
Surprisingly, however, the same World Bank report which records risingunemployment and stagnant real wages in agriculture mentions that between 1981-82 and1986-87 food consumption appears to have increased significantly for the very poor. Dataon poverty from the Consumer Finance Survey (mentioned above) does not support thisview.

RURAL INSTITUTIONS AND POVERTY/N AsIA 39
Table 1: The record on alleviation of rural poverty in selected Asian countries
Countries 1960s 1970s 1980s
Bangladesh — — +China + + +India ? ? +Indonesia ? + +Malaysia — + — +
Nepal — — —
Pakistan — + +Philippines = — ?Sri Lanka + — —
Thailand + + — +
Notes: — deterioration+ improvement— + fluctuation= no change? unclear.
The countries whose performance has been impressive include China,Indonesia, Malaysia and Thailand. India and Pakistan also appear to havecome out of the vicious circle of continued poverty, particularly in the1980s. At the other extreme, the performance of Bangladesh, Nepal andthe Philippines has been disappointing.
2. Poverty alleviation, economic growthand macro-economic policies
How does one explain the varied experience in poverty alleviation asdescribed above? Is performance in this regard linked to the overall growthperformance of various economies? In other words, is a high rate of eco-nomic growth a necessary condition for alleviating poverty? A carefulanalysis of the Asian experience may provide some insights into thisquestion.
For example, the experience of countries like China and Sri Lanka,which attained notable success in poverty alleviation despite a rather lowor moderate growth rate in the 1960s (particularly in agriculture) haveoften given rise to the conclusion that high growth is not a necessarycondition. In support of this conclusion, one may also give the example ofPakistan, where a reversal in the worsening trend in poverty was achievedduring a period of rather low growth (i.e. the 1970s). However, beforepushing this conclusion too far one has to consider the specific circum-stances in which the achievements were made in the three countries justmentioned as well as the long-run sustainability of such achievements. The

40 THEPOVERTY AGENDA: TRENDS AND POLICY OPTIONS
institutional framework within which production was organized in ruralChina during the post-revolutionary period (particularly after the intro-duction of the commune system) guaranteed all able-bodied workers accessto employment, which served as a means of satisfying basic human needslike food, shelter and clothing. In addition, there was effective publicaction to ensure the satisfaction of such needs for those who were unableto work, as well as to provide education and health services to thepopulation. It was thus possible to remove the worst forms of poverty(hunger and malnutrition) without achieving very high rates of growth ofproduction or spectacular increases in rural incomes. However, it must berecognized that the institutional framework which played a crucial role inensuring the satisfaction of basic needs also kept the Chinese society lockedin a state of low material consumption and a rather austere way of living.Only after the institutional and economic reforms of the 1980s did theeconomy escape this moderate growth and austerity syndrome.
Sri Lanka is also well known for its long history of direct publicaction in the areas of food distribution, education and health services. Thegovernment implemented a system of distribution of rice at heavily subsi-dized prices to the entire population of the country from the 1 940s up to1978. This policy had obvious positive implications for maintainingadequate levels of nutrition among low-income groups. However, thegovernment could not bear the increasing fiscal cost of the programme. Inview of stagnating income, high levels of unemployment and the need toevolve proper incentives to local rice producers, the government wascompelled to rationalize the entire subsidy policy.
In contrast to China and Sri Lanka, there was no significant publicaction aimed at poverty alleviation in Pakistan. Despite the absence ofdirect intervention and a rather moderate rate of economic growth in the1 970s, how was Pakistan able to reverse the deteriorating trend of ruralpoverty during that period? At least a large part of the explanation canprobably be found in a special factor which benefitted the country, viz.large-scale overseas migration (particularly to the Middle East). Thisphenomenon helped in the alleviation of rural poverty in several ways.First, it led not only to a decline in the pressure on the labour market, butin some cases to acute and widespread shortages of workers during peakagricultural seasons. Second, as a result of the substantial inflow ofremittances, there was considerable injection of demand in the non-farmsector (particularly construction and services) which led to an increase inthe overall demand for labour in the rural economy. While these twofactors are often cited as explanations of increases in real wages of rural

RURAL INSTITUTIONS AND POVERTY/N As/A 47
labourers, remittances also added substantially to household incomes of therural poor.
It would thus appear that Pakistan's success story in poverty allevia-tion during the 1970s was neither growth-induced nor due to direct publicaction, but largely due to a fortuitions external influence. Naturally, thequestion was being asked whether the results of such a short-term palliativecould be sustained without putting the economy back on a high growth pathand/or introducing policies specifically aimed at preserving the gains madein the 1970s. In fact, there is evidence that large-scale flow of returnmigration (and the consequent decline in net out-migration) during the1 980s has been associated with a reversal in the tightening of rural labourmarkets (at least in some areas) and a stagnation of real wages. However,the overall rate of growth of the economy as well as that of agricultureincreased in the 1980s, and progress towards poverty alleviation alsocontinued.
The above discussion of the experience of China, Sri Lanka andPakistan does not appear to warrant the conclusion that growth is not anecessary condition for poverty alleviation. Indeed, their experience shouldindicate the importance of sustained growth from the point of view ofpoverty alleviation. This is further underscored by the experience ofMalaysia and Thailand during the 1 980s. In both these cases, a setback intheir record of poverty alleviation occurred during the recession of theearly 1980s; and it was reversed along with the recovery of growth. Theexperience of Bangladesh during the 1980s also indicates the importanceof economic growth for poverty alleviation.
The second question that needs to be addressed is whether highgrowth is a sufficient condition for poverty alleviation. Here the conclusionseems to be more straightforward in that the experience of the 1 960s hasalready implied a negative answer to this question. The experience of SriLanka during the 1980s provides further support for such a view. Asmentioned earlier, the incidence of rural poverty increased in that countrybetween 1978-79 and 1986-87. On the other hand, the rates of growth ofGDP, per capita GDP, and agriculture were substantially higher during1977-84 compared to 1970-77 (as reported by Bhalla & Glewwe [1986]).
The above conclusion applies even more to those items of basic needs(e.g. health services, education) whose satisfaction cannot be ensuredmerely by raising the level of personal income. The latter aspect is parti-cularly underscored by the experience of post-reform China and that ofPakistan and India in the 1980s. China made spectacular progress in ruralpoverty alleviation after 1979 in terms of the number of people below thepoverty line. However, this has not been associated with similar achieve-

42 THE POVERTY AGENDA: TRENDS AND POLICY OPTIONS
ments in other indicators of well-being. In fact, it has been pointed out thatthe death rate has gone up, life expectancy at birth declined (thoughmoderately) and the infant mortality rate rose sharply after 1978 [Drèze &Sen, 1989]. The slowing down of social progress just when economicgrowth speeded up has been mainly due to the dismantling of the systemof direct support in the area of health services that was part of the insti-tutional framework under the commune system. Clearly, even a high rateof growth of personal income has not been able to compensate for the lossof services provided by the society. Pakistan and India have also attainedrespectable growth rates during the 1980s; and the incidence of poverty interms of poverty line income levels has declined considerably. Achieve-ments in the areas of health and education, however, remain unimpressive.
High growth per se is not sufficient to ensure that the incomes of thepoor increase sufficiently to enable even the satisfaction of what has beencalled the private consumption part of basic needs (e.g. food, clothing andshelter) . The nature and pattern of growth are crucial in this regard asthey will determine to a large extent how much employment and incomeis generated for the poor in the process of growth. And it is in this contextthat the experience of Asian countries during the 1970s and 1980s differsfrom their experience in the 1960s. Disenchantment with the experience ofthat earlier decade resulted in an increased expression of concern forpoverty alleviation and employment generation in the governments' plan-ning and policy Strategies of growth, particularly in theSouth-east Asian countries, were reoriented towards the promotion oflabour-intensive exports [see Lee, 19811. And the more successful amongstthem, viz. Malaysia, Thailand, and — to a lesser extent — Indonesia, arethe ones who were able to reduce their incidence of poverty. Indeed,Thailand succeeded in reducing rural poverty in the 1960s; this isexplained partly by the nature of agricultural growth in which the poorwere able to participate and from which they could benefit [Islam, 1984bJ.In Indonesia, on the other hand, significant reduction in poverty took placeonly in the late 1970s when the rice sector (which is labour-intensive) grewvery rapidly. Success in non-oil, labour-intensive exports was achieved inthe 1980s and that contributed further to poverty alleviation [World Bank,1990].
Khan [1978] has distinguished the private consumption part of basic needs from items(e.g. health services, education) for which provision has to be made by society.
'° Whether such concerns were matched by concrete setting up of targets and adoptionof policies is, of course, another matter. On this, see Islam & Lee [1985].

RURAL INSTITUTIONS AND POVERTY IN AsIA 43
South Asian countries also attempted (in varying degrees) to liberalizetheir economies and orient them more towards labour-intensive exports.Pakistan has actually experienced a rapid growth in its small-scaleindustries [ARTEP, 1983]; and rural non-agricultural employmentincreased at a high rate during the late 1 970s and the 1 980s [Irfan, 1990].Bangladesh and India have adopted target group-oriented special schemesfor employment creation on a fairly large scale in order to supplement theemployment that is generated in the process of growth itself [Islam, 1985;Muqtada, 1989].
On the whole, there seems to be some basis for the belief thatplanning and policy-making in developing Asian countries has been, overthe last two decades or so, more conscious than during the 1960s about theurgency of alleviating poverty and the importance of employment genera-tion in attaining this goal. While this is not to say that employmentgeneration and poverty alleviation have already become a major concernof planners and policy-makers, the pattern of growth that unfolded duringthe latter period was more conducive to increases in incomes of the poorthan was the case in the 1960s. High growth cannot be a sufficientcondition for poverty alleviation unless the pattern and mechanism of thegrowth contain sufficient elements to enable the poor to benefit from thegrowth process.
Macro-economic policies play an important role in shaping the patternand mechanism of growth and in providing the poor with access to thebenefits of the growth process. Such policies can affect the levels ofincome and living conditions of the rural poor by changing any of thefollowing: (a) access to productive assets (e.g. land, equipment andmachinery, knowledge and infonnation); (b) returns to productive assets;(c) employment opportunities; (d) access to social services (e.g. education,health, etc.); and (e) the nature and magnitude of transfer payments (e.g.social security, relief, etc.).
An analysis based on the Asian experience came to the followingconclusions concerning the kind of macro policies that are likely to havea positive impact on alleviation of rural poverty [Islam, 1990]. First,policies regarding ownership and operation of land (e.g. redistributive landreforms, tenancy and other institutional reforms, legal provisions regardingopening up of land frontiers, etc.) are important in providing the poor withaccess to the most important productive asset in agriculture. Second,policies concerning the spread of knowledge and information about yield-raising techniques and practices in agriculture determine the extent towhich poorer farmers can have access to an important non-tangible assetand raise their incomes by using it. Third, a policy of providing incentives

44 THE POVERTY AGENDA: TRENDS AND POLICY OPTIONS
through pricing and other non-discriminatory trade and exchange ratepolicies can be effective in simultaneously achieving growth and povertyalleviation objectives when the distribution of land is relatively egalitarian.In an agriculture dominated by small farmers, incentive pricing needs tobe supported by subsidies on inputs and specifically targeted credit in orderto enable them to increase the returns on their land. Fourth, in countrieswhere a large proportion of the poor are landless (or near-landless) agri-cultural labourers, it needs to be ensured that macro-economic policies donot create incentives for premature adoption of labour-saving devices inagriculture. In the absence of redistributive reforms, the only way thesmall farmers can benefit from a high growth of agriculture is throughaugmented employment opportunities and a rise in real wage rates. Theirincomes will need to be increased adequately in order to protect them fromthe adverse distributive effect of incentive pricing. An alternative may beto have food subsidies targeted specifically towards them. Finally, asagricultural growth picks up, necessary incentives will have to be createdfor the generation of remunerative employment through non-farm activitiesso that a decisive shift in the structure of employment takes place. Theright kind of macro-economic policies in the areas of trade, exchange rate,taxation, credit, etc. will have to be created for the generation ofremunerative employment through non-farm activities so that a decisiveshift in the structure of employment takes place.
3. Profiles of the poor
In order to understand the role of institutions in perpetuating oralleviating poverty, it is important to know the socio-economic backgroundof the poor. However, it is difficult to have a clear answer to this questionas many countries lack comprehensive national-level data providing cross-classification of income and occupation categories. Moreover, as the poorare quite often forced to simultaneously pursue more than one occupationmerely for survival, it will not be easy to relate poverty with occupationeven if the cross-classification mentioned above is available. The usualpractice of identifying the principal occupation of the head of a householdis also fraught with complications. Indeed, in many cases a clear principaloccupation may not exist at all, and within the household there may bemore than one earner. In a predominantly agrarian economy where accessto land significantly influences access to income, application of certain landownership criterion my help one in identifying the vulnerable rural poor.Based on fragmentary data that are available by occupational and land

RURAL INSTITUTIONS AND POVERTY/N AsIA 45
ownership category, the following paragraphs try to provide a picture ofthe structure of poverty in some Asian countries.
For Bangladesh, based on nutritional data (i.e. daily per capita calorieintake), one study [World Bank, 1985] identified the following socio-economic classes as constituting the hard core rural poor: the landless farmworkers, the small farmers, medium tenant farmers, and those in ruralinformal non-farm activities. As far as the landless workers are concerned,it is important to distinguish those who own homesteads from those whoown none. Poverty is most acute for the latter, as they have no access toeven informal short-term credit to tide them over difficult periods.
In India, the quinquennial National Sample Surveys which combinehousehold expenditure data with household data on employment andunemployment make it possible to apply various measures of poverty todifferent cross-classifications of sampled households in terms of theirconsumption and socio-economic status. The livelihood groups in ruralareas include self-employed agricultural or non-agricultural households,agricultural labour households, rural labour households, and the non-labour, non-self-employed households. In rural areas, self-employedhouseholds engaged in agriculture and non-agriculture experience arelatively lower degree of social deprivation as compared to rural labourhouseholds. Rural labour households (which are predominantly agriculturallabour households, accounting for a third of the rural population, are worstoff. In terms of social deprivation, their contribution to the indices ofpoverty, its depth and severity is uniformly much higher than their shareof population [ILO-ARTEP, 1993].
Nepal is also a predominantly agrarian economy where vulnerabilityto poverty is associated with the size of farm holdings and landlessness.People with smaller farms have to depend on non-farm activities, returnsfrom which are low. Thus, non-farm activities are not of much help inreducing the extent of vulnerability of small and marginal farmers and non-cultivators. The vulnerability of the landless and marginal farmers isfurther accentuated by a high degree of rural indebtedness. The expenditurepattern of various occupational classes in rural Nepal indicates greatervulnerability among general labourers, production workers, and peopleassociated with construction and transport activities.
In Indonesia, the incidence of poverty is the highest amongstagricultural labourers, followed by those self-employed in agriculture. Theincidence of poverty is also high amongst those engaged in mining. Theother vulnerable groups are the self-employed in industries, constructionlabourers and the self-employed in various services [Tjondronegoro, 1992].

46 THE POVERTY AGENDA: TRENDS AND POLICY OPTIONS
In the Philippines, the majority of the rural poor are engaged infarming; and the incidence of poverty was equally high among familieswhose incomes depended mainly on fishing. One unusual feature in thePhilippines is that the incidence of poverty among the self-employed is assevere, if not more severe, than wage households. In agriculture, the poorself-employed include primarily lessees, tenants and small owner-cultivators. Within agriculture, among the poorest were (i) farm workersin sugar cane, rice, corn, coconut and forestry, and (ii) corn and othercrop farmers, coconut farmers and fishermen [Balisacan, 1992].
In Sri Lanka, the rural poor are usually the small and marginalfarmers, landless labourers, rural artisans and semi-skilled workers. Basedon occupational classification, the vulnerable groups are agriculturalworkers, cultivators, and construction workers [Gunatillake et al., 1992].
Ill. Rural institutions and poverty
1. Some conceptual issues
It is not easy to conceptualize or define institutions. They arecommonly perceived as organizations, which could be government or non-government, and could be economic, social or political in nature. A moregeneral concept of institutions would encompass arrangements, rules, andnorms upon which economic or social behaviour is constructed [Rodgers,1993]. While it is difficult to produce a comprehensive definition or evenlist of institutions, the following list may serve to indicate the kind ofinstitutions that are relevant for understanding the process of rural povertyand its alleviation:
(a) the structure of ownership and control of productive assets;
(b) arrangements for credit and irrigation;
(c) arrangements for use of productive assets (e.g. tenancy, renting ofequipment and livestock);
(d) arrangements for hiring labour (i.e. nature of employment contracts);
(e) methods of wage payment;
07 interlinking of labour hiring, tenancy and credit; and
(g) organizations of workers (e.g. trade unions, craft associations, etc.).

RURAL INSTITUTIONS AND POVERTY IN ASIA 47
The institutions mentioned above can have an impact on povertythrough a variety of means. First, they can influence economic growth aswell as the distribution of benefits from growth. While institutions mayinfluence overall levels of investment and types of technology, they mayalso have an impact on the efficiency of resource allocation and pro-ductivity of inputs. Institutions related to ownership and use of productiveassets (e.g. distribution of landholding, and tenancy), credit, and irrigationcan be put in this category. It must also be mentioned in this context thatthe relationship between institutions and growth is a two-way one; whileinstitutions affect growth, they are also influenced by the process ofgrowth. The manner in which the poor will be affected by this dynamicinteraction between institutions and growth is, of course, a complex matter.
Second, institutions can also influence the level of earnings of workers— through wage rates or quantum of employment or both. In this categorywould come institutions related to labour hiring (including interlinkagesbetween labour, land and credit markets) and wages as well as organiza-tions of workers. For example, the nature of employment contracts and themode of wage payment would influence the quantum of employment aswell as wage rates. Permanently employed workers are likely to beemployed for more days than casual labourers. The wage rates may alsodiffer, and total earnings will vary depending on the number of days ofemployment and the wage rates. Interlinking of labour hiring with tenancyand/or credit can also influence both the number of days of employmentand wage rates. When leasing of land is conditional upon a workerproviding labour (free of charge or at less than market wage rate) to thelandlord during peak agricultural seasons, this naturally affects the earningsof the worker. Earnings are also affected when credit is tied to the supplyof labour by the debtor (often at less than market wage rate) — althoughany difference between the market wage rate and the rate at which theworker is paid can be said to represent an interest on the credit.
While trade unions can also influence earnings, their activities mayhave wider implications for poverty. Wage rates for unionized workersmay increase at the cost of expansion of employment. Trade unionactivities may also have adverse implications for long-term investment andhence growth. Thus, their activities may not help in overall povertyalleviation, although unionized workers may enjoy a protection of theirearnings and employment conditions. The actual outcome will, of course,depend on how broad-based union membership is, the attitude of unionstowards technological change, and the overall environment concerningemployer-worker relations.

48 THEPOVERTY AGENDA: TRENDS AND POLICY OPTIONS
2. Evidence on linkages between institutions and rural poverty
A. Tenancy, farm size, agricultural growth and poverty
Tenancy and size-structure of farms influence agricultural growth viatheir impact on productivity. And there is a vast amount of literature onthis issue. On the question of tenancy and share-cropping, the basichypothesis is that it is unable to ensure optimal allocation of resourcesbecause it reduces tenants' incentives to optimize the application of theirown labour and other inputs. This hypothesis (which is basically due toMarshall) has been subsequently challenged by a large number ofeconomists (see, for example, Cheung [1968], Newbery [1975], Stiglitz[1974], among others). Under certain conditions, e.g. resident landlords,supervision by them, their participation in decisions concerning inputs, andsharing of the cost of purchased inputs (e.g. fertilizers, pesticides andirrigation), the problems of sub-optimal application of inputs and incentivescan be overcome to a large extent (see, for example, Castillo [1973]; Singh[1982]). A large number of studies are available documenting differencesin input and output intensities between own and share-cropped farms; andmany find only very minor differences. In other words, such studiessuggest that problems of incentives and sub-optimal application of inputscan indeed be overcome. Of course, this is not to say that obstacles tohigher productivity and growth created by share-cropping have been over-come everywhere completely. The actual outcome depends very much onspecific circumstances; and there are a large number of studies pointing tothe existence of differences in productivity." The upshot of suchdivergent findings is that share-cropping (and tenancy in general) cannotbe regarded as a factor impeding optimum application of inputs. Indeed,the relationship between share-cropping and productivity is being furtherinfluenced by the inroad of new technology based on HYV seeds, and thephenomenon of lower productivity in share-cropped land compared to ownland is far from common in the changed scenario.
Like the tenancy-productivity linkage, there is a large body ofliterature on the farm size-productivity linkage; the general conclusion isthat smaller farms display higher productivity and more intensive use ofland compared to larger farms. Evidence from Asian countries indicates thefollowing: (i) smaller farms achieve higher cropping intensities than largerfarms; (ii) smaller farms display greater diversity of crop or product mix;
H The literature on this is vast, and a review of such literature is not within the scopeof the present chapter.

RURAL INSTITUTIONS AND POVERTY/N As/A 49
(iii) smaller farms are able to achieve higher productivity by applying morelabour per unit of land because the effective cost of family labour used bysmall farms is lower than that of wage labour on which large farms haveto depend.
The relationship between farm size and productivity as indicated aboveis also changing in a dynamic situation where new technology is beingadopted. In this context, two forces may be at work. Large farmers withtheir easy access to credit and technology and greater ability to assume riskcan take advantage of new opportunities and narrow the productivity gapwith smaller farmers working with traditional technology. On the otherhand, given access to necessary inputs, the smaller farmers have beenfound to be equally receptive to new technology. The resulting impact ofthese opposing forces on farm size-productivity linkage is difficult topredict. Hence, the case for land reforms has become less strong from thepoint of view of efficiency.
B. Technological and institutional changes in agriculture:Effects on labour processes and earnings
Technological changes in agriculture have often been associated withinstitutional changes concerning use of labour (e.g. in labour hiringarrangements and modes of wage payments) and consequently returns tolabour. For example, the introduction of new rice harvesting technologyin Indonesia was associated with the displacement of women workers andthe replacement of an open harvest system with a more commercial mode(tebasan) under which a rice trader purchases a farmer's standing rice cropand employs wage labourers to harvest the crop. This led to a reduction ofemployment opportunities for landless labourers even in areas practisingmultiple cropping. Small and marginal farmers were, however, able toraise their incomes considerably through the rice-intensification programme[Tjondronegoro et al., 1992]. In some parts of India also, traditional modesof wage payment were replaced by cash payments as agricultural modern-ization took place [Bardhan & Rudra, 1980]. In Bangladesh, there was amove in the opposite direction, i.e. payment of crop-share as wage [Islam& Rahman, 1985].
In the Philippines, the introduction of HYV technology led to thereplacement of traditional system of hiring harvesting labourers (involvinga share payment) with a system called gamma, in which participation in theharvesting operation was limited to workers who had provided free labourin the weeding operation. This new system can therefore be interpreted asan institutional innovation to prevent wage rates from rising.

50 THEPOVERTY AGENDA: TRENDS AND POLICY OPTIONS
In eastern India, the importance of attached (or permanent) labourincreased as HYVs spread. With the adoption of new technology, therewas increased need for durable labour contracts on account of a generaltightening of the labour market and greater emphasis on the timeliness ofoperations involved in such technology [Bardhan, 1980]. In Bangladesh,however, dependence on permanent labour did not increase with theadoption of new technology. Other mechanisms (e.g. use of contract labourfor specific operations and interlinking of labour hiring arrangements withcredit and land transactions for ensuring the availability of labour duringpeak seasons) were used to adjust to increased demand for labour [Islam& Rahman, 1985]. Whatever the adjustment mechanism, the basic object-ive is to prevent the benefits of new technology reaching labourers in theform of higher wages and to ensure a smooth supply of labour.
C. Interlinking of labour hiring, tenancy and credit:Implications for labour earnings
Tenancy is sometimes linked to labour services. In parts of India andNepal, for example, small parcels of land are leased out to prospectivelabourers on condition that they will work for their landlords, particularlyduring peak seasons [Rudra, 1982]. Share-croppers are sometimes requiredto make payments to landlords in addition to the crop-share stipulated inthe contract; and such side payments (or "compensatory payments" astermed by Cheung [1968]) are sometimes made by providing the servicesof human labour. The rationale for this kind of interlinkage between landand labour transactions is that it ensures the supply of labour for thelandlord during tight labour market periods and also provides the laboursupplying households with an opportunity to increase the utilization offamily labour. The apparent impact of such an arrangement may thus bepoverty reducing. However, the supply of free labour associated with thisinstitution needs to be noted — although the opportunity cost of suchlabour may not be very high.
Transactions of labour and credit are related through the practice ofland owners providing a consumption loan (which can also be looked onas a wage advance) to labourers committed to work for them during peakagricultural seasons. Again, the rationale for providing credit to pros-pective workers may be a strategy to ensure a smooth supply of labourduring peak periods. Labourers entering into interlinked transactions withlandlords and creditors may succeed in ensuring a higher amount ofemployment during slack seasons compared to other labourers. Interlinkagebetween labour and credit transactions may, on the other hand, lead to

RURAL INSTITUTIONS AND POVERTY/N As/A 51
lower-than-market wage rates during peak seasons — the differencerepresenting an interest payment for the credit. Since HYV crops are morelabour-intensive unless the operations are mechanized, the spread of suchcrops may create conditions in which landowners would find it profitableto ensure the supply of peak period labour by interlinking this with theprovision of a consumption loan during slack seasons or with the leasingof small plots of land. During the early stages of the "green revolution"in parts of India (e.g. Haryana) careful interlocking of individual labourcommitments and personalized credit transactions served to counter thepotential for higher wages due to tighter peak period demand for labour[Bhalla, 1976].
For Bangladesh, findings on interlinkage are mixed. One study [Cain& Mozumdar, 1980] did not find any evidence of large land-owners exer-cising leverage in the labour market by rationing share tenancy among thelandless. Nor did this study find any interlinkage between labour and creditmarkets. Islam and Rahman [1985], however, report both types of inter-linkage, albeit on a small scale. They also find some support for thehypothesis that the spread of HYVs may create conditions in which land-owners find it profitable to ensure the supply of peak period labour byinterlinking this with the provision of a consumption loan during slackseasons. However, interlinked transactions did not result in higher averageemployment or a better seasonal balance in the employment of semi-attached workers. Also, both the average and peak season wage rates werelower for such workers. These results indicate that it is mainly theemployers who benefit by interlinking labour hiring with land lease andprovision of credit. The workers would also have gained if a smootherseasonal consumption pattern could have been achieved with the help of theslack season loan.
Interlinking of credit, tenancy and labour hiring has also beenobserved in Nepal, with associated regressive effects [Banik, 1993]. Underan informal credit market structure, the mode of surplus appropriation bycreditors from debtors takes several forms. For example, creditors chargeexorbitantly high interest rates, obtain free labour services or pay lower-than-market wages, or combine these methods. Generally, creditors arealso landlords who lease land to tenants for cultivation; they charge highground rents or garner large shares of production. In addition, marketoutlets for agricultural products are controlled by creditors. The tenant-debtor is generally required to repay his debt right after the harvest is in.This means that he is trapped in a regressive market mechanism in twoways. First, since he does not have any other means to repay his debt, heis forced to sell his produce following the harvest — most often to his

52 THE POVERTY AGENDA: TRENDS AND POLICY OPTIONS
creditor or to the creditor's agent, probably at a pre-arranged price. Thisimplies that he is likely to get less than the current market price. Second,sale of crops immediately after the harvest means that the tenant-debtorprobably receives much less for his produce than what he could haveobtained at a later point in time when market prices would have gone up.
0. Rural workers' organizations, wages and employment
As mentioned earlier, the impact of trade unions can go beyond short-term influences on wage rates to longe-term implications for employment,investment and growth. Since workers' organizations have not yet takenroots in rural areas of Asian countries, it is difficult to provide empiricalevidence on these questions. Some limited evidence from the Kerala stateof India and the Philippines may, however, throw some useful light on thissubject.
Evidence on Kerala regarding the impact of unions on agriculturalwages is not conclusive. Some studies (reported in Kannan [1992]attributed the observed increase in wage rates in the 1960s to unionizationwhile others were sceptical because areas with both high and low unioniza-tion showed increases in wage rates. Studies focusing on earnings (takinginto account wage rates as well quantum of employment) noted that therewas a decline in earnings because of the decline in employment. At leastone study [Kannan, 1990] however, shows that this has been reversedduring the 1980s — as wage increases more than compensated for thedecline in employment, leading to an increase in annual earnings. In somecases (e.g. cashew processing), however, little increase in wage ratesoccurred and employment also declined.
What about the impact on investment and growth? Can increases inwage rates dampen investment and growth? Increases in real wage rates perse cannot be taken as a constraint on growth. From the point of view ofinvestors, the relevant wage cost is the share of wages in value added.There may be an adverse effect on growth if the product wage grows fasterthan labour productivity. And this is what seems to have happened inKerala's agriculture since the mid- 1970s. From the early 1960s to the mid-1970s, increases in wages seem to have been more than compensated byincreases in product prices, resulting in a marginal decline in the productwage. Thereafter, however, wage increases continued while product pricesexperienced a relative decline. This resulted in a faster growth of wages inrelation to productivity. Between the mid-i 970s and mid-i 980s agriculturalgrowth declined and even became negative, the real rate of profit in agri-culture declined, and its employment implications were manifest in the

RURAL INSTITUTIONS AND POVERTY/N As/A 53
shifts in cropping pattern from more labour-intensive crops (e.g. paddy)to less labour-absorbing ones (e.g. rubber). Per capita employment alsodeclined due to a reduction in the area under cultivation [Kannan, 1992].
The experience of trade unions in the sugar plantations of Negros inthe Philippines provides a contrast to the above picture. When the planta-tions faced a severe crisis caused by falling world demand and low prices,the main impact was borne by the workers. Thousands were suddenly outof work, and even those who were fortunate enough to hold on to jobssuffered steep declines in wages and living conditions. This experiencehighlights the limitations of workers' organizations in the face of aneconomic crisis, although it must be mentioned that unions in Negros didmake efforts to mitigate the sufferings of workers, e.g. by findingalternative avenues of employment, arranging loans, etc. Also, the factremains that in terms of wages, other benefits, and job security theunionized workers were better off [Wickramasekara, 1992].
IV. Concluding remarks
Asian countries have, by and large, performed better in respect ofpoverty alleviation during the 1980s compared to the two earlier decades.The present chapter argues that a high rate of economic growth is anecessary condition, but not a sufficient one, for poverty alleviation. Highgrowth cannot be a sufficient condition for achieving this objective unlessthe pattern and mechanism of the growth contain sufficient elements toenable the poor to benefit from the growth process. While macro-economicpolicies play an important role in this regard, rural institutions may alsohelp or hinder the process of poverty alleviation. Some institutions caninfluence economic growth, while others may have an impact on the distri-bution of benefits from growth, e.g. by affecting the employment andearnings of workers.
Although some institutions like tenancy and unequal size distributionof farms are usually considered as impediments to agricultural growth andalleviation of rural poverty, the relationships are undergoing changes withthe introduction of new technology in agriculture. Orthodox views on thesequestions may therefore be no longer valid. On the other hand, certaininstitutional changes following the spread of new technology have acted asa hindrance to workers receiving full benefits (in the form of higher wagerates and employment) of the latter. Interlinked transaction in land, labourand credit may also have such effects.
54 THE POVERTY AGENDA: TRENDS AND POLICY OPTIONS
It must, however, be added here that the purpose of this chapter wasprimarily to analyse these processes. The fragmentary evidence on thebasis of which such analysis was done does not provide any indication ofthe pervasiveness of the various processes. Institutions vary considerablyat the local level; and what is in operation in small local communities maynot be significant at the national level unless the practices in question arereally widespread. Hence, it is difficult to arrive at any conclusionconcerning the relative importance of institutions and macro-economicpolicies. However, the experience of countries (or regions) which haveachieved success in poverty alleviation (e.g. Indonesia, Thailand, and thePunjab state of India) does seem to indicate that if macro-economic policiescreate the right kinds of incentives, it may be possible to overcomeconstraints posed by institutions.
Bibliographical references
Ahluwalia, M. S. 1984: "Rural poverty, agricultural production and prices:A reexamination", in Mellor, J. W.; Desai, G. M. (eds.): Agricultural change andrural poverty: Variations on a theme by Dharm Narain. Washington, DC, IFPRI.
Ahmad, Q. K.; Hossain, M. 1985. "An evaluation of selected policies and programmes forthe alleviation of rural poverty in Bangladesh", in Islam (1985).
Alamgir, M. 1978. Bangladesh: A case of below poverty level equilibrium trap. Dhaka,BIDS.
ARTEP. 1983. Employment and structural change in Pakistan: issues for the eighties.Bangkok, ILO-ARTEP.
Bajracharya, P.; Bajracharya, B. 1989. "Integrated strategies for alleviating rural povertyin Nepal", mimeo. New Delhi, ILO-ARTEP.
Balisacan, A. M. 1992. "Rural poverty in the Philippines: Incidence, determinants andpolicies", in Asian Development Review (Manila), Vol. 10, No. 1.
Banik, A. 1993. "Production behaviour of farms under different types of watermanagement: Evidence from Eastern India, Nepal and Bangladesh", mimeo. NewDelhi, IDRC.
Bardhan, P. 1980. "Terms and conditions of sharecropping contracts: An analysis ofvillage survey data in India", in Journal of Development Studies (London), Vol. 16,April.
Bardhan, P.; Rudra, A. 1980. "Labour employment and wages in agriculture: Results ofa survey in West Bengal (1979)", in Economic and Political Weekly (Bombay), 15(45-46), 8-15 November, pp. 1943-1949.

RURAL INSTITUTIONS AND POVERTY IN AS/A 55
Bhalla, S. S.; Glewwe, P. 1986. "Growth and equity in developing countries:A reinterpretation of the Sri Lankan experience", in The World Bank EconomicReview (Washington), Vol. 1, No. 1.
—. 1976. "New relations of production in Haryana agriculture", in Economic and Political
Weekly (Bombay), March.
BIDS. 1990. The face of rural poverty in Bangladesh: Trends and insights. Dhaka.
Burki, S.J. 1990. "Development strategies for poverty alleviation", in Asian DevelopmentReview (Manila), Vol. 8, No. 1.
Cain, M.; Mozumder, A. B. M. K. A. 1980. Labour market structure, child employmentand reproductive behaviour in rural South Asia. Centre for Policy Studies WorkingPapers, No. 56. New York.
Castillo, G. 1973. All in a grain of rice: A review of Philippine studies on the social andeconomic implications of the new rice technology. University of the Philippines, LosBanos, December.
Cheung, S. N. 5. 1968. The theory of share tenancy. Chicago, University of ChicagoPress.
Drèze, J.; Sen, A. 1989. Hunger and public action. Oxford, Clarendon Press.
Fields, G. 1980. Poverty, inequality and development. Cambridge, Cambridge UniversityPress.
Fredericks, L. J. 1985. "Rural productivity-raising strategies and programmes in peninsularMalaysia", in Mukhopadhyay (1985).
Ghose, A. K. 1987. "The people's commune, responsibility system and rural developmentin China, 1965-1984", in Saith (1987).
Ginneken, W. van. 1990. "Social costs of restructuring: The experience of Sri Lanka",mimeo. Geneva, ILO Employment and Development Department.
Gupta, S. P.; Datta, K. L. 1984. "Poverty calculation in the Sixth Plan", in Economic andPolitical Weekly (Bombay), 14 April.
Gunatillake, G. et al. 1992. "Rural poverty in Sri Lanka: Priority issues and policymeasures", in Asian Development Review (Manila), Vol. 10, No. 1.
Hossain, M.; Sen, B. 1992. "Rural poverty in Bangladesh: Trends and determinants", inAsian Development Review (Manila), Vol. 10, No. 1.
ILO-ARTEP. 1993. India: Employment, poverty and economic policies. Delhi.
Irfan, M. 1990. Rural employment and wages in Pakistan. ARTEP Working Papers, NewDelhi, ILO-ARTEP.
—; Amjad, R. 1984. "Poverty in rural Pakistan", in Khan and Lee (1984).
Islam, R. 1984a. "Poverty and income distribution in rural Nepal", in Khan and Lee(1984).
—. 1984b. "Poverty, income distribution and growth in rural Thailand", in Khan and Lee(1984).

56 THE POVERTY AGENDA: TRENDS AND POLICY OPTIONS
— (ed.). 1985. Strategies for alleviating poverty in rural Asia. New Delhi, ILO-ARTEP.
—. 1990. "Rural poverty, growth and macroeconomic policies: The Asian experience", inInternational Labour Review (Geneva, ILO), Vol. 129, No. 6.
—; Lee, E. 1985. "Strategies for alleviating poverty in rural Asia", in Islam (1985).
—; Atiq Rahman. 1985. Agrarian change, labour contracts and interlinked transactions inlabour, land and credit in rural Bangladesh: A study with micro-level data. AsianEmployment Programme Working Papers. Bangkok, ILO-ARTEP.
—; Muqtada, M. 1986. Bangladesh: Selected issues in employment and development. NewDelhi, ILO/ARTEP.
Jitsuchon, S. 1990. Alleviation of ruralpoverty in Thailand. ARTEP Working Papers, NewDelhi, ILO-ARTEP.
Kannan, K. P. 1990. State and union intervention in rural labour: A study of Kerala, India.ARTEP Working Papers. New Delhi, ILO-ARTEP.
—. 1992. "Labour institutions and the development process in Kerala", in Papola, T. S.;Rodgers, G. (eds.): Labour institutions and economic development in India. Geneva,International Institute for Labour Studies.
Khan, A. R. 1977a. "Poverty and inequality in rural Bangladesh", in ILO (1977).
—. 1977b. "The distribution of income in rural China", in ILO (1977).
—. 1978. "Basic needs targets: An illustrative exercise in identification and quantification",in ILO: The basic-needs approach to development. Geneva.
—; Lee, E. (eds.). 1984. Poverty in rural Asia. Bangkok, ILO-ARTEP.
Lee, E. 1977. "Rural poverty in West Malaysia, 1957-70", in ILO (1977).
— (ed.). 1981. Export-led industrialisation and development. Bangkok, ILO-ARTEP.
—. 1984. "Agrarian changes and poverty in rural Java", in Khan and Lee (1984).
Malik, M. H. 1989. Trends in poverty in Pakistan: 1963-64 to 1984-85. Paper presentedat the Fifth Annual General Meeting of Pakistan Society of Development Economists,Islamabad.
Malik, S. J. 1992. "Rural poverty in Pakistan: Some recent evidence", in PakistanDevelopment Review (Islamabad), Vol. 31, No. 24, Winter.
Mangahas, M. 1985. "Rural poverty and operation land transfer in the Philippines", inIslam (1985).
Meesook, 0. A. 1976. Income, consumption and poverty in Thailand, 1962-63 to 1975-76,World Bank Staff Working Paper No. 364. Washington, DC.
Mukhopadhyay, S. 1985. The poor in Asia: Productivity -rising programmes and strategies.Kuala Lumpur, Asian and Pacific Development Centre.
—. 1990. Rural poverty and inequality in post-reform China. ARTEP Working Papers,New Delhi, ILO-ARTEP.

RURAL INSTITUTIONS AND POVERTY/N AS/A 57
Muqtada, M. 1986. "Poverty and inequality: Trends and causes", in Islam and Muqtada(1986).
— (ed.). 1989. The elusive target. New Delhi, ILO-ARTEP.
Newbery, D. 1975. "Tenurial obstacles to innovation", in Journal of Development Studies(London), Vol. II, No. 3, July, pp. 263-277.
Naseem, S. M. 1977. "Rural poverty and landlessness in Pakistan", in ILO (1977).
Osmani, S. R. 1989. Notes on some recent estimates of rural poverty in Bangladesh.Helsinki, WIDER.
Palmer, 1. 1977. "Rural poverty in Indonesia with special reference to Java", in ILO(1977).
Rahman, A.; Haque, T. 1988. "Poverty and inequality in Bangladesh in the eighties: Ananalysis of some recent evidence". Research Report No. 91. Dhaka, BIDS.
Rao, C. H. H. 1985. "Changes in rural poverty in India: Implications for agriculturalgrowth". Dr. Rajendra Prasad Memorial Lecture, 29 December. New Delhi.
Rodgers, G. 1993. "The creation of employment in segmented labour markets: A generalproblem and its implications in India", in The Indian Journal of Labour Economics(Lucknow), Vol. 36, No. 1.
Rudra, A. 1982. Extraeconomic constraints on agricultural labour: Results of an intensivesurvey in some villages near Santiniketan, West Bengal, Bangkok, ILO/AsianRegional Team for Employment Promotion.
Sahn, D. E. 1987. "Changes in the living standards of the poor in Sri Lanka during aperiod of macroeconomic restructuring", in World Development (New York),Vol. 15. No. 6.
Saith, A. 1987. Re-emergence of the Chinese peasantry: Aspects of rural decollecti visation.London, Croom Helm.
Singh, I. 1982. Small farmers and the landless in South Asia. World Bank Staff WorkingPaper 320, Washington, DC.
Stiglitz, J. 1974. "Incentives and risk sharing in sharecropping", in Review of EconomicStudies (Edinburgh), Vol. 61, April, pp. 219-256.
Tjondronegoro, S. M. P. et al. 1992. "Rural poverty in Indonesia: Trends, issues andpolicies", in Asian Development Review (Manila), Vol. 10, No. 1.
Wickramasekara, P. 1985. "An evaluation of policies and programmes for the alleviationof poverty in Sri Lanka", in Islam (1985).
—. 1992. "Interventions in rural labour markets: A review of some Asian experiences",in ILO-ARTEP: Employment and labour market interventions. New Delhi, ILO-ARTEP.
World Bank. 1980. Aspects of poverty in the Philippines: A review and assessment. ReportNo. 2984-PH.
—. 1985. Bangladesh: Food and nutrition sector review. Dhaka.

58 THE POVERTY AGENDA: TRENDS AND POLICY OPTIONS
—. 1987. Bangladesh: Promoting higher growth and human development. Report No. 6616-BD.
—. 1989a. Bangladesh: Recent economic developments and short-term prospects. ReportNo. 7596-BD.
—. 1989b. India: Poverty, employment and social services. Washington, DC.
—. 1989c. Sri Lanka nutrition review. Report No. 7575-CE.
—. 1990. Indonesia: Poverty assessment and strategy report. Report No. 8034-IND.

4 Changing poverty and employmentpatterns under crisis in Africa
Vail Jamal1
I. Introduction
Given the context of falling incomes, from levels which were alreadylow to start with, it may seem almost axiomatic that poverty has increasedin the sub-Saharan African countries. While by and large this picture doeshold out, the answer is somewhat less straightforward than might appearat first sight since income declines have been unevenly spread and since,precisely in response to falling incomes, the vulnerable groups — farmersand wage-earners — have adopted complex survival strategies to make endsmeet, straddling both the rural as well as urban areas, and the formal aswell as the informal sectors. This renders the usual indicators of levels ofliving — wages and prices — inadequate to reflect changes in familywelfare. The fact is that the pattern of poverty and associated povertyprocesses have changed in Africa, complicating poverty analysis, but moresubstantively requiring a rethinking in our modelling of these economies.To cite the most prominent example, most of the "urban bias" which wasonce thought to be the hallmark of African economies ,2 and which wasrecently blamed for their crisis, has by now disappeared, with massiveturnarounds in the rural-urban terms of trade and declines in wages. Ifchanging the internal terms of trade implies a redistribution of income, that
'Senior Economist, Employment and Development Department, International LabourOffice. The author wishes to thank, without implicating, Mboya Bagachwa, DeborahBryceson, Ian Livingstone and Paul Streeten for comments on an earlier draft.
2 The "Berg Report" [World Bank, 1981] and Bates [1981] come to mind, inspiredundoubtedly by the influential study of Lipton [1977], although the model that governmentpricing and wages policies were creating unfathomable gaps between town and country hasbeen a staple of African economic analysis for a long time. Jamal and Weeks [1987, 1988and 1993] have reviewed some of the calculations used in measuring the rural-urban gapand questioned the basis of the "distortion" model of Africa.

60 THEPOVERTY AGENDA: TRENDS AND POLICY OPTIONS
redistribution is now not as cataclysmic as in the past, as in practical termsit happens within the same family. And because the same individual maybe both a farmer as well as a wage earner, the kind of reallocation oflabour attendant upon changes in relative prices also does not happen aspredicted in theory. We may indeed need a new paradigm to explainAfrican economies.
The objective of this chapter is to provide a basis for understandingthe changes in poverty and employment that have occurred in the Africancountries in the last two decades and to draw out their implications forpolicy formulation. The next section will take us over the outlines of theAfrican crisis and structural characteristics of economies, particularly theirengines of growth and labour force profile. It is important to note theimplications of recent changes in employment patterns for income levels.The latter is specifically taken up in Section III based on indicators relatingto agricultural output and wages. The limitations of such indicators in theface of changing employment patterns are highlighted. The major conclu-sion that emerges is the huge turnaround in the rural-urban gap, perhapseven rural-urban terms of trade, in the last decade. What does this signifyfor "urban bias"; how do we in fact measure urban bias in the context ofexport-crop oriented marketing controls? An attempt is made to open thatPandora's box in Section IV. The findings are still preliminary. Section Vcontains the conclusions. We look here at the long-term developmentstrategy for Africa on the recognition that poverty is a structuralphenomenon and requires a long-term solution.
II. Economic crisis, structures and labour force
Although the 1980s have been called the "lost decade" in Africa, thecontinent has been more or less in crisis since at least the early 1970s —and the crisis is continuing into the 1990s. We could now be talking of the"lost two decades". A long-term perspective is important to bring out thestructural nature of the African crisis and the required cures.
Table 1 shows some selected indicators of economic performance inAfrica. Per capita income declined by 10 per cent between 1973 and 1992,which in some ways belies the description of "crisis", but during the sameperiod, East Asian incomes quadrupled, South Asian incomes doubled, andLatin American incomes rose by around two-thirds. Consumer priceincreases averaged 23 per cent per year, central government fiscal deficitremained at a persistent 6-7 per cent of GDP, while the current accountbalance stayed negative, at some 20 per cent of exports. Export volume

Tab
le 1
: Ind
icat
ors
of e
cono
mic
pe
rfor
man
ce in
SS
A,
1973
-92
(per
cent
ages
, ex
cept
as
indi
cate
d)
Ave
rage
19
73-8
2 19
83
1984
19
85
1986
19
87
1988
19
89
1990
19
91
1992
Cen
tral
gove
rnm
ent fi
scal
ba
lanc
e (%
GD
P)
Exp
ort v
olum
es
Ter
ms
of tr
ade
Cur
rent
acco
unt
bala
nce
as %
of e
xpor
ts
—22
.6
Ext
erna
l deb
t (U
S$ b
illio
ns)
—
Ext
erna
l deb
t as
% of
GD
P —
Deb
t ser
vice
ratio
—
0.3
1.1
3.6
3.3
2.2
2.6
2.8
2.0
2.3
2.1
n.a.
n.
a.
3.4
2.9
2.2
3.0
2.9
1.3
1.1
0.4
—2.
6 —
1.8
0.7
0.4
—0.
7 —
0.3
—0.
1 —
0.9
—0.
6 —
0.8
25.4
20
.5
20.2
20
.0
23.4
20
.9
20.4
22
.8
24.0
41
.9
—6.
0 —
5.3
—5.
6 —
6.7
—7.
7 —
7.0
—6.
5 —
6.2
—7.
8 —
5.9
—0.
9 3.
2 —
0.2
4.7
1.0
—3.
9 4.
1 3.
1 3.
7 4.
8
1.1
6.3
—1.
4 —
9.5
—7.
2 1.
2 —
3.3
—3.
2 —
3.4
—2.
0
—24
.1
—12
.0
—13
.4
—21
.2
—22
.3
—25
.7
—21
.5
—25
.0
—22
.2
—19
.7
54.6
56
.8
65.5
88
.5
107.
0 11
0.1
112.
7 13
0.1
127.
3 13
3.0
51.7
55
.8
61.9
73
.0
82.8
76
.2
78.1
83
.7
75.8
75
.4
21.7
23
.5
22.4
24
.8
21.4
23
.1
21.2
22
.5
22.0
22
.7
Not
es:
PPP
= P
urch
asin
g Po
wer
Par
ity. A
ttem
pts
to c
orre
ct f
or d
isto
rtio
ns i
ntro
duce
d in
con
vert
ing
coun
try
GD
Ps to
dol
lar t
erm
s fo
r agg
rega
tion.
Allo
ws
for d
iffe
renc
es in
$
purc
hasi
ng p
ower
. PP
P fi
gure
s wou
ld b
e re
leva
nt i
n com
pari
ng p
erfo
rman
ce ac
ross
cou
ntri
es a
nd re
gion
s.
Ave
rage
for
197
4-83
. So
urce
: IM
F, M
ay l9
92an
d M
ay 1
993.
1 -ç 0 1 O)
Rea
l G
DP
(% p
.a.)
PP
P te
rmsa
Rea
l G
DP
p.c.
(%
p.a
.)
Con
sum
er pr
ices
2.5
2.2l
—0.
4
21.9
—0.
6
—0.
5

62 THE POVERTY AGENDA: TRENDS AND POLICY OPTIONS
increased at the most by 15 per cent, but terms of trade fell by a quarter,so that the purchasing power of exports declined by 14 per cent; in percapita terms, the bundle of imports halved. External debt increased 2.5-fold (1983-92), and in a situation of stagnating incomes, debt came to 75per cent of GDP compared to 52 per cent in 1983. Increased exportvolumes managed to keep the debt service ratio at around 22 per cent, yetthe one-fifth of exports that went to service debt was an immense drain onthe African countries, especially in the context of falling commodity priceswhich meant that the same amount of debt in dollar terms had to be paidby a bigger bundle of goods.
Apart from the severity of the crisis, the African region also standsout from the other developing regions in terms of its structural features(Table 2). Sectoral shares of GDP, labour force, and exports are all higherhere than in the other developing regions. While the GDP share of agri-culture has fallen since the mid-1960s, this was more in the context ofdeclining agricultural incomes than a faster growth of the non-agriculturalsectors. By contrast, the South Asian region, which in the mid-i 960s wasmore agriculture-oriented than the sub-Saharan (SSA) region (46 per centof GDP from agriculture compared to 43 per cent), had by 1991 seen agri-culture's share fall to the same level as in SSA (31 per cent). Even oil-richNigeria had 37 per cent of its GDP emanating from agriculture in 1991,the same, incidentally, as from industry. Two-thirds of the African labourforce is engaged in agriculture, whereas already by 1985 this share in LatinAmerica was down to 29 per cent. Agricultural exports provided over one-third of total exports of SSA in i991, or 44 per cent of the exports of SSAexcluding Nigeria, whereas in Asia this share was under 15 per cent.
The African economies are also more "open" than their Asian orLatin American counterparts, making them that much more vulnerable toexternal shocks. In 1991 around 23 per cent of the regional GDP was ex-ported, compared to only 10 per cent for South Asia, and around one-thirdof the agricultural output of SSA, ex-Nigeria, was exported, compared toonly 7 per cent in South Asia. Openness is combined with concentration.In most African countries the two largest exports generate over one-half ofexport proceeds, and in some, just one commodity attains this status.3
For example, coffee earned 76 per cent of the total exports of Burundi in 1980-90,coffee earned 53 per cent in Ethiopia, tobacco 66 per cent in Malawi, cotton 47 per centin Mali, and live animals 44 per cent in Somalia [UNCTAD, 1992, Table 4.3}.

CHANGING POVERTY AND EMPLOYMENT PA TTERNS UNDER CRISIS IN AFRICA 63
Table 2: Indicators of agriculture's role in SSA economies, 1965-91 and extentof "openness", 1991 (percentages unless otherwise indicated)
1965 1980 1987 1991 1991 range
Share of agriculture inGDP
SSA 43 30 34 31 14 (Lesotho), 64 (Mozambique)SSA (ex-Nigeria) 40 34 35 —
Nigeria 54 26 30 —Labour force
SSA 77 71 — — 35(Namibia),91(Burundi,Rwanda)SSA (ex-Nigeria) 78 72 — —
ExportsSSA 58 25 39 34 3 (Nigeria), 96 (Sudan)SSA (ex-Nigeria) 60 49 52 44Nigeria 65 3 8 3
Memo itemShare of fuels, minerals andmetal exports in total exports
SSA 34 71 47 58 0 (Malawi), 98 (Zambia)SSA (ex-Nigeria) 36 43 33 40Nigeria 32 96 91 96
Urbanization% of population (SSA) 14 22 27 29 6 (Burundi), 51 (Zambia)Growth (% p.a.)'SSA 5.6 6.9 5.8 3.8 (Mali), 10.1 (Tanzania),
[South Asia 3.9]Memo itemSSA population growth(% per annum) 2.7 3.1 3.1 1.9 (G. Bissau), 3.8 (Kenya)
LSouth Asia 2.21
"Openness" indices, 1991Total exports as % GDP
SSA — — 23.1 7.9 (Uganda), 41.2 (Côte d'Ivoire)[South Asia — — 9.6]
Total agricultural exportsas % of agricultural GDP
SSA 25.3SSA (ex-Nigeria) 33.3South Asia 7.1
Note: Growth (of urban population) figures are for 1965-80 (average for 1965-73 and 1973-80), 1980-87, and1980-1991.
Sources: World Bank [1989; 1993, respectively Tables 3, 34, 14, 35 and 28 up to "openness indices"]. The latterwere derived as follows: total exports as percentage of GDP from table 12; and total agricultural exportsas percentage of agricultural GDP; total exports (Table 12) multiplied by percentage of other primarycommodities (Table 14) = agricultural exports divided by agricultural value added (Table 8). Islandeconomies were excluded in the consideration of range figures.

64 THE POVERTY AGENDA: TRENDS AND POLICY OPTIONS
In the mineral-based economies, one single mineral may provide upwardsof four-fifths of exports .
Apart from agriculture and minerals, remittances also play animportant role in some African countries. Botswana, Lesotho and Swazilandare long-standing examples of remittance economies in southern Africa, butrecently in Egypt, Tunisia, Sudan and Somalia, as also some West Africancountries, remittances have gained importance. In Lesotho, practically one-half of the male labour force work in South African mines and contributethe same proportion of the country's national income [ILO/JASPA, 1979].For Somalia, it was estimated for the late 1980s that as many peopleworked in the Gulf countries as in the domestic modern sector and contri-buted about the same amount in remittances as the whole urban GDP[Jamal, 1988e]. In West African countries, too, migration is significant, astypified by the well-publicized expulsion of a million Ghanaian workersfrom Nigeria in 1982.
1. Rural labour force
Agricultural labour force dominates, and, within that, smaliholders(Table 3), even in countries like Zimbabwe and Kenya which have a distinctlarge-scale agricultural sector. It may be noted that the figures ofsmallholder population comprise the head of the family plus familymembers. Farms are small (1.5 ha being the average per household [IFAD,1992, Table 14]), households large (six members), and hence, very littlelabour is employed on a wage basis on the smallholdings. Table 4 atteststo this. In the typical smallholder country — Ghana and Sierra Leone beingcited here — agricultural wage-earners comprise no more than 5 per centof the agricultural labour force and one-fifth of the total wage employees .Most farm labourers are employed on a seasonal basis and are quite likelyto come from farm households. Payment may be in kind rather than cash.
A gender-based division of labour prevails, with food crops beingwomen's responsibility, in addition to their domestic duties, and exportcrops, men's. Given that many more food crops are grown than export
Petroleum provided 96 per cent of Nigeria's exports in 1989-90, 91 per cent inAngola, 80 per cent in Congo, and 77 per cent in Gabon; in Niger, uranium contributed80 per cent of total exports in 1989-90, the same as did copper in Zambia and Zaire.
In Zimbabwe, which has a significant large-scale farm sector, agricultural employeescomprised only 13.5 per cent of the total farm workers and just under one-quarter of thetotal wage employees. See Jamal [1993b1.

CHANGING POVERTY AND EMPLOYMENT PA TTERNS UNDER CR/S/S IN AFRICA 65
Table 3: Rural, agricultural, smaliholder, and landless populations, selected SSAcountries, and SSA and other regions, 1988 (percentage)
Countries/regions Rural Agricultural population Smallholder Landless
population
% of total % of agricultural % rural1% of total % of rural
Ethiopia 88 76 86 90 16
Ghana 68 51 76 94 —
Kenya 78 78 100 57 13
Nigeria 66 65 98 84 9Tanzania 78 80 lO3 88 —
Uganda 90 82 91 66' —
Zimbabwe 74 69 94 83 10
Memo itemssub-Saharan Africa 73 71 98 74 11"
Asia (exci. China, India) 70 52 74 68 20Near East/N. Africa 51 37 73 57 23C
Lat. America/Carib. 29 28 96 39
Notes: Note these figures are given as percentage of rural. Since rural population = agricultural + non-farm(villagers) + landless, the figures may not imply 'true" landlessness.
Implies urban farming. Note, however, that Zambian agricultural populationis shown to be 49% greaterthan its rural population, hence data problems could be present.
Difficult to reconcile since other categories of rural population (landless, pastoralists, ethnic indigenous,fishermen, internally displaced refugees) are shown to be insignificant. Note also that smallholders and theother categoriea do not seem to add up to 100 and also that under rural population is also shown female-headed householdsas a separate category. This is an error. "Female-headedhouseholds"and "smallholders"are not mutually exclusive.
As non-farm activities are limited, most of these (say 7%) could be "truly" landless.Most of these would be in non-farm employment in the villages.As non-farm activities are limited, these would be "truly" landless. Some individual country figures may
be noted: Brazil 39%, Costa Rica 44%, Mexico 32%, Venezuela 27%.Source: IFAD [1992, Tables 6 and 7].
crops,6 a great majority of the labour time has to be devoted to foodcrops. In terms of cash income generation, however, the division couldwell go in favour of export crops. The implication is that women, who dothe bulk of the work on the farms, receive only a fraction of the cashincome. Days of 12-14 hours are common for women: 5 a.m. to 9 p.m.as opposed to the 9 to 5 for men! A new trend is that a growing proportionof rural households are female-headed because of the absence of males intowns in search of employment. Figures above 25 per cent are recorded inat least 20 countries according to IFAD estimates [1992, Table 61.
6Country tonnage figures indicate a division between food crops and export crops in
the ratio of 70:30 [UNDP/World Bank, 1992, Tables 8.7 and 8.9].

66 THE POVERTY AGENDA: TRENDS AND POLICY OPTIONS
Table 4: Agricultural wage-earners in the labour force and wage employment,selected SSA countries, c. 1990
Country Year Agricultural wage earners as % of
Agricultural labour force Total wage earners
Ghana 1988 1.0 8.8
Kenya 1990 3.5 19.1Malawi 1989 6.7 46.9Sierra Leone 1986-87 0.6 8.9Tanzania 1989 11.8 16.5Zambia 1990 2.1 10.3Zimbabwe 1989 11.2 24.4
Source: Wage earner figures from ILO t1992], except Sierra Leone and Tanzania which are from EJU: Sierra
Leone 1990-91, p. 12 and EIU: Tanzania 1991-92, p.11 and EIU: Zambia 1992-93, p. 18. Agriculturallabour force figures from IFAD [1992].
Another emerging trend is that farmers undertake diverse non-farmactivities to ensure survival ("straddling"). They engage in side businessesin the rural areas as well as having family members who work onneighbouring farms or in towns. Appleton and Collier [1990] show that inGhana rural households undertake a myriad of activities apart fromfarming. In Kenya in 1981-82 farm income provided (only) 48 per cent ofthe income of a rural household, with wages contributing 21 per cent, non-farming activities 17 per cent, and remittances and gifts 14 per cent[ILO/JASPA, 1991]. Pinstrup-Andersen [1989] shows that in HurungweDistrict of Zimbabwe, in 1985-86, 43 per cent of a farming household'scash income came from non-farming sources. Wages generated 7 per centand remittances 17 per cent, the two together attesting to the direct (wages)and indirect (remittances) importance of wage employment for farm fami-lies. Business and other non-agricultural activities contributed the rest ofthe cash income.
Differentiation on the farms arises from the fact that larger farmershave more surplus land available for cash crops and they consequentlydominate crop sales. At the very bottom of the ladder farms are much toosmall to produce a sufficient calorie intake for their families. Thus, higherproducer prices do not mean higher incomes for them; in fact they meanhigher expenditures since they are net purchasers of food. Unacknowledgedup to now, 30-40 per cent of African farmers quite likely fall into thiscategory.7 Increasing landlessness contributes to rural differentiation. In
See Weeks [forthcoming] for the case of Sierra Leone; Pinstrup-Andersen [1989], forMalawi and Zimbabwe, and Jamal [1993b1, for Zimbabwe.

CHANGING POVERTY AND EMPLOYMENT PA TTERNS UNDER CRISIS IN AFRICA 67
densely populated countries, such as Rwanda and Burundi, the proportioneasily reaches 20 per cent, but landlessness is also present in countries suchas Kenya and Zimbabwe, where significant tracts of fertile land have been
appropriated by large-scale farmers.
2. Urban labour force
The urban labour market has changed even more than the rural in thelast 15 years. It has become practically informalized, with the informalsector quite easily providing the bulk of employment in the towns. Declin-ing urban wages have contributed to this.
Table 5 shows the progress/regress in wage employment in eight SSAcountries — four where wage employment stagnated or fell and four whereit increased. Unfortunately, the first group is more typical of the regionalexperience than the second. Even where employment increased, it did soat rates much lower than the urban labour force (6-8 per cent beingcommon in most SSA countries) and hence the share of wage earners inthe urban labour force declined. Open unemployment has increased, withrates of 15-20 per cent becoming the norm but, more important, the shareof labour going to the informal sector has increased — the urban labourforce has become "informalized". Table 6 shows the trend for Tanzaniaand Kenya, with spot figures for Ghana, Malawi, Sierra Leone, Zambia,and Zimbabwe. Non-agricultural wage employment is expressed as a pro-portion of the urban labour force. It is assumed that the non-agriculturalwage category can be taken to proxy "urban" and that the residual urbanlabour force is all in the informal sector (whereas it also includes theunemployed). Assumptions have also to be made about the proportion ofthe population which can actually be counted to be in the labour force8but, by and large, despite such caveats, the ensuing figures should sufficeto establish certain broad trends in African urban labour markets.
In both Kenya and Tanzania, the "informal sector" was a rarity atindependence.9 Even a decade later, when the ILO first put the informalsector on the map (based on its renowned mission to Kenya in 1972),
A global figure of 45 per cent is used; in reality, labour force participation rates areincreasing, so in fact the calculations would go even more in the direction of informal-ization. For further discussion see Jamal [1993c].
In fact the calculations show that the non-agricultural wage employees exceeded thenon-agricultural labour force at the start of the 1 960s in bothcountries. This should not beconsidered a negation of the estimating procedure. It could simply mean that some of the"non-agricultural" wage employees were in fact not located in the urban areas. They couldbe in rural transportation, mines, etc.

68 THE POVERTY AGENDA: TRENDS AND POLICY OPTIONS
Table 5: Wage employment in selected SSA countries, 1975-91 (thousands)
1975 1980 1985 1991
Côte d'IvoireGhanaTanzaniaZambia
340.9
470.8393.5
470.2279.6(1982)
607.7379.3
415.5464.3534.8361.5
371.1306.8(1988)
711.8(1989)
365 .5
BotswanaKenyaMalawiMauritius
57.3819.1276.8168.6
83.41 005.81 370.4
197.1
117.21174.4
394.6209.5
222.81 464.0
461.0281.4
Source: ILO, Yearbook of labour stat istics, varbus years.
Kenya's urban economy was still very formal, with four-fifths of the urbanlabour force still in wage employment)0 By the same date, however,because of stagnating employment, Tanzania's urban sector was already 40per cent informalized. During the rest of the 1970s and the 1980s Tanzaniawent through even faster informalization because of its much higher rateof urbanization compared to Kenya (10-12 per cent against 6-8 per cent).
The other countries in Table 6 help to establish additional stylizedfacts about the informalization process in Africa, something that is worthpursuing since the informal sector is now taken so much for granted. Thingswere different at the start of the 1970s. One would at that time havedistinguished four types of African economies, based on the role of theinformal sector: (i) informal sector traditional: North Africa; (ii) informalsector dominant: West Africa; (iii) informal sector emergent: East Africa;(iv) informal sector negligible: Southern Africa. The first category wouldsignal the fact that in the north African countries small-scale activities havealways been the norm on which a modern sector was imposed," whereas
10 After doing these calculations, I consulted the estimates in ILO [1972], for theinformal sector: for Nairobi males, informal sector employment was estimated at 15.2 percent of the labour force (i.e. adult population over 14 years minus students) andunemployment at 9 per cent. Thus, the residual was 25 per cent. Formal sector wageemployment was put at 72.2 per cent. My figure here is for the whole of Kenya and nottoo far from ILO's estimate of 1972.
As Charmes [19851 put it for Tunisia: "Dans un pays aussi anciennement urbaniséque Ia Tunisie, I 'artisanat de production et de service, et le petit commerce, ont toujoursrepresenré une fraction importante de I 'emploi non agricole, depuis des dates trèsanciennes." [In a country of such a long history of urbanization as Tunisia, small-scaleproduction and service crafts as well as petty trading have always constituted an importantshare of non-farm employment.] O'Connor [1983] sums up the argument: "There arefundamental differences between pre-colonial cities (or parts of cities), where petty trade

CHANGING POVERTY AND EMPLOYMENT PA TTERNS UNDER CRISIS IN AFRICA 69
Table 6: Changes in the share of wage-earners in the urban labour force, Kenyaand Tanzania, 1962-90, and other selected countries (1960 = 100)
Year Tanzania Kenya
1960 100 100
1970 64 na.1972 n.a. 801975 52 701980 42 581984 25 na.1985 n.a. 531989 17 n.a.1990 na. 50
Note: Comparablefigures for other selected countriesare: Zimbabwe 76(1989); Zambia = 40(1990); Malawi= 25(1989); Sierra Leone = 12(1986-87); Ghana = 10(1988).
Source: ILO [1992] for wage-earners (non-agriculturalwage-earners identified as urban) and estimates of the urbanlabour force based on urban population.
elsewhere, first the modern sector appeared then the informal sector creptin. The contrast between the second and third categories would arise fromthe fact that urban zoning laws were much stricter in East Africa duringthe colonial days than in West Africa. The same situation obtained in thesouthern African countries where, additionally, the mines in South Africasiphoned off the excess labour which could not find productiveemployment on the land.
By now, there is a definite escalation, with the southern Africancountries in the "informal sector emergent" category and the easternAfrican ones in the "informal sector dominant" group. For both, zoninglaws have eroded in the face of rapid urbanization. In the meantime,informalization has continued apace in West Africa, and even in northAfrica we could now be talking more appropriately of the "informalsector" — as opposed to the "traditional sector" — since newcomers totowns have been pushed into non-traditional small-scale activities. Theinformal sector has managed to create "employment", but the sector isfamous for its heterogeneity and for "disguising" underemployment.'2
and crafts form the historic basis of the urban economy and where the 'formal sector' mayeven remain peripheral, and those cities where the latter developed first and an 'informalsector' has emerged dependent upon it."
12Indeed, as opposed to the fad, discovery of "jobless growth" (what is new about
GDP growing faster than employment?) I have sometimes referred to the informal sectoras a case of "growthless jobs".

70 THE POVERTY AGENDA: TRENDS AND POLICY OPTIONS
Moreover, recent increases in unemployment in African cities show thelimits to the absorptive capacity of this increasingly ubiquitous sector.
III. Poverty trends
What happened to poverty levels during the African crisis? Thepresumption should be that poverty increased: average incomes fell in mostcountries and they fell from levels which were already low, hence incomesof a significant proportion of the population must have fallen belowpoverty levels. By and large, this reasoning is correct and we also havespot indicators available to confirm the story, but the whole question hasto be approached quite gingerly since the composition of householdincomes has changed drastically in recent years. A broad picture can bedrawn up which will show that the impact of income declines was unevenas between the rural and urban areas and as between wage earners and therest; the urban areas lost more, and within the urban areas the wageearners lost even more.
1. Rural areas
Table 7 shows agricultural production figures on an aggregate and percapita basis. Agricultural output is an appropriate indicator to use in a casewhere a majority of the agricultural population are subsistence oriented,consuming what they produce, and where, as we also saw, wage labour isof marginal importance. Agricultural production doubled between 1961 and1992, which translates to a decline of 13 per cent in per capita terms, but,because of the massive migration from the rural areas, to an increase of 16per cent in per capita agricultural (approximately agricultural productivity)terms. Most of the increase occurred between 1961 and 1970. During thetwo decades of the crisis itself (1970-92) agricultural productivity stag-nated. Food production fared better than export production, which ratherneatly coincides with the generally held belief that African farmers with-drew out of export crops because of unattractive prices but maintained theirfood production.'3
' See Jamal [1988b]. This is a finding with global validity. Singh and Tabatabai[1993], show that in all the developing regions agricultural production held up much betterthan total production during the crisis.

CHANGING POVERTY AND EMPLOYMENT PA TTERNS UNDER CR/S/s IN A FR/CA 71
Table 7: Sub-Saharan Africa: Rate of growth of total and per capita agriculturalproduction, 1961-70, 1970-80 and 1980-92(% p.a. and index)
Rate of growth (% pa.) Index (1961 = 100)
1961-70 1970-80 1980-92 1970 1992
TotalAgricultural production 3.0 1.8 2.2 130.5 202.5Food production 2.9 2.0 2.3 129.3 207.1Agricultural export volume 3.8 0.0 2.8 145.5 196.9
Per capitaAgricultural production 0.4 —0.9 —0.7 103.7 87.0Food production 0.3 —0.7 —0.6 102.7 89.1Agricultural export volume 1.2 —2.7 —0.1 111.3 83.7
Per capita agric. populationAgricultural production 1.2 —0.2 0.5 111.3 115.9Food production 1.1 0.0 0.6 110.3 118.6Agricultural export volume 2.0 —2.0 1.1 119.5 111.3
Source: UNCTAD [19921, Table 6.5 for first two items and Table 2.1 for agricultural export volume, with sub-Saharan Africa identified as "non-petroleum, non-manufacturingexporter" Africa. Note that Table 2.1gives volume of total exports. Excluding petroleum and manufactures allows us to identify this approxi-mately as agricultural exports (mineral exports, however, not excluded). The figure for agricultural exportvolume against 1961-70 is actually for 1960-70. It is assumed that the rate of growth for 1960-70 alsoapplied to 1960-70.
One should now relax some of the implicit assumptions in the abovebroad-based picture in order to take account of the distributional angle. Atthe lower end of the scale, farmers who are net purchasers of food are hurtby higher food prices. The middle third remains indifferent, while the topone-third, who are net sellers of food as well as export crops, gain.'4 Thecash position of the top farmers probably remained stable in the 1975-85period, with declines in export incomes being counter-balanced byincreases in "food income"; since 1985 their position should haveimproved, with the turnaround in export-crop prices (see later) andcontinued increases in food prices. The position of the self-sufficientfarmers, too, should have improved since average food productionincreased. The worrying aspect remain the bottom one-third farmers. Not
'Obviously, this is another stylized picture. Both export-crop and food-crop sales are
made by many more farmers than just the top one-third. In terms of concentration, however,the top group controls upwards of three-quarters of the marketing. Kenya (3,000 or so large-scale farmers contribute over one-half of the crops markefrd) and Zimbabwe (6,000 or solarge-scale farmers contribute two-thirds) may seem like exceptions because of the legacyof large-scale farming, but they are actually not too far from the pattern in other Africancountries.

72 THE POVERTYAGENDA: TRENDS AND POLICY OPTIONS
only have they been faced with higher food prices, their food productionmay also have declined more than for the average farmer, under the impactof weather conditions. These farmers are also much more dependent onremittances from urban family members to make ends meet, and, as weshall see, urban wages fell even more than agricultural incomes.
Altogether, the point that emerges from the above discussion is thatagricultural incomes (or output) fell much less than average incomes (GDPper capita), but that the impact was on the whole regressivebecause of thedeteriorating position of the bottom third of the farmers. While not allfarmers fell into poverty, the implied decline in cash incomes in the 1975-85 period visibly translated for all into a decline in housing standards andin the stock of durable goods, such as bicycles, utensils and agriculturalimplements. Since the late 1980s, export volumes have begun to recoveras have producer prices, but both remain far below their levels in the early1970s. Whether prices will ever attain their 1970s level is much to bedoubted.
The picture we have painted above is incomplete, since farmers aremuch more than farmers and since their extra-farm sources of income havebeen changing. As we saw earlier, agricultural smallholder families obtainquite a large part of their total income from wages, remittances and non-farm activities. It is unfortunately difficult to say anything precise on howany of these changed or how the different layers of farmers were affected.Zimbabwe data indicate that the wage sources of income (wages and remit-tances) contribute proportionately more to family income at the lower endof the distribution than at the upper end. Farm wages have been falling, ashave urban wages,'5 and congruently, the bottom end of the farmers aremost affected by these trends. By and large, this generalization wouldapply to most other African countries. As for non-farm activities, thepicture seems to be that mostly the better-off farmers dominate these, sincethey have sources of savings to carry on trade and production. It could bethat we simply did not notice them up to now, but the increasing attentionto the rural non-farm sector in Africa [see Baker, 1990] does seem tosignify that there has been a genuine expansion: the collapse of theinfrastructure has pushed the rural areas to their own resources while at thesame time providing them some natural protection against town products.
° It is worth interjecting that wage declines in Zimbabwe have been quite smallcompared to the rest of the SSA countries (see Table 7). The urban informal sector, too,absorbs only a quarter of the urban labour force compared to the 60-75 per cent elsewhere.All this could be changing — see ILO 19931.

CHANGING POVERTY AND EMPLOYMENT PA TTERNS UNDER CRISIS IN A FRICA 73
2. Urban areas
The most visible impact of the crisis has been in the urban areas. Aswe have noted, rural incomes fell much less than total GDP — i.e. ipsofacto, urban incomes fell more than total GDP. At the same time, urbanareas have been growing much faster than the rural areas (5-6 per cent peryear compared to 2 per cent) and hence average urban incomes have fallensharply, declines of 30-40 per cent being registered in countries such asGhana, Uganda, Tanzania, and Zambia. Perhaps one could say that urbanincomes being above subsistence needs could "afford" to fall, whereasfarm incomes were too near bare sufficiency to countenance any decline.Also, of course, urban production requires a host of inputs and supportinginfrastructure and services, all of which disappeared under the crisis,whereas the average farmer being self-sufficient in terms of input usagecould maintain at least his food production despite the widespread collapse.
Within the urban areas, wages fell the most. Table 8 shows this forsome of the more important sub-Saharan economies. As an average, wageshave fallen by 50-60 per cent in most African countries, with much greaterdeclines if comparison is made against 1975 when wages were generallyat their highest in Africa. Thus, in Kenya, wages fell by 50 per centcompared to 1975 and in Ghana and Tanzania by 70 per cent.
Table 8: Minimum wages in real terms, selected SSA countries, 1970-92(1980= 100)
Year Côte d'lvoire Ghana Kenya Nigeria Tanzania Zimbabwe
1970 104 455 120 — 1311975 114 523 121 — 138 —
1980 100 100 100 100 100 1001981 92 105 88 148 104 971982 94 86 73 138 77 1431983 89 82 64 115 60 107
1984 85 82 59 81 52 1171985 84 136 63 79 45 1101986 79 154 59 — 37 1231987 — — 59 — 31 1091988 — — 60 — 30 1201989 — — 61 — 29 1221990 — — — — — 1201991 — — — — — 1141992 — — — — — 92Source: ILO databank, supplementedby Jamal & Weeks [1993) and ILO [1993].
74 THE POVERTY AGENDA: TRENDS AND POLICY OPTIONS
Wage declines of the magnitude depicted above obviously mean a cutin living standards, but what do they mean for poverty? We need a povertyyardstick. Three are provided in Table 9, taking the case of Tanzania forillustrative purposes since, by and large, it corresponds to the pattern inmost African countries. One comparison is in terms of what the minimumwage would purchase of maize meal, while the others set the minimumwage against a food and total poverty line. The first comparison itselfneeds a yardstick to be meaningful: two-thirds of a kilogramme of maizemeal provide 2,200 calories, the absolute minimum for an average person.On this basis, by 1991, the minimum wage would feed only three persons— on maize meal alone, and uncooked at that. Estimates of the food andtotal poverty line allow for other essential needs. The poverty lines (for afamily of five members) were originally calculated at March 1984 prices[see ILO, 1988; Jamal, 1988d], and extrapolated to other years by applyingthe consumer price index. Very simple baskets were chosen. In the case offood, maize meal was given a weight of 75 per cent of daily per capitacalories (set at 2,200), beans 15 per cent, fats 5 per cent, and sugar 5 percent. Similarly, in the non-food, basket only core items such as clothing,rent, transport, fuel and water were included. School fees, medicines andentertainment were deliberately omitted as were tea, spices, milk, meat,etc. Obviously those falling below such austere poverty lines must be
considered to be in extreme poverty.At its maximum (1974), 40 per cent of the minimum wage would have
sufficed to purchase the minimum needs poverty basket — in other words,60 per cent of the income would be available to purchase relatively morediscretionary goods. By 1984 the minimum wage had fallen below theminimum basket and by 1988 below even the minimum food basket. Sincethen there has been an improvement in the real wage measured against theconsumer price index (though not against maize meal price)'6 and by1991, the minimum wage would purchase 20 days' worth of basic goods.If we were to add the other essential items — medicines, transport, etc. —
the minimum wage would be exhausted within 12-15 days.
16 As an aside, we note that the change in living standards measured in terms of maizemeal differs compared to the consumer price index. This is because after 1984 under thestructural adjustment programme, the government removed the subsidy on maize meal,letting its price increase almost 2½-fold overnight. Thereafter, the maize meal pricestill
increased faster than the overall price index.
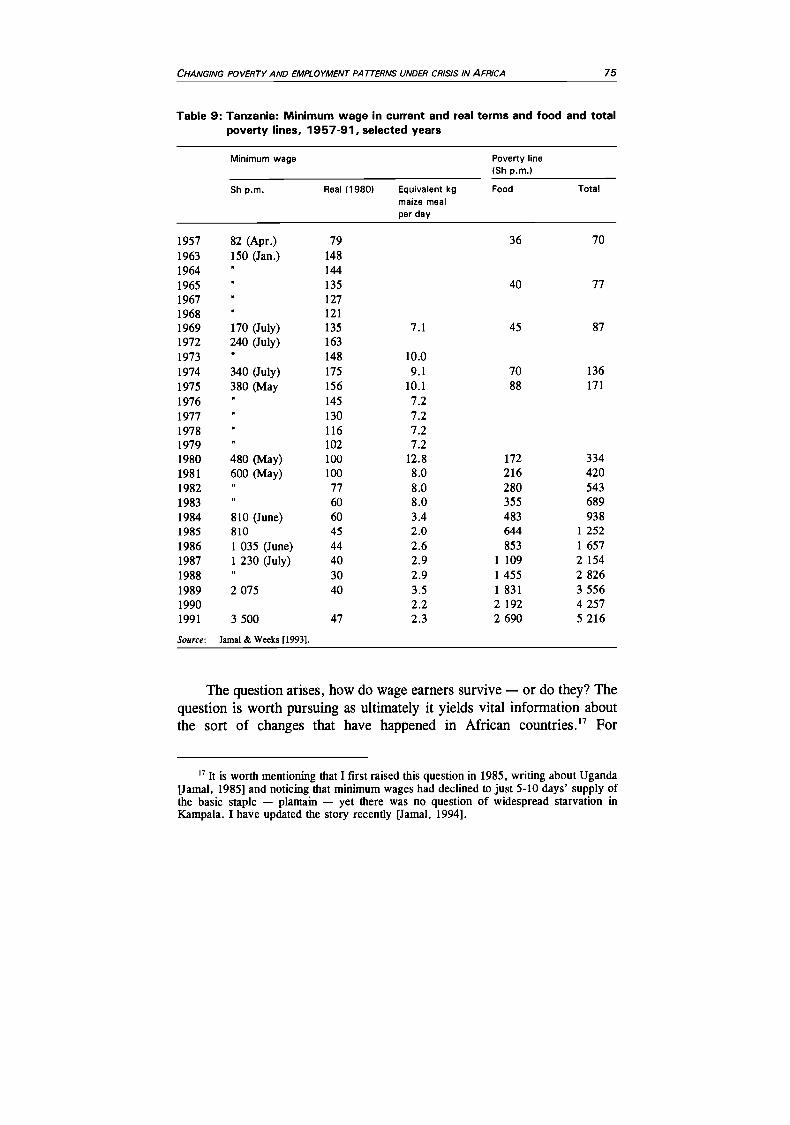
CHANGING POVERTY AND EMPLOYMENT PA TERNS UNDER CRISIS IN AFRICA 75
Table 9: Tanzania: Minimum wage in current and real terms and food and totalpoverty lines, 1957-91, selected years
Minimum wage Poverty line(Sh p.m.)
Sh p.m. Real (1980) Equivalent kgmaize mealper day
Food Total
1957 82 (Apr.) 79 36 70
1963 150 (Jan.) 148
1964' 144
1965" 135 40 77
1967 127
1968' 121
1969 170 (July) 135 7.1 45 871972 240 (July) 163
1973" 148 10.0
1974 340 (July) 175 9.1 70 136
1975 380 (May 156 10.1 88 171
1976 145 7.2
1977 130 7.2
1978" 116 7.2
1979 102 7.2
1980 480 (May) 100 12.8 172 334
1981 600 (May) 100 8.0 216 420
1982" 77 8.0 280 543
1983 " 60 8.0 355 6891984 810 (June) 60 3.4 483 938
1985 810 45 2.0 644 1 252
1986 1 035 (June) 44 2.6 853 1 657
1987 1 230 (July) 40 2.9 1109 2 154
1988" 30 2.9 1 455 2 826
1989 2 075 40 3.5 1 831 3 556
1990 2.2 2 192 4 257
1991 3 500 47 2.3 2 690 5 216
Source: Jamal & Weeks [1993}.
The question arises, how do wage earners survive —or do they? Thequestion is worth pursuing as ultimately it yields vital information aboutthe sort of changes that have happened in African countries)7 For
" It is worth mentioning that I first raised this question in 1985, writing about Uganda[Jamal, 1985] and noticing that minimum wages had declined to just 5-10 days' supply ofthe basic staple — plantain — yet there was no question of widespread starvation inKampala. I have updated the story recently [Jamal, 1994].

76 THE POVERTY AGENDA: TRENDS AND POLICY OPTIONS
example, for most African countries, a calculation of the minimum wagein terms of its purchasing power would imply starvation for the urbanwage earners, yet, nowhere do we see such a dire situation. First of all,the average wage in most countries is higher than the minimum wage. Forexample, to stay with the Tanzania case, the average wage at the start ofthe 1990s was 1.5 times the minimum wage. This means that while theminimum wage could only buy 20 days' supply of goods, the average wagemanaged to buy a month's supply. But even the average wage would buyonly a most austere basket and still one-half of the wage earners earnaround the minimum wage. The answer to the "wage/poverty puzzle" isprovided by "straddling". Urban households have re-established theirlinkswith the countryside, reversing the labour force stabilization process of the1960s. Compared to before when they regularly remitted a part of theirwages back to the rural areas, now they are as likely to be recipients of"remittances" from the rural areas in the form of food collected fromfamily farms. They have begun to grow their own food in towns, some-thing that was always practised in Africa, but had declined because ofincreasing urban specialization, and they have turned to trading in theinformal sector.
These kinds of "fusions" have managed to keep the urban familiesabove absolute poverty. Certainly the sort of declines depicted by wagefigures do not translate to declines in family incomes. Put differently, wageis now no longer a reliable indicator of family welfare since the composi-tion of family incomes has changed. Whereas up to the mid-i 970s wagescomprised, say, three-quarters of a wage-earner family's income, now theyprovide less than two-fifths. What has quite likely happened is that,compared to the 60-80 per cent decline in wages shown by the statistics,total family income probably declined by only half as much. This kind ofdecline should not be scoffed at: in the context of generally low incomes,it would mean the loss of command over everything except the most basicgoods. It would mean food absorbing three-quarters of the family incomecompared to only half as much at the start of the i 970s. The "topping" hasdisappeared from urban incomes. We have only to look at import figuresto see how much living standards have fallen. Most sub-Saharan countriesare now importing less than one-third as much in per capita terms as 15years previously, and this in a context of a virtual collapse of localindustries. "Income" for the majority of urban dwellers now effectivelymeans 2,200 calories per day plus basic necessities plus emergency fundsfor health care.
Moreover, just as in the rural areas, differentiation has increased inthe towns since the straddling solutions are not equally available to all

CHANGING POVERTY AND EMPLOYMENT PA TTERNS UNDER CRISIS IN AFRICA 77
wage earners. Growing food in the urban areas is only possible for thosewith a plot of land in the vicinity and this effectively means long-termresidents and migrants with ethnic ties to the city. Similarly, making foraysinto the rural areas to tap on family farms is only possible for those whohave migrated from nearby areas. On both counts, migrants from outlyingdistricts lose out. It is not unknown for these non-native migrants to moveback to the rural areas.'8
Some summing up is in order on the trends in rural and urban povertyand to provide a transition to the next section. Urban incomes have fallenmuch more than rural incomes and poverty has increased in the urbanareas to the extent that now we speak of an "urbanization of poverty" inAfrica, whereas at the start of the 1970s it was rare to speak of urban po-verty.'9 The great decline in urban wages has been the contributing fac-tor. Two famous casualties have been the wage-farm gap and the rural-ur-ban gap. In so far as these gaps were taken to be manifestations of urbanbias, that bias has been reduced; in fact, based on discussion to follow, ur-ban bias has disappeared. The part of the alleged bias that came from mi-nimum wage regulations has obviously gone with the total marginalizationof these regulations but even the bias against agricultural prices has gone.
IV. Deciphering "urban bias"
As one understood it up to now,2° "urban bias" implied a redistribu-tion of income: farm prices were held low and urban wages high, and the
18For example, the population of Kampala (Uganda) is now much more Baganda thanin the 1970s. Lack of security was also a contributory factor. In fact as opposed to thegeneral African trend, Uganda's towns were depopulating during the 1975-85 decadebecause of the widespread breakdown of law and order during the Amin and Obote years[see Jamal, 1988a; 19941. An examination of how the ethnic composition of towns in theother countries changes would provide some real clues to the differential impact of thecrisis.
19 For example, for Kenya in 1976, I (and many other researchers) had estimated urbanpoverty at under 10 per cent [Jamal, 1982 (Kenya)] whereas for 1990, working for theKenya Presidential Committee on Employment, I estimated it at one-third [Jamal, 1990].
20 the revival of the debate in the Journal of Development Studies (July 1993) whereProf. Lipton takes the stand that to him now the more important aspect of urban bias is interms of government allocation of expenditures rather than "price twists" [Lipton, 1993].Even though everywhere in the world urban bias through wages and price distortions maybe disappearing does not mean that the powerful mechanism for distribution embodied inwages and pricing policies that Lipton himself did so much to publicize should be jettisonedso easily.
78 THE POVERTY AGENDA: TRENDS AND POLICY OPTIONS
former fed the latter (literally). "Urban bias" was mostly derived from thecase of Asian countries where "farm prices" meant food prices and whereholding down farm prices could thus be taken to imply a subsidizationofurban consumers [Lipton, 1977]. However, when the African case cameto be considered by Berg in the World Bank's 1981 report [World Bank,19811 and by Bates in his celebrated book on State intervention in Africa[Bates, 1981], "urban bias" was almost exclusively applied to export cropssince these comprised the bulk of crop marketing in Africa and since theirprices were almost everywhere controlled by the State. (Grain prices also
were nominally controlled but evasion was common; non-grain stapleprices were almost never controlled. Non-grain staples provide the bulk of
calories in most African countries.)Parts of the argument, however, emerged much earlier. Bauer [1954],
Ehrlich [1958], and Helleiner [1966] wrote in the 1950s and 1960s aboutthe surpluses extracted from farmers by the marketing boards; Berg him-self noted the increase in urban wages in the 1960s [Berg, 1964; 1966];and no less an authority than W. Arthur Lewis warned about the attendantrural-urban gaps in 1967 [Lewis, 1967]. Turner, in a series of reports forthe ILO [1967; 1969; 1975; 1978], expressed concern about wages andpricing policies in Tanzania and Zambia in terms of the widening gaps, and
ILO/JASPA' s earlier employment missions [ILO/JASPA, 1977; 1978; 19811carried on the tradition.
By the start of the 1980s, mostly unnoticed up to then, urban wageshad been declining for at least five years and the income gap betweenfarmers and wage earners had begun to turn in favour of the former (Jamal[1982]; consolidated in Jamal & Weeks [1987; 1988] — now published,[1993]). It was shown that wage declines were an Africa-wide phenomenonapplicable even to the francophone countries. Jamal and Weeks's findingwas that urban wages were on the decline. We saw some examples earlier.
In the rest of this section, we shall look at the agricultural side ofurban bias showing how we might arrive at some estimation. We shall con-centrate on export crops since it is for them that bias was said to be mostrampant. We shall as before use the example of a single African country— Uganda. This presents no problem since we wish to illustrate how calcu-lation of urban bias might be done; whether the trends depicted are alsoapplicable to other African countries would have to be justified separately.
Deriving urban bias requires comparing farm prices against someideal. That ideal is provided by the price that would obtain under free-market conditions. Lacking an unequivocal internal candidate, the importparity price is sometimes chosen to compare food-crop prices and the
export parity price to compare export crops. The underlying argument

CHANGING POVERTY AND EMPLOYMENT PA 7TERNS UNDER CR/S/S IN AFRICA 7.9
seems to be that fanners' labour should be rewarded at a rate determinedby the price of their produce in the world market. Why this is an appro-priate standard has never been clarified; wage labour is, of course, notrewarded by any comparison with what agricultural or non-agriculturalexports fetch. Also, why farmers should prima facie receive the full benefitof an erratic boom in commodity prices — as in 1976 — or how boomsand busts should be managed, is also not self-evident. Moreover, a simplecomparison of producer price and border price, as is done for derivingnominal or effective rates of protection, often yields erroneous results2'and in any given year, cannot even be used as a guide on farm taxation.22
One fruitful avenue to get around some of the problems is to comparefarm prices and international prices in real terms and to render these priceseven more "real" by showing what the farmer and the country could buyof a consumer good from a quantity of exports. How the two series movein relation to each other would tell us something about government bias,and when we combine that with calculations of nominal protection, we maybegin to get nearer the full picture on farm taxation. As far as I know,nobody has looked at distortions this way, although I myself had tried toapply the idea a few times before (Jamal [1986a1, for the case of Tanzania,[1991] for the case of Uganda and [1993c] for the case of Ghana; alsoJamal [1994], for Uganda). Perhaps there was nothing innovative aboutthis, but recently Peter Timmer [1993] has made this point emphatically.
Calculating the terms of trade for Uganda — the ratio between metresof cloth and 100 kilogrammes of lint — on the international market (NewYork) and the internal market (for the farmers producing crops for export),indicates, for instance, that in 1972 the farmers were "taxed" on a 36 per
21 Three problems arise in comparing producer prices to international prices. (i) Thetwo sets of prices will be for products at different stages of processing —in the case ofcotton, the farm price will be for unginned cotton ("seed cotton"), whereas the export pricewill be for "lint". Each kg of seed cotton yields one-third kg of lint (+ seed as a by-product). Hence a price of Sh. 5 per kg of seed cotton translates to Sh. 15 per kg of lint.(ii) An allowance should be made for processing costs. (iii) Prices have to be reduced tothe same unit of currency for comparison purposes and for this an exchange rate has to beapplied. In the 1960s using the official exchange rate was justified since exchange rateswere then in "equilibrium". In the 1980s this procedure yielded disastrous results. All threetypes of errors are contained in World Bank/UNDP's "Indicators for Africa" [WorldBank/UNDP, 1992, Table 8-21. To give just one example, in 1980 the Uganda cottonfarmer is shown to be getting 13 per cent more than the international price; in fact thefarmer was being severely punished, to the extent of receiving only a quarter of theinternational potential price.
22 For example, it is possible to find in a boomyear very heavy "taxation" but thiswould simply signify government's desire to maintain some parity between export pricesand food prices and between farmers and non-farmers.

80 THE POVERTYAGENDA: TRENDS AND POLICY OPTIONS
cent rate, i.e. their purchasing power was 36 per cent lower than that ofexporters in New York. The question is whether 36 per cent is the truemagnitude of the urban bias. To answer this question, it is necessary tolook at the evolution of taxation over time. Using a historical seriesstarting in 1927, it appears that 1970 is the year with the lowest taxation(20 per cent). Most of this was in the form of indirect taxes to protect thelocal textile factory. If we hold that 20 per cent is the "right" amount offarm taxation then, since external prices had risen, this would require thatin 1973 farmers' labour should be rewarded at almost twice the rate of1970: on what grounds?
The wider point is that the case of export-crop pricing is differentfrom that of food-crop pricing, which provided the earlier impetus for theurban bias model. In the food case, lower producer prices could be takento be directly benefiting the urban dwellers, and if this happened becauseof government intervention, it could be said that farmers were being penal-ized to benefit the townspeople, particularly the wage earners. In theexport case, of course, there is no such linkage, since export crops for the
most part do not enter into local consumption. The surplus that is/was
extracted from the farmers was used to construct much-needed infra-structure (in the rural as well as urban areas), to build up an industrialbase, and to provide social services (in both rural and urban areas).Townspeople too were taxed - directly and indirectly. No doubt theygained the most from the infrastructure, industries and social services, butto that extent there will perhaps always be urban bias: development almostby definition requires industrialization and initially industries may have tobe financed from taxing the farmers.
Trends after 1980 should be noted, since they tell the common tale ofdisappearing urban bias in agricultural pricing policies in Africa. Between1972 and 1980, producer prices declined by a staggering 85 per centwhereas external prices more or less held their own. The differencebetween the country's purchasing power and the farmers' came mostlyfrom the maintenance of an overvalued exchange rate: farmers' realincome was simply allowed to erode away and the difference pocketed bythose who had access to imports at the official exchange rate.23 After1980, devaluations enabled farm prices to be raised in the face of fallingexternal prices. For a while these opposing trends could be accommodatedby reducing overt taxation but, with the surplus exhausted, additional
23 As shown in Jamal [1993c, Table 3.41, in 1980 the exchange was still fixed at Sh.7/$(since at least independence) whereas on the parallel market Sh.50 was routinely obtaiued.

CHANGING POVERTY AND EMPLOYMENT PA TTERNS UNDER CRISIS IN AFRICA 81
increases in real prices have effectively been financed by income transfersfrom other groups.
As the point is new and likely to be disbelieved, Table 10 shows theproducer and New York prices for Ugandan cotton for three representativeyears and the price chain for 199 1-92. Between 1972 and 1980 the realprice of cotton fell by 87 per cent on the internal market at a time whenthe external price held its own. Between 1980 and 1991 the trends wereequally dramatic; internal price increased almost sevenfold whereas externalprice fell by a third. The price chain for 199 1-92 shows that almost the fullvalue of the parity price was returned to the farmer, which could easilyturn into a subsidy situation if allowance is made for transportation fromthe farm to the ginnery.
Similar trends are shown by most other African countries which areapplying standard structural adjustment programmes — and that means amajority of the African countries. "Rural bias" is now well ensconced inAfrica. To cite just two other examples, by 1991-92 the Tanzanian cottonfarmer was getting the full potential international price and the coffeefarmer was actually being subsidized,24 while in Ghana the trends forcocoa were going counter to international trends after the mid-1980s [seeJamal, 1993a] and by now the attempt to maintain internal prices in realterms must mean effective subsidization. Obviously this is a subject wellworth further research since it signifies "getting the prices wrong" —with,it is worth noting, the full blessing of the World Bank and the IMF.
A final comment brings us back to the question of poverty. Theprevious reference to the ratio representing the terms of trade for Ugandacan be translated to incomes if we realize that 100kg of cotton is the usualyield from an acre of land and that an acre of land is about the averagedevoted to cotton. Minimal incomes are suggested. These would be on topof "income" embodied in food consumed from own farm. The averageAfrican farmer has never risen above a position where food constitutes lessthan two-thirds of total "income". And it is a comment on internationalprice trends that farmers obtained much more for their produce in thedistant past. The savings accumulated had enabled them to build up a stockof durable goods up to the 1960s. Most of these disappeared in the 1970sbut significant improvement is shown in the incomes of cotton farmerssince 1980.
24 Bienefeld [forthcoming has looked carefully at the earlier studies by Ellis (see, inparticular, Ellis [1982]) of urban bias in Tanzania, raising questions about their statisticalprocedures. More recent figures of trends in real producer prices given by Bienefeld whencompared to international prices show the disappearance of even the remaining urban bias.

82 THE POVERTY AGENDA: TRENDS AND POLICY OPTIONS
Table 10: Producer and New York price of cotton, Uganda, 1972, 1980and 1991 , and price chain, 1991/92
Year Producer price for Cost of living New York price Manufacturing unit
seed cotton (Sh/kg) index for lint 1$/kg) value index'
1972 0.0125 1.51 0.76 37.3
1980 0.06 57 1.79 91.6
1991 300 41 380 1.55 117.9
Price chain, 1991-92New York (per kg) lint price 1.55
Equivalent preginningb 1.00
Exchange rate (Sh/$) 955Value of lint pre-ginned Sh. 955Convert to seed cottonat 033d = Parity price Sh. 316
Farmer paid Sh. 300
Notes: MIJV reflects the price of Uganda's imports.Deducts Kampala-New York transport, and ginning chargesBureau exchange rate, average of 1991 and 1992.
of seedd One kg of seed cotton yields 0.3 kg of lint. Therefore Sh.955 per kg of lint = per kg
cotton.Source: Jamal [1994, Tables A11l.l and AI1I.2]. Price chain is for 1991/92 season.
V. Conclusion
African labour markets and the associated poverty patterns havechanged dramatically in just the last 15 years. The once so-calledaristocracy of labour in urban areas has practically disappeared, so muchso that the informal sector and farming now contribute the greater part ofthe income of a nominal wage-earning family in towns. Simultaneouslystagnation in wage employment and continuing rural-urban migration haveresulted in an informalization of the urban labour force. Open employmenthas also increased. In the rural areas the sources of income have shiftedfrom export crops to food crops under the impact of changes in relativeprices and outputs. Cash incomes from export crops have fallen sub-stantially but the cushion provided by subsistence production and increasingfood prices has helped to limit the decline in total income. The drop in thecash income, however, must have caused a commensurate drop in house-hold expenditure. Rural labour markets have changed in other significantrespects. Landlessness is increasing and non-farm activities are beginningto rival farming as a source of family income. And — again as a reflectionof the diversified strategies families have to follow — the number offemale-headed households is increasing in the rural areas.

CHANGING POVERTY AND EMPLOYMENT PA TTERNS UNDER CR/S/S IN A FR/CA 83
On the income front, declines have been registered in both the ruraland urban areas, more in the latter than the former. Poverty has increased,especially given that the income declines have been greater for the poorestsections of the population. The very poor farmers have suffered propor-tionately greater output declines under the impact of inclement weather,while at the same time they have not been in a position to gain from priceincreases for food crops, or lately, under structural adjustmentprogrammes, for export crops, since they have few surplus crops to sell.On the other hand, as consumers, they have lost from higher food prices.In the urban areas the wage declines have obviously affected wage-earnersand a majority of them must now be counted among the vulnerable groups.
What sort of policy implications arise? The problem is, of course,how to bring about an increase in productive employment in Africa —butit is not as simple a question as implementing a "wages policy" to increaseurban employment or a prices policy to increase agricultural output.Removing the distortions from wages and agricultural prices ("distortioncleansing", as I call it) has already happened under structural adjustmentprogrammes without any of the beneficial impacts expected. Most notice-ably wages have fallen — decimated — without any increase in wageemployment, and prices, of both food crops and export crops, haveincreased, again without any perceptible increase in output. The limit tofalling wages and increasing prices has already been reached.
The problem is much more deep-seated. In fact in a situation wherewhole economies have collapsed and infrastructure decayed, the problemis to get the economies on the growth path again. And here, initially, theunpalatable truth will have to be faced that, although export crop prices areon a falling trend, they remain the main engine of growth of most Africancountries and hence somehow they must be revived. Simultaneously allefforts must be made to diversify into non-traditional exports. Initially thedirect beneficiaries will be the large-scale farmers who dominate exportproduction but exports also have indirect benefits by increasing governmentrevenues. These could be used to increase sorely needed social services andrebuild the infrastructure.
Increasing export production will require changing the state oftechnology in agriculture and rehabilitating the supporting infrastructure.The task was always difficult, and became even more so given the intensi-fication of the "vicious circles of poverty" as a result of the persistentcrisis. At the household level this has meant that farm incomes have falleneven below their already low thresholds and farmers have no surplus toinvest in tools, fertilizers, bags, etc. At the national level, given the

84 THE POVERTY AGENDA: TRENDS AND POLICY OPTIONS
contraction in revenues, the government is in no position to supply any ofthese, let alone repair the infrastructure and import medicines and books.
Obviously, the vicious circle has to be broken and the best means isto increase agricultural incomes. Increasing export prices could do this butthis is unlikely. The onus falls on the government to marshall all resourcesin a major effort to revive the agricultural sector. At the internationallevel, aid should be increased with this specific objective in view. Thetruth is, the African economies need to be jump-started. Without this, thegains from minor increases from export production may not be sufficientto stop the cumulative decline.
Once the economies begin to achieve 5-6per cent growth based on theagricultural sector, all efforts must be made to diversify the economies.The first avenue for diversification could be non-traditional export crops,such as fruits, vegetables, flowers, but even here the markets are alreadybeginning to soften as almost all developing countries attempt to capturea share. The potential for absorbing labour is also limited.
Diversification should in fact attempt to reduce the reliance of theeconomies on agricultural exports. Initially the rural non-farm sectorshould be targeted so as to ease the pressure of the population on the land— as well as stop the drift to the towns. Non-farm activities haveburgeoned spontaneously as a coping mechanism under the crisis but nowthey must be explicitly incorporated in the growth process. They not onlyhave a vast potential for labour absorption, they also have the greatadvantage of being linked with the agricultural sector. The "rural informalsector" — for that is what the rural non-farm activities amount to —utilizes agricultural products as inputs and its own outputs are used asinputs in agriculture. Thus, growth in agriculture would stimulate non-farmactivities, which would in turn stimulate agriculture.
In the past, great emphasis was put on the urban informal sector as theanswer to the "employment problem" in Africa. This should be guardedagainst. The informal sector is simply the embodiment of a coping mecha-nism and often a dysfunctional one. Much of the increase in "employment"in the informal sector simply signifies an increase in underemployment andthis has definite limits. The rural-based strategy recommended here shouldhelp to stem the tide of migration to the towns and give the urban economya chance to clear the backlog of unemployment. During this time theinformal sector skills should be improved to ensure a dynamic role for thissector. The caution against relying on the informal sector should be seenin this light: the informal sector should be an integral part of the growthprocess and play its role in employment creation, but this should be basedon increasing the dynamic potential of the sector.

CHANGING POVERTY AND EMPLOYMENT PA 7TERNS UNDER CRISIS IN AFRICA 85
Skill enhancement is in fact the sine qua non of African growth. In allsectors, production technology remains rudimentary. African countriesachieved much success in spreading primary and secondary education —but the weak link was that university education was seen as the culminationof the education cycle. Vocational training, which can even start mid-waythrough secondary school, should be the focus of attention in the educationfield. The pity is that even the rudimentary vocational training that existedhas virtually disappeared, with the breakdown of equipment and the braindrain of teachers to foreign countries.
Everywhere we look, then, there are major constraints to be lifted tobreak the chain of the downward spiral. Africa is in fact like a war-ravaged continent — ravaged by famines, civil wars, falling commodityprices — and like any region emerging from war, it is faced with crumblinginfrastructure. The situation is even worse, as Africa's depredations arecontinuing and even some basic skills patiently acquired are disappearing.
To the list of factors responsible for Africa's decline some would wantto add "bad governance" and in fact put it at the top — policies whichhave favoured the urban sector at the expense of the farmers. In the natureof things, this debate (the relative contributions of external and internalfactors to the crisis) is indeterminate: economics is like that, everything isinterconnected and no economic models are yet available to disentangle theimpacts of myriad exogenous and endogenous factors. In a way, of course,the debate was won by the internalists some time ago; everywhere inAfrica now the major distortions in factor and product markets have beencorrected. Most African countries are now also going through a process ofdemocratization. These positive developments should be recognized, butat the same time there should be an acknowledgement that results havebeen lacking so far and of the real threat that withdrawal of the State fromsocial and even economic functions is leaving an utter vacuum in the sub-Saharan countries which privatization is not yet able to fill. There shouldbe a recognition that free-market dictates at the international level are tyingup the African countries to declining markets and that the debt burden iseating away Africa's only source of foreign exchange and savings. By nowAfrican countries have fulfilled their part of the bargain by accepting strictstructural adjustment programmes. Now is the time to set that ideologicaldebate aside and ensure that some visible results are forthcoming.

86 THEPOVERTYAGENDA: TRENDS AND POLICY OPTIONS
Bibliographical references
Appleton, S.; Collier, P. 1990. Agriculture and the macro-economy: Consequences ofnegative external shocks in Ghana and the Côte d'Ivoire, 1979-87. WEP ResearchPaper. Geneva, ILO.
Baker, J. (ed.). 1990. Small town Africa: Studies in rural-urban interactions. Uppsala,Bohusläningens Boktryckeri.
Bates, R. 1981. Markets and states in tropical Africa. Berkeley, University of CaliforniaPress.
Bauer, P. T. 1954. West African trade: A study of competition, oligopoly and monopoly ina changing economy. Cambridge, Cambridge University Press.
Berg, E. 1964. "Real income trends in West Africa", in Herskovits, M. J.; Harwitz, M.(eds.): Economic transition in Africa. London, Routledge and Kegan Paul.
—. 1966. "Major issues of wage policy in Africa", in Ross, A. M. (ed.): Industrialrelations and economic development. London, Macmillan.
Bienefeld, M. Forthcoming. "Structural adjustment and rural labour markets in Tanzania",in Jamal, forthcoming.
Charmes, J. 1985. Secteur non structure: Politique économique et structuration sociale enTunisie, 1970-1985, mimeo.
Ehrlich, C. 1958. "The marketing of cotton in Uganda", Ph. D. dissertation. Universityof London.
EIU (Economist Intelligence Unit). 1990-91. Country report on SierraLeone. London, EIU.
—. 1991-92. Country report on Tanzania. London, EIIJ.
—. 1992-93. Country report on Zambia. London, EIU.
Ellis, F. 1982. "Agricultural price policy in Tanzania", in World Development (NewYork), Vol. 10, No. 4.
Helleiner, G. K. 1966. Peasant agriculture, government and economic growth in Nigeria.Homewood, Ill. Richard B. Irwin.
WAD. 1992. The state of world rural poverty. New York, New York University Press.
ILO. 1967. "Report to the Government of the United Republic of Tanzania on wages,incomes and prices policy", Turner Tanzania Report I. Geneva, ILO.
1969. "Report to the Government of Zambia on incomes, wages and prices in Zambia:Policy and machinery", Turner Zambia Report I. Geneva, ILO.
—. 1972. Employment, incomes and equality: A strategy for increasing productiveemployment in Kenya. Geneva, ILO.
—. 1975. "Report to the Government of Tanzania on the past, present and future incomespolicy in Tanzania", Turner Tanzania Report II. Geneva, ILO.
—. 1978. "Second report to the Government of Zambia on incomes, wages and prices inZambia: Policy and machinery", Turner Zambia Report II. Geneva, ILO.

CHANGING POVERTY AND EMPLOYMENT PA TTERNS UNDER CRISIS IN AFRICA 87
—. 1988. Distributional aspects of stabilisation programmes in Tanzania. Geneva, ILO.
—. 1992. Yearbook of labour statistics. Geneva, ILO.
—. 1993. "Structural change and adjustment in Zimbabwe", report of a mission toZimbabwe. Geneva, ILO, mimeo.
ILO/JASPA. 1977. Narrowing the gaps: Planning for basic needs and productiveemployment in Zambia. Addis Ababa, ILO/JASPA.
—. 1978. Towards self-reliance: Development, employment and equity issues in Tanzania.Addis Ababa, ILO/JASPA.
—. 1979. Options for a dependent economy: Development, employment and equity problemin Lesotho. Addis Ababa, ILO/JASPA.
—. 1981. Ensuring equitable growth: A strategy for increasing employment, equity andbasic needs satisfaction in Sierra Leone. Addis Ababa, ILO/JASPA.
—. 1991. African Employment Report 1990. Addis Ababa, ILO/JASPA.
Jamal, Vali. 1982. Rural-urban gap and income distribution: The case of Kenya, Lesotho,Nigeria, Sierra Leone, Somalia, Tanzania (6 separate case studies). Addis Ababa,JASPA.
—. 1985. Structural adjustment and food security in Uganda. WEP Research WorkingPaper. Geneva, ILO.
—. 1986. "Economics of devaluation: The case of Tanzania", in Labour and Society(Geneva, IlLS), Vol. 11, No. 3 (special issue: guest editor, Ajit Singh).
—. 1988a. "Coping under crisis in Uganda", in Jamal, 1988c.
—. 1988b. "Getting the crisis right: Missing perspectives on Africa", in Jamal, 1988c.— (ed.). 1988c. The African crisis, food security and structural adjustment. Special issue
of the International Labour Review (Geneva, ILO), Vol. 127, No. 6.
—. 1988d. "The demise of the labor aristocracy in Africa: Structural adjustment inTanzania", in Weeks, J. (ed.) 1988: Debt disaster? Governments, banks andmulti laterals face the crisis. New York and London, New York University Press.
—. 1988e. "Understanding an unconventional economy", in Development and Change(London), Vol. 19, No. 2.
—. 1990. "Wages and employment", draft chapter for Presidential Committee onEmployment, Kenya. Geneva, ILO, mimeo.
—. 1991. "Inequalities and adjustment in Uganda", in Development and Change (London),Vol. 22, No. 2, Apr.
—. 1 993a. "African agrarian crisis in a historical perspective", in Singh and Tabatabai, 1993.
—. 1993b. "Agriculture under structural adjustment in Zimbabwe", chapter for ILOStructural Adjustment mission. Geneva, ILO, Apr.
—. 1993c. "Changing employment patterns in sub-Saharan Africa", background paper forthe Social Summit. Geneva, ILO, mimeo, Sept.

88 THE POVERTY A GENOA: TRENDS AND POLICY OPTIONS
—. 1994. "Poverty in Uganda: Now and then", paper submitted to Conference onDeveloping Uganda, Roskilde, Denmark, May/June.
—. Forthcoming. Structural adjustment and rural labour markets in Africa. Geneva,manuscript for Macmillan.
—; John Weeks. 1987. "Rural-urban income trends in sub-Saharan Africa", WEP Research
Working Paper. Geneva, ILO.
—; —. 1988. "The vanishing rural-urban gap in sub-Saharan Africa", in InternationalLabour Review (Geneva, ILO), Vol. 127, No. 3.
—; —. 1993. Africa misunderstood, or whatever happened to the rural-urban gap? London,Macmillan.
Lewis, W. Arthur. 1967. Reflections on Nigeria's economic growth. Paris, OECD.
Lipton, M. 1977. Why poor people stay poor. A study of urban bias in world development.London, Temple Smith.
—. 1993. Rejoinding in Journal of Development Studies ("Beyond urban bias"), July.
O'Connor, A. 1993. The African city. London, Hutchison.
Pinstrup-Andersen, Per. 1989. "Government policy, food security and nutrition in sub-Saharan Africa", PEW/Cornell Lecture Series on Food and Nutrition Policy, Cornell.
Singh, Ajit; Hamid Tabatabai (eds.). 1993. Economic crisis and Third World agriculture.Cambridge, Cambridge University Press.
Timmer, P. 1993. Journal of Development Studies ("Beyond urban bias"), July.
UNCTAD. 1992. Handbook of international trade and development statistics. New York,United Nations.
UNDP/World Bank. 1992. African development indicators. New York and Washington,UNDP and World Bank.
Weeks, J. Forthcoming. "Structural adjustment and rural labour markets in Sierra Leone",in Jamal, forthcoming.
World Bank. 1981. Accelerated development in sub-Saharan Africa: An agenda for action
("Berg Report").
—. 1989 and 1993. World Development Report, 1989 and 1993. New York, OxfordUniversity Press.

5 Coping with austerity:Poverty and inequalityin Latin America
Nora Lustig1
At the end of the 1 980s, Latin America had a proportionally lowernumber of poor people than other parts of the developing world, butincome distribution was relatively worse. Exact poverty estimates varyaccording to the statistical definition, but a number of studies have shownthat in the mid-1980s, the poverty headcount ratio for Latin America wasabout one-third lower than the average for the developing world.2Furthermore, the severity of poverty, as measured by the poverty gap, waslower for Latin America than for the developing world as a whole.3
The figures for income distribution reveal a somewhat different image.Comparable data for all countries are not available, but one study finds that
'Senior Fellow, Brookings Institution. This chapter draws heavily on the introductionof Lustig [forthcoming]. The author is grateful to Gary Gordon and Ann Mitchell for ableresearch assistance, and to Trisha Brandon for patiently retyping the many changes made.The author is also grateful to Harold Alderman, Jere Behrman, Jorge DomInguez, AlbertFishlow, Peter Hakim, John Steinbruner, Richard Webb and John Williamson. All the usualdisclaimers apply.
2According to the World Bank, the headcount index for Latin America was 19, as
against 33 for all developing countries. The index for extreme poverty (which uses apoverty line of $23 ($1985 PPP) per month, was 12 for Latin America, compared with 18for all developing countries [World Bank, World Development Report 1990, Table 2.1,p. 29]. Ravallion et al. [1991, Table 2, p. 354J attain similar results using poverty lines of$31 per month and $23 per month. However, as discussed in the appendix, all theseestimates must be regarded with caution.
Ravallion et a!. [1991] report a poverty gap index of 6.9 for Latin America, ascompared with 10.2 for the developing world as a whole. The poverty gap measures theamount of income required to raise all of the poor to the poverty line, expressed as aproportion of the amount required to give every poor person a grant equal to the amountof the poverty line.

90 THEPOVERTY AGENDA: TRENDSAND POLICY OPTIONS
the average Gini4 coefficient for Latin America at the end of the 1980swas 0.50 (compared with 0.39 for non-Latin American countries), and thepoorest 20 per cent of the population earned only 4.0 per cent of totalincome (compared with 6.5 per cent for non-Latin American countries)[Psacharopoulos et al., 1992]. The ratio of the income of the poorest 20per cent of the population to that of the wealthiest 20 per cent in the 1980swas around 0.10 for Latin America compared to 0.15 in other low- andmiddle-income countries for which data are available.6
As far as social welfare indicators are concerned, Latin America'sperformance compared favourably with that of other developing regions.By 1990, Latin America had brought the infant mortality rate down to 48per 1,000 live births, compared to a world average of 52, an average of79 in the Middle East and North Africa, and 93 in South Asia [WorldBank, 1992]. The average Latin American's daily caloric intake in 1989was slightly higher than the world average.7 Primary school enrolmentrate estimates taken in the same year also placed Latin America slightlyabove the world average, with gross enrolment rates of 107 per cent of the
eligible age group.8Although Latin America was a region of marked economic inequality
before the debt crisis,9 in general, as we shall see below, inequality and
The Gini coefficient is a common measure of inequality which indicates a greater!smaller degree of inequality the closer the coefficient is to unity zero.
Figures for "non-LAC countries" are from an earlier period, but Psacharopoulos etal. [1992, p. 17] contend that the "... disparity ... between LAC countries and non-LACcountries is still quite relevant, and could possibly have increased over time".
calculations based on data in World Bank, World Development Report 1991,Table 30, pp. 262-263. Data for a large number of countries are not available in thissource, and the data that are available are for different years. More consistent and up-to-date figures for LAC countries can be found in Psacharopoulos et al. [1992, Annex 3].Using the latter data, the ratio for Latin America and the Caribbean is only .076 (author'scalculation).
Average daily caloric intake was 2,721 for Latin America, compared to 2,711 for theworld, 2,617 for East Asia and the Pacific, and 2,225 for South Asia [World Bank, 1992].
8 The world average was 105 per cent [World Bank, 19921.
In the 1970s, for example, the poorest 40 per cent of Latin America's populationearned 10.1 per cent of total income, compared to 14.8 per cent in South-east Asian andAsian countries. The shares of the richest 10 per cent were 40.1 per cent and 34.1 per cent,respectively. When compared with any developing region of the world, the share of incomeof the poorest 20 per cent was lower in Latin America. Latin America's poorest 20 per centreceived 2.9 per cent of total income, compared to 6.2 per cent in sub-Saharan Africa, 5.3per cent in the Middle East and North Africa, 6.3 per cent in East Asia and the Pacific,7 per cent in South Asia and 5 per cent in South Europe [World Bank, 1993, Tables 8-1and 8-2].

COPING WITH AUSTERITY: POVERTY AND INEQUALITY IN LA TIN AMERICA 91
poverty increased during the 1980s. Ethical considerations apart, whyshould one be concerned with the evolution of poverty and inequality? Thepeasant uprising in the state of Chiapas, Mexico, in 1994 and the urbanriots in Caracas, Venezuela, in 1989, and in Santiago del Estero,Argentina, in 1993, might be seen as examples of how poverty amidstgrowing inequality presents a threat to social and political stability.However, although the available evidence indicates that in most LatinAmerican countries poverty has been increasing and income has becomemore concentrated, outbursts of social and political violence cannot beattributed to these factors alone. Social explosions are complex phenomena,and it may well be that harsh economic conditions per se are not so muchto blame as low expectations of improving those conditions.
However, even if frustration with growing poverty and inequality doesnot always manifest itself in armed uprisings or violent riots, there arereasons to be concerned with both their economic and their politicalconsequences. In contrast to what was formerly believed, recent empiricalresearch shows that income inequality can be detrimental to growth, sinceit can have a negative effect on the accumulation of human and physicalcapital. It has been demonstrated that a more egalitarian incomedistribution has a positive influence on aggregate school enrolment[Bourguignon, 1993; Birdsall & Sabot, 1993] and that the increased socio-political instability fuelled by inequality creates greater uncertainty that inturn reduces investment and growth [Alesina & Perotti, 1993]. Policy-makers and politicians are increasingly concerned with the negativeimplications of poverty and income inequality for political stability andeconomic prosperity. High and rising levels of poverty and inequalitycould, for example, undermine the process of economic reform, bring backthe so-called populist policy agenda, intensify environmental degradation,put in jeopardy social and political stability, and reduce long-termeconomic growth. This fear is not ill founded. The fear that rising povertyand economic inequality may breed a political backlash against fiscalprudence and efficiency-oriented structural reforms is based on theacknowledgement that large groups in the population, whether accuratelyor not, identify stabilization policies and structural reform as detrimentalto the poor and the cause of greater inequality.
The discussion so far raises several important questions which thischapter attempts to answer. First, to what extent did economic inequalityand poverty increase in the region during the 1980s? How did governmentsin specific countries respond to the imperative of austerity? Were safetynets put in place? What can be done in the future to reduce inequality andpoverty?

92 THE POVERTY AGENDA: TRENDS AND POLICY OPTIONS
L Economic crisis and the evolution of poverty,income distribution and social indicators
1. Poverty and income distribution
Thecombination of growing domestic macro-economic imbalances andadverse external factors'° resulted in severe balance of payments crisesand produced sharp economic downturns in most Latin American countries.For practically every country in the region, the accumulated growth ratein per capita GDP was either negative or close to zero between 1982 and1989. The economic crisis forced most countries to undergo drasticadjustment and profound economic restructuring.
How did poverty and income distribution change in the 1980s whenmany countries in Latin America, faced with the need to reduce theirbudget deficits, introduced far-reaching economic reforms and experiencedstagnant or negative growth? Such an important question cannot beanswered fully for any country in the region. For no country do we havea pair of income surveys with the characteristics necessary for a completeand reliable comparison over time."
With the existing information, however, it is possible to identify thefollowing trends. Among countries with data at the national level (Brazil,Costa Rica, Panama and Venezuela), one finds that, in three out of four,poverty increased in the 1980s (Table 1). In Costa Rica the situation isambiguous: some sources find that poverty declined while one concludesthat poverty increased. In three of the four cases (Brazil, Panama andVenezuela), income distribution was more unequal around 1989 thanaround 1980, and in one case (Panama) the rise in inequality wassubstantial (Table 2). In Costa Rica sources differ as to whether or notinequality declined. Overall, among the countries with data at the nationallevel, those that had a lower per capita income at the end of the period alsoexperienced rising poverty and inequality.
tO For example, the fall in commodity prices in the early 1980s, the recession indeveloped countries, higher world interest rates, and the sudden cutback in externalfinancing (especially from private sources).
"Ideally, we should have two surveys at the national level, taken at each end of therelevant period (circa 1980 and circa 1990), which include a complete measure of totalincome (one that includes non-wage and non-monetary income and for which under-reporting of income is low). For further discussion, see the appendix to the introduction ofLustig [forthcoming].

COPING WITH AUSTERITY: POVERTY AND INEQUALITY/N LATIN AMERICA 93
There are six countries for which the question can be answered for theurban sectors only: Argentina, Colombia, Chile, Paraguay, Peru andUruguay. In three of them (Argentina, Chile and Peru) urban poverty rosesubstantially. In Colombia and Paraguay it fell, and in Uruguay thesituation is ambiguous, but both cited sources indicate that the change wasprobably very small (Table 1). Urban inequality rose in Chile and rosesubstantially in Argentina and Peru; it fell in the other three countries(Table 2).
In three countries there were two countrywide surveys during the1980s, but the earlier survey was carried out after the debt crisis hadalready begun to take its toll so that a "before/after" comparison is notpossible (Tables 1 and 2). Of these three, Guatemala and Mexico show arise in poverty and inequality at the national level. Chile, on the otherhand, shows a reduction in poverty and inequality between 1987 and 1990,with a very large reduction in poverty in the rural areas. Bolivia andHonduras, which both have data for the urban sector only, show a rise inboth poverty and inequality.
The events of the 1980s caused changes in the ranking of countries interms of inequality. Brazil replaced Colombia as the country with the worstincome distribution of the region, and Argentina and Panama, which onceboasted the lowest levels of income inequality, were surpassed by CostaRica and Uruguay.
Were the poor hurt disproportionately during the 1 980s? In about halfof the countries that had a more concentrated income distribution in 1989,the poor (the bottom 20 per cent) had to bear the brunt of the crisis.12This is bad news, particularly because this pattern occurred in countrieswhere the poor were very poor to begin with (for example, Bolivia,Guatemala and Peru). However, the costs of the crisis and adjustmentprocess were borne disproportionately by the middle-income (Argentina,Brazil and Mexico) and upper-middle (Honduras and Venezuela) rangeshalf of the time. These groups are likely to be composed of blue-collar andwhite-collar workers in urban settings.
12 Data at the national level and for urban centres show that in nine Latin Americancountries poverty and inequality rose in the 1980s: Argentina, Bolivia, Brazil, Guatemala,Honduras, Mexico, Panama, Peru and Venezuela. In four of those (Bolivia, Guatemala,Panama and Peru), the bottom 20 per cent were hurt disproportionately, that is, theirincome share fell the most. In five, those who were hurt disproportionately were either inthe middle ranges (Argentina, Brazil and Mexico) or in the upper middle ranges (Hondurasand Venezuela). In eight countries (Argentina, Bolivia, Brazil, Guatemala, Honduras,Mexico, Panama and Venezuela), the top 10 per cent were the biggest or the only winners.

Tab
le 1
: Com
paris
on o
f pov
erty
hea
dcou
nt r
atio
s fo
r se
lect
ed L
atin
Am
eric
an co
untr
ies
Cou
ntry
Y
ear
Nat
iona
l U
rban
A
reas
R
ural
A
reas
Alti
mir
Psa
ch.
et a
l. C
ount
ry
stud
ies
in
Lust
ig (
ed.)
Alti
mir
Psa
ch.
et a
l. C
ount
ry
stud
ies
in
Lust
ig
(ed.
)
Alti
mir
Psa
ch.
et a
l. C
ount
ry
stud
ies
in
Lust
ig
(ed.
)
Arg
entin
a 19
80
1986
19
89
1990
19
91
5 9 3.
0
6.4
7.6a
28.5
k 23
.2
Bol
ivia
19
86
1989
51
.1
54.0
Bra
zil
1979
19
81
1983
19
86
1987
19
88
1989
19
90
39
40
43
34.1
40.9
30
.
34
39
23.9
33.2
29.P
38
.2k
22.8
k 25
.5k
24.4
27
.9k
28.9
k
62
60
56
55.0
63.1
Chi
le
1969
19
70
1980
19
85
1987
19
89
1990
38
35
10.0
17.0
45.0
38
.1
34.6
37
34
9.9
28.5
40.Y
48.6
45
36
10.4
Col
ombi
a 19
80
1986
19
89
1990
38
36
36
35
13.0
8.0
42
C.,
-D
C)

Cou
ntry
Y
ear
Nat
iona
l U
rban
Are
as
Rur
al
Are
as
Alti
mir
Psa
ch.
et a
l. C
ount
ry
stud
ies
in
Lust
ig
(ad.
)
Alti
mir
Psa
ch.
et a
l. C
ount
ry
stud
ies
in
Lust
ig (
ed.)
Alti
mir
Psa
ch.
et a
l. C
ount
ry
stud
ies
in
Lust
ig (
ad.)
Cos
ta R
ica
1981
19
88
1989
19
90
22
25
24
13.4
3.4
16
21
22
9.9
3.5
28
28
25
16.7
3.2
Dom
inic
an
Rep
ublic
19
89
24.1
Ecu
ador
19
87
24.2
El
Salv
ador
19
90
41.5
Gua
tem
ala
1986
-87
1989
66
.4
67.0
50
.9
76.5
Hon
dura
s 19
86
1989
48
.7
54.4
Jam
aica
19
89
12.1
4.
4 18
.3
Mex
ico
1977
19
84
1989
32
30
16.6
22
6b
23
43
Pan
ama
1979
19
86
1989
36
34
38
27.9
31.8
31
30
34
26.0
26.9
45
43
48
33.0
36.8
Para
guay
19
83
1990
13
.P
7.6k
Peru
19
79
1985
-86
52
35
45
31.P
64
C-)
—I (0

Tab
le 1
: Com
paris
on o
f pov
erty
hea
dcou
nt r
atio
s fo
r se
lect
ed L
atin
Am
eric
an c
ount
ries
(con
td.)
Cou
ntry
Y
ear
Nat
iona
l U
rban
A
reas
R
ural
Are
as
Alti
mir
Psa
ch.
Cou
ntry
A
ltim
ir P
sach
. C
ount
ry
Alti
mir
Psa
ch.
Cou
ntry
st
udie
s in
et
al.
stud
ies
in
et a
l. st
udie
s in
et
Lu
stig
le
d.)
Lust
ig l
ed.)
Lu
stig
le
d.)
Uru
guay
19
81
9 6.
2 19
86
14
1989
10
5.
3
Ven
ezue
la
1981
22
4.
0 18
18
2.
5 15
35
9.
0 26
19
85
28
23
47
1986
27
25
34
19
87
32
28
49
1989
12
.9
41
10.8
38
23
.5
60
1990
34
33
38
19
91
35
31
53
Not
es:
Bas
ed o
n a
hous
ehol
d su
rvey
for t
he m
etro
polit
an a
rea(
s) o
nly.
b A
pre
limin
ary
estim
ate
base
d on
an
unw
eigh
ted
sam
ple
whi
ch m
ay n
ot re
flec
t ac
tual
popu
latio
n co
mpo
sitio
n.
Whe
n es
timat
es o
f bot
h ex
trem
e an
d m
oder
ate
pove
rty
wer
e gi
ven,
the
tabl
e pr
esen
ts th
e re
sults
for m
oder
ate p
over
ty.
Bla
nk
spac
es m
ean
that
info
rmat
ion
is n
ot a
vaila
ble.
So
urce
s: A
ltim
ir [
1992
]. T
he p
over
ty e
stim
ates
are
tak
en fr
om C
EPA
L [1
991 a
; 19
9 ib
; 199
2],
as c
ited
in th
e pap
er,
exce
pt w
here
not
ed.
Est
imat
es a
re b
ased
on
hous
ehol
d pe
r ca
pita
inc
ome,
adj
uste
d fo
r un
dere
stim
atio
n, a
nd c
ount
ry-s
peci
fic
pove
rty
lines
rep
rese
ntin
g m
inim
um n
orm
ativ
e bu
dget
s of
pnv
ate
cons
umpt
ion
base
d on
min
imum
foo
d ba
sket
s th
at a
dequ
atel
y co
ver n
utri
tiona
l re
quir
emen
ts.
Psac
haro
poul
os e
t al.
[199
2].
The
sam
e po
vert
y lin
e of
U
S$60
per
mon
th in
pur
chas
ing
pow
er p
arity
dol
lars
was
use
d fo
r all
coun
trie
s. P
over
ty e
stim
ates
in
thir
d co
lum
ns a
re th
ose p
rese
nted
in th
e co
untr
y st
udie
s in
Lus
tig [
fort
hcom
ing]
. For
all
coun
trie
s ex
cept
Chi
le,
pove
rty
estim
ates
wer
e ca
lcul
ated
by
the
auth
ors,
and
are
ther
efor
e com
para
ble
acro
ss
year
s. T
he e
stim
ates
for
Chi
le a
re f
rom
PR
EA
LC
[19
90].
1 0 c 1 LI

Cou
ntry
/ so
urce
S
urve
y co
vera
ge
Inco
meS
N
A
adj.
1979
19
80
1981
19
82
1983
19
84
1985
19
86
1987
198
8 19
89
1990
%
cha
ngeb
Arg
entin
a 0.
48
16.6
7 Ps
ach.
et a
!. (
1992
) B
ueno
s A
ires
Y
HPC
N
o 0.
43
0.40
0.
40
0.40
0.
43
0.45
11
.60
Fisz
bein
(19
89)
Bue
nos
Air
es
YH
PC
? 0.
461
Fisz
bem
& P
sach
. B
ueno
s A
ires
PY
EA
N
o 0.
389
Bol
ivia
0.
52
0.53
1.
74
Psac
h. e
t a!.
(199
2)
Nat
iona
l Y
HPC
N
o
Bra
zil
0.60
0.
58
0.52
B
onel
li &
Sed
lace
k N
atio
nal
YH
PC
? 0.
57
0.56
0.
59
0.59
0.
60
0.59
0.
60
0.61
3.
38
Alm
eida
Rei
s et
a!.
N
atio
nal
YH
PC
? 0.
63
6.57
Ps
ach.
et a
!. (
1992
) N
atio
nal
YH
PC
No
0.59
0.
60
0.62
5.
08
Hof
fman
N
atio
nal
YH
?
0.59
0.
59
0.59
0.
59
0.59
0.
60
0.61
0.
63
0.61
3.
39
Bar
ros
et a
l. (P
B.)
M
etro
polit
an
YH
PC
No
0.59
0.
58
0.58
0.
625
8.89
Fi
szbe
m &
Psa
ch.
Nat
iona
l PY
EA
N
o
Chi
le
0.54
0.
56
0.53
0.
54
0.53
2.
51
Muj
ica
Sant
iago
Y
HPC
?
0.52
0.
53
0.52
0.
47
0.46
—
2.13
A
ltim
ir (1
992)
N
atio
nal
YH
PC
? 0.
57
Psac
h. e
t al.
(199
2)
Nat
iona
l Y
HPC
N
o
Col
ombi
a 0.
47
—2.
08
Alti
mir
B
ogot
a Y
HPC
?
0.48
0.
45
—4.
26
Alti
mir
O
ther
Urb
an
YH
PC
? 0.
53
—9.
06
Psac
h. e
t al.
(199
2)
Urb
an
YH
PC
No
0.59
0.
515
—10
.90
Fisz
bem
& P
sach
. 7
maj
or ci
ties
PYE
A
No
Tab
le 2
: G
ini co
effic
ient
s in
sel
ecte
d La
tin A
mer
ican
cou
ntrie
s, 1
979-
1990
I

Tab
le 2
: Gin
i coe
ffici
ents
in s
elec
ted
Latin
Am
eric
an c
ount
ries,
197
9-19
90 (c
ontd
.)
Cou
ntry
/ so
urce
S
urve
y co
vera
ge
Inco
me
NA
adj.
1979
19
80
1981
19
82
1983
19
84
1985
19
86
1987
19
88
1989
19
90
% c
hang
eb
Cos
ta R
ica
Gin
dlm
g &
Ben
y N
atio
nal
YH
PC
? 0.
40
0.40
0.
42
0.38
0.
38
0.37
0.
36
0.42
0.
42
6.08
S
auna
a &
Tre
jos
Nat
iona
l Y
HP
C
? 0.
42
0.42
0.
00
Psa
ch. e
t al.
(199
2)
Nat
iona
l Y
HPC
N
o 0.
48
0.46
—
3.16
Fi
szbe
m &
Psa
ch.
Nat
iona
l PY
EA
N
o 0.
451
0.41
—
9.09
Dom
inic
an R
epub
lic
Psac
h. e
t al.
(199
2)
Nat
iona
l Y
HPC
N
o 0.
50
...
Ecu
ador
Ps
ach.
et a
l. (1
992)
U
rban
L
YH
PC
No
0.45
...
El S
alva
dor
Psac
h. e
t al.
(199
2)
Urb
an
YH
PC
No
0.45
...
Gua
tem
ala
W.B
. cou
ntry
mem
o N
atio
nal
YH
PC
7 0.
48
0.53
10
.42
Psac
h. e
t al.
(199
2)
Nat
iona
l Y
HPC
N
o 0.
58
0.60
2.
76
Hon
dura
s Ps
ach.
et a
l. (1
992)
U
rban
Y
HPC
N
o 0.
55
0.59
7.
65
Jam
aica
Ps
ach.
et a
l. (1
992)
N
atio
nal
EH
PC
No
0.44
...
Mex
ico
Lus
tig
Nat
iona
l Y
H
No
0.44
...
A
ltim
ir (
1984
) N
atio
nal
YH
?
0.48
...
E
NIG
H
Nat
iona
l Y
H
7 0.
47
...
Psac
h. e
t al.
(199
2)
Nat
iona
l Y
HPC
N
o 0.
51
0.55
' 8.
70
1 1 -ç
0,
0 C.)

Cou
ntry
l S
urve
y In
com
e'
NA
19
79
1980
19
81
1982
19
83
1984
19
85 1
986
1987
19
88
1989
19
90
% c
hang
eb
sour
ce
cove
rage
ad
j.
Pana
ma
Psac
h. e
t a!.
(199
2)
Nat
iona
l Y
HPC
N
o 0.
49
0.57
15
.78
Fisz
bein
& P
sach
.' N
atio
nal
LY
HPC
N
o 0.
376
0.44
6 18
.62
Para
guay
Ps
ach.
eta
!. (1
992)
A
sunc
ion
YH
PC
No
0.45
0.
40
—11
.75
Peni
Ps
ach.
et a
!. (l
992)
E
HPC
N
o 0.
43
0.44
2.
34
GR
AD
E
Lim
a Y
HPC
?
0.34
0.
39
0.40
0.
39
0.41
0.
44
29.4
1
Unj
guay
Ps
ach.
et a
!. (1
992)
U
rban
Y
HPC
N
o 0.
44
0.42
—
2.75
Fi
szbe
m &
Psa
ch.
Urb
an
PYE
A
No
0.45
2 0.
42
—7.
08
Ven
ezue
la
IESA
N
atio
nal
YH
PC
? 0.
40
0.44
0.
46
0.44
10
.00
CE
PAL
in
Alti
mir
N
atio
nal
YH
?
0.39
0.
42
0.44
12
.82
Psac
h. e
t a!.
(19
92)
Nat
iona
l Y
HPC
N
o 0.
43
0.44
3.
04
Fisz
bein
& P
sach
. N
atio
nal
LY
HPC
N
o 0.
512
0.49
8 —
2.73
Not
es:
YH
PC =
Hou
seho
ld in
com
e pe
r cap
ita,
LY
HPC
= H
ouse
hold
labo
ur in
com
e pe
r cap
ita Y
H =
Ave
rage
Hou
seho
ld I
ncom
e, E
HPC
= H
ouse
hold
cons
umpt
ion e
xpen
ditu
re pe
r cap
ita.
PYE
A =
Tot
al p
erso
na! in
com
e (f
rom
wor
k, r
ent,
tran
sfer
s) of
all i
ndiv
idua
ls 1
5 ye
ars
or o
lder
that
wer
e in
the
labo
ur fo
rce
and
had
posi
tive
inco
me.
b P
erce
ntag
e ch
ange
bet
wee
n th
e ea
rlie
st a
nd th
e la
test
year
. 0
1979
figu
re i
s fo
r 197
7.
d B
ased
on
unw
eigh
ted
sam
ple
whi
ch m
ay n
ot a
ccur
atel
y re
flec
t po
pula
tion
com
posi
tion.
B
ased
on
surv
ey d
ata
for
empl
oyee
s on
ly (
i.e.
no s
elf-
empl
oyed
or
em
ploy
ers)
. T
he i
ncom
e m
easu
re i
s de
fmed
as
inco
me
from
wor
k (i
.e. e
xclu
ding
ren
ts a
nd tr
ansf
ers)
. g
1985
est
imat
e is
nat
iona
l and
199
0 es
timat
e is
for L
ima.
A
ll bl
ank
spac
es m
ean t
hat d
ata
was
not
ava
ilabl
e.
? =
una
ble
to c
onfi
rm
Sour
ces:
Psa
ch. e
ta!.
(199
2) fr
om P
sach
arop
oulo
s et
a!. [
1992
, Ann
ex 3]
. Fi
szbe
in &
Psa
ch.
from
[fo
rthc
omin
g, T
able
s A
2.1-
A2.
71.
Bar
ros e
ta!.
(P.
B.)
fro
m
[for
thco
min
g, T
able
5].
A
ll ot
her d
ata f
rom
Mor
ley
[for
thco
min
g, T
able
1].
C) 0 -l I (0
(0

100 THE POVERTY AGENDA: TRENDS AND POLICY OPTIONS
Perhaps the most important finding is that while most groups saw theirshare in total income fall during the adjustment process, the top 10 percent — those who were richest to begin with — improved their relativeposition (with the exception of Colombia). In several cases it is likely thatthey improved their absolute position as well. Unfortunately, this propo-sition cannot be tested with the available information. In any event, thefeeling that adjustment costs have been unfairly distributed is confirmed bythese findings.
2. Trends in social indicators
In Latin America, indicators of public health such as infant mortalityand life expectancy generally continued to improve during the 1980s, asshown by the figures reported for the six countries included in Table 3.However, with the exception of Chile, where the decline was over 5 percent per year, the rate of reduction in infant mortality was relatively slow.And even in Chile most of the reduction occurred between 1980 and 1982;during 1984-88 the rate of reduction was much lower [Raczynski &Romaguera, forthcoming]. It is difficult to identify a general trend for thecountries included in Table 3 in terms of the pace of improvement in the1 980s compared to that in the 1 970s. In Argentina and Chile, the rate ofimprovement was slower in the 1980s. The difference is particularlyremarkable in the case of Argentina (around one percentage point per yearlower in the 1 980s). In Brazil, the pace of improvement was fastest in the1980s, according to one of the sources, but slower according to another.Venezuela showed a higher rate of improvement in the 1 980s than in the1970s.'4
How should one interpret the results presented in Table 3? The firsttemptation is to say that the crisis and adjustment years do not seem tohave had a significant negative impact on a crucial social indicator such asthe infant mortality rate. In a way, this is not surprising as the infantmortality rate is largely determined by factors which are the result of pastinvestments in physical and human capital. Examples of such investmentinclude increases in the number of public hospitals and doctors per inhabi-tant, improved water and sanitation facilities, higher educational attainment
For a more comprehensive discussion on social indicators in Latin America and theCaribbean see, for example, Psacharopoulos et at. [1992, Ch. 51.
14 Infant mortality rates show important regional differences within countries[Psacharopoulos et at., 1992, Table 5.3].

COPING WITH AUSTERITY: POVERTY AND INEQUALITY IN LA TIN AMERICA 101
Table 3: Social indicators — health
1970 1980 1988 1989 1990
ArgentinaInfant mortality rate - 1DB" 51.8 38.0 30.4
Life expectancy - IDBb 66.8 69.3 70.9
BrazilInfant mortality rate"© 114.0 88.0Infant mortality rate"' 75.0 48.0 45.0Infant mortality rate - 1DB" 94.6 74.2 59.9Life expectancy - IDB' 59.0 62.8 65.6
ChileInfant mortality ratea 82.0 33.0 19.0 16.0
Life expectancycMen 60.0 63.9 67.8Women 66.5 70.6 74.6
MexicoInfant mortality ratea 53.1 40.6 39.3
Life expectancy - IDBb 61.7 66.6 69.4
PeruInfant mortality rateaf 102.0 82.0Life expectancy - 1DB" 53.9 57.9 62.1
VenezuelaInfant mortality ratea.g 49.8 35.2 25.5Life expectancy - IDBb 65.2 68.5 69.9
Notes: Number of infants, per 1,000 live births, who die before reaching one year of age. "Lifeexpectancy at birth, in years. 'Estimates based on household surveys. Estimates based
on vital statistics corrected for under-reporting. 1970 figures are for 1972 and 1980figures are for 1982. Estimated "by extrapolation." The precise methods used to estimatethese figures are unclear. 1970 figure is for 1971 and 1980 figure is for 1981. Blankspaces indicate that data are not available.
Sources: All data were obtained from the country study papers in the tables listed by country below,except items noted as 1DB from Inter-American Development Bank [1991, p. 15]. Brazil:Infant mortality rates from survey and from vital statistics data from Lustig [forthcoming,Ch. 6, Tables 13 and 14, respectively]. Chile: Infant mortality rates and life expectancyfrom [ibid. Ch. 7, Table 111.5]. Mexico: Infant mortality rates from [ibid, Ch. 8, Table 12].Peru: Noted in [ibid, Ch. 9]. Venezuela: Total infant mortality rate from [ibid, Table 2;all other data from Table A-7].
of mothers, and widespread implementation of health practices such as oralrehydration therapy and inoculation [Barros et al., forthcoming].
It is quite conceivable that the rate of improvement in infant mortalitycould have been higher without the economic crisis. A study by Barros etal. [forthcoming] finds that there was an association between economic

102 THE POVERTY AGENDA: TRENDS AND POLICY OPTIONS
performance and the infant mortality rate in Brazil during the 1980s but theevidence is not conclusive. Friedmann et al. [forthcoming] find that infantand pre-school mortality caused by nutritional deficiency rose in Mexicoin the 1980s, reversing the trend that had been observed in the 1970s.Raczynski and Romaguera [forthcoming, Table 111.8] also argue that thedata on low birth-weight infants and undernourished children in Chile showa variability which may be associated with changes in economic conditions.After a systematic fall in the two indicators in the 1970s, for example,there followed a period of ups and downs in the 1980s, a pattern whichreflects the general course of the Chilean economy.
In the area of education, illiteracy rates declined and average years ofschooling increased for all the countries reported in Table 4. This shouldnot perhaps be surprising since changes in educational indicators in onedecade (for example, the average number of years of schooling of the adultpopulation) often reflect investments made earlier. None the less, the rateof improvement was slower in the 1980s than in the 1970s. An economicslowdown can lead to a slowdown in improvement in educational indicatorsthrough its effect on private and public investment in education. However,one should not attribute this slower rate of improvement to deterioratingeconomic conditions until further research is done on the factors thatinfluence these variables. To some extent, a slowdown of progress inliteracy may not be unusual, especially when one starts from a higher base.
There may be other indicators of educational performance which aremore sensitive to economic downturns. Marquez [1993, Table 2] showsthat in Venezuela the literacy rate for the 15-19 age group actually fellbetween 1981 and 1990. Friedmann et al. [forthcoming] find that inMexico the proportion of children from the appropriate age cohort enteringfirst grade declined. These authors also find that the proportion of studentsmoving to high school after completing junior high, or to university aftercompleting high school, declined during the 1980s. Such trends seem to bethe result of a reduction by some households in their investment in educa-tion, rather than the result of reduced supply or quality of educationalservices. It is quite possible that lower earnings led households to postponetheir children's entry to primary school because of complementary costs(for example, transport, school materials, etc.). Lower household incomesmay also have forced young people to join the workforce rather thancontinue with their education. Barros et al. [forthcoming] note that theefficiency and quality of education in Brazil, as measured by repetition ofyears and drop-out rates, remained high during the 1980s.

COPING WITH AUSTERITY: POVERTY AND INEQUALITY IN LATIN AMERICA 103
Table 4a: Social indicators — educationAverage years of schooling and illiteracy
1970 1980 1989 1990
ArgentinaIlliteracy rate (%) - IDBI,c 7.4 6.1 4.5
Average years of schoolingal 6.1 8.64 9.63
BrazilIlliteracy rate (%)d 34.0 26.0 19.0
Average years of schoolinge 2.50 3.9 4.9
Average years of schoolinga 4.47 5.8
ChileIlliteracy rate (%)f 11.0
Average years of schoolingk 5.76 6.43
MexicoAverage years of schooling 3.40 5.4 6.3 6.4Illiteracy rate (%) - IDBC 25.8 17.3 9.7
PeruIlliteracy rate (%)h 28.0 18.0 12.0
Average years of schoolingk 4.28 5.51
Venezuela
Illiteracy rate (%) 24.1 14.0 9.3Average years of schoolinaIJt 3.7 6.4 7.6
Notes: aAverage number of years of schooling of the working population, which consists of all
individuals aged 15 or older who were in the labour force and had positive income. Figuresfrom Lustig [forthcoming, Ch. 2, Tables A3.1 -A3 .7]. Argentina figures are for GreaterBuenos Aires; Brazil and Venezuela figures are national. 1980 figure for Brazil is for 1979.Proportion of the population aged 15 years and older who cannot, with understanding, read
and write a short simple statement on everyday life. Figures noted as 1DB [1991, p. 15].1989 figure is for 1985. Percentage of the population aged 15 years or older who cannot
read or write a simple message. C Average number of years of schooling completed by thepopulation aged 25 years or older. Percentage of illiterates in the population aged 15 yearsor older. g Average number of years of schooling of the population aged 15 years or older.
The figures presented are for the years 1972, 1981 and 1989; estimates are based oncensus data and the 1989 figure is an extrapolation. Peru and Venezuela figures for 1970are actually for 1972 and 1971, respectively. 1980 figure is for 1981. ' Source: WorldBank International Economics Department, TFP Project Data, data bank, 1994. 1970figures from World Bank [ibid]. Blank spaces indicate that data are not available.
Source: All data were obtained from Lustig [forthcoming]. Brazil: Chapter 6, Table 10. Chile:Chapter 7, Table 111.5. Mexico: Chapter 8, Table 13. Figures for 1970 refer to 1970-71,1980 to 1980-81, etc. Peru: Chapter 9. Venezuela: Chapter 10, Illiteracy rates for the totalpopulation are from Table 2 and all other illiteracy rates are from Table A-6.

104 THE POVERTY AGENDA: TRENDS AND POLICY OPTIONS
Table 4b: Social indicators — educationPrimary, secondary and tertiary enrolment rates (per cent of age group)
1970 1980 1989
ArgentinaPrimarySecondaryTertiary
1054422
1165623
1117441
Brazil
Primary
Secondary
Tertiary
82
2612
93
32
12
105
39
11
ChilePrimarySecondaryTertiary
1073913
1175512
1007519
Mexico
Primary
Secondary
Tertiary
104
22
14
120
37
15
114
53
15
PeruPrimarySecondary
Tertiary
107
31
19
112
5616
123
67
32
VenezuelaPrimary 94 104 105
Secondary 33 39 56
Tertiary 21 21 28
Sources: 1970 figures are from World Bank [1994a, Table 28, pp. 216-2171. 1980 figures are fromWorld Bank [1983, Table 25, pp. 196-197]. Tertiary enrolment rates are for 1979. 1989figures are from World Bank [1992], data bank.

COPING WITH AUSTERITY: POVERTY AND INEQUALITY/N LATIN AMERICA 105
II. Coping with austerity: Country experiences inArgentina, Brazil, Chile, Mexico, Peru, and Venezuela
1. Argentina
Argentina's economic performance during the 1980s was like a rollercoaster. GDP and real wages fell and rose several times between 1980 and1990. Inflation was high throughout the period, often bordering onhyperinflation; hyperinflation actually occurred in 1989 [Beccaria &Carciofi, forthcoming, Table 1; World Bank, 1990, p. 22]. The story ofArgentina during the 1980s can be seen as that of a country in whichsociety resisted adjustment and, for a while, was successful in itsresistance. In the end, however, adjustment occurred by default. In 1990,real national income was 12.6 per cent lower and real wages 14.4 per centlower than they had been in 1980 [Beccaria & Carciofi, ibid., p. 1 andTable 3].
Although there is no nationwide information, poverty in GreaterBuenos Aires (where about one-third of the country's population lives) rosevery sharply. Beccaria and Carciofi [ibid., Table 4] estimate that theproportion of households below the poverty line rose from 7.6 per cent in1980 to 28.5 per cent in 1990. Others have made smaller estimates for theproportion of households below the poverty line. Morley and Alvarez[Morley, forthcoming] estimate that the poverty headcount ratio rose from6.3 per cent in 1980 to 21.5 per cent in 1989, and Psacharopoulos et al.[1992] estimate that it rose from 3 per cent in 1980 to 6.4 per cent in1989.15 However, they all coincide in their finding that poverty worsenedsubstantially. Although poverty due to lack of sufficient income rosesharply in Greater Buenos Aires, poverty due to lack of access to basicservices remained practically unchanged.'6 One striking feature of povertyin Greater Buenos Aires is that it is quite sensitive to changes in theeconomic growth rate. In 1991, when real GDP grew by 8.5 per cent, theproportion of households below the poverty line fell by over fivepercentage points [Beccaria & Carciofi, ibid., Tables 1 and 4].
n This difference is most likely explained by the fact that the studies use differentpoverty lines and that Beccaria and Carciofi did not correct for under-reporting.
16 Poverty due to "unmet basic needs" changed from 15.9 per cent of the householdsin 1980 to 16.1 per cent in 1990, a change that is not significant [Beccaria & Carciofi,ibid., Table 4, cols. I and 2]. A household is classified as poor according to this criterionif it does not meet at least one of five basic needs.

106 THE POVERTY AGENDA: TRENDS AND POLICY OPTIONS
At first glance, data on public social spending in Argentina lead oneto believe that it should be viewed as a "model" country. After the fall inper capita public spending in the social sectors during the crisis years of1982 and 1983, for example, it rose almost steadily between 1984 and1987, and in 1988 it was still above the 1980 level [Beccaria & Carciofi,ibid., Table 6]. A superficial interpretation of these figures would be thatthe Argentine government made an explicit effort to compensate thepopulation for losses of income from the labour market by expandingprovision of publicly-delivered goods and services and other welfare andsocial insurance programmes. Unfortunately, this is not what happened.
It is true that the democratic government which took power in 1983[World Bank, 1990] was probably more committed to protecting socialexpenditures than the previous military government had been. One clearexample of this commitment was the launching of the National FoodProgramme in 1985. This programme gave poor families a food basketdesigned to satisfy 30 per cent of the nutritional needs of a family of four;it was the first food programme in Argentina with national coverage.
According to Beccaria and Carciofi [ibid.], however, Argentina'sfiscal accounts during the 1980s reflect the enormous difficultiesencountered by the government in cutting the deficit and reforming thepublic sector. The obstacles included large fluctuations in price levels, theproblems of coordinating the various levels of the public sector (central,provincial and municipal), an uncooperative opposition in Congress, andthe resistance of powerful unions within the public sector itself (such as theteachers' union). Owing to all these factors, public expenditures in thesocial sectors, and public sector spending in general, were not subject tothe type of downward adjustment seen, for example, in Mexico.
The apparent "protection" of social spending probably did not resultin protection of the quality of the services. On the contrary, the educationalsector, for example, was subject to a series of teachers' union strikes;although these kept teachers' salaries from falling, they caused classes tostart late or be interrupted on several occasions. These interruptions are notlikely to have improved the quality of education. It was not until after thehyper-inflationary episode in 1989 that adjustment of the fiscal accountsbegan.
Attempts to decentralize social services (which started under themilitary regime), education in particular, turned out to be counter-productive if not disastrous. Decentralization meant dumping theresponsibility for carrying out services on under-funded and undertrainedlocal governments.

COPING WITH AUSTERITY: POVERTY AND /NEOUALITY IN LATIN AMERICA 107
2. Brazil
During the 1980s, Brazil experienced periods of economic expansionand contraction, but at the end of the decade per capita GDP was verysimilar to that at the beginning. The —0.6 per cent growth rate of percapita GDP in the 1980s was notoriously smaller than the 6 per centgrowth rate observed in the previous decade. Wages contracted but totalemployment continued to grow at a much higher pace than total output. Atthe same time, income distribution became substantially more unequal(especially between 1986 and 1989) and poverty rose. In contrast toMexico, where the middle-income groups were hit disproportionately, inBrazil the poorest segments of the population were affected the most. Thestudy by Barros et al. [forthcoming] shows how sensitive the incidence ofpoverty is to economic fluctuations and how sensitive the measurement ofpoverty is to changes in criteria such as the definition of the poverty lineand the choice of base year.
As in the case of Argentina, the beginning of the democratizationprocess in Brazil was accompanied by a rise in social spending, particularlyafter 1985. Although detailed data on social spending seem hard to obtain,the available indicators show that public spending on education, publichealth, food assistance programmes and assistance to unemployed workersrose during the 1980s. In fact, unemployment insurance and some foodassistance programmes were launched in the mid-1980s. According toBarros et al., however, most of these programmes had serious targetingproblems and failed to reach the poorest segments of the population.
The steady improvement in educational indicators continued in the1980s, and infant mortality fell, despite the sharp slowdown in outputgrowth and the increase in inequality and poverty. The authors ascribe thestrong performance in education to a combination of the maturing of pastinvestments in education and the rise in the share of GDP allocated to thepublic provision of educational services. They explain the reduction ininfant mortality rates in terms of factors such as developments in healthtechnology, better access to information and health services, improvementsin the education of parents, and the continuous investment in water supplyand sanitation. The authors find some evidence that cyclical fluctuations inGDP may have some effect on infant mortality but this is not the case witheducational performance.
3. Chile
Chile was a pioneer in pursuing market-oriented structural reforms.The process began immediately after the military coup in 1973. The

108THE POVERTY AGENDA: TRENDS AND POLICY OPTIONS
military rulers introduced tax reforms, liberalized trade and deregulated thefinancial sector throughout the 1 970s. Between 1973 and 1979, collectivebargaining and strikes were prohibited, but these restrictions were partiallylifted in 1979.
One of the interesting aspects of the Chilean economy is that thereforms did not shield it from a crisis similar to those experienced bycountries like Brazil and Mexico whose economies were run according tothe import-substitution and statist model. Although Chile had introducedmarket-oriented reforms, it had not managed to avoid risky macro-economic policies such as maintaining a fixed nominal exchange rate which— given the inflation rate — resulted in the usual real appreciation of thecurrency, rising current account deficit and external (private and public)debt. The 1982 crisis highlighted the need for re-regulation of financialmarkets, which was subsequently carried out in 1986 [Merlán & Bosworth,1994, p. 192].
In contrast with Argentina, and similarly to Mexico (although fordifferent reasons), Chile was able to implement adjustment and stabilizationprogrammes with little resistance from the Chilean people. Unlike Mexico,Chile had the advantage of having introduced structural change, especiallytrade liberalization, a few years before it was hit by the debt crisis. Thelatter may explain why Chile's recovery was faster and more sustained thanwas Mexico's after its 1983 programme.
According to Raczynski and Romaguera [forthcoming], fluctuatingrates of growth were the main cause of increased poverty and concentrationof income, because of the negative impact on employment and wages.None the less, the privatization process — inherent in the market-orientedreforms — exacerbated the increase in inequality which resulted from pooreconomic performance. Tax reforms were not progressive, and the sameis true of the reform of the public health system. During the crisis andadjustment process, the government introduced highly targeted policies.Those worked as a "palliative" but came nowhere near to compensating thepoor for the loss of income they had suffered as a result of the crisis.
It is difficult to estimate the extent of the rise in poverty during the1 980s because no comparable nationwide surveys exist that were carriedout before and after the crisis. Assuming that the study by Altimir in 1970and the subsequent studies by the Economic Commission for Latin America(CEPAL) reported in Altimir [1992] are comparable, poverty in Chile rosefrom 17.0 per cent in 1970 to 38.1 per cent in 1987, while extremepoverty rose from 6.0 per cent to 13.5 per cent during the same time span.The study carried out by the Regional Employment Programme for LatinAmerica and the Caribbean (PREALC) on Greater Santiago indicates that
COPING WITH AUSTERITY: POVERTY AND INEQUALITY IN LA TIN AMERICA 109
poverty rose from 28.5 per cent in 1969 to 40.3 per cent in 1980 and to48.6 per cent in 1987. Even if these figures are not totally accurate, theincrease is so large that there can be little doubt that poverty in Chile rosesubstantially. The reduction in poverty as a result of recovery appears tobe less spectacular than in Argentina: between 1987 and 1990 GDP grewat 6.3 per cent per year while poverty was reduced from 38.0 per cent to34.0 per cent.
Of the countries analysed here, Chile is the only one that undertooka major overhaul of social sector policies, institutions and financing mecha-nisms which started before and continued after the debt crisis. Market-oriented reform and decentralization were the order of the day for socialas well as economic policy.
The reduction in public social spending started after the 1973 militarycoup. The reduction was not continuous, but in 1989 the level of realpublic social spending was below the 1970 figure.'7 But not all of thecomponents of social spending underwent the same treatment. Spending oneducation, health and housing fell, both in relative and in absolute terms,whereas social security and "other social spending" rose. The latter is verysmall in comparison to the other items, but it includes "safety net" pro-grammes like the public emergency employment programme. Spending onsocial security rose as a result of reforms introduced in 1980. Thesetransferred active workers to the new, privately-administered system whilethe government had to take care of the passive beneficiaries of the oldsystem, pay "seniority bonds" and guarantee a minimum pension.
Raczynski and Romaguera [forthcoming] find that the cuts ineducation and health represented a reduction in investment and, above all,a fall in the real wages of teachers, doctors, nurses, etc., in the publicsector. In addition to experiencing budget cuts, the public health systemwas subject to a process of decentralization; its financing mechanism waschanged to support demand rather than supply; it became more reliant onprivate sector providers and administrators; the universal system wasreplaced with targeted programmes directed to the poor and to the mother-child population; and cost recovery policies were implemented. Other areasof social public policy such as education and housing were subject tofundamental changes as well.
According to Raczynski and Romaguera, the impact of these reformson the welfare of the poor, the welfare of the population in general, and
17 In contrast to what happened in Mexico, the fall in public social spending was lowerthan that in total public spending excluding interest payments.
110 THE POVERTY AGENDA: TRENDS AND POLICY OPTIONS
the quality of services was mixed. Providing preventive health services tothe poorest in the population and targeting infants, mothers and pregnantwomen reduced infant mortality significantly, but other sectors of thepopulation were neglected. This may explain the changes observed inbiomedical indicators: the main causes of death and morbidity becamecardiovascular diseases, cancer, cirrhosis and illness of old age [Castañeda,1992, p. 112]. Social security reform resulted in a narrower coverage andreduced benefits.'8 Finally, the authors argue that the reforms in theeducational system did not result in a clear improvement in its quality.
4. Mexico
Mexico was simultaneously hit by the decline in world oil prices andthe debt crisis. In fact, the Mexican involuntary moratorium in mid-1982on its debt repayment obligations triggered the worldwide debt crisis.Unlike what happened in Argentina, Brazil, Peru and Venezuela, and morelike what occurred in Chile, the Mexican leadership introduced a veryambitious programme of fiscal adjustment almost immediately.
Friedmann et al. [forthcoming] show that external shocks delivered aheavy blow to the Mexican population, wage-earners in particular. Between1983 and 1988, real wages declined by between 7.7 and 10.5 per cent peryear (depending on the category of worker). Unfortunately, Mexico is oneof the countries for which a "before/after" comparison in terms of theevolution of poverty and income distribution cannot be made (see Section1.1). Between 1984 and 1989, both poverty and extreme poverty rose, ifsurvey data are "corrected" for under-reporting. Given the performance ofwage and non-wage income in agriculture, and of corn output and prices,one would expect a rise in poverty since a high proportion of the poor —particularly the extremely poor — are engaged in agriculture and a highproportion of those working in agriculture are poor. The surveys alsoindicate that the concentration of income increased substantially between1984 and 1989, with the share of the top 10 per cent increasing by almostfive percentage points.
The reduction in the fiscal deficit, particularly the primary deficit(which excludes debt servicing), was indeed remarkable: the primaryaccounts went from a deficit of close to 8 per cent per year in 198 1-82 toan average surplus of 4.1 per cent per year between 1983 and 1988. Thisreduction in the fiscal deficit in the 1980s was achieved through acombination of tax increases and a reduction in so-called programmable
18 Castafleda's book arrives at apparently different conclusions [1992, pp. 185-186].

COPING WITH AUSTERITY: POVERTY AND INEQUALITY IN LA TIN AMERICA 111
(excluding debt servicing) spending. The latter was brought about primarilyby a huge reduction in public investment, a cut in government wages, andthe elimination of most consumer and producer subsidies. Notably, thereduction in public spending was not achieved through reduced publicemployment. This was true of social spending as well.
According to Friedmann et al. [forthcoming], social spending fellfaster than other programmable expenditures, but most of the fall wasexplained by the cuts in wages and investment in the social sectors. Thestrategy of protecting public employment at the expense of governmentwage levels and, particularly, public investment has met with criticism. Byprotecting employment, however, the Mexican government spread the costof austerity among its workers. This may have been a safer strategy, fromboth a political and a social insurance point of view, in a country wherethere were no unemployment insurance or employment programmes. Inaddition, keeping the workforce in the health and education sectors moreor less intact meant that the population did not have to face a reduction inthe provision of these services (although their quality may have worsened).In contrast to the position in Argentina, the Mexican government clearlyenjoyed much greater freedom in managing the process of fiscalretrenchment, as it did not have to deal with strong independent unionswithin its bureaucracy. Friedmann et al. [ibid.] show that, unfortunately,the government did not attempt to protect the social programmes that wereaimed at the very poor (such as COPLAMAR). These programmessuffered greater budget cuts than the rest of social spending, and they weresubject to a process of decentralization which seems to have seriouslydiminished their impact.'9 In the case of food subsidies, however, theauthorities tried to replace the general price subsidies with targetedprogrammes. Unfortunately, even the targeted subsidies did not reach thepoorest, and they clearly failed to compensate for the reduction in realincomes of the poor caused by the elimination of the general subsidyschemes.
5. Peru
Ofthe six countries reviewed here, Peru presented the most dauntingsituation. According to Figueroa [forthcoming], in 1991 real GDP percapita was equivalent to only 70 per cent of its 1981 value. Social spending
' This changed drastically with the new administration. In December 1988 the newgovernment announced the launching of the Pro gramaNacional de Solidaridad whichwould address poverty with demand-driven, targeted programmes.

112 THEPOVERTY AGENDA: TRENDS AND POLICY OPTIONS
had fallen quite precipitously both in absolute value and relative to GDP.In 1990 social spending was equal to a mere 21 per cent of its 1980 value.Wages in the public sector in 1991 were less than 10 per cent of their 1981level. Urban poverty and inequality rose substantially during the 1980s 20"Extreme" poverty (defined as the inability to cover the household's basicnutritional requirements) in Lima (where 30 per cent of the populationlives) rose from 0.5 per cent of the population in 1985-86 to 17.3 per centin 1990. The provision of drinkable water and sewage services in Limaalso deteriorated within this period [Glewwe & Hall, 1992, p. 48].
As far as social indicators are concerned, Figueroa [forthcoming]indicates that Peru, in contrast to the other countries, does show asignificant drop in school enrolment although more aggregate figuresreported an increase. On the other hand, the infant mortality rate continuedto decline, though one should bear in mind that information on infantmortality is based on extrapolations and not on actual data. In any event,Figueroa argues that the performance of the infant mortality rate may bea consequence of the continuation of immunization programmes.
Figueroa defines the situation prevailing in Peru as a "distributivecrisis". According to him "[a] distributive crisis occurs when real wages,and living standards in general, fall below a threshold that is sociallytolerable. Under a distributive crisis, the fall in private investment, theincrease in social violence, and the impoverishment of the masses are allendogenous variables." Although the concept of a distributive crisis issuggestive, it is not clear which factors determine the "threshold" oftolerability [Alesina & Perotti, 1993; Alesina & Rodrik, 1991, 1993]. Onewould expect this threshold to vary from country to country and to bedetermined by overall historical and political conditions. It is not clear howuseful the concept is in operational terms: in other words, when mustredistributive policies be undertaken to avert a "distributive crisis" so thatgrowth can be resumed? Figueroa attributes the "distributive crisis" in partto the orthodox adjustment programmes implemented by the government.The reader is left wondering to what extent the economic crisis provokedby the external shocks of the 1 980s was exacerbated by the populistpolicies followed in 1985-88, which necessitated more drastic correctivemeasures 21
20 Tables 1 and 2. The reader should recall that there is no information to make thecomparison for rural areas in Peru.
21 For more on Peruvian economic policy during this period, see Glewwe and Hall[19921.

COPING WITH AUSTERITY: POVERTY AND INEQUALITY IN LA TIN AMERICA 113
6. Venezuela
Marquez [1993] describes the Venezuelan situation in the 1980s as onein which:
successive ... governments have been prisoners of the same dilemma: thedesire to sustain the expansion of the public enterprise sector while at the sametime providing sufficient resources to the traditional social sectors. The competinginterests of groups supporting deficit-ridden public enterprises and social serviceinstitutions, under increasingly tight fiscal budget restrictions, generated first anunsustainable increase in the external debt, later rising inflation, and finally thecollapse of 1989.
In Venezuela the political conditions determined a pattern similar to thatobserved in Argentina, Brazil and Peru: namely, the existing coalitionmade an "orderly" adjustment impossible.
During the 1980s poverty and inequality increased sharply. Accordingto Marquez [ibid.], in 1990 the poor were "more like the rest of thepopulation" than they had been in the previous decade: they were urbantwo-parent families with at least one or two members working. Poverty,as measured by the headcount ratio and the poverty gap, doubled between1981 and 1989. Marquez analyses whether this rise in poverty can beattributed to "behavioural" variables such as changes in family size and therate of participation in the labour force. He finds that family size declinedand the rate of participation increased, so these factors cannot explain theincrease in poverty. The basic explanation for the rise in poverty lay in thefall in average earnings, real wages in particular. As in the case ofMexico, unemployment was not the cause of falling incomes.
Social spending per capita fell during the 1980s, but social spendingwas not affected disproportionately in comparison with other budget items.However, Marquez [ibid.] considers that the change in the composition ofthe social sector ministries was detrimental: "there was an increase in theshare of expenditures allocated to the support, planning, and administrationprogram and a reduction in the share of operational programs and inputs."In particular, "Pressure groups organized around unions and the vocaluniversity and medical personnel lobbies ensure that personnel, universityexpenditure and high level medical facilities' claims on the budget arefulfilled..." to the detriment of primary education and medical services.One dilemma is whether fiscal cuts in the social sectors should beimplemented by reducing employment in those sectors or by lowering thewages of workers. As we saw above, in the case of Mexico the govern-ment opted for the latter. In principle, this strategy seems less conflictualin the short run and may protect at least the quantity of social services

114 THE POVERTY AGENDA: TRENDS AND POLICY OPTIONS
delivered to the population. None the less, this is clearly an area thatdeserves further analysis.
Marquez finds that neither health nor education indicators show along-term deterioration, despite the cuts in per capita social spending.However, in contrast to what was found in other countries, the infantmortality rate in Venezuela rose after 1989, after having declined most ofthe decade.
After 1989 the government introduced a number of targeted program-mes designed to reach the poor, circumventing the bureaucracies of thesocial sector ministries. Marquez notes that the switch from indirect todirect subsidies represented an improvement in efficiency. However, theamounts involved in these programmes were not sufficient to compensatethe poor in full for their losses. More importantly, Marquez argues that thefailure to reform the "traditional" social sectors ended up rendering theseefforts much less effective than had been hoped.
Ill. The determinants of inequality and poverty
What are the factors that explain the evolution of inequality andpoverty? At the root of economic inequality and poverty is the distributionof, and access to, financial, human and physical assets. But what deter-mines their distribution? In principle, there is a wide range of factors thatcan affect it, including preferences, innate talents, inherited wealth, familyenvironment and market imperfections.
To obtain empirical estimates of the contribution of the various factorsto inequality, Fiszbein and Psacharopoulos [forthcoming] break down totalinequality into four (or three where the data do not permit the use of four)"explanatory" variables: age, employment category, education and econo-mic sector, for a sample of seven Latin American countries 22 The authorsfind that "education is the variable with the strongest impact on incomeinequality and poverty". On average, about one-quarter of total inequalitycan be explained as inequality between individuals grouped according totheir level of schooling. Fiszbein and Psacharopoulos find a positive
22Argentina, Brazil, Colombia, Costa Rica, Panama, Uruguay and Venezuela. The
reader should remember that data for Argentina, Colombia and Uruguay are not for thewhole country but for the main metropolitan area or urban areas.
23 In the first version of their paper, Barros et al. [forthcoming] cite their own findingson the relationship between education and inequality. They suggest that if all wagedifferentials associated with education level were eliminated, overall inequality would bereduced by almost 50 per cent.

COPING WITH AUSTERITY: POVERTY AND INEQUALITY/N LA TIN AMERICA 115
association between education and being out of poverty. Using logitanalysis, these authors find that the probability of belonging to the bottom20 per cent is higher the less educated the individual. For most countriesin their sample, "an additional year of schooling reduces the probability ofbeing poor — for an 'average' individual — by between three to fourpercentage points...".
Although it is clear that the question that best predicts a person'sincome is "What education have you had?", only about one-quarter ofincome inequality would be explained by the answer to such a question[Fields, 1992]. Looking at people's skills in an attempt to explaininequality and poverty gives only part of the story: is poverty in LatinAmerica caused more by people's lack of education or by insufficientopportunity to put the skills they have acquired through education to work?If the latter is more — or even as — important, then policies designed toreduce poverty should concentrate not only on improving the skills of thepoor but also on increasing demand for the labour of the poor. In addition,education may be associated with other variables which might also affectpoverty and inequality (for example, greater ability, greater motivation,more sophisticated household environment). If the analysis does not controlfor these factors, the contribution of education may be overstated[Behrman, 1990a, 1990b, 1990c).
A very interesting aspect mentioned by Fiszbein and Psacharopoulos[forthcoming] is the possible role of gender and ethnic discrimination indetermining who is poor. The authors find that, holding everything else(education, age, economic sector, etc.) equal, working females "have a 34per cent [probability] of belonging to the bottom [20 per cent], versus 14per cent for males". They also cite another study that found that"indigenous people in Bolivia and Guatemala have a probability ofbelonging to the bottom quintile of well over 20 per cent, as do mulattoand blacks in Brazil". Discrimination, in particular ethnic discrimination,has not usually been an area of serious study or policy. In the light of theseresults, the eradication of discriminatory practices should become an areaof primary concern for governments and international lending institutions.Although the authors do not analyse it, discriminatory practices and marketfailure in the capital markets can be another important source of inequalityand poverty.
Do the factors which explain poverty and inequality in the long runalso explain the changes that occur during periods of economic crisis andadjustment? Does human capital provide as good a shield from the impactof a crisis as physical or financial capital? In the light of the evidence, theanswer to both of these questions seems to be negative. Neither education,
116 THE POVERTY AGENDA: TRENDS AND POLICY OPTIONS
age, occupation nor economic sector change fast enough to explain theobserved changes in inequality and poverty during the 1980s. One cannotattribute the big increase in income inequality which occurred, forexample, in Brazil between 1981 and 1983 to changes in the distributionof education. The poor do not lose their skills so fast, nor do the richacquire them [Cardoso, 1992].
Education clearly seems to be an important variable in determining anindividual's probability of being poor. However, education did not providea shield strong enough to keep people out of poverty during the economicdownturn of the 1980s. Interestingly, Fiszbein and Psacharopoulos [forth-coming] find that the probability of being in the bottom 20 per cent at theend of the decade increased, even for those with university education, inall seven of the countries they analysed except Costa Rica. Morley[forthcoming] also finds that the incidence of poverty among well-educatedpeople in Argentina and Venezuela rose. In Argentina (or, strictlyspeaking, the metropolitan area of Greater Buenos Aires) "the incidenceof poverty rose so fast among graduates of grade school and high schoolthat it swamped the rise in poverty among illiterates". A question that noneof these authors answers is whether the probability of becoming poorduring an economic slowdown becomes higher the less educated the indi-vidual. A positive answer to this question would permit us to say thatalthough more education does not protect individuals from falling intopoverty during a crisis, it might diminish the probability of thishappening 24
Despite the importance that the characteristics of labour demand mayhave in explaining long-term inequality and poverty, its contribution tochanges in those variables during the 1980s seems to be weaker. Morley[ibid.] finds that in Argentina and Venezuela "poverty was not primarilya problem confined to those who were either unemployed or retired"although the percentage of unemployed or retired people who received anincome below the poverty line did rise dramatically. However, most poorpeople worked in both countries (76 per cent of the poor in Argentina andVenezuela in 1989), and the incidence of poverty among the workingpopulation also shot up. This happened particularly in the so-calledinformal sector, but it happened in the formal sector, too [Morley, ibid.,Table 5].
Because yearly data were available for Brazil, some of the relation-ships could be examined using econometric analysis. According to the
24 The results for Peru in Glewwe and Hall [1992, p. 48] seem to support this.

COPING WITH AUSTERITY: POVERTY AND INEQUALITY IN LATIN AMERICA 117
studies cited by Barros et al. [forthcoming], characteristics of the labourmarket such as changes in the structure of wages and employment whichcould explain the changes in inequality in Brazil between 1960 and 1970were no longer able to explain these changes during the 1 980s. Nor couldthey be explained in terms of inequality in education levels. Based on theresults of other studies, Barros et al. argue that the increase in inequalityin the 1980s is to be explained, primarily, by reference to macro-economicvariables such as inflation and economic activity.
IV. Policies for reducing inequality and poverty:The role of targeting
Targeting — that is, directing public resources to specific populationgroups — can be used for three distinct, but not mutually exclusive,purposes:
(a) to compensate those who lose income as a result of a policy change;
(b) to protect the most vulnerable groups from the negative effects of aneconomic crisis;
(c) to make more efficient use of fiscal resources to reduce poverty.
For multilateral financial institutions and governments alike, targeting hasbecome a way of introducing poverty reduction programmes that complywith the objectives of keeping government interventions in specific marketsto a minimum and using fiscal resources more carefully.
Grosh [forthcoming] has written about how a government should goabout choosing between different programmes. In theory, the best pro-gramme is that which increases most the present discounted value of socialwelfare given all the costs and all the market and non-market (that is,externalities) interactions and behavioural reactions in the economy, andthe asset endowments [Behrman, 1992]. Nevertheless, Grosh points out,in practically every single case in which a government decision had to bemade, the use of a rigorous framework was not possible because therequirements for good cost-effectiveness analysis are so formidable.
25 Barros et al. [forthcoming, p. 13] admit, however, that although the "studies are verysuccessful in explaining the increase in inequality up to 1989, they are much less successfulin explaining the sharp decline in inequality from 1989 to 1990".

118 THE POVERTY AGENDA: TRENDS AND POLICY OPTIONS
As an alternative Grosh [ibid.] proposes a set of "rules of thumb" forchoosing among programmes. These rules include administrativefeasibility, political feasibility, collateral effects on efficiency, ability totarget, and tailoring the solution to the problem. Using these criteria,Grosh compared programmes such as general food subsidies, food stampprogrammes, food commodity distribution, school feeding programmes,social funds and micro-enterprise credit schemes. Targeted food stampprogrammes, food commodity distribution and school feeding programmesare, as would be expected, more cost-effective than general food subsidies.None the less, since there is more dissent about whether particular targetedoptions can meet minimum levels of administrative and political feasibility,the details of programme design, institutional capacities and otherobjectives will determine the selection among programmes that often fallin the same range of cost-effectiveness with regard to the income transferthey provide. This might be the case, for example, when governments haveto choose between food stamp programmes and food commoditydistribution. Since food commodity distribution will always involve highertransport and spoilage costs than food stamp programmes, other thingsbeing equal, the latter option will be preferable.
The so-called "social funds" or Social Investment Funds compareunfavourably with food stamp programmes, food commodity distributionor school feeding programmes if only direct transfers are calculated.However, a proper assessment would have to include the "benefit from theinfrastructure created or redistributed", and not only the employmenteffects. Although micro-enterprise projects have the potential advantage of"a permanent boost in earnings capacity", Grosh argues that such projectscan reach only a limited number of beneficiaries, at least judging fromobserved experience.26
Grosh [ibid.] reaches three broad conclusions: first, that there existslittle evidence on many facets of programme impact such as the magnitudeof externalities and of behavioural response to programme participation.Second, the general range of results for different types of programmeoverlaps greatly. Third, the details of programme design and context havea great effect on the cost-effectiveness of programmes. Finally, Groshunderscores the problem of lack of adequate information to enablegovernments to make the best choice in terms of selecting and monitoringprogrammes.
26 For a discussion of the political benefits associated with different forms of safetynets, see Graham [forthcoming].

COPING WITH AUSTERITY: POVERTY AND INEQUALITY/N LATIN AMERICA 119
V. Concluding remarks
The evidence summarized here supports the impression that povertyand inequality in Latin America rose during the 1980s, particularly incountries that had a lower per capita income at the end of the decade.While the poor were not always hurt disproportionately, they were in abouthalf of the countries for which there is information. In the rest, the middleor upper middle ranges suffered relatively more than the poor. In everyone of the countries analysed, with the exception of Colombia, the top 10per cent improved their relative position. Commonly-used social indicatorssuch as infant mortality and gross school enrolment rates continued toimprove, but the pace was slower than previously and there are some clearindications that they could have improved at a higher rate without theeconomic crisis.
One straightforward reason why inequality increases with an economiccrisis is that the poor are less able to protect themselves against inflation.In particular, they are less likely to be able to protect their income andwealth with indexed or foreign-denominated financial instruments. The risein poverty followed naturally from the fact that average income declinedwhile inequality rose. Did the stabilization and adjustment policies increasepoverty to such an extent that it would have been better if governments hadtaken no action? The results available indicate that for the medium andlong run the answer is no: failing to take action to reduce the fiscal deficitand restrict domestic credit would have caused more poverty in the end.
The overview of what happened in specific countries, in particularhow governments reacted to the conditions imposed by austerity, illustratesseveral important facts. First and foremost, none of these countries, withthe possible exception of Chile, was really prepared to protect the poorfrom the impact of the crisis and adjustment programmes. A recent studyfocusing on Social Investment Funds corroborates this impression for othercountries of the region. These funds were usually implemented severalyears (even a decade) after the crisis had erupted [World Bank, 1994b].Second, one should not interpret the maintenance of social spending atclose to pre-crisis level as an indication of the government's will andability to protect the poor during the time of crisis. Maintaining close topre-crisis social spending may be more a reflection of the difficultiesencountered by the government in reducing the wages paid in thosesectors, where workers are often organized into powerful unions. Third,premature efforts to decentralize social services provision to states andmunicipalities can seriously damage their performance; in particular,problems occur when decentralization is not accompanied by adequate

120 THE POVERTY AGENDA: TRENDS AND POLICY OPTIONS
financing and training of the local government bodies. Last but not least,one should not underestimate the difficulties posed by large fluctuations inprice levels and by the lack of coordination or clearly-established prioritiesamong the various levels of government in implementing fiscal adjustment
programmes.One obvious way to reduce poverty is through economic growth
[Birdsall et al., 1994]. To the extent that part of the rise in incomeinequality in the 1980s was associated with high inflation and an economiccrisis, the recovery of sustained economic growth and macro-economicstability may also reduce inequality. Sustained growth requires adequatemacro-economic policies (which do not result in inflation, a balance ofpayments crisis or unemployment) and a regulatory environment whichencourages private investment, competition and technological change. Butsustained growth also requires mechanisms to shield countries fromexternal shocks. In this sense, governments should implement, and themultilateral institutions encourage, policies that cushion the impact ofexternal shocks.
There is, however, a feeling that growth alone may reduce povertyand inequality at too slow a pace. Are there proactive policies that agovernment can adopt to speed up the process without jeopardizinggrowth? Although this question is not treated in depth in this chapter, it hasbeen the object of analysis by others [Bourguignon, 1989].
The changes in macro-economic policy-making and economic structureundertaken in the 1 980s have introduced important restrictions on the typeof instrument that governments can use to redistribute income. In the past,many redistributive policies took the form of price intervention, almostalways accompanied by some form of market control. The policies imple-mented in most of Latin America in the 1980s introduced fiscal disciplineand market-oriented reforms. As a result, general subsidies, for example,were eliminated. The privatization of public enterprises eliminated thepossibility of subsidizing producers and consumers by providing somegoods and services at below market prices — and even if the enterpriseswere still in government hands, their pricing schemes would be bound bythe regulations governing the use of subsidies in international trade.Independent central banks put constraints on credit policy. Open marketsfor goods and capital put floors on domestic interest rates and ceilings ontax rates. Trade liberalization implies the elimination of import and exportcontrols and targeted industrial programmes, and forces domestic prices tobe closer to international prices. The elimination of exchange and capitalcontrols restricts the use of the exchange rate for redistributive purposes.

COPING WITH AUSTERITY: POVERTY AND INEQUALITY/N LATIN AMERICA 121
There are, however, many policy options still open to governments.Improving the standard of education and reducing inequality in thedistribution of education would be helpful. Education has the additionaladvantage of leading to higher growth rates because of its impact on labourproductivity [Bourguignon, 1993]. Public spending on education shouldgive priority to primary education. This is the most egalitarian approachto spending since poor people tend to have more children. Higher levelsof education should also be made accessible to lower income groups, andupper income groups should be required to pay for university education.
As mentioned in the preceding section, the demand for labour has tomove in a direction that is compatible with the skills that people haveacquired through education. Policies that affect the level and distributionof education have an impact in the medium run. In the short run, therelevant variable is the number of employment opportunities that are opento the poor. A growth pattern which favours the expansion of labour-intensive sectors will therefore help reduce poverty and inequality. Policiesthat directly or implicitly transfer current income are also helpful. Ingeneral, these take the form of transfers designed to increase food intake,in the hope that they will thus improve the nutritional status of thebeneficiary 27
In Latin America it is important to reduce poverty and inequality notonly in terms of income, but also in terms of access to social services andsocial infrastructure. Providing poor individuals with access to free orinexpensive health care is also important, both to improve the welfare ofthe poor and to increase their earning capacities. The same applies tosewerage systems, drinkable water, and electricity.
Although family planning was given less emphasis in the 1980s thanpreviously, high population growth, which translates into high dependencyratios, is probably still a problem for some groups. Family planning hasto be introduced in a way that respects the religious and moral beliefs ofthe population; altering the relative power of women in household decis ion-making will probably be necessary. Giving greater power to women in thehouseholds may also bring about a more progressive distribution of incomewithin households [Kanbur & Haddad, 1992, pp. 372-378].
One question which is not settled is what sort of rules should governlabour markets. One obvious way of stimulating employment is to reducelabour costs. A reduction in labour costs can be attained by eliminating
27 These include food stamp programmes, food commodity distribution, ration shopsand school feeding programmes, for example.

122 THE POVERTY AGENDA: TRENDS AND POLICY OPTIONS
some of the labour market regulations designed to protect workers from"unfair" competition such as those governing minimum wages, wageindexation, severance payments, paid sick and maternity leave [see Cox-Edwards, 1993; Marquez, 1993]. But the impact on poverty and inequalityof eliminating these safeguards is not clear. Do minimum wage laws helpreduce poverty and inequality by determining a minimum income standardfor low-wage workers, or do they exacerbate poverty and inequality byincreasing unemployment and underemployment? What about other labourmarket regulations such as those concerning severance pay, paid maternityleave and occupational health and safety norms? Is there any way ofmoving the burden away from employers so that hiring is not negativelyaffected by employment protection regulations? All these questions are atthe centre of debates not only in developing countries but in the developedworld as well.
One solution would be to integrate some workers' benefits into thesocial security system. The social security system can also be used toreduce poverty and improve the distribution of income. Social securitycould be used to pay minimum pensions to retired poor people, payunemployment insurance to those who are out of work, cover wages duringsick and maternity leave, and provide mechanisms of health coverage forthe entire population. The problem is that expanding the types of benefitincluded in the social security system may also increase labour costs (ascontributions paid by employers rise). It is possible, however, that thecosts involved might still be lower than if all the costs associated withlabour protection laws were borne by employers. These are questions thatmust be answered empirically.
Other policies that can help reduce poverty and inequality do notinvolve social security at all. Examples include the redistribution ofresalable assets such as land; preferential credit schemes for "micro-enterprises" and low-income housing; infrastructure projects such asproviding irrigation, roads and electricity, which can improve theproductivity of economic activities; and intervention in situations wheremarket failure results in discrimination against poor people (for example,in terms of access to credit).
Moreover, since it has been found that discriminatory practices mayresult in lower pay for women and some ethnic groups (indigenouspopulations, blacks and people of mixed race), reforms in countries' legalsystems and law enforcement agencies may be necessary. There are anumber of initiatives at the level of the legal system that could beimplemented to help poor people defend themselves. Poor people often donot have regularized property titles, they can be subjected to extortionate

COPING WITH AUSTERITY: POVERTY AND INEQUALITY/N LA TIN AMERICA 123
conditions in the credit market and they often do not have access to thelegal system (for example, they often cannot afford to hire a lawyer).
Most of the initiatives discussed above require government resourcesto implement them. In order to avoid inflationary deficit financing,governments will have to make tough decisions in allocating their limitedrevenues, perhaps cutting back one worthy programme in order to promoteanother. In addition to a progressive public spending policy, governmentsshould also implement a progressive tax system.
The implementation of redistributive initiatives may encounter politicalresistance, even if the economy is growing, and this resistance may bemore effective the more concentrated the distribution of income and wealthis initially. A high level of concentration in the distribution of income andwealth may be a significant obstacle to more egalitarian policy-making.The opposite may also be true, however. Because Latin America has suchhigh levels of economic inequality, it is not uncommon to encounter self-defeating populist policies as governments try to accommodate the demandsof the under-privileged [Sachs, 1989; Dornbusch & Edwards, 1991].
Clearly, the wealthy could react very violently when threatened byredistributive policies, particularly if the policies are perceived as radical,or involve expropriation. But coalitions with economic clout can blockredistributive policies that are not radical at all. For example, a highlyconcentrated distribution of economic power may in effect block stateaction to make the tax and spending system more progressive bythreatening capital flight. In fact, there does not have to be an explicitpolitical confrontation. Savings may be deposited abroad if the rate oftaxation is viewed as "excessive". A landed aristocracy may prevent aprogressive and well-designed agrarian reform even if it includes adequatecompensation [Ascher, 1984]. In the future, the major challenge facingLatin American governments is to introduce policies and reforms thatreduce inequality and poverty without succumbing to measures that areeither economically or politically unsustainable. It is to be hoped thattaking stock both of past mistakes and of practices which have provedsuccessful will facilitate this task.
124 THEPOVERTY AGENDA: TRENDS AND POLICY OPTIONS
Bibliographical references
Alesina, A.; Perotti, R. 1993. "Income distribution, political instability and investment".NBER Working Paper 4486.
—; Dani Rodrik. 1991. "Distributive politics and economic growth". NBER WorkingPaper 3668.
—; —. 1993. "Income distribution and economic growth: A simple theory and someempirical evidence", in The political economy of business cycles and growth. MITPress.
Altimir. 1992. Income distribution and poverty through crisis and adjustment. Santiago,CEPAL.
Ascher, W. 1984. Scheming for the poor: The politics of redistribution in Latin America.Harvard University.
Barros, R. eta!. Forthcoming. "Brazil: Welfare, inequality, poverty, social indicators, andsocial programs in the 1980s", in Lustig, N. (ed): Coping with austerity: Povertyand inequality in Latin America. Washington, DC, Brookings Institution.
Beccaria, L.; Carciofi, R. Forthcoming. "Social policy and adjustment during the 1980s.An overview of the Argentine case", in Lustig.
Behrman, J. 1990a. Human resource led development? New Delhi, ARTEP/ILO.
—. 1990b. The action of human resources and poverty on one another: What we have yetto learn. Washington, DC, World Bank Population and Human ResourcesDepartment.
—. 1990c. "Women's schooling and nonmarket productivity: A survey and a reappraisal".Paper prepared for the Women in Development Division of the Population andHuman Resources Department of the World Bank, Philadelphia.
—. 1992. "Comments on Margaret Grosh's paper: 'Choosing a poverty alleviationprogram: The relative merits of alternative interventions". University ofPennsylvania, Department of Economics, 12 July.
Birdsall, N.; Sabot, R. 1993. "Virtuous circles: Human capital, growth and equity in EastAsia". Washington, DC, World Bank.
—; et a!. 1994. Inequality and growth reconsidered. Washington, DC, World Bank.
Bourguignon, F. 1989. "Optimal poverty reduction, adjustment and growth: An appliedframework". World Bank Human Resources Division Technical Department, LACRegion, December.
—. 1993. "Growth, distribution and human resources: A cross-country analysis".Document 93-13, June 1993. Paris, EHESS and DELTA.
Cardoso, E. 1992. "Poverty and inequality in Brazil: Comments on Barros, Ricardo et al.(1992): 'Welfare, inequality, poverty and social conditions in Brazil in the last threedecades". Paper presented at the Brookings Institution Conference, 15-17 July 1992,Washington, DC; unpublished document.

COPING WITH AUSTERITY: POVERTY AND INEQUALITY/N LATIN AMERICA 125
Castafleda, T. 1992. Combating poverty: Innovative social reforms in Chile during the1980s. San Francisco, International Center for Economic Growth.
CEPAL. 199 la. Magnitude de Ia pobreza en America Latina en los años ochenta, Estudiose Informes de Ia CEPAL No. 81 Santiago 1991.
—. 199 lb. La equidad en Ia panorama social de America Latina durante los años ochentaLC/G 1686 (Santiago, October 1991)
—. 1992. El Perfil de Ia pobreza en America Latina a comienzos de los años 90, LC/L716, (Santiago, 1992)
Cox-Edwards, A. 1993. Labor market legislation in Latin America and the Caribbean.World Bank Latin America and the Caribbean Technical Department Regional StudiesProgram Report No. 31, December.
Dornbusch, R.; Edwards, S. (eds.). 1991. The macroeconomics of populism in LatinAmerica. University of Chicago.
Fields, G. 1992. "Comments on 'Income and inequality trends in Latin America in theeighties: A decomposition analysis', by Ariel Fiszbein and George Psacharopoulos".Cornell University, July.
Figueroa, A. Forthcoming. "Peru: Social policies and economic adjustment in the 1980s",in Lustig, forthcoming.
Fiszbein, A.; Psacharopoulos, G. Forthcoming. "Income inequality trends in Latin Americain the 1980s", in Lustig, forthcoming.
Friedmann, S. et a!. Forthcoming. "Mexico: Social spending and food subsidies duringadjustment", in Lustig, forthcoming.
Glewwe, P.; Hall, G. 1992. Poverty and inequality during unorthodox adjustment: The caseof Peru, 1985-90. Living Standards Measurement Study Working Paper 86.Washington, DC, World Bank.
Graham, C. Forthcoming. Safety nets, politics and the poor: Transitions to marketeconomies. Brookings Institution.
Grosh, M. Forthcoming. "Five criteria for choosing among poverty programs", in Lustig,forthcoming.
Inter-American Development Bank. 1991. Economic and social papers in Latin America.1991 Report. Washington, DC, John Hopkins University Press.
Kanbur, R.; Haddad, L. 1992. "Intrahousehold inequality and the theory of targeting", inEuropean Economic Review, 36: 2-3, April.
Lustig, N. (ed.). Forthcoming. Coping with austerity: Poverty and inequality in LatinAmerica. Washington, DC, Brookings Institution.
Marquez, G. (ed.). 1993. Regulación del mercado de trabajo en America Latina.Venezuela, CINDE.
Merlán, M.; Bosworth, B. 1994. "Saving, investment and economic growth", in BarryBosworth, Rudiger Dornbusch and Radi Labán (eds.): The Chilean economy: Policylessons and challenges. Washington, DC, Brookings Institution.

126 THEPOVERTY AGENDA: TRENDS AND POLICY OPTIONS
Morley, S. Forthcoming. "Structural adjustment and the determinants of poverty in Latin
America", in Lustig, forthcoming.
PREALC. 1990. Pobreza y empleo: un análisis del periodo 1967-1987 en el GranSantiago, Working Paper 348 (Santiago: PREALC, 1990).
Psacharopoulos, G. et al. 1992. Poverty and income distribution in Latin America: The
story of the 1980s. Latin America and the Caribbean Technical Department RegionalStudies Program Report 27. World Bank, December.
Raczynski, D.; Romaguera, P. Forthcoming. "Chile: Poverty, adjustment and socialpolicies in the 1980s", in Lustig, forthcoming.
Ravallion, M. et al. 1991. "Quantif'ing absolute poverty in the developing world", inReview of Income and Wealth (New Haven), Vol. 37, No. 4, December, table 2, p.354.
Sachs, J. 1989. Social conflict and populist policies in Latin America. National Bureau ofEconomic Research Working Paper 2897.
World Bank. 1983. World development report 1983. New York, Oxford.
—. 1990. Argentina: Reforms for Price Stability and Growth. Washington, DC, WorldBank, p. xii.
—. 1992. World Development Indicators 1992. Data bank.
—. 1993. Latin America and the Caribbean: A decade after the debt crisis. Washington,World Bank.
—. 1994a. World development report, 1994, (NY, Oxford, 1994), Table 28, pp. 216-217.
—. 1994b. Poverty alleviation and social investmentfunds: The Latin American experience.LA2HR, Washington, DC, 23 May.

Part II:Structural change
and structural adjustment

6 Poverty in Eastern Europe:The latest manifestationof global polarization
Peter Townsend1
The objective of this chapter is to call attention to the fundamentalcontemporary global problem of social polarization and to show howinequality — and poverty — within countries is related to inequalitybetween countries. It is argued that avoidance of an objective, inter-nationally accepted measure of poverty has not served the internationalcommunity. It is also argued that irresolute comparative analysis ofconditions in unstable as well as stable regions of the world is leading tomisplaced theory and social development policies. World Bank strategies,for example, are not really derived from hard-headed analysis of thereasons for continuing, and even deepening, mass poverty. The chiefproblem is a refusal to face up to the increasing international hierarchy ofpower and to address the dominant structural problems not only of thelabour market but of international organization and democratic expression.
It is no longer plausible to discuss the structural problems of a singlecountry or even of a major region of the world without identifying, andanalysing, the international context. International forces (groupings ofstates, international agencies like the World Bank and the InternationalMonetary Fund, and multinational corporations and other internationalmarket institutions) are shaping conditions in every country. Local,national and regional conditions cannot be investigated and understood, orindeed measured, without acknowledging the international and objectivecharacter of the investigation. This has fundamental implications for workon poverty and the labour market.
Department of Social Policy and Social Planning, University of Bristol, England.

130 THEPOVERTY AGENDA: TRENDS AND POLICY OPTIONS
I. The new international context
1. InstabilityWhat is this international context? The collapse of the Soviet Union
in the early 1 990s, and the deepening problems of poverty in many ThirdWorld countries, have provoked anxiety throughout the world. Both thesedevelopments are cited as examples of continuing international crisis.
The "crisis" may be even more serious than is currently recognized.Much depends on whether it is to be judged as temporary, endemic or verylong-term. There is multiplying instability, poverty and inequality. On allthree counts, elaborate evidence might be brought forward. The trends takeboth quantitative and qualitative form. The international agencies like theUnited Nations Development Programme [UNDP, 1992, 1993] and theWorld Bank [1990, 1993a, 1993b] have been issuing a stream of discon-certing information even when, as in the latter case, that information ispresented in the language of what might, gently, be called "overspeak".Optimistic measures and interpretations of events are conveyed in languagewhich tends to conceal brutal realities.
There are respects in which growing instability, diverging livingstandards and deepening poverty are becoming marked features of theworld of the 1990s. These have to be traced, measured and understood.Our representation of this objective "reality" must be set against thespurious representations of interested parties and those who are gallantlytrying to make the best of an already bad situation.
Instability is marked by famine, large-scale migration or movement ofrefugees, civil war and war, inter-racial violence, terrorism, high rates ofcrime, especially of personal violence, and the disintegration of communityand family relationships. Even if a stringent definition of instability isapplied, it is clear that a very large proportion of the total world populationis involved. Upheavals, disruption of food supplies and of basic publicservices and utilities, and violence on a large scale are being experienceddaily in the 15 republics of the Commonwealth of Independent States(formerly the Soviet Union); in Eastern Europe, especially in Romania,Albania and the former Yugoslavia; in countries like Iraq, Afghanistan,Nicaragua, Haiti, Cambodia, East Timor, parts of Sri Lanka; and in alarge number of African countries (Somalia, Ethiopia, Mozambique andAngola among them). Our means of measuring, and summarizing, theseverity, extent and contributory causes of that instability are still verycrude. Although of course the proportion of the world populationexperiencing instability in its harshest forms fluctuates from year to year,

POVERTY/N EASTERN EUROPE: THE LA TEST MAN/FESTA TION OF GLOBAL POLAR/Z4 TION 131
it may be said to apply to a larger proportion in the 1990s than in anydecade since the 1950s. Theories of poverty and of labour marketoperations need to inform and not just take account of that instability.
2. Absence of global integration of living standards
There are two related trends. One is the persistence of, and indeedwidening, inequality between First and Third Worlds. According to theWorld Bank, the high-income economies continued to grow at a muchfaster rate per person during the 1980s than middle-income andlow-income countries, discounting China and to a lesser extent India[World Bank, 1993b, pp. 238-239]. The average annual rate of growthduring 1980-91 was 1.0 per cent for the 38 low-income countries otherthan China and India, 0.3 per cent for the 65 middle-income countries, and2.3 per cent for the 21 high-income countries [ibid.]. When the trends areexamined more closely, there is little or no sign of the gap between richestand poorest, or even poorer, countries beginning to be closed. Thus themedian purchasing power in the 40 low-income countries was only 4.7 percent of that in the United States in 1987, and 5.2 per cent in 1991. In thenext 23 "lower middle-income countries" the comparable change was from20.2 to 20.3 per cent, and in the 22 "upper middle-income" countries from33.8 to 34.1 per cent, whereas in the 22 high-income countries the changewas from 74.0 to 79.0 per cent. Scrutiny of individual countries bears outthe overall results which can be drawn from this analysis of income classes(Table 1).
There is therefore no evidence at all of any global integration ofaverage living standards. Table 2 gives a useful overview. The poorest 20per cent of the world population had a smaller global share in 1990 thanin 1960-70 in terms of GNP, trade, domestic investment, domestic savingsand commercial credit (Table 2).
Moreover, the International Fund for Agricultural Development(IFAD) has called attention [Jazairy et al., 1992] to the increase in"absolute" as well as relative poverty in most of the poorest developingcountries. As the evidence shows, the extent to which this can be attributedto population increase is small.
The IFAD provides much fuller data about 114 developing countriesthan is provided by other agencies. Among 41 countries for which detailedinformation about trends can be given, covering 2.2 billion people livingin rural areas, only 11 experienced a decrease in poverty. Most of theother 25 countries experienced a proportionate as well as an absolute in-crease.

132 THE POVERTY AGENDA: TRENDS AND POLICY OPTIONS
Table 1: Income per person: Rich and poor countries, and rich and poorwithin countries
Countries GDP per p(US=100)
1987
erson
1991
GDP per pers(US=100)
on
poorest20 per cent
richest20 per cent
Ethiopia 1.9 1.7 0.7 3.5
Bangladesh 5.0 5.2 2.5 10.0India 4.6 5.2 2.3 10.7
Kenya 6.1 6.1 0.8 18.6China 6.5 7.6 2.4 15.9Ghana 8.9 9.1 3.1 19.8Indonesia 10.5 12.3 5.4 26.040 low-income 4.8 5.2 2.2 10.9
Philippines 10.8 11.0 3.6 26.3Guatemala 14.4 14.4 1.5 45.4Peru 19.7 14.1 3.5 36.2Poland 24.8 20.3 9.3 36.6Chile 27.3 31.9 5.9 100.3
Malaysia 26.5 33.4 7.7 89.743 lower middle-income 20.2 20.3 4.9 51.6
Hungary 31.9 27.5 15.0 47.3Venezuela 36.3 36.7 8.8 90.8Brazil 26.0 23.7 2.5 80.0Mexico 31.4 32.4 6.6 90.622 upper middle-income 33.8 34.1 8.2 95.3
New Zealand 68.0 63.1 16.1 141.0
Spain 50.5 57.3 19.8 114.6
United Kingdom 73.0 73.8 21.4 145.8
Italy 71.4 77.0 26.2 157.8France 78.1 83.3 26.2 169.9United States 100.0 100.0 23.5 209.5Germany 80.5 89.3 30.4 172.8Sweden 80.3 79.0 31.6 145.8
Japan 74.4 87.6 38.1 164.2Switzerland 95.6 98.4 25.6 219.422 high-income 74.0 79.0 21.3 145.8
Notes: The figures in the first two columns convert the valuation of a country's GDP per person froma national currency into the equivalent in US dollars. They are also further adjusted to 'standardize"that amount in relation to the goods and services each dollar will buy. The figures therefore afford anapproximate comparison of 'real" average living standards for the countries of the world. These'international" dollar values are obtained by special conversion factors designed to equalize thepurchasing powers of currencies in the respective countries. This conversion factor, the Purchasing

POVERTY/N EASTERN EUROPE: THE LATEST MANIFESTATION OF GLOBAL POLARIZATION 133
Power of Currencies (PPC), is defmed as "the number of units of a country's currency required to buythe same amounts of goods and services in the domestic market as one dollar would buy in the United
States" [World Bank, 1993b, p. 320].
The third and fourth columns show the GDP per person for the poorest and richest 20 per cent of eachpopulation. They are intended to place the measured inequality between countries in the context ofinequality within those self same countries. These estimates are based on statistics published by theWorld Bank. However, estimates in the fonn shown here have not been published by the World Bankor other international agencies. The estimates must be treated with caution. They depend on recentsurveys of income distribution carried out for the countries in question: many (in the case of the poorercountries) apply to 1990 or the late 1980s, but some (the majority among the high-income countries)apply to the early or mid-1980s.
The figures given in bold for the "median" countly within groups of countries should also beexplained. In each column I have simply reproduced the median result for each group of countries forwhich information is available. This will differ from an average for the group weighted by population.I have chosen not to attempt the latter for the good reason that the World Bank and others provideincome data for a wide range of years between 1979 and 1990, and in the case of some countries (forexample, the United States and the United Kingdom, where inequality was much greater in the 1990sthan the early 1980s) an average figure would be misleading.
Source: World Bank [1993b], table 30, pp. 296-297; see also pp. 319-321.
Table 2: Share of poorest 20 per cent of world population in globalopportunities (percentage of global economic activity)
Type of measure 1960-70 1990
Global GNPGlobal tradeGlobal domestic investmentGlobal domestic savingsGlobal commercial credit
2.31.33.53.50.3
1.3
0.91.1
0.50.2
Source: UNDP [l993, p. 27.
The number of people living in poverty in Bangladesh, forexample,increased from 45 million in 1965 to 82 million in 1988; in Kenya, from3.6 million to 9.9 million; in the Philippines, from 12 million to 22 mil-lion; inMalawi, from 3.2 million to 6.1 million; in Zambia, from 1.4 mil-lion to 2.9 million; in China, from 35 million to 120 million; in Mexico,from 9.9 million to 12.4 million. In all these examples the increase is aproportionate and not just an absolute increase. In India and Pakistan therewas an absolute but not a proportionate increase, from 213 million to 251million, and from 18 million to 23 million, respectively (see Table 3).There was unambiguous success in reducing poverty only in the Republicof Korea, Malaysia and Indonesia [Jazairy et al., 1992, Table 3. 11].

134 THE POVERTY AGENDA: TRENDS AND POLICY OPTIONS
Table 3: The extent of rural poverty in 41 low-income countries
Country (among % of rural population Number below poverty41 poorest) below poverty line line (million)
1965 1988 1965 1988
Bangladesh 83 86 45.4 82.1
Brazil 66 73 2.0 3.4China 6 14 35.2 119.5Costa Rica 30 34 0.3 0.5
Egypt 17 25 3.0 6.7Ethiopia 65 43 16.3 16.9Ghana 50 54 2.9 5.2India 53 42 213.1 251.4Indonesia 47 27 42.4 34.6
Kenya 40 55 3.6 9.9Malawi 85 90 3.2 6.1
Malaysia 59 22 4.1 2.2Pakistan 43 29 18.8 23.0Peru 68 75 3.8 4.9
Philippines 56 64 12.3 22.4Sri Lanka 13 46 1.2 6.1Tanzania 65 60 7.1 12.1
Tunisia 20 15 0.6 0.5Venezuela 36 58 1.0 1.1
Zambia 52 80 1.4 2.941 countries(mc. above) 35 33 511.4 712.4
Source: Jazairy et al. [1992], table 3.11.
Different international agencies use slightly different methods ofmeasurement, and they also provide complementary illustrations. Thus a1992 report on the 47 "least developed" countries compiled by the UnitedNations Conference on Trade and Development [UNCTAD, 1993] showsthat between 1980 and 1990 they experienced a fall in average GDP perperson from US$324 to US$311, and that as many as 26 out of the 47countries recorded a fall [ibid., p. A3].
II. Global instability, Eastern Europeand the Commonwealth of Independent States
The world picture is even less encouraging if we take account of theless stable regions and countries. These include the dismembered former

POVERTY/N EASTERN EUROPE: THE LATEST MANIFESTATION OF GLOBAL POLARIZATION 135
Yugoslavia, the 15 republics deriving from the former Soviet Union,Afghanistan, the miserable minorities living in northern and southern Iraq,African countries like Somalia, Angola, Mozambique and Burundi, wherefamine has been added to impoverishment, Cambodia, Viet Nam, and EastTimor where a third of the population has been annihilated. Conditions inthese areas of the world, and their causes, must in future be regarded asan integral rather than a marginalized part of the analysis of poverty.Recently available information shows how many of these countries areexperiencing a sharp fall in living standards. Of the 21 countries listed inTable 4, for which the World Bank provides some data, 17 experienced afall, sometimes a very sharp fall, in average living standards relative to theUnited States between 1987 and 1991. Reports for different countries showunambiguously that this fall applies much more sharply to poorer than toricher income groups within those countries.
A final indicator of instability can be given. In its annual reports theWorld Bank gives at least some information for 127 countries, but another71 countries are listed in an appendix. Although 56 of these are countrieswith populations of less than 1 million, the remaining 15 account for 270million people. There is even less information about these states than aboutthe countries of Eastern Europe. They include Viet Nam, Myanmar, Zaire,the Democratic People's Republic of Korea, Afghanistan, Iraq, Cuba,Angola, Cambodia, Somalia, the Libyan Arab Jamahiriya, Lebanon,Albania, Liberia, Mongolia, the United Arab Emirates and Kuwait [WorldBank, 1993b].
III. Poverty in Eastern Europe
A prominent feature of the argument being developed above is thatthere has to be up-to-date documentation of current social developments inthe world — and that this must include the unstable regions as well asdifferent income groups or classes within the high-income countries. In1993-94 this obviously applies to the former Soviet Union and the formerEastern European satellite countries. They account for 412 million people.Table 4 shows that, according to the World Bank, the average standard ofliving in nearly all these countries fell sharply between 1987 and 1991.
Studies of individual countries show that conditions affecting millionsof people have deteriorated sharply. In the first year of the reformprogramme in Poland in 1990 Gross National Product fell by 18 per cent,compared with the 3 or 4 per cent predicted, more than a million peoplebecame unemployed and the average standard of living fell drastically.

136 THE POVERTY AGENDA: TRENDS AND POLICY OPTIONS
Table 4: Restructuring and falling living standards in Eastern Europe
Country GDP per person US = 100)1987 1991
Tajikstan 11.9 9.9Uzbekistan 12.1 12.6Rumania 42.3 31.2Kyrgyzstan 14.2 14.8
Georgia 24.7 16.6
Azerbaijan 20.2 16.6Turkmenistan 17.3 16.0Poland 24.8 20.3
Bulgaria 31.1 22.5Armenia 24.3 20.8Moldova 23.1 20.0Ukraine 25.7 23.4Czechoslovakia 35.0 28.4Kazakhstan 23.0 20.3Lithuania 29.4 24.4
Hungary 31.9 27.5Belarus 29.7 31.0Russian Fed. 35.2 31.3Latvia 37.2 34.1Estonia 45.8 36.6
Yugoslavia 28.4 (15)
Source: World Bank [1993b], Table 30.
Deregulation of price control on practically all goods and services andelimination of most subsidies, connected with very strict curbs on wage increaseshave resulted in the drastic increase in the cost of living index and the steep dropin real incomes, which diminished by approximately 35 per cent in the first ninemonths of 1990. It hit hardest the most dispossessed parts of the population... InMarch 1990, according to estimates made by the Central Bureau of Statistics,about 40 per cent of employees' households and 39 per cent of pensioners'households (compared with 8 per cent and 19 per cent respectively in December1989) had incomes below the subsistence level [Ksiezopolski, 1991, pp. 17-18].
Economic recession, rising unemployment, the falling value ofsavings, and privatization of public and social services since the early1980s was leading to "the gradual pauperization of Polish society".
Data for Czechoslovakia suggest that after falling slowly from about5.5 per cent in 1958 to around 1 per cent in 1988 the proportion of peoplein subsistence poverty jumped to between 19 per cent and 23 per cent,according to specific measures [Vecernik, 19911.
POVERTY/N EASTERN EUROPE: THE LATEST MANIFESTATION OF GLOBAL POLARIZATION 137
The UNDP team has summed up the situation in the early 1990s inEastern Europe in graphic terms.
In every country for which data are available, the proportion of thepopulation living in poverty has increased. In Bulgaria, the Czech Republic,Poland, Rumania and the Slovak Republic, the number of households living belowthe poverty line has risen sharply - and the available figures are probablyconsiderable underestimates. [UNDP, 1993, p. 47].
As the UNDP team says, "The long term objectives of privatizationmay be to increase economic growth and promote human development, butthe immediate effects have been traumatic... Eastern and Central Europeis entering an era of unemployment that could last for years" [ibid.].Because of increasing unemployment and poverty, social security systemsare "finding it increasingly difficult to cope. State-owned enterprises usedto distribute most social benefits, from child care to health care topensions. But over the past three years, these widespread automaticbenefits have been dramatically curtailed and are being replaced by 'socialsafety nets' whose services are targeted much more narrowly — and thusrisk missing millions of people in desperate need" [ibid., p. 48].
The belief that theoretical edicts like targeting — which are derivedfrom monetarism — can be reconciled with policies likely to relievepoverty in Eastern Europe poses a major international problem. This is awidely shared form of professional and political self-deception, which onlya rigorous, and determinedly independent, examination of the evidence islikely to change. Disastrous mistakes appear to be being made byinternational agencies. Even the OECD admits:
The rise in unemployment, especially when combined with declining realwages, is a source of increasing economic hardship. In this context, mountingpressures on governments to reduce the social costs of the transition process maybe accompanied by a gradual erosion of the consensus reached regarding theobjectives of reforms. Increasing regional disparities in unemployment rates arealso fostering forms of social disintegration, rekindling ethnic conflicts andgenerating centrifugal regional pressures. It follows that dealing with massunemployment is today a matter of high priority for all governments in Central andEastern Europe. [OECD, 1992a, p. 258].
The management of structural change is being guided by poor theory.The extent of the structural change which is taking place is even moremarked when account is taken of conditions in previous decades. Some ofthe latest studies can be compared with studies of earlier periods [seeDeacon, 1991, 1992]. The distribution of income in Eastern Europeancountries in the 1950s and 1960s has been shown to be substantially less

138 THE POVERTY AGENDA: TRENDS AND POLICY OPTIONS
unequal than that in Western European countries [Lydall, 1968].Concluding a study of Poland, Czechoslovakia, Hungary, the USSR andthe UK in the early and mid- 1980s, Atkinson and Micklewright [1992,p. 30] find that income inequality at the time was "less in all four countriesthan the UK, and among the first four of these five was less inCzechoslovakia and Hungary than in Poland and the USSR".
IV. Widening inequality within countries
Another, less well-documented trend is the widening inequality withinseveral, if not most, of the richest countries of the world as well as withinmiddle-income and low-income countries. In the United States [Committeeon Ways and Means, 1992] and the United Kingdom [Townsend, 1993a,Chs. 1 and 10] poverty was greater on average in the 1980s than in the1970s; in the UK it had increased very sharply by the end of the 1980s.Material deprivation and degradation in parts of New York, London andother Western cities take forms as bad as any which can be found in ThirdWorld countries. The re-emergence of tuberculosis, the higher death rateof young black males in Harlem than in Bangladesh, and homicide andincarceration rates, are examples which demand structural exposition and
analysis.In both the United States and the United Kingdom the distribution of
disposable incomes widened significantly during the 1980s [Townsend,1993 a]. Statistical indicators for both countries suggest that for substantialnumbers of people on low incomes (in the UK low-income families withchildren account for 6 million) disposable income at the end of the 1980swas lower than at the beginning of the decade. Mortality rates, rates oflong-term unemployment, homelessness rates, and rates of reported crimes,especially those involving personal violence, are also correlated, with someevidence of acceleration in the late 1980s [Townsend, 1993b].
Not all rich countries have experienced social polarization to the sameextent during the 1980s and early 1990s, but there are signs that someothers are doing so, and not only in Eastern Europe and Germany.Scandinavian countries, for long the leaders of welfare state developments,are now experiencing similar problems, and there are a number ofexamples of cutbacks in public expenditure on social services [see e.g.Osberg, 1991].
The trends cannot be understood — and countered — without givingtop priority, in all international discussion, to developing a comprehensiveconcept of social development, and without better theory to account for the

POvERTY IN EASTERN EUROPE: THE LATEST MANIFESTATION OF GLOBAL POLARIZATION 139
trends. The concept of social development must be seen to apply to richand poor countries alike. In their statistical reports the internationalagencies have taken some initial steps to provide indicators of incomedistribution and "weakening social fabric" in high-income countries[UNDP, 1992, 1993, Table 30]. But comparable figures for people inprison, suicides, rapes, drug-related crimes and murders are not given forthe poorer countries, and many other features of positive as well asnegative social development deserve comparative documentation. Thereare, of course, political motives at work which obstruct or inhibitdevelopment of a better scientific basis for global statistical indicators.
The same concern applies within countries. Common standards anddefinitions have to be seen to apply. This means that all strata withinsociety, and not just the poor, have to be taken into the reckoning. This isnot only because the wealth of the rich is in large measure a function ofthe poverty of the poor, but because rich and poor are connected by thethreads of a national and international web of institutions which governstheir opportunities as well as their conditions.
Perhaps the key breakthrough would be to persuade governments andinternational agencies to systematically describe conditions in terms ofdistribution among groups and classes within populations and therefore toattach less importance to national averages. The World Bank and otheragencies tend to provide (or seek) few data about the distribution of incomewithin countries. Not only are the data which are available astonishinglyout of date in some cases, but no substantial efforts are made to documentrecent and current trends which would in principle provide early warningof policies going wrong — or right. Thus both the World Bank and theUNDP continue to give data about the distribution of income in the high-income economies which are drawn from the early 1980s, and even fromthe late 1970s, when data for the 1990s are readily available [see WorldBank, 1993b; UNDP, 1992]. This is puzzling because the statistics whichthey provide for the poorest countries are up to date. Nor is the link madebetween inequality between countries and inequality within countries. I nTable 1 an attempt is therefore made to provide that link. Columns 3 and4 show that there are wide differences in living standards within countries— and that the standards of the poorest 20 per cent of the population inmiddle-income, and even high-income, countries overlap with those of themost prosperous 20 per cent in some low-income countries. Increasinglythe global problem of poverty is one which applies to rich and poorcountries alike, and not just to poor countries.

140 THE POVERTY AGENDA: TRENDS AND POLICY OPTIONS
V. Structural inequalities within the labour market
Lying behind the widening inequalities in income is not only thegrowing problem of access to paid employment, but also the problems ofmaintaining the real value of wages and safeguarding conditions ofemployment. For the OECD countries the standardized unemployment rategrew steadily from 2.7 per cent in 1964-67 to 7.2 per cent in 1980-90.Forthe 12 countries which are now members of the European Union the rategrew from 2.3 per cent in 1964-67 to 9.5 per cent in 1980-90 [OECD,
1992a, p. 45]. There is plentiful evidence that this long-term trend is likelyto continue, with marked fluctuations among individual countries.
Young people, members of minority groups and women seeking toenter employment are particularly vulnerable, and in many countriespremature "retirement" in the fifties and early sixties is becoming aeuphemism for permanent unemployment. Officially measured unemploy-ment is often seriously adrift from reality. Thus in August 1993, when theofficial figure for unemployment in the United Kingdom was 2,922,000 (or10.4 per cent), the Unemployment Unit estimated that it had actuallyreached 4,080,000 (or 14.6 per cent).
Large-scale unemployment undoubtedly also leads to increasingcasualization of employment [Rodgers & Wilkinson, 1991]. There is lessjob security, sweated conditions and child employment reappear, access tosocial insurance and various employment rights is more often denied, andemployers resort increasingly to employing workers on a temporary basis.Increasingly the United Kingdom has been perceived in Europe as settingthe pace for a more comprehensive restructuring of the labour market."The restructuring of the British economy over the past decade put millionsout of work, creating regional imbalances and a shrinking, deterioratingpublic sector. This experience could be the model for the way thatrestructuring and deregulation will affect the European economy after1992" [Eurostat, 1991, p. 3].
One feature of marginalization in some countries is an upsurge inself-employment, some of it tenuous and ill paid. Table 5 shows thatself-employment is dominant in most of the poorest countries but is ofconsiderable consequence in a number of rich countries, too. It tends toincrease in those richer countries experiencing substantial unemployment.Thus in the United Kingdom the proportion of self-employed grewmarkedly in the late 1980s and early 1990s. The rate was 7.1 per cent ofcivilian employment in 1979 but 11.6 per cent in 1990.
There is a tendency to suggest that this has occured as a result ofdeliberate government policies [OECD, 1992a, pp. 172-173]. However,

POVERTY/N EASTERN EUROPE: THE LATEST MANIFESTATION OF GLOBAL POLARIZATION 141
Table 5: Percentage of labour force self-employed
Developing countries Per cent Industrial countries Per cent in non-agricultural sector
Ghana 68 Italy 22Pakistan 56 Spain 20Ecuador 56 United Kingdom 14
Nigeria 56 Australia 13
Mexico 48 Ireland 12
Indonesia 44 France 11
Bangladesh 41 Netherlands 8
Philippines 36 Germany 8India 31 United States 8Republic of Korea 30 Canada 7Thailand 29Colombia 28
Malaysia 28Brazil 27
Note: Data for all the industrial countries apply to 1987. Data for developing countries apply toyears between 1981 and 1987.
Source: UNDP [1993], p. 39.
that is an assumption which requires critical analysis. High rates ofself-employment, as found in Spain and Ireland as well as in the UnitedKingdom, correspond with high rates of unemployment. Some analystswho have examined this relationship in the United Kingdom haveconcluded that high rates of unemployment have indeed prompted muchhigher rates of self-employment [Johnson et al., 1988; Robson, 1991].Certainly the contracting out of social services (for example, catering andcleaning) and the removal of requirements for insurance cover (affectingbuilding and construction in particular) have increased self-employment[Rubery, 1989]. Specially commissioned studies also suggest that asubstantial proportion of those claiming to be self-employed in fact earnvery little and maintain this status partly in order to convince potentialemployers that they are not unemployed and are strong candidates for a job[Lee & Townsend, 1993].
While the British experience of increasing self-employment is out ofline with that in France, Germany and Japan, where the rate ofself-employment has fallen, it appears merely to have been catching upwith the rates in a number of the high-unemployment OECD countries[OECD, 1992a, p. 158].

142 THE POVERTY AGENDA: TRENDS AND POLICY OPTIONS
VL The growing power of international agencies
How can polarization between countries, and within countries, beunderstood? The argument thus far may seem merely to be properlycomparative. It insists on objective comparison between societies, and alsowithin the hierarchical structures of societies, rather than limitedcomparison between averages for each nation state.
But the world is no longer, if ever it was, a world of independentnation states. Increasingly the autonomy of the nation state is submittingto that of the multinationals. What does this mean? It means the explosiveenlargement of multinational corporations (the largest have a biggerfinancial turnover than middle-sized nation states such as Saudi Arabia);the growing predominance of international agencies like the World Bankand the IMF; and the emergence of new regional powers, like theEuropean Union.
Each of these structural innovations demands serious examination asthey are all major actors on the world scene. All three have an influenceon social development policies and policies affecting social integration anddisintegration. All three have, in effect, their own social policies whichaffect their employees or constituents, as well as people who do not sharethat status — like temporary workers, immigrants and refugees seekingasylum.
All three structures form a kind of hierarchy of power, with theGroup of Seven nations located at the apex of the hierarchy. There are ofcourse interconnections between the three: many observers believe that theinternational agencies primarily reflect the interpretation of interests andpower assumed by the principal multinational corporations. This hierarchyhas been strengthened in the aftermath of the Cold War; it now requiresdemocratization and a different method of accountability.
One of the continuing problems for an understanding of the phenome-non of poverty is that many commentators do not seem to appreciate thatthe assumptions they make about one country or region are often inconsis-tent with those they make about another country or region. A commonmistake is to define poverty differently for Eastern and Western Europe,North and South America, First and Third Worlds. An illustration isprovided by the World Bank. The Bank has conceded the "loss ofmomentum during the 1 980s" in reducing poverty and is developing a newstrategy [World Bank, 1993 a]. "Poverty reduction is the benchmark againstwhich our performance as a development institution must be judged",stated Lewis T. Preston, President of the World Bank (28 April 1993).

POVERTY/N EASTERN EUROPE: THE LATEST MANIFESTATION OF GLOBAL POLARIZATION 143
But what is this benchmark? The "poverty line" is defined as "$31 perperson per month or $1 dollar per day at US purchasing power parity"[World Bank, 1993a, p. 4]. For 1990 this produces an estimate of 1,133million poor people in the developing world. "An extra $0.70 per dayadded to the poverty line implies a doubling of the number of peoplecounted as being poor" [ibid., p. 4]. A previous report [World Bank,1990] had "argued the case for basing international comparisons" on thelatter line. However, this absolute measure differs from previous measuresput forward by the Bank, and is inconsistent with other definitions of"absolute poverty" and the "poverty line" given in the same report. Thusabsolute poverty is "the position of an individual or household in relationto a poverty line the real value of which is fixed over time"; and thepoverty line is "the standard of living (usually measured in terms ofincome or consumption) below which people are deemed to be poor"[World Bank, 1993a, p. vii].
When these various statements are put together it is clear that thestandard below which people are deemed to be poor is in practice a fixedstandard, for which there is no country or regional variation and for whichno criteria independent of "$1 per day" are given. For Latin America andthe Caribbean the World Bank has actually adopted a different poverty lineof $2 per day [ibid., p. 6]. The Bank's poverty measurement cannot,therefore, remain acceptable in international practice.
Other international agencies compound the problem. The poverty lineis defined by the UNDP as "that income level below which a minimumnutritionally adequate diet plus essential non-food requirements are notaffordable" [UNDP, 1993, p. 225]. A report for the International Fund forAgricultural Development comes close to this perspective but seems tointroduce a measure of flexibility into the concern of a "fixed" poverty lineby taking note of measures which originate nationally and which dependon a more sophisticated investigation of changes in consumption as well asconsumption prices. Thus the poverty line is a "commodity bundle tied tothe minimum requirement (calories and protein for food, and some notionalminimum for non-food items), and the determination of an appropriate setof prices to be applied to individual commodities to calculate the povertyexpenditure and income" [Jazairy et al., 1992, p. 461].
The ILO has contributed over the years to a more "structural" inter-pretation of poverty and its causes [IlLS, 1993]. In particular, its work onthe structure of the labour market and questions of access to that markethas helped to balance the monetarist perspectives of the IMF and theWorld Bank. In the 1970s the ILO also began to demonstrate the part tobe played in explaining poverty by lack of community utilities or

144 THE POVERTY AGENDA: TRENDS AND POLICY OPTIONS
infrastructure — water, sanitation, health centres, primary schools, andtransport. This aspect of understanding poverty, and its alleviation,deserves renewed attention. Thus, some commentators have pointed outthat the World Bank's 1990 report on poverty "represents a step awayfrom neoliberalism and back toward the Bank's attitude of the 1960s: thatthe continuing existence of the poor in poor nations is the developmentproblem. Indeed, the WDR's insistence on remedying water and airpollution resembles nothing more strongly than 20-year-old strategiesaimed at satisfying developing countries' basic needs" [Taylor, 1992, p.57]. The ILO preoccupations of the 1970s are back in fashion.
Any reference to rich countries illustrates the nature of the problem.The United States, for example, defines a poverty line based on assump-tions far removed from those applied to the poorer countries. The line isbased on the least costly budget demonstrated to achieve adequate nutritionand conform in its overall distribution to the budgets of low-incomefamilies in the United States — the specific amounts varying according tohousehold size and composition, and being adjusted each year inaccordance with price changes. In 1990 the poverty line varied from$6,652 for a person living alone to $26,848 for a household of nine ormore members [US Department of Commerce, 1992, p. 111. The povertyline in the United States in 1990 thus varied from over $6,000 to $3,000per person per annum, depending on the size and type of household. Thismeans that at comparable purchasing standards people in the United Statescan have between 8 and 18 times as much income as those in countries likeChina, India and Mozambique and still be defined as poor.
Different criteria from those used in the United States apply inEurope. In launching the Second European Poverty Programme (1985-89),the Council of Ministers defined the poor as "persons whose resources(material, cultural and social) are so limited as to exclude them from theminimum acceptable way of life in the Member State in which they live"[Commission of the European Communities, 1991, p. 2]. Sadly, criteriafor giving effect to this definition were never worked out. Instead, thenumber of those with less than 50 per cent of average disposable incomeper person in each member country was regarded as "a good indicator ofthe extent of poverty" [ibid., p. 2]. In 1990 this would have given apoverty line for a person living alone in the United Kingdom of approxi-mately £3,500, or, at the exchange rates then prevailing, nearly $6,000.For a family of four the poverty line would have been about $17,000,compared with a figure of $13,359 for the same family in the UnitedStates. Thus, although the United States and Europe follow differentprocedures in measuring poverty, in practice they both apply assumptions
POVERTY IN EASTERN EUROPE: THE LA TEST MA NIFES TA TION OF GLOBAL POLARIZA TION 145
in constructing a poverty line radically more generous than those appliedby international agencies to poor countries. It reflects a different racial,and not merely cultural, standard.
A definition is therefore required which stands the test of time and isgenuinely international. The problem tends to be glossed over in reportson the poorer countries by the international agencies. Thus the arbitraryselection of $1 per day as a poverty line conforms to an ideology whichpresupposes that economic growth is the principal strategy to overcomepoverty [see World Bank, 1993a, p. ix]. It also conforms to an ideologywhich suggests that the needs of people in poor countries are less thanthose in rich countries. This carries imputations which cannot be acceptedin the 1990s. It also results in entirely misplaced strategies.
In principle there is a solution. It is to identify forms of deprivationand multiple deprivation in all countries, and to investigate what thresholdsof income (and other resources for both individuals and communities) canbe shown to eliminate or greatly reduce such deprivation. That is acomplex task, but the interrelationship of forms of nutritional, material,environmental, work-related and social deprivation is no more complexthan the interrelationship of genes or physical nuclei or atoms.
VII. International agencies, structural adjustmentand national policies
It may be argued that the hierarchy of management or administration,in describing the evolution of the international agencies, to which I havereferred above, and multinational corporations (Centre on TransnationalCorporations), is the motivating force behind structural inequality withinthe world. This possible thesis, if confirmed, would help to explain morethan the persistence of poverty and social polarization, which are abundant-ly documented in the whole range of international reports —a number ofwhich have been referred to in this chapter. It would also help to explainmuch of the current alienation from democratic government, the persis-tence of high rates of unemployment, the reduction in already low wages,and the growing poverty and homelessness.
This hierarchy or "international state" espouses policies, which applyto rich and poor countries alike: cuts in public expenditure, pricestabilization, reduction of the costs of labour deregulation and priva-tization. These policies masquerade under titles like "structural adjustment"[Woodward, 1992]. Yet, freed from the constraints of a more effectivesystem of human rights, employee rights, citizenship entitlement,

146 THEPOVERTY AGENDA: TRENDS AND POLICY OPTIONS
international anti-discrimination legislation, and especially legal restraintsapplied through international company law and international taxation law,they tend to serve the interests of an arbitrary exercise of power toinstitutionalize competitive inequality.
The World Bank provides a contemporary example. In the 1970s, thepersisting problem of poverty in the so-called developing countriesprompted the World Bank, under McNamara, to call public attention to theneed for policies to alleviate the phenomenon. Policies based on theoriesof modernization, advocated by Rostow and others and adopted by theinternational agencies in the 1960s, had failed to work. But the analysis ofthe reasons for the persistence of poverty was insufficiently scientific, orradical; in the 1980s, paradoxically, a more extreme version of the sametherapy was applied by the World Bank and the IMF, influenced by thespread of monetarist theory.
Action had in fact been prompted more by the debt crisis than by thepersistence of poverty — but World Bank strategy was to attempt to dealwith both through new structural adjustment policies. Structural adjustmentloans were introduced in 1980; these provided longer-term finance tosupplement the relatively short-term finance available from the commercialbanks and the IMF. This had the effect of providing new lending to financesubstantial annual debt repayments — provided stringent conditions wereaccepted. The loans increased the already large measure of control exertedover the policy choices of borrowing countries by the internationalfinancial institutions. What were the conditions? No important sector of theborrower's economic life was left untouched: "trade and exchange ratepolicies; investment and operating policies for energy, agriculture andindustry; the review of national investment priorities; the financialperformance and efficiency of public-sector enterprises; the budget; taxpolicy; interest rates and debt management" (Payer [1991, p. 96]; see alsoher earlier analysis of the World Bank in Payer [1982]).
Underlying all the specific conditions of the structural adjustmentloans were the familiar objectives: opening a closed or protected economyto world market forces; forcing prices into line with world market prices;privatizing government economic enterprises; reducing labour's share ofnational income; reducing subsidies and welfare benefits under the pretextof targeting need and achieving "cost efficiency". Case studies of indivi-dual countries, such as Mozambique [Hanlon, 1991], offer indisputabletestimony to the damage caused by such a strategy to vulnerable countriesand populations.
In the 1990s the massive indebtedness of the poor countries, togetherwith the obvious failure to close the gap between rich and poor countries,

POVERTY/N EASTERN EUROPE: THE LA TEST MA NIFES TA T/ON OF GLOBAL POLARIZA TION 147
has prompted fresh anxiety about the structural adjustment loans (and theconditions attached) which were made available in the 1 980s.
Under a new president, the World Bank has issued a new analysis ofhow to deal with poverty [World Bank, 1993 a]. What is remarkable aboutthis analysis is not only the failure to specify an objective basis for apoverty line — so that the true dimensions of the phenomenon at the centreof attention can be rationally measured and understood, as argued above— but that no explanation is given for the failure of previous policies (andloans) to alleviate poverty. By the same token, no account is offered of thechanges required in Bank policies.
Lewis T. Preston, President of the Bank, says in a foreword that"Sustainable poverty reduction is the World Bank's fundamental objective.It is the benchmark by which our performance as a development institutionshould be judged" [ibid., p. iii]. A two-part strategy for reducing povertyis proposed.
The first element involves encouraging the kind of growth that makesefficient use of the poor's most abundant asset — their labour. Thesubsidization of capital, distorted prices for labour-intensive products, andrestrictions on labour mobility all act as constraints on the demand forlabour and must be overcome, while the availability of basic infrastructureand inputs must be improved. The second element of the strategy involvesensuring widespread access to primary health care, family planning,nutritional services, and primary education to enable the poor to participatefully in the growth of the economy [ibid., p. 1].
There is also a need "to provide safety nets to protect the mostvulnerable members of society".
There is in fact no substantial evidence that poverty has been causedby the lack of economic growth, on the one hand, or the lack of targeted"safety nets" on the other. The problem has been much more to do withthe inability to obtain a fair price for local products, and hence reasonablewage levels, because of the domination of world trade by rich states andpowerful corporations. And targeting, or means-testing, only exacerbatesthe very conditions of impoverishment and social division which it isintended to ameliorate.
The underlying objective is clear: to find acceptable and cheapmethods of persuading countries to conform more closely to a "free"international market. Deregulation, privatization and reduced publicexpenditure are the primary prescriptions of structural adjustment theory.The World Bank identifies five types of policy for achieving broad-basedgrowth: "(i) investing in people; (ii) establishing a competitive environment
148 THE POVERTY AGENDA: TRENDS AND POLICY OPTIONS
for enterprise; (iii) opening markets to the rest of the world; (iv) ensuringmacro-economic stability; and (v) building effective state and marketinstitutions" [World Bank, 1993a, p. 40].
The emphasis on conformity with the market and increased targetingis illustrated copiously in the "poverty assessments" completed by WorldBank teams. To take a few examples at random: there is "inefficienttargeting of beneficiaries" (Egypt); a withdrawal of general food subsidiesis proposed in favour of programmes "targeted to lower income groups"and there is an increased role for "the private sector in service delivery"(Venezuela); social services reforms are needed to "restructure publicexpenditure to achieve better targeting, for instance by exploitingopportunities for price discrimination in charging for public services"(Indonesia). The theoretical basis and justification for such poverty"assessments" is very tenuous. There is strong evidence, for example, thateconomic growth does not necessarily result in "trickle-down" unlesspolicies of equalization and redistribution are vigorously pursued [Newman& Thompson, 1989]. The disadvantages of "targeted" welfare benefits, asfor example in the United States and the United Kingdom, have beenconvincingly documented.
What is also overlooked is that the World Bank appears to be wieldingenormous influence over government policies in many poor countries withminimal resources. In 1992 only $2.6 billion was committed by the Bankto structural or sector adjustment loans directed at reducing poverty. Thisis roughly the income of Malta, or a quarter of the income ofLuxembourg; it represents only 0.0005 per cent of the income of theUnited States, and 0.0002 per cent of the income of the Group of Sevencountries.
VIII. The long-term construction of alternative policies
Many of the social policies operating at national level must be used asmodels for what might be done at international level to reinforce stabilitythrough social integration. The destruction of systems of compensation andwelfare in pursuit of some of the illusory objectives of the market is notthe best interests of humankind. In resolving the immense social problemsof the world, therefore, we must first slow down the destruction ofwell-established public institutions and services, and seek to democratizein the process the international bodies that are assuming greater power.When European bodies look at the problems of "sustainable development",at least they acknowledge, unlike the IMF and the World Bank, that
POVERTY IN EASTERN EUROPE: THE LATEST MANIFESTATION OF GLOBAL POLARIZATION 149
planning must have a top place on the agenda [Council of Europe, 1993].A second step is to insist on balancing "corrective" action with
"preventive" action. There is a complex list of measures that might betaken at international, national and regional or local level to establishrights, life chances, minimum entitlement to benefits on the part ofunemployed, sick, disabled and elderly people, and minimum wages, tocreate a framework for social development. Perhaps the most crucialrequirement is for an international bill of rights, or law, internationalcompany law being the most critical aspect.
This framework of policy must also include provisions to restrainexcessive forms of personal and corporate aggrandizement — in thecommon, or public, interest. Hierarchies of wealth are being constructednot just to the detriment of the marginalized and excluded, but at the costtoo of general insecurity and sudden impoverishment of formerly securemiddle classes.
Policies of redistribution have to be modernized. Indeed, some havea new relevance (in relation to inheritance taxation, consumer goodstaxation and corporation taxes, for example). But the all-important role ofdirect policies of "distribution" cannot be ignored. Rates of profit and topsalaries are critical in this context, as are rates of taxation and minimumwages, and they deserve priority over corrective measures like personalincome taxation. Boards of management of major companies must be seento exercise more responsibly decisions to make redundant thousands ofemployees, transform pension rights, and introduce casual or temporaryconditions of work, as well as close plants without forewarning or publicconsultation. In short, there have to be social and not just market"policies" for wealth creation, because wealth creation is the most criticalreal form of social construction or social development.
Bibliographical references
Atkinson, A. B.; Micklewright, J. 1992a. The distribution of income in Eastern Europe.WSP/72, The Welfare State Programme, Suntory-Toyota International Centre forEconomics and Related Disciplines, London School of Economics.
—. 1992b. Economic transformation in Eastern Europe and the distribution of income.Cambridge, Cambridge University Press.
Centre on Transnational Corporations. 1992. World InvestmentReport, 1992: Transnationalcorporations as engines of growth. Transnational Corporations and ManagementDivision of the UN Department of Economic and Social Development. New York,United Nations.

150 THE POVERTY AGENDA: TRENDS AND POLICY OPTIONS
Commission of the European Communities. 1991. Final Report on the Second EuropeanPoverty Programme 1985-1989. Luxembourg, Office for the Official Publications ofthe European Communities.
Committee on Ways and Means. 1992. 1992 Green Book. Washington, DC, US Govern-ment Printing Office.
Council of Europe. 1993. The challenges facing European society with the approach of theyear 2000: The outlook for sustainable development and its implications onregional/spatial planning. European Regional Planning No. 54. Strasbourg, Councilof Europe Press.
Deacon B. 1991. Social welfare developments in Eastern Europe and thefuturefor socialistwelfare. Leeds Polytechnic.
—. 1992. The impact of supranational and global agencies on Central European nationalpolicy. Presented at the first European Conference of Sociology, Vienna, August1992, and also at other European conferences in 1992. Leeds Polytechnic; publicationforthcoming.
— et a!. 1992. Eastern Europe in the nineteen nineties. London, Sage.
Eurostat. 1990. Poverty in figures: Europe in the early 1980s. Luxembourg.
—. 1991. Unemployment. Luxembourg, EEC.
Fanelli, J. M.; Frenkel, R.; Taylor, L. 1992. "The World Development Report 1991: Acritical assessment", in UNCTAD: International Monetary and Financial Issues forthe 1990s. Research Papers for the Group of 24, Vol. I. New York, United Nations.
Hanlon, 1. 1991. Mozambique: Who Calls the Shots? London, James Currey.
International Institute for Labour Studies. 1993. The framework of ILO action againstpoverty. Geneva, IlLS.
Jazairy, I.; Alamgir, M.; Panuccio, T. 1992. The state of work! rural poverty. Rome andNew York, WAD, New York University Press.
Johnson, S.; Lindley, R.; Bourlakis, C. 1988. Modelling aggregate self-employment:A preliminary analysis. DE Programme Project Report. University of Warwick,Institute of Employment Research.
Ksiezopolski, M. 1991. "Labour market in transition and the growth of poverty in Poland".Unpublished paper for the International Institute for Labour Studies, Geneva.
Lee, P.; Townsend, P. 1993. Trends in deprivation in the london labour market: A studyof low incomes and unemployment in London between 1985 and 1992. Report for theInternational Institute for Labour Studies, Geneva.
Lydall, H. 1968. The structure of earnings. Oxford, Oxford University Press.
Newman, B. A.; Thompson, R. J. 1989. "Economic growth and social development:A longitudinal analysis of causal priority", in World Development (New York),Vol. 17, pp. 461-471.
OECD. 1992a. Employment Outlook. Paris, OECD.
POVERTY/N EASTERN EUROPE: THE LATEST MANIFESTATION OF GLOBAL POLARIZATION 151
—. 1992b. Historical Statistics 1960-1990, Economic Outlook. Paris, OECD.
Osberg, L. (ed.). 1991. Economic inequality and poverty: International perspectives. NewYork and London, Sharpe.
Payer, C. 1982. The World Bank: A critical analysis. New York, Monthly Review Press.
—. 1991. Lent and lost: Foreign credit and Third World development. London and NewJersey, Zed Books.
Robson, M. T. 1991. A survey of recent time series studies of business formations anddissolutions in the United Kingdom. Report prepared for the UK Department ofEmployment.
Rodgers, G.; Wilkinson, F. 1991. "Deprivation and the labour market: Research issues andpriorities", in Labour and Society, (Geneva, IlLS), Vol. 16, No. 2.
Rubery, J. 1989. "Precarious forms of work in the United Kingdom", in Rodgers G. andRodgers J. (eds.): Precarious jobs in labour market regulation. Geneva, ilLS.
Taylor, L. 1992. "The World Bank and the environment: The World Development Report,1992", in UNCTAD: International Monetary and Financial Issues for the 1990s,Research Papers for the Group of 24, Vol. II. New York, United Nations.
Townsend, P. 1993a. The international analysis of poverty. Milton Keynes, HarvesterWheatsheaf.
Townsend, P. 1 993b. The repressive nature and extent of poverty in the UK: Predisposingcause of crime. Symposium on the link between poverty and crime. Proceedings of the11th Annual Conference of the Howard League on poverty and crime,8-10 September 1993. Summary in Criminal Justice, the magazine of the HowardLeague, Vol. 11, No. 4, October.
UK Research and Development Unit (Local Government Centre, University of Warwick.1992. The Poverty Summit: The Edinburgh Declaration. An agenda for changeprepared by participants in the Poverty Summit held in Edinburgh, 6-8 December1992.
UNCTAD. 1993. The least developed countries: 1992 Report. New York, United Nations.
UNDP. 1992. Human Development Report, 1992. New York and Oxford University Press.
—. 1993. Human Development Report, 1993. New York and Oxford, Oxford UniversityPress.
US Department of Commerce. 1992. Income, poverty and wealth in the United States:A ChartBook, by L. Lamison-White. Current Population Reports, Consumer Income,Series P-60, No. 179.
Vecernik, J. 1991. "Economic inequalities and poverty in Czechoslovakia: Determinants,transformations and household strategies". Unpublished paper presented to aconference organized by the International Institute for Labour Studies, Geneva.
Woodward, D. 1992. Debt adjustment and poverty in developing countries, Vols. I and H.London, Pinter.
World Bank. 1990. World Development Report 1990. Poverty. Washington, World Bank.

152 THE POVERTY AGENDA: TRENDS AND POLICY OPTIONS
—. 1993a. Implementing the World Bank's strategy to reduce poverty: Progress andchallenges. Washington, DC, World Bank.
—. 1993b. World Development Report 1993: Investing in health. Washington, OxfordUniversity Press for the World Bank.

7 Labour market, urban povertyand adjustment:New challenges and policy options
Ricardo Infante1
The setback in human development suffered by Latin America and theCaribbean in the past decade has created a common consciousness of theneed to confront the problem of poverty. This consensus, apart from itsjustification on ethical grounds, is also associated with the greater eco-nomic efficiency required by the prevalent open market regimes. It isbelieved that the promotion of policies aimed at facilitating the integrationinto society of the less privileged groups strengthens grass-roots supportfor the processes of productive structural adjustment in the region and thusmakes them economically and politically viable.
The objective of this chapter is to contribute to the analysis of thefactors determining the evolution of poverty and of the mechanisms thatshould be considered in the formulation of economic and social policiesoriented towards alleviating it. These topics are approached by taking intoaccount the different effects of the structural adjustment processes on theliving standards of the different social sectors in the region during the1980s. In this context, attention is focused on the impact that changes inthe labour market and in public social spending had on the evolution ofpoverty and its characteristics. The response of the poor to the increasingdeterioration in their living conditions is also examined. Finally, someconsiderations are presented with respect to the efforts required to eradicateor reduce poverty and the conditions in which labour market policies couldeffectively contribute to achieving this goal.
'PREALC/ILO expert.

154 THE POVERTY AGENDA: TRENDS AND POLICY OPTIONS
L Background in formation on povertyand its determinants in the 1980s
This section provides information which permits an appreciation of themagnitude and characteristics of poverty as the chief component of thedistributive imbalance generated by the adjustment processes of the 1980s.It also attempts to identify the factors that could explain the behaviour ofpoverty during the period.
1. The evolution of poverty: The poverty line approach
In the past decade, the effects of the crisis and the differentiateddistributive impact of adjustment policies on the well-being of differentsocial groups could be perceived most clearly in the rise of poverty, whichjumped from 33 per cent of households in the region in 1980 to 39 percent in 1990.2 This phenomenon encompasses two basic characteristics.The first is related to the eminently urban nature of the rise in poverty,whose extent increased from 24 per cent of urban households in 1980 to34 per cent in 1990, whereas poverty in rural households remainedconstant at around 52 per cent. The second is the increased extent ofextreme poverty, with indigence in affected urban areas rising from 8 percent in 1980 to 13 per cent in 1990. Hence, it can be affirmed that duringthe period poverty not only increased in extent but also heightened inintensity in urban areas of the region.
The foregoing estimates of the evolution of poverty and indigencewere reached by the Economic Commission for Latin America and theCaribbean [ECLAC, 1990a, 1992b1 by applying the absolute poverty orpoverty line approach. In this connection, it is understood that theindigence line corresponds to the food basket containing the basicnutritional needs of the population, taking into account the effectiveavailability of these staple foods as well as their relative prices. Thepoverty line, on the other hand, is obtained by adding to this cost the valueof the resources required by households to satisfy the rest of their basicneeds. In practice, the poverty line is estimated by multiplying theindigence line by a coefficient equal to 2 in urban areas and 1.75 in ruralareas.
According to this criterion, a household is held to be either poor orindigent if the per capita monetary income of its members is below the
2 This meant that the proportion of poor in the total population increased from 41 percent to 46 per cent over the period mentioned.

LABOUR MARKET, URBAN POVERTY AND ADJUSTMENT 155
respective poverty or indigence line. Although this method allows theheadcount ratio of poverty to be estimated, it does not permit anappreciation of the intensity of poverty. For this purpose it is necessary toestimate the income shortfall of household members. Merging both factorsin a single indicator makes it possible to determine the amount of resourcesrequired to cover the aggregate income gap of the poor sectors; this isnormally expressed in terms of total household income or some aggregatefigure or percentage of the GDP.
For the region as a whole it is estimated that the per capita incomeinsufficiency of poor urban households corresponded to 30 per cent of thepoverty line level in 1980, but by 1990 this proportion had risen to 45percent [Infante, 1993]. These indicators show that both the extent and theintensity of poverty in urban areas increased during the decade, while theper capita income of poor households fell disproportionately (by 21.4 percent) in comparison with the decline per capita national income during theperiod (15 per cent). The outcome of these factors combined is that theaggregate poverty gap rose from an amount equivalent to 2.4 per cent ofGDP in 1980 to 4.6 per cent in 1990.
2. The determinants of urban poverty
An analysis of the factors determining the behaviour of poverty,following the approach mentioned, implies specifying beforehand thedifferent components of the incomes of poor urban households. It is worthbearing in mind that in Latin America the bulk of the monetary income (70per cent) of poor households proceeds from the labour market while therest is provided by social expenditure resources.4 In essence, the condi-tions of poverty and indigence of households are closely linked both to thevulnerable position of marginalized groups in the labour market and to thelack of access of household members to social expenditure resources. It canalso be argued that these poor groups have to devise their own initiativesin terms of family survival strategies and community organization so as toforestall any further deterioration in their already uncertain economicsituation.
With respect to the labour situation of urban poor groups, it must benoted first that their labour market position is precarious, given that the
This estimate is based on the premise that the value corresponding to the per capitapoverty line was equal to one-quarter of per capita GDP for the years mentioned.
' Estimate based on data from ECLAC [1 992b].

156 THE POVERTY AGENDA: TRENDS AND POLICY OPTIONS
majority have jobs in the urban informal sector.5 Using data from ECLAC[1992b] and the Regional Employment Programme for Latin America andthe Caribbean [PREALC, 1993], it can be estimated that about 60 per centof those from poor urban households who are employed are engaged ininformal sector activities 6 These break down as follows: domestic service(10 per cent); self-employed and unpaid family members (30 per cent);micro-enterprises or small establishments with less than five workers (18per cent). The remaining 40 per cent are wage earners, either in the publicsector (8 per cent) or in establishments with more than five workers in theprivate sector. Second, it must be emphasized that even if a high propor-tion of the jobs to which poor groups have access involve wage-earninglabour relations, these are just as precarious as those jobs that do not, sincethey are not subject to any institutional framework in such matters ascontracts, minimum wages or work hours. Third, although the participationrate of the poor urban workforce is only approximately 10 per cent belowthe average, the unemployment rate is double that for the total urban work-force. This is largely due to the lack of job opportunities open to poorpeople, but it also reflects their extreme labour market vulnerability[Rodgers, 1985].
Before considering the importance for the poor of social expenditureresources, it must be noted that the poverty line approach takes intoaccount only the monetary benefits of social spending (social security,transfers and subsidies) when calculating household income. Non-monetarybenefits (health, education and housing) do not form part of the concept ofhousehold monetary income, even though they are considered to contributeto the creation of equal opportunities and the improvement of the qualityof life of individuals.7
To appreciate fully the potential effect of monetary social expenditureon the incomes of the poor, it must first be realized that the fiscalresources destined for this purpose average around 7 per cent of GDP [seeInfante & Revoredo, 1993]. Second, assuming that these resources aredistributed proportionally among the population, urban poor groups wouldbe entitled to receive a volume of resources equivalent to 3 per cent ofGDP.8 This magnitude reflects the important role that monetary social
For further details, see Rodgers [19891.6 This proportion climbs to 66 per cent if only workers from indigent households are
taken into account.
A more thorough analysis of this aspect will be undertaken in the following section.
The extent of urban poverty rose from 30 per cent in 1980 to 39 per cent in 1990

LABOUR MARKET, URBAN POVERTY AND ADJUSTMENT 157
expenditure can play in compensating poor urban groups, especially if itis borne in mind that the aggregate income from labour of these sectorsrepresents only 8 per cent of GDP.
Finally, when looking the determinants of urban poverty, an additionalfactor must be considered. This concerns the initiatives launched by poorhouseholds in response to the distributive imbalances generated by thefunctioning of the labour market and the allocation of public socialexpenditure. Among these initiatives, family survival strategies andcommunity-based organizations developed by poor urban groups during thepast decade are worth singling out.
II. Explanatory factors behind the increasein urban poverty
The foregoing observations indicate that any analysis of the factorswhich had a bearing on the increase in urban poverty in the 1980s impliesan examination both of the transformations that took place in the labourmarket and of adjustments in social expenditure. In addition, thecontribution of the above-mentioned initiatives undertaken by poor peoplethemselves must be taken into account. Changes brought about by macro-economic factors corresponded to the distributive effects of the stabilizationpolicies and to the economic reforms carried out during the past decade.
1. Unequal distribution of adjustment costs:Changes in primary income distribution
In global terms, the external shocks absorbed by the region, especiallyat the beginning of the 1980s (rising interest rates, contraction of financialflows, low raw material prices and decreasing demand for the industrialproducts of the region), translated into a net transfer abroad of resourcesequivalent to 6 per cent of the regional product [ECLAC, 1992a;PREALC, 19911. The policies adopted to meet this external imbalanceconsisted in adjusting the national economies by means of recessionarymeasures to deal with rising inflation; among other effects, this furtheraggravated problems of internal distribution. As a result, economic growth,which had reached a regional average of 5.6 per cent per annum of GDPin the 1970s, plummeted to an annual figure of 1.2 per cent in the period
[ECLAC, 1990a, 1992b1.

158 THE POVERTY AGENDA: TRENDS AND POLICY OPTIONS
1980-90. Similarly, the annual inflation rate of 43 per cent registered in the1970s skyrocketed to 271 per cent during the 1 980s.
The slow pace of economic expansion, coupled with a relatively highrate of demographic growth (2.1 per cent per year), meant that GDP percapita in 1990 was 10 per cent lower than at the beginning of the decade.Worse still, if one considers the effective availability of resources in theregion, after deduction of the transfers abroad mentioned above, grossnational income per capita in 1990 was actually 15 per cent lower that ithad been in 1980. Although both figures clearly illustrate the sacrifices thathad to be made to absorb the impact of the external imbalances, the secondfigure provides a truer picture of the loss of overall well-being (consump-tion, investment) experienced by the region as a whole during the yearsthat have been called the "lost decade" or the "decade of painfulapprenticeship" [ECLAC, 1990b].
In terms of the distribution of adjustment costs, the effects ofrecessionary measures combined with the effects of high and unstableinflation meant, on the one hand, that not all economic agents succeededin adapting themselves equally swiftly and, on the other, that the degreeof income loss sustained varied among these agents. In addition, thegreater success of the agricultural sector in incrementing the net supply ofexportable goods meant that it suffered significantly less than other sectorsof the economy. This, added to the historical tendency of the rural popula-tion to reduce its rate of population growth, meant that the adjustment fellmainly on the urban population of the region.9
Included in the analysis of the distributive situation of the economicagents are such items as foreign capital, whose income comes from netremittances of factor payments, interest payments on the foreign debt, andnet price profits derived from the interchange of goods and services.Further taken into account are the national entrepreneurial sector, whichobtains its income from profits and other non-labour rents, and wageearners, whose income basically arises from the labour market.'° Finally,account must be taken of the public sector, whose revenues proceed from
In the 1980s, the total population of Latin America and the Caribbean grew by 2.1per cent per annum, while that of the rural areas expanded by 0.2 per cent. In thesecircumstances, the urban population grew by 3 per cent a year, increasing its share of thetotal Latin American population from 65 per cent in 1980 to 71 per cent in 1990 and from53 per cent to 60 per cent in the countries of the Caribbean [ECLAC, 1992a}.
tO This comprises all wage earners, including those pertaining to micro-enterprises inthe informal sector.

LABOUR MARKET, URBAN POVERTY AND ADJUSTMENT 159
direct and indirect taxation, non-tax income and the savings (profits) ofpublic enterprises.
During the period 1980-90 regional GDP grew by 12.7 per centwhereas gross national income increased by 6.1 per cent [ECLAC, 1991 a].Over the same period, owing to adjustment policy measures and theprocess of redefining the limits of state control, the role of the publicsector weakened in two ways. First, public revenues diminished owing tothe natural reduction of the tax burden in recessionary conditions; second,public enterprises became more indebted, owing to an exchange rate policyaffecting import costs and the lagging behind of public sector tariffs." Asa result, the total income of the public sector expanded by only 4.2 percent during the decade, and its share in regional GDP fell by two per-centage points between 1980 and 1990.
In addition, as a consequence of the deterioration experienced in thelabour market [PREALC, 19911, the share of wage-earning workers inregional GDP declined by six percentage points from 39 per cent in 1980to 33 per cent in 1990.12 These shrinkages in the share of regional GDPof both the public sector and the workers, besides leading to a 6 per centincrease in the share of foreign capital in GDP, created room for thenational entrepeneurial sector to increase their share by 2 per cent of GDP.Hence, adjustment meant that these latter economic agents enhanced theirincomes by an amount equivalent to eight percentage points of GDP, anaccretion that was absorbed in part by the losses sustained by the publicsector (2 per cent of GDP) but mainly by the losses suffered by the sectorsderiving their income from the labour market (6 per cent of GDP).
In sum, from this analysis of the distributive effects of adjustmentpolicies,'3 it can be inferred, first of all, that primary income distributionwas modified in favour of foreign capital and national entrepreneurialcircles to the disadvantage of the public sector and the workers. Thismeans that the social cost of adjustment was borne disproportionately bythe productive agents. The second conclusion is that the burden ofadjustment fell mainly on the urban population, chiefly affecting the socialgroups that obtain their income from the labour market.
For further information on this subject, see ECLAC [1991a].
12 The aggregate of workers, including the self-employed, is assumed to have incurreda similar or even higher loss, since average incomes in the informal sector are supposedto have experienced a greater reduction in real terms than GDP per working person.
13 The present analysis considers only modifications in the distribution of income andnot alterations derived from changes in equity among the productive agents.

160 THE POVERTY AGENDA: TRENDS AND POLICY OPTIONS
2. Deterioration of the urban labour market
During the 1980s, as a result of the policies applied during the crisisand the structural reforms adopted subsequently by some countries, the
labour market in the region underwent changes which decisivelyinfluenced
its behaviour. Various ILO [1991, 1992] and PREALC [1991, 1992a]documents have affirmed that these changes basically affected the
functioning of the labour market in the following ways: they influenced the
nature of the employment problem; they entailed a serious deterioration inthe wages and real incomes of working people the urban informal sector;they weakened the labour institutions.
A. Changes in the nature of the employment problem
The impact of adjustment policies on the labour market during the
1980s has three basic components; an expansion of the urban laboursupply, a loss of quality in urban jobs, and an increase in unemployment
and changes in its composition.
Rapid growth of the urban labour supply
In spite of the slowing in population growth experienced bythe regionas a whole, the urban labour force maintained a high level of growth (3.3per cent annually) in the 1980s, similar to that registered in the precedingdecade [ILO, 19921. This meant that job seekers continued to exertpressures on the labour market. The phenomenon of growth in the urbanlabour supply can be explained by two factors. First, there was an increasein the female participation rate; this intensified during the crisis period(1980-83) and then continued at a lower but sustained pace until the endof the decade. This sudden and swift rise in the female participation rateduring the crisis can be attributed to the entry into the labour market ofwomen from households in extreme poverty, motivated more than anythingby the need for survival. During the period of economic recovery,however, this contingent withdrew from the labour market, lacking thequalification profile required for most jobs in a period of productivegrowth [Pollack, 1992]. Secondly, displacement of the population towards
the urban zones continued; for the region as a whole, this meant thattowards the end of the decade 74 per cent of the total labour force waslocated in urban areas.'4 In sum, during the 1980s the urban labourmarket of the region had to face — in a recessionary macro-economic
" The total workforce (aged 15 or over) amounted to 156.4 million people in 1990.

LABOUR MARKET, URBAN POVERTY AND ADJUSTMENT 161
context — the pressures stemming from a rapid growth in the labour supply,which, in comparison with the preceding decade, exhibited a bettereducational leveP5 and an increasing level of female participation.
Loss of quality in urban jobs
Recent analyses by the ILO [1992] and PREALC [1991, 1 992a] revealthat the urban employment situation in the region basically deterioratedbecause of changes in the occupational structure of employment. The mainchanges in the occupational structure stemmed from a pronounced declinein the generation of jobs in large enterprises of the modern private sector.Combined with the diminished employment creation in the public sector,this implied a lessening of the capacity of the modern sector as a whole toabsorb the swelling labour supply by providing good quality jobs.
During the 1 980s the non-agricultural product expanded at an annualrate of 1 per cent, and employment in large-sized modern enterprisesincreased only by 0.6 per cent per year. As a result, the share of thislabour segment in non-agricultural employment'6 shrank from 44 per centin 1980 to 32 per cent in 1990 [PREALC, 1992aJ. The public sector,which assimilated employment at a high rate (4.5per cent annually) duringthe 1970s, in turn modified its behaviour — though not substantially — inthe 1980s, owing to policies affecting its size and the fiscal budget. Publicemployment growth thus decreased to 4 per cent per annum [PREALC,1991], but its share in non-agricultural employment stayed at around16 per cent during the period 1980-90. All in all, towards the end of thedecade the capacity of modern activities in large enterprises or institutionsto generate good jobs had diminished, as evidenced by the reduction intheir share of total non-agricultural employment from 60 per cent in 1980to 48 per cent in 1990. Though the unemployment rate rose sharply duringthe period of the external crisis, at the end of the decade it had settled ata level of 6.2 per cent which was only slightly above the historical one.This relatively neutral behaviour of unemployment during the 1980s indi-cates that re-employment occurred basically via an accelerated expansionof low-productivity, and low-income activities, which are typical of theurban informal sector (self-employed workers, unpaid family workers,those occupied in micro-enterprises) and increased demand in the domesticservice sector. All this reflects a deterioration in the quality of the jobsgenerated. According to ILO research [1992], employment in such
° This topic is analysed in ECLAC l991c}.
16 In this text the concept "non-agricultural" is used as a proxy for "urban'.

162 THE POVERTY AGENDA: TRENDS AND POLICY OPTIONS
activities grew at a notably faster rate (4 per cent annually) thannon-agricultural employment as a whole. Small enterprises (up to fiveemployed) showed outstanding dynamism, reaching an annual growth rateof 8.4 per cent during the decade. The share of these non-structured sec-tors in urban employment thus increased steadily throughout the decade,rising from 19.2 per cent in 1980 to 23.9 per cent in 1990 in the case ofthe informal sector and from 14.6 per cent to 22.1 per cent in the case ofsmall enterprises. The restructuring of employment induced by adjustmentmeant that towards the end of the 1 980s around half of employment wasgenerated by activities characterized by low productivity, meagre incomesand lack of protection for workers. If one looks at the behaviour of sec-toral labour demand, an intensification of the historical shift towards tertia-ry activities can be observed, sustained by the slowing-down in the growthof industrial employment and by the swift expansion of employment bothin the services required by the transition towards open market economiesand in informal activities.'7 Put differently, during 1 980s tertiary activitiesincreased, as did the heterogeneity of occupations generated in the servicesector. ILO research [1992] shows that while employment in the secondarysector reduced its share in the total from 25 per cent in 1980 to 23.7 percent in 1990, the tertiary sector increased its share significantly, from 46.7per cent to 53.9 per cent towards the end of the decade.
Increase in unemployment and changes in its composition
Contrary to experiences in the industrialized countries, the labourmarket of the region is historically liable to adjust through changes whichhave a bearing on the occupational structure rather than on the rate of openunemployment. The adaptation of labour to the requirements of adjustmentpolicies did, however, bring about a notable change in the behaviour ofopen unemployment. During the 1980s the rate of urban unemployment ineffect went up; in addition a modification in the historical profile of theunemployed took place. To begin with, according to PREALC [1993],during the recessionary adjustment of 1980-83 the urban unemploymentrate rose swiftly (to 8.7 per cent) before reaching a level which practicallydoubled the historical one (5 per cent). In this connection, it should benoted that although open unemployment was extremely sensitive in reactingto the slowdown in the levels of activity, the capacity of employment toincrease during the period of recovery remained relatively feeble. Thisbehavioural asymmetry is reflected in the fact that it took until the end of
' The "spurious tertiary drift', corned by Pinto [1984], became accentuated.

LABOUR MARKET, URBAN POVERTY AND ADJUSTMENT 163
the decade for the employment rate attain during the crisis to reach a levelnear the historical one. Furthermore, important shifts occurred in the mixurban unemployment. The unemployed historically consisted largely of thesecondary workforce, that is young people and women who were not headsof households; during the crisis they were displaced by male heads ofhouseholds with low skill levels [PREALC, 1991]. In spite of a decline inoverall unemployment since the crisis years, the unemployment rates forspecific groups such as women and young people remained high at theclose of the decade, at almost double the average overall unemploymentrate. Summing up, the transformation undergone by urban employment inresponse to adjustment policies translated into a significant increase in thedegree of total under-utilization of the urban labour force of the region.This manifested itself — depending on the country — either in a rise in theopen unemployment rate and/or in a larger proportion of occupations inlow-productivity, low-income activities.
B. Deterioration of labour incomes
The impact of the external crisis and of adjustment policies on thehighly heterogeneous labour market of the region had negative and unevenrepercussions on labour incomes. There was a general drop in wages, butit affected the living standards of wage earners differently depending onwhether they were employed in the public or private sector and whateconomic activities they were engaged in; the strength of the unionmovement and their access to collective bargaining also made a difference.All this led to an even further decline in real average incomes in theinformal sector, whose sales crucially hinge on the behaviour ofemployment and real wages in the modern sector [PREALC, 1991].
Adjustment of wages
In the region as a whole, a general deterioration in labour incomeswas registered during the 1980s [ILO, 1992]. This was basically due to thebehaviour of wages in the modern sector, where workers lacked theinstitutional mechanisms to uphold their real incomes in the distributivecontest with other productive agents in a highly inflationary and unstableenvironment. The weakening of the union movement and the dearth ofindexation mechanisms led to regressive wage readjustments. Hardest hitwere workers employed in the public sector and those on minimum wages.According to PREALC [1992a, 1993], the decrease in real wagesregistered during the decade reached 13.2 per cent in the case of manu-facturing industry, 15.2 per cent in construction and 27.9 per cent in

164 THE POVERTY AGENDA: TRENDS AND POLICY OPTIONS
agriculture.'8 In addition, as a result of fiscal adjustments, remunerationin the public sector dropped by 30 per cent in real terms [PREALC, 1991],while the policies of not adjusting minimum wages fully to inflationreduced the purchasing power of these by 33 per cent.
Contraction of real incomes in the urban in formal sector
The real incomes of people occupied in the informal sector contractedfirst because of the slow evolution of aggregate demand for its productsand services; this in turn was caused by the lack of dynamism in modernsector employment and the lowering of real wages. Second, given thecompetitive character of informal sector activities, it is assumed that theaverage income of those engaged in them tended to decrease as the numberof workers in the sector swelled as a result of the restructuring of urbanemployment. Taking into account both these tendencies, it is estimated[PREALC, 1991] that the decline in real income of those occupied in theurban informal sector reached 42 per cent during the decade. In somecountries this negative trend is corroborated by findings related to theevolution of incomes of unskilled self-employed workers, who constitutean important part of the urban informal sector [ECLAC, 1992a].
All things considered, three basic characteristics of wage adjustmentduring the decade can be noted. First, there was a general drop in realwages, most severe during the crisis. After this the idle capacity generatedcombined with an easing of external constraints permitted a slow recoveryin the levels of activity, employment and real wages in certain sectors. Inthis respect, it must be stressed that this wage improvement was not sharedby workers receiving minimum wages, whose purchasing power continueto decline even during the recovery period. Second, there was a change inprimary income distribution to the benefit of the entrepreneurial and rentiersectors. The fact that real wages contracted faster than real per capitaincome must be construed as a clear signal that, during the period of thecrisis, the global margin of profit rose in the majority of economicactivities. Third, the overall reduction in real wages did not affect allworkers in the same way, so increased income differentials were generated.These differentials affected both the public and the private sector. In thelatter differentials were determined according to branch of economicactivity and occupational group within the enterprise. Furthermore, thepassive minimum wage policy of not adjusting minimum wages fully to
This brought average agricultural wages down to the level of the agriculturalminimum wage.

LABOUR MARKET, URBAN P0 VERTYAND ADJUSTMENT 165
inflation disproportionately harmed the high proportion of workers whodepended on the evolution of minimum wages (young people, apprentices,domestic service workers, wage earners in small enterprises). Finally, itmust be kept in mind that by and large the group whose income levelsdeteriorated most seriously where those in the informal sector, which in thecourse of the decade provided employment for an average of almost 41 percent of urban workers.'9
C. The precarious character of labour relations
Another feature of the decade was the increasing precariousness ofwork or the "underground flexibilization" of labour [ILO, 1991, 1992;PREALC, 19921. The fundamental reason for this lies in changes in thelabour market structure, which led to a loss of quality in jobs. Thisresulted from the substitution of informal occupations for formalemployment, as well as the expansion of unemployment.
These precarious forms of employment in the informal sector areexcluded from the regulatory norms and social protection which safeguardmodern employment. Consequently they have led, directly or indirectly,to a progressive deterioration in working conditions in the past decade[Córdova, 19861. This precarious character of labour relations in the 1980smanifested itself in various ways: lessened labour stability; lack ofprotection by labour legislation covering, inter alia, minimum wages,working conditions and social security; increased reliance on homeworkers; and subcontracting by large enterprises, both at the individuallevel and through agencies [ILO, 1992].
The effect on poverty of this pervasive uncertainty in labour relationscan be perceived clearly through the impaired functioning of the labourmarket. In the first place, the expansion of precarious jobs led to very lowwages. Second, for workers without protection this meant longer workinghours, high-risk work and the lack of organizations set up to defend theirinterests. Third, the precariousness of working conditions began spreadingfrom the informal sector to large enterprises, where the quality of jobs alsodeclined in consequence. In short the global change undergone by theemployment structure in the 1980s greatly heightened the lack of socialprotection of workers.
' Thisbreaks down as an average incidence of 22 per cent of total urban employmentfor self-employed workers, 12 per cent for workers in micro-enterprises, and 7 per cent fordomestic service workers. See PREALC, 1991.

166 THE POVERTY AGENDA: TRENDS AND POLICY OPTIONS
3. Cuts in social expenditure
During the 1980s, the countries of the region had to resort to diversefiscal policy strategies. As a result of these, the burden of economic adjust-ment fell to a large extent on the social expenditure of the public sector.
From the PREALC analysis of the behaviour of social expenditureduring the past decade, it can be inferred that we are dealing here with avariable that is relevant to redistributive economic policy, considering thatthe outlays on public sector social expenditure represented a significantproportion of GDP in the majority of countries under study.2° In morethan half of these (Costa Rica, Uruguay, Argentina and Chile) the level ofsocial expenditure fluctuated between 10 per cent and 18 per cent of GDPduring the years in question. Considering the advances attained by thesecountries in tenns of social development, the range of percentagesmentioned could serve as a yardstick as to the minimum amounts thatshould be allotted to social spending if public action is to be effective fromthe redistributive point of view. The PREALC study further concludes thatin most of the countries analysed per capita social expenditure decreasedby around 30 per cent in the course of the decade as a result of fiscaladjustments 21
In appraising the effects on poverty of this contraction, it must beremembered that the poverty line approach regards only some componentsof social expenditure as contributing to household income. These are socialsecurity and transfers which, together, represent around 30 per cent of themonetary income of poor urban families.
The first point to stress here is that, according to available figures, inthe majority of countries per capita monetary social expenditure behavedin the opposite way to overall social expenditure in that the level ofspending was maintained, or even increased, during the decade.22
Second, even though monetary social expenditure increased in manycases, the effect on equity remains questionable. In most countries of theregion the lion's share of these outlays (85 per cent) covers social securitybenefits whereas the remainder (15 per cent) goes towards subsidies and
20 The analysis mentioned includes Argentina, Bolivia, Costa Rica, Colombia, Chile,Ecuador, Guatemala, Mexico and Uruguay [Infante & Revoredo, 1993].
21 The exceptions were Colombia and Chile, where per capita social expenditure roseby 15 per cent in real terms between 1980 and 1990.
22 Reference is made here to Bolivia, Brazil, Colombia, Chile and Mexico. InArgentina, on the other hand, the contraction in monetary social spending surpassed thatof overall social spending.

LABOUR MARKET, URBAN POVERTY AND ADJUSTMENT 167
direct transfers. While the former have a generally acknowledgedregressive effect, given that they mirror the inequality of factor incomedistribution (work, capital and rents), the latter contribute to achievinggreater distributive progressiveness by narrowing the income gap of poorand indigent households.
Third, it is worth pointing out that in some countries of the region thecontraction of social expenditure, apart from contributing to the fiscaladjustment, went hand in hand with improved targeting on the mostdeprived groups. Although this partially compensated the poor for theirlosses of income, this was to a large extent achieved by curtailing thepublic resources destined for medium-income groups.
In sum, despite the efforts made by some countries to improve thefocusing of public resources, monetary social expenditure did not reallysucceed in compensating for the income losses suffered by households asa result of deterioration in the labour market. However, though this com-ponent of social spending did not play a major role in combating poverty,it was useful in alleviating its extreme manifestations in indigenthouseholds.
In addition to its monetary component, social expenditure includesnon-monetary items, such as education, health and housing, whosemagnitude is such that its influence on the household well-being of thepoorer groups must be re-examined.23 In this connection, an alternativeapproach to measuring incomes might be suggested which takes intoaccount the total resources available to households. The outcome wouldthen correspond to the effective income perceived, including resourcesproceeding from the labour and capital market as well as the aggregate ofall components of social expenditure.
On the basis of this approach it is feasible to elaborate a method ofassessing the joint impact of public policies on the level of effectivewell-being of poor and indigent households 24 Applying this methodology,
23 To appreciate fully the importance of both aggregates, it should be noted that whiletotal social expenditure represented between 10 per cent and 18 per cent of GDP during the1 980s, outlays on education, health and housing represented an amount equivalent to around6 per cent GDP. Furthermore, it should be borne in mind that the share in GDP of familyincomes in poor sectors is around 8 per cent. Thus, if non-monetary social expenditure isdistributed proportionally, the poor sectors (first two quintiles) should receive resourcesequivalent to 2.4 per cent of the GDP, which translates into a 30 per cent increase inmonetary family incomes.
24 In fact, the method mentioned was developed in a joint effort by PREALC and theMinistry of Planning and Cooperation of Chile to analyse the distributive impact of publicpolicies in that country [MIDEPLAN, 1992a}.

168 THE POVERTY AGENDA: TRENDS AND POLICY OPTIONS
based on the concept of effective household income, could also provide avaluable supportive instrument for the formulation of coordinated policiesoriented towards the labour market and social expenditure. This could helpimprove the distributive efficiency of public action against poverty.
4. The response of poor groups: Family survival strategiesand community-based organizations
This section refers to the initiatives undertaken by poor groups in theface of increasing deterioration in their living standards. These initiativeswere aimed at developing survival strategies and community-basedorganizations, which in practice came to constitute part of an informalnetwork of social protection. These endeavours sustained themselves thanksto the organizational and administrative capacities of the people involvedand were buttressed by the solidarity, at both the household and thecommunity level, displayed by these vulnerable sectors.
To understand the nature and development of survival strategies it isnecessary to return to the topic of the impact of adjustment policies, andspecifically to their effect on households in the most deprived sectors.There is evidence that these policies had a different impact on differenthousehold members, notably worsening the human development opportuni-ties of children and women, who are traditionally considered the most vul-nerable group in this context [Moser et al., 1993]. The unequal distributionof adjustment costs within households arises as a consequence of certaininequitable aspects of the socio-economic environment, in which the statusof household members tends to be determined according to their age andgender.
In these conditions, members of poor households developed diversesurvival strategies in which women acted as "shock absorbers" against thehardships to which these families were exposed [ibid.]. It is not surprising,therefore, that women's labour market position in the 1980s was characte-rized by such factors as: an abrupt rise in the female participation rate,especially in indigent households; precarious employment, predominantlyin informal activities with low levels of productivity and low incomes; ahigh unemployment rate. In some cases the unemployment rate for poorwomen greatly exceeded the overall average rate as well as that fornon-poor groups in urban areas.
25 In 1990 the unemployment rates for indigent and poor non-indigent women in Chilereached 18 and 8%, respectively. At that time, the average unemployment rate for thecountry was 6% while that for non-poor sectors did not exceed 3% [MIDEPLAN, 1992b].

LABOUR MARKET, URBAN POVERTY AND ADJUSTMENT 169
The premature entry into the labour market of young people and chil-dren likewise reflects the imperatives imposed by family survival strategiesamong the poorest groups. In practice, young people either found jobs cha-racterized by low productivity, low incomes and scant prospects of advan-cement or they were unemployed.26 Use of child labour, which tended toexpand in the measure that poverty and indigence grew, continued to be animportant survival strategy to which some deprived households had toresort. PREALC studies on the labour situation of children in CentralAmerican countries towards the end of the 1980s27 find that in 22 per centof poor households children were working. In São Paulo, Brazil, a similarpercentage (23 per cent) was found among deprived groups [SEADE,1992]. In spite of the exceedingly precarious and unprotected labourmarket position of children engaged in informal activities, domestic serviceand work in the streets, the studies mentioned reveal that their contributionto monetary household income was appreciable, especially among indigenturban households 28
Experiences in Latin America indicate that more favourable results canbe achieved when poor groups decide to act unitedly through solidaritynetworks and community-based organizations, rather than poor familieshaving to rely for survival on the individual efforts of their members.
In practice, collective actions were mainly oriented towards the impro-vement of families' well-being in the face of deterioration in the labourmarket and curtailments in social expenditure. Initiatives include the settingup of community organizations for food processing, child care centres,self-help house building, family credit schemes, and wholesale provisionmarkets in urban communities to counterbalance the rise in food prices. Itis foreseeable that such organizational resources will continue to play animportant role in sustaining the effective consumption level of poorhouseholds, particularly if ongoing adjustment processes imply increasingtransfers of resources —especially in the area of service provision — fromthe public to the private sector.
At the same time, we must reflect on how these initiatives reallyaffected the living standards and human development of poor groups. Itcannot be denied that the endeavours at community organization had
26According to data from PREALC [1992b], the unemployment rate of young people
from poor households (33 per cent) was over five times the national average in Chile, whilein Costa Rica the 17 per cent rate was triple the national average.
27 For further details on the subject, see MartInez [19921.28 In effect, this contribution to household income reached 20 per cent in the Central
American countries, rising to 30 per cent in the case of São Paulo, Brazil.

170 THE POVERTY AGENDA: TRENDS AND POLICY OPTIONS
positive aspects, in so far as they impelled individuals to take action andto improve their access to targeted social expenditure resources. But thereare two sides to the issue, and the survival strategies also had a negativeimpact on the living conditions of deprived families. Though admittedlythey partially compensated for the income shortfall in households in theshort term, they adversely affected the behaviour of basic indicators ofhuman development (infant mortality, school attendance, life expectancy)in the medium term. This would seem to indicate that, all thingsconsidered, the survival strategies tended to strengthen the intergenerationalmechanisms of poverty transmission.
ilL Final considerations: New challenges for labourmarket policies oriented towards reducing poverty
This final section includes some suggestions as to how labour marketpolicies can contribute to poverty alleviation in the present decade. It mustbe kept in mind that both the initial conditions and the structural contextwhich generated the poverty problem have changed substantially as a resultof the adjustment processes effected in Latin America and the Caribbeanin the 1 980s. This introduces new challenges for those formulating labourmarket policies, which will have to overcome greater obstacles than everif they are to reduce poverty effectively in the immediate future.29
At present poverty, besides being more widespread, has acquired newforms associated with the characteristics of individuals and the growth ofurban areas. The increase in poverty recorded in the 1 980s affected newsocial groups, the "new poor" as they are called. But poverty also intensi-fied among already poor groups; it made certain family members, such aswomen, young people and children, more vulnerable, and it concentratedin the urban areas of the region. To overcome such a distributive imba-lance would require very considerable resources, though the magnitude ofthese varies depending on the approach used. On one hand, using thepoverty line approach it is estimated that at present a permanent transferof 4.6 per cent of GDP would be required to close the aggregate incomegap of poor sectors. On the other hand, according to the "social debt"concept developed by PREALC at the beginning of the 1 990s, resourcesequivalent to 27 per cent of GDP would be needed to eradicate structuralurban poverty through investment in human capital and the implementation
29 This topic has been analysed in depth by Tokman [1991].

LABOUR MARKET, URBAN POVERTY AND ADJUSTMENT 171
of policies generating productive jobs with adequate pay.3° These verylarge amounts give an idea of the kind of challenge inherent in theformulation of labour market policies which efficiently contribute to thealleviation of poverty.
As far as the changes in the structural context are concerned, it mustbe emphasized that the implementation of stabilization and adjustmentpolicies in the face of the foreign debt crisis, as well as the adoption ofstrategies for transforming production in response to the call for integrationinto the world economy, brought about — and continue to bring about —major changes in the production and labour structures in most countries ofthe region. The present structural context, implying as it does importantmodifications in the rules determining macro-economic and labour marketfunctions, thus imposes new conditions on the processes of generatingemployment and incomes for workers. Hence, those formulating policiesaimed at alleviating poverty during the 1990s must come to terms with thetask of diminishing distributive imbalances even more serious than thoseof the recent past, and moreover accomplish this objective in the newenvironment dictated by the economic transformation.3'
The work done by PREALC on the issue of paying the social debt inLatin America may possibly be considered a first step in the search foroptions to minimize the social costs entailed by the adjustment process andthe productive transformation (see PREALC [1988] and Infante [1993]).Highlighted in what follows are certain points derived from those analyses,chosen for their relevance to the formulation of policies oriented towardsovercoming present-day poverty.
One point relates to the need of an analytical framework which allowsthe issue of productive transformation with equity to be reviewed. Thisimplies the elaboration of specific criteria to assess the social efficiencyattained during the different stages of the transformation process.Incorporating the equity criterion in studies on the social debt requires thatadjustment costs be absorbed proportionally by non-poor groups. Theexplicit distributive objective of this criterion is thus to prevent thecondition of poor groups from deteriorating further, especially during therecessionary phase that precedes productive transformation.
30 For further details, see Infante [1993], and the comments contained in section 1 ofthis study.
31 The most recent contributions of international organizations to these topical issuescan be found in ECLAC [1992a]; UNICEF [1992]; IDB/UNDP [1993]; World Bank[1993]; ILO [1993] and United Nations [1993].

172 THEPOVERTY AGENDA: TRENDS AND POLICY OPTIONS
Another point is linked to the development of methodologies which
permit the distributive impact of policies to be measured and their relative
efficiency in countering poverty evaluated. In this connection, a method
was devised for quantifying the social cost impliedby adjustment in terms
of deterioration in the labour market, changes in primary income distribu-
tion, and the resulting effects on poverty and on the living standards ofmedium-income groups [Infante & Tokman, 1992]. Furthermore, to
appraise the effect of public action on the well-being of the different social
sectors, a methodology was designed to assess the distributive impact ofsuch action. This made it possible to provide the necessary information to
anticipate the outcomes of macro-economic policies and policies affecting
the labour market, social expenditure and poverty alleviation, while simul-
taneously evaluating the distributive effectiveness of the differentinstruments used 32
A final point concerns the incorporation of the main lessons learned
from the ekperiences of the countries of the region during the 1980s into
the formulation of policies aimed at diminishing poverty through the
generation of employment and incomes. In this regard, it is worthunderlining the importance of participation by the principal social partners
in the design of more adequate policies to attenuate the costs of adjustment.
By way of example, the PREALC studies on the social debt wereconducted jointly with trade union representatives, entrepreneurialassociations, governmental authorities and academics. In what follows three
policy areas are outlined which should be considered core issues in the task
of reducing poverty.The first of these concerns the recovery of sustained growth and the
quality of the jobs generated. The knowledge gained during the 1980s
indicates that in order to eradicate structural poverty and improve incomedistribution it no longer suffices to create more jobs: dueattention must be
paid to the quality of the job created. This poses questions which need to
be resolved as to the degree of participation of publicand private sectors
in the creation of employment and income. These questionsrelate to the
productive spheres and the economic activities generating the jobs; theyalso concern the institutional framework of labour.
The second policy area is related to the issue of wages. Reviewing the
experiences of some countries (Colombia and Costa Rica, for instance), itcan be inferred that the use of a more active minimum wage policy could
32 Further information on this subject can be found in the study carried out by PREALC
in conjunction with the Ministry of Planning and Cooperation ofChile [MIDEPLAN,
1992a].

LABOUR MARKEr, URBAN POVERTY AND ADJUSTMENT 173
prove doubly advantageous, namely as a "signal" to the labour market andas an element of the social safety net, having both a direct bearing on theremuneration of less qualified workers and an indirect influence on theincomes of those occupied in the informal sector. Such an active minimumwage policy, while not jeopardizing stabilization goals, would allow lessqualified, low-income workers to maintain their standards of living.
The third policy area is associated with social expenditure. Judgingfrom successful experiences of economic recovery and social debtreduction (Bolivia, Costa Rica, Colombia and Chile), it can be affirmedthat social spending, as a proportion of GDP, must stay permanently atrelatively high levels if it is to fulfil its role of compensating for the lossesin income suffered by the most deprived social groups. This inevitablyleads to the question of how to finance these outlays in a framework ofstrict macro-economic balance and of how to administer the expenditureefficiently. The answer to the former question lies in raising the tax loadand/or reallocating social spending as well as the possibility of financingthe increased social expenditure by privatizing certain public enterprises.The latter question seems to be more linked to the issue of adequate distri-bution of social expenditure among the different social sectors and theresulting impact on household incomes, especially among poor and middle-income groups. In this context, it is worth highlighting the importance ofinstruments such as Social Investment Funds (SIF).33 Apart from notexerting pressures on the fiscal balance, these are effective in providingsocial infrastructure and services to the most deprived sectors of thepopulation. Moreover, the SIFs are deemed to have a secondary effect onemployment and income levels, particularly those of indigent households.
Finally, attention must be drawn to the role social expenditure couldassume in the area of investment in human capital. If good jobs aregenerated, highly skilled and qualified wokers will be required to do them.It seems obvious that the quality of education to which the different socialgroups have access at present is likely to determine their possibilities ofattaining a solid labour integration and of thus participating equitably in thefruits of future growth.
° See Ch. 5 by Lustig for a discussion on SIFs.

774 THE POVERTY AGENDA: TRENDS AND POLICY OPTIONS
Bibliographical references
COrdova, E. 1986 "From full-time wage employment to atypical employment: A majorshift in the evolution of labour relations" in International Labour Review (Geneva,
ILO), Nov.-Dec..
ECLAC. 1990a. Magnitud de Ia pobreza en America Latina en los años 80. Santiago,Economic Commission for Latin America and the Caribbean.
—. 1990b. Changing production patterns with social equity: The prime task of Latin
American and Caribbean developing in the 90s. Santiago, ECLAC.
—. 1991a. Statistical yearbook for Latin America and the Caribbean. Santiago, ECLAC.
—. 1991b. Economic survey of Latin America and the Caribbean, Vol. 1. Santiago,
ECLAC.
—. 1991c. Education and knowledge: Basic pillars of changing production patterns with
social equity. Santiago, ECLAC.
—. 1992a. Social equity and changing production patterns: An integrated approach.Santiago, ECLAC.
—. 1992b. El perfil de Ia pobreza en America Latina a comienzos de los años 90.
Document presented at the Third Conference on Poverty in Latin America. Santiago,
ECLAC.
IDB/UNDP. 1993. Social reform and poverty: Towards an integrated development agenda.
Washington, DC, International Development Bank/United Nations for Development
Programme (preliminary version).
ILO. 1991. Employment policies in the economic restructuring of Latin America and the
Caribbean. Document presented at the tripartite symposium on "Structural adjust-ment, employment and training in Latin America and the Caribbean, Caracas, 12-16
August, WEP 1-4-07. Geneva, International Labour Office.
—. 1992. Report of the Director-General. Document presented at theThirteenth Conference
of American States Members of the ILO, Caracas, Sep.-Oct. Geneva, ILO.
—. 1993. The framework of ILO action against poverty. Document prepared by anILOworking group for presentation at a symposium on "Poverty: New approaches to
analysis and policy", organised by the International Institute for Labour Studies
(IILS/ILO) in Geneva, 22-24 November 1993.
—. Infante, R. (ed.). 1993. Deuda social. Desaflo de Ia equidad. Santiago, PREALC.
—; Revoredo, C. 1993. "Gasto social y nivel de ingresos de las familias pobres", inInfante, R. (ed.): Deuda social. Desaflo de Ia equidad. Santiago, PREALC.
—; Tokman, V.E. 1992. Monitoring poverty and employment trends: An index for social
debt. Series Working Papers/365. Santiago, PREALC.
Martinez, D. 1992. El trabajo de los menores de edad en Centroamérica. Panama,
PREALC.

LABOUR MARKET, URBAN POVERTY AND ADJUSTMENT 175
MIDEPLAN. 1992a. impacto distributivo de Ia poiltica económica y social en elperlodo1990-1991: Antecedentes y resultados. Santiago, Ministry of Planning and Coopera-tion (preliminary version).
—. 1992b. Proyecto Chile. Integraciónproductjva de laspersonas. Santiago, MIDEPLAN.
Moser, C.; Herbert, A; Makomen, R. 1993. Urban poverty in the context of structuraladjustment. Recent evidences and policy responses. TWURD, The World BankWorking Paper. Washington, DC, The World Bank).
PREALC. 1988. Meeting the social debt. Santiago, PREALC.
—. 1991. Empleo y equidad: El desafto de los 90. Santiago, PREALC.
—. 1992a. Empleo y transformaciOn productiva en America Latina y el Caribe. SeriesWorking Papers/369. Santiago, PREALC.
—. 1992b. Newsletter (Santiago, PREALC), No. 30, October.
1993. America Latina. Indicadores de empleo y salarios. Santiago, PREALC.
Pinto, A. 1984. "Metropolizacion y terciarizaciOn: Malformaciones estructuralesen eldesarrollo latinoamericano", in Revista de Ia CEPAL (Santiago, CEPAL), Dec.
Pollack, M. 1992. "Los grupos vulnerables del mercado de trabajo. Los casos de Chile yParaguay", in Lopez, C. et al. (eds.): Género y mercado de trabajo en AmericaLatina. Santiago, PREALC.
Rodgers, G. 1985. Some issues in labour market research. Geneva, ILO.
Rodgers, G. (ed.). 1989. Urban poverty and the labour market. Geneva, ILO.
SEADE. 1992. Pesquisa de condiçoes de vida na regiao metropolitana de São Paulo. SãoPaulo, Fundacao Sistema Estadual de Analise de Dados).
Tokman, V. E. 1991. "Pobreza y homogeneizacion social: Tareas para los 90", inPensamiento iberoamericano. Madrid, Instituto de CooperaciOn Iberoamericana.
UNICEF. 1992. Los niños de las Americas. Santafe de Bogota, United Nations Children'sFund.
United Nations. 1993. World Summit for Social Development, including the roleof theUnited Nations system in promoting social development. Report of the Secretary-General. New York, Economic and Social Council (advance unedited version).
World Bank. 1993. Implementing the World Bank's strategy to reduce poverty. Progressand challenges. Washington, DC, The World Bank.


8 Structural adjustment, povertyand macro-economic policy
Roiph van der Hoeven1
This chapter will discuss two related questions. The first question is:is structural adjustment causing poverty (or rather additionalpoverty, sincepoverty has not disappeared in any country in the world, especially not inadjusting countries)? And if structural adjustment is causing (additional)poverty, is the poverty caused by structural adjustment different in naturefrom normal poverty? The second question is: can macro-economic policybe used to reduce poverty? And if it can, under what conditions will it bepossible to reduce poverty?
Each of these questions would make a subject for at least a separatechapter. This chapter does not therefore attempt to be path-breaking butrather puts together some recent findings from relevant theoretical andempirical studies in order to contribute to the debate. Section I deals withthe question of whether structural adjustment is causing (additional)poverty and whether the nature of poverty caused by structural adjustmentis different from normal poverty. It begins with a fairly theoreticaldiscussion and then goes on to present some empirical evidence aboutthedevelopment of poverty in Latin America and sub-Saharan Africa, as it isin these two continents that the bulk of structural adjustment programmeshave been implemented.
Section II discusses the use of macro-economic policies for povertyalleviation. Three aspects are highlighted. First is the role of economicgrowth. Economic growth, at a pace faster than that of populationgrowth(or labour force growth), will necessarily reduce poverty if incomedistribution remains constant. We therefore discuss the effects ofmacro-economic policies on growth as well as some of the relevant policyinstruments. However, poverty can also be reduced if income inequality
International Labour Office, Geneva. The views expressed in this paper are those ofthe author and not necessarily those of the International Labour Office.

178 THE POVERTY AGENDA: TRENDS AND POLICY OPTIONS
decreases (theoretically even in the absence of growth, although in practicethis has rarely occurred). In Section 11.2, we discuss the effectof macro-
economic policies on income distribution. We also distinguish between
primary distribution, secondary distribution and tertiary distribution inorder to highlight the effects of government transfer programmes. Finally,we look at the issue of the possible trade-offbetween growth and incomedistribution policies, and whether macro-economic policies canbe appliedto stimulate growth and reduce income distributionsimultaneously.
L Does structural adjustment havean adverse effect on poverty?
1. Structural adjustment, stabilization and poverty
The question whether adjustment is causing poverty cannot beanswered in a straightforward manner. It is difficult to define poverty but,for our purposes, it suffices to define it as the percentage of households
with an average income below a certain poverty threshold [Fields, 1993].Although there are objections to such a simple definition [Foster et al.,1984; Kanbur, 19871, this definition is much more clear-cut than anyexisting definition of adjustment. What constitutes an adjustment policy?One easy answer is simply to define adjustment policies as the set ofpolicies of those countries which have accepted one or more structuraladjustment loans from the World Bank since this term was introduced.
Such a definition would, however, leave out a possible set of adjustmentpolicies applied by a country that adjusts so smoothly that it does not needexternal financing from the World Bank. But since most countries in the
developing world have needed World Bank financing, this objection is not
a strong one. Hence, a definition based upon the actual practice ofadjustment is acceptable and can be used in the following sections where
actual experiences are evaluated.For this purpose, we define structural adjustment policies as a set of
policies which combines short-term stabilization measures and longer-termadjustment measures; these can be applied sequentially or simultaneously
or they can overlap with each other.A set of stabilization policies will consist of the following elements:
(a) fiscal policies to reduce the public budget deficit;
(b) monetary policies to reduce the money supply either directly orthrough interest rate policy;

STRUCTURAL ADJUSTMENT, POVERTY AND MACRO-ECONOMIC POLICY 179
(c) wage and price policies to control inflation either in support of theabove policies (orthodox programmes) or partly replacing them(heterodox policies);
(d) exchange rate policies to reduce balance of payments deficits.
A set of adjustment policies will contain policies to make product andfactor markets operate more smoothly by removing "obstacles" such asprice controls and subsidies through a process of liberalization. Anotherimportant element is reform of trade policies with the aim of liberalizingtrade. Restructuring of the public sector and privatization of publiclyowned enterprises to reduce the fiscal deficit and to make enterprises moreprofitable will also form part of a set of adjustment policies.
It is clear from the above description that it is much more difficult todelineate a proper set of adjustment policies than it is to delineate thecomponents of a set of stabilization policies. One could ask, for example,to what extent a change of trade regime is part of "normal" policy and towhat extent it is part of an adjustment effort. It is here that the conceptstarts to become fuzzy. In order to evaluate the consequences of adjustmentpolicies on poverty, therefore, it is probably best to follow the principle of"Occam's razor" and to distinguish simply between those countries whichparticipate in an adjustment programme and those which do not, as we doin the next section.
Since stabilization policies are more narrowly defined and constitutea necessary element of all structural adjustment programmes, we shall lookfirst at the effects of stabilization policies on poverty.
The instruments of stabilization policy mostly applied are fiscalpolicies and monetary policies coupled with wage policies and devaluation.Fiscal and monetary policies that deflate the economy as part of astabilization programme reduce absorption in the economy, which lowersgrowth rates and may even result in a decline in national income. Thesimulation models applied by Moshin Khan of the IMF [Khan, 1990]suggest that such policies usually lead to reduced growth for one or twoyears. How do such deflationary policies affect poverty? If one assumesthat income distribution does not change, then deflation, per Se, increasespoverty. How much poverty increases depends not only on the amount ofdeflation but also on the parameters which determine the slope of theincome inequality function around the cut-off point for poverty. A firstapproximation is therefore that stabilization policies increase poverty.However, it is difficult to maintain the assumption that income distributionremains unchanged during a process of stabilization, since the very policyinstruments applied in the stabilization process change the parameters for
180 THEPOVERTYAGENDA: TRENDS AND POLICY OPTIONS
the distribution of different types of income: income before tax (wages,profit, rents), income after tax, and net incomes, which include theimputed benefits of public services (respectively, primary, secondary and
tertiary income distribution [Ndulu, 1992]).How stabilization policies affect income distribution depends not only
on the nature of the policies but also on the forces which drive incomeinequality, what Taylor [1988] calls the social matrix and Khan [1993]calls the interface between institutional organization and the policy regimeof the country applying stabilization policies. Based upon an overview thatforms part of a UN/WIDER set of studies of the stabilization experiencesin 17 countries in the mid- 1980s, Lance Taylor concludes:
These examples suggest that different economic groups will be affecteddifferentially by numerous factors: changes in relevant commodity prices, whether
from market developments or state intervention; movements in the volume ofoutput and its composition; asset revaluations and shifting rates of return. Each
group wields stronger or weaker defences against adversity. Workers may or maynot be able to achieve full indexation of their money wages or food-stampallotments against inflation. Recently, Indian agriculturalists have been able tomove the terms of trade in their favour by political influence overthe regulatoryprocess, and Tanzanians through parallel transactions as the government tried toforce prices well below market-clearing levels. In other circumstances — Turkey
and Sri Lanka — the state may hold considerable sway over the terms of trade.Inflation may force rentiers to accept negative real rates of return for at least atime. The balances of power always change, but strongly limit the actions awould-be stabilizer can take.
The moral is that getting into and out of economic stabilizations are notprocesses independent of major groups in the country, their political role, andinsertion in the economic system. On the whole, professional economists dealuneasily with these issues, and often carry through their analyses of economicclasses and their political roles ineptly. But such factors have been vital to thesuccesses and failures of many stabilizations "with a human face". This can onlybe realized on the basis of a serious analysis of the social matrix [Taylor, 1988].
Early analysis of the effects of stabilization policies pointed to anadverse effect on the poor which was at least equal to the deflationary pushand often greater [Cornia et al., 1987; van der Hoeven, 1987; PREALC,1985]. Singer's multiplier shock effect is quite illuminating in this respect[Singer, 1984]. Contraction of the economy has also frequently led to adecline in the share of wages in national income, as Pastor hasdemonstrated [Pastor, 1987].
Since then, the adverse effects of stabilization policies have becomemore or less accepted wisdom, as demonstrated by the opening paragraph

STRUCTURAL ADJUSTMENT, POVERTY AND MACRO-ECONOMIC POLICY 181
of Chapter 6 of the World Bank's World Development Report, 1990:
Many countries experienced macro-economic difficulties in the 1 980s as thedebt crisis and international recession brought structural weaknesses into the open.But when structural adjustment issues came to the fore, little attention was paid tothe effects on the poor. Macro-economic issues seemed more pressing, and manyexpected that there would be a rapid transition to new growth paths. As the decadecontinued, it became clear that macro-economic recovery and structural changewere slow in coming. Evidence of declines in incomes and cutbacks in socialservices began to mount. Many observers called attention to the situation, but itwas UNICEF that first brought the issues into the center of the debate on thedesign and effects of adjustment. By the end of the decade, the issue had becomeimportant for all agencies, and it is now reviewed in all adjustment programsfinanced by the World Bank. As UNICEF advocated, attention is focused both onhow adjustment policies affect the poor and on the specific measures that can betaken to cushion the short-term costs [World Bank, 19901.
More recently, some authors [Sahn, 1992] have argued that poorpeople do not take part in the formal economy and in particular do notmake much use of government services, and hence are less (either negati-vely or positively) affected by stabilization policies than non-poor groups,which benefit much more from public services. Hence stabilization poli-cies, particularly fiscal contraction, result in a more equal tertiary incomedistributions. These views are, however, questioned by many observers.In general it is accepted that the deflationary component of stabilizationpolicies results in increased poverty, whatever the mix of policies applied.However, the intensity depends both on the actual policies adopted and onthe initial conditions, as Kahn [1993] has recently demonstrated.
The stabilization package is not, however, expected to affect povertythrough the deflationary package alone but also through the switchingpackage — changes in the price ratio between tradeable and non-tradeableas a result of goods as a result of devaluation of the national currency.Here the key question is to what extent the poor produce or consumetradeables and non-tradeables. The theory is rather agnostic on this point.The application of the Salter-Swan type of analysis is now widespread[Sachs & Larrien, 1993; Demery & Addison, 1993] and does not need tobe repeated here. The difficulty lies in the interpretation of the theory inpractice. First, the definition of tradeable goods is not as clear as it maysound. Second, the production and consumptions patterns of the poorcannot as easily be mapped in terms of tradeables and non-tradeables assome would lead us to believe. The complication is well explained byJamal and Weeks [1993].

182 THEPOVERTY AGENDA: TRENDS AND POLICY OPTIONS
In short, the relationship between stabilization policies and povertydepends on the combined effects of fiscal policies (in general negative),monetary policies (usually negative), wage policies (usually negative) anddevaluation (negative or positive depending on the specific situation).Combining these effects, it can be safely argued that stabilization policiesusually increase poverty, at least in the short run.
The effect of adjustment policies on poverty is more difficult to judge.The effects on poverty of privatization, or of a shrinking in public sectoremployment, depend very much on whether, for example, dismissed civilservants belong to poor groups or not, whether they can find other jobs,and whether privatization will result in a decline in the tax burden for thepoor. Nor can the effect of deregulation be predicted in advance. Ifderegulation reduces rent-seeking by wealthy and influential groups andthis results in lower prices for products consumed by the poor, thenadjustment policies can contribute to a decline in poverty. However, ifderegulation results in the creation of natural monopolies, then the effectof deregulation on the poor may be negative. The effects of adjustmentpolicies on poverty therefore depend largely on the initial socio-economicsituation in the country undergoing adjustment, as well as on the type ofadjustment policies applied.
In the next two sections, we consider some empirical evidence abouthow poverty developed during the 1980s in two continents in which manycountries underwent a process of adjustment, namely Latin America andAfrica.
2. Adjustment and poverty in Latin America2
With few exceptions, all countries in Latin America appliedadjustment measures during the 1980s for various lengths of time. But theintensity of adjustment varied among countries. The World Bank hasapplied various criteria in assessing the effectiveness of the adjustmentpolicies. The 1990 Report on Adjustment Lending (RAL II) classifiescountries into early-intensive adjustment lending countries and otheradjustment lending countries, while the most recent 1992 Report onAdjustment Lending (RAL III) makes a distinction between intensiveadjustment lending and other adjustment lending countries.3 In both cases,
2 Part of this section draws on van der Hoeven & Stewart [1993].
One can question whether the difference in classification between 1990 (early-intensive) and 1992 (intensive) is a questions of semantics alone. The change in definitionin the last report may well be inspired by the fact that the notion of adjustment yielding

STRUCTURAL ADJUSTMENT, POVERTY AND MACRO-ECONOMIC POLICY 183
the remaining group is called "non-adjustment lending countries" .'To alarge extent, the definitions overlap in the two reports. All large countriesbelong to the group of adjustment lending countries. The group of otheror non-adjustment lending countries is dominated by small countries.
The Latin American region as a whole suffered a decline in per capitaincome in the 1980s. In some countries (Bolivia, Argentina, Guyana, Haiti,Nicaragua) the decline was almost 25 per cent, while other countries(Chile, Colombia, Barbados) showed no increase. Countries with hugepositive and negative variations can be found in the category of intensiveadjustment lending countries. Looking at the experience over the decadein more detail shows that developments over the first five years followeda more or less uniformly negative pattern for all countries. After 1985,more variation can be observed, with some countries continuing to dobadly while others improved. Several commentators have ascribed thisvariation to application of different macro- and micro-economic policies[Stewart, 1992a; ILO, 1992]. What has been the effect on poverty? Sinceincome from employment is the major source of income for ordinaryhouseholds in most Latin American countries, we will look briefly at thedevelopment of employment patterns and then relate this to the povertysituation.
A. Employment and wages
The last decade saw some important changes in the nature and statusof employment. The crisis manifested itself particularly in the early 1980s,when all countries in Latin America confronted an acute foreign exchangecrisis, largely owing to the debt situation. Subsequently, they experiencedsevere recession, in part because of the deflationary policies governmentswere forced to adopt.
In consequence, average urban unemployment in Latin America hadrisen to unprecedented levels of over 10 per cent by the mid-i 980s(Table 1). Furthermore, the share of industry in total employment decli-ned; this was not a manifestation of a post-industrial society, as in WesternEurope, but rather the result of industrial activities being severely hit bythe crisis of the mid-i 980s. The crisis in industry is confirmed by two
quick results (early adjustment lending countries should do better than late adjusters) hasmade way for an emphasis on intensity (countries who bite the bullet will do better).
Theoretically, this group should be divided into "non-adjustment lending countriesneeding adjustment" and "non-adjustment lending countries not needing adjustment" inorder to make a meaningful analysis [van der Hoeven, 1991].

184
Table 1: Employment, wages and poverty in Latin America, 1980-1990
Indicators 1 980 1985 1990 1991
Employment structure (%)Total employment 100.0 100.0 100.0
Agriculture 28.3 27.2 22.4
Industry 25.0 22.0 23.7
Services 46.7 50.8 53.9
Non-agricultural employment 100.0 100.0 100.0
Private sector employment 58.7 53.1 53.7
Large enterprises 44.1 36.5 31.6
Small enterprises 14.6 16.6 22.1
Public sector employment 15.7 16.6 15.5
Informal sector employment 25.6 30.4 30.8
Self-employment 19.2 22.6 23.9
Domestic service 6.4 7.8 6.9
UnemploymentTotal unemployment (rate) 5.2 6.0 4.5 4.5
Urban unemployment (rate) 6.7 10.1 8.1 8.5
Wages (1980= 100)Per capita GDP 100.0 92.0 91.1 91.9
Minimum wage 100.0 86.4 68.3 66.2
Industrial wage 100.0 93.1 85.3 —
Agricultural wage 100.0 87.2 73.5 —
Construction wage 100.0 85.3 88.7 —
Poverty* (%)Total poor households 35.0 37.0 37.0
Urban poor households 25.0 30.0 31.0
Notes: — = not available. *Data on poverty for 1980, 1984 and 1989.
Source: ILO [1992] based on PREALC data.
other trends. First, employment in large enterprises declined rapidly whileemployment in small enterprises almost doubled; this trend continuedthroughout the 1980s. Second, there was an increase in informal sectoremployment. This trend did not continue after the mid-1980s, when theshare of informal sector workers in non-agricultural employment remainedmore or less stationary.
The general crisis and the changing nature of employment alsoaffected wages. Here several trends are noticeable. All wages indicatorswere lower in 1990 than at the beginning of the decade (Table 1);furthermore, they declined faster than did per capita GDP. Until the mid-
STRUCTURAL ADJUSTMENT, POVERTY AND MACRO-ECONOMIC POLICY 185
1980s, the minimum wage, the construction wage (which is often taken asa proxy for unskilled wages) and the agricultural wage all declined at asimilar rate, whereas the industrial wage (which reflects higher skill levels)declined less, more or less in proportion to the decline in per capitaincome. After 1985 the picture changes. Both the minimum wage and theindustrial wage declined much faster. The construction wage in 1990 was,in effect, somewhat higher than in 1985. Per capita GDP in 1990 wasmore or less the same as in 1985. The relative recovery — or rather thehalting of the decline of the early 1980s — thus changed the system ofwage differentials: minimum wages and skilled wages became lower.Wages for unskilled workers remained stable.
When looking at the situation in more detail, one notices that in mostintensive adjustment lending countries the minimum wage droppedconsiderably, and at a faster rate, than the industrial wage, the exceptionsbeing Colombia and Costa Rica. In Costa Rica, the minimum wageincreased, while the industrial wage dropped (this was one of the majorfactors contributing to the rapid decline in poverty there). The otheradjustment lending countries and the other countries show the same patternof declining minimum wages, with the exception of Paraguay.
The major conclusion from the employment and wage trends is thatrecession and adjustment usually drive minimum wages down quickly.When special measures are taken, however, as in Costa Rica andColombia, this process is halted, even in recessionary periods. What effectthese changing wage trends have on poverty and deprivation is difficult tojudge. This depends very much whether the cut-off point for the povertyline is situated around a level of income which corresponds to a minimumwage or to an unskilled wage. The poverty figures (poor households as apercentage of the total population) rose considerably in the early 1980s butremained fairly stable in the second half of the decade. This indicates thatthe decline in minimum wages had already been picked up in the increasedincidence of poverty in the first half of the decade.
B. Income distribution and poverty
Income distribution in Latin America has always been more unequalthan in other regions of the world. A joint ILO/Worid Bank study onworld income distribution [van Ginneken & Park, 1984], based upon datafor the 1960s and 1970s, reports a Gini ratio of 0.52 for Latin Americancountries compared with 0.39 for non-Latin American developingcountries. The income share of the bottom 20 per cent in Latin Americawas less than half that of the other group (3.1 compared to 6.5 per cent).

186 THE POVERTY AGENDA: TRENDS AND POLICY OPTIONS
Table 2: Changes in rural and urban poverty, 1980-89
LAC region Total population Population in poverty Headcount index (%l
1980 All 345 400 000 91 400 000 26.5
Urban 227 400 000 38 200 000 16.8
Rural 118 000 000 53 200 000 45.1
1989 All 421 400 000 132 700 000 31.5
Urban 300 100 000 69 000 000 23.0
Rural 121 300 000 63 700 000 52.5
Notes: An adjusted per capita income of $60 per month has been used as the poverty cut-off point.
Source: Psacharopoulos [1992].
Some authors [Hirschman, 1981; Sachs, 19871 even argue that the frequentrecourse to stabilization and adjustment policies which, for most LatinAmerican countries goes back much further than the 1980s and is in effecta consequence of deep-seated internal conflict about the distribution ofnational income which fuels inflation time after time.
A recent World Bank study [Psacharopoulos et al., 1992] observesthat in most Latin American countries inequality has not declined and mayeven have increased. Continuing unequal income distribution combinedwith a decline or stagnation in per capita income in many countries leadsinevitably to an increase in poverty in the region, as has indeed beenhappening. In Latin America, the total number of people in povertyincreased by 45 per cent over the last decade (Table 2). For every newperson added to the population, the chance of being poor was well over50
per cent.The increase in poverty in the 1980s was so large that the percentage
of poor in the population increased in both urban and rural areas. Since theurban population has swelled, poverty in Latin America has become muchmore of an urban problem than before. The majority of poor people livein urban areas. Although a large proportion of Latin America's poor livein Brazil, the trends reported there are also to be found in other countries.
If poverty in Latin America is increasing because of persistent incomeinequality and low or stagnant levels of production, it may be asked towhat extent the low levels of production and persistent income inequalityare the consequences of adjustment policies. Prima facie, one could arguethat as so many countries in Latin America adopted adjustment policies,and as these policies were mostly implemented for a decade, adjustmentpolicies can be held accountable for the increase in poverty and deteriora-tion in living conditions. Others argue, however, that the adjustment

STRUCTURAL ADJUSTMENT, POVERTY AND MA CR0-ECONOMIC POLICY 187
policies prevented a further, fall in production and incomes, and thatwithout them the situation would have been much worse and poverty evenmore widespread. This often-held debate (on the so-called counter-factual)is difficult to settle; it can at best be conducted on the basis of carefullyundertaken country studies which involve the use of (general equilibrium)models to generate a hypothetical course of development withoutadjustment. However, as Morrison [1991] indicates, these methods havetheir drawbacks. Robinson [1991], in discussing a set of generalequilibrium models produced for the Organisation for Economic Co-operation and Development (OECD) to evaluate adjustment experiences,argues that these models are useful for increasing our understanding butthat, because of the assumptions regarding parameter values and reactioncoefficients, it is improper to use them for detailed policy advice. Bearingthis in mind, we can still say, on the basis of analysis over time, that theexcessive economic contraction in the early 1 980s caused unnecessarydecline for most Latin American countries — a view confirmed bySummers and Pritchet [1993] and by a recent publication of Garcia [1993].
In order to throw some more light on this issue, it may be worthlooking at some cases in more detail. Based upon World Bank data for the1980s, income distribution, as measured by the Gini ratio, worsened inArgentina, Bolivia, Brazil, Guatemala, Honduras, Panama, Peru andVenezuela,5 while it improved in Colombia, Costa Rica, Paraguay andUruguay. We have compared these trends in poverty with trends in wages,employment and per capita GDP (Table 3).
What is striking is the strong relation between minimum wages andincome equality. In all but one case, where income inequality had declinedby the end of the decade, minimum wages were higher in absolute termsthan at the beginning of the decade and had often increased more than theaverage wage. Furthermore, this improvement in the minimum wage doesnot seem to have affected employment negatively.
C. Did switching occur in Latin America?
If one of the principal aims of structural adjustment is to favourtradeable goods, has this had an effect on the poor in Latin America? Wehave seen that, in most cases, poverty increased during the adjustmentprocess. However, the poor are not affected by incomes and prices alonebut also by factor mobility, while a real depreciation of the currency will
For some of the countries, measures of urban inequality are used because of the lackof national figures.

188 THE POVERTY AGENDA: TRENDS AND POLICY OPTIONS
Table 3: Changes in income inequality, employment and minimum wagesover the decade 1980-1990
Country Income equality Minimum wages GDP per capita Urban employmentI— = increase in(— increased) I— = lower) I — =
unemployment)less) I + = higher) 1+ = higher)= decline in
unemployment)Absolute Compared toaverage wage
ArgentinaBolivia — n.a.
BrazilColombia + + + +CostaRica + + + +Guatemala + n.a.Honduras — — n.a. — +Panama — 0 n.a. —
Paraguay + — + 0PeruUruguay + — — 0
Venezuela — — n.a. —
Notes: n.a. = not available; 0 = no change.
Source: van der Hoeven & Stewart [1993] based on ILO [1992] and Psacharopoulos et a!. [1992].
induce workers to move towards export sectors. The poor will benefit ifemployment is created in the labour-intensive export sectors. To whatextent did this happen? Given their importance, it is astonishing to find solittle analysis of labour intensity and exports. As a proxy, one can look atexports of products which are typically produced in a labour-intensivemanner, such as textiles and footwear. Table 4 gives the share of textilesand clothing in total exports; this shows that in a few countries their shareincreased considerably (Costa Rica, Dominican Republic, Guatemala,Honduras, Jamaica and Panama), which may have been beneficial forpoorer people but in most cases their share remained the same. There was,however, a large increase in the export of footwear, with Latin Americaincreasing its world market share from 0.9 per cent in 1970 to 4.4 per centin 1980 and 7.5 per cent in 1990.
There is therefore some evidence that adjustment policies have led toan expansion of opportunities for poorer workers in export industries, butthis must be offset against declining growth in public sector employmentand in employment elsewhere in industry.

STRUCTUIAL ADJUSTMENT, POVERTY AND MACRO-ECONOMIC POLICY 189
Table 4: Textiles and clothing as % of total exports in Latin America, 1980-89
1980 1989
Argentina 2 3Bolivia n.a. 1Brazil 4 3Chile 0 1Colombia 6 6Costa Rica 5 18
Dominican Republic 0 35Ecuador 1 0El Salvador 13 11
Guatemala 6 11Honduras 2 7Jamaica 1 13Mexico 3 2Panama 3 7Paraguay 0 1
Peru 6 9Trinidad and Tobago 0 0Venezuela 0 0
Sources: World Development Report [1983, 1991, 1993].
3. Adjustment and poverty in sub-Saharan Africa
Although there is controversy about how effective adjustmentprogrammes in sub-Saharan Africa have been (for a discussion, see van derHoeven & van der Kraaij [1994]), all parties to the debate acknowledgethat per capita income in the region declined during the 1980s. This wasnot a mere statistical artefact caused by the decline in Nigerian GDP(which accounts for 40-45 per cent of sub-Saharan GDP); rather, it was amajor explanatory factor behind the absolute and relative increase inpoverty in Africa.
Many adjustment programmes were implemented in sub-SaharanAfrica during the 1980s but the data suggest that adjustment policiesperformed less satisfactorily there than in other groups of countries (suchas manufacturing exporting countries) (see also Elbadawi et al., [1992]).In the following paragraphs, we briefly sketch the adjustment programmesand their effects on incomes.6
6 The following paragraphs draw partly on Chapter 1 (by E. Jespersen) in Cornia et al.[1992].

190 THE POVERTY AGENDA: TRENDS AND POLICY OPTIONS
Broadly speaking, stabilization policies in sub-Saharan Africa in the1980s achieved positive but modest results in tenns of reducing the currentaccount deficit. This occurred despite large real currency devaluations,substantial cuts in public expenditure and credit ceilings, and theintroduction of agricultural support prices. Data for sub-Saharan Africa,including both "adjustment" and the few "non-adjustment" countries, showthat in 1989 the regional current account deficit was $7.8 billion, asopposed to $9.6 billion and $8.3 billion recorded in 1981 and 1982,respectively. In 1988, however, the regional budget deficit relative to GDP(6.9 per cent) was as large as that in 1981-82. Meanwhile, the averageinflation rate in the region hovered around 21 per cent throughout the1982-89 period, thus showing little change from the average rate of 20.8per cent recorded over the 1972-81 period [IMF, 1989a, 1990a].Stabilization performance varied from country to country, of course. Amore detailed analysis shows that, of the 24 countries which adoptedadjustment programmes in the early to mid- 1980s, only six managedsimultaneously to lower deficits relative to GDP both in the current accountbalance and in the government budget and to reduce the inflation rate.While 12 other countries met at least two of these three objectives, macro-economic imbalances in the six remaining countries were as severe at theend of the 1980s as they had been before adjustment efforts began. Inseven of the 18 countries which showed some progress towardsstabilization, the current account deficit in 1987-88 was still in excess of10 per cent of GDP.
With few exceptions, stabilization was accompanied by sharp declinesin GDP growth, investment and human capital development. Of the 18countries which managed some degree of stabilization of their economiesin the 1980s, only five recorded positive growth in per capita GDP. In allothers, macro-economic stabilization was achieved at the expense ofgrowth. The belt-tightening undertaken by most African countries wouldperhaps have been acceptable if adjustment had triggered the desiredchanges in the economic structure and eventually led to expansion of foodproduction, manufacturing activities and non-traditional exports. However,this did not occur, despite profound reforms involving privatization,liberalization of prices and foreign trade, and mobilization of externalresources. Indeed, contrary to claims that the programmes supported by theInternational Monetary Fund (IMF) and the World Bank generated slightlybetter results in countries with "strong" reform programmes, the availableevidence indicates that by the late 1980s, with few exceptions, structuralconditions had not improved in the 24 countries which initiated adjustmentprogrammes in the 1980s.

STRUCTURAL ADJUSTMENT, POVERTY AND MACRO-ECONOMIC POLICY 191
GDP growth averaged 2.1 per cent per year for sub-Saharan Africaas a whole during the 1980s. Given an average population growth of 3.2per cent, average per capita GDP dropped by 1.1 per cent per year duringthe decade (Table 5). Some temporary recovery occurred in the mid-1980spartly because of more favourable weather conditions, improved netfinancial flows to the region and, more debatably, the impact of adjustmentprogrammes. Towards the end of the decade, however, the GDP growthrate dropped once more. While not all countries recorded negative growthin per capita GDP, 21 countries, representing 81 per cent of the populationof the region, were worse off in terms of average per capita GDP at theend of the decade than at the beginning.
A. Employment and incomes
Despite the focus on industrialization in the 1960s and 1970s, formalsector wage employment accounted for less than 10 per cent of the region'smore than 130 million strong labour force by the early 1980s [ILO-JASPA,19901, while manufacturing accounted for less than 20 per cent of formalsector wage employment. In the 14 countries for which relevant data areavailable, the growth rate in formal sector employment declined from 2.8per cent in 1975-80 to 1.0 per cent in the 1980s [ibid.].
In the industrial sector, employment growth came to a virtualstandstill. In several cases, the imposition of rapid import liberalizationundermined potentially viable local industries, which were given little timeto adjust despite the unfavourable conditions (lack of appropriate infra-structure and tight credit from weak credit systems) they had to facerelative to foreign companies.
Real (non-agricultural) average and minimum wages fell by 25 percent between 1980 and 1985 in two-thirds of the countries for which dataare available [ibid.]. Scattered country studies point to a continuedworsening of this trend in the late 1 980s. The real value of the minimumwage plummeted by 72 per cent in Zaire between 1984 and 1988 [WorldBank, 1989], by 30 per cent in Niger between 1980 and 1987 [Tinguiri,1992], by around the same amount in Benin between 1983 and 1990, andby at least 25 per cent in Nigeria between 1986 and 1990. Sizeabledecreases were also recorded in a number of other countries (see e.g.Davies et al. [1992]). The cut in real wages was deliberate: the aim wasto reduce labour costs, contain budget deficits and increase competitive-ness, production and employment. But lower real wages did not stimulateemployment or growth. Rather, as seen above, employment opportunitiesin both the public and the private formal sectors dropped substantially.

192 THE POVERTY AGENDA: TRENDS AND POLICY OPTIONS
Table 5: Average annual per capita GDP growth in 33 sub-Saharan countries,1 980-89
Average annual per Countries with a population of % of totalAfrican populationcapita GDP growth
20 millionLess than10 million
10-20 million Over
Greater than 2% Botswana 3.9Burkina FasoChadMauritius
Between 0 and 2% Burundi Cameroon Kenya 15.2
CongoLesothoMali
SenegalSomalia
Between 0 and —2% Benin Ghana Ethiopia 40.8
Central African
Republic Uganda TanzaniaMalawi Zimbabwe ZaireMauritaniaRwandaSierra Leone
Less than —2% Gabon Côte d'Ivoire Nigeria 40.4
Mozambique MadagascarNamibia
NigerTogoZambia
Note: * Countries with a population of less than 1 million are not included.Source: Based on World Bank [19911.
In practically all cases, wages and salaries fell below the "efficiencywage". Studies on Tanzania [Tripp, 19891, Uganda [Chew, 1990] andZaire [World Bank, 1989] show that in the late 1980s formal sectorworkers and civil servants could no longer support their families on theirformal sector incomes. However, the public wage bill may not have beenreduced as much as intended because civil servants increasingly took tousing promotions and allowances to sustain their earnings [Robinson,1991]. While some narrowing of wage differentials between the public sec-tor and other sectors was warranted, the actual declines demoralized publicemployees, who increasingly resorted to additional income-generating acti-
STRUCTURAL ADJUSTMENT, POVERTY AND MACRO-ECONOMIC POLICY 193
vities, either through their regular jobs (by demanding direct payment fortheir services, for instance) or outside their jobs but during their normalpublic sector working hours. The decline in public sector wages thus hadserious negative consequences for that sector, whose efficiency fell at atime when it was being called upon to implement stabilization and struc-tural adjustment measures and to improve management. The most qualifiedprofessionals, for instance, often chose to emigrate.
One could argue that the decline in urban incomes and wages is lessrelevant to a total appreciation of adjustment programmes in sub-SaharanAfrica because jobs in urban areas are in the non-tradeable sector, whichneeds to shrink in order to allow production and jobs in the tradeablesector to expand. Although in some countries there has been a shifttowards more production of tradeables in agriculture, this has often not ledto an overall increase in rural incomes in relation to urban incomes [Jamal& Weeks, 1993].
B. Fiscal adjustment and the provision of social services
With the onset of the crisis in the early 1980s, government revenuestagnated or declined, both in absolute terms and in relation to GDP inseveral countries of the region, particularly in those countries relying ontrade taxes. Analysis reveals that by 1985 real per capita governmentexpenditures had declined in two-thirds of the 19 sub-Saharan countries forwhich data are available. The situation had improved somewhat by 1987-89, but real per capita government expenditures were still below the 1980level in nearly half the countries for which information is available.Simultaneously, the claims on fiscal resources to meet debt serviceobligations grew disproportionately, further reducing the number ofcountries showing an increase in real "discretionary" expenditure — thatis, government expenditures after interest payments have been made. Inmany of the larger countries, such as Nigeria, Zaire and Zambia, whichaccount for a considerable proportion of the population of Africa, interestpayments accounted for 30 per cent of total government expenditures in1985-87, an amount two to seven times greater than that allocated forhealth care and education combined.
It is important to note that the shift in the allocation of governmentresources observed in the 1980s did not reflect a shift in governmentpriorities but rather a reduction in discretionary expenditures. Indeed, ananalysis of government spending priorities over the same period points toa tendency for shares to remain stable. There was, however, someshrinkage in the share allocated to health care and education, more
194 THEPOVERTY AGENDA: TRENDS AND POLICY OPTIONS
pronounced in low-income than in middle-income countries. Data onchanges in health, nutrition and educational status are not easily availableand are often difficult to interpret. Moreover, some of these changesbecome manifest only after long time lags and as a result of numerousother factors operating outside the sectors concerned. Health status, forinstance, may be directly affected by the availability of health services,drugs or properly trained birth attendants. However, factors such aschanges in income, food prices or the environment may have an evengreater impact on the need for people to be able to access health services.The information that is available points to a decline or at best a standstillin social welfare.
C. New or old poverty?
As Cornia et al [1992] argue, it is virtually impossible to tell whetherthe decline or stagnation in sub-Saharan Africa was caused by externalshocks, domestic policy-making or adjustment policies. What is clear,however, is that there were extremely large external shocks and thatadjustment policies did not in general steer the African countries towardsa satisfactory development path. A more detailed assessment needs to bebased on factual country analysis and a breakdown of the various elementsof stabilization and adjustment programmes [Bourgignon et al., 1992].Mosley and Weeks [1993] argue on the basis of a breakdown of thevarious elements of adjustment programmes that policy coordination andcomplementarity are the key to success in alleviating poverty. A long-termdevelopment perspective therefore needs to be the over-riding concern inthe formulation of adjustment policies [Cornia et al., 1992]. Externalfinance can help in this respect, but it should not lead to a proliferation ofpolicies and consequent difficulties of policy coordination, as was often thecase in various African countries [van der Hoeven, forthcoming].
More detailed analysis confirms the continent-wide picture sketchedabove. A study on COte d'Ivoire [Grootaert, 1993] finds that adjustmentachieved the desired effect of a shift in the rural-urban terms of trade infavour of rural areas. The expenditure of middle-income groups fellsignificantly, especially in urban areas, where poverty increased. Althoughpoverty was low among public sector employees, it rose by 14 per cent in1985-86. Clearly, adjustment led to the creation of some "new poor".Poverty also rose in the urban private sector (formal and informal). By1988, poverty had risen to 46 per cent of the population as a whole, withurban poverty almost doubling over the level of the previous year. Thatmeant an increase from 2 million people living in poverty in 1986 to 4.8

STRUCTURAL ADJUSTMENT, POVERTY AND MACRO-ECONOMIC POLICY 1.95
million in 1988. Extreme poverty also increased rapidly — to 14 per centof the population by 1988. In rural areas, the biggest rise in poverty wasin West Forest among export crop farmers, because of rapidly fallingyields and exports, especially of coffee. The study argues that the increasein poverty was due to negative economic growth. The survey data fromCôte d'Ivoire contain information from a panel of households, whichsuggests that there is a great deal of movement into, and out of, poverty.For each of the years studied, at least 30 per cent of households improvedtheir standard of living. In 1987 and 1988, when overall poverty increasedsharply, 27 per cent of those households that were very poor in 1987improved their living standards enough in 1988 to become mid-poor oreven not poor, and 19 per cent of households that were mid-poor in 1987escaped poverty in 1988. Much poverty in Côte d'Ivoire is thus transitory,and coping mechanisms help many households out of poverty.
Although government spending (in real terms) fell during adjustment,the share of the social sectors (health and education) in recurrentexpenditure rose slightly. In general, use of health care facilities, access tosafe water and housing amenities remained stable in 1985-88. But thesecountry-wide results mask big differences between the poor and the non-poor. Net primary school enrolment for girls in very poor households fellfrom 22.4 per cent to 16.7 per cent. The number of children one year ormore behind the grade for their age doubled to 64 per cent for boys and53 per cent for girls. Medical consultations for ill women in very poorhouseholds fell from 30 per cent to 16 per cent. Access to electricity fellfrom 14 per cent to 11 per cent. In addition, the private expenditures ofvery poor households on education and health care fell by 50 per cent and12 per cent, respectively. There was only one exception to this pattern inhealth care: preventive consultations rose more for very poor householdsthan the national average.
What these figures show is that, although some of Côte d'Ivoire'spoor manifested a remarkable ability to cope with poverty, the pooresthouseholds were hit hardest by structural change. Although there seems tobe a group of families belonging to the so-called "new poor" which moverelatively easily in and out of poverty, structural adjustment policies haveas yet done little to alleviate the lot of households belonging to the "old"poor. Policies emphasizing poverty alleviation for this group are called formore than ever.

196 THEPOVERTY AGENDA: TRENDS AND POLICY OPTIONS
II. Macro-economic policies and poverty alleviation
1. Macro-economic policies and growth
Since the absence of growth or slow growth has often contributed toincreases in poverty, we review first some aspects of the relation betweengrowth and macro-economic policies.
Especially in the context of discussing adjustment policies, it isimportant to distinguish between short-term and long-term growth. Theprevious sections have shown that periods of stabilization and adjustmenthave often been characterized by a contraction in the economy, which hasled to a fall in per capita GDP. Such a contraction is often accompaniedby lower rates of capacity utilization. Several economists have thereforeargued that a first priority of macro-economic policies in such situationsis to increase capacity utilization, as this will contribute to non-inflationarygrowth. Taylor [1988 and forthcoming] has criticized the financialaccounting in most stabilization packages of failing to take account of theimportance of capacity utilization. Monetary policies and income policiescan play an important part in the process of increasing capacity utilizationand reviving non-inflationary growth.
In general, however, the literature pays more attention to the relationbetween macro-economic policies and long-term growth. Fisher's overviewarticle [Fisher, 1991] provides a good summary of this. Fisher starts fromthe premise that current thinking among economists differs from currentthinking in the 1 970s, when it was generally accepted that short-termcyclical movements should be dealt with through (Keynesian) effectivedemand policies, while growth or at least the trend of growth should resultfrom more structural policies. In the 1980s, this was upset by theexperience of adjustment policies as well as by the emergence of a newgrowth theory. This theory, although emphasizing the role of structuralphenomena in explaining growth and the acceleration of growth, also takesinto account variables relating to the policy climate [Romer, 1986; Lucas,1988]. Fisher argues that the new growth theory is still production-drivenand pays too little attention to the role of macro-economic policies ingrowth. However, the experience of stabilization policies has shown thatmacro-economic policies do matter for economic growth: they affect notonly the variation around a trend of steady state growth but also the steadystate growth rate itself.
Cross-country regression analysis, using variables in line withneoclassical growth theory and the new growth theory as well as macro-economic variables (both outcome variables, such as inflation rate and

STRUCTURAL ADJUSTMENT, POVERTY AND MACRO-ECONOMIC POLICY 197
current account deficit, and policy variables such as budget surplus)suggests some relationship between macro-economic policies and growth."The evidence supports the view that the quality of macro-economic mana-gement reflected in these regressions in the inflation rate, the external debtratio and the budget surplus, matters for growth" [Fisher, 1991, p. 342].However, Fisher also points out that, although it would be logical to tryto tie down precisely which macro-economic indicators are most robustlyassociated with growth, this would not lead to instructive results (as Levineand Revelt [1991] have also shown). The main reason for not being ableto draw lessons relating to individual policy instruments is that thevariables of macro-economic policy —especially variables such as the debtratio, the budget surplus and the current account deficit — are not trulyexogenous with respect to growth. Faltering growth can affect the level ofeach of these variables leading, for example, to larger current accountdeficits, larger budget deficits and higher debt ratios. In short, there is alarge degree of simultaneity in the relationship between growth and macro-economic variables.
The conclusion of most cross-section analysis is that one can arguebroadly that good macro-economic policies will contribute to growth, butthat it is not possible to determine exactly what constitutes good macro-economic policy, as this apparently depends very much on the specificsituation in each country. In order to solve the problem of causality, Fisher[1991] resorts to emphasizing the relationship between certain macro-economic variables and a major determinant of growth, namely investment,in order to establish an indirect relationship between macro-economics andgrowth. He reports evidence that both inflation and the budget surplus arenegatively correlated with investment. Fisher regards this result as counter-intuitive, since a positive relation between budget surplus and investmentand hence a negative relation between deficits and investment, does nottally well with the "crowding-out" hypothesis of budget deficits. However,others like Taylor [especially Taylor, 1988] would see such results as beingacceptable since in many instances public investment "crowds in" privateinvestment if conditions are stable and ownership rights are respected.
A final attempt to establish more robust relations between macro-economic policy and growth can be made through combining countrystudies and time series, in which investment is again treated as the mostcrucial variable. The major conclusion of this more qualitative type ofanalysis is that uncertainty or instability in macro-economic variablesreduces investment and hence growth. More recent work by Serven andSolimano [1992] also confirms these conclusions.

198 THE POVERTY AGENDA: TRENDS AND POLICY OPTIONS
Dornbusch [1990], analysing policies needed to move fromstabilization to growth, offers a similar line of argument. He, too,concludes that responsible macro-economic policies contribute to growthbut finds it difficult to define exactly what are responsible macro-economicpolicies. The debate on whether a 20 pe cent annual inflation rate isresponsible or not has not been settled. What Dornbusch seems to regardas important is again the degree of uncertainty.
A related question is what implications the new growth theory has formacro-economic policies. In essence, the new growth theory relates chan-ges in structural factors — such as education, infrastructure, market accessand human resource development — not only to a higher level of income,as in neoclassical theory, but also to higher growth rates. It thereforeprovides potentially stronger arguments for growth-enhancing policies.However, all this is still underdeveloped. We will discuss some aspects inthe next section, since the distributional aspect of these structural factorscan be a major explanation of increases or decreases in income inequality.
2. Macro-economic policy and income distribution
The previous section raised issues related to macro-economic policiesand growth in general. This section looks at the relation of macro-economic policies to income distribution and the subsequent effects onpoverty.
In theory, macro-economic policy should almost, by definition, havean effect on the different types of income distribution. This becomesimmediately apparent when one considers the distinction between primaryincome distribution, which relates to total income earned before tax,secondary income distribution, which relates to after-tax income plustransfers, and tertiary income distribution, which includes imputed incomefrom government services.
Tight monetary policy, as far as it relates to policy on interest rates,will be beneficial to holders of interest-bearing assets, usually members ofthe higher income groups. Furthermore, to the extent that higher interestrates depress (at least initially) economic activity, a strict application ofmonetary policies will result in more unemployment and lower wages. Amore unequal primary income distribution can thus be expected to resultfrom strict monetary policies. The effects on income distribution of a morerelaxed monetary policy resulting in a higher rate of inflation are more dif-ficult to gauge. It actually depends on whether wage income and pensionsare properly indexed in order to keep levels of real wages and pensionsconstant [Marinakis, 1993]. Experience shows that a high rate of inflation

STRUCTURAL ADJUSTMENT, POVERTY AND MACRO-ECONOMIC POLICY 19.9
Table 6: Estimates of the redistributive tendencies of taxes
Indirect taxesVAT Without exceptions R
With exceptions SPFuels SPSpecific taxes Tobacco R
Liquor RVehicles VPServices SPStamp tax PBusiness licences VP
Import duties R
Direct taxesIncome tax Personal VP
Unearned income VPWealth VPInheritance VPBank interest PReal estate Urban dwellings P
Agricultural VPSocial security Personal contribution SR
Employer's contribution R
Notes: VP = very progressive. P = progressive. SP = slightly progressive.SR = slightly regressive. R = regressive.
Source: Altimir & Barbera [19921.
is often regressive (and therefore not much liked by electorates). However,the redistributive effect of lower levels of inflation is more difficult todetermine and research outcomes are ambiguous [Dornbusch, 1990].
Fiscal policies have, by definition, an effect on income distributionsince taxes determine the net disposable incomes of families. Indeed, oneof the aims of tax policies is precisely to bring about a redistribution in theeconomy, although the extent to which this is possible is often questioned(see, e.g., the discussion in Newbery & Stern [1987]). The effect of diffe-rent tax measures on secondary income distribution depends very much onthe composition of taxes. Table 6 provides a useful overview of theredistributive tendencies of different tax measures.
In many developing countries, tax systems rely heavily upon indirecttaxes; this makes the tax system regressive rather than progressive. InLatin America, for example, direct taxes are equivalent to some 3 per centof GDP, whereas in Europe they are equivalent to 10 per cent of GDP.

200 THE POVERTY AGENDA: TRENDS AND POLICY OPTIONS
A switch towards direct taxes could make secondary income distributionmuch more equal.
Public expenditure policy affecting the provision of services to poorergroups can have a considerable effect on tertiary income distribution. Asizeable literature existed at the end of the 1970s and in the early 1980s onthe distributive effects of government expenditure [Paukert et al., 1984; seealso Jiminez, 1986], but the effects on the welfare situation of householdswere often dealt with in a static way. In the light of the new growththeory, the issue of the distribution of government services becomes moreimportant since access to government services is not seen as a consumptionor an imputed income element but as contributing directly to growth.Whether such growth will increase or decrease inequality (or whethertertiary income distribution will affect primary income distribution in thefuture) cannot be argued a priori. This clearly depends on whether poorergroups, through income-earning assets or high factor rewards, can profitfrom increased growth.
3. Macro-economic policy and poverty alleviation
In the previous two sections, we reviewed briefly the relationshipbetween macro-economic policy and growth and between macro-economicpolicy and income distribution. This leaves us to deal with a third set ofissues, namely whether there is a trade-off between growth and more equalincome distribution and whether, in the absence of a trade-off, a set ofmacro-economic policies can be singled out which would foster bothgrowth and a more equal distribution of income.
It has been argued that a trade-off between growth and inequality doesexist since greater income equality would lead to a reduction in nationalsavings rates and hence, through reduced capital accumulation, hamperfuture growth. Research conducted in the 1970s has shown fairlyconvincingly that the savings arguments for a trade-off between incomeequality and growth is often not valid; in addition, were it valid, it wouldonly be a weak explanatory variable. Country studies have providedexamples of countries which combined greater income equality with highgrowth rates, either because the effects on savings behaviour were not verystrong or because the negative effect of lower savings rates wascompensated by growth-inducing effects such as a lower capital-outputratio or an increase in productivity [Cline, 1972].
The new growth theory, which emphasizes structural factors such asthe level of human resources, the accessibility of markets and the degreeof infrastructure as well as the general political climate, offers a whole new

STRUCTURAL ADJUSTMENT, POVERTY AND MACRO-ECONOMIC POLICY 201
set of possibilities for reconsidering the growth and equality debate in thelight of the experiences of the 1980s. Higher taxes and some deficitfinancing can, for example, have a negative effect on savings and,according to neoclassical reasoning, distort growth. On the other hand, ahigher level of government expenditure (as a result of higher taxes ordeficit financing) can increase investment in human resources, support thedevelopment of markets and improve infrastructure; according to the newgrowth theory, this can contribute to higher levels of growth. The newgrowth theory thus offers, especially through the link between tertiaryincome distribution and the generation of future primary incomes, a moredynamic view of the relationship between income inequality and economicgrowth than the traditional one. Macro-economic policy variables can playa positive role here. However, little empirical research in this area hasbeen undertaken.
Macro-economic policies could have a potentially positiveredistributive effect, especially when emphasis is simultaneously placed ontax and expenditure policies [Pyatt, 1993], with monetary policies playingonly the lesser role of bringing stability into the economy. Macro-economicpolicies can, in particular, be more poverty-focused if "sound" macro-economic policies are implemented in tandem with a set of incomes policies(including minimum wage policies) and mesopolicies which underline theredistributive aspect of the macro-economic policies.
Incomes policy, when based upon consultation with employers andworkers, can contribute to a better social climate and can therefore reduceinflationary pressures. Countries which have reduced income inequality andhave a reasonable growth record have often relied, amongst other things,on a set of incomes policies which included an active minimum wagepolicy [Camargo and Garcia, 1993].
Mesopolicies deal with the distribution of the fiscal burden of targetedpublic expenditure, the distribution of micro-economic policies (affectingthe functioning of the labour market and intervention in the productmarket) and distribution of ownership of assets [Steward, 1992b].However, despite their potentially redistributive role, this aspect of fiscalpolicies is often not explored. Tax policies are often less redistributive thanoriginally designed, and budget deficits are frequently dealt with throughreducing expenditure rather than increasing taxes. The redistributive effectsof government expenditure are often less than it is claimed, since manypublic service programmes benefit the rich more than the poor and the useof priority ratios to favour expenditure items affecting the poor is often notwell developed. Yet some countries have combined high priority ratioswith high growth rates [UNDP, 19911.

202 THE POVERTY AGENDA: TRENDS AND POLICY OPTIONS
An evaluation of tax and expenditure policies reveals that whether ornot macro-economic policies favour the poor depends not on the macro-economic policies themselves but on the social situation in the country,especially whether a society is willing to give priority to distributionalissues in times of economic crisis. Politically, it is often more difficult todevelop a redistributive strategy in times of economic difficulty than intimes of economic growth. The paradox is, therefore, that elements ofmacro-economic policies will favour the poor, especially in those countrieswhich already have a relatively egalitarian society, but that it is moredifficult to implement poverty-oriented macro-economic policies in a lessegalitarian society. External funding can, of course, provide relief inperiods of economic difficulty and make it possible to move towards amore egalitarian society, but it can also help perpetuate economicallyinefficient policies and an unequal pattern of income distribution. Theexperience of policy conditions imposed by international and national donororganizations in order to achieve better economic policy and more equalincome distribution has been very mixed [Khan, 1993].
Changes in societal attitudes may therefore be necessary if a set ofmacro-economic policies is to reduce poverty. Appropriate macro-economic policies introduced as part of a stabilization package cannot inthemselves do the trick, but they could contribute to a more long-termdevelopment and anti-poverty strategy. Compartmentalization in decision-making and a lack of international cooperation often prevent this.
Bibliographicalreferences
Altimir, 0; Barbera, M. 1992. "TributaciOn y equidad en America Latina. Un ejercicio deevaluaciôn cuantitativa". Santiago, Chile, ECLAC, October 1991, unpublished, asquoted in ECLAC: Social equity and changing production patterns. Santiago.
Bourgignon, F.; de Melo, J.; Morrison, C. 1991. "Poverty and income distribution duringadjustment: Issues and evidence from the OECD project", in World Development(New York), Vol. 19, No. 11.
Camargo, J. M.; Garcia, N. E. 1993. "Stabilisation minimum wages and poverty", inInfante, R.: Social debt: The challenge of equity. Santiago, ILO/PREALC.
Chew, D. 1990. "Internal adjustments to falling civil services salaries: Insights for Uganda",in World Development (New York), Vol. 18, No. 7.
Cline, W. 1972. Potential effects of income redistribution on economic growth. NewYork, Praeger.
Cornia, G. A.; Jolly, R.; Stewart, F. 1987. Adjustment with a human face. Oxford, OxfordUniversity Press.

STRUCTURAL ADJUSTMENT, POVERTY AND MACRO-ECONOMIC POLICY 203
Hoeven, R. van der; Mkandawire, T. 1992. Africa's recovery in the 1990s: Fromstagnation and adjustment to human development. London, Macmillan.
Davies, R. eta!. 1992. "Liberalisation for development. Zimbabwe's adjustment without theFund", in Cornia et a!., 1992.
Demery, L.; Addison, T. 1993. "The impact of macroeconomic adjustment on poverty in thepresence of wage rigidities", in Journal of Development Economics (Amsterdam).
Dornbusch, R. 1990. "Policies to move from stabilization to growth", in World Bank, 1992.
Elbadawi, I. et al. 1992. Why structural adjustment has not succeeded in sub-SaharanAfrica. World Bank Policy Research Working Papers 1000.
Fields, G. 1993. "Poverty changes in developing countries", in Hoeven van der; Anker,1993.
Fisher, S. 1991. "Growth, macroeconomics and development", in National Bureau ofEconomic Research Macroeconomic Annual. Cambridge, Mass., MIT Press.
Foster, J.; Green, J.; Thorbecke, E. 1984. "A class of decomposable poverty measures", inEconometrica (New Haven, Yale University), Vol. 52, pp. 761-765.
Garcia, N. 1993. Lessons from the structural adjustment processes of Costa Rica, Chile andMexico. Santiago, PREALC, mimeo.
Ginneken, W. von; Park, J. G. 1984. Generating internationally comparable incomedistribution estimates. Geneva, ILO.
Grootaert, C. 1993. The evolution of welfare and poverty during structural change andeconomic recession: The case of Cdte d 'Ivoire, 1985-1988. World Bank PolicyResearch Working Paper 1078.
Hirschman, A. 1981. Essays in trespassing economics to politics and beyond. Cambridge,Mass., Cambridge University Press.
Hoeven, R. van der. 1987. "External shocks and stabilization policies: Spreading the load",in International Labour Review (Geneva, ILO), Vol. 126, No. 2.
—. 1991. "Adjustment with a human face: Still relevant or overtaken by events", in WorldDevelopment (New York), Vol. 19, No. 12.
—; Anker, R. 1993. Poverty monitoring: An international concern. London, Macmillan.
—; Stewart, F. 1993. Social policies during periods of adjustment in Latin America.Occasional Paper 18. Geneva, ILO, Interdepartmental Project on StructuralAdjustment.
van der Kraaij. 1994. Structural adjustment and beyond. London, James Curry.
Forthcoming. "External dependence, structural adjustment and development in sub-Saharan Africa", in K. Jansen and R. Vos (eds.): Externalfinance and adjustment.Failures and success in the developing world. London, Macmillan.
ILO. 1992. Report to the 13th Regional Conference of the American States: Report of theDirector-General. Geneva.

204 THE POVERTY AGENDA: TRENDS AND POLICY OPTIONS
ILO-JASPA. 1990. African Employment Report 1990. Addis Ababa.
IMF. 1989. World Economic Outlook. Washington, DC, October.
—. 1990. World Economic Outlook. Washington, DC, October.
Jamal, V.; Weeks, J. 1993. Africa misunderstood or whatever happenedto the urban-rural
gap? London, Macmillan.
Jiminez. 1986. "The public subsidization of education and health in developing countries;
A review of equity and efficiency", in WorldBank Research Observer(Washingtofl,DC, World Bank), Vol. 1, No. 1.
Jolly, R.; Cornia, G. A. 1983. The effects of the world recession on children. New York,
Pergamon Press.
Kanbur, R. 1987. "Measurement and alleviation in poverty", in IMF Staff Papers, Vol. 36,
pp. 60-85.
Khan, A. 1993. Structural adjustment and income distribution: Issuesand experiences.
Geneva, ILO.
Khan. M. 1990. "The macroeconomic effects of Fund-supported adjustment programs", in
IMF Staff Papers, Vol. 37, No. 2, June.
Levine; Revelt. 1991. Cross-country studies of growth and policy: Methodological.conceptual and statistical problems. World Bank Policy Research Working
Paper6O8.
Lucas, R. 1988. "On the mechanics of economic development", inJournal of Monetary
Economy, Vol. 22.
Marinakis, A. 1993. Wage indexation, flexibility and inflation: Some Latin American
experiencesin the 1980s. Occasional Paper 6. Geneva, ILO, Interdepartmental Projecton Structural Adjustment.
Morrison, C. 1991. "Foreword: Special issue on adjustment with growth and equity", in
World Development (New York), Vol. 19, No. 11.
Mosley, P.; Weeks, J. 1993. "Has recovery begun? Africa's adjustment in the 1980s", in
World Development (New York), Vol. 21, No. 10.
Ndulu, B. 1992. "Enhancing income distribution and rationalizing consumption patterns",in Cornia et al., 1992.
Newbery, D.; Stern, N. 1987. The theory oftaxationfor developing countries.New York
and Oxford, Oxford University Press.
Pastor, M. 1987. "The effects of IMF programmes in the Third World: Debate and evidence
from Latin America", in World Development (New York), Vol. 15, No. 7.
Paukert, F. et al. 1984. Income distribution and economic development. Geneva, ILO.
PREALC. 1985. Beyond the crisis. Santiago, ILO.
Psacharopoulos, G. et al. 1992. Poverty and income distributionin Latin America: The storyof the 1980s. LACTD Report 27. Washington, DC, World Bank, December.

STRUCTURAL ADJUSTMENT, POVERTY AND MA CR0-ECONOMIC POLICY 205
Pyatt, G. 1993. Fiscal policies, adjustment and balanced development. Occasional Paper 8.Geneva, ILO, Interdepartmental Project on Structural Adjustment.
Robinson, D. 1990. Civil service pay in Africa. Geneva, ILO.
Robinson, S. 1991. "Macroeconomics, financial variables and computable generalequilibrium models", in World Development (New York), Vol. 19, No. 11.
Romer, P. 1986. "Increasing returns and long-term growth", in Journal of PoliticalEconomy(Chicago), Vol. 94, October.
1992. "Two strategies for economic development: Using ideas and producing ideas", inWorld Bank, 1992.
Sachs, J. 1987. "Trade and exchange rate policies in growth-oriented adjustmentprogrammes", in American Economic Review(Nashville), Papers and Proceedings 77,pp. 279-283.
Larrain, F. 1993. Macroeconomics in the global economy. New York, Harvester.
Sahn, D. 1992. "Public expenditures in sub-Saharan Africa during a period of economicreforms", in World Development (New York), Vol. 20, No. 5.
Serven, A.; Solimano, A. 1992. "Economic adjustment and investment performance indeveloping countries: The experience of the 1980s", in Corbo, V. et a!.: Adjustmentlending revisited: Policies to restore growth. Washington, DC, World Bank.
Singer, H. 1983. "North-South multipliers", in World Development (New York), Vol. II,No. 5, May.
Stewart, F. 1992a. Protecting the poor during adjustment in Latin America and theCaribbean in the 1980s: How adequate was the World Bank's response? Oxford,Queen Elizabeth House Working Paper.
—. 1992b. "Shorterm policies for long-term development", in Cornia et al., 1992.
Summers, L.; Pritchet, L. 1993. "The Structural Adjustment Debate", inAmericanEconomicReview (Nashville), Papers and Proceedings, May.
Taylor, L. 1988. Varieties of stabilization experience. Oxford, Clarendon Press.
—. 1993. The rocky road to reform. Cambridge, MIT Press.
Tinguiri, K. 1992. "Stabilisation without structural adjustment: The case of Niger", inCornia et al., 1992.
Tripp, R. 1989. "Women and the changing household economy in urban Tanzania", inJournal of Modern African Studies (Cambridge), Vol. 27, No. 4, December.
IJNDP. 1991. Human Development Report. New York.
World Bank. 1989. Sub-Saharan Africa: From crisis to sustainable growth. Washington.
—. 1990. World Development Report 1990. Washington, DC.
—. 1991. World Development Report 1991. Washington, DC.
—. 1992. Proceedings of the Annual Conference of Development Economics. Washington,DC.

Copyright © 2022 FDOKUMEN


![Credit ratings failures and policy options [with Discussion]](https://static.fdokumen.com/doc/165x107/633fd3e6d10f841e2f086984/credit-ratings-failures-and-policy-options-with-discussion.jpg)