Drivers, impacts, and policy options to address land use ...
187
UNIVERSIDAD POLITÉCNICA DE MADRID ESCUELA TÉCNICA SUPERIOR DE INGENIERÍA AGRONÓMICA, ALIMENTARIA Y DE BIOSISTEMAS Drivers, impacts, and policy options to address land use changes at multiple scales: implications of food production, rural livelihoods, and ecosystem conservation Tesis Doctoral Rhys Manners Master en Cambio Medioambiental Global Madrid, 2018
-
Upload
khangminh22 -
Category
Documents
-
view
2 -
download
0
Transcript of Drivers, impacts, and policy options to address land use ...
UNIVERSIDAD POLITÉCNICA DE MADRID
ESCUELA TÉCNICA SUPERIOR DE INGENIERÍA AGRONÓMICA, ALIMENTARIA
Y DE BIOSISTEMAS
Drivers, impacts, and policy options to address land use changes at multiple scales: implications of food
production, rural livelihoods, and ecosystem conservation
Tesis Doctoral
Rhys Manners
Master en Cambio Medioambiental Global
Madrid, 2018

Departamento de Economía Agraria, Estadística y Gestión de Empresas
Escuela Técnica Superior de Ingeniería Agronómica, Alimentaria y de Biosistemas
Universidad Politécnica de Madrid
Drivers, impacts, and policy options to address land use changes at multiple scales: implications of food
production, rural livelihoods, and ecosystem conservation
Tesis Doctoral
Rhys Manners
Master en Cambio Medioambiental Global
Directora
Consuelo Varela Ortega
Dr. Ingeniero Agrónomo (Universidad Politécnica de Madrid)
Madrid, 2018

Tribunal nombrado por el Sr. Rector Magfco. de la Universidad Politécnica de Madrid, el día
……… de …………………. de 201…
Presidente: …………………………………………………………………………
Vocal: ………………………………………………………………………………
Vocal: ………………………………………………………………………………
Vocal: ………………………………………………………………………………
Secretario: …………………………………………………………………………
Suplente:…………………………………………………………………………
Suplente: …………………………………………………………………………
Realizado el acto de defensa y lectura de la Tesis el día …… de …………. de 201… en la
E.T.S.I./Facultad ……………………….
Calificación ………………………………………….
EL PRESIDENTE LOS VOCALES
EL SECRETARIO


For my family
Pour y parvenir


No matter how intently one studies the hundred little dramas of the woods and meadows, one
can never learn all the salient facts about any one of them.
Aldo Leopold (1966)

i
ii
Acknowledgements
These pages, even if they were to fill tomes and the words reach into the millions, could never
fully express the anguish, joy, and relief I have felt in finally putting them into print. They would
never, however, have seen the light of day without the unerring support of a group of people,
to which I will try to, too briefly, express my gratitude.
I want to offer my deepest thanks to my thesis supervisor, Professor Consuelo Varela-Ortega. I
will be forever grateful to her for seeing my potential and giving me the space to grow
professionally. Her invaluable and constant inputs, along with her encouragement for excellence
and betterment have shaped me into the scientist I am today. She helped me to learn from my
weaknesses and build upon my strengths. Consuelo´s inclusion of me in her research group and
her research projects offered me the freedom to pursue my interests in natural ecosystems, gain
new interests in food and agricultural systems, whilst providing the space and time to link them,
resulting in this thesis. She has been far more than a doctoral supervisor for me, she has been a
history, philosophy, linguistics, cultural, and culinary teacher. I can offer her no greater thanks
than to say she helped me to learn so much about myself, I will never forget all that she has
done for me.
I want to highlight the unfailing support of the Universidad Politécnica de Madrid. The
Universidad Politécnica de Madrid has funded this research since 2016 through their contracts
for doctoral students (Contratos predoctorales en el marco del programa Propio de ayudas para
el personal investigador en formación, financiados por la UPM, para la realización del
doctorado). The university also supported this investigation through a grant to perform an
international research stay (Ayudas a los beneficiarios de los programas predoctorales oficiales
de formación de investigadores para estancias breves en el extranjero). This financial backing
permitted me the opportunity and liberty to follow my research interests and pursue them
across the world.
I also want to thank Bioversity International (CGIAR), Costa Rica for inviting me into their centre
and providing a platform for my investigation. The space and support offered me there, as part
of my international research stay, was key in the final steps of the research performed in this
thesis. I am particularly grateful to Dr Jacob van Etten. He not only opened his research team to
me, but was a constant source of recommendations and feedback during his supervision of my
time in Costa Rica. I will always be grateful for his contributions.
I would further like to highlight the importance of the two European Commission funded
projects within which I have been fortunate to participate. The projects ROBIN and
PROTEIN2FOOD provided not only funding (2014-2016), but also much inspiration and support
for this thesis. Exposure to international research groups, working on cutting edge
methodologies and research fields offered fertile mediums within which to develop this
investigation. From the ROBIN project, I would like to thank Dr Terry Parr (Centre for Ecology
and Hydrology, UK) for his support, Dr Marisol Toledo (Instituto Boliviano de Investigación
iii
Forestal, Bolivia) for her assistance in the development of the field-work used in this research,
and to all researchers of the project who contributed. I must also thank the people of the
Provincia de Guarayos (Bolivia), some of the most hospitable and welcoming people I have met.
Further contributions of stakeholders to this work have been important and I must recognise
the participation of local stakeholders in workshops performed in Santa Cruz (Bolivia), Jalisco
(Mexico), and Pará (Brazil). From the PROTEIN2FOOD project, I want to thank Dr Sven-Erik
Jacobsen (University of Copenhagen, Denmark) for his inputs and suggestions concerning the
impacts of climate change on protein-rich crops across Europe, Andreas Detzel (IFEU, Germany)
for his feedback and ideas on the trend analysis, to all researchers who provided comments and
recommendations, and to the stakeholders of the two workshops performed within the project
in Caserta (Italy) and Freising (Germany).
During the development of this research I was extremely fortunate to participate in a summer
school for doctoral students hosted by IRI-THESys (Integrative Research Institute on
Transformations of Human-Environment Systems), Humboldt University (Berlin). The focus on
human-environment systems and participatory methods for co-production and co-producing
helped me to envisage and develop a more holistic perspective for academic research, readily
applied in this doctoral investigation. In particular, I must thank Professors Tobias Krüger and
Jörg Niewöhner for their insightful and thought provoking approach.
I want to thank the members of my pre-doctoral thesis defence committee Professors Ana
Tarquis Alfonso, Carlos Gregorio Hernández Díaz-Ambrona, and Irene Blanco. Their invaluable
comments improved this document, its focus, and approach greatly.
I must further voice my thanks to the institutional support provided by Universidad Politécnica
de Madrid, specifically the School of Agricultural, Food, and Biosystems Engineering, particularly
the Department of Agricultural Economics, Statistics, and Business Management and the
Research Centre for the Management of Agricultural and Environmental Risks (CEIGRAM). These
centres have nurtured me over the past 4 years and have offered me an inspiring research
environment within which to develop this work. In particular, I must thank the heads of both
entities during this time, Professors Isabel Bardaji Azcárate, Silverio Alarcón Lorenzo, Alberto
Garrido Colmenero, Inés Minguez Tudela, and José Maria Sumpsi Viñas. They have provided me
assistance and input whenever I have needed it. Further, I also want to thank other members of
both centres for their contributions, especially Professor Maria Blanco.
I want to pay special thanks to my two colleagues Professors Irene Blanco and Paloma Esteve,
who have been constant sources of professional assistance and have played key roles in my
development. They have supported me since my first day at UPM, even when we barely
understood each other. From Bolivia to Costa Rica, I have learnt what it is to be a professional
and scientist from them both. It is because of them that I am confident in myself as a researcher,
thank you both so much. I would also like to thank Macarena Saenz who has assisted me greatly
since my arrival at UPM.
iv
My time at UPM has not only been a source of academic inspiration, but also a place where I
have developed bonds of friendship. Over the past 4 years I have shared frustration, anger, and
desperation, but also much laughter and happiness. It was a pleasure to share an office, trials,
and tribulations with Pilar Martinez, this thesis and my time at UPM would not have been the
same without her. Silvestre and Fran although our time together was short, I continue to be
indebted to them both. Castaño, I can say nothing more than without him, life would have been
far less entertaining. Cristhian for his constant help and inputs. Marina, Luis, Lucian, Sebastian,
and Zhiyang their involvement in this work will never be forgotten. To all other people I have
met, thank you.
The roles of Gabriel, Mirko, Sebastiano, Jose, Tom, and CJ in the long-road that led to this work
have been fundamental. The friendship of each of them has delivered me to where I am today.
To my family. Helen and Malcolm, I can never hope to grasp or appreciate the extent of the
sacrifices they made for me. I have always carried them with me, but they have never been a
heavy burden. Please accept these pages as some small payment and a recognition of my deep
and too little spoken gratitude. I want to thank my sister, Angharad, for always being there
whenever I’ve fallen to lift me up again. Karen and Morgan, who are far more than an aunt and
cousin to me. Craig for being a pillar for my family in difficult times.
Finally to Lucia, she had to suffer me at my worst and knew more than anyone how trying these
years have been. I can never hope to express how grateful I am for the support she gave me or
how sorry I am for not being able share this moment with her. Without her constant aid, I could
never have completed this work, I can offer no greater thanks.
I have undoubtedly forgotten some people who have supported me along the way, but the
words bound in this thesis are a testament of their contributions. Each person has taught me so
much, without them all this document wouldn’t be here, and I wouldn’t be who I am.
Adfyd a ddwg wybodaeth, a gwybodaeth ddoethineb
Thank you
Diolch

v
vi
Agradecimientos
Estas páginas, incluso si fueran a llenar tomos y las palabras llegaran a millones, nunca podrían
expresar por completo la angustia, la alegría y el alivio que sentí al publicarlas finalmente. Sin
embargo, nunca habrían visto la luz sin el apoyo incondicional de un grupo de personas a las que
intentaré, demasiado brevemente, expresar mi gratitud.
Quiero expresar mi más profundo agradecimiento a mi directora de tesis, la profesora Consuelo
Varela-Ortega. Estaré eternamente agradecido con ella por ver mi potencial y darme el espacio
para crecer profesionalmente. Sus aportaciones invalorables y constantes, junto con su aliento
a la excelencia y la mejora, me han convertido en el científico que soy. Ella me ayudó a aprender
de mis debilidades y a desarrollar mis puntos fuertes. Consuelo me incluyó en su equipo y sus
proyectos de investigación, ofreciéndome la libertad de perseguir mi vocación por la
investigación de los ecosistemas naturales y obtener nuevos intereses en los sistemas agrícolas
y alimentarios, al tiempo que me proporcionó el espacio y el tiempo para vincularlos, lo que dio
como resultado esta tesis. Ella ha sido mucho más que una directora de tesis para mí, ha sido
profesora de historia, filosofía, lingüística, cultura y gastronomía. No puedo ofrecerle mayor
reconocimiento que decir que ella me ayudó a aprender mucho sobre mí, nunca olvidaré todo
lo que ha hecho por mí.
Quiero destacar el apoyo incondicional de la Universidad Politécnica de Madrid, que ha
financiado esta investigación desde 2016 a través de sus contratos para estudiantes de
doctorado (Contratos predoctorales en el marco del programa Propio de ayudas para el personal
investigador en formación, financiados por la UPM, para la realización del doctorado). La
universidad también apoyó esta investigación a través de una subvención para realizar una
estancia de investigación internacional (Ayudas a los beneficiarios de los programas
predoctorales oficiales de formación de investigadores para estancias breves en el extranjero).
El respaldo financiero e institucional ofrecido por la UPM no solo me brindó la oportunidad y la
libertad de seguir mis intereses de investigación, sino también de perseguirlos en todo el mundo.
También quiero agradecer a Bioversity International (CGIAR), Costa Rica por invitarme a su
centro y facilitarme una plataforma para desarrollar mi investigación. El espacio y el apoyo que
me ofrecieron, durante mi estancia de investigación internacional, fue clave en los pasos finales
de la investigación realizada en esta tesis. Estoy particularmente agradecido con el Dr. Jacob van
Etten. No solo me acogió en su equipo de investigación, sino que fue una fuente constante de
recomendaciones y comentarios durante su supervisión en mi estancia en Costa Rica. Siempre
estaré agradecido por sus contribuciones.
También me gustaría destacar la importancia de los dos proyectos financiados por la Comisión
Europea en los cuales he tenido la suerte de participar. Los proyectos ROBIN y PROTEIN2FOOD
proporcionaron no solo fondos (2014-2016), sino también mucha inspiración y apoyo. La
colaboración con grupos de investigación internacionales y el trabajo con metodologías y en
campos de investigación de vanguardia me ofrecieron medios fértiles para desarrollar esta
vii
investigación. En el proyecto ROBIN, quisiera agradecer al Dr. Terry Parr (Center for Ecology and
Hydrology, Reino Unido) todo su apoyo, a la Dra. Marisol Toledo (Instituto Boliviano de
Investigación Forestal, Bolivia) su ayuda en el desarrollo del trabajo de campo utilizado en esta
investigación, y también a todos los investigadores del proyecto que contribuyeron. Asimismo,
quiero dar las gracias a la gente de la Provincia de Guarayos (Bolivia), por ser unas de las
personas más hospitalarias y acogedoras que he conocido. Las contribuciones de los grupos de
interés han sido fundamentales para este trabajo y quiero agradecer su participación en los
talleres realizados en Santa Cruz (Bolivia), Jalisco (México) y Pará (Brasil). En el proyecto
PROTEIN2FOOD, quiero agradecer al Dr. Sven-Erik Jacobsen (Universidad de Copenhague,
Dinamarca) por sus aportes y sugerencias sobre los impactos del cambio climático en los cultivos
ricos en proteínas en Europa, Andreas Detzel (IFEU, Alemania) por sus comentarios e ideas sobre
el análisis de tendencias y a todos los demás investigadores que han aportado comentarios y
recomendaciones para este trabajo y los participantes de los talleres realizados como parte del
proyecto en Caserta (Italia) y en Freising (Alemania).
Durante el desarrollo de esta investigación, tuve la gran suerte de participar en una escuela de
verano organizada por IRI-THESys, Universidad Humboldt (Berlín). El enfoque en los sistemas
humanos y ambientales, y los métodos participativos para la coproducción me ayudaron a
visualizar y desarrollar una perspectiva más holística para la investigación académica, fácilmente
aplicable en esta investigación doctoral. En particular, debo agradecer a los profesores Tobias
Krüger y Jörg Niewöhner por su perspicaz y sugerente enfoque.
Quiero agradecer a los miembros de mi comité de defensa predoctoral, los profesores Ana
Tarquis Alfonso, Carlos Gregorio Hernández Díaz-Ambrona e Irene Blanco. Sus inestimables
comentarios mejoraron este documento y su enfoque de manera significativa.
Además, quiero expresar mi agradecimiento a la Escuela de Ingeniería Agronómica, Alimentaria
y de Biosistemas, en particular, al Departamento de Economía Agraria, Estadística y Gestión de
Empresas, y al Centro de Estudios e Investigación para la Gestión de Riesgos Agrícolas y
Medioambientales (CEIGRAM). Estos centros me han nutrido en los últimos 4 años y me han
ofrecido un entorno de investigación inspirador para desarrollar este trabajo. En particular, debo
agradecer a los directores de ambas entidades durante este tiempo, los profesores Isabel Bardaji
Azcárate, Silverio Alarcón Lorenzo, Alberto Garrido Colmenero, Inés Minguez Tudela y José
María Sumpsi Viñas. Me han prestado su apoyo siempre que lo he necesitado. Además, quiero
agradecer a todos los miembros de ambos centros por sus contribuciones, en particular a
profesor María Blanco.
Quiero agradecer especialmente a mis dos colegas, las profesoras Irene Blanco y Paloma Esteve,
que han sido una fuente constante de asistencia profesional y han desempeñado un papel clave
en mi desarrollo. Me han apoyado desde mi primer día en la UPM, incluso cuando apenas nos
entendíamos. Desde Bolivia hasta Costa Rica, he aprendido lo que es ser un profesional y
científico de ambas. Es por ellas que tengo confianza en mí mismo como investigador. También
me gustaría mencionar a Macarena Saenz, que me ha ayudado mucho desde mi llegada a la
UPM.

viii
Mi tiempo en la UPM no solo ha sido una fuente de inspiración académica, sino también un lugar
en el que he desarrollado vínculos de amistad. En los últimos 4 años he compartido frustración,
enfados y desesperación, pero también muchas risas y felicidad. Fue un placer compartir una
oficina, dificultades y aflicciones con Pilar Martínez, esta tesis y mi tiempo en la UPM no habrían
sido lo mismo sin ella. Silvestre y Fran, aunque nuestro tiempo juntos fue corto, sigo estando en
deuda con los dos. Castaño, no puedo decir nada más que sin él, la vida hubiera sido mucho
menos entretenida. Cristhian por su constante ayuda y aportes. Marina, Luis, Lucian, Sebastian
y Zhiyang su participación en este trabajo nunca será olvidada. A todas las otras personas que
he conocido, gracias.
Gabriel, Mirko, Sebastiano, José y Tom, sus roles en el largo camino que condujo a este trabajo
han sido fundamentales. CJ, a veces un acto para cambiar el mundo, puede ser tan pequeño
como plantar una semilla y esperar. La amistad de cada uno de vosotros me ha llevado a donde
estoy hoy.
A mi familia. Helen y Malcolm, nunca podré comprender o apreciar el alcance de los sacrificios
que han hecho por mí. Siempre los llevé conmigo, pero nunca han sido una carga pesada.
Aceptad estas páginas como un pequeño pago y un reconocimiento de mi profunda y muy poca
gratitud verbal. Angharad, gracias por estar siempre cuando he caído para levantarme de nuevo.
Karen y Morgan, son mucho más que mi tía y primo. Craig por ser un pilar para mi familia en
tiempos difíciles.
Finalmente, para Lucía, ella tuvo que sufrirme en lo peor y sabe mejor que nadie cómo han sido
estos años. Nunca podré expresar lo agradecido que estoy por el apoyo que me brindó y lo
mucho que siento no poder compartir este momento con ella. Sin su constante ayuda, nunca
podría haber completado este trabajo.
Indudablemente, he olvidado a algunas personas que me han apoyado en el camino, pero las
palabras que componen esta tesis son un testimonio de sus contribuciones. Cada uno de
vosotros me ha enseñado mucho, sin vosotros este documento no estaría aquí, y yo no sería
quien soy.
Gracias

ix
x
Abstract
In recent decades the pace, scale, and impacts of land use changes have become
unprecedented. In Latin America, forests have reduced by almost 10% since 1990, with an array
of drivers and causes implicated in these losses, inclduing global dietary shifts. The scale and
speed of deforestation represent considerable challenges for humanity, due to implications for
forest based ecosystem services and the development of socio-economic-environmental trade-
offs. In light of these changes, this investigation aims to analyse the role of socio-economic,
environmental, and institutional factors in Latin American and Caribbean deforestation, explore
the historical trends in consumption and production patterns linked to deforestation, and
outline strategies to address these changes in the future.
The complexity of studying land use changes, ecosystem conservation, rural livelihoods, and
food production suggests the need for a multi-scalar and interdisciplinary methodological
approach. This methodology should incorporate and analyse drivers, impacts, and trade-offs,
but also allow for the identification of social, political, and economic responses to improve them
or ameliorate their impacts. To address this, this investigation develops a composite index to
investigate temporal and spatial patterns of forest vulnerability to socio-economic processes in
Latin American and Caribbean forests. It applies mathematical goal programming to investigate,
at the farm level, the manifestation of these vulnerabilities in the development of ecosystem
service trade-offs, and highlights how decision-making may exacerbate these antagonistic
relationships. Trend analysis is combined with participatory assessments to elucidate the
historical patterns of consumption and production of protein-rich products, identify the barriers
and opportunities for plant-protein production and consumption, and develop strategies to
increase production and consumption of plant proteins across the European Union. Finally, a
crop suitability model is implemented to investigate the potential of protein-rich crops under
future European climates.
The findings evidence the benefits of analysing complex processes from distinct perspectives
and scales, providing a new understanding and aiding in developing actions to address negative
aspects. This thesis has outlined the temporal and spatial differentiation in forest vulnerability
to socio-economic factors across Latin America and teased out the sources of recent declines.
The results infer the primacy and necessity of stable institutions and governance infrastructures
to reduce vulnerability. Farm-scale mathematical goal programming highlighted the antagonistic
relationship between maximisation of farm income and protection of ecosystem services,
indicating the substantial and overt influence of decision-making on these relationships. These
results signal the complex and antagonistic environment within which contemporary policy
makers and decision-makers find themselves. They also reaffirm the need for supporting
governance infrastructure to assist decision-making.
Continuation of long-term global, continental, and national trends towards greater consumption
and production of animal based products were observed, even in wealthier regions like the
European Union. Agronomic, supply chain, and consumer awareness barriers were suggested to
xi
be preventing transitions towards plant protein consumption and production. In light of these,
four robust strategies were formulated to encourage such transitions: increased research and
development, elevated consumer education and awareness, improved and connected supply
and value chains, and greater public policy supports. The urgency for the calls for increased
research are underlined by the results of the crop modelling analysis. The results demonstrate
the divergent effects of climate change upon European agriculture and the potential for novel
crops like quinoa as robust protein-rich crop option under future European climates. To exploit
the potential of protein-rich crops as potential animal product replacements in European
agricultural systems, geographically differentiated planning, research, and breeding strategies
should be implemented.
The results of this investigation offer a series of outputs that can contribute to improving the
knowledge base of the interactions between land use changes, ecosystem conservation, rural
livelihoods, and food production to better inform future decision-making. In particular, to
improve sustainable management of forests, reduce the extent of trade-offs in agriculture-
forest systems, outline options for reducing external socio-economic pressures upon forests,
and derive potential policy options for achieving the aforementioned. This research has
established the benefits of a novel methodological approach for analysing land-use changes and
for parsing out the interactions between them and socio-economic processes. The selection and
combination of previously applied methodologies in an innovative manner has provided an
enhanced understanding of food production, rural livelihoods, and ecosystem conservation at
multiple scales.
xii
Resumen
En las últimas décadas, el ritmo, la escala y los impactos de los cambios en el uso del suelo no
tienen precedentes. En América Latina, la superficie de bosque ha disminuido en torno al 10%
desde 1990 como consecuencia de diversas causas, entre las que se incluyen los cambios en la
dieta hacia un mayor consumo de productos animales a nivel global. La escala y la velocidad de
la deforestación y la degradación de los bosques representan un desafío considerable para la
humanidad, sobre todo debido a las implicaciones e impactos sobre los servicios de los
ecosistemas forestales y los consiguientes trade-offs socio-económico-ambientales. A la luz de
estos cambios, esta investigación tiene como objetivo analizar el papel de los factores
socioeconómicos, ambientales e institucionales en la deforestación de América Latina y el
Caribe, al tiempo que investiga las tendencias históricas en los patrones de consumo y
producción vinculados a la deforestación y propone estrategias para aliviar presiones
ambientales derivadas de los cambios en la dieta en la Unión Europea.
La complejidad de estudiar los cambios en el uso del suelo, la conservación del ecosistema, los
medios de vida rurales y la producción de alimentos requiere la aplicación de un enfoque
metodológico multiescalar e interdisciplinario. Esta metodología debe incorporar y analizar los
factores impulsores, los impactos y las compensaciones, pero también permitir la identificación
de respuestas sociales, políticas y económicas. Para abordar esto, esta investigación se
desarrolla un índice compuesto para analizar los patrones de vulnerabilidad temporal y espacial
derivados de los procesos socioeconómicos en los bosques de América Latina. Estrechando el
foco en cuestiones más localizadas, se desarrolla un modelo a nivel de explotación utilizando
programación matemática multi-objetivo para estudiar la manifestación de estas
vulnerabilidades y el desarrollo de trade-offs de los servicios ecosistémicos, mientras se destaca
cómo la toma de decisiones puede exacerbar las relaciones antagónicas. Además, el análisis de
tendencias se combina con evaluaciones participativas para dilucidar los patrones históricos de
consumo y producción de productos ricos en proteínas, analizar las barreras y oportunidades
para el cambio hacia dietas sostenibles y desarrollar estrategias para la producción y el consumo
sostenible de proteínas en toda la Unión Europea. Finalmente, se implementa un modelo de
idoneidad del cultivo para investigar el potencial de la transición de las actividades de
producción hacía modelos más sostenibles, para aliviar las presiones sobre los bosques en climas
futuros.
Los resultados de esta investigación evidencian los beneficios de analizar procesos complejos
desde distintas perspectivas y a diferentes escalas, proporcionando una nueva comprensión de
su complejidad, a la vez que ayudan a desarrollar acciones para abordar los aspectos negativos.
Esta tesis demuestra la diferenciación temporal y espacial de la vulnerabilidad de los bosques a
los factores socioeconómicos en América Latina, al tiempo que revela las causas de las
disminuciones recientes en la vulnerabilidad a escala nacional. Los resultados revelan la primacía
y la necesidad de instituciones estables e estructuras de gobernanza para alentar la disminución
de la vulnerabilidad. La programación matemática multi-objetivo al nivel de explotación
demostró la relación antagónica entre la maximización de los ingresos agrícolas y la protección
de los servicios ecosistemicos como el secuestro de carbono, al tiempo que indicaba la influencia
xiii
sustancial y manifiesta de la toma de decisiones sobre estas relaciones. Estos resultados señalan
el entorno complejo y antagónico en el que se encuentran los responsables políticos y los
tomadores de decisiones contemporáneos y reafirman la necesidad de apoyar la infraestructura
de gobernanza para ayudar a la toma de decisiones sostenibles.
Esta investigación demuestra la continuación de las tendencias mundiales, continentales y
nacionales hacia un mayor consumo y producción de productos de origen animal. Las supuestas
transiciones hacia sistemas alimentarios más sostenibles (mayor consumo y producción de
productos vegetales en lugar de productos animales) no se observaron ni siquiera en las
regiones más ricas como la Unión Europea. Barreras agronómicas, de la cadena de suministro y
de la conciencia del consumidor pueden evitar tales transiciones. A la luz de estos, grupos de
interés se formularon cuatro estrategias robustas para fomentar tales transiciones:
investigación y desarrollo; educación y conciencia del consumidor; cadenas de suministro y valor
mejoradas y conectadas y apoyo de políticas públicas. Los resultados del análisis del modelo de
cultivos revelan la urgencia de la necesidad de una mayor inversión en investigación. Los
resultados muestran efectos divergentes del cambio climático sobre la agricultura europea y
evidencia el potencial para la producción de cultivos novedosos, como la quínoa, como opciones
robustas de cultivos ricos en proteínas en climas futuros. Para aprovechar el potencial de los
cultivos ricos en proteínas como sustitutos de productos animales en los sistemas agrícolas
europeos, se deben implementar estrategias de planificación, investigación y mejora
geográficamente diferenciadas.
Los resultados de esta investigación contribuyen a mejorar la base de conocimiento de las
interacciones entre los cambios en el uso del suelo, la conservación del ecosistema, los medios
de vida rurales y la producción de alimentos para apoyar la toma de decisiones en el futuro. En
particular, aquellas vinculadas a la mejora de la gestión sostenible de los bosques, la reducción
del alcance de las compensaciones en los sistemas agrícolas y forestales, el desarrollo opciones
que permitan reducir las presiones socioeconómicas externas sobre los bosques y, en definitiva,
el diseño de posibles opciones políticas para lograr lo mencionado. Esta investigación demuestra
los beneficios de la aplicación de un nuevo enfoque metodológico para analizar los cambios en
el uso del suelo y analizar las interacciones entre ellos y los procesos socioeconómicos. La
selección de metodologías aplicadas previamente y su combinación de una manera innovadora,
por lo tanto, ha proporcionado una mejor comprensión de la producción de alimentos, los
medios de vida rurales y la conservación del ecosistema en múltiples escalas.
xiv
TABLE OF CONTENTS
Acknowledgements .................................................................................................. ii
Agradecimientos ..................................................................................................... vi
Abstract ................................................................................................................... x
Resumen ................................................................................................................ xii
TABLE OF CONTENTS ............................................................................................. xiv
LIST OF TABLES ..................................................................................................... xviii
LIST OF FIGURES ..................................................................................................... xx
LIST OF ABBREVIATIONS ........................................................................................ xxii
1. INTRODUCTION ................................................................................................. 1
1.1 Research Context .................................................................................................. 1
1.2 Related Publications ............................................................................................. 2
1.3 Historic and Contemporary Land Use Changes ....................................................... 4
1.4 Impacts of Deforestation ....................................................................................... 6
1.5 Drivers and Causes of Deforestation ...................................................................... 7
1.6 Forest Vulnerability and Landscape-Scale Trade-Offs ............................................. 9
1.7 Dietary Change as a Global Driver of Change ....................................................... 11
1.8 Research Objective ............................................................................................. 14
2. METHODOLOGY ............................................................................................... 16
2.1 Methodological Framework ................................................................................ 16
2.2 The Areas of Study .............................................................................................. 19
Continental .......................................................................................................................... 19
National ............................................................................................................................... 19
State .................................................................................................................................... 19
Municipal/Farm ................................................................................................................... 24
2.3 Methodological Review ....................................................................................... 25
2.4 Investigating Deforestation Vulnerability: Composite Index Development ............ 28
Identification of Factors Responsible for Forest Vulnerability ............................................ 28
Selection of National Indicators and Data Collection ......................................................... 31
State Scale Index Development .......................................................................................... 31
Calculating the Deforestation Vulnerability Index .............................................................. 32
Weighting the Index ............................................................................................................ 33
Robustness and Sensitivity of Index .................................................................................... 33
2.5 Analysing Ecosystem Service Trade-offs: Multi-objective Goal Programming ........ 35
Province of Guarayos Field-work ........................................................................................ 35
National Census and Survey Data ....................................................................................... 36
Cluster Analysis ................................................................................................................... 36
Farm-Scale Goals ................................................................................................................. 36
Model Development ........................................................................................................... 39
Calibration ........................................................................................................................... 40
xv
Generating Satisficing Values .............................................................................................. 42
Multi-Objective Goal Programming .................................................................................... 42
Baseline ............................................................................................................................... 43
Policy Scenarios ................................................................................................................... 43
2.6 Exploring Consumption and Production Trends and Transitional Pathways:
Statistical Trend and Participatory Analyses.................................................................... 45
Data Analysis ....................................................................................................................... 45
Participatory Analysis .......................................................................................................... 46
2.7 Addressing Climate Change: Biophysical Climate based Crop Modelling ............... 51
Crops and Area .................................................................................................................... 51
EcoCrop and Extension ........................................................................................................ 51
Crop, Climate, and Soil Data ................................................................................................ 54
Current Distribution Analysis .............................................................................................. 54
Future Suitability Analysis ................................................................................................... 55
Sensitivity Analysis .............................................................................................................. 55
3. RESULTS .......................................................................................................... 57
3.1 Analysing Latin American and Caribbean forest vulnerability from socio-economic
factors .......................................................................................................................... 57
Results of Indicator Weighting ............................................................................................ 57
The National Index .............................................................................................................. 58
The State Index .................................................................................................................... 60
Robustness and Sensitivity of National DVI ........................................................................ 62
3.2 The role of decision making in ecosystem service trade-offs in Amazonian
agricultural-forest systems ............................................................................................. 63
Conflict Among Goals .......................................................................................................... 63
Impact of Decision Making in Goal Achievement ............................................................... 63
Identifying Satisficing Management Solutions .................................................................... 67
3.3 Global and EU Patterns of Consumption and Production of Protein Rich Products
and Development of Robust Strategies for Transitioning EU Consumption and Production
Patterns ......................................................................................................................... 70
Past protein-rich product trends ......................................................................................... 70
Present and Future EU Plant-Protein Situation ................................................................... 78
3.4 Protein-rich legume and pseudo-cereal crop suitability under future European
climates ......................................................................................................................... 86
Current Protein-Rich Crop Distribution ............................................................................... 86
Future Protein-Rich Crop Suitability .................................................................................... 89
Climate Proof Protein-Rich Crops ........................................................................................ 93
Sensitivity Analysis .............................................................................................................. 95
4. DISCUSSION ..................................................................................................... 97
5. CONCLUSIONS ............................................................................................... 109
5.1 General findings and research contributions ...................................................... 109
5.2 Conclusions on the methodological approach .................................................... 112
5.3 Limitations and Further Research ...................................................................... 114
Limitations ......................................................................................................................... 114
Further Research ............................................................................................................... 116
xvi
6. REFERENCES .................................................................................................. 118
7. ANNEXES ....................................................................................................... 145
Annex 1. Latin American and Caribbean forest area and forest area changes from 1990-
2014 ................................................................................................................................... 145
Annex 2. Latin American and Caribbean arable area and arable area changes from 1990-
2014 ................................................................................................................................... 147
Annex 3. Latin American and Caribbean meadows and grasslands area and area changes
from 1990-2014 ................................................................................................................. 149
Annex 4. List of the 30 Global Circulation Models used within the analysis. Associated
institute and country included. ......................................................................................... 151
Annex 5. Deforestation Vulnerability Index results under expert weighting. Index results
have been rounded to two decimal points, whilst % percentage change was calculated on
non-rounded values. ......................................................................................................... 152
Annex 6. Deforestation Vulnerability Index results from provincial application. Results
from both expert and stakeholder weighting displayed. .................................................. 152
Annex 7. Results from pairwise t-test analysis of Deforestation Vulnerability Index (DVI)
values under random weighting of DVI indicators through Monte Carlo analysis. .......... 153
Annex 8. Average percentage suitability changes for all crops across EU-28 countries.
Percentage changes calculated from baseline suitability (1970-2000) and future climatic
scenario data (2050). ......................................................................................................... 154

xvii

xviii
LIST OF TABLES
Table 1. Drivers of deforestation identified from literature review, and enriched by findings
from stakeholder workshops performed as part of the EU project ROBIN. ....................... 30
Table 2. List of 13 indicators of forest vulnerability selected for the index. .............................. 31
Table 3. Representative farm types of the Province of Guarayos. ............................................. 36
Table 4. Farm-Scale Goal Information ........................................................................................ 38
Table 5. Stakeholder workshops ................................................................................................. 47
Table 6. List of legume and pseudo-cereals analysed................................................................. 51
Table 7. Sensitivity scenarios representing crop parameter changes. ....................................... 56
Table 8. Results from expert survey and stakeholder workshops for Deforestation Vulnerability
Index (DVI) weighting. ......................................................................................................... 57
Table 9. Payoff matrix for all farm types .................................................................................... 63
Table 10. Potential management solutions across three farm types and under policy scenario
conditions. ........................................................................................................................... 67
Table 11. Elements identified in the two groups from Workshop 1........................................... 78
Table 12. Elements identified in the two backcasting exercises from Workshop 2. .................. 79
Table 13. Policy actions needed to attain the desirable end-point from the backcasts. Most
important policy actions identified by proportion of votes given to each. Only common
policy actions across both groups are displayed. ................................................................ 83
Table 14. Elements linked within defined strategies. ................................................................. 83
Table 15. Sensitivity analysis results. .......................................................................................... 96

xix
xx
LIST OF FIGURES
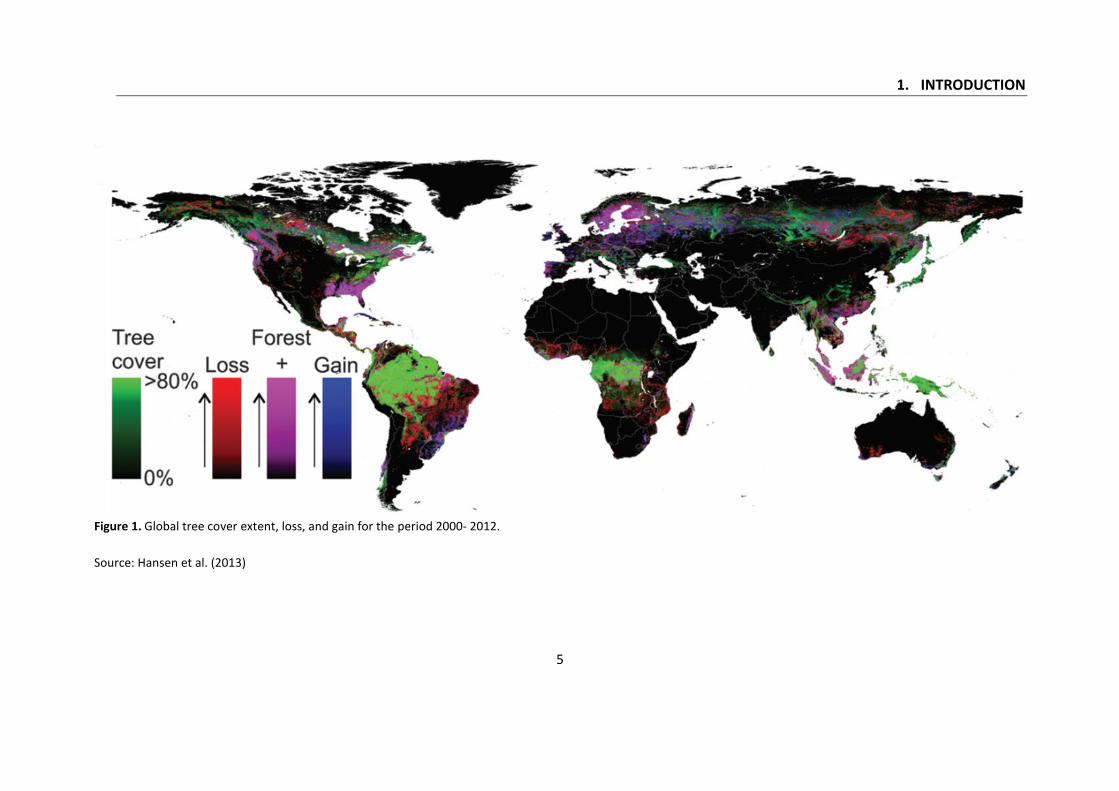
Figure 1. Global tree cover extent, loss, and gain for the period 2000- 2012. ............................. 5
Figure 2.The forest transition curve. ............................................................................................. 7
Figure 3. Land-use change and export products relationship in South America. ....................... 12
Figure 4. Methodological framework of thesis investigation. .................................................... 18
Figure 5. Case study sites ............................................................................................................ 20
Figure 6. Land use and agricultural activities in the Department of Santa Cruz, Bolivia. ........... 21
Figure 7. Land use and agricultural activities in the State of Pará, Brazil ................................... 22
Figure 8. Land use and agricultural activities in the State of Jalisco, Mexico ............................. 24
Figure 9. Methodology applied in the development of the Deforestation Vulnerability Index. 28
Figure 10. Deforestation Vulnerability Index (DVI) results for Latin American and Caribbean. . 58
Figure 11. Weighted vulnerability values for the Deforestation Vulnerability Index (DVI)
indicators. ............................................................................................................................ 59
Figure 12. State Deforestation Vulnerability Index (DVI) values for the year 2010. .................. 60
Figure 13. Weighted vulnerability values for provincial Deforestation Vulnerability Index (DVI)
indicators. ............................................................................................................................ 61
Figure 14. Estimation of the sensitivity of the Deforestation Vulnerability Index (DVI) in LAC. 62
Figure 15. The effect of decision-making upon net farm carbon sequestration and net farm
income. ................................................................................................................................ 64
Figure 16. The effect of decision-making upon Ecosystem Service Indicators. .......................... 66
Figure 17. Achievement frontiers of the two goals. ................................................................... 68
Figure 18. Global and continental patterns of per capita consumption and production of
legume and animal (meat and milk) products. ................................................................... 71
Figure 19. EU per capita consumption (kg/capita/year) and aggregated production (Million
tonnes) of legume and animal products from 1961-2013. ................................................. 73
Figure 20. Proportion of arable land dedicated to legumes in countries within the ‘European
Union’ (throughout steps of accession). Common Agricultural Policy reforms overlaid. ... 75
Figure 21. Percentage changes in European Union legume and animal products consumption
and production during the years 1993-1997 and 2009-2013. ............................................ 77
Figure 22. Barriers and opportunities within the EU plant-protein market. .............................. 78
Figure 23. Backcast from Group 1. Five identified strategies imposed. ..................................... 80
Figure 24. Backcast from Group 2. Four identified strategies imposed. .................................... 81
xxi
Figure 25. Relationship between crop distribution and maximum and mean crop suitability at
EU-28 NUTS-2 level. ............................................................................................................ 87
Figure 26. Relationship between crop yields and maximum and mean crop suitability at EU-28
NUTS-2 level. ....................................................................................................................... 88
Figure 27. Percentage changes in suitability from baseline (1970-2000) under future (2050)
climates. .............................................................................................................................. 90
Figure 28. Geographical representation of average future suitability (2050) generated from 30
GCMs under RCP4.5. ........................................................................................................... 92
Figure 29. Robust protein-rich crop options under baseline and future climates conditions. ... 94
xxii
LIST OF ABBREVIATIONS
ABT Autoridad de Fiscalización y Control Social de Bosques y Tierra, Bolivia CCAFS Climate Change, Agriculture and Food Security CES Conservation of Ecosystem Services CIAT Centro Internacional de Agricultura Tropical CONAFOR Comisión Nacional Forestal, Mexico CS Carbon Sequestration DM Decision-maker DSC Department of Santa Cruz DVI Deforestation Vulnerability Index ES Ecosystem Services EU European Union FAO Food and Agricultural Organization FAPESPA Fundação Amazônia de Amparo a Estudos e Pesquisas FBS Food Balance Sheets FCM Fuzzy Cognitive Mapping FT Forest Transition GCM Global Circulation Model GDP Gross Domestic Product GHG Greenhouse Gases GP Goal Programming ha Hectare HDI Human Development Index IBGE Instituto Brasileño de Geografía y Estadística, Brazil INE Instituto Nacional de Estadística, Bolivia INEGI Instituto Nacional de Estadística y Geografía, Mexico INPE Instituto Nacional de Pesquisas Espaciais, Brazil IPCC Intergovernmental Panel on Climate Change ISRIC International Soil Reference and Information Centre LAC Latin America and Caribbean LULCC Land Use Change and Land Cover Change MEA Millennium Ecosystem Assessment Mha Million Hectares MOGP Multi-Objective Goal Programming MS Member State (European Union) MT Million Tonnes NUTS Nomenclature of Territorial Units for Statistics OECD Organisation for Economic Co-operation and Development PMP Positive Mathematical Programming POG Province of Guarayos PPP Price Purchasing Parity PROTEIN2FOOD Development of high quality food protein from multi-purpose crops
through optimized, sustainable production and processing methods RCP Representative Concentration Pathways, EU Project ROBIN Role Of Biodiversity In climate change mitigation, EU Project SED Socio-Economic Development SIAP Servicio de Información Agroalimentaria y Pesquera, Mexico SOC Soil Organic Carbon
xxiii
SOJ State of Jalisco TEEB The Economics of Ecosystems & Biodiversity UNDP United Nations Development Programme UPM Universidad Politécnica de Madrid USD United States Dollar USDA United States Department of Agriculture yr Year

1. INTRODUCTION
1
1. INTRODUCTION
1.1 Research Context
This PhD thesis is based upon studies performed from 2014-2018 within the Department of
Agricultural Economics, Statistics, and Business Management of the School of Agricultural, Food
and Biosystems Engineering at the Universidad Politécnica de Madrid (UPM). This research
received funding from UPM via their contracts for pre-doctoral researchers (Contractors
Predoctorales en el Marco del Programa Propio de Ayudas para el Personal Investigador en
Formación) during the period 2016-2018.
This work was developed, structured, and further funded (2014-2016) by two European
Commission projects. In both cases, Professor Consuelo Varela-Ortega coordinated the UPM
team. These projects were:
ROBIN (The Role Of Biodiversity In climate change mitigatioN). Project No. 283093. 7th
Framework Programme. EU Commission, 2011-2015.
PROTEIN2FOOD (Development of high quality food protein from multi-purpose crops
through optimized, sustainable production and processing methods). Project No.
635727-2. Horizon 2020 Programme. EU Commission, 2015-2020.
The aims of ROBIN (www.robinproject.info) were to: 1) quantify the role of biodiversity in
mitigating climate change in Latin and Meso-American ecosystems; 2) quantify the interactions
from local to regional scales between biodiversity, land use, and the potential for climate change
mitigation. Within ROBIN, three case study sites were developed: Province of Guarayos (Bolivia);
Tapajós National Forest (Brazil) and the Cuitzmala river basin (Mexico). Within the framework
of the project, specific field-work activities and stakeholder interactions were performed in two
case studies: the Province of Guarayos and the Tapajós National Forest. ROBIN provided
foundations to the thesis structuring and knowledge development of two of its component
themes: land-use changes and ecosystem service trade-offs at multiple scales.
PROTEIN2FOOD (www.protein2food.eu) aims to develop innovative, cost-effective, and
resource-efficient food crops that are high in protein, with a positive impact on human health,
the environment and biodiversity. This project is largely concentrated upon the production and
consumption of plant proteins within Europe, specifically EU-28 countries. The work developed
within the framework of PROTEIN2FOOD applied methodologies to highlight the changes in
consumption and production patterns at multiple scales, whilst suggesting potential strategies
to transition these patterns towards more sustainable futures.
To further develop and complement the research carried out at UPM, as part of these European
projects, a research stay was completed at Bioversity International, Costa Rica. The three-month
1. INTRODUCTION
2
stay (September 15th- December 15th, 2017) was performed under the supervision of Dr Jacob
van Etten and funded by a UPM grant (Ayudas a los beneficiarios de los programas predoctorales
oficiales de formación de investigadores para estancias breves en el extranjero). The research
stay was used to refine and develop a methodology for analysing the potential of protein-rich
crops, often cited as potential replacements for animal based products, under future climates
to assist in future decision-making.
1.2 Related Publications
Through the implementation of this investigation a series of publications were developed which
include research articles, presentations in international congresses, and seminars.
Publications
Manners, R. and Varela-Ortega, C. (2018) The role of decision-making in ecosystem service
trade-offs in lowland Bolivia´s Amazonian agricultural systems. Ecological Economics. 153:31-42.
Doi:10.1016/j.ecolecon.2018.06.021.
Manners, R. and Varela-Ortega, C. (2017) Analysing Latin American and Caribbean forest
vulnerability from socio-economic factors. Journal of Integrative Environmental Sciences.
14:109-130. Doi:10.1080/1943815X.2017.1400981
Manners, R. Varela-Ortega, C. and van Etten, J. Protein-rich legume and pseudo-cereal crop
suitability under present and future European climates. European Journal of Agronomy. (Under
Review: EURAGR_2018_50)
Manners, R., Varela-Ortega, C., Blanco, I. and Esteve, P. Developing robust strategies and policy
suggestions for transitioning European protein-rich food consumption and production towards
more sustainable patterns. Food Policy (Under Review: FOODPOLICY_2018_527)
Congresses
Manners, R. and Varela-Ortega, C. Analysing vulnerability to deforestation of Latin American and
Caribbean forests. European Geophysical Union General Assembly. Vienna, Austria. 14th May
2015.
Varela-Ortega, C., Esteve, P., Manners, R., Blanco-Gutiérrez, I. and Barrios, L. Analysis of current
patterns of deforestation in Latin America and the Caribbean. European Society for Ecological
Economics 2015: Transformations. University of Leeds, UK. 1st July 2015.
Blanco, I., Varela-Ortega, C., Manners, R., Esteve, P., Martorano, L. and Toledo, M.
Understanding environmental change through the eyes of locals: a comparative analysis in

1. INTRODUCTION
3
tropical rainforest agro-ecosystems in Bolivia and Brazil. XI Congreso Iberoamericano de
Estudios Rurales. Segovia, Spain. 4th July 2018.
Seminars
Manners, R. and Varela-Ortega, C. Analysing Latin American and Caribbean forest vulnerability:
an alternative approach using a composite index. CEIGRAM, Universidad Politécnica de Madrid.
22nd May 2015.
Manners, R. Agricultural expansion as a driver of change- A multi-scale analysis in Latin America.
IRI-THEsys, Humboldt University, Germany. 27th September 2016.
Varela-Ortega, C., Blanco, I., Manners, R., Sango-Lucas, S. and Esteve, P. WP4 Market Analysis.
Protein2Food annual meeting. Freising-Munich, Germany. 1st March 2018

1. INTRODUCTION
4
1.3 Historic and Contemporary Land Use Changes
In recent centuries and in particular recent decades the pace, scale, and impacts of Land Use
Change and Land Cover Change (LULCC) have become unprecedented (Lambin et al., 2001).
LULCC are changes in biophysical attributes and modifications in the purpose of these attributes
(Lambin et al., 2001). The forces behind these transformations can be natural (e.g. drought, fire,
and disease) or anthropogenic (for habitation, farming, and resource collection). As methods of
anthropogenic driven changes have evolved (from localised slash and burn to industrial
landscape-scale alterations), so have their impacts. Contemporary land use changes are so
pervasive and have escalated to such an extent that they are implicated in driving epoch-
defining extinction rates (Crutzen and Stoermer, 2000; Ceballos et al., 2017), indirectly
threatening systems on which humanity depends (Lobell et al., 2011; Challinor et al., 2014), and
the stability of planetary systems (Houghton et al., 2012; Baccini et al., 2017).
Global forests have been subject to anthropogenic driven transformations for millennia, used as
sources of fuel, building materials, and food (Hughes and Thirgood, 1982; Willis et al., 2004;
Kaplan et al., 2012). Forests have cycled through periods of deforestation1 and reforestation, as
the interventions and intensity of human activities have cycled (Mbida et al., 2000; Berrios et
al., 2002; Willis et al., 2004). Goldewijk and Ramankutty (2001) estimate that global forests
declined by up to 25% from 1700 to 2000. In contrast, croplands and pastures simultaneously
increased by 550% and 660% respectively (Goldewijk, 2001). The pace and scale of modern
deforestation far outstrips pre-industrial and more contemporaneous rates. As of 2015, global
forests covered just over 30% of global land area, totalling 4000 million hectares (Mha), declining
between 3-6% since 1990 (FAO, 2015b; Keenan et al., 2015). The extent and distribution of such
losses (for the period 2000-2012) are presented in Figure 1. Despite these losses, net annual
global deforestation rates are slowly reducing (FAO, 2015b).
However, aggregated global figures mask the spatial diversity of forest losses. Tropical and
subtropical areas saw forest coverage reduce by 9% to 2090 Mha, contrasting with temperate
forest area, which increased by 10% to 680 Mha (Keenan et al., 2015). The majority of these
tropical losses occurred in Latin American and Caribbean (LAC) countries, which saw reductions
of 9.3 Mha (9.7%) from 1990-2014 (FAO, 2015b) (Annex 1: LAC forest area and forest area
changes from 1990-2014). Figure 1 highlights that Latin America, particularly the Amazon basin,
is a hotspot of global forest losses (as highlighted in red).
1 The FAO (2015a) define deforestation as “The conversion of forest to other land use or the permanent reduction
of the tree canopy cover below the minimum 10 percent threshold”.
1. INTRODUCTION
5
Figure 1. Global tree cover extent, loss, and gain for the period 2000- 2012.
Source: Hansen et al. (2013)
1. INTRODUCTION
6
1.4 Impacts of Deforestation
The scale and speed of deforestation and forest degradation represent considerable challenges.
Not least due to the implications and impacts upon forest based ecosystem services (ES). Global
forests are estimated to sequester up to 1400 (± 400) Tg of carbon per year, providing important
regulating services for the global climate (Schimel et al., 2015). In contrast, emissions from
LULCC are estimated between 810-1140 Tg C yr-1 (Baccini et al., 2012; Harris et al., 2012;
Houghton et al., 2012). Recent studies now propose that tropical forests, rather than being net
carbon sinks, may in fact be net carbon sources (Baccini et al., 2017). Baccini et al. (2017) suggest
that emissions from deforestation and reductions in forest carbon density due to degradation,
may be as high as 861.7 ± 80.2 Tg C yr-1. These emissions contribute to climate change and may
subsequently limit the integrity and resilience of globally important regions such as the Amazon
basin (Giles, 2006; Brando et al., 2008; Spracklen and Garcia-Carreras, 2015). Lenton (2011)
suggests that forest conservation is fundamental for limiting global temperature increases
beyond 2°C. Baccini et al. (2017) found that reducing deforestation and forest degradation to
zero could offer a pathway for reducing global emissions by 862 Tg C yr-1, equivalent to 1.8% of
annual global GHG emissions (IPCC, 2014).
A further product of deforestation in LAC countries is its impacts on biodiversity (Achard et al.,
2002; Rosa et al., 2016). Deforestation driven biodiversity losses are acute in highly biodiverse
LAC forest systems (Mittermeier et al., 2003; Peres et al., 2010). An estimated 28 vertebrate
species have recently disappeared in the Amazon alone (Rosa et al., 2016), with greater future
losses expected (Rosa et al., 2016). Liang et al. (2016) suggest that further forest species losses
could have detrimental effects upon global carbon sequestration sinks, coinciding with Baccini
et al. (2017). Deforestation is also associated with profound changes to soil quality (Grimaldi et
al., 2014), with soil organic carbon (SOC) levels in deforested tropical forests found to reduce
(Fujisaki et al., 2017). Lal (2006) suggest that these changes can be linked to reduced crop
production. Coupled to this, Oliveira et al. (2013) found that deforestation may further impact
agricultural output and productivity, concluding that replacement of forests with agricultural
activities may drive a vicious cycle, where more agricultural expansion may reduce productivity
due to precipitation changes. The indirect impacts upon agriculture may already be notable,
with farms growing increasingly larger in order to support incomes, due to ecosystem service
degradation along a deforestation succession continuum (Lavelle et al., 2016). Despite these
observations, Raudsepp-Hearne et al. (2010) conclude that the social benefits of deforestation
gained via increased food production, outweigh the costs to other ecosystem services, at the
global scale. At more localised scales, Barbier et al. (2008) found that the impacts from
ecosystem services losses due to agricultural activities can be extensive.
Destruction of natural capital (e.g. deforestation) and human appropriation of ecosystem
services may be driving an environmental debt, that may not currently have widespread socio-
economic impacts globally, but progressively impacts are predicted to be large (Lal, 2006; Foley
et al., 2007; Rodrigues et al., 2009). This debt could manifest itself environmentally, through soil
1. INTRODUCTION
7
degradation and reduced water quality affecting agricultural activities (Raudsepp-Hearne et al.,
2010), but also could have social impacts through the effects of ES losses on human wellbeing
(e.g. Sandifer et al., 2015). ES losses have been linked to increased stress (Fritze et al., 2008),
declining life satisfaction (Carroll et al., 2009), and increased anxiety (Satore et al., 2008). Social
impacts of ES losses directly associated with agricultural activities have been implicated in
increased financial pressures, population declines, and reduced employment opportunities due
to reduced productivity and land values (e.g. Staniford et al., 2009; Caldwell and Boyd, 2009).
1.5 Drivers and Causes of Deforestation
Deforestation events are highly site-specific, but may follow predictable temporal and spatial
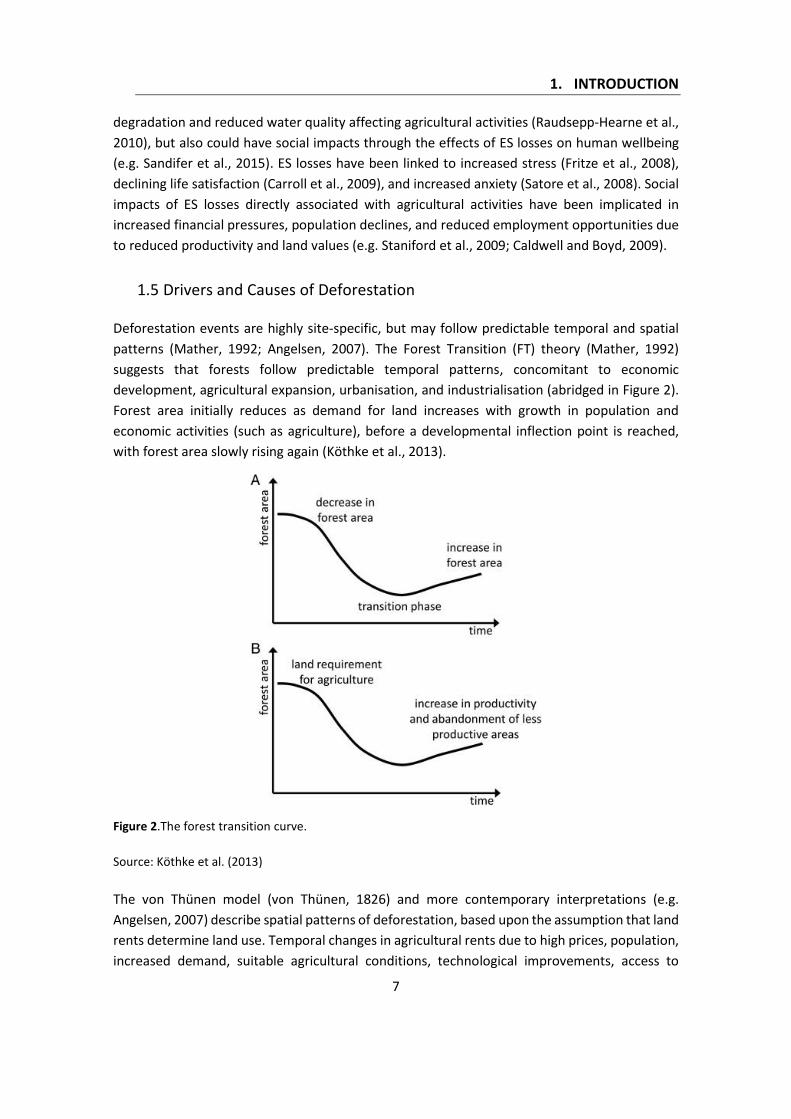
patterns (Mather, 1992; Angelsen, 2007). The Forest Transition (FT) theory (Mather, 1992)
suggests that forests follow predictable temporal patterns, concomitant to economic
development, agricultural expansion, urbanisation, and industrialisation (abridged in Figure 2).
Forest area initially reduces as demand for land increases with growth in population and
economic activities (such as agriculture), before a developmental inflection point is reached,
with forest area slowly rising again (Köthke et al., 2013).
Figure 2.The forest transition curve.
Source: Köthke et al. (2013)
The von Thünen model (von Thünen, 1826) and more contemporary interpretations (e.g.
Angelsen, 2007) describe spatial patterns of deforestation, based upon the assumption that land
rents determine land use. Temporal changes in agricultural rents due to high prices, population,
increased demand, suitable agricultural conditions, technological improvements, access to
1. INTRODUCTION
8
credit and infrastructure development are posited to increase deforestation rates, before
reductions or stabilisation in rents reduce deforestation and eventually reforestation (Angelsen,
2007). Although the processes behind these suggested patterns of deforestation can be highly
specific, the general forces of deforestation were elegantly presented in the seminal paper by
Geist and Lambin (2002) as proximate causes and underlying drivers.
Proximate causes are direct human activities such as agricultural expansion (Aide et al., 2013),
expansion of infrastructure (Hosunuma et al., 2012), and wood extraction (Echeverria et al.,
2008). These causes are in many cases intertwined and mutually dependent, with agricultural
expansion coinciding with infrastructure expansion. This expansion is driven by demands for
resources including arable land and timber, with timber extraction being the result of both
agricultural expansion and infrastructure development (Laurance et al., 2014). The impacts of
these causes are not limited to deforestation, but also extend to biodiversity loss, land-use
conflicts, aquatic system functionality, and climate change (Asner et al., 2009; Michalski and
Peres, 2013; Laurance et al., 2014; Machovina and Feeley, 2014; Baccini et al., 2017).
The underlying drivers behind these causes are highly diverse, site-specific social processes
(Geist and Lambin, 2002). In many cases it is not a single driver, but a series of often self-
reinforcing processes, which create the socio-economic conditions that drive deforestation
events. Demographic conditions are one of the most widely recognised of these processes;
population growth, immigration, and population densities are widely associated with
deforestation (Goldewijk, 2001; Scrieciu, 2007; Huang et al., 2007; Bonilla-Moheno et al., 2012).
The role of poor governance has also been observed to encourage conditions for resource
extraction and deforestation (Fearnside, 2006). Ineffective governance can drive land tenure
insecurity, with farmers using land clearing and deforestation as a means of establishing land
titles in conditions of insecurity (Angelsen and Kaimowitz, 1999; Müller et al., 2014). The benefits
of strong governance and democratic institutions for balancing natural resource conservation
with socio-economic development are well explored (Didia, 1997; Nepstad et al., 2014;
Wehkamp et al., 2018).
The role of infrastructure in deforestation is complex, not only being a cause, but also a driver
(Müller et al., 2012). Further, improvements and expansion in infrastructure can also permit
access to more efficient agricultural technology and methods, which have also been described
as a driver of deforestation (Gasparri and Grau, 2009).
Economic factors and economic development are recognised and fundamental to the
aforementioned spatial (Angelsen, 2007) and temporal (Köthke et al., 2013) patterns of
deforestation. Economic development is often documented as a precursor to deforestation,
with increased wealth increasing resource use and lifestyle improvements, driving greater
utilisation of resources and need for land to further support and continue these patterns.
However, economic factors as drivers are not concrete, but can be fluid, with per capita
affluence suggested to both encourage and suppress deforestation, stimulating demand at the

1. INTRODUCTION
9
individual level, whilst improving conservation efforts at the government level (Angelsen and
Kaimowitz, 1999) as modelled by the FT. In recent years and within an increasingly globalised
and interconnected economy, a particularly important affluence based driver of deforestation
has manifested itself in dietary changes, with increasingly wealthier individuals consuming more
resource intensive products, like animal products (Godfray et al., 2010; Kastner et al., 2012; de
Ruiter et al., 2014).
1.6 Forest Vulnerability and Landscape-Scale Trade-Offs
The wealth of studies dedicated to the drivers and causes of deforestation highlight not only
their diversity, multi-scalar nature, but also in many cases the increments in their intensity. The
identification of these factors and their associated effects upon forest area are suggestive of
forest vulnerability to their presence. Using a positivist slant, Turner et al. (2003) defines
vulnerability as the harm experienced from exposure to a hazard(s). If such a definition is applied
to forest ecosystems, then their exposure to the aforementioned drivers and causes, implies
their vulnerability from continued exposure.
Previous analyses of forest vulnerability although diverse, invariably concentrated upon, with
good reason, climatic conditions and fire (e.g. Allen et al., 2015; Nurdina and Risdiyanto, 2015;
Amalina et al., 2016; Mildrexler et al., 2016). These analyses indirectly studied vulnerability to
socio-economic development, through the guise of anthropogenic driven climate change
induced drought, or fire hazards. However, limited analysis has been dedicated to the explicit
relationship between socio-economic dynamics and forest vulnerability. Although examples can
be found where socio-economic factors have been integrated within vulnerability analyses (e.g.
Chuvieco et al., 2014; Vogt et al., 2016), analyses of direct vulnerability of forests to socio-
economic factors are limited. Vilar et al. (2014) addressed the explicit link between socio-
economic factors and anthropogenic driven forest fires. They highlighted the heterogeneity of
vulnerability at multiple scales and the significant vulnerability of forests to certain socio-
economic factors. These findings suggest the potential for quantifying direct links between
forest vulnerability and socio-economic processes. Such quantification could offer a better
resolved and more accurate interpretation of the state of contemporary forests, strengthening
and diversifying the toolbox for forest management (Pretzsch et al., 2008).
As outlined, the increments in causes and drivers of deforestation have likely driven the
contemporary state of modern LAC forests, where the scale and speed of deforestation and
forest degradation represents a considerable challenge for humanity, due to the implications
and impacts upon the ES that forests provide. These services are manifold and are fundamental
to global systems (Malhi et al., 2008; Aragão, 2012). However, the scale of forest losses may
undermine the capacity of forests to sustain these services at current levels (Nepstad et al.,
2008; Oliveira et al., 2013; Lapola et al., 2014). In particular, forests' capacity for climate
regulation (Saatchi et al., 2011; Harris et al., 2012; Baccini et al., 2017) and habitat integrity
(Haddad et al., 2015) is now being questioned. Agricultural activities, as a product of socio-
1. INTRODUCTION
10
economic processes and development, are now implicit contributors to multi-scale trade-offs of
ecosystem service provision, and are complicit in threatening global systems. Lavelle et al.
(2016) elegantly display the progressive nature of these trade-offs, with human well-being,
agricultural production, and income indices rising as biodiversity and regulating ecosystem
services decline along the succession from intact forest to agricultural landscapes.
Although the environmental impacts of deforestation are, as demonstrated, large and wide-
ranging, the provisioning of food, fuel, building materials, employment, and incomes from these
activities (Foley et al., 2007) are important for rural development (DeFries et al., 2004). The
positive social impacts, or benefits, of deforestation are understood, with human development
improvements coming at the cost of natural capital losses. Newton et al. (2013) suggest that
agricultural expansion in forest regions also represents a wider conflict between development
and conservation, with forests conserved for their wider societal benefits (Gibson et al., 2011),
and agricultural areas expanding to stimulate rural economic development (Diversi, 2014). The
Millennium Ecosystem Assessment found that over the 50 years analysed, human well-being
improved concomitantly with the destruction and conversion of natural landscapes (Millennium
Ecosystem Assessment [MEA], 2005). This observation is further supported by Rodrigues et al.
(2009) who found that human development improves during the early stages of land use change
and deforestation. Lavelle et al. (2016) observed that conversion of forests to agricultural
activities can also be associated in some cases with improved social well-being due to reduced
isolation, improved health care and education, and connection to infrastructure.
The trade-offs between environmental integrity and socio-economic development present
particular issues for land-use planning (Goldstein et al., 2012). Braat and de Groot (2012)
propose the need to identify balances between multiple ES to improve land-use management.
Balvanera et al. (2012) suggest that analysis of management strategies in ES relationships can
facilitate decision-making and policy development. It could also assist in reducing conflicts and
identifying efficient management solutions (Viglizzo et al., 2006; Power, 2010; White et al.,
2012). Lavelle et al. (2016) offer that analysis and subsequent optimisation of these trade-offs
could offer a sustainable route forward in highly conflict-ridden regions and improve land-use
efficiency (Godar et al., 2014).
Although analysis of these relationships is important, it should not negate the importance of
stakeholder preference and decision-making in driving their development. Understanding the
role of decision-making in these dynamic situations and the subsequent impacts upon ES is
imperative (Nelson et al., 2008). To develop sustainable solutions to antagonistic situations,
recognition and analysis of divergent preferences of stakeholders, or decision-makers, within a
system is necessary (King et al., 2015; Cavender-Bares et al., 2015). Consideration of the inherent
role of decision-making in ES relationships is therefore important for future policy making and
land-use planning (Goldstein et al., 2012). Investigating ES relationships and decision-making
may avoid undermining the long-term provision of certain ES through unsustainable exploitation
(Raudsepp-Hearne et al., 2010; Dearing et al., 2012).
1. INTRODUCTION
11
1.7 Dietary Change as a Global Driver of Change
An array of studies has highlighted how global dietary changes have contributed to increasingly
degraded and conflict-ridden systems (Godfray et al., 2010; Foley et al., 2011; Aide et al., 2013;
Machovina et al., 2015). Agriculture accounts for up to 35% of anthropogenic greenhouse gas
emissions (Foley et al., 2011; Vermeulen et al., 2012), 80% of which is associated with livestock
rearing (Tubiello et al, 2013). Dietary changes are now so acute that animal production
dominates global agricultural land-use, occupying (directly or indirectly) at least 75% of
agricultural land (Steinfeld et al., 2006; Alexander et al., 2015; Ranganathan et al., 2016).
These figures are the manifestation of socio-economic driven shifts in global diets (Kastner et
al., 2012). Larger, wealthier, and increasingly urban populations have shifted from cheaper
plant-based foods, to costlier diets rich in animal products (Vranken et al., 2014). Popkin (1997)
identified the link between socio-economic development and consumption transitions towards
animal based products. Delgado (2003) demonstrated the acuteness of these changes in
developing regions. More recently, Sans and Combris (2015) found that global consumption of
animal products has increased by almost 30% since 1961, with animal proteins accounting for
37-40% of dietary protein (Boland et al., 2013; Poore and Nemecek, 2018). In wealthier regions,
this figure is even greater, with de Boer et al. (2006) and Bonhommeau et al. (2013) observing
that animal proteins supply the majority of dietary protein in contemporary European and North
American diets. These shifts are so great that average global protein consumption now exceeds
recommended allowances (Ranganathan et al., 2016). Machinova and Feeley (2014) describe
these trends as one the greatest threats to biodiversity and tropical ecosystems, a conclusion
echoed by Tilman and Clark (2014).
Expansion in arable land and pastures (Figure 3a and b) to supply feed crops for livestock have
been identified to come at the expense of native forests in LAC countries (Steinfeld et al., 2006;
McAlpine et al., 2010; Aide et al., 2013). The scale of these expansions across LAC countries is
evident in Annex 2 (LAC arable area and arable area changes from 1990-2014) and Annex 3 (LAC
grassland area and grassland area changes from 1990-2014). The production of soya in LAC has
been key to satisfying the burgeoning global market for animal products (Aide et al., 2013).
Figure 3a evidences the extent of these changes highlighting the soya area harvested in LAC to
supply the demands of global pork and poultry production which has more than doubled since
1990. Pastures have increased across LAC (Figure 3b) to support the growing LAC cattle stocks.

1. INTRODUCTION
12
Figure 3. Land-use change and export products relationship in South America.
Note: A) Global pig and poultry production and soybean production in South America. B) Permanent
pastures in South America and mean bovine exports.
Source: Updated from Aide et al. (2013) using FAO data (FAO, 2018a).
In the 15 years from 2000-2015, total soya exports from the most important LAC producers
(Brazil, Argentina, Bolivia, Paraguay, and Uruguay) increased by more than 350% (20-72 million
tonnes) (UN Comtrade, 2017). Furthermore, a geographical shift in importing regions reflects
the global-scale and geographical shift (associated with economic development) of these dietary
changes. In 2015, more than 80% of exports were sent to Asia, compared to 32% in 2000. In
Europe, soya imports from LAC producers remained relatively stable (UN Comtrade, 2017).
Despite this, European livestock feed-stuffs are largely imported, with imported soybean
accounting for 97% of soybean supply (de Visser et al., 2014). These imports have now largely
replaced domestic production of protein-rich feed-stuffs, in particular legumes (Zander et al.,
2017). The environmental impacts of these imports are sizable, with de Visser et al. (2014)
estimating that European soya imports are equivalent to roughly 13 Mha of arable land outside
of Europe.
Continued expansion of diets rich in animal products are widely expected (Bailey et al, 2014;
Tilman and Clark, 2014; Ranganathan et al., 2016), even in wealthier regions like the European
Union (Bodirsky et al., 2015; Ranganathan et al., 2016). The long-term consequences of
maintenance of these changes have led to suggestions that without future targeted dietary
changes, the associated environmental and health impacts will be grave (e.g. Springmann et al.,
2016; Etemadi et al., 2017), especially considering global population growth (Tilman et al., 2011).
The United Nations Environment Programme (UNEP, 2010) conclude that reduction of the
environmental impacts from agriculture can only be achieved through substantial dietary
changes.
The benefits of reversing current and projected future trends in animal product consumption
and stimulating future consumption transitions less reliant upon animal products for dietary
protein have been widely espoused from environmental (Cassidy et al., 2013; West et al., 2014;
Tilman and Clark, 2014; Schader et al., 2015; Erb et al., 2016), human health (Larsson and Wolk,
1. INTRODUCTION
13
2006; Tilman and Clark, 2014; Bouvard et al., 2015; Springmann et al., 2016), and financial
perspectives (Springmann et al., 2016). Targeted changes to reduce meat consumption could
cut dietary based emissions between 29-70% (Springmann et al., 2016), supply adequate dietary
calories to over 10 billion people (Cassidy et al., 2013), avert 5-8 million health related avoidable
deaths (Springmann et al., 2016), and reduce deforestation driven by agricultural activities to
zero (Erb et al., 2016).
Adoption of the ‘Mediterranean’ (Tilman and Clark, 2014), vegetarian or vegan diets (Cassidy et
al., 2013; Erb et al., 2016) high in plant products and proteins from cereals or legumes (Hedenus
et al., 2014), or diets with reduced total protein consumption (Ranganathan et al., 2016) have
been proposed as beneficial consumption end-points. Henchion et al. (2017) and Harwatt et al.,
(2017) evidence the potential of legumes in these changes, due to their high protein content
(United States Department of Agriculture [USDA], 2017), nutrient density (USDA, 2017), general
health benefits (Delgado-Andrade et al., 2016; Clemente and Olias, 2017), limited environmental
impacts (Springmann et al., 2017; Poore and Nemecek, 2018), and agronomic benefits (Watson
et al., 2017). Legumes are in many cases more nutrient dense, with comparable protein
contents, compared to protein rich cereals (e.g. wheat) (USDA, 2017), which can be a more
common source of plant based dietary protein (Food and Agricultural Organization [FAO],
2016a). Despite these benefits, legume cultivation is limited across much of the world, the EU in
particular has seen long-term production declines over recent decades (Magrini, et al. 2016). A
series of agronomic (unstable yields), social (low demand), and economic (path dependency)
factors have been implicated in these declines (Voison et al. 2014; Reckling et al. 2015, Magrini
et al., 2016). de Boer et al. (2006) suggest that consumption of these products has also seen
widespread declines across the EU.
Notwithstanding observed increases in the levels of vegetarianism in developed countries
(Beverland, 2014) and the renewed importance that consumers attach to health and ethical
factors in their diets (Wirsenius et al., 2010), consumer perceptions of future dietary trends
suggest that shifts to vegetarianism and veganism are distant and unlikely (Judge and Wilson,
2015). Further, demand for protein-rich legumes is projected to decline across the European
Union (Bodirsky, personal communication). Therefore, dramatic shifts in consumer attitudes
would be required to achieve advocated consumption changes (Wirsenius et al., 2010; Ritchie
et al., 2018). These observations evidence a divergence between two modelled futures: an
idealised future landscape, where environmental and health impacts of animal product
consumption and production are reduced, or eliminated; versus a projected future landscape,
where current trends in consumption and production continue.
Idealised future conditions (e.g. Cassidy et al., 2013; Springmann et al., 2016) characterise
significant cultural and agronomic systemic changes with wide-spread vegetarianism and
veganism. The beneficial impacts of these changes are often presented and discussed in the
narrow terms of mechanisms for their achievement (e.g. taxation of animal products) and the
subsequent effects (e.g. reduced dietary based emissions). However, characterisation of
1. INTRODUCTION
14
strategies and policy requirements to encourage such cultural and agronomic changes described
in these idealised futures are often omitted. This is not a criticism of such approaches, the utility
of which are unquestionable for framing the argument for the need of dietary changes and
presenting potential future conditions. These omissions do however make it necessary to begin
to define strategies and required policy options to encourage a shift from the present, to an
idealised future.
However, in modelling futures and considering options of moving towards more desirable
futures, it is prudent not to consider production and consumption patterns in a vacuum.
Considerations need also be made of other future global changes. As agriculture is one of the
economic sectors most exposed to climate change (Hansen, 2002), any analysis of future
production activities should also be considerate of climate change and its potential impacts.
Estimated global temperature increases between 1.5°-4.9°C by 2100 (Intergovernmental Panel
on Climate Change [IPCC], 2014; Raftery et al., 2017) are likely to have profound effects upon
crop distribution (Chaves et al., 2003), production and productivity (Delgado et al. 2011), and
farm-scale decision-making (Jones and Thornton, 2008). Consideration of these observations
should therefore be included in any future analysis of production activities, and identifying
potential protein-rich crops to replace animal products.
Both Tol et al. (2004) and Lobell et al. (2011) observe notable impacts of climate change in global
agricultural activities, with future changes widely expected (Challinor et al., 2014). Large-scale
analyses of climate change impacts however have largely concentrated upon major crops
(maize, wheat, soya, and rice) for which well-developed crop growth models are available (e.g.
Rosenzweig et al., 2014; Challinor et al., 2014). Despite the observed and modelled impacts,
little research attention has been paid to the potential impacts of climate change on minor
crops, like protein-rich legumes. Analyses for these crops (excluding soya) are limited, with
exceptions (e.g. Basu et al., 2016; Ramirez-Cabral et al., 2016; Mohammed et al., 2017).
Unfortunately, such analyses are almost non-existent across Europe.
It seems judicious therefore, with the potential importance of protein-rich crops for replacing
animal products in the future, to address this knowledge gap. Bridging this gap may provide a
foundation for reactive future planning of European agricultural systems in the face of climate
change. It may also provide a resource for encouraging greater production of protein-rich crops
in European agriculture.
1.8 Research Objective
The magnitude and complexity of studying land use changes, ecosystem conservation, rural
livelihoods, and food production suggests the need for a multi-scalar methodological approach.
Such a methodology should have the capacity to incorporate and analyse drivers, impacts, and
trade-offs, but also allow for the identification of social, political, and economic responses to
improve them or ameliorate their impacts. This approach should also provide a platform for
1. INTRODUCTION
15
incorporating the perspectives and inputs of stakeholder groups. From this research, it is hoped
that an integrated and contemporary perspective of deforestation, food production, and
ecosystem service trade-offs can be derived, whilst further illuminating the socio-natural inter-
linkages of these processes.
To respond to this, the overall objective of this research is to analyse the role of socio-economic,
environmental, and institutional factors in Latin American and Caribbean deforestation, whilst
investigating historical trends in consumption and production patterns of protein-rich products,
and outlining strategies for the future to address these changes in the European Union.
The specific objectives of the research can be summarised as follows:
To develop and implement an interdisciplinary methodology to analyse deforestation,
ecosystem service trade-offs, and food production, incorporating the multi-scalar
problems and the dynamic interactions that take place between the drivers, causes, and
impacts of these processes.
To quantify how multi-scale socio-economic conditions can drive or inhibit the
vulnerability of forests to deforestation at multiple scales across Latin America and
Caribbean countries.
To analyse the balance between socio-economic development and environmental
conservation in agricultural-forest systems of Latin America at the farm scale, assessing
the particular role of decision-makers and policy implementation in affecting this
balance.
To evaluate global and continental dietary changes, identify current barriers and
opportunities for consumption and production shifts, and define potential strategies for
future consumption changes across the European Union.
To explore the potential of protein-rich crops, as replacements of animal products as
part of these consumption changes, under future climates across the European Union
To identify potential actions and strategies that could be implemented to improve long-
term environmental and socio-economic conditions within deforesting nations, or in
regions exerting indirect deforestation pressure to reduce pressures.
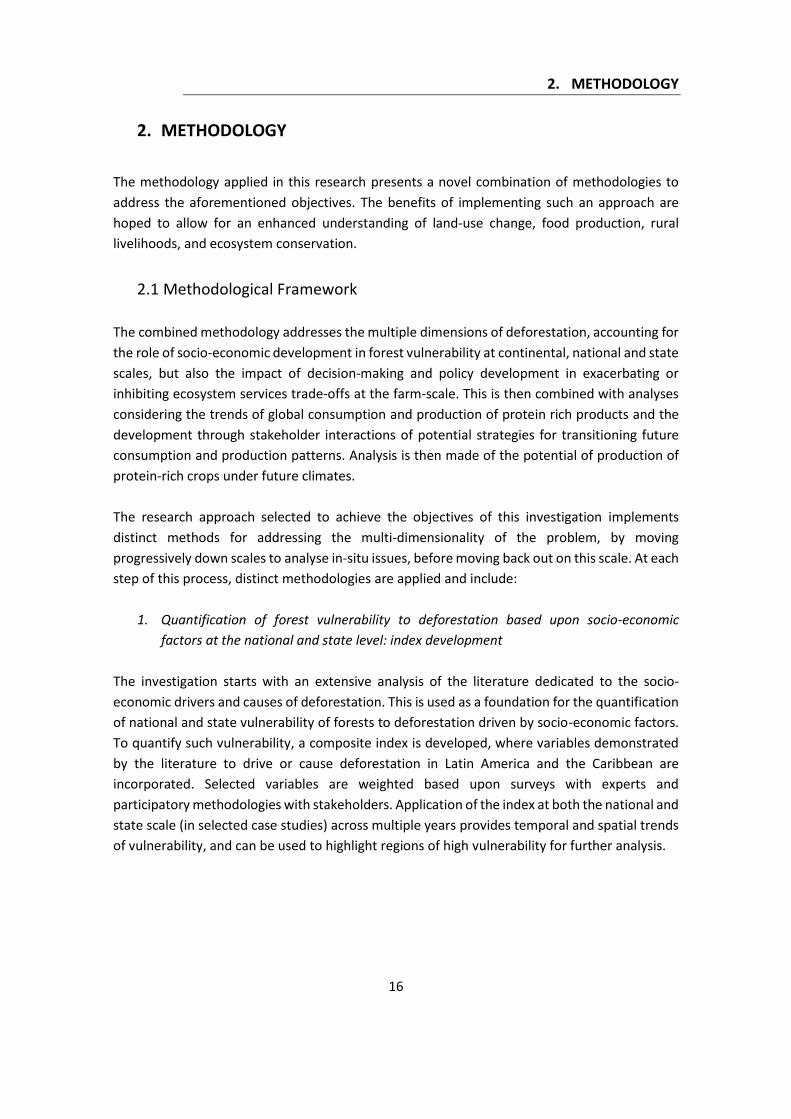
2. METHODOLOGY
16
2. METHODOLOGY
The methodology applied in this research presents a novel combination of methodologies to
address the aforementioned objectives. The benefits of implementing such an approach are
hoped to allow for an enhanced understanding of land-use change, food production, rural
livelihoods, and ecosystem conservation.
2.1 Methodological Framework
The combined methodology addresses the multiple dimensions of deforestation, accounting for
the role of socio-economic development in forest vulnerability at continental, national and state
scales, but also the impact of decision-making and policy development in exacerbating or
inhibiting ecosystem services trade-offs at the farm-scale. This is then combined with analyses
considering the trends of global consumption and production of protein rich products and the
development through stakeholder interactions of potential strategies for transitioning future
consumption and production patterns. Analysis is then made of the potential of production of
protein-rich crops under future climates.
The research approach selected to achieve the objectives of this investigation implements
distinct methods for addressing the multi-dimensionality of the problem, by moving
progressively down scales to analyse in-situ issues, before moving back out on this scale. At each
step of this process, distinct methodologies are applied and include:
1. Quantification of forest vulnerability to deforestation based upon socio-economic
factors at the national and state level: index development
The investigation starts with an extensive analysis of the literature dedicated to the socio-
economic drivers and causes of deforestation. This is used as a foundation for the quantification
of national and state vulnerability of forests to deforestation driven by socio-economic factors.
To quantify such vulnerability, a composite index is developed, where variables demonstrated
by the literature to drive or cause deforestation in Latin America and the Caribbean are
incorporated. Selected variables are weighted based upon surveys with experts and
participatory methodologies with stakeholders. Application of the index at both the national and
state scale (in selected case studies) across multiple years provides temporal and spatial trends
of vulnerability, and can be used to highlight regions of high vulnerability for further analysis.

2. METHODOLOGY
17
2. Analysis of the role of decision-making in farm-scale trade-offs between forest
conservation and agricultural expansion: multi-objective goal programming
Analysis of national and state scale vulnerability may provide improved understanding of the
impacts of socio-economic development. However, it cannot offer an insight into the role of
lower-scale decision-making in these processes. To address this, a farm-scale mathematical
programming model was developed, applying multi-objective goal programming (MOGP) across
a series of representative farms in a selected case study (Department of Santa Cruz, Bolivia). The
model analyses the relationship between two potential farm-scale ecosystem service goals: net
farm income and net farm carbon sequestration. The model further permits the analysis of the
role of decision-making in these relationships, through parametric changes to preference
weights for achievement of each goal. The use of this model allows for the application of two
policy scenarios: Conservation of Ecosystem Services and Socio-Economic Development. These
scenarios were developed to identify how the ecosystem service relationships and the role of
decision-makers might alter under the conditions of opposing policy scenarios developed to
encourage ecosystem service conservation and socio-economic development.
3. Identification of global and continental trends of animal product consumption and
exploration of strategies for attaining desirable future consumption and production
changes: trend analysis and participatory assessment
To identify how consumption and productions trends of protein-rich products (animal and
vegetable) have evolved in recent decades across the world trend analyses of consumption and
production at global, continental, and national scales is presented. This is combined with
participatory analyses to: identify current barriers and opportunities for plant-protein
consumption and production in the European Union; develop potential strategies for achieving
desirable consumption and production futures in the EU. These participatory analyses were
developed through interactions with pan-European stakeholders.
4. Modelling how future climate change may affect one of the principal solutions cited to
reduce deforestation at the national-scale: biophysical crop modelling
Finally, as a means of measuring the potential for meat replacement products in the EU under
future climates, a crop suitability model is developed and applied to a group of protein-rich
crops. Climate change may have an important role in defining which potential crop options
might be suitable for farmers in the future across the EU. This analysis identifies climate change
impacts at national scales, whilst also suggesting the best protein-rich crop options for
production at landscape (4 km2) scale.
Figure 4 summaries the methodological framework of this research.
2. METHODOLOGY
18
Figure 4. Methodological framework of thesis investigation.
2. METHODOLOGY
19
2.2 The Areas of Study
The multi-dimensionality of the challenges facing Latin American and Caribbean forests, as
outlined above, infers the need for a dynamic approach to analyse the process of deforestation,
ecosystem conservation, rural livelihoods, and food production at multiple scales and from
various perspectives. Such an approach will assist in providing a more resolved and diverse
analysis, attendant to the complexity of the problem. As such, the methodology will be
developed at global, continental, national, state, and farm-scales.
Continental
At the continental scale, the wider drivers and patterns of deforestation are addressed to
provide a context for more detailed and downscaled analyses that follow. At this scale, forest
vulnerability across Latin America and the Caribbean will be quantified during the period 2000-
2010. Further, at this scale trends of historical protein products consumption and production
will be outlined for the period 1961-2013. Future strategies for achieving consumption and
production changes will also be assessed at the continental scale.
National
Moving down the scales, the majority of the focus of this investigation will be based at the
national scale. At this scale, temporal patterns of vulnerability to deforestation stemming from
socio-economic factors will be analysed for all LAC countries. Analysis of vulnerability at this
scale will permit mapping of temporal and spatial trends, within the wider context of continental
patterns. This national scale approach will also be applied to examine consumption and
production trends of protein products across EU Member States (MS). This scale will also be
used to investigate the response of protein-rich to the conditions of future European climates.
State
To derive more resolved conclusions of the role of socio-economic processes in driving
vulnerability in Latin American forests, three state (sub-national) case studies were developed:
The Department of Santa Cruz (Bolivia), the State of Pará (Brazil), and the State of Jalisco
(Mexico). Each case study is highlighted in dark grey in Figure 5. These case-studies were also
selected as part of the ROBIN project. Each case study site, although distinct, does share many
characteristics: seeing high levels of land-use change in recent years, economically dependent
upon agricultural activities, low-levels of socio-economic development, and high population
growth. More detailed information for each of these case-study sites is provided below:

2. METHODOLOGY
20
Figure 5. Case study sites
Note: The Department of Santa Cruz (Bolivia), the State of Pará (Brazil), the State of Jalisco (Mexico) all in darkest grey. The Province of Guarayos (blue) within the Department of Santa Cruz.
The Department of Santa Cruz
The Department of Santa Cruz (DSC) is the largest of Bolivia's 9 departments. It represents
roughly a third of Bolivia´s land surface area (370,621 km2). The population of DSC has grown
30%, at a rate of 2.6%/year since 2001, to 2.65 million inhabitants (Instituto Nacional de
Estadistica [INE], 2012a). The DSC is one of the most developed of Bolivia's departments, with a
HDI value of 0.689 (United Nations Development Programme [UNDP], 2004). Despite this, the
department suffers from high and increasing levels of poverty, with 35.5% of the population
living below the poverty line in 2012, increasing from (31.8%) in 2001 (INE, 2001; INE, 2012a).
The department also sustains high levels of official unemployment, with only 49.2% of the
working age population in work (INE, 2012a). The biggest employers in the department are
commerce and transport (27%), non-specified employment (26%), and agriculture (15%) (INE,
2012a).
The importance of Santa Cruz to Bolivian agriculture is considerable, with the DSC accounting
for 70.1% of Bolivia's cultivated area (INE, 2017a). Crop cultivation covers 6.9% of the
department's land surface area, more than doubling in the 15 years from 2001-2016 to 25,519
km2 (Figure 6a). Soya is the most widely cultivated crop, occupying 1.3 Mha, or 51.9% of the
department's arable land area. This represents a doubling in soya cultivated area from the
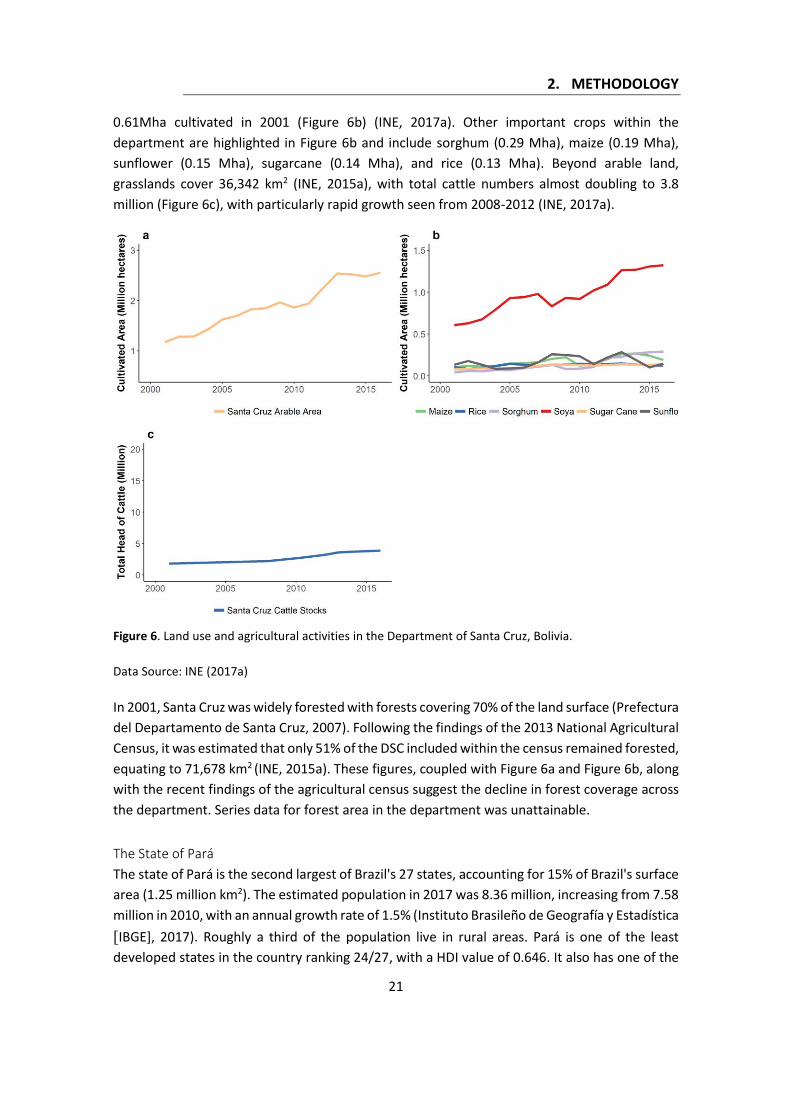
2. METHODOLOGY
21
0.61Mha cultivated in 2001 (Figure 6b) (INE, 2017a). Other important crops within the
department are highlighted in Figure 6b and include sorghum (0.29 Mha), maize (0.19 Mha),
sunflower (0.15 Mha), sugarcane (0.14 Mha), and rice (0.13 Mha). Beyond arable land,
grasslands cover 36,342 km2 (INE, 2015a), with total cattle numbers almost doubling to 3.8
million (Figure 6c), with particularly rapid growth seen from 2008-2012 (INE, 2017a).
Figure 6. Land use and agricultural activities in the Department of Santa Cruz, Bolivia.
Data Source: INE (2017a)
In 2001, Santa Cruz was widely forested with forests covering 70% of the land surface (Prefectura
del Departamento de Santa Cruz, 2007). Following the findings of the 2013 National Agricultural
Census, it was estimated that only 51% of the DSC included within the census remained forested,
equating to 71,678 km2 (INE, 2015a). These figures, coupled with Figure 6a and Figure 6b, along
with the recent findings of the agricultural census suggest the decline in forest coverage across
the department. Series data for forest area in the department was unattainable.
The State of Pará
The state of Pará is the second largest of Brazil's 27 states, accounting for 15% of Brazil's surface
area (1.25 million km2). The estimated population in 2017 was 8.36 million, increasing from 7.58
million in 2010, with an annual growth rate of 1.5% (Instituto Brasileño de Geografía y Estadística [IBGE], 2017). Roughly a third of the population live in rural areas. Pará is one of the least
developed states in the country ranking 24/27, with a HDI value of 0.646. It also has one of the
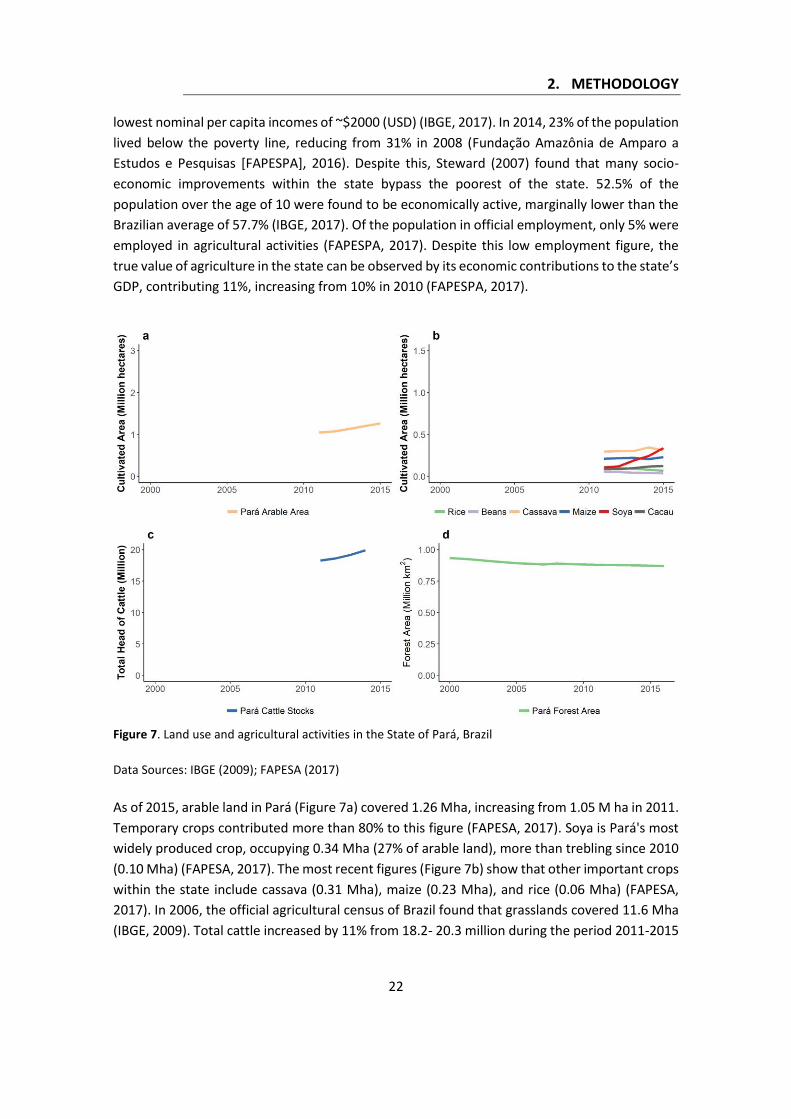
2. METHODOLOGY
22
lowest nominal per capita incomes of ~$2000 (USD) (IBGE, 2017). In 2014, 23% of the population
lived below the poverty line, reducing from 31% in 2008 (Fundação Amazônia de Amparo a
Estudos e Pesquisas [FAPESPA], 2016). Despite this, Steward (2007) found that many socio-
economic improvements within the state bypass the poorest of the state. 52.5% of the
population over the age of 10 were found to be economically active, marginally lower than the
Brazilian average of 57.7% (IBGE, 2017). Of the population in official employment, only 5% were
employed in agricultural activities (FAPESPA, 2017). Despite this low employment figure, the
true value of agriculture in the state can be observed by its economic contributions to the state’s
GDP, contributing 11%, increasing from 10% in 2010 (FAPESPA, 2017).
Figure 7. Land use and agricultural activities in the State of Pará, Brazil
Data Sources: IBGE (2009); FAPESA (2017)
As of 2015, arable land in Pará (Figure 7a) covered 1.26 Mha, increasing from 1.05 M ha in 2011.
Temporary crops contributed more than 80% to this figure (FAPESA, 2017). Soya is Pará's most
widely produced crop, occupying 0.34 Mha (27% of arable land), more than trebling since 2010
(0.10 Mha) (FAPESA, 2017). The most recent figures (Figure 7b) show that other important crops
within the state include cassava (0.31 Mha), maize (0.23 Mha), and rice (0.06 Mha) (FAPESA,
2017). In 2006, the official agricultural census of Brazil found that grasslands covered 11.6 Mha
(IBGE, 2009). Total cattle increased by 11% from 18.2- 20.3 million during the period 2011-2015

2. METHODOLOGY
23
(Figure 7c) (FAPESA, 2017). These contemporary values represent a dramatic increase from the
13.9 million cows identified in the agricultural census of 2006 (IBGE, 2009).
Ioris (2016) found that Pará has a long history of deforestation, migration and conflicts, relating
to agricultural activities. Simmons (2004) suggests these conflicts stem from the state’s resource
wealth. In 2000, Pará was 74% forested, covering 0.93 million km2 (Instituto Nacional de
Pesquisas Espaciais [INPE], 2017). By 2016, forest cover had reduced to 70% (0.87 million km2)
(Figure 7d) (INPE, 2017). During this same period, deforestation rates were found to have
declined from a peak of 11,271 km2 in 2003, to 1784 km2 in 2014. However, in 2015 and 2016
this rate rose for the first time in a decade, in 2016 standing at 2693 km2 (INPE, 2017).
The State of Jalisco
The State of Jalisco (SOJ) is the 7th largest of Mexico’s 31 states, occupying roughly 4% of the
national land surface area (80,228 km2). The SOJ’s population grew 7% to 7.84 million, during
the period 2010-2015 (Instituto Nacional de Estadística y Geografía [INEGI], 2018a). In 2010, the
SOJ had lower than average socio-economic development, with a HDI value of 0.673 (INEGI,
2018a), whilst the national value stood at 0.745 (UNDP, 2016). In 2016, 31.8% of the population
lived in conditions of poverty, with 1.8% in extreme poverty (INEGI, 2018b). Despite this, the SOJ
had one of the highest per household incomes of $7,724 in 2014 (INEGI, 2018b). As of 2014,
61.6% of the working population was found to be economically active, higher than the national
average of 59.1% (INEGI, 2018b). Of the working population, 5.3% were employed in agricultural
activities in 2014, increasing from 4.7% in 2010 (INEGI, 2018a).
2. METHODOLOGY
24
Figure 8. Land use and agricultural activities in the State of Jalisco, Mexico
Data Sources: SIAP (2018a); SIAP (2018b); SIAP (2018c); CONAFOR (2014)
In 2016, 1.64 Mha of SOJ was covered by arable lands (Figure 8a), increasing from 1.53 Mha in
2004 (Servicio de Información Agroalimentaria y Pesquera [SIAP], 2018a). This represents
roughly 20% of the SOJ’s land surface area. The majority of this land is dedicated to temporary
crops, with 0.46Mha of maize cultivated in 2016 (SIAP, 2018b). Other important crops in the
state are sugarcane (0.09Mha), wheat (0.03Mha), and sorghum (0.02Mha) (Figure 8b). Total
cattle in the SOJ increased from 2.6 to 3.1 million over the period 2006-2015 (SIAP, 2018c)
(Figure 8c).
In 2013, SOJ was 52% forested, with the state's forests covering 0.04 million km2 (Comisión
Nacional Forestal [CONAFOR], 2014). Forest cover across the SOJ reduced by 6% since the turn
of the millennium (CONAFOR, 2014) (Figure 8d).
Municipal/Farm
At this scale, the impacts of climate change on protein-rich crops across the European Union will
be analysed, with results derived at a resolution of 4 km2. Further, to deliver a more resolved
analysis of the trade-offs associated with socio-economic development and environmental
degradation at more localised scales, one municipal (sub-state) case study site was selected
within a forest frontier community of the Amazon basin: The Province of Guarayos (Santa Cruz,
Bolivia) highlighted in blue (Figure 5).
The Province of Guarayos
The Province of Guarayos (POG) is one of the DSC's largest provinces, covering 32,810 km2 (INE,
2015b). The population of the POG almost doubled between 2001 and 2012 to 48,301, with
annual growth of 3.1% (INE, 2012b). More than 50% of the populace is under the age of 18 (INE,
2012b), with school attendance rates of 85%. Unlike the DSC, the POG is far more dependent
upon agricultural activities in terms of employment and economic development, with 49.5% of
population employed in agricultural activities, representing the biggest employer of the province
(INE, 2015b).
As with the DSC, agricultural activities dominate land-use, with arable land covering 1,319 km2,
or 4% of the province's land surface area (INE, 2015b). Of this arable land, soya dominates both
winter (37%) and summer (38%) cultivation, with sunflower (28%), maize (13%), and sorghum
(10%) being important winter crops, whilst rice (36%) and maize (18%) are secondary summer
crops (INE, 2015b). Pastures are also an important agricultural activity within the province, with
24% (2,291km2) of the census area being grassland, with cattle stocks of 0.22 million (INE,
2015b).
2. METHODOLOGY
25
Forest area, like in the DSC is the principal land cover, with 52% (9,404 km2) of the area recently
included within the national agricultural census being forest. Furthermore, a lack of
management strategies and conservation policies have been identified as causing reductions in
local biodiversity, depleted natural resources and high levels of deforestation across the POG
(Varela-Ortega et al., 2014).
2.3 Methodological Review
Mildrexler et al. (2016) highlight potential options available for the development of a forest
vulnerability analysis, through index development. The utility of indices in vulnerability research
has been emphasised by Beroya-Eitner (2016), as they can incorporate a wealth of information
and provide concise and easily understood information. Composite index development and the
implicit inclusion of multiple variables offers advantages over individual indicators as they can
provide a more representative image of the modelled reality (Vincent, 2004). Indices also offer
the potential for spatial and temporal comparisons to be made (Mildrexler et al., 2016) and
permit constant and easy refinement to improve validity (Vincent, 2004). Gesellschaft für
Internationale Zusammenarbeit (GIZ) (2013) and Varela-Ortega et al. (2014) both suggest that
to better understand forests, and their future, there is a fundamental need to investigate the
role of socio-economic factors and how their interactions can affect forests.
Trade-offs in ecosystems services and socio-economic development and environmental
degradation have been analysed and described through the application of an array of support
tools and methodologies (e.g. Polasky et al., 2008; Giller et al., 2011). In many cases, the
application of optimisation methods have been implemented to maximise the utility of one, or
multiple resources or services, then measuring the impacts upon others (Groot et al., 2012). One
often used approach is multi-objective goal programming (Charnes et al., 1955). Goal
programming (GP) allows for the development and solving of multiple, often contrasting
objective problems through optimisation programming (Kaiser and Messer, 2011). As part of
this methodology, goals are set as target values, with the achievement function of the model
limiting negative deviations from these values. GP has been widely applied in resource
management (Groot et al., 2012; Diaz- Balteiro et al., 2013; Aldea et al., 2014) to demonstrate
how achievement of decision-maker derived goals can diffuse through a system and result in
differential impacts. Optimisation methods also permit the incorporation of scenarios (Dogliotti
et al., 2005), which can highlight the impacts of systemic changes upon the trade-offs and
measured indicators (Fisher et al., 2011; Kanter et al., 2016a). The potential of GP is evident for
trade-off analysis and has been widely implemented (e.g. Groot et al., 2012; Schroder et al.,
2016). The utility for ecosystem service trade-off analyses is further evident by their ability to
identify optimal management solutions for achievement of conflicting ES based goals, whilst
potentially reducing local development conflicts (Dearing et al., 2012; White et al., 2012;
Carrasco et al., 2014).
2. METHODOLOGY
26
Consumption changes have been addressed through implementation of an assortment of
methodologies. Popkin (1997) applied regression analysis to identify the link between socio-
economic factors and dietary transitions towards increased consumption of animal based
products. Delgado (2003) implemented trend analyses to demonstrate the acuteness of these
changes in developing regions. de Boer et al. (2006) through the application of principal
component analysis exposed the presence of these changes across developed regions, whilst
Vranken et al. (2014) using regression analysis, may have highlighted the ultimate pathway of
these trends. Imamura et al. (2015) used national consumption surveys to demonstrate that
animal product consumption is increasing across most of the world. Although national food
consumption surveys provide the most reliable and detailed consumption data for such studies,
the lack of concrete methodologies and limited coverage often limits their utility for
international comparative analyses (Kearney et al., 2010). In most cases, publicly available
databanks are the source of data for these studies. Although the use of open access databanks,
like the FAO’s Food Balance Sheets (FBS) are problematic, in terms of their potential
overestimation of consumption (Kearney et al., 2010), they are considered the most reliable
data sources for trend analyses like those applied by Delgado (2003).
In investigating idealised consumption and production futures like those condoned in the
literature (e.g. Cassidy et al., 2013; Springmann et al., 2016) and to develop potential strategies
for their achievement, the development of normative scenarios can be useful (Börjeson et al.,
2006). Backcasting (Robinson, 1982) offers such a scenario based methodology, examining the
mechanisms for attaining desirable futures (Dreborg, 1996; Robinson, 2003; Kok et al., 2011).
Backcasting develops a normative vision of the future and works backwards from a desired
future goal, with milestones and policy actions identified, and potential strategies for attaining
the goal developed (Robinson, 1982; Robinson, 2003; Salter et al., 2010). Backcasting offers a
useful tool for elucidating transitional pathways for shifting consumption in the future and has
been extensively used for sustainable lifestyle choices (Neuvonen et al., 2014), agricultural
planning (Kanter et al., 2016b), food security (Vervoot et al., 2014), but has yet to be applied to
for analysing dietary transitions. Further, inclusion of stakeholder perceptions, through
participatory backcasting, provides an essential attribute for such a complex problem as dietary
protein transitions (de Bakker and Dagevos, 2010).
Extensive overviews of climate based crop modelling can be found in Ewert et al. (2015) and
Fernández (2017), in each case they identify three approaches for crop modelling: biophysical
(Jones et al., 2011), agro-ecosystem models (Fischer et al., 2002), and historical analyses (Lobell
and Burke, 2010). Climate change analyses that have largely concentrated upon biophysical
aspects have approached climate change analysis by invariably considering yield impacts upon
globally important crops (maize, wheat, soya, and rice) (Lobell and Gourdji, 2012; Rosenzweig
et al., 2014; Challinor et al., 2014). However, these analyses have largely ignored the impacts
upon lesser crops. Other biophysical crop-modelling options also exist that measure impacts of
climate change not through yield changes, but through changes in suitability to a given
environment or abiotic variables. The utility of such an approach is highlighted by Manners and
2. METHODOLOGY
27
van Etten (2018), where they suggest these models can provide an approximation of climate
change impacts in situations where more detailed modelling activities are missing or difficult to
implement. The value of such approaches is also evident for agricultural planning (Foley et al.,
2005; Zabel et al., 2014), identification of adaptation requirements (Jarvis et al., 2012), and
detecting potentially highly suited, but uncultivated crop species for a particular region (Beebe
et al., 2011). The mechanistic suitability model EcoCrop (Hijmans and Elith, 2017) represents one
such tool, determining crop suitability based upon expert derived crop-specific climatic
parameter ranges. Ramirez-Villegas et al. (2013) found that the outputs of this relatively
simplistic model to be largely consistent with more complex crop models. Despite its simplicity,
the utility of its outputs is evident in its widespread application, deriving climate change impacts
upon multiple crops and crop groups across the globe (Jarvis et al., 2012; Ramirez-Villegas et al.,
2013; Piikki et al., 2017).
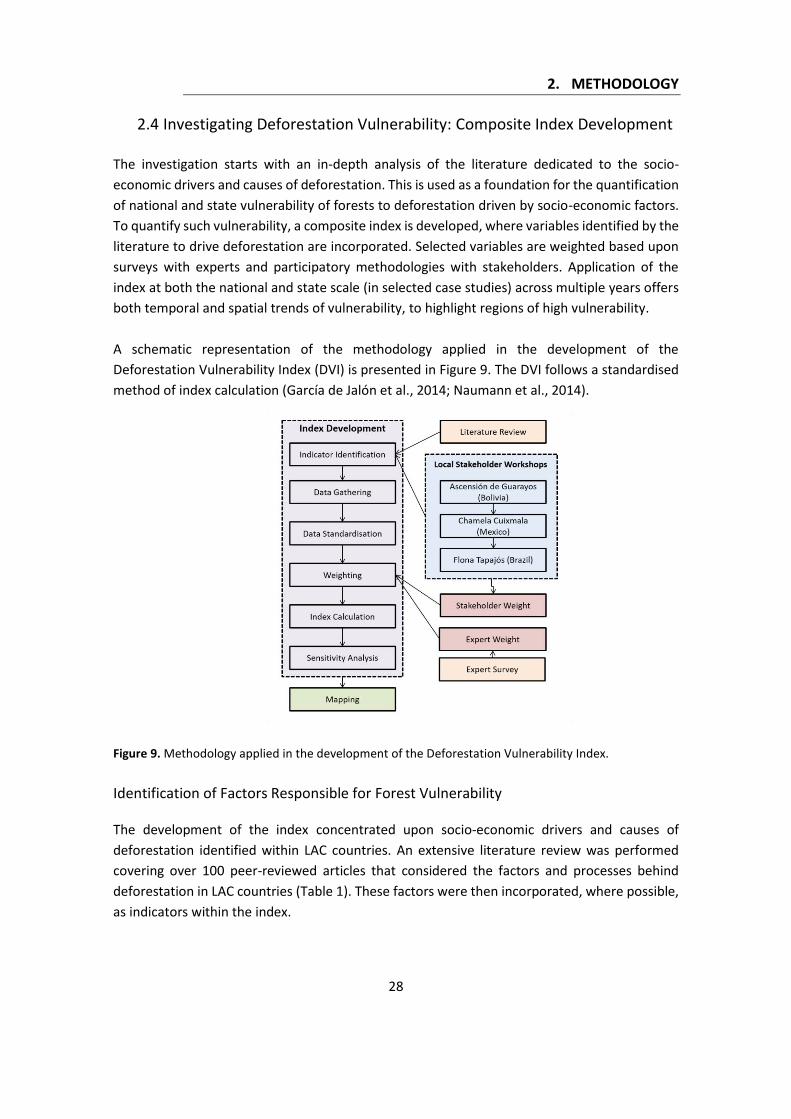
2. METHODOLOGY
28
2.4 Investigating Deforestation Vulnerability: Composite Index Development
The investigation starts with an in-depth analysis of the literature dedicated to the socio-
economic drivers and causes of deforestation. This is used as a foundation for the quantification
of national and state vulnerability of forests to deforestation driven by socio-economic factors.
To quantify such vulnerability, a composite index is developed, where variables identified by the
literature to drive deforestation are incorporated. Selected variables are weighted based upon
surveys with experts and participatory methodologies with stakeholders. Application of the
index at both the national and state scale (in selected case studies) across multiple years offers
both temporal and spatial trends of vulnerability, to highlight regions of high vulnerability.
A schematic representation of the methodology applied in the development of the
Deforestation Vulnerability Index (DVI) is presented in Figure 9. The DVI follows a standardised
method of index calculation (García de Jalón et al., 2014; Naumann et al., 2014).
Figure 9. Methodology applied in the development of the Deforestation Vulnerability Index.
Identification of Factors Responsible for Forest Vulnerability The development of the index concentrated upon socio-economic drivers and causes of
deforestation identified within LAC countries. An extensive literature review was performed
covering over 100 peer-reviewed articles that considered the factors and processes behind
deforestation in LAC countries (Table 1). These factors were then incorporated, where possible,
as indicators within the index.
2. METHODOLOGY
29
The identification of indicators was further enriched using information gathered during local
stakeholder workshops performed in 2013 (Varela-Ortega et al., 2014) as part of the project
ROBIN. A workshop was performed in each of the state-scale case study sites of this investigation
(See Section 2.3- State): The Province of Guarayos (DSC, Bolivia), Tapajós National Forest (Pará,
Brazil), and Cuitzmala River Basin (SOJ, Mexico).
These workshops invited stakeholders (politicians, researchers, technicians, and local
community groups) to describe and map local environmental and socio-economic changes using
the qualitative and semi-quantitative integrated methodology Fuzzy Cognitive Mapping (Kosko,
1986). In each workshop, deforestation was identified as the most important process occurring
within each area, with an array of factors and processes identified as drivers (Varela-Ortega et
al., 2014). The inclusion of this stakeholder-based information not only enriches the analysis by
offering a multi-scale perspective of deforestation, but also demonstrates the potential and
opportunity for incorporating stakeholder-derived information within the development of a
vulnerability metric. Processes such as agricultural expansion, immigration, soybean demand,
infrastructure expansion, unenforced policy, and poor governmental coordination were
identified by both the literature and stakeholders as causal factors of deforestation (Table 1).
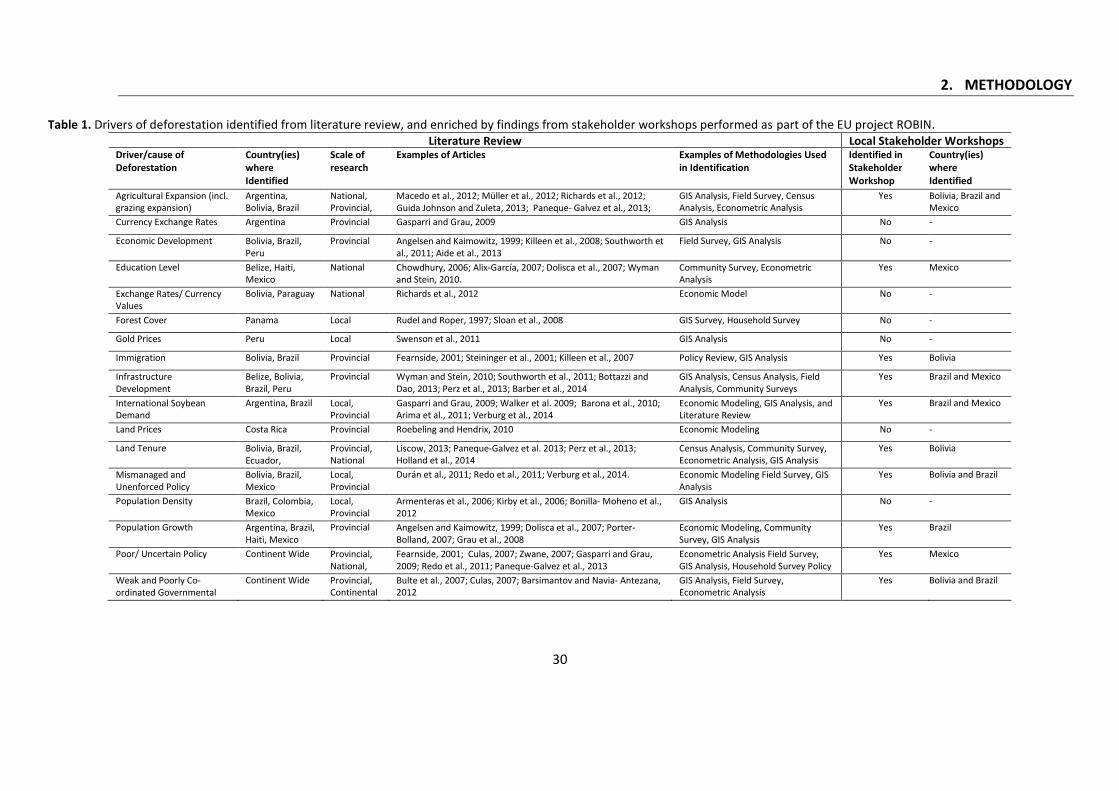
2. METHODOLOGY
30
Table 1. Drivers of deforestation identified from literature review, and enriched by findings from stakeholder workshops performed as part of the EU project ROBIN. Literature Review Local Stakeholder Workshops
Driver/cause of Deforestation
Country(ies) where Identified
Scale of research
Examples of Articles Examples of Methodologies Used in Identification
Identified in Stakeholder Workshop
Country(ies) where Identified
Agricultural Expansion (incl. grazing expansion)
Argentina, Bolivia, Brazil
National, Provincial,
Macedo et al., 2012; Müller et al., 2012; Richards et al., 2012; Guida Johnson and Zuleta, 2013; Paneque- Galvez et al., 2013; Verburg et al. 2014
GIS Analysis, Field Survey, Census Analysis, Econometric Analysis
Yes Bolivia, Brazil and Mexico
Currency Exchange Rates Argentina Provincial Gasparri and Grau, 2009 GIS Analysis No -
Economic Development Bolivia, Brazil, Peru
Provincial Angelsen and Kaimowitz, 1999; Killeen et al., 2008; Southworth et al., 2011; Aide et al., 2013
Field Survey, GIS Analysis No -
Education Level Belize, Haiti, Mexico
National Chowdhury, 2006; Alix-García, 2007; Dolisca et al., 2007; Wyman and Stein, 2010.
Community Survey, Econometric Analysis
Yes Mexico
Exchange Rates/ Currency Values
Bolivia, Paraguay National Richards et al., 2012 Economic Model No -
Forest Cover Panama Local Rudel and Roper, 1997; Sloan et al., 2008 GIS Survey, Household Survey No -
Gold Prices Peru Local Swenson et al., 2011 GIS Analysis No -
Immigration Bolivia, Brazil Provincial Fearnside, 2001; Steininger et al., 2001; Killeen et al., 2007 Policy Review, GIS Analysis Yes Bolivia
Infrastructure Development
Belize, Bolivia, Brazil, Peru
Provincial Wyman and Stein, 2010; Southworth et al., 2011; Bottazzi and Dao, 2013; Perz et al., 2013; Barber et al., 2014
GIS Analysis, Census Analysis, Field Analysis, Community Surveys
Yes Brazil and Mexico
International Soybean Demand
Argentina, Brazil Local, Provincial
Gasparri and Grau, 2009; Walker et al. 2009; Barona et al., 2010; Arima et al., 2011; Verburg et al., 2014
Economic Modeling, GIS Analysis, and Literature Review
Yes Brazil and Mexico
Land Prices Costa Rica Provincial Roebeling and Hendrix, 2010 Economic Modeling No -
Land Tenure Bolivia, Brazil, Ecuador, Nicaragua, Peru
Provincial, National
Liscow, 2013; Paneque-Galvez et al. 2013; Perz et al., 2013; Holland et al., 2014
Census Analysis, Community Survey, Econometric Analysis, GIS Analysis
Yes Bolivia
Mismanaged and Unenforced Policy
Bolivia, Brazil, Mexico
Local, Provincial
Durán et al., 2011; Redo et al., 2011; Verburg et al., 2014. Economic Modeling Field Survey, GIS Analysis
Yes Bolivia and Brazil
Population Density Brazil, Colombia, Mexico
Local, Provincial
Armenteras et al., 2006; Kirby et al., 2006; Bonilla- Moheno et al., 2012
GIS Analysis No -
Population Growth Argentina, Brazil, Haiti, Mexico
Provincial Angelsen and Kaimowitz, 1999; Dolisca et al., 2007; Porter- Bolland, 2007; Grau et al., 2008
Economic Modeling, Community Survey, GIS Analysis
Yes Brazil
Poor/ Uncertain Policy Continent Wide Provincial, National, Continental
Fearnside, 2001; Culas, 2007; Zwane, 2007; Gasparri and Grau, 2009; Redo et al., 2011; Paneque-Galvez et al., 2013
Econometric Analysis Field Survey, GIS Analysis, Household Survey Policy Review
Yes Mexico
Weak and Poorly Co-ordinated Governmental Institutions
Continent Wide Provincial, Continental
Bulte et al., 2007; Culas, 2007; Barsimantov and Navia- Antezana, 2012
GIS Analysis, Field Survey, Econometric Analysis
Yes Bolivia and Brazil
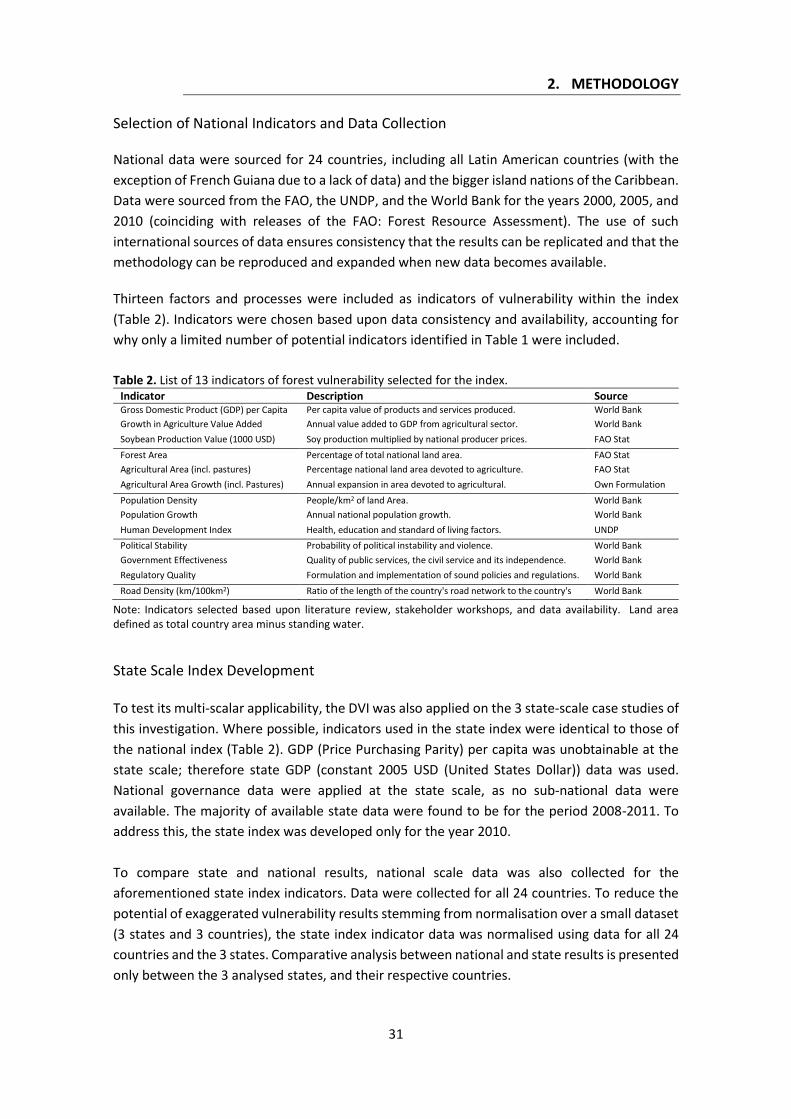
2. METHODOLOGY
31
Selection of National Indicators and Data Collection National data were sourced for 24 countries, including all Latin American countries (with the
exception of French Guiana due to a lack of data) and the bigger island nations of the Caribbean.
Data were sourced from the FAO, the UNDP, and the World Bank for the years 2000, 2005, and
2010 (coinciding with releases of the FAO: Forest Resource Assessment). The use of such
international sources of data ensures consistency that the results can be replicated and that the
methodology can be reproduced and expanded when new data becomes available.
Thirteen factors and processes were included as indicators of vulnerability within the index
(Table 2). Indicators were chosen based upon data consistency and availability, accounting for
why only a limited number of potential indicators identified in Table 1 were included.
Table 2. List of 13 indicators of forest vulnerability selected for the index.
Indicator Description Source Gross Domestic Product (GDP) per Capita Purchasing Power Parity (PPP)
Per capita value of products and services produced. World Bank
Growth in Agriculture Value Added Annual value added to GDP from agricultural sector. World Bank
Soybean Production Value (1000 USD) Soy production multiplied by national producer prices. FAO Stat
Forest Area Percentage of total national land area. FAO Stat
Agricultural Area (incl. pastures) Percentage national land area devoted to agriculture. FAO Stat
Agricultural Area Growth (incl. Pastures) Annual expansion in area devoted to agricultural. Own Formulation
Population Density People/km2 of land Area. World Bank
Population Growth Annual national population growth. World Bank
Human Development Index Health, education and standard of living factors. UNDP
Political Stability Probability of political instability and violence. World Bank
Government Effectiveness Quality of public services, the civil service and its independence. World Bank
Regulatory Quality Formulation and implementation of sound policies and regulations. World Bank
Road Density (km/100km2) Ratio of the length of the country's road network to the country's
land area
World Bank
Note: Indicators selected based upon literature review, stakeholder workshops, and data availability. Land area defined as total country area minus standing water.
State Scale Index Development
To test its multi-scalar applicability, the DVI was also applied on the 3 state-scale case studies of
this investigation. Where possible, indicators used in the state index were identical to those of
the national index (Table 2). GDP (Price Purchasing Parity) per capita was unobtainable at the
state scale; therefore state GDP (constant 2005 USD (United States Dollar)) data was used.
National governance data were applied at the state scale, as no sub-national data were
available. The majority of available state data were found to be for the period 2008-2011. To
address this, the state index was developed only for the year 2010.
To compare state and national results, national scale data was also collected for the
aforementioned state index indicators. Data were collected for all 24 countries. To reduce the
potential of exaggerated vulnerability results stemming from normalisation over a small dataset
(3 states and 3 countries), the state index indicator data was normalised using data for all 24
countries and the 3 states. Comparative analysis between national and state results is presented
only between the 3 analysed states, and their respective countries.
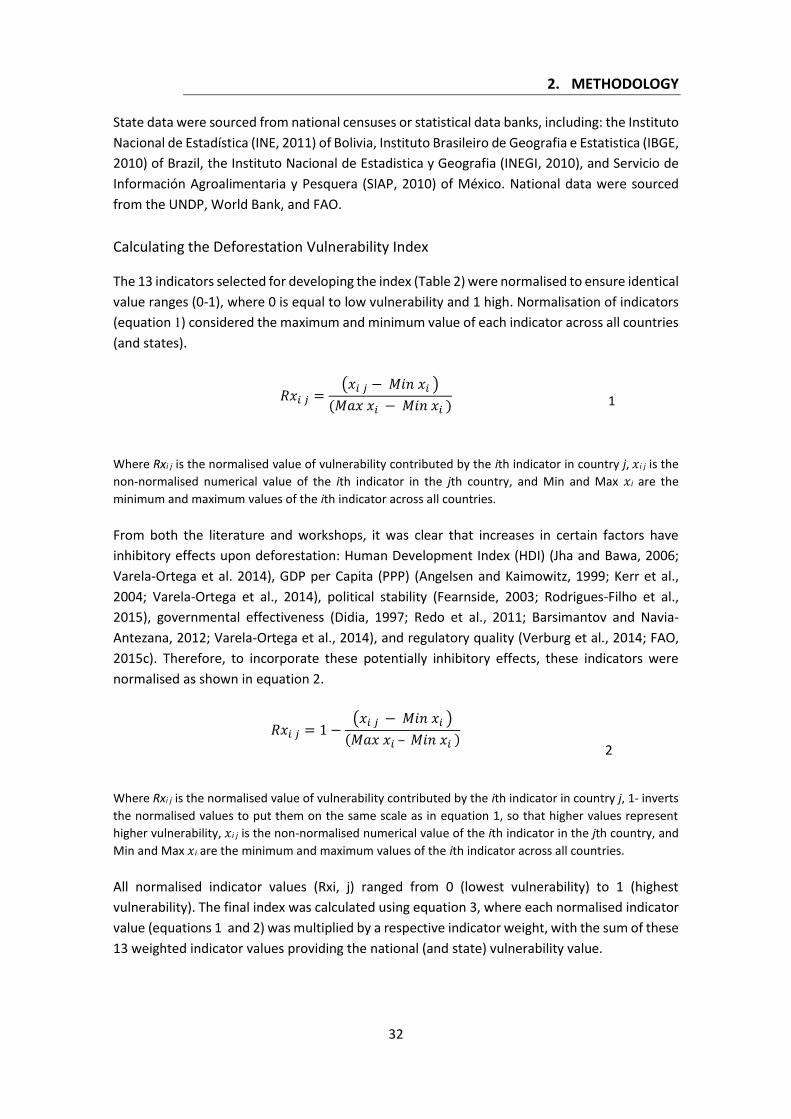
2. METHODOLOGY
32
State data were sourced from national censuses or statistical data banks, including: the Instituto
Nacional de Estadística (INE, 2011) of Bolivia, Instituto Brasileiro de Geografia e Estatistica (IBGE,
2010) of Brazil, the Instituto Nacional de Estadistica y Geografia (INEGI, 2010), and Servicio de
Información Agroalimentaria y Pesquera (SIAP, 2010) of México. National data were sourced
from the UNDP, World Bank, and FAO.
Calculating the Deforestation Vulnerability Index
The 13 indicators selected for developing the index (Table 2) were normalised to ensure identical
value ranges (0-1), where 0 is equal to low vulnerability and 1 high. Normalisation of indicators
(equation 1) considered the maximum and minimum value of each indicator across all countries
(and states).
𝑅𝑥𝑖 𝑗 =(𝑥𝑖 𝑗 − 𝑀𝑖𝑛 𝑥𝑖 )
(𝑀𝑎𝑥 𝑥𝑖 − 𝑀𝑖𝑛 𝑥𝑖 )
1
Where Rxi j is the normalised value of vulnerability contributed by the ith indicator in country j, 𝑥i j is the
non-normalised numerical value of the ith indicator in the jth country, and Min and Max 𝑥i are the
minimum and maximum values of the ith indicator across all countries.
From both the literature and workshops, it was clear that increases in certain factors have
inhibitory effects upon deforestation: Human Development Index (HDI) (Jha and Bawa, 2006;
Varela-Ortega et al. 2014), GDP per Capita (PPP) (Angelsen and Kaimowitz, 1999; Kerr et al.,
2004; Varela-Ortega et al., 2014), political stability (Fearnside, 2003; Rodrigues-Filho et al.,
2015), governmental effectiveness (Didia, 1997; Redo et al., 2011; Barsimantov and Navia-
Antezana, 2012; Varela-Ortega et al., 2014), and regulatory quality (Verburg et al., 2014; FAO,
2015c). Therefore, to incorporate these potentially inhibitory effects, these indicators were
normalised as shown in equation 2.
𝑅𝑥𝑖 𝑗 = 1 −(𝑥𝑖 𝑗 − 𝑀𝑖𝑛 𝑥𝑖 )
(𝑀𝑎𝑥 𝑥𝑖 – 𝑀𝑖𝑛 𝑥𝑖 )
2
Where Rxi j is the normalised value of vulnerability contributed by the ith indicator in country j, 1- inverts
the normalised values to put them on the same scale as in equation 1, so that higher values represent
higher vulnerability, 𝑥i j is the non-normalised numerical value of the ith indicator in the jth country, and
Min and Max 𝑥i are the minimum and maximum values of the ith indicator across all countries.
All normalised indicator values (Rxi, j) ranged from 0 (lowest vulnerability) to 1 (highest
vulnerability). The final index was calculated using equation 3, where each normalised indicator
value (equations 1 and 2) was multiplied by a respective indicator weight, with the sum of these
13 weighted indicator values providing the national (and state) vulnerability value.
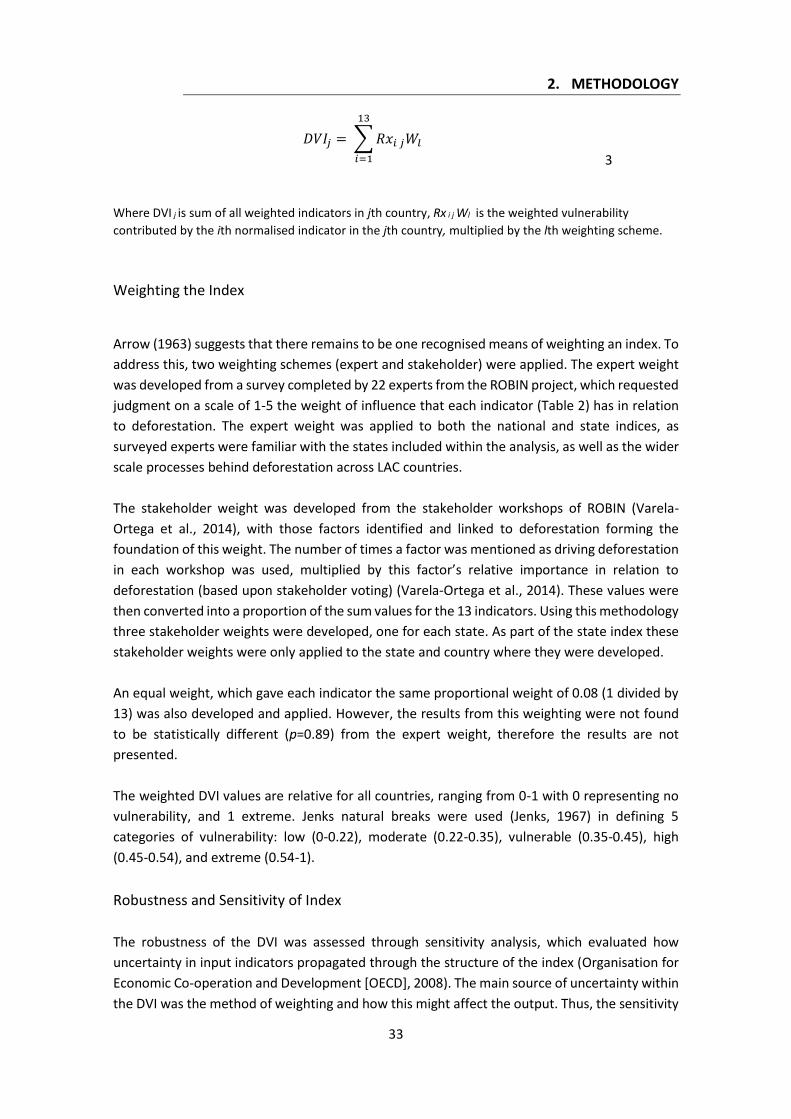
2. METHODOLOGY
33
𝐷𝑉𝐼𝑗 = ∑ 𝑅𝑥𝑖 𝑗𝑊𝑙 .
13
𝑖=1
3
Where DVI j is sum of all weighted indicators in jth country, Rx i j Wl is the weighted vulnerability
contributed by the ith normalised indicator in the jth country, multiplied by the lth weighting scheme.
Weighting the Index
Arrow (1963) suggests that there remains to be one recognised means of weighting an index. To
address this, two weighting schemes (expert and stakeholder) were applied. The expert weight
was developed from a survey completed by 22 experts from the ROBIN project, which requested
judgment on a scale of 1-5 the weight of influence that each indicator (Table 2) has in relation
to deforestation. The expert weight was applied to both the national and state indices, as
surveyed experts were familiar with the states included within the analysis, as well as the wider
scale processes behind deforestation across LAC countries.
The stakeholder weight was developed from the stakeholder workshops of ROBIN (Varela-
Ortega et al., 2014), with those factors identified and linked to deforestation forming the
foundation of this weight. The number of times a factor was mentioned as driving deforestation
in each workshop was used, multiplied by this factor’s relative importance in relation to
deforestation (based upon stakeholder voting) (Varela-Ortega et al., 2014). These values were
then converted into a proportion of the sum values for the 13 indicators. Using this methodology
three stakeholder weights were developed, one for each state. As part of the state index these
stakeholder weights were only applied to the state and country where they were developed.
An equal weight, which gave each indicator the same proportional weight of 0.08 (1 divided by
13) was also developed and applied. However, the results from this weighting were not found
to be statistically different (p=0.89) from the expert weight, therefore the results are not
presented.
The weighted DVI values are relative for all countries, ranging from 0-1 with 0 representing no
vulnerability, and 1 extreme. Jenks natural breaks were used (Jenks, 1967) in defining 5
categories of vulnerability: low (0-0.22), moderate (0.22-0.35), vulnerable (0.35-0.45), high
(0.45-0.54), and extreme (0.54-1).
Robustness and Sensitivity of Index
The robustness of the DVI was assessed through sensitivity analysis, which evaluated how
uncertainty in input indicators propagated through the structure of the index (Organisation for
Economic Co-operation and Development [OECD], 2008). The main source of uncertainty within
the DVI was the method of weighting and how this might affect the output. Thus, the sensitivity
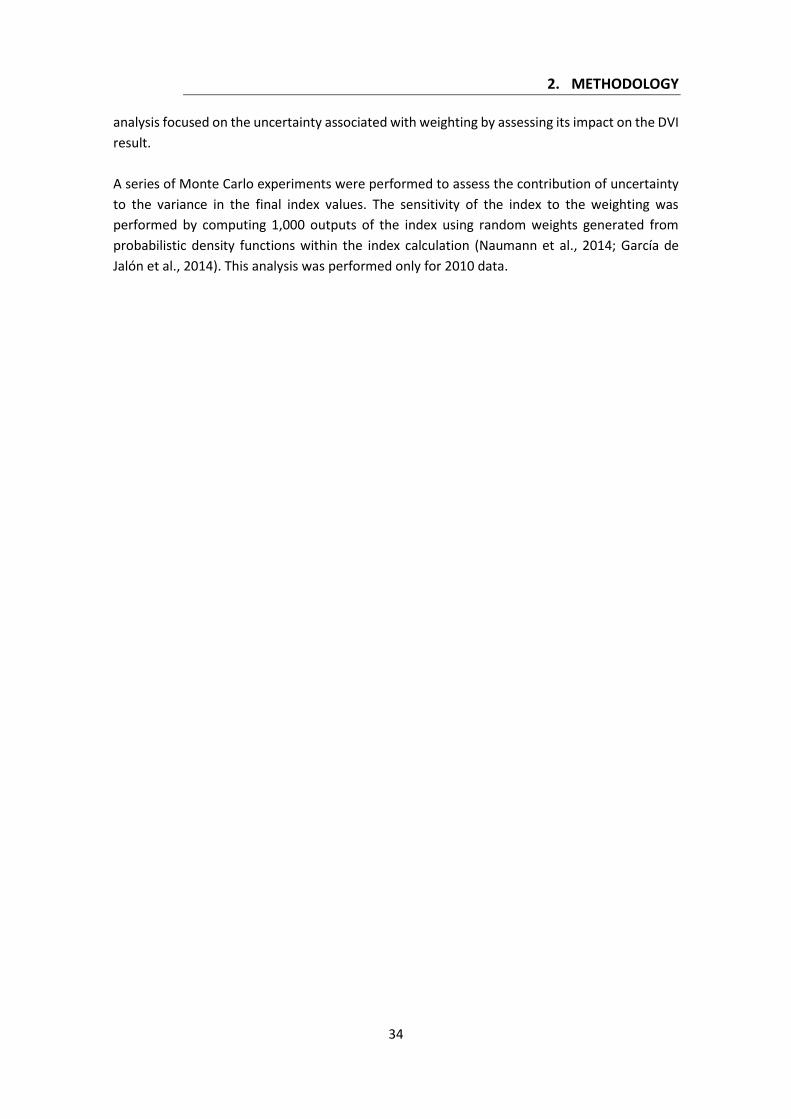
2. METHODOLOGY
34
analysis focused on the uncertainty associated with weighting by assessing its impact on the DVI
result.
A series of Monte Carlo experiments were performed to assess the contribution of uncertainty
to the variance in the final index values. The sensitivity of the index to the weighting was
performed by computing 1,000 outputs of the index using random weights generated from
probabilistic density functions within the index calculation (Naumann et al., 2014; García de
Jalón et al., 2014). This analysis was performed only for 2010 data.
2. METHODOLOGY
35
2.5 Analysing Ecosystem Service Trade-offs: Multi-objective Goal
Programming
Moving down the spatial scales and to broaden the spatial perspective of this investigation a
farm-scale mathematical programming model was developed. This model applied multi-
objective goal programming (MOGP) across a series of representative farms characterised from
fieldwork within the municipality/farm-scale case study- Province of Guarayos, Bolivia (Figure
5). As mentioned in Section 2.2, the province is highly dependent upon agriculture for economic
development and employment and has seen dramatic environmental degradation over recent
years. In spite of the abundance of natural resources, the Province of Guarayos is one of the
poorest within the department, with low levels of economic activity and below national average
levels of education (INE, 2011).
The model reproduces farmer’s behaviour under different constraints. In particular, reproducing
the effects of parametric changes to preference weights for achievement of two farm-scale
goals: net farm income and net farm carbon sequestration. The outputs of this model
demonstrate the impacts of such weighting changes in achievement of the two goals, resource
allocations, cropping options, and ecosystem services, simulating the role of hypothetical
decision-makers and goal preference can have in inhibiting or aggravating farm-scale trade-offs.
The scale of achievement of one goal, versus the cost to the other goal were used to quantify
farm-scale trade-offs. A series of policy scenarios were applied to identify how such decision-
maker based trade-offs might alter under the conditions of policy scenarios developed to inhibit
the extent of trade-offs.
Province of Guarayos Field-work
As part of the ROBIN project, field-work was performed across the province in November 2013,
with 31 semi-structured interviews performed with randomly chosen farmers. Farmers were
asked a range agronomic, economic, and social questions relating to their farm, agronomic
practices, and perceptions of the current situation within the area. Farms ranged from less than
1ha (subsistence) to more than 500ha (industrial), with the surveyed area exceeding 4500ha
(~0.2% of the province). Three clear groupings of farms were found: less than 100ha
(representing the greatest proportion), 100-250ha, and a lesser group of more than 250ha. In
each group, varying proportions of cultivated and forested areas were observed, with smaller
farms having broadly the greatest proportion of forest. Farmers in these smaller holdings
suggested a lack of access to credit and machinery limited their ability for more extensive forest
clearances. This limitation was not found in the larger holdings. In general, farms cultivated at
least 2 crops, with higher crop diversity seen in smaller, subsistence holdings. The most common
crops were maize, soya, bean, and rice. Subsistence farmers also cultivated pineapple, banana,
and yucca. Notable seasonal rotations were evident in all farms.
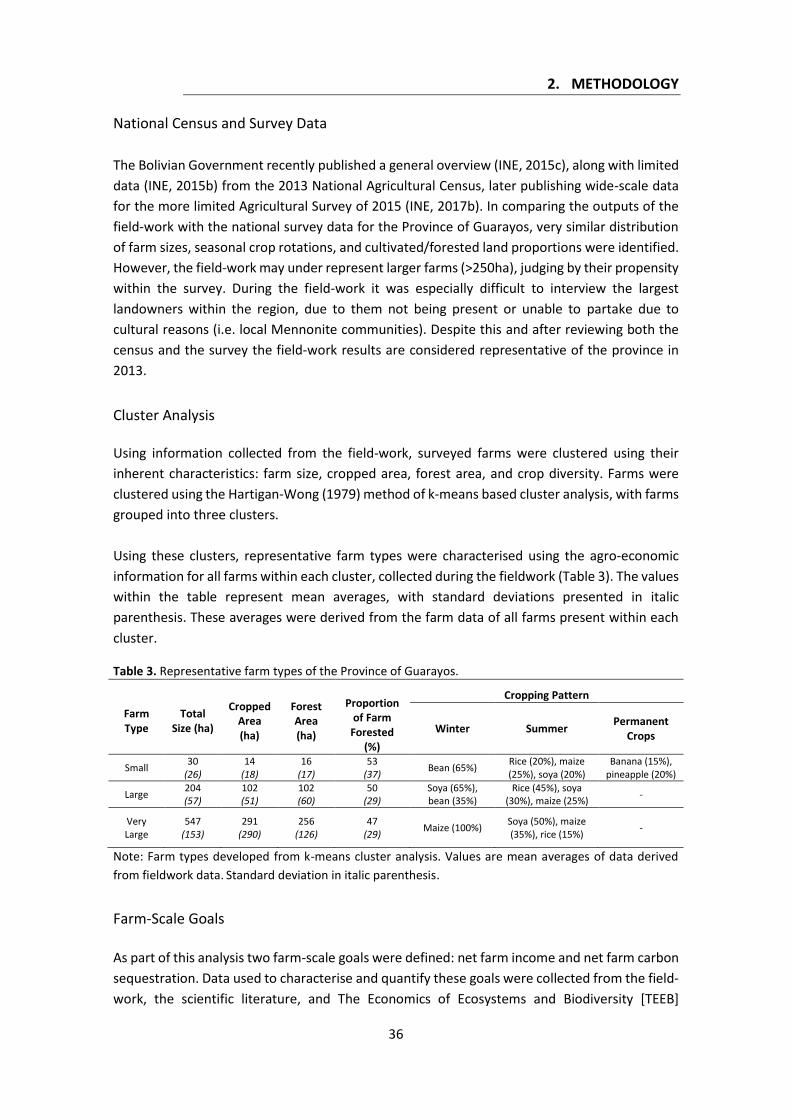
2. METHODOLOGY
36
National Census and Survey Data
The Bolivian Government recently published a general overview (INE, 2015c), along with limited
data (INE, 2015b) from the 2013 National Agricultural Census, later publishing wide-scale data
for the more limited Agricultural Survey of 2015 (INE, 2017b). In comparing the outputs of the
field-work with the national survey data for the Province of Guarayos, very similar distribution
of farm sizes, seasonal crop rotations, and cultivated/forested land proportions were identified.
However, the field-work may under represent larger farms (>250ha), judging by their propensity
within the survey. During the field-work it was especially difficult to interview the largest
landowners within the region, due to them not being present or unable to partake due to
cultural reasons (i.e. local Mennonite communities). Despite this and after reviewing both the
census and the survey the field-work results are considered representative of the province in
2013.
Cluster Analysis
Using information collected from the field-work, surveyed farms were clustered using their
inherent characteristics: farm size, cropped area, forest area, and crop diversity. Farms were
clustered using the Hartigan-Wong (1979) method of k-means based cluster analysis, with farms
grouped into three clusters.
Using these clusters, representative farm types were characterised using the agro-economic
information for all farms within each cluster, collected during the fieldwork (Table 3). The values
within the table represent mean averages, with standard deviations presented in italic
parenthesis. These averages were derived from the farm data of all farms present within each
cluster.
Table 3. Representative farm types of the Province of Guarayos.
Farm Type
Total Size (ha)
Cropped Area (ha)
Forest Area (ha)
Proportion of Farm
Forested (%)
Cropping Pattern
Winter Summer Permanent
Crops
Small 30
(26) 14
(18) 16
(17) 53
(37) Bean (65%)
Rice (20%), maize (25%), soya (20%)
Banana (15%), pineapple (20%)
Large 204 (57)
102 (51)
102 (60)
50 (29)
Soya (65%), bean (35%)
Rice (45%), soya (30%), maize (25%)
-
Very Large
547 (153)
291 (290)
256 (126)
47 (29)
Maize (100%) Soya (50%), maize (35%), rice (15%)
-
Note: Farm types developed from k-means cluster analysis. Values are mean averages of data derived
from fieldwork data. Standard deviation in italic parenthesis.
Farm-Scale Goals
As part of this analysis two farm-scale goals were defined: net farm income and net farm carbon
sequestration. Data used to characterise and quantify these goals were collected from the field-
work, the scientific literature, and The Economics of Ecosystems and Biodiversity [TEEB]

2. METHODOLOGY
37
database (McVittie and Hussain, 2013). The TEEB dataset combines ES valuation data from the
research literature.
Net Farm Income
Farm income, although not directly an ecosystem service included a series of provisioning ES
(economically valued proxies) appropriated at farm-scales. These services include crop
production, timber production, and forestry products (Table 4).
Crop Production: sum of the gross margin of crops cropped, multiplied by area harvested.
Information for crop production was collected from the field-work. Crop production yields were
multiplied by farm gate prices, with associated costs subtracted. The gross margin per hectare
of crops differed by farm type and agronomic technique (intensive/ extensive). The agronomic
data used were averages of all farms found within each representative cluster.
Deforested Timber: sum of timber sold as part of forest clearing processes for agricultural
activities. Rights and Resources (2006) suggest the sale of timber is common within the province
following deforesting activities. This can be a valuable income stream to rural households
(Amacher et al., 2009). To define the value of timber sold, timber prices per hectare were taken
from the TEEB database (McVittie and Hussain, 2013) and the Autoridad de Fiscalización y
Control Social de Bosques y Tierra [ABT] (2017). An average timber price was set as a constant
and multiplied by the area deforested.
Forestry Products: sum of forestry products available on each farm. The importance of forestry
products to rural households (Angelsen et al., 2014) was also considered. These products are
used in the daily lives of peoples within the Province of Guarayos, with plants harvested for
traditional medicines and forest fruits and vegetables also gathered (Municipality of Ascension
de Guarayos, 2006). Forests also represent important sources of protein, with hunting and
fishing common (Municipality of Ascension de Guarayos, 2006). The price of raw materials are
also included, which following conversation with farmers, they mentioned the utility of these
materials for building, amongst other uses. Prices for these products were collected from the
TEEB dataset (McVittie and Hussain, 2013). Data was only collected for data from Latin American
tropical forests. Median economic prices (2013 USD) of these services were generated for food,
medicine, and raw materials provided by forests.
The assumption was made that these services (Forestry Products) were only appropriated by
farmers on the small and large farms. The very large farms were of industrial scales, with farming
families largely not present and it was assumed that owners are not concerned with collecting
fruits, vegetables, medicinal plants, nor hunting on holdings.
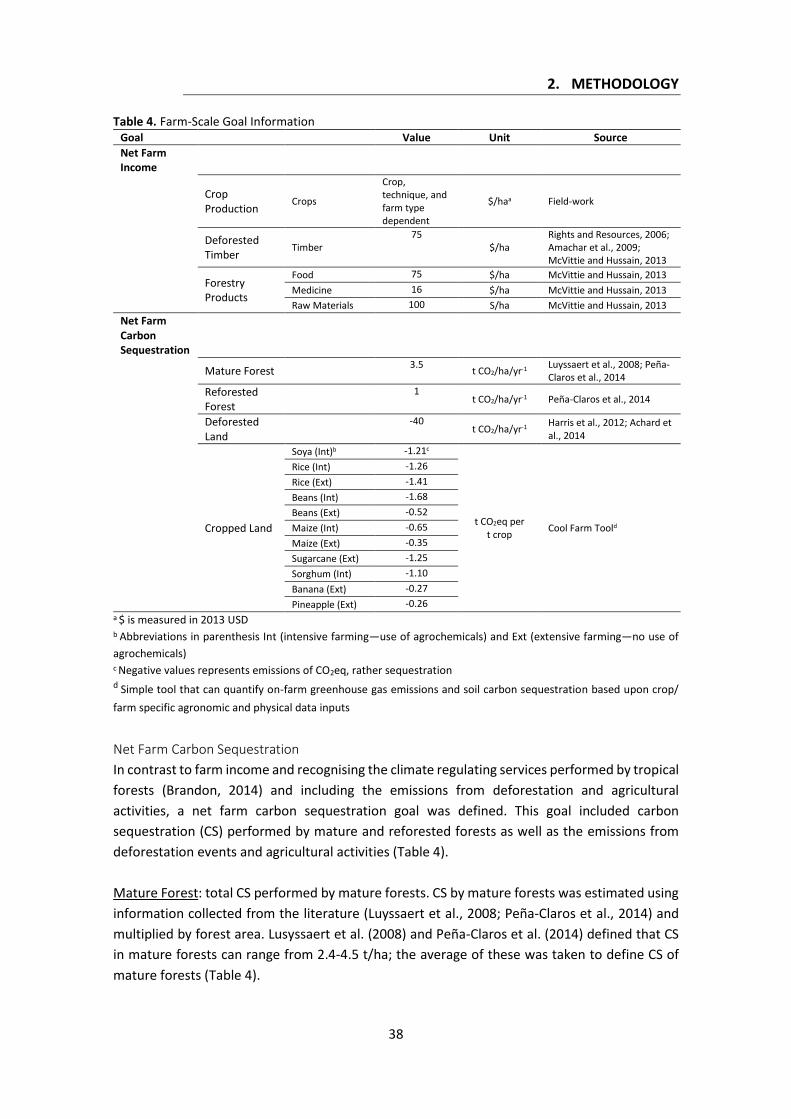
2. METHODOLOGY
38
Table 4. Farm-Scale Goal Information Goal Value Unit Source
Net Farm Income
Crop Production
Crops
Crop, technique, and farm type dependent
$/haa Field-work
Deforested Timber
Timber 75
$/ha Rights and Resources, 2006; Amachar et al., 2009; McVittie and Hussain, 2013
Forestry Products
Food 75 $/ha McVittie and Hussain, 2013
Medicine 16 $/ha McVittie and Hussain, 2013
Raw Materials 100 S/ha McVittie and Hussain, 2013
Net Farm Carbon Sequestration
Mature Forest 3.5
t CO2/ha/yr-1 Luyssaert et al., 2008; Peña-Claros et al., 2014
Reforested Forest
1
t CO2/ha/yr-1 Peña-Claros et al., 2014
Deforested Land
-40
t CO2/ha/yr-1 Harris et al., 2012; Achard et al., 2014
Cropped Land
Soya (Int)b -1.21c
t CO2eq per t crop
Cool Farm Toold
Rice (Int) -1.26
Rice (Ext) -1.41
Beans (Int) -1.68
Beans (Ext) -0.52
Maize (Int) -0.65
Maize (Ext) -0.35
Sugarcane (Ext) -1.25
Sorghum (Int) -1.10
Banana (Ext) -0.27
Pineapple (Ext) -0.26 a $ is measured in 2013 USD b Abbreviations in parenthesis Int (intensive farming—use of agrochemicals) and Ext (extensive farming—no use of
agrochemicals) c Negative values represents emissions of CO2eq, rather sequestration d Simple tool that can quantify on-farm greenhouse gas emissions and soil carbon sequestration based upon crop/
farm specific agronomic and physical data inputs
Net Farm Carbon Sequestration
In contrast to farm income and recognising the climate regulating services performed by tropical
forests (Brandon, 2014) and including the emissions from deforestation and agricultural
activities, a net farm carbon sequestration goal was defined. This goal included carbon
sequestration (CS) performed by mature and reforested forests as well as the emissions from
deforestation events and agricultural activities (Table 4).
Mature Forest: total CS performed by mature forests. CS by mature forests was estimated using
information collected from the literature (Luyssaert et al., 2008; Peña-Claros et al., 2014) and
multiplied by forest area. Lusyssaert et al. (2008) and Peña-Claros et al. (2014) defined that CS
in mature forests can range from 2.4-4.5 t/ha; the average of these was taken to define CS of
mature forests (Table 4).
2. METHODOLOGY
39
Reforested Forest: total CS performed by reforested forests. Sequestration by reforested or
secondary forests are also important sources of CS in tropical forests. The information from
Peña-Claros et al. 2014 was used to define reforested CS (Table 4) and multiplied by reforested
area. Recently reforested areas were assumed to immediately become sinks of CS.
Deforested Land: total carbon emissions from deforestation. To include carbon released from
deforestation events, estimates from the literature were used (Harris et al., 2012; Achard et al.,
2014). The literature suggests CO2 emissions from deforestation range from 30-50 tonnes per
hectare. The average from these two values was taken (Table 4). This value was multiplied by
total deforested area. Emissions from deforestation were assumed to be instantaneous.
Cropped Land: total emissions from agricultural activities. The Cool Farm Tool (Cool Farm
Alliance, 2016) was used to calculate equivalent carbon dioxide emissions from agricultural
activities. This tool permitted the inclusion of CO2 equivalent emissions from all facets of
agriculture production: agro-chemical inputs, residue and soil management, and transport of
crops to markets. Emissions differed based upon the agronomic techniques implemented in
production. Farms clustered into the small farm were largely observed not to use agro-chemicals
and little/no machinery. These observations therefore affected the emissions per hectare of
crops on the small farm. Emission values were calculated per tonne of crop produced, multiplied
by yields and areas harvested (Table 4).
Inclusion of CS from agricultural activities was also considered following the literature
demonstrating its capacity (e.g. Lal, 2004; Managalassery et al., 2015; Powlson et al., 2016).
However, as no farmers were observed to be performing soil management conservation
methods agricultural based sequestration was excluded.
Model Development
An optimisation model using goal programming (GP) (Charnes et al., 1955) was developed for
each of the three representative farms (Table 3). GP allows for the specification of multiple goals
that can represent management objectives, subject to a series of constraints. The GP model
specified a desired aspiration level (satisficing value) for each goal and then minimised the
weighted sum of unwanted deviations from these values (Kaiser and Messer, 2011). Agronomic
(e.g. yields, prices, inputs, land-uses) and labour data used for each of the models were derived
from means of farms present in each cluster, as described in the previous section. All other
information was calculated using values presented in Table 4.
Non pre-emptive GP was applied, which assumes that a decision-maker (DM) has a specific set
of goals and that each goal can be weighted by preference with respect to the other(s) (Kaiser
and Messer, 2011). The application of this type of model can be used to identify potential
management solutions for achieving these goals, even in cases where goals are conflicting,
demonstrating the utility of trade-off analysis (Schroder et al., 2016).
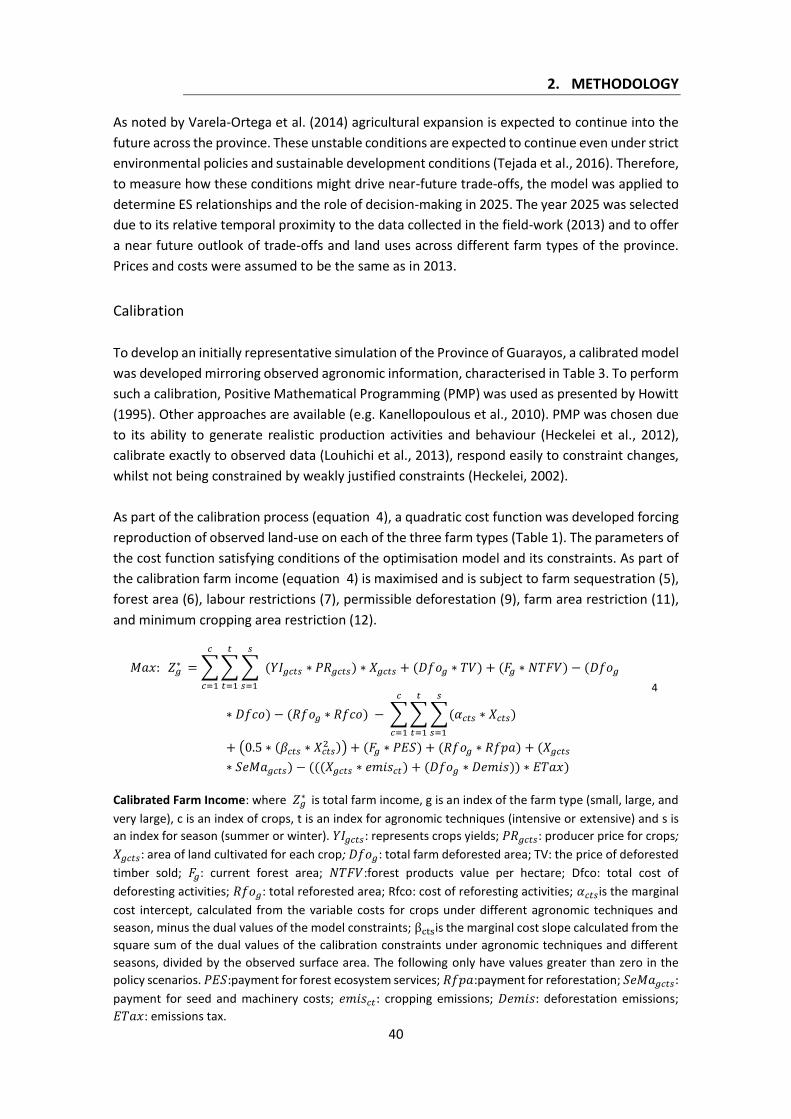
2. METHODOLOGY
40
As noted by Varela-Ortega et al. (2014) agricultural expansion is expected to continue into the
future across the province. These unstable conditions are expected to continue even under strict
environmental policies and sustainable development conditions (Tejada et al., 2016). Therefore,
to measure how these conditions might drive near-future trade-offs, the model was applied to
determine ES relationships and the role of decision-making in 2025. The year 2025 was selected
due to its relative temporal proximity to the data collected in the field-work (2013) and to offer
a near future outlook of trade-offs and land uses across different farm types of the province.
Prices and costs were assumed to be the same as in 2013.
Calibration
To develop an initially representative simulation of the Province of Guarayos, a calibrated model
was developed mirroring observed agronomic information, characterised in Table 3. To perform
such a calibration, Positive Mathematical Programming (PMP) was used as presented by Howitt
(1995). Other approaches are available (e.g. Kanellopoulous et al., 2010). PMP was chosen due
to its ability to generate realistic production activities and behaviour (Heckelei et al., 2012),
calibrate exactly to observed data (Louhichi et al., 2013), respond easily to constraint changes,
whilst not being constrained by weakly justified constraints (Heckelei, 2002).
As part of the calibration process (equation 4), a quadratic cost function was developed forcing
reproduction of observed land-use on each of the three farm types (Table 1). The parameters of
the cost function satisfying conditions of the optimisation model and its constraints. As part of
the calibration farm income (equation 4) is maximised and is subject to farm sequestration (5),
forest area (6), labour restrictions (7), permissible deforestation (9), farm area restriction (11),
and minimum cropping area restriction (12).
𝑀𝑎𝑥: 𝑍𝑔 ∗ = ∑ ∑ ∑ (𝑌𝐼𝑔𝑐𝑡𝑠
𝑠
𝑠=1
𝑡
𝑡=1
𝑐
𝑐=1
∗ 𝑃𝑅𝑔𝑐𝑡𝑠) ∗ 𝑋𝑔𝑐𝑡𝑠 + (𝐷𝑓𝑜𝑔 ∗ 𝑇𝑉) + (𝐹𝑔 ∗ 𝑁𝑇𝐹𝑉) − (𝐷𝑓𝑜𝑔
∗ 𝐷𝑓𝑐𝑜) − (𝑅𝑓𝑜𝑔 ∗ 𝑅𝑓𝑐𝑜) − ∑ ∑ ∑(𝛼𝑐𝑡𝑠
𝑠
𝑠=1
𝑡
𝑡=1
𝑐
𝑐=1
∗ 𝑋𝑐𝑡𝑠)
+ (0.5 ∗ (𝛽𝑐𝑡𝑠 ∗ 𝑋𝑐𝑡𝑠2 )) + (𝐹𝑔 ∗ 𝑃𝐸𝑆) + (𝑅𝑓𝑜𝑔 ∗ 𝑅𝑓𝑝𝑎) + (𝑋𝑔𝑐𝑡𝑠
∗ 𝑆𝑒𝑀𝑎𝑔𝑐𝑡𝑠) − (((𝑋𝑔𝑐𝑡𝑠 ∗ 𝑒𝑚𝑖𝑠𝑐𝑡) + (𝐷𝑓𝑜𝑔 ∗ 𝐷𝑒𝑚𝑖𝑠)) ∗ 𝐸𝑇𝑎𝑥)
4
Calibrated Farm Income: where 𝑍𝑔 ∗ is total farm income, g is an index of the farm type (small, large, and
very large), c is an index of crops, t is an index for agronomic techniques (intensive or extensive) and s is
an index for season (summer or winter). 𝑌𝐼𝑔𝑐𝑡𝑠: represents crops yields; 𝑃𝑅𝑔𝑐𝑡𝑠: producer price for crops;
𝑋𝑔𝑐𝑡𝑠: area of land cultivated for each crop; 𝐷𝑓𝑜𝑔: total farm deforested area; TV: the price of deforested
timber sold; 𝐹𝑔: current forest area; 𝑁𝑇𝐹𝑉:forest products value per hectare; Dfco: total cost of
deforesting activities; 𝑅𝑓𝑜𝑔: total reforested area; Rfco: cost of reforesting activities; 𝛼𝑐𝑡𝑠is the marginal
cost intercept, calculated from the variable costs for crops under different agronomic techniques and
season, minus the dual values of the model constraints; βctsis the marginal cost slope calculated from the
square sum of the dual values of the calibration constraints under agronomic techniques and different
seasons, divided by the observed surface area. The following only have values greater than zero in the
policy scenarios. 𝑃𝐸𝑆:payment for forest ecosystem services; 𝑅𝑓𝑝𝑎:payment for reforestation; 𝑆𝑒𝑀𝑎𝑔𝑐𝑡𝑠:
payment for seed and machinery costs; 𝑒𝑚𝑖𝑠𝑐𝑡: cropping emissions; 𝐷𝑒𝑚𝑖𝑠: deforestation emissions;
𝐸𝑇𝑎𝑥: emissions tax.
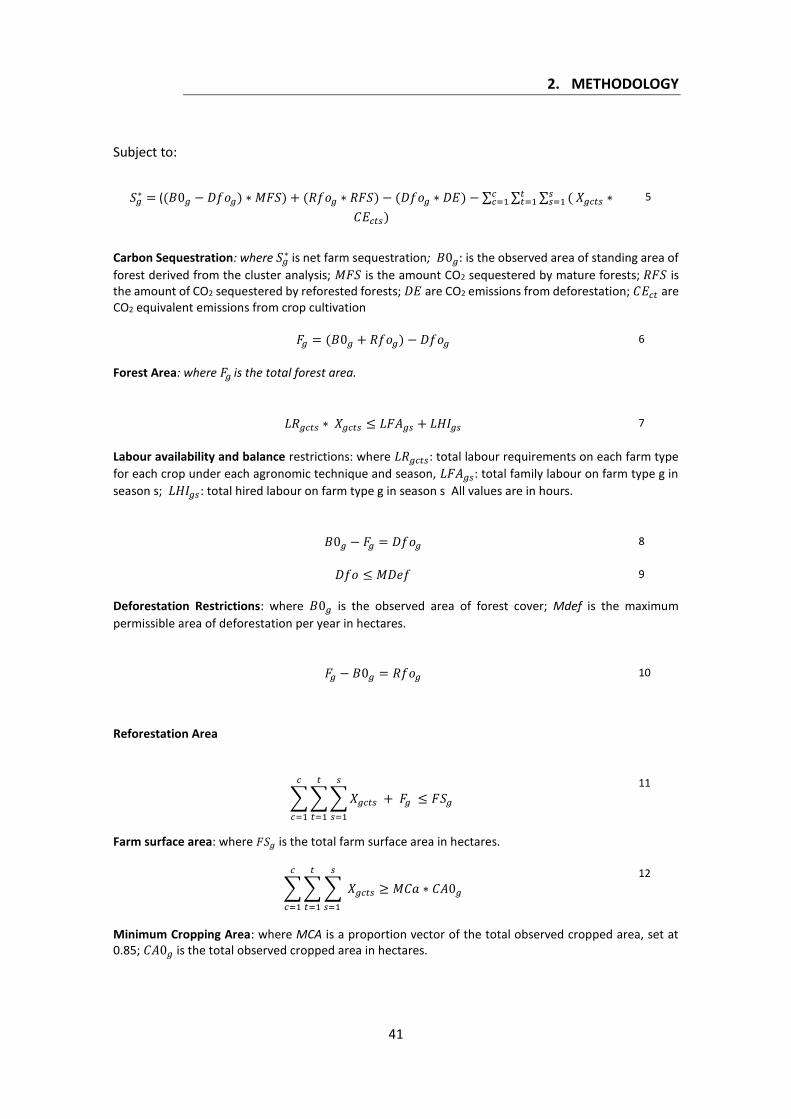
2. METHODOLOGY
41
Subject to:
𝑆𝑔
∗ = ((𝐵0𝑔 − 𝐷𝑓𝑜𝑔) ∗ 𝑀𝐹𝑆) + (𝑅𝑓𝑜𝑔 ∗ 𝑅𝐹𝑆) − (𝐷𝑓𝑜𝑔 ∗ 𝐷𝐸) − ∑ ∑ ∑ ( 𝑋𝑔𝑐𝑡𝑠 ∗𝑠𝑠=1
𝑡𝑡=1
𝑐𝑐=1
𝐶𝐸𝑐𝑡𝑠)
5
Carbon Sequestration: where 𝑆𝑔∗ is net farm sequestration; 𝐵0𝑔: is the observed area of standing area of
forest derived from the cluster analysis; 𝑀𝐹𝑆 is the amount CO2 sequestered by mature forests; 𝑅𝐹𝑆 is the amount of CO2 sequestered by reforested forests; 𝐷𝐸 are CO2 emissions from deforestation; 𝐶𝐸𝑐𝑡 are CO2 equivalent emissions from crop cultivation
𝐹𝑔 = (𝐵0𝑔 + 𝑅𝑓𝑜𝑔) − 𝐷𝑓𝑜𝑔 6
Forest Area: where 𝐹𝑔 is the total forest area.
𝐿𝑅𝑔𝑐𝑡𝑠 ∗ 𝑋𝑔𝑐𝑡𝑠 ≤ 𝐿𝐹𝐴𝑔𝑠 + 𝐿𝐻𝐼𝑔𝑠 7
Labour availability and balance restrictions: where 𝐿𝑅𝑔𝑐𝑡𝑠: total labour requirements on each farm type
for each crop under each agronomic technique and season, 𝐿𝐹𝐴𝑔𝑠: total family labour on farm type g in
season s; 𝐿𝐻𝐼𝑔𝑠 : total hired labour on farm type g in season s All values are in hours.
𝐵0𝑔 − 𝐹𝑔 = 𝐷𝑓𝑜𝑔 8
𝐷𝑓𝑜 ≤ 𝑀𝐷𝑒𝑓 9
Deforestation Restrictions: where 𝐵0𝑔 is the observed area of forest cover; Mdef is the maximum
permissible area of deforestation per year in hectares.
𝐹𝑔 − 𝐵0𝑔 = 𝑅𝑓𝑜𝑔 10
Reforestation Area
∑ ∑ ∑ 𝑋𝑔𝑐𝑡𝑠
𝑠
𝑠=1
𝑡
𝑡=1
𝑐
𝑐=1
+ 𝐹𝑔 ≤ 𝐹𝑆𝑔 11
Farm surface area: where 𝐹𝑆𝑔 is the total farm surface area in hectares.
∑ ∑ ∑ 𝑋𝑔𝑐𝑡𝑠
𝑠
𝑠=1
𝑡
𝑡=1
𝑐
𝑐=1
≥ 𝑀𝐶𝑎 ∗ 𝐶𝐴0𝑔 12
Minimum Cropping Area: where MCA is a proportion vector of the total observed cropped area, set at 0.85; 𝐶𝐴0𝑔 is the total observed cropped area in hectares.
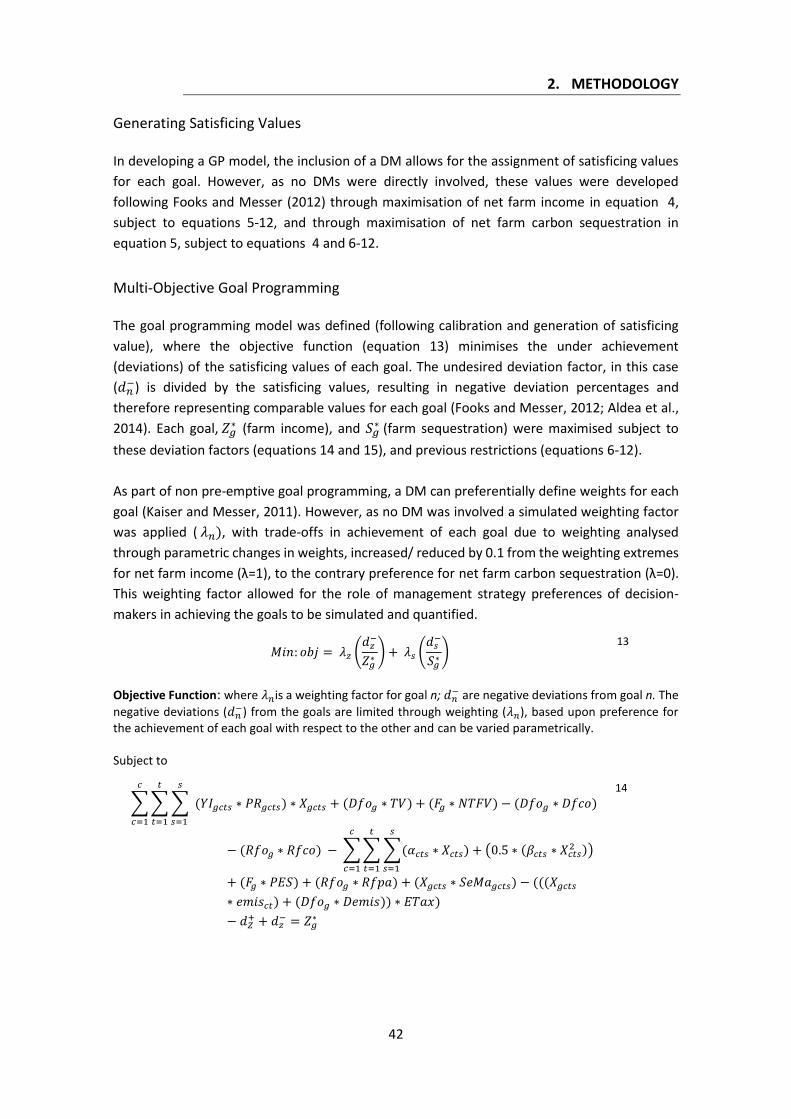
2. METHODOLOGY
42
Generating Satisficing Values
In developing a GP model, the inclusion of a DM allows for the assignment of satisficing values
for each goal. However, as no DMs were directly involved, these values were developed
following Fooks and Messer (2012) through maximisation of net farm income in equation 4,
subject to equations 5-12, and through maximisation of net farm carbon sequestration in
equation 5, subject to equations 4 and 6-12.
Multi-Objective Goal Programming
The goal programming model was defined (following calibration and generation of satisficing
value), where the objective function (equation 13) minimises the under achievement
(deviations) of the satisficing values of each goal. The undesired deviation factor, in this case
(𝑑𝑛−) is divided by the satisficing values, resulting in negative deviation percentages and
therefore representing comparable values for each goal (Fooks and Messer, 2012; Aldea et al.,
2014). Each goal, 𝑍𝑔∗ (farm income), and 𝑆𝑔
∗ (farm sequestration) were maximised subject to
these deviation factors (equations 14 and 15), and previous restrictions (equations 6-12).
As part of non pre-emptive goal programming, a DM can preferentially define weights for each
goal (Kaiser and Messer, 2011). However, as no DM was involved a simulated weighting factor
was applied ( 𝜆𝑛), with trade-offs in achievement of each goal due to weighting analysed
through parametric changes in weights, increased/ reduced by 0.1 from the weighting extremes
for net farm income (λ=1), to the contrary preference for net farm carbon sequestration (λ=0).
This weighting factor allowed for the role of management strategy preferences of decision-
makers in achieving the goals to be simulated and quantified.
𝑀𝑖𝑛: 𝑜𝑏𝑗 = 𝜆𝑧 (𝑑𝑧
−
𝑍𝑔 ∗
) + 𝜆𝑠 (𝑑𝑠
−
𝑆𝑔∗
) 13
Objective Function: where 𝜆𝑛is a weighting factor for goal n; 𝑑𝑛− are negative deviations from goal n. The
negative deviations (𝑑𝑛−) from the goals are limited through weighting (𝜆𝑛), based upon preference for
the achievement of each goal with respect to the other and can be varied parametrically. Subject to
∑ ∑ ∑ (𝑌𝐼𝑔𝑐𝑡𝑠
𝑠
𝑠=1
𝑡
𝑡=1
𝑐
𝑐=1
∗ 𝑃𝑅𝑔𝑐𝑡𝑠) ∗ 𝑋𝑔𝑐𝑡𝑠 + (𝐷𝑓𝑜𝑔 ∗ 𝑇𝑉) + (𝐹𝑔 ∗ 𝑁𝑇𝐹𝑉) − (𝐷𝑓𝑜𝑔 ∗ 𝐷𝑓𝑐𝑜)
− (𝑅𝑓𝑜𝑔 ∗ 𝑅𝑓𝑐𝑜) − ∑ ∑ ∑(𝛼𝑐𝑡𝑠
𝑠
𝑠=1
𝑡
𝑡=1
𝑐
𝑐=1
∗ 𝑋𝑐𝑡𝑠) + (0.5 ∗ (𝛽𝑐𝑡𝑠 ∗ 𝑋𝑐𝑡𝑠2 ))
+ (𝐹𝑔 ∗ 𝑃𝐸𝑆) + (𝑅𝑓𝑜𝑔 ∗ 𝑅𝑓𝑝𝑎) + (𝑋𝑔𝑐𝑡𝑠 ∗ 𝑆𝑒𝑀𝑎𝑔𝑐𝑡𝑠) − (((𝑋𝑔𝑐𝑡𝑠
∗ 𝑒𝑚𝑖𝑠𝑐𝑡) + (𝐷𝑓𝑜𝑔 ∗ 𝐷𝑒𝑚𝑖𝑠)) ∗ 𝐸𝑇𝑎𝑥)
− 𝑑𝑍+ + 𝑑𝑧
− = 𝑍𝑔 ∗
14
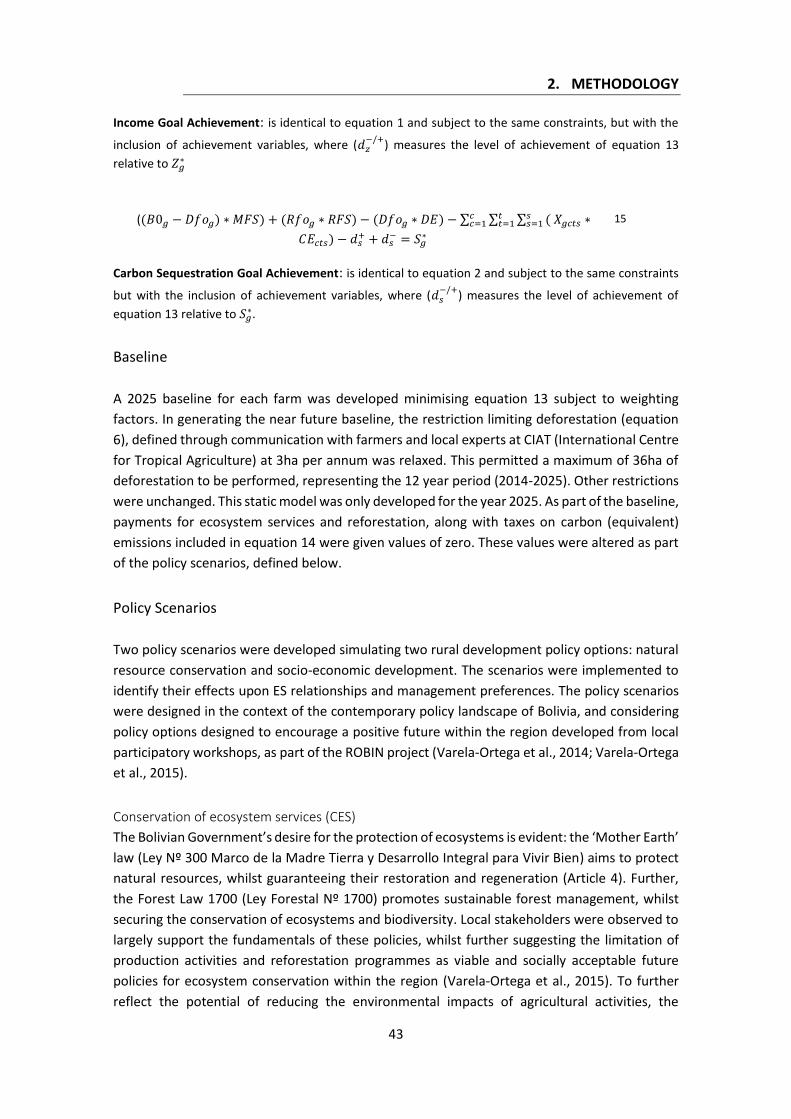
2. METHODOLOGY
43
Income Goal Achievement: is identical to equation 1 and subject to the same constraints, but with the
inclusion of achievement variables, where (𝑑𝑧−/+
) measures the level of achievement of equation 13
relative to 𝑍𝑔 ∗
((𝐵0𝑔 − 𝐷𝑓𝑜𝑔) ∗ 𝑀𝐹𝑆) + (𝑅𝑓𝑜𝑔 ∗ 𝑅𝐹𝑆) − (𝐷𝑓𝑜𝑔 ∗ 𝐷𝐸) − ∑ ∑ ∑ ( 𝑋𝑔𝑐𝑡𝑠 ∗𝑠𝑠=1
𝑡𝑡=1
𝑐𝑐=1
𝐶𝐸𝑐𝑡𝑠) − 𝑑𝑠+ + 𝑑𝑠
− = 𝑆𝑔 ∗
15
Carbon Sequestration Goal Achievement: is identical to equation 2 and subject to the same constraints
but with the inclusion of achievement variables, where (𝑑𝑠−/+
) measures the level of achievement of
equation 13 relative to 𝑆𝑔∗.
Baseline
A 2025 baseline for each farm was developed minimising equation 13 subject to weighting
factors. In generating the near future baseline, the restriction limiting deforestation (equation
6), defined through communication with farmers and local experts at CIAT (International Centre
for Tropical Agriculture) at 3ha per annum was relaxed. This permitted a maximum of 36ha of
deforestation to be performed, representing the 12 year period (2014-2025). Other restrictions
were unchanged. This static model was only developed for the year 2025. As part of the baseline,
payments for ecosystem services and reforestation, along with taxes on carbon (equivalent)
emissions included in equation 14 were given values of zero. These values were altered as part
of the policy scenarios, defined below.
Policy Scenarios
Two policy scenarios were developed simulating two rural development policy options: natural
resource conservation and socio-economic development. The scenarios were implemented to
identify their effects upon ES relationships and management preferences. The policy scenarios
were designed in the context of the contemporary policy landscape of Bolivia, and considering
policy options designed to encourage a positive future within the region developed from local
participatory workshops, as part of the ROBIN project (Varela-Ortega et al., 2014; Varela-Ortega
et al., 2015).
Conservation of ecosystem services (CES)
The Bolivian Government’s desire for the protection of ecosystems is evident: the ‘Mother Earth’
law (Ley Nº 300 Marco de la Madre Tierra y Desarrollo Integral para Vivir Bien) aims to protect
natural resources, whilst guaranteeing their restoration and regeneration (Article 4). Further,
the Forest Law 1700 (Ley Forestal Nº 1700) promotes sustainable forest management, whilst
securing the conservation of ecosystems and biodiversity. Local stakeholders were observed to
largely support the fundamentals of these policies, whilst further suggesting the limitation of
production activities and reforestation programmes as viable and socially acceptable future
policies for ecosystem conservation within the region (Varela-Ortega et al., 2015). To further
reflect the potential of reducing the environmental impacts of agricultural activities, the
2. METHODOLOGY
44
potential for reducing agricultural emissions was incorporated through the application of
improved crop and soil management techniques (Lal et al., 2004; Managalassery et al., 2015;
Powlson et al., 2016).
The ‘Conservation of Ecosystem Services’ (CES) policy scenario was designed to encourage forest
regeneration and more sustainable agricultural activities, deter excessive land use changes and
provide financial assistance to cover foregone profits made from deforestation. The scenario
consisted of:
A payment for Ecosystem Services of $175 per hectare of forest on the farm was
offered. This value was developed considering Carrasco et al. (2014) and McVittie and
Hussain (2013). Payment offered to subsidise foregone profits made from
deforestation.
A payment of $150 per hectare of reforestation, covering costs and providing an
incentive for reforestation activities.
A tax of $5 per tonne of CO2 (or CO2 equivalent) emitted.
Application of zero tillage agricultural activities, reducing agricultural emissions by 0.5
tonnes of carbon per hectare (Lal et al., 2004; Managalassery et al., 2015; Powlson et
al., 2016).
Socio-economic development (SED)
To propagate rural socio-economic development, the Bolivian government established the plan
for development of the agricultural sector “Plan del Sector Desarrollo Agropecuario- Hacia el
2025” (Ministerio de Desarrollo Rural y Tierras, 2014), building upon earlier plans, which aimed
to eradicate poverty, encourage food-security, transform land use, develop agricultural
technology, and encourage sustainable agricultural practices. The fundamental structure of this
plan was echoed by stakeholders, who considered that improvements in technical training,
programmes to assist subsistence farmers and diversity in incomes could assist ecosystem
conservation and encourage development in the future (Varela-Ortega et al., 2015).
The ‘Socio Economic Development’ (SED) scenario addresses the policy framework and
stakeholders through reductions in barriers facing farmers in the region, whilst promoting
greater incomes for rural communities. The SED scenario includes:
Fully subsidised seeds, easing the burden of upfront costs on farms, along with access
to farm machinery for free.
Farms are permitted to deforest up to 70% of their present forest area but must
conserve the remaining 30% of present forest area. However a tax of $90 per hectare
deforested is applied.
2. METHODOLOGY
45
2.6 Exploring Consumption and Production Trends and Transitional
Pathways: Statistical Trend and Participatory Analyses
To explore global, continental, national consumption and production changes, coupled with
potential strategies for developed regions to encourage consumption and production changes a
a multi-scale methodology was developed. This methodology includes an initial data analysis
investigating global, continenental and EU past trends of production and consumption of
protein-rich products, combined with a participatory analysis that incorporates two stakeholder
workshops perfomed in the EU to elucidate the current situation of protein-rich crop production
and consumption, and to develop sustainable pathways and identify policy requirement to
encourage future shifts in protein-rich product consumption and production.
Data Analysis
To provide an overview of past trends in production and consumption of protein-rich products
across the across the globe the following analyses were performed: (i) analytical description of
per capita human consumption and total production of legumes and animal products for the
period 1961-2013, at global and continental (Africa, Americas, Asia, Europe, and Oceania) scales,
and aggregated for all EU-28 Member States (MS); (ii) analysis of the harvested area response
of legume production to the Common Agricultural Policy (CAP) across the EU during the period
previously analysed (1961-2013, and updated to 2015); (iii) map recent consumption and
production changes across all EU-28 MS (1993-2013).
To develop the third analysis, 1993 was selected as a starting point to include EU MS such as
Czechia and Slovakia (formerly Czechoslovakia), who previously did not have sovereign data.
Average per capita consumption and total production values were calculated for each country
and each product group (legumes and animal) across two 5 year periods: 1993-1997 and 2009-
2013. The period 2009-2013 was selected as a 5-year period containing the most recent
available data. 5-year averages were used rather than arbitrarily selecting a year, to avoid
unrepresentative data caused by climatic conditions affecting production, or price or supply
fluctuations reducing consumption. From these two averages, percentage changes were
calculated across EU-28 countries and mapped.
Data Collection
Due to the scarcity and paucity of representative national scale household survey data to
quantify consumption, consumption data from the FAO Food Balance Sheets (FBS) (FAO, 2016)
was used. Aggregated data for food supply quantity (kg/capita/year) was collected for the period
1961-2013, first and last year available in dataset for each of the FAO defined continents (Asia,
Africa, Americas, Europe, and Oceania) and global values. Data was also collected for all EU-28
MS. Due to the means in which continental aggregations are developed, European results may
differ from EU-28 results, due to the inclusion of non EU-28 countries (e.g. Russia). Food supply
represents the quantity of a product available for direct human consumption (processed or
unprocessed) and does not include the quantity of the product available as feed. We interpreted
this as a direct proxy for human consumption. Using the food supply data did limit the analysis
2. METHODOLOGY
46
to legume groups (beans, peas, pulses, and soybeans2) as disaggregated individual crop data
were not available. Food supply data for animal products: beef, mutton, pork, and poultry meat,
along with milk and butter were also collected. Production quantity data for each of the above
products (legume groups and animal products) were also collected from the FBS for the period
1961-2013 (the first and last year available in the dataset). Data was collected using the
European Union aggregation from the FBS, which includes data for all EU-28 MS during the
period 1961-2013.
Data of production area dedicated to each crop group (beans, peas, pulses, and soybeans) were
collected from the FAO (2017) for the period 1961-2015. As part of this study we focus upon
internal production markets of each product and do not consider trade data (imports/ exports).
Individual crop data were collected and grouped where necessary to align with the FBS defined
crop groups. Total arable area data for each MS were also collected for the same period. This
allowed for a percentage of each crop group, relative to the total arable land area to be
calculated. To analyse the effect of the EU’s CAP, data for production area (and arable area)
were collected for all EU MS for the years in which they formed part of the European Union (or
within its previous naming designations). For example data for Spain was only collected from
1986-2015, with data for Italy collected from 1961-2015.
Participatory Analysis
Eames et al. (2013) suggest that engagement with stakeholders is vital when considering
complex and long-term societal issues, especially when attempting to characterise desirable
futures (van Berkel and Verburg, 2012). To investigate potential strategies for encouraging shifts
in consumption and production of protein-rich products across the European Union a
participatory methodology was adopted and developed within two stakeholder workshops. Two
different but complementary participatory methods were applied in the stakeholder workshops:
card technique and voting was applied in the first, and participatory backcasting in the second.
Stakeholder Workshops
The stakeholder workshops were performed during the period May 2017- February 2018. The
workshops involved stakeholders from across the European Union and were performed as part
of the project PROTEIN2FOOD.
Invited stakeholders either formed part of the project, or were selected due to their expertise
in relation to plant-proteins in the EU. Participants represented industries and sectors
throughout the production-processing-consumption chain, including: farmers associations,
researchers, non-governmental organisations (NGOs), food processing companies, sales,
consultants, and communication experts (Table 5).
2 Classified by the FAO as: beans (beans, dry); peas (peas, dry); pulses (broad beans dry, chick peas, cow peas,
pigeon peas, lentils, bambara beans, vetches, lupins, and pulses nested), soybeans (soybeans).
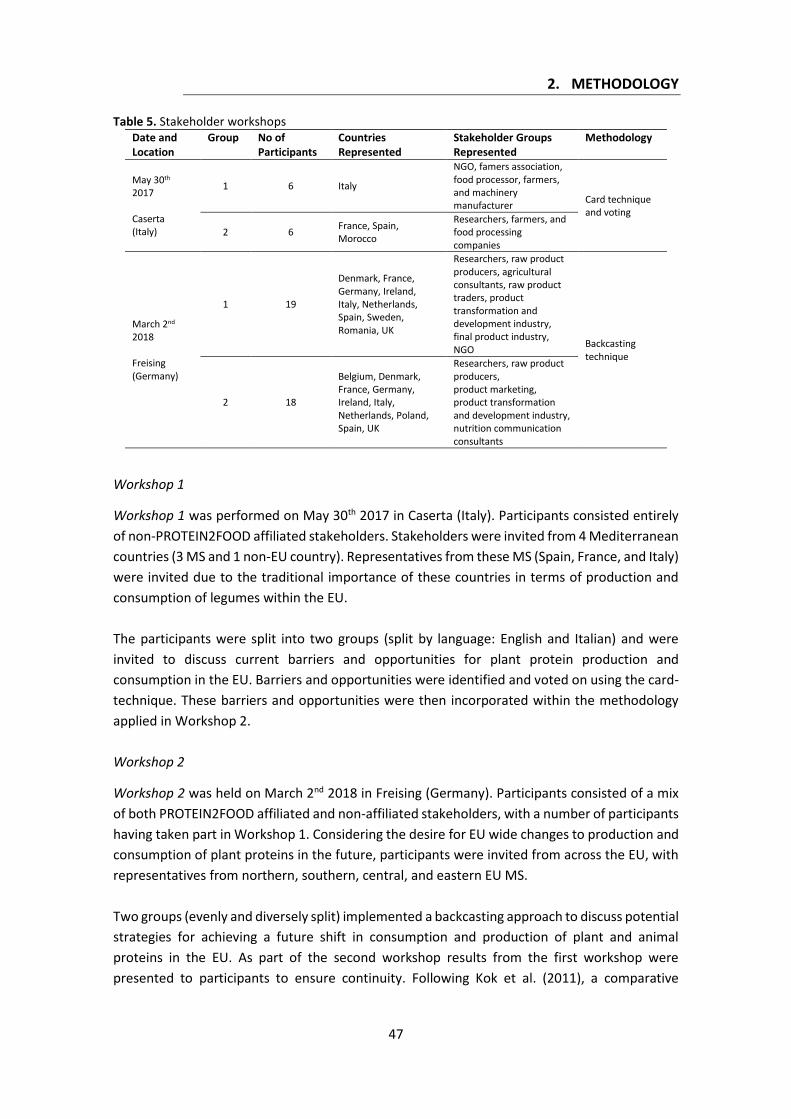
2. METHODOLOGY
47
Table 5. Stakeholder workshops Date and Location
Group No of Participants
Countries Represented
Stakeholder Groups Represented
Methodology
May 30th 2017 Caserta (Italy)
1 6 Italy
NGO, famers association, food processor, farmers, and machinery manufacturer
Card technique and voting
2 6 France, Spain, Morocco
Researchers, farmers, and food processing companies
March 2nd 2018 Freising (Germany)
1 19
Denmark, France, Germany, Ireland, Italy, Netherlands, Spain, Sweden, Romania, UK
Researchers, raw product producers, agricultural consultants, raw product traders, product transformation and development industry, final product industry, NGO
Backcasting technique
2 18
Belgium, Denmark, France, Germany, Ireland, Italy, Netherlands, Poland, Spain, UK
Researchers, raw product producers, product marketing, product transformation and development industry, nutrition communication consultants
Workshop 1
Workshop 1 was performed on May 30th 2017 in Caserta (Italy). Participants consisted entirely
of non-PROTEIN2FOOD affiliated stakeholders. Stakeholders were invited from 4 Mediterranean
countries (3 MS and 1 non-EU country). Representatives from these MS (Spain, France, and Italy)
were invited due to the traditional importance of these countries in terms of production and
consumption of legumes within the EU.
The participants were split into two groups (split by language: English and Italian) and were
invited to discuss current barriers and opportunities for plant protein production and
consumption in the EU. Barriers and opportunities were identified and voted on using the card-
technique. These barriers and opportunities were then incorporated within the methodology
applied in Workshop 2.
Workshop 2
Workshop 2 was held on March 2nd 2018 in Freising (Germany). Participants consisted of a mix
of both PROTEIN2FOOD affiliated and non-affiliated stakeholders, with a number of participants
having taken part in Workshop 1. Considering the desire for EU wide changes to production and
consumption of plant proteins in the future, participants were invited from across the EU, with
representatives from northern, southern, central, and eastern EU MS.
Two groups (evenly and diversely split) implemented a backcasting approach to discuss potential
strategies for achieving a future shift in consumption and production of plant and animal
proteins in the EU. As part of the second workshop results from the first workshop were
presented to participants to ensure continuity. Following Kok et al. (2011), a comparative
2. METHODOLOGY
48
analysis of the backcasting exercises, performed by each of the groups, was carried out to
identify robust strategies across the backcasts.
Both workshops were facilitated by facilitators with a long experience of implementing
stakeholder based interactions (e.g. Varela-Ortega et al., 2016; Esteve et al., 2018).
Participatory techniques
Card Technique and Voting
The card technique allows for elicitation of stakeholders’ perspectives on a given question,
through dialogue development and voting. It has been widely implemented as a pre-cursor to
more complex participatory approaches (e.g. Ziv et al., 2018). This technique invites participants
to write down a certain number of factors, which they feel are key in relation to a given subject,
and then vote on which of these factors is the most important.
The card technique applied in this study consists of four steps:
Step 1: Brainstorming
In a plenary session, participants were presented with the results from the past trends analysis.
This presentation was given to situate and inform stakeholders of the past situation of plant-
proteins in the EU and to initiate discussions on past and future market trends. Following this
introduction, participants were asked to consider and discuss the current situation for plant
proteins in the EU considering both production and consumption.
Step 2: Post-it session
Participants were split into two groups (as explained in the previous section ‘Workshop 1’). They
were given three cards (post-its/sticky notes) and asked to write down individually the three
most relevant factors from their perspectives. Each participant was then invited to present their
factors and then place them on a board amongst factors suggested by other participants. Similar
factors were grouped together by participants, with assistance from the facilitators. This was
repeated twice, with stakeholders identifying the most relevant barriers and opportunities.
Step 3: Voting and Ranking
Following a brief discussion of the outcomes from the previous step, stakeholders were then
given the opportunity to vote upon which of the factors was most important. This was repeated
for both barriers and opportunities.
Step 4: Plenary Discussion
Following the previous three steps, the two groups were brought back together (to the plenary).
A representative from each group then presented the barriers and opportunities identified
during the exercise to the other group (and vice versa). This was followed by a general discussion
of the results.
2. METHODOLOGY
49
Backcasting Technique
Backcasting explores future desirable end-points, which may be distinct from predicted futures
(Robinson, 1982), to assist in planning and decision-making (Dreborg, 2004). Backcasting
presents the opportunity to explore the desirability and feasibility of alternative future
conditions and formulate solutions for their achievement (Kok et al., 2011). Backcasting has
been widely implemented including stakeholder knowledge for planning processes (e.g. Kok et
al., 2011). In participatory backcasting, stakeholders work backwards from an agreed end-point,
defining milestones and describing actions required for the achievement of the goal (Salter et
al., 2010). Van Vliet (2011) suggests that performing backcasting with stakeholders can liberate
them of constraints in present thinking and offer greater freedom in the development of more
creative solutions. Stakeholder engagement can also expand the knowledge base and provide
an opportunity for social learning (Swart et al., 2004), increase legitimisation of outputs (van de
Kerkhof, 2006), and allow for consensus building (Nassauer and Corry, 2004).
The implementation of the backcasting technique was split into the following six steps:
Step 1: Definition of Desired Objectives
A desirable end-point was presented based upon the expected impacts of the project
PROTEIN2FOOD: to increase the EU’s arable land destined for protein-crop production and
accelerate the EU’s transition in consumption from animal-based to plant-based proteins. This
was then discussed, refined and agreed upon, following input from workshop participants during
a plenary at the start of the workshop.
The desired end-point in 2030 was agreed as “To increase plant-protein: production by 25% and
consumption by 10%”. The year 2030 was selected due to the timeline and expected impacts of
the PROTEIN2FOOD project, its temporal proximity to facilitate participants’ ability to imagine a
future, and to coincide with the targets of relevant international initiatives, such as the
Sustainable Development Goals and one of the EU’s key research and innovation policy
response: FOOD 2030. FOOD 2030 will investigate actions required to “…transform and future-
proof [EU] food systems to be sustainable…” and includes the PROTEIN2FOOD project as a
relevant research and innovation achievement under its first priority ‘Nutrition for sustainable
and healthy diets’ (European Commission, 2016).
Following the agreement of the objective during the introduction, the group was split into two
evenly distributed group (as explained in the previous section ‘Workshop 2’) where steps two to
five were performed identically as two individual groups, and step six with the group as a whole.
As part of steps two to four, the card-technique was utilised, with voting used only in step four.
Step 2: Defining Milestones
Milestones were defined as interim objectives that need to be reached to achieve the agreed
upon desirable objective. As part of this step, participants were each given a yellow card and
invited to suggest one milestone, necessary for achieving the objective. Each participant was
asked to explain the milestone to other participants and place it on the backcasting timeline
(2015-2030). Participants were also asked to consider why the milestones are needed, what they
2. METHODOLOGY
50
entail, and when they need to be achieved. Similar milestones were clustered by participants,
with assistance from the facilitators, if they appeared at similar points along the timeline.
Step 3: Identifying Barriers and Opportunities
In this step, barriers and opportunities for achieving the objective and the milestones were
identified. Stakeholders were given the opportunity to present factors or processes that they
considered to stand in the way of the desired end-point. Similarly, opportunities that can be
taken advantage of to achieve the objective and the interim milestones were provided by
stakeholders. As with the milestones, each participant was given a card (red for barriers and
green for opportunities) and asked to explain the barrier/ opportunity to the other participants
and then to place it on the backcasting timeline. Barriers and opportunities from the first
workshop were initially presented to participants and could be re-used and placed upon the
backcast timeline if desired. Barriers and opportunities were clustered together if they appeared
at temporally similar points along the timeline.
Step 4: Identifying Policy Actions
Participants were then asked to identify policy actions that could be implemented to achieve
the objective and milestones, address the barriers, or take advantage of the opportunities.
Participants were requested to be as specific as possible, specifying what these actions would
entail, who would enforce them, and when they would be implemented. As with the previous
two steps, the card-technique was used with participants given a blue card and invited to
describe the action and place it upon the backcast timeline. As part of this step voting was also
used. Individual participants were then invited to vote upon which of the policy actions is most
needed to achieve the final objective. Participants gave three votes to the most important, two
votes to second, and one to the third.
Step 5: Defining Strategies
Participants were then asked to develop pathways from the objective (2030) back to the present
(2015) connecting milestones and necessary policy actions required for their achievement and
considerate of the timeline.
Step 6: Identifying Robust Strategies
Following the previous five steps, the two groups returned to one group for a plenary discussion.
Each group presented their backcasting, with a comparison made of the two backcasts by
participants. In particular, the discussion focussed upon the strategies outlined by both groups,
with similarities between these strategies highlighted. From this discussion and comparison, a
series of robust strategies were identified and policy suggestions derived.
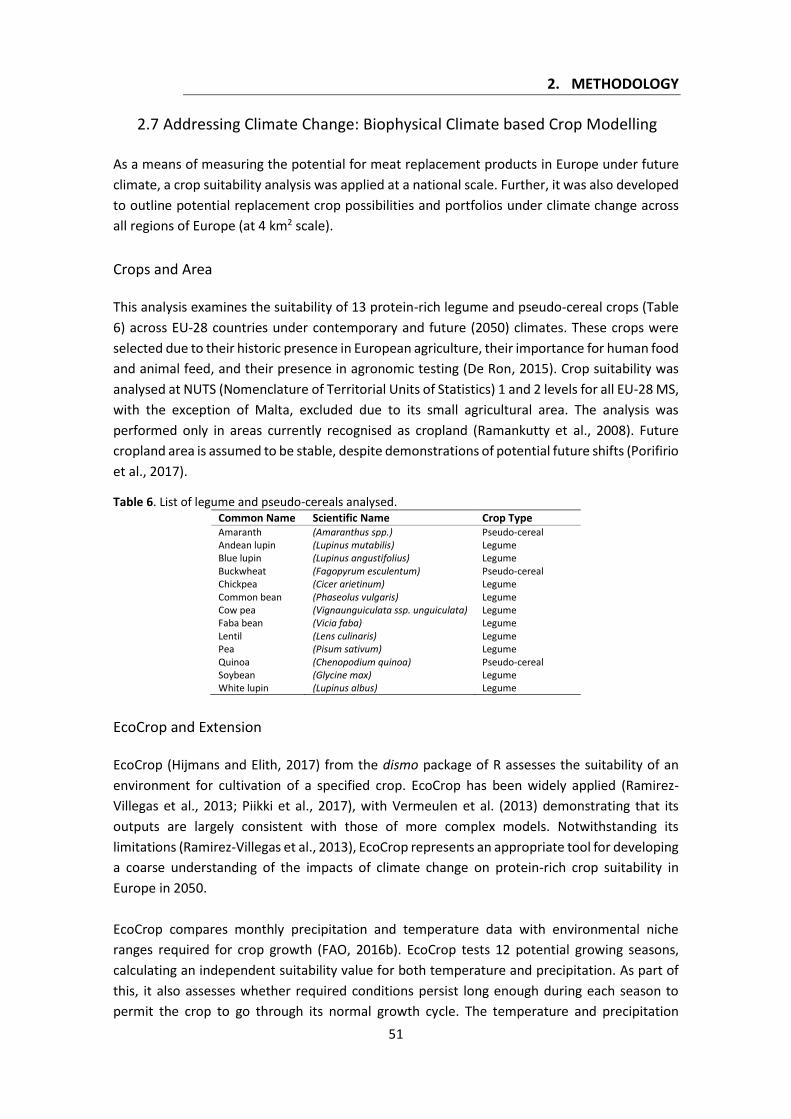
2. METHODOLOGY
51
2.7 Addressing Climate Change: Biophysical Climate based Crop Modelling
As a means of measuring the potential for meat replacement products in Europe under future
climate, a crop suitability analysis was applied at a national scale. Further, it was also developed
to outline potential replacement crop possibilities and portfolios under climate change across
all regions of Europe (at 4 km2 scale).
Crops and Area
This analysis examines the suitability of 13 protein-rich legume and pseudo-cereal crops (Table
6) across EU-28 countries under contemporary and future (2050) climates. These crops were
selected due to their historic presence in European agriculture, their importance for human food
and animal feed, and their presence in agronomic testing (De Ron, 2015). Crop suitability was
analysed at NUTS (Nomenclature of Territorial Units of Statistics) 1 and 2 levels for all EU-28 MS,
with the exception of Malta, excluded due to its small agricultural area. The analysis was
performed only in areas currently recognised as cropland (Ramankutty et al., 2008). Future
cropland area is assumed to be stable, despite demonstrations of potential future shifts (Porifirio
et al., 2017).
Table 6. List of legume and pseudo-cereals analysed. Common Name Scientific Name Crop Type Amaranth (Amaranthus spp.) Pseudo-cereal Andean lupin (Lupinus mutabilis) Legume Blue lupin (Lupinus angustifolius) Legume Buckwheat (Fagopyrum esculentum) Pseudo-cereal Chickpea (Cicer arietinum) Legume Common bean (Phaseolus vulgaris) Legume Cow pea (Vignaunguiculata ssp. unguiculata) Legume Faba bean (Vicia faba) Legume Lentil (Lens culinaris) Legume Pea (Pisum sativum) Legume Quinoa (Chenopodium quinoa) Pseudo-cereal Soybean (Glycine max) Legume White lupin (Lupinus albus) Legume
EcoCrop and Extension
EcoCrop (Hijmans and Elith, 2017) from the dismo package of R assesses the suitability of an
environment for cultivation of a specified crop. EcoCrop has been widely applied (Ramirez-
Villegas et al., 2013; Piikki et al., 2017), with Vermeulen et al. (2013) demonstrating that its
outputs are largely consistent with those of more complex models. Notwithstanding its
limitations (Ramirez-Villegas et al., 2013), EcoCrop represents an appropriate tool for developing
a coarse understanding of the impacts of climate change on protein-rich crop suitability in
Europe in 2050.
EcoCrop compares monthly precipitation and temperature data with environmental niche
ranges required for crop growth (FAO, 2016b). EcoCrop tests 12 potential growing seasons,
calculating an independent suitability value for both temperature and precipitation. As part of
this, it also assesses whether required conditions persist long enough during each season to
permit the crop to go through its normal growth cycle. The temperature and precipitation
2. METHODOLOGY
52
suitability values for each growing season are then multiplied, with the maximum value from
the 12 potential growing seasons considered the suitability index for the crop. Suitability ranges
from 0 (unsuitable) to 1 (suitable).
For each growing season𝑖, EcoCrop calculates whether temperature ranges in a given land
surface pixel are firstly permissible (𝑇𝑚𝑖𝑛𝑇𝑚𝑎𝑥) for growth, and secondly whether they are
within an optimal growth range (𝑇𝑜𝑝𝑚𝑖𝑛𝑇𝑜𝑝𝑚𝑎𝑥). If the mean temperature (�̅�𝑖) of the evaluated
growing season is within the optimal temperature range, as defined by the crop parameters
(FAO, 2016b), this results in a temperature suitability value of 1. If however, the mean
temperature falls outside of the optimal range, but within the permissible range temperature
suitability is set at more than zero and less than one. If the mean temperature of the growing
season falls between 𝑇𝑚𝑖𝑛 and 𝑇𝑜𝑝𝑚𝑖𝑛 suitability is calculated as shown in equation 16, whilst if
it falls between 𝑇𝑜𝑝𝑚𝑎𝑥 and 𝑇𝑚𝑎𝑥 it is calculated as shown in equation 17. If the mean
temperature falls outside of the permissible temperature range (𝑇𝑚𝑖𝑛𝑇𝑚𝑎𝑥) suitability is set to
0.
𝑇𝑆𝑢𝑖𝑡𝑖 =�̅�𝑖 − 𝑇𝑚𝑖𝑛
𝑇𝑜𝑝𝑚𝑖𝑛 − 𝑇𝑚𝑖𝑛
16
𝑇𝑆𝑢𝑖𝑡𝑖 =𝑇𝑚𝑎𝑥 − �̅�𝑖
𝑇𝑚𝑎𝑥 − 𝑇𝑜𝑝𝑚𝑎𝑥
17
EcoCrop also evaluates minimum temperature values, using a death temperature (𝑇𝑘𝑖𝑙𝑙), derived
from FAO (2016b). If within the growing season the minimum temperature drops to 𝑇𝑘𝑖𝑙𝑙 + 4C,
temperature suitability is set to 0. Using each month as the potential start of growing season𝑖,
EcoCrop analyses the temperature data for the months that fall within this cycle. The geometric
mean of the crop cycle, defined by the EcoCrop database (FAO, 2016b) was used for crop cycle
length.
EcoCrop then evaluates the precipitation suitability for growing season𝑖 by calculating the
cumulative precipitation (𝑃𝑖) over the length of the crop cycle, including one month before and
one month after the season. As with the temperature suitability, EcoCrop assesses whether
these cumulative precipitation values lie within a permissible range of required cumulative
precipitation (𝑃𝑚𝑖𝑛𝑃𝑚𝑎𝑥), or within the optimal range (𝑃𝑜𝑝𝑚𝑖𝑛𝑃𝑜𝑝𝑚𝑎𝑥) for this crop, as defined
by FAO (2016b). If precipitation is within the optimal cumulative range, this results in a
precipitation suitability value of 1. If cumulative precipitation falls outside of this, but within the
permissible range precipitation suitability is set at more than zero and less than one. If the
cumulative precipitation falls between 𝑃𝑚𝑖𝑛 and 𝑃𝑜𝑝𝑚𝑖𝑛 suitability is calculated as shown in
equation 18, whilst if it falls between 𝑃𝑜𝑝𝑚𝑎𝑥 and 𝑃𝑚𝑎𝑥 it is calculated as shown in equation 19.
If cumulative precipitation falls outside of the permissible range (𝑃𝑚𝑖𝑛𝑃𝑚𝑎𝑥) suitability is set to
0.
2. METHODOLOGY
53
𝑃𝑆𝑢𝑖𝑡𝑖 =𝑃𝑖 − 𝑃𝑚𝑖𝑛
𝑃𝑜𝑝𝑚𝑖𝑛 − 𝑃𝑚𝑖𝑛
18
𝑃𝑆𝑢𝑖𝑡𝑖 =𝑃𝑚𝑎𝑥 − 𝑃𝑖
𝑃𝑚𝑎𝑥 − 𝑃𝑜𝑝𝑚𝑎𝑥 19
Following the development of the 12 𝑇𝑆𝑢𝑖𝑡𝑖 and 𝑃𝑆𝑢𝑖𝑡𝑖 values, these are then multiplied to
develop 12 growing season suitability values (𝑆𝑢𝑖𝑡𝑖) (equation 20). From this series, EcoCrop
takes the highest value as the crop suitability value (Suit), based upon the assumption that a
farmer plants during this ideal period.
𝑆𝑢𝑖𝑡 = 𝑚𝑎𝑥[𝑆𝑢𝑖𝑡𝑖 = (𝑇𝑆𝑢𝑖𝑡𝑖 ∗ 𝑃𝑆𝑢𝑖𝑡𝑖)] 20
EcoCrop is highly flexible and permits the inclusion of extra parameters to further refine crop
suitability, as demonstrated by Pikki et al. (2017). As an extension to the original EcoCrop model,
a parameter for soil pH is included. Soil pH was selected due to its observed effects upon water
uptake, nutrient availability, and crop growth (Kemmitt et al., 2006; Ghimire et al., 2017). Other
soil parameters were also considered, but were omitted due to a lack of consistent data and
niche range values. Soil pH has been shown to fluctuate daily and seasonally due to precipitation
and may also change in the future due to climate change (Rengel, 2002; Rengel, 2011). Despite
these observations, soil pH was considered a constant due to a lack of contemporary and future
monthly pH data. As pH was assumed to be constant, pH suitability was only calculated once,
rather than for the 12 aforementioned growing seasons.
The calculation of 𝑝𝐻𝑆𝑢𝑖𝑡 was identical to that of temperature and equations 16 and 17, with a
permissible soil pH range (𝑝𝐻𝑚𝑖𝑛𝑝𝐻𝑚𝑎𝑥) and an optimal range (𝑝𝐻𝑜𝑝𝑚𝑖𝑛𝑝𝐻𝑜𝑝𝑚𝑎𝑥) developed,
as defined by FAO (2016b). If the pH value lies within the optimal pH range, pH suitability was
set to 1. If however, the pH value falls outside of the optimal range, but within the permissible
range pH suitability is set at more than zero and less than one. If the pH falls
between (𝑝𝐻𝑚𝑖𝑛𝑝𝐻𝑚𝑎𝑥) suitability is calculated as shown in equation 16, whilst if it falls
between (𝑝𝐻𝑜𝑝𝑚𝑖𝑛𝑝𝐻𝑜𝑝𝑚𝑎𝑥) it is calculated as in equation 17.
Following the calculation of 𝑝𝐻𝑆𝑢𝑖𝑡, crop suitability was assumed to be limited by the minimum
value of climatic suitability (𝑇𝑆𝑢𝑖𝑡 ∗ 𝑃𝑆𝑢𝑖𝑡) and soil suitability 𝑝𝐻𝑆𝑢𝑖𝑡. Crop suitability, under
the extended model, for each cropland pixel was defined as being the minimum value from the
climatic and soil suitability values, as defined in equation 21. The smallest value from this
equation was assumed to represent the parameter that limited crop suitability and was
extracted during analysis.
𝑆𝑢𝑖𝑡 = min [(𝑇𝑆𝑢𝑖𝑡 ∗ 𝑃𝑆𝑢𝑖𝑡); 𝑝𝐻𝑆𝑢𝑖𝑡] 21
The EcoCrop model (and extension) were both run using current climate data to develop a
contemporary baseline, and were also run using climate data for each of the 30 GCMs, under
RCP4.5.
2. METHODOLOGY
54
Crop, Climate, and Soil Data
Crop suitability was modelled using climate and soil data for present and future conditions.
These data were analysed subject to expert derived crop-specific admissible ranges, with
parameter data extracted from the EcoCrop database maintained by the FAO (2016b). An
assumption was made that no crop breeding programmes are performed that would alter these
parameter ranges.
Current climate data were sourced from WorldClim, which contains average monthly climate
data for temperature (minimum, maximum, and mean) and precipitation for the period 1970-
2000 (Fick and Hijmans, 2017). From WorldClim, 12 monthly data sets of precipitation,
minimum, and mean temperature data were collected to analyse present suitability, at a
resolution of 2.5 arc minutes (~4.5 km² at the equator). Future climate data (2050s) were taken
from the Climate Change, Agriculture and Food Security (CCAFS) database (http://ccafs-
climate.org/data/). These data had been previously downscaled, as described by Ramirez and
Jarvis (2010). 12 monthly data sets were collected for precipitation, minimum and mean
temperatures at a resolution of 2.5 arc minutes. Data were collected for the 30 available Global
Circulation Models (GCMs) (Annex 4: List of the 30 Global Circulation Models used within the
analysis) under Representative Concentration Pathway (RCP) 4.5. RCP4.5 was selected as the
scenario behind this pathway (IPCC, 2014) as it was considered the most probable and
informative for 2050.
Soil pH data were sourced from the International Soil Reference and Information Centre (ISRIC)
and their SoilGrids platform (www.soilgrids.org). Data were collected at depths of 0, 5, 15, and
30cm at 30 arc seconds, with average pH values (0-30cm) calculated using the software R. Soil
data were aggregated to 2.5 arc minutes, and cropped to correspond with the climate data.
All data were cropped to 75N-30S and 55E- -15W, incorporating all EU-28 MS.
Current Distribution Analysis
To analyse current protein-rich crop distributions and their potential relationship with climate
suitability, EcoCrop suitability outputs were evaluated against sub-national (NUTS-2) agricultural
production statistics (European Commission, 2017). This analysis was performed for all crops
with available and disaggregated sub-national data. Suitability is only one of the limiting factors
in crop selection, so an asymmetric relationship between production and suitability is expected.
Crops can be absent in highly suitable areas, but are not expected to be present in highly
unsuitable areas. To analyse this type of relationship quantile regressions focusing on the
highest quantile (95th) of production were performed.
Production area data were sourced for the year 2010 for blue lupin, buckwheat, faba bean, pea,
and soybean. The proportional distribution of each crop, in all NUTS-2 regions, was calculated
from the total production of all protein-rich crops within that region. For each NUTS-2 region
and crop combination, from EcoCrop outputs for the maximum and mean suitability values of
2. METHODOLOGY
55
the pixels falling in that region were derived. In performing the suitability analysis EcoCrop was
implemented under the assumption that rainfall was not an absolute limiting factor, to allow for
the possibility of irrigated production.
Future Suitability Analysis
To identify how climate change may affect suitability across EU-28 MS, percentage changes in
aggregated national suitability were calculated from EcoCrop outputs under the baseline and
future climates. For both baseline and future suitability, the minimum suitability value (climatic
or soil) was used to define the limiting factor for each cropland area pixel. Modal values for
limiting factors were calculated for each crop in each country. Aggregated national suitability
was defined from the average of suitability values for all cropland surface pixels within national
boundaries (Ramankutty et al., 2008). This calculation was replicated for all the 30 GCMs runs
of the model.
Ideal baseline and future crop options for each cropland surface pixel were also identified. The
baseline ideal crop option was developed from stacking all crop suitability layers. From this
stack, the maximum suitability value from within the stack for each surface pixel was extracted,
with this maximum value corresponding to a crop layer. A layer with the highest suitability values
(across all crops) for each surface pixel was developed and was used to define ideal crop options.
In defining future ideal crop options, a similar approach was applied. However, a crop suitability
layer that included results from all 30 GCMs was initially developed. For this, the maximum
suitability value for each cropland surface pixel was extracted from the stack of 30 GCM specific
crop layers. This was repeated for each crop. These maximum suitability layers were then
stacked. Using these maximum crop suitability layers, the same methodology as for the current
ideal option was repeated.
For the future analyses rainfed crop production was assumed. Irrigation in Europe is not
expected to expand greatly in the future (Alexandratos and Bruinsma, 2012), which implies that
expansion of the analysed crops will likely be into non-irrigated areas. Also, the crops are
analysed within the context of their potential as meat replacements in order to reduce
environmental impacts. Therefore, identification of production areas was focused on areas
where the crops are not competing strongly for scarce water resources.
Sensitivity Analysis
To test the robustness of this analysis, the sensitivity of the EcoCrop outputs to changes in
parameters within the model was analysed. Previous analyses of EcoCrop (e.g. Ramirez-Villegas
et al., 2013; Manners and van Etten, 2018) have highlighted the robustness of the model and
the limited sensitivity of parameter changes. Despite this, sensitivity of EcoCrop outputs to
changes in temperate, precipitation, pH, and crop cycle length were investigated.
Parameter ranges defined by FAO (2012) were altered, to vary them to such an extent that the
correct parameter value is likely to be found within that range. Following Manners and van Etten
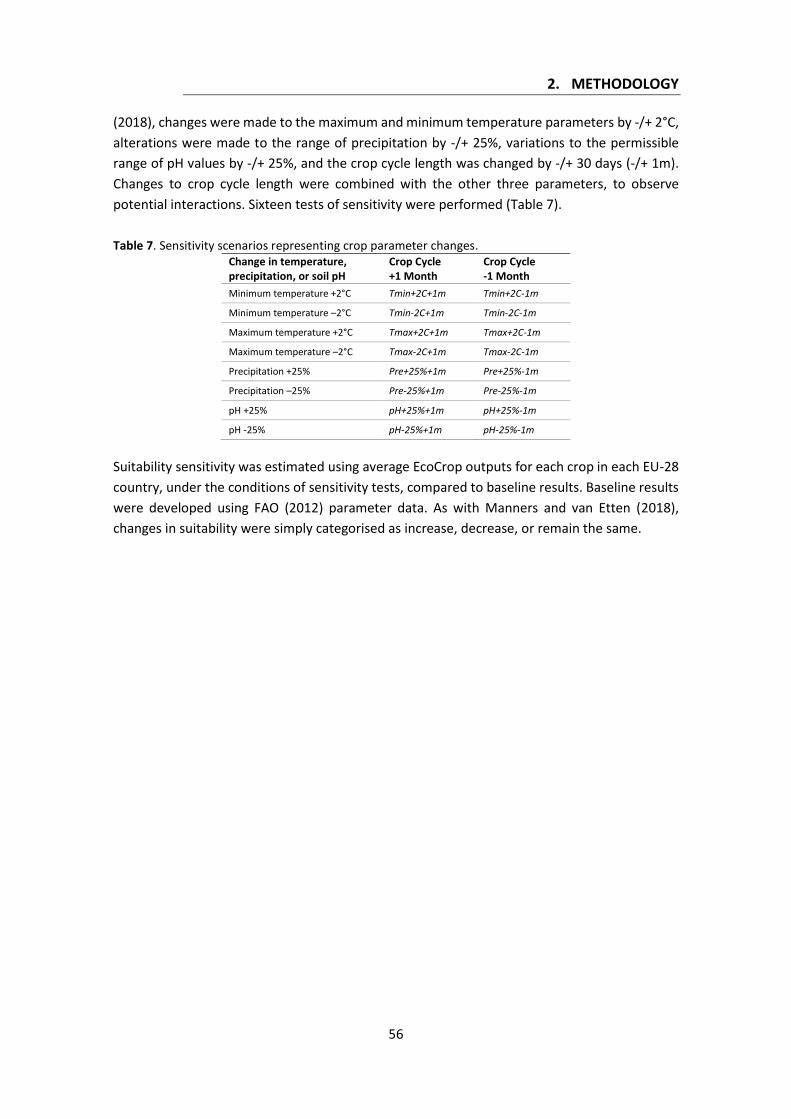
2. METHODOLOGY
56
(2018), changes were made to the maximum and minimum temperature parameters by -/+ 2°C,
alterations were made to the range of precipitation by -/+ 25%, variations to the permissible
range of pH values by -/+ 25%, and the crop cycle length was changed by -/+ 30 days (-/+ 1m).
Changes to crop cycle length were combined with the other three parameters, to observe
potential interactions. Sixteen tests of sensitivity were performed (Table 7).
Table 7. Sensitivity scenarios representing crop parameter changes. Change in temperature, precipitation, or soil pH
Crop Cycle +1 Month
Crop Cycle -1 Month
Minimum temperature +2°C Tmin+2C+1m Tmin+2C-1m
Minimum temperature –2°C Tmin-2C+1m Tmin-2C-1m
Maximum temperature +2°C Tmax+2C+1m Tmax+2C-1m
Maximum temperature –2°C Tmax-2C+1m Tmax-2C-1m
Precipitation +25% Pre+25%+1m Pre+25%-1m
Precipitation –25% Pre-25%+1m Pre-25%-1m
pH +25% pH+25%+1m pH+25%-1m
pH -25% pH-25%+1m pH-25%-1m
Suitability sensitivity was estimated using average EcoCrop outputs for each crop in each EU-28
country, under the conditions of sensitivity tests, compared to baseline results. Baseline results
were developed using FAO (2012) parameter data. As with Manners and van Etten (2018),
changes in suitability were simply categorised as increase, decrease, or remain the same.
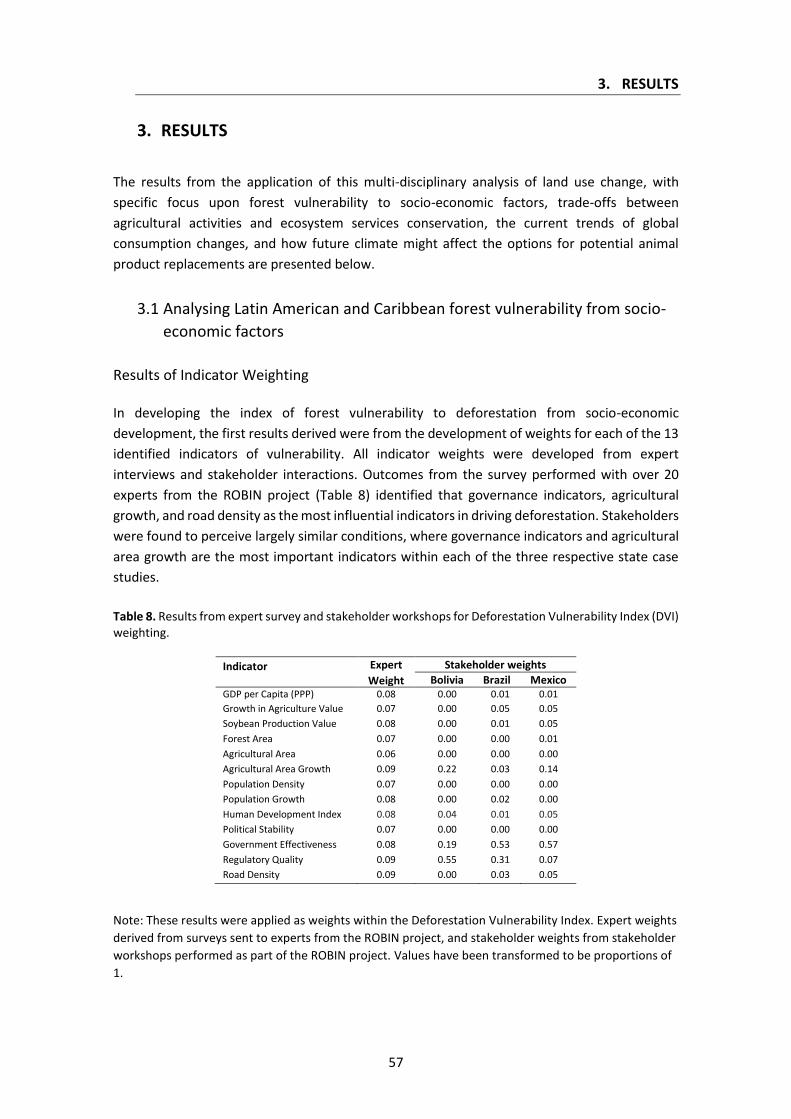
3. RESULTS
57
3. RESULTS
The results from the application of this multi-disciplinary analysis of land use change, with
specific focus upon forest vulnerability to socio-economic factors, trade-offs between
agricultural activities and ecosystem services conservation, the current trends of global
consumption changes, and how future climate might affect the options for potential animal
product replacements are presented below.
3.1 Analysing Latin American and Caribbean forest vulnerability from socio-
economic factors
Results of Indicator Weighting
In developing the index of forest vulnerability to deforestation from socio-economic
development, the first results derived were from the development of weights for each of the 13
identified indicators of vulnerability. All indicator weights were developed from expert
interviews and stakeholder interactions. Outcomes from the survey performed with over 20
experts from the ROBIN project (Table 8) identified that governance indicators, agricultural
growth, and road density as the most influential indicators in driving deforestation. Stakeholders
were found to perceive largely similar conditions, where governance indicators and agricultural
area growth are the most important indicators within each of the three respective state case
studies.
Table 8. Results from expert survey and stakeholder workshops for Deforestation Vulnerability Index (DVI) weighting.
Indicator Expert
Weight
Stakeholder weights
Bolivia Brazil Mexico GDP per Capita (PPP) 0.08 0.00 0.01 0.01
Growth in Agriculture Value
Added to GDP
0.07 0.00 0.05 0.05
Soybean Production Value 0.08 0.00 0.01 0.05
Forest Area 0.07 0.00 0.00 0.01
Agricultural Area 0.06 0.00 0.00 0.00
Agricultural Area Growth 0.09 0.22 0.03 0.14
Population Density 0.07 0.00 0.00 0.00
Population Growth 0.08 0.00 0.02 0.00
Human Development Index 0.08 0.04 0.01 0.05
Political Stability 0.07 0.00 0.00 0.00
Government Effectiveness 0.08 0.19 0.53 0.57
Regulatory Quality 0.09 0.55 0.31 0.07
Road Density 0.09 0.00 0.03 0.05
Note: These results were applied as weights within the Deforestation Vulnerability Index. Expert weights
derived from surveys sent to experts from the ROBIN project, and stakeholder weights from stakeholder
workshops performed as part of the ROBIN project. Values have been transformed to be proportions of
1.
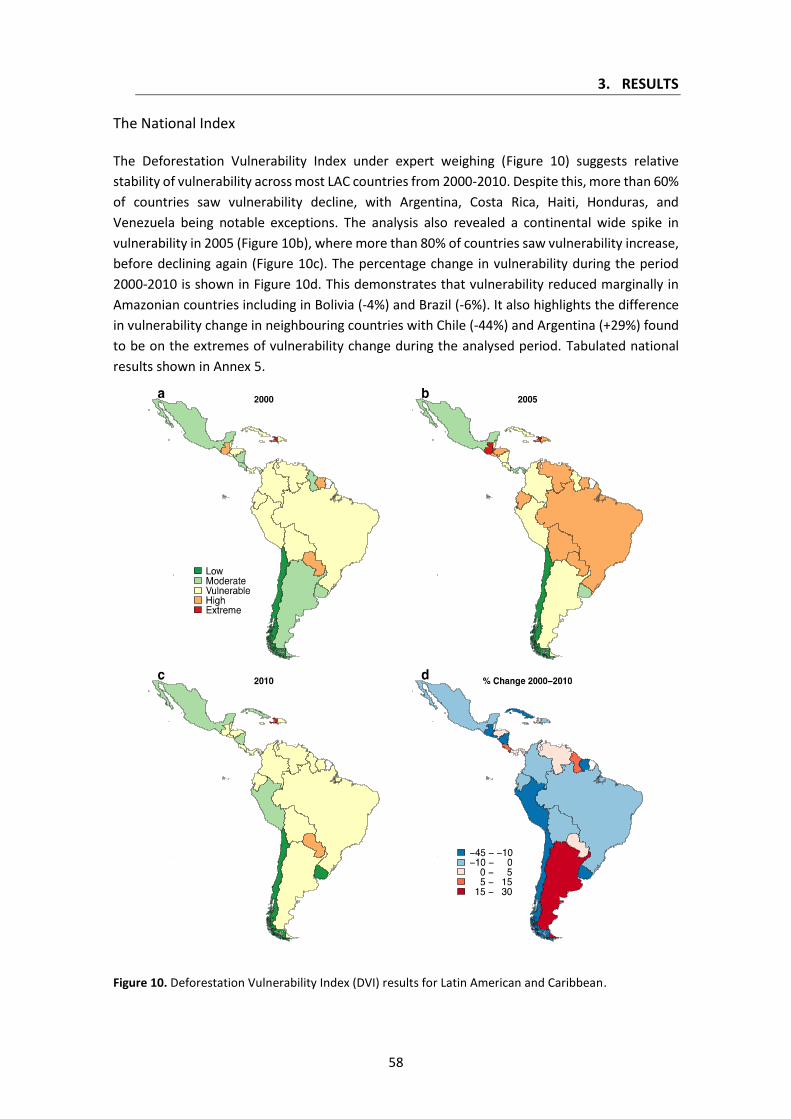
3. RESULTS
58
The National Index
The Deforestation Vulnerability Index under expert weighing (Figure 10) suggests relative
stability of vulnerability across most LAC countries from 2000-2010. Despite this, more than 60%
of countries saw vulnerability decline, with Argentina, Costa Rica, Haiti, Honduras, and
Venezuela being notable exceptions. The analysis also revealed a continental wide spike in
vulnerability in 2005 (Figure 10b), where more than 80% of countries saw vulnerability increase,
before declining again (Figure 10c). The percentage change in vulnerability during the period
2000-2010 is shown in Figure 10d. This demonstrates that vulnerability reduced marginally in
Amazonian countries including in Bolivia (-4%) and Brazil (-6%). It also highlights the difference
in vulnerability change in neighbouring countries with Chile (-44%) and Argentina (+29%) found
to be on the extremes of vulnerability change during the analysed period. Tabulated national
results shown in Annex 5.
Figure 10. Deforestation Vulnerability Index (DVI) results for Latin American and Caribbean.
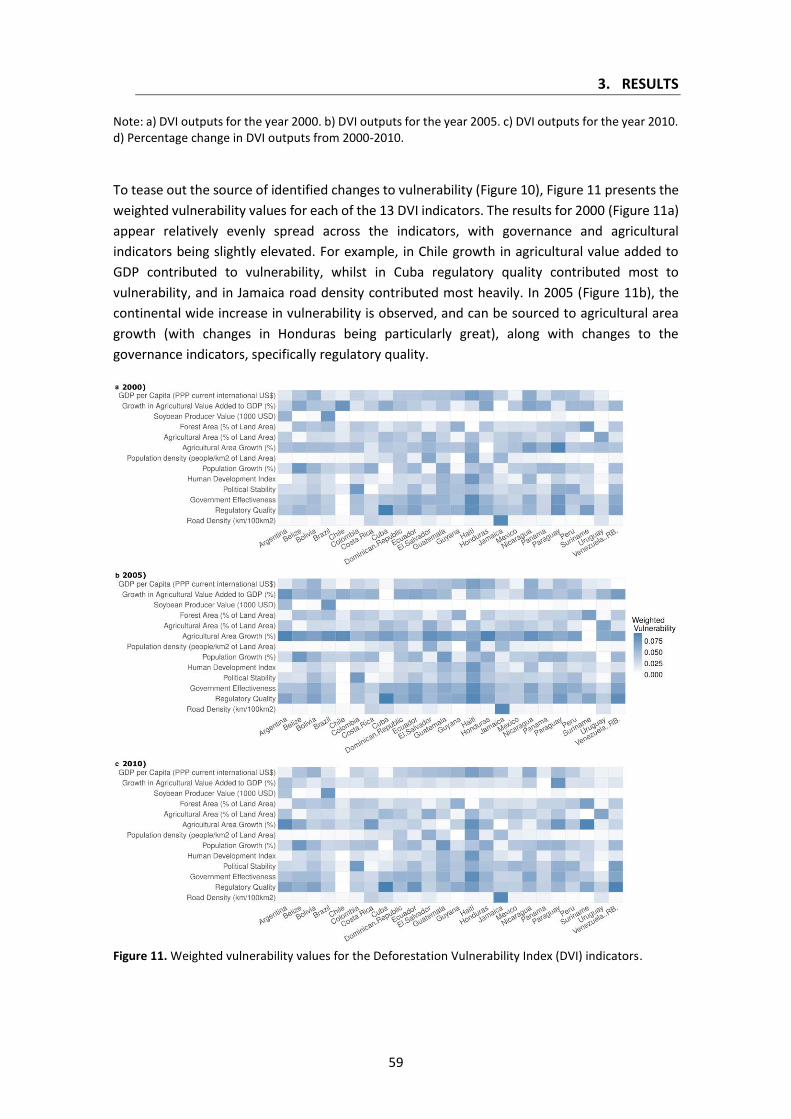
3. RESULTS
59
Note: a) DVI outputs for the year 2000. b) DVI outputs for the year 2005. c) DVI outputs for the year 2010. d) Percentage change in DVI outputs from 2000-2010.
To tease out the source of identified changes to vulnerability (Figure 10), Figure 11 presents the
weighted vulnerability values for each of the 13 DVI indicators. The results for 2000 (Figure 11a)
appear relatively evenly spread across the indicators, with governance and agricultural
indicators being slightly elevated. For example, in Chile growth in agricultural value added to
GDP contributed to vulnerability, whilst in Cuba regulatory quality contributed most to
vulnerability, and in Jamaica road density contributed most heavily. In 2005 (Figure 11b), the
continental wide increase in vulnerability is observed, and can be sourced to agricultural area
growth (with changes in Honduras being particularly great), along with changes to the
governance indicators, specifically regulatory quality.
Figure 11. Weighted vulnerability values for the Deforestation Vulnerability Index (DVI) indicators.
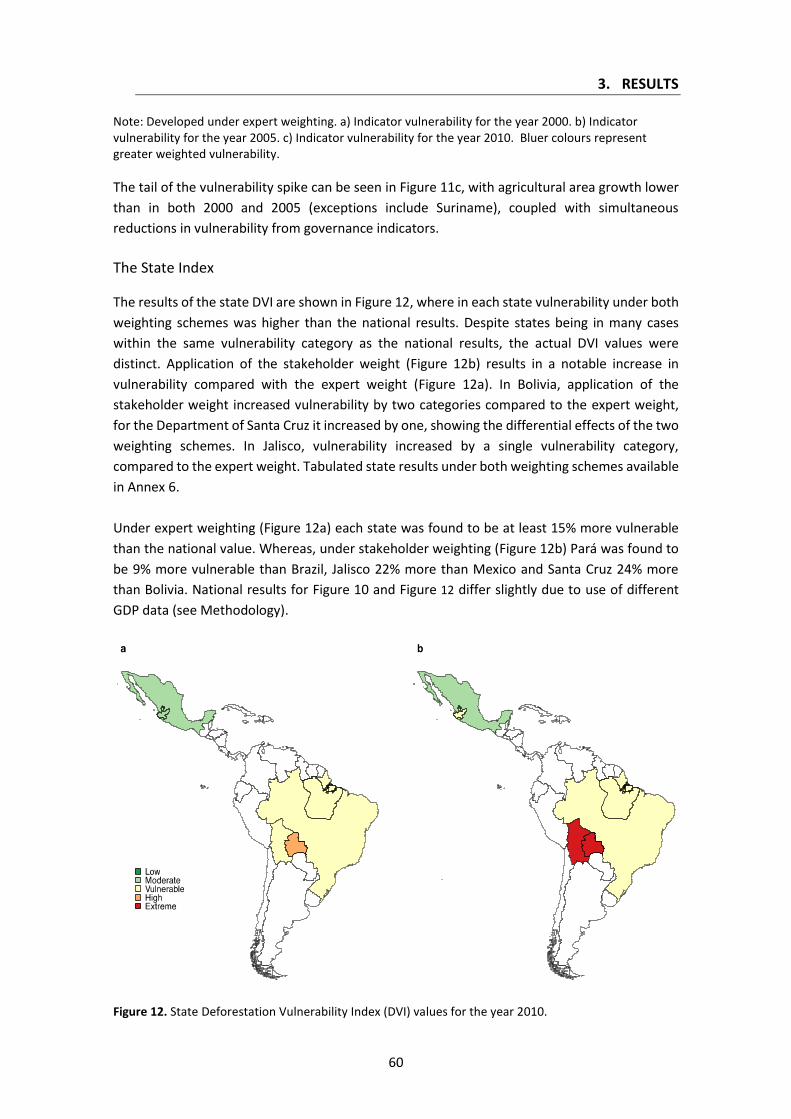
3. RESULTS
60
Note: Developed under expert weighting. a) Indicator vulnerability for the year 2000. b) Indicator vulnerability for the year 2005. c) Indicator vulnerability for the year 2010. Bluer colours represent greater weighted vulnerability.
The tail of the vulnerability spike can be seen in Figure 11c, with agricultural area growth lower
than in both 2000 and 2005 (exceptions include Suriname), coupled with simultaneous
reductions in vulnerability from governance indicators.
The State Index
The results of the state DVI are shown in Figure 12, where in each state vulnerability under both
weighting schemes was higher than the national results. Despite states being in many cases
within the same vulnerability category as the national results, the actual DVI values were
distinct. Application of the stakeholder weight (Figure 12b) results in a notable increase in
vulnerability compared with the expert weight (Figure 12a). In Bolivia, application of the
stakeholder weight increased vulnerability by two categories compared to the expert weight,
for the Department of Santa Cruz it increased by one, showing the differential effects of the two
weighting schemes. In Jalisco, vulnerability increased by a single vulnerability category,
compared to the expert weight. Tabulated state results under both weighting schemes available
in Annex 6.
Under expert weighting (Figure 12a) each state was found to be at least 15% more vulnerable
than the national value. Whereas, under stakeholder weighting (Figure 12b) Pará was found to
be 9% more vulnerable than Brazil, Jalisco 22% more than Mexico and Santa Cruz 24% more
than Bolivia. National results for Figure 10 and Figure 12 differ slightly due to use of different
GDP data (see Methodology).
Figure 12. State Deforestation Vulnerability Index (DVI) values for the year 2010.
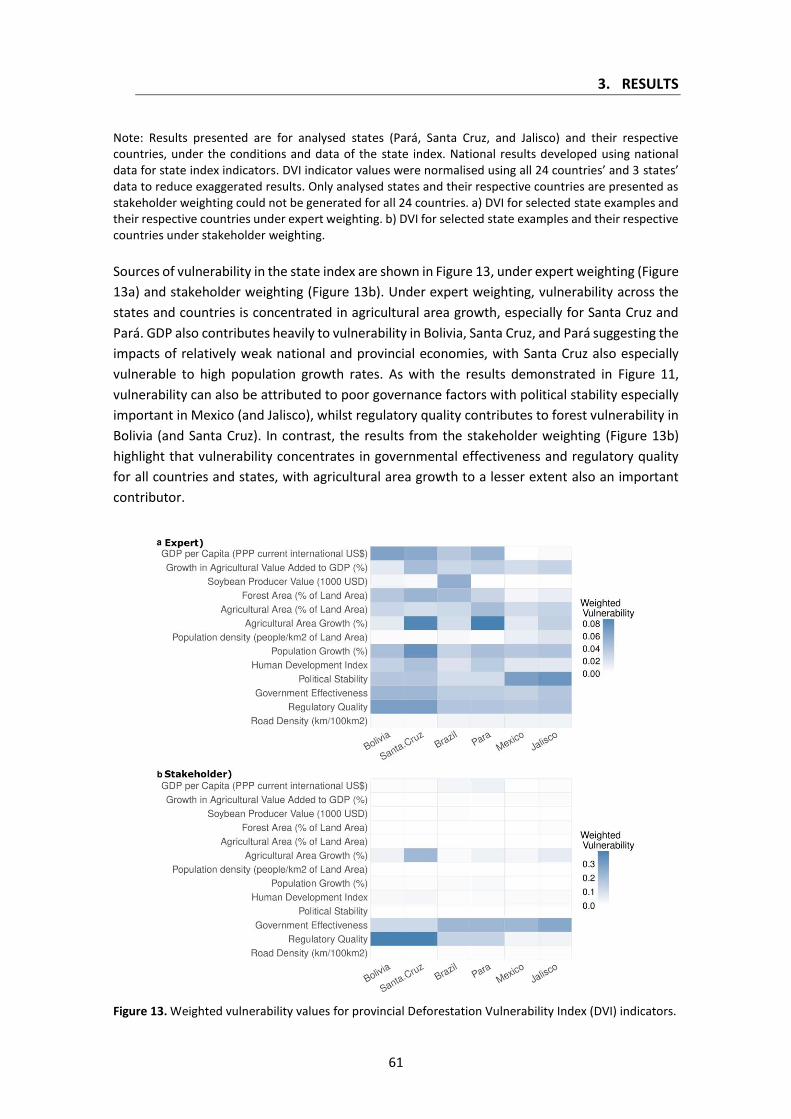
3. RESULTS
61
Note: Results presented are for analysed states (Pará, Santa Cruz, and Jalisco) and their respective countries, under the conditions and data of the state index. National results developed using national data for state index indicators. DVI indicator values were normalised using all 24 countries’ and 3 states’ data to reduce exaggerated results. Only analysed states and their respective countries are presented as stakeholder weighting could not be generated for all 24 countries. a) DVI for selected state examples and their respective countries under expert weighting. b) DVI for selected state examples and their respective countries under stakeholder weighting.
Sources of vulnerability in the state index are shown in Figure 13, under expert weighting (Figure
13a) and stakeholder weighting (Figure 13b). Under expert weighting, vulnerability across the
states and countries is concentrated in agricultural area growth, especially for Santa Cruz and
Pará. GDP also contributes heavily to vulnerability in Bolivia, Santa Cruz, and Pará suggesting the
impacts of relatively weak national and provincial economies, with Santa Cruz also especially
vulnerable to high population growth rates. As with the results demonstrated in Figure 11,
vulnerability can also be attributed to poor governance factors with political stability especially
important in Mexico (and Jalisco), whilst regulatory quality contributes to forest vulnerability in
Bolivia (and Santa Cruz). In contrast, the results from the stakeholder weighting (Figure 13b)
highlight that vulnerability concentrates in governmental effectiveness and regulatory quality
for all countries and states, with agricultural area growth to a lesser extent also an important
contributor.
Figure 13. Weighted vulnerability values for provincial Deforestation Vulnerability Index (DVI) indicators.
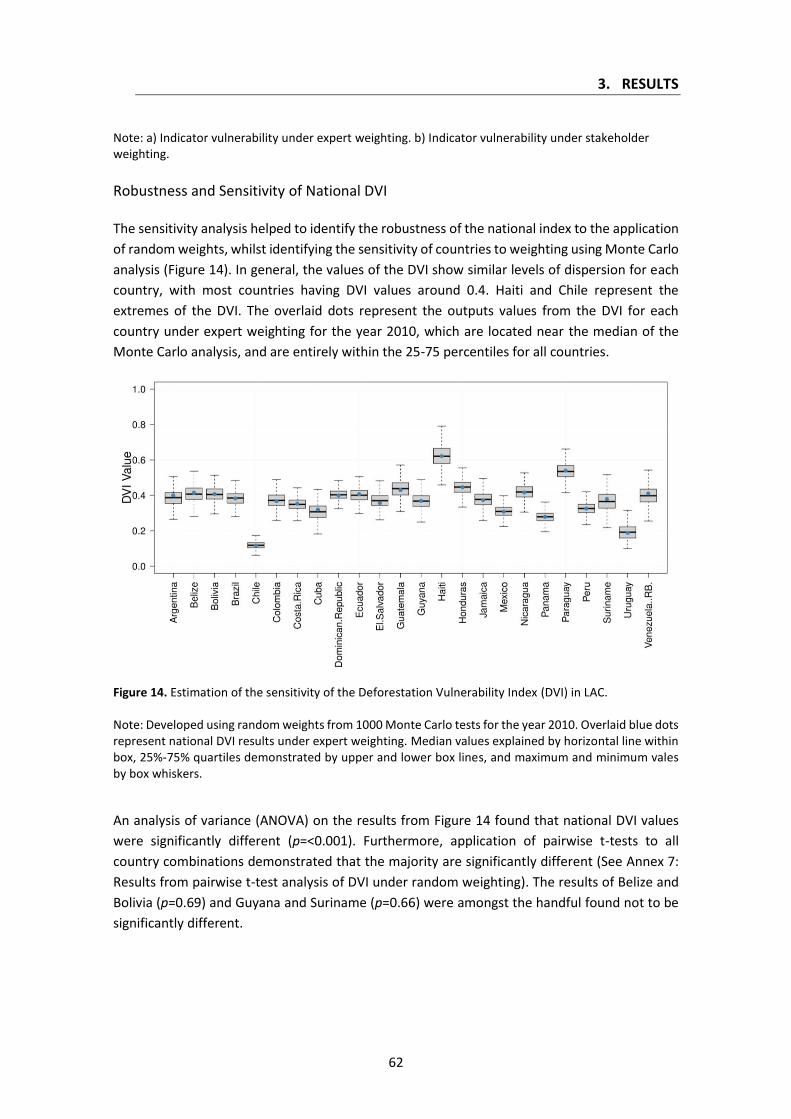
3. RESULTS
62
Note: a) Indicator vulnerability under expert weighting. b) Indicator vulnerability under stakeholder weighting.
Robustness and Sensitivity of National DVI
The sensitivity analysis helped to identify the robustness of the national index to the application
of random weights, whilst identifying the sensitivity of countries to weighting using Monte Carlo
analysis (Figure 14). In general, the values of the DVI show similar levels of dispersion for each
country, with most countries having DVI values around 0.4. Haiti and Chile represent the
extremes of the DVI. The overlaid dots represent the outputs values from the DVI for each
country under expert weighting for the year 2010, which are located near the median of the
Monte Carlo analysis, and are entirely within the 25-75 percentiles for all countries.
Figure 14. Estimation of the sensitivity of the Deforestation Vulnerability Index (DVI) in LAC. Note: Developed using random weights from 1000 Monte Carlo tests for the year 2010. Overlaid blue dots represent national DVI results under expert weighting. Median values explained by horizontal line within box, 25%-75% quartiles demonstrated by upper and lower box lines, and maximum and minimum vales by box whiskers.
An analysis of variance (ANOVA) on the results from Figure 14 found that national DVI values
were significantly different (p=<0.001). Furthermore, application of pairwise t-tests to all
country combinations demonstrated that the majority are significantly different (See Annex 7:
Results from pairwise t-test analysis of DVI under random weighting). The results of Belize and
Bolivia (p=0.69) and Guyana and Suriname (p=0.66) were amongst the handful found not to be
significantly different.
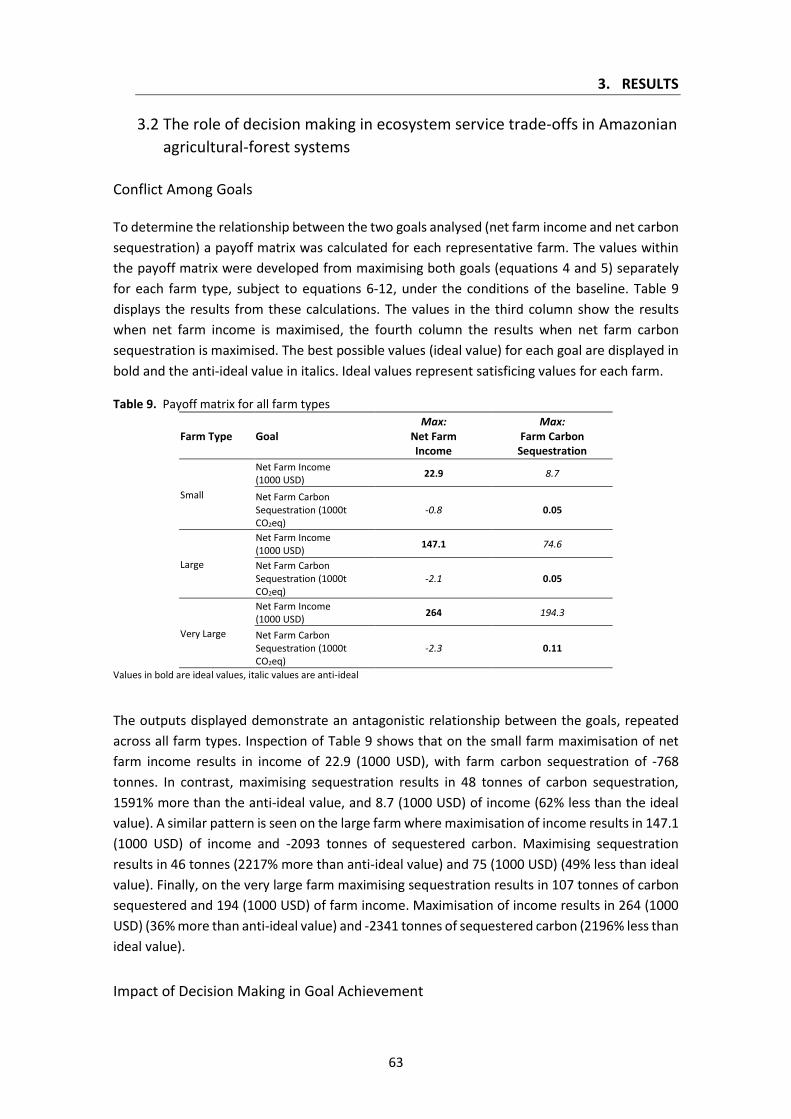
3. RESULTS
63
3.2 The role of decision making in ecosystem service trade-offs in Amazonian
agricultural-forest systems
Conflict Among Goals
To determine the relationship between the two goals analysed (net farm income and net carbon
sequestration) a payoff matrix was calculated for each representative farm. The values within
the payoff matrix were developed from maximising both goals (equations 4 and 5) separately
for each farm type, subject to equations 6-12, under the conditions of the baseline. Table 9
displays the results from these calculations. The values in the third column show the results
when net farm income is maximised, the fourth column the results when net farm carbon
sequestration is maximised. The best possible values (ideal value) for each goal are displayed in
bold and the anti-ideal value in italics. Ideal values represent satisficing values for each farm.
Table 9. Payoff matrix for all farm types
Farm Type Goal Max:
Net Farm Income
Max: Farm Carbon
Sequestration
Small
Net Farm Income (1000 USD)
22.9 8.7
Net Farm Carbon Sequestration (1000t CO2eq)
-0.8 0.05
Large
Net Farm Income (1000 USD)
147.1 74.6
Net Farm Carbon Sequestration (1000t CO2eq)
-2.1 0.05
Very Large
Net Farm Income (1000 USD)
264 194.3
Net Farm Carbon Sequestration (1000t CO2eq)
-2.3 0.11
Values in bold are ideal values, italic values are anti-ideal
The outputs displayed demonstrate an antagonistic relationship between the goals, repeated
across all farm types. Inspection of Table 9 shows that on the small farm maximisation of net
farm income results in income of 22.9 (1000 USD), with farm carbon sequestration of -768
tonnes. In contrast, maximising sequestration results in 48 tonnes of carbon sequestration,
1591% more than the anti-ideal value, and 8.7 (1000 USD) of income (62% less than the ideal
value). A similar pattern is seen on the large farm where maximisation of income results in 147.1
(1000 USD) of income and -2093 tonnes of sequestered carbon. Maximising sequestration
results in 46 tonnes (2217% more than anti-ideal value) and 75 (1000 USD) (49% less than ideal
value). Finally, on the very large farm maximising sequestration results in 107 tonnes of carbon
sequestered and 194 (1000 USD) of farm income. Maximisation of income results in 264 (1000
USD) (36% more than anti-ideal value) and -2341 tonnes of sequestered carbon (2196% less than
ideal value).
Impact of Decision Making in Goal Achievement
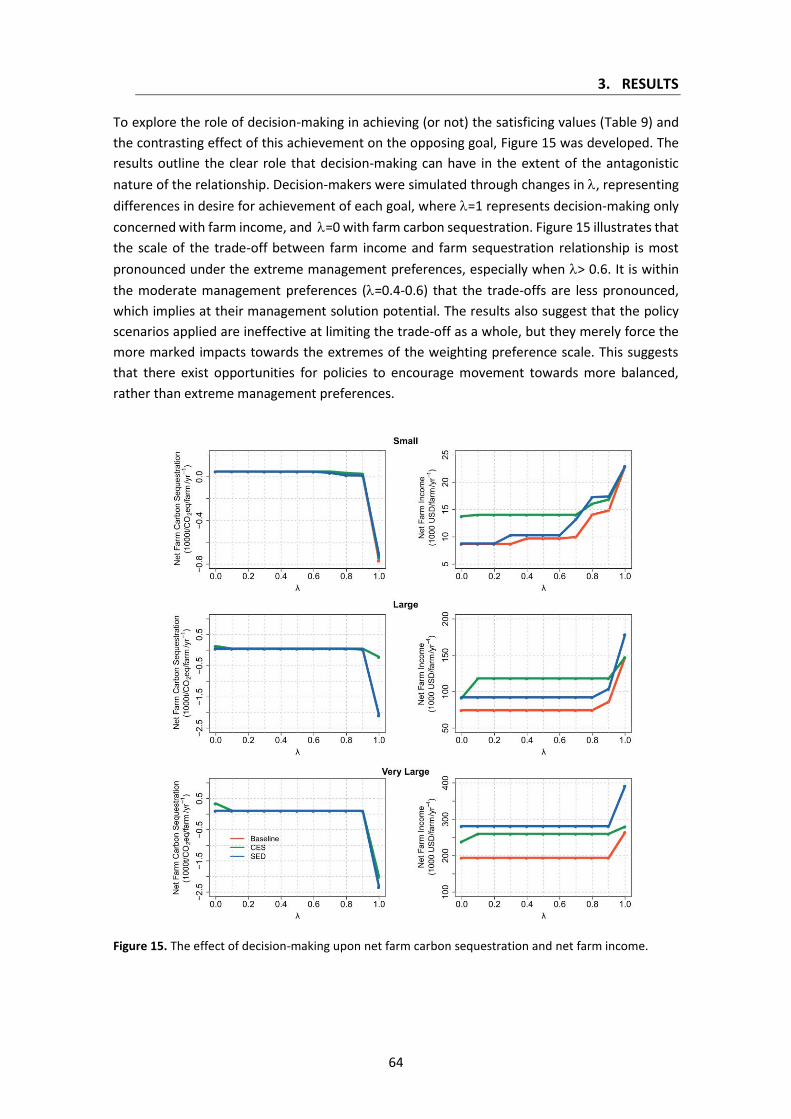
3. RESULTS
64
To explore the role of decision-making in achieving (or not) the satisficing values (Table 9) and
the contrasting effect of this achievement on the opposing goal, Figure 15 was developed. The
results outline the clear role that decision-making can have in the extent of the antagonistic
nature of the relationship. Decision-makers were simulated through changes in , representing
differences in desire for achievement of each goal, where =1 represents decision-making only
concerned with farm income, and =0 with farm carbon sequestration. Figure 15 illustrates that
the scale of the trade-off between farm income and farm sequestration relationship is most
pronounced under the extreme management preferences, especially when > 0.6. It is within
the moderate management preferences (=0.4-0.6) that the trade-offs are less pronounced,
which implies at their management solution potential. The results also suggest that the policy
scenarios applied are ineffective at limiting the trade-off as a whole, but they merely force the
more marked impacts towards the extremes of the weighting preference scale. This suggests
that there exist opportunities for policies to encourage movement towards more balanced,
rather than extreme management preferences.
Figure 15. The effect of decision-making upon net farm carbon sequestration and net farm income.
3. RESULTS
65
Note. Results developed across three representative farm types of the Province of Guarayos under the
conditions of the baseline and two policy scenarios. Full management preference for farm income (=1)
and forest conservation (=0).
The effects of decision-making across the indicators used to define the goals (crop production,
deforested timber, forestry product, mature forest sequestration, reforested forest
sequestration, deforested land emissions, and cropped land emissions) are available in Figure
16. The results displayed present similar patterns to that of Figure 15, in terms of both the role
of decision-making and the impacts of the policy scenarios.
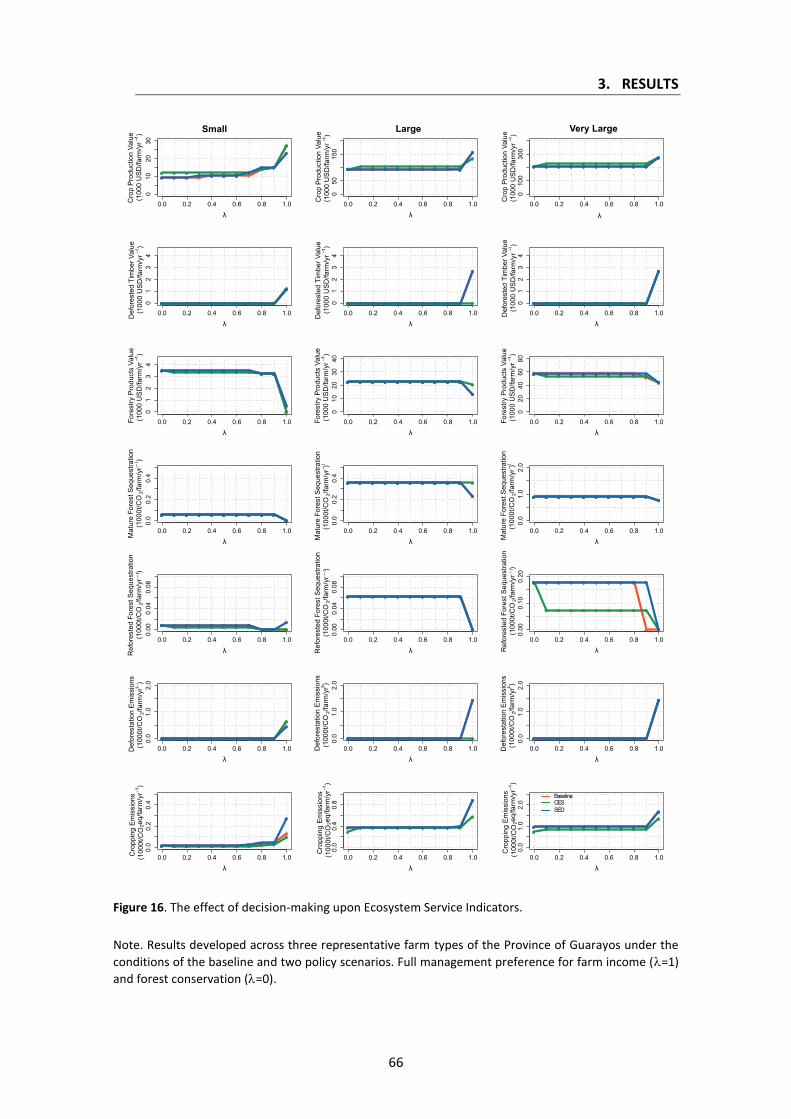
3. RESULTS
66
Figure 16. The effect of decision-making upon Ecosystem Service Indicators.
Note. Results developed across three representative farm types of the Province of Guarayos under the
conditions of the baseline and two policy scenarios. Full management preference for farm income (=1)
and forest conservation (=0).
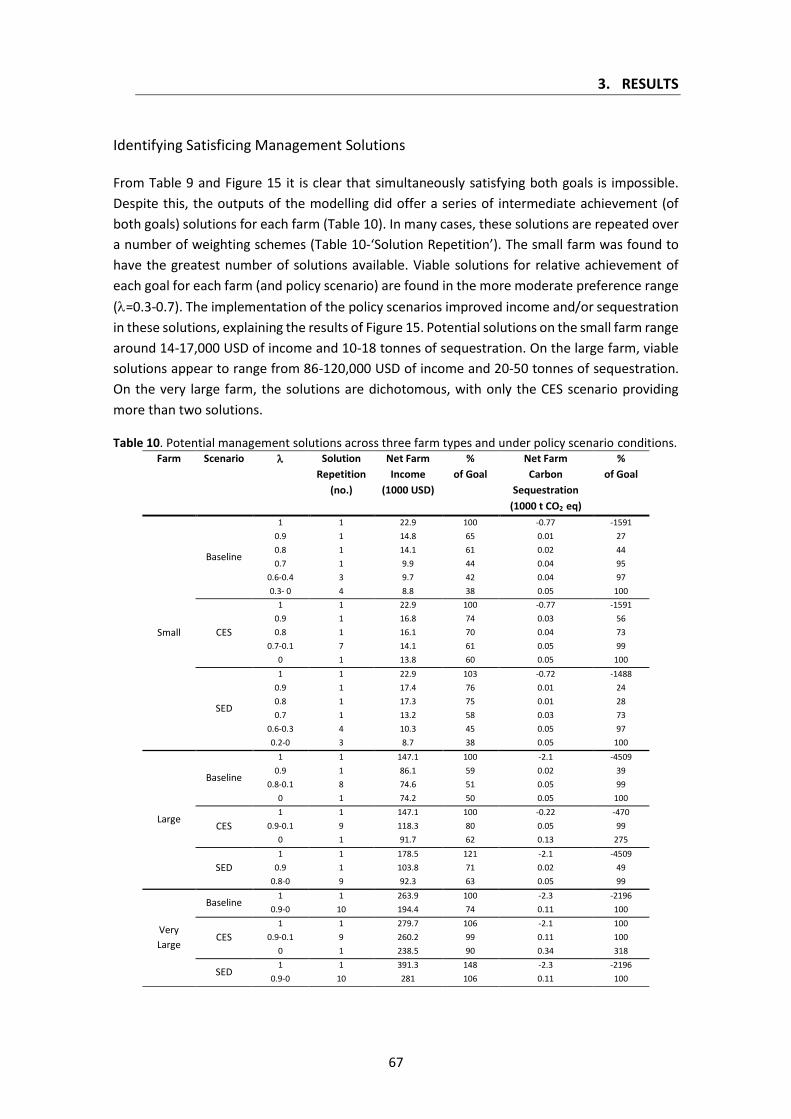
3. RESULTS
67
Identifying Satisficing Management Solutions
From Table 9 and Figure 15 it is clear that simultaneously satisfying both goals is impossible.
Despite this, the outputs of the modelling did offer a series of intermediate achievement (of
both goals) solutions for each farm (Table 10). In many cases, these solutions are repeated over
a number of weighting schemes (Table 10-‘Solution Repetition’). The small farm was found to
have the greatest number of solutions available. Viable solutions for relative achievement of
each goal for each farm (and policy scenario) are found in the more moderate preference range
(=0.3-0.7). The implementation of the policy scenarios improved income and/or sequestration
in these solutions, explaining the results of Figure 15. Potential solutions on the small farm range
around 14-17,000 USD of income and 10-18 tonnes of sequestration. On the large farm, viable
solutions appear to range from 86-120,000 USD of income and 20-50 tonnes of sequestration.
On the very large farm, the solutions are dichotomous, with only the CES scenario providing
more than two solutions.
Table 10. Potential management solutions across three farm types and under policy scenario conditions. Farm Scenario Solution
Repetition
(no.)
Net Farm
Income
(1000 USD)
%
of Goal
Net Farm
Carbon
Sequestration
(1000 t CO2 eq)
%
of Goal
Small
Baseline
1 1 22.9 100 -0.77 -1591
0.9 1 14.8 65 0.01 27
0.8 1 14.1 61 0.02 44
0.7 1 9.9 44 0.04 95
0.6-0.4 3 9.7 42 0.04 97
0.3- 0 4 8.8 38 0.05 100
CES
1 1 22.9 100 -0.77 -1591
0.9 1 16.8 74 0.03 56
0.8 1 16.1 70 0.04 73
0.7-0.1 7 14.1 61 0.05 99
0 1 13.8 60 0.05 100
SED
1 1 22.9 103 -0.72 -1488
0.9 1 17.4 76 0.01 24
0.8 1 17.3 75 0.01 28
0.7 1 13.2 58 0.03 73
0.6-0.3 4 10.3 45 0.05 97
0.2-0 3 8.7 38 0.05 100
Large
Baseline
1 1 147.1 100 -2.1 -4509
0.9 1 86.1 59 0.02 39
0.8-0.1 8 74.6 51 0.05 99
0 1 74.2 50 0.05 100
CES
1 1 147.1 100 -0.22 -470
0.9-0.1 9 118.3 80 0.05 99
0 1 91.7 62 0.13 275
SED
1 1 178.5 121 -2.1 -4509
0.9 1 103.8 71 0.02 49
0.8-0 9 92.3 63 0.05 99
Very
Large
Baseline 1 1 263.9 100 -2.3 -2196
0.9-0 10 194.4 74 0.11 100
CES
1 1 279.7 106 -2.1 100
0.9-0.1 9 260.2 99 0.11 100
0 1 238.5 90 0.34 318
SED 1 1 391.3 148 -2.3 -2196
0.9-0 10 281 106 0.11 100
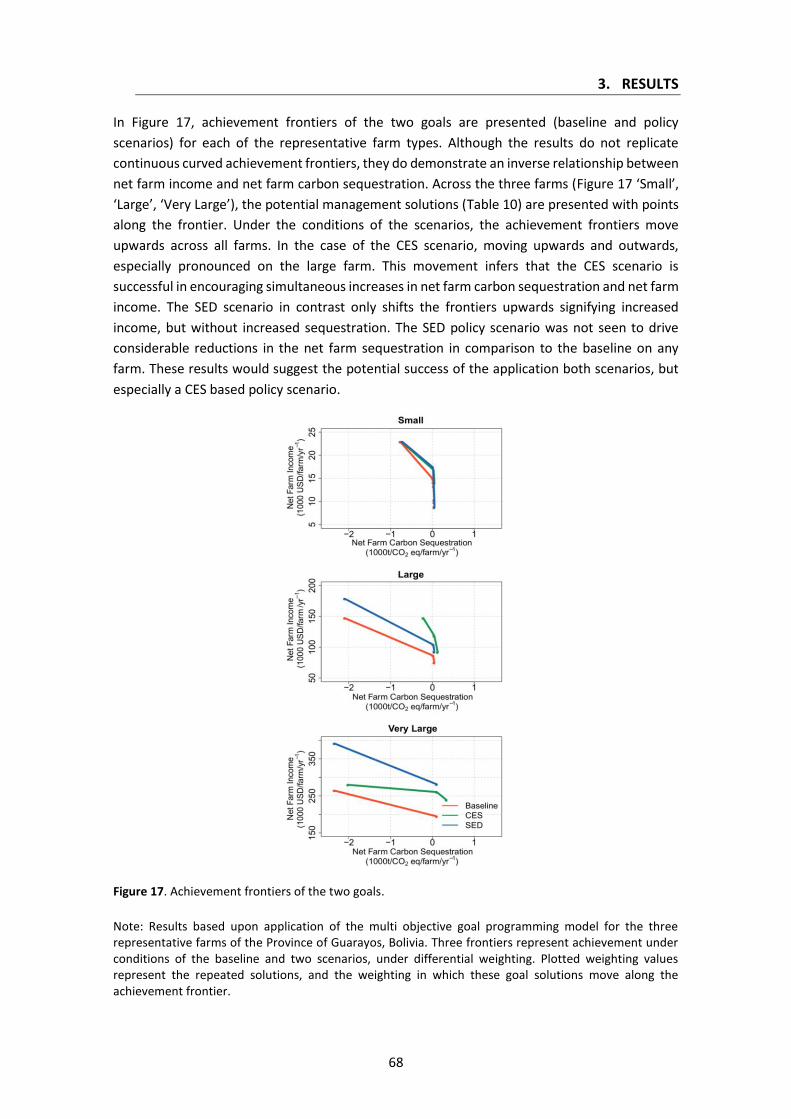
3. RESULTS
68
In Figure 17, achievement frontiers of the two goals are presented (baseline and policy
scenarios) for each of the representative farm types. Although the results do not replicate
continuous curved achievement frontiers, they do demonstrate an inverse relationship between
net farm income and net farm carbon sequestration. Across the three farms (Figure 17 ‘Small’,
‘Large’, ‘Very Large’), the potential management solutions (Table 10) are presented with points
along the frontier. Under the conditions of the scenarios, the achievement frontiers move
upwards across all farms. In the case of the CES scenario, moving upwards and outwards,
especially pronounced on the large farm. This movement infers that the CES scenario is
successful in encouraging simultaneous increases in net farm carbon sequestration and net farm
income. The SED scenario in contrast only shifts the frontiers upwards signifying increased
income, but without increased sequestration. The SED policy scenario was not seen to drive
considerable reductions in the net farm sequestration in comparison to the baseline on any
farm. These results would suggest the potential success of the application both scenarios, but
especially a CES based policy scenario.
Figure 17. Achievement frontiers of the two goals.
Note: Results based upon application of the multi objective goal programming model for the three representative farms of the Province of Guarayos, Bolivia. Three frontiers represent achievement under conditions of the baseline and two scenarios, under differential weighting. Plotted weighting values represent the repeated solutions, and the weighting in which these goal solutions move along the achievement frontier.
3. RESULTS
69
Across all three farms, the majority of potential management solutions lie in the space where
net farm carbon sequestration is positive, with the application of the two policy scenarios
providing higher levels of net farm income in each case. It is only under the most extreme
weighting (=1) in favour of net farm income that net farm sequestration is negative (emissions).
This graphically demonstrates that despite potential increases in income derived from
deforestation and expansion in potential cropping area, the resultant impacts upon net farm
sequestration are so extreme (i.e. sequestration turns to emissions), that no deforestation
occurs. The series of options that are found around the neutral scale of weighting (=0.3-0.7),
although not achieving either goal, may represent potentially sustainable management options.
From this analysis it is evident the considerable effect that management preferences and
decision making can have in (dis)encouraging net farm income and sequestration, and the large
impact that such preferences can have in ES trade-offs.
3. RESULTS
70
3.3 Global and EU Patterns of Consumption and Production of Protein Rich
Products and Development of Robust Strategies for Transitioning EU
Consumption and Production Patterns
The above results have highlighted the scale of the trade-offs between agricultural expansion
and forest conservation in agriculture-forest systems. To better understand how these trade-
offs might develop under continued pressure to producing agricultural products to satiate
increasing global demand for animal products, it is vital to understand the historical and current
trends of global diets, and also provide potential pathways for encouraging production and
consumption changes.
Past protein-rich product trends
Global and Continental Consumption and Production
Analysis of global historical trends of aggregated per capita legume consumption as food (Figure
18a) highlight a long-term decline from 10. 9kg/capita/year in 1962, to 8. 9kg/capita/year in
2013. Despite this decline, there have been recent nascent global upturns driven by pulse
consumption. Global production of legumes, (Figure 18b) increased more than 500% (67- 351
million tonnes (MT)) from 1961-2013. During this period, production proportions changed
greatly, initially split proportionally between beans, peas, pulses, and soybeans. Soybean has
dominated production from the mid-1970s onwards. In 2013, soybean production (278 MT) was
almost ten times that of pulses (38 MT), and more than three times greater than beans, peas,
and pulses combined (72 MT).
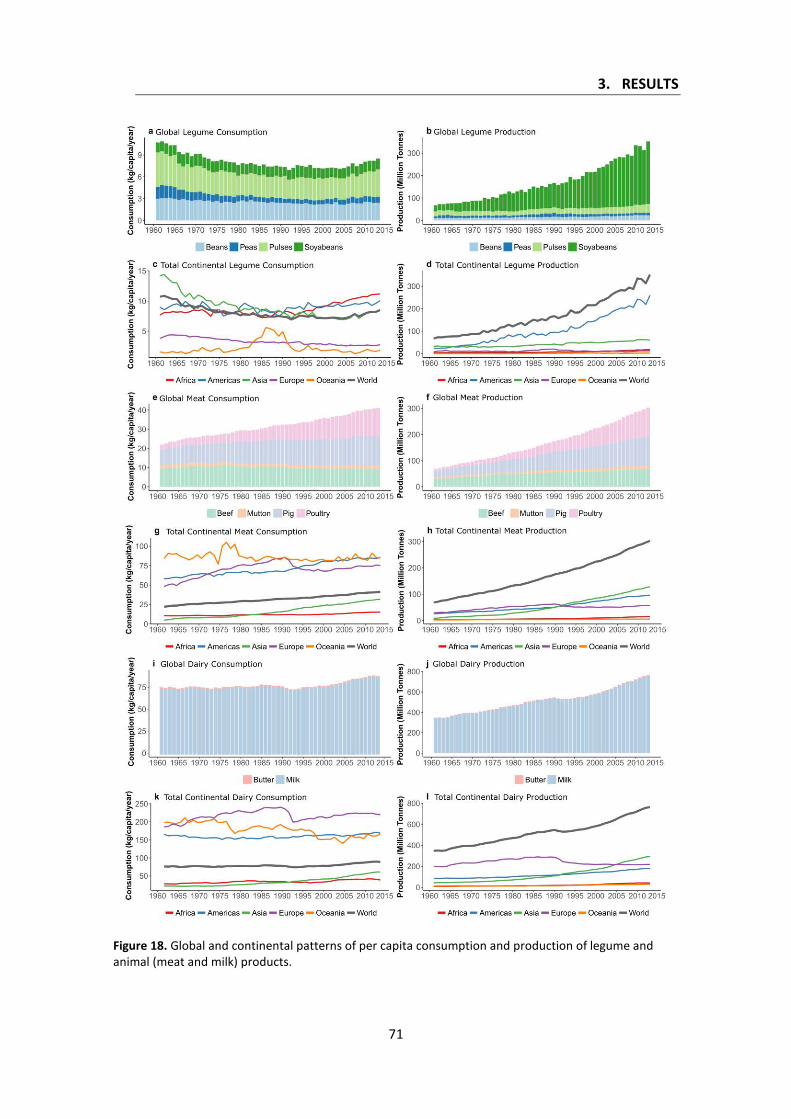
3. RESULTS
71
Figure 18. Global and continental patterns of per capita consumption and production of legume and animal (meat and milk) products.
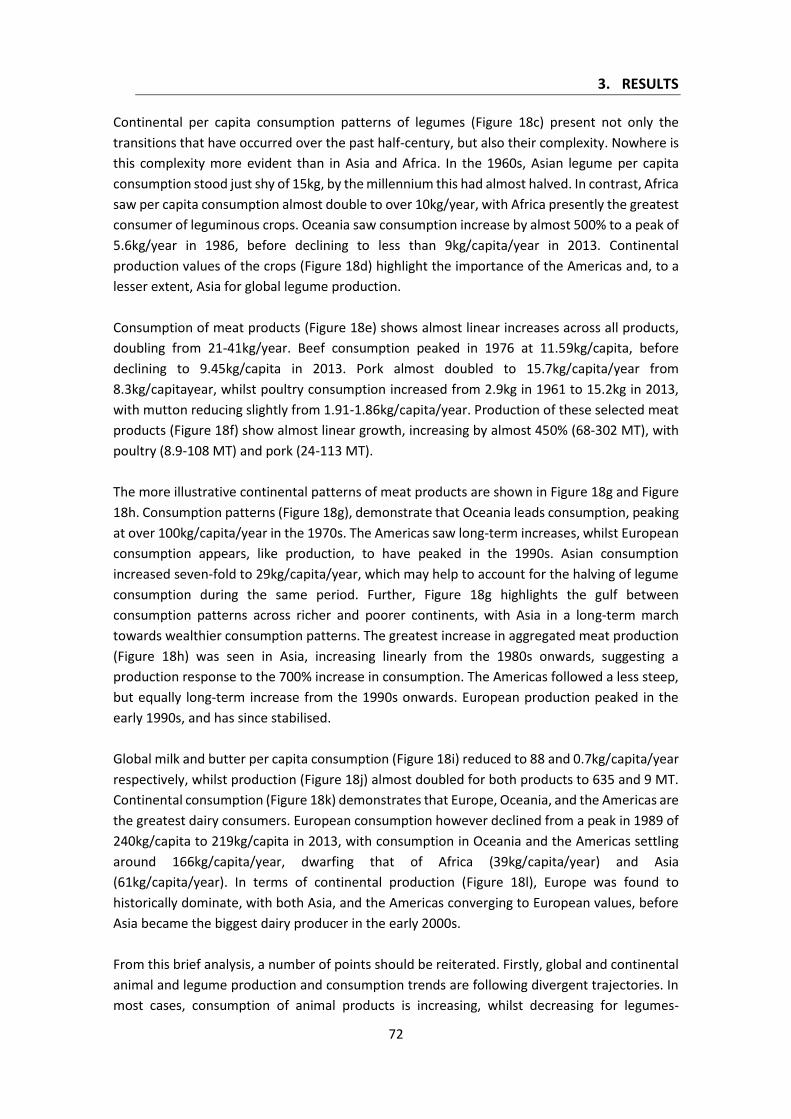
3. RESULTS
72
Continental per capita consumption patterns of legumes (Figure 18c) present not only the
transitions that have occurred over the past half-century, but also their complexity. Nowhere is
this complexity more evident than in Asia and Africa. In the 1960s, Asian legume per capita
consumption stood just shy of 15kg, by the millennium this had almost halved. In contrast, Africa
saw per capita consumption almost double to over 10kg/year, with Africa presently the greatest
consumer of leguminous crops. Oceania saw consumption increase by almost 500% to a peak of
5.6kg/year in 1986, before declining to less than 9kg/capita/year in 2013. Continental
production values of the crops (Figure 18d) highlight the importance of the Americas and, to a
lesser extent, Asia for global legume production.
Consumption of meat products (Figure 18e) shows almost linear increases across all products,
doubling from 21-41kg/year. Beef consumption peaked in 1976 at 11.59kg/capita, before
declining to 9.45kg/capita in 2013. Pork almost doubled to 15.7kg/capita/year from
8.3kg/capitayear, whilst poultry consumption increased from 2.9kg in 1961 to 15.2kg in 2013,
with mutton reducing slightly from 1.91-1.86kg/capita/year. Production of these selected meat
products (Figure 18f) show almost linear growth, increasing by almost 450% (68-302 MT), with
poultry (8.9-108 MT) and pork (24-113 MT).
The more illustrative continental patterns of meat products are shown in Figure 18g and Figure
18h. Consumption patterns (Figure 18g), demonstrate that Oceania leads consumption, peaking
at over 100kg/capita/year in the 1970s. The Americas saw long-term increases, whilst European
consumption appears, like production, to have peaked in the 1990s. Asian consumption
increased seven-fold to 29kg/capita/year, which may help to account for the halving of legume
consumption during the same period. Further, Figure 18g highlights the gulf between
consumption patterns across richer and poorer continents, with Asia in a long-term march
towards wealthier consumption patterns. The greatest increase in aggregated meat production
(Figure 18h) was seen in Asia, increasing linearly from the 1980s onwards, suggesting a
production response to the 700% increase in consumption. The Americas followed a less steep,
but equally long-term increase from the 1990s onwards. European production peaked in the
early 1990s, and has since stabilised.
Global milk and butter per capita consumption (Figure 18i) reduced to 88 and 0.7kg/capita/year
respectively, whilst production (Figure 18j) almost doubled for both products to 635 and 9 MT.
Continental consumption (Figure 18k) demonstrates that Europe, Oceania, and the Americas are
the greatest dairy consumers. European consumption however declined from a peak in 1989 of
240kg/capita to 219kg/capita in 2013, with consumption in Oceania and the Americas settling
around 166kg/capita/year, dwarfing that of Africa (39kg/capita/year) and Asia
(61kg/capita/year). In terms of continental production (Figure 18l), Europe was found to
historically dominate, with both Asia, and the Americas converging to European values, before
Asia became the biggest dairy producer in the early 2000s.
From this brief analysis, a number of points should be reiterated. Firstly, global and continental
animal and legume production and consumption trends are following divergent trajectories. In
most cases, consumption of animal products is increasing, whilst decreasing for legumes-
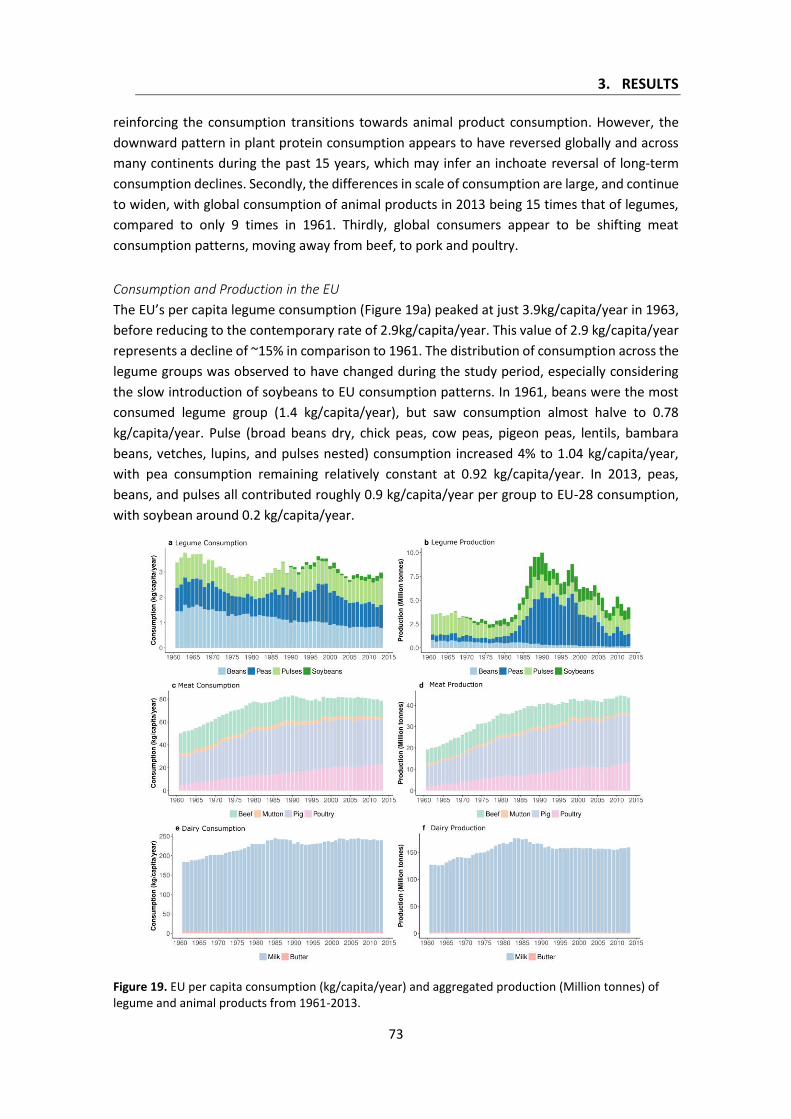
3. RESULTS
73
reinforcing the consumption transitions towards animal product consumption. However, the
downward pattern in plant protein consumption appears to have reversed globally and across
many continents during the past 15 years, which may infer an inchoate reversal of long-term
consumption declines. Secondly, the differences in scale of consumption are large, and continue
to widen, with global consumption of animal products in 2013 being 15 times that of legumes,
compared to only 9 times in 1961. Thirdly, global consumers appear to be shifting meat
consumption patterns, moving away from beef, to pork and poultry.
Consumption and Production in the EU
The EU’s per capita legume consumption (Figure 19a) peaked at just 3.9kg/capita/year in 1963,
before reducing to the contemporary rate of 2.9kg/capita/year. This value of 2.9 kg/capita/year
represents a decline of ~15% in comparison to 1961. The distribution of consumption across the
legume groups was observed to have changed during the study period, especially considering
the slow introduction of soybeans to EU consumption patterns. In 1961, beans were the most
consumed legume group (1.4 kg/capita/year), but saw consumption almost halve to 0.78
kg/capita/year. Pulse (broad beans dry, chick peas, cow peas, pigeon peas, lentils, bambara
beans, vetches, lupins, and pulses nested) consumption increased 4% to 1.04 kg/capita/year,
with pea consumption remaining relatively constant at 0.92 kg/capita/year. In 2013, peas,
beans, and pulses all contributed roughly 0.9 kg/capita/year per group to EU-28 consumption,
with soybean around 0.2 kg/capita/year.
Figure 19. EU per capita consumption (kg/capita/year) and aggregated production (Million tonnes) of legume and animal products from 1961-2013.
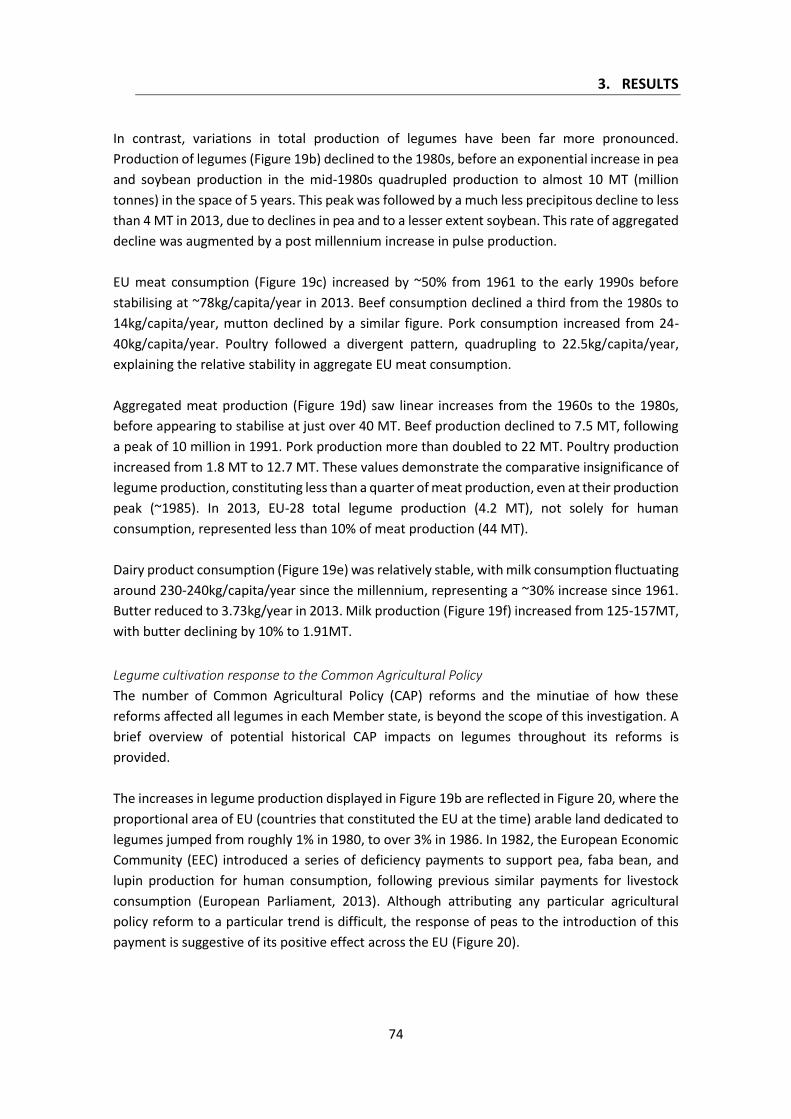
3. RESULTS
74
In contrast, variations in total production of legumes have been far more pronounced.
Production of legumes (Figure 19b) declined to the 1980s, before an exponential increase in pea
and soybean production in the mid-1980s quadrupled production to almost 10 MT (million
tonnes) in the space of 5 years. This peak was followed by a much less precipitous decline to less
than 4 MT in 2013, due to declines in pea and to a lesser extent soybean. This rate of aggregated
decline was augmented by a post millennium increase in pulse production.
EU meat consumption (Figure 19c) increased by ~50% from 1961 to the early 1990s before
stabilising at ~78kg/capita/year in 2013. Beef consumption declined a third from the 1980s to
14kg/capita/year, mutton declined by a similar figure. Pork consumption increased from 24-
40kg/capita/year. Poultry followed a divergent pattern, quadrupling to 22.5kg/capita/year,
explaining the relative stability in aggregate EU meat consumption.
Aggregated meat production (Figure 19d) saw linear increases from the 1960s to the 1980s,
before appearing to stabilise at just over 40 MT. Beef production declined to 7.5 MT, following
a peak of 10 million in 1991. Pork production more than doubled to 22 MT. Poultry production
increased from 1.8 MT to 12.7 MT. These values demonstrate the comparative insignificance of
legume production, constituting less than a quarter of meat production, even at their production
peak (~1985). In 2013, EU-28 total legume production (4.2 MT), not solely for human
consumption, represented less than 10% of meat production (44 MT).
Dairy product consumption (Figure 19e) was relatively stable, with milk consumption fluctuating
around 230-240kg/capita/year since the millennium, representing a ~30% increase since 1961.
Butter reduced to 3.73kg/year in 2013. Milk production (Figure 19f) increased from 125-157MT,
with butter declining by 10% to 1.91MT.
Legume cultivation response to the Common Agricultural Policy
The number of Common Agricultural Policy (CAP) reforms and the minutiae of how these
reforms affected all legumes in each Member state, is beyond the scope of this investigation. A
brief overview of potential historical CAP impacts on legumes throughout its reforms is
provided.
The increases in legume production displayed in Figure 19b are reflected in Figure 20, where the
proportional area of EU (countries that constituted the EU at the time) arable land dedicated to
legumes jumped from roughly 1% in 1980, to over 3% in 1986. In 1982, the European Economic
Community (EEC) introduced a series of deficiency payments to support pea, faba bean, and
lupin production for human consumption, following previous similar payments for livestock
consumption (European Parliament, 2013). Although attributing any particular agricultural
policy reform to a particular trend is difficult, the response of peas to the introduction of this
payment is suggestive of its positive effect across the EU (Figure 20).
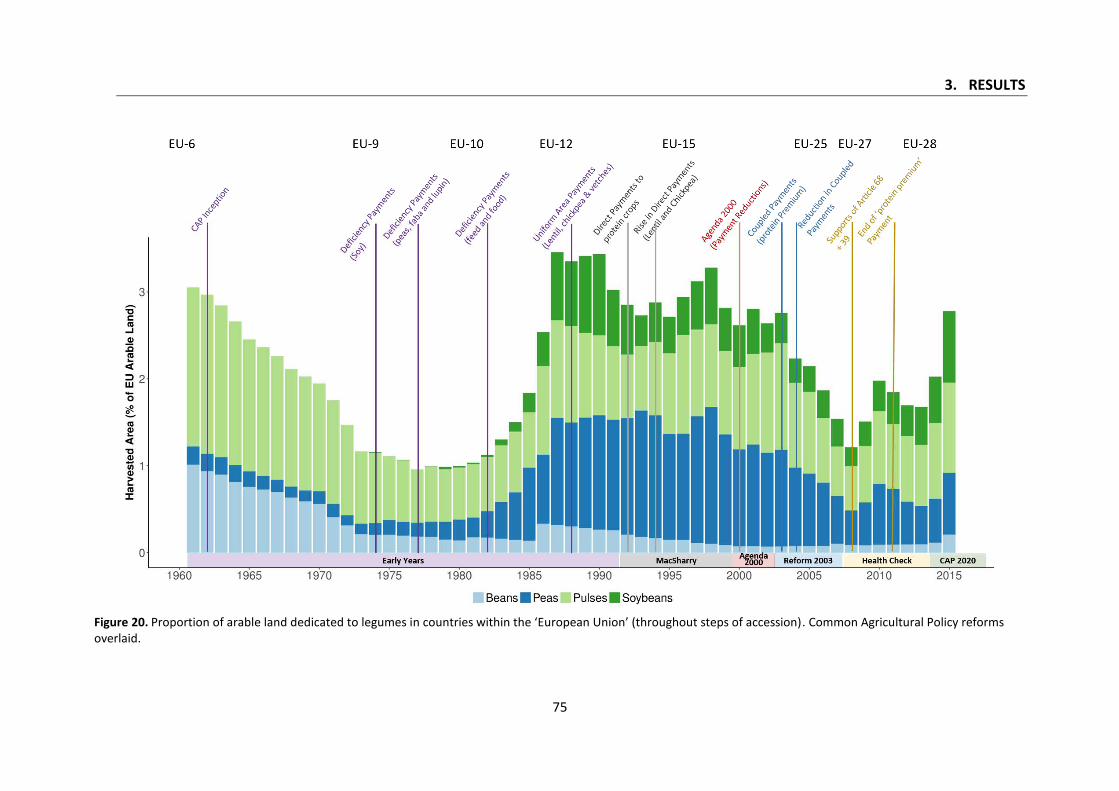
3. RESULTS
75
Figure 20. Proportion of arable land dedicated to legumes in countries within the ‘European Union’ (throughout steps of accession). Common Agricultural Policy reforms overlaid.

3. RESULTS
76
As part of the 1992 MacSharry Reform, price supports were replaced with area-related direct
payments for protein crops, cereals and oilseed crops, which were increased in subsequent
years (European Parliament, 2013). Payments for pea were higher than for other crops, which
may explain the continued production of peas as a European aggregate. During this period, soya
received far lower payments due to restrictions on supports for oilseeds following agreements
made between the European Union and the United States, as part of the Blair House Agreement
(Zander et al., 2017).
Decoupling and the introduction of the protein premium as part of the 2003 CAP reform
(European Parliament, 2013) appears to have had a positive effect upon pulses. The Health
Check provided a number of options for individual MS for protein crops. The introduction of
these measures appears to coincide with increases in pulse and pea and production from 2008
onwards. Increased soya production during this period may also be attributable to the removal
of restrictions from the Blair House Agreement, although the absence of import levies on oilseed
and proteins remained. However, the Health Check also agreed the removal of the
aforementioned protein premium coupled payment (introduced in 2003) by the year 2011 (2012
in several states) (European Parliament, 2013). This removal may be connected with the subtle
reductions in these crops (especially peas) after 2011.
EU-28 Patterns of Change
Recent spatial patterns of consumption and production of protein-rich products across EU MS
from 1993-2013 are presented in Figure 21. This figure places EU-28 countries, and an EU-28
average, within four quadrants according to relative changes (from 1993-2013) in per capita
consumption (Figure 21a) and production (Figure 21b) of both product groups.
The lower right quadrants of Figure 21 represent increases in consumption/ production of
legumes and simultaneous reductions in animal products. These quadrants represent the
idealised location for EU-28 MS considering the environmental and health benefits of
consumption and production shifts away from animal to legume products.

3. RESULTS
77
Figure 21. Percentage changes in European Union legume and animal products consumption and production during the years 1993-1997 and 2009-2013.
Note: a) Change in consumption of legume and animal products. b) Change in production of legumes and animal products. AT: Austria, BG: Bulgaria, BLX: Belgium-Luxembourg, CY: Cyprus, CZ: Czechia, DK: Denmark, DE:
Germany, EE: Estonia, EL: Greece, ES: Spain, FI: Finland, FR: France, HR: Croatia, HU: Hungary, IE: Ireland, IT: Italy, LV: Latvia, LT: Lithuania, MT: Malta, NL: Netherlands, PL: Poland, PT: Portugal, RO: Romania, SI: Slovenia, SK: Slovakia, SE: Sweden, UK: United Kingdom, and EU-28: European Union Average.
Consumption patterns (Figure 21a) show that MS cluster in the left hand quadrants (reduced
legume per capita consumption). Only three countries are located in the desired, or idealised
quadrant (lower right): Austria, Czechia, and Hungary. Denmark, Estonia, Romania, and Sweden
were found to be increasing both legume and animal product consumption.
Production patterns (Figure 21b) largely mirror those of consumption, with MS largely not
located in the desirable quadrant. Only a handful of smaller agricultural nations (Estonia, Greece,
Lithuania, and Latvia) found in the most desirable quadrant. Most MS, as with consumption,
congregate within the two left quadrants, representing reduced production of legumes, with
many (including the EU-28 average) within the lower left (reduced animal production). This
implies that production of both legumes and animal products have declined during the period
1993-2013, contrary to the period 1961-2013 (Figure 19).
These results evidence that across most of EU MS, consumption and production transitions are
yet to be seen. This reinforces the need for identifying the present barriers and opportunities to
such shifts, and for potential transitional pathways to shift these historical trends.

3. RESULTS
78
Present and Future EU Plant-Protein Situation
Current barriers and opportunities for protein-rich products
The basic results from the first workshop are presented in Table 11. From the two groups, 34
barriers and 23 opportunities for current EU plant-protein production and consumption were
identified, with notable differences across the two groups.
Table 11. Elements identified in the two groups from Workshop 1
Group No. Barriers Opportunities Total Elements 1 19 11 40 2 15 12 41
Barriers and Opportunities
In the first group (Figure 22a), the most voted barriers concentrated around agricultural factors
(i.e. small farm size and farmers not used to protein-rich crops), in the second group (Figure 22c)
barriers concentrated upon technological and product factors (i.e. production technology and
organoleptic properties).
Figure 22. Barriers and opportunities within the EU plant-protein market. Note: Brown line represents number of time factor was mentioned and green line the number of votes it received.
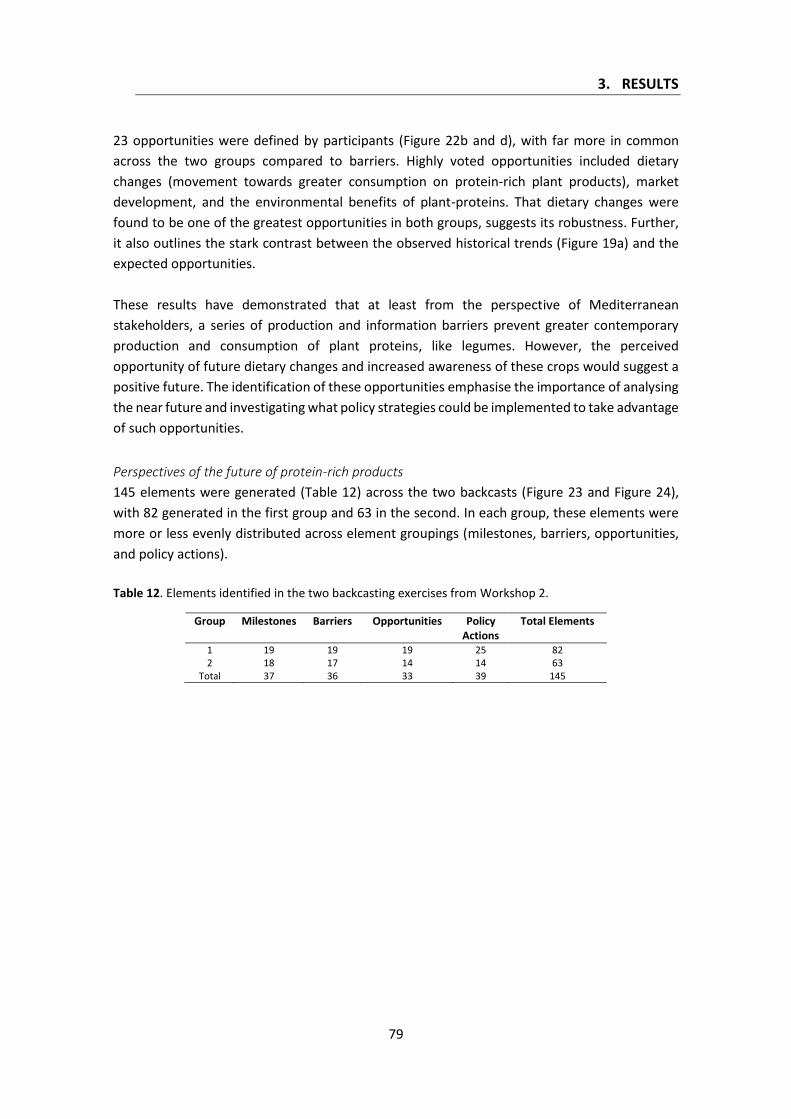
3. RESULTS
79
23 opportunities were defined by participants (Figure 22b and d), with far more in common
across the two groups compared to barriers. Highly voted opportunities included dietary
changes (movement towards greater consumption on protein-rich plant products), market
development, and the environmental benefits of plant-proteins. That dietary changes were
found to be one of the greatest opportunities in both groups, suggests its robustness. Further,
it also outlines the stark contrast between the observed historical trends (Figure 19a) and the
expected opportunities.
These results have demonstrated that at least from the perspective of Mediterranean
stakeholders, a series of production and information barriers prevent greater contemporary
production and consumption of plant proteins, like legumes. However, the perceived
opportunity of future dietary changes and increased awareness of these crops would suggest a
positive future. The identification of these opportunities emphasise the importance of analysing
the near future and investigating what policy strategies could be implemented to take advantage
of such opportunities.
Perspectives of the future of protein-rich products
145 elements were generated (Table 12) across the two backcasts (Figure 23 and Figure 24),
with 82 generated in the first group and 63 in the second. In each group, these elements were
more or less evenly distributed across element groupings (milestones, barriers, opportunities,
and policy actions).
Table 12. Elements identified in the two backcasting exercises from Workshop 2.
Group Milestones Barriers Opportunities Policy Actions
Total Elements
1 19 19 19 25 82 2 18 17 14 14 63
Total 37 36 33 39 145
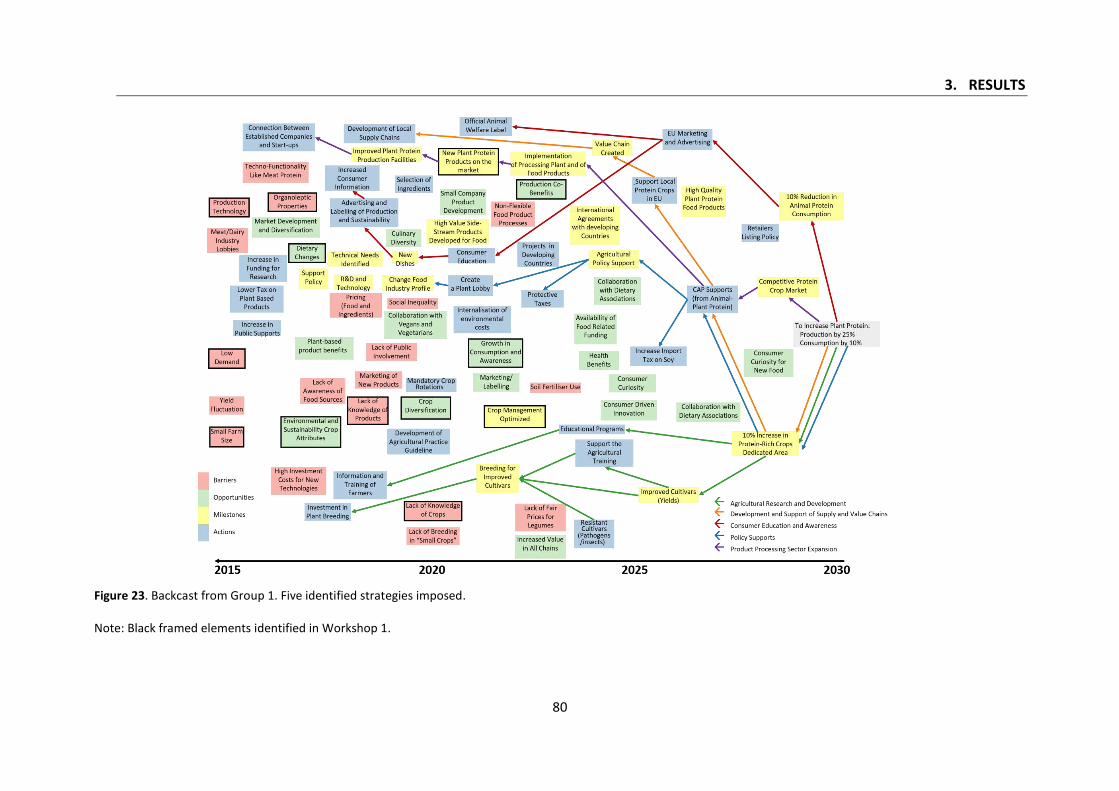
3. RESULTS
80
Figure 23. Backcast from Group 1. Five identified strategies imposed. Note: Black framed elements identified in Workshop 1.
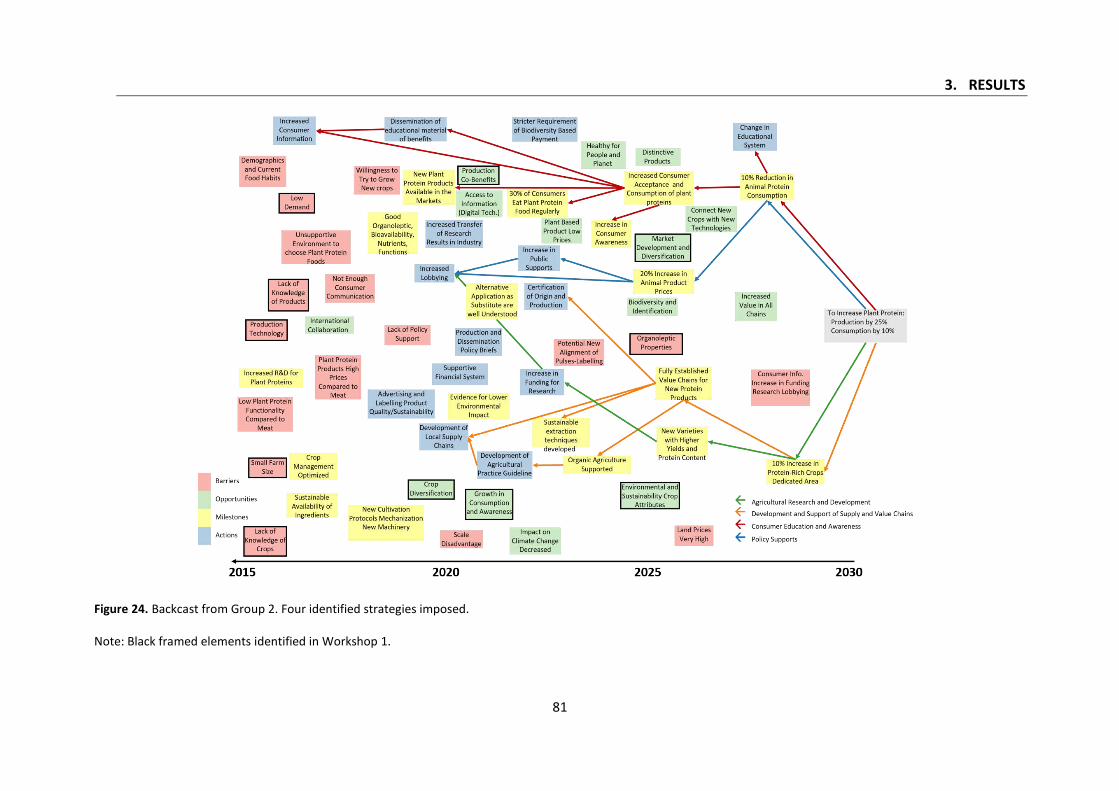
3. RESULTS
81
Figure 24. Backcast from Group 2. Four identified strategies imposed. Note: Black framed elements identified in Workshop 1.
3. RESULTS
82
Milestones
In total, 37 were defined (19 in Group 1 and 18 in Group 2). Common milestone themes included:
Increased funding for research and development of plant-proteins (2018)
Availability of plant-protein products on the market (2019-21)
Establishment of value and supply (production-processing-retail) chains for
protein-rich products (2024-25)
Development of new varieties of protein-rich crops (2026)
The timing of these milestones suggests the stakeholders´ perceptions of the temporal feasibility
for their achievement.
Barriers and Opportunties
Across the two groups, 36 barriers and 33 opportunities were identified. In both groups, barriers
and opportunities identified from the first workshop were also included and unchanged in the
second (elements edged in black in Figure 23 and Figure 24). In general, barriers were
concentrated around the present or very near future (2018-2020) (Figure 23 and Figure 24). This
may be explained by the fact that current barriers are often more evident than future ones,
which may arise from unknown knock-on effects. Group 1 identified 19 barriers and Group 2 17.
In the two groups three similar barrier themes were identified:
High prices of protein-rich processed products may limit greater consumption
(2018-2022)
Low demand and a lack of knowledge of products also hinder consumption
(2015-2020)
Protein-rich product functional properties in terms of difficulty of protein
extraction, lack of homogeneity in isolates, and the organoleptic properties and
anti-nutritional factors of represent processing barriers (2016-2025)
From these results it is clear that stakeholders not only in Mediterranean countries, but across
the EU perceive similar barriers for plant-protein products. With each of the most important
barriers voted from the 1st Workshop (and presented to participants in the 2nd workshop) used
in both backcasting exercises. These results would suggest the continuance of contemporary
barriers into the near future and would need to be addressed.
In contrast to barriers, 33 opportunities (19 in Group 1 and 14 in Group 2) were spread out more
evenly across the timelines. Although opportunities were distinct between the groups, repeated
themes were evident:
Health and environmental benefits (2020-2025)
Dietary changes and increased consumer awareness (2021-2022)
Marketability of products and improved access to information (2022)
As with barriers, participants in the second workshop perceived similar opportunities to those
of identified within the first workshop. Once again, all opportunities from the first workshop
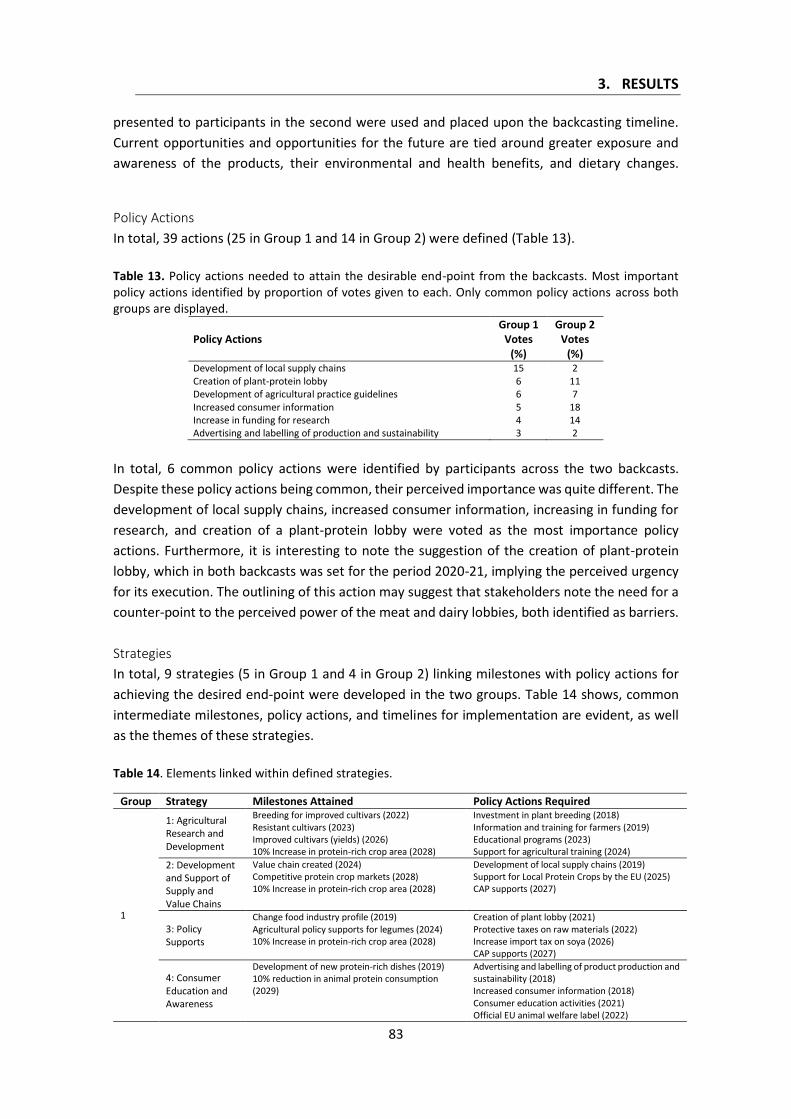
3. RESULTS
83
presented to participants in the second were used and placed upon the backcasting timeline.
Current opportunities and opportunities for the future are tied around greater exposure and
awareness of the products, their environmental and health benefits, and dietary changes.
Policy Actions
In total, 39 actions (25 in Group 1 and 14 in Group 2) were defined (Table 13).
Table 13. Policy actions needed to attain the desirable end-point from the backcasts. Most important policy actions identified by proportion of votes given to each. Only common policy actions across both groups are displayed.
Policy Actions Group 1 Group 2
Votes (%)
Votes (%)
Development of local supply chains 15 2 Creation of plant-protein lobby 6 11 Development of agricultural practice guidelines 6 7 Increased consumer information 5 18 Increase in funding for research 4 14 Advertising and labelling of production and sustainability 3 2
In total, 6 common policy actions were identified by participants across the two backcasts.
Despite these policy actions being common, their perceived importance was quite different. The
development of local supply chains, increased consumer information, increasing in funding for
research, and creation of a plant-protein lobby were voted as the most importance policy
actions. Furthermore, it is interesting to note the suggestion of the creation of plant-protein
lobby, which in both backcasts was set for the period 2020-21, implying the perceived urgency
for its execution. The outlining of this action may suggest that stakeholders note the need for a
counter-point to the perceived power of the meat and dairy lobbies, both identified as barriers.
Strategies
In total, 9 strategies (5 in Group 1 and 4 in Group 2) linking milestones with policy actions for
achieving the desired end-point were developed in the two groups. Table 14 shows, common
intermediate milestones, policy actions, and timelines for implementation are evident, as well
as the themes of these strategies.
Table 14. Elements linked within defined strategies.
Group Strategy Milestones Attained Policy Actions Required
1
1: Agricultural Research and Development
Breeding for improved cultivars (2022) Resistant cultivars (2023) Improved cultivars (yields) (2026) 10% Increase in protein-rich crop area (2028)
Investment in plant breeding (2018) Information and training for farmers (2019) Educational programs (2023) Support for agricultural training (2024)
2: Development and Support of Supply and Value Chains
Value chain created (2024) Competitive protein crop markets (2028) 10% Increase in protein-rich crop area (2028)
Development of local supply chains (2019) Support for Local Protein Crops by the EU (2025) CAP supports (2027)
3: Policy Supports
Change food industry profile (2019) Agricultural policy supports for legumes (2024) 10% Increase in protein-rich crop area (2028)
Creation of plant lobby (2021) Protective taxes on raw materials (2022) Increase import tax on soya (2026) CAP supports (2027)
4: Consumer Education and Awareness
Development of new protein-rich dishes (2019) 10% reduction in animal protein consumption (2029)
Advertising and labelling of product production and sustainability (2018) Increased consumer information (2018) Consumer education activities (2021) Official EU animal welfare label (2022)
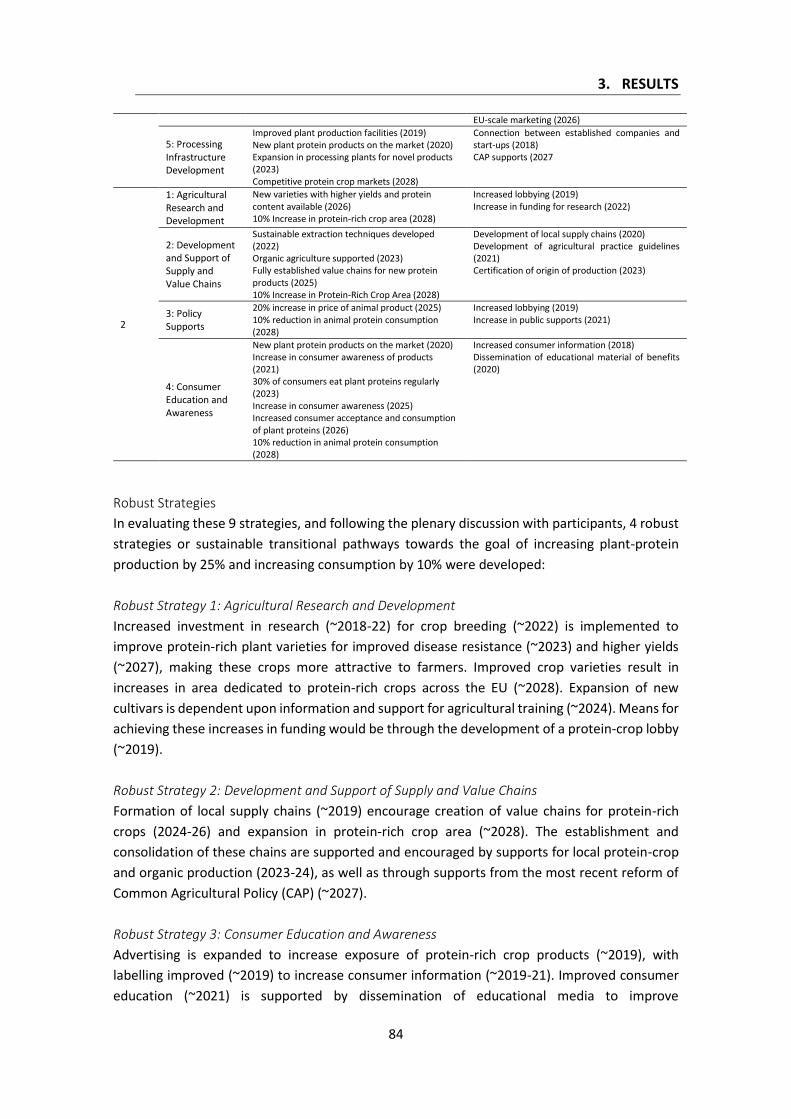
3. RESULTS
84
EU-scale marketing (2026)
5: Processing Infrastructure Development
Improved plant production facilities (2019) New plant protein products on the market (2020) Expansion in processing plants for novel products (2023) Competitive protein crop markets (2028)
Connection between established companies and start-ups (2018) CAP supports (2027
2
1: Agricultural Research and Development
New varieties with higher yields and protein content available (2026) 10% Increase in protein-rich crop area (2028)
Increased lobbying (2019) Increase in funding for research (2022)
2: Development and Support of Supply and Value Chains
Sustainable extraction techniques developed (2022) Organic agriculture supported (2023) Fully established value chains for new protein products (2025) 10% Increase in Protein-Rich Crop Area (2028)
Development of local supply chains (2020) Development of agricultural practice guidelines (2021) Certification of origin of production (2023)
3: Policy Supports
20% increase in price of animal product (2025) 10% reduction in animal protein consumption (2028)
Increased lobbying (2019) Increase in public supports (2021)
4: Consumer Education and Awareness
New plant protein products on the market (2020) Increase in consumer awareness of products (2021) 30% of consumers eat plant proteins regularly (2023) Increase in consumer awareness (2025) Increased consumer acceptance and consumption of plant proteins (2026) 10% reduction in animal protein consumption (2028)
Increased consumer information (2018) Dissemination of educational material of benefits (2020)
Robust Strategies
In evaluating these 9 strategies, and following the plenary discussion with participants, 4 robust
strategies or sustainable transitional pathways towards the goal of increasing plant-protein
production by 25% and increasing consumption by 10% were developed:
Robust Strategy 1: Agricultural Research and Development
Increased investment in research (~2018-22) for crop breeding (~2022) is implemented to
improve protein-rich plant varieties for improved disease resistance (~2023) and higher yields
(~2027), making these crops more attractive to farmers. Improved crop varieties result in
increases in area dedicated to protein-rich crops across the EU (~2028). Expansion of new
cultivars is dependent upon information and support for agricultural training (~2024). Means for
achieving these increases in funding would be through the development of a protein-crop lobby
(~2019).
Robust Strategy 2: Development and Support of Supply and Value Chains
Formation of local supply chains (~2019) encourage creation of value chains for protein-rich
crops (2024-26) and expansion in protein-rich crop area (~2028). The establishment and
consolidation of these chains are supported and encouraged by supports for local protein-crop
and organic production (2023-24), as well as through supports from the most recent reform of
Common Agricultural Policy (CAP) (~2027).
Robust Strategy 3: Consumer Education and Awareness
Advertising is expanded to increase exposure of protein-rich crop products (~2019), with
labelling improved (~2019) to increase consumer information (~2019-21). Improved consumer
education (~2021) is supported by dissemination of educational media to improve
3. RESULTS
85
understanding of consumption and production benefits. Increased exposure to products and
information drives greater consumption (~2023) and acceptance (~2025) of novel plant-based
products.
Robust Strategy 4: Policy Supports
The formation of a protein-crop lobby (~2019) encourages greater national public (agricultural)
policy supports (~2022-24) directed towards protein-rich crops, leading to increased supports
from the CAP (~2027). This results in a competitive protein crop market (~2028) and increases
in areas dedicated to protein crops (~2029). Further support mechanisms are used to increase
taxes on imported soya (~2026) and establish protective taxes to encourage greater use of EU-
produced raw materials (~2023). Policies are also implemented to increase prices of animal
protein products (~2025).

3. RESULTS
86
3.4 Protein-rich legume and pseudo-cereal crop suitability under future
European climates
The potential for nascent consumption transitions in Europe, supported by European grown
protein-rich plant-based animal product replacements, are likely to depend upon abiotic
suitability and crop distributions. However, to gauge how future production agricultural systems
may increasingly incorporate protein-rich crops, it is important to understand how current and
future climates affect crop distributions across the European Union.
Current Protein-Rich Crop Distribution
The results from the analysis of current protein-rich crop distribution are presented in Figure 25.
For illustrative purposes, each relationship is displayed with a non-statistical theoretical
expected relationship between distribution and suitability (dashed line). Suitability is expected
as a limiting factor, so more points should be under this line than above it. Quantile regression
lines (red line), derived from regressions of the 95th quantile of crop distribution values and
suitability for each crop are also included. Regression lines are only plotted if a relationship was
found to be significant (p <0.05).
For all crops the majority of the points is below the dashed line, confirming the hypothesised
asymmetric relationship between suitability and production. In most cases, crop distribution is
far below what may be expected from its suitability. Buckwheat (Figure 25g and Figure 25h) is a
particularly good example of this. Production only occurs in regions with near perfect conditions,
with the distribution of this crop being far below what may be expected. This suggests that other
factors, beyond climatic suitability, are important when it comes to protein-rich crop choice.
Figure 25 also displays that at the 95th quantile of crop distributions, climatic suitability is
significantly related to distribution for soya and faba bean (max and mean suitability), and blue
lupin under max suitability. Other relationships were found to be marginally insignificant at the
95th quantile of suitability results, but in most cases this is because crop production occurs only
under optimal conditions, limiting the range of suitability values for the regression analysis.
These results reveal not only that climatic suitability is a limiting factor for protein-rich crop
distributions across the EU, but also that in many cases these crops are widely under cultivated,
considering their suitability. This result would infer the latent and under-utilised potential of
many of these crops. Soya (Figure 25a and Figure 25b) offers an interesting result with many
regions over cultivating relative to climate suitability and under cultivating despite high
suitability in other areas. Those regions in lower-right of Figure 25a and Figure 25b are in Greece,
Italy and Spain, suggesting that other protein-rich crops are being cultivated in these area,
despite near perfect conditions for irrigated soya production.
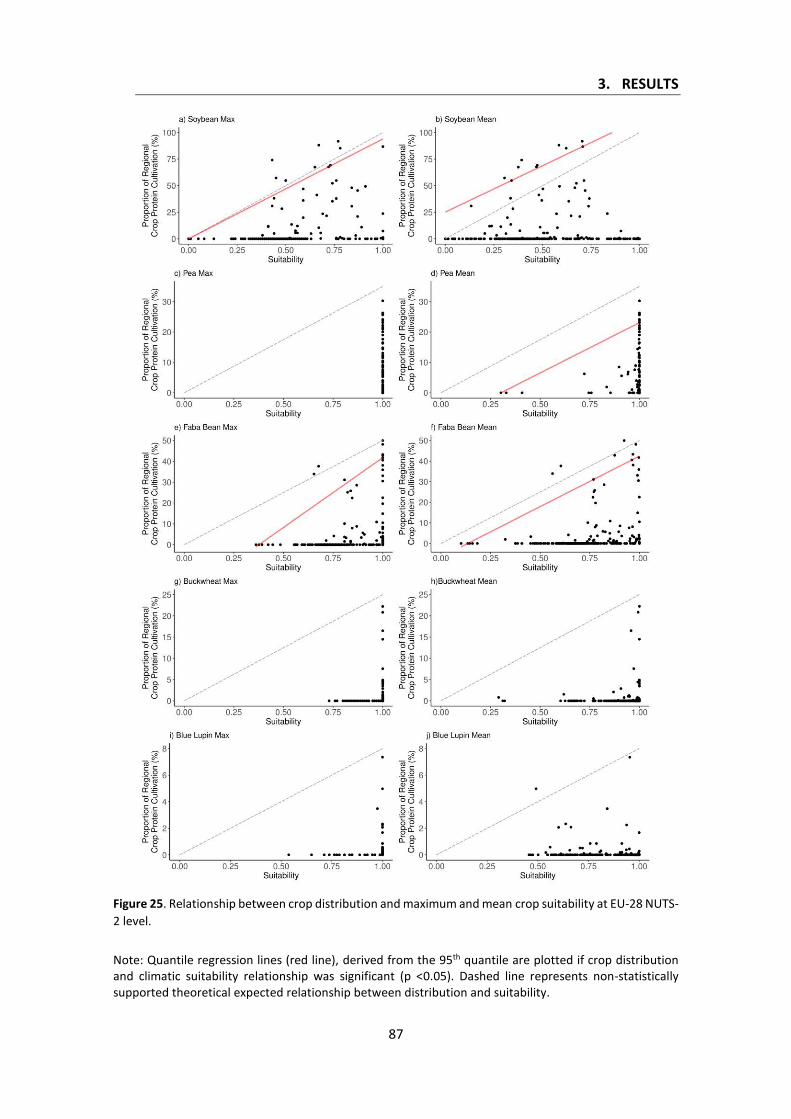
3. RESULTS
87
Figure 25. Relationship between crop distribution and maximum and mean crop suitability at EU-28 NUTS-
2 level.
Note: Quantile regression lines (red line), derived from the 95th quantile are plotted if crop distribution and climatic suitability relationship was significant (p <0.05). Dashed line represents non-statistically supported theoretical expected relationship between distribution and suitability.
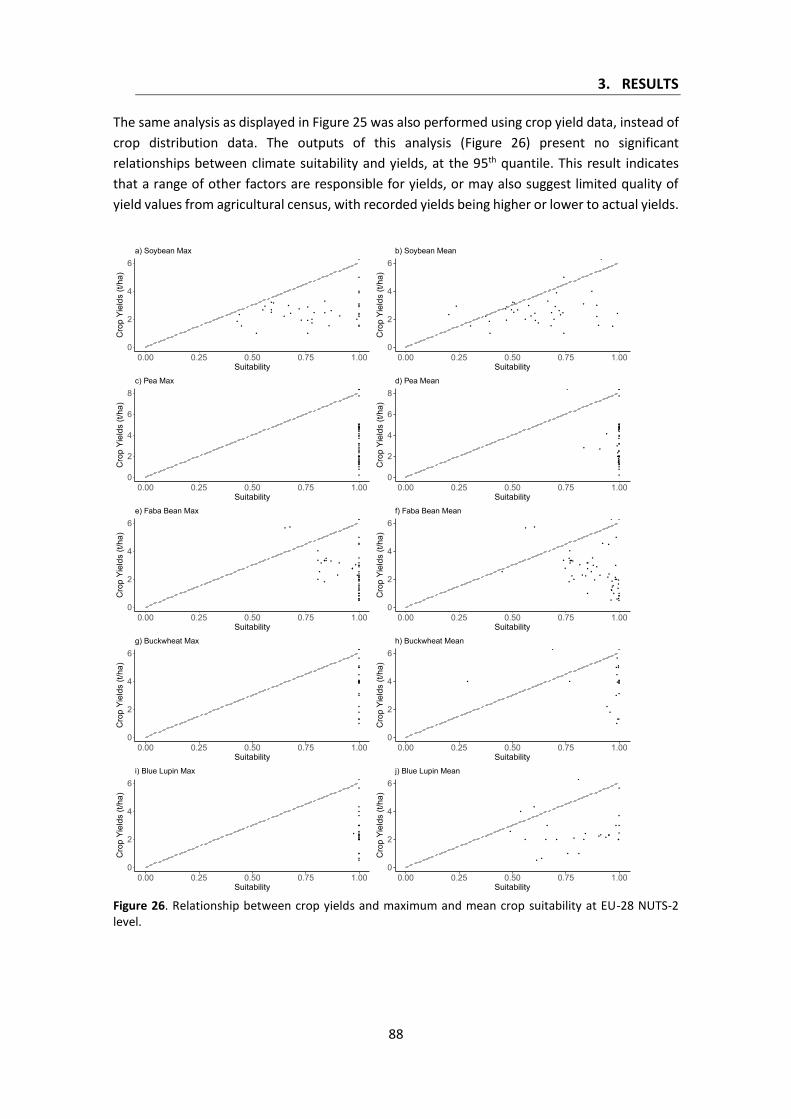
3. RESULTS
88
The same analysis as displayed in Figure 25 was also performed using crop yield data, instead of
crop distribution data. The outputs of this analysis (Figure 26) present no significant
relationships between climate suitability and yields, at the 95th quantile. This result indicates
that a range of other factors are responsible for yields, or may also suggest limited quality of
yield values from agricultural census, with recorded yields being higher or lower to actual yields.
Figure 26. Relationship between crop yields and maximum and mean crop suitability at EU-28 NUTS-2 level.
●●●
●
●●
●
●
●
●
●
●●●
●
● ●
●●
●
● ●
●
●
●●
●
●
●
●
●
●
●●
●
●
●
●●
0
2
4
6
0.00 0.25 0.50 0.75 1.00Suitability
Cro
p Yi
elds
(t/h
a)
a) Soybean Max
● ●●
●
●●
●
●
●
●
●
●●
●
●
● ●
●●
●
● ●
●
●
●●
●
●
●
●
●
●
●●
●
●
●
●●
0
2
4
6
0.00 0.25 0.50 0.75 1.00Suitability
Cro
p Yi
elds
(t/h
a)
b) Soybean Mean
●
●
●
●●●
●
●
●●●
●
●
●
●
●
●
●
●
●
●
●
●●●●●●●
●●●
●
●
●
●●
●
●
●●
●
●
●●●●●●
0
2
4
6
8
0.00 0.25 0.50 0.75 1.00Suitability
Cro
p Yi
elds
(t/h
a)
c) Pea Max
●
●
●
● ●●
●
●
●●●
●
●
●
●
●
●
●
●
●
●
●
●●●●●●●
●●●
●
●
●
●●
●
●
●●
●
●
●●●●●●
0
2
4
6
8
0.00 0.25 0.50 0.75 1.00Suitability
Cro
p Yi
elds
(t/h
a)d) Pea Mean
●●
●
●
●
●
●
●●
●●
●
●●●
●
●●
●
●
●●● ●
●
●
●
● ●
●
●
●●
●●
●●●
● ●
●
●
●●
●●
●
●●
●
●
●●●●
0
2
4
6
0.00 0.25 0.50 0.75 1.00Suitability
Cro
p Yi
elds
(t/h
a)
e) Faba Bean Max
●●
●
●
●
●
●
●●
●●
●
●●●
●
●●
●
●
●●● ●
●
●
●
● ●
●
●
● ●
●●
●●
●
● ●
●
●
●●
●●
●
●●
●
●
● ●●●
0
2
4
6
0.00 0.25 0.50 0.75 1.00Suitability
Cro
p Yi
elds
(t/h
a)
f) Faba Bean Mean
●●●
●
●
●●
●
●
●●
●
●●
●
●
●
●
●
●
●
●
0
2
4
6
0.00 0.25 0.50 0.75 1.00Suitability
Cro
p Yi
elds
(t/h
a)
g) Buckwheat Max
●●●
●
●
●●
●
●
●●
●
●●
●
●
●
●
●
●
●
●
0
2
4
6
0.00 0.25 0.50 0.75 1.00Suitability
Cro
p Yi
elds
(t/h
a)
h) Buckwheat Mean
●
●
●
●
●
●
●
●
●
●●
●
●
●
●●
●
●●●
●
●●●●
●●
0
2
4
6
0.00 0.25 0.50 0.75 1.00Suitability
Cro
p Yi
elds
(t/h
a)
i) Blue Lupin Max
●
●
●
●
●
●
●
●
●
● ●
●
●
●
●●
●
●●
●
●
●●
●●
● ●
0
2
4
6
0.00 0.25 0.50 0.75 1.00Suitability
Cro
p Yi
elds
(t/h
a)
j) Blue Lupin Mean
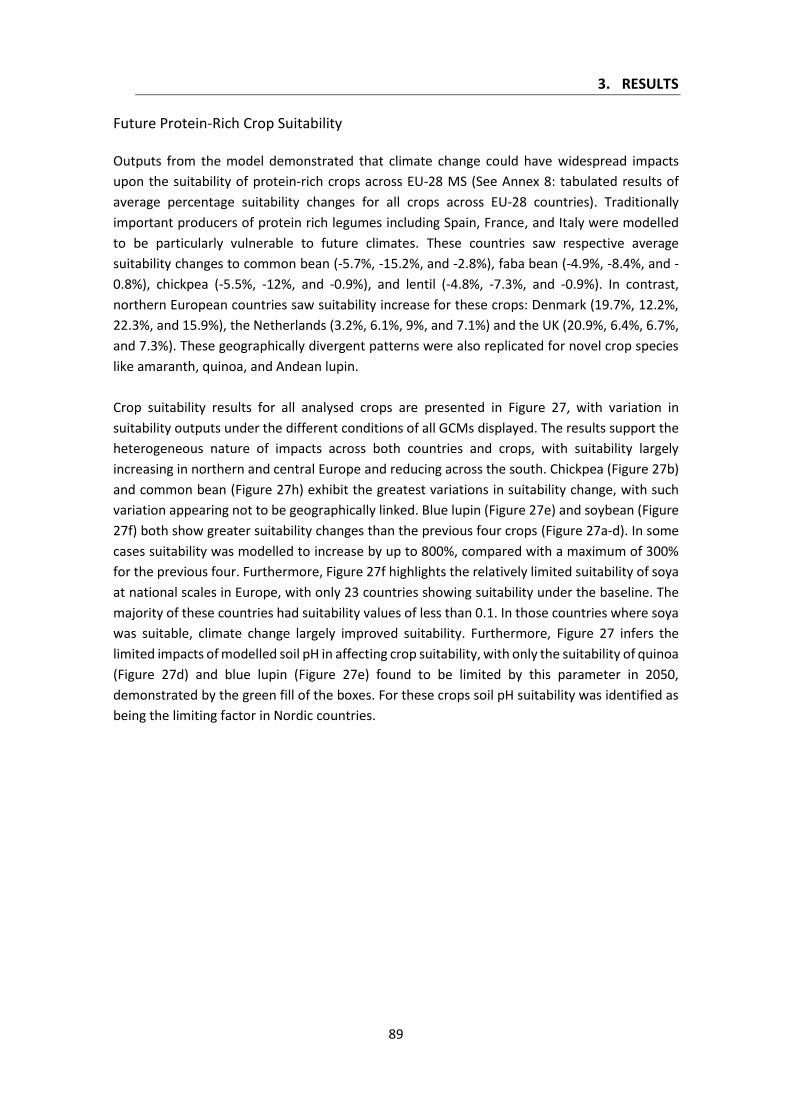
3. RESULTS
89
Future Protein-Rich Crop Suitability
Outputs from the model demonstrated that climate change could have widespread impacts
upon the suitability of protein-rich crops across EU-28 MS (See Annex 8: tabulated results of
average percentage suitability changes for all crops across EU-28 countries). Traditionally
important producers of protein rich legumes including Spain, France, and Italy were modelled
to be particularly vulnerable to future climates. These countries saw respective average
suitability changes to common bean (-5.7%, -15.2%, and -2.8%), faba bean (-4.9%, -8.4%, and -
0.8%), chickpea (-5.5%, -12%, and -0.9%), and lentil (-4.8%, -7.3%, and -0.9%). In contrast,
northern European countries saw suitability increase for these crops: Denmark (19.7%, 12.2%,
22.3%, and 15.9%), the Netherlands (3.2%, 6.1%, 9%, and 7.1%) and the UK (20.9%, 6.4%, 6.7%,
and 7.3%). These geographically divergent patterns were also replicated for novel crop species
like amaranth, quinoa, and Andean lupin.
Crop suitability results for all analysed crops are presented in Figure 27, with variation in
suitability outputs under the different conditions of all GCMs displayed. The results support the
heterogeneous nature of impacts across both countries and crops, with suitability largely
increasing in northern and central Europe and reducing across the south. Chickpea (Figure 27b)
and common bean (Figure 27h) exhibit the greatest variations in suitability change, with such
variation appearing not to be geographically linked. Blue lupin (Figure 27e) and soybean (Figure
27f) both show greater suitability changes than the previous four crops (Figure 27a-d). In some
cases suitability was modelled to increase by up to 800%, compared with a maximum of 300%
for the previous four. Furthermore, Figure 27f highlights the relatively limited suitability of soya
at national scales in Europe, with only 23 countries showing suitability under the baseline. The
majority of these countries had suitability values of less than 0.1. In those countries where soya
was suitable, climate change largely improved suitability. Furthermore, Figure 27 infers the
limited impacts of modelled soil pH in affecting crop suitability, with only the suitability of quinoa
(Figure 27d) and blue lupin (Figure 27e) found to be limited by this parameter in 2050,
demonstrated by the green fill of the boxes. For these crops soil pH suitability was identified as
being the limiting factor in Nordic countries.
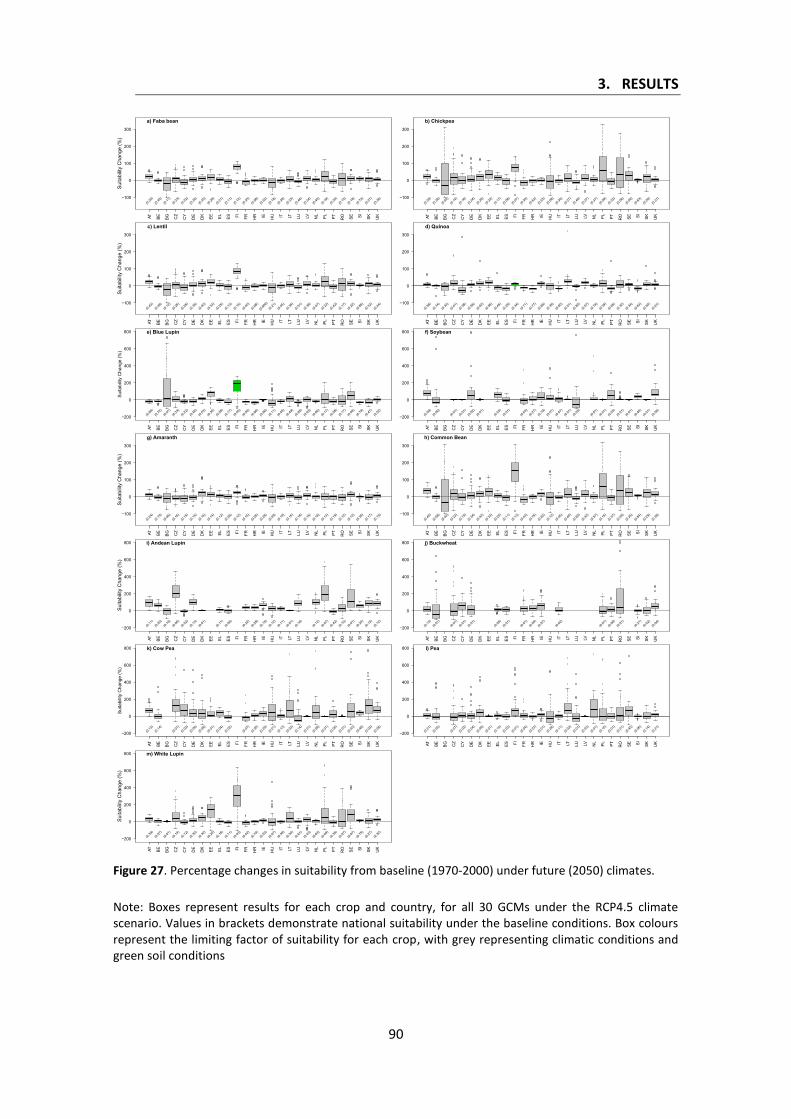
3. RESULTS
90
Figure 27. Percentage changes in suitability from baseline (1970-2000) under future (2050) climates.
Note: Boxes represent results for each crop and country, for all 30 GCMs under the RCP4.5 climate scenario. Values in brackets demonstrate national suitability under the baseline conditions. Box colours represent the limiting factor of suitability for each crop, with grey representing climatic conditions and green soil conditions
AT BE BG CZ
CY
DE
DK EE EL ES FI FR HR IE HU IT LT LU LV NL PL PT RO SE SI SK UK
−100
0
100
200
300
Suita
bilit
y C
hang
e (%
)a) Faba bean
(0.35
)(0.
40)
(0.11
)(0.
23)
(0.22
)(0.
30)
(0.35
)(0.
29)
(0.21
)(0.
11)
(0.12
)(0.
35)
(0.58
)(0.
52)
(0.18
)(0.
38)
(0.33
)(0.
44)
(0.34
)(0.
40)
(0.19
)(0.
35)
(0.15
)(0.
18)
(0.72
)(0.
27)
(0.36
)
AT BE BG CZ
CY
DE
DK EE EL ES FI FR HR IE HU IT LT LU LV NL PL PT RO SE SI SK UK
−100
0
100
200
300
b) Chickpea
(0.35
)(0.
36)
(0.02
)(0.
14)
(0.16
)(0.
24)
(0.29
)(0.
22)
(0.17
)(0.
08)
(0.07
)(0.
30)
(0.62
)(0.
53)
(0.08
)(0.
36)
(0.27
)(0.
40)
(0.27
)(0.
37)
(0.09
)(0.
32)
(0.06
)(0.
09)
(0.83
)(0.
20)
(0.31
)
AT BE BG CZ
CY
DE
DK EE EL ES FI FR HR IE HU IT LT LU LV NL PL PT RO SE SI SK UK
−100
0
100
200
300
Suita
bilit
y C
hang
e (%
)
c) Lentil
(0.43
)(0.
48)
(0.12
)(0.
26)
(0.26
)(0.
35)
(0.40
)(0.
33)
(0.25
)(0.
13)
(0.15
)(0.
40)
(0.68
)
(0.66
6)
(0.21
)(0.
45)
(0.38
)(0.
51)
(0.38
)(0.
47)
(0.22
)(0.
42)
(0.17
)(0.
22)
(0.86
)(0.
32)
(0.44
)
AT BE BG CZ
CY
DE
DK EE EL ES FI FR HR IE HU IT LT LU LV NL PL PT RO SE SI SK UK
−100
0
100
200
300
d) Quinoa
(0.58
)(0.
74)
(0.33
)(0.
41)
(0.38
)(0.
56)
(0.62
)(0.
56)
(0.45
)(0.
29)
(0.34
)(0.
71)
(0.77
)(0.
68)
(0.39
)(0.
60)
(0.51
)(0.
80)
(0.57
)(0.
78)
(0.39
)(0.
65)
(0.32
)(0.
34)
(0.83
)(0.
50)
(0.61
)
AT BE BG CZ
CY
DE
DK EE EL ES FI FR HR IE HU IT LT LU LV NL PL PT RO SE SI SK UK
−200
0
200
400
600
800
Suita
bilit
y C
hang
e (%
)
e) Blue Lupin
(0.65
)(0.
72)
(0.01
)(0.
33)
(0.22
)(0.
46)
(0.53
)(0.
36)
(0.28
)(0.
17)
(0.05
)(0.
56)
(0.66
)(0.
86)
(0.11
)(0.
45)
(0.49
)(0.
85)
(0.63
)(0.
86)
(0.17
)(0.
58)
(0.17
)(0.
09)
(0.79
)(0.
47)
(0.52
)
AT BE BG CZ
CY
DE
DK EE EL ES FI FR HR IE HU IT LT LU LV NL PL PT RO SE SI SK UK
−200
0
200
400
600
800 f) Soybean
(0.09
)(0.
06)
(0.01
)(0.
01)
(0.02
)(0.
01)
(0.03
)(0.
01)
(0.03
)(0.
27)
(0.19
)(0.
01)
(0.07
)(0.
01)
(0.03
)(0.
01)
(0.01
)(0.
03)
(0.01
)(0.
01)
(0.46
)(0.
01)
(0.06
)
AT BE BG CZ
CY
DE
DK EE EL ES FI FR HR IE HU IT LT LU LV NL PL PT RO SE SI SK UK
−100
0
100
200
300
Suita
bilit
y C
hang
e (%
)
g) Amaranth
(0.24
)(0.
19)
(0.06
)(0.
16)
(0.15
)(0.
15)
(0.16
)(0.
14)
(0.12
)(0.
06)
(0.12
)(0.
15)
(0.26
)(0.
28)
(0.09
)(0.
19)
(0.15
)(0.
18)
(0.16
)(0.
18)
(0.13
)(0.
19)
(0.12
)(0.
12)
(0.38
)(0.
17)
(0.19
)
AT BE BG CZ
CY
DE
DK EE EL ES FI FR HR IE HU IT LT LU LV NL PL PT RO SE SI SK UK
−100
0
100
200
300
h) Common Bean
(0.40
)(0.
58)
(0.02
)(0.
22)
(0.19
)(0.
34)
(0.42
)(0.
33)
(0.20
)(0.
11)
(0.13
)(0.
43)
(0.76
)(0.
62)
(0.12
)(0.
45)
(0.40
)(0.
60)
(0.42
)(0.
57)
(0.15
)(0.
37)
(0.09
)(0.
25)
(0.84
)(0.
29)
(0.39
)
AT BE BG CZ
CY
DE
DK EE EL ES FI FR HR IE HU IT LT LU LV NL PL PT RO SE SI SK UK
−200
0
200
400
600
800
Suita
bilit
y C
hang
e (%
)
i) Andean Lupin
(0.11
)(0.
20)
(0.16
)(0.
06)
(0.02
)(0.
13)
(0.01
)(0.
11)
(0.06
)(0.
22)
(0.28
)(0.
15)
(0.12
)(0.
11)
(0.01
)(0.
16)
(0.12
)(0.
07)
(0.42
)(0.
10)
(0.01
)(0.
24)
(0.13
)(0.
12)
AT BE BG CZ
CY
DE
DK EE EL ES FI FR HR IE HU IT LT LU LV NL PL PT RO SE SI SK UK
−200
0
200
400
600
800 j) Buckwheat
(0.13
)(0.
01)
(0.01
)(0.
01)
(0.01
)(0.
05)
(0.01
)(0.
01)
(0.05
)(0.
07)
(0.02
)(0.
01)
(0.06
)(0.
01)
(0.21
)(0.
02)
(0.04
)
AT BE BG CZ
CY
DE
DK EE EL ES FI FR HR IE HU IT LT LU LV NL PL PT RO SE SI SK UK
−200
0
200
400
600
800
Suita
bilit
y C
hang
e (%
)
k) Cow Pea
(0.12
)(0.
14)
(0.01
)(0.
02)
(0.06
)(0.
08)
(0.01
)(0.
04)
(0.02
)(0.
07)
(0.35
)(0.
25)
(0.01
)(0.
13)
(0.03
)(0.
14)
(0.01
)(0.
08)
(0.01
)(0.
05)
(0.01
)(0.
03)
(0.48
)(0.
02)
(0.08
)
AT BE BG CZ
CY
DE
DK EE EL ES FI FR HR IE HU IT LT LU LV NL PL PT RO SE SI SK UK
−200
0
200
400
600
800 l) Pea
(0.21
)(0.
05)
(0.07
)(0.
03)
(0.04
)(0.
06)
(0.01
)(0.
10)
(0.03
)(0.
01)
(0.04
)(0.
23)
(0.01
)(0.
28)
(0.11
)(0.
02)
(0.01
)(0.
03)
(0.01
)(0.
15)
(0.01
)(0.
01)
(0.45
)(0.
06)
(0.14
)(0.
21)
AT BE BG CZ
CY
DE
DK EE EL ES FI FR HR IE HU IT LT LU LV NL PL PT RO SE SI SK UK
−200
0
200
400
600
800
Suita
bilit
y C
hang
e (%
)
m) White Lupin
(0.39
)(0.
57)
(0.01
)(0.
14)
(0.12
)(0.
30)
(0.32
)(0.
20)
(0.18
)(0.
11)
(0.03
)(0.
42)
(0.70
)(0.
53)
(0.07
)(0.
39)
(0.30
)(0.
61)
(0.43
)(0.
63)
(0.09
)(0.
35)
(0.07
)(0.
07)
(0.75
)(0.
27)
(0.32
)
3. RESULTS
91
Spatial patterns of future suitability across the EU are displayed in Figure 28. These results
present average suitability values from the outputs of all the models run for the 30 GCMs. In
2050, areas identified with high suitability for protein-rich crops were concentrated within
Adriatic countries, alpine regions (northern Italy, Slovenia, southern Germany, and Eastern
France), and northwestern Europe. These high levels of sutiability may also be able to account
for recent increases in production across some Adriatic countries (Figure 21). However, in some
of these regions suitability for a number of crops was modelled to decline (i.e. faba bean and
chickpea in Croatia). Further, quinoa and to a lesser extent blue lupin were found to have high
suitability across a range of environments. High quinoa suitability (Figure 28d) was observed
from the Atlantic coast of Portugal, to the Eurasian Steppe. In contrast, regions highly suitable
for soya (Figure 28f) are almost exclusively concentrated in the Adriatic, with lesser suitability
seen in southern Germany and Ireland.
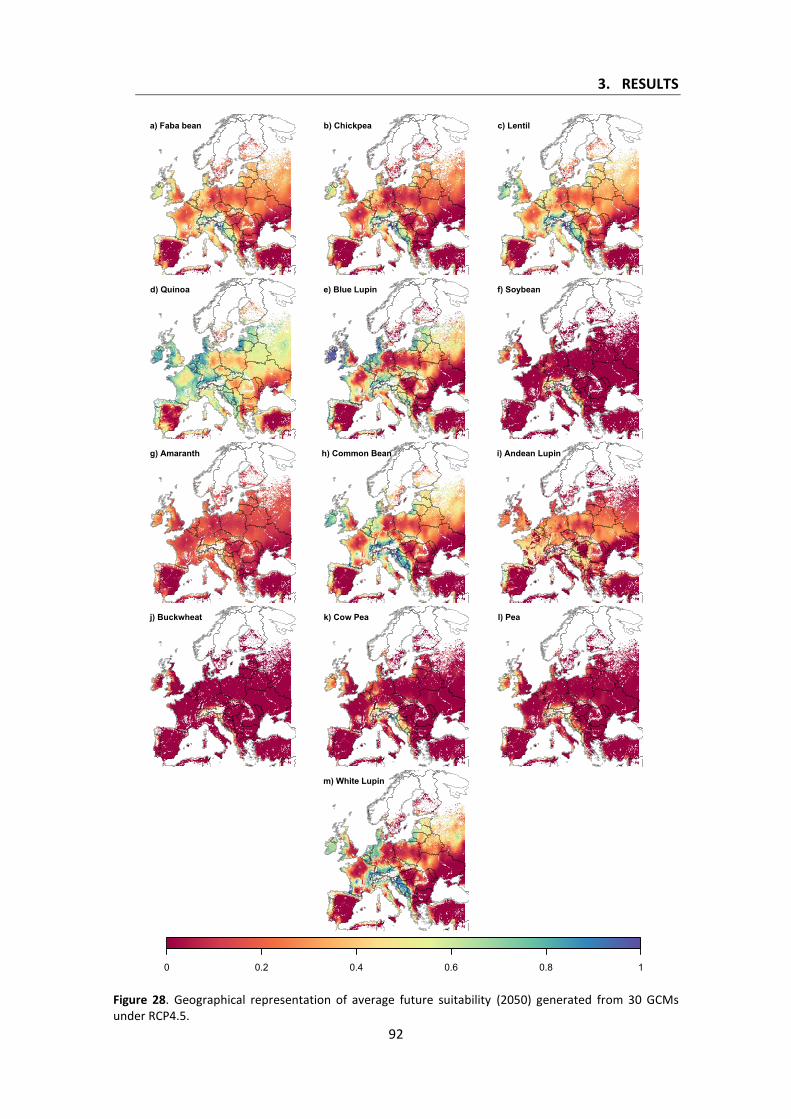
3. RESULTS
92
Figure 28. Geographical representation of average future suitability (2050) generated from 30 GCMs under RCP4.5.
a) Faba bean b) Chickpea c) Lentil
d) Quinoa e) Blue Lupin f) Soybean
g) Amaranth h) Common Bean i) Andean Lupin
j) Buckwheat k) Cow Pea l) Pea
m) White Lupin
0 0.2 0.4 0.6 0.8 1
3. RESULTS
93
Note: 0 (red) represents unsuitable conditions, and 1 (purple) suitable conditions. White pixels represent lands not cultivated under the baseline
Climate Proof Protein-Rich Crops
Under the baseline conditions (Figure 29a), quinoa was found to be the most suitable crop across
almost 70% of European arable land followed by: blue lupin (23%), common bean (4%), and
white lupin (1.4%). However, by 2050 (Figure 29b) and suggesting the impacts of climate change,
a more diverse cropping structure is observed. Despite this, quinoa still dominates, representing
the most suitable crop in more than 36% of European arable land followed by white lupin (19%),
blue lupin (19%), and common bean (15%). Further, 21 multi-crop options covering ~10% of
European arable land were identified. The presence of these multi-crop options correlates with
the regions of high suitability identified in Figure 28.

3. RESULTS
94
Figure 29. Robust protein-rich crop options under baseline and future climates conditions.
a) 2000 b) 2050
Six Crop Portfolio
Five Crop Portfolio
Four Crop Portfolio
Three Crop Portfolio
Two Crop Portfolio
Pea
Blue Lupin
Andean Lupin
White Lupin
Amaranth
Lentil
Chickpea
Common Bean
Quinoa
Buckwheat

3. RESULTS
95
Sensitivity Analysis
Table 15 displays how changes in the parameters for each test affect how suitability responds
under present and future conditions. Suitability is characterised into three categories: increase,
neutral, and decrease. These categories represent changes from present climatic conditions to
future conditions. The below tabulates how changes to parameters can alter these categories,
with five categories developed to highlight how parameter changes alter suitability, compared
to the baseline. The results display the number of crop country combinations (e.g. quinoa
suitability in Sweden) affected by the parameter changes, based upon average national
suitability values for each crop.
The results demonstrate that under all sensitivity tests (Table 7), the greatest number of
category changes (increase, decrease, and no change) in crop-country combinations were seen
for the ph-25%+1m test, compared to the baseline results. Under the conditions of this
sensitivity test, 32% of crop-country combinations changed, with 31% changing for the
Tmin+2C+1m and the Pre+25%-1m tests. Complete changes in suitability outputs (increase to
decrease, or decrease to increase) ranged from 1-19% across the sensitivity tests. The greatest
changes being a positive shift from decrease to increase. The sensitivity results, although
suggesting higher sensitivity to previous analysis (Manners and van Etten, 2018), still
demonstrate the moderate level of sensitivity of EcoCrop outputs to parameter changes and the
robustness of the model.
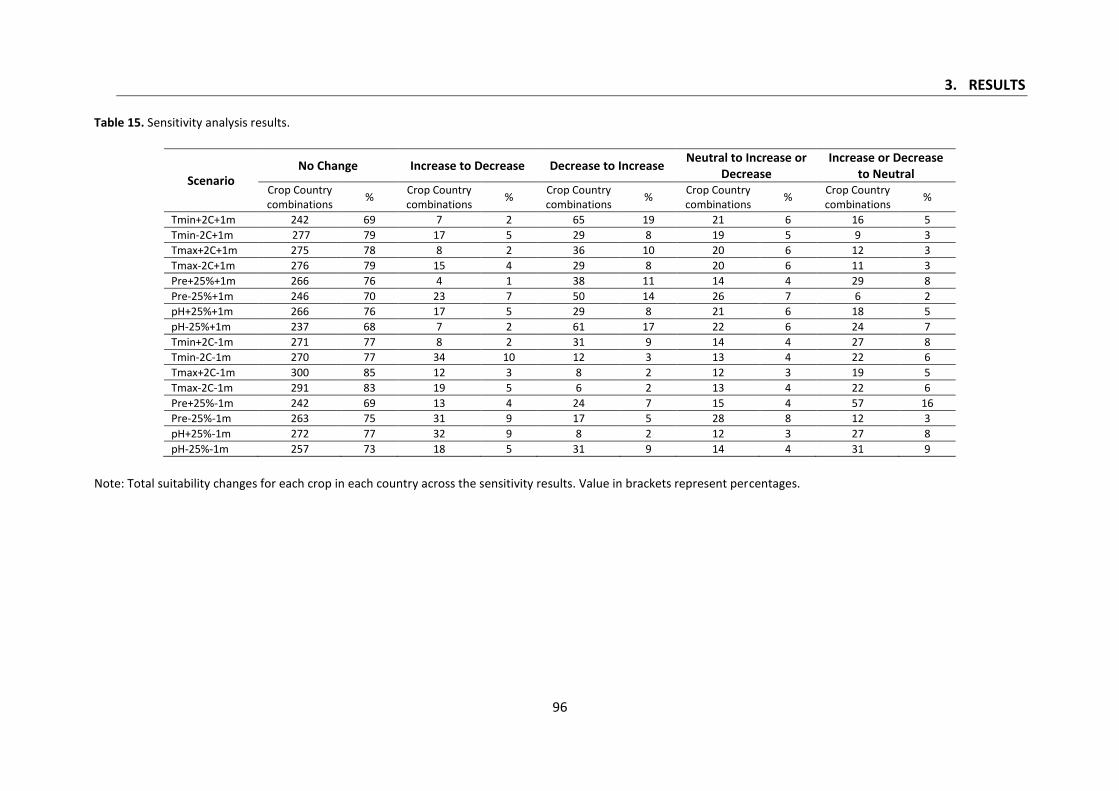
3. RESULTS
96
Table 15. Sensitivity analysis results.
Scenario No Change Increase to Decrease Decrease to Increase
Neutral to Increase or Decrease
Increase or Decrease to Neutral
Crop Country combinations
% Crop Country combinations
% Crop Country combinations
% Crop Country combinations
% Crop Country combinations
%
Tmin+2C+1m 242 69 7 2 65 19 21 6 16 5
Tmin-2C+1m 277 79 17 5 29 8 19 5 9 3
Tmax+2C+1m 275 78 8 2 36 10 20 6 12 3
Tmax-2C+1m 276 79 15 4 29 8 20 6 11 3
Pre+25%+1m 266 76 4 1 38 11 14 4 29 8
Pre-25%+1m 246 70 23 7 50 14 26 7 6 2
pH+25%+1m 266 76 17 5 29 8 21 6 18 5
pH-25%+1m 237 68 7 2 61 17 22 6 24 7
Tmin+2C-1m 271 77 8 2 31 9 14 4 27 8
Tmin-2C-1m 270 77 34 10 12 3 13 4 22 6
Tmax+2C-1m 300 85 12 3 8 2 12 3 19 5
Tmax-2C-1m 291 83 19 5 6 2 13 4 22 6
Pre+25%-1m 242 69 13 4 24 7 15 4 57 16
Pre-25%-1m 263 75 31 9 17 5 28 8 12 3
pH+25%-1m 272 77 32 9 8 2 12 3 27 8
pH-25%-1m 257 73 18 5 31 9 14 4 31 9
Note: Total suitability changes for each crop in each country across the sensitivity results. Value in brackets represent percentages.
4. DISCUSSION
97
4. DISCUSSION
Forest losses represent a challenge for humanity in terms of climate change, biodiversity loss,
and ecosystem service functionality (Nepstad et al., 2008; Peres et al., 2010; Oliveira et al., 2013;
Lapola et al., 2014; Keenan et al., 2015; Machovina et al., 2015; Baccini et al., 2017). The
complexity of this land-use change and its intertwined and globalised drivers are suggestive of
the utility of the application of a holistic, multi-scalar, and interdisciplinary methodological
approach to address it.
The efficacy of such an approach is evidenced by the development and implementation of a
metric for quantifying how socio-economic factors can contribute to forest vulnerability and
mapping how temporal and spatial fluxes in these factors can result in considerable vulnerability
changes. The Deforestation Vulnerability Index (DVI) provides a multi-scale insight into the
dynamic role that socio-economic factors have had in driving vulnerability across LAC forests in
recent years. In general, vulnerability was found to have reduced across much of the continent.
These declines were attributable to reductions in agricultural area growth and governance
improvements. The positive effects of governance and institutional improvements are, following
the literature, to be expected. McNeil et al. (2012) outline the constraining effect that poor
governance can have on sustainable development. The specific and beneficial role of
governance and institutional improvements in forest conservation and communities is
increasingly being established (Rodrigues-Filho et al., 2015; Caviglia-Harris et al., 2016).
Governance improvements coupled with social and supply chain initiatives have been
repeatedly cited as potential avenues for reducing deforestation and limiting agricultural area
growth in Latin America (Nepstad et al., 2014; Rodrigues-Filho et al., 2015; Gibbs et al., 2015).
Müller et al. (2014) and Høiby and Zenteno-Hopp (2015) suggest that little progress can be made
to conserve forests if good policies are subject to poor governance, or if policy conflicts exist.
The results from the DVI advocate the benefits of policies dedicated towards governance and
institutional improvements. Such improvements could provide a route to ensuring natural
resource conservation and subsequently reduce deforestation. However, despite contemporary
improvements in governance across many Amazonian countries in recent decades (World Bank,
2016), implementation of governance reforms may be challenging, especially under increasingly
turbulent political landscapes, exemplified by the current political situation in Brazil (e.g.
Bragagnolo et al., 2017). Further, potentially intangible (in the short-term) and time consuming
governance and institutional reforms may be unpalatable for voter conscious and electioneering
administrations. Governments wanting to appear proactive in terms of rural development and
environmental conservation may consider other, more palpable options (Cuiza, 2017). The
benefits of institutional reforms may only be reaped in the long-term, by which time
governments may have changed and the benefits of change lost for the implementing
administration. This may highlight the space for market-based interventions (e.g. Nepstad et al.,
2014: Gibbs et al., 2015).
The DVI provides an illustration of how ephemeral and temporary vulnerability reductions
stemming from governance improvements may be, with the identification of a vulnerability peak

4. DISCUSSION
98
in 2005. On closer inspection of the data, this peak can be linked to a continent-wide reduction
in governmental efficacy, political stability, and regulatory quality (World Bank, 2016). Analysis
of historical election data offers an explanation for such declines. The period 2004-2006 saw
continent-wide legislative and/or presidential elections (University of Texas, 2010). Examination
of the literature highlights precedence for these findings and their implications for forest
conservation. Electoral periods have been characterised by increased deforestation, where
deforesters anticipate that elections will bring relaxation in enforcement and or amnesties for
previous deforesting (Fearnside, 2003; Rodrigues-Filho et al., 2015). These observations are
suggestive that although improvements in governance may reduce vulnerability, these
reductions may only be based upon perception and are easily lost. Conservation of natural
resources therefore may be dependent upon the perception of consequences for illegal actions.
As such institutional improvements, which may only be perceived for example through greater
physical displays of policy (i.e. more forest managers or wardens), may assist in providing greater
protections to forests.
Smith et al. (2014), and FAO (2015b) both observe that reducing/stabilising deforestation rates
have been identified across LAC countries. The FAO (2015b) observe that rates of forest losses
have reduced by more than 50% since 1990, accounted for by improved monitoring, reporting,
planning, and stakeholder management. Identified declines in vulnerability from the DVI are
somewhat inconsistent to the observed, albeit reducing rates of deforestation (FAO, 2015b). A
number of factors may have contributed to such differences. The omission of indicators of
vulnerability due to: a lack extensive data (e.g. land tenure), them falling outside of the scope of
the analysis (e.g. physical characteristics like slope and aspect), or them not being identified
(Vincent, 2004) may be accountable. Additionally, these differences may also expose the
existence of a lag between socio-economic improvements and subsequent benefits in terms of
reduced or halted deforestation. Improvements in governance, reductions in population growth
or agricultural area growth may not be noted with immediate cessation of deforestation, but
take time for the environmental benefits to be realised, as per the Forest Transition model
(Mather, 1992). The presence of such a lag may be supported by the FAO (2015b) (See Annex 1:
Latin American and Caribbean forest area and forest area changes from 1990-2014), where
deforestation rates for the period 2010-2014 were found to have further declined in countries
where vulnerability reduced from 2000-2010. Further investigation of the presence of such a lag
between socio-economic improvements and reduced deforestation could offer an interesting
expansion of this analysis.
Results from state-scale application of the DVI support the concept of complexity and variability
at sub-national levels (Simane et al., 2016). Application of the index at the state-scale revealed
not only its flexibility, but also the disparate vulnerability at distinct scales. The Department of
Santa Cruz (Bolivia) and the State of Pará (Brazil) are both on the respective front-lines of their
national agricultural frontiers. Both regions have high levels of agricultural area growth and
economic dependence upon agriculture. Santa Cruz does however have lower governance
quality than those seen within Pará. Their high economic dependence upon agricultural
activities and rapid expansion in agricultural area (INE, 2011; FAPESPA, 2017) explain their
elevated vulnerability. These results reinforce the inappropriateness of ´blueprint thinking´
4. DISCUSSION
99
(Ostrom and Cox, 2010) when it comes to forest management, demonstrating that sources of
vulnerability differ both temporally and spatially within a single country. These differences stress
the need for specific and, where possible, localised management strategies to address
vulnerability heterogeneity and respond to deforestation threats. They also suggest that
localised focus upon improving governance and implementation of policies could be a pathway
to reducing forest vulnerability at more local scales. The results further demonstrate the utility
of the DVI, it can be used as an aid for policy makers, forest managers, and stakeholders to
identify and address the source(s) of forest vulnerability, whilst generating a more detailed
perspective of forest vulnerability. Pretzsch et al. (2008) stress the utility of the toolbox
approach when it comes to forest management, with diverse and interdisciplinary approaches
aiding in decision-making. The DVI can be one such tool, directing reactive and responsive
sustainable forest management strategies, tailored to and considerate of the socio-economic
vulnerabilities identified.
The DVI further underscores the benefits of participatory approaches (Wollenberg et al., 2000).
The inclusion of stakeholders in the DVI development offered new perspectives and emphasised
the differences in opinion concerning the importance of processes driving deforestation, and
their considerable effects on DVI outputs. The DVI’s results and its development demonstrate
the benefits of the inclusion of expert and non-expert perspectives. Inclusion of multiple
stakeholders could encourage collaborative information-led forest management decision-
making (Achyar et al., 2015). Finally, the DVI could also be used in concert with other metrics of
forest vulnerability (e.g. Mildrexler et al., 2016; Amalina et al., 2016), to provide a more detailed,
better-resolved, multi-faceted, and interdisciplinary image of global forests and their
vulnerability, further facilitating forest management.
The identified differential in national and state vulnerability demonstrates the importance of
evaluating processes like deforestation at the smallest scale possible to gain a more resolved
and informed idea of the processes and decision-making behind it. Elevated vulnerability at
state-scale in agriculture-forest interfaces may have been supported, indirectly, by policies and
decision-making encouraging rural development through agricultural expansion and natural
resource extraction (Diversi, 2014). In some instances, such policy-making has successfully
catalysed socio-economic improvements (Le Tourneau et al., 2013). However, Ioris (2016)
established that concentrating solely upon agricultural intensification and/or resource
extraction may provide only marginal socio-economic gains, and may be responsible for long-
term environmental costs (Weinhold et al., 2015). Conversely, conservation policies have been
implicated as drivers of outward migration and reduced settlement (Carr, 2009), confining local
communities to conditions of poverty (Chomitz, 2007), and hindering sustainable development
(Guedes et al., 2014).
This investigation reinforces the well documented trade-offs between regulating and
provisioning ecosystem services in agricultural systems (Raudsepp- Hearn et al., 2010; Carreño
et al., 2012; Phalan et al., 2011; Lee and Lautenbach, 2016). The results outline that focussing
simply on farm-scale income (and the potential associated socio-economic benefits) can have
negative impacts upon natural resource conservation (farm-scale net sequestration of carbon)
4. DISCUSSION
100
and vice-versa. The impacts of the binary choice between these antagonistic goals can be stark,
with decision-makers having to make substantial compromises. The results offer an insight into
the sensitivity of these ES relationships to decision-making, bolstering suggestions of Bennett et
al. (2009). Extreme management preferences were found to aggravate ES trade-offs markedly.
Managing trade-offs, whilst supporting ES provision is essential for sustainability (Cavender-
Bares et al., 2015). In this regard, the goal programming modelling establishes a series of
repeated intermittent solutions that may offer sustainable management options for all farms
types. Fooks and Messer (2012) suggest the repetition of these solutions demonstrate their
robustness, and they may represent viable management options (Schroder et al., 2016). These
solutions could provide points of reference in the development of strategies sensitive to the
nuanced effects of decision-making in such dynamic and important regions. Identification of
these management option reinforce the utility of modelling ES relationships (Viglizzo et al.,
2006; White et al., 2012). Application of balanced management strategies resulted in relatively
stable farm sequestration and incomes. More extreme preferences drove large variations in
income and especially sequestration, with these most extreme results seen in favour of income
maximisation, where forests were widely deforested, with subsequent impacts upon carbon
sequestration, reflecting the current reality of the region (Davidson et al., 2012; Varela-Ortega
et al., 2014).
As a means of addressing these antagonistic relationships and following suggestions within the
literature (e.g. Sayer et al., 2013), the identified ES trade-off relationship were analysed under
the conditions of hypothetical policy scenarios. Under moderate management preferences,
implementation of a conservation oriented scenario encouraged future farm-scale income and
carbon sequestration gains compared to a baseline, with implementation of an agricultural
development policy scenario encouraging similar gains in income, with limited costs to
sequestration. The results propose the potential success of a policy scenario based upon
conservation of ecosystem services, in improving farm income, protecting carbon sequestration,
and conserving forest area. The long-term importance of the introduction of such a policy is
suggested by Tejada et al. (2016), who found that limiting future environmental degradation,
specifically deforestation, without offering new economic alternatives is unlikely. These are
important observations considering the benefits of forest protection for ES (Brandon, 2014) and
that well managed forests may provide a more robust income stream than agriculture under
climate change, with forest protection offering a climate change adaption mechanism for rural
communities (Wunder et al., 2018).
Moving from the modelled world to the real, where implementation of such policies requires
consideration of social acceptability, likelihood of implementation, willingness of politicians and
institutions to reform, and funding availability may result in complications. The applied policy
scenarios would be heavily dependent upon a system where environmental monitoring is
available, and an effective governance system to implement policies is in place. The importance
of strong governance apparatus having already being established by the DVI. However, Varela-
Ortega et al. (2014) suggest that such systems are absent in the region and are likely to act as a
barrier to a sustainable future (Varela-Ortega et al., 2015). Furthermore, these policy scenarios
(especially Conservation of Ecosystem Services) represent a considerable financial cost,

4. DISCUSSION
101
suggesting the necessity of long-term funding to sustain them. However, such funding is
invariably scarce (James et al., 1999; Ferraro and Pattanayak, 2006). Despite recent suggestions
of the availability of unlocked funding resources (World Bank, 2015), there are still disconnects
between funding potential and actual funding (Clark et al., 2018). Domestic policy-makers will
need to be encouraged to release sufficient funds (Sethi et al., 2017), or barriers to private
financing (Clark et al., 2018) will need to be addressed to resolve these financial obstacles.
Further, implementation of these policies may be challenging, especially under increasingly
turbulent political landscapes. Intangible (in the short-term), financially costly, and time
consuming policies, as mentioned earlier, may be once again unpalatable for voter conscious
administrations.
This analysis enlightens the complex and antagonistic environment within which contemporary
policy makers and decision-makers find themselves in agriculture-forest systems. Increasingly
under pressure to balance competing goals, under such precarious circumstances a balance is
often not achieved (Börner et al., 2007; McNeil et al., 2012; Ioris, 2016; Nobre et al., 2016) and
may be unlikely under the current political landscape (Tejada et al., 2016). In consideration of
these circumstances, in situ application of models such as the multi-objective goal programming
model may assist in developing more realistic and viable alternative management solutions, to
avoid such conflict-ridden states. Such application may aid in identifying and developing
common attractive solutions amongst stakeholders and simultaneously formulate a dialogue
amongst stakeholders to find a balance between antagonistic objectives. Dialogue
establishment could also encourage mutually beneficially social learning and trust building
amongst stakeholders (Cáceres et al., 2015). Finally, such dialogue could aid in developing
context specific and tailored policy responses, which according to Pinho et al. (2014) are
necessary to encourage conservation and limit poverty in tropical forest systems.
Although quantifying the exact role of consumption and production changes in driving these
trade-offs may be impossible, global dietary transitions are entrenching environmental
degradation (Godfray et al., 2010; Foley et al., 2011). Greater consumption of animal products
has already been shown to be responsible for increased production of livestock and feed
commodity crops in LAC countries, with subsequent effects on forest area (Aide et al., 2013). In
particular, the production of soya for oil and meal, as a replacement source of protein for global
animal feeds, has become one of the driving forces in global soybean production (Dei, 2011).
During field-work in the Province of Guarayos (Bolivia), recently deforested lands (on non-
subsistence farms) were found in many cases to have been, or in the process of being, converted
to soya production. In the Department of Santa Cruz, soya cultivated area has almost tripled
since the turn of the millennium (with similar patterns seen in Pará, Brazil). Statistics from the
FAO and UN Comtrade highlight that in terms of weight (2.8 MT), more than 20% of Bolivian
soya production in 2013 was exported as raw beans, with a further 50% as soya-cake (UN
Comtrade, 2017; FAO, 2018b). These figures demonstrate the importance of external markets
(de Visser et al., 2014; Zander et al., 2017) and indirectly dietary changes for Bolivian soya
production and consequentially forest area and ES functionality. These patterns are repeated
across much of Latin America, especially in Paraguay, Uruguay, Argentina, and principally Brazil
(UN Comtrade, 2017; FAO, 2018b).

4. DISCUSSION
102
These dietary changes, not only represent a societal challenge (Tilman and Clark, 2014), but also
an environmental hazard (UNEP, 2010). Despite the environmental and health warnings, global
consumption of animal products was found to have increased by 32% since 1961, following
trends identified by Sans and Combris (2015). Increments in consumption of animal products
were especially acute in Asia, where meat consumption increased 6-fold. These findings
reinforce Vranken et al. (2014) who state that as incomes increase, parallel increases in
consumption of meat are observed. In contrast, long-term global consumption of potential meat
replacement options, like legumes, were found to have reduced by 21%. Recent global increases
in per capita consumption of legumes are encouraging, even under the proviso that such
increases are relatively small. Analysis of global production patterns highlight that animal
product production has trebled. These increases are most acute in economically growing
continents and are stabilising in wealthier regions, reflecting Rae and Nayga (2010). Identified
shifts within the composition of global meat consumption from beef to poultry may, according
to Saxe et al. (2013), substantially reduce the environmental impacts of meat consumption.
However, both Audsley et al. (2010) and de Vries and de Boer (2010) dispute this, suggesting
that such shifts could increase demand for land-use. In contrast, production of legume crops has
increased, but at far gentler rates, compared with animal product production. These results
illustrate that globally, consumption patterns appear not to be changing tack, but continue
towards greater consumption of animal products.
Transitions from animal product consumption to legumes or plant-based products are not
currently expected globally, but are more likely in wealthier regions (Vranken et al., 2014).
Across the European Union, aggregated consumption of meat and dairy products were observed
to have stabilised, supporting both de Boer et al. (2006) and Vranken et al. (2014). Despite the
stabilisation, little evidence of consumption transitions towards protein-rich legumes and away
from animal products was identified. In fact, a number of larger, wealthier MS (e.g. Germany
and the UK) increased their per capita consumption of animal products, contrary to expectations
(Vranken et al., 2014). These patterns were also evident in traditional producers and consumers
(Mediterranean MS) of legumes who were all identified to be reducing legume consumption,
but with distinct patterns of production. These results demonstrate the clear need for country
specific policy interventions to address these heterogeneous patterns and governmental
leadership to shift diets away from unhealthy patterns, a point outlined by Wellesley et al.
(2015). Only a handful of EU-28 countries saw consumption of legume crops increase, whilst
simultaneously seeing animal product consumption reduce (e.g. Austria, Czechia, and Hungary).
That so few countries were found to see positive changes would suggest that EU-scale
consumptions transitions remain distant.
Across the EU, dietary land use is now dominated by animal protein production, with demand
from other potential protein sources reducing (Kastner et al., 2012). These findings are reflected
in the results of this investigation, where production of animal products is orders of magnitude
greater than that of legumes in the EU. Production of potential meat replacements like protein-
rich legumes was found to be declining across the EU-28, with few EU MS seeing production
transitions. This observation is concerning considering the negative consequences of continued

4. DISCUSSION
103
animal protein production (Tilman and Clark, 2014; Schader et al., 2015; Erb et al., 2016). In
contrast, production of legumes was observed to fluctuate extensively, with long-term declines
in total production and area dedicated to these crops across the EU. Analysis of the impacts of
the CAP on legume production across the EU is suggestive of specific, rather than general
successes. Unfortunately, these successes were found to be limited and focussed upon certain
leguminous crops (peas). These findings echo Watson et al. (2017) and Zander et al. (2017),
where EU agricultural policies were considered to have had limited effects in encouraging
production of leguminous crops sufficiently to reverse long-term declines.
However, decision-making behind crop cultivation is far more complex than consideration of
agricultural policy and subsidy provision. As noted by stakeholders, a series of barriers may help
to explain why, despite agricultural policy supports, legume production was found to be so
volatile and will need to be addressed by future agricultural policies. Lack of crop knowledge,
lack of production technology, product properties, and farm sizes were identified to inhibit EU
production, with the literature also suggesting farm intensification, abandonment of traditional
agricultural systems, and low prices as important factors in legume production (Voison et al.
2014; Cernay et al., 2015).
The direct outcomes of such barriers may be tangible in the observations made by Magrini et al.
(2016) and supported by this investigation that cultivation of many legumes in EU-28 MS is done
in unsuitable conditions. These observations may also account for the low and unstable yields
identified by both stakeholders and the European Parliament (2013) as barriers to production.
These findings may be the result of the systemic lock-in, where European agriculture has
increasingly favoured cereals over recent decades, to the detriment of other crops (Voisin et al.,
2014; Magrini et al., 2016). The perceived instability of yields may have tainted the image of
legumes to modern European farmers and infers the circular nature of this problem. To address
these issues, the barriers and potential policy lock-ins will need to be recognised and confronted
to free legume production from their current constraints.
Despite these barriers, stakeholders’ suggest various opportunities for encouraging both
production and consumption of these products. The perceived inevitability of dietary changes
towards greater consumption of plant protein-rich products is particularly interesting.
Stakeholders even suggest a self-supporting policy mechanism for encouraging these changes,
through increased awareness campaigns. Keats and Wiggins (2014) already highlight how such
campaigns have been a successful policy mechanism for achieving consumption shifts.
According to the results of the backcasting exercise, to encourage greater production of legumes
in the EU, investments in agricultural research should become a focus of future EU policies.
Research investments could have a liberating effect upon legume production across the EU. Such
a policy is not without precedence within the EU, where focussed research investments were
successful in stimulating pea production (Magrini et al., 2016). The benefits of such a policy could
also address the aforementioed agronomic barriers affecting legumes (e.g. Watson et al., 2017).
Greater research investments in breeding programmes could result in development of more
resistant and higher yielding crop varieties. These investments have also been called for as a
4. DISCUSSION
104
mechanism for ensuring nutrient security from leguminous crops under climate change
(Manners and van Etten, 2018), which is predicted to have a large impact in certain regions of
Europe, as highlighted within this document.
Stakeholder also suggest that EU policy focus should shift towards the completion and support
of supply and value chains for protein-rich crops, like legumes. Magrini et al. (2016) outline the
inhibitory effects of incomplete supply chains for legumes, a point reflected in both phases of
the participatory assessment. Ranganathan et al. (2016) evidence the benefits of complete and
well-resourced value chains, highlighting how investments in livestock value chains contributed
to consumption increases. Stakeholders insist the crucial role of multi-scale governments
(regional-supra national) for this policy strategy. Voisin et al. (2014) demonstrate previous
governmental successes of supply chain supports, through creation of niche markets and
labelling.
A decade after Schneider (2002) posited that a lack of information concerning the benefits of
legumes and a lack of product adaptation to modern consumption patterns may have limited
their production and consumption, De Bakker and Dagevos (2012) reinforced the need for
consumer education concerning the environmental impacts of animal-based products, coupled
with the health and nutritional benefits of plant-based products. Awareness of animal products’
environmental impacts has been repeatedly found to be low among western consumers (Lentz
et al., 2018). According to stakeholders, this lack of information continues to affect EU
consumers. Ritchie et al. (2018) state that without movement in consumer attitudes concerning
animal-based products, consumption shifts are unlikely. Stakeholders noted and addressed
these concerns, stating that to reduce animal product consumption, increase animal
replacement products’ acceptance, and shift towards greater legume consumption would
require EU-scale improvements in consumer education and information availability. Although
stakeholders consider that improved consumer awareness of the benefits of plant-protein and
legume consumption as an opportunity, the EU and individual MS should consider educational
policies as a conduit for encouraging consumption changes and take advantage of this perceived
opportunity. Governments have historically had policy successes in encouraging and promoting
consumption shifts through educational activities (Keats and Wiggins, 2014). Wellesley et al.
(2015) establish that the general public expect governmental leadership to reduce the
consumption of unhealthy products. Stakeholders suggest that marketing campaigns, which
follow information and education campaigns, coupled with improved labelling and exposure to
novel products, could assist in shifting consumer perceptions and increase awareness of the
environmental and health impacts of animal products.
Increases in public supports and implementation of taxes is the final strategy suggested. To
increase production, stakeholders noted that national or supra-national agricultural policy
supports were required. Such a policy is not without precedence within the EU, where focussed
research investments were highly successful in stimulating pea production (Magrini et al., 2016).
Stakeholders reinforce the continued need of these supports for encouraging EU production of
legumes. Stakeholders also stressed the need for taxation upon non-EU produced protein-rich
crops, like soya, supporting calls from Zander et al. (2017). Stakeholders also stated the need for
4. DISCUSSION
105
protective taxes to encourage use of local raw protein-rich materials in plant-based products.
However, such protectionist taxation could have international trade implications, considering
the EU’s global trade agreements. Stakeholders summarised that application of taxes on animal-
based products could also be used to reduce consumption. This echoes calls from the literature
for such measures (Springmann et al., 2017; Poore and Nemecek, 2018). Nordgren (2011) argues
the wide-ranging benefits of taxing meat consumption, with Springmann et al. (2017) noting the
benefits of carbon intensity related taxation, coupled with subsidies for food groups with
positive health and environmental impacts. Saxe et al. (2013) however caution the likely
political, industrial, and social opposition to such a strategy.
The above strategy, along with that for increased research funding would, according to
stakeholders, hinge upon the development of a plant-protein lobby. This action was recurrent
across the backcasts, indicating its robustness and necessity. The development of such a lobby
could provide an immediate counter-point to the perceived power of the meat and dairy lobbies.
Although these strategies have been defined individually, it is evident that their application in
the real-world could not be mutually exclusive, being in many cases interdependent. For
example, lobbying for greater supports for legumes and increased investment in research may
be far more successful with greater citizen awareness and interest in their benefits. Improved
consumer education would also encourage the completion of the supply chains, as farmers and
companies would recognise the benefits of following consumer demands. Proposed policy
suggestions could be considered individually or as part of a supra-pathway, taking advantage of
their interconnectedness (as perceived and demonstrated by stakeholders in the backcasts), to
encourage a series a virtuous circles towards more desirable futures.
The implementation of this combined approach has allowed for an improved understanding of
historical trends, current barriers and opportunities, and potential pathways to the future for
consumption and production of animal products and legumes at multiple scales. The inclusion
of stakeholder knowledge within this original approach allowed for the incorporation of distinct
interpretations of this of such a complex problem. de Bakker and Dagevos (2010) stress the
importance of such knowledge when analysing societal scale problems such a consumption
changes. Furthermore, inclusion of diverse and stakeholder based knowledge backgrounds may
have aided in the development of strategies that may be more societally suitable and acceptable
(van de Kerkhof, 2006). The application of the backcasting approach was highly beneficial in the
development of this strategies, as it helped to remove the restrictions normally associated with
analyses of the future (van Vliet. 2011). It also allowed stakeholders to envision how
contemporary production and consumption patterns can be altered in a step-wise fashion to
achieve a more desirable future outcome through strategy development.
The potential of these, or any strategies for encouraging protein-rich crop production, to reduce
EU protein deficits and increase consumption of animal product replacement products would
have to be considerate of other major future global changes like climate change. Curiously, as
part of the backcasting assessment stakeholders neither defined climate change as a barrier nor
an opportunity when developing strategies. However, understanding how current crop
4. DISCUSSION
106
distributions are correlated with climate and how climatic changes might affect future
distributions are important sources of uncertainty for any potential production strategy.
Addressing this uncertainty may assist in developing more climate resistant planning strategies
that can support dietary and production transitions.
The results from the current crop distributions demonstrate that climatic suitability presents a
limiting factor for contemporary distributions of protein-rich crops across the EU. The results
also establish that in many regions of the EU protein-rich crops are not included in crop
portfolios, despite high suitability. This infers the impacts of competition in productive
environments for protein-rich crops. In the case of EU production of soybean, high suitability
across much of southern Europe was not found to be associated with large areas of production.
In many cases, common pea was found to be produced in these regions, despite identical
suitability. These points may suggest the influence of other, non-climatic, drivers in crop choice
in these regions. The benefits of identifying this protein-rich crop competition and the diversity
of cropping options may be increasingly important as climates increasingly change. Informed
farmers could use this information to shift cropping choices to protein-rich crops better adapted
to new climatic conditions (Seo and Mendelsohn, 2008).
Encouragingly, climate change was found to represent an opportunity for many protein-rich
crops. This potential is especially acute outside of current distribution patterns, supporting
Stoddard et al. (2009). The outputs of this modelling mirror Iglesias et al. (2012) and Zabel et al.
(2014) and the divergent effects of climate change on European agriculture. Northern Europe
saw suitability increases, and in southern Europe culturally important species saw suitability
reduce, consistent with previous studies (FAO, 2012; Valverde et al., 2015; Ramirez-Cabral et al.,
2016). Salon et al. (2011) found that cool-season legume species (faba bean, lentil, lupins, pea,
and chickpea) are particularly sensitive to abiotic stresses, compared to warm season (pigeon-
pea, cowpea, and soybean). These findings are evident in the modelling, with faba-bean, lentil,
lupins, and pea suitability declining in southern regions and increasing in northern parts of
Europe. In particular, common bean and chickpea were found to see the greatest suitability
declines in southerly regions. These results are suggestive of the need for increased research
and breeding activities to address the stress related sensitivity of these crops (Zurita-Silva et al.,
2014; Araújo et al., 2015; Santra and Schoenlechner, 2017). The outputs of this modelling stress
the urgency of these activities especially across southern Europe. However, this call comes
within the context of findings from Kwak and Gepts (2009) and Berger et al. (2012) who highlight
that some cultivated protein-rich species exhibit limited genetic diversity and require breeding
with wild relatives to improve tolerances.
Stoddard et al. (2009) and Daryanto et al. (2017) both suggest that limited breeding activities,
coupled with a lack of investment have driven higher abiotic stress sensitivity and subsequent
yield problems for legumes, compared to cereals. Schreuder and De Visser (2014) propose that
the small EU market for many legumes, for example, may be behind a historical lack of
investment, resulting in limited commercial breeding activities, supported by the observations
of stakeholders. As mentioned previously, Voisin et al. (2014) and Magrini et al. (2016) posit that
a systemic ‘lock-in’ has developed, favouring cereals whilst side-lining grain legumes. These
4. DISCUSSION
107
systemic problems need addressing for not only traditional EU protein-rich crops, but potentially
also for novel crops. The modelling demonstrates the striking potential of quinoa and certain
lupin species in many regions of the EU. Research attention should be dedicated to these crops
to take advantage of their modelled potential. These crops in tandem with more resilient
traditional crops may represent robust, protein-rich meat replacement cropping options for
future European agricultural systems, reinforcing previous findings (Ruiz et al., 2014; Lucas et
al., 2015).
The findings of this modelling represent the first-step in informing policies to promote protein-
rich crops as replacements of animal products in diets and to enable internal food security of
EU-based protein production. Geographically differentiated planning, research, and breeding
strategies could assist in taking advantage of the positive changes to suitability in northern
Europe, while addressing the reductions in southern Europe before they become too extreme.
Strategies to achieve these aims could follow those outlined previously. Shifts in agricultural
research and development investments towards crops that are likely to be less vulnerable to
climate change in given areas could become a priority, following suggestions by Manners and
van Etten (2018). Magrini et al. (2016) highlights the historical precedence in research shifts and
their success in improving protein-rich crop production in Europe. Increased research could also
take advantage of the largely untapped capacity of many protein rich species for adaptation to
more stress tolerant forms due to their considerable land-race genetic diversity (Coba de la Peña
and Pueyo, 2012; Rastogi and Shukla, 2013; Daryanto et al., 2015). The benefits of increased
focussed breeding programmes could be used to address the modelled distribution shifts from
this investigation by focussing on identified constraints that may be faced. The long-term
benefits from focussing on breeding, may assist in developing more resistant varieties, with
subsequent long-term benefits (Cowling et al., 2017; Considine et al., 2017). The projected long-
term high prices of plant-proteins (Pilorge and Muel, 2016) and recent expansions in European
cultivation (Watson et al., 2017) are likely to make such strategies economically and politically
attractive. Further strategies could follow those developed by stakeholders and suggested by
the literature including: knowledge and physical infrastructure development (Schreuder and De
Visser, 2014), and educational activities (Magrini et al., 2016) to encourage not only production
but also consumption, coupled with financial support mechanism (Cullis and Kunert, 2017).
Finally, consideration should also be made of the cultural potential of these crops. The findings
stemming from the backcasting exercise infer a currently limited social capacity for wide-scale
consumption and production increases of protein-rich crops. The benefits of crop shifting
encouraged by climate change, or novel crop introductions, would be lost if there was limited
capacity to process, market, or consume them. Therefore, it seems evident that introduction of
plant-based meat replacement products would be entirely reliant upon responsive supply and
value chains, which according to stakeholders are largely absent in much of the EU. Lucas et al.
(2015) recently found that there are sizable issues concerning supply chains. These problems
would need to be addressed, with Magrini et al. (2016) identifying the need for downstream
industry development to counter these problems. To address this, Manners and van Etten
(2018) outline that agricultural research and development investments could be increasingly
4. DISCUSSION
108
moved away from solely focussing upon production, and increasingly shifted towards supply
chain development, marketing, and education.

5. CONCLUSIONS
109
5. CONCLUSIONS This research has combined index development, mathematical goal programming, trend
analysis, participatory assessments, and crop suitability modelling to gain a unique perspective
of the socio-economic processes behind land-use changes and potential opportunities for
addressing these processes in the future. The findings stemming from this investigation offer a
series of outputs that can contribute to improving the knowledge base of the interactions of
these processes to better inform future decision-making. In particular, to improve sustainable
management of forests, reduce the extent of trade-offs in agriculture-forest systems, outline
options for reducing external socio-economic pressures upon forests, and derive potential policy
options for achieving the aforementioned. The most relevant of these outputs and
contributions, along with the potential of the methodologies applied, their utility to policy-
making, and decision-making are outlined below.
5.1 General findings and research contributions 1. The diversity, interconnectedness, and multi-scalar nature of the socio-economic processes
associated with deforestation across Latin America highlights the complex nature of
deforestation and the difficulty accompanying its analysis from a socio-economic perspective.
Despite this, the analysis did suggest the opportunity for aggregation of such factors, to quantify
how the amalgamation of these processes in a particular country (or state) may implicitly define
the vulnerability of forests to deforestation. Investigation of previous analyses of forest
vulnerability emphasised the limited focus on socio-economic vulnerability, in favour of
environmental vulnerability. This presented an opportunity to redress this gap in the research
with the development of a metric for quantifying (spatially and temporally) forest vulnerability
from socio-economic factors and processes.
The Deforestation Vulnerability Index showed small, but widespread reductions in vulnerability
across Latin American and Caribbean countries over recent years, with heterogeneity in
vulnerability seen at various scales of application. The index established that improvements in
governance and reductions in the scale of agricultural expansion were responsible for
reductions. Despite recent improvements in governance across many Amazonian countries the
subsequent reduction in vulnerability, implementation of further and more widespread
governance reforms, to solidify forest conservation, may be challenging, especially under
increasingly turbulent political landscapes. The benefits of institutional reforms may only be
reaped in the long-term, by which time governments may have changed and the benefits of
change lost for the implementing administration. The potential existence of a lag between socio-
economic improvements, demonstrated by reduced vulnerability, and subsequent reduced
deforestation may help to explain why deforestation continues, albeit in declining rates, in
countries with reducing vulnerability.
The DVI offers a simple and effective tool for providing easily digested information on spatial
and temporal vulnerability trends. The DVI can be used as an aid for policy makers, forest
managers, and stakeholders to identify and address the source(s) of forest vulnerability at
5. CONCLUSIONS
110
various scales. The DVI can also be used in conjunction with other tools/ indices to develop a
meta-indice, in turn generating a more refined perspective of forest vulnerability, which could
aid in their management and conservation. The index can also be used to direct reactive and
responsive sustainable forest management strategies tailored to and considerate of socio-
economic vulnerabilities.
2. The novel application of goal programming for the Province of Guarayos (Bolivia),
demonstrated the presence of ES trade-offs, which have been widely recorded in other regions
of LAC under similar development and agricultural conditions. This model highlighted the
antagonistic relationship between achievement of maximising farm income and farm
sequestration simultaneously. The model also demonstrated the overt influence of decision-
making on these relationships. This modelling was also able to develop and characterise
potential management option spaces for different characteristic farm types within the province.
Focussing management preferences towards more balanced strategies may provide the most
acceptable and achievable management strategy, offering potentially acceptable solutions for
income and conservation for the future. The solutions could be implemented to reduce
antagonism between farm based agricultural income (and subsequent socio-economic
development) and natural resource conservation (through protection of carbon sequestration
sinks).
Goal programming also provided further contributions through the demonstration of the
potential efficacy of two opposing policy scenarios to reduce the negative impacts of these ES
trade-offs. Policy measures addressing this antagonism and the influence of management
preferences were found to be effective under extreme management preferences, improving
both net farm income and net farm carbon sequestration under certain circumstances, with a
policy directed at ecosystem service conservation especially effective at improving both farm-
scale income and carbon sequestration. However, governance, financial, and political barriers
will need to be further explored as they will likely inhibit the potential of any particular policy to
inhibit the extent of these antagonistic relationships between these goals at local scales. A
conclusion evident from the DVI, with governance being a fundamental pivot between high and
low vulnerability.
Beyond this, this modelling has contributed in its demonstration of the highly complex and
antagonistic environment within which contemporary policy makers and decision-makers find
themselves in rural regions of Bolivia. These individuals are charged with encouraging rural
socio-economic development and simultaneously conserving natural resources, but are
constrained by governance and financial limitations. The outcomes of this research suggest that
a balance between these goals is often impossible and results in evident losses in forest area
and increases in forest vulnerability. In consideration of these circumstances, in situ application
of models such as the multi-objective goal programming model may assist in developing more
realistic and viable alternative management solutions, to avoid such conflictive states.
Application may aid in identifying and developing common attractive solutions amongst
stakeholders, whilst formulating a stakeholder dialogue to find a balance between antagonistic
objectives. Dialogue establishment could also encourage mutually beneficially social learning
5. CONCLUSIONS
111
and trust building amongst stakeholders. Dialogue could aid in developing context specific and
tailored policy responses, necessary to encourage conservation and limit poverty in tropical
forest systems.
3. This research demonstrates that global and continental dietary patterns continue to shift
towards greater animal product consumption and production, and increasingly away from
consumption of legumes. Despite the environmental and health impacts of animal product
consumption, global diets continue to shift towards ever greater reliance upon these products.
The implications of these patterns may be stark for future environmental protection, considering
the demand for feed products, with forest areas increasingly sacrificed to satiate this demand.
Increased consumption and production of these products, contrary to theorised patterns,
continues even in wealthier regions of the world. Across the EU-28, some of the wealthiest
countries were those found to be increasing consumption of animal products at the greatest
rates. Further, few countries were found to reduce animal product consumption, whilst
simultaneously increasing consumption of potential legumes that could potential replace animal
proteins. The arguments for the benefits of these consumption shifts, according to this thesis,
remain unheeded across much of the EU. This suggests the need for interventions to encourage
change.
Stakeholder interactions highlighted an array of barriers and opportunities for consumption and
production of legumes across the EU. Implementation of participatory backcasting derived four
innovative potential strategies, which working back from a positive future, could form the basis
of future (2030) transitions in EU plant-protein production and consumption. These strategies
revolved around increased funding for research into protein-rich crops, development and
support of local supply chains, consumer education and awareness building, and policy supports.
The development of a plant-protein lobby was noted to be key for many strategies.
4. This study represents the first European-scale analysis of the impacts of climate change on
many protein-rich crops. The results suggest that current protein-rich crop distributions reflect
climatic suitability and suggest widespread under-utilisation and latent potential of many crops
across much of the European Union. The results further outline the heterogeneous impacts of
climate change upon crop suitability, with northern Europe in general favoured under the
conditions of future climates. Non-traditional crops including quinoa and lupin species may
present robust crop options under future climates, with traditional crops like chickpea and lentil
found to be more sensitive to climatic changes across southern Europe and will likely need to
shift northwards.
These findings represent the first-step in informing policies to promote protein-rich crops as
replacements of animal products in human diets, whilst enabling internal food security of EU-
based protein production. Geographically differentiated planning, research, and breeding
strategies could be implemented to take advantage of the positive changes to suitability in
northern Europe, whilst addressing the reductions in southern Europe before they become too
extreme. Strategies could focus upon shifts in agricultural research and development
5. CONCLUSIONS
112
investments, knowledge and physical infrastructure development, and educational activities to
encourage not only production but also consumption, coupled with financial support
mechanism.
5.2 Conclusions on the methodological approach
This research has explored and established the benefits of a novel methodological approach for
analysing land-use changes at multiple scales and for parsing out the interactions between these
changes and socio-economic processes, as well the role of decision-making in many of these
processes. The selection and combination of previously applied methodologies in an innovative
manner has provided an enhanced understanding of food production, rural livelihoods, and
ecosystem conservation at multiple scales.
The robustness of the multi-scale analysis has also been evidenced through its capacity to
incorporate local actors and stakeholders in the research process. The outputs derived from
these interactions undoubtedly enhance the findings and aid in legitimising derived policy
actions and strategies. Inclusion of stakeholders and the application of approaches that can
incorporate them highlight the clear benefits of such analyses when approaching complex
process such as land use change.
The relative simplicity of the approaches applied, strengthened by their combination, and their
capacity for spatial and temporal expansion outlines the opportunity for transferring and
expanding the scope of the analyses performed either individually, or as a whole, when further
data or needs arise. The application of this novel methodology has allowed for the identification,
testing, and characterisation of potential policy options for the future to address the
investigated processes that have implications for land-use changes, as well as for food
production, rural livelihoods, and ecosystem conservation. This demonstrates one of the clear
benefits of this approach with its capacity to outline policy option spaces that can be used to
guide future decision-making in the realm of environmental, agricultural, and rural development
policies.
The investigation applied a standardised approach for index development to formulate a
composite index of forest vulnerability in Latin America and Caribbean countries. This permitted
not only the development of an original metric for quantification of forest vulnerability to socio-
economic factors, but included the perspectives of stakeholders and experts in its development.
The inclusion of diverse perspectives of forest vulnerability emphasised the differences in
opinion concerning the importance of the socio-economic processes driving deforestation,
which can be highly dependent upon scale and location. The flexibility of the composite index
development was further emphasised through its capacity for quantifying vulnerability at
multiple scales. This capacity highlighted the presence of heterogeneity in vulnerability at
different scales. The simplicity of this methodology, as well as its flexibility, allows for future
inclusion of further variables, new temporal data, and spatial expansion. This flexibility is
conducive to providing a more globalised perspective of the vulnerability of forests to socio-
economic processes and to deforestation.
5. CONCLUSIONS
113
The multi-scale application of this index helped to identify sub-national regions with elevated
vulnerability. To explore the role of decision-making at more localised scales in one of these
examples, multi-objective goal programming was implemented. It was applied to model how
differential decision-making outcomes can influence two highly antagonistic goals in agriculture-
forest systems. Goal programming emphasised these conflicts, in particular their impacts on
ecosystem services. The strength of this approach also permitted the application of policy
scenarios to address and improve the identified antagonistic situation. Application of goal
programming reinforced its utility for analyses of ecosystem services, its ability to simulate
decision-making without direct input from such actors, whilst also providing potential
management solutions. This capacity for outlining the option space for management solutions
and how this changes under the conditions of distinct policy scenarios, demonstrates the utility
of this methodology for use by policy-makers. The methodology applied also lends itself for
future in-situ application and spatial expansion of application to gather a more detailed and
comparative perspective of the local scale impacts across regions of high deforestation
vulnerability.
The combination of trend analyses and participatory assessments allowed for the examination
of historical trends, current barriers and opportunities, and future strategies to increase EU
plant-protein consumption and production. Stakeholder involvement permitted the inclusion of
knowledge from distinct groups, offering novel stakeholder based solutions to address such
complex societal problem. Implementation of the backcasting methodology provided an image
of a normative future, but also allowed stakeholders to envision how contemporary production
and consumption patterns can be altered in a step-wise fashion. It also provided participants
with a methodology that removes the restrictions normally associated with analyses of the
future, permitting greater creativity in the development of potential strategies. Furthermore,
participatory approaches offered an interactive platform for engaging stakeholders, allowing for
social learning, consensus building, and providing greater legitimisation of the strategies
developed due to the diversity of stakeholders involved.
To address how potential animal replacement products, like protein-rich crops, will respond to
future climate change across the European Union, the application of the crop suitability
modelling demonstrated its efficacy in providing national scale impacts for these crops across
all European Union MS. The implemented model provided a highly resolved (4 km2) analysis of
potential future protein-rich crop portfolios suitable for all arable regions of the EU. This highly
detailed information represents a step forward in the analysis of climate change impacts in the
EU for these generally under researched, but potentially important crops. The benefits of this
approach are reinforced by its demonstrated capacity to include other physical attributes within
the model (e.g. pH), providing increasingly more reliable outputs of crop suitability and the
potential impacts of climate change. This model can be applied, currently, to identify the impacts
of climate change and suggest crop portfolios at the landscape-scale. In the future, when more
resolved climate data becomes available, these results could be further refined to the farm-
scale. The provision of such highly resolved information for farmers and policy makers could
5. CONCLUSIONS
114
have considerable utility in assisting decision-making and agricultural policy-making, as well as
for encouraging research efforts over the coming years.
In conclusion, the application of this methodology has allowed this research to achieve its 6
primary objectives. It has, through the development of the DVI been able to quantify how
changes in socio-economic conditions can have notable effects upon forest vulnerability, it also
demonstrated how these conditions at different scales can have dramatically different effects
upon vulnerability. The investigation has also been able to identify the farm-scale ES trade-offs
present in regions of high deforestation vulnerability, with the explicit role and impacts of
decision-making on these trade-offs quantified. This thesis also successfully evaluated and
updated global, continental, and EU Member States trends in animal product and legume
consumption and production. It has also identified barriers and opportunities to consumption
and production of plant proteins in the EU, and presented a series of strategies that could form
the basis of future transitions towards greater replacement of animal products by legumes and
protein-rich crops in future consumption and production landscapes. Finally, this investigation
has successfully modelled how such protein-rich crops may be influenced by future climate
change across the European Union. From this, the analysis has been able to outline a series of
policy suggestions that could be implemented to address these issues.
5.3 Limitations and Further Research
Limitations In the development of any composite index, such as the DVI, there are always associated
problems with treating countries as uniform. The comparison between Chile (a developed and
mature economy) and Suriname (a relatively undeveloped and growing economy) is a
recognised limitation when considering the socio-economic drivers of deforestation in each
country. In the quantification of vulnerability in each country, the omission of indicators which
have been previously correlated with deforestation due to: a lack extensive data (e.g. land
tenure), them falling outside of the scope of the analysis (e.g. physical characteristics like slope
and aspect), or them not being identified also represents a limitation of the outputs of the DVI.
Also, the use of generic weighting for indicators across all countries may severely limit the ability
of the DVI to fully unpick national and state differences in vulnerability.
The assumptions made in applying the multi-objective goal programming model may be, as with
any model, unrealistic in terms of their representation of reality. As part of the goal
programming model, farmers were assumed to adhere to legal levels of deforestation. Under
present environmental monitoring and political conditions in the region, this is unlikely.
Furthermore, the static nature of this model did not allow for the inclusion and analysis of the
impacts of market and climate signals. Consideration of such signals may have demonstrated
how climate and market changes may drive changes to crop portfolios and the subsequent
impacts upon the established trade-off relationship. The assumption that farmers will continue
maximising profits following the same crop portfolios is likely misplaced. Under such
5. CONCLUSIONS
115
circumstances farmers are likely to change crops, introduce new profitable crops, or adopt new
management techniques as a means of adaptation to localised climatic changes. The model
provides a static snapshot of the antagonistic conditions in the region and the role of decision-
making and policy application in driving these conditions. That the model was static may have
also have resulted in too much weight having been given to limiting emissions. In the model,
hypothetical decision-makers may only consider the immediate impacts on sequestration,
without consideration of the long-term financial benefits of deforesting. This in turn may reduce
the likelihood of short-termism, where a decision-maker only considers the immediate
profitability of reducing sequestration (via deforestation), without considering the potential
long-term costs. Therefore, to improve the accuracy and realism of this model it would be
beneficial to further develop it, as a dynamic model, offering the opportunity for year on year
developments.
The data used for the trend analysis of consumption changes also represents a limitation, mainly
concerning the availability and how representative the data are. Under ideal conditions, the
development of this trend analysis would have been developed using national food
consumption surveys for all analysed countries, across multiple years. The data derived from
such surveys would provide reliable and accurate consumption data with which to make detailed
analyses and refined conclusions. However, the lack of concrete and standardised
methodologies for such surveys, coupled with the limited spatial and temporal coverage due to
the associated costs of representative surveys often limits their application and in turn their
utility for international multi-year comparative analyses. In response to the scarcity and paucity
of representative national and continental scale household survey data, publicly available
databanks are the only source of consistent data. The use of open access databanks, are also
problematic, in terms of their potential overestimation of consumption and their lack of
disaggregated data. Further limitations associated with this analysis are that protein
consumption transitions are framed as being from animal products, to legumes. The sources of
most non-animal dietary proteins are invariably from cereals. These were purposely excluded to
shed a light on legume trends, which could have been shadowed had cereal data been included.
In their current format, the strategies to increase consumption and production of legumes lack
detail, with vague milestones and actions outlined. Repetition of the exercise, over an extended
workshop(s), allowing for greater detail and validation of results would strengthen the relevance
and robustness of these and future results. Further, the outputs of backcasting are normative
and therefore could benefit from combination with other analyses to combine the “…what
should happen…” questions of backcasting, to “…what will/could happen…” of other scenario
based methods. More generally, stakeholder based approaches, such as backcasting, and
ensuing outputs can be inhibited by unrepresentative stakeholders, stakeholder frustration,
identification of new conflicts, and further empowerment of important stakeholders to name a
few. Consideration of the representative nature of stakeholders is an important factor and may
severely limit the validity of any outputs or conclusions drawn from such methodologies.
The biophysical crop-modelling performed is also not without limitations. The limitation of
EcoCrop analyses are well recognised. The reliance of the model upon monthly data may mask
5. CONCLUSIONS
116
high-stress, shorter extreme conditions. This may manifest itself in failure to account for impacts
of extreme weather conditions during important physiological steps (flowering and fruiting).
This may infer the inability of the model to fully capture all interactions between climatic
conditions and physiological development. The implications of this may be that results over-
estimate suitability. Furthermore, the parameterisation of the model is based upon the use of
ecological niches defined by experts and the literature. These parameters remain to be fully
validated. That this study does not perform a detailed calibration of the EcoCrop model for each
crop and their parameters is a further limitation. Finally, the outputs from this model are unable
to offer indications of any relationship between yields and suitability. This makes cross
referencing the results from this analysis to other models and studies, using yield as their
reference point, difficult.
Further Research
The DVI should be applied globally. This expansion could help to clarify whether the
identified trends in LAC are continentally specific, or are indicative of global vulnerability
trends. Furthermore, such expansion could help to highlight whether vulnerability
indicators are globally consistent in terms of their importance.
The DVI should be continually updated with new data and indicators, when they become
available and are identified. This could reduce the potential effects of the indicators
omitted (as noted above). The index could also be tested through the development of
country specific weighting schemes, which would require country based stakeholder
interactions to develop weights.
The trade-off analysis should be further developed in situ with decision-makers to
formulate their own satisficing values and goal preference weighting. This development
would provide more realistic and viable alternative management solutions. These
advances could also assist in formulating a stakeholder dialogue to find a balance
between the two antagonistic development goals.
The goal programming model could be expanded to become a dynamic (multi-year)
model. This expansion could not only address the aforementioned limitations, but could
also allow for the inclusion of the impacts of climate change. Development of such a
model and inclusion of climate effects would offer a more realistic interpretation of
trade-offs and the role of decision-making.
The trend analyses should be expanded to include cereals and other non-animal based
protein sources. Inclusion of these data would allow for a more reliable and refined
analysis of whether animal-plant protein transitions are evident.
The analysis of national consumption and production spatial patterns could be extended
globally. This analysis could be used to contextualise the European Union scale results
and may demonstrate whether EU Member States are outliers or the rule in terms of
5. CONCLUSIONS
117
richer regions largely failing to enter the proposed transition towards less consumption
of animal products.
Further and more extended backcasting based workshops should be developed to
provide greater detail and validation of initial results, while strengthening their
relevance and robustness. This workshop(s) could provide more detailed information
concerning timelines, actions, and milestones for the transitional pathways from a more
diverse group of stakeholders and representation of Member States.
The EcoCrop model should be calibrated against genebank accession coordinates to
provide a more resolved understanding of the impacts of climate change in Europe.
Expert validation of the ecological niche parameters for each crop should also be
considered to further improve the reliability of the model outputs. Expert-based
validation could also be used to define ranges for parameters not currently included in
the model (i.e. soil fertility), further refining the suitability outputs. Experts could also
be used to define parameter ranges for neglected and under-utilised species, not
currently present within the EcoCrop database.
Another logical next step for the model is to expand it spatially (globally) and temporally
(2070s), whilst also comparing outputs across various representative concentration
pathways (RCPs) to provide a range of potential outcomes.

6. REFERENCES
118
6. REFERENCES
Achard, F., Eva, H.D., Stibig, H-J., Mayaux, P., Gallego, J., Richards, T. and Malingreau, J-P. (2002)
Determination of Deforestation Rates of the World´s Humid Tropical Forests. Science. 297:999-1002.
Achard, F., Beuchle, R. Mayaux, P., Stibig, H-S., Bodart, C., Brink, A., Carboni, S., Desclée, D., Donnay, F.,
Eva, H.D., Lupi, A., Ras, R., Seliger, R. and Simonetti, D. (2014) Determination of tropical deforestation
rates related to carbon losses from 1990 to 2010. Global Change Biology. 20:2540-2554. Doi:
10.1111/gcb12605
Achyar, E., Schmidt-Vogt, D. and Shivakoti, G.P. (2015) Dynamics of the multi-stakeholder forum and its
effectiveness in promoting forest fire management practices in South Sumatra, Indonesia. Envrionmental
Development. 13:4-17. Doi:10.1016/j.envdev.2014.011.002
Aide, T.M., Clark, M.L., Grau, H.R., López-Carr, D., Levy, M.A., Redo, D., Bonilla-Moheno, M., Riner, G.,
Andrade-Núñez, M.J. and Muñiz, M. (2013) Deforestation and Reforestation of Latin America and the
Caribbean (2001-2010). Biotropica. 45:262-271. Doi:10.1111/j.1744-7429.2012.00908.x
Aldea, J., Martínez-Peña, F., Romero, C. and Diaz-Balteiro, L. (2014) Participatory Goal Programming in
Forest Management: An Application Integrating Several Ecosystem Services. Forests. 5:3352-3371.
Doi:10.3390/f5123352
Alexander, A.P., Rounsevell, M.D.A., Dislich, D., Dodson, J.R., Engström, K. and Moran, D. (2015) Drivers
for global agricultural land use change: The nexus of diet, population, yield and bioenergy. Global
Environmental Change. 35:138-147. Doi: 10.1016/j.gloenvcha.2015.08.011
Alexandratos, N. and Bruinsma, J. (2012) World Agriculture Towards 2030/2050: The 2012 Revision, ESA
Working Paper. Agricultural Development Economics Division, FAO.
Alix-García, J. (2007) A spatial analysis of common property deforestation. Journal of Environmental
Economics and Management. 53:141-157. Doi:10.1016/j.jeem.2006.09.004
Allen, C.D., Breshears, D.D. and McDowell, N.G. (2015) On underestimation of global vulnerability to tree
mortality and forest die-off from hotter drought in the Anthropocene. Ecosphere. 6:129.
Doi:10.1890/ES15-00203.1
Allais, O., Bertail, P. and Nichéle, V. (2010) The Effects of a Fat Tax on French Households’ Purchases: A
Nutritional Approach. American Journal of Agricultural Economics. 92: 228-245. Doi:10.1093/ajae/aap004
Amacher, G.S., Merry, F.D. and Bowman, M.S. (2009) Smallholder timber sale decisions on the Amazon
frontier. Ecological Economics. 68:1787-1796. Doi:10.1016/j.ecolecon.2008.11.018
Amalina, P., Prasetyo, L.B. and Rushayati, S.B. (2016) Forest Fire Vulnerability Mapping Way Kambas
National Park. Procedia Environmental Sciences. 33:239-252. Doi:10.1016/j.proenv.2016.03.075
Angelsen A. (2007) Forest cover change in space and time: Combining the von Thunen and forest
transition theories. Policy, Research working paper; no. WPS 4117. World Bank, Washington, DC
Angelsen, A., P. Jagger, R. Babigumira, B. Belcher, N.J. Hogarth, S. Bauch, J. Börner and C. Smith-Hall.
(2014) Environmental Income and Rural Livelihoods: A global Comparative Analysis. World Development.
64: S12-S28. Doi:10.1016/j.worlddev.2014.03.006.
Angelsen, A. and Kaimowitz, D. (1999) Rethinking the Causes of Deforestation: Lessons from Economic
Models. The World Bank Research Observer. 14:73-98.
Aragao, L.E.O.C. (2012) The rainforest’s water pump. Nature. 489:217-218.
6. REFERENCES
119
Araújo, S.S., Beebe, S., Crespi, M., Delbreil, B., González, E.M., Gruber, V., Lejeune-Henaut, I., Link, W.,
Monteros, M.J., Prats E, Rao I, Vadez V, Vaz Patto MC (2015) Abiotic Stress Responses in Legumes:
Strategies Used to Cope with Environmental Challenges. Critical Review in Plant Sciences.i 34:237-280.
Doi: 10.1080/07352689.2014.898450
Arima, E.Y., Richards, P., Walker, R. and Caldas, M.M. (2011) Statistical confirmation of indirect land use
change in the Brazilian Amazon. Environmental Research Letters. 6:024010. Doi:10.1088/1748-
9326/6/2/024010
Armenteras, D., Rudas, G., Rodriguez, N., Sua, S. and Romero, M. (2006) Patterns and causes of
deforestation in the Colombian Amazon. Ecological Indicators. 6:353-368.
Doi:10.1016/j.ecolind.2005.03.014
Asner, G.P., Llactayo, W., Tupayachi, R. and Ráez-Luna, E. (2013) Elevated rates of gold mining in the
Amazon revealed through high-resolution monitoring. Proceedings of the National Academy of Sciences.
110:18454-18459. Doi:10.1073/pnas.1318271110
Audsley, E., Angus, A., Chatterton, J., Graves, A., Morris, J., Murphy-Bokern, D., Pearn, K., Sandars, D. and
Williams, A. (2010) Food, land and greenhouse gases. The effect of changes in UK food consumption on
land requirements and greenhouse gas emissions. Report for The Committee on Climate Change.
Cranfield University, UK.
Autoridad de Fiscalizacion y Control Social de Bosques y Tierra [ABT]. (2017) Forestales sacan la madera
de 10 nuevas especies. Available at:
http://www.abt.gob.bo/index.php?option=com_content&view=article&id=1158:forestales-sacan-la-
madera-de-10-nuevas-especies&catid=8:noticias&Itemid=211&lang=es. Last accessed 27th March 2018.
Baccini, A., Goetz, S.J., Walker, W.S., Laporte, N.T., Sun, M., Sulla-Menashe, D., Hackler, J., Beck, P.S.A.,
Dubayah, R., Friedl, M.A., Samanta, S. and Houghton, R.A. (2012) Estimated carbon dioxide emissions from
tropical deforestation improved by carbon-density maps. Nature Climate Change. 1354:1-4. Doi:
10.1038/nclimate1354
Baccini, A., Walker, W., Carvalho, L., Farina, M., Sulla-Menashe, D. and Houghton, R.A. (2017) Tropical
forests are a net carbon source based on above ground measurements of gain and loss. Science. 358:230-
234. Doi: 10.1126/science.aam5962
Bailey, R., Froggatt, A. and Wellesley, L. (2014) Livestock – Climate Change’s Forgotten Sector Global Public
Opinion on Meat and Dairy Consumption. Chatham House Report.
Balvanera, P., M. Uriarte, L. Almeida-Leñero, A. Altesor, F. DeClerck, T. Gardner, J. Hall, A. Lara, P. Laterra,
M. Peña-Claros, D.M. Silva Matos, A.L. Vogl, L.P. Romero-Duque, L.F. Arreola, A.P. Caro-Borrero, F.
Gallego, M. Jain, C. Little, R. Xavier, J.M. Paruelo, J. Emilio-Peinado, L. Poorter, N. Ascarrunz, F. Correa,
M.B. Cunha-Santino, A.P. Hernández-Sánchez and M. Vallejos. (2012) Ecosystem services research in Latin
America: The state of the art. Ecosystem Services. 2:56-70. Doi:10.1016/j.ecoser.2012.09.006.
Barber, C.P., Cochrane, M.A., Souza Jr. C.M. and Laurance, W.F. (2014) Roads, deforestation, and the
mitigating effects of protected areas in the Amazon. Biological Conservation. 177:203-209.
Doi:10.1016/j.biocon.2014.07-004
Barbier, E.B., Koch, E.M., Silliman, B.R., Hacker, S.D., Wolanski, E., Primavera, J., Granek, E.F., Polasky, S.,
Aswani, S., Cramer, L.A., Stoms, D.M., Kennedy, C.J., Bael, D., Kappel, C.V., Perillo, G.M.E. and Reed, D.J.
(2008) Coastal Ecosystem-Based Management with Nonlinear Ecological Functions and Value. Science.
319:321-323. Doi:10.1126/science.1150349
6. REFERENCES
120
Barona, E., Ramankutty, N., Hyman, G. and Coomes, O.T. (2010) The role of pasture and soybean in
deforestation of the Brazilian Amazon. Environmental Research Letters. 5:024002. Doi:10.1088/1748-
9326/5/2/024002
Barsimantov, J. and Navia- Antezena J. (2012) Forest cover change and land tenure in Mexico’s avocado
region: Is community forestry related to reduced deforestation for high value crops? Applied Geography.
32:844-853. Doi:10.1016/j.apgeog.2011.09.001
Basu, P.S., Singh, U., Kumar, A., Praharaj, C.S. and Shivran RK (2016) Climate change and its mitigation
strategies in pulses production. Indian Journal of Agronomy 61: S71-S82.
Beebe, S., Ramirez, J., Jarvis, A., Rao, I.M., Mosquera, G., Bueno, G. and Blair, M. (2011) Genetic
improvement of common beans and the challenges of climate change. In: Yadav, S.S., Redden, R.J.,
Hatfield, J.L., Lotze-Campen, H. and Hall, A.E. (eds) Crop Adaptation to Climate Change, 1st edn. Wiley,
New York. pp.356-369
Bennett, E.M., Peterson, G.D. and Gordon, L.J. (2009) Understanding relationships among multiple
ecosystem services. Ecological Letters. 12:1394-1404. Doi:10.1111/j.1461-0248.2009.01387.x
Berger, J.D., Buirchell, B.J., Luckett, D.J. and Nelson, M.N. (2012) Domestication bottlenecks limit genetic
diversity and constrain adaptation in narrow-leafed lupin (Lupinus angustifolius L.). Theoretical and
Applied Genetics. 124:637-652. Doi:10.1007/s00122-011-1736-z
Beroya-Eitner, M.A. (2016) Ecological vulnerability indicators. Ecological Indicators. 60:329-334.
Doi:10.1016/j.ecolind.2015.07.001
Berrios, J.C., Hooghiemstra, H., Marchant, R. and Rangel, O. (2002) Late-glacial and Holocene history of
the dry forest area in the south Colombian Cauca Valley. Journal of Quaternary Science. 17: 667-682
Beverland, M.B. (2014) Mainstreaming Plant-Based Diets in Developed Economies. Journal of
Macromarketing. 34:369-382. Doi:10.1177/0276146714526410
Bodirsky, B.L., Rolinski, S., Biewald, A., Weidnle, I., Popp, A. and Lotze-Campen, H. (2015) Global Food
Demand Scenarios for the 21st Century. PLOS ONE. 10:e0139201. Doi: 10.1371/journal.pone.0139201
Boland, M.J., Rae, A.N., Vereijken, J.M., Meuwissen, M.P.M., Fischer, A.R.H., van Boekel, M.A.J.S.,
Rutherfurd, S.M., Gruppen, H., Moughan, P.J. and Hendriks, W.H. (2013) The future supply of animal-
derived protein for human consumption. Trends in Food Science & Technology. 29: 62–73. Doi:
10.1016/j.tifs.2012.07.002
Bonhommeau, S., Dubroca, L., Le Pape, O., Barde, J., Kaplan, D.M., Chassot, E. and Nieblas, A-E. (2013)
Eating up the world’s food web and the human trophic level. Proceedings of the National Academy of the
Sciences. 110: 20617-20620. Doi:10.1073/pnas.1305827110
Bonilla-Moheno, M., Aide, T.M. and Clark, M.L. (2012) The influence of socioeconomic, environmental,
and demographic factors on municipality-scale land-cover change in Mexico. Regional Environmental
Change. 12:543-557. Doi: 10.1007/s10113-011-0268-z
Börjeson, L., Höjer, M., Dreborg, K.-H., Ekvall, T. and Finnveden, G. (2006) Scenario types and techniques:
towards a user’s guide. Futures. 38: 723–739. Doi:10.1016/j.futures.2005.12.002
Börner, J., Mendoza, A. and Vosti, S.A. (2007) Ecosystem service, agriculture, and rural poverty in the
Eastern Brazilian Amazon: Interrelationships and policy prescriptions. Ecological Economics 64: 356-373.
Doi: 10.1016/j.ecolecon.2007.03.001.
Bottazzi, P. and Dao, H. (2013) On the roads through the Bolivian Amazon. A multi-level governance
analysis of deforestation. Land Use Policy. 30:137-146. Doi:10.1016/j.landusepol.2012.03.010
6. REFERENCES
121
Bouvard, V., Loomis, D., Guyton, K.Z., Grosse, Y., Ghissassi, F.E., Benbrahim-Tallaa, L., Guha, N., Mattock,
H. and Straif, K. (2015) Carcinogenicity of consumption of red and processed meat. Lancet Oncology. 16:
1599–1600. Doi: 10.1016/S1470-2045(15)00444-1
Braat, L.C. and de Groot, R. (2012) The ecosystem services agenda: bridging the worlds of natural science
and economics, conservation and development, and public and private policy. Ecosystem Services. 1:4-
15. Doi:10.1016/j.ecoser.2012.07.011
Bragagnolo, C., Carvalho Lemos, C., Ladle, R.J. and Pellin, A. (2017) Streamlinig or sidestepping? Political
pressure to revise environmental licensing and EIA in Brazil. Environmental Impact Assessment Review.
65:86-90. Doi:10.1016/j.eiar.2017.04.010
Brando, P.M., Nepstad, D.C., Davidson, E.A., Trumbore, S.E., Ray, D. and Camargo, P. (2008) Drought
effects on litterfall, wood production and belowground carbon cycling in an Amazon forest: results of
throughfall reduction experiment. Philosophical Transactions of the Royal Society B. 363:1839-1848.
Doi:10.1098/rstb.2007.0031
Brandon, K. (2014) Ecosystem Services from Tropical Forests: Review of Current Science. Center for Global
Development Working Paper 380.
Bulte, E.H., Damania, R. and López, R. (2007) On the gains of committing to inefficiency: Corruption,
deforestation and low land productivity in Latin America. Journal of Environmental Economics and
Management. 54:277-295. Doi: 10.1016/j.jeem.2007.05.002
Cáceres, D.M., Tapella, E. Quétier, F. and Díaz, S. (2015) The social value of biodiversity and ecosystem
services from the perspectives of different social actors. Ecology and Society. 20:62. Doi: 10.5751/ES-
07297-200162
Caldwell, K. and Boyd, C.P. (2009) Coping and resilience in farming families affected by drought. Rural
Remote Health. 9: 1088–1098.
Carr, D., (2009) Population and deforestation: why rural migration matters. Progress in Human
Geography. 33:355–378. Doi: 10.1177/0309132508096031
Carrasco, L.R., Nghiem, T.P.L., Sunderland, T. and Koh, L.P. (2014) Economic valuation of ecosystem
services fails to capture biodiversity value of tropical forests. Biological Conservation. 178:163-170.
Doi:10.1016/j.biocon.2014.08.007
Carreño, L., Frank, F.C. and Viglizzo, E.F. (2012) Tradeoffs between economic and ecosystem services in
Argentina during 50 years of land-use change. Agriculture, Ecosystems & Environment. 154: 68–77.
Doi:10.1016/j.agee.2011.05.019
Carroll, N., Frijters, P. and Shields, M.A. (2009) Quantifying the costs of drought: new evidence from life
satisfaction data. Journal of Population Economics. 22: 445–461. Doi: 10.1007/s00148-007-0174-3
Cassidy, E.S., West, P.C., Gerber, J.S. and Foley, J.A (2013) Redefining agricultural yields: from tonnes to
people nourished per hectare. Environmental Research Letters. 8: 34015. Doi:10.1088/1748-
9326/8/3/034015
Cavender-Bares, J., Polasky, S. King, E. and Balvanera, P. (2015) A sustainability framework for assessing
trade-offs in ecosystem services. Ecology and Society. 20:17. Doi:10.5751/ES-06917-200117
Caviglia-Harris, J., Sills, E., Bell, A., Harris, D., Mullan, K. and Roberts, D. (2016) Busting the Boom- Bust
Pattern of Development in the Brazilian Amazon. World Development. 79:82-96.
Doi:10.1016/j.worlddev.2015.10.040
6. REFERENCES
122
Ceballos, G., Ehrlich, P.R. and Dirzo, R. (2017) Biological annihilation via the ongoing sixth mass extinction
signaled by the vertebrate population losses and declines. Proceedings of the National Academy of
Sciences. E6089-E6096. Doi:10.1073/pnas.1704949114
Challinor, A. J., Watson, J., Lobell, D.B., Howden, S.M., Smith, D.R. and Chhetri N. (2014) A meta-analysis
of crop yield under climate change and adaptation. Nature Climate Change. 7:287-291.
Doi:10.1038/nclimate2153
Charnes, A., Cooper, W.W. and Ferguson, R. (1955) Optimal estimation of executive compensation by LP.
Management Science. 1:138-151.
Chaves, M.M., Maroco, J.P. and Pereira, J.S. (2003) Understanding plant responses to drought- from genes
to the whole plant. Functional Plant Biology. 30:239-264
Chomitz, K.M. (2007) At Loggerheads? Agricultural Expansion, Poverty Reduction, and Environment in the
Tropical Forests. World Bank, Washington, DC.
Chowdhury, R.R. (2006) Landscape change in the Calakmul Biosphere Reserve, Mexico: Modeling the
driving forces of smallholder deforestation in land parcels. Applied Geography. 26:129-152.
Doi:10.1016/j.apgeog.2005.11.004
Chuvieco, E., Martínez, S., Román, M.V., Hantson, S. and Pettinari, M.L. (2014) Integration of ecological
and socio-economic factors to assess global vulnerability to wildfire. Global Ecology and Biogeography.
23:245–258. Doi:10.1111/geb.12095
Clark, R., Reed, J. and Sunderland, T. (2018) Bridging funding gaps for climate and sustainable
development: Pitfalls, progress and potential of private finance. Land Use Policy. 71:335-346.
Doi:10.1016/j.landusepol.2017.12.013
Clemente, A. and Olias, R. (2017) Beneficial effects of legumes in gut health. Current Opinion in Food
Science. 14:32-36. Doi:10.1016/j.cofs.2017.01.005.
Coba de la Peña, T. and Pueyo, J.J. (2012) Legumes in the reclamation of marginal soils, from cultivar and
inoculant selection to transgenic approaches. Agronomy for Sustainable Development. 32:65-91.
Doi:10.1007/s13593-011-0024-2
Comisión Nacional Forestal [CONAFOR] (2014) Anexo 2. Información de las condiciones ambientales de
los Estados y sus áreas de intervención en el marco de la IRE. Available at:
http://www.conafor.gob.mx:8080/documentos/docs/35/6914Anexo%202.pdf. Last accessed: 6th April
2018
Considine, M.J., Siddique, K.H.M. and Foyer, C.H. (2017) Nature’s pulse power: legumes, food security and
climate change. Journal of Experimental Botany. 68:1815-1818. Doi:10.1093/jxb/erx099
Cool Farm Alliance. (2016) Cool Farm Tool. Available at:
https://coolfarmtool.org/coolfarmtool/greenhouse-gases/.
Cowling, W.A., Li, L., Siddique, K.H.M., Henryon, M., Berg, P., Banks, R.G., Kinghorn, B.P. (2017) Evolving
gene banks: improving diverse populations of crop and exotic germplasm with optimal contribution
selection. Journal of Experimental Botany. 68:1927-1939. Doi: 10.1093/jxb/erw406
Crutzen, P. and Stoermer, E.F. (2000) The “Anthropocene”. The International Geosphere-Biosphere
Programme Newsletter. 41:17-18.
Cuiza, P. (2017) Destinan más de Bs. 17, 8 millones en apoyo a la mecanización del agro en Oruro. Available
at: http://www.la-razon.com/economia/Mecanizacion-Agro-Oruro-Bolivia_0_2652334818.html. Last
accessed 5th September 2017.
6. REFERENCES
123
Culas, R.J. (2007) Deforestation and the environmental Kuznets curve: An institutional perspective.
Ecological Economics. 61:429-437. Doi:10.1016/j.ecolecon.2006.03.014
Cullis, C. and Kunert, K.J. (2017) Unlocking the potential of orphan legumes. Journal of Experimental
Botany. 68:1895- 1903. Doi:10.1093/jxb/erw437
Daryanto, S., Wang, L. and Jacinthe, P-E. (2015) Global synthesis of Drought Effects on Food Legume
Production. PLoS ONE 10:e0127401. Doi: 10.1371/journal.pone.0127401
Daryanto, S., Wang, L. and Jacinthe, P-E. (2017) Global synthesis of drought effects on cereal, legumes,
tuber and root crops production. A Review. Agricultural Water Management. 179:18-33.
Doi:10.1016/j.agwat.2016.04.022
Davidson, E.A., de Araújo, A.C., Artaxo, P., Balch, J.K., Brown, I.F., Bustamante, M.M.C., Coe, M.T., DeFries,
R.S., Keller, M., Longo, M., Mungerm, J.W., Schroeder, W., Soares-Filho, B.S., Souza, C.M. and Wofsy, S.C.
(2012) The Amazon basin in transition. Nature. 481:321-328. Doi:10.1038/nature10717
de Bakker, E. and Dagevos, H. (2010) Meat lovers, meats reducers, and meat avoiders: Sustainable protein
consumption in a carnivorous food culture. LEI Wageningen UR, The Hague
de Bakker, E. and Dagevos, H. (2012) Reducing Meat Consumption in Today’s Consumer Society:
Questioning the Citizen-Consumer Gap. Journal of Agricultural and Environmental Ethics. 25:877-894.
Doi:10.1007/s10806-011-9345-z
de Boer, J., Helms, M. and Aiking, H. (2006) Protein consumption and sustainability: Diet diversity in EU-
15. Ecological Economics. 59:267–274. Doi:10.1016/j.ecolecon.2005.10.011
de Bruin, J.O., Kok, K. and Hoogstra-Klein, M.A. (2017) Exploring the potential of combining participative
backcasting and exploratory scenarios for robust strategies: Insights from the Dutch forest sector. Forest
Policy and Economics. 85:269-282. Doi:10.1016/j.forpol.2017.06.007
de Ron, A.M. (2015) Grain Legumes. Series: Handbook on Plant Breeding. Springer, New York
de Ruiter, H., Kastner, T. and Nonhebel, S. (2014) European dietary patterns and their associated land use:
Variation between and within countries. Food Policy. 44:158–166. Doi:10.1016/j.foodpol.2013.12.002
de Visser, C.L.M., Schreuder, R. and Stoddard, F. (2014) The EU’s dependency on soya bean import for the
animal feed industry and potential for EU produced alternatives. Oilseeds and fats Crops and Lipids.
21:D407. Doi:10.1051/ocl/2014021
de Vries, M. and de Boer, I.J.M. (2010) Comparing environmental impacts for livestock products: A review
of life cycle assessments. Livestock Science. 128:1-11. Doi:10.1016/j.livsci.2009.11.007
Dearing, J.A., Bullock, S. Costanza, R., Dawson, T.P., Edwards, M.E., Poppy, G.M and Smith, G.M. (2012)
Navigating the Perfect Storm: Research Strategies for Socioecological Systems in a Rapidly Evolving World.
Environmental Management. 49:767-775. Doi:10.1007/s00267-012-9833-6
Defries, R., Foley, J.A. and Asners, G.P. (2004) Land-use choices: Balancing human needs and ecosystem
function. Frontiers in Ecology and the Environment. 2:249-257. Doi:10.1890/1540-
9295(2004)002[0249:LCBHNA]2.0.CO;2
Dei, H.K. (2011) Soybean as a Feed Ingredient for Livestock and Poultry. In: Krezhova, E. (Ed), Recent
Trends for Enhancing the Diversity and Quality of Soybean Products. Intechopen, Rijeka. Pp:215-226
Delgado, C.L. (2003) Raising Consumption of Meat and Milk in Developing Countries Has Created a New
Food Revolution. The Journal of Nutrition. 3907S-3910S
6. REFERENCES
124
Delgado, J.A., Groffman, P.M., Nearing, M.A., Goddard, T., Reicosky, D., Lal, R., Kitchen, N.R., Rice, C.W.,
Towery, D. and Salon, P. (2011) Conservation practices to mitigate and adapt to climate change. Journal
of Soil and Water Conservation. 66:118-129. Doi:10.2489/jswc.66.4.118A
Delgado-Andrade, C., Olias, R., Jimenez-Lopez, J.C. and Clemente, A. (2016) Nutritional and beneficial
effects of grain legumes on human health. Arbor. 192: a313. Doi:10.3989/arbor.2016.779n3003
Diaz-Balteiro, L., González-Pachón, J. and Romero, C. (2013) Goal programming in forest management:
customising models for the decision maker’s preferences. Scandinavian Journal of Forest Research.
28:166-173. Doi:10.1080/02827581.2012.712154
Didia, D.O. (1997) Democracy, political instability and tropical deforestation. Global Environmental
Change. 7:63-76.
Diversi, M. (2014) Damming the Amazon: the postcolonial march of the wicked west. Cultural Studies –
Critical Methodologies. 14:242–246. Doi:10.1177/1532708614527557
Dogliotti, S., van Ittersum, M.K. and Rossing, W.A.H. (2005) A method for exploring sustainable
development options at farm scale: a case study for vegetable farms in South Uruguay. Agricultural
Systems. 86:29-51. Doi:10.1016/j.agsy.2004.08.002
Dolisca, F., McDaniel, J.M., Teeter, L.D. and Jolly, C.M. (2007) Land tenure, population pressure, and
deforestation in Haiti: The case of Forêt des Pins Reserve. Journal of Forest Economics. 13:277-289.
Doi:10.1016/j.jfe.2007.02.006
Dreborg, K-H. (1996) Essence of backcasting. Futures. 28:813-828
Dreborg, K-H. (2004) Scenarios and structural uncertainty: explorations in the field of sustainable
transport. Ph.D. Thesis. Department of Infrastructure Royal Institute of Technology. Stockholm, Sweden.
Durán, E., Bray, D.B., Velázquez, A. and Larrazábal, A. (2011) Multi-Scale Forest Governance,
Deforestation, and Violence in Two Regions of Guerrero, Mexico. World Development. 39:611-619.
Doi:10.1016/j.worlddev.2010.08.018
Eames, M., Dixon, T., May, T. and Hunt, M. (2013) City futures: exploring urban retrofit and sustainable
transitions. Building Research & Infrastructure. 41:504-516. Doi:10.1080/09613218.2013.805063 .
Echeverria, C., Coomes, D.A., Hall, M. and Newton, A.C. (2008) Spatially explicit models to analyze forest
loss and fragmentation between 1976 and 2020 in southern Chile. Ecological Modelling. 212:439-449.
Doi:10.1016/j.ecolmodel.2007.10.045
Erb, K-H., Lauk, C., Kastner, T., Mayer, A., Theurl, M.C. and Haberly, H. (2016) Exploring the biophysical
option space for feeding the world without deforestation. Nature Communications. 7:11382.
Doi:10.1038/ncomms11382
Esteve. P., Varela-Ortega, C. and Downing, T.E. (2018) A stakeholder-based assessment of barriers to
climate change adaptation in a water-scarce basin in Spain. Regional Environmental Change. In press
Etemadi, A., Sinha, R., Ward, M.H., Graubard, B.I., Inoue-Choi, M., Dawsey, S.M. and Abnet, C.C. (2017)
Mortalitiy from different causes associated with meat, heme iron, nitrates, and nitrites in the NIH-AARP
Diet and Health Study: population based cohort study. British Medical Journal. 357:j1957.
Doi:10.1136/bmj.j1957
European Commission. (2016) FOOD 2030: Research & Innovation for Tomorrow’s Nutrition & Food
Systems. Available at: https://ec.europa.eu/info/events/food-2030-research-innovation-tomorrows-
nutrition-food-systems-2016-oct-12_en. Last accessed: 29th May 2018.
6. REFERENCES
125
European Commission. (2017) Eurostat. Available at: http://ec.europa.eu/eurostat. Last accessed 25
November 2017
European Parliament (2013) The environmental role of protein crops in the new Common Agricultural
Policy. Directorate General for Internal Policies: Policy Department. Available at:
http://www.europarl.europa.eu/RegData/etudes/etudes/join/2013/495856/IPOL-
AGRI_ET(2013)495856_EN.pdf. Last accessed: 27 February 2016.
Ewert, F., Rötter, R.P., Bindi, M., Webber, H., Trnka, M., Kersebaum, K.C., Olesen, J.E., van Ittersum, M.K.,
Janssen, S., Rivington, M. (2015) Crop modelling for integrated assessment of risk to food production from
climate change. Environmental Modelling & Software. 72: 287-303. Doi:10.1016/j.envsoft.2014.12.003
[FAO] Food and Agricultural Organization of the United Nations. (2012) GAEZ Global Agro-Ecological
Zones. Data Portal Version 3.0. Available at: http://gaez.fao.org/. Last accessed 15 May 2017
[FAO] Food and Agricultural Organization of the United Nations. (2015a) Terms and Definitions. Available
at: http://www.fao.org/docrep/017/ap862e/ap862e00.pdf. Last accessed 14th July 2017.
[FAO] Food and Agricultural Organization of the United Nations. (2015b) Global Forest Resources
Assessment 2015: Desk Reference. Available at: http://www.fao.org/3/a-i4808e.pdf. Last accessed 10th
October 2017.
[FAO] Food and Agricultural Organization of the United Nations. (2015c) Global Forest Resources
Assessment 2015: How are the world’s forests changing? Rome (Italy). Food and Agricultural Organization
of the United Nations.
[FAO] Food and Agricultural Organization of the United Nations. (2016a) 2013 Food Balance Sheets for 42
selected countries. Available at: http://faostat3.fao.org/download/FB/FBS/E. Last accessed 14th July
2017.
[FAO] Food and Agricultural Organization of the United Nations. (2016b) EcoCrop. Available at:
http://ecocrop.fao.org. Last accessed 28th January 2017
[FAO] Food and Agricultural Organization of the United Nations. (2018a) FAOSTAT. Available at:
http://www.fao.org/faostat/en/#data. Last accessed 20th July 2018.
[FAO] Food and Agricultural Organization of the United Nations. (2018b) Crops. Available at:
http://www.fao.org/faostat/en/#data/QC. Last accessed 15th January 2018.
[FAPESPA] Fundação Amazônia de Amparo a Estudos e Pesquisas. (2016) Mapa de Excusao Social Do
Estado Do Pará 2016.
[FAPESPA] Fundação Amazônia de Amparo a Estudos e Pesquisas. (2017) Anúario Estatístico do Pará 2017.
Available at: http://www.fapespa.pa.gov.br/menu/151. Last accessed: 18th November 2017
Fearnside, P.M. (2001) Land-Tenure Issues as Factors in Environmental Destruction in Brazilian Amazonia:
The Case of Southern Pará. World Development. 29:1361-1372.
Fearnside, P.M. (2003) Deforestation control in Mato Grosso: A new model for slowing the loss of Brazil’s
Amazon forest. Ambio. 32:343–345.
Fernández, F. (2017) Economic effects of climate change on agriculture: multi-scale assessment through
regional mathematical programming models. Available at: http://oa.upm.es/47723/. Last accessed 18th
January 2018
Ferraro, P.J. and Pattanayak, S.K. (2006) Money for Nothing? A Call for Empirical Evaluation of Biodiversity
Conservation Investments. PLoS Biology. 4:e105. Doi:10.1371/journal.pbio.0040105

6. REFERENCES
126
Fick, S.E. and Hijmans, R.J. (2017) Worldclim 2: New 1-km spatial resolution climate surfaces for global
land areas. International Journal of Climatology. 37:4302-4315. Doi:10.1002/joc.5086
Fischer, G., Shah, M.M. and Van Velthuizen, H. (2002) Climate change and agricultural vulnerability.
Discussion paper, IIASA, International Institute for Applied Systems Analysis.
Fisher, B., Turner, R.K., Burgess, N.D., Swetnam, R.D., Green, J., Green, R.E., Kajembe, G., Kuilndwa, K.,
Lewis, S.L., Marchant, R., Marshall, A.R., Madoffe, S., Munishi, P.K.T., Morse-Jones, S., Mwakalia, S.,
Paavola, J., Naidoo, R., Ricketts, T., Rouget, M., Wilcock, S., White, S. and Balmford, A. (2011) Measuring,
modelling and mapping ecosystem services in the Eastern Arc Mountains of Tanzania. Progress in Physical
Geography. 35:595-611. Doi.10.1177/0309133311422968
Foley, M.H. and Foley, J.A. (1997) Water balance of the Amazon Basin: Dependence on vegetation cover
and canopy conductance. Journal of Geophyiscal Research. 102:23973-23989.
Foley, J.A., DeFries, R., Asner, G.P., Barford, C., Bonan, G., Carpenter, S.R., Chapin, S., Coe, M.T., Daily,
G.C., Gibbs, H.K., Heljowski, J.H., Holloway, T., Howard, E.A., Kucharik, C.J., Monfreda, C., Patz, J.A,
Prentice, C., Ramankutty, N. and Snyder, P.K. (2005) Global Consequences of Land Use. Science. 309:570-
574. Doi:10.1126/science.1111772
Foley, J.A., Asner, G.P., Costa, M.H., Coe, M.T., DeFries, R., Gibbs, H.K., Howard, E.A., Olson, S., Patz, J.,
Ramankutty, N. and Snyder, P. (2007) Amazonia revealed: forest degradation and loss of ecosystem good
and services in the Amazon Basin. Frontiers in Ecology and the Environment. 5:25-32
Foley, J.A., Ramankutty, N., Brauman, K.A., Cassidy, E.S., Gerber, J.S., Johnston, M., Mueller, N.D.,
O’Connell, C., Ray, D.K., West, P.C., Balzer, C., Bennett, E.M., Carpenter, S.R., Hill, J., Monfreda, C., Polasky,
S., Rockström, J, Sheehan, J., Siebert, S., Tilman, D. and Zaks, D.P.M. (2011) Solutions for a cultivated
planet. Nature. 478:337–342. Doi:10.1038/nature10452
Fooks, J.R. and Messer, K.D. (2012) Maximizing conservation and in-kind cost share: Applying Goal
Programming to forest protection. Journal of Forest Economics. 18:207-217.
Doi:10.1016/j.jfe.2012.04.001
Fritze, J.G., Blashki, G.A., Burke, S. and Wiseman, J. (2008) Hope, despair and transformation: climate
change and the promotion of mental health and wellbeing. International Journal of Mental Health
Systems. 2:13–23. Doi:10.1186/1752-4458-2-13
Fujisaki, K., Perrin, A-S., Garric, B., Balesdent, J. and Brossard, M. (2017) Soil organic carbon changes after
deforestation and agrosystem establishment in Amazonia: An assessment by diachronic approach.
Agriculture, Ecosystems and Environment. 245:63-73. Doi:10.1016/j.agee.2017.05.011
García de Jalón, S., Iglesias, A. and Barnes, A.P. (2014) Drivers of farm-level adaptation to climate change
in Africa: an evaluation by a composite index of potential adoption. Mitigation and Adaptation Strategies
for Global Change. 21:779-798. Doi:10.1007/s11027-014-9626-8
Gasparri, N.I. and Grau, H.R. (2009) Deforestation and fragmentation of Chaco dry forest in NW Argentina
(1972-2007). Forest Ecology and Management. 258:913-921. Doi:10.1016/j.foreco.2009.02.024
Gibbs, H.K., Rausch, L., Munger, J., Schelly, I., Morton, D.C., Noojipady, P., Soares-Filho, B., Barreto, P.,
Micol, L. and Walker, N.F. (2015) Brazil’s Soy Moratorium. Supply-chain governance is needed to avoid
deforestation. Science. 347:377-378. Doi:10.1126/science.aaa0181
Gibson, L., Lee, T.M., Koh, L.P., Brook, B.W., Gardner, T.A., Barlow, J., Peres, C.A., Bradshaw, C.J., Laurance,
C.J., Lovejoy, T.E. and Sodhi, N.S. (2011) Primary forests are irreplaceable for sustaining tropical
biodiversity. Nature. 478:378-381. Doi:10.1038/nature10425
Giles, J. (2006) The outlook for Amazonia is dry. Nature. 442:726- 727

6. REFERENCES
127
Giller, K.E., Tittonell, P., Rufino, M.C.., van Wijk, M.T., Zingore, S., Mapfumo, P., Adjei-Nsiah, S., Herrero,
M., Chikowo, R., Corbeels, M., Rowe, E.C., Baijukya, F., Mwijage, A., Smith, J., Yeboah, E., van der Burg,
W.J., Sanogo, O.M., Misiko, M., de Ridder, N., Karanja, S., Kaizzi, C., K`ungu, J., Mwale, M., Nwaga, D.,
Pacini, C. and Vanlauwe, B. (2011) Communicating complexity: Integrated assessment of trade-offs
concerning soil fertility management within African farming systems to support innovation and
development. Agricultural Systems. 104:191-203. Doi:10.1016/j.agsy.2010.07.002
[GIZ] Gesellschaft für Internationale Zusammenarbeit. (2013) Analysis of Key Drivers of Deforestation and
Forest Degradation in the Philippines. Manila (Philipines). Deutsche Gesellschaft für Internationale
Zusammenarbeit.
Geist, H.J. and Lambin, E.R. (2002) Proximate Causes and Underlying Driving Forces of Tropical
Deforestation. BioScience. 52:143-150.
Ghimire, R., Machado, S. and Bista, P. (2017) Soil pH, Soil Organic Matter, and Crop Yields in Winter Wheat-
Summer Fallow. Agronomy Journal. 109:706-717. Doi:10.2134/agronj2016.08.0462
Godar, J., Gardner, T.A., Tizado, E.J. and Pacheco, P. (2014) Actor-specific contributions to the
deforestation slowdown in the Brazilian Amazon. Proceedings of the National Academy of Science.
111:15591-15596. Doi:10.1073/pnas.1322825111
Godfray, H.C.J., Beddington, J.R., Crute, I.R., Haddad, L., Lawrence, D., Muir, J.F., Pretty, J., Robinson, S.,
Thomas, S.M. and Toulmin, C. (2010) Food Security: The Challenge of Feeding 9 Billion People. Science.
327: 812–818. Doi:10.1126/science.1185383
Goldewijk, K.K. (2001) Estimating global land use change over the past 30 years: The HYDE Database.
Global Biogeochemical Cycles. 15:417-433
Goldewijk, K.K. and Ramankutty, N. (2001) Land Use Change During the Past 300 Years. Land Use, Land
Cover and Soil Science. 1
Goldstein, J.H., Caldarone, G. Duarte, T.K. Ennaanay, D. Hannahs, N. Mendoza, G. Polasky, S. Wolny, S. and
Daily, G.C. (2012) Integrating ecosystem-service tradeoffs into land-use decisions. Proceedings of the
National Academy of Sciences 109:7565-7570. Doi:10.1073/pnas.1201040109
Grau, H.R., Gasparri, I. and Aide, T.M. (2008) Balancing food production and nature conservation in the
Neotropical dry forests of northern Argentina. Global Change Biology. 14:985-997. Doi:10.1111/j.1365-
2486.2008.01554.x
Grimaldi, M., Oszwald, J., Dolédec, S., Hurtado, M.P.M.I.S., Xavier, S.A., Assis, W.S., Castañeda, E.,
Desjardins, T., Dubs, F., Guevara, E., Gond, V., Lima, T.T.S., Marichal, R., Michelotti, F., Mitja, D., Noronha,
N.C., Oliveira, M.N.D., Ramirez, B., Rodriguez, G., Sarrazin, M., Silva Junior, M.L., Costa, L.G.S., Souza, S.L.,
Veiga, I., Velasquez, E. and Lavelle, P. (2014) Ecosystem services of regulation and support in Amazonian
pioneer fronts: searching for landscape drivers. Landscape Ecology.29:311-28. Doi:10.1007/s10980-013-
9981-y
Groot, J.C.J., Oomen, G.J.M. and Rossing, W.A.H. (2012) Multi-objective optimization and design of
farming systems. Agricultural Systems. 110:63-77. Doi:10.1016/j.agsy.2012.03.012
Guedes, G.R., VanWey, L.K., Hull, J.R., Antigo, M. and Barbieri, A.F. (2014) Poverty dynamics, ecological
endowments, and land use among smallholders in the Brazilian Amazon. Social Science Research. 43:74-
91. Doi:10.1016/j.ssresearch.2013.09.002
Guida-Johnson, B. and Zuleta, G.A. (2013) Land-use land-cover change and ecosystem loss in the Espinal
ecoregion, Argentina. Agriculture, Ecosystems & Environment. 181:31-40.
Doi:10.1016/j.agee.2013.09.002
6. REFERENCES
128
Haddad, N.M., Brudvig, L.A., Clobert, J., Davies, K.F., Gonzalez, A., Holt, R.D., Lovejoy, T.E., Sexton, J.O.,
Austin, M.P., Collins, C.D., Cook, W.M., Damschen, E.I., Ewers, R.M., Foster, B.L., Jenkins, C.N., King, A.J.,
Laurence, W.F., Levey, D.J., Margules, C.R., Melbourne, B.A., Nicholls, A.O., Orrock, J.L. Song, D-X. and
Townshend, J.R. (2015) Habitat fragmentation and its lasting impact on Earth’s ecosystems. Science
Advances. 1:e1599952. Doi:10.1126/sciadv.1500052.
Hansen, J.W. (2002) Realizing the potential benefits of climate prediction to agriculture: issues,
approaches, challenges. Agricultural Systems. 74:309–330.
Harris, N.L., Brown, S., Hagen, S., Saatchi, S.S., Petrova, S., Salas, W., Hansen, M.C., Potapov, P.V. and
Lotsch, A. (2012) Baseline Map of Carbon Emissions from Deforestation in Tropical Regions. Science.
336:1573- 1576. Doi:10.1126/science.12.17962
Hartigan, J.A. and Wong, M.A. (1979) A K-means clustering algorithm. Applied Statistics. 28:100-108
Heckelei, T. (2002) Calibration and Estimation of Programming Models for Agricultural Supply Analysis.
Habilitation Thesis, University of Bonn. Bonn, Germany.
Heckelei, T., Britz, B. and Zhang, Y. (2012) Positive Mathematical Programming Approaches- Recent
Developments in Literature and Applied Modelling. Bio-based and Applied Economics. 1:109-124.
Hedenus, F., Wirsenius, S. and Johansson, D.J.A. (2014) The importance of reduced meat and dairy
consumption for meeting stringent climate change targets. Climatic Change. 124:79–91.
Doi:10.1007/s10584-014-1104-5
Henchion, M., Hayes, M., Mullen, A.M., Fenelon, M. and Tiwari, B. (2017) Future Protein Supply and
Demand: Strategies and Factors Influencing a Sustainable Equilibrium. Foods. 6:53.
Doi:10.3390/foods6070053
Hijmans, R.J. and Elith, J. (2017) Species distribution modeling with R. Available at: https://cran.r-
project.org/web/packages/dismo/vignettes/sdm.pdf. Last accessed 15th June 2017.
Hoek, A.C., Pearson, D., James, S.W., Lawrence, M.A. and Friel, S. (2017) Shrinking the food-print: A
qualitative study into consumer perceptions, experiences and attitudes towards health and
environmentally friendly food behaviours. Appetite. 108:117-131. Doi:10.1016/j.appet.2016.09.030
Høiby, M. and Zenteno Hopp, J. (2014) Bolivia: Emerging and Traditional Elites and the Governance of the
Soy Sector. In: Bull, B. and AguilarStøen, M.C. (Eds), Environmental Politics in Latin America: Elite
Dynamics, the Left Tide and Sustainable Development. Routledge Studies in Sustainable Development,
London. Pp: 51–70
Holland, M.B., Koning, F.D., Morales, M., Naughton-Treves, L., Robinson, B.E. and Suárez, L. (2014)
Complex Tenure and Deforestation: Implications for Conservation Incentives in the Ecuadorian Amazon.
World Development. 55:21-36. Doi:10.1016/j.worlddev.2013.01.012
Houghton, R.A. (2012) Carbon emissions and the drivers of deforestation and degradation in the tropics.
Current Opinion in Environmental Sustainability. 4:597-603. Doi:10.1016/j.cosust.2012.06.006
Hosonuma, N., Herold, M., De Sy, V., De Fries, R.S., Brockhaus, M., Verchot, L., Angelsen, A. and Romijn,
E. (2010) An assessment of deforestation and forest degradation drivers in developing countries.
Environmental Research Letters. 7:044009. Doi:10.1088/1748-9326/7/4/044009
Howitt, R.E. (1995) Positive Mathematical Programming. American Journal of Agricultural Economics.
77:329-342.
6. REFERENCES
129
Huang, C., Kim, S., Altstatt, A., Townshend, J.R.G., Davis, P., Song, K., Tucker, C.J., Rodas, O., Yanosky, A.,
Clay, R. and Musinsky, J. (2007) Rapid loss of Paraguay’s Atlantic forest and the status of protected area:
A Landsat assessment. Remote Sensing of Environment. 106:460-466. Doi:10.1016/j.rse.2006.09.016
Hughes, J.D. and Thirgood, J.V. (1982) Deforestation, Erosion, and Forest Management in Ancient Greece
and Rome. Journal of Forest History. 26:60-75
[IBGE] Instituto Brasileño de Geografía y Estadística. (2009) Census of Agriculture- 2006.
https://ww2.ibge.gov.br/estadosat/temas.php?sigla=pa&tema=censoagro. Last accessed: 19th October
2017
[IBGE] Instituto Brasileiro de Geografia e Estatística. (2010) Estados- Pará. Available from:
http://www.ibge.gov.br/estadosat/perfil.php?sigla=pa. Last accessed 14th December 2014
[IBGE] Instituto Brasileño de Geografía y Estadística. (2017) Pará. Available at:
https://cidades.ibge.gov.br/brasil/pa/panorama. Last accessed: 15th November 2017
Iglesias, A., Garrote, L., Quiroga, S. and Moneo, M. (2012) A regional comparison of the effects of climate
change on agriculture in Europe. Climatic Change. 112:29-46. Doi:10.1007/s10584-011-0338-8
Imamura, F., Micha, R., Khatibzadeh, S., Fahimi, S., Shi, P., Powles, J., Mozaffarian, D., Global Burden of
Diseases Nutrition and Chronic Diseases Expert Group (NutriCoDE). (2015) Dietary quality among men and
women in 187 countries in 1990 and 2010: a systematic assessment. Lancet Global Health. 3:e132-143.
Doi:10.1016/S2214-109X(13)70381-X
[INE] Instituto Nacional de Estadistica de Bolivia. (2011) Estadísticas Socioeconómicas del Departamento
de Santa Cruz. Available from:
http://www.hombresnuevos.org/pdfs/EstadisticaDepartamentodeSantaCruz.pdf? Last accessed: 4th
May 2016
[INE] Instituto Nacional de Estadística. (2012a) Ficha Resúmen Censo Población y Vivienda 2012. Available
at: http://censosbolivia.ine.gob.bo/censofichacomunidad/c_listadof/listar_comunidades. Last accessed:
19th November 2017
[INE] Instituto Nacional de Estadística. (2012b) Ficha Resúmen Censo Población y Vivienda 2012. Available
at: http://censosbolivia.ine.gob.bo/censofichacomunidad/. Last accessed: 19th November 2017
[INE] Instituto Nacional de Estadística. (2015a) Ficha Resúmen Censo Nacional Agropecuario 2013.
Available at: http://fm.ine.gob.bo/censofichacna/c_listadof/listar_comunidades. Last accessed: 17th
October 2017
[INE] Instituto Nacional de Estadística. (2015b) Ficha Resúmen Censo Nacional Agropecuario 2013.
Available at: http://fm.ine.gob.bo/censofichacna. Last accessed: 17th October 2017
[INE] Instituto Nacional de Estadística de Bolivia. (2015c) Censo Agropecuario 2013 Bolivia. Instituto
Nacional de Estadística. Bolivia.
[INE] Instituto Nacional de Estadística. (2017a) Agricultura. Available at:
http://www.ine.gob.bo/index.php/estadisticas-por-actividad-economica/industria-manufacturera-y-
comercio-4. Last accessed: 17th October 2017
[INE] Instituto Nacional de Estadística de Bolivia. (2017b) Base de Datos de Encuestas Agropecuarias.
Instituto Nacional de Estadística. Bolivia. Available at: http://www.ine.gob.bo/index.php/banco/base-de-
datos-agropecuarias. Accessed: 3rd May 2017.

6. REFERENCES
130
[INEGI] Instituto Nacional de Estadística y Geografía. (2010) Censo de Población y Vivienda. Available at:
http://www.inegi.org.mx/est/contenidos/proyectos/ccpv/cpv2010/Default.aspx. Last accessed: 23rd
December 2014.
[INEGI] Instituto Nacional de Estadística y Geografía. (2018a) Sistema de consulta para el estado de Jalisco.
Available at: http://indicadoresmunicipales.jalisco.gob.mx:8001/cobdem/. Last accessed: 4th April 2018
[INEGI] Instituto Nacional de Estadística y Geografía. (2018b) Indicadores de Bienestar por entidad
federativa: Jalisco. Available at: http://www.beta.inegi.org.mx/app/bienestar/?ag=14. Last accessed: 4th
April 2018
[INPE] Instituto Nacional de Pesquisas Espaciais. (2017) Desmatamento nos Municípios. Available at:
http://www.dpi.inpe.br/prodesdigital/prodesmunicipal.php. Last accessed: 19th October 2017
Ioris, A. A. R. (2016) The paradox of poverty in rich ecosystems: Impoverishment and development in the
Amazon of Brazil and Bolivia. Geographical Journal. 182:178–189. Doi:10.1111/geoj.12124
[IPCC] Intergovernmental Panel on Climate Change. (2014) Summary for Policymakers. In: Climate Change
2014: Mitigation of Climate Change. Contribution of Work¬ing Group III to the Fifth Assessment Report of
the Intergovernmental Panel on Climate Change [Edenhofer, O., R. Pichs-Madruga, Y. Sokona, E. Farahani,
S. Kadner, K. Seyboth, A. Adler, I. Baum, S. Brunner, P. Eickemeier, B. Kriemann, J. Savolainen, S. Schlömer,
C. von Stechow, T. Zwickel and J.C. Minx (eds.)]. Cambridge University Press, Cambridge, United Kingdom
and New York, NY, USA.
James, A.N., Gaston, J.K. and Balmford, A. (1999) Balancing the world´s accounts. Nature. 41:323-324
Jarvis, A., Ramirez-Villegas, J., Herrera Campo, B.V. and Navarro-Racines, C. (2012) Is Cassava the Answer
to African Climate Change Adaptation? Tropical Plant Biology. 5:9-29. Doi:10.1007/s12042-012-9096-7
Jenks, G.F. (1967) The Data Model Concept in Statistical Mapping. International Yearbook of Cartography.
7:186-190
Jha, S. and Bawa, K.S. (2006) Population Growth, Human Development, and Deforestation in Biodiversity
Hotspots. Conservation Biology. 20:906-912. Doi:10.1111/j.1523-1739.2006.00398.x
Jones, P. and Thornton, P.K. (2008) Croppers to livestock keepers: livelihood transitions to 2050 in Africa
due to climate change. Environmental Science & Policy. 12:427-437. Doi:10.1016/j.envsci.2008.08.006
Jones, J.W., Bartels, W., Fraisse, C., Boote, K.J., Ingram, K.T. and Hoogenboom, G. (2011) Use of Crop
Models for Climate-Agricultural Decisions, Handbook of Climate Change and Agroecosystems. ICP Series
on Climate Change Impacts, Adaptation, and Mitigation. Imperial College Press, London. Pp. 131-157.
Judge, M. and Wilson, M.S. (2015) Vegetarian Utopias: Visions of dietary patterns in future societies and
support for social change. Futures. 71:57-69. Doi:10.1016/j.futures.2015.07.005
Kaiser, H.M. and K.D. Messer. (2011) Goal Programming. In: Kaiser, H.M and K.D. Messer (Eds)
Mathematical Programming for Agricultural, Environmental, and Resource Economics. New Wiley & Sons,
Jersey. Pp: 427-452.
Kanellopoulos, A., Berentsen, P., Heckelei, T., van Ittersum, M. and Lansink, A.O. (2010) Assessing the
Forecasting Performance of a Generic Bio-Economic Farm Model Calibrated With Two Different PMP
Variants. Journal of Agricultural Economics. 61:274-294. Doi:10.1111/j.1477-9552.2010.00241.x
Kanter, D.R., Musumba, M., Wood, S.L.R., Palm, C., Antle, J., Balvanera, P., Dale, V.H., Havlik, P., Kline, K.L.,
Scholes, R.J., Thornton, P., Tittonell, P. and Andelman, S. (2016a) Evaluating agricultural trade-offs in the
age of sustainable development. Agricultural Systems. 163:73-88. Doi:10.1016/j.agsy.2016.09.010
6. REFERENCES
131
Kanter, D.R., Schwoob, M-H., Baethgen, W.E., Bervejillo, J.E., Carriquiry, M., Dobermann, A., Ferraro, B.,
Lanfranco, B., Mondelli, M., Penengo, C., Saldias, R., Silva, M.E. and Soares de Lima, J. (2016b) Translating
the Sustainable Development Goals into action: A participatory backcasting approach for developing
national agricultural transformation pathways. Global Food Security. 10:71-79.
Doi:10.1016/j.gfs.2016.08.002
Kaplan, J.O., Krumhardt, K.M. and Zimmermann, N. (2009) The prehistoric and preindustrial deforestation
of Europe. Quaternary Science Reviews. 28:3016-3034. Doi:10.1016/j.quascirev.2009.09.028
Kastner, T., Rivas, M.J.I., Koch, W. and Nonhebel, S. (2012) Global changes in diets and the consequences
for land requirements for food. Proceedings of the National Academy of Sciences. 109:6868–6872.
Doi:10.1073/pnas.1117054109
Kearney, J. (2010) Food consumption trends and drivers. Philosophical Transactions of The Royal Society
B. 365:2793–2807. Doi:10.1098/rstb.2010.0149
Keats, S. and Wiggins, S. (2014) Future diets: Implications for agriculture and food prices. London: The
Overseas Development Institute.
Keenan, R.J., Reams, G.A., Achard, F., V. de Freitas, J., Grainger, A. and Lindquist, E. (2015) Dynamics of
global forest area: Results from the FAO Global Forest Resources Assessment 2015. Forest Ecology and
Management. 352:9-20. Doi:10.1016/j.foreco.2015.06.014
Kemmitt, S.J., Wright, D., Goulding, K.W.T and Jones, D.L. (2006) pH regulation of carbon and nitrogen
dynamics in two agricultural soils. Soil Biology and Biochemistry. 38:898-911.
Doi:10.1016/j.soilbio.2005.08.006
Kerr, S., Pfaff, A.S.P., Cavatassi, R., Davis, B., Lipper, L., Sanchez, A. and Timmins, J. (2004) Effects of Poverty
on Deforestation: Distinguishing Behavior from Location. Agricultural and Development Economics
Division: ESA Working Paper No. 04-19. Rome (Italy): Food and Agricultural Organization of the United
Nations.
Killeen, T.J., Calderon, V., Soria, L., Quezada, B., Steininger, M.K., Harper, G., Solórzano, L.A. and Tucker,
C.J. (2007) Thirty Years of Land-cover Change in Bolivia. Ambio. 36:600-606.
Killeen, T.J., Guerra, A., Calzada, M., Correa, L., Calderon, V., Soria, L., Quezada, B. and Steininger, M.K.
(2008) Total Historical Land-Use Change in Eastern Bolivia: Who, Where, When, and How Much? Ecology
and Society. 13:Art.36.
King, E., Cavender-Bares, J. Balvanera, P. Mwampamba, T.H. and Polasky, T. (2015) Trade-offs in
ecosystem services and varying stakeholder preferences: evaluating conflicts, obstacles, and
opportunities. Ecology and Society. 20:25. Doi:10.5751/ES-07822-200325
Kirby, K.R., Laurance, W.F., Albernaz, A.K., Schroth, G., Fearnside, P.M., Bergen, S., Venticinque, E.M. and
da Costa, C. (2006) The future of deforestation in the Brazilian Amazon. Futures. 38:432-453.
Doi:10.1016/j.futures.2005.07.011
Kok, K., van Vliet, M., Barlund, I., Dubel, A. and Sendzimir, J. (2011) Combining participative backcasting
and exploratory scenario development: experiences from the SCENES project. Technological Forecasting
and Social Change. 78: 835–851. Doi:10.1016/j.techfore.2011.01.004.
Kosko, B. (1986) Fuzzy Cognitive Maps. International Journal of Man Machine Studies. 24:65-75.
Köthke, M., Leischner, B. and Elsasser P. (2013) Uniform global deforestation patterns- An empirical
analysis. Forest Policy and Economics. 28:23-37. Doi: 10.1016/j.forpol.2013.01.001
6. REFERENCES
132
Lachat, C., Otcehere, S., Roberfroid, D., Abdulai, A., Seret, F.M., Milesevic, J., Xuereb, G, Candeias, V. and
Kolsteren, P. (2013) Diet and physical activity for the prevention of noncommunicable diseases in low-
and middle-income countries: a systematic policy review. PLoS Medicine. 10:e1001465.
Doi:10.1371/journal.pmed.1001465.
Lal, R. (2004) Soil carbon sequestration to mitigate climate change. Geoderma. 123:1-22.
Doi:10.1016/j.geoderma.2004.01.032.
Lal, R. (2006) Enhancing crop yields in the developing countries through restoration of the soil organic
carbon pool in agricultural lands. Land Degradation & Development. 17:197–209. Doi:10.1002/ldr.696
Lambin, E.F., Turner, B.L., Geist, H.J., Agbola, S.B., Angelsen, A., Bruce, J.W., Coomes, O.T., Dirzo, R.,
Fischer, G., Folke, C., George, P.S., Homewood, K., Imbernon, J., Leemans, R., Li, X., Moran, E.F.,
Mortimore, M., Ramakrishnan, P.S., Richards, J.F., Skanes, H., Steffen, W., Stone, G.D., Svedin, U.,
Veldkamp, T.A., Vogel., C. and Xu, J. (2001) The causes of land-use and land-cover change: moving beyond
the myths. Global Environmental Change. 11:261-269.
Lapola, D. M., Martinelli, L. A., Peres, C. A., Ometto, J. P. H. B., Ferreira, M. E., Nobre, C. A., Aguiar, A.P.D.,
Bustamante, M.M.C., Cardoso, M.F., Costa, A.J., Leite, C.C., Sampaio, G., Strassburg, B.N. and Vieira, I.C.G.
(2014) Pervasive transition of the Brazilian land-use system. Nature Climate Change. 4:27–35.
Doi:10.1038/nclimate2056
Larsson, S.C. and Wolk, A. (2006) Meat consumption and risk of colorectal cancer: A meta-analysis of
prospective studies. International Journal of Cancer. 119:2657–2664. Doi:10.1002/ijc.22170
Laurance, W.F., Sayer, J. and Cassman, K.G. (2014) Agricultural expansion and its impacts on tropical
nature. Trends in Ecology & Evolution. 29:107-116. Doi:10.1016/j.tree.2013.12.001
Lavelle, P., Dolédec, S., Arnauld de Sartre, X., Decaëns, T., Gond, V., Grimaldi, M., Oszwald, J., Hubert, B.,
Ramirez, B., Veiga, I., de Souza, S., Santos de Assis, W., Michelotti, F., Martins, M., Feijoo, A., Bommel, P.,
Castañeda, E., Chacon, P., Desjardins, T., Dubs, F., Gordillo, E., Guevara, E., Fonte, S., Hurtado, P.D.P., Lena,
P., Lima, T., Marichal, R., Mitja, D., Miranda, I., Otero, T., Praxedes, C., Poccard, R., de Robert, P.,
Rodriguez, G., Sanabria, C., Tselouiko, S., Velasquez, A., Velasques, E. and Velasquez, J. (2016)
Unsustainable landscapes of deforested Amazonia: An analysis of the relationships among landscapes and
the social, economic and environmental profiles of farms at different ages following deforestation. Global
Environmental Change. 40:137-155. Doi:10.1016/jgloenvcha.2016.04.009
Le Tourneau, F.-M., Marchand, G., Greissing, A., Nasuti, S., Droulers, M., Bursztyn, M., Léna, P. and
Dubreuil, V. (2013) Assessing the impacts of sustainable development projects in the Amazon: the
DURAMAZ experiment. Sustainability Science. 8:199–212. Doi:10.1007/s11625-013-0200-1
Lee, H. and Lautenbach, S. (2016) A quantitative review of relationships between ecosystem services.
Ecological Indicators. 66:340-351. Doi:10.1016/j.ecolind.2016.02.004.
Lenton, T. (2011) 2°C or not 2°C? That is the climate question. Nature. 473:7.
Lentz, G., Connelly, S., Mirosa, M. and Jowett, T. (2018) Gauging attitudes and behaviours: Meat
Consumption and potential reduction. Appetite. 127:230-241. Doi:10.1016/j.appet.2018.04.015
Liang, J., Crowther, T.W., Picard, N., Wiser, S., Zhou, M., Alberti, G., Schulze, E-D., McGuire, D., Bozzato,
F., Pretzsch, H., de-Miguel, S., Paquette, A., Hérault, B., Scherer-Lorenzen, M., Barrett, C.B., Glick, H.B.,
Hengeveld, G.M., Nabuurs, G-J, Pfautsch, S., Viana, H., Vibrans, A.C., Ammer, C., Schall, P., Verbyla, D.,
Tchebakova, N., Fischer, M., Watson, J.V., Chen, H.Y.H., Lei, X., Schelhaas, M-J., Lu, H., Gianelle, D.,
Parfenova, E.I., Salas, C., Lee, E., Lee, B., Kim, H.S., Bruelheide, H., Coomes, D.A., Piotto, D., Sunderland,
T., Schmid, B., Gourlet-Fleury, S., Sonké, B., Tavani, R., Zhu, J., Brandl, S., Vayreda, J., Kitahara, F., Searle,
E.B., Neldner, V.J., Ngugi, M.R., Baraloto, C., Frizzera, L., Balazy, R., Oleksyn, J., Zawila-Niedzwiecki, T.,
6. REFERENCES
133
Bouriaud, O., Bussotti, F., Finér, L., Jaroszewicz, B., Jucker, T., Valladares, F., Jagodzinski, A.M., Peri, P.L.,
Gonmadje, C., Marthy, W., O´Brien, T., Martin, E.H., Marshall, A.R., Rovero, F., Bitariho, R., Niklaus, P.A.,
Alvarez-Loayza, P., Chamuya, N., Valencia, R., Mortier, F., Wortel, V., Engone-Obiang, N.L., Ferreira, L.V.,
Odeke, D.E., Vasquez, R.M., Lewis, S.L. and Reich, P.B. (2016) Positive biodiversity-productivity
relationship predominant in global forests. Science. 354:196. Doi:10.1126/science.aaf8957
Liscow, Z.D. (2013) Do property rights promote investment but cause deforestation? Quasi-experimental
evidence from Nicaragua. Journal of Environmental Economics and Management. 65:241-261.
Doi:10.1016/j.jeem.2012.07.001
Lobell, D. and Burke, M. (2010) On the use of statistical models to predict crop yield responses to climate
change. Agricultural and forest meteorology. 150:1443-1452. Doi:10.1016/j.agrformet.2010.07.008
Lobell, D.B., Schlenker, W. and Costa-Roberts, J. (2011) Climate Trends and Global Crop Production Since
1980. Science. 333:616-620. Doi:10.1126/science.1204531
Lobell, D. and Gourdji, S.M. (2012) The Influence of Climate Change on Global Crop Productivity. Plant
Physiology. 160:1686-1697. Doi:10.1104/pp.112.208298
Louhichi, K., Gomez y Paloma, S., Belhouchette, H., Allen, T., Fabre, Blanco-Fonseca, M., Chenoune, R.,
Acs, S. and Flichman, G. (2013) Modelling Agri-Food Policy Impact at Farm-household Level in Developing
Countries (FSSIM-Dev). Louhichi, K. and Gomez y Paloma, S (Eds). JRC Scientific and Policy Reports.
Lucas, M.M., Stoddard, F.L., Annicchiarico, P., Frías, J., Martínez-Villaluenga, C., Sussman, D., Duranti, M.,
Seger, A., Zander, P.M. and Pueyo, J.J. (2015) The future of lupin as a protein crop in Europe. Frontiers in
Plant Science. 6:705. Doi:10.3389/fpls.2015.00705
Luyssaert, S., Detlef Sculz, E., Börner, A., Knohl, A., Hessenmöller, D., Law, B.E., Ciais, P. and Grace. J. (2008)
Old-growth forests as global carbon sinks. Nature. 455:213-215. Doi:10.1038/nature07276
Macedo, M.N., DeFries, R.S., Morton, D.C., Stickler, C.M., Galford, G.L. and Shimabukuro, Y.E. (2012)
Decoupling of deforestation and soy production in the southern Amazon during the late 2000s.
Proceedings of the National Academy of Sciences. 109:1341-1346. Doi:10.1073/pnas.1111374109
Machovina, B. and Feeley, K.J. (2014) Meat consumption as a key impact on tropical nature: a response
to Laurance et al. Trends in Ecology & Evolution. 29:430-431. Doi:10.1016/j.tree.2014.005.011.
Machovina, B., Feeley, K.J. and Ripple, W.J. (2015) Biodiversity conservation: The key is reducing meat
consumption. Science of the Total Environment. 536:419–431. Doi:10.1016/j.scitotenv.2015.07.022
Magrini, M.B., Anton, M., Cholez, C., Corre-Hellou, G., Duc, G., Jeuffroy, M-H., Meynard, J-M., Pelzer, E.,
Voisin, A-S. and Walrand, S. (2016) Why are grain-legumes rarely present in cropping systems despite their
environmental and nutritional benefits? Analyzing lock-in in the French agrifood system. Ecological
Economics. 126:152–162. Doi:10.1016/j.ecolecon.2016.03.024
Malhi, Y., Roberts, T., Betts, R.A., Killeen, T.J., Li, W. and Nobre, C.A. (2008) Climate Change, Deforestation,
and the Fate of the Amazon. Science. 319:169-172. Doi:10.1126/science.11.46.961
Mangalassery, S., Sparkes, S.S.D.L. and Mooney, J. (2015) Examining the potential for climate change
mitigation from zero tillage. Journal of Agricultural Science. 153:1151-1173.
Doi:10.1017/S0021859614001002
Manners, R. and van Etten, J. (2018) Are agricultural researchers working on the right crops to enable food
and nutrition security under future climates? Global Environmental Change. 53:182-194.
Doi:10.1016/j.gloenvcha.2018.09.010
Mather AS. (1992) The forest transition. Area. 24:367-379.
6. REFERENCES
134
Mbida, C.M., Van Neer, W. Doutrelepont, H. and Vrydaghs, L. (2000) Evidence of Banana Cultivation and
Animal Husbandry During the First Millennium BC in the Forest of Southern Cameroon. Journal of
Archaeological Science. 27:151-162
McAlpine, C.A., Ryan, J.G., Seabrook, L., Thomas, S., Dargusch, P.J., Syktus, J.I., Pielke Sr, R.A., Etter, A.E.,
Fearnside, P.M. and Laurance, W.F. (2010) More than CO2 a broader paradigm for managing climate
change and variability to avoid ecosystem collapse. Current Opinion in Environmental Sustainability. 2:1-
13. Doi:10.1016/j.cosust.2010.10.001
McNeil, D., Verburg, R. and Bursztyn, M. (2012) Institutional context for sustainable development. In:
McNeil, D., Nesheim, I., Brouwer, F. (Eds), Land Use Policies for Sustainable Development. Exploring
Integrated Assessment Approaches. Edward Elgar, Cheltenham, UK, Northampton, MA, USA. Pp.24-44.
McVittie A. and Hussain S.S. (2013) The Economics of Ecosystems and Biodiversity – Valuation Database
Manual. Available at: http://www.teebweb.org/publication/tthe-economics-of-ecosystems-and-
biodiversity-valuation-database-manual/. Last accessed: 25th March 2018
[MEA] Millennium Ecosystem Assessment. (2005) Ecosystems and human well-being: Synthesis.
Washington, DC: Island press
Michalski, F. and Peres, C.A. (2013) Biodiversity Depends on Logging Recovery Time. Science. 339:1521-
1522.
Mildrexler, D., Yang, Z., Cohen, W.B. and Bell, D.M. (2016) A forest vulnerability index based on drought
and high temperatures. Remote Sensing of Environment. 173:314-325. Doi:10.1016/j.rse.2015.11.024
Ministerio de Desarrollo Rural y Tierras. (2014) Plan del Sector Sector Desarrollo Agropecuario 2014 – 2018 “hacia el 2025”. Available at: www.ruralytierras.gob.bo/download.php?file. Accessed: 19th December 2014.
Mittermeier, R.A., Mittermeier, C.G., Brooks, T.M., Pilgrim, J.D., Konstant, W.R., da Fonseca, G.A.B. and
Kormos, C. (2003) Wilderness and biodiversity conservation. Proceedings of the National Academy of
Sciences. 100:10309-10313. Doi:10.1073/pnas.1732458100
Mohammed, A., Tana, T., Singh, P., Korecha, D. and Molla, A. (2017) Management options for rainfed
chickpea (Ciceraritinum L.) in northeast Ehtopia under climate change condition. Climate Risk
Management. 16:222-223. Doi:10.1016/j.crm.2016.12.003
Müller, R., Müller, D., Schierhorn, F., Gerold, G. and Pacheco, P. (2012) Proximate causes of deforestation
in the Bolivian lowlands: an analysis of spatial dynamics. Regional Environmental Change. 12:445-459.
Doi:10.1007/s10113-011-0259-0
Müller, R., Pacheco, P. and Montero, J.C. (2014) The context of deforestation and forest degradation in
Bolivia: drivers, agents and institutions. Centre for International Forestry Research, Bogot Barat
(Indonesia)
Municipality of Ascension de Guarayos. (2006) Gobierno Municipal de Ascension de Guarayos Plan
Internacional: Plan de Desarrollo Municipal 2006-2010. Diagnostico Municipal. Available at:
https://es.slideshare.net/doctora_edilicia/pdm-ascensin-de-guarayos. Last accessed 8th April 2018.
Nassauer, J.I. and Corry, R.C. (2004) Using normative scenarios in landscape ecology. Landscape Ecology.
19:343–356. Doi:10.1023/B:LAND.0000030666.55372.ae.
Naumann, G., Barbosa, P., Garrote, L., Iglesias, A. and Vogt, J. (2014) Exploring drought vulnerability in
Africa: an indicator based analysis to be used in early warning systems. Hydrology and Earth System
Sciences. 18:1591-1604. Doi:10.5194/hess-18-1591-2014
6. REFERENCES
135
Nelson, E., Polasky, S. Lewis, D.J. Plantinga, A.J. Lonsdorf, E. White, D. Bael, D. and Lawler, J.J. (2008)
Efficiency of incentives to jointly increase carbon sequestration and species conservation on a landscape.
Proceedings of the National Academy of Sciences. 105:9471-9476. Doi:10.1073/pnas.0706178105
Nepstad, D.C., Stickler, C., Soares-Filho, B. and Merry, F. (2008) Interactions among Amazon land use,
forests and climate: prospects for a near-term forest tipping point. Philosophical Transactions of The Royal
Society B. 363:1737-1746. Doi:10.1098/rtsb.2007.0036
Nepstad, D., McGrath, D., Stickler, C., Alencar, A., Azevedo, A., Swette, B., Bezerra, T., DiGiano, M.,
Shimada, J., Seroa da Motta, R., Armijo, E., Castello, L., Brando, P., Hansen, M.C., McGrath-Horn, M.,
Carvalho, O. and Hess, L. (2014) Slowing Amazon deforestation through public policy and interventions in
beef and soy supply chains. Science. 344:1118-1123. Doi:10.1126/science.1248525
Neuvonen, A., Kaskinen, T., Leppänen, J., Lähteenoja, S., Mokka, R. and Ritola, M. (2014) Low-carbon
futures and sustainable lifestyles: A backcasting scenario approach. Futures. 58:66-76.
Doi:10.1016/j.futures.2014.01.004
Newton, P., Agrawal, A. and Wollenberg, L. (2013) Enhancing the sustainability of commodity supply
chains in tropical forest and agricultural landscapes. Global Environmental Change. 23:1761-1722.
Doi:10.1016/j.gloenvcha.2013.08.004
Nobre, C.A., Sampaio, G., Borma, L.S., Castilla-Rubio, J.C., Silva, J.S. and Cardoso, M. (2016) Land-use and
climate change risks in the Amazon and the need of a novel sustainable development paradigm.
Proceedings of the National Academy of Sciences. 113:10795-10768. Doi:10.1073/pnas.1605516113
Nordgren, A. (2012) Ethical Issues in Mitigation of Climate Change: The Option of Reduced Meat
Production and Consumption. Journal of Agricultural and Environmental Ethics. 25:563-584.
Doi:10.1007/s10806-011-9335-1
Nurdina, A. and Risdiyanto, I. (2015) Indicator Determination of Forest and Land Fires Vulnerability Using
Landsat-5 TM Data (Case Study: Jambi Province). Procedia Environmental Sciences. 24:141-151.
Doi:10.1016/j.proenv.2015.03.019
[OECD] Organisation for Economic Co-operation and Development. (2008) Handbook on constructing
composite indicators: methodology and user guide. Paris (France): Organisation for Economic Co-
operation and Development.
Oliveira, L.J.C., Costa, M.H., Soares-Filho, B.S. and Coe, M.T. (2013) Large-scale expansion of agriculture in
Amazonia may be a no-win scenario. Environmental Research Letters. 8: 024021. Doi:10.1088/1748-
9326/8/2/024021
Ostrom, E. and Cox, M. (2010) Moving beyond panaceas: a multi-tiered diagnostic approach for social-
ecological analysis. Environmental Conservation. 37:451-463. Doi:10.1017/S0376892910000834
Paneque- Gálvez, J., Mas, J-F., Guéze, M., Luz, A.C., Macía, M.J., Orta-Martínez, M., Pino, J. and Reyes-
García, V. (2013) Land tenure and forest cover change. The case of southwestern Beni, Bolivian Amazon,
1986-2009. Applied Geography. 43:113-126. Doi:10.1016/j.apgeog.2013.06.005
Peña-Claros, M., Poorter,L., van der Sande, M., Arets, A., Ascarrunz, N., Boit, A., Hoosbeek, B.,
Sakschewski, K., Thonicke., K. and M. Toledo. (2014) Quantifying the spatial relationship between
biodiversity and climate change mitigation at different scales (site and regional), along environmental
gradients (precipitation and soil fertility) in undisturbed forests and across land use intensities. Deliverable
D1.1.2, ROBIN Project. European Commission. EU Project (283093) Role Of Biodiversity In climate change
mitigation Deliverable.
6. REFERENCES
136
Peres, C.A., Gardner, T.A., Barlow, J., Zuanon, J., Michalski, F., Lees, A.C., Vieira, I.C.G., Moreira, F.M.S. and
Feeley, K.J. (2010) Biodiversity conservation in human-modified Amazonian forest landscapes. Biological
Conservation. 143:2314-2327. Doi:10.1016/j.biocon.2010.01.021
Perz, S.G., Qiu, Y., Xia, Y., Southworth, J., Sun, J., Marsik, M., Rocha, K., Passos, V., Rojas, D., Alarcón, G.,
Barnes, G. and Baraloto, C. (2013) Trans-boundary infrastructure and land cover change: Highway paving
and community-level deforestation in a tri-national frontier in the Amazon. Land Use Policy. 34:27-41.
Doi:10.1016/j.landusepol.2013.01.009
Phalan, B., Onial, M., Balmford, A., and Green, R.E. (2011) Reconciling Food Production and Biodiversity
Conservation: Land Sharing and Land Sparing Compared. Science. 333:1289-1291.
Doi:10.1126/science.1208742
Piikki, K., Winowiecki, L., Vagen, T-G., Ramirez-Villegas, J. and Söderström, M. (2017) Improvement of
spatial modelling of crop suitability using a new digital soil map of Tanzania. South African Journal of Plant
and Soil. 34:243-254 Doi:10.1080/02571862.2017.1281447
Pilorge, E. and Muel, F. (2016) What vegetable oils and proteins for 2030? Would the fraction be the future
of oil and protein crops. OCL. 23:D402. Doi: 10.1051/ocl/2016030
Pinho, P.F., Patenaude, G., Ometto, J.P., Meir, P., Toledo, P.M., Coelho, A. and Frickmann-Young, C.E.
(2014) Ecosystem protection and poverty alleviation in the tropics: Perspective from a historical evolution
of policy-making in the Brazilian Amazon. Ecosystem Services. 8:97-109.
Doi:10.1016/j.ecoser.2014.03.002
Polasky, S., Nelson, E., Camm, J., Csuti, B., Fackler, P., Lonsdorf, E., Montgomery, C., White, D., Arthur, J.,
Garbey-Yonts, B., Haight, R., Kagan, J., Starfield, A. and Tobalske, C. (2008) Where to put things? Spatial
land management to sustain biodiversity and economic returns. Biological Conservation. 141:1505-2524.
Doi:10.1016/j.biocon.2008.03.022
Poore, J. and Nemecek, T. (2018) Reducing food’s environmental impacts through producers and
consumers. Science. 360:987:992. Doi:10.1126/science.aaq0216
Popkin, B.M (1997) The nutrition transition and its health implications in lower-income countries. Public
Health Nutrition. 1:5-21
Porfirio, L.L., Newth, D., Harman, I.N., Finnigan, J.J. and Ca, Y. (2017) Patterns of crop cover under future
climates. Ambio. 46:265-276. Doi: 10.1007/s13280-016-0818-1
Porter- Bolland, L., Ellis, E.A., Gholz, H.L. (2007) Land use dynamics and landscape history in La Montaña,
Campeche, Mexico. Landscape and Urban Planning. 82:198-207. Doi:10.1016/j.landurbplan.2007.02.008
Power, A.G. (2010) Ecosystem services and agriculture: tradeoffs and synergies. Philosophical
Transactions of the Royal Society B. 365:2959–2971. Doi:10.1098/rstb.2010.0143
Powlson, D.S., Stirling, C.M. Thierfelder, C. White, R.P. and Jat, M.L. (2016) Does conservation agriculture
deliver climate change mitigation through soil carbon sequestration in tropical agro-ecosystems?
Agriculture, Ecosystems and Environment. 220:164-174. Doi:10.1016/j.agree.2016.01.005
Prefectura del Departamento de Santa Cruz. (2007) Mapa de Cobertura y Uso Actual de la Tierra para el
Depto. De Santa Cruz -2005. Available at:
http://www.santacruz.gob.bo/sczturistica/medioambiente/ordenamiento_plandptal/contenido/665/30
0300. Last accessed: 12th June 2014
Pretzsch, H., Grote, R., Reineking, B., Rötzer, T. and Seifert, S. (2008) Models for Forest Ecosystem
Management: A European Perspective. Annals of Botany. 101:1065-1087. Doi:10.1093/aob/mcm246
6. REFERENCES
137
Rae, A. and Nayga, R. (2010) Chapter 2 Trends in consumption, production and trade in livestock and
livestock products. In Steinfeld, H., Mooney, H., Schneider, F. and Neville, L (Eds), Livestock in a changing
landscape, Vol. 1: Drivers, consequences, and responses. Island Press, Washington, DC. Pp: 11-33.
Raftery. A.E., Zimmer, A., Frierson, D.M.W., Startz,R. and Liu, P. (2017) Less than 2ºC warming by 2100
unlikely. Nature Climate Change. Doi:10.1038/NCLIMATE3352
Ranganathan, J., Vennard, D., Waite, R., Dumas, P., Lipinski, B., Searchinger, T. (2016) Shifting Diets for a
Sustainable Food Future. World Resources Institute Working Paper.
Ramankutty, N., Evan, A., Monfreda, C. and Foley, J.A. (2008) Farming the planet: 1. Geographic
distribution of global agricultural lands in the year 2000. Global Biogeochemical Cycles. 22:GB1003.
Doi:10.1029/2007GB002952
Ramirez, J. and Jarvis, A. (2010) Downscaling global circulation model outputs: the delta method. Decision
and Policy Analysis Working Paper No. 1. Decision and Policy Analysis. International Center for Tropical
Agriculture (CIAT), Cali (Colombia).
Ramirez-Cabral, N.Y.Z, Kumar, L. and Taylor, S. (2016) Crop niche modelling projects major shifts in
common bean growing areas. Agricultural and Forest Meteorology. 219:102-113. Doi:
10.1016/j.agroformet.2015.12.002
Ramirez-Villegas, J., Jarvis, A. and Laderach, P. (2013) Empirical approaches for assessing impacts of
climate change on agriculture: The EcoCrop model and a case study with grain sorghum. Agricultural and
Forest Meteorology. 170:67-78. Doi: 10.1016/j.agrformet.2011.09.005
Rastogi, A. and Shukla, S. (2013) Amaranth: a new millennium crop of nutraceutical values. Critical Reviews
in Food Science and Nutrition. 53:109–125. Doi:10.1080/10408398.2010.517876
Raudsepp-Hearne, C., Peterson, G.D., Tengö, M., Bennett, E.M., Holland, T., Benessaiah, K., MacDonald,
G.K. and Pfeifer, L. (2010) Untangling the Environmentalist´s Paradox: Why is Human Well-being
Increasing as Ecosystem Services Degrade. BioScience. 60:576-589. Doi:10.1525/bio.2010.60.8.4
Redo, D., Millington, A.C. and Hindery, D. (2011) Deforestation dynamics and policy changes in Bolivia’s
post-neoliberal era. Land Use Policy. 28:227-241. Doi:10.1016/j.landusepol.2010.06.004
Rengel, Z. (2002) Role of pH in Availability of Ions in Soil. In: Rengel, Z. (Ed) Handbook of plant growth. pH
as the master variable. Marcel Dekker Inc, New York
Rengel, Z. (2011) Soil pH, soil health and climate change. In: Singh, B.P., Cowie, A.L. and Chan, K.Y. (Eds)
Soil Health and Climate Change. Springer, Berlin Heidelberg. Pp 68-95
Richards, P.D., Myers, R.J., Swinton, S.M. and Walker, R.T. (2012) Exchange rates, soybean supply
response, and deforestation in South America. Global Environmental Change. 22:454-462.
Doi:10.1016/j.gloenvcha.2012.01.004
Rights and Resources. (2006) Informe inversiones Bolivia: Casos territorios Guarayos y Multiétnico II.
Available at: https://rightsandresources.org/wp-content/exported-
pdf/11cedl03anexo1aestudiobolivia.pdf. Last accessed 8th April 2018
Ritchie, H., Reay, D.S. and Higgins, P. (2018) The impact of global dietary guidelines on climate change.
Global Environmental Change. 49:46-55. Doi:10.1016/j.gloenvcha.2018.02.005
Robinson, J. (1982) Energy backcasting: a proposed method of policy analysis. Energy Policy. 10:337-344.
Robinson, J. (1988) Unlearning and backcasting: rethinking some of the questions we ask about the future.
Technological Forescasting and Social Change. 33:325-338.
6. REFERENCES
138
Robinson, J. (2003) Future subjunctive: backcasting as social learning. Futures. 35:839-856.
Rodrigues, A.S.L., Ewers, R.M., Parry, L., Souza Jr, C., Veríssimo, A. and Balmford, A. (2009) Boom-and-Bust
Development Patterns Across the Amazon Deforestation Frontier. Science. 324:1435-1437.
Doi:10.1126/science.1174002
Rodrigues-Filho, S., Verburg, R., Bursztyn, M., Lindoso, D., Debortoli, N. and Vilhena, A.M.G. (2015)
Election-driven weakening of deforestation control in the Brazilian Amazon. Land Use Policy. 43: 111–118.
Doi:10.1016/j.landusepol.2014.11.002
Roebeling, P.C. and Hendrix, E.M.T. (2010) Land speculation and interest rate subsidies as a cause of
deforestation: The role of cattle ranching in Costa Rica. Land Use Policy. 27:489-496.
Doi:10.1016/j.landusepol.2009.07.002
Rosa, I.M.D., Smith, M.J., Wearn, O.R., Purves, D. and Ewers, R. (2016) The Environmental Legacy of
Modern Tropical Deforestation. Current Biology. 26:2161-2166. Doi:10.1016/j.cub.2016.06.013
Rosenzweig, C., Elliot, J., Deryng, D., Ruane, A.C., Müller, C., Arneth, A., Boote, K.J., Folberth, C., Glotter,
M., Khabarov, N., Neumann, K., Piontek, F., Pugh, T.A.M., Schmid, E., Stehfest, E., Yang, H. and Jones, J.W.
(2014) Assessing agricultural risks of climate change in the 21st century in a global gridded crop model
intercomparison. Proceedings of the National Academy of Sciences. 111:3268-3273.
Doi:10.1073/pnas.1222463110
Rudel, T, and Roper, J. (1997) The Paths to Rain Forest Destruction: Crossnational Patterns of Tropical
Deforestation, 1975-90. World Development. 25:53-65.
Ruiz, K.B., Biondi, S., Oses, R., Acu-a-Rodríguez, I.S., Antognoni, F., Martinez-Mosqueira, E.A., Coulibaly,
A., Canahua-Murillo, A., Pinto, M., Zurita-Silva, A., Bazile, D., Jacbosen, S-E. and Molina-Montenegro, M.A.
(2014) Quinoa biodiversity and sustainability for food security under climate change. A review. Agronomy
for Sustainable Development. 34:349-359. Doi:10.1007/s13593-013-0195-0
Saatchi, S. S., Harris, N.L., Brown, S., Lefsky, M., Mitchard, E.T.A., Salas, W., Zutta, B.R., Buermann, W.,
Lewis, S.L., Hagen, S., Petrova, S., White, L., Silman, M. and Morel, A. (2011) Benchmark map of forest
carbon stocks in tropical regions across three continents. Proceedings of the National Academy of
Sciences. 108:9899- 9904. Doi:10.1073/pnas.1019576108
Salon, C., Avice, J-C., Larmure, A., Ourry, A., Prudent, M. and Voisin, A-S. (2011) Plant N Fluxes and
Modulation by Nitrogen, Heat, and Water Stresses: A Review Based on Comparison of Legumes and non-
legumes plants. In: Shanker, A.K. and Venkateswarlu, B. (Eds) Abiotic Stress in Plants- Mechanisms and
Adaptations. InTech. Pp.79- 119.
Salter, J., Robinson, J. and Wiej, A. (2010) Participatory methods of integrated assessment- a review.
Advanced Review. 1:697-717. Doi:10.1002/wcc.73
Sandifer, P.A., Sutton-Grier, A.E. and Ward, B.P. (2015) Exploring connections among nature, biodiversity,
ecosystem services, and human health and well-being: opportunities to enhance health and biodiversity
conservation. Ecosystem Services. 12: 1–15. Doi:10.1016/j.ecoser.2014.12.007
Sans, P. and Combris, P. (2015) World meat consumption patterns: An overview of the last fifty years
(1961 – 2011). Meat Science. 109:106–111. Doi:10.1016/j.meatsci.2015.05.012
Santra, D.K. and Schoenlechner, R. (2017) Amaranth Part 2- Sustainability, Processing and Applications of
Amaranth. In: Nadathur, S., Wabasybdara, J.P.D. and Scanlin, L. (Eds) Sustainable Protein Source. Elsevier,
Amsterdam, Boston, Heidelberg, London, New York, Oxford, Paris, San Diego, San Francisco, Singapore,
Sydney, Tokyo. Pp: 257- 264. Doi: 10.1016/B978-0-12-802778-3.000016-0
6. REFERENCES
139
Sartore, G.M., Kelly, B., Stain, H.J., Albrecht, G. and Higginbotham, N. (2008) Control, uncertainty, and
expectations for the future: a qualitative study of the impact of drought on a rural Australian community.
Rural Remote Health. 8:950–964.
Saxe, H., Larsen, T.M. and Mogensen, L. (2013) The global warming potential of two healthy Nordic diets
compared with the average Danish diet. Climatic Change. 116:249-262. Doi:10.1007/s10584-012-0495-4
Sayer, J., Sunderland, T., Ghazoul, J., Pfund, J-L., Sheil, D., Meijaard, E., Venter, M., Boedhihartono, A.K.,
Day, M., Garcia, C., van Oosten, C. and Buck, L.E. (2013) Ten principles for a landscape approach to
reconciling agriculture, conservation, and other competing land uses. Proceeding of the National Academy
of Sciences. 110:8349–8356. Doi:10.1073/pnas.1210595110
Schader, C., Muller, A., Scialabba, N.E-H., Hecht, J., Isensee, A., Erb, K-H., Smith, P., Makkar, H.P.S., Klocke,
P., Leiber, F., Schwegler, P., Stolze, M. and Niggli, U. (2015) Impacts of feeding less food-competing
feedstuffs to livestock on global food system sustainability. Journal of the Royal Society Interface.
12:20150891. Doi:10.1098/rsif.2015.0891
Schimel, D., Stephens, B.B. and Fisher, J.B. (2015) Effect of increasing CO2 on the terrestrial carbon cycle.
Proceedings of the National Academy of Sciences. 112:436-441. Doi:10.1073/pnas.1407302112
Schneider, A.V.C. (2002) Overview of the market and consumption of pulses in Europe. British Journal of
Nutrition. 88:243. Doi: 10.1079/BJN2002713
Schreuder, R. and de Visser, C. (2014) Report EIP-AGRI focus group protein crops. Available at:
http://ec.europa.eu/eip/agriculture/sites/agri-eip/files/fg2_protein_crops_final_report_2014_en.pdf).
Last accessed 22 March 2017
Schroder, S.A., Tóth, S.F., Deal, R.L. and Ettl, G. (2016) Multi-objective optimization to evaluate tradeoffs
among forest ecosystem services following fire hazard reduction in the Deschutes National Forest, USA.
Ecosystem Services. 22:328-347. Doi:10.1016/j.ecoser.2016.08.006
Scrieciu, S.S. (2007) Can economic causes of tropical deforestation be identified at a global scale?
Ecological Economics. 62:603-612. Doi:10.1016/j.ecolecon.2006.07.028
Sethi, T., Custer, S., Turner, J., Sims, J., DiLorenzo, M. and Latourell, R. (2017) Realizing Agenda 2030: Will
Donor Dollars and Country Priorities Align with Global Goals? Aid Data at the College of William & Mary,
Williamsburg, VA.
Sharmina, M. (2017) Low-carbon scenarios for Russia’s energy system: A participative backcasting
approach. Energy Policy. 104:303-315. Doi:10.1016/jenpol.2017.02.009.
[SIAP] Servicio de Información Agroalimentaria y Pesquera. (2010) Producción Agrícola por Estado
Available from: http://www.siap.gob.mx/cierre-de-la-produccion-agricola-por-estado/. Last accessed 4th
October 2014
[SIAP] Servicio de Información Agroalimentaria y Pesquera. (2018a) Anuario Estadístico de la Producción
Agrícola. Available at: http://nube.siap.gob.mx/cierre_agricola/. Last accessed: 5th April 2018
[SIAP] Servicio de Información Agroalimentaria y Pesquera. (2018b) Avance de Siembras y Cosechas:
Resumen nacional por estado. Available at:
http://infosiap.siap.gob.mx:8080/agricola_siap_gobmx/AvanceNacionalCultivo.do. Last accessed: 5th
April 2018
[SIAP] Servicio de Información Agroalimentaria y Pesquera. (2018c) Producción Ganadera. Available at:
https://www.gob.mx/siap/acciones-y-programas/produccion-pecuaria. Last accessed 5th April 2018
6. REFERENCES
140
Simane, B., Zaitchik, B.F. and Foltz, J.D. (2016) Agroecosystem specific vulnerability analysis: application
of the livelihood vulnerability index to a tropical highland region. Mitigation and Adaptation Strategies for
Global Change. 21:39-65. Doi:10.1007/s11027-014-9568-1
Simmons, C.S. (2004) The political economy of land conflict in the eastern Brazilian Amazon. Annals of the
Association of American Geography. 94:183–206
Sisto, R., Lopolito, A. and van Vliet, M. (2018) Stakeholder participation in planning rural development
strategies: Using backcasting to support Local Action Groups in complying with CLLD requirements. Land
Use Policy. 70:442-450. Doi:10.1016/j.landusepol.2017.11.022
Sloan, S. (2008) Reforestation amidst deforestation: Simultaneity and succession. Global Environmental
Change. 18:425-441. Doi:10.1016/j.gloenvcha.2008.04.009
Smil, V. (2000) Feeding the World: A Challenge for the Twenty-First Century. MIT Press, Boston
Smith, P., Bustamante, M., Ahammad, H., Clark, H., Dong, H., Elsiddig, E.A., Haberl, H., Harper, R., House,
J., Jafari, M., Masera, O., Mbow, C., Ravindranath, N.H., Rice, C.H., Abad, C.R., Romanovskaya, A., Sperling,
F. and Tubiello, F.N. (2014). Agriculture, Forestry and Other Land Use (AFOLU). In: Edenhofer, O., Pichs-
Madruga, R., Sokona, Y., Farahani, E., Kadner, S., Seyboth, K., Adler, A., Baum, I., Brunner, S., Eickemeier,
P., Kriemann, B., Savolainen, J., Schlömer, S., von Stechow, C., Zwickel, T. and Minx, J.C. (Eds.): Climate
Change 2014: Mitigation of Climate Change. Contribution of Working Group III to the Fifth Assessment
Report of the Intergovernmental Panel on Climate Change. Cambridge University Press, Cambridge,
United Kingdom and New York, NY, USA.
Soria-Lara, J.A. and Banister, D. (2018) Collaborative backcasting for transport policy scenario building.
Futures. 95:11-21. Doi:10.1016/j.futures.2017.09.003
Southworth, J., Marsik, M., Qiu, Y., Perz, S., Cumming, G., Stevens, F., Rocha, K., Duchelle, A. and Barnes
G. (2011) Roads as Drivers of Change: Trajectories across the Tri-National Frontier in Map, the
Southwestern Amazon. Remote Sensing. 3:104-1066. Doi:10.3390/rs3051047
Spracklen, D.V. and Garcia-Carreras, L. (2015) The impact of Amazonian deforestation on Amazon basin
rainfall. Geophysical Research Letters. 42: 9546-9552. Doi:10.1002/2015GL066063
Springmann, M., Godfray, H.C.J., Rayner, M. and Scarborough, P. (2016) Analysis and valuation of the
health and climate change cobenefits of dietary change. Proceedings of the National Academy of Sciences.
113:4146–4151. Doi:10.1073/pnas.1523119113
Springmann, M., Mason-D’Croz, D., Robinson, S., Wiebe, K., Godfray, H.C.J., Rayner, M. and Scarborough,
P. (2017) Mitigation potential and global health impacts from emissions pricing of food commodities.
Nature Climate Change. 7:69-74. Doi:10.1038/NCLIMATE3155
Staniford, A.K., Dollard, M.F. and Guerin, B. (2009) Stress and help-seeking for droughtstricken citrus
growers in the Riverland of South Australia. Australian Journal of Rural Health. 17:147–154.
Doi:10.1111/j.1440-1584.2009.0105.x
Steinfeld, H., Gerber, P., Wassenaar, T., Castel, V., Rosales, M. and de Haan, C. (2006) Livestock’s long
shadow: environmental issues and options. Food and Agricultural Organization.
Steininger, M.K., Tucker, C.J., Townshend, J.R.G, Killeen, T.J., Desch, A., Bell, V. and Ersts, P. (2001) Tropical
deforestation in the Bolivian Amazon. Environmental Conservation. 28:127-134.
Steward, C. (2007) From colonization to “environmental soy”: A case study of environmental and socio-
economic valuation in the Amazon soy frontier. Agriculture and Human Values. 24:107-122.
Doi:10.1007/s10460-006-9030-4
6. REFERENCES
141
Stoddard, F.L., Hovinen, S., Kontturi, M., Lindström, K. and Nykänen, A. (2009) Legumes in Finnish
agriculture: history, present status and future prospects. Agricultural and Food Science. 18:191-205.
Doi:10.2137/145960609790059578
Swart, R.J., Raskin, P. and Robinson, J.B. (2004) The problem of the future: sustainability science and
scenario analysis. Global Environmental Change. 14:137–146. Doi:10.1016/j.gloenvcha.2003.10.002.
Swenson, J.J., Carter, C.E., Domec, J-C. and Delgado, C.I. (2011) Gold mining in the Peruvian Amazon:
global prices, deforestation, and mercury imports. PLoS One. 6:e18875.
Doi:10.1371/journal.pone.0018875
Tejada, G., Dalla-Nora, E., Cordoba, D., Lafortezza, R., Ovando, A., Assis, T. and Aguiar, A.P. (2016)
Deforestation scenarios for the Bolivian lowlands. Environment Research. 144B:49-63.
Doi:10.1016/j.envres.2015.10.010.
Tilman, D., May, R.M., Lehman, C.L. and Nowak, M.A. (1994) Habitat destruction and the extinction debt.
Nature. 371: 65-66.
Tilman, D., Balzer, C., Hill, J. and Befort, B.L. (2011) Global food demand and the sustainable intensification
of agriculture. Proceedings of the National Academy of Sciences. 108:20260–20264.
Doi:10.1073/pnas.1116437108
Tilman, D. and Clark, M. (2014) Global diets link environmental sustainability and human health. Nature.
515:518–522. Doi: 10.1038/nature13959
Tubiello, F.N., Salvatore, M., Rossi, S., Ferrara, A., Fitton, N. and Smith, P. (2013) The FAOSTAT database
of greenhouse gas emissions from agriculture. Environmental Research Letters. 8:15009.
Doi:10.1088/1748-9326/8/1/015009
Turner, B.L., Kasperson, R.E., Matson, P.A., McCarthy, J.J., Corell, R.W., Christensen, L., Eckley, N.,
Kasperson, J.X., Luers, A., Martello, M.L., Polsky, C., Pulsipher, A. and Schiller, A. (2003) A framework for
vulnerability analysis in sustainability science. Proceedings of the National Academy of Science. 100:8074-
8079. Doi:10.1073/pnas.1231335100
Tol, R.S., Downing, T.E., Kuik, O.J. and Smith, J.B. (2004) Distributional aspects of climate change impacts.
Global Environmental Change. 14:259-272. Doi:10.1016/j.gloenvcha.2004.04.007
UN Comtrade. (2017) UN Comtrade Database. Available at: https://comtrade.un.org/data/. Last accessed
10th November 2017.
[UNDP] United Nations Development Programme. (2004) Interculturalismo y Globalización: La Bolivia
Posible. Informe Nacional de Desarrollo Humano 2004. Available at:
http://hdr.undp.org/sites/default/files/bolivia_2004_sp.pdf. Last accessed: 24th November 2017
[UNDP] United Nations Development Programme. (2016) Human Development Report 2016: Human
Development for Everyone. Available at:
http://hdr.undp.org/sites/default/files/2016_human_development_report.pdf. Last accessed: 4th April
2018
[UNDP] United Nations Development Programme. (2010) Assessing the Environmental Impacts of
Consumption and Production: Priority Products and Materials. A Report of the Working Group on the
Environmental Impacts of Products and Materials to the International Panel for Sustainable Resource
Management.
University of Texas. (2010) Latin American Electoral Data. Available at:
http://lanic.utexas.edu/laeda/directories/electoral/. Last accessed 10th October 2014.

6. REFERENCES
142
[USDA] United States Department of Agriculture. (2017) USDA Food Composition Databases. Available at:
https://ndb.nal.usda.gov/ndb/search/list. Last accessed: 17th October 2017.
Valverde, P., de Carvalho, M., Serralheiro, R., Maia, R., Ramos, V. and Oliveira, B. (2015) Climate change
impacts on rainfed agriculture in the Guadiana river basin (Portugal). Agricultural Water Management.
150:35-45. Doi:10.1016/j.agwat.2014.11.008
van de Kerkhof, M. (2006) A dialogue approach to enhance learning for sustainability. A Dutch experiment
with two participatory methods in the field of climate change. The Integrated Assessment Journal. 6:7–
34.
van Berkel, D.B. and Verburg, P.H. (2012) Combining exploratory scenarios and participatory backing:
using an agent-based model in participatory policy design for multi-functional landscape. Landscape
Ecology. 27:641-658. Doi:10.107/s10980-012-9730-7
van Vliet, M. (2011) Bridging Gaps in the Scenario World? Linking Stakeholders, Modellers and Decision
Makers. Land Dynamics Group. Ph.D. Thesis. Wageningen University, Netherlands.
van Vliet, M. and Kok, K. (2013) Combining backcasting and exploratory scenarios to develop robust water
strategies in face of uncertain futures. Mitigation and Adaptation Strategies for Global Change. 20:43-74.
Doi:10.1007/s11027-013-9479-6
Varela-Ortega, C., Blanco, I., Manners, R., Esteve, P., Kok, K., Toledo, M., Martorano, L., Simoes, M., Diniz,
F., Lazos, E. and Gerritsen, P. (2014) Methods and Results from the first and second of local stakeholder
meetings- Part 1. Deliverable D3.1.3, ROBIN Project (Role of Biodiversity In climate change mitigatioN)
(number 283093). European Commission, Brussels
Varela-Ortega, C., Blanco, I., Manners, R., Esteve, P., Tarquis, A., Barrios, L., Martorano, L., Ascarrunz, N.,
Toledo, M., Simoes, M. and Sotta, E. (2015) Identifying options for integrating biodiversity conservation
and climate change mitigation: A multi-scale perspective. Deliverable D3.1.4, ROBIN Project. European
Commission. EU Project (283093) Role Of Biodiversity In climate change mitigatioN Deliverable.
Varela-Ortega, C., Blanco-Gutiérrez, I., Esteve, P., Bharwani, S., Fronzek, S. and Downing, T.E. (2016). How
can irrigated agriculture adapt to climate change? Insights from the Guadiana Basin in Spain. Regional
Environmental Change. 16:59-70. Doi:10.1007/s10113-014-0720-y
Verburg, R., Rodrigues-Filho, S., Debortoli, N., Lindoso, D., Nesheim, I. and Bursztyn, M. (2014) Evaluating
sustainability options in an agricultural frontier of the Amazon using multi-criteria analysis. Land Use
Policy. 37:27-39. Doi:10.1016/j.landusepol.2012.12.005
Vermeulen, S.J., Campbell, B.M. and Ingram, J.S.I. (2012) Climate Change and Food Systems. Annual
Review of Environment and Resources. 37:195-222. Doi:10.1146/annurev-environ-020411-130608
Vermeulen, S.J., Challinor, A.J., Thornton, P.K., Campbell, B.M., Eriyagama, N., Vervoort, J.M., Kingyangi,
J., Jarvis, A., Läderbach, P., Ramirez-Villegas, J., Nicklin, K.J., Hawkins, E. and Smith, D.R. (2013) Addressing
uncertainty in adaptation planning for agriculture. Proceedings of the National Academy of Science.
110:8357-8362. Doi: 10.1073/pnas.1219441110
Vervoort, J.M., Thornton, P.K., Kristjanson, P., Förch, W., Ericksen, P.J., Kok, K., Ingram, J.S.I., Herrero, M.,
Palazzo, A., Helfgott, A.E.S., Wilkinson, A., Havlík, P., Mason-D´Croz, D. and Jost, C. (2014) Challenges to
scenario-guided adaptive action on food security under climate change. Global Environmental Change.
28:383-394. Doi:10.1016/j.gloenvcha.2014.03.001
Viglizzo, E.F. and F.C. Frank. (2006) Land-use options for Del Plata Basin in South America: Tradeoffs
analysis based on ecosystem service provision. Ecological Economics. 57:140-151.
Doi:10.1016./j.ecolecon.2005.03.025
6. REFERENCES
143
Vilar, L., Camia, A. and San-Miguel-Ayanz, J. (2014) Modelling socio-economic drivers of forest fires in the
Mediterranean Europe. Advances in Forest Fire Research. Doi:10.14195/978-989-26-0884-6_209
Vincent K. (2004) Creating an index of social vulnerability to climate change for Africa. Tyndall Centre for
Climate Change Research, Working Paper, 56. Norwich (UK): Tyndall Centre for Climate Change Research.
Vogt, D.J., Vogt, K.A., Gmur, S.J., Scullion, J.J., Suntana, A.S., Daryanto, S. and Sigurdardóttir, R. (2016)
Vulnerability of tropical forest ecosystems and forest dependent communities to droughts. Environmental
Research. 144:27-38. Doi:10.1016/j.envres.2015.10.022
Voisin, A-S., Guéguen, J., Huyghe, C., Jeuffroy, M-H., Magirini, M-B., Meynard, J-M., Mougel, C., Pellerin,
S. and Pelzer, E. (2014) Legumes for feed, food, biomaterials and bioenergy in Europe: a review. Agronomy
for Sustainable Development. 34:361-380. Doi:10.1007/s13593-013-0189-y
Von Thünen, J. E. (1826) Der Isolierte Staat. Wartenberg, C.M (translated, 1966), Hall, P (Ed) edited and
introduced by P. Hall. Pergamon Press, UK
Vranken, L., Avermaete, T., Petalios, D. and Mathijs, E. (2014) Curbing global meat consumption: Emerging
evidence of a second nutrition transition. Environmental Science & Policy. 39:1–12. Doi:
10.1016/j.envsci.2014.02.009
Walker, R., Browder, J., Arima, E., Simmons, C., Pereira, R., Caldas, M., Shirota, R. and Zen, S. (2009)
Ranching and the new global range: Amazónia in the 21st century. Geoforum. 40:732-745.
Doi:10.1016/j.geoforum.2008.10.009
Watson, C.A., Reckling, M., Preissel, S., Bachinger, J., Bergkvist, G., Kuhlman, T., Lindstöm, K., Nemecek,
T., Topp, C.F.E., Vanhatalo, A., Zander, P., Murphy-Bokern, D. and Stoddard, F.L. (2017) Grain legume
Production and Use in European Agricultural Systems. Advances in Agronomy. 144:235–303.
Doi:10.1016/bs.agron.2017.03.003
Wehkamp, J., Koch, N., Lübbers, S. and Fuss, S. (2018) Governance and deforestation- a meta-analysis in
economics. Ecological Economics. 144:214-227. Doi:10.1016/j.ecolecon.2017.07.030
Weinhold, D., Reis, E.J. and Vale, P.M. (2015) Boom–bust patterns in the Brazilian Amazon. Global
Environmental Change. 35:391–399. Doi:10.1016/j.gloenvcha.2015.09.013
Wellesley, L., Happer, C. and Froggatt, A. (2015) Changing Climate, Changing Diets Pathways to Lower
Meat Consumption. Chatham House Report: 64.
West, P.C., Gerber, J.S., Engström, P.M., Mueller, N.D., Brauman, K.A., Carlson, K.M., Cassidy, E.S.,
Johnston, M., MacDonald, G.K., Ray, D.K. and Siebert, S. (2014) Leverage points for improving global food
security and the environment. Science. 345:325–328. Doi:10.1126/science.1246067
White, C., B.S. Halpern and C.V. Kappel. (2012) Ecosystem service tradeoff analysis reveals the value of
marine spatial planning for multiple ocean uses. Proceedings of the National Academy of Sciences.
109:4696-4701. Doi:10.1073/pnas.1114215109
Willis, K.J. and Brncic, T.M. (2004) How ‘virgin’ is virgin rainforest? Science. 304:402-403.
Doi:10.1126/science.1093991
Wirsenius, S., Azar, C. and Berndes, G. (2010) How much land is needed for global food production under
scenarios of dietary changes and livestock productivity increases in 2030? Agricultural Systems. 103:621-
638. Doi:10.1016/j.agsy.2010.07
Wollenberg, E., Edmunds, D. and Buck, L. (2000) Anticipating Change: Scenarios As A Tool For Adaptive
Forest Management A Guide. Center for International Forestry Research, Bogor (Indonesia)
6. REFERENCES
144
World Bank. (2015) Joint report on multilateral development banks’ climate finance 2014. Available at:
www.worldbank.org/climate/MDBclimatefinance2014. Last accessed 22nd February 2018
World Bank. (2016). The Worldwide Governance Indicators (WGI) project. Available at:
http://info.worldbank.org/governance/wgi/index.aspx#home. Last accessed 3rd February 2017
Wunder, S., Noack, F. and Angelsen, A. (2018) Climate, crops, and forests: a pan-tropical analysis of
household income generation. Environment and Development Economics. 1-19.
Doi:10.1017/S1355770X18000116
Wyman, M.S. and Stein, T.V. (2010) Modeling social and land-use/land-cover change data to assess drivers
of smallholder deforestation in Belize. Applied Geography. 30:329-342.
Doi:10.1016/j.apgeog.2009.10.001
Zabel, F., Putzenlechner, B. and Mauser, W. (2014) Global Agricultural Land Resources – A High Resolution
Suitability Evaluation and Its Perspectives until 2100 under Climate Change Conditions. PLoS ONE.
9:e107522. Doi:10.1371/journal.pone.0107522
Zander, P., Amjath-Babu, T., Presissel, S., Reckling, M., Bues, A., Schläfke, N., Kuhlman, T., Bachinger, J.,
Uthes, S., Stoddard, F., Murphy-Bokern, D. and Watson, C. (2017) Grain legume decline and potential
recover in European Agriculture: a review. Agronomy for Sustainable Development. 36:26.
Doi:10.1007/s13593-016-0365-y
Ziv, G., Watson, E., Young, D., Howard, D., Larcom, S.T. and Tanentzap, A.J. (2018). The potential impact
of Brexit on the energy, water and food nexus in the UK: A fuzzy cognitive mapping approach. Applied
Energy. 210:487-498. Doi:10.1016/j.apenergy.2017.08.033.
Zurita-Silva, A., Fuentes, F., Zamora, P., Jacobsen, S-E. and Schwember, A.R. (2014) Breeding quinoa
(Chenopodium quinoa Willd.): potential and perspectives. Molecular Breeding. 34:13-30.
Doi:10.1007/s11032-014-0023-5
Zwane, A.P. (2007) Does poverty constrain deforestation? Econometric evidence from Peru. Journal of
Development Economics. 84
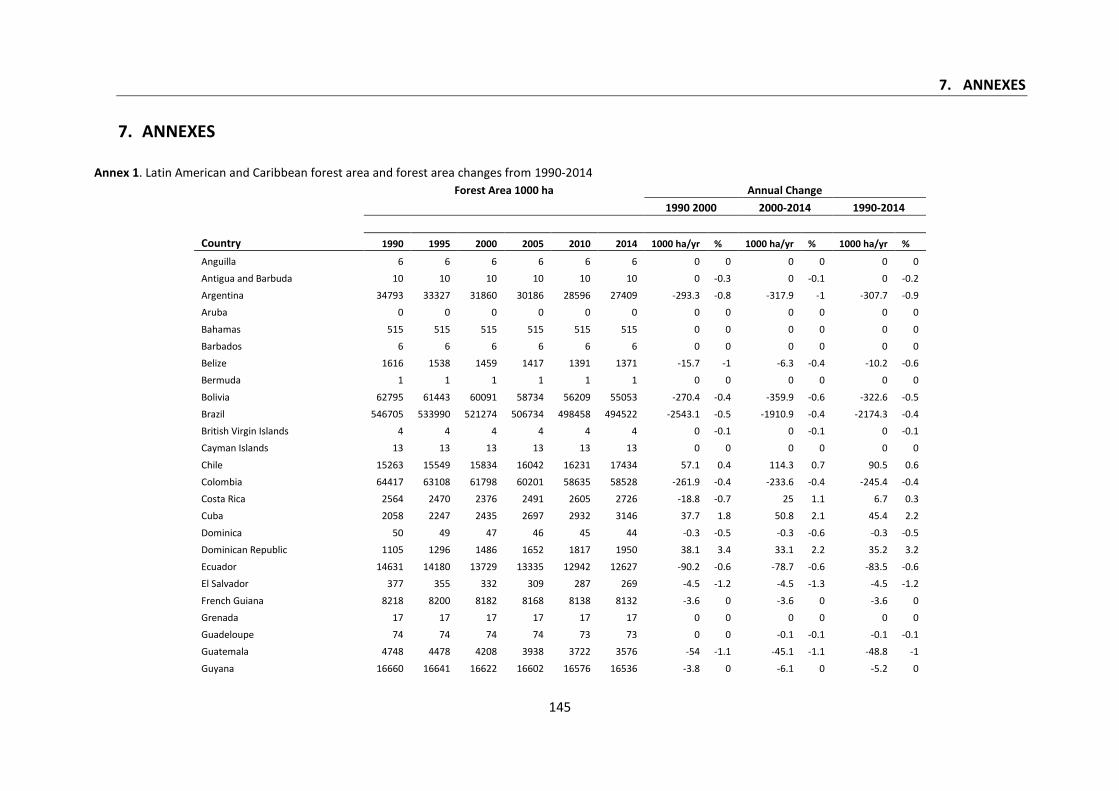
7. ANNEXES
145
7. ANNEXES
Annex 1. Latin American and Caribbean forest area and forest area changes from 1990-2014
Forest Area 1000 ha Annual Change
1990 2000 2000-2014 1990-2014
Country 1990 1995 2000 2005 2010 2014 1000 ha/yr % 1000 ha/yr % 1000 ha/yr %
Anguilla 6 6 6 6 6 6 0 0 0 0 0 0
Antigua and Barbuda 10 10 10 10 10 10 0 -0.3 0 -0.1 0 -0.2
Argentina 34793 33327 31860 30186 28596 27409 -293.3 -0.8 -317.9 -1 -307.7 -0.9
Aruba 0 0 0 0 0 0 0 0 0 0 0 0
Bahamas 515 515 515 515 515 515 0 0 0 0 0 0
Barbados 6 6 6 6 6 6 0 0 0 0 0 0
Belize 1616 1538 1459 1417 1391 1371 -15.7 -1 -6.3 -0.4 -10.2 -0.6
Bermuda 1 1 1 1 1 1 0 0 0 0 0 0
Bolivia 62795 61443 60091 58734 56209 55053 -270.4 -0.4 -359.9 -0.6 -322.6 -0.5
Brazil 546705 533990 521274 506734 498458 494522 -2543.1 -0.5 -1910.9 -0.4 -2174.3 -0.4
British Virgin Islands 4 4 4 4 4 4 0 -0.1 0 -0.1 0 -0.1
Cayman Islands 13 13 13 13 13 13 0 0 0 0 0 0
Chile 15263 15549 15834 16042 16231 17434 57.1 0.4 114.3 0.7 90.5 0.6
Colombia 64417 63108 61798 60201 58635 58528 -261.9 -0.4 -233.6 -0.4 -245.4 -0.4
Costa Rica 2564 2470 2376 2491 2605 2726 -18.8 -0.7 25 1.1 6.7 0.3
Cuba 2058 2247 2435 2697 2932 3146 37.7 1.8 50.8 2.1 45.4 2.2
Dominica 50 49 47 46 45 44 -0.3 -0.5 -0.3 -0.6 -0.3 -0.5
Dominican Republic 1105 1296 1486 1652 1817 1950 38.1 3.4 33.1 2.2 35.2 3.2
Ecuador 14631 14180 13729 13335 12942 12627 -90.2 -0.6 -78.7 -0.6 -83.5 -0.6
El Salvador 377 355 332 309 287 269 -4.5 -1.2 -4.5 -1.3 -4.5 -1.2
French Guiana 8218 8200 8182 8168 8138 8132 -3.6 0 -3.6 0 -3.6 0
Grenada 17 17 17 17 17 17 0 0 0 0 0 0
Guadeloupe 74 74 74 74 73 73 0 0 -0.1 -0.1 -0.1 -0.1
Guatemala 4748 4478 4208 3938 3722 3576 -54 -1.1 -45.1 -1.1 -48.8 -1
Guyana 16660 16641 16622 16602 16576 16536 -3.8 0 -6.1 0 -5.2 0
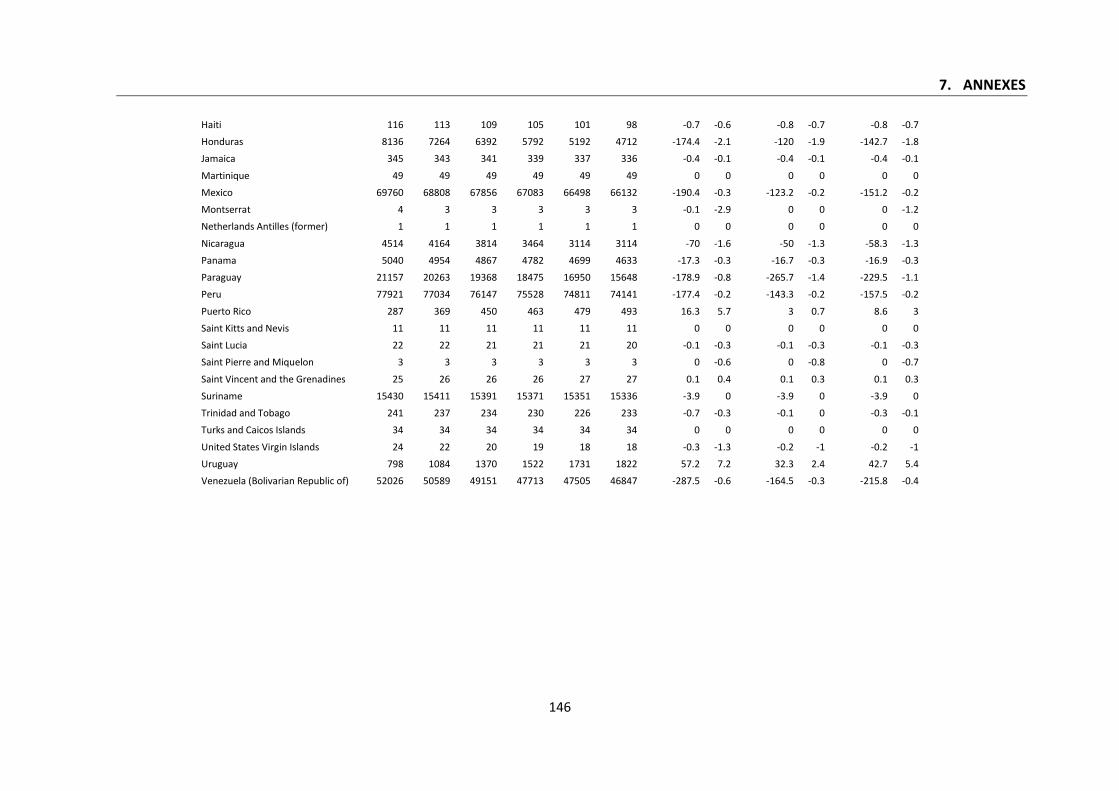
7. ANNEXES
146
Haiti 116 113 109 105 101 98 -0.7 -0.6 -0.8 -0.7 -0.8 -0.7
Honduras 8136 7264 6392 5792 5192 4712 -174.4 -2.1 -120 -1.9 -142.7 -1.8
Jamaica 345 343 341 339 337 336 -0.4 -0.1 -0.4 -0.1 -0.4 -0.1
Martinique 49 49 49 49 49 49 0 0 0 0 0 0
Mexico 69760 68808 67856 67083 66498 66132 -190.4 -0.3 -123.2 -0.2 -151.2 -0.2
Montserrat 4 3 3 3 3 3 -0.1 -2.9 0 0 0 -1.2
Netherlands Antilles (former) 1 1 1 1 1 1 0 0 0 0 0 0
Nicaragua 4514 4164 3814 3464 3114 3114 -70 -1.6 -50 -1.3 -58.3 -1.3
Panama 5040 4954 4867 4782 4699 4633 -17.3 -0.3 -16.7 -0.3 -16.9 -0.3
Paraguay 21157 20263 19368 18475 16950 15648 -178.9 -0.8 -265.7 -1.4 -229.5 -1.1
Peru 77921 77034 76147 75528 74811 74141 -177.4 -0.2 -143.3 -0.2 -157.5 -0.2
Puerto Rico 287 369 450 463 479 493 16.3 5.7 3 0.7 8.6 3
Saint Kitts and Nevis 11 11 11 11 11 11 0 0 0 0 0 0
Saint Lucia 22 22 21 21 21 20 -0.1 -0.3 -0.1 -0.3 -0.1 -0.3
Saint Pierre and Miquelon 3 3 3 3 3 3 0 -0.6 0 -0.8 0 -0.7
Saint Vincent and the Grenadines 25 26 26 26 27 27 0.1 0.4 0.1 0.3 0.1 0.3
Suriname 15430 15411 15391 15371 15351 15336 -3.9 0 -3.9 0 -3.9 0
Trinidad and Tobago 241 237 234 230 226 233 -0.7 -0.3 -0.1 0 -0.3 -0.1
Turks and Caicos Islands 34 34 34 34 34 34 0 0 0 0 0 0
United States Virgin Islands 24 22 20 19 18 18 -0.3 -1.3 -0.2 -1 -0.2 -1
Uruguay 798 1084 1370 1522 1731 1822 57.2 7.2 32.3 2.4 42.7 5.4
Venezuela (Bolivarian Republic of) 52026 50589 49151 47713 47505 46847 -287.5 -0.6 -164.5 -0.3 -215.8 -0.4
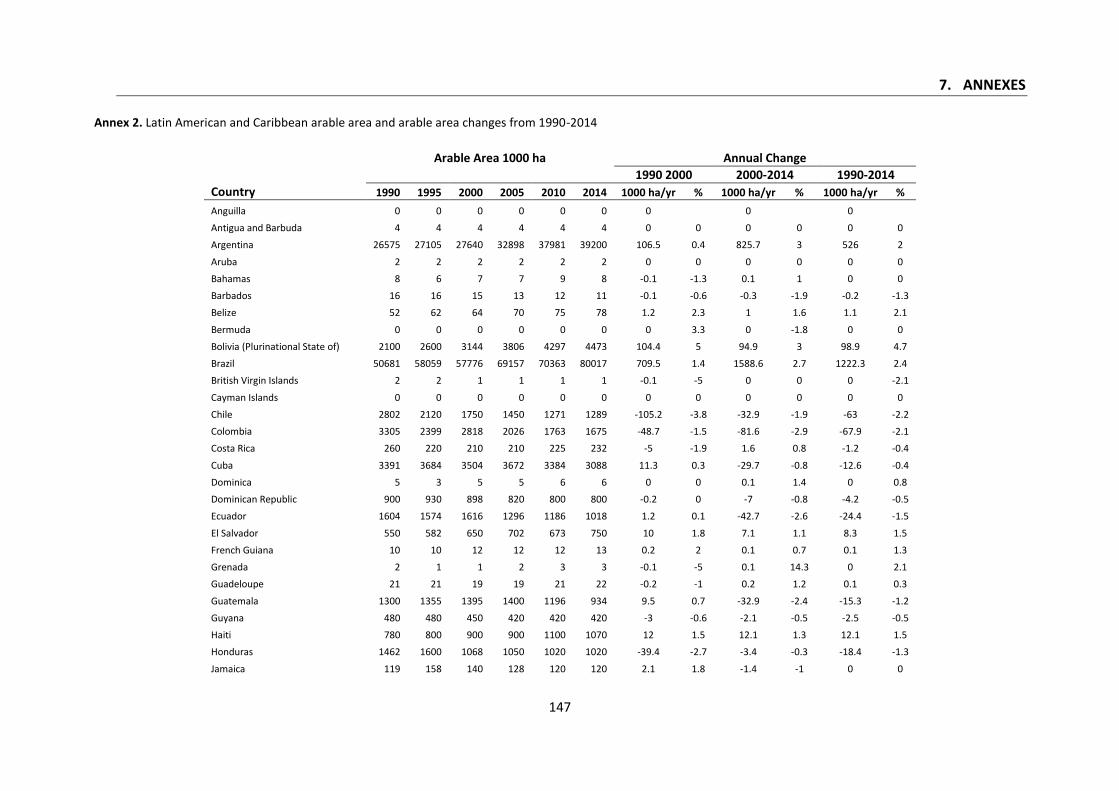
7. ANNEXES
147
Annex 2. Latin American and Caribbean arable area and arable area changes from 1990-2014
Arable Area 1000 ha Annual Change
1990 2000 2000-2014 1990-2014
Country 1990 1995 2000 2005 2010 2014 1000 ha/yr % 1000 ha/yr % 1000 ha/yr %
Anguilla 0 0 0 0 0 0 0 0 0
Antigua and Barbuda 4 4 4 4 4 4 0 0 0 0 0 0
Argentina 26575 27105 27640 32898 37981 39200 106.5 0.4 825.7 3 526 2
Aruba 2 2 2 2 2 2 0 0 0 0 0 0
Bahamas 8 6 7 7 9 8 -0.1 -1.3 0.1 1 0 0
Barbados 16 16 15 13 12 11 -0.1 -0.6 -0.3 -1.9 -0.2 -1.3
Belize 52 62 64 70 75 78 1.2 2.3 1 1.6 1.1 2.1
Bermuda 0 0 0 0 0 0 0 3.3 0 -1.8 0 0
Bolivia (Plurinational State of) 2100 2600 3144 3806 4297 4473 104.4 5 94.9 3 98.9 4.7
Brazil 50681 58059 57776 69157 70363 80017 709.5 1.4 1588.6 2.7 1222.3 2.4
British Virgin Islands 2 2 1 1 1 1 -0.1 -5 0 0 0 -2.1
Cayman Islands 0 0 0 0 0 0 0 0 0 0 0 0
Chile 2802 2120 1750 1450 1271 1289 -105.2 -3.8 -32.9 -1.9 -63 -2.2
Colombia 3305 2399 2818 2026 1763 1675 -48.7 -1.5 -81.6 -2.9 -67.9 -2.1
Costa Rica 260 220 210 210 225 232 -5 -1.9 1.6 0.8 -1.2 -0.4
Cuba 3391 3684 3504 3672 3384 3088 11.3 0.3 -29.7 -0.8 -12.6 -0.4
Dominica 5 3 5 5 6 6 0 0 0.1 1.4 0 0.8
Dominican Republic 900 930 898 820 800 800 -0.2 0 -7 -0.8 -4.2 -0.5
Ecuador 1604 1574 1616 1296 1186 1018 1.2 0.1 -42.7 -2.6 -24.4 -1.5
El Salvador 550 582 650 702 673 750 10 1.8 7.1 1.1 8.3 1.5
French Guiana 10 10 12 12 12 13 0.2 2 0.1 0.7 0.1 1.3
Grenada 2 1 1 2 3 3 -0.1 -5 0.1 14.3 0 2.1
Guadeloupe 21 21 19 19 21 22 -0.2 -1 0.2 1.2 0.1 0.3
Guatemala 1300 1355 1395 1400 1196 934 9.5 0.7 -32.9 -2.4 -15.3 -1.2
Guyana 480 480 450 420 420 420 -3 -0.6 -2.1 -0.5 -2.5 -0.5
Haiti 780 800 900 900 1100 1070 12 1.5 12.1 1.3 12.1 1.5
Honduras 1462 1600 1068 1050 1020 1020 -39.4 -2.7 -3.4 -0.3 -18.4 -1.3
Jamaica 119 158 140 128 120 120 2.1 1.8 -1.4 -1 0 0
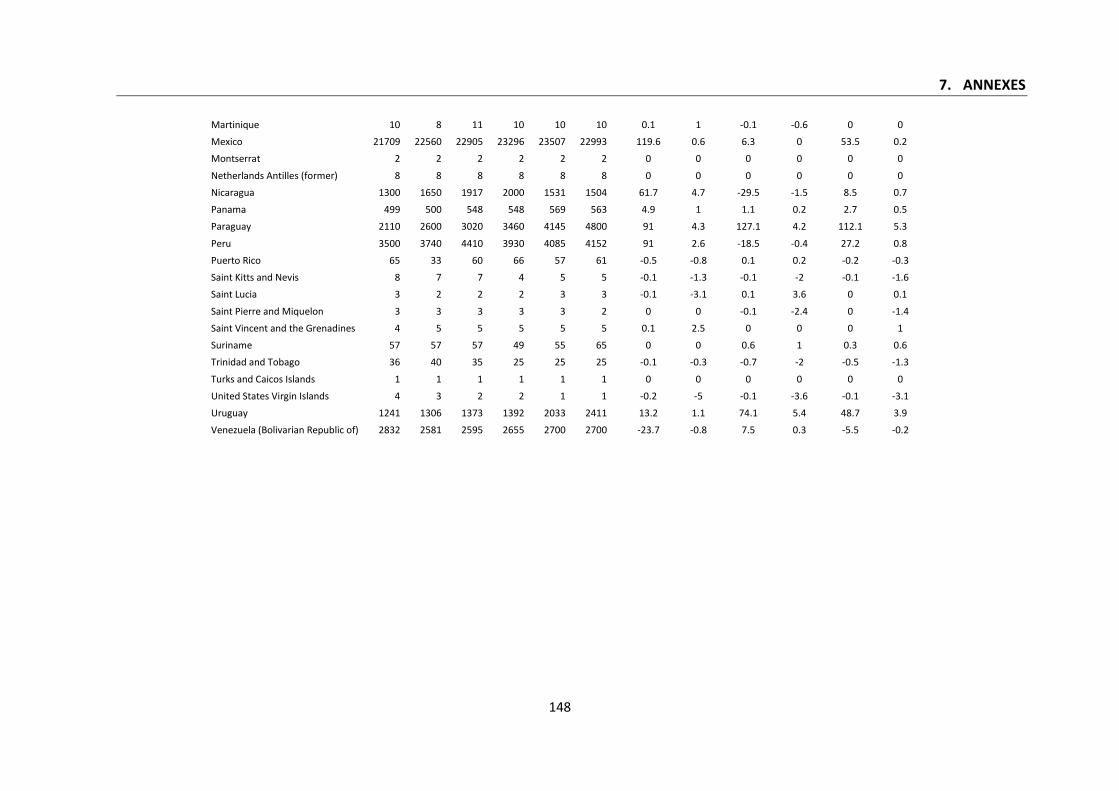
7. ANNEXES
148
Martinique 10 8 11 10 10 10 0.1 1 -0.1 -0.6 0 0
Mexico 21709 22560 22905 23296 23507 22993 119.6 0.6 6.3 0 53.5 0.2
Montserrat 2 2 2 2 2 2 0 0 0 0 0 0
Netherlands Antilles (former) 8 8 8 8 8 8 0 0 0 0 0 0
Nicaragua 1300 1650 1917 2000 1531 1504 61.7 4.7 -29.5 -1.5 8.5 0.7
Panama 499 500 548 548 569 563 4.9 1 1.1 0.2 2.7 0.5
Paraguay 2110 2600 3020 3460 4145 4800 91 4.3 127.1 4.2 112.1 5.3
Peru 3500 3740 4410 3930 4085 4152 91 2.6 -18.5 -0.4 27.2 0.8
Puerto Rico 65 33 60 66 57 61 -0.5 -0.8 0.1 0.2 -0.2 -0.3
Saint Kitts and Nevis 8 7 7 4 5 5 -0.1 -1.3 -0.1 -2 -0.1 -1.6
Saint Lucia 3 2 2 2 3 3 -0.1 -3.1 0.1 3.6 0 0.1
Saint Pierre and Miquelon 3 3 3 3 3 2 0 0 -0.1 -2.4 0 -1.4
Saint Vincent and the Grenadines 4 5 5 5 5 5 0.1 2.5 0 0 0 1
Suriname 57 57 57 49 55 65 0 0 0.6 1 0.3 0.6
Trinidad and Tobago 36 40 35 25 25 25 -0.1 -0.3 -0.7 -2 -0.5 -1.3
Turks and Caicos Islands 1 1 1 1 1 1 0 0 0 0 0 0
United States Virgin Islands 4 3 2 2 1 1 -0.2 -5 -0.1 -3.6 -0.1 -3.1
Uruguay 1241 1306 1373 1392 2033 2411 13.2 1.1 74.1 5.4 48.7 3.9
Venezuela (Bolivarian Republic of) 2832 2581 2595 2655 2700 2700 -23.7 -0.8 7.5 0.3 -5.5 -0.2

7. ANNEXES
149
Annex 3. Latin American and Caribbean meadows and grasslands area and area changes from 1990-2014
Permanent Meadows and Grasslands Area 1000 ha Annual Change
1990 2000 2000-2014 1990-2014
Country 1990 1995 2000 2005 2010 2014 1000 ha/yr % 1000 ha/yr % 1000 ha/yr %
Anguilla 0 0 0 0 0 0 0 0 0
Antigua and Barbuda 4 4 4 4 4 4 0 0 0 0 0 0
Argentina 99970 99920 99870 103900 108500 108500 -10 0 616.4 0.6 355.4 0.4
Aruba 0 0 0 0 0 0 0 0 0
Bahamas 2 2 2 2 2 2 0 0 0 0 0 0
Barbados 2 2 2 2 2 2 0 0 0 0 0 0
Belize 49 50 50 50 50 50 0.1 0.2 0 0 0 0.1
Bermuda 0 0 0 0 0 0 0 0 0
Bolivia (Plurinational State of) 33200 33835 33831 32957 33000 33000 63.1 0.2 -59.4 -0.2 -8.3 0
Brazil 184200 192972 196206 196000 196000 196000 1200.6 0.7 -14.7 0 491.7 0.3
British Virgin Islands 5 5 5 5 5 5 0 0 0 0 0 0
Cayman Islands 2 2 2 2 2 2 0 0 0 0 0 0
Chile 12850 12930 13000 14000 14015 14015 15 0.1 72.5 0.6 48.5 0.4
Colombia 40083 40083 40314 38944 39150 41365 23.1 0.1 75.1 0.2 53.4 0.1
Costa Rica 1795 1538 1350 1315 1279 1265 -44.5 -2.5 -6.1 -0.4 -22.1 -1.2
Cuba 2900 2500 2500 2540 2657 2764 -40 -1.4 18.9 0.8 -5.7 -0.2
Dominica 2 2 2 2 2 2 0 0 0 0 0 0
Dominican Republic 1200 1200 1197 1197 1197 1197 -0.3 0 0 0 -0.1 0
Ecuador 4921 5107 5087 4990 4920 3123 16.6 0.3 -140.3 -2.8 -74.9 -1.5
El Salvador 600 600 600 636 637 637 0 0 2.6 0.4 1.5 0.3
French Guiana 9 11 7 7 9 12 -0.2 -2.2 0.4 5.3 0.1 1.5
Grenada 1 1 1 1 1 1 0 0 0 0 0 0
Guadeloupe 24 25 24 21 35 28 0 0 0.3 1 0.1 0.6
Guatemala 2500 2602 2500 2321 1796 1799 0 0 -50.1 -2 -29.2 -1.2
Guyana 1230 1230 1230 1230 1230 1230 0 0 0 0 0 0
Haiti 497 490 490 490 490 490 -0.7 -0.1 0 0 -0.3 -0.1
Honduras 1500 1530 1508 1700 1760 1760 0.8 0.1 18 1.2 10.8 0.7
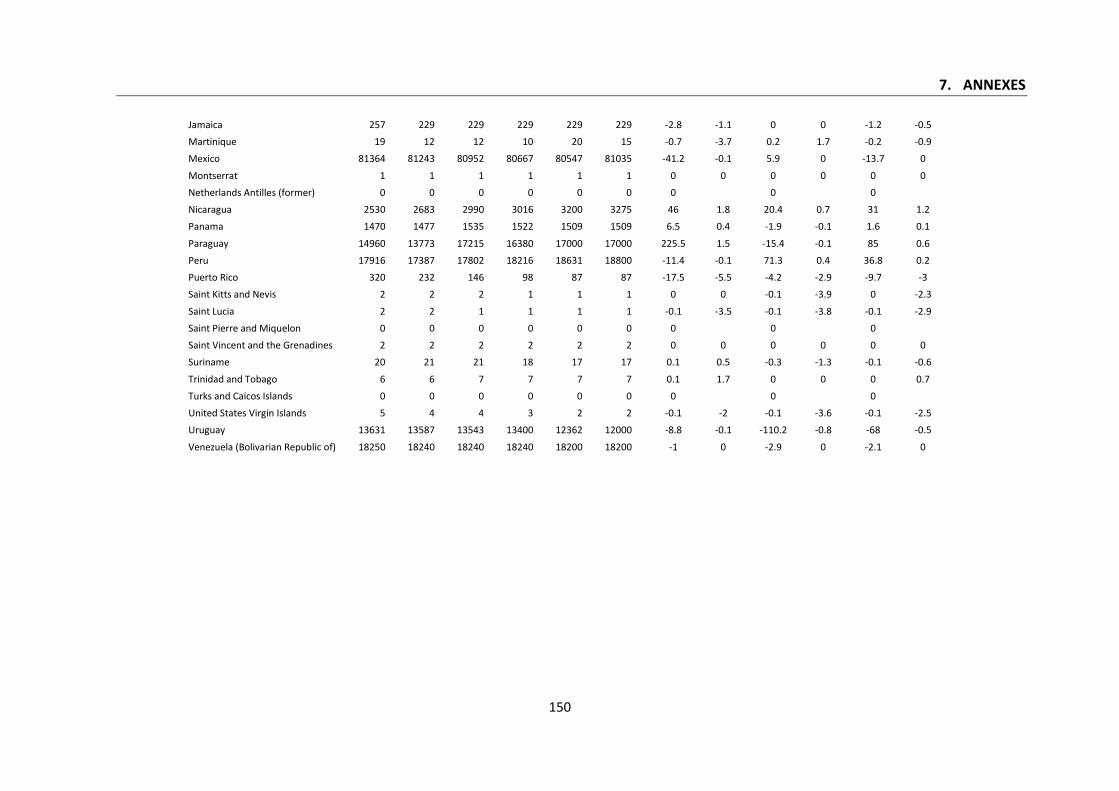
7. ANNEXES
150
Jamaica 257 229 229 229 229 229 -2.8 -1.1 0 0 -1.2 -0.5
Martinique 19 12 12 10 20 15 -0.7 -3.7 0.2 1.7 -0.2 -0.9
Mexico 81364 81243 80952 80667 80547 81035 -41.2 -0.1 5.9 0 -13.7 0
Montserrat 1 1 1 1 1 1 0 0 0 0 0 0
Netherlands Antilles (former) 0 0 0 0 0 0 0 0 0
Nicaragua 2530 2683 2990 3016 3200 3275 46 1.8 20.4 0.7 31 1.2
Panama 1470 1477 1535 1522 1509 1509 6.5 0.4 -1.9 -0.1 1.6 0.1
Paraguay 14960 13773 17215 16380 17000 17000 225.5 1.5 -15.4 -0.1 85 0.6
Peru 17916 17387 17802 18216 18631 18800 -11.4 -0.1 71.3 0.4 36.8 0.2
Puerto Rico 320 232 146 98 87 87 -17.5 -5.5 -4.2 -2.9 -9.7 -3
Saint Kitts and Nevis 2 2 2 1 1 1 0 0 -0.1 -3.9 0 -2.3
Saint Lucia 2 2 1 1 1 1 -0.1 -3.5 -0.1 -3.8 -0.1 -2.9
Saint Pierre and Miquelon 0 0 0 0 0 0 0 0 0
Saint Vincent and the Grenadines 2 2 2 2 2 2 0 0 0 0 0 0
Suriname 20 21 21 18 17 17 0.1 0.5 -0.3 -1.3 -0.1 -0.6
Trinidad and Tobago 6 6 7 7 7 7 0.1 1.7 0 0 0 0.7
Turks and Caicos Islands 0 0 0 0 0 0 0 0 0
United States Virgin Islands 5 4 4 3 2 2 -0.1 -2 -0.1 -3.6 -0.1 -2.5
Uruguay 13631 13587 13543 13400 12362 12000 -8.8 -0.1 -110.2 -0.8 -68 -0.5
Venezuela (Bolivarian Republic of) 18250 18240 18240 18240 18200 18200 -1 0 -2.9 0 -2.1 0
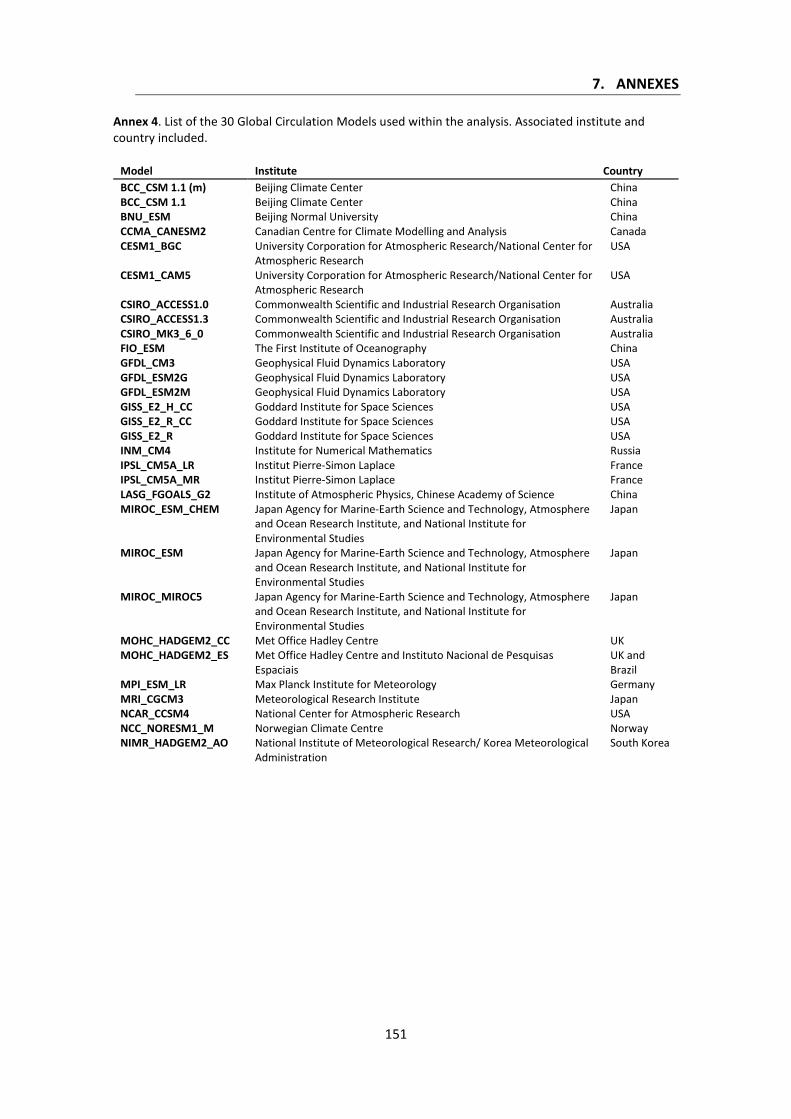
7. ANNEXES
151
Annex 4. List of the 30 Global Circulation Models used within the analysis. Associated institute and country included.
Model Institute Country
BCC_CSM 1.1 (m) Beijing Climate Center China BCC_CSM 1.1 Beijing Climate Center China BNU_ESM Beijing Normal University China CCMA_CANESM2 Canadian Centre for Climate Modelling and Analysis Canada CESM1_BGC University Corporation for Atmospheric Research/National Center for
Atmospheric Research USA
CESM1_CAM5 University Corporation for Atmospheric Research/National Center for Atmospheric Research
USA
CSIRO_ACCESS1.0 Commonwealth Scientific and Industrial Research Organisation Australia CSIRO_ACCESS1.3 Commonwealth Scientific and Industrial Research Organisation Australia CSIRO_MK3_6_0 Commonwealth Scientific and Industrial Research Organisation Australia FIO_ESM The First Institute of Oceanography China GFDL_CM3 Geophysical Fluid Dynamics Laboratory USA GFDL_ESM2G Geophysical Fluid Dynamics Laboratory USA GFDL_ESM2M Geophysical Fluid Dynamics Laboratory USA GISS_E2_H_CC Goddard Institute for Space Sciences USA GISS_E2_R_CC Goddard Institute for Space Sciences USA GISS_E2_R Goddard Institute for Space Sciences USA INM_CM4 Institute for Numerical Mathematics Russia IPSL_CM5A_LR Institut Pierre-Simon Laplace France IPSL_CM5A_MR Institut Pierre-Simon Laplace France LASG_FGOALS_G2 Institute of Atmospheric Physics, Chinese Academy of Science China MIROC_ESM_CHEM Japan Agency for Marine-Earth Science and Technology, Atmosphere
and Ocean Research Institute, and National Institute for Environmental Studies
Japan
MIROC_ESM Japan Agency for Marine-Earth Science and Technology, Atmosphere and Ocean Research Institute, and National Institute for Environmental Studies
Japan
MIROC_MIROC5 Japan Agency for Marine-Earth Science and Technology, Atmosphere and Ocean Research Institute, and National Institute for Environmental Studies
Japan
MOHC_HADGEM2_CC Met Office Hadley Centre UK MOHC_HADGEM2_ES Met Office Hadley Centre and Instituto Nacional de Pesquisas
Espaciais UK and Brazil
MPI_ESM_LR Max Planck Institute for Meteorology Germany MRI_CGCM3 Meteorological Research Institute Japan NCAR_CCSM4 National Center for Atmospheric Research USA NCC_NORESM1_M Norwegian Climate Centre Norway NIMR_HADGEM2_AO National Institute of Meteorological Research/ Korea Meteorological
Administration South Korea
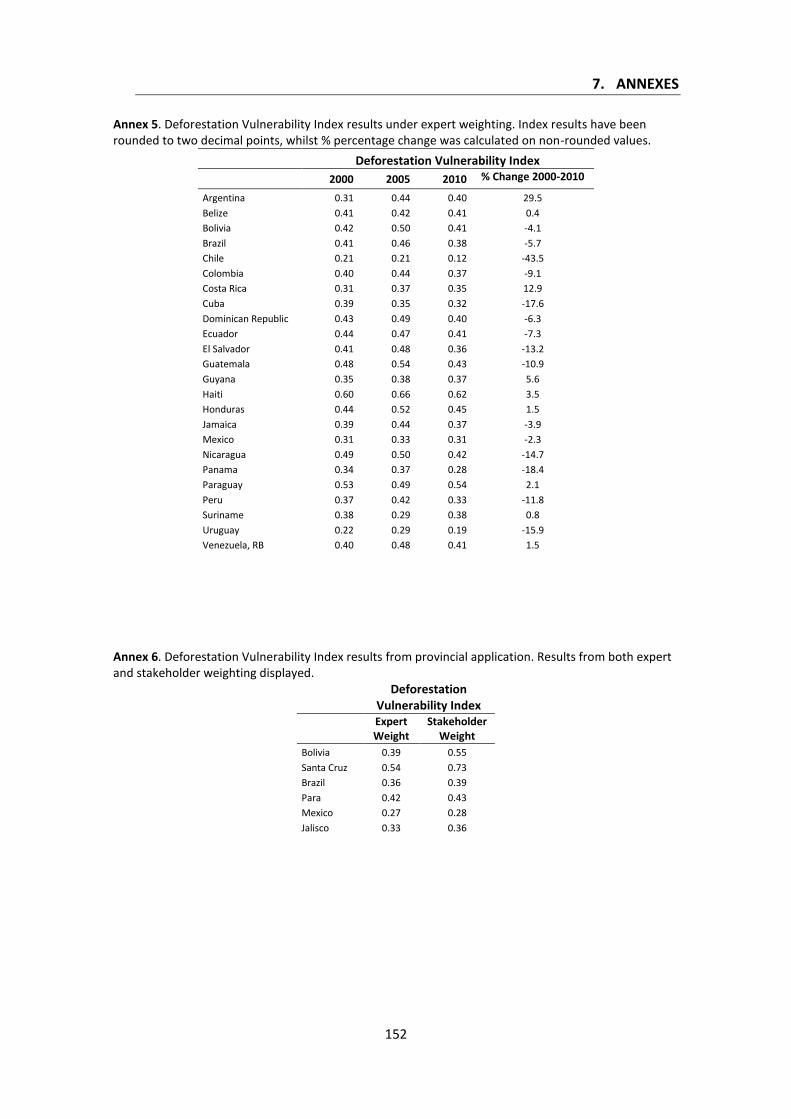
7. ANNEXES
152
Annex 5. Deforestation Vulnerability Index results under expert weighting. Index results have been rounded to two decimal points, whilst % percentage change was calculated on non-rounded values.
Deforestation Vulnerability Index
2000 2005 2010 % Change 2000-2010
Argentina 0.31 0.44 0.40 29.5
Belize 0.41 0.42 0.41 0.4
Bolivia 0.42 0.50 0.41 -4.1
Brazil 0.41 0.46 0.38 -5.7
Chile 0.21 0.21 0.12 -43.5
Colombia 0.40 0.44 0.37 -9.1
Costa Rica 0.31 0.37 0.35 12.9
Cuba 0.39 0.35 0.32 -17.6
Dominican Republic 0.43 0.49 0.40 -6.3
Ecuador 0.44 0.47 0.41 -7.3
El Salvador 0.41 0.48 0.36 -13.2
Guatemala 0.48 0.54 0.43 -10.9
Guyana 0.35 0.38 0.37 5.6
Haiti 0.60 0.66 0.62 3.5
Honduras 0.44 0.52 0.45 1.5
Jamaica 0.39 0.44 0.37 -3.9
Mexico 0.31 0.33 0.31 -2.3
Nicaragua 0.49 0.50 0.42 -14.7
Panama 0.34 0.37 0.28 -18.4
Paraguay 0.53 0.49 0.54 2.1
Peru 0.37 0.42 0.33 -11.8
Suriname 0.38 0.29 0.38 0.8
Uruguay 0.22 0.29 0.19 -15.9
Venezuela, RB 0.40 0.48 0.41 1.5
Annex 6. Deforestation Vulnerability Index results from provincial application. Results from both expert and stakeholder weighting displayed.
Deforestation
Vulnerability Index
Expert Weight
Stakeholder Weight
Bolivia 0.39 0.55
Santa Cruz 0.54 0.73
Brazil 0.36 0.39
Para 0.42 0.43
Mexico 0.27 0.28
Jalisco 0.33 0.36

7. ANNEXES
153
Annex 7. Results from pairwise t-test analysis of Deforestation Vulnerability Index (DVI) values under random weighting of DVI indicators through Monte Carlo analysis. Note: Values represent p values from pairwise t-test using data for the year 2010. Significance codes used in place of values for highly significant results. ISO two letter country codes used
AR BZ BO BR CL CO CR CU DO EC SV GT GY HT HN JM MX NI PA PY PE SR UY VE
AR
BZ ***
BO *** 0.69
BR 0.1 *** ***
CL *** *** *** ***
CO *** *** *** *** ***
CR *** *** *** *** *** ***
CU *** *** *** *** *** *** ***
DO *** 0.06. 0.13 *** *** *** *** ***
EC *** 0.002** 0.01** *** *** *** *** *** 0.27
SV *** *** *** *** *** 0.26 *** *** *** ***
GT *** *** *** *** *** *** *** *** *** *** ***
GY *** *** *** *** *** 0.003** *** *** *** *** 0.07. ***
HT *** *** *** *** *** *** *** *** *** *** *** *** ***
HN *** *** *** *** *** *** *** *** *** *** *** *** *** ***
JM *** *** *** *** *** 0.04* *** *** *** *** 0.002* *** *** *** ***
MX *** *** *** *** *** *** *** 0.16 *** *** *** *** *** *** *** ***
NI *** *** *** *** *** *** *** *** *** *** *** *** *** *** *** *** ***
PA *** *** *** *** *** *** *** *** *** *** *** *** *** *** *** *** *** ***
PY *** *** *** *** *** *** *** *** *** *** *** *** *** *** *** *** *** *** ***
PE *** *** *** *** *** *** *** *** *** *** *** *** *** *** *** *** *** *** *** ***
SR *** *** *** *** *** *** *** *** *** *** 0.02* *** 0.66 *** *** *** *** *** *** *** ***
UY *** *** *** *** *** *** *** *** *** *** *** *** *** *** *** *** *** *** *** *** *** ***
VE *** *** *** *** *** *** *** *** 0.01* 0.15 *** *** *** *** *** *** *** *** *** *** *** *** ***
Significance codes: 0 ‘***’ 0.001 ‘**’ 0.01 ‘*’ 0.05 ‘.’ 0.1 ‘ ’ 1
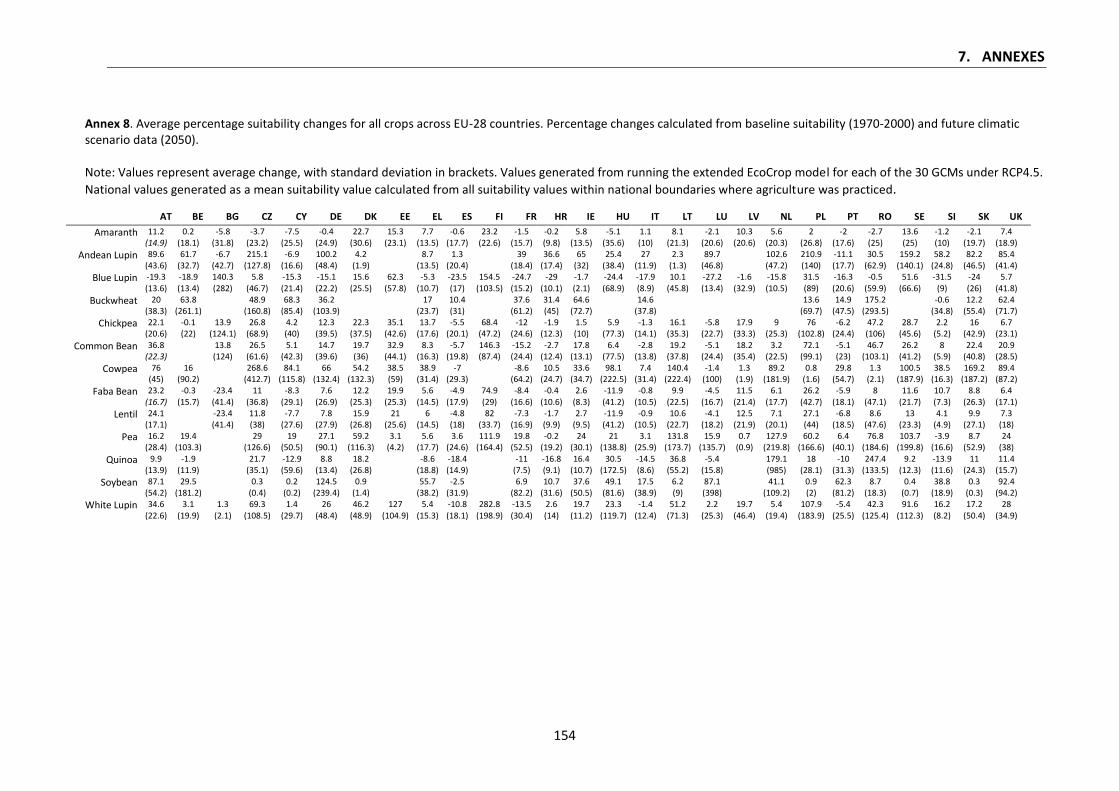
7. ANNEXES
154
Annex 8. Average percentage suitability changes for all crops across EU-28 countries. Percentage changes calculated from baseline suitability (1970-2000) and future climatic scenario data (2050). Note: Values represent average change, with standard deviation in brackets. Values generated from running the extended EcoCrop model for each of the 30 GCMs under RCP4.5.
National values generated as a mean suitability value calculated from all suitability values within national boundaries where agriculture was practiced.
AT BE BG CZ CY DE DK EE EL ES FI FR HR IE HU IT LT LU LV NL PL PT RO SE SI SK UK Amaranth 11.2
(14.9) 0.2
(18.1) -5.8
(31.8) -3.7
(23.2) -7.5
(25.5) -0.4
(24.9) 22.7
(30.6) 15.3
(23.1) 7.7
(13.5) -0.6
(17.7) 23.2
(22.6) -1.5
(15.7) -0.2 (9.8)
5.8 (13.5)
-5.1 (35.6)
1.1 (10)
8.1 (21.3)
-2.1 (20.6)
10.3 (20.6)
5.6 (20.3)
2 (26.8)
-2 (17.6)
-2.7 (25)
13.6 (25)
-1.2 (10)
-2.1 (19.7)
7.4 (18.9)
Andean Lupin 89.6 (43.6)
61.7 (32.7)
-6.7 (42.7)
215.1 (127.8)
-6.9 (16.6)
100.2 (48.4)
4.2 (1.9)
8.7 (13.5)
1.3 (20.4)
39 (18.4)
36.6 (17.4)
65 (32)
25.4 (38.4)
27 (11.9)
2.3 (1.3)
89.7 (46.8)
102.6 (47.2)
210.9 (140)
-11.1 (17.7)
30.5 (62.9)
159.2 (140.1)
58.2 (24.8)
82.2 (46.5)
85.4 (41.4)
Blue Lupin -19.3 (13.6)
-18.9 (13.4)
140.3 (282)
5.8 (46.7)
-15.3 (21.4)
-15.1 (22.2)
15.6 (25.5)
62.3 (57.8)
-5.3 (10.7)
-23.5 (17)
154.5 (103.5)
-24.7 (15.2)
-29 (10.1)
-1.7 (2.1)
-24.4 (68.9)
-17.9 (8.9)
10.1 (45.8)
-27.2 (13.4)
-1.6 (32.9)
-15.8 (10.5)
31.5 (89)
-16.3 (20.6)
-0.5 (59.9)
51.6 (66.6)
-31.5 (9)
-24 (26)
5.7 (41.8)
Buckwheat 20 (38.3)
63.8 (261.1)
48.9 (160.8)
68.3 (85.4)
36.2 (103.9)
17 (23.7)
10.4 (31)
37.6 (61.2)
31.4 (45)
64.6 (72.7)
14.6 (37.8)
13.6 (69.7)
14.9 (47.5)
175.2 (293.5)
-0.6 (34.8)
12.2 (55.4)
62.4 (71.7)
Chickpea 22.1 (20.6)
-0.1 (22)
13.9 (124.1)
26.8 (68.9)
4.2 (40)
12.3 (39.5)
22.3 (37.5)
35.1 (42.6)
13.7 (17.6)
-5.5 (20.1)
68.4 (47.2)
-12 (24.6)
-1.9 (12.3)
1.5 (10)
5.9 (77.3)
-1.3 (14.1)
16.1 (35.3)
-5.8 (22.7)
17.9 (33.3)
9 (25.3)
76 (102.8)
-6.2 (24.4)
47.2 (106)
28.7 (45.6)
2.2 (5.2)
16 (42.9)
6.7 (23.1)
Common Bean 36.8 (22.3)
13.8 (124)
26.5 (61.6)
5.1 (42.3)
14.7 (39.6)
19.7 (36)
32.9 (44.1)
8.3 (16.3)
-5.7 (19.8)
146.3 (87.4)
-15.2 (24.4)
-2.7 (12.4)
17.8 (13.1)
6.4 (77.5)
-2.8 (13.8)
19.2 (37.8)
-5.1 (24.4)
18.2 (35.4)
3.2 (22.5)
72.1 (99.1)
-5.1 (23)
46.7 (103.1)
26.2 (41.2)
8 (5.9)
22.4 (40.8)
20.9 (28.5)
Cowpea 76 (45)
16 (90.2)
268.6 (412.7)
84.1 (115.8)
66 (132.4)
54.2 (132.3)
38.5 (59)
38.9 (31.4)
-7 (29.3)
-8.6 (64.2)
10.5 (24.7)
33.6 (34.7)
98.1 (222.5)
7.4 (31.4)
140.4 (222.4)
-1.4 (100)
1.3 (1.9)
89.2 (181.9)
0.8 (1.6)
29.8 (54.7)
1.3 (2.1)
100.5 (187.9)
38.5 (16.3)
169.2 (187.2)
89.4 (87.2)
Faba Bean 23.2 (16.7)
-0.3 (15.7)
-23.4 (41.4)
11 (36.8)
-8.3 (29.1)
7.6 (26.9)
12.2 (25.3)
19.9 (25.3)
5.6 (14.5)
-4.9 (17.9)
74.9 (29)
-8.4 (16.6)
-0.4 (10.6)
2.6 (8.3)
-11.9 (41.2)
-0.8 (10.5)
9.9 (22.5)
-4.5 (16.7)
11.5 (21.4)
6.1 (17.7)
26.2 (42.7)
-5.9 (18.1)
8 (47.1)
11.6 (21.7)
10.7 (7.3)
8.8 (26.3)
6.4 (17.1)
Lentil 24.1 (17.1)
-23.4 (41.4)
11.8 (38)
-7.7 (27.6)
7.8 (27.9)
15.9 (26.8)
21 (25.6)
6 (14.5)
-4.8 (18)
82 (33.7)
-7.3 (16.9)
-1.7 (9.9)
2.7 (9.5)
-11.9 (41.2)
-0.9 (10.5)
10.6 (22.7)
-4.1 (18.2)
12.5 (21.9)
7.1 (20.1)
27.1 (44)
-6.8 (18.5)
8.6 (47.6)
13 (23.3)
4.1 (4.9)
9.9 (27.1)
7.3 (18)
Pea 16.2 (28.4)
19.4 (103.3)
29 (126.6)
19 (50.5)
27.1 (90.1)
59.2 (116.3)
3.1 (4.2)
5.6 (17.7)
3.6 (24.6)
111.9 (164.4)
19.8 (52.5)
-0.2 (19.2)
24 (30.1)
21 (138.8)
3.1 (25.9)
131.8 (173.7)
15.9 (135.7)
0.7 (0.9)
127.9 (219.8)
60.2 (166.6)
6.4 (40.1)
76.8 (184.6)
103.7 (199.8)
-3.9 (16.6)
8.7 (52.9)
24 (38)
Quinoa 9.9 (13.9)
-1.9 (11.9)
21.7 (35.1)
-12.9 (59.6)
8.8 (13.4)
18.2 (26.8)
-8.6 (18.8)
-18.4 (14.9)
-11 (7.5)
-16.8 (9.1)
16.4 (10.7)
30.5 (172.5)
-14.5 (8.6)
36.8 (55.2)
-5.4 (15.8)
179.1 (985)
18 (28.1)
-10 (31.3)
247.4 (133.5)
9.2 (12.3)
-13.9 (11.6)
11 (24.3)
11.4 (15.7)
Soybean 87.1 (54.2)
29.5 (181.2)
0.3 (0.4)
0.2 (0.2)
124.5 (239.4)
0.9 (1.4)
55.7 (38.2)
-2.5 (31.9)
6.9 (82.2)
10.7 (31.6)
37.6 (50.5)
49.1 (81.6)
17.5 (38.9)
6.2 (9)
87.1 (398)
41.1 (109.2)
0.9 (2)
62.3 (81.2)
8.7 (18.3)
0.4 (0.7)
38.8 (18.9)
0.3 (0.3)
92.4 (94.2)
White Lupin 34.6 (22.6)
3.1 (19.9)
1.3 (2.1)
69.3 (108.5)
1.4 (29.7)
26 (48.4)
46.2 (48.9)
127 (104.9)
5.4 (15.3)
-10.8 (18.1)
282.8 (198.9)
-13.5 (30.4)
2.6 (14)
19.7 (11.2)
23.3 (119.7)
-1.4 (12.4)
51.2 (71.3)
2.2 (25.3)
19.7 (46.4)
5.4 (19.4)
107.9 (183.9)
-5.4 (25.5)
42.3 (125.4)
91.6 (112.3)
16.2 (8.2)
17.2 (50.4)
28 (34.9)

7. ANNEXES
155