
a case study of single otter trawl in Zhoushan fishing groun
Upload
khangminh22Category
view
3download
0
Lower River Otter: Long term options for drainage and flood management
Client
Clinton Devon Estates
Author
Dr. N.E. Haycock
Date
18th December 2009
updated 16th February 2010
Version
3
Haycock, Suite 1, Deer Park Business Centre, Eckington, Pershore, Worcestershire, WR10 3DN
t +44 (0)1386 750642 e enquir [email protected]
w w w. h a y c o c k - a s s o c i a t e s . c o . u k
r ivers soi ls hydrology landscapes
Haycock Associates Limited. Registered in England No. 03934665 VAT No. GB 658 1644 14Registered office: Red Roof, Wick Road, Little Comberton, Pershore, Worcestershire WR10 3EG.
Table of Contents
Executive Summary 1
Aims of the Report 2
Introduction 2
Background 4
Catchment Topography and Geology 4
Lower Otter Topography and Geology 6
Catchment Hydrology 8
Current Drainage Layout 10
Recorded Flood Events 12
Tidal Levels and Data and its Current Influence 16
Historical Periods and Accounts of the Lower Otter Valley 18
Hydraulic Model of the Lower Otter Valley 20
Flood Dynamics - Fluvial 20
Flood Dynamics - Tidal 25
Flood Dynamics - Drainage 29
Predicted Sea Level and Flood Regime 29
Conclusions Arising from the Simulation Flood Models. 30
Long Term Options for Drainage and Flood Management 31
Option A - Cricket Ground Bund 32
Option B - Relocation of Cricket Ground 34
Haycock

Option C - South Farm Road 35
Option D - River Otter floodplain at White Bridge. 37
Option E - Southern Big Marsh (linked to option B, C and D). 38
Option F - Northern Big Marsh 40
Option K - River Otter Big Bank Reach 42
Option G - Little Bank and Swale 43
Option H - Otterton Mill and Otterton Bridge 44
Summary of Options - Table 5 47
Overview and recommendations 48
Key Documentation 49
Appendix A: Long section through the Lime Kiln Culvert (Howick and Partners, 2001). 50
Haycock

Executive SummaryThe Clinton Devon Estates commissioned Haycock Associates in late 2009 to undertake a review of the current drainage
and flood management of the Lower River Otter from Otterton to the discharge point of the River Otter into the sea. The key
issues to be addressed relate to the long term options for the drainage and flood management of this section of the Valley,
and how the underlying hydrological, geomorphological and climatic change regimes may impact the farming and
conservation operations on this land.
Data and information on the dynamics of flooding and drainage has been sourced from local residents and land users, plus
reports generated by the Clinton Devon Estates over the past decade. Environment Agency reports on the River Otter and
the dynamics of the shoreline and coastal flood risks have also been reviewed.
Floods in October 2008 have provided an insight into the dynamics of the site, but this flood event was extreme (>220 year
return period) and this report has focussed on smaller storms that have resulted in 21 flood events in the Lower Otter Valley
since 1959.
The historical development of the floodplain, from the leating of the channel prior to 1066, the need for navigation to Otterton
until 1540 and then the embankment of the floodplain in 1812, plus the railway embankments created in 1903, have all
complicated the natural flood and geomorphological regime of the river. Further complications arise in the form of a major
storm surge in the decade of 1480 that created the pebble bar, and also recent sea level adjustments, that have accelerated
the siltation of the estuary and the geomorphology of the coastal sediment supply.
Taking this information together, a series of recommendations and options have been proposed, 10 in total, which seek to address single
issues, or combinations of issues. These recommendations build on detailed hydraulic flood models developed for the Lower Otter, that
seek to track the movement of water through the landscape and the lessons that can be taken from this information. Furthermore, detailed
hydraulic models of tidal flood inundation have been developed to explore the implications of major tidal breaches of the embankments.
In reviewing the current hydrology, hydraulics and landscape operations within the Lower Otter, it is apparent that the impact
of poor drainage and flooding is becoming worse and more damaging to the economics of the Estate and users of the
landscape. The poor performance of the sea outfalls, the reduced hydraulic capacity of the River Otter and the siltation of
the estuary since 1812 are all conspiring to increase the flood frequency of a number of assets, most visibly at South Farm
Lane and the Cricket Club.
The future performance of drainage will become increasingly challenging, with increased fluvial runoff and higher tides, plus
the aggressive sedimentation of the sea outfall, both at the Lime Kiln and also within the estuary.
The Estate could simply allow this situation to become progressively worse, farming of the floodplain to become less viable,
conservation management more demanding and recreational access more difficult. At some point, either due to fluvial
flooding or tidal flooding the current embankments, which are nearly 200 year old, will fail and the resulting impact will be
extensive loss of terrestrial land and access to South Farm and its businesses.
It is proposed that there may be a series of options to phase the retreat of agriculture from the marshes in some locations,
upgrade the functioning of assets in other locations, and enhance the life of some of the embanked lands through small
modifications of the current land levels and linkages of the river to its floodplain. The options, in combination, will allow the
long term retreat of agriculture from the marshes, but allow the controlled formation of designated habitats without recklessly
endangering the current designated areas.
The options, either in combination, or independently, have not been subject to detailed flood modeling in the same detail as
the current environment, simply because the options raise numerous challenges in terms of the long term management of
the Lower Otter, its commercial use and as an Area of Outstanding Natural Beauty. The next stage of this process is to
review the options with key stakeholders and develop these with the Clinton Devon Estates to determine the way forward,
along with the financing of any major structural adjustments to the site. The aspiration of the Estate is to create an exemplary
project, that builds on the unique history of ownership and use of this valley, and ensures it has a viable future for the Estate
and the larger community.
Haycock
1
Aims of the ReportThe Clinton Devon Estates commissioned Haycock Associates in late 2009 to undertake a review of the current drainage
and flood management of the Lower River Otter from Otterton to the discharge point of the River Otter into the sea. The key
issues to be addressed relate to the long term options of the drainage and flood management of this section of the Valley
and how the underlying hydrological, geomorphological and climatic change regimes may impact the farming and
conservation operations on this land. It also examines the implications for key infrastructure, namely South Farm Lane and
White Bridge as well as the Budleigh Salterton Cricket Club.
During the review of this section of the river, three main issues have arisen:
1. The drainage of the floodplain and its ability to gravity drain through its sea outfall at Salterton.
2. The flood dynamics of the River Otter and how this floodwater passes through this section of floodplain and the
implications for land operations and infrastructure.
3. The tidal dynamics of the Otter Estuary and influence on fluvial flooding as well as the drainage of the site.
In undertaking this review we have had access to key documents in the Clinton Devon Estates archive plus access to
information held by the Environment Agency and Natural England. Additional information has been secured from Howick and
Partners (Engineers) on the operation of the piped sea outflow. Data-sets from the Met. Office, BODC, CEH-NERC have also
been secured. A detailed fluvial geomorphological audit, undertaken for the Environment Agency, of the River Otter upstream
of Otterton has also been assessed and was supplied by Southampton University (Geodata, Professor David Sear and Chris
Hill). Budleigh Salterton Cricket Club have given the Haycock team access to their archive of documents from 1959
onwards. In addition, key documents from the Otter Valley Association have been secured. Finally, discussions with key land
and building managers in the Valley have also been undertaken in order to check key observations and develop initial
options.
IntroductionThe current issues facing the Clinton Devon Estates within the Lower Otter Valley centre on the poor drainage of the
embanked farmland (locally referred to as Big Bank and Little Bank), which has reduced the level of farming operations that
can be sustained on this land. The poor drainage of normal runoff impacts the use of South Farm Road and frequently
results in the inundation of the Budleigh Salterton Cricket Club. The operation of drainage of the embanked land is linked to
the runoff regimes of the main River Otter, western tributaries and the performance of the sea outfall at Budleigh Salterton,
locally to the Lime Kilns. Drainage and the objectives of drainage within the embanked land is a key issue for the Estate.
Drainage also needs to be managed to sustain wetland habitats under Countryside Steward Schemes, and there appears to
be a challenge in meeting this objective in parallel with the need to effectively drain other blocks of land within the embanked
area of the Lower Otter.
Drainage issues are compounded by the impact of flooding on the Lower River Otter. A number of recent flood events have
resulted in substantial damage to a number of buildings, loss of access to South Farm and the prolonged storage of water
within the embanked lands, which have damaged farming operations. The flooding in the last decade is believed to have
become worse, both in terms of frequency and consequential damage. The inability of the flood waters to drain from the
embanked compartments is linked to underlying concerns about the the normal drainage capacity of the site.
Fluvial flooding appears to be a main concern, but current concerns also centre on the tidal inundation regime, how this
regime is impacting the estuarine and river SAC / SSSI. Equally, a breach of the embankments in 1982 resulted in salt water
ingress into the embanked compartment, which was mitigated by freshwater dilution from the River Otter. If salt water does
ingress into the embanked area, then implications to farming and terrestrial conservation interests is unclear.
In relation to predicted changes in sea level and predicted changes in the runoff regime of the Otter catchment, the Estate
have also raised the question of how the Lower Otter will respond, or be transformed, and the implications for current assets
like South Farm Lane, the Cricket Club, Otterton Mill and a number of private houses in Budleigh Salterton. The
embankment of the River Otter below Otterton, the capacity of this channel to cope with future changes in runoff and
Haycock
2

associated floods is of concern, and also how sedimentation of the embanked channel and relic floodplain will respond to
changes in catchment sediment supply. The future regime of the River Otter, in the embanked section, is of concern since
there is a perception that current conservation management guidance on this section of the river is resulting in a loss of
channel capacity and therefore an increased flood risk to the embanked lands to the west of the channel.
It is against this back ground of current concerns, both from the Estate, tenants and property owners that Clinton Devon
Estates commissioned a strategic review of the Lower Otter in order to define more technically the nature of the issues and
from this define possible options for the long term management of the Lower River Otter, which has been in the Estate’s
ownership since 1785.
Figure 1: View South over the Lower Otter Valley towards Budleigh Salterton. (Environment Agency)
Haycock
3

Background
Catchment Topography and Geology
Figure 2: Catchment of the River Otter taken from the “River Otter Fluvial Audit, February 2004, Environment Agency and
Geodata”
The Otter catchment is 230 km2 upstream of Otterton and is summarised in “River Otter Fluvial Audit, February 2004,
Environment Agency and Geodata” as:
“The River Otter rises in the Blackdown Hills in the north east of the catchment and drains in a south-westerly direction to its
estuary at Budleigh Salterton on the south coast of Devon, England. The upstream limit of the 30km section of channel
investigated coincides with where the river becomes designated as ‘Main River’, at the confluence with the River Love (near
Langford Bridge). At this point the floodplain has widened to approximately 200 to 300m, although the valley remains steep-
sided.
The River Otter then follows the line of the A30 as it skirts the suburbs of Honiton. The A373 crosses the Otter immediately
upstream of the confluence with The Gissage, a heavily culverted stream which is the main drainage channel for Honiton.
Between the A373 bridge and Weston (Trafalgar Bridge) the course of the Otter is very sinuous, although further meander
development is constrained by the A30 and a natural embankment at Cottarson. From Weston to Fenny Bridges the
planform is predominantly straight and the main channel is heavily reinforced as it passes under the A30 and South-Western
Railway viaduct.
#
#S
Sidmouth
Honiton
Budleigh Salterton
Ottery St Mary
OttertonEast Budleigh
Colaton Raleigh
Newton Poppleford
Tipton St John
Alfington
Weston
Fenny Bridges
HarpfordA3052
A373
A375
A35
A30
A30
A3052
River Tale
Rive
r Otte
r
Riv
er O
tter
Legend
Catchment Boundary
Major Towns and Villages
River Otter and River Tale
Tributary
Main Roads
Coastline
Dismantled Railway
Railway
Railway Stations
# Feniton Station#S Honiton Station
ÊÚ Gauging Station : 1. Fenny Bridges 2. Dotton
N
0 3 6 Kilometers
ÊÚ
ÊÚ1
2
Rive
r Wol
f
Rive
r Lov
e
Rive
r Giss
age
Budleigh Brook
Figure 3.2. River Otter Catchment Area
Haycock
4

Downstream of Fenny Bridges the underlying geology switches from Mercia Mudstone to Otter Sandstone (Figure 3.1), the
floodplain widens further and the valley sides decrease in gradient. Just upstream of Gosford Bridge a disused railway
embankment, which runs from Honiton to Budleigh Salterton, constrains the planform migration of the Otter to the west,
while natural Otter Sandstone Cliffs which outcrop repeatedly impinge upon the rivers development to the east.
After its confluence with the River Tale, the River Otter passes through the western side of Ottery St Mary. For approximately
1km downstream of Ottery St Mary the channel is extremely active and bank erosion is particularly intense. Thereafter the
channel is confined again between the disused railway to the west and bedrock bluffs to the east, and follows a straight
course to Tipton St John.
Figure 3: River Otter Geology, taken from the “River Otter Fluvial Audit, February 2004, Environment Agency and Geodata”
At Tipton St John the Otter crosses the disused railway embankment and meanders across a wide, flat floodplain,
constrained only by the bridge which fixes the location of the apex of the central meander bend. Downstream the channel
crosses back under the disused railway and follows a straight course along the embankment of the main road between
Tipton St John and Harpford.
At Harpford the channel actively meanders to Newton Poppleford Bridge, thereafter a large, stable meander bend takes the
river west, under the disused railway, until it impinges against a series of sandstone cliffs. Here, the river passes through the
Dotton EA gauging station and is narrowly constrained between the cliff line and railway embankment until the river passes
east under the railway just north of Colaton Raleigh. Between Colaton Raleigh and Otterton the Otter follows a fairly straight
course along the base of a series of sandstone cliffs to the east of the river. The disused railway embankment is some 350m
to the west, however this narrows to approximately 100km at Otterton Bridge.
Downstream of Otterton the valley sides steepen and clearly define the floodplain. The Otter flows between the sandstone
cliffs on its eastern bank and a wide, flat floodplain to the west, until its outfall to the sea. A flood protection embankment
GeologyBarton, Bracklesham and Bagshot BedsBasalt dolerite, camptonite and allied typesBasalt, spilite and rhyoliteBudleigh Salterton Pebble BedsChalk including Red ChalkDevonian limestoneLower LiasMiddle LiasPermian and Triassic sandstonesPermian basal breccias,sandstones, mudstonesTournaisian and ViseanTriassic mudstonesUpper CarboniferousUpper Greensand and GaultUpper Old Red Sandstoneand Upper Devonian
Rivers
LegendN
0 5 10 Kilometers
Exe
Creedy
Clyst
CulmTale
Otter
Sid
Coly
Axe
Yarty
Figure 3.1. Location and Geology of the River Otter Catchment Within East Devon
Haycock
5

lines the west bank of the Otter from the normal tide limit at the confluence with Budleigh Brook (downstream limit of the
Otter in this study) to its outfall at Budleigh Salterton.
It is clear that the course of the River Otter has been, and remains today, significantly affected by anthropogenic
interventions. Some 17 road and railway bridges (many disused) cross the Otter, while 7 major weirs and numerous smaller
weirs are used to control river flow, check bed erosion and supply the mill leats which run through Ottery St Mary, Tipton St
John, Otterton and Tracey Mill Farm north of Honiton.” (p4-10)
Lower Otter Topography and Geology
The area of investigation starts upstream of Otterton and its Mill, and extends downstream to the pebble bar at Budleigh
Salterton. The floodplain has a natural land elevation of 6.0m AOD upstream of Otterton, with the estuary land levels to the
south at 1.8-2.2m AOD. The floodplain ranges from 400-500m wide and the total length of the area of interest is
approximately 3.5 km long. In figure 4, key features are marked within the floodplain.
Otterton Mill
Flood Plain Embankments
1950ʼs Town Refuse Site
Otter Estuary
Cricket Club
Shingle BarBudleigh Car Park
Railway Line (Disused)
Figure 4: Illustrative surface elevation map of the Lower Otter Valley (Image based on Environment Agency LiDAR data)
Haycock
6

In terms of topography, the main features of interest, affecting drainage and flood dynamics, are the cross valley roads and
associated bridges at Otterton and South Farm. The railway line cuts diagonally through the floodplain, with land levels of the
track ranging from 0.5-1.5m above the natural floodplain. The embankment is clearly visible within the topographic map, as
are the fossilized tidal channels and creeks from below Otterton through the embanked section of the floodplain. In the lower
half of the floodplain, the triangular elevated land level is the town’s refuse dump, closed in the 1950’s. South of the refuse
site, the floodplain is split in half with the current estuary to the east and the embanked floodplain to the west. Within this
section of the floodplain, the Budleigh car park is clearly elevated relative to the estuary and floodplain, with an average
elevation of 3.6m AOD. The highest section of the pebble bar is 6.8-7.2m AOD.
The only section of the floodplain that is naturally narrower, is at East Budleigh, where the former natural channel has formed
a debris fan into the former estuary and floodplain.
The floodplain’s underlying geology is sandstone with most of the floodplain soils at the surface consisting of fine sand and
silt soils associated with historical alluvial sediments settling within the floodplain. There are small sections of gravel based
soils, but these are limited in area. Upstream of Otterton the floodplain soils are formed of more coarse sediments with more
visible sand and gravels at the surface. Peat, either at the surface or buried, is not known to be present in the floodplain.
Figure 5: Section through the Lower Otter floodplain to illustrate the elevation of three key features, the embankments and
refuse site. Information based on Environment Agency LiDAR at 1m resolution (2009 post processing).
Haycock
7

Catchment Hydrology
Since extensive flooding in the Otter Valley in 1968, government agencies over this period have maintained flow gauging
stations in the catchment, notably at Dotton, upstream of Otterton. In the past decade the flows for the Otter have been
extensively reviewed and analysed and since the floods of 2008, additional work on the flow statistics of the River Otter at
Dotton has also been undertaken by HydroLogic, building on the Environment Agency April 2008 Catchment Hydrology
Report. It is therefore not the intention of this report to review this data extensively, but just to summarise the key figures.
The overall hydrological regime of the River Otter lies between the extremes of a flash flood river and a true groundwater
based catchment. The peak flow recorded for the catchent divided by the catchment area (Q2 / km2) is approximately 0.35
cumecs / km2. This compares to a flash flood river with an index of 0.95 cumecs / km2 or a chalk stream with a runoff index
of 0.02 cumecs / km2. As a sandstone river, with large areas of mudstone, runoff responses can be fast, but the sandstone
does not retain large volumes of groundwater to sustain flows in the summer. The net effect is that rainfall tends to pass
through the catchment in less than 24 hours, with base flow often being very low and unable to sustain flow in the upper
catchment.
!"
#"
$"
%"
&"
'"
("
)"
*"
#+(%"
#+(&"
#+('"
#+(("
#+()"
#+(*"
#+(+"
#+)!"
#+)#"
#+)$"
#+)%"
#+)&"
#+)'"
#+)("
#+))"
#+)*"
#+)+"
#+*!"
#+*#"
#+*$"
#+*%"
#+*&"
#+*'"
#+*("
#+*)"
#+**"
#+*+"
#++!"
#++#"
#++$"
#++%"
#++&"
#++'"
#++("
#++)"
#++*"
#+++"
$!!!"
$!!#"
$!!$"
$!!%"
$!!&"
$!!'"
$!!("
!"#$%"&'()*+),+$)-+.//+-012+3)4#+
Figure 6: Number of peak flows over 25 cumecs per annum. Dotton Gauge (45005: 1963-2006: >25 mean daily flow:
cumecs)
Using the Dotton flow gauge, and the peak daily mean flow statistics (figure 6 and 7), the highest recorded daily flow in the
1960’s was 52 cumecs, in the 1970’s was 61 cumecs, in the 1980’s 56 cumecs and in the 1990’s 41 cumecs. In the 2000’s,
up to 2006, peak flow was 67 cumecs. There is no underlying trend, but the peak daily flows post 2000 are higher than
before this period.
The lack of major floods in the 1990’s is confirmed by Budleigh Salterton Cricket Club records for the period 1960 onwards,
which records a lack of major flooding in the period 1987 until 1997.
Haycock
8

Figure 7: Time plot of the recorded peak daily mean flows greater than 25 cumecs for the Dotton gauge for the period 1963
until 2006.
Recent flood events of the catchment are presented in figure 7. The number of flood events over 25 cumecs, in the last
decade has been low compared to the period 1963 until 2000. However, post 2008, there have been a number of serious
floods, notably on the 29th - 30th October 2008, which generated an estimated 212 cumecs of flow based on a localised
rainfall event of 187mm in 27 hours. This event was 3.0 times larger than the mean annual flood (Q2 = 70.45 cumecs) and
based on the April 2008 rating curves for the catchment at Dotton, would equate to a 170-220 year return period. The peak
flow was principle generated by the core of the rainfall, namely 135mm, landing in 2 hours. The rainfall return period was
estimated to be greater than 1:200 years (table 1).
Table 1: Met Office Statistics for the Rainfall at Ottery St. Mary, 29th - 30th October 2008
Rainfall total (mm) Duration (hrs)
187 27
160 3
135 2
!"
#!"
$!"
%!"
&!"
'!"
(!"
)!"
*!"
#+(!" #+('" #+)!" #+)'" #+*!" #+*'" #++!" #++'" $!!!" $!!'" $!#!"
Haycock
9
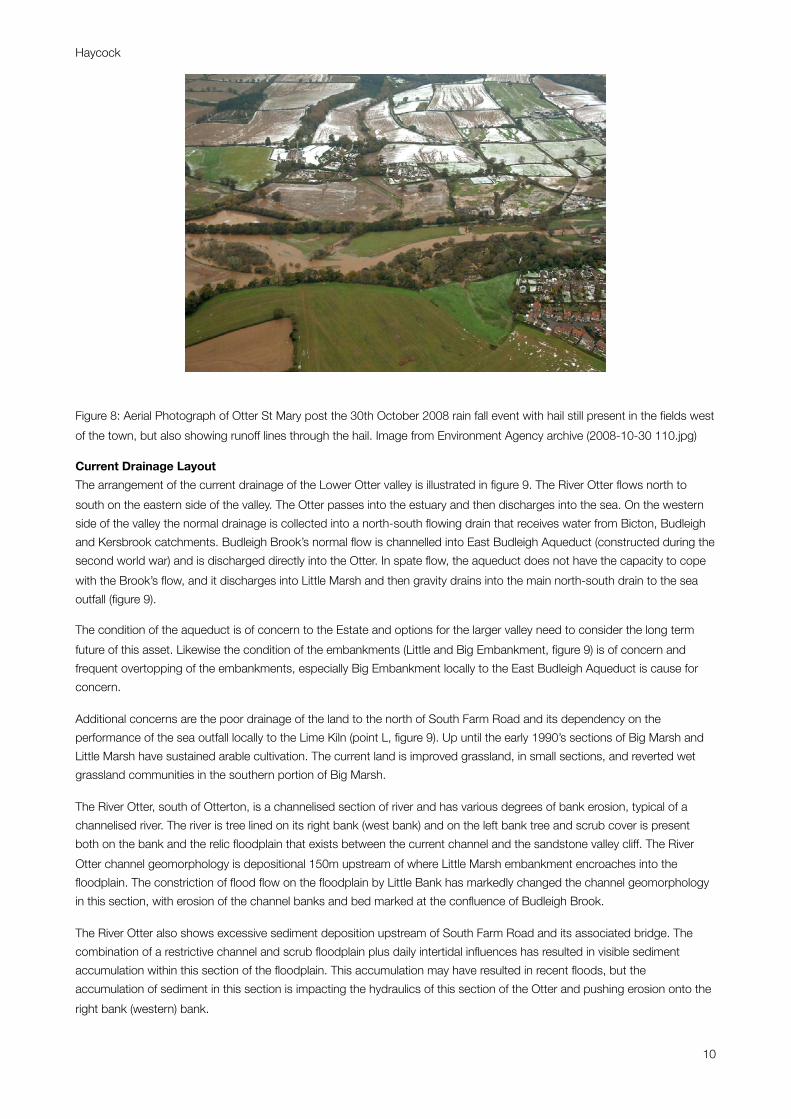
Figure 8: Aerial Photograph of Otter St Mary post the 30th October 2008 rain fall event with hail still present in the fields west
of the town, but also showing runoff lines through the hail. Image from Environment Agency archive (2008-10-30 110.jpg)
Current Drainage Layout
The arrangement of the current drainage of the Lower Otter valley is illustrated in figure 9. The River Otter flows north to
south on the eastern side of the valley. The Otter passes into the estuary and then discharges into the sea. On the western
side of the valley the normal drainage is collected into a north-south flowing drain that receives water from Bicton, Budleigh
and Kersbrook catchments. Budleigh Brook’s normal flow is channelled into East Budleigh Aqueduct (constructed during the
second world war) and is discharged directly into the Otter. In spate flow, the aqueduct does not have the capacity to cope
with the Brook’s flow, and it discharges into Little Marsh and then gravity drains into the main north-south drain to the sea
outfall (figure 9).
The condition of the aqueduct is of concern to the Estate and options for the larger valley need to consider the long term
future of this asset. Likewise the condition of the embankments (Little and Big Embankment, figure 9) is of concern and
frequent overtopping of the embankments, especially Big Embankment locally to the East Budleigh Aqueduct is cause for
concern.
Additional concerns are the poor drainage of the land to the north of South Farm Road and its dependency on the
performance of the sea outfall locally to the Lime Kiln (point L, figure 9). Up until the early 1990’s sections of Big Marsh and
Little Marsh have sustained arable cultivation. The current land is improved grassland, in small sections, and reverted wet
grassland communities in the southern portion of Big Marsh.
The River Otter, south of Otterton, is a channelised section of river and has various degrees of bank erosion, typical of a
channelised river. The river is tree lined on its right bank (west bank) and on the left bank tree and scrub cover is present
both on the bank and the relic floodplain that exists between the current channel and the sandstone valley cliff. The River
Otter channel geomorphology is depositional 150m upstream of where Little Marsh embankment encroaches into the
floodplain. The constriction of flood flow on the floodplain by Little Bank has markedly changed the channel geomorphology
in this section, with erosion of the channel banks and bed marked at the confluence of Budleigh Brook.
The River Otter also shows excessive sediment deposition upstream of South Farm Road and its associated bridge. The
combination of a restrictive channel and scrub floodplain plus daily intertidal influences has resulted in visible sediment
accumulation within this section of the floodplain. This accumulation may have resulted in recent floods, but the
accumulation of sediment in this section is impacting the hydraulics of this section of the Otter and pushing erosion onto the
right bank (western) bank.
Haycock
10

Figure 9: Current Drainage arrangements for The Lower Otter Valley (taken from Howick and Partners report to Clinton
Devon Estates)
Annotation: A-B is South Farm Road, which crosses the embanked compartment. C is the EA sea discharge behind the
Cricket Club. D is the main embankment drain. D-E is Big Bank. K-E (orange line) is the East Budleigh Aqueduct. E is the
discharge point of Budleigh Brook. F-E is Little Bank. G is Bicton Brook. J is Otterton and Otterton Mill. L-M is the culvert
discharge to the sea. M is the sea outfall of the embankment drain. F-C (green line) is the length of the embanked
compartment consisting of Little Marsh and Big Marsh.
E-Mail. [email protected]. 01395 265974 Fax. 01395 268579Rolle Street, Exmouth, Devon,National Westminster Bank Chambers,
Ian Howick and Partners
EX8 1HA
Haycock
11
Recorded Flood Events
Since 1959, Budleigh Salterton Cricket Club (BSCC), whose grounds lie on the embanked floodplain of the River Otter, have
kept an archive of the impact of floods on the grounds and associated buildings. In reviewing this archive, with the
assistance of the Cricket Club, we have sought to classify the dominant source of flooding. Namely drainage and associated
pluvial flooding, fluvial flooding from the River Otter and estuarine flooding (saline). The one recorded saline flood event was
in 1959, although Estates records indicate that in 1982 a section of the embankment, upstream of the Cricket Club failed
and was repaired, and may have resulted in saline inundation, but this was not recorded by the Cricket Club.
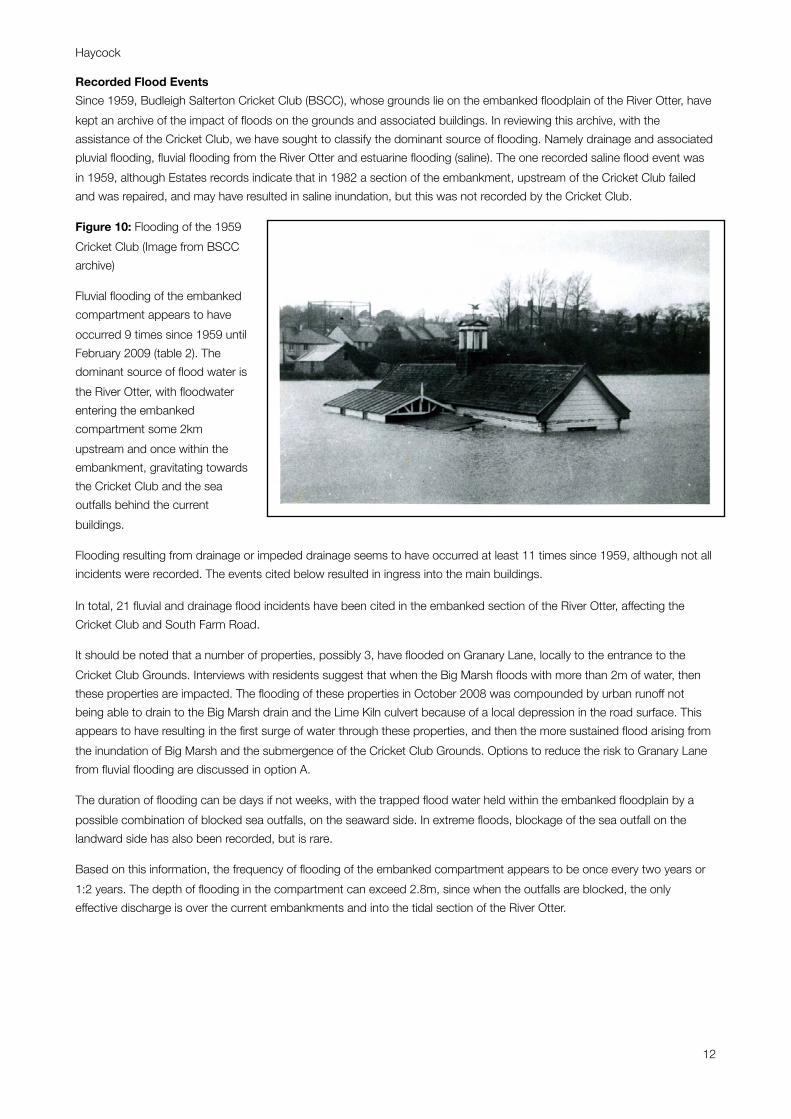
Figure 10: Flooding of the 1959
Cricket Club (Image from BSCC
archive)
Fluvial flooding of the embanked
compartment appears to have
occurred 9 times since 1959 until
February 2009 (table 2). The
dominant source of flood water is
the River Otter, with floodwater
entering the embanked
compartment some 2km
upstream and once within the
embankment, gravitating towards
the Cricket Club and the sea
outfalls behind the current
buildings.
Flooding resulting from drainage or impeded drainage seems to have occurred at least 11 times since 1959, although not all
incidents were recorded. The events cited below resulted in ingress into the main buildings.
In total, 21 fluvial and drainage flood incidents have been cited in the embanked section of the River Otter, affecting the
Cricket Club and South Farm Road.
It should be noted that a number of properties, possibly 3, have flooded on Granary Lane, locally to the entrance to the
Cricket Club Grounds. Interviews with residents suggest that when the Big Marsh floods with more than 2m of water, then
these properties are impacted. The flooding of these properties in October 2008 was compounded by urban runoff not
being able to drain to the Big Marsh drain and the Lime Kiln culvert because of a local depression in the road surface. This
appears to have resulting in the first surge of water through these properties, and then the more sustained flood arising from
the inundation of Big Marsh and the submergence of the Cricket Club Grounds. Options to reduce the risk to Granary Lane
from fluvial flooding are discussed in option A.
The duration of flooding can be days if not weeks, with the trapped flood water held within the embanked floodplain by a
possible combination of blocked sea outfalls, on the seaward side. In extreme floods, blockage of the sea outfall on the
landward side has also been recorded, but is rare.
Based on this information, the frequency of flooding of the embanked compartment appears to be once every two years or
1:2 years. The depth of flooding in the compartment can exceed 2.8m, since when the outfalls are blocked, the only
effective discharge is over the current embankments and into the tidal section of the River Otter.
Haycock
12

Table 2: Analysis of local press and BSCC archive on the flood history of the Lower Otter Valley
DateIncident
NumberTheme Source
Classificati
on
December 19th
19591
Floods the week prior to publication along with outfall pipe proposed. States in 1812
embankment on western side of river built up and therefore restricted the free movement of
water in and out of the estuary.
Floods the week prior to publication along with outfall pipe proposed. States in 1812
embankment on western side of river built up and therefore restricted the free movement of
water in and out of the estuary.
Tidal
March 1960 2 Floodwaters continued to be a problem. Fluvial
1986 Suggestion of flood in 1997 correspondents Fluvial
August 1997 3
Thursday 7th August rainstorm caused flooding along Otter Valley. Friday
8th August cricket grounds inundated, flood water reaching steps of clubhouse. Tidal valve examined and found to be purposefully blocked with plugging clay. Penstock valve also remained closed. Both valves freed
on Saturday 9th and floodwaters able to dissipate.
Chronicle of events
relating to flooding of
cricket ground 8:Aug:97
from cricket club
Fluvial
October 22nd
19974
Flooding during August 1997, prior to event no flooding since 1989 due to flood defence work carried out by National Rivers Authority further
upstream. During this time there were equally heavy rainstorms with no flood events. Tidal flap blocked by Environment Agency at the request of
Heritage Preservation Agency who wanted to preserve wetlands.
Letter from Cricket Club to Crawford &
Company
Letter from Cricket Club to Crawford &
Company
April 28th 1998 5Record of flooding during August 1997, thought to be due to faulty tidal
flap. Grounds unfit for use for period of 8 months from August.
Situation report from
Cricket clubDrainage
April 26th 2000 6Cricket grounds flooded for 2 weeks prior to letter. All land drains blocked
and surface water not able to drain away.Letter from cricket club
to Ctawford & Company,
and forwarded to EA.
Fluvial
November 9th
20007
5ft of water at cricket club pavillion. 2nd flooding in 7 days. Outfall cleared
on the Friday. Grounds re-flooded on following Wednesday.
The Budleigh Salterton
JournalFluvial
January 11th 2001 8 Clubhouse flooded for 2 months prior to article being written. The Budleigh Salterton
JournalDrainage
January 18th 2001 9Unprecedented flooding over 3 month period. When outfall needs to be working at full efficiency, it is often impaired. Losses of equipment and
building damage in excess of £50,000.
Letter from Cricket Club
to EDDCDrainage
November 21st
200210
3 Houses in Granary Lane flooded and clubhouse submerged under 15ft of water. 3rd time of serious floods in 3 years and only weeks since the last flood. 8hrs of rain between Weds and Thur.
The Budleigh Salterton
JournalFluvial
November 28th
200211
EA give go ahead for flood channel and penstock (£50,000). However
South Farm and businesses continue to be cut off and closed.
The Budleigh Salterton
JournalDrainage
December 5th
200212 November floods caused serious erosion of river walkways and banks.November floods caused serious erosion of river walkways and banks.
December 16th
200213
Cricket ground flooded for a number of weeks due to continual rainfall and
outfall pipe only able to discharge flood waters for 2 hours max, before shingle begins to block pipe once again.
Letter from Cricket Club
to EDDCDrainage
Winter 2002 14Floods over 13-14th November due to 47mm of rain falling at Dunkeswell
in the headwater catchment area. Closure of South Farm Road and Granary Lane properties flooded along with cricket club.
Newsletter for Clinton
Devon Estates PeopleFluvial
January 9th 2003 15 Cricket grounds re-flooded Drainage
January 20th 2003 16After flooding of November 2002 outfall pipe was found to be operational
only 30% of the time during December.
Letter from Granary Lane
resident to EDDCDrainage
Haycock
13
DateIncident
NumberTheme Source
Classificati
on
September 23rd
200517
Tidal valve repaired to full working order and expected to work
satisfactorily for 'a good few years to come'.Letter from EDDC to Cricket ClubLetter from EDDC to Cricket Club
January 2nd 2008 18Problems of flooding during December 2007 , outfall pipe blocked and
flooding grounds and pavillion.
Letter from Cricket Club
o EDDCDrainage
February 20th
200819
Early Jan 08 storms blocked outfall pipe and lead to farmers fields being 'permanently sodden', and further flooding of cricket grounds.
E-mail from Cricket Club
to EDDCDrainage
October 31st 2008 20 1ft of hail within 2hrs. Floodwaters hit homes.The Budleigh Salterton
JournalFluvial
February 5th 2009 21 Flood waters submerged clubhouse completely twice during the winter. Exmouth Journal Fluvial
February 11th
200922
Significant flooding during October and December 2008. Outfall pipe blocked, can take a full week before EDDC arrive to unblock. Express and Echo Drainage
February 2009 23Granary Lane flooded from 30th October 2008 beyond 11th February 2009.
E-mail from resident of
Granary Lane to EDDCDrainage
Total incidents 21
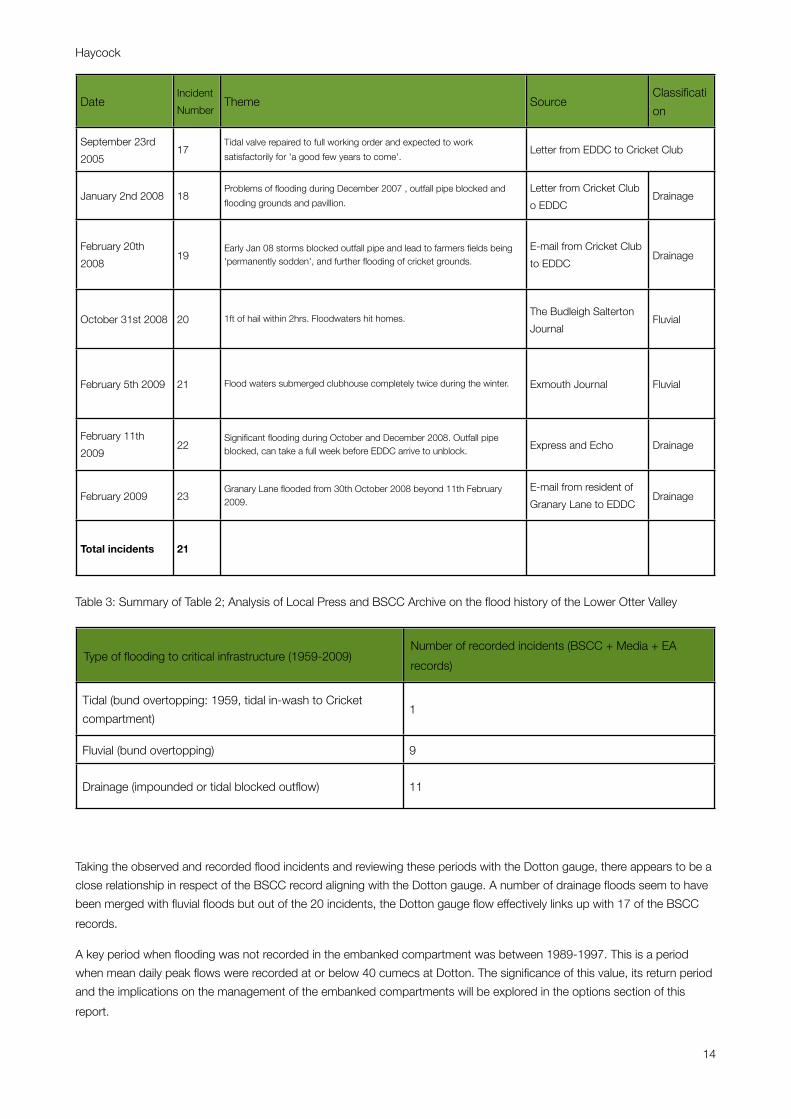
Table 3: Summary of Table 2; Analysis of Local Press and BSCC Archive on the flood history of the Lower Otter Valley
Type of flooding to critical infrastructure (1959-2009)Number of recorded incidents (BSCC + Media + EA
records)
Tidal (bund overtopping: 1959, tidal in-wash to Cricket
compartment)1
Fluvial (bund overtopping) 9
Drainage (impounded or tidal blocked outflow) 11
Taking the observed and recorded flood incidents and reviewing these periods with the Dotton gauge, there appears to be a
close relationship in respect of the BSCC record aligning with the Dotton gauge. A number of drainage floods seem to have
been merged with fluvial floods but out of the 20 incidents, the Dotton gauge flow effectively links up with 17 of the BSCC
records.
A key period when flooding was not recorded in the embanked compartment was between 1989-1997. This is a period
when mean daily peak flows were recorded at or below 40 cumecs at Dotton. The significance of this value, its return period
and the implications on the management of the embanked compartments will be explored in the options section of this
report.
Haycock
14

Figure 11: Linking observed flooding of the embanked compartment with the Dotton flow gauge peak daily flow record.
!"
#!"
$!"
%!"
&!"
'!"
(!"
)!"
*!"
#+(!" #+('" #+)!" #+)'" #+*!" #+*'" #++!" #++'" $!!!" $!!'" $!#!"
cum
ecs
38-40 cumecs flow threshold associated with flooding of the compartments
BSCC reported only drainage flooding in this period (1989-1997)
Haycock
15

Tidal Levels and Data and its Current Influence
The level of the tide exerts two main influences on the hydrology of the Lower Otter Valley. Firstly the drainage of the
embanked compartments is dependent on the gravity drainage to the sea through a set of weirs and through a culvert to a
sea outfall located on the pebble beach locally to the Lime Kiln, Budleigh Salterton (figure 12). The second effect is the tidal
surge of water through the pebble bar and into the estuary and the impact of this volume of water on the dynamics of the
estuary and interactions with the normal flow of the River Otter.
Figure 12: Photographs of the embanked compartment outfall on the pebble beach locally to the Lime Kiln, Budleigh
Salterton. The left image shows the outflow blocked by gravel and pebbles. The right image shows the Council clearing the
outflow which can occur weekly based on BSCC information.
The 975mm outfall at the Lime Kiln has an invert level of -1.6m AOD (Howick and Partners, 2001) and is below Mean Low
Water Spring Tide (-1.3m AOD). The Mean tidal is 0.7 mAOD. For the majority of the tidal cycle the outfall is submerged and
discharge from the pipe requires a hydrostatic head to build up on the inflow, greater than the tidal level. Once the tide
exceeds -1.05m AOD a flap valve starts to become submerged and the discharge efficiency of the embankment drains
becomes impaired or ceases. Land levels locally to the Cricket Club are 0.8-1.0m AOD with mean high neap tide
approximately 1.50 mAOD. The low elevation of the outflow results in frequent periods when the normal drainage of the
embanked compartment is compromised. When the drainage is impaired, excess runoff accumulates within the embanked
compartment drains and the low lying fields. If a normal rainfall event (>10mm/day) coincides with impaired drainage over a
number of tidal cycles, then key assets will flood. Major incidents of drainage related flooding have been recorded 11 times.
But flooding of fields and amenity areas is calculated to be far more frequent based on the elevations of the embanked
floodplain land.
The second impact of the outflow being so low relative to the tide, is the impact of shingle accumulation at the outflow
chamber. Howick Engineers reported in 2001 that:
“On 9th February 2001 the beach level was surveyed and was found 1.5m to 2.0m higher than when the end of the outfall
was reconstructed in the mid-1980s.” (BUDLEIGH SALTERTON TRUNK DRAIN SURVEY for Clinton Devon Estates, 2001,
Howick and Partners, p4)
This measurement and observation suggests that the pebble beach is undergoing some form of geomorphological
adjustment. As with pebble bars in other locations, its has been observed that these features are becoming steeper on the
seaward aspect, with the crest of the shingle bar also becoming higher. This has also been recorded at Loe Bar and Slapton
Ley. The impact of sediment accumulation at the outfall chamber is to reduce normal flow, even when the tide allows normal
drainage. The net result appears to be significantly impaired drainage for periods of days and weeks until the outflow is
excavated clear by the local council. This work can only occur at low tides.
Haycock
16

Potential changes in the sediment supply and sediment circulation of the pebble bar is outlined in the Environment Agency
Shoreline Management Plan (version 2, section 1.8, p29-31). In this report they discuss how the essential direction of long
shore drift aids the accumulation and growth of the pebble bar eastward. However, changes in the direction of long shore
drift in this section of coast have been recorded as Atlantic swells often compete with North Sea swells. In addition, the
sediment supply to the mouth of the Otter and the power of flow out of the Otter mouth can result in significant volumes of
sediment being laid back along the pebble beach, east of the Otter mouth.
In figure 13, BODC data for Weymouth since 1992, suggest that maximum monthly tides (cm ACD) have increased since
1992 until 2001. Since 2001, mean maximum tides have been consistently higher, but peak tides lower than 2001. This
change in tidal behaviour may support the assertion that at the pebble bar, long shore drift is indeed dynamic, and
dependent on the Altantic / North Sea dominance, and the sediment supply and flows from the River Otter. The observation
by Howick, that the beach locally to the embankment drain sea outfall has increased by 2m in 15 years does suggest a more
dynamic beech regime than previously considered.
!"#$%!"&$%!#$$%!#'$%!#($%!#)$%!#*$%!#+$%!#!$%!#"$%!##$%!#&$%!&$$%!&'$%!&($%!&)$%!&*$%!&+$%!&!$%!&"$%!&#$%!&&$%"$$$%"$'$%"$($%"$)$%"$*$%"$+$%"$!$%"$"$%"$#$%"$&$%"'$$%"''$%"'($%"')$%"'*$%"'+$%"'!$%"'"$%"'#$%"'&$%"($$%"('$%"(($%"()$%"(*$%"(+$%"(!$%"("$%"(#$%"(&$%")$$%")'$%
'&&$% '&&(% '&&*% '&&!% '&&#% ($$$% ($$(% ($$*% ($$!% ($$#% ($'$%
Figure 13: Extreme monthly tides for Weymouth based on BODC sea level gauge. Levels are cm ACD.
Haycock
17

Historical Periods and Accounts of the Lower Otter Valley
The economic history of the Lower Otter Valley is very rich. We have focussed on the period from 1060 until the present and
sought to illustrate the changing landscape of the river and its relationship with the sea. The key observations, taken from
“Historical Guide to the Lower Otter Valley, 1993” illustrate some key changes in landform of the valley:
• In the 10th century, 3 mills recorded at Otterton, owned by Countess Gytha, mother to King Harold (7th January 1066).
With Harold’s death, King William passes Otterton to Abbey of Mont St. Michael, Normandy.
• Abbey of Mont St. Michael record Otterton as a sea port, with ship building one of the recorded activities. Abbots were
very keen on the eels (p62).
• The Abbey records describe the silting up of Otter Mouth and formation of marshland at the end of the Mediaeval period.
Extreme storms in the South West were responsible for many coastal changes in this period (e.g., Loe Pool, Slapton).
• Large vessel navigation lost on the Otter by 16th century (J. Leland, cites the period 1440, one hundred year prior to his
visit). Leland writes of Otterton as a fishing port, a mile upstream of Ottermouth. Leland was Royal Librarian for Henry VIII
and his 10 year tour of the Cathedrals and Churches of England resulted in the publication of “Britannia” by William
Camden after Leland’s death in 1552. Camden became the first Chair of History at Oxford University.
• The land passes from Syon Abbey to Richard Duke c. 1539 with its 100 acres of marsh. Richard Duke (the father) was
protege to Cardinal Wolsey in Henry VIII’s court. His son, also Richard Duke became Mayor of Exeter and continued the
family line and its association with Otterton.
• The Duke family attempted to refloat the harbour in the period 1553 with public subscription. Efforts ended in the loss of
“Bodelie Haven”.
• The Rolle family purchase Otterton (1785) and record 189 acres of salt marsh, suitable for reclaiming.
• 1812 Rolle decided to tame the river, and using French prisoners, build the western embankment.
• Some evidence of a hurricane in 1824 that extended the Pebble Bar into its current form. Source Unknown.
• Rear Admiral F. Bullock (Vice-Admiral of surveying service, Woolwich, 1864) and Mr. Andrews in 1858 state navigation of
60 ton vessels possible until 1810, but embankment has accelerated siltation and allowed pebble bar to build up without
estuarine wash.
• 19th century until WW1, stable farming period.
• 1897-1903 the railway was developed to Salterton, funded by the Rolle Estate.
• Large floods in 1968 result in flood works in Otterton and surrounding area.
The picture that emerges from the historical records is a valley defined by stable periods, where economic activities could be
developed. The 10th until the 14th century appears to be period when the valley is predominantly estuarine with the sea port
and fishing community at Otterton. Trading in minerals and fibre at the Village seems key, with the Mills providing processing
of wool, lime and cereals. Extreme storms in the 1400’s resulted in an apparent shift in the geomorphological regime of the
pebble beech with the bar forming and the tidal regime throttled, with large ship navigation to Otterton reduced. The
development of the bar may relate to a period in 1485, when the bar at Loe Pool (Lizard Point) and Slapton Ley (Devon)
underwent massive changes as a result of a storm surge. This event was recorded by Chroniclers for Loe Pool, with the
erosion and washout of Loe Pool harbour recorded by ships sailing locally to Lands End (National Trust, Penrose Estate
Archive).
The formation of the pebble bar marked a change in the tidal and river regime of the Lower Otter. Leland, Henry VIII’s
chronicler records the loss of navigation of “Bodelie Haven”. Efforts to clear the bar and refloat the harbour by Richard Duke
in 1553 fail. The Rolle family in 1812 seek to build on the terrestrialisation of the valley and the growth of marshlands from
100 acres in 1553 to 189 acres in 1785, through a series of embankments, built with the labour of French prisoners of war.
Stone from the Otter Valley walls was harvested in the construction of these embankments, with the river effectively trained
from Otterton to the sea. This resulted in the marshlands being limed and restored to arable and grazing lands from the
period 1812.
Haycock
18

Concerns about the impact of these embankments and the loss of navigation up the estuary appeared to have been raised
by Rear Admiral Bullock in 1858. The combination of the embankment, the pebble bar and changing sediment supply into
the reduced estuary, from tidal and fluvial sources, are all legacies that the current land managers seek to deal with.
Haycock
19

Hydraulic Model of the Lower Otter ValleyIn order to generate a fuller understanding of the flood dynamics of the Lower Otter Valley, this project has constructed a 2-D
flood model of the River Otter and its associated floodplain. The underlying land levels in the computer flood model have
been derived from Environment Agency remote senses LiDAR data. This mapping system uses an airborne laser to scan the
ground surface at 1m intervals (X-Y axis) and records the elevation of land to within 0.05-0.15m vertically. A representation of
the land level data generated from this system is illustrated in figure 4 at the start of this report.
The Environment Agency LiDAR data was then checked with surveys of key assets and embankment heights secured from
previous Estate surveys.
The data used in the model was scaled to represent the average land surface elevation every 5m in open areas, and the
maximum land surface along the lines of key assets, for example the embankments and other structural features.
The digital terrain model was then processed in LisfloodM-MPI; a 2D hydraulic model designed by Bristol University and
optimized for UNIX platforms by Haycock Associates. The flood model allows discharges to be placed in the digital terrain
model and then their flow direction, rate and depth of water mapped as the flow moves through the model under gravity and
momentum based forces. The flood model responds to the elevation of the land and the underlying hydraulic roughness of
the land areas, as defined by land cover. The model can cope with multiple inflows (unlimited) and also enables the
simulation of tidal regime. Thus the model is ideally suited to the analysis of the Lower Otter.
The model generates considerable data, both of flood water height and also of water depth and velocity. Additional functions
within the model enable land elevation to be adjusted in response to geomorphological stresses, but this option was not
explored in the simplified models generated for the Lower Otter Valley.
In the following section we outline the main observations of simulated floods on the Lower Otter Valley. The first analysis was
of the current flood dynamics, without tidal influences. The second set of models was to explore the implications of removing
the current embankments, in key sections, and the resultant flood dynamics. The final set of models sought to explore the
tidal regime of the estuary and its impact on the fluvial regime. In the tidal flood simulations we also explored the implications
of the breaching of the flood embankments (Big Bank) and the resultant inundation areas.
Flood Dynamics - Fluvial
The fluvial flood simulations enter a flow of 69 cumecs into the model upstream of Otterton at a single point associated with
a constrained point in the channel. Flows from other tributaries were not simulated at this stage in order to concentrate on
the flood route and dynamics of the River Otter. 69 cumecs represents the peak flow of a 1:2 year flood or the average
sustained flow of a 1:100 year for the core 12 hours of the storm. Initial modelling work with a unit hydrograph of a 1:100
year storm simply swamped the model and did not enable any diagnostics and inspection of the processes of flooding to be
examined, thus a lower volume of water was entered into the model to enable the process of flood propagation to be
tracked. Based on the analysis of flows at Dotton in the previous section, we have estimated that flows greater than 40
cumecs result in flooding of the main embankment compartments.
In figure 14 a-d, key time slices of the model are presented. Key observations of the flood model, which support tenant and
Environment Agency flood records for the area, are:
1. The railway embankment upstream of Otterton restricts flow to the western floodplain. If this simulation had started
further upstream, then a portion of the flood water would have passed down this section of the floodplain. At Dotton, it
is estimated that 30% of the flood passes down the western portion of the floodplain (verbal, HydroLogic).
2. The Bridge at Otterton does not have the capacity for 69 cumecs, with the side arches effectively restricted by high land
upstream and downstream of the culvert. Flooding over the road on the western floodplain occurs.
Haycock
20

3. Below Otterton floodwater overtops the right bank and flows diagonally towards the railway embankment and then
down to Little Bank, where it ponds upstream of the embankment. Water depths on the floodplain locally to Otterton are
shallow, less than 500mm (figure 14a).
4. Once the land upstream of Little Bank is surcharged, then flood water attempts to re-enter the Otter channel, but flow is
restricted in this section to less than 40 cumecs. Surplus water therefore overtops Little Bank and enters Little Marsh
(figure 14a).
5. Once Little Marsh is surcharged, excess water passes over Big Bank along a broad crest and into Big Marsh. The
model suggests that no flow directly from the Otter enters Big Marsh, other than from flood flow entering Little Marsh.
Figure 14b shows the northern section of Big Marsh flooded, but no flood water ponded by the 1950 refuse site, which
has an elevation 1.8-2.5m above the embanked floodplain.
6. Water enters the southern section of Big Marsh via a depression to the western end of South Farm Road and also via
overtopping water in the main Otter channel near White Bridge. The main flood water enters via the western portion of
South Farm Road and results in 1.4-2.0m of standing water on the low lying road (figure 14c). It should be noted that
the majority of the flood water is entering the embanked compartments, and only slowly filling the estuarine portion of
the Otter, which has a land level of 1.8-2.2m AOD.
7. The final phase is the complete surcharging of the embanked compartments (figure 14d, at 695 minutes), the flooding
of the estuary via the main channel flow and also flow from the Big Marsh re-entering the main channel just downstream
of the refuse site. The depths of water in the embanked section exceeds 2.8m of standing water. The geometry of the
channel through the pebble bar restricts flow at 69 cumecs, but extensive flooding has occurred upstream because the
channel capacity is restricted and degraded.
8. We have not modelled the dewatering of the site, but we have estimated that flood water volumes in the final phase
exceed 1.4 million cubic metres. Assuming no tidal influence to limit discharge to the sea, it would take a minimum of 5
days to dewater. Given that the outfalls are compromised by tidal influence, the experience of standing water for many
weeks is to be expected.
Haycock
21

Figure 14 a-d: Key time slices of the modelled water depth for a 69 cumec fluvial flood passing through the Lower Otter
Valley based on LisfloodM-MPI output (model run on a 5m DTM with computation timesteps of 0.005 seconds, with model
output saved at 60 second interval [text] and 300 seconds for spatial data files).
Haycock
22
A
B
C
D

In order to simulate the impact of renaturalising the floodplain for fluvial flooding (namely Policy Unit 1, Environment Agency
CFMP, 2008) we have modelled the strategic removal of flood impounding features at critical locations. Figure 15 shows the
locations in red where the digital terrain model has been modified to remove features and return land levels to local
elevations. Key features lowered or removed would be sections of the railway embankment, sections of Little and Big Bank,
sections of the Otter embankment locally to Big Marsh (northern and southern compartment) and finally sections of the
embankment locally to the estuary. The aim of this simulation is to explore if any significant benefit can be generated from
upstream areas, namely Otterton and land locally to Little Marsh.
Figure 15: Option X, the removal of key land features to enable the free flow of fluvial floodwater through the Lower Otter
Valley.
The result of removing key land features is summarised below
(figure 16 a-d). The main observation is that the removal of the
railway embankment in the upper sections does result in the
movement of more water to the western side of the floodplain
with the result that there is an increase in flood conveyance in
this upper section. At point A in figure 15 (left) the effect is the
lowering of water surfaces by 9cm locally to Otterton.
But the effect of removing Little and Big Bank is to draw water
faster into these sections and result in greater depths of water
in this section because the River Otter channel is not being
used effectively with the flow concentrated on the western side
of the floodplain. As a result at point B (figure 15, left) the water
depth increases by 20cm.
In the lower section of Big Marsh at the Cricket Ground,
breaches in the flood embankment, assuming no tide, would
assist with lowering the flood depths in this area (point C, figure
15) by 52cm, but water depths would still exceed 2.31m at
peak flows. The main problem is that with the marsh land level
at 2.2m and the relic floodplain at 0.8-1.0m, once Big Marsh is
flooded it would not dewater, without excavation of a large
creek through the current estuary. In this simulation, tidal
influences have not been assessed, but obviously the holes in
the embankments would result in tidal ingress into Big Marsh
on most tidal cycles.
Haycock
23
A
B
C

Figure 16 a-d: Key time slices of the modelled water depth for a 69 cumec fluvial flood passing through the modified Lower
Otter Valley based on LisfloodM-MPI output. Key embankments have been lowered in the simulation to represent
renaturalisation of the floodplain for fluvial flooding.
Figure 16d
Figure 16a
Haycock
24

Flood Dynamics - Tidal
Two basic simulations have been undertaken to examine the tidal inundation dynamics of the Lower Otter Estuary. Firstly a
normal tidal cycle, neap tide, has been modelled and these dynamic water levels applied offshore to the pebble bar to
simulate the tidal flux into the estuary. The second simulation explores the impact of the highest recorded tidal levels and the
extent of flooding resulting from these levels, based on the data generated by BODC Weymouth.
In figure 18, the extent of the mean low neap tide is presented, which extends up the estuary towards White Bridge and the
South Farm Road. At peak height, water floods the lower salt marsh and mud flats in the estuary, but not the upper salt
marsh (figure 19). The model therefore agrees with the flood frequency at which the salt marsh habitats naturally occur.
In figure 17 (below) the effect of the pebble bar’s restriction on even the maximum tide is apparent, with water levels offshore
some 1m higher than the levels propagated upstream to White Bridge. Rear-Admiral Bullock’s comments of 1853 seem
correct, namely that the bar has restricted tidal inflow and scour. This combined with a reduced estuary area, as a result of
the embankment, possibly accounts for the accumulation of sediment in the estuary since embankment in 1812.
Figure 17: Plot of tidal water levels for a maximum tide at three locations: offshore (red), within the estuary (blue), and locally
to White Bridge (green).
In the second analysis, maximum recorded tidal levels for both peak tide and maximum low tides is simulated and the extent
of flooding shown in figure 20 and 21. In figure 20, the peak tide reaches a level higher than the current embankment,
especially at a point on the Big Bank, just downstream of the refuse site. Once tidal water inundates the Big Marsh it rapidly
fills the embanked compartment, as is shown in figure 20. Once the tide subsides, and assuming that the embankments are
still remaining, then a large volume of salt water is retained within the embanked compartment and will only dewater through
the culverts locally to the Cricket Club figure 21. As discussed in the fluvial flood section of the report, some 1.4 million cubic
metres of water will be retained on the site and will take between 5 and 21 days to dewater, depending on the performance
of the culverted sea discharges.
!"#$%
"%
"#$%
&%
&#$%
'%
'#$%
(%
(#$%
)%
)#$%
'% $'% &"'% &$'% '"'% '$'%
*+,-.,/%012,/%3,415,%
6+789%:-.;,9<%
6+=,//<%.+%>+;.?%@,95%A912B8%
Haycock
25

Figure 18: Extendt of tidal inundation in mean low neap tide
Figure 19: Extent of tidal inundation in mean high neap tide
Figure 20: Extent of maximum tidal inundation based on highest recorded level at BODC Weymouth sea level gauge
Figure 21: Extent of tidal inundation following maximum tide and after the estuary has dewatered to maximum low tide,
based on BODC data.
Haycock
26

As with the fluvial simulation, we have exposed the model to maximum tides with the strategic removal of embankments that
impair the fluvial flooding of the site. In figure 22, the extent of saline flooding into the embanked compartment is extensive
and extends beyond Little Embankment.
Figure 22: Extent of tidal inundation following a maximum tidal flood (BODC data) assuming that embankments have been
strategically removed (Option X) as per the fluvial simulations discussed earlier in the report.
Figure 23: Extent of tidal flood water with the retreat of the tide and extent of trapped water on the Otter floodplain.
Once the maximum tide retreats, even with the key embankments removed, the embanked compartment still retains
extensive areas of saline water (figure 23), since the ability of the low lying land to drain freely to the estuary is impaired by
the height of the current estuary.
Figure 24 shows a cross section through Big Marsh, locally to the Cricket club. The impact of the accumulated sediments in
the estuary will result in the impoundment of 1.0m of salt water on the embanked compartment, resulting in a shallow lagoon
or mudflats. It is interesting to note that the sediments in the estuary have accumulated since 1812, therefore equate to
4mm per year of net vertical accumulation.
If over time the tidal ingress resulted in creeks forming through the current estuary marsh, then the majority of the embanked
compartment, if not lagoon, would essentially be mudflats, and most of Big and Little Marsh would revert to saline habitat.
This would result in a landscape familiar to Leland who visited the area in 1539-1540 and reported Otterton being 1 mile
from the sea, with 100 acres of grazing marshland. Figure 25 shows the extent of upper mudflats based on the elevation this
habitat forms in the current estuary.
It should be noted, although not illustrated, that the velocity of flow through the peddle bar with the larger volume of tidal
inflow and outflow, does result in significantly higher velocities and one would therefore expect erosion of the bar and of the
current estuary. This would follow the pattern experienced at recent tidal retreat projects, where the existing estuary is
eroded and sediment re-deposited within the previously embanked area. The erosion of the current estuary would result in
more extensive creek systems and a higher ratio of mudflat to saltmarsh.
Haycock
27
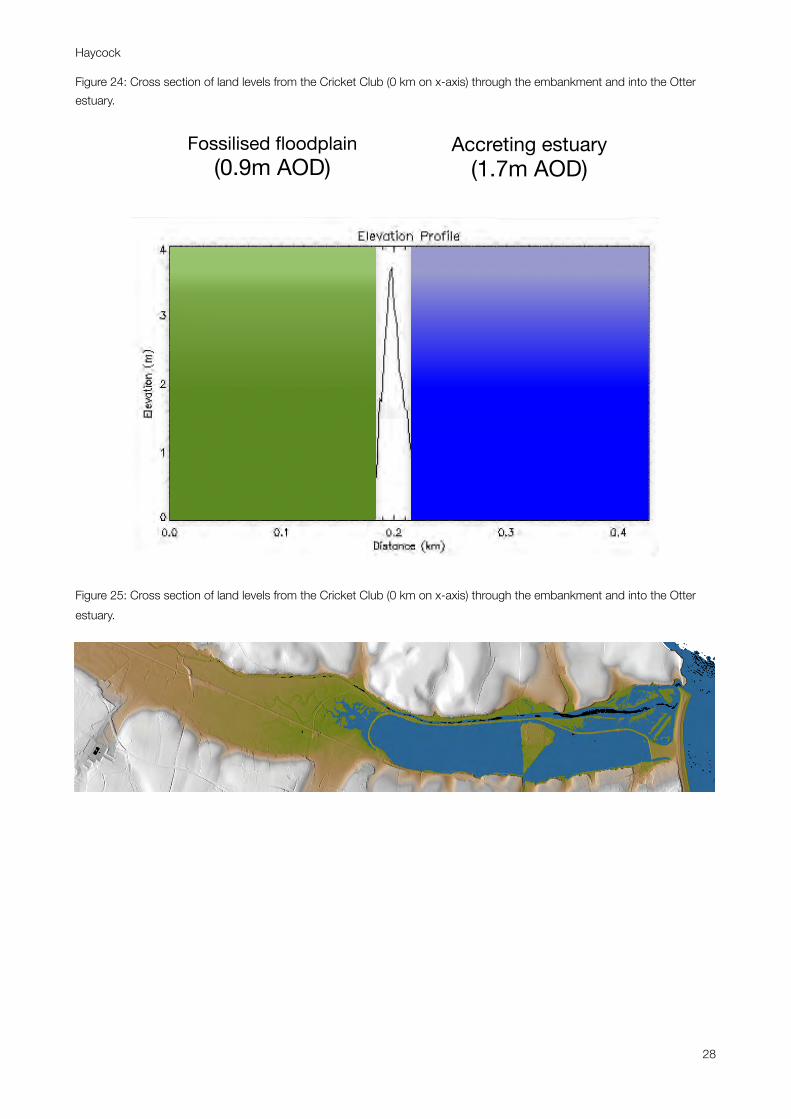
Figure 24: Cross section of land levels from the Cricket Club (0 km on x-axis) through the embankment and into the Otter
estuary.
Figure 25: Cross section of land levels from the Cricket Club (0 km on x-axis) through the embankment and into the Otter
estuary.
Fossilised floodplain (0.9m AOD)
Accreting estuary (1.7m AOD)
Haycock
28

Flood Dynamics - Drainage
In this report we have not modelled the flood dynamics from the failure of the sea outfalls, but note that Howick and Partners
report their estimations on the capacity of the culverted sea outfalls.
The current invert of the drains is -1.6m AOD and they are consistently submerged. This, combined with the frequent
blockage of the sea outfall due to sand and pebbles, results in frequent requests, especially in the summer months, for
clearance of the outfall.
Howick have prepared a scheme to extend the sea outfall to beyond the current shingle beech in order to reduce the
sediment blockage of the pipe. But the elevation relative to current tidal range still results in significant hydrostatic blockage
of the pipe’s flow.
In relation to the Environment Agency culverted discharge to the estuary behind the Cricket Club, the elevation of this
structure is below the estuary land level and without frequent dredging of the estuary to the sea, this culvert does not afford
any normal drainage to the embanked compartments. Once the compartments are flooded, this pipe affords additional
discharge to the sea, but only dewatering once floods have reach 300-400mm depth in the compartment.
The current poor performance of these structures, due to sediment accumulation in the estuary and within the pebble beech
is working against normal drainage.
Predicted Sea Level and Flood Regime
The predicted sea level rise for the South West’s, southern coastline, has recently been reviewed by the Environment
Agency, in order to plan the investment in coastal defenses. The “Devon Tidal Flood Zone, ABD and Flood Risk Area
Improvements, April 2008” report lays out sea level rise estimates and are summarised in table 4 (below).
Table 4: Recommended Contingency Allowances for Net Sea Level Rise (Devon Tidal Flood Zone, ABD and Flood Risk Area
Improvements, April 2008, table 13.2).
Period Assumptions Net sea level rise (mm)
2002-2025 23 years at 3.5 mm / year 80.5
2025-2055 30 years at 8.0 mm / year 240.0
net sea level rise to 2055 321.0
2055-2085 30 years at 11.5 mm / year 345
2085-2115 30 years at 14.5 mm / year 435
net sea level rise to 2115 1101.0
A potential rise in mean sea levels of 1.1m by 2115 (just over 100 years) will result in substantial changes in the tidal flood
risk to the Lower Otter. This would equate to the maximum recorded tidal levels occurring annually, as opposed to every 75
years. The volume of salt water entering the estuary would increase, associated scour of the pebble bar would increase, and
overtopping of the current embankment frequent. In addition to the above figures, it is not clear if they also account for
changes in surge tide elevations, which is typically expected to result in an increase in the amplitude of the tide of about
10%.
In relation to changes in the fluvial flood regime, current estimates suggest that we can expect a 20-30% increase in peak
flow. This would result in the mean annual flood (Q2) increasing from 70.45 cumecs to 91.6 cumecs. Additional changes in
land use may accelerate runoff and have in some part of England led to estimates that if land use changes over the last 40
years continue for the next 100 years that we could expect a 90% increase in mean annual flows when combined with
climatic change and the associated more intense storms. That would equate to the mean annual flow going from 70.45
cumecs to 133.9 cumecs, close to the figures we currently quote as the 1:100 year flood on the River Otter. Given that it has
Haycock
29

been estimated that the current embanked compartment floods with flows greater than 40 cumecs, any change in the
frequency of large flood runoff volumes, will result in more frequent and persistent flooding.
Conclusions Arising from the Simulation Flood Models.
Based on the review of the drainage, fluvial flood and tidal flood dynamics of the Lower Otter Valley, there seem to be
systemic issues arising from the embankment of the Lower Otter in 1812. Since this period, the geomorphology of the
estuary has been fundamentally changed with sediment accumulating in this area, resulting in a fossilization of land levels
behind the embankments. The normal drainage of the embanked compartment possibly worked very well when installed,
but rising sea levels, sedimentation of the beach and changes in the circulation of the sediment on the bar have degraded
the drainage of the current marsh. Furthermore, since 1812, the Otter flood waters have been pressurised down the
embanked channel. This combined with the construction of the railway line, has forced flows into discrete sections of the
floodplain, resulting in major erosion and sediment features forming along the Otter. The designation of the Otter and Estuary
for conservation reasons and the resulting lack of traditional channel maintenance, that is required on an embanked channel,
is resulting in even mean annual floods not being able to pass effectively down the channel.
The contemporary flooding of the embanked compartments, due to hydraulic degradation of the Otter channel, changes to
catchment runoff regime and siltation of the estuary, appear to be more frequent, and BSCC data suggest a total of 21 flood
incidents in 50 years.
The future flood regime is likely to be more frequent, both from continued poor drainage of the site, higher runoff to the River
Otter and with higher mean sea levels. The current agricultural regime within the embanked land, which has shifted from
arable to grassland and to grazing marsh appears to be becoming wetter, and will continue to drain poorly and flood more
frequently. Key assets at South Farm Road, and access to this farm and associated businesses is likely to become worse,
with prolonged periods of no access, apart from tractor access over farmland to the north. The frequency of flooding to the
Cricket Ground is currently frequent and likely to increase. The lack of dewatering capacity adds to the duration of standing
floodwater, but changes to sea level are likely to make this situation worse.
Haycock
30

Long Term Options for Drainage and Flood ManagementIn developing the options below, we have sought to either review individual options for specific locations and issues or
combine these with larger visions for the embanked compartments. The challenge is to provide technically viable options
that work with the frequency of flooding from the terrestrial catchments and the potential tidal inundation. Key to the Clinton
Devon Estates is the future of key assets, namely access to South Farm, Otterton Mill and the future of farming operations in
Big and Little Marsh and the impact on the wider farming landscape if radical changes occur in the embanked areas. The
future of the Cricket Ground, on land leased from Clinton Devon Estates, is a key issue. These issues are merged with a
range of conservation designations, and conservation agreements, World Heritage Site designations and geology
designations (GNRs and RIGGs).
In reviewing options, we have sought to comment on the technical viability, but not look extensively at the conservation
implications. We have sought to look at the sustainability of the hydrology and hydraulics and whether the option will weather
the predicted changes in sea levels and climate.
The options are the basis for discussion with the Clinton Devon Estates and the wider community, and at this stage no
option is preferred or pre-selected. The options will be discussed by the Clinton Devon Estates with a variety of stakeholders
to further define the issues and implications of the options. From this process the wider implications, to valley economics
and conservation interests will be explored, with the help of statutory agencies, in order to determine the viability of pursuing
elements of these options.
Haycock
31

Option A - Cricket Ground Bund
The location of the cricket ground, behind Big Bank, and lying at 0.8-1.0m AOD makes it one of the lowest lying cricket
grounds in England. Frequent flooding is making this unique position difficult to sustain. The option for this site, if it is to
remain in its historic location, is to bund the ground independently of the main compartment and ensure it is not dependent
on the sea outfall at the Lime Kiln, south of the grounds. The drainage of the site would be enhanced, with an inner ring
drain, which would be pumped to the Environment Agency sea outfall (marked in light blue in option figure). The current sea
outfall would be modified to house a pump and also enable any fluvial flood water and or tidal water that entered the smaller
compartment to be gravity drained. With the loss of the EA sea outfall to assist with drainage of Big Marsh, additional outfalls
would be required to the north of the ground, to enable the gravity dewatering of Big Marsh into the estuary.
The bund could be created from floodplain material, as was done in 1812, and a borrow pit created north of the grounds.
The existing Big Marsh would drain through the Lime Kiln culvert, and the borrow pit would act as a balancing pond to assist
with drainage of Big Marsh. The pond would dewater at low tides, assuming that the sea outfall is not blocked.
In time, current buildings for the ground would be placed on a widened bund. The banking of the bund could be landscaped
to favour spectators. The width of the bund would be wide enough to ensure vehicles could park on the feature or traffic to
the north west corner and park within the compartment or to the field to the north, when county matches occur.
If it was required, the Lime Kiln culvert could only drain Granary Lane, Budleigh Salterton, and upgrade the flood protection
of residents locally to Cricket Ground. Big Marsh could be drained into the estuary, but only with the construction and
maintenance of a new creek system into the current low channel. The option would negate the need to upgrade the Lime
Kiln sea outfall, although instead of extending it, it maybe preferable to convert the outfall into a soak-away by installing large
boulders at the outfall to enable water to dissipate into the pebble bar.
This option would reduce drainage flood risk to the ground, isolate it from the fluvial flooding of Big Marsh, as long at the
bund is higher than the current embankment, and remove the site from tidal flood risk, albeit for a period of less than 50
Riv
er
Ott
er
Cricket Ground
Option A - Bund Cricket Ground
Bund at 3.5-4.0m, borrow pit
created, which also act as
buffer storage for drainage in
times of high tide.
Inner ditch to drain
compartment.
Pumped discharge to
estuary by adoption
EA pipe and flap
value.
Club house and buildings
based on new bund, base
level at 3.1m and critical
infrastructure at +4.0m
due to saline flood risk.
If Cricket ground bunded,
allow new ditch to east of
floodplain and flood outflow
into Estuary.
If floodplain drains
into estuary
through new flap
pipes then could
connect bund to
high ground and
abandon the sea
outfall for floodplain
and use to locally
drain Granary Road.
Haycock
32

years based on the Environment Agency data. This option would require invasive works within the estuary to ensure the free
drainage of the pumped drainage and also to ensure the free drainage of modified Big Marsh drains, which could be
directed to the estuary if required. This could have conservation implications for the current SAC / SSSI.
Haycock
33

Option B - Relocation of Cricket Ground
In reviewing the operation of the current cricket ground, an option is to change the location of the club, but keep it in the
Otter Valley, which is a symbol of the club. In the flood model work, the former refuse site, which closed in 1950, did not
flood under a mean annual flood, and in terms of elevation is estimated with be at >1:200 year flood level in relation to tidal
limits. The current footprint of the ground fits into the current poplar plantation on the site with room for buildings and car
parks to the north and west of the current location. The site would need to be raised to 3.5-3.8m elevation, if not higher, with
buildings being placed at 4.4-4.8m invert level. The ground would have
an elevated view of the estuary and the southern portion of Big Marsh.
The material to fill the site is related in part to option C and D.
The removal of the ground from the floodplain would enable options for
Big Marsh to be more strategic and less impaired by the need to
accommodate the drainage and protection of the ground. The
conservation value of the refuse site is unknown, but has been planted
with poplar and pine since its abandonment in the 1950’s.
This option is dependent on flood proofing South Farm Road and
ensuring suitable means of evacuation of the ground in the event of a
major fluvial or tidal flood.
Figure 26: Image of the poplar plantation on the eastern portion of the
refuse site, as viewed in October 2009.
SOUTH FARM ROAD
Reproduced from the O.S. map with \nthe permission of the Controller
H.M.S.O\nCrown Copyright Reserved Licence No\nES763314\n\nScale 1:5000
Riv
er
Ott
er
South Farm CottageSOUTH FARM ROAD
Cricket Ground
Option B - Move Cricket Ground
Move cricket ground to
former land fill area, raise
ground level from 2.8-3.1
to 3.5-3.8m. Spoil created
by dredging the Otter
floodplain locally to
Bridge.
Maintain tree perimeter.
Pavillion
Store
Car park
overflow car park,
public usage
Haycock
34

Option C - South Farm Road
Independently of option A and B, the issue of ensuring safe passage to South Farm and associated business and buildings,
is of key concern to the Estate. An option, is to move the current road south and take advantage of the higher land levels
within the refuse grounds.
In the event of fluvial flooding, the conveyance of flood water from the northern section of Big Marsh to the southern section
of Big Marsh could be achieved by installing culverts under the road, to the western end of South Farm Road. The material
to raise the road could be won from moving the embankment, east of the current refuse site, and aligning westwards. This
would increase the hydraulic capacity downstream of the bridge and this section of the estuary.
Supporting this option would be desire to install additional flood culverts west of White Bridge to assist with the dewatering
of the northern section of Big Marsh. The aim being to increase the overall dewatering capacity of the embanked
compartments, and introduce fluvial flow into the upper estuary to ensure better fluvial flushing of this portion of the estuary.
To the east of White Bridge, it is recommended that the road is elevated to 3.1m on a causeway to allow floodwater to pass
through this section of the relic floodplain. This option is independent to options mentioned above.
SOUTH FARM ROAD
Reproduced from the O.S. map with \nthe permission of the Controller
H.M.S.O\nCrown Copyright Reserved Licence No\nES763314\n\nScale 1:5000
Riv
er
Ott
er
South Farm CottageSOUTH FARM ROAD
Option C - valley road
Move road south onto land
fill area, make elevation
3.1m, effectively raise
level from 1.3m. Red
boxes note bridging issues
to maintain flow on Otter.Set back left bund to landfill
boundary to enable increase
conveyancy at the bridge and
floodplain flood return flow,
critical if right bank cannot
be dredged
raise road level and install
flood flow culverts
culverts for drainage of
middle compartment and
flood dewatering
culverts
culverts to drain to lower
compartment and also flap
valves to prevent saline
flooding into middle
compartment
Haycock
35

Figure 27: Annotated sketch of road route through refuse site and key drainage culverts for drainage of the northern section
of big marsh. Option C
Figure 28: Cross section through refuse area using LiDAR data at 1m resolution. Option C
!"
!#$%"
!#%"
!#&%"
'"
'#$%"
'#%"
'#&%"
$"
$#$%"
$#%"
$#&%"
("
(#$%"
(#%"
(#&%"
)"
)#$%"
)#%"
)#&%"
%"
%#$%"
%#%"
%#&%"
*"
*#$%"
*#%"
(!&!!!" (!&'!!" (!&$!!" (!&(!!" (!&)!!" (!&%!!" (!&*!!" (!&&!!"
+,-./01"2.-34".5"6.78+"
,-./01".5"9:;"
Haycock
36

Option D - River Otter floodplain at White Bridge.
The build up of floodplain land levels locally to South Farm Road bridge is restricting the flow for the upstream section of the
channelised River Otter. This section of floodplain should be functional channel to enable the enhanced flow through the
Otter upstream. The suggestion is to lower land levels in this section (green boundary), possibly linked to option B and C.
The excess material could be moved to the refuse site to raise land levels for the cricket ground (option B) or road levels
(option C). Any surplus material could be used to furnish the thinned arable soils on South Farm.
The benefit of this option is linked to enhancements of the overall channel conveyance of the Otter upstream of this location
and increasing the volume of flood water through this section, reducing the frequency of flood water entering the floodplain
upstream and into Little Marsh.
The conservation implications of this option would have to be addressed. The aim is not to clear the main channel or
undertake works in the the main channel but to regenerate the floodplain flood capacity of this critical section of the Otter as
its flow transitions into the Estuary.
SOUTH FARM ROAD
Dis
mantled R
ailw
ay
Reproduced from the O.S. map with \nthe permission of the Controller
H.M.S.O\nCrown Copyright Reserved Licence No\nES763314\n\nScale 1:5000
South Farm CottageSOUTH FARM ROAD
Option D - Otter floodplain
Lower floodplain to restore
conveyance locally to
bridge and floodplain flood
return flow. No dredging of
river and its bed -
salmonoid and WFD
restrictions. Spoil used to
raise tip site for recreation
use / car park and road
causeway. High quality soil
and organic material taken
to thin soil locations and
incorporated into field
soils.
Haycock
37

Option E - Southern Big Marsh (linked to option B, C and D).
If the cricket ground is moved to the former refuse site, South Farm Road is elevated and the drainage of the houses in
Budleigh Salterton are independently drained through the Lime Kiln culvert, then options for the southern portion of Big
Marsh are opened.
Associated with this assumption is that without an upgrade to the Lime Kiln culvert and preventing this from blocking with
pebbles, then the continued drainage of this site is not possible and it will be increasingly flooded with changes to sea level.
Allowing the site to become wetter with freshwater, will require the continued functioning of the Lime Kiln culvert, and in the
short term this maybe possible, but the site will increasingly fail to meet conservation objectives, even for reedbed.
Allowing tidal ingress into the site is an option, if it is effectively sealed from the northern section of Big Marsh, which the
upgrade to South Farm Road could effectively achieve. But the resulting site will be lagoon or mudflats.
An additional option is the capture and storage of freshwater within the embanked area and the formation of a freshwater
lake. The long term geomorphological aim of this option is to allow the site to function as a freshwater lake in the short term,
but sedimentation of silt and organic material will accumulate to a level contiguous with the estuarine land levels and in a
number of decades enable the site to revert to lower and upper salt marsh.
In the short term, the lake could act as a freshwater reservoir for the Estate and farms, supporting the agricultural economy
by providing a reservoir of 484000 m-cu of water for water dependent crops.
Equally the lake could support sailing with a mean water depth of 2.2m (max. 3.4m). The sailing could combine facilities with
the relocated Cricket Ground.
SOUTH FARM ROAD
Riv
er
Ott
er
South Farm CottageSOUTH FARM ROAD
Cricket Ground
Option E - Freshwater Reservoir
(linked to B and C)
If the Valley road is designed
to separate the floodplain
compartments and limit salt
water ingress to the
middle/upper compartments,
then options for lower
floodplain are open. Volume
could be used to store
winter flood water and use
for irrigation / agricultural /
leisure purposes if water
stored at 2.5m. Alternatively
revert to lower saltmarsh
and mud flats. Dominant
landscape is bank breached
would be saline lagoon.
EA outflow drain modified to
allow normal drainage of
excess water in the reservoir.
Bund locally to Bridge
modified to allow flood
recharge of the reservoir.
Abstraction pipes to Clinton
Devon farms for irrigation
demands and or PWS.
Haycock
38

Once the lake has silted up to the desired level then land could be reverted to salt marsh, without exposing the current SAC
to excessive erosion which would occur if the current bunds were breached and large tidal volumes sought to fill the
resultant void.
This pattern could be repeated for the northern section of Big Marsh and Little Marsh over many decades, with the
freshwater reservoir migrating up valley and former reservoirs reverting to marshland.
Haycock
39

Option F - Northern Big Marsh
Option F is linked to option E, namely to provide independent drainage of the northern section of Big Marsh if the southern
section is to be hydraulically isolated. In option F, the inner drainage of the compartment is to be redirected to outfall into the
estuary locally to South Farm Road bridge. This option is also linked to option C, namely raising the lane to avoid disruption
as a result of flooding.
The drainage to the south eastern corner would also be associated with an enhance culvert to assist with the dewatering of
the site in when inundated with the River Otter flood water. The purple shaded area is linked to option G. The observations of
the behaviour of the river in this section are that the accumulated scrub vegetation on the relic floodplain to the east of the
river is hydraulically restricting flow and pushing the thalweg of the river to the embankment. This fast flowing water is
undercutting sections of the embankment, which has visibly thinned in key sections. The management of this vegetation
needs to be reviewed, in combination with option D. If option D and option K (below) are not viable, then thinning and
management of the relic floodplain in this section will need to be considered in order to simply maintain the capacity to
transfer the mean annual flow (Q2, 70.45 cumecs).
Aqueduct
Pulhayes Farm
CO
LLIV
ER L
AN
E ( T
rack)
ParkOtterton
SOUTH FARM ROAD
Aqueduct
Pulhayes Farm
Dis
mantled R
ailw
ay
Reproduced from the O.S. map with \nthe permission of the Controller
H.M.S.O\nCrown Copyright Reserved Licence No\nES763314\n\nScale 1:5000
South Farm CottageSOUTH FARM ROAD
Option F - Middle Compartment
Aim to limit saline flooding
(option C). Improve flood
water drainage, currently 7
days to dewater. If option
G cannot be undertaken
then coppice floodplain
channel woodland to
increase conveyance in
this section.
Haycock
40

The conservation implications of managing this section of the river are very acute, with access to the river challenging and
the overall impact on the current fisheries ecology very sensitive as this section represents the normal limit of freshwater
within the River Otter. High tides will influence the flow in this section, but normally this limit ends locally to White Bridge.
Haycock
41

Option K - River Otter Big Bank Reach
Aqueduct
Pulhayes Farm
CO
LLIV
ER L
AN
E ( T
rack)
ParkOtterton COLLIVER LANE (Track)
Otterton Park
Aqueduct
Pulhayes Farm
Dis
mantled R
ailw
ay
Option K - Part floodplain restoration
If existing channel cannot
be maintained and
coppiced, then hydraulics
compromised and frequent
flooplain inundation will
occur. If channel hydraulics
to be dominated by
woodland, then estimated
85m corridor required to
route flood water through
this section.
If option F, namely the restoration of normal flood conveyance in this section of the river, cannot be pursued, and the
conservation aspiration is to maintain a woodland corridor, then an option is to set-back the current embankment to create
an 85m wide corridor. The 85m wide corridor has been calculated so that even when wooded, with high hydraulic
resistance, that a 1:10 year flood will pass through the corridor. This will reduce the flood frequency into LIttle Marsh and the
northern section of Big Marsh. The option would allow for some limited geomorphological adjustment of the River Otter in
this section, abeit within a narrower floodplain corridor, but wider that the current embanked regime.
Haycock
42

Option G - Little Bank and Swale
Clamour Bridge
Aqueduct
Clamour Bridge
Pulhayes Farm
Syon House
CO
LLIV
ER L
AN
E ( T
rack)
ParkOtterton COLLIVER LANE (Track)
Otterton Park
Aqueduct
Clamour Bridge
Budleigh Brook
Pulhayes Farm
Dis
mantled R
ailw
ay
Option G - Upper Compartment
Aim to direct flood flow
back to River Otter and
avoid frequent
overtopping of bunds.
Relic channel connected to
river via ditch. Key section
of Otter river bank lowered
to enable flood flow to
transition into leated
section.
10m base ditch to
collect floodwater and
transition to River Otter.
10m cutting through
railway embankment to
collect floodwater and
transition to River Otter.
Spoil laid back on
existing bund and used
to strengthen feature,
not increase height.
Option G is linked to option D, namely the functional restoration of channel hydraulics locally to South Farm Road. In this
option, the aim is to improve the conveyance of small floods back to the River Otter and avoid the excessive accumulation of
flood water ponding locally to Little Bank. The aim is to create a swale upstream of Little Bank, and connect this to the Otter
locally to where Budleigh Brook enters the Otter. The land levels where Little Bank runs parallel to the Otter would be
lowered to enable water to sweep into the Otter (figure 29). In constructing the swale, with a base width of approximately
10m, the excavated material would be laid back onto Little Bank to strengthen the feature, but not raise the crest levels.
This option will allow the free passage of flood water away from Otterton,
and the Mill plus associated highway. The option assumes an increase in
the conveyance of the Otter downstream of these proposed works,
namely option D and or option F and K.
Figure 29: Image of Little Bank where it runs parallel to River Otter. This
land level is proposed to be lowered in option G.
Haycock
43

Option H - Otterton Mill and Otterton Bridge
Mill
Leat
Rive
r Ott
er
Bicton Home Farm
HIG
HER M
AUNDERS H
ILL
Reproduced from the O.S. map with \nthe permission of the Controller H.M.S.O\nCrown Copyright Reserved Licence No\nES763314\n\nScale 1:5000
HIG
HER M
AUNDERS H
ILL
Catson Hill
Reproduced from the O.S. map with \nthe permission of the Controller H.M.S.O\nCrown Copyright Reserved Licence No\nES763314\n\nScale 1:5000
SLEAP HILL
FRO
GM
ORE R
OA
D
Option H - Otterton Mill
Section
Aim to increase
conveyance locally to
bridge and push flood
water onto the floodplain.
Lower ground level to
invert level of brick bridge
culverts. Remove
woodland in this section.
Protect pipework and
prevent any further
infrastructure in this
upstream location that
limits ground level and
flood flow to the bridge.
Lower ground level to
invert level of brick bridge
culverts. Lower ground
and current bund
downstream of bridge.
Regrade footpath. Regrade
land to connect flood flow
to relic channel locally to
rail embankment.
Coppice woodland on left
bank, natural flood break
out strip. Review why
this is a sedimentation
point and coarse debris
drop location.
Coppice woodland
on left bank, natural
flood break out
strip.
Option H represents an independent option, and is not critically reliant on any of the downstream options, although the
implementation of option G would be preferable.
Using the flood simulation data, it is apparent that floodwater is seeking to break westwards and away from the leat mill
channels both upstream and downstream of the Mill. The first element of this option is therefore to work with this reality and
ensure that bank levels are lowered in key sections, and trees thinned and natural breaks in hedges widened. This is
especially critical downstream of the Mill, where new fence and hedges on the right bank are interfering with overtopping
flood routes (purple marked areas). Upstream of the Mill, similar treatment of the bank is required to enable flood water to
move west and then be directed to the culverts under the main road.
The culverts under the main road need extensive groundwork upstream and downstream in order to lower ground levels to
optimise the conveyance of these structures and reduce the build up of water. Critically the land levels downstream of the
culvert need to be lowered by over 1.2m to allow return flow to the Otter and also to feed water more effectively into the
Otter floodplain (figure 30).
It is not proposed at this stage to reduce the land levels of the railway line,
either upstream of Otterton or downstream, since the flood dynamics
upstream of Otterton is unclear and how much water is passing down the
western side of the floodplain. We have been informed that approximately
30% of major flood event waters will pass via this route.
Figure 30: Image of the Otterton road culvert to the west of the current
bridge and sediment accumlation in the culvert and land levels 1.2m higher
on downstream face.
Haycock
44

Option J - Otterton Mill Leat, Weir and Sluices.
Option J builds on option H and represents detailed adjustments to the options of the leats to reduce flood surges into the
housing locally to the Milll and the the Mill complex itself. The key issue to reduce River Otter flood water building up, is the
implementation of option G and H, and if undertaken then additional management of the leat could be undertaken to further
protect this section of Otterton.
Assuming that the land levels locally to the culverts west of the Bridge are regraded, then upstream of the leat weir and its
fish pass, it is suggested that land levels are lowered to enable flood water to pass westwards and start discharging onto the
floodplain before the leat sluice gates are submerged.
The leat sluice gates are difficult to access in a flood period, and it is suggested that this simple penstock, which consists of
a single large plate, is replaced with an automatic mechanism that can be closed by the mill when flood water levels build
up. This option is aimed at reducing debris and sediment ingress into the leat and mill structure.
A second modification would be to upgrade the penstocks that allow the leat channel to be dewatered and maintained,
which is located 100m upstream of the the mill. This complicated structure has an overshoot aqueduct taking runoff from the
Village which discharges into the Otter, plus a penstock to dewater the leat and throttle flow into the Mill. The proposal is to
Mill
Leat
Rive
r Ott
er
Plantation
Anchoring
Plantation
Anchoring
Bicton Home Farm
HIG
HER M
AUNDERS H
ILL
HIG
HER M
AUNDERS H
ILL
Catson Hill
Option J - Otterton Mill Leat
Comments on the
Otterton Mill Leat and
Grounds
Consider refurbishing
of leat offtake
pen-stock to ensure
effective seal in low
flow conditions.
Consider new pen-stock to
throttle flood flow to the
mill. Upstream pen-stock too
remote in a flood event to
limit flood ingress
Annual clearance of leat
and vegetation currently
undertaken and should
continue.
Refurbish car park
surface to regrade
slope towards river to
avoid floodwater
trapping users.
Consider automatic sluice
mechanism to shut down
inflow in flood event.
Lower bank upstream of the
weir to below top of leat
offtake sluice to ensure
flood water passes to
floodplain before
overtopping leat sluice.
Haycock
45

upgrade this to enable it to also be remotely controlled to dewater to the Otter and assist in redirecting flood water away
from the Mill and associated buildings.
It should be noted that currently the normal base flow is predominantly directed into the leat since the main weir was dry
when viewed. The remaining flow passes down the fish pass, but also a
major portion of flow passes under the weir and is visibly boiling up
below the foundations of the structure. We would point out that is not in
the best interests of this structure, composed of hydraulic lime
concrete, to be dry and allowed to dry for prolonged periods. The weir
leakage needs to be addressed, and also the flow through the leat and
fish pass better adjusted to ensure that the weir is wet (figure 31).
Figure 31: Image of Otterton Mill main weir, located upstream of the
Mill. As viewed in October 2009.
Haycock
46

Summary of Options - Table 5
Options title Description Aim of option
Option A Isolation bund for Cricket
Ground with independent
drainage.
This option seeks to remove the cricket ground from the effective
floodplain and free up options for Big Marsh to operate its drainage
independently of the Cricket Ground. Some improvement in the
operation of the sea outfall at Lime Kiln maybe possible by providing a
balancing pond.
Option B Moving the Cricket Ground
to high ground, but within
the Otter Valley.
This option seeks to remove the cricket ground from the effective
floodplain and free up options for Big Marsh to operate its drainage
independently of the Cricket Ground. Relocation does not compromise
other options and frees up Big Marsh.
Option C Elevation of South Farm
Road and upgrade of
culverts.
This options seeks to ensure access to South Farm and associated
businesses by moving the current road south onto high land. Option
would work with option B and also is linked to other options below.
Changes to the road level do not compromise future options of Big
Marsh.
Option D Restoration of hydraulic
function of River Otter
locally to White Bridge.
The embanked River Otter currently restricts flood flow, even for minor
floods. This option aims to remove a strategic throttle, and minimise
works on other sections of the river. This option supports option B and
C, which require additional material to deliver raised land levels. Option
supports reduced flood risk to Big and Little Marsh.
Option E Long term retreat of the
southern Big Marsh.
The aim is to create a large freshwater reservoir, allow this to function as
a water resource for the farming and recreation. Over time the feature will
silt, and when silt levels match estuarine land levels, allow site to
retreated to marsh without excessive erosion risk to the existing SAC.
Option F Northern Big Marsh -
Drainage Improvements
If option E developed, and or option C, then regrade drainage of the
northern section of Big Marsh eastwards and increase flood dewatering
capacity. Review hydraulics of River Otter channel to reduce overtopping
flood risk in this section, and erosion of Big Bank.
Option K Migrate Big Bank
westwards.
If vegetation management not possible within the currently embanked
corridor, then migrate big bank west to create a 85 m wide river corridor
to allow floods to pass through this section, even if corridor is fully
wooded. High frequency of flooding of Big and Little Marsh linked to high
roughness of this key section of the embanked channel.
Option G Little Bank Swale Aim of this option is to redirect floodplain flow back to the River Otter
embanked section more effectively and reduce overtopping of Little
Bank. Option linked to either option D, F and K.
Option H Local improvements to
River Otter at Otterton.
This option seeks to allow floodwater to pass to the west and into the
floodplain. The aggressive groundworks local to the current culvert are
sought to effectively use this asset. Tree removal at key sections, plus
land level lowering is required.
Option J Otter Mill Leat Proposed upgrade of mill leat and associated sluices to enable
floodwater to be throttled and redirected into floodplain. Linked to option
H and G.
Haycock
47
Overview and recommendationsIn reviewing the current hydrology, hydraulics and landscape operations within the Lower Otter, it is apparent that the impact
of poor drainage and flooding is becoming worse and more damaging to the economics of the Estate and users of the
landscape. The poor performance of the sea outfalls, the reduced hydraulic capacity of the River Otter, and the siltation of
the estuary since 1812 are all conspiring to increase the flood frequency of a number of assets, most visibly at South Farm
Road and the Cricket Club.
The future performance of drainage will become increasingly challenging, with increased fluvial runoff and higher tides, plus
the aggressive sedimentation of the sea outfall, both at the Lime Kiln and also within the estuary.
The Estate could simply allow this situation to become progressively worse, farming of the floodplain to become less viable,
conservation management more demanding and recreational access more difficult. At some point, either due to fluvial
flooding or tidal flooding the current embankments, which are nearly 200 year old, will fail and the resulting impact will be
extensive loss of terrestrial land and access to South Farm and its businesses.
In reviewing the hydrology, hydraulic and geomorphological processes, it is proposed that there may be a series of options
to phase the retreat of agriculture from the marshes in some locations, upgrade the functioning of assets in other locations,
and enhance the life of some of the embanked lands through small modifications of the current land levels and linkages of
river to its floodplain. The options in combination will allow the long term retreat of agriculture from the marshes, but allow
the controlled formation of designated habitats without recklessly endangering the current designed areas.
The options, either in combination or independently have not been subject to detailed flood modelling in the same detail as
the current environment, simply because the options raise numerous challenges in terms of the long term management of
the Lower Otter, its commercial use and as an Area of Outstanding Natural Beauty. The next stage of this process is to
review the options with key stakeholders and develop ideas and options with the Clinton Devon Estates to determine the
way forward, and the financing of any major structural adjustments to the site. The aspiration of the Estate is to create an
exemplary project, that builds on the unique history of ownership and use of this valley, and ensures it has a viable future for
the Estate and the wider community.
Haycock
48
Key Documentation
(documents not listed in order of importance).
1. Historical Guide to The Lower Otter Valley, OVA, 1993
2. River Otter Fluvial Audit, February 2004, Environment Agency and GeoData, Southampton University.
3. Photo archive of Otterton Mill, copyright Mr and Mrs Spiller, Otterton Mill, 2009.
4. NERC / BODC tidal data for Weymouth, copyright BODC and Proudman Laboratories.
5. Geomorphological Assessment of the River Otter, Devon, December 2003, Environment Agency
6. Devon Flood Hydrology Strategy Study Volume 1: Main Report, January 2007, Environment Agency
7. Devon Tidal Flood Zone and Flood Risk Area Improvements: Flood Zone Review, Environment Agency, June 2007
8. BUDLEIGH SALTERTON TRUNK DRAIN SURVEY, Howick and Partners, Clinton Devon Estates, 2001
9. East Devon Catchment Flood Management Plan, August 2008, Environment Agency.
10. East Devon Flood Hydrology Strategy Study, unknown data, Environment Agency (key figures and tables from report).
11. Dotton Flow Gauge Data, 1962-2009, Environment Agency.
12. Aerial Photographs of October 2008 Ottery St Mary Floods and Lower Otter Floods, Environment Agency.
13. Devon Tidal Flood Zone, ABD and Flood Risk Area Improvements : Project Report, April 2008 (Appendix A-H),
Environment Agency
14. Flood Reconnaissance Reports for October and November 2002, October 2008, Environment Agency.
15. Historic Flood Outlines for 10th July 1968, Environment Agency.
16. Historic Flood Outlines for 12th November 2002, Environment Agency.
17. Historic Flood Outlines for 30th October 2008, Environment Agency.
18. Lyme Bay and South Devon Coastline Group, Shoreline Management Plan, June 1998.
19. Shoreline Management Plan SMP2, Durlston Head to Rame Head, Draft Baseline Processes Understanding, October
2008. South Devon and Dorset Coastal Authorities Group (SDADCCAG).
20. Environment Agency Asset and Structure Maps for Lower Otter, Generated December 2009.
21. River Otter Corridor Survey, October 1990, produced by Eclogue for the National Rivers Authority.
22. Water Authority, South West, Annotated Maps of the July 1968 Floods and Images of Damage to the Lower Otter, from
Environment Agency Archive, secured December 2009.
Haycock
49

Appendix A: Long section through the Lime Kiln Culvert (Howick and Partners, 2001).
Ian
How
ick
Ass
ocia
tes
Haycock
50
Copyright © 2022 FDOKUMEN