Futures & Options Segment - NSE
24
Futures & Options Segment 6
-
Upload
khangminh22 -
Category
Documents
-
view
2 -
download
0
Transcript of Futures & Options Segment - NSE
Futures & OptionsSegment 6

88
89
Futures & Options Segment
The derivatives trading on NSE commenced on June 12, 2000 with futures trading on S&P
CNX Nifty Index. Subsequently, the product base has been increased to include trading in
futures and options on S&P CNX Nifty Index, CNX IT Index, Bank Nifty Index and Single
securities (188 stocks as stipulated by SEBI) and futures on interest rate. Futures and options
contracts were introduced on CNX Nifty Junior and CNX 100 indices for trading in F&O
segment on June 1, 2007.The turnover in the derivatives segment has witnessed considerable
growth since inception. In the global market, NSE ranks first (1st) in the world in terms of
number of contracts traded in the Single Stock Futures, second (2nd) in Asia in terms of
number of contracts traded in equity derivatives instrument. Since inception, NSE established
itself as the sole market leader in this segment in the country with more than 98 % market
share.
Trading Mechanism
The derivatives trading system at NSE is called NEAT-F&O trading system. It provides a
fully automated screen-based trading for all kind of derivative products available on NSE on
a nationwide basis. It supports an anonymous order driven market, which operates on a
strict price/time priority. It provides tremendous flexibility to users in terms of kinds of
orders that can be placed on the system. Various time and price related conditions like
Immediate or Cancel, Limit/Market Price, Stop Loss, etc. can be built into an order. Trading
in derivatives is essentially similar to that of trading of securities in the CM segment.
The NEAT-F&O trading system distinctly identifies two groups of users. The trading user more
popularly known as trading member has access to functions such as, order entry, order matching
and order & trade management. The clearing user (clearing member) uses the trader workstation
for the purpose of monitoring the trading member(s) for whom he clears the trades. Additionally,
he can enter and set limits on positions, which a trading member can take.
Contract Specification
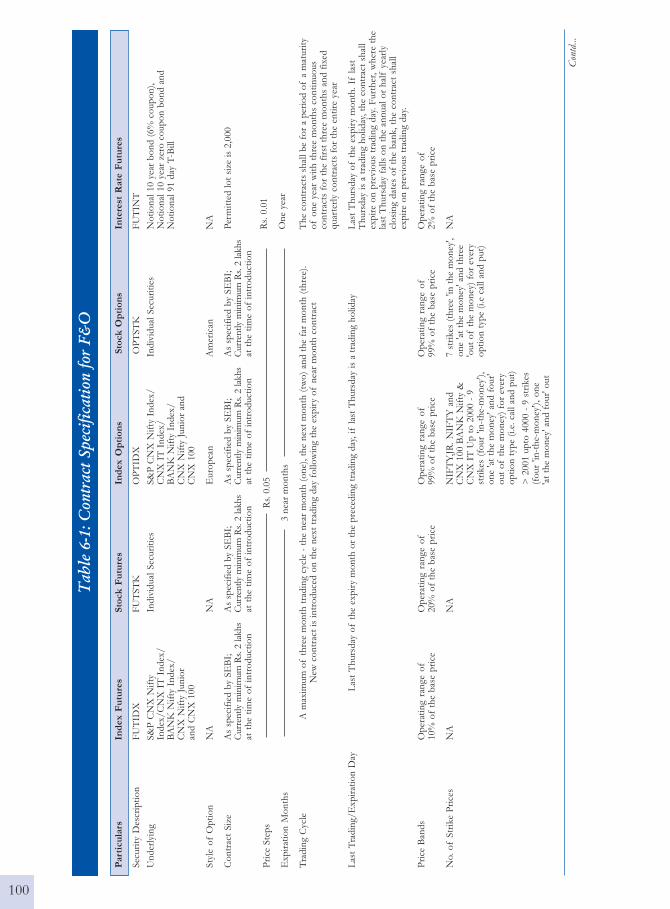
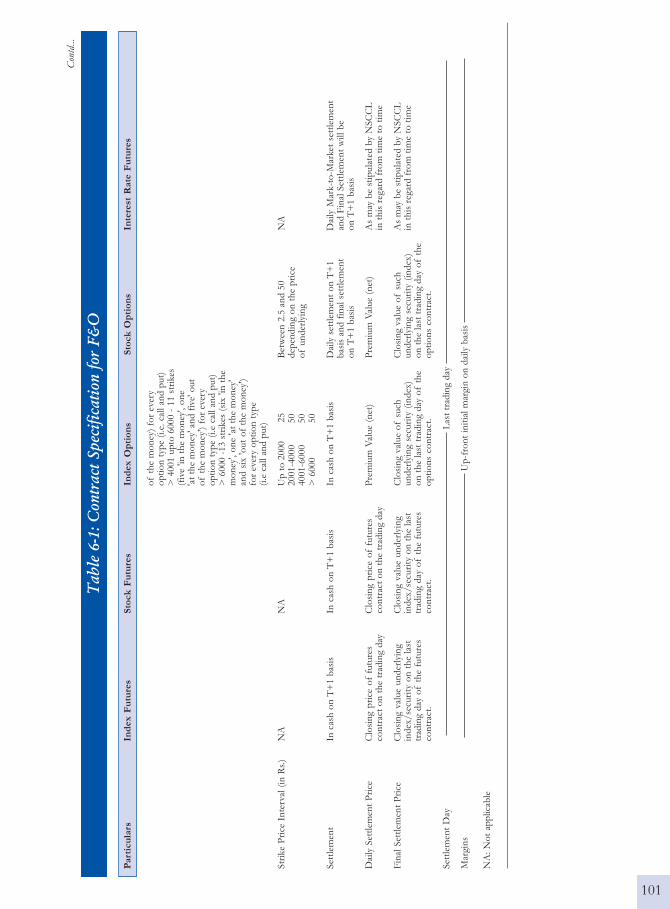
The contract specification for derivatives traded on NSE are summarised in Table 6-1.
The index futures and index options contracts traded on NSE are based on S&P CNX Nifty
Index, CNX IT Index, Bank Nifty, CNX Nifty Junior and CNX 100 while stock futures and
options are based on individual securities. Stock futures and options were available on 188
securities. Interest rate future contracts are available on Notional 91 day T-bill and Notional
10 year bonds (6% coupon bearing and zero coupon bond). While the index options are
European style, stock options are American style.
At any point of time there are only three contract months available for trading, with 1
month, 2 months and 3 months to expiry. These contracts expire on last Thursday of the
expiry month and have a maximum of 3-month expiration cycle. If the last Thursday is a
trading holiday, the contracts expire on previous trading day. A new contract is introduced
on the next trading day following the expiry of the near month contract. All the derivatives
contracts are presently cash settled.
66666
90
Introduction of strike prices for option contracts
NSE introduces option strikes on a daily basis based on the price of the underlying. With
regard to options on stocks the Exchange provides a minimum of seven stick prices for
every option type (i.e call & Put) during the trading month. At any time, there are at least
three strikes in-the-money (ITM), three strikes out-of-the-money (OTM) and one strike
at-the-money (ATM).
The number of strikes provided in options on Nifty, Nifty Junior, CNX 100, CNX IT and
Bank Nifty are related to the range in which previous day's closing value of the respective
indices falls as per the following table:
Nifty Index Level Strike Interval Scheme of strikes to be introduced
(ITM-ATM-OTM)
Upto 2000 25 4-1-4
>2001 upto 4000 50 4-1-4
>4001 upto 6000 50 5-1-5
>6000 50 6-1-6
Selection Criteria for Stocks and Indices
Eligibility Criteria of Stocks
• The stock shall be chosen from amongst the top 500 stocks in terms of average daily
market capitalisation and average daily traded value in the previous six months on a
rolling basis.
• The stock's median quarter-sigma order size over the last six months shall be not less
than Rs.1 lakh. For this purpose, a stock's quarter-sigma order size shall mean the
order size (in value terms) required to cause a change in the stock price equal to one-
quarter of a standard deviation.
• The market wide position limit in the stock shall not be less than Rs. 50 crore. The
market wide position limit (number of shares) shall be valued taking the closing prices
of stocks in the underlying cash market on the date of expiry of contract in the month.
The market wide position limit of open position (in terms of the number of underlying
stock) on futures and option contracts on a particular underlying stock shall be 20% of
the number of shares held by non-promoters in the relevant underlying security i.e.
free-float holding.
Continued Eligibility
• For an existing stock to become ineligible, the criteria for market wide position limit
shall be relaxed upto 10% of the criteria applicable for the stock to become eligible for
derivatives trading. To be dropped out of Derivatives segment, the stock will have to
fail the relaxed criteria for 3 consecutive months.
• If an existing security fails to meet the eligibility criteria for three months consecutively,
then no fresh month contract shall be issued on that security.
• Further, the members may also refer to circular no. NSCC/F&O/C&S/365 dated
91
August 26, 2004, issued by NSCCL regarding Market Wide Position Limit, wherein it is
clarified that a stock which has remained subject to a ban on new position for a significant
part of the month consistently for three months, shall be phased out from trading in
the F&O segment.
However, the existing unexpired contracts may be permitted to trade till expiry and new
strikes may also be introduced in the existing contract months.
Re-introduction of dropped stocks
A stock which is dropped from derivatives trading may become eligible once again. In such
instances, the stock is required to fulfill the eligibility criteria for three consecutive months
to be re-introduced for derivatives trading.
Eligibility Criteria of Indices
• The Exchange may consider introducing derivative contracts on an index if the stocks
contributing to 80% weightage of the index are individually eligible for derivative
trading. However, no single ineligible stocks in the index shall have a weightage of
more than 5% in the index.
• The above criteria is applied every month, if the index fails to meet the eligibility
criteria for three months consecutively, then no fresh month contract shall be issued
on that index, However, the existing unexpired contacts shall be permitted to trade
till expiry and new strikes may also be introduced in the existing contracts.
Selection criteria for unlisted companies
For unlisted companies coming out with initial public offering, if the net public offer is Rs.
500 crore or more, then the Exchange may consider introducing stock options and stock
futures on such stocks at the time of its' listing in the cash market.
Internet Trading
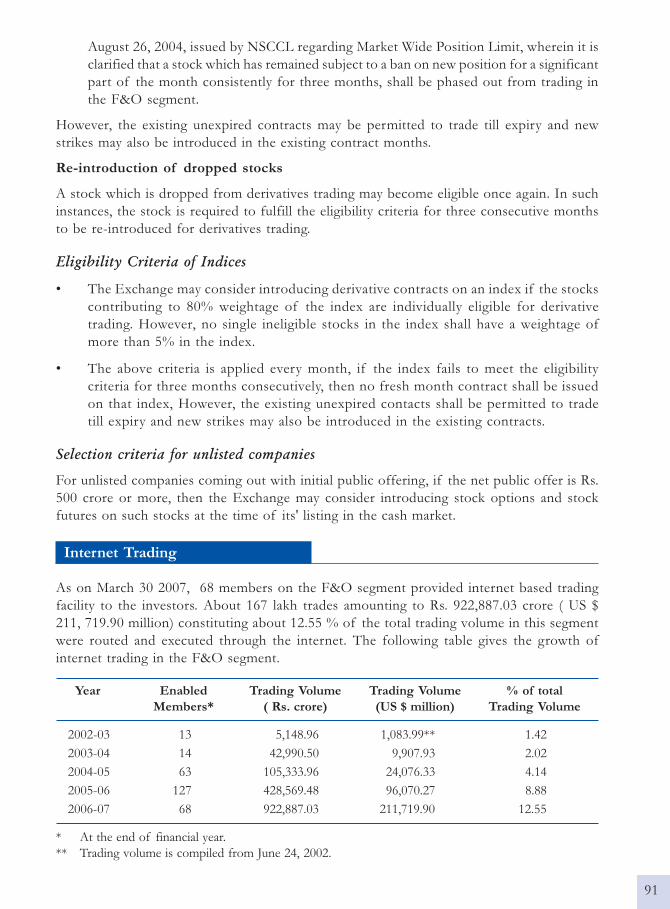
As on March 30 2007, 68 members on the F&O segment provided internet based trading
facility to the investors. About 167 lakh trades amounting to Rs. 922,887.03 crore ( US $
211, 719.90 million) constituting about 12.55 % of the total trading volume in this segment
were routed and executed through the internet. The following table gives the growth of
internet trading in the F&O segment.
Year Enabled Trading Volume Trading Volume % of total
Members* ( Rs. crore) (US $ million) Trading Volume
2002-03 13 5,148.96 1,083.99** 1.42
2003-04 14 42,990.50 9,907.93 2.02
2004-05 63 105,333.96 24,076.33 4.14
2005-06 127 428,569.48 96,070.27 8.88
2006-07 68 922,887.03 211,719.90 12.55
* At the end of financial year.
** Trading volume is compiled from June 24, 2002.

92
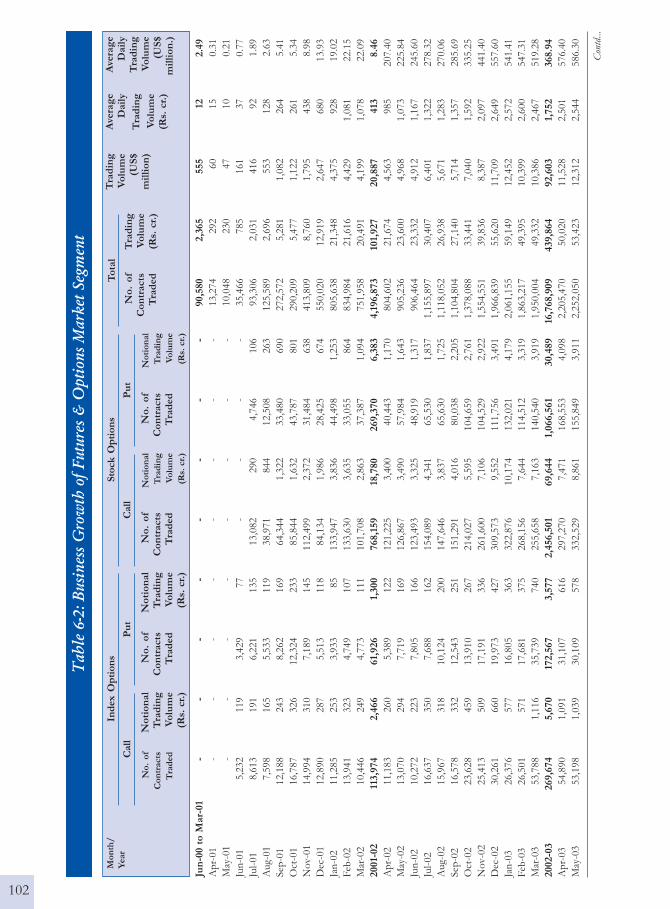
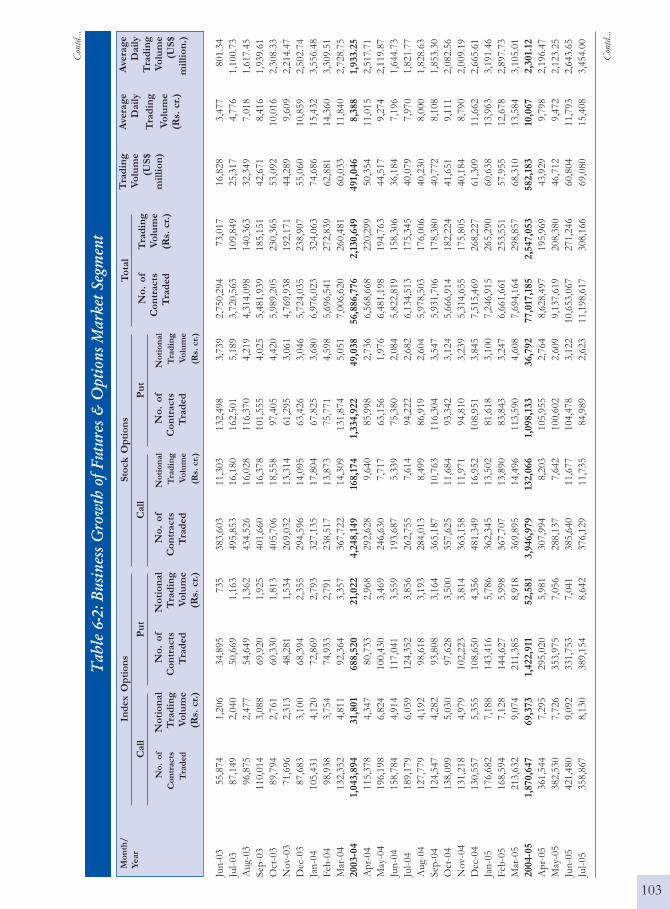
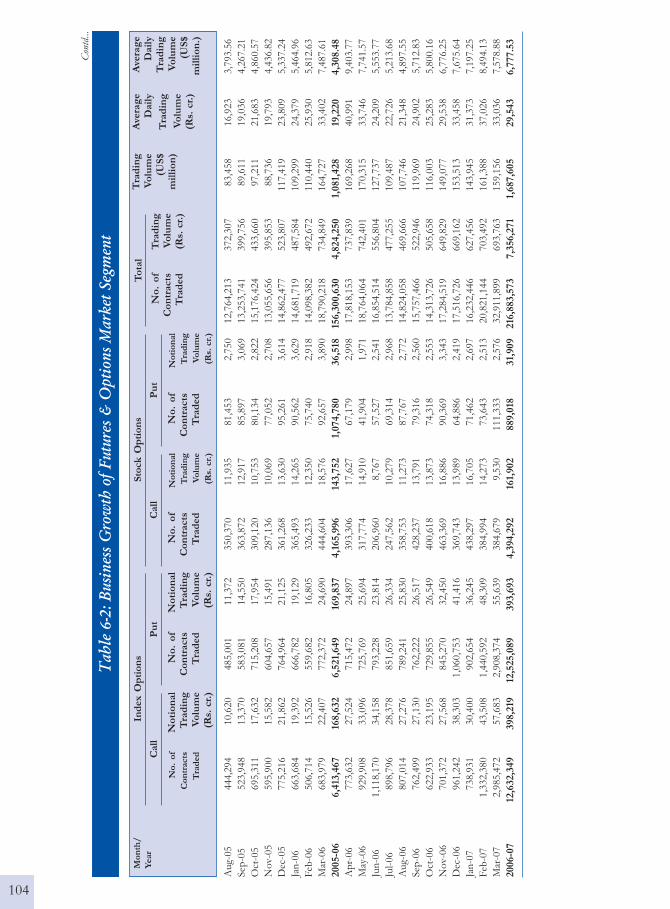
Trading Value
The F&O segment reported a total trading value (notional) of Rs.7,356,271 crore (US $
1,687,605 million) during 2006-07 as against Rs. 4,824,250 crore (US $ 1,687,605 million), a
rise of more than 52.49 % in the past one year. The business growth of F&O segment is
presented in Table 6-2 and Chart 6-1. The F&O segment provides a nationwide market. The
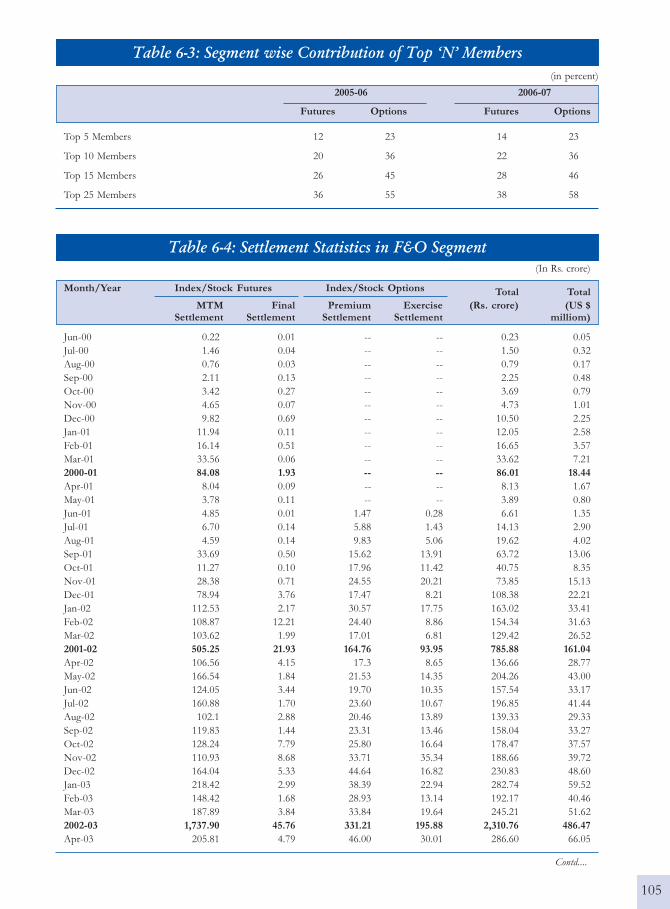
turnover of the top '5' and '10' members accounted to Rs. 1,805,717.55 crore ( US $ 414,250.41
million) and Rs. 2,813,590.61 crore (US $ 645,466.99 million) respectively in 2006-07 in the
Futures segment. However, the turnover of the top '5' and '10' members in the options
segment accounted to Rs. 450,639.73 crore (US $ 103,381.45 million) and Rs. 713,617.56
crore (US $ 163,711.30 million) respectively in the same period. The value contribution of
Top 'N' members is presented in Table 6-3.
Transaction Charges
The maximum brokerage chargeable by a trading member in relation to trades effected in
the contracts admitted to dealing on the F&O segment of NSE is fixed at 2.5% of the
contract value in case of index futures and stock futures. In case of index options and stock
options it is 2.5% of notional value of the contract [(Strike Price + Premium) × Quantity)],
exclusive of statutory levies.
The transaction charges payable to the exchange by the trading member for the trades executed
by him on the F&O segment are fixed at the rate of Rs. 2 per lakh of turnover (0.002%)
subject to a minimum of Rs. 1,00,000 per year. However, for the transactions in the options
sub-segment the transaction charges will be levied on the premium value at the rate of
0.05% (each side) instead of on the strike price as levied earlier.
The trading members contribute to Investor Protection Fund of F&O segment at the rate
of Re.1/- per Rs. 100 crore of the traded value (each side) in case of Futures segment and
Rs.1/- per Rs. 100 crore of the premium amount (each side) in case of Options segment.
The trading members are also required to pay securities transaction tax (STT) on non-delivery
transactions at the rate of 0.017% (payable by the seller) for derivatives w. e. f June 1, 2006.
No transaction charges will be payable in respect of trades done in Interest Rate Futures in
the Futures and Options Segment of the Exchange with effect from 1st April 2007 till 31st
March 2008. Every Trading Member participating in trading in such Interest Rate Futures at
any time during the year 2007-08 shall be required to make a lump sum contribution of
Rs.500/- for the whole year as a contribution to Investor Protection Fund.
There would be no transaction charges levied on turnover above Rs.10 crores per trading
member per day for trades done in NIFTY Junior and CNX 100 in the Futures sub-segment
till September 30, 2007. Further, no transactions charge will be levied on trades done in
NIFTY Junior and CNX 100 in the Options sub-segment till September 30, 2007.

93
Clearing and Settlement
NSCCL undertakes clearing and settlement of all trades executed on the F&O segment of the
Exchange. It also acts as legal counterparty to all trades on this segment and guarantees their
financial settlement. The Clearing and Settlement process comprises of three main activities,
viz., Clearing, Settlement and Risk Management.
Clearing Mechanism
The first step in clearing process is working out open positions and obligations of clearing
(self-clearing/trading-cum-clearing/professional clearing) members (CMs). The open
positions of a CM is arrived at by aggregating the open positions of all the trading members
(TMs) and all custodial participants (CPs) clearing though him, in the contracts which they
have traded. The open position of a TM is arrived at by summing up his proprietary open
position and clients' open positions, in the contracts which they have traded. While entering
orders on the trading system, TMs identify orders as either proprietary or client. Proprietary
positions are calculated on net basis for each contract and that of clients are arrived at by
summing together net positions of each individual client. A TM's open position is the sum
of proprietary open position, client open long position and client open short position.
Settlement Mechanism
All futures and options contracts are cash settled i.e. through exchange of cash. The underlying
for index futures/options of the Nifty index cannot be delivered. The settlement amount
for a CM is netted across all their TMs/clients, across various settlements. For the purpose
of settlement, all CMs are required to open a separate bank account with NSCCL designated
clearing banks for F&O segment.
Settlement of Futures Contracts on Index or Individual Securities
Futures contracts have two types of settlements, the MTM settlement which happens on a
continuous basis at the end of each day, and the final settlement which happens on the last
trading day of the futures contract.
� MTM Settlement for Futures: The positions in futures contracts for each
member are marked-to-market to the daily settlement price of the relevant futures
contract at the end of each day. The CMs who have suffered a loss are required to
pay the mark-to-market (MTM) loss amount in cash which is in turn passed on to
the CMs who have made a MTM profit. This is known as daily mark-to-market
settlement. CMs are responsible to collect and settle the daily MTM profits/losses
incurred by the TMs and their clients clearing and settling through them. Similarly,
TMs are responsible to collect/pay losses/ profits from/to their clients by the
next day. The pay-in and pay-out of the mark-to-market settlement are effected
on the day following the trade day (T+1).
After completion of daily settlement computation, all the open positions are reset to
the daily settlement price. Such positions become the open positions for the next day.
94
� Final Settlement for Futures: On the expiry day of the futures contracts, after the
close of trading hours, NSCCL marks all positions of a CM to the final settlement
price and the resulting profit/loss is settled in cash. Final settlement loss/profit amount
is debited/credited to the relevant CM's clearing bank account on the day following
expiry day of the contract.
� Settlement Prices for Futures: Daily settlement price on a trading day is the
closing price of the respective futures contracts on such day. The closing price
for a futures contract is currently calculated as the last half an hour weighted
average price of the contract in the F&O Segment of NSE. Final settlement
price is the closing price of the relevant underlying index/security in the Capital
Market segment of NSE, on the last trading day of the Contract. The closing
price of the underlying Index/security is currently its last half an hour weighted
average value in the Capital Market Segment of NSE.
Settlement of Options Contracts on Index or Individual Securities
Options contracts have three types of settlements, daily premium settlement, interim
exercise settlement in the case of option contracts on securities and final settlement.
� Daily Premium Settlement for Options: Buyer of an option is obligated to pay the
premium towards the options purchased by him. Similarly, the seller of an option is
entitled to receive the premium for the option sold by him. The premium payable
position and the premium receivable position are netted to compute the net premium
payable or receivable amount for each client for each option contract. The CMs who
have a premium payable position are required to pay the premium amount to NSCCL
which in turn passed on to the members who have a premium receivable position.
This is known as daily premium settlement. CMs are also responsible to collect and
settle for the premium amounts from the TMs and their clients clearing and settling
through them. The pay-in and pay-out of the premium settlement is on T+1 day
(T=Trade day). The premium payable amount and premium receivable amount are
directly credited/debited to the CMs clearing bank account.
� Interim Exercise Settlement: Interim exercise settlement takes place only for option
contracts on individual securities. An investor can exercise his in-the-money options
at any time during trading hours, through his trading member. Interim exercise
settlement is effected for such options at the close of the trading hours, on the day of
exercise. Valid exercised option contracts are assigned to short positions in the option
contract with the same series (i.e. having the same underlying, same expiry date and
same strike price), on a random basis, at the client level. The CM who has exercised
the option receives the exercise settlement value per unit of the option from the CM
who has been assigned the option contract.
Exercise settlement value is debited/credited to the relevant CMs clearing bank account
on T+1 day (T=exercise date).
95
� Final Exercise Settlement: Final Exercise settlement is effected for option positions
at in-the-money strike prices existing at the close of trading hours, on the expiration
day of an option contract. All long positions at in-the-money strike prices are
automatically assigned to short positions in option contracts with the same series, on
a random basis.
For index options contracts, exercise style is European style, while for options contracts
on individual securities, exercise style is American style. Final Exercise is Automatic
on expiry of the option contracts.
Final settlement loss/profit amount for option contracts on Index is debited/credited to
the relevant CMs clearing bank account on T+1 day (T=expiry day). Final settlement loss/
profit amount for option contracts on Individual Securities is debited/credited to the relevant
CMs clearing bank account on T+2 day. Open positions, in option contracts, cease to exist
after their expiration day.
The pay-in / pay-out of funds for a CM on a day is the net amount across settlements and
all TMs/clients, in F&O Segment.
Settlement of Interest Rate Futures Contracts
Daily Mark to Market settlement and Final Mark to Market settlement in respect of admitted
deals in Interest Rate Futures Contracts shall be cash settled by debiting/crediting of the
clearing accounts of Clearing Members with the respective Clearing Bank. All positions
(brought forward, created during the day, closed out during the day) of a F&O CM in Futures
Contracts, at the close of trading hours on a day, shall be marked to market at the Daily
Settlement Price (for Daily Mark to Market Settlement) and settled. All positions (brought
forward, created during the day, closed out during the day) of a F&O Clearing Member in
Futures Contracts, at the close of trading hours on the last trading day, shall be marked to
market at Final Settlement Price (for Final Settlement) and settled. Daily settlement price
shall be the closing price of the relevant futures contract for the trading day. Final settlement
price for an interest rate futures contract shall be based on the value of the notional bond
determined using the ZCYC computed by the Exchange or by any other agency as may be
nominated in this regard. Open positions in Futures contract shall cease to exist after its
expiration day.
� Daily Settlement Price: Daily Settlement price for an interest rate future contract is
the closing price of such interest rate futures contract on the trading day. The closing
price for an interest rate futures contract is calculated on the basis of the last half and
hour weighted average price of such interest rate futures contract. In absence of
trading in the last half an hour, the theoretical price is taken or such other price as
may be decided by the relevant authority from time to time. Theoretical daily settlement
price for unexpired futures contracts shall be the futures prices computed using the
(price of the notional bond) spot prices arrived at from the applicable ZCYC Curve.
The ZCYC shall be computed by the Exchange or by any other agency as may be
96
nominated in this regard from the prices of Government securities traded on the
Exchange or reported on the Negotiated Dealing System of RBI or both taking trades
of same day settlement (i.e. t = 0).
In respect of zero coupon notional bond, the price of the bond shall be the present
value of the principal payment discounted using discrete discounting for the specified
period at the respective zero coupon yield. In respect of the notional T-bill, the
settlement price shall be 100 minus the annualized yield for the specified period
computed using the zero coupon yield curve. In respect of coupon bearing notional
bond, the present value shall be obtained as the sum of present value of the principal
payment discounted at the relevant zero coupon yield and the present values of the
coupons obtained by discounting each notional coupon payment at the relevant zero
coupon yield for that maturity. For this purpose the notional coupon payment date
shall be half yearly and commencing from the date of expiry of the relevant futures
contract. For computation of futures prices from the price of the notional bond
(spot prices) thus arrived, the rate of interest may be the relevant MIBOR rate or
such other rate as may be specified from time to time.
� Final Settlement Price: Final settlement price for an interest rate futures contracts on
zero coupon notional bond and coupon bearing bond shall be based on the price of
the notional bond determined using the zero coupon yield curve. In respect of notional
T-bill it shall be 100 minus the annualized yield for the specified period computed
using the zero coupon yield curve.
Settlement of Custodial Participant (CP) Deals
NSCCL provides a facility to entities like institutions to execute trades through any TM, which
may be cleared and settled by their own CM. Such entities are called Custodial Participants (CP).
To avail of this facility, a CP is required to register with NSCCL through this CM, which allots
them a unique CP code. The CP and the CM are required to enter into an agreement as per
specified format. Thereafter, all trades executed by such CP through any TM are required to have
the CP code in the relevant field on the F&O trading system at the time of order entry. Such
trades executed on behalf of a CP are required to be confirmed by their CM (and not the CM of
the TM through whom the trade was executed), within the time specified by NSE, using the
confirmation facility provided by NSCCL to the CMs in the F&O segment. Till such time the
trade is confirmed by the CM of the CP, the same is considered as a trade of the TM and the
responsibility of settlement of such trade vests with the CM of the TM. Once the trades have
been confirmed by the CM of the CP, they form part of the obligations of the CM of the CP
and they shall be responsible for all obligations arising out of such trades including the payment
of margins and settlement of obligations.
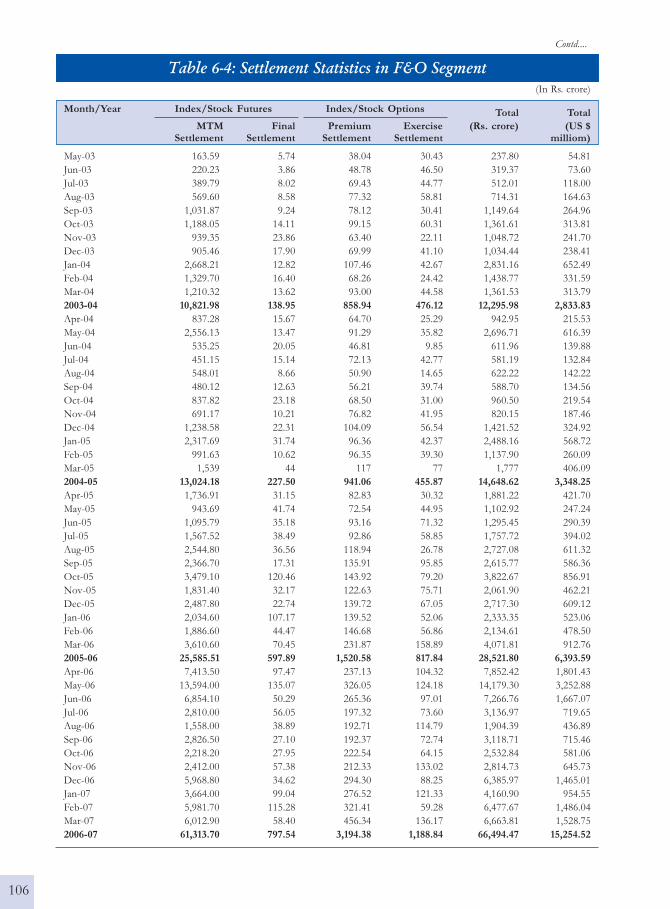
Settlement Statistics
All derivative contracts are currently cash settled. The participants discharge their obligations
through payment/receipt of cash. During the year, 2006-07, such cash settlement amounted
97
to Rs.66,494.47 crore. The details of settlement are presented in Table 6-4. The settlement
of futures and of options involved Rs. 62,111.24 crore and Rs. 4,383.22 crore respectively.
Risk Management System
NSCCL has developed a comprehensive risk containment mechanism for the F&O segment.
The salient features of risk containment measures on the F&O segment are:
• The financial soundness of the members is the key to risk management. Therefore, the
requirements for membership in terms of capital adequacy (net worth, security deposits)
are quite stringent. These requirements have already been explained in Table 2-1 in
Section 2 of this publication.
• NSCCL charges an upfront initial margin for all the open positions of a Clearing Member
(CM). It specifies the initial margin requirements for each futures/options contract on a
daily basis. It follows VaR-based margining computed through SPAN. The CM in turn
collects the initial margin from the trading members (TMs) and their respective clients.
• The open positions of the members are marked to market based on contract settlement
price for each contract at the end of the day. The difference is settled in cash on a T+1
basis.
• NSCCL's on-line position monitoring system monitors a CM's open position on a real-
time basis. Limits are set for each CM based on his effective deposits. The on-line
position monitoring system generates alert messages whenever a CM reaches 70 %, 80
%, 90 % and a disablement message at 100 % of the limit. NSCCL monitors the CMs
for Initial Margin violation, Exposure margin violation, while TMs are monitored for
Initial Margin violation and position limit violation.
• CMs are provided a trading terminal for the purpose of monitoring the open positions
of all the TMs clearing and settling through him. A CM may set limits for a TM clearing
and settling through him. NSCCL assists the CM to monitor the intra-day limits set up
by a CM and whenever a TM exceed the limits, it stops that particular TM from further
trading.
• A member is alerted of his position to enable him to adjust his exposure or bring in
additional capital. Margin violations result in disablement of trading facility for all
TMs of a CM in case of a violation by the CM.
• A separate Settlement Guarantee Fund for this segment has been created out of deposits
of members.
The most critical component of risk containment mechanism for F&O segment is the
margining system and on-line position monitoring. The actual position monitoring and
margining is carried out on-line through Parallel Risk Management System (PRISM) using
SPAN(R)* Standard Portfolio Analysis of Risk) system for the purpose of computation of
on-line margins, based on the parameters defined by SEBI.
* SPAN ® is a registered trademark of the Chicago Mercantile Exchange (CME) used here under license.
98
NSE - SPAN
The objective of NSE-SPAN is to identify overall risk in a portfolio of all futures and
options contracts for each member. The system treats futures and options contracts uniformly,
while at the same time recognising the unique exposures associated with options portfolios,
like extremely deep out-of-the-money short positions and inter-month risk.
Its over-riding objective is to determine the largest loss that a portfolio might reasonably be
expected to suffer from one day to the next day based on 99% VaR methodology.
SPAN considers uniqueness of option portfolios. The following factors affect the value of
an option:
i. Underlying market price
ii. Volatility (variability) of underlying instrument
iii. Time to expiration
iv. Interest rate
v. Strike price
As these factors change, the value of options maintained within a portfolio also changes.
Thus, SPAN constructs scenarios of probable changes in underlying prices and volatilites in
order to identify the largest loss a portfolio might suffer from one day to the next. It then
sets the margin requirement to cover this one-day loss.
The complex calculations (e.g. the pricing of options) in SPAN are executed by NSCCL.
The results of these calculations are called risk arrays. Risk arrays, and other necessary data
inputs for margin calculation are provided to members daily in a file called the SPAN Risk
Parameter file. Members can apply the data contained in the Risk Parameter files, to their
specific portfolios of futures and options contracts, to determine their SPAN margin
requirements.
Hence, members need not execute a complex option pricing calculations, which is performed
by NSCCL. SPAN has the ability to estimate risk for combined futures and options portfolios,
and also re-value the same under various scenarios of changing market conditions.
NSCCL generates six risk parameters file for a day taking into account price and volatilities
at various time intervals and are provided on the website of the Exchange.
Margins
The margining system for F&O segment is as below:
� Initial margin: Margin in the F&O segment is computed by NSCCL upto client level for
open positions of CMs/TMs. These are required to be paid up-front on gross basis at
individual client level for client positions and on net basis for proprietary positions.
99
NSCCL collects initial margin for all the open positions of a CM based on the margins
computed by NSE-SPAN. A CM is required to ensure collection of adequate initial
margin from his TMs up-front. The TM is required to collect adequate initial margins
up-front from his clients.
� Premium Margin: In addition to Initial Margin, Premium Margin is charged at client
level. This margin is required to be paid by a buyer of an option till the premium
settlement is complete.
� Assignment Margin for Options on Securities: Assignment margin is levied in addition to
initial margin and premium margin. It is required to be paid on assigned positions of
CMs towards interim and final exercise settlement obligations for option contracts on
individual securities, till such obligations are fulfilled. The margin is charged on the net
exercise settlement value payable by a CM towards interim and final exercise settlement.
� Exposure Margins: Clearing members are subject to exposure margins in addition to
initial margins.
� Client Margins: NSCCL intimates all members of the margin liability of each of their
client. Additionally members are also required to report details of margins collected
from clients to NSCCL, which holds in trust client margin monies to the extent reported
by the member as having been collected form their respective clients.
100
Tab
le 6
-1:
Con
trac
t Sp
ecif
icat
ion
for
F&
O
Part
icu
lars
Ind
ex
Fu
ture
sS
tock
Fu
ture
sIn
dex
Op
tio
ns
Sto
ck
Op
tio
ns
Inte
rest
Rate
Fu
ture
s
Sec
uri
ty D
escr
ipti
on
FU
TID
XF
UT
ST
KO
PT
IDX
OP
TST
KF
UT
INT
Un
der
lyin
gS&
P C
NX
Nif
tyIn
div
idual
Sec
uri
ties
S&
P C
NX
Nif
ty I
nd
ex/
Ind
ivid
ual
Sec
uri
ties
No
tio
nal
10
year
bo
nd
(6%
co
up
on
),In
dex
/C
NX
IT
In
dex
/C
NX
IT
In
dex
/N
oti
on
al 1
0 ye
ar z
ero
co
up
on
bo
nd
an
dB
AN
K N
ifty
In
dex
/B
AN
K N
ifty
In
dex
/N
oti
on
al 9
1 d
ay T
-Bill
CN
X N
ifty
Jun
ior
CN
X N
ifty
Jun
ior
and
and
CN
X 1
00C
NX
100
Sty
le o
f O
pti
on
NA
NA
Euro
pea
nA
mer
ican
NA
Co
ntr
act
Siz
eA
s sp
ecif
ied
by
SE
BI;
As
spec
ifie
d b
y SE
BI;
As
spec
ifie
d b
y SE
BI;
As
spec
ifie
d b
y SE
BI;
Per
mit
ted
lo
t si
ze i
s 2,
000
Cur
rentl
y m
inim
um R
s. 2
lak
hs
Cur
rentl
y m
inim
um R
s. 2
lak
hs
Cur
rentl
y m
inim
um R
s. 2
lak
hs
Cur
rently
min
imum
Rs.
2 lak
hs
at t
he
tim
e o
f in
tro
duct
ion
at t
he
tim
e o
f in
tro
duct
ion
at t
he
tim
e o
f in
tro
duct
ion
at t
he
tim
e o
f in
tro
duct
ion
Pri
ce S
tep
s
Rs.
0.0
5
Rs.
0.0
1
Exp
irat
ion
Mo
nth
s
3 n
ear
mo
nth
s
On
e ye
ar
Tra
din
g C
ycle
A m
axim
um
of
thre
e m
on
th t
rad
ing
cycl
e -
the
nea
r m
on
th (
on
e),
the
nex
t m
on
th (
two
) an
d t
he
far
mo
nth
(th
ree)
.T
he
con
trac
ts s
hal
l b
e fo
r a
per
iod
of
a m
aturi
tyN
ew c
on
trac
t is
in
tro
duce
d o
n t
he
nex
t tr
adin
g d
ay f
ollo
win
g th
e ex
pir
y o
f n
ear
mo
nth
co
ntr
act
of
on
e ye
ar w
ith
th
ree
mo
nth
s co
nti
nuo
us
con
trac
ts f
or
the
firs
t th
ree
mo
nth
s an
d f
ixed
quar
terl
y co
ntr
acts
fo
r th
e en
tire
yea
r
Las
t T
rad
ing/
Exp
irat
ion
Day
Las
t T
hurs
day
of
the
exp
iry
mo
nth
or
the
pre
ced
ing
trad
ing
day
, if
las
t T
hurs
day
is
a tr
adin
g h
olid
ayL
ast
Th
urs
day
of
the
exp
iry
mo
nth
. If
las
tT
hurs
day
is
a tr
adin
g h
olid
ay,
the
con
trac
t sh
all
exp
ire
on
pre
vio
us
trad
ing
day
. F
urt
her
, w
her
e th
ela
st T
hurs
day
fal
ls o
n t
he
ann
ual
or
hal
f ye
arly
clo
sin
g d
ates
of
the
ban
k, t
he
con
trac
t sh
all
exp
ire
on
pre
vio
us
trad
ing
day
.
Pri
ce B
and
sO
per
atin
g ra
nge
of
Op
erat
ing
ran
ge o
fO
per
atin
g ra
nge
of
Op
erat
ing
ran
ge o
fO
per
atin
g ra
nge
of
10%
of
the
bas
e p
rice
20%
of
the
bas
e p
rice
99%
of
the
bas
e p
rice
99%
of
the
bas
e p
rice
2% o
f th
e b
ase
pri
ce
No.
of
Str
ike
Pri
ces
NA
NA
NIF
TY
,JR
. N
IFT
Y a
nd
7 st
rike
s (t
hre
e 'in
th
e m
on
ey',
NA
CN
X 1
00 B
AN
K N
ifty
&o
ne
'at
the
mo
ney
' an
d t
hre
eC
NX
IT
Up
to
200
0 -
9'o
ut
of
the
mo
ney
) fo
r ev
ery
stri
kes
(fo
ur
'in-t
he-
mo
ney
'),
op
tio
n t
ype
(i.e
cal
l an
d p
ut)
on
e 'a
t th
e m
on
ey' a
nd
fo
ur'
out
of
the
mo
ney
) fo
r ev
ery
op
tio
n t
ype
(i.e
. ca
ll an
d p
ut)
> 2
001
up
to 4
000
- 9
stri
kes
(fo
ur
'in-t
he-
mo
ney
'),
on
e'a
t th
e m
on
ey' a
nd
fo
ur'
out
Contd...
101
Tab
le 6
-1:
Con
trac
t Sp
ecif
icat
ion
for
F&
O
Part
icu
lars
Ind
ex
Fu
ture
sS
tock
Fu
ture
sIn
dex
Op
tio
ns
Sto
ck
Op
tio
ns
Inte
rest
Rate
Fu
ture
s
of
the
mo
ney
) fo
r ev
ery
op
tio
n t
ype
(i.e
. ca
ll an
d p
ut)
> 4
001
up
to 6
000
- 11
str
ikes
(fiv
e 'in
th
e m
on
ey',
on
e'a
t th
e m
on
ey' a
nd
fiv
e' o
ut
of
the
mo
ney
') f
or
ever
yo
pti
on
typ
e (i
.e c
all
and
put)
> 6
000
-13
stri
kes
(six
'in
th
em
on
ey',
on
e 'a
t th
e m
on
ey'
and
six
'o
ut
of
the
mo
ney
')fo
r ev
ery
op
tio
n t
ype
(i.e
cal
l an
d p
ut)
Str
ike
Pri
ce I
nte
rval
(in
Rs.
)N
AN
AU
p t
o 2
000
25
Bet
wee
n 2
.5 a
nd
50
NA
2001
-400
0
50
dep
end
ing
on
th
e p
rice
4001
-600
0
50
of
un
der
lyin
g>
600
0
50
Set
tlem
ent
In c
ash
on
T+
1 b
asis
In c
ash
on
T+
1 b
asis
In c
ash
on
T+
1 b
asis
Dai
ly s
ettl
emen
t o
n T
+1
Dai
ly M
ark-
to-M
arke
t se
ttle
men
tb
asis
an
d f
inal
set
tlem
ent
and
Fin
al S
ettl
emen
t w
ill b
eo
n T
+1
bas
iso
n T
+1
bas
is
Dai
ly S
ettl
emen
t P
rice
Clo
sin
g p
rice
of
futu
res
Clo
sin
g p
rice
of
futu
res
Pre
miu
m V
alue
(net
)P
rem
ium
Val
ue
(net
)A
s m
ay b
e st
ipula
ted
by
NSC
CL
con
trac
t o
n t
he
trad
ing
day
con
trac
t o
n t
he
trad
ing
day
in t
his
reg
ard
fro
m t
ime
to t
ime
Fin
al S
ettl
emen
t P
rice
Clo
sin
g va
lue
un
der
lyin
gC
losi
ng
valu
e un
der
lyin
gC
losi
ng
valu
e o
f su
chC
losi
ng
valu
e o
f su
chA
s m
ay b
e st
ipula
ted
by
NSC
CL
ind
ex/
secu
rity
on
th
e la
stin
dex
/se
curi
ty o
n t
he
last
un
der
lyin
g se
curi
ty (
ind
ex)
un
der
lyin
g se
curi
ty (
ind
ex)
in t
his
reg
ard
fro
m t
ime
to t
ime
trad
ing
day
of
the
futu
res
trad
ing
day
of
the
futu
res
on
th
e la
st t
rad
ing
day
of
the
on
th
e la
st t
rad
ing
day
of
the
con
trac
t.co
ntr
act.
op
tio
ns
con
trac
t.o
pti
on
s co
ntr
act.
Set
tlem
ent
Day
Las
t tr
adin
g d
ay
Mar
gin
s U
p-f
ron
t in
itia
l m
argi
n o
n d
aily
bas
is
NA
: N
ot
app
licab
le
Contd...
102
Contd...
Tab
le 6
-2:
Bu
sin
ess
Gro
wth
of
Fu
ture
s &
Op
tion
s M
ark
et S
egm
ent
Ind
ex O
pti
on
s
Call
Pu
t
No
. o
f
Co
ntr
acts
Tra
ded
No
tio
nal
Tra
din
gV
olu
me
(Rs.
cr.
)
No
. o
fC
on
tracts
Tra
ded
No
tio
nal
Tra
din
gV
olu
me
(Rs.
cr.
)
To
tal
No
. o
fC
on
tracts
Tra
ded
Jun
-00 t
o M
ar-
01
--
--
--
--
90,5
80
2,3
65
555
122.4
9
Ap
r-01
--
--
--
--
13,2
74
292
6015
0.3
1
May
-01
--
--
--
--
10,0
48
230
4710
0.2
1
Jun
-01
5,2
32
119
3,4
29
77-
--
-35,4
66
785
161
370.7
7
Jul-
01
8,6
13
191
6,2
21
135
13,0
82
290
4,7
46
106
93,3
06
2,0
31
416
921.8
9
Aug-
01
7,5
98
165
5,5
33
119
38,9
71
844
12,5
08
263
125,5
89
2,6
96
553
128
2.6
3
Sep
-01
12,1
88
243
8,2
62
169
64,3
44
1,3
22
33,4
80
690
272,5
72
5,2
81
1,0
82
264
5.4
1
Oct
-01
16,7
87
326
12,3
24
233
85,8
44
1,6
32
43,7
87
801
290,2
09
5,4
77
1,1
22
261
5.3
4
No
v-0
114,9
94
310
7,1
89
145
112,4
99
2,3
72
31,4
84
638
413,8
09
8,7
60
1,7
95
438
8.9
8
Dec
-01
12,8
90
287
5,5
13
118
84,1
34
1,9
86
28,4
25
674
550,0
20
12,9
19
2,6
47
680
13.9
3
Jan
-02
11,2
85
253
3,9
33
85133,9
47
3,8
36
44,4
98
1,2
53
805,6
38
21,3
48
4,3
75
928
19.0
2
Feb
-02
13,9
41
323
4,7
49
107
133,6
30
3,6
35
33,0
55
864
834,9
84
21,6
16
4,4
29
1,0
81
22.1
5
Mar
-02
10,4
46
249
4,7
73
111
101,7
08
2,8
63
37,3
87
1,0
94
751,9
58
20,4
91
4,1
99
1,0
78
22.0
9
2001-
02
113,9
74
2,4
66
61,
926
1,300
768,1
59
18,7
80
269,3
70
6,3
83
4,1
96,8
73
101,
927
20,8
87
413
8.4
6
Ap
r-02
11,1
83
260
5,3
89
122
121,2
25
3,4
00
40,4
43
1,1
70
804,6
02
21,6
74
4,5
63
985
207.4
0
May
-02
13,0
70
294
7,7
19
169
126,8
67
3,4
90
57,9
84
1,6
43
905,2
36
23,6
00
4,9
68
1,0
73
225.8
4
Jun
-02
10,2
72
223
7,8
05
166
123,4
93
3,3
25
48,9
19
1,3
17
906,4
64
23,3
32
4,9
12
1,1
67
245.6
0
Jul-
02
16,6
37
350
7,6
88
162
154,0
89
4,3
41
65,5
30
1,8
37
1,1
55,8
97
30,4
07
6,4
01
1,3
22
278.3
2
Aug-
02
15,9
67
318
10,1
24
200
147,6
46
3,8
37
65,6
30
1,7
25
1,1
18,0
52
26,9
38
5,6
71
1,2
83
270.0
6
Sep
-02
16,5
78
332
12,5
43
251
151,2
91
4,0
16
80,0
38
2,2
05
1,1
04,8
04
27,1
40
5,7
14
1,3
57
285.6
9
Oct
-02
23,6
28
459
13,9
10
267
214,0
27
5,5
95
104,6
59
2,7
61
1,3
78,0
88
33,4
41
7,0
40
1,5
92
335.2
5
No
v-0
225,4
13
509
17,1
91
336
261,6
00
7,1
06
104,5
29
2,9
22
1,5
54,5
51
39,8
36
8,3
87
2,0
97
441.4
0
Dec
-02
30,2
61
660
19,9
73
427
309,5
73
9,5
52
111,7
56
3,4
91
1,9
66,8
39
55,6
20
11,7
09
2,6
49
557.6
0
Jan
-03
26,3
76
577
16,8
05
363
322,8
76
10,1
74
132,0
21
4,1
79
2,0
61,1
55
59,1
49
12,4
52
2,5
72
541.4
1
Feb
-03
26,5
01
571
17,6
81
375
268,1
56
7,6
44
114,5
12
3,3
19
1,8
63,2
17
49,3
95
10,3
99
2,6
00
547.3
1
Mar
-03
53,7
88
1,1
16
35,7
39
740
255,6
58
7,1
63
140,5
40
3,9
19
1,9
50,0
04
49,3
32
10,3
86
2,4
67
519.2
8
2002-0
3269,6
74
5,6
70
172,5
67
3,5
77
2,4
56,5
01
69,6
44
1,066,5
61
30,4
89
16,7
68,9
09
439,8
64
92,6
03
1,752
368.9
4
Ap
r-03
54,8
90
1,0
91
31,1
07
616
297,2
70
7,4
71
168,5
53
4,0
98
2,2
05,4
70
50,0
20
11,5
28
2,5
01
576.4
0
May
-03
53,1
98
1,0
39
30,1
09
578
332,5
29
8,8
61
155,8
49
3,9
11
2,2
52,0
50
53,4
23
12,3
12
2,5
44
586.3
0
Ave
rag
eD
ail
yT
rad
ing
Vo
lum
e(U
S$
mil
lio
n.)
Tra
din
gV
olu
me
(Rs.
cr.
)
Mo
nth
/
Year
Sto
ck
Op
tio
ns
Call
Pu
t
No
. o
fC
on
tracts
Tra
ded
No
tio
nal
Tra
din
g
Vo
lum
e
(Rs.
cr.
)
No
. o
fC
on
tracts
Tra
ded
No
tio
nal
Tra
din
g
Vo
lum
e
(Rs.
cr.
)
Ave
rag
eD
ail
y
Tra
din
g
Vo
lum
e(R
s. c
r.)
Tra
din
gV
olu
me
(US
$m
illi
on
)
103
Contd...
Tab
le 6
-2:
Bu
sin
ess
Gro
wth
of
Fu
ture
s &
Op
tion
s M
ark
et S
egm
ent
Jun
-03
55,8
74
1,2
06
34,8
95
735
383,6
03
11,3
03
132,4
98
3,7
39
2,7
50,2
94
73,0
17
16,8
28
3,4
77
801.3
4
Jul-
03
87,1
49
2,0
40
50,6
69
1,1
63
495,8
53
16,1
80
162,5
01
5,1
89
3,7
20,5
63
109,8
49
25,3
17
4,7
76
1,1
00.7
3
Aug-
03
96,8
75
2,4
77
54,6
49
1,3
62
434,5
26
16,0
28
116,3
70
4,2
19
4,3
14,0
98
140,3
63
32,3
49
7,0
18
1,6
17.4
5
Sep
-03
110,0
14
3,0
88
69,9
20
1,9
25
401,6
60
16,3
78
101,5
55
4,0
25
5,4
81,9
39
185,1
51
42,6
71
8,4
16
1,9
39.6
1
Oct
-03
89,7
94
2,7
61
60,3
30
1,8
13
405,7
06
18,5
58
97,4
05
4,4
20
5,9
89,2
05
230,3
65
53,0
92
10,0
16
2,3
08.3
3
No
v-0
371,6
96
2,3
13
48,2
81
1,5
34
269,0
32
13,3
14
61,2
95
3,0
61
4,7
69,9
38
192,1
71
44,2
89
9,6
09
2,2
14.4
7
Dec
-03
87,6
83
3,1
00
68,3
94
2,3
55
294,5
96
14,0
95
63,4
26
3,0
46
5,7
24,0
35
238,9
07
55,0
60
10,8
59
2,5
02.7
4
Jan
-04
105,4
31
4,1
20
72,8
69
2,7
93
327,1
35
17,8
04
67,8
25
3,6
80
6,9
76,0
23
324,0
63
74,6
86
15,4
32
3,5
56.4
8
Feb
-04
98,9
38
3,7
54
74,9
33
2,7
91
238,5
17
13,8
73
75,7
71
4,5
98
5,6
96,5
41
272,8
39
62,8
81
14,3
60
3,3
09.5
1
Mar
-04
132,3
52
4,8
11
92,3
64
3,3
57
367,7
22
14,3
09
131,8
74
5,0
51
7,0
06,6
20
260,4
81
60,0
33
11,8
40
2,7
28.7
5
2003-0
41,
043,8
94
31,
801
688,5
20
21,
022
4,2
48,1
49
168,1
74
1,334,9
22
49,0
38
56,8
86,7
76
2,1
30,6
49
491,
046
8,3
88
1,933.2
5
Ap
r-04
115,3
78
4,3
47
80,7
33
2,9
68
292,6
28
9,6
40
85,9
98
2,7
36
6,5
68,6
68
220,2
99
50,3
54
11,0
15
2,5
17.7
1
May
-04
196,1
98
6,8
24
100,4
30
3,4
69
246,6
30
7,7
17
63,1
56
1,9
76
6,4
81,1
98
194,7
63
44,5
17
9,2
74
2,1
19.8
7
Jun
-04
158,7
84
4,9
14
117,0
41
3,5
59
193,6
87
5,3
39
75,3
80
2,0
84
5,8
22,8
19
158,3
06
36,1
84
7,1
96
1,6
44.7
3
Jul-
04
189,1
79
6,0
59
124,3
52
3,8
56
262,7
55
7,6
14
94,2
22
2,6
82
6,1
34,5
13
175,3
45
40,0
79
7,9
70
1,8
21.7
7
Aug-
04
127,7
79
4,1
92
98,6
18
3,1
93
284,0
13
8,4
99
86,9
19
2,6
04
5,9
78,5
03
176,0
06
40,2
30
8,0
00
1,8
28.6
3
Sep
-04
124,5
47
4,2
82
93,8
08
3,1
64
365,1
87
10,7
63
116,3
04
3,5
47
5,9
31,7
06
178,3
80
40,7
72
8,1
08
1,8
53.3
0
Oct
-04
138,0
99
5,0
30
97,6
28
3,5
00
357,6
25
11,6
84
93,3
42
3,1
24
5,6
66,9
14
182,2
24
41,6
51
9,1
11
2,0
82.5
6
No
v-0
4131,2
18
4,9
79
102,2
23
3,8
14
363,1
58
11,9
71
94,8
10
3,2
39
5,3
14,6
55
175,8
05
40,1
84
8,7
90
2,0
09.1
9
Dec
-04
130,5
57
5,3
55
108,6
50
4,3
56
481,3
49
16,9
52
108,9
51
3,8
45
7,5
15,4
69
268,2
27
61,3
09
11,6
62
2,6
65.6
1
Jan
-05
176,6
82
7,1
88
143,4
16
5,7
86
362,3
45
13,5
02
81,6
18
3,1
00
7,2
46,9
15
265,2
90
60,6
38
13,9
63
3,1
91.4
6
Feb
-05
168,5
94
7,1
28
144,6
27
5,9
98
367,7
07
13,8
90
83,8
43
3,2
47
6,6
61,6
61
253,5
51
57,9
55
12,6
78
2,8
97.7
3
Mar
-05
213,6
32
9,0
74
211,3
85
8,9
18
369,8
95
14,4
96
113,5
90
4,6
08
7,6
94,1
64
298,8
57
68,3
10
13,5
84
3,1
05.0
1
2004-0
51,
870,6
47
69,3
73
1,422,9
1152,5
81
3,9
46,9
79
132,0
66
1,098,1
33
36,7
92
77,0
17,1
85
2,5
47,0
53
582,1
83
10,0
67
2,3
01.
12
Ap
r-05
361,5
44
7,2
95
295,0
20
5,9
81
307,9
94
8,2
03
105,9
55
2,7
64
8,6
28,4
97
195,9
69
43,9
29
9,7
98
2,1
96.4
7
May
-05
382,5
30
7,7
26
353,9
75
7,0
56
288,1
37
7,6
42
100,6
02
2,6
09
9,1
37,6
19
208,3
80
46,7
12
9,4
72
2,1
23.2
5
Jun
-05
421,4
80
9,0
92
331,7
53
7,0
41
385,6
40
11,6
77
104,4
78
3,1
22
10,6
53,0
67
271,2
46
60,8
04
11,7
93
2,6
43.6
5
Jul-
05
358,8
67
8,1
30
389,1
54
8,6
42
376,1
29
11,7
35
84,9
89
2,6
23
11,1
98,6
17
308,1
66
69,0
80
15,4
08
3,4
54.0
0
Contd...
Ind
ex O
pti
on
s
Call
Pu
t
No
. o
f
Co
ntr
acts
Tra
ded
No
tio
nal
Tra
din
gV
olu
me
(Rs.
cr.
)
No
. o
fC
on
tracts
Tra
ded
No
tio
nal
Tra
din
gV
olu
me
(Rs.
cr.
)
To
tal
No
. o
fC
on
tracts
Tra
ded
Ave
rag
eD
ail
yT
rad
ing
Vo
lum
e(U
S$
mil
lio
n.)
Tra
din
gV
olu
me
(Rs.
cr.
)
Mo
nth
/
Year
Sto
ck
Op
tio
ns
Call
Pu
t
No
. o
fC
on
tracts
Tra
ded
No
tio
nal
Tra
din
g
Vo
lum
e
(Rs.
cr.
)
No
. o
fC
on
tracts
Tra
ded
No
tio
nal
Tra
din
g
Vo
lum
e
(Rs.
cr.
)
Ave
rag
eD
ail
y
Tra
din
g
Vo
lum
e(R
s. c
r.)
Tra
din
gV
olu
me
(US
$m
illi
on
)
104
Contd...
Tab
le 6
-2:
Bu
sin
ess
Gro
wth
of
Fu
ture
s &
Op
tion
s M
ark
et S
egm
ent
Aug-
05
444,2
94
10,6
20
485,0
01
11,3
72
350,3
70
11,9
35
81,4
53
2,7
50
12,7
64,2
13
372,3
07
83,4
58
16,9
23
3,7
93.5
6
Sep
-05
523,9
48
13,3
70
583,0
81
14,5
50
363,8
72
12,9
17
85,8
97
3,0
69
13,2
53,7
41
399,7
56
89,6
11
19,0
36
4,2
67.2
1
Oct
-05
695,3
11
17,6
32
715,2
08
17,9
54
309,1
20
10,7
53
80,1
34
2,8
22
15,1
76,4
24
433,6
60
97,2
11
21,6
83
4,8
60.5
7
No
v-0
5 5
95,9
00
15,5
82
604,6
57
15,4
91
287,1
36
10,0
69
77,0
52
2,7
08
13,0
55,6
56
395,8
53
88,7
36
19,7
93
4,4
36.8
2
Dec
-05
775,2
16
21,8
62
764,9
64
21,1
25
361,2
68
13,6
30
95,2
61
3,6
14
14,8
62,4
77
523,8
07
117,4
19
23,8
09
5,3
37.2
4
Jan
-06
663,6
84
19,3
92
666,7
82
19,1
29
365,4
93
14,2
65
90,5
62
3,6
29
14,6
81,7
19
487,5
84
109,2
99
24,3
79
5,4
64.9
6
Feb
-06
506,7
14
15,5
26
559,6
82
16,8
05
326,2
33
12,3
50
75,7
40
2,9
18
14,0
98,3
82
492,6
72
110,4
40
25,9
30
5,8
12.6
3
Mar
-06
683,9
79
22,4
07
772,3
72
24,6
90
444,6
04
18,5
76
92,6
57
3,8
90
18,7
90,2
18
734,8
49
164,7
27
33,4
02
7,4
87.6
1
2005-0
6 6
,413
,467
168,6
32
6,5
21,
649
169,8
37
4,1
65,9
96
143,7
52
1,0
74,7
80
36,5
18 1
56,3
00,6
30
4,8
24,2
50
1,0
81,
428
19,2
20
4,3
08.4
8
Ap
r-06
773,6
32
27,5
24
715,4
72
24,8
97
393,3
06
17,6
27
67,1
79
2,9
98
17,8
18,1
53
737,8
39
169,2
68
40,9
91
9,4
03.7
7
May
-06
929,9
08
33,0
96
725,7
69
25,6
94
317,7
74
14,9
10
41,9
04
1,9
71
18,7
64,0
64
742,4
01
170,3
15
33,7
46
7,7
41.5
7
Jun
-06
1,1
18,1
70
34,1
58
793,2
28
23,8
14
206,9
60
8,7
67
57,5
27
2,5
41
16,8
54,5
14
556,8
04
127,7
37
24,2
09
5,5
53.7
7
Jul-
06
898,7
96
28,3
78
851,6
59
26,3
34
247,5
62
10,2
79
69,3
14
2,9
68
13,7
84,8
58
477,2
55
109,4
87
22,7
26
5,2
13.6
8
Aug-
06
807,0
14
27,2
76
789,2
41
25,8
30
358,7
53
11,2
73
87,7
67
2,7
72
14,8
24,0
58
469,6
66
107,7
46
21,3
48
4,8
97.5
5
Sep
-06
762,4
99
27,1
30
762,2
22
26,5
17
428,2
37
13,7
91
79,3
16
2,5
60
15,7
57,4
66
522,9
46
119,9
69
24,9
02
5,7
12.8
3
Oct
-06
622,9
33
23,1
95
729,8
55
26,5
49
400,6
18
13,8
73
74,3
18
2,5
53
14,3
13,7
26
505,6
58
116,0
03
25,2
83
5,8
00.1
6
No
v-0
6 7
01,3
72
27,5
68
845,2
70
32,4
50
463,3
69
16,8
86
90,3
69
3,3
43
17,2
84,5
19
649,8
29
149,0
77
29,5
38
6,7
76.2
5
Dec
-06
961,2
42
38,3
03
1,0
60,7
53
41,4
16
369,7
43
13,9
89
64,8
86
2,4
19
17,5
16,7
26
669,1
62
153,5
13
33,4
58
7,6
75.6
4
Jan
-07
738,9
31
30,4
00
902,6
54
36,2
45
438,2
97
16,7
05
71,4
62
2,6
97
16,2
32,4
46
627,4
56
143,9
45
31,3
73
7,1
97.2
5
Feb
-07
1,3
32,3
80
43,5
08
1,4
40,5
92
48,3
09
384,9
94
14,2
73
73,6
43
2,5
13
20,8
21,1
44
703,4
92
161,3
88
37,0
26
8,4
94.1
3
Mar
-07
2,9
85,4
72
57,6
83
2,9
08,3
74
55,6
39
384,6
79
9,5
30
111,3
33
2,5
76
32,9
11,8
99
693,7
63
159,1
56
33,0
36
7,5
78.8
8
2006-0
7 1
2,6
32,3
49
398,2
19 1
2,5
25,0
89
393,6
93
4,3
94,2
92
161,
902
889,0
18 3
1,909
216
,883,5
73
7,3
56,2
71
1,6
87,6
05
29,5
43
6,7
77.5
3
Ind
ex O
pti
on
s
Call
Pu
t
No
. o
f
Co
ntr
acts
Tra
ded
No
tio
nal
Tra
din
gV
olu
me
(Rs.
cr.
)
No
. o
fC
on
tracts
Tra
ded
No
tio
nal
Tra
din
gV
olu
me
(Rs.
cr.
)
To
tal
No
. o
fC
on
tracts
Tra
ded
Ave
rag
eD
ail
yT
rad
ing
Vo
lum
e(U
S$
mil
lio
n.)
Tra
din
gV
olu
me
(Rs.
cr.
)
Mo
nth
/
Year
Sto
ck
Op
tio
ns
Call
Pu
t
No
. o
fC
on
tracts
Tra
ded
No
tio
nal
Tra
din
g
Vo
lum
e
(Rs.
cr.
)
No
. o
fC
on
tracts
Tra
ded
No
tio
nal
Tra
din
g
Vo
lum
e
(Rs.
cr.
)
Ave
rag
eD
ail
y
Tra
din
g
Vo
lum
e(R
s. c
r.)
Tra
din
gV
olu
me
(US
$m
illi
on
)
105
Table 6-3: Segment wise Contribution of Top ‘N’ Members
Table 6-4: Settlement Statistics in F&O Segment(In Rs. crore)
Month/Year Index/Stock Futures Index/Stock Options Total Total
MTM Final Premium Exercise (Rs. crore) (US $Settlement Settlement Settlement Settlement milliom)
Jun-00 0.22 0.01 -- -- 0.23 0.05
Jul-00 1.46 0.04 -- -- 1.50 0.32
Aug-00 0.76 0.03 -- -- 0.79 0.17
Sep-00 2.11 0.13 -- -- 2.25 0.48
Oct-00 3.42 0.27 -- -- 3.69 0.79
Nov-00 4.65 0.07 -- -- 4.73 1.01
Dec-00 9.82 0.69 -- -- 10.50 2.25
Jan-01 11.94 0.11 -- -- 12.05 2.58
Feb-01 16.14 0.51 -- -- 16.65 3.57
Mar-01 33.56 0.06 -- -- 33.62 7.21
2000-01 84.08 1.93 -- -- 86.01 18.44
Apr-01 8.04 0.09 -- -- 8.13 1.67
May-01 3.78 0.11 -- -- 3.89 0.80
Jun-01 4.85 0.01 1.47 0.28 6.61 1.35
Jul-01 6.70 0.14 5.88 1.43 14.13 2.90
Aug-01 4.59 0.14 9.83 5.06 19.62 4.02
Sep-01 33.69 0.50 15.62 13.91 63.72 13.06
Oct-01 11.27 0.10 17.96 11.42 40.75 8.35
Nov-01 28.38 0.71 24.55 20.21 73.85 15.13
Dec-01 78.94 3.76 17.47 8.21 108.38 22.21
Jan-02 112.53 2.17 30.57 17.75 163.02 33.41
Feb-02 108.87 12.21 24.40 8.86 154.34 31.63
Mar-02 103.62 1.99 17.01 6.81 129.42 26.52
2001-02 505.25 21.93 164.76 93.95 785.88 161.04
Apr-02 106.56 4.15 17.3 8.65 136.66 28.77
May-02 166.54 1.84 21.53 14.35 204.26 43.00
Jun-02 124.05 3.44 19.70 10.35 157.54 33.17
Jul-02 160.88 1.70 23.60 10.67 196.85 41.44
Aug-02 102.1 2.88 20.46 13.89 139.33 29.33
Sep-02 119.83 1.44 23.31 13.46 158.04 33.27
Oct-02 128.24 7.79 25.80 16.64 178.47 37.57
Nov-02 110.93 8.68 33.71 35.34 188.66 39.72
Dec-02 164.04 5.33 44.64 16.82 230.83 48.60
Jan-03 218.42 2.99 38.39 22.94 282.74 59.52
Feb-03 148.42 1.68 28.93 13.14 192.17 40.46
Mar-03 187.89 3.84 33.84 19.64 245.21 51.62
2002-03 1,737.90 45.76 331.21 195.88 2,310.76 486.47
Apr-03 205.81 4.79 46.00 30.01 286.60 66.05
Contd....
2005-06 2006-07
Futures Options Futures Options
Top 5 Members 12 23 14 23
Top 10 Members 20 36 22 36
Top 15 Members 26 45 28 46
Top 25 Members 36 55 38 58
(in percent)
106
Table 6-4: Settlement Statistics in F&O Segment(In Rs. crore)
Month/Year Index/Stock Futures Index/Stock Options Total Total
MTM Final Premium Exercise (Rs. crore) (US $Settlement Settlement Settlement Settlement milliom)
May-03 163.59 5.74 38.04 30.43 237.80 54.81
Jun-03 220.23 3.86 48.78 46.50 319.37 73.60
Jul-03 389.79 8.02 69.43 44.77 512.01 118.00
Aug-03 569.60 8.58 77.32 58.81 714.31 164.63
Sep-03 1,031.87 9.24 78.12 30.41 1,149.64 264.96
Oct-03 1,188.05 14.11 99.15 60.31 1,361.61 313.81
Nov-03 939.35 23.86 63.40 22.11 1,048.72 241.70
Dec-03 905.46 17.90 69.99 41.10 1,034.44 238.41
Jan-04 2,668.21 12.82 107.46 42.67 2,831.16 652.49
Feb-04 1,329.70 16.40 68.26 24.42 1,438.77 331.59
Mar-04 1,210.32 13.62 93.00 44.58 1,361.53 313.79
2003-04 10,821.98 138.95 858.94 476.12 12,295.98 2,833.83
Apr-04 837.28 15.67 64.70 25.29 942.95 215.53
May-04 2,556.13 13.47 91.29 35.82 2,696.71 616.39
Jun-04 535.25 20.05 46.81 9.85 611.96 139.88
Jul-04 451.15 15.14 72.13 42.77 581.19 132.84
Aug-04 548.01 8.66 50.90 14.65 622.22 142.22
Sep-04 480.12 12.63 56.21 39.74 588.70 134.56
Oct-04 837.82 23.18 68.50 31.00 960.50 219.54
Nov-04 691.17 10.21 76.82 41.95 820.15 187.46
Dec-04 1,238.58 22.31 104.09 56.54 1,421.52 324.92
Jan-05 2,317.69 31.74 96.36 42.37 2,488.16 568.72
Feb-05 991.63 10.62 96.35 39.30 1,137.90 260.09
Mar-05 1,539 44 117 77 1,777 406.09
2004-05 13,024.18 227.50 941.06 455.87 14,648.62 3,348.25
Apr-05 1,736.91 31.15 82.83 30.32 1,881.22 421.70
May-05 943.69 41.74 72.54 44.95 1,102.92 247.24
Jun-05 1,095.79 35.18 93.16 71.32 1,295.45 290.39
Jul-05 1,567.52 38.49 92.86 58.85 1,757.72 394.02
Aug-05 2,544.80 36.56 118.94 26.78 2,727.08 611.32
Sep-05 2,366.70 17.31 135.91 95.85 2,615.77 586.36
Oct-05 3,479.10 120.46 143.92 79.20 3,822.67 856.91
Nov-05 1,831.40 32.17 122.63 75.71 2,061.90 462.21
Dec-05 2,487.80 22.74 139.72 67.05 2,717.30 609.12
Jan-06 2,034.60 107.17 139.52 52.06 2,333.35 523.06
Feb-06 1,886.60 44.47 146.68 56.86 2,134.61 478.50
Mar-06 3,610.60 70.45 231.87 158.89 4,071.81 912.76
2005-06 25,585.51 597.89 1,520.58 817.84 28,521.80 6,393.59
Apr-06 7,413.50 97.47 237.13 104.32 7,852.42 1,801.43
May-06 13,594.00 135.07 326.05 124.18 14,179.30 3,252.88
Jun-06 6,854.10 50.29 265.36 97.01 7,266.76 1,667.07
Jul-06 2,810.00 56.05 197.32 73.60 3,136.97 719.65
Aug-06 1,558.00 38.89 192.71 114.79 1,904.39 436.89
Sep-06 2,826.50 27.10 192.37 72.74 3,118.71 715.46
Oct-06 2,218.20 27.95 222.54 64.15 2,532.84 581.06
Nov-06 2,412.00 57.38 212.33 133.02 2,814.73 645.73
Dec-06 5,968.80 34.62 294.30 88.25 6,385.97 1,465.01
Jan-07 3,664.00 99.04 276.52 121.33 4,160.90 954.55
Feb-07 5,981.70 115.28 321.41 59.28 6,477.67 1,486.04
Mar-07 6,012.90 58.40 456.34 136.17 6,663.81 1,528.75
2006-07 61,313.70 797.54 3,194.38 1,188.84 66,494.47 15,254.52
Contd....
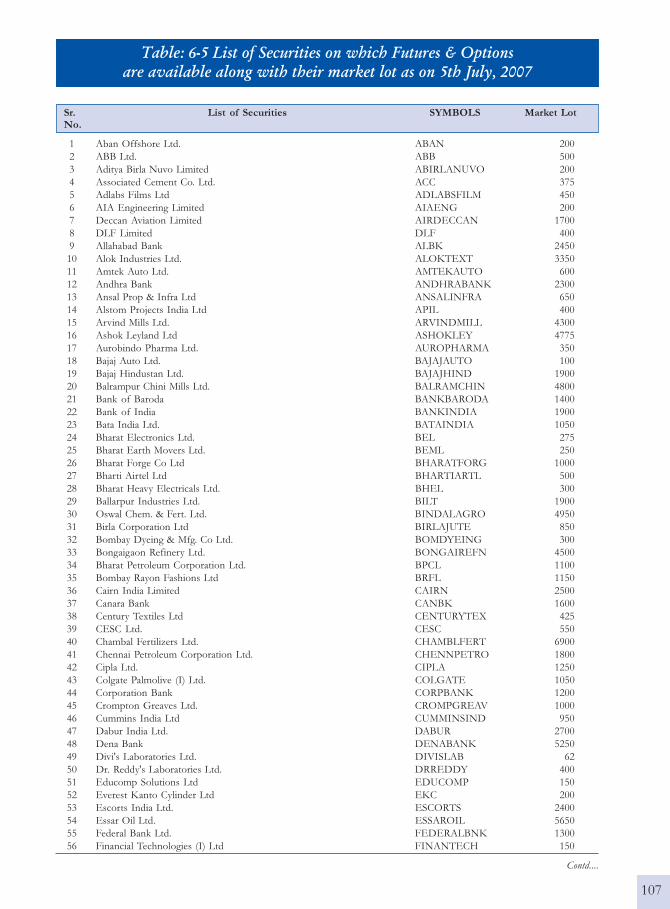
107
Table: 6-5 List of Securities on which Futures & Optionsare available along with their market lot as on 5th July, 2007
Sr. List of Securities SYMBOLS Market LotNo.
1 Aban Offshore Ltd. ABAN 200
2 ABB Ltd. ABB 500
3 Aditya Birla Nuvo Limited ABIRLANUVO 200
4 Associated Cement Co. Ltd. ACC 375
5 Adlabs Films Ltd ADLABSFILM 450
6 AIA Engineering Limited AIAENG 200
7 Deccan Aviation Limited AIRDECCAN 1700
8 DLF Limited DLF 400
9 Allahabad Bank ALBK 2450
10 Alok Industries Ltd. ALOKTEXT 3350
11 Amtek Auto Ltd. AMTEKAUTO 600
12 Andhra Bank ANDHRABANK 2300
13 Ansal Prop & Infra Ltd ANSALINFRA 650
14 Alstom Projects India Ltd APIL 400
15 Arvind Mills Ltd. ARVINDMILL 4300
16 Ashok Leyland Ltd ASHOKLEY 4775
17 Aurobindo Pharma Ltd. AUROPHARMA 350
18 Bajaj Auto Ltd. BAJAJAUTO 100
19 Bajaj Hindustan Ltd. BAJAJHIND 1900
20 Balrampur Chini Mills Ltd. BALRAMCHIN 4800
21 Bank of Baroda BANKBARODA 1400
22 Bank of India BANKINDIA 1900
23 Bata India Ltd. BATAINDIA 1050
24 Bharat Electronics Ltd. BEL 275
25 Bharat Earth Movers Ltd. BEML 250
26 Bharat Forge Co Ltd BHARATFORG 1000
27 Bharti Airtel Ltd BHARTIARTL 500
28 Bharat Heavy Electricals Ltd. BHEL 300
29 Ballarpur Industries Ltd. BILT 1900
30 Oswal Chem. & Fert. Ltd. BINDALAGRO 4950
31 Birla Corporation Ltd BIRLAJUTE 850
32 Bombay Dyeing & Mfg. Co Ltd. BOMDYEING 300
33 Bongaigaon Refinery Ltd. BONGAIREFN 4500
34 Bharat Petroleum Corporation Ltd. BPCL 1100
35 Bombay Rayon Fashions Ltd BRFL 1150
36 Cairn India Limited CAIRN 2500
37 Canara Bank CANBK 1600
38 Century Textiles Ltd CENTURYTEX 425
39 CESC Ltd. CESC 550
40 Chambal Fertilizers Ltd. CHAMBLFERT 6900
41 Chennai Petroleum Corporation Ltd. CHENNPETRO 1800
42 Cipla Ltd. CIPLA 1250
43 Colgate Palmolive (I) Ltd. COLGATE 1050
44 Corporation Bank CORPBANK 1200
45 Crompton Greaves Ltd. CROMPGREAV 1000
46 Cummins India Ltd CUMMINSIND 950
47 Dabur India Ltd. DABUR 2700
48 Dena Bank DENABANK 5250
49 Divi's Laboratories Ltd. DIVISLAB 62
50 Dr. Reddy's Laboratories Ltd. DRREDDY 400
51 Educomp Solutions Ltd EDUCOMP 150
52 Everest Kanto Cylinder Ltd EKC 200
53 Escorts India Ltd. ESCORTS 2400
54 Essar Oil Ltd. ESSAROIL 5650
55 Federal Bank Ltd. FEDERALBNK 1300
56 Financial Technologies (I) Ltd FINANTECH 150
Contd....
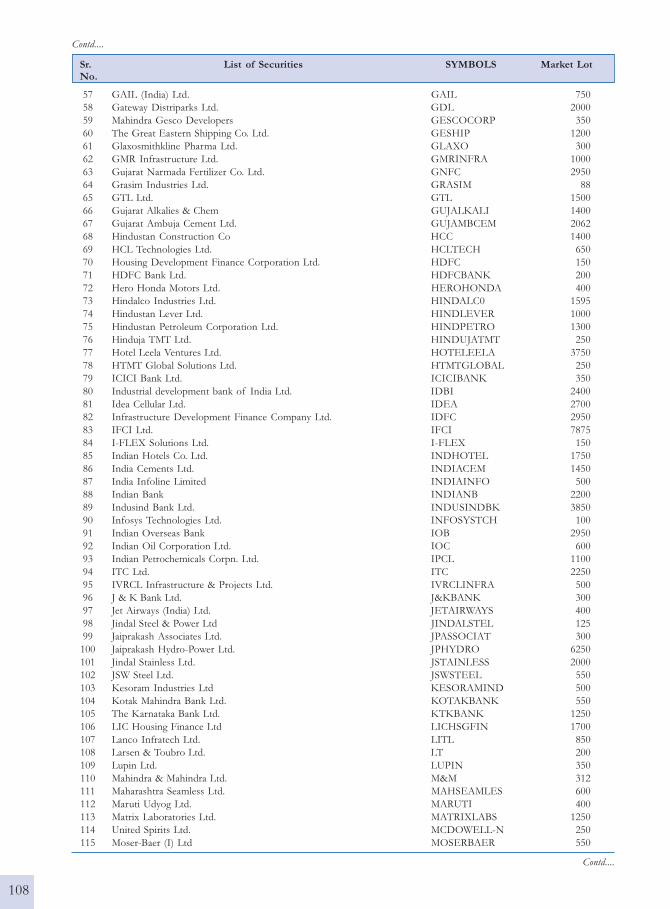
108
Sr. List of Securities SYMBOLS Market LotNo.
57 GAIL (India) Ltd. GAIL 750
58 Gateway Distriparks Ltd. GDL 2000
59 Mahindra Gesco Developers GESCOCORP 350
60 The Great Eastern Shipping Co. Ltd. GESHIP 1200
61 Glaxosmithkline Pharma Ltd. GLAXO 300
62 GMR Infrastructure Ltd. GMRINFRA 1000
63 Gujarat Narmada Fertilizer Co. Ltd. GNFC 2950
64 Grasim Industries Ltd. GRASIM 88
65 GTL Ltd. GTL 1500
66 Gujarat Alkalies & Chem GUJALKALI 1400
67 Gujarat Ambuja Cement Ltd. GUJAMBCEM 2062
68 Hindustan Construction Co HCC 1400
69 HCL Technologies Ltd. HCLTECH 650
70 Housing Development Finance Corporation Ltd. HDFC 150
71 HDFC Bank Ltd. HDFCBANK 200
72 Hero Honda Motors Ltd. HEROHONDA 400
73 Hindalco Industries Ltd. HINDALC0 1595
74 Hindustan Lever Ltd. HINDLEVER 1000
75 Hindustan Petroleum Corporation Ltd. HINDPETRO 1300
76 Hinduja TMT Ltd. HINDUJATMT 250
77 Hotel Leela Ventures Ltd. HOTELEELA 3750
78 HTMT Global Solutions Ltd. HTMTGLOBAL 250
79 ICICI Bank Ltd. ICICIBANK 350
80 Industrial development bank of India Ltd. IDBI 2400
81 Idea Cellular Ltd. IDEA 2700
82 Infrastructure Development Finance Company Ltd. IDFC 2950
83 IFCI Ltd. IFCI 7875
84 I-FLEX Solutions Ltd. I-FLEX 150
85 Indian Hotels Co. Ltd. INDHOTEL 1750
86 India Cements Ltd. INDIACEM 1450
87 India Infoline Limited INDIAINFO 500
88 Indian Bank INDIANB 2200
89 Indusind Bank Ltd. INDUSINDBK 3850
90 Infosys Technologies Ltd. INFOSYSTCH 100
91 Indian Overseas Bank IOB 2950
92 Indian Oil Corporation Ltd. IOC 600
93 Indian Petrochemicals Corpn. Ltd. IPCL 1100
94 ITC Ltd. ITC 2250
95 IVRCL Infrastructure & Projects Ltd. IVRCLINFRA 500
96 J & K Bank Ltd. J&KBANK 300
97 Jet Airways (India) Ltd. JETAIRWAYS 400
98 Jindal Steel & Power Ltd JINDALSTEL 125
99 Jaiprakash Associates Ltd. JPASSOCIAT 300
100 Jaiprakash Hydro-Power Ltd. JPHYDRO 6250
101 Jindal Stainless Ltd. JSTAINLESS 2000
102 JSW Steel Ltd. JSWSTEEL 550
103 Kesoram Industries Ltd KESORAMIND 500
104 Kotak Mahindra Bank Ltd. KOTAKBANK 550
105 The Karnataka Bank Ltd. KTKBANK 1250
106 LIC Housing Finance Ltd LICHSGFIN 1700
107 Lanco Infratech Ltd. LITL 850
108 Larsen & Toubro Ltd. LT 200
109 Lupin Ltd. LUPIN 350
110 Mahindra & Mahindra Ltd. M&M 312
111 Maharashtra Seamless Ltd. MAHSEAMLES 600
112 Maruti Udyog Ltd. MARUTI 400
113 Matrix Laboratories Ltd. MATRIXLABS 1250
114 United Spirits Ltd. MCDOWELL-N 250
115 Moser-Baer (I) Ltd MOSERBAER 550
Contd....
Contd....
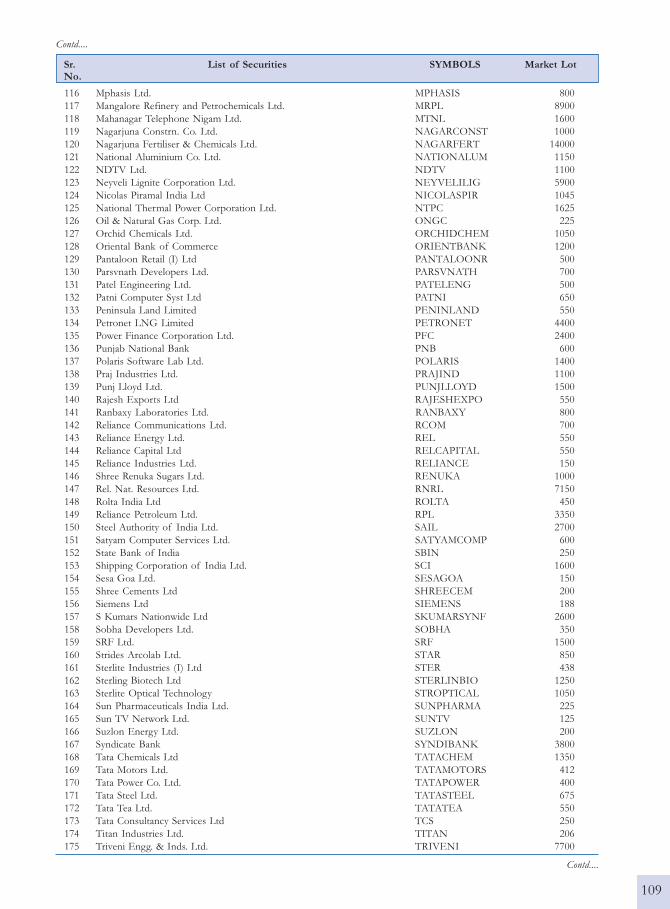
109
Sr. List of Securities SYMBOLS Market LotNo.
Contd....
116 Mphasis Ltd. MPHASIS 800
117 Mangalore Refinery and Petrochemicals Ltd. MRPL 8900
118 Mahanagar Telephone Nigam Ltd. MTNL 1600
119 Nagarjuna Constrn. Co. Ltd. NAGARCONST 1000
120 Nagarjuna Fertiliser & Chemicals Ltd. NAGARFERT 14000
121 National Aluminium Co. Ltd. NATIONALUM 1150
122 NDTV Ltd. NDTV 1100
123 Neyveli Lignite Corporation Ltd. NEYVELILIG 5900
124 Nicolas Piramal India Ltd NICOLASPIR 1045
125 National Thermal Power Corporation Ltd. NTPC 1625
126 Oil & Natural Gas Corp. Ltd. ONGC 225
127 Orchid Chemicals Ltd. ORCHIDCHEM 1050
128 Oriental Bank of Commerce ORIENTBANK 1200
129 Pantaloon Retail (I) Ltd PANTALOONR 500
130 Parsvnath Developers Ltd. PARSVNATH 700
131 Patel Engineering Ltd. PATELENG 500
132 Patni Computer Syst Ltd PATNI 650
133 Peninsula Land Limited PENINLAND 550
134 Petronet LNG Limited PETRONET 4400
135 Power Finance Corporation Ltd. PFC 2400
136 Punjab National Bank PNB 600
137 Polaris Software Lab Ltd. POLARIS 1400
138 Praj Industries Ltd. PRAJIND 1100
139 Punj Lloyd Ltd. PUNJLLOYD 1500
140 Rajesh Exports Ltd RAJESHEXPO 550
141 Ranbaxy Laboratories Ltd. RANBAXY 800
142 Reliance Communications Ltd. RCOM 700
143 Reliance Energy Ltd. REL 550
144 Reliance Capital Ltd RELCAPITAL 550
145 Reliance Industries Ltd. RELIANCE 150
146 Shree Renuka Sugars Ltd. RENUKA 1000
147 Rel. Nat. Resources Ltd. RNRL 7150
148 Rolta India Ltd ROLTA 450
149 Reliance Petroleum Ltd. RPL 3350
150 Steel Authority of India Ltd. SAIL 2700
151 Satyam Computer Services Ltd. SATYAMCOMP 600
152 State Bank of India SBIN 250
153 Shipping Corporation of India Ltd. SCI 1600
154 Sesa Goa Ltd. SESAGOA 150
155 Shree Cements Ltd SHREECEM 200
156 Siemens Ltd SIEMENS 188
157 S Kumars Nationwide Ltd SKUMARSYNF 2600
158 Sobha Developers Ltd. SOBHA 350
159 SRF Ltd. SRF 1500
160 Strides Arcolab Ltd. STAR 850
161 Sterlite Industries (I) Ltd STER 438
162 Sterling Biotech Ltd STERLINBIO 1250
163 Sterlite Optical Technology STROPTICAL 1050
164 Sun Pharmaceuticals India Ltd. SUNPHARMA 225
165 Sun TV Network Ltd. SUNTV 125
166 Suzlon Energy Ltd. SUZLON 200
167 Syndicate Bank SYNDIBANK 3800
168 Tata Chemicals Ltd TATACHEM 1350
169 Tata Motors Ltd. TATAMOTORS 412
170 Tata Power Co. Ltd. TATAPOWER 400
171 Tata Steel Ltd. TATASTEEL 675
172 Tata Tea Ltd. TATATEA 550
173 Tata Consultancy Services Ltd TCS 250
174 Titan Industries Ltd. TITAN 206
175 Triveni Engg. & Inds. Ltd. TRIVENI 7700
Contd....
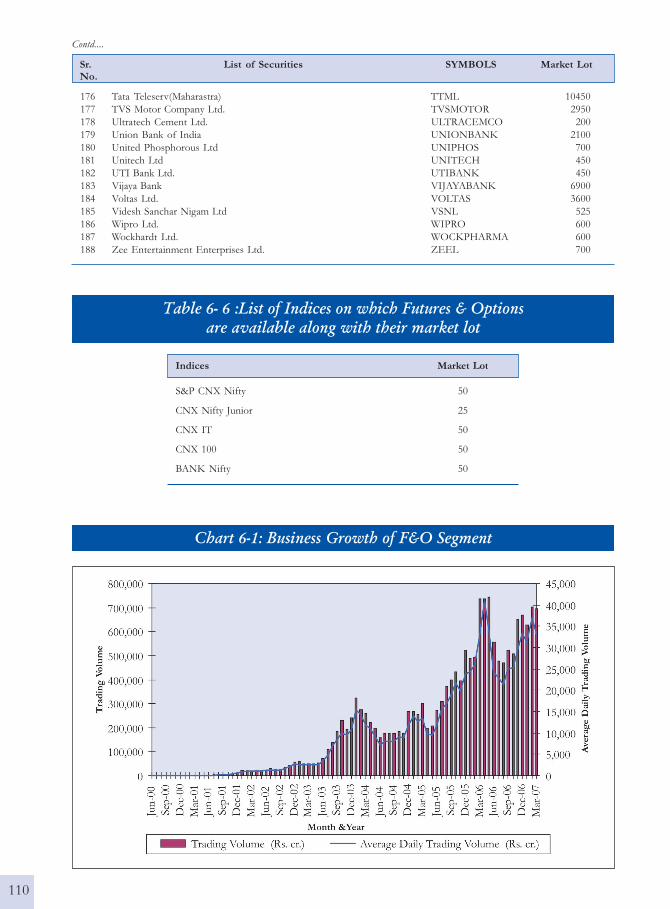
110
Chart 6-1: Business Growth of F&O Segment
Sr. List of Securities SYMBOLS Market LotNo.
Contd....
176 Tata Teleserv(Maharastra) TTML 10450
177 TVS Motor Company Ltd. TVSMOTOR 2950
178 Ultratech Cement Ltd. ULTRACEMCO 200
179 Union Bank of India UNIONBANK 2100
180 United Phosphorous Ltd UNIPHOS 700
181 Unitech Ltd UNITECH 450
182 UTI Bank Ltd. UTIBANK 450
183 Vijaya Bank VIJAYABANK 6900
184 Voltas Ltd. VOLTAS 3600
185 Videsh Sanchar Nigam Ltd VSNL 525
186 Wipro Ltd. WIPRO 600
187 Wockhardt Ltd. WOCKPHARMA 600
188 Zee Entertainment Enterprises Ltd. ZEEL 700
Table 6- 6 :List of Indices on which Futures & Optionsare available along with their market lot
Indices Market Lot
S&P CNX Nifty 50
CNX Nifty Junior 25
CNX IT 50
CNX 100 50
BANK Nifty 50