wrp,ii! - NSE
381
wrp,ii! ';"".. ^aoO June 20, 2019 The Manager- Listing BSE Limited (BSE:507685) The Manager-Listing National Stock Exchange of lndia Limited (NSE: WIPRO) The Market Operations, NYSE, New York (NYSE: WIT) Dear Sir/Madam, Sub: Notice of Annual General Meeting and Annual Report for Financiat Year 2018-19 Pursuant to Section 108 of Companies Act, 2013, Regulation 30 and Regulation 34 of SEBI (Listing Obligations and Disclosure Requirements) Regulations,2015 we are enclosing herewith the following for the Financial Year 2018-19: 1. Notice of the 73d Annual General Meeting 2. E-voting instruction slip 3. Annual Report for FinancialYear 2018-19 The aforesaid documents are being dispatched to all eligible shareholders and are also available on the website of the company at https://vrnrvw.wipro.com/annual-reports/. This is for your information and records. For WIPRO LIMITED (t-{q&q-o M Sanaulla Khan Company Secretary Registered Office: Wipro Limlted Doddakannetti Sarjapur Road Bengaluru 560 035 lndia T : +91 (80) 28440011 F : +91 (80) 2844A054 E : [email protected] W: wipro.com C : L32102KA1945P1C020800
-
Upload
khangminh22 -
Category
Documents
-
view
0 -
download
0
Transcript of wrp,ii! - NSE
wrp,ii!';""..^aoO
June 20, 2019
The Manager- ListingBSE Limited(BSE:507685)
The Manager-ListingNational Stock Exchange of lndia Limited(NSE: WIPRO)
The Market Operations,NYSE, New York(NYSE: WIT)
Dear Sir/Madam,
Sub: Notice of Annual General Meeting and Annual Report for Financiat Year 2018-19
Pursuant to Section 108 of Companies Act, 2013, Regulation 30 and Regulation 34 of SEBI(Listing Obligations and Disclosure Requirements) Regulations,2015 we are enclosing herewiththe following for the Financial Year 2018-19:
1. Notice of the 73d Annual General Meeting2. E-voting instruction slip3. Annual Report for FinancialYear 2018-19
The aforesaid documents are being dispatched to all eligible shareholders and are also availableon the website of the company at https://vrnrvw.wipro.com/annual-reports/.
This is for your information and records.
For WIPRO LIMITED
(t-{q&q-oM Sanaulla KhanCompany Secretary
Registered Office:
Wipro LimltedDoddakannettiSarjapur Road
Bengaluru 560 035
lndia
T : +91 (80) 28440011F : +91 (80) 2844A054E : [email protected]
W: wipro.comC : L32102KA1945P1C020800

1
Dear Members,
Invitation to attend the Annual General Meeting on July 16, 2019
You are cordially invited to attend the Seventy Third Annual General Meeting of the Company to be held on Tuesday, July 16, 2019 at 4.00 P M at Wipro’s Campus, Cafeteria Hall EC-3, Ground Floor, Opposite Tower 8, No. 72, Keonics, Electronics City, Hosur Road, Bengaluru – 561 229, India.
The notice convening the Annual General Meeting is attached herewith.
Your Company will be providing transport facility at 2.00 pm from the specified destinations given below to reach the venue comfortably.
1. Corporation Circle Bus Stop, Towards Kasturba Road, Bengaluru.
2. Dr. Rajkumar Road at the entrance of RaghavendraTemple, Rajaji Nagar, Bengaluru.
3. Malleswaram, 18th Cross, Near Circle Maramma Temple, Bengaluru.
4. BDA Complex, Koramangala Main Road, Bengaluru.
5. Jayanagar 4th Block police station, Bengaluru (buses will be parked facing towards outer ring road).
Those who wish to avail this facility are requested to get confirmation to this effect at the following numbers: 080-28440011 (Extn: 226128, Extn: 228053, Extn: 226175) (Contact: Corporate Secretarial Team)
You may also send your request by email to [email protected], [email protected] or [email protected]. Your requests must reach us latest by July 13, 2019.
Yours truly,
Azim H PremjiExecutive ChairmanWipro Limited
Place: BengaluruDate: June 6, 2019
EC Fly Over
Toll To Hosur
SIL
K B
oard
Toll
NTTF
Fanuc
INFOSYS
BHEL
CDOT
BDA Complex
Gate 5
Gat
e 6
KFC
Lem
on T
ree
Hot
el3M
Gat
e 7
Gat
e 10
ROUTE MAP TO THE VENUE
Notice & Proxy Form 2019.indd 1 6/14/2019 7:52:10 PM

Wipro Limited2
Notice is hereby given that the Seventy Third Annual General Meeting of Wipro Limited will be held at Wipro’s Campus, Cafeteria Hall EC-3, Ground Floor, Opp. Tower 8, No. 72, Keonics Electronic City, Hosur Road, Bengaluru - 561 229, on Tuesday, July 16, 2019 at 4.00 pm to transact the following businesses:
ORDINARY BUSINESS
1. To receive, consider and adopt the Audited Financial Statements of the Company (including consolidated financial statements) for the financial year ended March 31, 2019, together with the Reports of the Directors and Auditors thereon.
2. To confirm the payment of Interim Dividend of `1 per equity share already paid during the year as the Final Dividend for the Financial Year 2018-19.
3. To consider appointment of a Director in place of Mr. Abidali Z Neemuchwala (DIN 02478060)
who retires by rotation and being eligible, offers himself for re-appointment.
SPECIAL BUSINESS
4. Amendments to the Articles of Association of the Company
To consider and, if thought fit, to pass the following resolution as a Special Resolution:
RESOLVED THAT pursuant to provisions of Section 14 and other applicable provisions, if any, of the Companies Act, 2013 read with rules made thereunder (including any statutory modifications or re-enactment thereof, for the time being force), the Members of the Company hereby approve the substitution of the existing Article 96 and Article 192 of the Articles of Association of the Company, with the amended Articles as below:
Article Existing Article Proposed Article
96- General Meeting
The Chairman of the Board (whether Member or not) shall if present and willing, be entitled to take the chair at every General Meeting, whether Annual or Extraordinary, but if there be no such Chairman or in case of his being present or being unwilling or failing to take the chair within fifteen minutes of the time appointed for holding such meeting, the members present shall choose another Director (whether Member or not) as Chairman and if all the Directors present decline to take the chair or if there be no Director present, then the members present shall choose one of their own members to be Chairman of the meeting.
The Chairman of the Board (whether Member or not) shall if present and willing, be entitled to take the chair at every General Meeting, whether Annual or Extraordinary, but if there be no such Chairman or in case of his being present or being unwilling or failing to take the chair within fifteen minutes of the time appointed for holding such meeting, the members present shall choose another Director (whether Member or not) as Chairman and if all the Directors present decline to take the chair or if there be no Director present, then the members present shall choose one of their own members to be Chairman of the meeting.
WIPRO LIMITED. Registered Office: Doddakannelli, Sarjapur Road, Bengaluru- 560 035, Telephone: +91-80-28440011, Fax: +91-80-28440054, Website: www.wipro.com, Email: [email protected], CIN: L32102KA1945PLC020800
NOTICE TO MEMBERS
Notice & Proxy Form 2019.indd 2 6/14/2019 7:52:10 PM

Wipro Limited 3
Article Existing Article Proposed Article
If a poll is demanded it shall be taken forthwith in accordance with the provisions of sub-section (2) of section 104. The Chairman elected on a show of hands shall exercise all the powers of the Chairman for the purpose of such poll. If some other person is elected Chairman as a result of such poll, he shall be the Chairman for the rest of the meeting.
The Chairman be permitted to hold the position of both the Chairman of the Board and/or General Meeting as well as Managing Director/CEO/equivalent position thereof in the Company as per the recommendations of the appropriate committee of the Directors and approved by the Board of Directors and as permitted by applicable laws from time to time.
If a poll is demanded, it shall be taken forthwith in accordance with the provisions of sub-section (2) of section 104. The Chairman elected on a show of hands shall exercise all the powers of the Chairman for the purpose of such poll. If some other person is elected Chairman as a result of such poll, he shall be the Chairman for the rest of the meeting.
192- Provisions to which Managing Director will be subject to
A Managing Director or Joint Managing Director subject to the provisions of Article 184 shall not while he continues to hold that office be subject to retirement by rotation and he shall not be taken into account in determining the rotation of retirement of Directors or the number of Directors to retire but he shall, subject to the terms of any contract between him and the Company, be subject to the same provisions as to resignation and removal as the Directors of the Company, and if he ceases to hold the office of Directors from any cause shall ipso facto and immediately cease to be Managing director.
Subject to the provisions of the Act and of these Articles, a Managing Director or a Whole Time Director shall, while he continues to hold that office, be subject to retirement by rotation as may be determined by the Board and Shareholders to the extent as may be required, under the Act or these Articles and he shall be taken into account in determining the rotation of Directors or the number of Directors to retire. He shall, subject to the terms of any contract between him and the Company, be subject to the same provisions as to resignation and removal as the other Directors of the Company, and if he ceases to hold the office of Director for any cause, he shall ipso facto immediately cease to be Managing Director.
RESOLVED FURTHER THAT the Board of Directors of the Company (including a Committee thereof), be and is hereby authorized to do all acts and take all such steps as may be necessary, proper or expedient to give effect to this resolution.
5. Appointment of Mr. Azim H Premji (DIN 00234280) as Non-Executive, Non-Independent Director of the Company
To consider and, if thought fit, to pass the following resolution as a Special Resolution:
RESOLVED THAT pursuant to the recommendation of the Board Governance, Nomination and Compensation Committee and approval of the Board of Directors of the Company, and in accordance with Section 152 and other applicable provisions, if any, of the Companies Act, 2013 and the Companies (Appointment and Qualification of Directors) Rules, 2014 (including any statutory modification(s) or re-enactment thereof for the time being in force) and in accordance with the applicable provisions
of the SEBI (Listing Obligations and Disclosure Requirements) Regulations, 2015 as amended, Mr. Azim H Premji (Director Identification Number 00234280), Chairman and Managing Director of the Company, whose period of office is liable to expire on July 30, 2019, and in respect of whom the Company has received a notice in writing from a Member proposing his candidature for the office of Director pursuant to Section 160 of the Companies Act, 2013, be and is hereby appointed as a Non–Executive, Non-Independent Director of the Company, for a period of five years with effect from July 31, 2019 to July 30, 2024, whose office shall be liable to retire by rotation, on the following terms and conditions, and conferred him with the title of Founder Chairman of the Company:
a) Remuneration as applicable to other Non-Executive Directors of the Company, in addition to the sitting fees for attending the meetings of the Board of Directors thereof, as may be determined by the Board of Directors of the
Notice & Proxy Form 2019.indd 3 6/14/2019 7:52:10 PM

Wipro Limited4
Company, provided however that the aggregate remuneration, including commission, paid to the Directors other than the Managing Director and Whole Time Directors in a financial year shall not exceed one percent of the net profits of the Company, in terms of Section 197 of the Companies Act, 2013 and computed in the manner referred to in Section 198 of the Companies Act, 2013.
b) Maintenance of Founder Chairman’s office including executive assistant at Company’s expense.
c) Reimbursement of travel, stay and entertainment expenses actually and properly incurred in the course of business as per the Company’s policy.
RESOLVED FURTHER THAT pursuant to Regulation 17(1A) of the SEBI (Listing Obligations and Disclosure Requirements) Regulations, 2015, approval of the Members be and is hereby accorded to the continuation of directorship of Mr. Azim H Premji (Director Identification Number 00234280) after he attains the age of 75 years, as a Non-Executive, Non-Independent Director of the Company, liable to retire by rotation.
RESOLVED FURTHER THAT the Board of Directors be and is hereby authorized to do all such acts, deeds and things and execute all such documents, instruments and writings as may be required and to delegate all or any of its powers herein conferred to any Committee of Directors or Director(s) to give effect to the aforesaid resolutions.
6. Re-appointment of Mr. Rishad A Premji (DIN 02983899) as Whole Time Director of the Company
To consider and, if thought fit, to pass the following resolution as an Ordinary Resolution:
RESOLVED THAT pursuant to the recommendation of the Board Governance, Nomination and Compensation Committee and approval of the Board of Directors of the Company, and in accordance with the provisions of Section 152, 196, 197, 198, 203 and other applicable provisions if any, of the Companies Act, 2013 and the Companies (Appointment and Remuneration of Managerial Personnel) Rules, 2014 (including any statutory modification or re-enactment thereof) read with Schedule V of the Companies Act, 2013, Mr. Rishad A Premji (Director Identification Number 02983899), Whole Time Director (designated as Executive Director and Chief Strategy Officer) of the Company whose period of office is liable to expire on April 30, 2020, and in respect of whom the Company has received a notice in writing from a Member proposing his candidature
for the office of Director pursuant to Section 160 of the Companies Act, 2013, be and is hereby re-appointed as Whole Time Director (designated as “Executive Chairman” by the Board of Directors) of the Company for a period of five years with effect from July 31, 2019 to July 30, 2024, not liable to retire by rotation, on the payment of remuneration and other terms and conditions as set out below:
Remuneration:
a) Fixed Salary: In the range of ` 4,50,00,000 (Rupees Four Crores Fifty Lakhs only) per annum to ` 9,00,00,000 (Rupees Nine Crores only) per annum. The fixed salary can be paid as basic salary and various allowances under Wipro Benefits Plans & Allowances which is a basket of various allowances/reimbursements, like Leave Travel Allowance, Commutation Allowance, House Rent Allowance, and Company leased car & accommodation, etc. which one can plan as per the Company policy. The Fixed salary also includes contribution to Provident Fund, Pension Fund, and Superannuation as per Company policy and Gratuity in accordance with the provisions of the Payment of Gratuity Act. For the purpose of Gratuity, Provident Fund, Superannuation and other like benefits, if any, the service of Mr. Rishad A Premji will be considered as continuous service from the date of his joining the Company.
b) Commission: The following commission will be calculated and payable every quarter on the quarterly net profits of the Company computed in accordance with the provisions of the Companies Act, 2013. The Commission payable on a quarterly basis shall be adjusted for the relative performance of the Company as per the method approved by the Board Governance, Nomination and Compensation Committee. The commission paid on a quarterly basis shall however be re-computed based on the net profits of the Company for the full year as under:
Period Commission
July 31, 2019 to July 30, 2024
0.35% of the incremental consolidated net profits of the Company
Other Perquisites and Benefits:
a) Furniture & Equipment Program: As per Company policy.
b) Corporate Club Fees: Fees of 2 identified clubs.
c) Personal Accident Insurance, Group Life Insurance: Personal accident cover and group life insurance cover is as per the Company policy.
Notice & Proxy Form 2019.indd 4 6/14/2019 7:52:11 PM

Wipro Limited 5
d) Medical: Reimbursement of self, spouse and dependent children up to maximum of one month’s basic pay as per the Company policy. In addition, he will be entitled to medical insurance and annual health check-up as per Company policy.
e) Leave with full pay and allowance: Leave with full pay and allowance as per Company’s policy.
f) Reimbursement of travel, stay and entertainment expenses actually and properly incurred in the course of business as per the Company’s policy.
g) Minimum remuneration: Notwithstanding anything to the contrary herein contained, where in any financial year during the tenure of the Executive Chairman, the Company has no profits, or its profits are inadequate, the Company will pay remuneration by way of salary including perquisites and allowance as specified under Section II of Part II of Schedule V to the Companies Act, 2013.
h) Sitting Fees: The Executive Chairman shall not be entitled to sitting fees for attending the meetings of the Board of Directors of the Company or committees thereof.
RESOLVED FURTHER THAT in view of the provisions contained in Regulation 17(1B) of the SEBI (Listing Obligations and Disclosure Requirements) Regulations, 2015, which currently are scheduled to come into effect from April 1, 2020 (“Listing Regulation Amendment”), and upon the Listing Regulation Amendment coming into effect, either on April 1, 2020 or later at such extended date as may be determined by SEBI, Mr. Rishad A Premji shall cease to perform any executive role in the Company and shall become a Non-Executive Director (designated as “Non-Executive Chairman” by the Board of Directors) of the Company, on a remuneration as applicable to other Non-Executive Directors of the Company, as may be determined by the Board of Directors of the Company from time to time, provided however that the aggregate remuneration, including commission, paid to the Directors other than the Managing Director and Whole Time Directors in a financial year shall not exceed one percent of the net profits of the Company, in terms of Section 197 of the Companies Act, 2013 and computed in the manner referred to in Section 198 of the Companies Act, 2013.
RESOLVED FURTHER THAT the Board of Directors be and is hereby authorized to alter and vary the terms and conditions of the appointment and/or remuneration based on the recommendation of the Board Governance, Nomination and Compensation
Committee subject to the same not exceeding the limits specified under Section 197 read with Schedule V of the Companies Act, 2013 (including any statutory modification(s) or re-enactment thereof for the time being in force).
RESOLVED FURTHER THAT the Board of Directors be and is hereby authorized to do all such acts, deeds and things and execute all such documents, instruments and writings as may be required and to delegate all or any of its powers herein conferred to any Committee of Directors or Director(s) to give effect to the aforesaid resolutions.
7. Designating and appointing Mr. Abidali Z Neemuchwala (DIN 02478060), Whole Time Director, as Managing Director of the Company
To consider and, if thought fit, to pass the following resolution as an Ordinary Resolution:
RESOLVED THAT pursuant to the recommendation of the Board Governance, Nomination and Compensation Committee and approval of the Board of Directors of the Company, and in accordance with the provisions of Section 196, 197, 203 and other applicable provisions if any, of the Companies Act, 2013 and the Companies (Appointment and Remuneration of Managerial Personnel) Rules, 2014 (including any statutory modification or re-enactment thereof) read with Schedule V of the Companies Act, 2013, and subject to the approval of the Central Government as may be required, Mr. Abidali Z Neemuchwala (Director Identification Number 02478060), Whole Time Director who was earlier designated as the Chief Executive Officer and Executive Director of the Company, and in respect of whom the Company has received a notice in writing from a Member proposing his candidature for the office of Director pursuant to Section 160 of the Companies Act, 2013, be and is hereby designated and appointed as Managing Director of the Company with effect from July 31, 2019 till the end of current tenure of his appointment i.e. January 31, 2021, liable to retire by rotation, in addition to his existing position as Chief Executive Officer of the Company, on the terms and conditions and on the remuneration payable with effect from July 31, 2019 as follows:
Remuneration:
a) Basic Pay: In the range of USD 85,000 per month to USD 125,000 per month.
b) Target Variable Pay: Mr. Abidali Z Neemuchwala will be eligible to receive target variable pay in the range of USD 75,000 per month to USD 120,000 per month. The variable pay program may be changed or modified in part or full from time to time, at the sole discretion of the Company.
Notice & Proxy Form 2019.indd 5 6/14/2019 7:52:11 PM

Wipro Limited6
c) Stock compensation: Grant of Restricted Stock units, Employee Stock Options and other stock based compensation as may be decided by the Board of Directors of the Company based on the recommendation of the Board Governance, Nomination and Compensation Committee from time to time and such other perquisites and allowances in accordance with the rules of the Company or as may be agreed to by the Board of Directors of the Company based on the recommendation of the Board Governance, Nomination and Compensation Committee, from time to time.
Other Perquisites and Benefits:
a) Personal Accident Insurance, Group Life Insurance: Personal accident insurance cover and Group life insurance cover is as per the Company policy.
b) Medical: Reimbursement of medical expenses for self, spouse and dependent children up to maximum of one month’s basic pay as per the Company policy. In addition, Mr. Abidali Z Neemuchwala will be entitled to medical insurance and annual health check-up as per Company policy.
c) Leave with full pay and allowance: Leave with full pay and allowance as per Company’s policy.
d) Reimbursement of travel, stay and entertainment expenses: Reimbursement of travel, stay and entertainment expenses actually and properly incurred in the course of business as per Company’s policy.
e) Minimum Remuneration: Notwithstanding anything to the contrary herein contained, where in any financial year during the tenure of the Chief Executive Officer and Managing Director, the Company has no profits, or its profits are inadequate, the Company will pay remuneration by way of salary including perquisites and allowance as specified under Section II of Part II of Schedule V to the Companies Act, 2013.
f) Separation: The appointment may be terminated by either party by giving notice to the other party of such termination or paying salary in lieu of notice period as mentioned below:
- If the agreement is terminated by the Chief Executive Officer and Managing Director, he is required to give prior written notice of six months to the Company or pay to the Company six months’ base pay in lieu of the notice.
- If the agreement is terminated by the Company, the Company is required to pay to the Chief Executive Officer and Managing Director severance pay equivalent of 12 months’ base pay.
g) The Chief Executive Officer and Managing Director shall not be entitled to sitting fees for attending the meetings of the Board of Directors of the Company or committees thereof.
h) All other terms and conditions of Mr. Abidali Z Neemuchwala’s original appointment shall remain unchanged.
RESOLVED FURTHER THAT the Board of Directors be and is hereby authorized to alter and vary the terms and conditions of the appointment and/or remuneration based on the recommendation of the Board Governance, Nomination and Compensation Committee subject to the same not exceeding the limits specified under Section 197 read with Schedule V of the Companies Act, 2013 (including any statutory modification(s) or re-enactment thereof for the time being in force).
RESOLVED FURTHER THAT the Board of Directors be and is hereby authorized to do all such acts, deeds and things and execute all such documents, instruments and writings as may be required and to delegate all or any of its powers herein conferred to any Committee of Directors or Director(s) to give effect to the aforesaid resolutions.
By Order of the Board of DirectorsFor Wipro Limited
Date: June 6, 2019 M Sanaulla KhanPlace: Bengaluru Company Secretary
Notes
1. A MEMBER ENTITLED TO ATTEND AND VOTE AT THE ANNUAL GENERAL MEETING IS ENTITLED TO APPOINT A PROXY TO ATTEND AND VOTE INSTEAD OF HIMSELF/HERSELF, AND THAT A PROXY NEED NOT BE A MEMBER OF THE COMPANY. PROXIES TO BE EFFECTIVE MUST BE RECEIVED BY THE COMPANY NOT LESS THAN 48 HOURS BEFORE THE COMMENCEMENT OF THE MEETING. A PERSON CAN ACT AS A PROXY ON BEHALF OF MEMBERS NOT EXCEEDING FIFTY AND HOLDING IN AGGREGATE NOT MORE THAN TEN PERCENT OF THE TOTAL SHARE CAPITAL OF THE COMPANY. A MEMBER HOLDING MORE THAN TEN PERCENT OF THE TOTAL SHARE CAPITAL OF THE COMPANY CARRYING VOTING RIGHTS MAY APPOINT A SINGLE PERSON AS PROXY, PROVIDED THAT THE PERSON DOES NOT ACT AS PROXY FOR ANY OTHER MEMBER.
Notice & Proxy Form 2019.indd 6 6/14/2019 7:52:11 PM
Wipro Limited 7
2. Corporate Members intending to send their authorized representatives to attend the meeting are requested to send to the Company a certified copy of the Board resolution authorizing their representative to attend and vote on their behalf at the meeting.
3. Only bonafide Members of the Company whose names appear on the Register of Members/Proxy holders, in possession of valid attendance slips duly filled and signed will be permitted to attend the meeting. The Company reserves its right to take all steps as may be deemed necessary to restrict non-members from attending the meeting.
4. In order to enable us to register your attendance at the venue of the Annual General Meeting (AGM), we request you to please bring your folio number/demat account number/DP ID-Client ID to enable us to give you a duly filled attendance slip for your signature and participation at the meeting.
5. In case of joint holders attending the meeting, only such joint holder who is higher in the order of names will be entitled to vote.
6. Members who hold equity shares in the dematerialized form and want to provide/change/correct the bank account details should send the same immediately to their concerned Depository Participant and not to the Company. Members are also requested to give the MICR Code of their bank to their Depository Participants. The Company will not entertain any direct request from Members for change of address, transposition of names, deletion of name of deceased joint holder and change in the bank account details. While making payment of Dividend, the Registrar and Share Transfer Agent is obliged to use only the data provided by the Depositories, in case of equity shares held in dematerialised form.
7. In accordance with the proviso to Regulation 40(1) of the SEBI (Listing Obligations and Disclosure Requirements) Regulations, 2015, effective from April 1, 2019, transfers of shares of the Company shall not be processed unless the shares are held in the dematerialized form with a depository. Accordingly, shareholders holding equity shares in physical form are urged to have their shares dematerialized so as to be able to freely transfer them and participate in various corporate actions.
8. Members who are holding equity shares in physical form are advised to submit particulars of their bank account, viz. name and address of the branch of the bank, MICR code of the branch, type of account and account number to our Registrar and Share Transfer Agent, Karvy Fintech Private Limited, Karvy Selenium Tower B, 31-32, Unit: Wipro Limited, Financial District, Nanakramguda, Gachibowli, Hyderabad- 500 032.
9. Non-resident Indian shareholders are requested to inform about the following immediately to the Company or its Registrar and Share Transfer Agent or the concerned Depository Participant, as the case may be:
a) change in the residential status on return to India for permanent settlement.
b) particulars of the NRE account with a Bank in India, if not furnished earlier.
10. The certificate from the Statutory Auditors relating to the Company’s Stock Options/Restricted Stock Units Plans under SEBI (Share Based Employee Benefits) Regulations, 2014 will be available for inspection at the 73rd AGM.
11. Members are requested to note that the dividend remaining unclaimed for a continuous period of seven years from the date of transfer to the Company’s Unpaid Dividend Account shall be transferred to the Investor Education and Protection Fund (IEPF). In addition, all equity shares in respect of which dividend has not been paid or claimed for seven consecutive years or more shall be transferred by the Company to demat account of the IEPF authority within a period of thirty days of such equity shares becoming due to be transferred to the IEPF.
In the event of transfer of equity shares and the unclaimed dividends to IEPF, Members are entitled to claim the same from IEPF authority by submitting an online application in the prescribed Form IEPF-5 available on the website www.iepf.gov.in and sending a physical copy of the same duly signed to the Company along with the requisite documents enumerated in Form IEPF-5. Members can file only one consolidated claim in a financial year as per the IEPF rules.
12. Pursuant to Rule 5(8) of Investor Education and Protection Authority (Accounting, Audit, Transfer and Refund) Rules, 2016, the Company has uploaded details of unpaid and unclaimed amounts lying with the Company as on July 19, 2018 (date of last AGM) on its website at www.wipro.com/unpaid-dividend and also on the website of the Ministry of Corporate Affairs.
13. The Registers under the Companies Act, 2013 will be available for inspection at the registered office of the Company during business hours between 11.00 am to 1.00 pm except on holidays. The said Registers will also be available for inspection by the Members at the 73rd AGM.
14. The notice of the 73rd AGM along with the Annual Report 2018-19 is being sent by electronic mode to those Members whose e-mail addresses are registered with the Depositories, unless any Member
Notice & Proxy Form 2019.indd 7 6/14/2019 7:52:11 PM

Wipro Limited8
has requested for a physical copy of the same. For Members who have not registered their e-mail addresses, physical copies are being sent by the permitted mode. Members may please note that this Notice and Annual Report 2018-19 will also be available on the Company’s website www.wipro.com.
Members who have not registered their e-mail address with the Company are requested to submit their valid e-mail address to Karvy Fintech Private Limited. Members holding equity shares in demat form are requested to register/update their e-mail address with their Depository Participant(s) directly.
15. A statement pursuant to Section 102(1) of the Companies Act, 2013 relating to certain ordinary business and the special businesses to be transacted at the 73rd AGM is annexed hereto. All documents referred to in the accompanying Notice and the Explanatory Statement shall be open for inspection at the registered office of the Company during business hours except on holidays, up to and including the date of the AGM.
16. The Company has provided a facility to Members to exercise their right to vote by electronic means. A separate e-voting instructions slip has been sent explaining the process of e-voting with necessary user id and password along with procedure for such e-voting. Such remote e-voting facility is in addition to voting that may take place at the meeting venue on July 16, 2019.
17. The Company has appointed Mr. V Sreedharan, Partner, V. Sreedharan and Associates, Practicing Company Secretaries, to act as the Scrutinizer, to scrutinize the e-voting process in a fair and transparent manner.
18. The facility for voting shall be made available at the venue of the AGM and the Members attending the meeting who have not already cast their vote by remote e-voting shall be able to exercise their right to vote at the AGM. The Members who have cast their vote by remote e-voting prior to the AGM may also attend the AGM but shall not be entitled to cast their vote again.
19. Pursuant to Regulation 44(6) of the SEBI (Listing Obligations and Disclosure Requirements) Regulations, 2015, the proceedings of the 73rd AGM will be web-casted live for all the shareholders as on the cut-off date i.e. Tuesday, July 9, 2019. The shareholders can visit https://corpreg.karvy.com/agmlive/liveevents.aspx and login through existing user id and password to watch the live proceedings of the 73rd AGM on July 16, 2019 from 4:00 PM onwards.
20. The details of the Directors seeking appointment/re-appointment at the 73rd AGM are provided at Annexure A to this Notice. The Company has received the requisite consents/declarations for the appointment/re-appointment under the Companies Act, 2013 and the rules made thereunder.
21. In case of any queries regarding the Annual Report, Members may write to [email protected] to receive an email response. Members desiring any information relating to the financial statements at the meeting are requested to write to us at least ten (10) days before the meeting to enable us to keep the information ready.
EXPLANATORY STATEMENT PURSUANT TO SECTION 102 OF THE COMPANIES ACT, 2013The following statement sets out all material facts relating to certain ordinary business and the special businesses mentioned in the accompanying Notice:
Item No. 3Though not statutorily required, the following is being provided as an additional information to the Members.
Pursuant to the provisions of Section 152 and applicable provisions of the Companies Act, 2013 and the Company’s Articles of Association, not less than two-thirds of total number of Directors of the Company shall be liable to retire by rotation. One third of these Directors must retire from office at each AGM, but each retiring director is eligible for re-election at such meeting. Independent directors are not subject to retirement by rotation.
In July 2018, Mr. Rishad A Premji was subject to retirement by rotation and was re-appointed by Members at the 72nd AGM. Accordingly, Mr. Abidali Z Neemuchwala is required to retire by rotation at this AGM and being eligible, has offered himself for re-appointment.
Except Mr. Abidali Z Neemuchwala or his relatives, none of the Directors and Key Managerial Personnel of the Company or their relatives are concerned or interested financially or otherwise, in the resolutions set out at Item No. 3.
Considering Mr. Abidali Z Neemuchwala’s skills, competencies, expertise and experience, the Board of Directors recommends the resolution at Item No. 3 for approval of the Members by way of an Ordinary Resolution.
Additional information in respect of Mr. Abidali Z Neemuchwala, pursuant to Regulation 36 of SEBI (Listing Obligations and Disclosure Requirements) Regulations, 2015 and the Secretarial Standard on General Meetings (SS-2), is given at Annexure A to this Notice.
Item No. 4The Members of the Company at the AGM held on July 23, 2014, approved adoption of new Articles of Association of the Company under the Companies Act, 2013, to align it with the provisions of Companies Act, 2013 including rules framed thereunder.
Notice & Proxy Form 2019.indd 8 6/14/2019 7:52:11 PM

Wipro Limited 9
It is now proposed to amend the existing Article 96 and Article 192 of Articles of Association of the Company to align it with requirements under Regulation 17(1B) of the SEBI (Listing Obligations and Disclosure Requirements) Regulations, 2015, whereby the top 500 listed companies are required to ensure separation of role of Chairman with that of Managing Director or Chief Executive Officer (CEO) with effect from April 1, 2020. Accordingly, Article 96 of Company’s existing Articles of Association, which permits the Chairman to hold the position of both the Chairman of the Board as well as Managing Director/CEO/equivalent position, is proposed to be amended.
Further, keeping in view of the proposed changes to the Executive Board membership structure of the Company and to align with the requirements to determine the Board of Directors who are required to retire by rotation in terms of Section 152(6) of the Companies Act, 2013 and Article 158 of the Articles of Association of the Company, it is proposed to amend Article 192 of the Articles of the Association of the Company to provide that the Managing Director is subject to retirement by rotation.
Copy of the Articles of Association of the Company with proposed amendments as above, is available for inspection by Members at the Registered Office of the Company during business hours from the date of this Notice till the date of the 73rd AGM.
None of the Directors and Key Managerial Personnel of the Company and their relatives are concerned or interested, financially or otherwise, in the resolution set out at Item No. 4.
The Board of Directors recommends the resolution in relation to amendments to the Articles of Association of the Company as set out in Item No. 4 for approval of the Members by way of a Special Resolution.
Item No. 5
The Members of the Company at the AGM held on July 19, 2017 had approved the re-appointment of Mr. Azim H Premji as Executive Chairman and Managing Director (designated as “Executive Chairman”), not liable to retire by rotation, for a period of two years with effect from July 31, 2017. Accordingly, Mr. Azim H Premji will complete his present term on July 30, 2019.
After having spent 53 exhilarating years in executive role at the Company, Mr. Azim H Premji feels that it is time for the next generation to take over. In March 2019, Mr. Azim H Premji increased his commitment to philanthropy, by irrevocably renouncing more of his personal assets and earmarking them to the endowment, which supports Azim Premji Foundation’s philanthropic activities. Mr. Azim H Premji has done this by additionally earmarking all economic benefits for philanthropic purposes, in approximately 34% of the shares in the Company (approx. value USD 7.5 Billion), held by certain entities controlled by him. This action was in addition to his earlier donations to philanthropy, which included Wipro’s shares as well as other assets owned by him. With this action, the total
value of the philanthropic endowment corpus contributed by Mr. Azim H Premji was USD 21 billion, which includes 67% of economic ownership of the Company. This requires Mr. Azim H Premji to spend substantially more time at the Foundation and play a more active role in other Philanthropy Initiatives. Mr. Azim H Premji has expressed his intention not to seek re-appointment as Executive Chairman and Managing Director when the renewal comes up in July 2019. Accordingly, Mr. Azim H Premji will retire from his current position as Executive Chairman and Managing Director effective July 30, 2019.
The Board of Directors of the Company places on record on the occasion of this 73rd AGM, the immense contribution of Mr. Azim H Premji to the transformation of Wipro under his leadership over the years.
Accordingly, the Board of Directors at its meeting held on June 6, 2019, on the recommendation of the Board Governance, Nomination and Compensation Committee, and subject to approval of Members of the Company, approved the appointment of Mr. Azim H Premji as a Non-Executive Non Independent Director of the Company for a period of five years with effect from July 31, 2019 on such remuneration as set out in the Resolution and conferred him with the title of Founder Chairman.
The role played by the Founder Chairman will be that of a mentor and advisor to the Company and will not include the powers and role of a Chairman under the applicable law and Articles of Association of the Company.
Keeping in view Mr. Azim H Premji’s rich and varied experience in the Industry, his involvement in the operations of the Company over a long period of time, and his pioneering role in guiding the Company through five decades of diversification and growth to emerge as a world leader in the Software industry, the Board of Directors is of the opinion that it would be in the interest of the Company to appoint him as a Non-Executive Non Independent Director of the Company for a period of five years with effect from July 31, 2019.
As per Regulation 17(1A) of the SEBI (Listing Obligations and Disclosure Requirements) Regulations, 2015, with effect from April 1, 2019, no listed company shall appoint or continue the directorship of a non-executive director who has attained the age of 75 years, unless a special resolution is passed to that effect and justification thereof is indicated in the explanatory statement annexed to the notice for such appointment. Considering that during the course of term of appointment of Mr. Azim H Premji, he will be attaining the age of 75 years, it is necessary to approve continuation of his directorship on the Board of Directors of the Company by way of a special resolution.
Additional information in respect of Mr. Azim H Premji, pursuant to Regulation 36 the SEBI (Listing Obligations and Disclosure Requirements) Regulations, 2015 and the Secretarial Standard on General Meetings (SS-2), is given at Annexure A to this Notice. Brief profile of Mr. Azim H Premji is given at Annexure B to this Notice.
Notice & Proxy Form 2019.indd 9 6/14/2019 7:52:11 PM

Wipro Limited10
Except Mr. Azim H Premji and Mr. Rishad A Premji or their relatives, none of the Directors and Key Managerial Personnel of the Company and their relatives are concerned or interested, financially or otherwise, in the resolution set out at Item No. 5.
The Board of Directors recommends the resolution in relation to the appointment of Mr. Azim H Premji as Non-Executive Non-Independent Director of the Company as set out in Item No. 5 for approval of the Members by way of a Special Resolution.
Item No. 6
The Members of the Company at the AGM of the Company held on July 22, 2015 had approved appointment of Mr. Rishad A Premji as Whole Time Director designated as Executive Director and Chief Strategy Officer for a period of five years with effect from May 1, 2015.
As part of the succession planning and re-composition of the Executive Board membership structure of the Company, the Board of Directors of the Company at the meeting held on June 6, 2019, on the recommendation of the Board Governance, Nomination and Compensation Committee and subject to the approval of the Members of the Company, approved re-appointment of Mr. Rishad A Premji as Whole Time Director (designated as “Executive Chairman” by the Board of Directors) of the Company for a period of five years, i.e., from July 31, 2019 to July 30, 2024, on such remuneration as set out in the resolution. Mr. Rishad A Premji shall not be liable to retire by rotation. Mr. Rishad A Premji has spent 12 years with the Company and the Board of Directors is of the view that he has built credibility with investors/customers and employees and will be able to find the right balance between ownership and management.
As per the amendment to Regulation 17(1B) of the SEBI (Listing Obligations and Disclosure Requirements) Regulations, 2015, made on May 9, 2018, the top 500 listed companies are mandated to ensure that the Chairman is a non-executive director and is not related to the Managing Director or CEO as per the definition of the term “relative” defined under the Companies Act, 2013, and such amendment is scheduled to come into effect from April 1, 2020 (“Listing Regulation Amendment”). Accordingly, upon the Listing Regulation Amendment coming into effect, either on April 1, 2020 or later at such extended date as may be determined by SEBI, Mr. Rishad A Premji will cease to perform any executive roles in the Company and will continue in the capacity of a Non-Executive Director (designated as “Non-Executive Chairman” by the Board of Directors) of the Company, such that the Company remains compliant with the Listing regulations in force at all times.
Additional information in respect of Mr. Rishad A Premji, pursuant to Regulation 36 the SEBI (Listing Obligations and Disclosure Requirements) Regulations, 2015 and the Secretarial Standard on General Meetings (SS-2), is given at Annexure A to this Notice. Brief profile of Mr. Rishad A Premji is given at Annexure B to this Notice.
Except Mr. Rishad A Premji and Mr. Azim H Premji or their relatives, none of the Directors and Key Managerial Personnel of the Company and their relatives are concerned or interested, financially or otherwise, in the resolution set out at Item No. 6.
The Board of Directors recommends the resolution in relation to the re-appointment of Mr. Rishad A Premji, as Whole Time Director of the Company as set out in Item No. 6 for approval of the Members by way of an Ordinary Resolution.
Item No. 7
The Members of the Company at the AGM of the Company held on July 19, 2016 had approved appointment of Mr. Abidali Z Neemuchwala, as Whole Time Director designated as Chief Executive Officer and Executive Director of the Company for a period of five years with effect from February 1, 2016.
To align with the proposed re-composition of the Executive Board membership structure of the Company, and in view of the powers and functions of Mr. Abidali Z Neemuchwala, the Board of Directors of the Company at the meeting held on June 6, 2019, on the recommendation of the Board Governance, Nomination and Compensation Committee and subject to the approval of the Members of the Company, approved designating and appointing Mr. Abidali Z Neemuchwala, Whole Time Director, as Managing Director of the Company with effect from July 31, 2019 till the end of current tenure of his appointment i.e. January 31, 2021, liable to retire by rotation, on such remuneration as set out in the resolution. Mr. Abidali Z Neemuchwala will also continue in his current capacity as Chief Executive Officer of the Company.
Additional information in respect of Mr. Abidali Z Neemuchwala, pursuant to Regulation 36 of SEBI (Listing Obligations and Disclosure Requirements) Regulations, 2015 and the Secretarial Standard on General Meetings (SS-2), is given at Annexure A to this Notice. Brief profile of Mr. Abidali Z Neemuchwala is given at Annexure B to this Notice.
Except Mr. Abidali Z Neemuchwala or his relatives, none of the Directors and Key Managerial Personnel of the Company and their relatives are concerned or interested, financially or otherwise, in the resolution set out at Item No. 7.
The Board of Directors recommends the resolution in relation to designating and appointing Mr. Abidali Z Neemuchwala as Managing Director of the Company, in addition to his existing position as Chief Executive Officer of the Company, as set out in Item No. 7 for approval of the Members by way of an Ordinary Resolution.
By Order of the Board of DirectorsFor Wipro Limited
Date: June 6, 2019 M Sanaulla KhanPlace: Bengaluru Company Secretary
Notice & Proxy Form 2019.indd 10 6/14/2019 7:52:12 PM

Wipro Limited 11
Annexure-A
Details of Directors seeking appointment/re-appointment at the at the 73rd Annual General Meeting to be held on July 16, 2019
[Pursuant to Regulation 36(3) of the SEBI (Listing Obligations and Disclosure Requirements) Regulations, 2015]
Name of the Director Mr. Azim H Premji Mr. Rishad A Premji Mr. Abidali Z Neemuchwala
Date of Birth July 24, 1945 January 9, 1977 December 8, 1967
Age 73 years 42 years 51 years
Date of Appointment September 1, 1968 May 1, 2015 February 1, 2016
Relationship with Directors and Key Managerial Personnel
Relative (Father) ofMr. Rishad Azim Premji
Relative (Son) ofMr. Azim H Premji
None
Expertise in specific functional area* Wide managerial experience
Economics, Finance and wide managerial experience
Technology, Sales, Operations and Consulting
Qualification(s) G r a d u a t e D e g r e e i n Electrical Engineering from Stanford University.
MBA from Harvard Business School and BA in Economics from Wesleyan University.
Master’s Degree in Industrial Management from Indian Institute of Technology - Mumbai, and Bachelor’s Degree in Electronics and Communication from National Institute of Technology, Raipur.
Board Membership of other listed Companies as on March 31, 2019
- - -
Chairmanships/Memberships of the Committees of other public limited companies as on March 31, 2019
a. Audit Committee - - -
b. Stakeholders Relationship Committee
- - -
c. B o a r d G o v e r n a n c e a n d Nomination Committee
- - -
d. CSR Committee - - -
e. Other Committee(s) - - -
Number of equity shares held in the Company as on March 31, 2019
254,451,816@ 1,831,109# 426,666^
* For additional details on skills, expertise, knowledge and competencies of Directors, please refer Corporate Governance Report forming part of the Annual Report.
@ Includes shares held jointly by Mr. Azim H Premji and members of his immediate family.# Shares are held by Mr. Rishad A Premji jointly with his relatives and included in shareholding of Mr. Azim H Premji.^ Represents ADSs having equivalent underlying equity shares.Notes: 1. The Directorship, Committee Memberships and Chairmanships do not include positions in foreign companies, unlisted
companies and private companies, position as an advisory board member and position in companies under Section 8 of the Companies Act, 2013.
2. Information pertaining to remuneration paid to the Directors who are being appointed/re-appointed and the number of Board Meetings attended by them during the year 2018-19 have been provided in the Corporate Governance Report forming part of the Annual Report.
Notice & Proxy Form 2019.indd 11 6/14/2019 7:52:12 PM

Wipro Limited12
Annexure-BBrief profile of Directors seeking appointment/re-appointment at the
73rd Annual General Meeting to be held on July 16, 2019
Azim H Premji: Azim H Premji has been at helm of Wipro since the late 1960s, turning what was then a small cooking fat company into a $8.5 billion revenue group with businesses in IT, Consulting and Business Process Services with a presence in over 50 countries. Mr. Premji is a member of our Board’s Strategy Committee. Mr. Premji also serves as Non-Executive Chairman of Wipro Enterprises (P) Limited and is a director of Wipro GE Healthcare Private Limited and in other entities of the promoter group. Mr. Premji has established the Azim Premji Foundation and its related entities, which do extensive philanthropic work in India. The work spans from deep-on-the-ground efforts focused on improving public school education, working directly in seven states of India which have over 350,000 schools, to running the not-for-profit Azim Premji University, which is focused on programs in education and related fields of human development, and providing support through multi-year financial grants to other not-for-profit organizations working in specific areas such as reduction of child stunting, improvement of local governance and alleviation of the conditions of the most vulnerable groups. Over the years, Mr. Premji has received numerous honors and accolades, which he considers as recognitions for the Wipro team. Mr. Premji is the first Indian recipient of the Faraday Medal. The Republic of France bestowed upon him the highest French civilian distinction, the Chevalier de la Legion d’Honneur (Knight of the Legion of Honor) in November 2018. In January 2011, he was conferred with Padma Vibhushan, the second highest civilian award in India. The Carnegie Medal of Philanthropy was bestowed on him in 2017. Business Today and Ernst & Young conferred Mr. Premji with a Lifetime Achievement Award in 2018. Mr. Premji has been listed as one of the most influential people in the world by several global publications including Time, Financial Times, Forbes and Fortune. Business Week listed him among the top 30 entrepreneurs in world history. Mr. Premji has a graduate degree in Electrical Engineering from Stanford University. Mr. Premji is the father of Mr. Rishad A Premji.Rishad A Premji: Rishad A Premji has been a member of our Board since May 2015. He also serves as a member on our Strategy Committee and Administrative and Shareholders/Investors Grievance Committee. As the Chief Strategy Officer, he is responsible for shaping the Company’s strategy to drive sustained and profitable growth. In his role, Mr. Premji is also responsible for Investor Relations and all Government relations activities of the Company. As the Chief Strategy Officer, he has led Wipro’s M&A Strategy and conceptualized Wipro Ventures, a $100 million fund to invest in start-ups developing technologies and solutions that will complement Wipro’s businesses with next-generation services and products.Mr. Premji was the Chairman of the National Association of Software and Services Companies (NASSCOM) for financial year 2018-19. Mr. Premji is on the Board of Wipro Enterprises (P) Limited, a leading player in FMCG & Infrastructure Engineering and Wipro-GE, a joint venture between Wipro Enterprises (P) Limited and
General Electric in the healthcare domain. Separately, he is on the Boards of the Azim Premji Foundation, one of the largest not-for-profit initiatives in India, and Azim Premji Philanthropic Initiatives, which provides grants to organizations that contribute to social change. Prior to joining Wipro in 2007, Mr. Premji was with Bain & Company in London, working on assignments across Consumer Products, Automobiles, Telecom and Insurance. He also worked with GE Capital in the United States across businesses in the Insurance and Consumer Lending space and is a graduate of GE’s Financial Management Program. Mr. Premji has an MBA from Harvard Business School and a BA in Economics from Wesleyan University. In 2014, he was recognized as a Young Global Leader by the World Economic Forum for his outstanding leadership, professional accomplishments, and commitment to society. Mr. Rishad A Premji is the son of Mr. Azim H Premji.Abidali Z Neemuchwala: Abidali Z Neemuchwala is our Chief Executive Officer and Member of the Company’s Board of Directors. He has served in this role since February 1, 2016. He also serves as a member on our Strategy Committee. Previously, he served as Group President and Chief Operating Officer of the Company with effect from April 1, 2015. Mr. Neemuchwala drives Wipro’s vision through a strong belief that technology can drive consumer aspirations into instant reality. This drive, he believes, establishes a consumer-first world where business and technology converge into an era of mass personalization, data fluency, real time intelligence and seamlessly integrated experiences. He is an advocate of change and believes simplification of processes, belief in people and customer centricity are the keys to success.To realize this vision within the Company, Mr. Neemuchwala has spearheaded a transformative strategy across Wipro to make it a services company of the future enabling clients modernize their core and drive their future by creating an innovative, agile and client execution focused organization that is eager and ready to meet the challenges of tomorrow.Mr. Neemuchwala has spent 27 years in the industry and Mr. Neemuchwala’s career includes a 23-year tenure in Tata Consultancy Services. Mr. Neemuchwala has played roles in the industry through its multiple evolutions, now leading the digital transformation, where he handled multiple executive roles across business, technology, sales, operations and consulting. Mr. Neemuchwala has been recognized with multiple industry awards and sits on boards of industry and community forums such as the World Affairs Council of Dallas Fort Worth. He has been recently appointed on the Board of Texas Economic Development Corporation and is also a member of its CEO Council. He is very passionate about community service and champions diversity and inclusion in the workplace. Mr. Neemuchwala has a master’s Degree in Industrial Management from the Indian Institute of Technology, Mumbai, and a bachelor’s Degree in Electronics and Communication from the National Institute of Technology, Raipur.
Notice & Proxy Form 2019.indd 12 6/14/2019 7:52:12 PM

WIPRO LIMITED. Registered Office: Doddakannelli, Sarjapur Road, Bengaluru - 560 035, Telephone : +91-80-28440011, Fax No.+91-80-28440054, Website : www.wipro.com, Email: [email protected], CIN: L32102KA1945PLC020800
ATTENDANCE SLIP
Venue of the meeting : Wipro’s campus, Cafeteria Hall EC-3, Ground Floor, Opp. Tower 8, No. 72, Keonics Electronics City, Hosur Road, Bengaluru - 561229
Day, Date & Time : Tuesday, July 16, 2019 at 4:00 pm
PLEASE FILL ATTENDANCE SLIP AND HAND IT OVER AT THE ENTRANCE OF THE MEETING VENUE
Name of Member(s)
Registered Address
Email ID
DP ID*
Client ID*
Folio No.
No. of shares held
* Applicable for investors holding shares in Electronic form.
I certify that I am the registered shareholder(s)/proxy for the registered shareholder of the Company.
I hereby record my presence at the 73rd Annual General meeting of the Company on Tuesday, July 16, 2019 at 4.00 pm at Wipro’s campus, Cafetaria Hall EC-3, Ground Floor, Opp. Tower 8, No.72, Keonics Electronics City, Hosur Road, Bengaluru - 561229.
_________________________Signature of Member/Proxy
PROCEDURE AND INSTRUCTIONS FOR WEB CHECK-IN/ATTENDANCE REGISTRATION
Web Check-in/Attendance Registration: Members are requested to tender their attendance slip at the registration counters at the venue of the Annual General Meeting (AGM) and seek registration before entering the meeting hall. Alternatively, to facilitate hassle free and quick registration/entry at the venue of the AGM, the Company has provided a Web-Check in facility through Karvy’s website. Web Check-in on Karvy’s website enables the members to register attendance online in advance and generate attendance slip without going through the registration formalities at the registration counters.
Procedure of Web Check-in is as under:
a. Log on to https://karisma.karvy.com and click on https://agm.karvy.com/webcheckin/WebReg.aspx
b. Select Wipro Limited.
Notice & Proxy Form 2019.indd 13 6/14/2019 7:52:12 PM

Notice & Proxy Form 2019.indd 14 6/14/2019 7:52:12 PM

FORM OF PROXYForm MGT-11
Pursuant to Section 105(6) of the Companies Act, 2013 and Rule 19(3) of the Companies (Management and Administration) Rules, 2014
Venue of the meeting : Wipro’s campus, Cafeteria Hall EC-3, Ground Floor, Opp. Tower 8, No.72, Keonics Electronics City, Hosur Road, Bengaluru - 561229Day, Date & Time : Tuesday, July 16, 2019 at 4:00 PM
PLEASE FILL ATTENDANCE SLIP AND HAND IT OVER AT THE ENTRANCE OF THE MEETING VENUE
Name of Member(s)
Registered Address
Email ID
DP ID*/Folio No.
Client ID*
* Applicable for investors holding shares in Electronic form.
I/We _____________________________________________ of ____________________________________ being the member/members of Wipro Limited hereby appoint the following as my/our Proxy to attend and vote on a poll (for me/us and on my/our behalf at the 73rd Annual General Meeting of the Company, to be held on Tuesday, July 16, 2019 at 4:00 pm and at any adjournment thereof) in respect of such resolutions as are indicated below;
1. Name ___________________________________ Registered address ___________________________________
Email id ___________________________________ Signature ___________________________________
or failing him/her
2. Name ___________________________________ Registered address ___________________________________
Email id ___________________________________ Signature ___________________________________
or failing him/her
3. Name ___________________________________ Registered address ___________________________________
Email id ___________________________________ Signature ___________________________________
** I/We direct my/our Proxy to vote on the Resolutions in the manner as indicated below:
Sl. No.
Resolution Number of shares held
For Against
Ordinary Business1. To receive, consider and adopt the Audited Financial Statements of the Company (including consolidated
financial statements) of the Company for the financial year ended March 31, 2019, together with the Reports of the Directors and Auditors thereon.
2. To confirm the payment of Interim Dividend of `1 per equity share already paid during the year as the Final Dividend for the Financial Year 2018-19.
3. To consider appointment of a Director in place of Mr. Abidali Z Neemuchwala (DIN 02478060) who retires by rotation and being eligible, offers himself for re-appointment.
Special Business4. Amendments to the Articles of Association of the Company5. Appointment of Mr. Azim H Premji (DIN 00234280) as Non-Executive, Non-Independent Director of the
Company6. Re-appointment of Mr. Rishad A Premji (DIN 02983899) as Whole Time Director of the Company7. Designating and appointing Mr. Abidali Z Neemuchwala (DIN 02478060), Whole Time Director, as Managing
Director of the Company
This is optional. Please put a tick mark (√) in the appropriate column against the resolutions indicated in the box. If a Member leaves the “For” or “Against” column blank against any or all the Resolutions, the proxy will be entitled to vote in the manner he/she thinks appropriate. If a Member wishes to abstain from voting on a particular resolution, he/she should write “Abstain” across the boxes against the Resolution.
Signature (s) of Member(s)
1. _____________________________ 2. _____________________________ 3. _____________________________
Signed this ---------------- day of ------------------2019.
Notes:
1. The Proxy to be effective should be deposited at the Registered office oft he company not less than FORTY EIGHT HOURS before the commencement of the Meeting. A Proxy need not be a Member of the Company.
2. In the case of joint holders, the vote of the senior who tenders a vote, whether in person or by proxy, shall be accepted to the exclusion of the vote of the other joint holders. Seniority shall be determined by the order in which the names stand in the Register of Members.
3. A member may vote either for or against each resolution.
WIPRO LIMITED. Registered Office: Doddakannelli, Sarjapur Road, Bengaluru - 560 035, Telephone : +91-80-28440011, Fax No.+91-80-28440054, Website : www.wipro.com, Email: [email protected], CIN: L32102KA1945PLC020800
Affix oneRupee
RevenueStamp
Notice & Proxy Form 2019.indd 15 6/14/2019 7:52:13 PM

PROCEDURE AND INSTRUCTIONS FOR e-VOTING:
I. Remote e-voting: In compliance with the provisions of Section 108 of the Companies Act, 2013, read with Rule 20 of the Companies (Management and
Administration) Rules, 2014, as amended and the provisions of Regulation 44 of the Securities and Exchange Board of India (Listing Obligations and Disclosure
Requirements) Regulations, 2015, the Members are provided with the facility to cast their vote electronically, through the e-voting services provided by Karvy Fintech
Private Limited (Karvy) on all resolutions set forth in this Notice, from a place other than the venue of the Meeting (remote e-voting).
(A) In case a Member receives an email from Karvy [for Members whose email IDs are registered with the Company/Depository Participants(s)], please follow the below
instructions:
i. Launch internet browser by typing the URL: https://evoting.karvy.com.
ii. Enter the login credentials (i.e. User ID and password). In case of physical folio, User ID will be EVEN (E-Voting Event Number) 4593 followed by folio number. In
case of Demat account, User ID will be your DP ID and Client ID. However, if you are already registered with Karvy for e-voting, you can use your existing User ID
and password for casting your vote.
iii. After entering these details appropriately, click on "LOGIN".
iv. You will now reach password change menu wherein you are required to mandatorily change your password.The new password shall comprise of minimum 8 characters
with at least one upper case (A-Z), one lower case (a-z), one numeric value (0-9) and a special character (@,#,$, etc). The system will prompt you to change your
password and update your contact details like mobile number, email ID etc, on first login. It is strongly recommended that you do not share your password with any
other person and that you take utmost care to keep your password confidential.
v. You need to login again with the new credentials.
vi. On successful login, the system will prompt you to select the "EVENT" and click on 'Wipro Limited'.
vii. On the voting page, enter the number of shares (which represents the number of votes) as on the Cut-off Date (Tuesday, July 9, 2019) under "FOR/AGAINST" or
alternatively, you may partially enter any number "FOR" and partially "AGAINST" but the total number in "FOR/AGAINST" taken together shall not exceed your total
shareholding as mentioned herein above. You may also choose the option ABSTAIN. If the Member does not indicate either "FOR" or "AGAINST", it will be treated as
"ABSTAIN" and the shares held will not be counted under either head.
viii. Members holding multiple folios/demat accounts shall choose the voting process separately for each folio/demat accounts.
ix. Voting has to be done for each item of the notice separately. In case you do not desire to cast your vote on any specific item, it will be treated as abstained.
x. You may then cast your vote by selecting an appropriate option and click on "Submit".
xi. A confirmation box will be displayed. Click "OK" to confirm else "CANCEL" to modify. Once you have voted on the resolution(s), you will not be allowed to modify
your vote. During the voting period, Members can login any number of times till they have voted all the Resolution(s).
xii. Corporate/Institutional Members (i.e. other than Individuals, HUF, NRI etc.) are also required to send scanned certified true copy (PDF Format) of the Board
Resolution/Authority Letter etc., together with attested specimen signature(s) of the duly authorised representative(s), to the Scrutinizer at email ID:
[email protected] with a copy marked to [email protected]. The scanned image of the above mentioned documents should be in the naming format
"Corporate Name_Event No."
(B) In case of Members receiving physical copy of Notice [for Members whose email IDs are not registered with the Company/Depository Participants(s)]:
i. E-Voting Event Number - 4593 (EVEN), User ID and Password is provided in the Attendance Slip.
ii. Please follow all steps from Sl. No. (i) to (xii) above to cast your vote by electronic means.
I.
II. Voting at Annual General Meeting:The Members who have not cast their vote through Remote e-voting can exercise their voting rights at the AGM. The Company
will make necessary arrangements in this regard at the AGM Venue. Members who have already cast their votes by Remote e-voting are eligible to attend the
Meeting. However, those Members are not entitled to cast their vote again at the Meeting.
III. A Member can opt for only single mode of voting i.e. through Remote e-voting or voting at the AGM. If a Member casts votes by both modes i.e. voting at AGM and
Remote e-voting, voting done through Remote e-voting shall prevail and vote at the AGM shall be treated as invalid.
OTHER INSTRUCTIONS
a. In case of any query and/or grievance, in respect of voting by electronic means, Members may refer to the Help & Frequently Asked Questions (FAQs) and E-voting
user manual available at the download section of https://evoting.karvy.com (Karvy Website) or contact Mr. B Srinivas, Manager (Unit:Wipro Limited) of Karvy Fintech
Private Limited, Karvy Selenium Tower B, Plot 31-32, Gachibowli, Financial District, Nanakramguda, Hyderabad - 500 032 or at [email protected] and
[email protected] or phone no. 040 - 6716 2222 or call Karvy's toll free No. 1-800-3454-001 for any further clarifications.
b. You can also update your mobile number and e-mail id in the user profile details of the folio which may be used for sending future communication(s).
c. The remote e-voting period commences on Friday, July 12, 2019 (9.00 a.m. IST) and ends on Monday, July 15, 2019 (5.00 p.m. IST). During this period, Members
of the Company, holding shares either in physical form or in dematerialized form, as on the cut-off date of Tuesday, July 9, 2019, may cast their votes electronically.
The remote e-voting module shall be disabled for voting thereafter. Once the vote on a resolution(s) is cast by the Member, the Member shall not be allowed to change it
subsequently.A person who is not a Member as on the cut-off date should treat this Notice for information purposes only.
d. The voting rights of Members shall be in proportion to their share of the paid up equity share capital of the Company as on the cut-off date i.e. Tuesday, July 9, 2019.
e. In case a person has become a Member of the Company after dispatch of AGM Notice but on or before the cut-off date for E-voting i.e., Tuesday, July 9, 2019, he/she
may obtain the User ID and Password in the manner as mentioned below :
i. If the mobile number of the Member is registered against Folio No./DP ID Client ID, the Member may send SMS: MYEPWD <space> E-Voting Event
Number+Folio No. or DP ID Client ID to 9212993399
Example for NSDL
-
MYEPWD <SPACE> IN12345612345678
Example for CDSL - MYEPWD <SPACE> 1402345612345678
Example for Physical - MYEPWD <SPACE> XXXX1234567890
ii. If e-mail address or mobile number of the Member is registered against Folio No. / DP ID Client ID, then on the home page of https://evoting.karvy.com the
Member may click "Forgot Password" and enter Folio No. or DP ID Client ID and PAN to generate a password.
iii. Member may call Karvy's toll free number 1800-3454-001.
iv. Member may send an e-mail request to [email protected]. However, Karvy shall endeavour to send User ID and Password to those new Members whose mail
ids are available.
f. The Scrutinizer will submit his report to the Chairman after the completion of scrutiny, and the result of the voting will be announced by the Chairman or any Director of
the Company duly Authorised, on or before Thursday, July 18, 2019 at the registered office and will also be displayed on the website of the Company (www.wipro.com),
besides being communicated to the Stock Exchanges, Depositories and Registrar and Share Transfer Agents.
Notes:
1. Electronic copy of the Annual Report for 2018-19 and Notice of the Annual General Meeting along with Attendance Slip and Proxy Form is being sent to all the
Members whose email ids are registered with the Company/Depository Participant unless any Member has requested for a hard copy of the same. Shareholders receiving
electronic copy and attending the Annual General Meeting can print a copy of this Attendance Slip.
2. Physical copy of the Annual Report for 2018-19 and Notice of the Annual General Meeting along with Attendance Slip and Proxy Form is being sent in the permitted
mode(s) to all Members whose email ids are not registered with the Company and those who have requested for a hard copy.
3. The Notice of Annual General Meeting and The Annual Report 2018-19 is available on the Company's website www.wipro.com


Wipro Limited 1
Welcome to our 4th Integrated Report!
This is our fourth annual report aligned to the principles of International Integrated Reporting Framework (referred to as <IR> framework) developed by the International Integrated Reporting Council (IIRC).
In addition, the 2018-19 annual report is aligned to GRI* Standards required by Sustainability Reporting Guidelines of Global Reporting Initiative (GRI) and Business Responsibility Report (BRR) requirements of SEBI. The Natural Capital section of this report, includes the recommendations set out by the Task Force on Climate-related Financial Disclosures (TCFD) and CDSB (Climate Disclosures Standards Board) framework. All these (except BRR) are global standards.
The report complies with financial and statutory data requirements of the Companies Act, 2013 (including the Rules made thereunder, Accounting Standards), the Securities and Exchange Board of India (Listing Obligations and Disclosure Requirements) Regulations, 2015 and the Secretarial Standards.
The topics covered in the report were identified through a comprehensive process that included an internal materiality determination^ exercise, external benchmarking with peers and sustainability raters as well as frameworks like the Sustainability Accounting Standard Board (SASB).
At Wipro, stakeholder engagement^ is an ongoing process. Identifying and understanding stakeholders, their priorities and engaging with them is key to materiality determination. The report incorporates financial and non-financial information – governance, environmental and social – in a manner that can help stakeholders understand how a company creates and sustains value over the long term.
*Link to GRI Index and additional graph sheet: http://wiprosustainabilityreport.com/18-19/AR-supportings
^ Refer to chapter 5 of Wipro Sustainability Report (FY 2017-18): https://www.wipro.com/content/dam/nexus/en/sustainability/sustainability_reports/sustainability-report-fy-2017-18.pdf
Overview of the Report

2 Annual Report 2018-19
About Wipro
Wipro Limited 3
Be passionate about clients’ success
Be passionate about clients’ success. We succeed when we make our clients successful. We collaborate to sharpen our insights and amplify this success. We execute with excellence. Always.
Treat each person with respect
We treat every human being with respect. We nurture an open environment where people are encouraged to learn, share and grow. We embrace diversity of thought, of cultures, and of people.
Be global and responsible
We will be global in our thinking and our actions. We are responsible citizens of the world. We are energized by the deep connectedness between people, ideas, communities and the environment.
Unyielding integrity in everything we do
Integrity is our core and is the basis of everything. It is about following the law, but it’s more. It is about delivering on our commitments. It is about honesty and fairness in action. It is about being ethical beyond any doubt, in the toughest of circumstances.
Wipro Limited (NYSE: WIT, BSE: 507685, NSE: WIPRO) is a leading global information technology, consulting and business process services company. We harness the power of cognitive computing, hyper-automation, robotics, cloud, analytics and emerging technologies to help our clients adapt to the digital world and make them successful. A company recognized globally for its comprehensive portfolio of services, strong commitment to sustainability and good corporate citizenship, we have over 170,000 dedicated employees serving clients across six continents. Together, we discover ideas and connect the dots to build a better and a bold new future.
We began our business as a vegetable oil manufacturer in 1945 at Amalner, a small town in Western India and thereafter, forayed into soaps and other consumer care products. During the early 1980s, we entered the Indian IT industry by manufacturing and selling mini computers. In the 1990s, we leveraged our hardware R&D design and software development expertise and began offering software services to global clients. In 2013, we demerged the non-IT Diversified Businesses. With a track record of nearly 30 years in IT Services, we are, today, focused entirely on the global Information Technology business. Wipro is listed on National Stock Exchange and Bombay Stock Exchange in India and New York Stock Exchange in the US.
For more information, please visit wipro.com
Values
The Spirit of Wipro is the core of Wipro. These are our Values. It is about who we are. It is our character. It is reflected consistently in all our behavior. The Spirit is deeply rooted in the unchanging essence of Wipro. It also embraces what we must aspire to be. The Spirit is a beacon. It is what gives us direction and a clear sense of purpose. It energizes us and is the touchstone for all that we do. It is the indivisible synthesis of the four values.
Spirit of Wipro

4 Annual Report 2018-19
In a little over two decades of existence, the internet has changed many industries. From e-commerce and digital advertising to streaming content, hospitality and ride-sharing; many industries have seen a redefinition of value chains by upstarts and technology savvy incumbents. But the visible change that we see today, powered by smart phones, plentiful bandwidth, social network and digital payments, is just the tip of the iceberg.
The change that’s around the corner in the next two decades will dwarf what we have seen so far. A cohort of innovation streams - from AI to Blockchain to 3D printing,
will redefine many other sectors even more dramatically. Large enterprises see opportunities in this disruption to outperform, not just in today’s businesses, but also over longer horizons. Business and technology leaders in these enterprises need to become adept at managing innovation priorities, driving experimentation and scaling value creation on multiple fronts.
At Wipro, our close partnerships with Global 2000 companies give us a privileged view that has helped us identify what drives the key levers of outperformance and guided our investments in new capabilities to build on top of deep technology heritage. We understand how outperformance in rapidly changing markets takes more than trend chasing and silver bullets. A sustainable approach to outperformance needs not just laying deep foundations in simplifying and modernizing the IT and engineering landscape but also embedding trust in transactions, relationships and technologies. Business transformation creates new experiences and new value propositions for customers but needs an innovation approach that is ingrained in new ways working both within the enterprise and with the ecosystem outside.
Business Transformation: Our design-led customer-centric approach helped a large Healthcare Group Procurement Organization to completely reimagine their business model to an e-commerce market place, creating an end to end digital experience and an entirely different brand for the digital world. We helped one of the largest payment gateways to compete effectively with new-age fintechs in reimagining the on-boarding process for millions of small merchants to an intuitive, self-service process, crashing cycle time from weeks to minutes.
Modernization: One of the largest airports in North America is winning awards for being the best in customer experience
Outperform.With Wipro.
4 Annual Report 2018-19

Wipro Limited 5
by reducing response times to queries on passenger flow, baggage and fleet tracking from minutes to seconds. This was an outcome of an engagement where we partnered with them in modernizing their technology infrastructure by leveraging AI/ML, IoT and Blockchain solutions. Another rewarding engagement was in automating technology and business processes of the largest processors of employee health and wealth insurance providers, which resulted in dramatically improved efficiency and experience in serving millions of their customers.
Connected Intelligence: By embedding IoT and Analytics competencies into information pathways and business processes, we are evolving both the DNA and the nervous
system of outperforming businesses. We helped a global industrial pumps business rethink asset maintenance and operations to improve customer satisfaction and discover new service revenue streams. Our intelligent pricing engine has helped improve pricing recommendation and workflow implementation for a global consumer goods company, resulting in an estimated 5% increase in revenue.
Trust: As we helped blueprint and execute a move to the cloud for a global nutrition major, we consolidated security policies and processes across 197 countries, ensuring local compliance and removing bottlenecks. As a result, we helped them achieve an enhanced security posture with the implementation of next generation security controls and a cyber defense platform with advanced threat detection capabilities. We also leveraged our expertise to help a global life sciences enterprise operating in 71 countries to achieve GDPR compliance in a timely and orderly fashion.
Open Innovation straddles both the ‘what’ and ‘why’ of an outperform strategy. Wipro’s Open Innovation ecosystems let our clients leverage the power of start-ups, leading universities and more than 1.5 million individuals through our Topcoder crowdsourcing platform to drive modernization and transformation. With our unique, managed crowdsourcing approach on Topcoder, we demonstrated that the power of the gig economy has moved beyond pilots and experiments and can scale enterprise challenges. We proved that from perfecting cancer detection algorithms, to identifying feasible hydrocarbon reserves, to automating critical operations of urban infrastructure utilities, the power of a million strong community can be harnessed to solve problems that were previously considered unsolvable with the traditional ways of working.
Our commitment to helping our clients outperform continues to be demonstrated by our deep investments in all dimensions, with our continuous drive to leverage our capabilities creating significant value for our clients’ businesses.
Wipro Limited 5

6 Annual Report 2018-19
1. Revenue is aggregate revenue for the purpose of segment reporting including the impact of exchange rate fluctuations2. EPS adjusted for the years prior to the bonus issue. Bonus issue was in proportion of 1:3 and was approved by shareholders in February 20193. Number of shareholders (as at March 31st of respective years) represents holders of equity shares and does not include holders of ADRs4. Market price of shares is based on closing price in NSE as on March 31st of respective years and has been adjusted for bonus issue in 2019
Financial performance 2014-15 2015-16 2016-17 2017-18 2018-19
Revenue1 473,182 516,307 554,179 546,359 589,060
Profit before Depreciation, Amortisation, Interest and Tax
108,246 111,825 116,986 105,418 119,384
Depreciation and Amortisation 12,823 14,965 23,107 21,124 19,474
Profit before Interest and Tax 95,423 96,860 93,879 84,294 99,910
Profit before Tax 111,683 114,933 110,356 102,474 115,415
Tax 24,624 25,366 25,213 22,390 25,242
Profit after Tax - attributable to equity holders
86,528 89,075 84,895 80,081 90,031
Per share data
Earnings Per Share- Basic (`)2 13.22 13.60 13.11 12.64 14.99
Earnings Per Share- Diluted (`)2 13.18 13.57 13.07 12.62 14.95
Financial position
Share Capital 4,937 4,941 4,861 9,048 12,068
Net Worth 409,628 467,384 522,695 485,346 570,753
Gross cash (A) 251,048 303,293 344,740 294,019 379,245
Total Debt (B) 78,913 125,221 142,412 138,259 99,467
Net Cash (A-B) 172,135 178,072 202,328 155,760 279,778
Property, Plant and Equipment (C) 54,206 64,952 69,794 64,443 70,601
Intangible Assets (D) 7,931 15,841 15,922 18,113 13,762
Property, Plant and Equipment and Intangible Assets (C+D)
62,137 80,793 85,716 82,556 84,363
Goodwill 68,078 101,991 125,796 117,584 116,980
Net Current Assets 272,463 284,264 309,355 292,649 357,556
Capital Employed 488,538 592,605 665,107 623,605 670,220
Shareholding related
Number of Shareholders3 213,588 227,369 241,154 269,694 330,075
Market Price Per Share (`)4 235.8 211.6 193.4 210.9 254.8
(Figures in ` million except otherwise stated)
Financial Highlights

Wipro Limited 7
1. IT services operating margin refers to segment results total as reflected in IFRS financials2. Net Income has been considered after adjusting for profit attributable to non-controlling interest (Minority Interest)3. Attrition rates refers to voluntary attrition computed on a trailing twelve months basis excluding DO&P4. For convenience, the market capitalization in ` as per NSE have been translated into United States Dollar at the certified foreign exchange rate published
by Federal Reserve Board of Governors on the last day of the respective financial years 5. Payout Ratio has been computed by dividing the payout (comprising interim and final dividend declared for the respective financial year and buy back if
any, considered based on the date of Board’s approval) to shareholders by net income on a trailing three year basis. The buyback of ` 105 billion that the Board approved in April 2019 will be considered as a part of the payout for FY 2020
Revenue IT Services($ Million)
FY 2017 FY 2018 FY 2019
8,120
7,895
7,569
FY 2017 FY 2018 FY 2019
17.9%
16.1%
18.8%
IT Services Operating Margin1
Net Income to Revenue2
FY 2017 FY 2018 FY 2019
15.3%14.7%
15.3%
FY 2017 FY 2018 FY 2019
Free Cash Flow to NetIncome
106.0%
79.3%86.1%
FY 2017 FY 2018 FY 2019
Operating Cash Flow toEBITDA
97.4%
79.9%79.3%
Gross Utilization
FY 2017 FY 2018 FY 2019
74.4%
72.2%
71.5%
Market Capitalization($ Billion)4
FY 2017 FY 2018 FY 2019
22.2
19.519.3
AttritionRate3
FY 2017 FY 2018 FY 2019
17.6%16.8%
16.3%
PayoutRatio5
FY 15 -17
60.7%
72.8%
37.9%
FY 16 -18 FY 17 -19

8 Annual Report 2018-19
Key Performance Metrics
HumanCapital
Persons with Disabilities
FY 2017 FY 2018 FY 2019
545
442
334
IntellectualCapital
USA UK Australia
64.0% 30.9% 31.2%
Localization inOn-shore Workforce
Patents Granted till Date
FY 2017 FY 2018 FY 2019
558
380
250
Patents FilledCumulatively till Date
Number of People Trained in Digital
R&D Expenses
2200+39,000+
133,000+
90,000+
2000+
1662
FY2017
FY2018
FY2019FY 2017
FY 2018FY 2019
`
FY 2017 3,338
FY 2018 3,041
FY 2019 3,942
million
FY 2017 FY 2018 FY 2019
Women Employees (%)
35.2%35.0%
33.0%FY 2017 FY 2018 FY 2019
Total Employees
175,690
163,827165,481
Nationalitiesin Workforce
FY 2018
FY 2017 FY 2019
110100 125

Wipro Limited 9
Social & RelationshipCapital
FY 2017 FY 2018 FY 2019
Community Partners
70+
150+
175+
FY 2017 FY 2018 FY 2019
CSR Spend
1,863 1,866 1,853
` million
NaturalCapital
FY 2016 FY 2017 FY 2018
Overall Environmental CostReduction due to Initiatives*
` Million
* Valuation of FY 2019 will be completed by July 2019
1,2651,1531,086
FY 2017 FY 2018 FY 2019
GHG Emission Reduction (YoY)tons of W eq.W
44,500
24,000
11,000 Waste sent to Landfill (excluding C&D)
30,000+28,000+25,000+
FY 2019FY 2018FY 2017
Total Employees Engagedwith Wipro Cares
(volunteering or monetarycontribution or both)
Active customers
1,3231,248
1,179
FY 2017FY 2018
FY 2019
Increase in Customer Net Promoter Score
basis points
486 bps 511 bps
740 b
ps
FY 2017
FY 2018
FY 2019
38%
41% 42%
Water Recycled(% of total water consumption)
FY 2017
FY 2018 FY 2019
FY 2017 4.5%
FY 2018 3.3%
FY 2019 3.0%
FY 2017 FY 2018 FY 2019
Revenue from ExistingCustomers
98.0%98.6% 98.4%
FY 2017
FY 2018
FY 2019
1,381
1,296
1,3717,985
8,649
8,539
Wipro earthian Engagement with Students and Institutes

10 Annual Report 2018-19
Education & Community Care
Sustainability Education• Participation in flagship Wipro earthian program from 1,371 schools and colleges across 51 districts in 29 states and 3 UT’s• Faculty led research, Faculty development program on MOOC’s and doctoral fellowships on sustainability with IIM-B• 3 academic workshops held with CEPT, ICT and IIMA with 55 participants from top business schools, planning schools and
chemical engineering institutes• 7 sustainability quizzes conducted with 1,420 participants from 710 teams along with national finals• 20 college sustainability internships facilitated at 5 partner organizations
School Education• Partnered with 116 organizations in areas of systemic reforms over 18 years• Supporting 14 new organizations through seeding fellowships & 2 through grants in FY 2019• Close to 150 participants attended the 18th Partner’s Forum on school education• More than 85 education seeding fellows supported till date
Energy & Emission
• Over 29% reduction in global people based emissions intensity to 0.85 tons per person per annum
• 40% (98 million units) of our total India Energy Consumption comes from Renewable Energy (RE)
• Wipro EC campus is first in IT service sector to receive Greenco Silver Rating award by CII-GBC (Green Business Center)
• 44% increase in energy saving due to server virtualization from FY 2018• 21% reduction in air travel footprint from FY 2018
A Sustainable, Empowering Workplace
Biodiversity, Waste and Water
• 4% reduction in water consumption intensity to 951 liters per employee
• 42% of water recycled in FY 2019 compared to 41% in FY 2018
• 97% of waste (excluding C&D) is diverted from landfill
• 3 biodiversity projects completed till date-Butterfly park, Wetland zone and thematic garden in Bengaluru and Pune
• Community Water Programs: Participative urban water programs in Bengaluru and Pune
• Bengaluru Sustainability Forum: 3 multi-stakeholder retreats and 9 grant proposal selected on urban water and biodiversityE
colo
gica
l Sus
tain
abili
ty
• 133,000+ employees trained in digital skills as of FY 2019• 600,000+ hits on Wipro OnAir Podcasts, 106,000+ employees on the enterprise social platform Yammer and 47,000 monthly
active users on collaborative platforms like MS Teams• Work from Home policy implemented, India paternity leave enhanced and employee rotations policy changed based on employee
feedback• 75% overall engagement score in the Employee Perception Survey Pulse FY 2019 – an increase of 1.4% compared to FY 2018• 100,000+ employees covered in 20 locations in India and 8 locations outside India under ISO 14000 and OHSAS certifications
Sustainability Highlights
EnergyIntensityKwH per sq. meter per annum
FY 2018
174
FY 2019
142
GHG Intensity for Office Energy ConsumptionKg CO2 eq per sq. meter per annum
FY 2018
101
FY 2019
71.3

Wipro Limited 11
Engagement With Suppliers• Adopted EPEAT program in 2016 for IT hardware
procurement for laptops, desktops, printers, mobiles and servers. Till date we saved 2.6 million KW of energy and 598 tons of CO2 eq.
• Wipro received an EPEAT Purchaser award with a four-star rating
Rewards & Recognition• Member of Dow Jones Sustainability Index (DJSI), World for the ninth time in a row• Named as 2019 World’s Most Ethical Company for the 8th successive year by the Ethisphere Institute• Wipro Limited receives Silver Class Sustainability Yearbook Award 2019• Member of Vigeo Eiris Emerging Market Sustainability Index (comprises of the 70 most advanced companies in the Emerging
Market Region)• Wipro is part of FTSE4Good Index Series and also a global sector leader• Wipro received A- in Carbon Disclosure Project (CDP)-Climate Change Assessment• Wipro’s Intellectual Property Portfolio Recognized with National IP Award and WIPO Enterprise IP Trophy• Wipro wins Gold for Physical Identity & Access Management and Security Intelligence as a Service at 2018 IT world Awards• Ecovadis-CSR rating of Gold• SHRM India HR Awards 2018 - Excellence in Leveraging HR Technology and Excellence in Developing Leaders for Tomorrow• Association for Talent Development (ATD) – Best of Best Award for FY 2018• RobecoSAM Silver Class Sustainability Yearbook Award for 2019• Golden Peacock HR Excellence Award, 2018• Brandon Hall Excellence Awards – Bronze Award for Best Advances in Social Learning for FY 2018• United Nations Global Compact Network India (UN GCNI) – Women at Workplace Awards 2019 - 1st Runner Up• Nipman Foundation – Microsoft Equal Opportunity Awards 2018, Winner in the category of ‘Enabler – Employment of Persons with
Disabilities’• Top 20 Companies in DivHERsity (Large Enterprises) and Top20 Most Innovative Practices - DivHERsity Programs• Annual HR Distinction Awards 2019, UK - Winner in the category “Distinction in Inclusion and Diversity”• Wipro has received a score of 95 out of 100 on the 2019 Corporate Equality Index
Customer Stewardship• Participated in sustainability assessment led by +150
customers• Topcoder is our crowd sourcing platform for enterprise with
1.5 million total & active members from 255 countries. In FY 2019 close to 10K challenges and tasks were completed
Community• Nearly 41,000 children from underprivileged communities benefit from our 24 education projects in eight states• Education for Children with Disability program supports the educational and rehabilitative needs of 2,200 underprivileged
children with disabilities, through 17 projects in six states• Over 77,000 people from disadvantaged communities have access to primary healthcare• Project in urban solid waste management in Bengaluru provides social, nutritional and health security to nearly 8,000 workers
in the informal sector• Agro-forestry project in rural Tamil Nadu helped 100 farmers in integrated farming by planting 40,000 trees
• Wipro Science Education Fellowship, our flagship program in the USA is active in seven locations- Tampa, Jefferson City, Mountain View, Boston, New York, New Jersey and Dallas. Anchored by UMass, Boston, our partners include Stanford University, University of Southern California, University of Missouri
• Three-year agreement with King’s College London to develop and offer UK’s first Master’s program in STEM education• ‘Wipro Teacher Fellowship’ and ‘Wipro Teacher Mentor’ programs initiated by Sheffield Hallam University (UK) -to provide
rigorous continuous professional development to STEM teachers
Wipro Science Education Fellowship Program

12 Annual Report 2018-19
Chairman’s Letter to the Stakeholders
Dear Stakeholders,
This year, we embark on our 75th year of creating value for our stakeholders. It is an important milestone for us and we take great pride in how Wipro is an exemplar of a successful, ethical and a socially responsible organization. If we look back at the Wipro journey in the last seven decades, from a small vegetable oil company to a leading information technology company that we are today, we have evolved by constantly re-inventing ourselves and creating newer opportunities. This has been possible because of the deep commitment and hard work of Wiproites and the core values that have remained our guiding light.
Along the journey, we have focused on continuous evaluation of the capabilities we need to win. This year as a part of the strategic plan exercise, we identified four technologies that will lead us into the future - Digital, Cloud, Engineering Services and Cyber Security. Based on the approval from the Board, we have decided to step up our investments significantly in these four big bets. Furthermore, we also
divested our datacenter business which has improved our return on capital employed.
We are committed to enhancing value for our stakeholders.
Our EPS for the year ended March 31, 2019 grew by 18.6% YoY, which was the best in the last 5 years. We improved our working capital substantially and our free cash flows was robust at 106% of our net profits. We have a capital allocation philosophy of providing regular and stable payout to investors keeping two important considerations, one that of building long term stakeholder value and two that allows us to make required investments for future growth. Consistent with this philosophy, we declared a dividend of ` 1 per share, completed a bonus issue of one equity share for every three held in March 2019 and also announced a buyback of ̀ 105 billion through buyback to the shareholders in April 2019. The shareholders have approved the proposal to buyback equity shares of the company and the process is likely to be completed by August 2019.

Wipro Limited 13
We remain committed to building a glorious future.
I am pleased to share that Rishad Premji, Chief Strategy Officer and Member of the Board, will take over as the Executive Chairman of Wipro Limited with effect from July 31, 2019. Rishad brings to this role new ways of thinking, experience, and competence that will lead Wipro to greater heights. He has been an integral part of the leadership team since 2007, and has a deep understanding of the company, business strategy, culture and heritage. He is also deeply committed to the values which form the bedrock of Wipro. I will continue to serve on the Board of Wipro Limited as Non- Executive Director and Founder Chairman while dedicating most of my time and energy to the philanthropic efforts of the Foundation.
Leading Wipro from 1966 till now has been the greatest privilege of my life, it has been an extraordinary journey. I want to thank the generations of Wiproites and their families for their contribution towards building our company to what it is today. I am grateful to our clients, partners, and other stakeholders who have reposed trust and confidence in us.
Wipro will continually transform to scale new heights as the world changes while remaining firmly committed to its values. I am confident that the future of Wipro will far outshine anything that we have done before.
Very Sincerely,
Azim Premji
As a large technology company which employs 170,000+ people, we have the responsibility to drive an inclusive growth. Technologies like digital and AI are disrupting the way services are rendered and the ability to learn becomes vital for our employees. At Wipro, we have made significant investments in re-skilling our employees in digital technologies. There are three levels of training that start from awareness programs, extensive learning programs through virtual labs and immersive programs that provide opportunities to build deep expertise. We are also using TopGear, our social learning and crowdsourcing platform as a workforce transformation tool as it has 2000+ learning assignments across 200+ skills. Today, we already have 55,000+ employees on TopGear. Localization is an important initiative we are driving to create a global, diverse and distributed talent base. In the last few years of running this program we have successfully localized all our major markets like USA, UK, Australia, Canada, Singapore, Africa and Middle East.
We are acutely aware that much of the economic progress in the world has come at the cost of climate change and therefore we have a responsibility towards creating a sustainable community. We have significantly scaled up renewable energy for our operations, contributing to 40% of our total consumption. Recycled water now contributes to 42 % of our total water usage. Education, has been the primary focus of our work for close to two decades now. Till date, we have partnered with 166 organizations working in school education. Wipro Earthian, a sustainability education program focused on water and bio-diversity, has reached out to 8,600 schools over the last nine years. The Wipro Science Education fellowship in the USA, which we started in 2013, works in seven sites across 35 school districts on improving STEM learning in schools serving disadvantaged communities. This year, we are collaborating with Kings College London and Sheffield Hallam University to provide rigorous continuous professional development to STEM teachers working in government designated ‘opportunity areas’ in the UK, which by definition have a high proportion of failing-schools.
Through Wipro cares, our employee giving program, we have worked on education for disadvantaged children and children with disabilities and worked with partners who provide quality primary health care services to underserved communities. My own thinking of wealth & philanthropy is that we must remain ‘trustees’ of our wealth for society, not its owners. As announced earlier, I have irrevocably renounced more of my personal assets and earmarked them to the endowment which supports the Azim Premji Foundation’s philanthropic activities. The total value of the philanthropic endowment corpus contributed over time is ~USD 21 billion, which includes 67% of economic ownership of Wipro Limited.

14 Annual Report 2018-19
we have in enterprise scale modernization & transformation. Our AI-First strategy and differentiated assets such as Data Discovery Platform are being well received in the market which is reflected in the double digital growth of DAAI (10% YoY in constant currency). Our big bet in Cybersecurity is central to our Trust pillar. We are scaling assets such as our Cyber Defense Assurance Platform and working with security ecosystem partners and governing bodies. Cyber security as a service offering which forms 4% of the revenues grew at 16% YoY (in constant currency) in FY 2019.
There were several green shoots in our overall performance as we built the momentum consistently through the year. On a full year basis, we grew 5.4% in constant currency. Two of the business units BFSI and CBU grew by 16% and 10% (in constant currency) respectively. Our operating margins have improved by 1.8% on full year basis because of our relentless focus on the quality of revenues.
I am sharing with you an update on how we have been progressing across the 6 key themes that we have outlined to serve our customers better.
Dear Stakeholders,
We are in an exciting time in history where transformative digital technologies are emerging at an unprecedented rate and technology is becoming the core for all products and services across industries. Established business models are being challenged to give way to new. To stay ahead of the curve as our client enterprises undergo this rapid transformation, we have anchored our efforts on first understanding how our customers’ needs could change and then building our capability to deliver to those needs. I can see the outcome of those focused efforts when in my conversations with our customers, there is a shift from “how can Wipro help us execute better” to ‘how can Wipro help us transform & innovate”. Our customers are now trusting Wipro to do more and we are ready to be the partner that helps them outperform.
We have sharpened our strategy into four pillars based on what our customers need i.e. Business Transformation, Modernization, Connected Intelligence and Trust. In order to build the capability that is needed to deliver these strategies, we have been investing significantly in the four areas of big bet which are Digital, Cloud, Engineering Services and Cyber Security. Our Digital revenues grew by 32% YoY. Our largest deal win to date of $1.5 billion, is a testimony to the capabilities
CEO’s Letter to the Stakeholders

Wipro Limited 15
Digital & Consulting
Our customers are no longer asking if or why digital transformation should be a top priority. The question now for enterprises is how to make it real and how to show outcomes. As a result, digital is ubiquitous and at the forefront of all our offerings. The strength that we have built in our Digital practice through the last few years has helped transform customers into digital businesses, changing how they work in order to deliver new product and service experiences. We are a partner of choice to our customers because of our differentiated talent, end-to-end capabilities that enable us to execute leveraging our IP and process and transform to new ways of working for the customer. Our 4 M’s focus - method, model, mindset and machinery enable the full engineering and business transformation for our customers. For the year, Digital grew from 27% of revenue in Q4’18 to 35% of revenues as of Q4’19. Consulting which is 7% of our Revenues grew by 19% YoY.
Client Mining
Our biggest assets are our customer relationships and there is no better endorsement of our capabilities than the faith that our customers repose in us. We believe in delivering not only what we promise but also go beyond and meet the unsaid expectations. We continue to take proactive ideas which leverage our investments contextualized for the customer. Our Net Promoter Scores (NPS), improved by 511 basis points in FY 2019 over FY 2018. Our top ten clients grew 9.6% for the year and we added 2 clients in the >$ 50 million bucket.
Process & IT estate Modernization
Simplifying complex customer processes and technology through cloud enablement, creating APIs and driving hyper automation forms the foundation for effective digital transformation for our customers. Wipro HOLMESTM, our proprietary platform for automation is now deployed across 350+ customers to hyper-automate processes and offload specific cognitive tasks to the artificial intelligence (“AI”) platform to gain cost efficiencies, agility and enhanced user experience. In Q4’19, work done by BOTS in fixed price projects was at 11%.
IP & Platforms
We continue to invest and scale intellectual property via platforms, products, frameworks and solutions, enabled by innovative commercial constructs and delivered in a ‘as a-service’ model, thus truly making their costs variable in a risk reward model (e.g. transaction based, outcome-based pricing). The number of patents we held (and applied for) crossed 2,200, we now have 558 patents granted within our portfolio and we continue to maintain our innovation focus towards new age technologies like Data Analytics, Artificial Intelligence, Wireless technologies, etc.
Open Innovation
As I mentioned earlier since the core of all products and services is now technology, the responsibility to innovate is with us. We have therefore a very robust open innovation ecosystem framework which comprises of M&A, Ventures, Partner Ecosystem, Horizon program, Topcoder, Expert Networks & Academia. This year, we invested in Syfte, an Australian design agency which uses human-centered design thinking to solve compelling client challenges and further strengthens Wipro’s design capabilities. Through Topcoder, our customers are accessing and executing with incredible digital talent faster, including specialized talent driving projects utilizing AI, Blockchain, Computer Vision, Machine Learning, Precision Medicine, and even Quantum Computing. This equates to more and faster digital experimentation for our customers, which helps them win through better innovation.
I am encouraged by the recognition that we have gained with Industry analysts as a ‘Leader’ across various industry segments and domains like Cloud, Digital, IoT, Blockchain Automation , AI, & Analytics etc. We are now positioned as “Leader” in 65% of the ~322 such active reports, which gives us the ability to differentiate ourselves.
Talent & Localization
We are investing in re-skilling of our employees into pi and X shaped talent and taking affirmative actions to create a global, diverse, local and distributed talent. Our endeavour to localize has been successful in all our major markets, in US, we have reached new high of 64%+ up from 55% in FY 2018. Campus hiring from the universities is playing a crucial role across the markets along with training programs specially designed to get the University graduates move successfully into customer projects. As of March 31, 2019, we have trained over 133,000 professionals in digital technologies.
Through the last year, we remained steadfast in our efforts to execute on our strategy and made good progress. This was possible because of the passion and commitment of Wiproites across the world, who are the Spirit of Wipro! I would also like to express my deep gratitude and appreciation to our customers who have provided us an opportunity to partner with them, our partners and our shareholders for their unwavering support.
Very Sincerely,
Abidali Z Neemuchwala

16 Annual Report 2018-19

Wipro Limited 17
Standing from left to right
Patrick Dupuis
Independent Director
Rishad A Premji
Executive Director & Chief Strategy Officer
Abidali Z Neemuchwala
Chief Executive Officer & Executive Director
Ireena Vittal
Independent Director
Arundhati Bhattacharya
Independent Director
William Arthur Owens
Independent Director
M K Sharma
Independent Director
Dr. Patrick J Ennis
Independent Director
Sitting from left to right
Dr. Ashok S Ganguly
Independent Director
Azim H Premji
Executive Chairman
Narayanan Vaghul
Independent Director
Board of Directors
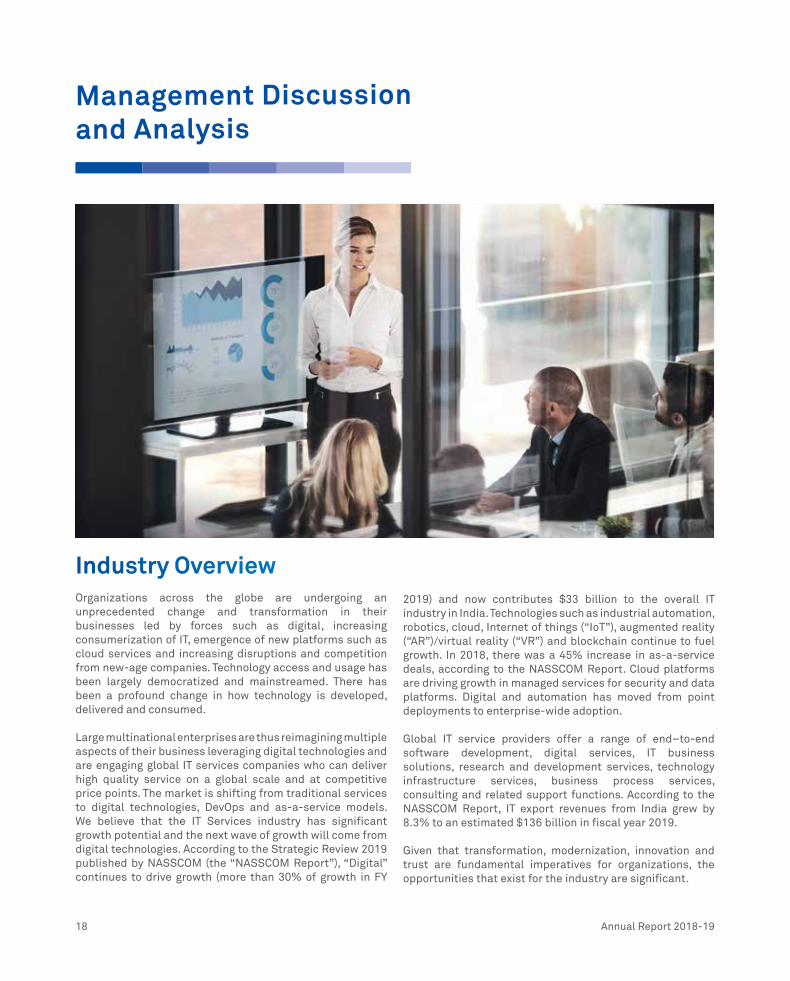
18 Annual Report 2018-19
Industry OverviewOrganizations across the globe are undergoing an unprecedented change and transformation in their businesses led by forces such as digital, increasing consumerization of IT, emergence of new platforms such as cloud services and increasing disruptions and competition from new-age companies. Technology access and usage has been largely democratized and mainstreamed. There has been a profound change in how technology is developed, delivered and consumed.
Large multinational enterprises are thus reimagining multiple aspects of their business leveraging digital technologies and are engaging global IT services companies who can deliver high quality service on a global scale and at competitive price points. The market is shifting from traditional services to digital technologies, DevOps and as-a-service models. We believe that the IT Services industry has significant growth potential and the next wave of growth will come from digital technologies. According to the Strategic Review 2019 published by NASSCOM (the “NASSCOM Report”), “Digital” continues to drive growth (more than 30% of growth in FY
2019) and now contributes $33 billion to the overall IT industry in India. Technologies such as industrial automation, robotics, cloud, Internet of things (“IoT”), augmented reality (“AR”)/virtual reality (“VR”) and blockchain continue to fuel growth. In 2018, there was a 45% increase in as-a-service deals, according to the NASSCOM Report. Cloud platforms are driving growth in managed services for security and data platforms. Digital and automation has moved from point deployments to enterprise-wide adoption.
Global IT service providers offer a range of end–to-end software development, digital services, IT business solutions, research and development services, technology infrastructure services, business process services, consulting and related support functions. According to the NASSCOM Report, IT export revenues from India grew by 8.3% to an estimated $136 billion in fiscal year 2019.
Given that transformation, modernization, innovation and trust are fundamental imperatives for organizations, the opportunities that exist for the industry are significant.
Management Discussion and Analysis
Wipro Limited 19
Business OverviewWe are a global technology services firm, with employees across 50 countries and serving enterprise clients across 27 industry verticals. We provide our clients with competitive advantages by applying various emerging technologies and ensuring cyber resilience and cyber assurance. We work with our clients not only to enable their digital future, but also to drive hyper efficiencies across their technology infrastructure, applications and core operations, enabling them to achieve cost leadership in their businesses.
We are recognized by our clients for our ability to bring in “an integrated perspective”, i.e., our ability to bring together broad and deep technology and domain expertise, our ability to draw learnings and apply insights from one company or sector to another and our ability to provide end-to-end services. Our clients value our consistent excellence in execution and our ability to proactively incorporate relevant innovation.
Going forward, digital enterprises will increasingly require partners, such as Wipro, who are able to bring capabilities that span across consultancy, design, engineering, systems integration and operations to enable them to achieve digital transformation. This transformation can only be effective if delivered in the context of the relevant industry or domain, hence it is critical to us that we provide strong domain expertise along with “Digital.” We have invested significantly in building domain expertise and we will continue to strengthen our domain capabilities.
The vision for our business is “to earn our clients’ trust and maximize value of their businesses by helping them in their journey to ‘re-invent’ their business and operating models with our ‘Digital’ first approach and best in class execution.”
Our IT Services business provides a range of IT and IT-enabled services which include digital strategy advisory, customer- centric design, technology consulting, IT consulting, custom application design, development, re-engineering and maintenance, systems integration, package implementation, cloud infrastructure services, analytics services, business process services, research and development and hardware and software design to leading enterprises worldwide.
Our IT Products segment provides a range of third-party IT products, which allows us to offer comprehensive IT system integration services. These products include computing, platforms and storage, networking solutions, enterprise information security and software products, including databases and operating systems. We continue to focus on being a system integrator of choice where we provide IT products as a complement to our IT services offerings rather than sell standalone IT products.
Our India SRE segment consists of IT Services offerings to organizations owned or controlled by Government of India and/or any Indian State Governments.
Our Business StrategyOur strategy is about driving a “Digital first” approach through four foundational pillars i.e. Business Transformation, Modernization, Connected Intelligence and Trust. As part of these, we are prioritizing and disproportionately investing to drive growth in key strategic fields such as digital, cloud, cybersecurity and industrial and engineering services through our “Big Bet” program. For example, our “Big Bet” in each of Digital and Cloud are at the heart of our Business Transformation and Modernization pillars, while our “Big Bet” in Industrial and Engineering services is central to our Connected Intelligence pillar and our “Big Bet” in cybersecurity is central to our Trust pillar. Talent, IPs/ Platforms & Open Innovation are underlying strategies that support the four pillars.
Business Transformation
Business Transformation is about transforming the customer experience at scale and generating new revenue models through a consulting-led approach combining deep domain and technology expertise and strategic design capabilities, which we have scaled through our acquisitions, such as of Designit, Cooper and Syfte.
Our acquisition of Syfte, an Australian design agency leverages human-centered design thinking to solve compelling client challenges & strengthens Wipro’s design and innovation capabilities. Syfte, which is a part of Digital, expands our reach in Australia and contributes to significant synergy across our integrated digital and design capabilities.
Modernization
Modernization is about taking an integrated “Cloud first” approach across applications, infrastructure and data to modernize the IT landscape, while leveraging HOLMESTM, new ways of working, Application Programming Interface (“API”) and Microservices.
We are investing in Cloud Studios across geographies, which provides services such as cloud assessment, cloud migration (Lift and Shift), cloud native, Agile and DevOps, among others.
Wipro HOLMESTM helps enterprises hyper-automate processes and offload specific cognitive tasks to the artificial intelligence (“AI”) platform to gain cost efficiencies, agility and enhanced user experience. Wipro HOLMESTM helps businesses adopt a hybrid mode of operation (i.e., pairing automation and human effort), which is achieved through a combination of virtual agents, predictive systems, cognitive process automation, visual computing applications, knowledge virtualization and AI reasoning.
We also offer automation advisory services to help clients in their journey of AI/automation through designing automation
20 Annual Report 2018-19
roadmaps and setting up Digital Centers of Excellence for automation initiatives. In addition to the Wipro HOLMESTM platform, we are building a collaboration ecosystem for automation, working with partners such as Robotics Process Automation providers (e.g. UiPath ), start-ups (e.g., Avaamo, Inc., Arago and GmbH) and established partners (e.g., IBM, Amazon.com, Inc., Google LLC, Microsoft Corporation, SAP SE, Oracle Corporation and ServiceNow, Inc.).
For our API and microservices, we have significantly scaled our consulting talent pool and solutions, which includes our Digital Modernization platform.
Connected Intelligence
Connected Intelligence is about driving outcomes through HOLMESTM, our Data Discovery Platform and use-case based AI solutions and building strong industrial & engineering service capabilities and assets in areas such as Autonomous systems, IoT,5G, etc. We have adopted an “AI First” strategy, which entails acquiring and assimilating data, driving accurate decisions and delivering measurable business outcomes., e.g. Faster Time-to-Market.
We continue to invest in scaling end-to-end capabilities across sensors, gateways, connectivity, platforms, analytics, machine learning and artificial intelligence to drive transformation in a hyper-connected world. We are scaling assets and capabilities in emerging areas such as IoT, 5G, and autonomous systems.
Trust
Trust is about addressing a changing security, privacy & regulatory landscape driven by ubiquitous technology through a consulting led approach to Cyber-security.
We have adopted a consulting-led approach in areas such as enterprise risk management, data privacy and control assurance and we have leveraged cognitive automation, e.g., automated incident detection and response, to drive security.
We are scaling assets such as our cyber defense assurance platform (“CDAP”) and working with security ecosystem partners and governing bodies, such as Cloud Security Alliance and Wipro Ventures Portfolio (IntSights, CyCognito, Vectra).
Underlying Strategies that Support the Four Pillars
Talent
Talent strategy is about building a robust ‘re-skill & recruit’ engine and scaling a global, diverse, local and distributed talent pool. We are scaling π-shaped talent (i.e., people with “double-stemmed” skill sets), product managers, scrum masters and full stack engineers. We are driving re-skill programs for our employees, such as our Digital Academy. We are hiring and training new employees locally through Wipro’s Ascent program and driving scale in our various geographic segments through employee trainings in areas such as Digital, Analytics, Engineering Services and Cybersecurity.
As of March 31, 2019, we trained over 133,000 professionals in digital technologies. We are expanding our innovation labs, or digital pods, to offer enhanced transformation services to global customers.
IPs & Platforms
IPs and Platforms is about driving differentiation and non- linear revenues. We are scaling IPs, platforms and solutions to drive differentiation in our as-a-service offerings. We are integrating IPs to drive greater impact across domains and technology. Examples of our domain and industry IPs are Netoxygen in our Banking, Financial Services and Insurance business unit and Medicare Advantage in our Health Business Unit, and examples of our technology-based IP include Cyber Defense Platform and Virtuadesk.
Open Innovation
Open Innovation is about tapping the innovation ecosystem to bring the best solutions to our customers through vehicles such as Wipro Ventures, through which we invest in start- ups relevant to enterprises, Partner ecosystem, Academia partnerships , our Horizon Program, which is our organic intrapreneurship initiative, our Crowdsourcing Model (Topcoder), Expert Networks and M&A.
• Wipro Ventures: The strategic investment arm of Wipro, Wipro Ventures is a $100 million fund that invests in early to mid-stage enterprise software startups. As of March 31, 2019, Wipro Ventures has active investments in and partnered with 13 startups in the following areas – AI (Avaamo, Inc., Vicarious FPC, Inc.), Business Commerce (Tradeshift, Inc.), Cybersecurity (IntSights Cyber Intelligence Ltd., Vectra Networks, Inc. CyCognito), Data Management (Imanis Data, Inc.), Industrial IoT (Altizon Systems Private Ltd.), Fraud & Risk Mitigation (Emailage Corp.), Testing Automation (Headspin, Inc., Tricentis GmbH) and Cloud Infrastructure (Cloudgenix, Moogsoft).

Wipro Limited 21
In addition to direct investments in emerging startups, Wipro Ventures has invested in four enterprise-focused venture funds: TLV Partners, Work- Bench Ventures, Glilot Capital Partners and Boldstart Ventures. During year ended March 31, 2019, one of our portfolio companies, Demisto, was acquired.
• Partner Ecosystem: We have a dedicated unit to drive and deepen our partner ecosystem to drive creation of new markets and solutions, expand in key verticals and geographies, drive innovation in our offerings and drive go-to-market outcomes. We have subdivided the partner ecosystem into the following categories:
» Strategic Partners: A strategic partnership has multiple technologies and industry use cases aligned to Wipro’s business covering multiple Wipro service lines. These partnerships are global in nature, with higher business volume and larger business potential with a medium to long term joint business roadmap. Wipro and the strategic partner co-develop focused industry solutions and co-invest in joint go to market initiatives. Strategic partnerships usually have strong solutions portfolio which either complete a value chain by themselves or play a prime technology position in a value chain.
» Growth Partners: These are partnerships have focused alignment on a core technology practice and provide extended solutions based on a common technology baseline. These partnerships help Wipro to strengthen industry positioning, usually helping Wipro to achieve leadership position in that technology. Growth partners have higher potential for multi practice engagements through either branching to other services lines of Wipro or leveraging an ecosystem of partnerships.
» Niche Partners: Niche partners are highly focused relationship on addressing a specific business need through a unique positioning. Niche partnerships help Wipro to differentiate ourselves in the market through one or more of multiple advantages like cost, unique technology positioning, future proofing and addressing new growth areas.
• Academia Partnerships: Collaboration with academic institutions and associations in the United States, Europe, Israel and India in the fields of computer and electrical engineering to promote innovative technology research and capability.
• Horizon Program: The goal of the Horizon Program is to drive organic incubation in emerging areas covering products, platforms, solutions and capabilities. In order to achieve this objective, we are investing in key areas such as AI, AR/VR, IoT, cloud computing, software- defined everything, autonomous vehicle, cybersecurity, digital experience, digital marketing and commerce and Industry 4.0. During the year ended March 31, 2019 we funded 16 themes/areas as part of this program.
• Crowdsourcing (Topcoder): A community and crowdsourcing platform with of over 1.5 million developers, designers, data scientists, and testers. Topcoder provides focused enterprise offerings around AI/ML and Analytics, Digital Experience (DX), Quality as a Service (QaaS), Workforce Transformation, Talent as a Service (TaaS), and Hybrid (Certified) Communities. We are also using the Topcoder Hybrid Crowd Platform to scale and engage ‘in-house’ talent pools in emerging technologies such as Full Stack, DevOps, AI/ML, Cloud, Analytics & other Digital skills with our internal TopGear hybrid community. It also acts as a structured learning path for accounts providing hands-on experience across 200+ skills. We are creating a pool of Challenge Architects, Topcoder Co-pilots & Reviewers to expand the percentage of work delivered through crowdsourcing.
• M&A: Acquisitions are key enablers for us and drive our capability to build industry domain, focus on key strategic areas, strengthen our presence in emerging technology areas, including Digital, and increase market footprint in newer markets. We focus on opportunities where we can further develop our domain expertise, specific skill sets and our global delivery model to maximize service and product enhancements and create higher margins. We also evaluate business units to determine if divestures would maximize our focus on key priorities.
Operating Segment OverviewOur business comprises of the IT Services, IT Products and ISRE segments. The ISRE segment consists of IT services offerings to ISRE Customers. Effective October 1, 2018, we carved out ISRE as a separate segment from our global IT Services business. We made this decision because we changed our strategy for providing services to ISRE Customers. Historically, projects in our ISRE business have been primarily SI projects that have complex deliverables and, compared to our IT Services segment, longer working capital cycles and different downstream processes, including billing and collections. Most ISRE deals come in the form of a tender process, with little room to negotiate the terms and conditions. We have pivoted our ISRE strategy to focus more on consulting and digital engagements and to be selective in bidding for SI projects with long working capital cycle.
Additionally, we provide our IT Services segment revenue and results by industry verticals. Our industry verticals are subject to change and may vary depending on industry trends.

22 Annual Report 2018-19
IT Services OfferingsWe are a leading provider of IT services to enterprises across the globe. We provide a range of services, which include digital strategy advisory, customer-centric design, technology consulting, IT consulting, custom application design, development, re-engineering and maintenance, systems integration, package implementation, cloud infrastructure services, business process services, cloud, mobility and analytics services, research and development and hardware and software design. Our key service offerings are outlined below
DIGITAL
44% 8%
Industrial and Engineering
Services (I&ES)
Modern Application
Services(MAS)
Wipro has been a strategic partner in the transformation of the application landscape of its clients by offering integrated business solutions that span across enterprise applications and digital transformation to security and testing. MAS is comprised of four units: the Enterprise Applications and Modernization (“EAM”) unit, the Application Engineering and DevOps (“AED”) unit, the Enterprise Architecture unit and the Appirio Cloud Services unit. These units will leverage themes such as AI/Cognitive Systems, IoT, blockchain and open source to enable smart application technology, or “Smart Applications”.MAS focuses on driving application transformation with contextual solutions for our customers from front office to back office by combining consulting, design and development, continuous testing and integration, automation and operational excellence across all industries.
The Engineering Services team at Wipro facilitates 350+ clients across multiple industries / verticals with a platform to innovate and engineer products, platforms and technologies at scale. This is termed as “Engineering NXT” by Wipro.
Over the last 2 decades, I&ES has engineered innovative customer experiences, personalized products and technologies for new markets, integrated next-generation technologies, facilitated faster time to market and ensured global product compliance, all by making use of technologies around connectivity (Wireless technologies), Cloud and Data Platforms, Systems Design, VLSI, next generation Software Development and Testing, EDS, PLM, IoT and Industry 4.0.
Across Wipro and led by our digital services unit, Wipro Digital, we help our customers with the full, end-to-end imagination to execution lifecycle that enable new digital product and service experiences. By changing legacy systems and enabling new enterprise agility, processes, tools and mindsets, we help our customers to “be digital”, not just do digital. In the last year, we opened additional digital pods, bringing our total number of pods to 19 and supporting our “No-Shore” model of delivery with distributed teams around the world. We have also brought more integrated capability by aligning our digital consulting practice fully under Wipro Digital now.
The percentages that appear in the above infographic represent the contribution of revenue of the service offering to the overall IT Services revenue

Wipro Limited 23
14%
4%
23% 7%
Digital Operations and
Platforms (DO&P)
CYBERSECURITY & RISK SERVICES
(CRS)
Cloud andInfrastructure Services (CIS)
Data,Analytics
and AI (DAAI)
Wipro is a leader in providing next generation technology-led business process services to global enterprises. Our process excellence and domain expertise helps us drive transformation via reimagine, redesign & standardization. Combined with Enterprise Operations Transformation we help clients leverage and deliver benefits from RPA, AI, analytics and other emerging technologies.
Some of our leading offerings: » Digital Customer Experience which leverages AI,
Chatbots, Augmented & Virtual Reality. » Supply Chain Management 10+ million annual
transactions for 30+ languages across 16 global centers.
» Finance and Accounting 130+ global clients with leadership rating by Gartner and Everest.
» Protect the Internet to moderate public domain web content.
» Geospatial Information Services to manage intuitive navigation maps creation, data and route consistency across geographies.
CIS is an end-to-end cloud and IT infrastructure services provider that helps global clients accelerate their digital journey. Our offerings include Cloud and Datacenter, Software Defined, DevOps & Micro-services, Digital workplace services, ‘connected intelligence’ services including Digital intent-aware network, IoT and 5G across advisory & consulting, transformation and system integration, testing and managed services. We have a presence across 50+ countries with over 700 clients and 21 delivery centers. Our investment in IP, a comprehensive partner ecosystem and our skills in emerging technologies like software-defined everything, opensource, DevOps and IoT ensure that we are a one-stop shop for all cloud and IT infrastructure needs.
DAAI is a preferred partner in customer journey to transform into an intelligent enterprises by automating decision making, powered by insights and driven by rich datasets. As a trusted enabler of Data & Insights transformation for our customers, Wipro leverages AI, machine learning, advanced analytics, big data and information management platforms and capabilities. We are committed to deliver value across the customers’ journey from data to decisions focusing on:
» Insights transformation – Transform legacy decision- making processes into a modern, elastic, and AI & ML driven insights-centric fabric that enable smarter processes.
» Data transformation - Helps adopt modern data platforms, processes and methods in on premise, cloud & hybrid ecosystem to support Analytics, Machine Learning and AI workloads through a set of themes that brings transformative change to the data landscape by infusing AIdata landscape by infusing AI
CRS enables next generation global enterprises to enhance their business resilience through intelligent and integrated risk approach with modernizing the security at the core. CRS enables the customers in defining their cyber strategy and the cybersecurity needs, envisaging best-recommended practices across the people, process and technology. Leveraging a large pool of experienced security professionals and a global delivery model that leverages our Cyber Defense Centers (CDC), we execute implementation projects and deliver managed and hosted services backed by our Cyber Defense Platform (CDP). Our unique top-down risk-based approach delivers innovative security platforms for better scalability, improved cost efficiency and greater agility.

24 Annual Report 2018-19
IT Services Industry Verticals
The BFSI business unit serves over 100 clients globally across Retail Banking, Investment Banking, Capital Markets, Wealth Management and Insurance. We deliver success to our clients by leveraging state-of-the-art technology and process transformation solutions, service design innovation, unparalleled domain expertise, IP and integrated offerings and end-to-end consulting services. We also help our clients adapt to the digital world by harnessing the power of emerging technologies like the cloud, cognitive computing, hyper-automation and robotics.
Banking Financial
Services and Insurance
(BFSI)
31%
Health BU mission is to help organizations solve real world health problems to improve people’s lives. Health BU is dedicated to helping health and life sciences companies rethink, reshape and restructure their business to increase their competitiveness in the industry. We help companies realize value in their core businesses by fueling innovation born in collaboration, and help recalibrate their business toward more accountable, affordable and accessible care.
Health Business
(Health BU)13%
CBU offers a full array of innovative solutions and services that cater to the business value chain where the consumer is at the core, through a blend of domain knowledge, technology expertise and delivery excellence. We offer an integrated environment that allows organizations to model, optimize, forecast, budget, execute, manage and measure product, customer and service performance across the globe to enable our clients to maximize value from their technology investments.
Consumer Business
(CBU)16%
Manufacturing BU help transform leading manufacturing organizations across the globe to drive enterprise and business transformation, and accelerate revenue. By coupling our digital and domain expertise across industrial and process manufacturing, automotive and aerospace and defence, we help our customers transform processes, product design, supply chain, and aftermarket/services to achieve digital transformation. Our ongoing investments in emerging technologies like autonomous systems and robotics, Industry 4.0, blockchain and industrial IoT are helping customers innovate faster and maximize their business value.
Manufacturing (MFG)
8%
Technology (TECH)
13%
Companies across the high-tech value chain; from the silicon providers to software companies,
are serviced by Wipro’s Technology business unit. We help our customers transition
to new business models by helping them build digital products and
solutions,digitize their back office and front office operations
as well as their sales and marketing channels, and
enable their servitization strategy. With extensive focus on
5G, AI Cloud Native based solutions we bring together an ecosystem of
expertise to build IP,platforms and domain/ industry-focused solutions that help our
customers reach their business goals.
Energy, Natural Resources, Utilities, Engineering & Construction (ENU): Our
deep domain, digital, consulting and technology expertise have helped the
business become a trusted partner to over 75 leaders in the Oil and
Gas, Mining,Water, Natural Gas, Electricity, Airports,
Ports, Engineering and Construction industries
across the globe. We provide consulting, engineering,
technology and business processes services expertise to enable business
value and digital transformation for our customers.
Energy, Natural Resources and
Utilities (ENU)
13%
Communications (COMM)
6%
Wipro has been enabling the digital transformation journey of Communications
Service Providers (“CSPs”) across the globe as they transform to become
Digital Service Providers. Our digital business solutions are
tailored for CSPs customer context, with capabilities
in technologies such as 5G, Cloud, SDN/NFV, AI, IoT,
blockchain and cybersecurity, and a digital workplace in order to focus
on new ways of working. We enable the convergence of network, IT and business
process across the entire customer lifecycle.
Our IT Services business is organized into seven industry verticals:
The percentages that appear in the above infographic represent the contribution of revenue of the Business Units to the overall IT Services revenue

Wipro Limited 25
IT Services CompetitionThe market for IT services is competitive and rapidly changing. Our competitors in this market include global consulting firms and IT services companies as well as local and niche services providers.
The following factors differentiate us from our competition:
1. The comprehensive and integrated suite of IT solutions, including digital strategy advisory, customer-centric design, technology consulting, IT consulting, custom application design, development, re-engineering and maintenance, systems integration, package implementation, cloud infrastructure services, mobility and analytics services, business process services, research and development and hardware and software design.
2. Wipro Digital’s integrated propositions in customer mapping and interaction, seamless integration and data science and insight differentiate its approach with customer journey engineering.
3. Our organizational culture of innovation and our early start in deploying cutting edge platforms and technologies that drive hyper-automation and achieve industrialization of service delivery, such as Wipro HOLMESTM.
4. Our investments in developing IP across products, platforms, frameworks, solutions, components, accelerators, tools and apps that enable us to provide standardized solutions to our customers and obtain enormous time-to-market advantage.
5. Our decades of experience in serving in the IT business, proven track record of delivery excellence and satisfied customers who recommend our services to other corporations.
6. Our ability to provide an entire range of research and development services from concept to product realization.
7. Our global delivery model, that leverages our global, regional and local near-shore development centers and collaborative technologies to help us better serve our clients in this modern technology era.
8. Our ability to access, attract and retain highly skilled personnel across key markets.
9. Our emphasis on engaging the culture of our new age acquisitions and integrating these technologies with our executional experience and service offerings to maximize synergies for our clients.
10. Our ability to offer opportunities to work with cutting edge technologies and focus on training is a critical differentiator to the quality of our manpower.
11. The Wipro brand that is recognized globally for its comprehensive portfolio of services, a practitioner’s approach to delivering innovation and an organization-wide commitment to sustainability.
12. Our commitment to the highest levels of corporate governance.
IT Products
In order to offer comprehensive IT system integration solutions, we use a combination of hardware products (including servers, computing, storage, networking and security), related software products (including databases and operating systems) and integration services. We maintain a presence in the hardware market by providing suitable third-party brands as a part of our solutions in large integrated deals. Our range of third-party IT Products is comprised of Enterprise Platforms, Networking Solutions, Software Products, Data Storage, Contact Center Infrastructure, Enterprise Security, IT Optimization Technologies, Video Solutions and End-User Computing solutions.
IT Products Customers
We provide our offerings to enterprises in all major industries, primarily in the India market, including government, defense, IT and IT-enabled services, telecommunications, manufacturing, utilities, education and financial services sectors. We have a diverse range of customers, none of whom individually account for more than 10% of our overall IT Products segment revenues.
IT Products Competition
Our competitors in the IT Products market include global system integrators as well as local and niche services providers operating in specific geographies like India. One of the major challenges we encounter is margin pressure due to competitive pricing. Achieving mindshare and market share in a crowded market place requires differentiated strategies on pricing, branding, delivery and products design. In the system integration market, we believe we are favorably positioned based on our brand, quality leadership, expertise in target markets and our ability to create customer loyalty by delivering value to our customers. The following factors differentiate us from our competition:
1. Our decades of experience in serving in the IT business, proven track record of delivery excellence and satisfied customers who recommend our services to other corporations.
2. Our deep understanding of the market especially in the India
3. Our trusted ability to provide impartial advice on selection of products.
4. The Wipro brand that is recognized for serving the Indian market of over seventy years.
5. Our commitment to environmental sustainability as well as deep engagement with communities.

India State Run Enterprise (ISRE) The ISRE segment consists of IT Services offerings to Departments or Ministries of the GoI or the Indian State Governments, as well as to corporate entities where more than 51% of the paid-up capital is held by the GoI or any Indian State Government, either individually or jointly (i.e., a Public Sector Undertaking). In certain cases, corporate entities which are held by the Central / State Government (more than 51%), in turn hold more than 51% stake of paid-up capital in other entities (i.e., a controlling stake), such other entities are also classified as an ISRE.
We will be using our strong domain practice in areas like taxation and e-governance, oil and gas and utilities, along with our strong partner system to work with large companies in the government sector. In the BFSI sector, we aim to replicate our successes in areas such as core banking transformation, and consulting.
ISRE Customers
We have customers across the GoI, Indian State Governments and in industry segments such as BFSI and ENU in the form of corporate entities where more than 51% of the paid-up capital is held by the government.
ISRE Competition
In the ISRE sector, our competition comes from both local and global IT services companies, including large global consulting firms. For the GoI segment, several small companies have entered the market as disruptors, with most of these small companies focused on penetration strategy. The following factors differentiate us from our competition:
1. Our deep technology knowledge and domain expertise specifically in BFSI and ENU
2. Our strong partnership with key alliance partners including hardware and software partners
3. Prior experience in successfully delivering key marquee projects to ISRE customers
Good Governance and Management Practices Corporate governanceAt Wipro, Corporate Governance is more than just adherence to the statutory and regulatory requirements. It is equally about focusing on voluntary practices that underlie the
highest levels of transparency and propriety.Our Corporate Governance philosophy is put into practice at Wipro through the following four functional layers, namely,
Governance by Shareholders
Governance by Board of Directors
Governance by Sub-Committees of Board of Directors
Audit, Risk and Compliance Committee
Board Governance, Nomination and Compensation Committee, which also acts as CSR Committee
Strategy Committee
Administrative, Shareholders and Investors Grievance Committee (Stakeholders Relationship Committee)
Governance by Management Process
Risk Management
Code of Business Conduct
Compliance Framework
The Ombuds process
Governance by Management Process
Ensuring regulatory compliance and adherence to standards is of utmost importance to Wipro. Wipro has a compliance framework and the objective of this framework is to deploy appropriate practices and processes to ensure compliance with all applicable laws and regulations, globally and to ensure compliance risks are identified, and adequately mitigated. The Compliance framework includes the Global Statutory Compliance Policy and Certification Process as approved by the Audit Committee and Board of Wipro Limited. Electronic dashboards, self-deceleration checklists on statutory obligations and audits are some of the mechanisms to monitor and manage compliance in Wipro.
Governance by Code of Business Conduct
Wipro has an organization wide Code of Business Conduct which reflects general principles to guide employees in making ethical decisions. The Code outlines fundamental ethical considerations as well as specific considerations that need to be maintained for professional conduct. More details are provided in the Corporate Governance report.
Risk ManagementRisk Management at Wipro is an enterprise wide function backed by a qualified team of specialists with deep industry experience who develop frameworks and methodologies for assessing and mitigating risks.
26 Annual Report 2018-19

Wipro Limited 27
• Orange Book by UK Government Treasury
• COSO; Enterprise Risk Management-Integrating with Strategy and Performance (2017) by Tread way Commission
• AS/NZS ISO 31000:2009 Risk Management – Principles and Guidelines by AUS/NZ Standards Board
• ISO – ISO 31000:2018, Risk management – Guidelines
Risk Management
Standard ERM Framework
People, Process,Technology
OversightTone @The Top
Risk Categories
Governance Strategic Operational Compliance Reporting
Identification Analysis Evaluate MonitoringTreatmentRisk
Ownership
Business Units
& Functions
Risk Management
Team
Audit Committee of
the Board
Devel
op &
dep
loy
Polic
y/Fr
amew
ork Continuous Im
provement
Framework
Management
Governance
Major risks Mitigation plan
Information Security and Cyber Security breaches that could result in systemic failures, loss, disclosure of confidential information.
Based on the perceived risks, effective security controls implemented to detect, prevent and remediate threats. Program to continuously monitor the effectiveness of the controls have been implemented to effectively sustain the security controls. Based on the changing threat landscape, focus is on continuous improvement of efficacy of the security controls with adoption of new processes and latest technology solutions.
Intellectual Property violating or misusing our clients’ intellectual property rights or for breaches of third-party intellectual property rights or confidential information in connection with services to our clients.
Elaborate program exists and is enhanced on an ongoing basis, to assess and mitigate the risks on account of intellectual property, both Customer and Wipro owned. The program is crucial and assists in identifying, monitoring, governing and creating awareness across the organization.
Data Privacy regulations (such as General Data Protection Regulation in Europe) relating to personal information dealt with both by and on behalf of Wipro increases the risk of non-compliance.
The Data Privacy program has been augmented keeping into consideration privacy regulatory requirements, with specific emphasis to revalidate all existing frameworks, policies and processes that can be leveraged by respective support function and delivery teams, covering all applicable geographies and areas of operations.
Wipro has implemented the Data process/ Data transfer agreements with customers as well as vendors for flow down DTA/DPA to ensure GDPR governance of personal data. We have also strengthened wipro systems to strengthen personal data governance from controller perspective. Also set-up a process to handle subject access requests related to personal data. Implemented Personal incident management process to ensure speedy governance on personal data related incidents; if any.
Regulatory Compliances covering various federal, state, local and foreign laws relating to various aspects of the business operations are complex and non- compliances can result in substantial fines, sanctions etc.
A program on statutory compliance is in place with the objective to track all applicable regulations, obligation arising out of the same and corresponding action items that requires to be adhered to ensure compliance along with necessary workflows enabled. The program is monitored and regularly reviewed to ensure compliance.
Risk Management Framework
The risk landscape in the current business environment is changing dynamically with the dimensions of Cyber security, Information Security and Business Continuity, Data Privacy and Large Deal Execution figuring prominently in the risk charts of most organizations. To effectively mitigate these risks, we have employed a risk management framework, which helps proactively identify, prioritize and mitigate risks. The framework is based on principles laid out in the four globally recognized standards as below

28 Annual Report 2018-19
Grievance Redressal
Wipro is committed to the highest standards of openness, probity and accountability. Having a robust whistle-blower policy that allows employees and other stakeholder to raise concern in confidence is an essential condition for a transparent and ethical company. This ensures a robust mechanism is in place, which allows employees, non- employees, partners, customers, suppliers and other members of public to voice concern in a responsible and effective manner.
Under Ombuds Policy adopted by each of our businesses, all complaints are addressed to Ombuds and investigative findings are reviewed and approved by Chief Ombudsperson who reports into the Compliance Committee. Dedicated email address ([email protected]) has been created to facilitate receipt of complaints and for ease of reporting. The company has a 24x7 muntilingual hotline where concerns can be communicated through telephone call. All employees and stakeholders can also register their concerns through web-based portal at www.wiproombuds.com. The toll-free numbers provides global languages options. Following an investigation, a decision is made by
Functional and Operational risks arising out of various operational processes
Appropriate risk and control matrices have been designed for all critical business processes and both design and effectiveness is tested under the SOX & Internal Financial Control Programs and theme based assessments.
Service Delivery risks relating to complex programs providing end-to-end business solutions for our clients.
Risk Management framework has been deployed for large value deals to assess solution fitness, credit risks, financial risks, technology risks among other risk factors. Additionally contract compliance programs are in place with regular reviews, early warning systems as well as customer satisfaction surveys to assess the effectiveness of the service delivery and early detection of any risks arising from the service delivery.
Work place environment, Safety and Security
Strong Control measures have been put in place to ensure employee health and safety. Awareness is created about various issues and are communicated on regular basis to employees. Wipro maintains Zero Tolerance for violators of code of business conduct. Also employees are provided with an online web portal to log in concerns relating to various subjects including environment and safety in the work place.
Business Continuity risks arising out of global disruptions like natural disasters, IT outages, Cyber, pandemic, terror and unrest, power disruptions etc. which will challenge or impact the availability of People and process, Technology and Infrastructure.
Effective implementation of Business Continuity Management System (BCMS) and framework aligned to ISO 22301 across global locations, accounts and service functions. The framework will ensure a robust BCM planning to manage any crisis which could disrupt People and process, Technology and Facility level disruption effectively and efficiently.
Geo political risk arising out of entering into contracts in a new country.
An assessment of doing business in a new country is done in order to analyze the feasibility of doing business based on the country’s economic stability, corruption index, investment opportunities, ease of doing business and physical safety.
Risk of Protectionism policies impacting the business
Appropriate measures are being taken to provide uninterrupted high quality services to the clients at all geographies. Additionally, localization efforts are being prioritized. More than 64% of USA workforce are local. In Latin America almost all our employees are local.
the appropriate authority on the action to be taken basis the findings of the investigation. In case the complainant is non-responsive for more than 15 days, the concern may be closed without further action.
1,460 complaints were received via the Ombuds process and 1,414 complaints were closed in FY 2019. All cases were investigated and actions taken as deemed appropriate. Based on self- disclosure data, 23.5% of these were reported anonymously. The top categories of complaints were people processes at 38% and workplace concerns and harassment at 22%. The majority of cases (73%) were resolved through engagement of human resources or mediation, or closed since they were unsubstantiated.
Wipro has a policy and framework for employees to report sexual harassment cases at workplace and our process ensures complete anonymity and confidentiality of information. Adequate workshops and awareness programmes against sexual harassment are conducted across the organization. The information on number of complaints is provided at page 126 of the report.

Wipro Limited 29
production-oriented equipment and tools. For the IT services business, these are the fixed assets like buildings, IT hardware and telecommunication equipment. The deployment of the capital is adequately represented in financial capital and through impacts to natural capital. Hence this report does not cover manufactured capital separately.
Scope of reporting
Natural Capital
India: 58 locations (includes 3 data centers) representing 77% of our workforce. 34 of these locations are owned (includes 3 data centers) and the balance 20 are leased. Overseas: 202 office locations. Most locations are leased and used as marketing/liaison offices.
Aspect Aspect Boundary
Energy India (offices and DC’s) –100% coverage – ActualsOverseas offices – 100% coverage - Estimated
Water& Waste
India - 98% coverage - Actuals (Estimated for the balance leased spaces)Overseas - Not reported
Other capitals
Financial, Human, Intellectual and Social & Relationship Capital
Entire organization i.e. Wipro Limited.
Linkage to Other Reports
Business Responsibility Report, Sustainability Report, Carbon Disclosure Project & United Nation Global Compact (UNGC) Communication On Progress (COP).
Capitals and Value CreationIn this section we cover Wipro’s approach to value creation across the five capitals namely Financial, Human, Intellectual, Social & Relationship and Natural.
a. Financial Capital is broadly understood as the pool of funds available to an organization. Financial capital also serves as a medium of exchange that can obtain value through conversion into other forms of capital.
b. Human Capital is broadly people’s competencies, capabilities and experience, being continuously innovative and contribute to the organizations shared goals and values.
c. Intellectual Capital is broadly organizational, knowledge-based intangibles, including intellectual property, such as patents, copyrights, software, rights and licences and ‘organizational capital’ such as tacit knowledge, systems, procedures and protocols.
d. Social & Relationship Capital is broadly the institutions and the relationships within and between communities, groups of stakeholders and other networks, and the ability to share information to enhance individual and collective well-being such as customers, investors and suppliers.
e. Natural Capital is broadly all renewable and non-renewable environmental resources and processes that provide goods or services that support the past, current or future prosperity of an organization. It includes air, water, land, minerals, forests, biodiversity and eco-system health.
Manufactured Capital is broadly seen as human-created,
Business Model Corporate Governance
EX
TER
NA
L E
NV
IRO
NM
EN
TIN
PU
T C
AP
ITA
LS
Financial
Intellectual
Manufactured
Human
Natural
Social &Relationship
ConnectedIntelligence
StrategyTrust
VisionMissionValues
Tale
nt
Stakeholder Engagement
OU
TCO
ME
Open Innovation
IP and Platforms
Customer solutions
and services
BusinessTransformation
Modernization

30 Annual Report 2018-19
Financial Capital (Figures in ` million except otherwise stated)
Consolidated results FY 2018 FY 2019 YoY Change
Revenue1 546,359 589,060 7.8%
Cost of revenue (385,575) (413,033) 7.1%
Gross profit 160,784 176,027 9.5%
Selling and marketing expenses (42,349) (44,510) 5.1%
General and administrative expenses (34,141) (35,951) 5.3%
Other Operating Income - 4,344 100.0%
Operating Income 84,294 99,910 18.5%
Finance Expenses (5,830) (7,375) 26.5%
Finance and Other Income 23,999 22,923 (4.5%)
Income Taxes 22,390 25,242 12.7%
Profit attributable to equity holders 80,081 90,031 12.4%
As a Percentage of Revenue
Gross Margin2 29.4% 29.7% 0.2%
Selling and marketing expenses 7.8% 7.6% (0.2%)
General and administrative expenses 6.2% 6.1% (0.1%)
Operating Margin2 15.4% 16.8% 1.4%
Earnings per share-Basic (`)3 12.64 14.99 18.6%
Earnings per share-Diluted (`)3 12.62 14.95 18.5%
1. For segment reporting, we have included the impact of exchange rate fluctuations in revenue. Excluding the impact of exchange rate fluctuations, revenue, as reported in our statements of income, is ` 544,871 million and ` 585,845 million for the years ended March 31, 2018 and 2019 respectively. Further, finance income on deferred consideration earned under multi-year payment terms in certain total outsourcing contracts is included in the revenue of the respective segment and is eliminated under reconciling items.
2. Gross margin and operating margin as a percentage of revenue for year ended March 31, 2019 have been calculated by including Other Operating Income with Revenue.
3. Earnings per share for the year ended March 31, 2018, has been proportionately adjusted for the bonus issue in the ratio of 1:3 as approved by the shareholders on February 22, 2019.
Revenues: Our revenue increased by 7.8%. The IT Services segment revenue increased by 9.8%. This growth was led by two of our largest industry verticals, BFSI, CBU and was also a result of depreciation of the Indian Rupee against foreign currencies, including the U.S. Dollar, Euro, United Kingdom Sterling Pound and Canadian Dollar. The growth in the BFSI and CBU industry verticals was a result of increasing our differentiated offerings across our geographic and digital capabilities. Growth was partially offset by a decline in revenues from the Health BU, due to uncertainties around regulatory changes relating to the Affordable Care Act. Revenue of IT products segment declined by 31.6%. The decrease in IT Products segment revenue was primarily due to our focus on being a system integrator of choice where we provide IT products as a complement to our IT services offerings rather than sell standalone IT products. Revenue of the ISRE segment declined by 20.1%, which was primarily due to completion of large engagements and cost overruns in existing engagements.
Profitability: In absolute terms, cost of revenues increased by 7.1% primarily because of increase in employee compensation due to the impact of salary increases, increase in headcount during the year, increase in subcontracting/technical fees and depreciation of the Indian Rupee against foreign currencies, including the U.S. Dollar, Euro, United Kingdom Sterling Pound and Canadian Dollar. This was partially offset by a reduction in the cost of hardware and software and increases in depreciation, amortization and impairment charges, primarily as a result of the sale of our datacenter business, during the fiscal year ended March 31, 2019. As a result of the foregoing factors, our gross profit as a percentage of our total revenue increased by 0.2%.
Selling and Marketing expenses: Our selling and marketing expenses as a percentage of total revenue decreased from 7.8% for the year ended March 31, 2018 to 7.6% for the year ended March 31, 2019. In absolute terms, selling and marketing expenses increased by 5.1% primarily because

Wipro Limited 31
of salary increases and depreciation of the Indian Rupee against foreign currencies including U.S. Dollar, Euro, United Kingdom Sterling Pound and Canadian Dollar. These increases have been offset by the decrease in travel and marketing and brand building charges in the year ended March 31, 2019 as compared to the year ended March 31, 2018.
General and Administrative expenses: Our general and administrative expenses as a percentage of revenue decreased from 6.2% for the year ended March 31, 2018 to 6.1% for the year ended March 31, 2019. In absolute terms, general and administrative expenses increased by 5.3%, primarily due to charges paid against a one-time settlement of a legal claim against the company included under “Others.” This was offset by a decrease in the lifetime expected credit loss, deferred contract cost and travel.
Other Operating income: During the year ended March 31, 2019, we concluded the sale of our hosted datacenter services business, Workday and Cornerstone OnDemand, and reduced our holding in WAISL (formerly known as Wipro Airport IT Services Limited). Net gain from the sale of our hosted datacenter services business, Workday and Cornerstone OnDemand, and reduction in our holdings in WAISL (formerly known as Wipro Airport IT Services Limited), in the total amount of ̀ 4,344 million, has been recorded as “Other operating income.”
As a result of the foregoing factors, our operating income increased by 18.5%, from ` 84,294 million for the year ended March 31, 2018 to ` 99,910 million for the year ended March 31, 2019. As a result of the above, our results from operating activities as a percentage of revenue (operating margin) increased by 1.4% from 15.4% to 16.8%.
Finance expenses: Our finance expenses increased from ` 5,830 million for the year ended March 31, 2018 to ` 7,375 million for the year ended March 31, 2019. This increase is primarily due to an increase of ` 2,165 million in interest expense, which was partially offset by a decrease of ` 620 million in exchange loss on foreign currency borrowings and related derivative instruments.
Finance and Other income: Our finance and other income decreased from ` 23,999 million for the year ended March 31, 2018 to ` 22,923 million for the year ended March 31, 2019. The decrease is due to a reduction in net gains from investments by ` 3,283 million during the year ended March 31, 2019 as compared to the year ended March 31, 2018, resulting from a decrease in the average investments held during the year.
Income Taxes: Our income taxes increased by ` 2,852 million from ` 22,390 million for the year ended March 31, 2018 to ` 25,242 million for the year ended March 31, 2019. Please refer to Note 16 of the Notes to Consolidated Financial Statements for further information. Our effective tax rate has narrowly increased from 21.8% for the year ended March 31, 2018 to 21.9% for the year ended March 31, 2019.
Profit: Profit attributable to non-controlling interest has increased from ` 3 million for the year ended March 31, 2018 to ` 142 million for the year ended March 31, 2019.
As a result of the foregoing factors, our profit attributable to equity holders increased by ` 9,950 million or 12.4%, from ` 80,081 million for the year ended March 31, 2018 to ` 90,031 million for the year ended March 31, 2019.
Performance Highlights – IT Services (Figures in ` million except otherwise stated)
IT Services FY 2018 FY 2019 YoY Change
Revenue1 517,716 568,253 9.8%
Gross Profit 157,999 178,056 12.7%
Selling and Marketing expenses (41,874) (44,207) 5.6%
General and administrative expenses (32,966) (35,690) 8.3%
Other Operating Income - 4,344 100.0%
Operating Income2 83,159 102,503 23.3%
As a Percentage of Revenue
Gross Margin3 30.5% 31.1% 0.6%
Selling and marketing expenses 8.1% 7.8% (0.3)%
General and administrative expenses 6.4% 6.3% (0.1)%
Operating Margin3 16.1% 17.9% 1.8%
1. For the purpose of segment reporting, we have included the impact of exchange rate fluctuations amounting to ` 1,498 million and ` 3,208 million for the years ended March 31, 2018 and 2019 respectively, in revenue. Further, finance income on deferred consideration earned under multi-year payment terms in certain total outsourcing contracts is included in the revenue of the respective segment and is eliminated under reconciling items.
2. Includes Other Operating Income, which is being included to present the effect from the sale of hosted data center business, Workday and Cornerstone OnDemand, in the year ended March 31, 2019.
3. Gross margin and operating margin as a percentage of revenue have been calculated by including Other Operating Income with Segment Revenue.
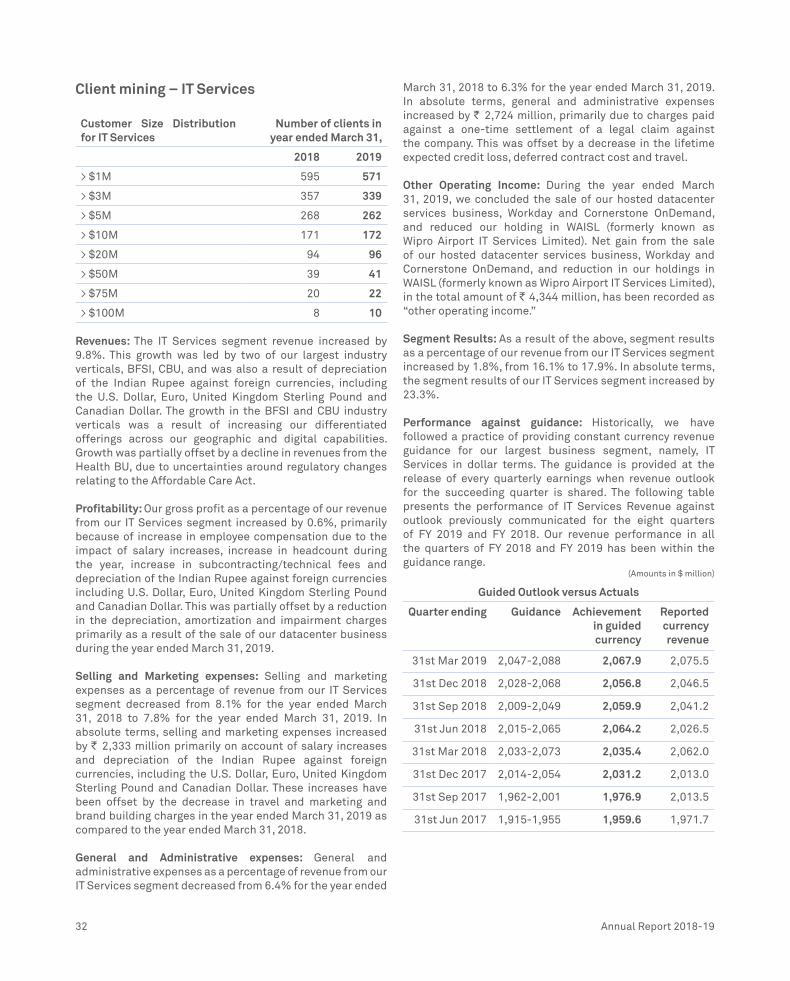
32 Annual Report 2018-19
Client mining – IT Services
Customer Size Distribution for IT Services
Number of clients in year ended March 31,
2018 2019
> $1M 595 571
> $3M 357 339
> $5M 268 262
> $10M 171 172
> $20M 94 96
> $50M 39 41
> $75M 20 22
> $100M 8 10
Revenues: The IT Services segment revenue increased by 9.8%. This growth was led by two of our largest industry verticals, BFSI, CBU, and was also a result of depreciation of the Indian Rupee against foreign currencies, including the U.S. Dollar, Euro, United Kingdom Sterling Pound and Canadian Dollar. The growth in the BFSI and CBU industry verticals was a result of increasing our differentiated offerings across our geographic and digital capabilities. Growth was partially offset by a decline in revenues from the Health BU, due to uncertainties around regulatory changes relating to the Affordable Care Act.
Profitability: Our gross profit as a percentage of our revenue from our IT Services segment increased by 0.6%, primarily because of increase in employee compensation due to the impact of salary increases, increase in headcount during the year, increase in subcontracting/technical fees and depreciation of the Indian Rupee against foreign currencies including U.S. Dollar, Euro, United Kingdom Sterling Pound and Canadian Dollar. This was partially offset by a reduction in the depreciation, amortization and impairment charges primarily as a result of the sale of our datacenter business during the year ended March 31, 2019.
Selling and Marketing expenses: Selling and marketing expenses as a percentage of revenue from our IT Services segment decreased from 8.1% for the year ended March 31, 2018 to 7.8% for the year ended March 31, 2019. In absolute terms, selling and marketing expenses increased by ` 2,333 million primarily on account of salary increases and depreciation of the Indian Rupee against foreign currencies, including the U.S. Dollar, Euro, United Kingdom Sterling Pound and Canadian Dollar. These increases have been offset by the decrease in travel and marketing and brand building charges in the year ended March 31, 2019 as compared to the year ended March 31, 2018.
General and Administrative expenses: General and administrative expenses as a percentage of revenue from our IT Services segment decreased from 6.4% for the year ended
March 31, 2018 to 6.3% for the year ended March 31, 2019. In absolute terms, general and administrative expenses increased by ` 2,724 million, primarily due to charges paid against a one-time settlement of a legal claim against the company. This was offset by a decrease in the lifetime expected credit loss, deferred contract cost and travel.
Other Operating Income: During the year ended March 31, 2019, we concluded the sale of our hosted datacenter services business, Workday and Cornerstone OnDemand, and reduced our holding in WAISL (formerly known as Wipro Airport IT Services Limited). Net gain from the sale of our hosted datacenter services business, Workday and Cornerstone OnDemand, and reduction in our holdings in WAISL (formerly known as Wipro Airport IT Services Limited), in the total amount of ` 4,344 million, has been recorded as “other operating income.”
Segment Results: As a result of the above, segment results as a percentage of our revenue from our IT Services segment increased by 1.8%, from 16.1% to 17.9%. In absolute terms, the segment results of our IT Services segment increased by 23.3%.
Performance against guidance: Historically, we have followed a practice of providing constant currency revenue guidance for our largest business segment, namely, IT Services in dollar terms. The guidance is provided at the release of every quarterly earnings when revenue outlook for the succeeding quarter is shared. The following table presents the performance of IT Services Revenue against outlook previously communicated for the eight quarters of FY 2019 and FY 2018. Our revenue performance in all the quarters of FY 2018 and FY 2019 has been within the guidance range.
(Amounts in $ million)
Guided Outlook versus Actuals
Quarter ending Guidance Achievement in guided currency
Reported currency revenue
31st Mar 2019 2,047-2,088 2,067.9 2,075.5
31st Dec 2018 2,028-2,068 2,056.8 2,046.5
31st Sep 2018 2,009-2,049 2,059.9 2,041.2
31st Jun 2018 2,015-2,065 2,064.2 2,026.5
31st Mar 2018 2,033-2,073 2,035.4 2,062.0
31st Dec 2017 2,014-2,054 2,031.2 2,013.0
31st Sep 2017 1,962-2,001 1,976.9 2,013.5
31st Jun 2017 1,915-1,955 1,959.6 1,971.7

Wipro Limited 33
Performance Highlights - IT Products
Our IT Products segment accounted for 3.3% and 2.1% of our revenue for the years ended March 31, 2018 and 2019, respectively, and 0.4% and (1.0)% of our operating income for each of the years ended March 31, 2018 and 2019, respectively.
(Figures in ` million except otherwise stated)
IT Products FY 2018 FY 2019
Revenue1 17,998 12,312
Gross Profit 1,483 (255)
Selling and Marketing expenses (248) (168)
General and administrative expenses (873) (624)
Operating Income 362 (1,047)
As a Percentage of Revenue:
Gross Margin 8.2% (2.1%)
Selling and Marketing expenses 1.4% 1.4%
General and administrative expenses 4.9% 5.1%
Operating Margin 2.0% (8.5%)
Business Unit Wise Performance (Figures in $ millions except otherwise stated)
Business unit Revenue FY 2018
Revenue FY 2019
Growth YoY% in reported currency
Growth YoY% in constant currency
Margins FY 2018
Margins FY 2019
BFSI 2,196 2,503 14.3% 16.1% 17.0% 19.3%
CBU 1,187 1,276 8.4% 9.8% 16.2% 18.8%
COMM 513 466 (9.2%) (5.4%) 9.6% 13.5%
ENU 1,034 1,040 1.1% 4.0% 11.9% 9.7%
HLS 1,136 1,075 (5.4%) (4.6%) 13.0% 11.5%
MFG 702 666 (4.2%) (2.6%) 15.2% 17.9%
TECH 1,127 1,094 0.8% 1.5% 19.9% 20.8%
Total 7,895 8,120 3.8% 5.4% 16.1% 17.9%
Geography Wise Performance(Figures in $ millions except otherwise stated)
Geo Revenue FY 2018
Revenue FY 2019
Growth YoY% in reported currency
Growth YoY% in constant currency
Americas 4,307 4,615 8.9% 9.6%
Europe 2,061 2,069 0.4% 2.6%
Rest of the World 1,527 1,436 (6.0%) (2.2%)
Total 7,895 8,120 3.8% 5.4%The YoY growth rates have been computed by adjusting revenues for the divestment of our hosted data center services business
1. For the purpose of segment reporting, we have included the impact of exchange rate fluctuations amounting to ` (12) million and ` (2) million for the years ended March 31, 2018 and 2019, respectively in revenue. Further, finance income on deferred consideration earned under multi-year payment terms in certain total outsourcing contracts is included in the revenue of the respective segment and is eliminated under reconcil-ing items.
Revenues: Our revenue from the IT Products segment decreased by 31.6%. The decline was primarily due to our focus on being a system integrator of choice where we provide IT products as a complement to our IT services offerings rather than sell standalone IT products.
Profitability: Our gross profit as a percentage of our IT Products segment revenue decreased by 10.3%, primarily because of cost escalation relating to depreciation of the Indian Rupee against the U.S. Dollar and increase in loss provisions in certain customer contracts.
Selling and Marketing Expenses: Selling and marketing expenses as a percentage of revenue from our IT Products segment has remained flat at 1.4%. In absolute terms, selling and marketing expenses decreased by ` 80 million, in line with reduction in revenues.
General and Administrative Expenses: General and administrative expenses as a percentage of revenue from our IT Products segment increased from 4.9% for the year ended March 31, 2018 to 5.1% for the year ended March

34 Annual Report 2018-19
31, 2019. In absolute terms, general and administrative expenses decreased by ` 249 million primarily on account of decreases in employee compensation and lifetime expected credit loss in our India business.
Segment Results: As a result of the above, in absolute terms, segment results of our IT Products segment recorded a loss of ` 1,047 million for the year ended March 31, 2019 as compared to a profit of ` 362 million for the year ended March 31, 2018.
Performance Highlights - ISRE
Our ISRE segment accounted for 2.0% and 1.5% of our revenue for the years ended March 31, 2018 and 2019, respectively, 0.5% and (1.8)% of our operating income for each of the years ended March 31, 2018 and 2019, respectively.
(Figures in ` million except otherwise stated)
ISRE FY 2018 FY 2019
Revenue1 10,694 8,544
Gross Profit 1,559 (1,382)
Selling and Marketing expenses (379) (294)
General and administrative expenses (726) (153)
Operating Income 454 (1,829)
As a Percentage of Revenue:
Gross Margin 14.6% (16.2%)
Selling and Marketing expenses 3.5% 3.4%
General and administrative expenses 6.8% 1.8%
Operating Margin 4.2% (21.4%)
1. Finance income on deferred consideration earned under multi-year pay-ment terms in certain total outsourcing contracts is included in the reve-nue of the respective segment and is eliminated under reconciling items.
Revenues: Our revenue from the ISRE segment decreased by 20.1%. This was primarily due to scaling down of large engagements and delay in completion of projects.
Profitability: Our gross profit as a percentage of our ISRE segment revenue decreased by 30.8%, primarily on account of cost overruns in existing engagements.
Selling and Marketing Expenses: Selling and marketing expenses as a percentage of revenue from our ISRE segment remained flat from 3.5% for the year ended March 31, 2018 to 3.4% for the year ended March 31, 2019. In absolute terms, selling and marketing expenses decreased by ` 85 million, which is in line with reduction in revenues.
General and Administrative Expenses: General and administrative expenses as a percentage of revenue from our ISRE segment decreased from 6.8% for the year ended March 31, 2018 to 1.8% for the year ended March 31, 2019. In absolute terms, general and administrative expenses
decreased by ` 573 million. This was primarily on account of reduction in lifetime expected credit loss.
Segment Results: As a result of the above, in absolute terms, segment results of our ISRE segment recorded a loss of ` 1,829 million for the year ended March 31, 2019 as compared to a profit of ` 454 million for the year ended March 31, 2018.
Resource Allocation StrategyCash generated from operations is our primary source of liquidity. We believe that our cash and cash equivalents along with cash generated from operations will be sufficient to meet our working capital requirements as well as repayment obligations with respect to debt and borrowings. Our choices of sources of funding will be driven with the objective of maintaining an optimal capital structure.
We maintain a debt/borrowing level that we have established through consideration of a number of factors including cash flow expectations, cash required for operations and investment plans. We continually monitor our funding requirements, and strategies are executed to maintain sufficient flexibility to access global funding sources, as needed. Please refer to Note 11 of our Notes to the Consolidated Financial Statements for additional details on our borrowings.
As of March 31, 2019, we had cash and cash equivalent and short-term investments of ` 379,245 million. Cash and cash equivalent and short-term investments, net of debt, was ` 279,778 million.
In addition, we have unutilized credit lines of ̀ 41,955 million. To utilize these lines of credit, we require the consent of the lender and compliance with certain financial covenants. We have historically financed our working capital and capital expenditures through our operating cash flows and through bank debt, as required.
Cash Generated from Operating Activities: Cash generated by operating activities for the year ended March 31, 2019 increased by ` 32,083 million while profit for the year increased by ` 10,089 million during the same period. The increase in cash generated by operating activities is primarily due to decreased working capital requirements.
Cash Generated from Investing Activities: Cash generated from investing activities for the year ended March 31, 2019 was ` 50,126 million. We had a net cash inflow of ` 26,103 million from sale of hosted data center business. The cash generated from sale of investments (net of purchases) amounted to ` 24,340 million. We purchased property, plant and equipment amounting to ` 22,781 million which was primarily driven by the growth strategy of the Company.

Wipro Limited 35
( ` million)
Net cash provided by/ (used in) : 2018 2019 YOY change
Operating activities 84,233 116,316 32,083
Investing activities 35,578 50,126 14,548
Financing activities (129,978) (49,369) 80,609
Net change in cash and cash equivalents (10,167) 117,073 127,240
Effect of exchange rate changes on cash and cash equivalent 375 526 151
Cash and cash equivalent at the end of the period 40,926 158,525 117,599
Cash used in financing activities:
Cash used in financing activities for the year ended March 31, 2019 was ̀ 49,369 million as against ̀ 129,978 million for the year ended March 31, 2018. This is primarily on account of outflow for an equity share buyback amounting to ` 110,312 million in the year ended March, 31 2018 and increased outflow in the year ended March 31, 2019, on account of partial repayment of loans taken for acquisitions. Payment towards the dividend, including dividend distribution tax for the year ended March 31, 2019, amounted to ` 5,434 million. Dividend paid in the year ended March 31, 2019 represent interim (and final) dividend declared for the year ended March 31, 2019 amounting to ` 1 per share.
Shareholder Returns
We have always strived to enhance shareholder value for our investors. The Company’s policy has been to provide regular, stable and consistent distribution of return. There is no change in our philosophy on shareholder return.
Dividend: The cash dividend paid per equity share during the year ended March 31, 2019 was interim dividend of ` 1. The Board recommended the adoption of the interim dividend of ` 1 per equity share as the final dividend for the year ended March 31, 2019.
Buyback: On April 16, 2019, our Board of Directors approved a proposal to buyback up to 323,076,923 equity shares of the Company for an aggregate amount not exceeding ` 105,000 million, being 5.35% of total paid-up equity share capital as at March 31, 2019, at a price of ` 325/- (US$ 4.70) per equity share. Subsequently, vide resolution dated June 1, 2019, the shareholders approved the buyback of equity shares through postal ballot/e-voting.
Assessment of Key Risks Global Economic and Geo Political Risks: We derive approximately 57% of our IT Services revenue from the Americas (including the United States) and 25% of our IT Services revenue from Europe. If the economy in the Americas or Europe continues to be volatile or conditions in the global financial market deteriorate, pricing for our services may become less attractive and our clients located in these geographies may reduce or postpone their technology spending significantly. Reduction in spending on IT services may lower the demand for our services and negatively affect our revenues and profitability. Our clients are concentrated in certain key industries. Any significant decrease in the growth of any one of these industries, or widespread changes in any such industry, may reduce or alter the demand for our services and adversely affect our revenue and profitability.
Taxation Risks: Our profits for the period earned from providing services at client premises outside India are subject to tax in the country where we perform the work. Most of our taxes paid in countries other than India can be applied as a credit against our Indian tax liability to the extent that the same income is subject to taxation in India. Currently, we benefit from certain tax incentives under Indian tax laws. These tax incentives include a tax holiday from payment of Indian corporate income taxes for our businesses operating from specially designated Special Economic Zones (“SEZs”). Changes to these incentives and other exemptions we receive due to government policies can impact our financial performance.
Wage Pressure: Our wage costs in emerging markets have historically been significantly lower than wage costs in the developed markets for comparably skilled professionals, and this has been one of our competitive advantages. However, wage increases in emerging markets may prevent us from sustaining this competitive advantage and may negatively
The Company’s cash flow from its operating, investing and financing activities, as reflected in the Consolidated Statement of Cash Flows, is summarized in the table below:

36 Annual Report 2018-19
affect our profit margins. We may need to increase the levels of our employee compensation more rapidly than in the past to retain talent. Unless we are able to continue to increase the efficiency and productivity of our employees over the long term, wage increases may reduce our profit margins. Inability to provide adequate wage increase may result in attrition and impact competitiveness.
General Market Risk: Market risk is the risk of loss of future earnings, to fair values or to future cash flows that may result from a change in the price of a financial instrument. The value of a financial instrument may change as a result of changes in the interest rates, foreign currency exchange rates and other market changes that affect market risk sensitive instruments. Market risk is attributable to all market risk sensitive financial instruments including investments, foreign currency receivables, payables and loans and borrowings.
Components of Market Risks
Foreign Currency Risk: We operate internationally and a major portion of our business is transacted in several currencies. Consequently, the Company is exposed to foreign exchange risk through receiving payment for sales and services in the United States and elsewhere, and making purchases from overseas suppliers in various foreign currencies. The exchange rate risk primarily arises from foreign exchange revenue, receivables, cash balances, forecasted cash flows, payables and foreign currency loans and borrowings. A significant portion of our revenue is in United States. Dollars, United Kingdom Pound Sterling, Euros, Australian Dollars and Canadian Dollars while a large portion of our costs are in Indian Rupees. The exchange rates between the rupee and these currencies have fluctuated significantly in recent years and may continue to fluctuate in the future. Appreciation of the Indian Rupee against these currencies can adversely affect our results of operations.
We evaluate our exchange rate exposure arising from these transactions and enter into foreign currency derivative instruments to mitigate such exposure. We follow established risk management policies, including the use of derivatives like foreign exchange forward/option contracts to hedge forecasted cash flows denominated in foreign currency.
We have designated certain derivative instruments as cash flow hedges to mitigate the foreign exchange exposure of forecasted highly probable cash flows. We have also designated foreign currency borrowings as hedges against respective net investments in foreign operations.
As of March 31, 2019, a `1 (Rupees one) increase/decrease in the spot exchange rate of the Indian rupee with the U.S. dollar would result in approximately ` 2,002 million decrease/increase in the fair value of foreign currency dollar denominated derivative instruments.
Interest rate risk: Interest rate risk primarily arises from floating rate borrowing, including various revolving and other lines of credit. Our investments are primarily in short-term investments, which do not expose it to significant interest rate risk. To manage our net exposure to interest rate risk relating to borrowings, we may enter into interest rate swap agreements, which allows us to exchange periodic payments based on a notional amount and agreed upon fixed and floating interest rates. Certain borrowings are also transacted at fixed interest rates. If interest rates were to increase by 100 bps from March 31, 2019, additional net annual interest expense on our floating rate borrowing would amount to approximately ` 866 million.
Credit Risk: Credit risk arises from the possibility that customers may not be able to settle their obligations as agreed. To manage this, we periodically assess the financial reliability of customers, considering the financial condition, current economic trends, analysis of historical bad debts and ageing of accounts receivable. Individual risk limits are set accordingly. No single customer accounted for more than 10% of the accounts receivable as of March 31, 2018 and 2019. There is no significant concentration of credit risk.
Counterparty Risk: Counterparty risk encompasses issuer risk on marketable securities, settlement risk on derivative and money market contracts and credit risk on cash and time deposits. Issuer risk is minimized by only buying securities in India which are at least AA rated by Indian rating agencies. Settlement and credit risk is reduced by the policy of entering into transactions with counterparties that are usually banks or financial institutions with acceptable credit ratings. Exposure to these risks are closely monitored and maintained within predetermined parameters. There are limits on credit exposure to any financial institution. The limits are regularly assessed and determined based upon credit analysis including financial statements and capital adequacy ratio reviews.
Liquidity Risk: Liquidity risk is defined as the risk that we will not be able to settle or meet our obligations on time or at a reasonable price. Our corporate treasury department is responsible for liquidity and funding as well as settlement management. In addition, processes and policies related to such risks are overseen by senior management. Management monitors the Company’s net liquidity position through rolling forecasts on the basis of expected cash flows. As of March 31, 2019, our cash and cash equivalents are held with major banks and financial institutions. Our Gross cash and cash equivalent and short-term investments of ` 379,245 million ($ 5.5 billion). Cash and cash equivalent and short-term investments, net of debt, was ̀ 279,778 million ($ 4.0 billion).

Wipro Limited 37
Risk Management Procedures
We manage market risk through a corporate treasury department, which evaluates and exercises independent control over the entire process of market risk management. Our corporate treasury department recommends risk management objectives and policies, which are approved by senior management and the Audit Committee. The activities of this department include management of cash resources, implementing hedging strategies for foreign currency exposures, borrowing strategies, and ensuring compliance with market risk limits and policies.
Foreign Exchange Risk Management Policy and Results
We evaluate our foreign exchange rate exposure arising from operations and enter into foreign currency derivative instruments to mitigate such exposure. We have a consistent hedging policy, designed to minimize the impact of volatility in foreign exchange fluctuations on the earnings and assets & liabilities.
We evaluate exchange rate exposure arising from transactions and positions and enter into foreign currency derivative instruments to mitigate such exposure. We follow established risk management policies, including the use of derivatives like foreign exchange forward/option/future contracts to hedge forecasted cash flows denominated in foreign currency. As per the policy, the total hedges shall be 45% to 100% of the next four quarters of inflows in addition to select long term contracts which are beyond one year in tenor.
We have designated certain derivative instruments as cash flow hedges to mitigate the impact of foreign exchange exposure on Profit and Loss account and forecasted highly probable cash flows. We have also designated foreign currency borrowings as hedges against respective net investments in foreign operations.
Our Hedge Book as on March 31, 2019 stood at $ 2.6 billion dollars.
Internal Control Systems and their Adequacy
We have presence across multiple countries, and a large number of employees, suppliers and other partners collaborate to provide solutions to our customer needs. Robust internal controls and scalable processes are imperative to manage the global scale of operations.
The Management has laid down internal financial controls to be followed by the Company. We have adopted policies and
procedures for ensuring the orderly and efficient conduct of the business, including adherence to the Company’s policies, the safeguarding of its assets, the prevention and detection of frauds and errors, the accuracy and completeness of the accounting records, and the timely preparation of reliable financial disclosures.
Key Ratios:
Particulars FY 2018 FY 2019YoY
Change
Revenue in ` million (% terms)
546,359 589,060 7.8 % F
IT Services Operating Margin (% terms)
16.1% 17.9% 1.8% F
Net Income Margin (% terms)
14.7% 15.3% 0.6% F
Earnings per share in ` (% terms)
12.64 14.99 18.6% F
Price Earning Ratio (times)
16.7 17.0 0.3 F
Return on Networth (% terms)
15.9% 17.0% 1.1% F
Current Ratio (times) 2.4 2.7 0.3 F
Debtors Turnover (times)
5.4 5.8 0.4 F
Free Cash Flow as % of Net Income (% terms)
79.3% 106.0% 26.7% F
Debt-equity (times) 0.3 0.2 (0.1) F
Interest Coverage Ratio (times)
24.4 17.8 (6.6) A
F - Favourable
A - Adverse
Reasons for significant changes:
• Our Free Cashflow is computed as operating cash flows less net capital expenditure in a given year. Our operating cashflows have improved on account of lower DSO.
• We realized ` 26,103 million from the sale of our hosted data center services. We have used part of the proceeds to partially repay our long term borrowings in some of our acquisitions.
• Our interest expense has increased on account of increase in benchmark interest rates.
• Return on Networth is computed as Net Profit by average Networth. The increase in the Net income from ` 80,081 million in FY 2018 to ` 90,031 million in FY 2019 has resulted in improvement of Return on Networth.

38 Annual Report 2018-19
Human Capital Value Chain – Working Ethically and Upholding Human Rights
Our human capital interventions are driven by the dynamic business landscape we operate in. Today, innovations like artificial intelligence, automation and analytics are disrupting traditional business models, and opening up newer opportunities and revenue streams. Continuous learning is key to staying relevant in any industry and more so in the IT and ITeS sector. Organizations are moving away from being process-centric to becoming experience-centric in order to attract, nurture and retain the best global talent.Our human capital value chain consists of people strategies which are based on the current and future business requirements. Our policies, processes and systems flow from these strategies which encompass our employee lifecycle. The outcomes of these people interventions are reflected through our people result indicators, which directly
or indirectly contribute to the intellectual, social, natural and financial capital of Wipro. As part of our governance process, the strategies, processes and results are reviewed periodically by the leadership and course corrections are made when and where necessary. Throughout this value chain, our strategies, processes and policies reflect an unflinching commitment to the Spirit of Wipro values, as well as globally-recognized principles of business responsibility, human rights and corporate governance.
People Strategy
Our people strategies are geared to create learning opportunities, build careers, and foster an empowering and inclusive culture where our employees find meaning in what they do while they create value for Wipro.
Human Capital
Financial CapitalSocial & Relationship Capital
Natural CapitalIntellectual Capital
Business ResultsCompetitive Markets,
Crowd Sourcing,Disruptive Technology
Automation,Inorganic Growth,
Demand for Skilled Labour
Seamless EmployeeExperience,
Optimal Resources Utilization,
Empowerment, Glocalization,
Collaboration & Co-creation, Diversity
1Building CapabilityReimagined Careers
Cultural TransformationDigitalization and Talent
Analytics
PeopleStrategy
Spirit of Wipro
People Process
2Hiring & OnboardingEmployee Wellbeing
Learning & DevelopmentPerformance & Talent
ManagementEmployee Engagement
& Communication
Human Rights G
overnan
ce &
Leg
al C
omplia
nce
3InclusionEngagement
Productivity & Retention
PeopleResults
Bus
ines
s Outlook

Wipro Limited 39
People Processes: Key Highlights FY 2019 Hiring and Onboarding
Attracting and recruiting the best-in-class global talent, while ensuring long term people sustainability is a key business objective. We are an equal opportunity employer and focus on meritocracy at all stages of the hiring and deployment process, including role-mapping and remuneration. Localization continues to be a strategic focus for our talent agenda and we have made considerable progress in our key markets. We have a robust process to source and select the best talent, both for entry-level roles as well as lateral hires through our website, channel partners, job fairs, campus placements, and internal job postings. Our comprehensive onboarding program aided by best-in-class systems, help assimilate new talent seamlessly within Wipro. The program includes mandatory sessions on the Spirit of Wipro and Prevention of Sexual Harassment at the workplace.
In FY 2019, we moved towards digitalizing and exploring new channels for our campus hiring process. For the first time, we conducted a National Level Talent Hunt for engineering graduates in India with over 95,800 applicants.
Our recruitment process has become more inclusive with diversity-focused sourcing. As an equal opportunity employer, we do not discriminate on the basis of race, colour, religion, sex, national origin, gender identity, gender expression, sexual orientation, disability status. Our G100 program has successfully brought in diverse talent across the globe who are engaged in impactful work and are groomed for leadership roles of the future. Performance and Talent Management
Our development-focused performance management system is based on the principles of meritocracy, fairness and transparency. Our quarterly review process, introduced in
2016, continues to be a strong platform to encourage candid, constructive and meaningful feedforward discussions between employees and managers. Our performance management system leverages Artificial Intelligence to aid employees and managers in writing effective reviews. For employees working on Agile methodology in certain projects, we have an Agile Performance Management process which incorporates metrics-driven evaluation and feedback on competencies from self, peers and managers in addition to the quarterly feedforward discussions.
We have an annual 360-degree feedback survey where employees in middle and senior level roles receive feedback on identified competencies from their teams, peers, internal customers, managers, external customers, among others. The feedback report is app-based and interactive, enabling the creation of appropriate action plans for self-development.
At Wipro, succession planning is an annual exercise. Talent is classified in terms of performance and potential, successors are identified for critical roles and development actions are framed. Executive coaching is provided to senior leadership to facilitate their all-round development.
Learning and Development
We continue to make significant investments in learning and development in line with our business imperatives as well as the evolving expectations of our employees. We have a comprehensive Learning and Development program which caters to the behavioural, technical and leadership needs of our employees. Our curriculum includes classroom courses, on-the-job-training, blended learning, social learning, mentoring and gamified modules to suit the diverse needs of the participants.
Social/Peer Learning: 55,000+ employees are members of TopGear - social learning and crowdsourcing platform. Through this platform 7,841 real-life project challenges were
Culture Transformation
We aim to build an inclusive and empowering work environment focussed on enhancing employee experiences, localization and talent optimization.
Careers Reimagined
Our focus is to hire the right individuals, assimilate them quickly, develop leadership and create an internal pipeline and mobility of talent to build a future-ready organization.
Building Capability
Anticipating and developing future skills and behavioural competencies is vital to Wipro’s long-term sustainability. We continue to invest in skill enhancement across levels, with a focus on upskilling and building Digital capabilities to drive innovation.
Digitization and Talent Analytics
We are proactively adopting digital trends and automating our people processes. We use digitalization and talent analytics to enhance employee experiences and drive business outcomes which result in employee delight.

40 Annual Report 2018-19
completed by these employees in FY 2019. We have created over 250 learning videos which are accessible on mobile. We have also enabled learning through social learning platforms like MS Teams and Yammer, and revamped our Learning Management System, focusing on hands-on training and assessments.
Digital Upskilling: We have enabled over 133,000 employees in foundational, intermediate and advanced digital skills as of FY 2019. We are enabling the delivery leadership through a program called ADAPT, where our Delivery Managers and Delivery Heads are covered to understand nuances of managing digital projects.
Building Capability: We have engaged more than 7,600 senior and middle level managers effectively in workshops such as Global Executive Leadership Program, Global Business Leaders Program, ADROIT, EMPOWER, Design Thinking, Win More: Account Mining for Growth, among others. We have sustained interventions like LeadNxt, Global 100, India 200, PRiSM, Your Career Your Choice, Women in Leadership and Leading Global Teams to manage key aspects such as customer focus, leadership development, diversity and inclusion. Over 50,000 employees across various levels were trained in behavioural skills including communication, customer service, and more to ensure faster assimilation in the organization.
Mentoring Networks: We have launched Mentoring Networks, a platform where employees can find, connect and sustain meaningful mentoring relationships.
Building Foundational Talent: We ensure campus recruits learn behavioral skills through a mandatory three-day program, EMERGE. We impart communication skills and customer orientation to employees through such interventions.
Employee Well-being
Our employee wellness programs encompass the three areas of employee well-being, namely physical, emotional and financial well-being.
Physical Well-being
Risk Assessment: Wipro has established, implemented and maintained a Risk Assessment procedure for ongoing hazard identification, risk assessment and determination of necessary controls, considering all the requirements of the OHSAS 18001:2007 Standard. We conduct periodic as well as annual assessments of our campuses/offices, employees, stakeholders and service providers as a part of this process. Environment, Occupational Health & Safety management systems in our campuses conform to international standards such as 14001/OHSAS 18001 and are certified by accredited third party agencies. Besides internal and other third-party audits, EHS experts assess every unit at periodic intervals
not exceeding six months, to ensure compliance to statutory norms and EHS requirements.
Safety and security: Wipro has voluntarily committed to providing best-in-class ‘duty of care’ support to our global and diverse workforce of over 170,000 employees and 100,000 unique business travellers spanning over 230 cities worldwide. Wipro has a dedicated Global Security Command Centre, run by the Global Security Group, to mitigate risks and ensure safety for a globally mobile workforce. The Foresight & Analysis (F&A) Division proactively and continually assesses global developments to provide business with various risk briefs and forecasts, and carries out country risk assessments to provide insight to business teams on the operating environment, before they even enter a market. We have well-defined policies and standard operating procedures to ensure the safety of women employees inside and outside the campus. These include Safety Awareness Programs, Global 24x7 Security Command Centre, cab pick-up/ drop facility with escort, mobile apps to confirm “Safe Reach”, among others.
Sensitization: We have institutionalized various channels that raise awareness, foster dialogue and provide opportunities for employees to give feedback. Over the years, our engagement programs have evolved to cater to our diverse workforce.
Participation in committees: All our facilities have safety committees which meet quarterly and participate in risk assessments, safety inspections, incident investigations and hygiene audits. 3500+ permanent and contract employees participated in committees on safety, food, transport, etc. across India, to represent the interests of the workforce.
Coverage of Training: All employees and contractors working for Wipro undergo the necessary Health, Safety & Environment (HSE) training to ensure they meet with the standard of competence required by law in performing their duties.
Health: All our campuses meet Indian/International standards on hygiene, lighting, ventilation and effective controls on noise and dust. Wipro has 24 Occupational Health Centers with adequate medical staff to monitor occupational health and provide immediate relief, when required. Wellness events are conducted to raise awareness on fitness and health among our workforce.
Cafeteria: A Food Safety Standards Authority of India (FSSAI) license is mandatory for vendors operating within Wipro-owned locations in India. Regular inspections and audits are conducted by internal and external teams to ensure compliance.
FitforLife: Our physical wellbeing program that encourages employees to remain fit and lead a healthy lifestyle. We have a special Wellness Corner mobile app and a web portal that

Wipro Limited 41
provides employees access to health trackers and a host of other online services to enhance their physical wellbeing.
Emotional Wellbeing
Given our hectic lifestyles, employees sometimes need additional help and guidance for their emotional wellbeing. Mitr is our employee counselling and support forum in India. It enables employees to reach out to counsellors 24x7 in-person and/or on phone to seek assistance for issues pertaining to personal or professional life. In geographies outside India, we have employee counselling services provided as a part of Employee Assistance Programs.
Financial Wellbeing
We continually strive to provide our full-time and part-time employees with compensation packages commensurate with their skills and experience and in accordance with laws of the land. Our benefits program follows an integrated approach and provides a range of options for better financial and social security, including efficient tax-management options, life and accident insurance, medical packages and assistance in managing financial issues. For employees in India, we have MoneyWise, a financial wellbeing program which helps them in better financial planning, tax savings as well as contingency planning. We started providing long-term incentives by granting restricted stock units (RSUs) in 2004 towards long-term retention of key talent. We continue to drive a high-performance culture through our variable pay programs. Our management compensation is now more closely aligned with organizational objectives and commitments, and rewards higher performance, significantly.
Employee Engagement and Communication
To facilitate open channels of feedback and communication within the organization, we have instituted town halls, Yammer blogs and employee connect sessions with senior leadership as well as the human resources teams.
Wipro OnAir – Our global podcast series is the exclusive window into Wipro’s culture and people. Since its launch in 2017, it has received over 600,000 hits over 50 podcasts. The Wipro OnAir group on Yammer is one of the most engaged groups with over 21,000 members.
Yammer – Our enterprise social platform launched in 2014 has over 106000 users who have shared over 2.3 million messages and formed over 11,000 groups. It is currently the largest social engagement tool at Wipro.
Microsoft Teams – MS Teams is used widely to set up meetings, chats, share data and collaborate across geographies and time zones. The platform has over 47,000 monthly active users with over 3 million conversations per month.
Employee Perception Survey and Employee Insights – EPS is the formal mechanism to capture employee feedback, annually. EPS Pulse 2018-19 results have already been analysed and action areas based on employee feedback are being finalized for the coming year. Based on feedback, we have simplified several of our systems and processes including revamping our Employee Helpdesk, introduced policies that allow greater flexibility at work (the Work from Home policy was introduced in FY 2019), and made trainings and job rotations more flexible. Supplementing the annual EPS, we have also introduced Employee Insights, a platform to seek real-time, continuous and targeted feedback from employees, besides communicating actions taken on feedback. This is done through a combination of pop-polls and enterprise level surveys with built-in analytics.
Inclusion and Diversity (I&D) – Today, the scope of our I&D charter encompasses gender, persons with disabilities, nationalities, underprivileged communities, suppliers, and more recently, LGBT groups. We encourage plurality of ideas and focus on elimination of unconscious bias to foster an inclusive workplace. Our CEO is the Executive Sponsor of our I&D Council. Further, I&D is a key agenda item for our Board reviews. Some of Wipro’s key diversity initiatives include:
• Focus on returning mothers: We have in-house Day Care Centers in eight locations and 11 tie-ups covering 98% of our India employee population. In-house day care centres enrol children from 6 months to 6 years. The food prepared in the centres is in line with recommendations from nutritionists. A basic study curriculum is a part of the package. Parent Teacher Meetings (PTMs) are conducted on a monthly basis and milestones of kids shared with every parent. Core Committees have been formed across locations which include members from facilities, security, HR teams and parents to conduct internal audits, complementing external ones.
Day care center

42 Annual Report 2018-19
We have created a WoW (Women of Wipro) Mom program which aims to support employees returning from maternity break as they transition back to work. HR representatives connect with the employees to provide them with any support or information that they might need. Further, we have curated a WoW Mom handbook for employees in India that gives an overview of relevant policies and processes which (to-be) mothers at Wipro usually look for.
• Inclusivity trainings: We continue to nurture a more inclusive work environment by conducting sensitization programs on breaking unconscious bias, working with a culturally diverse workforce and creating focused development programs for women employees. Over 7,000 employees have been covered through the cross-cultural sensitization and women’s training programs. Over 9000 employees have undertaken the Unconscious Bias module since its launch in Q3’FY19. Over 625 Wiproites have been sensitized on disability. 1,600+ Wiproites across the globe pledged their support for inclusivity by participating in an Inclusive Walkathon and other allied activities. 112,000 employees have completed the PSH online assessment. At Wipro, we believe in the power of conversations and role models- this is enabled through our mentoring programs, I&D speaker series/panel discussions/Women in Business customer sessions
• Accessibility for Persons with Disabilities: 90% of our user-facing internal applications, 95% of our external career site, 90% of the mandatory e-learning modules and 20% of the intranet mobile applications have been made accessible for our employees with sensory disabilities. 100+ engineers and training content developers have been coached on Web Content Accessibility Guidelines and Web Accessibility Initiative – Accessible Rich Internet Applications (WAI-ARIA).
• LGBT Workplace equality: In FY 2019, we undertook many initiatives to make our workplace more inclusive towards the lesbian, gay, bisexual and transgender
(LGBT) community. These include, revising our Code of Business Conduct, Supplier Code of Conduct and Equal Opportunity Policy to include protection against discrimination based on gender identity and gender expression. We modified our resume application system to include gender neutral language. We launched Wipro Pride – an employee resource group for LGBT and ally employees. We have also created gender-neutral restrooms in Wipro offices. Employees can self-identify as LGBT in our internal HR systems. We supported Business Roundtable’s endorsement of the US Equality Act, a federal standard that provides non-discrimination protections based on sexual orientation and gender identity for employment, public spaces, education, services, federal programs, and housing. Wipro has received a score of 95 out of 100 on the 2019 Corporate Equality Index (CEI). It is the premier benchmarking survey and report on US corporate policies and practices relating to LGBT workplace equality, administered by the Human Rights Campaign. Wipro’s score reflects its commitment to LGBT workplace equality, with regard to tangible policies, benefits, and practices.
• Thought Leadership & Advocacy: Wipro has participated in various eminent forums through the year, including a senior business leader participation at the United Nations Global Compact & Male champions CEO Roundtable in New York.
Freedom of Association – We respect the right of employees to free association without fear of reprisal, discrimination, intimidation or harassment. Our employees are represented by formal employee representative groups in certain geographies including Continental Europe and Latin America which constitute about 3.4% of our workforce with a further 2.5% under collective bargaining agreements. Our HR representatives meet these groups periodically to inform and consult on any change that can impact their terms and conditions / work environment.
Human Rights & Values at Wipro
Human Rights related Polices and Commitment
• Commitment to Human Rights: Wipro is committed to protecting and respecting Human Rights and remedying rights violations in case they are identified. Providing equal employment opportunity, ensuring distributive, procedural and interactional fairness, creating a harassment-free, safe environment and respecting fundamental rights are some of the ways in which we do so. Our Code of Business Conduct (COBC) and Human Rights Policy are aligned to globally accepted standards and frameworks like the U.N. Global Compact, U.N. Universal Declaration of Human Rights and International Labour Organization’s Declaration on Fundamental
Wiproites participating in an inclusive Walkathon
Wipro Limited 43
Principles and Rights at Work (ILO Declaration). They cover all employees, suppliers, clients, communities and countries across geographies where we do business. Wipro is also one of the founding members of CII’s Business for Human Rights Initiative.
• Risk Identification Process: We have established committees/processes like the Ombuds process, Prevention of Sexual Harassment Committee, EPS, Audit/Risk & Compliance committees, EHS and an Inclusion & Diversity Council to review progress and formulate strategies to address issues pertaining to compliance, safety and a harassment-free workplace. We keep our employees informed about these processes regularly through trainings, mailers and internal social media platforms. We have also started a process of Human Rights Audit in association with the industry body, Confederation of Indian Industries (CII). The study is designed to identify any risk of Human Rights violations or gaps in any of our own operations or in the extended supply chain.
• Identified Risks: Through various audits and feedback we have identified the following as potential risks to Human Rights:
» Benefits and engagement of extended/contract workforce
» Unconscious bias at the workplace.
• Mitigation Policies/Processes: We have created specific interventions to tackle these issues:
» Contract Employee Engagement: We engage contract employees for infrastructure support at our offices in India. The duration of engagement varies depending upon the project and role. We have created eLearning modules on COBC, Prevention of Sexual Harassment (POSH) and data privacy for them. Chatbots have been introduced to clarify any doubts that employees may have on policies and guidelines. We also proactively conduct open houses for our contract employees across India where we address their concerns /queries, take feedback and provide them career guidance. Specific concerns on delayed claims, role change and location change, among others are actively addressed.
» Sensitization on Unconscious Bias: As mentioned above, under the umbrella of our #BreaktheBias campaign, we have monthly leadership blogs, mailers and a mandatory e-learning module which raise awareness among employees on how they can eliminate biases at the workplace. Around 9000 employees have been trained till date on the e-module since Q3 FY 2019. The campaign also includes scenario based quiz questions with focus on various aspects of inclusion
People Results
Leaders who significantly influence human capital strategies of the organization are measured on the performance of key indicators in this area. The indicators provide insights into the effectiveness of human capital strategies and are reviewed regularly both at organizational and individual business unit levels. The key targets are:
• Attrition – low to mid double digits with focus on retaining top talent
• Employee Perception Survey (EPS) Score – Show measurable progress on engagement levels (Top scores) over the past two years
Productivity & Retention
• Gross Utilization has gone up to 74.4% (increased by 2.2%)
• Net Utilization has gone up to 84.8%, excluding Trainees (increased by 2.3%)
• Voluntary attrition (includes employee initiated termination) - 17.6% (increased by 0.8%)
Engagement – EPS Pulse 2018-19
• 75% overall engagement score (up 1.4% from EPS 2017)• Increase in scores across all parameters/drivers of
Engagement from EPS 2017• Managerial Effectiveness and Team & Collaboration –
highest-rated drivers of engagement. Career and Work-Life balance are areas which need more focus
• Engagement scores for Males is at 74.1% (up 1.6% from EPS 2017) while for Females is at 76.7% (up 0.9% from EPS 2017). For all the questions in the EPS, Female scores are higher than the Male scores
Inclusion
• 35.2% Overall Gender Diversity (0.2% higher YoY)• 16.9% women in management (in junior, middle and
senior management) positions• 125 nationalities• Localization : USA - 64.0%, UK - 30.9%, Australia 31.2%• 545 employees with disabilities employed (with 15
disability types)

44 Annual Report 2018-19
Relationship to Other Capitals
HUMAN CAPITAL
Natural Capital
Financial Capital
Intellectual Capital
Social & RelationshipCapital
• Customer NPS Improvement 511 basis point increase
• No. of Wipro Care Volunteers 12,500 and contributing 33,000 hours
• No. of employee contributions on social causes is more than 30,000
• 305 patents filled in year• No. of patents granted (till
date) 558• No. of people trained in
Digital > 133,000
• Revenue share of Digital business reached 35% in Q4’19
• 5.4% Revenue increase from FY 2018 in constant currency terms
• 74,000 employees registered for carpooling in India
• 5 global UN environment day cerebrated across locations

Wipro Limited 45
Intellectual Capital Intellectual Capital is core to Wipro’s Strategy for creating value for the customers and for driving sustained growth, differentiation, non-linearity and profitability for Wipro - by building scalable domain and technology IPs for high opportunity areas leveraging partners, Academia and the start-ups ecosystem and delivered in aaS construct.
Wipro has launched an idea hunting program called “The Great Blue Heron” (The bird – Great Blue Heron is a great fisher and fishing is used as a metaphor for idea hunting) for capturing High potential Opportunities and problem patterns across Customers, Domains and Technologies. This program has been supplying a validated pipe of potential ideas for developing commercially viable IPs.
The commercially viable and market validated ideas are funded through the Horizon program (popularly called H2H3). This platform is designed to identify & incubate disruptive ideas, helping drive significant growth & differentiation for Wipro from a 2-3 year horizon standpoint. During FY 2019 we incubated 16 themes (7 newly approved) around Autonomous vehicle, Digital Twins, Digital, Open Banking, Analytics, Cloud security, Additive manufacturing, SDx, industry solutions for Insurance & Banking.
We are also focused on continued investments for enhancing some of our existing and proven products and platforms like Promax, Netoxygen, Medicare, HOLMESTM, Topcoder, Base))), Virtuadesk etc.
IP Assets: Wipro has a rich portfolio of 60+ commercial-grade licensable Products, Platforms and Frameworks and have been actively investing in strengthening, enhancing and refreshing the portfolio. Here are some examples:
Wipro IMAGINE has near-human ability of having intuitive multi-modal interactions, thereby providing personalized experiences accurately and efficiently across different senses: voice, vision, haptics, smell and taste. It has the potential to transform customer experience through nascent channels of interaction such as augmented reality, virtual reality and mixed reality experiences provided on head-mounted devices. There have been customer engagements on Wipro IMAGINE, such as Digital Advisor Solution for Field & Service personas, Immersive Visualization solution for Product exploration and Facility / Plant Walk-throughs, Digital Trainer Solution for Technician.
Another example is Wipro AutoInsights - A connected car platform using telematics devices to continuously read data from connected cars and uses sophisticated analytics to offer a wide range of benefits to car owners, OEMs, insurers and the ecosystem players. The transformational usecases are Loss Prevention, Safety & Wellbeing, Incentives and offers, Ecosystem Value.
Wipro has also been investing in building IP capabilities is towards Autonomous Vehicle with intent to position Wipro as a Software defined System Integrator for implementing various levels of autonomy in autonomous vehicle and a niche provider of best in class IP that solves unique challenges for autonomous driving.
Cargo Digital Transformation is another example of Domain specific area of investment for Wipro with focused IP around Cargo Reservation Operations Accounting and Management Information System (CROAMIS).
Wipro has been investing in building IP capabilities across the entire spectrum of AI and Automation spanning, RPA to Cognitive and Deep Learning. Wipro drives a persona-first AI approach through Wipro HOLMESTM wherein each persona (COO, CFO, CPO etc.) has a wide portfolio of Automation/AI use cases.
Co-Innovation and Open Innovation: We actively co-innovate with alliances and customers on emerging themes, enabling new customer experiences. Our Open Innovation programs leverage the innovation ecosystem by working closely with our partner/startups ecosystem, academia and expert networks to jointly provide latest innovations to our customers. In FY 2019 we have identified key innovative startups that usefully differentiate our solutions and have been successful in building traction for joint engagements. We continue to be part of various industry and startup forums including the NASSCOM Industry Partner Program, which connect promising startups with us. We also work with and maintain our relationships with accelerators and other investors and influencers in the startup ecosystem. We continue to work with a variety of open innovation intermediaries to leverage expert networks across the world to complement our specialists on niche projects such as rapid development of mobile applications, AR based immersive experience on applications, revolutionizing employee based retention through Intelligent chatbot, streamline IT operations with AI, automating drafting and executing of legal contracts and much more.
Innovation Centres: Our innovation incubation centres, the Technovation Center at Bengaluru and the Silicon Valley Innovation Centre in Mountain View California, continues to drive technology-led innovation to visualize the “art of the possible” in emerging business environments for our customers globally. These Centers brings together an innovation ecosystem, a set of best practices, IP and research and development resources to help our clients develop successful initiatives
Wipro also has 19 Digital Pods across the globe. A Digital Pod is a workspace to foster collaboration within a multidisciplinary agile team. Each team of 8-10 persons is known as a “Digital Cell”. These cells work with the necessary autonomy to facilitate speed, continually validating progress with user research and technical performance data. The
46 Annual Report 2018-19
cells also follow Wipro’s No-Shore ways when working with similar cells distributed across the globe. Leveraging the best in class processes, teaming norms and technology enablers like the Digital Rig etc, the cells work as a single networked entity delivering business value faster to the consumers.
Research Areas and Solutions in Advanced Tech. Areas: Wipro’s Research and Development initiatives continue to focus on strengthening and extending our capabilities across multiple new and emerging technology areas, intersection of these technologies and potential business use cases applying these technologies. We are investing extensively in developing solutions and services in a host of advanced technology areas (e.g. ADAS/autonomous vehicles, commercial wearables, machine vision, human machine interfaces, smart assistants, natural language processing and understanding, Blockchain tech, quantum computing, smart machines, among others). We continue to invest in working on new ways of software development and deployment for edge-based IoT and always-on architectures.
We are actively building solutions in collaborative robotics, drones for industrial and warehouse applications. Our objective is to build AI based software platforms that consists of cognition and decision systems so that we could deploy the solutions at scale with the customers. We are currently building software platforms for automations of machine tending, intelligent material handling & transport. This uses the Computer Vision Platform that which provides actionable insights to improve compliance, quality and productivity using image and video analytics. We have built partnerships with Robot & accessory vendors to become single point solution provider for our customers. Some of the use cases we have built that are showcased in our innovation centres are shopper robot, vision assisted machine tending operation, inventory & inspection, segregation of hazardous materials, game playing robot.
We are building a solution for warehouse inspection using drones. Drones fly periodically and help in the accurate identification of materials across the warehouse at any point in time.
We are also collaborating with agricultural university, start-ups and research institutions to develop early detection of pest infestation in crops with the use of these APIs. We have reached a reasonable accuracy in detection and are working with one of the processing industries to deploy the same.
Academia: This year we signed an agreement with Swinburne University, Melbourne, Australia to create a Wipro Chair in the University, to lead critical joint AI technology research. We continue to actively scout for academia research programs from institutions across the world, where we can establish mutually beneficial research collaborations.
Our joint research collaboration with Tel Aviv University where Wipro and TAU are working on core and applied research in image and text analytics using deep learning and sparse representation models and techniques, transfer domain and incremental learning problems has resulted in some key advances, and our research collaborations with the Indian Institute of Science on technologies for autonomous vehicles is also on track.
In addition, we have entered into research collaborations with IISc on technologies for autonomous vehicles. Further we continue to actively scout for academia research programs from institutions across the world, where we can establish mutually beneficial research collaborations.Wipro has also worked with IIT Kharagpur to discover an alternate way to secure the IoT devices which is lightweight and doesn’t require computational & battery power. This is achieved by building Physically Unclonable Function (PUF) based authentication and key exchange protocol for IoT devices. The drawbacks associated with the traditional authentication protocols for IoT devices is minimized by eliminating password dependency and binding access requests to originating device.
Crowdsourcing: We have continued our investments in TopGear, the social learning and crowdsourcing platform focusing on workforce transformation in ‘Digital’ and “in-demand” skills.
Patent Filings: Our R&D work has contributed to some significant patent applications during the FY in key technology domains. As has been reported earlier we have been investing in building a focused patent portfolio that protects critical Wipro IP. As of FY 2019, we have a total of 2,236 patents filed in various Patent Jurisdictions across the world, of which 558 have been granted. Recognition of our work in IP creation has come in the form of the prestigious Enterprise Trophy presented to us by the World Intellectual Property Organization, as well as the National IP Award from the Government of India.
Highlights for the year
• In the year ended March 31, 2019, Wipro filed 305 patents and currently has approximately 558 registered patents and 1,678 patent applications pending registrations in various jurisdictions across the world.
• Wipro won the “Asia IP Elite” award from the Intellectual Asset Management publication for the sixth consecutive year for best IP Practices

Wipro Limited 47
Social & Relationship Capital Organizations earn and maintain their societal license to operate by adopting a boundary-less perspective and co-creates social value through positive outcomes along with its customers, business partners, vendors, employees, investors, communities and civil society. To this we also add another key stakeholder– future generations, helping bring a perspective from the unrepresented future, but that is core to creating a sustainable society. We talk about each of these stakeholders in brief below.
Customers
Wipro believes in creating value for the customer over and above our contractual obligation. Our approach is based on our vision of delivering value to our customer businesses based on a solid relationship of trust, collaboration and competence. We ensure this by providing solutions that integrate deep industry insights, leading technologies and best in class delivery processes.
Artificial intelligence is emerging as a defining technology, empowering organizations to make rapid and informed decisions. However, for AI to deliver on its promise, predictability, transparency and trust are critical. Our solution capabilities enable responsible AI through our platform (Wipro HOLMESTM) and the ETHICA (Explainability, Transparency, Human-first, Interpretability, Common sense, and Auditability) framework.
Engagement is critical to meet and understand the expectations of customers. The key to customer retention is building deep relationships. IT industry, a major driver of efficiency and productivity improvements for most businesses, is undergoing tremendous change in the face of disruptive technologies. The Business Strategy section outlines the drivers and how it informs our business model, offerings and customer engagement approach.
The Voice of the Customer is heard at various levels i.e., at project level, program level, account level and through direct feedback, informal meetings, governance meetings and senior management interaction with the client. The processes include Program CSAT, Quarterly Pulse Surveys and the Annual CSAT conducted through third party surveys. These are conducted formally and at appropriate intervals to capture customer feedback on Wipro. During the reporting year, there has been a 511 basis point increase in customer Net Promoter Score from previous year.
From a sustainability perspective, the most material issues for our customers include Data privacy, IT Security and compliance on sustainability related aspects. The World Economic Forum Global Risks Report 2019 lists large-scale IT security issues and data fraud/thefts among the top 10 in terms of likelihood and impact. The Sustainability Accounting
Standard Board (SASB) standard for software and IT services also lists these as being material to the sector.
IT Security: Wipro’s IT infrastructure is certified under the ISO 27001 standard which provides assurance in the areas of information security, physical security and business continuity. We benchmark our processes to meet the EU’s General Data Protection Regulation (GDPR) and SOX IT compliance requirements. We closely monitor IT infrastructure availability incidents based on severity, outage duration and users impacted. Most of the incidents are related to telecommunications and network links. We have maintained SLA with vendors on IT and telecom infrastructure availability close to 99.99% in the reporting year.
Data Privacy: Being a B2B business, Wipro does not collect, store or monetize information pertaining to our customer’s attributes or actions, including but not limited to, records of communications, content of communications, demographic data, behavioral data, location data, or any other personally identifiable information. Therefore, our company does not receive requests for customer information from government or law enforcement agencies. Wipro does not store any customer proprietary data in its systems and networks. In rare circumstances where, as part of project requirement, it is needed to view customer data, it is accessed remotely with the data being stored and hosted on the customer’s systems. This helps in meeting data privacy compliance requirements from a contractual & operational perspective since it is Wipro’s customers that are in control of their own data, even while outsourcing project work to Wipro. Wipro signs Master Services Agreements with its customers that have clauses covering confidentiality of the customer’s information. Wherever applicable, Wipro also executes Business Associate Agreements with its customers who are governed by sectoral privacy regulations such as HIPAA (Health Insurance Portability and Accountability Act) of 1996. As a matter of due process, a customer is notified in the event of any breach of data privacy as per notification procedure agreed in the contract.
We have a Data Protection and Privacy policy based on globally accepted data protection principles applicable to the entire organization. The privacy policies and procedures are reviewed internally and audited on compliance. There is continuous monitoring of any privacy incident or deviations to the policy. Appropriate disciplinary actions are taken in the event of any breach.
In April 2019, we became aware that our system was subject to a cyber attack by a coordinated and advanced phishing campaign, which was reportedly directed against several major companies, including Wipro. Upon learning of this incident, we collaborated with forensic firms to investigate and have worked closely with our anti-virus provider and our information security team to counter the threat found in our system and implemented a series of additional precautionary

48 Annual Report 2018-19
and containment measures across our systems. Our investigation into this incident remains ongoing and will be concluded shortly.
Sustainability: Apart from technology driven value creation, our global customers also expect transparency and compliance on different sustainability aspects within our operations and in our extended value chain – Human Rights, Labour Practices and Diversity being key dimensions among them. Many customers require acceptance and alignment with their supplier code of conduct and/or global frameworks. We have +150 of our customers who are part of independent raters like Ecovadis, Verego and industry led consortiums like the JAC (Joint Audit Consortium), Pharmaceutical Supply Chain Initiative (PSCI) and Quest Forum (Focusing on Quality and Sustainability in ICT community). We also respond to CDP supply chain with information on our GHG emissions attributable to the work we do for specific customers and as a corollary, on collaboration opportunities with those customers on GHG mitigation.
Suppliers
Managing and mitigating the environmental and social impacts of one’s supply chain are interlinked to effective economic outcomes over the long term – they can help businesses avoid disruptions, meet evolving customer requirements, foster innovation and protect the company’s reputation and brand value. It can also help further the business imperatives of efficiency, cost effectiveness and resilience in the supply chain. The supplier ecosystem of Wipro can be broadly categorized into two heads - contract employees involved in core delivery of IT Services and Solutions (refer the Human Capital section); and ‘product or services supply chain’ or ‘secondary supply chain’ which comprises suppliers who provide materials, equipment and end-products, business support services and facility management services for our operations.
Our Code of Business Conduct (COBC) and the Spirit of Wipro values provide the ethical guidelines and expectations for conducting business and for directing Wipro’s relationship with its suppliers. The code is applicable to all suppliers, agents, service providers, channel partners, dealers and distributors. In addition to the COBC, the Supplier Code of Conduct (SCOC) of Wipro further strengthens and augments the COBC with respect to environmental and social aspects (including key aspects of human rights) of business practices and sets clear expectations from our supply chain. All decisions related to procurement are governed by our procurement policy which addresses social and environmental aspects like green procurement, supplier diversity, equal opportunity in sourcing and accessibility of goods and services for people with disabilities.
Our Supply Chain engagement has been a journey where
sustainability has increasingly become central. Our engagement approach is multi-pronged with the focus on improving the capabilities of suppliers in managing their sustainability performance. Manpower service providers in civil, operations and support services is a category identified as being significant in terms of social impacts. Similarly, suppliers who provide utility products and services (electricity, water, waste management) and ICT equipment have large environmental footprints and are therefore material to our strategy to reduce our environmental impact.
A significant feature of our engagement is how we align our community or CSR (Corporate Social Responsibility) programs with supplier engagement wherever it is possible. This can address some of the fundamental issues at hand– our bridge program in education for children of migrant laborers for our new infrastructure projects, urban water programs in cities where we operate and access to social benefits for city municipal solid waste workers are some examples.
ENGAGE
InformCommunicate intent and requirements to
our suppliers
CollaborateEducate our suppliers
on environmental, social and governance
best practices to be incorporated in their
business
AssessAudits and
assessments of suppliers
UnderstandContext and current compliance of our
suppliers and developing policies and processes
audits and assessments of suppliers
Supplier Diversity: Wipro is an Equal Opportunity employer and strongly advocates the same through its supply chain by encouraging supplier diversity. Qualified enterprises owned by persons with disability, women or member of minority communities are proactively identified and engaged with. We are restructuring our vendor empanelment process to help strengthen our supplier diversity process.
Summary of supplier sustainability engagements:
a. The second phase of Vendor Compliance Management Audit covering FY 2017 and FY 2018 concluded in June 2018. Employee Benefits provided and Women’s Safety at workplace were identified as key issues for workers in

Wipro Limited 49
supply chain. A total of 330 vendors were covered within its scope.
b. Based on Trucost’s natural capital valuation, high
carbon/water/waste footprint suppliers are identified in supply chain.
c. Identifying High Risks Vendors: It is compulsory for all our vendors to submit a signed copy of Wipro Supplier Code of Conduct (SCOC). High Risk Vendors (HRV) identified based on geography, nature of service and other criteria go through additional checks and balances during processing for key words like government payments, miscellaneous expenses, bribe, commission, facilitation fee, gift, reward, out of pocket expense, etc. All HRV vendors are required to submit an anti-bribery anti-corruption questionnaire. We also have requirements of stricter negotiating threshold, clear break up of costs and multiple quote regardless of the value.
d. Supplier Diversity Program for facilities management services at our campuses – A sensitization program was conducted and expectations have been conveyed formally through our contracting process. The gender diversity ratio for supplier staff deployed at our facilities is 25.6%.
e. Green initiatives in ICT Hardware:
» Green Procurement: Wipro adopted the EPEAT standard from Green Electronic Council in 2016 for its IT hardware procurement – across categories such as laptops, desktops, printers, mobiles and servers. In 2018, we purchased more than 6,344 EPEAT Gold and over 140 EPEAT Silver and Bronze category products across desktops, laptops, displays, imaging equipment and mobiles. In tangible terms, our procurement of EPEAT certified hardware translates into a saving of 2.6 million KwW of energy, reduction of 598 tons eq.
» Enhancing Virtualization Platform: Till date we have migrated 6300 users from traditional physical desktop to Virtual Desktop Infrastructure (VDI). This has led to reduction in energy consumption, easier operations and cost saving.
» Asset re-utilization: Through proactive maintenance and upgrades, we have been able to reutilize 16% of the assets post their scheduled end of life.
» Managed Print Services: This outcome-based model, where Wipro’s printing services are managed through an independent third party helps generate higher operational efficiency through better controls and analytics as well as reduced resource consumption (paper, toner) and planned asset refresh. Consumables and printer issues are tracked remotely and managed by MPS vendor.
During the reporting year, we optimized MPS through asset reuse and printer removal, leading to cost saving of ` 1.1 million. We have also reduced unwanted printouts by a provision to scan and send documents to respective user mailboxes and are currently planning to implement ‘authentication service’-access before print to further bring down print and paper volumes.
Investors
Our endeavor is to, not merely, report true and fair financial results in a timely manner but also communicate the business outlook, risks and opportunities transparently to the investor community. Increasingly, discerning investors are interested in the longer term strategy of the organization and issues which are material to the industry. We deploy multiple channels of communications to keep investors informed about various development and events.
Wipro’s senior leaders along with our dedicated Investor Relations team participate in various forums like investor conferences and investor road shows, in addition to hosting investors and equity analysts who visit our campus. Our quarterly results, regulatory filings, transcripts of our earnings call, media presentations and schedule of investor interactions are available at https://www.wipro.com/en-IN/investors/
We participate in leading investor led disclosures like Dow Jones Sustainability Index, Vigeo, FTSE Russell ESG, MSCI ESG, Sustainalytics and Carbon Disclosure Project. Wipro was selected as a member of the global Dow Jones Sustainability Index (DJSI) 2018 for the ninth year in succession. Wipro is included in both the DJSI World and Emerging Markets Indices. The Euronext Vigeo Emerging Market Sustainability Index also includes Wipro among the 70 most advanced companies in the Emerging Market Region. We are also member of FTSE4Good and Global Sector leader.
Highlights of the year
The following table details the different types of engagement exercises undertaken by the company in FY 2019:
Particulars Q1 Q2 Q3 Q4 FY
Investors meetings & Calls
39 27 23 30 119
Conference - 4 3 2 9
Road Show Conducted
1 1 2 1 5

50 Annual Report 2018-19
Earning Conference calls
1 1 1 1 4
Communities and Civil Society
At Wipro, we think it is critical for business to engage with the social and ecological challenges that face humanity in a deep and meaningful manner with long-term commitment; for that is the only way by which real change can happen on the ground. We engage with communities on issues that matter to them most. Wipro’s social initiatives center on the following dimensions. The programs on ecology are covered in the ‘Natural Capital’ section.
Key programs in Education
Our work in education covers a range of initiatives in school and higher education from systemic reforms to sustainability education. Apart from India, we have significant programs in USA and initiated a new program in UK as well. The common vision that ties this together is our belief that good education is a the primary enabler of change towards a better society.
Systemic reforms in School Education
Since 2001 we have been working on issues of systemic
reform in school education in India, through the Wipro Applying Thought in Schools (WATIS) program. The strategy has two key elements; (i) to support the development and strengthening of good organizations working in this space. Till date, we have partnered with 116 organizations working in different areas of systemic reform. The impact of this wide network of education organizations has been in the areas of curriculum, text books, teacher capacity, and school leadership. Since inception, our work has spanned 181 projects with a collective reach of close to 20,000 schools across 29 states. During FY 2019, we continued to build momentum of identifying and supporting new and young start-ups in school education through a structured program of seeding fellowships. 25 Fellows from 14 organizations were added during the year taking the total number of ‘Fellows’ to more than 85. (ii) The second element of our strategy is to support organizations working in other developmental areas like livelihoods or healthcare and encourage them to expand their work to school education. In addition, we continue to identify and partner with good early to mid-stage organizations who are already working in education. Two such organizations were supported through the grants program during the reporting period.
In combination, we hope this strategy will eventually help to build a bulwark of strong organizations across the country which are deeply committed to change in school education.
As part of network building and advocacy of such issues, our 18th annual forum was organized – a unique platform that brings together the best minds in education in the country to deliberate and exchange thoughts and ideas on some of the most important issues in education.
30 40
Primary Education
Schooltransformation
Cocurriclar
Science & Maths
Social Sciences
0 10 20
Number of Organizations with respect to thematic Areas
East
South
West
North East
Central
0 5 10 15 2520
Geography - India
North
Education
Engaging in deep and meaningful systemic work in the area of school and college education• School Education in India - WAITS • School Education outside India - USSEF • Sustainability Education - Wipro earthian • Engineering Education - WASE, WiSTA
Ecology
Addressing environmental issues like energy, water, solid, waste and biodiversity • Energy & Carbon • Water • Waste • Biodiversity
Community Care
Engaging with the proximate communities in areas of primary health-care, education, ecology and disaster rehabilitation • Primary Health care • Education for underprivileged • Children with disability • Environment • Disaster Rehabilitation

Wipro Limited 51
Key Highlights of the Year
• 18th Partners’ Forum held in November with ~ 150 participants attending; Fellows Annual Meet and 2 Regional Meets (for East & West) also organized.
• 8 capacity building workshops conducted for partners through the year, in partnership with resource organizations such as Jodo Gyan, Vikramshila, Digantar, Bookworm and Azim Premji Foundation.
• Sixteen new organizations have been supported this year; of these, 14 organizations (25 fellows) were supported through seeding fellowships and 2 through organization grants.
Wipro Science Education Fellowship Program in USA
The Wipro Science Education Fellowship (SEF) is a significant initiative we started in USA in 2013 with a focus on improving STEM (Science, Technology, Engineering and Math) learning in schools that serves disadvantaged communities. Our work centers around helping teachers become better STEM educators and change leaders for STEM in their school districts. Anchored by the University of Massachusetts, the program has been widely accepted in USA as an important initiative in this space. In last 18 months, we expanded our presence significantly, adding three new sites at Tampa, Florida, Jefferson City, Missouri and Mountain View, Santa Clara. We established three new partnerships for these sites with the University of Southern California, University of Missouri and Stanford University respectively. With this, the Wipro-SEF program is active in 35 school districts across seven locations in the U.S, including the existing sites at Boston, New York, New Jersey and Dallas. Cumulatively, we have worked with 500 teachers till date.
Wipro Science Education Fellowship Program in UK
We launched the Wipro Science Education Fellowship program in the UK in FY 2019 in partnership with Kings College, London and Sheffield Hallam University. A three-year agreement was finalized with King’s College London, to develop and offer UK’s first Master’s program in STEM education, targeted at in-service teachers from ‘social-mobility cold-spots’. The program was launched successfully in February 2019 and will admit its first cohort in the coming academic year. Sheffield Hallam University initiated the ‘Wipro Teacher Fellowship’ and ‘Wipro Teacher Mentor’ programs to provide rigorous continuous professional development to STEM teachers working in government designated ‘opportunity areas’, which by definition have
a high proportion of failing-schools. About 25 teachers representing 20 schools in/around Sheffield have joined the first cohort in January 2019. The recruitment of the second cohort will begin in Q1’20.
Sustainability Education
Wipro earthian, our flagship program that brings together two of our key concerns, Education and Sustainability, into a nation-wide initiative for schools and colleges continued to expand and progress on multiple fronts in its eighth year. In the schools segment, Wipro earthian is now present in more than 30 states and union territories across India. In the past couple years, we have consciously established and expanded our outreach to the North-East in India and the Northern Himalayas, which is normally underserved on many counts. While our strategy for schools is centered on broad awareness building through large scale outreach, our engagement with colleges is more selective and aligned with the particular characteristics of different disciplines and institutes.Wipro earthian covers two phases – the Wipro earthian awards program and the Continuous Engagement Program (CEP). The award program for schools engage students under two thematic areas - Water and Biodiversity. Participating schools form teams and engage in an intensive 5 month activity based learning program in their school and communities. The CEP provides unique learning experiences for schools and colleges – through experiential workshops, internships, in-school learning material and co-creation of faculty led pedagogy material, which further accelerates sustainability learning at an institutional level.
National Level Sustainability Quiz
Field Experimental Workshop in Katerniaghat

52 Annual Report 2018-19
Key Highlights of the Year
• First - time workshops held in underserved areas like Kargil, Dras, Nicobar Islands, and Sunderbans, increasing our geographic spread and reach. Overall submissions came in from 29 states, 3 UT’s and 51 districts covered by the program.
• Continued partnership with School of Sustainability, Xavier University, Bhubaneswar and MOU’s with leading institutes to develop sustainability pedagogy tools for faculty across various disciplines/subjects - CEPT, Ahmedabad(Urban Planning), IIM Ahmedabad (Sustainability Business Case study development) and ICT, Mumbai (Chemical Engineering).
• 2 doctoral fellowships on sustainability, a faculty-led research program on the theme of ‘Business and Human Rights’ and ‘Sustainability Risk Assessment’ with IIM-Bengaluru and a faculty development program on curating MOOC’S fpr business sustainability
• 20 students from 5 colleges completed their internships with diverse sustainability non-profit and consultancy organizations - TRUCOST, BIOME, CSTEP, WRI, CDP
• 7 sustainability quizzes at XUB, IIM-B, IIM Kozhikode, NIT Trichy, GIM Goa, IIT Delhi, MIT with participation from 710 teams and 1420 participants.
• 2 Field Experiential workshop conducted Yelagiri and Katerniaghat wildlife sanctuary attended by 9 teachers and 41 students from schools
• The 8th edition of the Wipro earthian awards were held on the 9th of Feb 2019 with over 200 attendees including winning teams, program partners, employees and media.
Technology Education
People with the right skills and competencies form the bedrock of IT services organizations. The challenge for the Indian IT industry has always been to respond fast enough to the ever rapidly changing dynamics of the industry. The present times are no different, in fact even more so with the challenge of a bewilderingly fast changing landscape of technology which is often summarized as Industry 4.0. We have always owned this as our primary responsibility. In 1995, we started a program for science graduates that would enable them to study for a post-graduate degree in engineering and technology, called the Wipro Academy of Software Excellence (WASE) program, it helps Science graduates to study for a Master’s degree in Software Engineering (M.Tech). Run in partnership with the Birla Institute of Technology & Science (BITS), Pilani, India, this unique program blends rigorous academic exposure
with practical professional learning at the workplace. We launched yet another program with BITS Pilani, called Wipro Infrastructure Management School (WIMS) to develop and nurture an exclusive talent in IT infrastructure business, keeping the Cloud Computing as the technology theme. We run a similar program called Wipro Software Technology Academy (WiSTA) in collaboration with Vellore Institute of Technology (VIT) for science graduates to offer some specific courses like Data Scientists, VLSI and Embedded and Information Technology programs. Since its inception in 1995, Wipro has supported and enabled more than 30,000 students to pursue their higher education in Engineering with India’s Premier Engineering Institutions under the programs WASE, WiSTA and WIMS. Over 18,200 students successfully completed their M.Tech degree in various IT disciplines over the last two decades. During FY 2019, the total number of new entrants into the three programs was 1,440 while the aggregate strength across four years was over 10,000.
Working with communities everywhere
A primary tenet of our CSR strategy is that we must engage with communities proximate to wherever we have significant operational presence in the world. We choose to work with underprivileged communities in particular. Our work is channeled through Wipro Cares, a unique trust that is based on operating model of employee contribution matched by Wipro Limited. The work spans following areas:
a. Education for underprivileged children: Education is so critical that it is necessary to focus on multiple points of leverage. While systemic reforms are an important area of work, we also have a large program that is designed for more direct impact on underprivileged children. Run through Wipro Cares, the program reached out to around 41,000 children across eight states in FY 2019. The projects address a gamut of critical issues faced by disadvantaged communities when it comes to school education – starting from enrolment in schools to nutrition for children, counseling services for parents, remedial education, just to name a few. These children are from some of the most vulnerable groups in our society – urban slums, HIV-affected families, migrant labor families, street children.
b. Education for Children with Disability: We continue to strengthen our program which supports the educational and rehabilitative needs of children with disabilities from underprivileged backgrounds through 17 projects across six states that works with around 2,200 children. Going beyond just schooling, our approach tries to integrate enabling factors like availability of nutrition, community support, specially trained teachers, assistive technology, access to healthcare etc. Our work in this space covers multiple categories of disability and focuses on early intervention and inclusive education.
c. Primary Health Care: Access to primary health care is a key determinant of an individual’s future trajectory

Wipro Limited 53
in life, including the ability to engage in productive livelihoods and responsible citizenship. Wipro works with partners who provide quality primary health care services to underserved communities covering more than 77,000 people belonging to extremely disadvantaged communities in Nagaland, Karnataka, Delhi and Maharashtra. Our work in these states is in urban slums, and villages where health care access has been weak or non-existent. Our operating approach is driven by the primary goals of building the capacity of the local community in managing their health needs, of augmenting government infrastructure and in training health workers to address the unique needs of the communities.
d. Disaster Rehabilitation: Natural disasters like earthquakes, floods and cyclonic storms are an unfortunate fact of life, especially in a climatically and geologically diverse country like India. Whenever these happen, the disadvantaged sections get affected the most as the already fragile basis of their livelihoods gets further disrupted. Starting with the Gujarat earthquake in 2001, we have responded to several natural calamities wherein Wipro’s employees have also risen to the occasion and played a sterling role. By design, we focus on the more difficult challenge of long-term rehabilitation of the affected communities.
‘Unnati’, the rehabilitation project that we initiated in 2014-15 in Uttarakhand, aftermath its 2013 floods, has
progressed well on multiple fronts. Our program seeks to strengthen local livelihoods of communities in 27 villages in Uttarkashi district through improved farming practices in organic agriculture. A farmers’ cooperative has been set up to strengthen market linkages, a crucial element in the whole value chain. While we think there is a long way to go in this regard, our assessment is that the program is at a stage now where the basic institutional scaffolding is in place and it can be built up effectively, going forward. In response to the Kerala floods in Aug 2018, as part of our rehabilitation program we initiated two projects:
» To restore running of 8 craft-based livelihood centres which have been dysfunctional as a result of the Kerala floods and to train and provide employment for 150 women with a special focus on 30 persons with disabilities.
» To strengthen the existing livelihood of 149 flood affected fishermen community with restoration of damaged fishing equipment and gear.
e. Community Ecology: Our project in agro-forestry in rural Tamil Nadu has helped nearly 100 farmers in effectively implementing integrated farming by planting 40,000 trees in FY 2019. Our project in urban solid waste management at Bengaluru provides social, nutritional and health security to nearly 8,000 workers in the informal sector of waste as well as comprehensive skills upgradation program for about 100 such workers.
Nearly 41,000 children from underprivileged communities benefit from our 24 education projects in eight states IN FY 2019
Through 6 projects, an aggregate of over 77,000 people are getting access to primary health care
Education for Children with Disability program now supports the educational and rehabilitative needs of 2,200 underprivileged children with disabilities through 17 projects in six states
Highlights of the year for our community care program
Project in urban solid waste management in Bengaluru provides social, nutritional and health security to nearly 8,000 workers in the informal sector of waste and provides a comprehensive skills upgradation program for about 100 such workers
Promoting sustainable livelihood among the most vulnerable women from the fishing community in Cuddalore, Tamil Nadu by providing skill training in value added products, marketing skills and linkage to markets
The livelihood projects in Uttarkashi post the Uttarakhand floods of 2013 has helped around 1,000 families to stay back in their village and continue farming. A farmer co-operative called Unnati is setup to guide farmers on farming inputs and in selling their farm products.

54 Annual Report 2018-19
The power of engaged employees
Employees are integral to many of our social programs in many ways. Providing them a platform to engage develops a sense of citizenship and larger responsibility towards society. From our experience, employees also see this as a workplace differentiator, The Wipro Cares trust is built on a model of employee contribution that is matched by Wipro. More than 30,000 Wipro employees are currently engaged with Wipro Cares either through volunteering or by way of monetary contributions or both. During FY 2019, more than 12,500 employees from nearly 40 chapters in India and overseas collectively spent around 33,000 hours in voluntary engagement on a wide range of community and environmental initiatives. One of our prime goals is to further increase the scale and scope of employee engagement.
International Chapters
Our employees across the world are keen and enthusiastic participants in local community initiatives. Through Sprit of Wipro (SoW) Run, more than six thousand Wipro employees from across the globe contributed for their local charities. Beyond the SoW, in North America, First Book continues to be the anchor community program. More than 400 Wipro employees volunteered hundreds of hours and distributed more than 109,000 books impacting more than 50,000 at-risk and rural students throughout North America. Including First Book activities, Wipro employees volunteered more than 5089 hours in the US.
Beyond the US, Wipro Cares chapters in Philippines, UK, Europe, Asia-Pacific and Japan have also been very active in engaging with local communities on a range of initiatives that include disaster rehabilitation (i.e. Australia), biodiversity conservation (i.e. Spain), health care (i.e. Europe & US), food drives (i.e. Brazil & US) and education for disadvantaged children, particularly children with disabilities (i.e. Philippines). All programs remained consistent with the Wipro Cares Charter.
Interactive session of children with Wipro volunteersat Kolkata campus
Wipro Philippines CSR project in CEBU

Wipro Limited 55
Natural CapitalManaging economic development in a manner that does not compromise ecological integrity of our planet has posed one of the biggest challenges to humanity ever since the industrial revolution started. It will be even more so in the coming decades of this century. It is no surprise therefore that 7 of the 17 U.N. Sustainable Development Goals directly reflect these concerns while the remaining 10 goals have indirect intersects with ecology and environment in some way or the other. While the climate change challenge is most talked about and debated, the problems of water scarcity, biodiversity loss and the pollution and depletion of our natural commons are equally critical.
The increasing criticality of issues like climate change and water stress in the last few years has led organizations to look beyond their boundaries. While internal business drivers like resource efficiency, waste management and pollution mitigation have been the primary levers of any corporate environmental program, organizations have come to realize that in order to make a real impact at a larger, systemic level, one can no longer ignore the externalized costs of ecological damage. Natural capital thus refers broadly to the notion that nature provides immense value that is critical to human existence and therefore, any action that depletes natural capital is self-defeating for our society.
Our approach embraces the continuum of• Initiatives ‘within the organization’ that focus on
reducing the energy, water, waste and biodiversity footprint of our business operations; and
• Engaging through partners on key external programs in community ecology.
Ecological Sustainability Governance
Sustainability governance at Wipro is formed by our strategic choice to work across both dimensions – business responsibility and social responsibility. Business responsibility is about ensuring that the ecological footprint of its operations is minimized and about the organization fulfilling its essential regulatory duties, and running its business with integrity. The second dimension of social responsibility is about looking beyond the boundaries of organization and contributing towards development of the larger community. The governance responsibility is spread across hierarchies and functions seeing themselves as key stakeholders in its success; for ecological issues the Global Operations team, the People Function, Community programs team, the Risk office and Employee Chapters play a major role in several of the programs. Strategic oversight of sustainability programs rest at the corporate level with our Chairman, Board of Directors and Group Executive Council. The goals and objectives are jointly set with inputs from across functions. The quarterly reviews are attended by the Chairman, Chief Strategy Officer, Chief Financial Officer and Chief HR Officer apart from the Chief Sustainability Officer and Head of Operations. We benchmark our performance with our global peers through extensive disclosures as well as a system of rigorous audits internal and external. We have started the process of incorporating key sustainability risks like climate change into our ERM framework.
All key organizational stakeholders have defined responsibilities related to planning, execution, review, evangelization and advocacy of the sustainability agenda of the company. The table given below illustrates the responsibility matrix for our environment programs (energy, water, waste and biodiversity).
Planning & Review Execution Internal Evangelizing External Advocacy
Board of Directors
Group Executive Council
Business Leadership
Facilities Management Group
Infrastructure Creation Group
Ecoeye - Sustainability Office
Employee Chapters
Human Resources
Finance
Corporate affairs, Brand & Communication
Risk Office

56 Annual Report 2018-19
Management Approach
The implications of environmental and climate change risks to our business and to our society at large demands the identification and prioritization of material issues for our organization . At Wipro, we have identified Energy efficiency and Green House Gases (GHG) mitigation, Water efficiency and Responsible Water management, Pollution and Waste management, and Campus Biodiversity as our most material issues and have developed programs around them.
Our Ecological Sustainability Policy, available at https://www.wipro.com/content/dam/nexus/en/sustainability/pdf/ecological-sustainability-policy.pdf form the structural framework for our environmental programs and management systems. We have been following the guidelines of the ISO 14001 framework for nearly two decades now as one of the cornerstones of our Environmental Management System (EMS). 20 of our campus sites in India and 8 in Australia are certified to ISO 14001 and OHSAS 18001 standard. Other campuses are benchmarked against the same standard as a part of our internal review/audit process. We have been responding to Carbon Disclosure Project (CDP) Climate Change Investor and Supply Chain for the last 10 years. In addition we have applied the Natural Capital Protocol guidelines to publish our annual Environmental Profit and Loss account. We are also members of LfN (Leaders for Nature) consortium anchored by IUCN in India and CII’s India Business and Biodiversity initiative (IBBI).
Strategic Partnerships are key to achieving our goals across the value chain. We work with Renewable energy suppliers, energy efficient hardware manufacturers and service providers and other partners who help to reduce our overall GHG footprint including employee commute and business travel footprint. We were one of the early adopters of Green Building Design with 18 of our current buildings certified to the international LEED standard (Silver, Gold, and Platinum) during commissioning. We strive to maintain the same standards in the maintenance of our facilities.
A well-defined strategy drives out ecological initiatives with a rigorous framework of target goals and metrics which are reviewed on a regular basis.
Environmental Risks
The Enterprise Risk Management and Sustainability functions at Wipro jointly oversee environmental and climate change related risk identification and mitigation. Impacts of extreme weather events, urban water stress, air pollution, waste management and their impacts on employee health and wellbeing are the most material issues we engaged with. We are currently carrying out a comprehensive climate change risk assessment program, encompassing both physical and transitional risks, for our major operational
locations across the globe, covering India, China, Philippines, Germany, Romania, the UK and the US. This is being done for two scenarios (based on the IPCC defined RCP 4.5 and RCP 8.5) for the medium to long term (2030-2050). . This assessment provides detailed analysis of the changes in key climatic parameters such as temperature and rainfall that are likely to impact Wipro’s operations. It takes into consideration a variety of climate risks which include, an increase in extremely hot days and extremely warm nights, increasing frequency of heat waves, exacerbated urban heat island effect, air quality deterioration, urban flooding and decreasing water availability.
Key outputs from climate modeling:
Our assessment shows that we are likely to observe an increase in day-time temperature (0.02-2.98ºC) and night-time temperature (0.35-1.74ºC) across all locations except Chennai, where a decrease (0.7 ºC) in the day time temperature is likely, in both the short term (by 2030) and long term (by 2050). This increase in day time temperatures could contribute towards an increase in the energy consumption and associated operating costs at each location. This change could also adversely impact the health and well-being of our employees decreasing their productivity. When it comes to rainfall, our risk assessment model predicts an increase in rainfall, ranging from 11 to 267mm, for every city except Kolkata, Pune and Vishakhapatnam which will likely see decreases (13.2-126mm) in rainfall in the long term. Increase in extreme precipitation is likely to lead productivity loss due to employee absence caused by disruption in city infrastructure and an increase in tropical diseases. Given that every city other than Kochi and Kolkata already lie in highly water stressed zones, the predicted rise in temperature coupled with increasing urbanization is likely to accelerate water stress. The corresponding increase in rainfall in most cities is unlikely to help improve this situation unless additional water conservation measures are taken up in the city. Thus, across the country we are likely to experience increasing challenges and costs for procuring water.
We notice that our operations in Romania, China, Philippines and USA are likely to be susceptible to physical risks such as floods, tropical storms and tornadoes. These events could impact the wellbeing of our employees in the affected regions thus impacting our operations. Philippines in particular is likely to face significant fluctuations in rainfall and humidity patterns which could lead to an increase in the spread of infectious diseases in the country, affecting the health of our employees. On the other end of the spectrum, we find that our operations in Germany, the UK, the US, China and Romania, are the ones most exposed to transitional risks arising from policies and regulations geared towards enabling these countries’ transition into low carbon economies. However, we must point out here that the majority (more than 70%) of our employees are based out of India. In addition the fact that all our overseas locations are leased premises reduces

Wipro Limited 57
the direct infrastructural risk in our overseas centers.
Climate change related impact: Our risk assessment exercise is undertaken at both the company level and at the asset level. A well-defined Business Continuity Policy prescribes principles to plan for climatic disruptions which could disrupt business objectives. The Corporate Business Continuity Team (CBCMT) governs and guides the standard risk assessment methodology at every location to identify risks which could potentially impact continuity of business, financial parameters like revenue & profitability as well as reputational and legal parameters. This group collaborates with various support groups in the organization to assess risks for human resources, facilities & IT infrastructure with identified impacts, probability/likelihood & controls in place. A severity matrix of Low, Medium & High impacts is defined and a defined crisis management group is vested with the responsibility to respond, recover, resume, return & restore from these situations. The detailed climate modeling and impact assessment exercise will help in further calibrating our risk management program.
Energy efficiency & GHG mitigation
Science based target setting and recalibration of climate goals: We have used the science based target setting framework from WRI (World Resource Institute) that tries to align with the 2015 Paris agreement which aims to limit global warming to below 2 degrees celsius from pre-industrial levels. We have undertaken a recalibration of our greenhouse gas emission targets to account for two organizational accounting changes – the first due to divestment of our overseas customer data center business to Ensono and the second based on requirements of GHG protocol standard of accounting all leased/rented office spaces emissions under Scope 3. Considering 2017 as the base year, we have set medium term targets till 2022 and 2030 and longer term targets till 2040 and 2050. The following goals have been set for the period FY 2018 to FY 2022:
a. Absolute Scope 1 and 2 GHG emissions – emissions reduction of 23,700 tonnes for offices.
b. Energy Intensity in terms of EPI (Energy Performance Index) - Cumulative reduction of 7.8% in EPI over 5 years
c. GHG Emission Intensity (Scope 1 and Scope 2) on Floor Area (FAR) basis - Cumulative reduction of 16 % in GHG intensity from 117 Kg CO2 eq./ Sq. Mt. (kgpsm) to 98 kgpsm of CO2 –eq
d. Renewable Energy (RE)- Increase renewable energy procurement by 55% to a target of 120 million units in 2021-22
Performance against goals
Absolute Emissions: The absolute Scope 1 and 2 emissions (India) for FY 2019 have decreased by 40% from 1,61,858 to 1,17,290 tonnes - a reduction of over 44,500 tonnes. This is primarily due to significant drop in Scope 2 emissions by 29% due to energy efficiency improvement of nearly 18% as well as increase in share of in renewable energy procurement from 33% to 40% . In addition our India data center emissions have reduced significantly due to reduction in capacity utilization and divestment in the middle of the year.
The dashboard below provides a summary of our Global and India GHG emissions, including data centres. In accordance with the GHG protocol, from 2016-17, we have reclassified leased offices (upstream and downstream) as part of Scope-3. The figures are net emissions for all years, after considering zero emissions for renewable energy procured.
GHG Scope 1 and 2(Tons of CO2 Equiv.)
2016-170
50,000
1,00,000
1,50,000
2,00,000
2,50,000
2017-18 2018-19
Data centers
Offices
50,87453,470
4208
1,76,2721,52,361
1,13,082
Emissions Intensity: Our India office space emissions intensity (Scope 1 and Scope 2) is at 71.3 Kg CO2 eq. per Sq. Mt. per annum, a decrease of nearly 30 % from FY 2018.Concomitantly the global people based emissions intensity is down by more than 29% to 0.85 tons per person per annum.
Energy Consumption: The overall energy consumption from Scope 1 and 2 boundaries (operational and financial control) is 900.8 million Mjoules, compared to 1344.3 million Mjoules in the previous year, a reduction of 33%. The total energy
275000
280000181
177 174
100
150
200
50
0%
265000
260000
255000
250000
245000
169 167
120
80 8595
115
Energy Equivalent - India (MwH)
RE (Mn units) - For adoption & Communication
EPI India (KwH per sq. mt. PA)
2017 20192018 2020 2021 2022
170
110

58 Annual Report 2018-19
consumption, electricity and back-up diesel generated, for office spaces in India is 225 million units (including leased spaces globally this is 265 million units). Our overseas data center business was divested before the reporting year. Data centers in India, till their divestment contributed to another 5.1 million units.
For India operations, about 98 million units constituted renewable energy procured through PPAs (Power Purchase agreements) with private producers. Of this 92 million units is with green attributes (zero emissions). Another 10 million units is from renewable resources for our downstream leased space. In total renewable energy in our portfolio is 108 million units.
Energy Intensity: EPI for owned office spaces, measured in terms of energy per unit area has decreased by around 18.5% to 142 KwH units per sq. meter per annum. The absolute energy has reduced by 14% for the reporting year. The office space has increased by 5.3% in the reporting year.
Scope 3 Emissions: A summary of our Scope 3 emissions (other indirect sources) is provided below. Out of the 15 categories of scope 3 reporting as per the new GHG corporate value chain standard, we are currently reporting on all of the 8 categories applicable to us Downstream Scope 3 emissions: We have moved some facilities to a sub-leased model in the middle of the reporting year. This will be reported separately from the next year.
The table below shows the applicability and current reporting coverage across our operations for the major Scope 3 categories
Scope 3 Emissions Category Current Reporting, Coverage within IT business Tons of CO2 eq.
Purchased goods and servicesBased on purchase ledger for FY 2018 and application of econometric input-output model for different categories and business activities: 82,246
Fuel- and energy-related activi-ties (not included in scope 1 or scope 2)
Well To Tank (WTT) and Transmission and Distribution (T&D) losses globally 76,659
Upstream transportation and distribution
Not Reported, as not material
Waste generated in operations For India operations (85% coverage) 760
Employee commuting For India operations, which represents nearly 85% of footprint 79,160
Business travel Global. Includes air, bus, train, local conveyance and hotel stays 117,819
Upstream leased assets (Leased office space for Wipro use)
Leased offices spaces in India (10,162 tons) and overseas (14,140 tons CO2 eq)
24,302
Downstream leased assets ( Office space leased out)
Included in Scope 1 and 2 (transitioned mid year)
Total 380,946
The graph below shows the comparison for Business Travel, employee commute and Waste for last three years.
GHG Scope 3(Tons of CO2 Equiv.)
2016-17150,000
175,000
200,000
225,000
250,000
275,000
2017-18 2018-19
245,975
214,114197,739
Total Emissions: The overall emissions across all scopes is 498,236 tonnes. Within this, the main contributors to our GHG emissions are: Electricity – Purchased and Generated (22.1%), upstream fuel and energy emissions (15.4%), Business Travel (23.6%) and Employee Commute (15.9%). Leased office spaces contribute to 4.9% of emissions.
Wipro Electronic City campus

Wipro Limited 59
VDI’s across two of our campuses in the year. Thin clients consumes less energy (80% less) compared to Desktop, resulting in savings of 0.75 million units. Over a 5 year period, energy efficiency initiatives have resulted in savings of 140 million units (based on per capita consumption).
RE procurement: For the reporting period of FY 2019, RE purchase contributed to approximately 92 million units or 40% of our total India energy consumption. Our target for next year is 105 million units. RE procurement has cumulatively helped avoid emissions of 330,000 tons of CO2
eq. over a 5 year period.
Rooftop Solar and Captive RE: The rooftop Solar PV installations at 6 of our campuses followed by extensive use of solar water heaters in our guest blocks and cafeterias have resulted in equivalent savings of 1.54 million units of grid electricity in the reporting year
Business Travel: The IT services outsourcing model requires frequent travel across the delivery life cycle to customer locations, mainly overseas, and contributes to around 1/5th of our overall emissions footprint. This includes travel by air, bus, train, local conveyance and hotel stays. Policies on usage of different modes of travel based on distance and time taken, need and budget-based travel and increasing focus on processes which enable remote working and collaboration are some of the cost and process optimization measures implemented over past few years. We have seen an air travel footprint reduction of around 21% compared to FY 2018.
Employee Commute: Employees have various choices for intra-city commuting. In addition to company arranged transport (36%), employees owned cars & two wheelers contribute to 12% and other modes of transport including public transport account for the balance.
Over the past few years, we have taken steps to facilitate a shift towards improved access to public transport for employees (buses, commuter trains) and carpooling. Our car pooling initiative launched through a third-party mobile app based partners in July’16 in Bengaluru has now scaled and expanded to 8 other locations in India. With this, we now have 74,000 registered users across locations. Around 9 Million kms of rides were shared in the reporting year saving 2100 tons of CO2 equivalent emissions
We became the first major Indian business to join EV100 in April 2018, a commitment to transition our global fleet to electric vehicles (EVs) by 2030. EV100 is a global initiative by The Climate Group bringing together forward-looking companies committed to accelerating the transition to electric vehicles (EVs). In the current year (since July 2018), 2.0 Million Kms across 33,000 trips have been covered in Hyderabad, the first location where we have started the program.
Wipro’s electronics city campus was awarded the Greenco Silver Rating by CII-GBC (Green Business Center). We were the first campus in IT Services sector to have received the award. The rating is provided based on 700 points performance covering energy efficiency, water conservation, renewable energy, GHG emission reduction, waste management, material conservation, green supply chain and other innovations.
GHG Mitigation Measures
Our five year GHG mitigation plan consists of three key elements – Energy Efficiency (Reduce), Renewable Energy (RE) Purchase (Replace) and Travel Substitution (Reduce and Replace); of this, RE procurement will contribute the maximum, 80% share to GHG emission mitigation strategy for Scope 1 and 2.
Energy Efficiency: These measures include new retrofit technologies to improve Chiller and Air Handling Units (AHUs), integrated design and monitoring platforms. The Global Energy command centre aggregates Building Management System inputs on a common platform to optimize operational control and improve energy efficiency. At one of our campuses, we have seen a 15% YoY reduction in absolute energy consumption. This has been achieved by operating the plant in auto-mode (based on real time demand), performance monitoring of equipment and optimization of air-water balance in chiller plant - resulting in improved thermal comfort.
Since 2007, we have been working on a server rationalization and virtualization program, through which we have decommissioned old physical servers and replaced the processing capacity with virtualization technology on fewer numbers of servers. As of March 2019, we have 6,750 virtual servers (4,780 in March 2018) running on 386 physical servers which contributes to an energy savings of approximately 29 million units in the reporting year. The savings showed an increase of 44% over the previous year. We have enhanced our Virtual Desktop Infrastructure (VDI) capacity to 8,000. VDI’s provide high capacity scalable infrastructure with On Demand provisioning, High Availability and High Performance Computing environment. Out of this, we have enabled 6,300
Global Energy Command Center

60 Annual Report 2018-19
IT infrastructure enablers like anytime direct connectivity access to office intranet applications, secure personal device connectivity through the BYOD initiative (Bring Your Own Devices) are other key steps in enabling more flexible work place options.
Water efficiency and responsible use
Urban water in India is a story of paradoxes and extremities. Water related risks in cities range from supply shortages, equitable availability to all sections of the population to urban flooding driven by extreme weather events. This is symptomatic of a failure in urban planning and governance of a critical resource as water. At Wipro, we view water from the inter-related lens of efficiency and conservation coupled with our role as a responsible citizen in engaging with urban water issues outside our own boundaries. Our articulated goals are therefore derived from these three dimensions.
Water Efficiency
Goalsa. To improve water efficiency (fresh water use per
employee) by 5% year on yearb. To reduce absolute water consumption in existing
campuses by 20% between FY 2016 and FY 2021
Water Responsibility
To ensure responsible water management in proximate communities, especially in locations that are prone to water scarcity. We are also collaborating on building capacity and advocacy platforms at the city level for integrated urban water management.
Freshwater recycling and efficiency
The per employee water consumption for the reporting year is 951 litres per month as compared to 991 litres in FY 2018, an improvement of around 4%. Freshwater consumption has seen a marginal increase from last year at 1518 million Liters essentially due to few leakages from aging pipeline network. Real-time monitoring pilots are being implemented in two of
our campuses. Water free systems (where applicable), smart metering, optimizing heating and cooling and recycling of blow down are other initiatives being explored. However, we have achieved 18% reduction in absolute fresh water consumption from FY 2016 and are on target to exceed our target of 20% reduction by FY 2021.
We recycle 1,090 million litres of water in 27 of our major locations (vs 1,045 million litres in FY 2018) using Sewage Treatment Plants (STPs) and ultra-filtration units.
Recycled water represents 42% of our total water consumption (vs 41% in the previous year). The amount of recycled water as a percentage of freshwater extracted is around 72%, up from 69% in FY 2018. This improvement in efficiency is due to the adoption of ultra-filtration and RO projects for STP treated water at three our large locations. Of the total treated water (1090 million liters), 62% is used for flushing and 6% is used in cooling tower. The balance 32% is used for our landscapes – the quality is equivalent to freshwater (Less than TDS of 1000). Our water recycling initiatives have cumulatively saved 5030 million liters of water over a 5 year period.
Fresh water use-India offices
1650000 1.100
1700000 1.150
1600000 1.050
1550000 1.000
1500000 0.950
1450000 0.900
1400000 0.850
Fresh water (KL)
People intensity(KL pp per month)
Area intensity(KL per sq mt)
2016-17
1.090
0.991
0.951
2017-18 2018-19
Sourcing of Water: Our water is from four sources – private water (mainly ground water sourced from tanker water suppliers), municipal water supply, in-situ ground water and harvested rain water – with the first two sources accounting for nearly 98% of the sourced water. Water purchased from private sources can be traced to have been primarily extracted from ground water. Not surprisingly, ground water contributes to nearly 56% of our total freshwater consumption across cities in India – an overexploited resource which has also been largely left out of effective governance mechanisms. Our urban/ peri-urban facilities located in three states – Karnataka, Tamil Nadu and Telengana, are located in water stressed basins. The
EV at Hyderabad campus
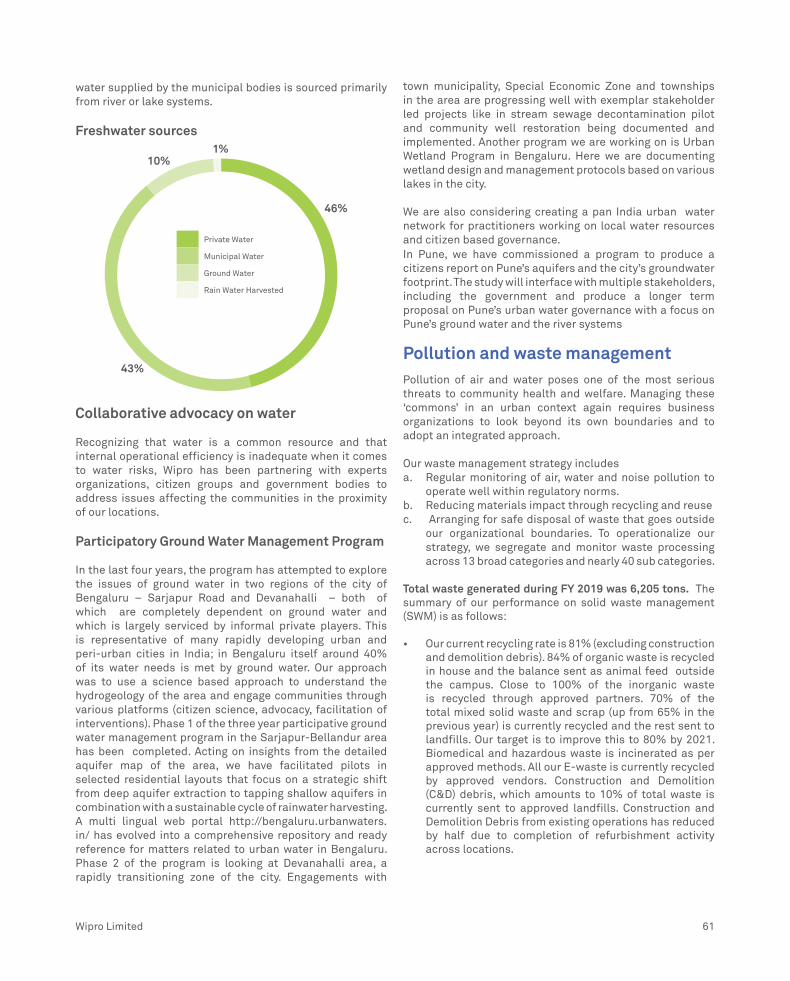
Wipro Limited 61
water supplied by the municipal bodies is sourced primarily from river or lake systems.
Freshwater sources
Private Water
Municipal Water
Ground Water
Rain Water Harvested
46%
1%
43%
10%
Collaborative advocacy on water
Recognizing that water is a common resource and that internal operational efficiency is inadequate when it comes to water risks, Wipro has been partnering with experts organizations, citizen groups and government bodies to address issues affecting the communities in the proximity of our locations.
Participatory Ground Water Management Program
In the last four years, the program has attempted to explore the issues of ground water in two regions of the city of Bengaluru – Sarjapur Road and Devanahalli – both of which are completely dependent on ground water and which is largely serviced by informal private players. This is representative of many rapidly developing urban and peri-urban cities in India; in Bengaluru itself around 40% of its water needs is met by ground water. Our approach was to use a science based approach to understand the hydrogeology of the area and engage communities through various platforms (citizen science, advocacy, facilitation of interventions). Phase 1 of the three year participative ground water management program in the Sarjapur-Bellandur area has been completed. Acting on insights from the detailed aquifer map of the area, we have facilitated pilots in selected residential layouts that focus on a strategic shift from deep aquifer extraction to tapping shallow aquifers in combination with a sustainable cycle of rainwater harvesting. A multi lingual web portal http://bengaluru.urbanwaters.in/ has evolved into a comprehensive repository and ready reference for matters related to urban water in Bengaluru. Phase 2 of the program is looking at Devanahalli area, a rapidly transitioning zone of the city. Engagements with
town municipality, Special Economic Zone and townships in the area are progressing well with exemplar stakeholder led projects like in stream sewage decontamination pilot and community well restoration being documented and implemented. Another program we are working on is Urban Wetland Program in Bengaluru. Here we are documenting wetland design and management protocols based on various lakes in the city.
We are also considering creating a pan India urban water network for practitioners working on local water resources and citizen based governance. In Pune, we have commissioned a program to produce a citizens report on Pune’s aquifers and the city’s groundwater footprint. The study will interface with multiple stakeholders, including the government and produce a longer term proposal on Pune’s urban water governance with a focus on Pune’s ground water and the river systems
Pollution and waste managementPollution of air and water poses one of the most serious threats to community health and welfare. Managing these ‘commons’ in an urban context again requires business organizations to look beyond its own boundaries and to adopt an integrated approach.
Our waste management strategy includes a. Regular monitoring of air, water and noise pollution to
operate well within regulatory norms. b. Reducing materials impact through recycling and reusec. Arranging for safe disposal of waste that goes outside
our organizational boundaries. To operationalize our strategy, we segregate and monitor waste processing across 13 broad categories and nearly 40 sub categories.
Total waste generated during FY 2019 was 6,205 tons. The summary of our performance on solid waste management (SWM) is as follows:
• Our current recycling rate is 81% (excluding construction and demolition debris). 84% of organic waste is recycled in house and the balance sent as animal feed outside the campus. Close to 100% of the inorganic waste is recycled through approved partners. 70% of the total mixed solid waste and scrap (up from 65% in the previous year) is currently recycled and the rest sent to landfills. Our target is to improve this to 80% by 2021. Biomedical and hazardous waste is incinerated as per approved methods. All our E-waste is currently recycled by approved vendors. Construction and Demolition (C&D) debris, which amounts to 10% of total waste is currently sent to approved landfills. Construction and Demolition Debris from existing operations has reduced by half due to completion of refurbishment activity across locations.

• The proportion of waste that is send to landfill (excluding construction and demolition debris) is currently at 3.4%. This is mainly mixed scrap and solid waste, which can not be further segregated and recycled. We plan to evaluate co-processing options for this category of waste in cement manufacturing.
Waste Management Summary (Excluding C&D)
Recyle - 81%
Landfill - 3%
Other Methods - 10%
Incineration - 6%
Others: We monitor diesel generator stack emissions (NOX, SOX and SPM), indoor air quality (CO, CO2, VOC’s, RSPM), treated water quality and ambient noise levels across 25 key locations every month. These meet the specified regulatory norms.
Collaborative Engagements
Zero Plastic Initiative: We generate around 120 tons of plastic waste every year. At present, this is sent to approved recyclers. However we aim to significantly reduce plastic waste by looking at close to 20+ categories and introducing process changes and engaging with suppliers. Some examples of plastic reduction initiative are replacement of single use cutlery, packing, etc.
We continue to work with Electronic City Industrial Township Authority (ELCITA) in Bengaluru on SWM issues. We continue to be part of the sub-committee on ‘Waste’ in the CII National Environment Committee. We are associated with “Reimagine Waste” hackathon for the past three years, being conducted in association with Indian Institute of Science, Bengaluru, Waste Ventures and other partners. We supported a study to understand the contribution of informal economy to waste and material recycling in Bengaluru. This study was done by
Hasiru Dala in association with IIHS, Bengaluru. The study report will now be disseminated through workshops and a publication.
Urban Biodiversity
Our urban biodiversity program addresses the twin aims of creating biodiversity in our urban campuses while also using it as a platform for wider education and advocacy. We have set the following goals:
• To convert five of our existing campuses to biodiversity zones
• All new campuses to incorporate biodiversity principles into their design
Our first flagship project in biodiversity was the unique Butterfly Park and wetland biodiversity zone that uses recycled water at the Electronic City campus in Bengaluru. Our second project in Pune focused on trebling the number of native species and includes five thematic gardens – Aesthetic and palm garden, Spring garden, Ficus garden, Spice and Fruit garden. This is a unique project in a corporate campus setting with a dense year-round flowering of more than 240 species of native plants serving multiple ecological purposes. In all these programs we work closely with expert partners in biodiversity, conservation, ecological design and communications. A work environment which integrates biodiverse and natural design principles has multiple intangible benefits for employees and visitors – it builds a larger sense of connectedness and emphasizes values of sensitivity and our place in the world around us. To strengthen these connects, we regularly conduct photography sessions, nature walks and plantation activities for employees and their children.
Collaborative advocacy: Our participation in advocacy on biodiversity issues is through the Leaders for Nature program from the India chapter of International Union of
Wetland biodiversity zone
62 Annual Report 2018-19

Wipro Limited 63
Conservation Networks (IUCN). We have been supporting the “World Sparrow Day” and the “Wipro-Nature Forever Society Sparrow Awards” for the past six years. We also chair the Bengaluru chapter of CII’s Greenco program.
Bengaluru Sustainability Forum (BSF)
This forum was set up in early 2018 and convened by Wipro along with the National Center for Biological Sciences. BSF brings together civil society, academia, research institutions and government with the broad goals of fostering curated interactions between different stakeholders on issues of urban sustainability. Over the past year, the forum has curated three retreats on the themes of Urban Water, Biodiversity and Climate Change. Complementing the network building has been the small grants program for collaborative projects – nine proposals from the first two themes of urban water and biodiversity were selected.
Wipro’s Natural Capital Valuation Program
Valuation of natural capital externalities of a company serves multiple objectives :
a. For the company, it provides a useful anchoring ref-erence of how large its externalities are when com-pared to the financial capital and value it has creat-ed for its shareholders. It also serves as a common lexicon for strategic conversations on natural capi-tal within and outside the company
b. For investors, it is an indicator of the company’s risk profile when weighed against current and future en-vironmental regulations
c. For interested citizen groups, it helps provide a more nuanced understanding of the company’s profile. We have been active and enthusiastic early adopters of natural capital valuation and it aligns very well with our larger emphasis on Integrated Reporting, This is the fourth year of the valuation exercise for us
Total environmental cost relating to Wipro’s operations and supply chain was equal to ` 10,841 million in FY 2018. GHG emissions (47%), water consumption (26%) and air pollution (16%) contributed the most. The operational footprint (including business travel and employee commute) accounted for 48% (` 5246 million) of Wipro’s total environmental cost in FY 2018, a 11% decrease from previous year (` 5874 million). In supply chain, fuel and energy related activities decreased by 8% year on year and purchased goods and services increased by 12% during the same period.
The above figures are net of our positive valuation, attributable to our environmental initiatives. The biggest driver of overall environmental cost reduction by ` 1,265 million – around 6% increase from ` 1,152 million in FY 2017 were emission reduction activities, water recycling and renewable energy procurement. Valuation for FY 2019 is unlikely to vary significantly different and will be completed in July 2019.
Participants in BSF

Natural Capital – Relations to other capital
This disclosure is in conformance with the CDSB Framework. Due care has been taken to apply the guiding principles and comply with the reporting requirements laid out by CDSB Framework. While preparing the report, the recommendations set out by the Task Force on Climate-related Financial Disclosures were also considered. The report also aligns with the requirements of NVG Guidelines issued by MCA.
NATURAL CAPITAL
Social & RelationshipCapital
• Till date we saved 2.6 Mn KW energy through engagement with suppliers on green IT hardware procurement
• 8,600 schools and colleges outreach through Wipro’s flagship sustainability education programme.
• 150 customers assessing Wipro annually on Sustainability performance
• Commissioned a program to study groundwater footprint in proximate of two cities
Financial Capital
• 8% reduction in cost of Air Travel YoY
• Reduction in energy cost by 13.8% and fresh water import cost by 5.6% YoY
Human Capital
• 5 global UN environment day cerebrated across locations
• 74,000 employees register for car pooling in India. 9 million km of ride shared during FY 2019, saving 2100 tons of CO2 eq. emissions
64 Annual Report 2018-19

Annual Report 2018-19 65
On behalf of the Board of Directors (the “Board”) of the Company, it gives me immense pleasure to present the 73rd Board’s Report, along with the Balance Sheet, Profit and Loss account and Cash Flow statements, for the financial year ended March 31, 2019.
I. Financial Performance
The standalone and consolidated financial statements for the financial year ended March 31, 2019, forming part of this Annual Report, have been prepared in accordance with the Indian Accounting Standards (Ind AS) as notified by the Ministry of Corporate Affairs.
On a consolidated basis, our sales increased to ̀ 585,845 million for the current year as against ̀ 544,871 million in the previous year, recording an increase of 7.52%. Our net profits increased to ` 90,179 million for the current year as against ` 80,031 million in the previous year, recording an increase of 12.68%.
On a standalone basis, our sales increased to ` 480,298 million for the current year as against ` 447,100 million in the previous year, recording an increase of 7.43%. Our net profits declined to ̀ 76,140 million in the current year as against ` 77,228 million in the previous year, recording a decline of 1.41%.
Key highlights of financial performance of your Company for the financial year 2018-19 are provided below:
(` in millions)
Standalone Consolidated2018-19 2017-18 2018-19 2017-18
Sales 480,298 447,100 585,845 544,871Other Operating Income 940 - 4,344 -Other Income 25,686 24,796 26,138 25,487Profit before Tax 98,705 100,343 115,422 102,422Provision for Tax 22,565 23,115 25,243 22,391Net profit for the year 76,140 77,228 90,179 80,031Other comprehensive (loss)/income for the year
1,246 (7,300) 800 (3,127)
Total comprehensive income for the year
77,386 69,928 90,979 76,094
Total comprehensive income for the period attributable to:Minority Interest - - 251 19Equity holders 77,386 69,928 90,728 76,885
Standalone Consolidated2018-19 2017-18 2018-19 2017-18
Appropriations
Dividend 4,524 4,525 4,504 4,499
Corporate tax on distribution of dividend
930 921 930 921
EPS
- Basic
- Diluted
12.67
12.64
16.26
16.23
14.99
14.95
16.85
16.82
Dividend
Pursuant to Regulation 43A of the Securities and Exchange Board of India (Listing Obligations and Disclosure Requirements) Regulations, 2015, as amended (“Listing Regulations”), the Board has approved and adopted a Dividend Distribution Policy. The policy details various considerations based on which the Board may recommend or declare Dividend, dividend track record, usage of retained earnings for corporate actions, etc. The policy is available on the Company’s website at https://www.wipro.com/investors/corporate-governance.
Pursuant to the approval of the Board of Directors on January 18, 2019, your Company paid an interim dividend of ` 1/- per equity share of face value of ` 2/- each, to shareholders who were on the register of members as on January 30, 2019, being the record date fixed for this purpose. The Board has not recommended a final dividend and the interim dividend of ` 1/- declared by the Board in January 2019 shall be considered as the final dividend for the financial year 2018-19. Thus, the total dividend for the financial year 2018-19 remains ` 1 per equity share.
Your Company is in compliance with its Dividend Distribution policy as approved by the Board.
Issue of Bonus Equity Shares
The Board of Directors at their meeting held on January 18, 2019, recommended issue of bonus equity shares, in the proportion of 1:3, i.e. 1 (One) bonus equity share of ` 2/- each for every 3 (three) fully paid-up equity shares held (including American Depository Shares (“ADS”)). The said bonus issue was approved by the Members of the Company vide resolution dated February 22, 2019 passed through postal ballot/e-voting, subsequent to which, on
Board’s Report

66 Wipro Limited
March 8, 2019, 1,508,469,180 bonus shares were allotted to the Members whose names appeared on the register of members as on March 7, 2019, being the record date fixed for this purpose.
As part of the aforesaid allotment, 106,273 bonus equity shares representing fractional entitlement(s) of eligible Members were consolidated and allotted to the trustee appointed by the Board. Subsequently, the trustee sold such equity shares at the prevailing market price and distributed the net sale proceeds, after adjusting the costs and expenses in respect thereof, among the eligible Members in proportion to their respective fractional entitlements.
Buyback of Equity Shares
On April 16, 2019, the Board approved a proposal to buyback up to 323,076,923 (Thirty Two Crores Thirty Lakhs Seventy Six Thousand Nine Hundred and Twenty Three) equity shares of the Company for an aggregate amount not exceeding ̀ 105,000,000,000/- (Rupees Ten Thousand Five Hundred Crores only), being 23.03% of the aggregate of the fully paid-up equity share capital and free reserves as per the audited standalone balance sheet as at March 31, 2019, at a price of ̀ 325/- (Rupees Three Hundred and Twenty Five) per equity share.
Subsequently, vide resolution dated June 1, 2019, the shareholders approved the buyback of equity shares through postal ballot/e-voting. The buyback is proposed to be made from all the existing Members of the Company as on June 21, 2019, being the record date for this purpose, on a proportionate basis under the tender offer route in accordance with the provisions contained in the Securities and Exchange Board of India (Buy-Back of Securities) Regulations, 2018 and the Companies Act, 2013 and the rules made thereunder.
Share Capital
During the financial year 2018-19, your Company’s authorized capital was increased from ` 11,265,000,000/- (Rupees One Thousand One Hundred and Twenty Six Crores and Fifty Lakhs) to ` 25,274,000,000 /- (Rupees Two Thousand Five Hundred and Twenty Seven Crores and Forty Lakhs) by creation of additional 7,004,500,000 (Seven Hundred Crores and Forty Five Lakhs) equity shares of ` 2/- (Rupees Two each). The said increase in authorized share capital was pursuant to approval of shareholders through postal ballot/e-voting dated February 22, 2019 and also as per the terms of the Scheme (as defined below) approved by the Hon’ble National Company Law Tribunal (“NCLT”), Bengaluru Bench, on account of clubbing the authorized share capital of Appirio India Cloud Solutions Private Limited with and into the authorized capital of your Company.
During the year 2018-19, the Company allotted 1,681,717 equity shares and transferred 2,599,183 equity shares of ` 2/- each from Wipro Equity Reward Trust, pursuant to exercise of stock options by eligible employees and allotted 1,508,469,180 equity shares of ` 2/- each as bonus equity shares on March 8, 2019 by capitalization of sums standing to the credit of the free reserves and/or the securities premium account and/or the capital redemption reserve account of the Company. Consequently, the paid-up equity share capital of the Company as at March 31, 2019 stood at ` 12,067,870,776/- consisting of 6,033,935,388 equity shares of ` 2/- each.
During the year under review, the Company has not issued shares with differential voting rights and sweat equity shares.
Transfer to Reserves
Appropriations to general reserve for the financial year ended March 31, 2019 as per standalone and consolidated financial statements are as under:
(` In millions)
Standalone Consolidated
Net profit for the year 76,140 90,037
Balance of Reserve at the beginning of the year
413,578 470,215
Adjustment on adoption of Ind AS 115
(1,605) (2,279)
Adjustment on account of merger
(975) -
Transfer to General Reserve - -
Balance of Reserve at the end of the year
481,852 552,158
Subsidiary Companies
In accordance with Section 129(3) of the Companies Act, 2013, a statement containing salient features of the financial statements of the subsidiary companies in Form AOC-1 is provided at page 285 of this Annual Report. The statement also provides details of performance and financial position of each of the subsidiaries.
Audited financial statements together with related information and other reports of each of the subsidiary companies have also been placed on the website of the Company at www.wipro.com.
During the financial year 2018-19, your Company invested an aggregate of ` 36,373 million in its direct subsidiaries. Apart from this, your Company funded its subsidiaries, from time to time, as per the fund requirements, through loans, guarantees and other means to meet working capital requirements.

Annual Report 2018-19 67
During the financial year 2018-19, your Company has carried out restructuring of its following subsidiaries:
a) Merger of Wipro Technologies Austria GmbH, Wipro Information Technology Austria GmbH, NewLogic Technologies SARL and Appirio India Cloud Solutions Private Limited (wholly owned subsidiaries) with and into Wipro Limited pursuant to order dated March 29, 2019 passed by NCLT approving the scheme of amalgamation (“Scheme”) for the aforesaid merger. As per the said Scheme, the appointed date is April 1, 2018.
b) Liquidation of Appirio Singapore Pte Ltd and Appirio GmbH.
c) Merger of Cellent Mittelstandsberatung GmbH with and into Cellent GmbH, Germany.
d) Reduction of the Company’s equity holding in WAISL Limited (formerly known as Wipro Airport IT Services Limited), which was a joint venture between Wipro Limited and Delhi International Airport Limited, from 74% to 11%, by selling the stake to Antariksh Softtech Private Limited on April 5, 2018.
e) Setting up of a new subsidiary namely Wipro IT Services S.R.L in Romania.
f) Setting up of a new subsidiary namely Wipro US Foundation in USA.
Transfer to Investor Education and Protection Fund
a) As required under the Investor Education and Protection Fund Authority (Accounting, Audit, Transfer and Refund) Rules, 2016 (“IEPF Rules”), during the year 2018-19, unclaimed dividend for financial years 2010-11 and 2011-12 of ` 7,929,792/- and ` 4,714,164/- respectively, were transferred to the Investor Education and Protection Fund (“IEPF”).
b) Pursuant to the provisions of Section 124(6) of the Companies Act, 2013 and the IEPF Rules, during the year 2018-19, 60,958 equity shares in respect of which dividend has not been claimed for the final dividend declared in financial year 2010-11 and interim dividend declared in financial year 2011-12 were transferred to the IEPF authority.
c) Pursuant to Rule 6(8) of the IEPF Rules, under the bonus issue, 426,445 equity shares were allotted to the IEPF authority based on their shareholding as on the record date of March 7, 2019 and an amount of ` 102,485 /- pertaining to sale proceeds of fractional bonus shares were transferred to the IEPF.
Particulars of Loans, Advances, Guarantees and Investments
Pursuant to Section 186 of Companies Act, 2013 and Schedule V of the Listing Regulations, disclosure on particulars relating to loans, advances, guarantees and investments are provided as part of the financial statements.
Deposits
Your Company has not accepted any deposits from public and as such, no amount on account of principal or interest on public deposits was outstanding as on the date of the balance sheet.
II. Business
Your Company is a leading information technology, consulting and business process services company. Your Company’s range of services includes digital strategy, customer-centric design, consulting, infrastructure services, business process services, research and development, cloud, mobility and advanced analytics and product engineering. Your Company offers its customers a variety of commercial models including time and material, fixed price, capacity based, pay-per-use, as-a-service and outcome based models. Your Company offers all of these services and models globally by leveraging its proprietary products, platforms, partnerships and solutions, including state of the art automation technologies such as cognitive intelligence tool, Wipro HOLMES Artificial Intelligence PlatformTM (“Wipro HOLMESTM”).
The vision for your Company’s business is “to earn our clients’ trust and maximize value of their businesses by helping them in their journey to ‘re-invent’ their business and operating models with its ‘Digital’ first approach and best in class execution”. To realize its vision and strategy, your Company is prioritizing and investing to drive growth in key strategic fields such as digital, cloud, cybersecurity and industrial and engineering services through its “Big Bet” program. For example, your Company’s “Big Bet” in each of digital and cloud are at the heart of its Business Re-imagination and Engineering Transformation and Modernization pillars, while the “Big Bet” in industrial and engineering services is central to its Connected Intelligence pillar and the “Big Bet” in cyber security is central to its Trust pillar.
Your Company provides its clients with competitive advantages by applying various emerging technologies and ensuring cyber resilience and cyber assurance. Your Company works with its clients not only to enable their

68 Wipro Limited
digital future, but also to drive hyper efficiencies across their technology infrastructure, applications and core operations, enabling them to achieve cost leadership in their businesses. Going forward, digital enterprises will increasingly require partners, such as Wipro, who are able to bring capabilities that span consultancy, design, engineering, systems integration and operations to enable them to achieve digital transformation. These combined capabilities will only be effective if delivered in the context of the relevant industry or domain. Hence, it is critical to your Company that it provides strong domain expertise along with “Digital”. Your Company has invested significantly in building domain expertise and will continue to strengthen its domain capabilities.
Your Company’s IT Products segment provides a range of third-party IT products, which allows it to offer comprehensive IT system integration services. These products include computing, platforms and storage, networking solutions, enterprise information security and software products, including databases and operating systems. Your Company continues to focus on being a system integrator of choice where it provides IT Products as a complement to its IT Services offerings rather than sell standalone IT Products.
Sector Outlook
According to the Strategic Review 2019 published by NASSCOM (the “NASSCOM Report”), “Digital” continues to drive growth (more than 30% of growth in fiscal year 2019) and now contributes $33 billion to the overall IT industry in India. Technologies such as industrial automation, robotics, cloud, Internet of things (“IoT”), augmented reality (“AR”)/virtual reality (“VR”) and blockchain continue to fuel growth.
Global IT service providers offer a range of end–to-end software development, digital services, IT business solutions, research and development services, technology infrastructure services, business process services, consulting and related support functions. According to the NASSCOM Report, IT export revenues from India grew by 8.3% to an estimated $136 billion in fiscal year 2019.
Acquisitions, Divestments and Investments
Acquisitions are a key enabler for driving capability to build industry domain, focus on key strategic areas, strengthen presence in emerging technology areas including Digital, and increase market footprint in newer markets. Your Company focuses on opportunities where it can further develop its domain expertise, specific skill sets and its global delivery model to maximize service and product enhancements and higher margins.
During July 2018, your Company has entered into a strategic partnership arrangement with Alight Solutions, a leader in technology-enabled health, wealth, HR and finance solutions, which will reshape the HR services industry by providing Alight’s clients with the breadth and depth of capabilities from the two industry-leading organizations. Your Company has also divested its Workday and Cornerstone OnDemand business to Alight Solutions LLC.
Further, your Company completed divestment of its data center services business to Ensono Holdings, LLC, a leading hybrid IT services provider, consisting of Wipro Data Centre and Cloud Services, Inc. (USA) and data center services business in certain other countries.
The strategic investment arm of your Company, Wipro Ventures is a $100 million fund that invests in early to mid-stage enterprise software startups. As of March 31, 2019, Wipro Ventures has active investments in and partnered with 13 startups in the following areas – AI (Avaamo, Inc., Vicarious FPC, Inc.), Business Commerce (Tradeshift, Inc.), Cybersecurity (IntSights Cyber Intelligence Ltd., Vectra Networks, Inc., CyCognito), Data Management (Imanis Data, Inc.), Industrial IoT (Altizon Systems Private Ltd.), Fraud & Risk Mitigation (Emailage Corp.), Testing Automation (Headspin, Inc., Tricentis GmbH) and Cloud Infrastructure (Cloudgenix, Moogsoft). In addition to direct investments in emerging startups, Wipro Ventures had invested in four enterprise-focused venture funds: TLV Partners, Work-Bench Ventures, Glilot Capital Partners and Boldstart Ventures. During the year ended March 31, 2019, one of our portfolio companies, Demisto, was acquired.
Management Discussion and Analysis Report
In terms of Regulation 34 of the Listing Regulations and SEBI circular SEBI/HO/CFD/CMD/CIR/P/2017/10 dated February 6, 2017, your Company has adopted salient features of Integrated Reporting prescribed by the International Integrated Reporting Council (‘IIRC’) as part of its Management Discussion and Analysis report (“MD&A Report”). The MD&A report, capturing your Company’s performance, industry trends and other material changes with respect to your Company and its subsidiaries, wherever applicable, are presented from pages 18 to 64 of this Annual Report.
The MD&A Report provides a consolidated perspective of economic, social and environmental aspects material to its strategy and its ability to create and sustain value to your Company’s key stakeholders and includes aspects of reporting as required by Regulation 34 of the Listing Regulations on Business Responsibility Report. Statutory section of Business Responsibility Report is provided from pages 346 to 352 of this Annual Report.
Annual Report 2018-19 69
Key Awards and Recognitions
Your Company is one of the most admired and recognized companies in the IT industry. Your Company won several awards and accolades, out of which key recognitions are given below:
1. Wipro was ranked as the third fastest growing global IT Services brand in 2019 in a study conducted by Brand Finance, the world’s leading brand valuation firm.
2. Wipro received ‘Quality Global Supplier’ award from innogy SE.
3. Wipro was rated a Leader in Digital Transformation in ITSMA Report.
4. Wipro has been recognized as a Leader in Digital Process Automation by Independent Research Firm.
5. Wipro was included in the Dow Jones Sustainability Index (DJSI) – World and Emerging Markets for the 9th time in succession.
6. Wipro has been cited as a Leader in Everest Group’s Digital Workplace Services PEAK Matrix assessment.
7. Wipro’s Intellectual Property Portfolio was Recognized with National IP Award and WIPO Enterprise IP Trophy.
8. Wipro was cited as a Leader in Gartner’s Magic Quadrant for Data Center Outsourcing and Hybrid Infrastructure Managed Services, North America.
9. Wipro has been recognized for second successive year in the “Leadership” category for corporate governance practices on the basis of the Indian Corporate Governance Scorecard, which is a framework developed jointly by International Finance Corporation, a member of the World Bank group, BSE Limited and Institutional Investor Advisory Services based on globally accepted G20/OECD principles.
Further details of awards and accolades won by your Company are provided at page 11 of this Annual Report.
III. Governance and Ethics
Corporate Governance
Your Company believes in adopting best practices of corporate governance. Corporate governance principles are enshrined in the Spirit of Wipro, which form the core values of Wipro. These guiding principles are also articulated through the Company’s code of business conduct, Corporate Governance Guidelines, charter of various sub-committees and disclosure policy.
As per Regulation 34 of the Listing Regulations, a separate section on corporate governance practices
followed by your Company, together with a certificate from V. Sreedharan & Associates, Practising Company Secretaries, on compliance with corporate governance norms under the Listing Regulations, is provided in page 115 of this Annual Report.
Board of Directors
Board Composition and Independence
Your Company’s Board consists of global leaders and visionaries who provide strategic direction and guidance to the organization. As on March 31, 2019, the Board comprised of three Executive Directors and eight Non-Executive Independent Directors.
Definition of ‘Independence’ of Directors is derived from Regulation 16 of the Listing Regulations, the NYSE Listed Company Manual and Section 149(6) of the Companies Act, 2013. The Company has received necessary declarations under Section 149(7) of the Companies Act, 2013, from the Independent Directors stating that they meet the prescribed criteria for independence. The Board of Directors, after undertaking assessment and on evaluation of the relationships disclosed, considered the following Non-Executive Directors as Independent Directors:
a) Mr. N Vaghul
b) Dr. Ashok S Ganguly
c) Mr. M K Sharma
d) Mrs. Ireena Vittal
e) Mr. William Arthur Owens
f) Dr. Patrick J Ennis
g) Mr. Patrick Dupuis
h) Mrs. Arundhati Bhattacharya
All Independent Directors have affirmed compliance to the code of conduct for independent directors as prescribed in Schedule IV of the Companies Act, 2013.
Number of Meetings of the Board
The Board met five times during the financial year 2018-19 on April 24-25, 2018, June 8, 2018, July 19-20, 2018, October 23-24, 2018 and January 17-18, 2019. The maximum interval between any two meetings did not exceed 120 days.
Directors and Key Managerial Personnel
At the 72nd Annual General Meeting (AGM) held on July 19, 2018, Mrs. Ireena Vittal was re-appointed as an Independent Director for a second term with effect from October 1, 2018 to September 30, 2023.
70 Wipro Limited
Pursuant to the recommendation of Board Governance, Nomination and Compensation Committee, and subject to approval of the Members of the Company, the Board at its meeting held on October 24, 2018, approved appointment of Mrs. Arundhati Bhattacharya as Additional Director, designated as Independent Director of the Company for a term of 5 years from January 1, 2019 to December 31, 2023. Further, the shareholders of the Company approved the aforesaid appointment vide resolution passed by way of postal ballot/e-voting dated June 1, 2019.
Pursuant to the provisions of Section 152 of the Companies Act, 2013 and Articles of Association of the Company, Mr. Abidali Z Neemuchwala will retire by rotation at the 73rd AGM and being eligible, has offered himself for re-appointment.
The Board of Directors of the Company, at their meeting held on June 6, 2019, approved the following, subject to approval of the Members:
1. Appointment of Mr. Azim H Premji as Non-Executive Director for a period of 5 years with effect from July 31, 2019 to July 30, 2024 and conferred him with the title of Founder Chairman of the Company. Mr. Azim H Premji will retire from his current position as Executive Chairman and Managing Director effective July 30, 2019.
2. Re-appointment of Mr. Rishad A Premji as Whole Time Director for a period of 5 years with effect from July 31, 2019 to July 30, 2024 (designated as Executive Chairman by the Board of Directors of the Company).
As and when the amendments to Regulation 17(1B) of the Listing Regulations requiring appointment of Non-Executive Chairman by listed entities come into effect, Mr. Rishad A Premji will cease to perform any executive roles in the Company and continue in the capacity of Non-Executive Director (designated as “Non-Executive Chairman” by the Board of Directors) of the Company, such that the Company remains compliant with the Listing Regulations in force at all times.
3. Designated and appointed Mr. Abidali Z Neemuchwala as Managing Director of the Company with effect from July 31, 2019 till the end of his current term, in addition to his existing position as Chief Executive Officer of the Company.
Committees of the Board
The Company’s Board has the following committees:
1. Audit, Risk and Compliance Committee, which also acts as Risk Management Committee.
2. Board Governance, Nomination and Compensation Committee, which also acts as Corporate Social Responsibility Committee.
3. Strategy Committee.
4. Administrative and Shareholders/Investors Grievance Committee (Stakeholders’ Relationship Committee).
Details of terms of reference of the Committees, Committee membership and attendance of Directors at meetings of the Committees are provided in the Corporate Governance report from pages 122 to 125 of this Annual Report.
Board Evaluation
In line with the Corporate Governance Guidelines of your Company, Annual Performance Evaluation was conducted for all Board Members, for the Board and its Committees. This evaluation was led by the Chairman of the Board Governance, Nomination and Compensation Committee with specific focus on performance and effective functioning of the Board. The Board evaluation framework has been designed in compliance with the requirements under the Companies Act, 2013 and the Listing Regulations, and in accordance with the Guidance Note on Board Evaluation issued by SEBI in January 2017. The Board evaluation was conducted through questionnaire designed with qualitative parameters and feedback based on ratings.
Evaluation of the Board was based on criteria such as composition and role of the Board, Board communication and relationships, functioning of Board Committees, review of performance of Executive Directors, succession planning, strategic planning, etc.
Evaluation of Committees was based on criteria such as adequate independence of each Committee, frequency of meetings and time allocated for discussions at meetings, functioning of Board Committees and effectiveness of its advice/recommendation to the Board, etc.
Evaluation of Directors was based on criteria such as participation and contribution in Board and Committee meetings, representation of shareholder interest and enhancing shareholder value, experience and expertise to provide feedback and guidance to top management on business strategy, governance, risk and understanding of the organization’s strategy, etc.
The outcome of the Board evaluation for financial year 2018-19 was discussed by the Board Governance, Nomination and Compensation Committee and the Board at their meeting held in April 2019. The Board has received highest ratings on Board communication and relationships, functioning of Board Committees and legal

Annual Report 2018-19 71
and financial duties. The Board noted the actions taken in improving Board effectiveness based on feedback given in the previous year. Further, the Board also noted areas requiring more focus in the future, which include spending more time on trends, long-term threats and opportunities.
Policy on Director’s Appointment and Remuneration
The Board Governance, Nomination & Compensation Committee has framed a policy for selection and appointment of Directors including determining qualifications and independence of a Director, Key Managerial Personnel (KMP), senior management personnel and their remuneration as part of its charter and other matters provided under Section 178(3) of the Companies Act, 2013.
Pursuant to Section 134(3) of the Companies Act, 2013, the nomination and remuneration policy of the Company which lays down the criteria for determining qualifications, competencies, positive attributes and independence for appointment of Directors and policies of the Company relating to remuneration of Directors, KMP and other employees is available on the Company’s website at https://www.wipro.com/content/dam/nexus/en/investor/corporate-governance/policies-and-guidelines/ethical-guidelines/wipro-limited-remuneration-policy.pdf. We affirm that the remuneration paid to Directors is in accordance with the remuneration policy of the Company.
Risk Management
Your Company has put in place an Enterprise Risk Management (ERM) framework and adopted an enterprise risk management policy based on globally recognized standards. The ERM framework is administered by the Audit, Risk and Compliance Committee. The objective of the ERM framework is to enable and support achievement of business objectives through risk-intelligent assessment apart from placing significant focus on constantly identifying and mitigating risks within the business. The ERM Framework covers various categories of risks including, inter alia, information security and cyber security risks, effectiveness of the controls that have been implemented to prevent such risks and continuous improvement of the systems and processes to mitigate such risks.
For more details on the Company’s risk management framework, please refer page 27 of this Annual Report.
Compliance Management Framework
The Board has approved a Global Statutory Compliance Policy providing guidance on broad categories of
applicable laws and process for monitoring compliance. In furtherance to this, your Company has instituted an online compliance management system within the organization to monitor compliances and provide update to senior management and Board on a periodic basis. The Audit, Risk and Compliance Committee and the Board periodically monitor status of compliances with applicable laws.
Code for Prevention of Insider Trading
On December 31, 2018, Securities and Exchange Board of India amended the Prohibition of Insider Trading Regulations, 2015, prescribing various new requirements with effect from April 1, 2019. In line with the amendments, your Company has adopted an amended Code of Conduct to regulate, monitor and report trading by Designated Persons and their Immediate Relatives under the Securities and Exchange Board of India (Prohibition of Insider Trading) Regulations, 2015. This Code of Conduct also includes code of practices and procedures for fair disclosure of unpublished price sensitive information which has been made available on the Company’s website at https://www.wipro.com/corporate-governance.
Vigil Mechanism
Your Company has adopted an Ombuds process as a channel for receiving and redressing complaints from employees and Directors, as per the provisions of Section 177(9) and (10) of the Companies Act, 2013 and Regulation 22 of the Listing Regulations. The Ombuds policy of the Company was amended to align with the requirements under Regulation 9A of Securities and Exchange Board of India (Prohibition of Insider Trading) Regulations, 2015.
Under this policy, your Company encourages its employees to report any reporting of fraudulent financial or other information to the stakeholders, and any conduct that results in violation of the Company’s code of business conduct, to the management (on an anonymous basis, if employees so desire). Further, your Company has prohibited discrimination, retaliation or harassment of any kind against any employees who report under the Vigil Mechanism or participates in the investigation.
Awareness of policies is created by sending group mailers highlighting actions taken by the Company against the errant employees. Mechanism followed under Ombuds process has been displayed on the Company’s intranet and website at www.wipro.com.
The Audit, Risk and Compliance Committee periodically reviews the functioning of this mechanism. No personnel of the Company was denied access to the Audit, Risk & Compliance Committee.

72 Wipro Limited
Information Required under Sexual Harassment of Women at Work place (Prevention, Prohibition and Redressal) Act, 2013
Your Company has constituted Internal Complaints Committee as per the Sexual Harassment of Women at Workplace (Prevention, Prohibition and Redressal) Act, 2013 and also has a policy and framework for employees to report sexual harassment cases at workplace and its process ensures complete anonymity and confidentiality of information. Adequate workshops and awareness programmes against sexual harassment are conducted across the organization.
Details of complaints received/disposed during the financial year 2018-19 is provided on page 126 of this Annual Report.
Related Party Transactions
Your Company has historically adopted the practice of undertaking related party transactions only in the ordinary and normal course of business and at arm’s length as part of its philosophy of adhering to highest ethical standards, transparency and accountability. In line with the provisions of the Companies Act, 2013 and the Listing Regulations, the Board has approved a policy on related party transactions. An abridged policy on related party transactions has been placed on the Company’s website https://www.wipro.com/corporate-governance.
All related party transactions are placed on a quarterly basis before the Audit, Risk and Compliance Committee and before the Board for approval. Prior omnibus approval of the Audit, Risk and Compliance Committee and the Board is obtained for the transactions which are foreseeable and of a repetitive nature.
The particulars of contracts or arrangements with related parties referred to in Section 188(1) and applicable rules of the Companies Act, 2013 in Form AOC-2 is provided as Annexure I to this Annual Report.
Pursuant to Regulation 23(9) of the Listing Regulations, your Company has filed half yearly report on Related Party Transactions with the Stock Exchanges, for the year ended March 31, 2019.
Directors’ Responsibility Statement
Your Directors hereby confirm that:
(a) in the preparation of the annual accounts, the applicable accounting standards have been followed along with proper explanation relating to material departures;
(b) the Directors have selected such accounting policies and applied them consistently and made judgments and estimates that are reasonable and prudent so as to give a true and fair view of the state of affairs of the Company at the end of the financial year and of the profit and loss of the Company for that period;
(c) the Directors have taken proper and sufficient care for the maintenance of adequate accounting records in accordance with the provisions of the Companies Act, 2013 for safeguarding the assets of the Company and for preventing and detecting fraud and other irregularities;
(d) the Directors have prepared the annual accounts on a going concern basis;
(e) the Directors have laid down internal financial controls to be followed by the Company and that such internal financial controls are adequate and operating effectively; and
(f) as required under Section 134(5)(f) of the Companies Act, 2013, and according to the information and explanations presented to us, based on the review done by the Audit, Risk and Compliance Committee and as recommended by it, we, the Board, hereby, state that adequate systems and processes, commensurate with the size of the Company and the nature of its business, have been put in place by the Company, to ensure compliance with the provisions of all applicable laws as per the Company’s Global Statutory Compliance Policy and that such systems and processes are operating effectively.
Wipro Employee Stock Option Plans (WESOP)/Restricted Stock Unit Plans
Your Company has instituted various employee stock options plans/restricted stock unit plans from time to time to motivate, incentivize and reward employees. The Board Governance, Nomination and Compensation Committee administers these plans. The stock option plans are in compliance with Securities and Exchange Board of India (Share Based Employee Benefits) Regulations, 2014 (“Employee Benefits Regulations”) and there have been no material changes to these plans during the financial year. Disclosures on various plans, details of options granted, shares allotted upon exercise, etc. as required under the Employee Benefits Regulations read with Securities and Exchange Board of India circular no. CIR/CFD/POLICY CELL/2/2015 dated June 16, 2015 are available on the Company’s website at https://www.wipro.com/investors/annual-reports/. No employee was issued stock options during the year equal to or exceeding 1% of the issued capital of the Company at the time of grant.

Annual Report 2018-19 73
Particulars of Employees
Information required pursuant to Section 197(12) of the Companies Act, 2013 read with Rule 5(1) of the Companies (Appointment and Remuneration of Managerial Personnel) Rules, 2014 is provided as Annexure II to this report.
A statement containing, inter alia, the names of top ten employees in terms of remuneration drawn and every employee employed throughout the financial year and in receipt of remuneration of ` 102 lakhs or more and, employees employed for part of the year and in receipt of remuneration of ` 8.50 lakhs or more per month, pursuant to Rule 5(2) the Companies (Appointment and Remuneration of Managerial Personnel) Rules, 2014 is provided as Annexure III to this report.
IV. Internal Financial Controls and Audit
Internal Financial Controls and their Adequacy
The Board of your Company has laid down internal financial controls to be followed by the Company and that such internal financial controls are adequate and operating effectively. Your Company has adopted policies and procedures for ensuring the orderly and efficient conduct of its business, including adherence to the Company’s policies, the safeguarding of its assets, the prevention and detection of frauds and errors, the accuracy and completeness of the accounting records, and the timely preparation of reliable financial disclosures.
Statutory Auditors
At the 71st AGM held on July 19, 2017, the Members of the Company approved the appointment of Deloitte Haskins & Sells LLP, Chartered Accountants (Registration No. 117366W/W-100018) as statutory auditors of the Company for a term of 5 years from the financial year 2017-18 onwards on such terms and conditions and remuneration as may be decided by the Audit, Risk and Compliance Committee. Accordingly, Deloitte Haskins & Sells LLP will continue as statutory auditors of the Company till the financial year 2021- 22.
Vide notification dated May 7, 2018 issued by Ministry of Corporate Affairs, the requirement of seeking ratification of appointment of statutory auditors by members at each AGM has been done away with. Accordingly, no such item has been considered in notice of the 73rd AGM.
Auditors’ Report
There are no qualifications, reservations or adverse remarks made by Deloitte Haskins & Sells LLP, Statutory Auditors, in their report for the financial year ended March 31, 2019.
Pursuant to provisions of Section 143(12) of the Companies Act, 2013, the Statutory Auditors have not reported any incident of fraud to the Audit, Risk and Compliance Committee during the year under review.
Secretarial Audit
Pursuant to the provisions of Section 204 of the Companies Act, 2013 and the Companies (Appointment and Remuneration of Managerial Personnel) Rules, 2014, the Company has appointed Mr. V Sreedharan, Partner, V Sreedharan & Associates, Practicing Company Secretaries, to conduct Secretarial Audit of the Company. The Report of the Secretarial Audit in Form MR-3 for the financial year ended March 31, 2019 is enclosed as Annexure IV to this report. There are no qualifications, reservations or adverse remarks made by the Secretarial Auditor in his report.
Cost Records and Audit
Maintenance of cost records and requirement of cost audit as prescribed under the provisions of Section 148(1) of the Companies Act, 2013 are not applicable for the business activities carried out by the Company.
V. Social Responsibility and Sustainability
Corporate Social Responsibility
Your Company is at the forefront of Corporate Social Responsibility (CSR) and sustainability initiatives and practices. Your Company believes in making lasting impact towards creating a just, equitable, humane and sustainable society. Your Company has been involved with social initiatives for more than a decade and half and engages in various activities in the field of education, primary healthcare and communities, ecology and environment, etc. Your Company has won several awards and accolades for its CSR and sustainability efforts.
As per the provisions of the Companies Act, 2013, companies having net worth of ` 500 crores or more, or turnover of `1,000 crores or more or net profit of ` 5 crores or more during the immediately preceding financial year are required to constitute a Corporate Social Responsibility (CSR) committee of the board comprising three or more directors, at least one of whom should be an independent director and such company shall spend at least 2% of the average net profits of the company’s three immediately preceding financial years towards CSR activities. Accordingly, your Company spent ̀ 1,853 million towards CSR activities during the financial year 2018-19. The contents of the CSR policy and CSR Report for the year 2018-19 is attached as Annexure V to this report. Contents of the CSR policy are also available on the Company’s website at https://www.wipro.com/corporate-governance.

74 Wipro Limited
The terms of reference of CSR Committee, framed in accordance with Section 135 of the Companies Act, 2013, forms part of Board Governance, Nomination and Compensation Committee. The Committee consists of three independent directors, Dr. Ashok S Ganguly, Mr. N Vaghul and Mr. William Arthur Owens, as its members. Dr. Ashok S Ganguly is the Chairman of the Committee.
Particulars Regarding Conservation of Energy and Research and Development and Technology Absorption
Details of steps taken by your Company to conserve energy through its “Sustainability” initiatives, Research and Development and Technology Absorption have been disclosed as part of the MD&A Report.
VI. Other Disclosures
Foreign Exchange Earnings and Outgoings
During the year 2018-19, your Company’s foreign exchange earnings were ` 444,584 million and foreign exchange outgoings were ` 230,362 million as against ` 391,807 million of foreign exchange earnings and ` 207,831 million of foreign exchange outgoings for the financial year 2017-18.
Extract of Annual Return
Pursuant to Section 92(3) and Section 134(3)(a), extract of the annual return as on March 31, 2019 in form MGT-9 is enclosed as Annexure VI to this report. Additionally, your Company has also placed a copy of annual return for the financial year 2017-18 on its website at https://www.wipro.com/investors/annual-reports/.
Material Changes and Commitments Affecting the Financial Position of the Company
There have been no material changes and commitments, affecting the financial position of the Company which occurred between the end of the financial year to which the financial statements relate and the date of this report.
Details of Significant and Material Orders Passed by the regulators/courts/tribunals Impacting the going concern status and the Company’s operations in future
There are no significant material orders passed by the regulators/courts/tribunals which would impact the going concern status of the Company and its future operations.
Acknowledgements and Appreciation
Your Directors take this opportunity to thank its customers, shareholders, suppliers, bankers, business partners/associates, financial institutions and Central and State Governments for their consistent support and encouragement to your Company. I am sure you will join our Directors in conveying our sincere appreciation to all employees of your Company and its subsidiaries and associates for their hard work and commitment. Their dedication and competence has ensured that your Company continues to be a significant and leading player in the IT Services industry.
For and on behalf of the Board of Directors,
Bengaluru Azim H PremjiJune 6, 2019 Executive Chairman

75Annual Report 2018-19
Ann
exur
e I
Par
ticu
lars
of c
ontr
acts
/arr
ange
men
ts m
ade
wit
h re
late
d pa
rtie
s
Form
No.
AO
C-2
[Pur
suan
t to
cla
use
(h) o
f sub
-sec
tion
(3) o
f Sec
tion
134
of t
he C
ompa
nies
Act
, 201
3 an
d R
ule
8(2)
of t
he
Com
pani
es (A
ccou
nts)
Rul
es, 2
014]
This
For
m p
erta
ins
to t
he d
iscl
osur
e of
par
ticu
lars
of
cont
ract
s/ar
rang
emen
ts e
nter
ed in
to b
y th
e C
omp
any
wit
h re
late
d p
arti
es r
efer
red
to
in s
ub-
sect
ion
(1) o
f S
ecti
on 1
88 o
f th
e C
omp
anie
s A
ct, 2
013
incl
udin
g ce
rtai
n ar
m’s
leng
th t
rans
acti
ons
und
er t
hird
pro
viso
the
reto
.D
etai
ls o
f con
trac
ts o
r arr
ange
men
ts o
r tra
nsac
tion
s no
t at
arm
’s le
ngth
bas
is
Ther
e w
ere
no c
ontr
acts
or
arra
ngem
ents
or
tran
sact
ions
ent
ered
into
dur
ing
the
year
end
ed M
arch
31,
201
9, w
hich
wer
e no
t at
arm
’s le
ngth
bas
is.
Det
ails
of m
ater
ial c
ontr
acts
or a
rran
gem
ents
or t
rans
acti
ons
at a
rm’s
leng
th b
asis
Ther
e w
ere
no m
ater
ial c
ontr
acts
or a
rran
gem
ents
or t
rans
acti
ons
ente
red
into
dur
ing
the
year
end
ed M
arch
31,
201
9 cr
ossi
ng th
e m
ater
ialit
y th
resh
old
of
10%
of
the
annu
al c
onso
lidat
ed t
urno
ver
of t
he C
omp
any.
The
det
ails
of
cont
ract
s or
arr
ange
men
ts o
r tr
ansa
ctio
ns a
t ar
m’s
leng
th b
asis
for
the
ye
ar e
nded
Mar
ch 3
1, 2
019
are
as fo
llow
s:
Nam
e of
Rel
ated
Par
tyN
atur
e of
Rel
atio
nshi
pD
urat
ion
of C
ontr
act
Sal
ient
term
s *
Am
ount
(` M
n)
Sal
es o
f Goo
ds a
nd S
ervi
ces
Wip
ro, L
LCS
ubsi
dia
ry01
-04-
05 -
Ong
oing
As
per
Tra
nsfe
r P
rici
ng g
uid
elin
es 3
5,07
4 W
ipro
Gal
lagh
er S
olut
ions
, LLC
Sub
sid
iary
01-0
4-16
- O
ngoi
ngA
s p
er T
rans
fer
Pri
cing
gui
del
ines
1,4
59
Op
us C
apit
al M
arke
ts C
onsu
ltan
ts -
LLC
Sub
sid
iary
01-0
4-16
- O
ngoi
ngA
s p
er T
rans
fer
Pri
cing
gui
del
ines
20
Wip
ro T
echn
olog
ies
SA
DE
CV
Sub
sid
iary
01-0
1-12
- O
ngoi
ngA
s p
er T
rans
fer
Pri
cing
gui
del
ines
922
W
ipro
Tec
hnol
ogie
s S
AS
ubsi
dia
ry01
-04-
09 -
Ong
oing
As
per
Tra
nsfe
r P
rici
ng g
uid
elin
es 8
W
ipro
Pol
and
Sp
Z.O
.OS
ubsi
dia
ry01
-04-
10 -
Ong
oing
As
per
Tra
nsfe
r P
rici
ng g
uid
elin
es 6
W
ipro
Info
rmat
ion
Tech
nolo
gy N
ethe
rlan
ds
BV.
Sub
sid
iary
01-0
6-08
- O
ngoi
ngA
s p
er T
rans
fer
Pri
cing
gui
del
ines
1,4
58
Wip
ro P
ortu
gal S
.A.
Sub
sid
iary
01-0
4-07
- O
ngoi
ngA
s p
er T
rans
fer
Pri
cing
gui
del
ines
36
Wip
ro d
o B
rasi
l Tec
hnol
ogia
Ltd
aS
ubsi
dia
ry01
-04-
05 -
Ong
oing
As
per
Tra
nsfe
r P
rici
ng g
uid
elin
es 1
57
Wip
ro T
echn
olog
ies
Gm
bH
Sub
sid
iary
01-0
3-11
- O
ngoi
ngA
s p
er T
rans
fer
Pri
cing
gui
del
ines
1,6
73
Wip
ro T
echn
olog
ies
Lim
ited
Sub
sid
iary
01-0
5-08
- O
ngoi
ngA
s p
er T
rans
fer
Pri
cing
gui
del
ines
29
Wip
ro T
echn
olog
y C
hile
SPA
Sub
sid
iary
01-0
1-16
- O
ngoi
ngA
s p
er T
rans
fer
Pri
cing
gui
del
ines
20
Wip
ro O
utso
urci
ng S
ervi
ces
(Ire
land
) Lim
ited
Sub
sid
iary
12-1
1-12
- O
ngoi
ngA
s p
er T
rans
fer
Pri
cing
gui
del
ines
21
Wip
ro In
form
atio
n Te
chno
logy
Kaz
akhs
tan
LLP
Sub
sid
iary
15-0
5-14
- O
ngoi
ngA
s p
er T
rans
fer
Pri
cing
gui
del
ines
83
Wip
ro (T
haila
nd) C
o Li
mit
edS
ubsi
dia
ry01
-11-
10-
Ong
oing
As
per
Tra
nsfe
r P
rici
ng g
uid
elin
es 5
7 P
T. W
T In
don
esia
Sub
sid
iary
01-1
1-12
- O
ngoi
ngA
s p
er T
rans
fer
Pri
cing
gui
del
ines
224
W
ipro
IT S
ervi
ces
Pol
and
SP
Z.O
.OS
ubsi
dia
ry01
-04-
14 -
Ong
oing
As
per
Tra
nsfe
r P
rici
ng g
uid
elin
es 2
62
Wip
ro T
echn
olog
ies
Sou
th A
fric
a (P
rop
riet
ary)
Lim
ited
Sub
sid
iary
01-0
4-12
- O
ngoi
ngA
s p
er T
rans
fer
Pri
cing
gui
del
ines
1,0
89
Wip
ro T
echn
olog
ies
Nig
eria
Lim
ited
Sub
sid
iary
01-0
4-14
- O
ngoi
ngA
s p
er T
rans
fer
Pri
cing
gui
del
ines
70
Wip
ro S
hang
hai L
imit
edS
ubsi
dia
ry27
-04-
04 -
Ong
oing
As
per
Tra
nsfe
r P
rici
ng g
uid
elin
es 0
.09
Wip
ro T
echn
olog
ies
Aus
tral
ia P
ty L
tdS
ubsi
dia
ry01
-08-
12 -
Ong
oing
As
per
Tra
nsfe
r P
rici
ng g
uid
elin
es 7
99
Wip
ro P
rom
ax A
naly
tics
Sol
utio
ns A
mer
icas
, LLC
Sub
sid
iary
01-0
4-16
- O
ngoi
ngA
s p
er T
rans
fer
Pri
cing
gui
del
ines
5
Wip
ro C
heng
du
Lim
ited
Sub
sid
iary
01-0
4-09
- O
ngoi
ngA
s p
er T
rans
fer
Pri
cing
gui
del
ines
160
W
ipro
Net
wor
ks P
te L
imit
edS
ubsi
dia
ry01
-04-
16 -
Ong
oing
As
per
Tra
nsfe
r P
rici
ng g
uid
elin
es 1
,839
W
ipro
Tec
hnol
ogie
s S
DN
BH
DS
ubsi
dia
ry01
-04-
13-
Ong
oing
As
per
Tra
nsfe
r P
rici
ng g
uid
elin
es 1
6 W
ipro
Sol
utio
ns C
anad
a Li
mit
edS
ubsi
dia
ry16
-08-
14 -
Ong
oing
As
per
Tra
nsfe
r P
rici
ng g
uid
elin
es 2
,297
D
esig
nit
Ger
man
y G
mb
HS
ubsi
dia
ry31
-03-
16 -
Ong
oing
As
per
Tra
nsfe
r P
rici
ng g
uid
elin
es 1
1 D
esig
nit
Den
mar
k A
/SS
ubsi
dia
ry01
-03-
16 -
Ong
oing
As
per
Tra
nsfe
r P
rici
ng g
uid
elin
es 6
D
esig
nit
Col
omb
ia S
A S
Sub
sid
iary
01-0
4-18
- O
ngoi
ngA
s p
er T
rans
fer
Pri
cing
gui
del
ines
44
Hea
lthP
lan
Ser
vice
s, In
c.S
ubsi
dia
ry01
-06-
16 -
Ong
oing
As
per
Tra
nsfe
r P
rici
ng g
uid
elin
es 7
24
Cel
lent
Gm
bH
Sub
sid
iary
01-0
4-16
- O
ngoi
ngA
s p
er T
rans
fer
Pri
cing
gui
del
ines
30
Ap
pir
io, I
nc.
Sub
sid
iary
01-0
1-17
- O
ngoi
ngA
s p
er T
rans
fer
Pri
cing
gui
del
ines
1,4
69
Wip
ro H
old
ings
(UK
) Lim
ited
Sub
sid
iary
01-0
4-10
- O
ngoi
ngA
s p
er T
rans
fer
Pri
cing
gui
del
ines
1,5
11
Wip
ro A
rab
ia C
o. L
imit
edS
ubsi
dia
ry23
-12-
06 -
Ong
oing
As
per
Tra
nsfe
r P
rici
ng g
uid
elin
es 5
48

76 Wipro Limited
Nam
e of
Rel
ated
Par
tyN
atur
e of
Rel
atio
nshi
pD
urat
ion
of C
ontr
act
Sal
ient
term
s *
Am
ount
(` M
n)
Wip
ro D
oha
LLC
Sub
sid
iary
01-0
4-14
- O
ngoi
ngA
s p
er T
rans
fer
Pri
cing
gui
del
ines
511
W
ipro
Gul
f LL
CS
ubsi
dia
ry01
-04-
17 -
Ong
oing
As
per
Tra
nsfe
r P
rici
ng g
uid
elin
es 2
42
Wip
ro B
ahra
in L
imit
ed W
LLS
ubsi
dia
ry01
-01-
15 -
Ong
oing
As
per
Tra
nsfe
r P
rici
ng g
uid
elin
es 1
02
Wip
ro IT
Ser
vice
s B
angl
ades
h Li
mit
edS
ubsi
dia
ry31
-03-
18-
Ong
oing
As
per
Tra
nsfe
r P
rici
ng g
uid
elin
es 9
11
Wip
ro E
nter
pri
ses
Pri
vate
Lim
ited
Ent
ity
cont
rolle
d b
y P
rom
oter
s01
-04-
14 -
Ong
oing
As
per
RP
T P
olic
y gu
idel
ines
41
AB
P P
riva
te L
imit
edC
omm
on D
irec
tors
Ong
oing
As
per
RP
T P
olic
y gu
idel
ines
0.0
3 A
pol
lo H
osp
ital
s E
nter
pri
se L
imit
edC
omm
on D
irec
tors
Ong
oing
As
per
RP
T P
olic
y gu
idel
ines
0.2
9 A
sian
Pai
nts
Lim
ited
Com
mon
Dir
ecto
rsO
ngoi
ngA
s p
er R
PT
Pol
icy
guid
elin
es 2
0 In
dia
n S
choo
l of
Bus
ines
sC
omm
on D
irec
tors
Ong
oing
As
per
RP
T P
olic
y gu
idel
ines
11
Pir
amal
Ent
erp
rise
s Li
mit
edC
omm
on D
irec
tors
Ong
oing
As
per
RP
T P
olic
y gu
idel
ines
21
The
Ind
ian
Hot
els
Com
pan
y Li
mit
edC
omm
on D
irec
tors
Ong
oing
As
per
RP
T P
olic
y gu
idel
ines
1
Tita
n C
omp
any
Lim
ited
Com
mon
Dir
ecto
rsO
ngoi
ngA
s p
er R
PT
Pol
icy
guid
elin
es 6
W
ipro
GE
Hea
lthc
are
Pri
vate
Lim
ited
Join
t ve
ntur
e w
ith
Wip
ro
Ent
erp
rise
s P
riva
te L
imit
ed
and
Gen
eral
Ele
ctri
c
Ong
oing
As
per
RP
T P
olic
y gu
idel
ines
59
Pur
chas
e of
Ser
vice
sW
ipro
, LLC
Sub
sid
iary
01-0
4-05
- O
ngoi
ngA
s p
er T
rans
fer
Pri
cing
gui
del
ines
1,8
32
Info
cros
sing
, LLC
Sub
sid
iary
01-0
4-08
- O
ngoi
ngA
s p
er T
rans
fer
Pri
cing
gui
del
ines
13
Op
us C
apit
al M
arke
ts C
onsu
ltan
ts, L
LCS
ubsi
dia
ry01
-04-
16 -
Ong
oing
As
per
Tra
nsfe
r P
rici
ng g
uid
elin
es 2
W
ipro
Tec
hnol
ogie
s S
A D
E C
VS
ubsi
dia
ry01
-01-
12 -
Ong
oing
As
per
Tra
nsfe
r P
rici
ng g
uid
elin
es 1
,680
W
ipro
Phi
lipp
ines
, Inc
. S
ubsi
dia
ry31
-03-
11 -
Ong
oing
As
per
Tra
nsfe
r P
rici
ng g
uid
elin
es 2
,338
W
ipro
Tec
hnol
ogie
s S
AS
ubsi
dia
ry01
-04-
09 -
Ong
oing
As
per
Tra
nsfe
r P
rici
ng g
uid
elin
es 5
3 W
ipro
Pol
and
SP
Z.O
.OS
ubsi
dia
ry01
-04-
10 -
Ong
oing
As
per
Tra
nsfe
r P
rici
ng g
uid
elin
es 2
10
Wip
ro P
ortu
gal S
.A.
Sub
sid
iary
01-0
4-07
- O
ngoi
ngA
s p
er T
rans
fer
Pri
cing
gui
del
ines
934
W
ipro
do
Bra
sil T
echn
olog
ia L
tda
Sub
sid
iary
01-0
4-05
- O
ngoi
ngA
s p
er T
rans
fer
Pri
cing
gui
del
ines
2,3
74
Wip
ro T
echn
olog
ies
Gm
bH
Sub
sid
iary
01-0
3-11
- O
ngoi
ngA
s p
er T
rans
fer
Pri
cing
gui
del
ines
1,2
75
Wip
ro T
echn
olog
ies
Lim
ited
Sub
sid
iary
01-0
5-08
- O
ngoi
ngA
s p
er T
rans
fer
Pri
cing
gui
del
ines
20
Wip
ro T
echn
olog
y C
hile
SPA
Sub
sid
iary
01-0
1-16
- O
ngoi
ngA
s p
er T
rans
fer
Pri
cing
gui
del
ines
89
Wip
ro O
utso
urci
ng S
ervi
ces
(Ire
land
) Lim
ited
Sub
sid
iary
12-1
1-12
- O
ngoi
ngA
s p
er T
rans
fer
Pri
cing
gui
del
ines
164
W
ipro
Tec
hnol
ogie
s S
RL
Sub
sid
iary
01-0
1-10
- O
ngoi
ngA
s p
er T
rans
fer
Pri
cing
gui
del
ines
2,3
14
Wip
ro (T
haila
nd) C
o. L
imit
edS
ubsi
dia
ry01
-11-
10-
Ong
oing
As
per
Tra
nsfe
r P
rici
ng g
uid
elin
es 1
8 P
T. W
T In
don
esia
Sub
sid
iary
01-1
1-12
- O
ngoi
ngA
s p
er T
rans
fer
Pri
cing
gui
del
ines
37
Wip
ro IT
Ser
vice
s P
olan
d S
P Z
.O.O
Sub
sid
iary
01-0
4-14
- O
ngoi
ngA
s p
er T
rans
fer
Pri
cing
gui
del
ines
901
W
ipro
Tec
hnol
ogie
s S
outh
Afr
ica
(Pro
pri
etar
y) L
imit
edS
ubsi
dia
ry01
-04-
12 -
Ong
oing
As
per
Tra
nsfe
r P
rici
ng g
uid
elin
es 9
3 W
ipro
Tec
hnol
ogie
s N
iger
ia L
imit
edS
ubsi
dia
ry01
-04-
14 -
Ong
oing
As
per
Tra
nsfe
r P
rici
ng g
uid
elin
es 3
W
ipro
Jap
an K
KS
ubsi
dia
ry01
-04-
12-
Ong
oing
As
per
Tra
nsfe
r P
rici
ng g
uid
elin
es 0
.04
Wip
ro S
hang
hai L
imit
edS
ubsi
dia
ry27
-04-
04 -
Ong
oing
As
per
Tra
nsfe
r P
rici
ng g
uid
elin
es 8
8 W
ipro
Tec
hnol
ogie
s A
ustr
alia
Pty
Ltd
Sub
sid
iary
01-0
8-12
- O
ngoi
ngA
s p
er T
rans
fer
Pri
cing
gui
del
ines
153
W
ipro
Pro
max
Ana
lyti
cs S
olut
ions
Am
eric
as L
LCS
ubsi
dia
ry01
-04-
16 -
Ong
oing
As
per
Tra
nsfe
r P
rici
ng g
uid
elin
es 2
W
ipro
Che
ngd
u Li
mit
edS
ubsi
dia
ry01
-04-
09 -
Ong
oing
As
per
Tra
nsfe
r P
rici
ng g
uid
elin
es 3
94
Wip
ro N
etw
orks
Pte
Lim
ited
Sub
sid
iary
01-0
4-16
- O
ngoi
ngA
s p
er T
rans
fer
Pri
cing
gui
del
ines
381
W
ipro
Tec
hnol
ogie
s P
eru
SA
CS
ubsi
dia
ry01
-01-
16 -
Ong
oing
As
per
Tra
nsfe
r P
rici
ng g
uid
elin
es 1
6 W
ipro
Sol
utio
ns C
anad
a Li
mit
edS
ubsi
dia
ry16
-08-
14 -
Ong
oing
As
per
Tra
nsfe
r P
rici
ng g
uid
elin
es 8
1 W
ipro
Tec
hnol
ogie
s A
ustr
alia
Pty
Ltd
Sub
sid
iary
01-0
8-12
- O
ngoi
ngA
s p
er T
rans
fer
Pri
cing
gui
del
ines
12
Wip
ro T
echn
olog
ies
W.T
. Soc
ied
ad A
noni
ma
Sub
sid
iary
01-0
1-18
-O
ngoi
ngA
s p
er T
rans
fer
Pri
cing
gui
del
ines
2
Des
igni
t A
/SS
ubsi
dia
ry01
-04-
16 -
Ong
oing
As
per
Tra
nsfe
r P
rici
ng g
uid
elin
es 1
07
Des
igni
t D
enm
ark
A/S
Sub
sid
iary
01-0
3-16
- O
ngoi
ngA
s p
er T
rans
fer
Pri
cing
gui
del
ines
315
D
esig
nit
Ger
man
y G
mb
HS
ubsi
dia
ry31
-03-
16 -
Ong
oing
As
per
Tra
nsfe
r P
rici
ng g
uid
elin
es 2
D
esig
nit
Toky
o Li
mit
edS
ubsi
dia
ry01
-04-
16 -
Ong
oing
As
per
Tra
nsfe
r P
rici
ng g
uid
elin
es 2
1 D
esig
nit
Osl
o A
/SS
ubsi
dia
ry01
-04-
16 -
Ong
oing
As
per
Tra
nsfe
r P
rici
ng g
uid
elin
es 2
D
esig
nit
Sp
ain
Dig
ital
S L
Sub
sid
iary
01-0
4-16
- O
ngoi
ngA
s p
er T
rans
fer
Pri
cing
gui
del
ines
18
Des
igni
t S
wed
en A
BS
ubsi
dia
ry01
-04-
16 -
Ong
oing
As
per
Tra
nsfe
r P
rici
ng g
uid
elin
es 1
07
Des
igni
t T.
L.V
Lim
ited
Sub
sid
iary
01-0
4-16
- O
ngoi
ngA
s p
er T
rans
fer
Pri
cing
gui
del
ines
2
Wip
ro (D
alia
n) L
imit
edS
ubsi
dia
ry30
-12-
15 -
Ong
oing
As
per
Tra
nsfe
r P
rici
ng g
uid
elin
es 5
43

77Annual Report 2018-19
Nam
e of
Rel
ated
Par
tyN
atur
e of
Rel
atio
nshi
pD
urat
ion
of C
ontr
act
Sal
ient
term
s *
Am
ount
(` M
n)
Hea
lthP
lan
Ser
vice
s, In
c.S
ubsi
dia
ry01
-06-
16 -
Ong
oing
As
per
Tra
nsfe
r P
rici
ng g
uid
elin
es 3
03
Cel
lent
Gm
bH
Sub
sid
iary
01-0
4-16
- O
ngoi
ngA
s p
er T
rans
fer
Pri
cing
gui
del
ines
359
C
elle
nt G
mb
HS
ubsi
dia
ry01
-04-
16 -
Ong
oing
As
per
Tra
nsfe
r P
rici
ng g
uid
elin
es 5
A
pp
irio
, Inc
.S
ubsi
dia
ry01
-01-
17-
Ong
oing
As
per
Tra
nsfe
r P
rici
ng g
uid
elin
es 2
,390
A
pp
irio
Ltd
(Ire
land
)S
ubsi
dia
ry01
-01-
18-
Ong
oing
As
per
Tra
nsfe
r P
rici
ng g
uid
elin
es 2
7 A
pp
rio
Ltd
(UK
) S
ubsi
dia
ry01
-01-
17-
Ong
oing
As
per
Tra
nsfe
r P
rici
ng g
uid
elin
es 3
02
Coo
per
Sof
twar
e, L
LC.
Sub
sid
iary
23-1
0-17
- O
ngoi
ngA
s p
er T
rans
fer
Pri
cing
gui
del
ines
298
W
ipro
HR
Ser
vice
s In
dia
Pri
vate
Lim
ited
(f
orm
ally
kno
wn
as A
light
HR
Ser
vice
s In
dia
Pri
vate
Li
mit
ed)
Sub
sid
iary
19-0
2-19
- O
ngoi
ngA
s p
er T
rans
fer
Pri
cing
gui
del
ines
2
Fron
twor
x In
form
atio
nste
chno
logi
e G
mb
HS
ubsi
dia
ry01
-04-
18 -
Ong
oing
As
per
Tra
nsfe
r P
rici
ng g
uid
elin
es 6
1 D
enim
Gro
up L
imit
edA
ssoc
iate
01-0
3-18
- O
ngoi
ngA
s p
er R
PT
Pol
icy
guid
elin
es 5
5 D
rive
stre
am, I
ncA
ssoc
iate
12-0
6-17
- O
ngoi
ngA
s p
er R
PT
Pol
icy
guid
elin
es 1
34
Wip
ro E
nter
pri
ses
Pri
vate
Lim
ited
Ent
ity
cont
rolle
d b
y P
rom
oter
s01
-04-
14 -
Ong
oing
As
per
RP
T P
olic
y gu
idel
ines
240
A
tria
Con
verg
ence
Tec
hnol
ogie
s Li
mit
edC
omm
on D
irec
tors
Ong
oing
As
per
RP
T P
olic
y gu
idel
ines
0.0
3 C
onfe
der
atio
n of
Ind
ian
Ind
ustr
yC
omm
on D
irec
tors
Ong
oing
As
per
RP
T P
olic
y gu
idel
ines
1
Ind
ian
Sch
ool O
f B
usin
ess
Com
mon
Dir
ecto
rsO
ngoi
ngA
s p
er R
PT
Pol
icy
guid
elin
es 1
M
ahin
dra
Wor
ld C
ity
Dev
elop
ers
Lim
ited
Com
mon
Dir
ecto
rsO
ngoi
ngA
s p
er R
PT
Pol
icy
guid
elin
es 8
C
omm
issi
on P
aid
Wip
ro T
echn
olog
ies
Gm
bH
Sub
sid
iary
01-0
3-11
- O
ngoi
ngA
s p
er T
rans
fer
Pri
cing
gui
del
ines
876
W
ipro
Tra
vel S
ervi
ces
Lim
ited
Sub
sid
iary
01-0
2-03
- O
ngoi
ngA
s p
er T
rans
fer
Pri
cing
gui
del
ines
54
Wip
ro J
apan
KK
Sub
sid
iary
26-0
3-01
-Ong
oing
As
per
Tra
nsfe
r P
rici
ng g
uid
elin
es 2
03
Wip
ro T
echn
olog
ies
Aus
tral
ia P
ty L
tdS
ubsi
dia
ryO
ngoi
ngA
s p
er T
rans
fer
Pri
cing
gui
del
ines
1
Ren
t P
aid
Has
ham
Tra
der
sE
ntit
y co
ntro
lled
by
Pro
mot
ers
Ong
oing
As
per
Agr
eem
ent
8
Yasm
een
H P
rem
ji R
elat
ive
of D
irec
tor
Ong
oing
As
per
Agr
eem
ent
5
Wip
ro H
old
ings
(UK
) Lim
ited
Sub
sid
iary
Ong
oing
As
per
Agr
eem
ent
34
Wip
ro L
LCS
ubsi
dia
ryO
ngoi
ngA
s p
er A
gree
men
t 5
9 D
esig
nit
Sp
ain
Dig
ital
S L
Sub
sid
iary
Ong
oing
As
per
Agr
eem
ent
0.2
6 W
ipro
Jap
an K
KS
ubsi
dia
ryO
ngoi
ngA
s p
er A
gree
men
t 1
4 W
ipro
Ent
erp
rise
s P
riva
te L
imit
edE
ntit
y co
ntro
lled
by
Pro
mot
ers
Ong
oing
As
per
Agr
eem
ent
2
Cor
pora
te G
uara
ntee
Com
mis
sion
Wip
ro L
LCS
ubsi
dia
ry01
-04-
14-
Ong
oing
As
per
Tra
nsfe
r P
rici
ng g
uid
elin
es 6
9 W
ipro
Tec
hnol
ogie
s G
mb
HS
ubsi
dia
ry16
-06-
17-
Ong
oing
As
per
Tra
nsfe
r P
rici
ng g
uid
elin
es 8
W
ipro
Tec
hnol
ogie
s S
RL
Sub
sid
iary
01-0
4-14
- O
pen
ing
As
per
Tra
nsfe
r P
rici
ng g
uid
elin
es 1
W
ipro
IT S
ervi
ces
Pol
and
SP
Z.O
.O.
Sub
sid
iary
01-1
2-15
- O
ngoi
ngA
s p
er T
rans
fer
Pri
cing
gui
del
ines
0.4
7 W
ipro
Tec
hnol
ogie
s S
outh
Afr
ica
(Pro
pri
etar
y) L
imit
edS
ubsi
dia
ry01
-01-
15-
Ong
oing
As
per
Tra
nsfe
r P
rici
ng g
uid
elin
es 5
W
ipro
Sol
utio
ns C
anad
a Li
mit
edS
ubsi
dia
ry01
-09-
15-
Ong
oing
As
per
Tra
nsfe
r P
rici
ng g
uid
elin
es 4
5 W
ipro
Tec
hnol
ogie
s A
ustr
alia
Pty
Ltd
Sub
sid
iary
01-0
8-12
- O
ngoi
ngA
s p
er T
rans
fer
Pri
cing
gui
del
ines
6
Wip
ro H
old
ings
(UK
) Lim
ited
Sub
sid
iary
20-0
6-17
- O
ngoi
ngA
s p
er T
rans
fer
Pri
cing
gui
del
ines
1
Wip
ro A
rab
ia C
o. L
imit
edS
ubsi
dia
ry01
-04-
14-
Ong
oing
As
per
Tra
nsfe
r P
rici
ng g
uid
elin
es 1
8 W
ipro
Gul
f LL
CS
ubsi
dia
ry01
-04-
14-
Ong
oing
As
per
Tra
nsfe
r P
rici
ng g
uid
elin
es 4
9 R
enta
l Inc
ome
Wip
ro In
sura
nce
Sol
utio
ns L
LCS
ubsi
dia
ry01
-03-
17-
Ong
oing
As
per
Agr
eem
ent
4
Wip
ro G
alla
gher
Sol
utio
ns, L
LC.
Sub
sid
iary
01-0
1-16
- O
ngoi
ngA
s p
er A
gree
men
t 2
W
ipro
Tra
vel S
ervi
ces
Lim
ited
Sub
sid
iary
21-1
2-15
- O
ngoi
ngA
s p
er A
gree
men
t 3
D
esig
nit
Den
mar
k A
/SS
ubsi
dia
ry01
-03-
16 -
Ong
oing
As
per
Agr
eem
ent
33
Wip
ro L
LCS
ubsi
dia
ryO
ngoi
ngA
s p
er A
gree
men
t 1
39
Wip
ro E
nter
pri
ses
Pri
vate
Lim
ited
Ent
ity
cont
rolle
d b
y P
rom
oter
s01
-04-
14 -
Ong
oing
As
per
Agr
eem
ent
42
Azi
m P
rem
ji Fo
und
atio
nE
ntit
y co
ntro
lled
by
Pro
mot
ers
Ong
oing
As
per
Agr
eem
ent
0.3
9 M
anag
emen
t S
ervi
ce F
ees
Azi
m P
rem
ji Fo
und
atio
nE
ntit
y co
ntro
lled
by
Pro
mot
ers
Ong
oing
Man
agem
ent
Ser
vice
fee
s 2
W
ipro
Ent
erp
rise
s P
riva
te L
imit
edE
ntit
y co
ntro
lled
by
Pro
mot
ers
01-0
4-14
- O
ngoi
ngM
anag
emen
t S
ervi
ce f
ees
57

78 Wipro Limited
Nam
e of
Rel
ated
Par
tyN
atur
e of
Rel
atio
nshi
pD
urat
ion
of C
ontr
act
Sal
ient
term
s *
Am
ount
(` M
n)
Res
tric
ted
Sto
ck U
nit
(RS
U) C
ompe
nsat
ion
Cos
t A
lloca
tion
Wip
ro E
nter
pri
ses
Pri
vate
Lim
ited
Ent
ity
cont
rolle
d b
y P
rom
oter
s01
-04-
14 -
Ong
oing
As
per
Allo
cati
on 1
C
elle
nt G
mb
HS
ubsi
dia
ryO
ngoi
ngA
s p
er A
lloca
tion
0.2
8 W
ipro
Ara
bia
Co.
Lim
ited
Sub
sid
iary
Ong
oing
As
per
Allo
cati
on 5
W
ipro
Bah
rain
Lim
ited
WLL
Sub
sid
iary
Ong
oing
As
per
Allo
cati
on 0
.14
Wip
ro G
ulf,
LLC
Sub
sid
iary
Ong
oing
As
per
Allo
cati
on 0
.23
Wip
ro J
apan
KK
Sub
sid
iary
Ong
oing
As
per
Allo
cati
on 2
W
ipro
Info
rmat
ion
Tech
nolo
gy A
ustr
ia G
mb
HS
ubsi
dia
ryO
ngoi
ngA
s p
er A
lloca
tion
0.2
7 W
ipro
Por
tuga
l S.A
.S
ubsi
dia
ryO
ngoi
ngA
s p
er A
lloca
tion
0.3
6 W
ipro
do
Bra
sil T
echn
olog
ia L
tda
Sub
sid
iary
Ong
oing
As
per
Allo
cati
on 1
W
ipro
Tec
hnol
ogie
s G
mb
HS
ubsi
dia
ryO
ngoi
ngA
s p
er A
lloca
tion
13
Info
cros
sing
, LLC
Sub
sid
iary
Ong
oing
As
per
Allo
cati
on 0
.19
Wip
ro G
alla
gher
Sol
utio
ns, L
LC.
Sub
sid
iary
Ong
oing
As
per
Allo
cati
on 1
W
ipro
(Tha
iland
) Co
Lim
ited
Sub
sid
iary
Ong
oing
As
per
Allo
cati
on 0
.05
Wip
ro T
echn
olog
ies
Sou
th A
fric
a (P
rop
riet
ary)
Lim
ited
Sub
sid
iary
Ong
oing
As
per
Allo
cati
on 0
.21
Des
igni
t O
slo
A/S
Sub
sid
iary
Ong
oing
As
per
Allo
cati
on 1
D
esig
nit
Sp
ain
Dig
ital
S L
Sub
sid
iary
Ong
oing
As
per
Allo
cati
on 1
W
ipro
, LLC
Sub
sid
iary
Ong
oing
As
per
Allo
cati
on 1
1 W
ipro
do
Bra
sil S
ervi
cos
de
Tecn
olog
ia S
.A.
Sub
sid
iary
Ong
oing
As
per
Allo
cati
on 1
H
ealt
hPla
n S
ervi
ces,
Inc.
Sub
sid
iary
Ong
oing
As
per
Allo
cati
on 0
.18
Oth
er C
osts
Wip
ro E
nter
pri
ses
Pri
vate
Lim
ited
Ent
ity
cont
rolle
d b
y P
rom
oter
s01
-04-
14 -
Ong
oing
On
Act
ual C
ost
Bas
is 6
4 A
zim
Pre
mji
Foun
dat
ion
Ent
ity
cont
rolle
d b
y P
rom
oter
sO
ngoi
ngO
n A
ctua
l Cos
t B
asis
3
AB
P P
riva
te L
imit
edC
omm
on D
irec
tors
Ong
oing
On
Act
ual C
ost
Bas
is 0
.04
Ap
ollo
Hos
pit
als
Ent
erp
rise
Lim
ited
Com
mon
Dir
ecto
rsO
ngoi
ngO
n A
ctua
l Cos
t B
asis
0.0
1 A
sian
Pai
nts
Lim
ited
Com
mon
Dir
ecto
rsO
ngoi
ngO
n A
ctua
l Cos
t B
asis
2
Atr
ia C
onve
rgen
ce T
echn
olog
ies
Lim
ited
Com
mon
Dir
ecto
rsO
ngoi
ngO
n A
ctua
l Cos
t B
asis
0.0
1 C
ipla
Lim
ited
Com
mon
Dir
ecto
rsO
ngoi
ngO
n A
ctua
l Cos
t B
asis
6
Con
fed
erat
ion
of In
dia
n In
dus
try
Com
mon
Dir
ecto
rsO
ngoi
ngO
n A
ctua
l Cos
t B
asis
0.2
1 In
dia
n S
choo
l of
Bus
ines
sC
omm
on D
irec
tors
Ong
oing
On
Act
ual C
ost
Bas
is 1
M
ahin
dra
Wor
ld C
ity
Dev
elop
ers
Lim
ited
Com
mon
Dir
ecto
rsO
ngoi
ngO
n A
ctua
l Cos
t B
asis
4
Pir
amal
Ent
erp
rise
s Li
mit
edC
omm
on D
irec
tors
Ong
oing
On
Act
ual C
ost
Bas
is 1
Th
e In
dia
n H
otel
s C
omp
any
Lim
ited
Com
mon
Dir
ecto
rsO
ngoi
ngO
n A
ctua
l Cos
t B
asis
0.0
1 Ti
tan
Com
pan
y Li
mit
edC
omm
on D
irec
tors
Ong
oing
On
Act
ual C
ost
Bas
is 1
U
nite
d S
pir
its
Lim
ited
Com
mon
Dir
ecto
rsO
ngoi
ngO
n A
ctua
l Cos
t B
asis
0.0
1 W
ipro
GE
Hea
lthc
are
Pri
vate
Lim
ited
Join
t ve
ntur
e w
ith
Wip
ro
Ent
erp
rise
s P
riva
te L
imit
ed
and
Gen
eral
Ele
ctri
c
Ong
oing
On
Act
ual C
ost
Bas
is 3
Wip
ro C
ypru
s S
E (F
orm
erly
kno
wn
as
Wip
ro C
ypru
s P
ublic
Lim
ited
)S
ubsi
dia
ryO
ngoi
ngO
n A
ctua
l Cos
t B
asis
0.1
4
Wip
ro H
old
ings
Hun
gary
Kor
láto
lt F
elel
őssé
gű T
ársa
ság
Sub
sid
iary
Ong
oing
On
Act
ual C
ost
Bas
is 6
* A
pp
rop
riat
e ap
pro
vals
hav
e b
een
take
n fr
om t
he A
udit
Com
mit
tee
and
Boa
rd o
f D
irec
tors
of
the
Com
pan
y fr
om t
ime
to t
ime
for
the
rela
ted
par
ty t
rans
acti
ons
as m
enti
oned
ab
ove.
Azi
m H
Pre
mji
N V
aghu
l M
San
aulla
Kha
nE
xecu
tive
Cha
irm
an &
Man
agin
g D
irec
tor
Dir
ecto
r C
ompa
ny S
ecre
tary
Abi
dali
Z N
eem
uchw
ala
Jati
n P
ravi
ncha
ndra
Dal
alC
hief
Exe
cuti
ve O
ffice
r C
hief
Fin
anci
al O
ffice
r&
Exe
cuti
ve D
irec
tor
Ben
galu
ru
June
6, 2
019

79Annual Report 2018-19
Annexure IIStatement of Disclosure of Remuneration under Section 197 of Companies Act, 2013 and Rule 5(1) of Companies Appointment and Remuneration of Managerial Personnel) Rules, 2014.
Remuneration paid to Whole Time Directors
Name of Directors Designation % Increase/Decrease of remuneration in 2019 as
compared to 2018*
Ratio of remuneration
to MRE*
Ratio of remuneration to MRE and WTD*
Azim H Premji Executive Chairman and Managing Director
106.85 30.17 30.17
Abidali Z Neemuchwala
Chief Executive Officer and Executive Director
49.84 455.33 455.33
Rishad A Premji Executive Director and Chief Strategy Officer
15.98 113.83 113.83
Remuneration paid to Other Directors
Name of Directors Designation % Increase/Decrease of remuneration in 2019 as
compared to 2018*
Ratio of remuneration
to MRE*
Ratio of remuneration to MRE and WTD *
N Vaghul Independent Director 14.44 15.17 15.17Dr. Ashok S Ganguly Independent Director 9.27 11.83 11.83M K Sharma Independent Director 12.87 12.17 12.17Ireena Vittal Independent Director 16.59 12.17 12.17William A Owens Independent Director 11.28 38.83 38.83Dr. Patrick J Ennis Independent Director 11.22 30.67 30.67Patrick A Dupuis Independent Director 11.22 30.67 30.67Arundhati Bhattacharya**
Independent Director - - -
MRE–Median Remuneration of employees, WTD – Whole Time Director
* Rounded-off to two decimals
**Comparable figure not provided for Mrs. Arundhati Bhattacharya as she was appointed w.e.f. January 1, 2019.
Remuneration paid to other Key Managerial Personnel (KMP)
Name of KMPs Designation % Increase/Decrease of remuneration in 2019 as compared to 2018*
Ratio of remuneration to
MRE *
Ratio of remuneration to MRE and WTD *
Jatin Pravinchandra Dalal
Chief Financial Officer
30.93 101.50 101.50
M Sanaulla Khan Company Secretary 36.32 27.33 27.33
MRE- Median Remuneration of Employees, WTD- Whole Time Director
*Rounded-off to two decimals

80 Wipro Limited
1. The median Remuneration of employees (MRE) excluding Whole Time Directors was ` 6,00,000 and ` 5,40,000 in fiscal 2019 and fiscal 2018 respectively. The increase in MRE excluding the Whole Time Director in fiscal 2019 as compared to fiscal 2018 is 11.11%.
2. The median Remuneration of employees (MRE) including Whole Time Directors was ̀ 6,00,000 and ̀ 5,40,000 in fiscal 2019 and fiscal 2018 respectively. The increase in MRE including the Whole Time Director in fiscal 2019 as compared to fiscal 2018 is 11.11%
3. The number of employees on the rolls of the Company as of March 31, 2019 and March 31, 2018, at a consolidated level was 171,425 and 159,923 respectively. The comparable number for the previous year has been re-casted.
4. The aggregate remuneration of employees excluding WTD grew by 3.1% over the previous fiscal. The aggregate increase in salary for WTDs and other KMPs was 41.6% in fiscal 2019 over fiscal 2018, on account of the following:
a. Computation of remuneration to Chief Executive Officer and Executive Director, and Chief Financial Officer is on an accrual basis and it includes the amortization of Restricted Stock Units (RSU) granted to them, which will vest over a period of time. This also includes RSUs that will vest based on performance parameters of the Company.
b. Computation of remuneration of Executive Director and Chief Strategy Officer includes cash bonus (part of his variable pay) on an accrual basis, which is payable over a period of time.
c. Computation of remuneration of Company Secretary includes perquisites value of Restricted Stock Units exercised during the financial year and does not include grant of such options.
5. The Company affirms that the remuneration is paid as per the remuneration policy of the Company.
Variable Pay Compensation
The variable pay of top executives including the Chief Executive Officer and Executive Directors is based on clearly laid out criteria and measures, which are linked to the desired performance and business objectives of the organization. The criteria for variable pay, which is paid out annually, includes both financial and non-financial parameters like revenue, profit achievement, customer satisfaction and other strategic goals as decided by the Board from time to time.
Apart from the variable pay component, long term (typically greater than one year) incentives granted to the Chief Executive Officer and Executive Director includes both time-based and performance-based stock units (PSUs). The vesting of PSUs is based on performance parameters of the Company over a two-year period and is linked to pre-defined financial goals. Time-based stock units typically vest over a four-year period. The vesting pattern and schedule for both these types of stock units are as determined by the Board Governance, Nomination and Compensation Committee.

81Annual Report 2018-19
Ann
exur
e III
Info
rmat
ion
as p
er R
ule
5(2)
of
the
Com
pan
ies
(Ap
poi
ntm
ent
and
Rem
uner
atio
n of
Man
ager
ial P
erso
nnel
) Rul
es, 2
014.
A)
Top
10
empl
oyee
s in
term
s of
sal
ary
draw
n du
ring
the
yea
r
Not
es:
1.
R
emu
ner
atio
n c
omp
rise
s sa
lary
, al
low
ance
s, c
omm
issi
on,
per
form
ance
bas
ed p
aym
ents
, p
erq
uis
ite
and
Com
pan
y’s
con
trib
uti
on t
o P
rovi
den
t F
un
d a
nd
su
per
-ann
uati
on a
s p
er t
he d
efini
tion
con
tain
ed in
Sec
tion
2(7
8) o
f th
e C
omp
anie
s A
ct, 2
013
pai
d d
urin
g th
e ye
ar.
It a
lso
incl
udes
per
qui
site
s va
lue
of R
estr
icte
d
Sto
ck U
nits
(RS
Us)
exe
rcis
ed, i
f an
y, b
y em
plo
yees
.2.
Th
e na
ture
of
emp
loym
ent
is c
ontr
actu
al in
all
the
abov
e ca
ses.
3.
Non
e of
the
em
plo
yees
em
plo
yed
thr
ough
out
the
fina
ncia
l yea
r or
par
t th
ereo
f, w
ere
in r
ecei
pt
of r
emun
erat
ion
in t
hat
year
, whi
ch in
the
agg
rega
te, o
r as
the
cas
e m
ay b
e at
a ra
te w
hich
, in
the
aggr
egat
e, is
in e
xces
s of
tha
t d
raw
n by
the
Man
agin
g D
irec
tor
or W
hole
Tim
e D
irec
tor
or M
anag
er a
nd h
old
s by
him
self
or
alon
g w
ith
his
spou
se a
nd d
epen
den
t ch
ildre
n, n
ot le
ss t
han
two
per
cent
of
the
equi
ty s
hare
s of
the
Com
pan
y.4.
In
term
s of
pro
viso
to R
ule
5 of
the
Com
pan
ies
(Ap
poi
ntm
ent a
nd R
emun
erat
ion
of M
anag
eria
l Per
sonn
el) R
ules
, 201
4, p
arti
cula
rs o
f em
plo
yees
pos
ted
and
wor
king
in
a c
ount
ry o
utsi
de
Ind
ia, n
ot b
eing
Dir
ecto
rs o
r th
eir
rela
tive
s, h
ave
not
bee
n in
clud
ed in
the
ab
ove
stat
emen
t.5.
M
r. R
isha
d A
Pre
mji,
who
is in
the
em
plo
ymen
t of
the
Com
pan
y is
the
son
of M
r. A
zim
H P
rem
ji, E
xecu
tive
Cha
irm
an o
f the
Com
pan
y. C
omp
utat
ion
of re
mun
erat
ion
of E
xecu
tive
Dir
ecto
r an
d C
hief
Str
ateg
y O
ffice
r in
clud
es c
ash
bon
us (p
art
of h
is v
aria
ble
pay
) on
an a
ccru
al b
asis
, whi
ch is
pay
able
ove
r a
per
iod
of
tim
e.*
Com
put
atio
n of
rem
uner
atio
n to
Chi
ef E
xecu
tive
Offi
cer
and
Exe
cuti
ve D
irec
tor,
and
Chi
ef F
inan
cial
Offi
cer
is o
n an
acc
rual
bas
is a
nd it
incl
udes
the
am
orti
zati
on
of R
SU
s gr
ante
d t
o th
em, w
hich
ves
t ov
er a
per
iod
of
tim
e. T
his
also
incl
udes
RS
Us
that
will
ves
t b
ased
on
per
form
ance
par
amet
ers
of t
he C
omp
any.
#
Figu
res
men
tion
ed in
` a
re e
qui
vale
nt o
f am
ount
s p
aid
in U
S$.
Sl.
No.
Nam
e of
the
E
mpl
oyee
Dat
e of
Jo
inin
g(d
d-m
m-y
yyy)
Gro
ss
Rem
uner
atio
n (`
)
Edu
cati
onal
Q
ualifi
cati
onA
geE
xper
ienc
e (y
rs)
Last
Em
ploy
men
tD
esig
nati
on
1A
bid
ali Z
N
eem
uchw
ala*
#
1-A
pr-
15 2
73,2
18,7
56
BE
, E
lec
tro
nic
s a
nd
C
omm
unic
atio
n, M
aste
rs
in In
dust
rial
Man
agem
ent
5127
Tata
Con
sult
ancy
S
ervi
ces
Chi
ef E
xecu
tive
Offi
cer a
nd E
xecu
tive
D
irec
tor
2B
hanu
mur
thy
B M
3-S
ep-9
2 6
9,14
7,51
2 B
Tec
h, P
GD
M55
32C
MC
Lim
ited
Pre
side
nt a
nd C
hief
Ope
rati
ng
Offi
cer
3R
isha
d A
Pre
mji
20-J
ul-0
7 6
8,30
6,01
7 B
.A.,
MB
A42
20B
ain
& C
ompa
nyE
xecu
tive
Dir
ecto
r an
d C
hief
S
trat
egy
Offi
cer
4Ja
tin
Pra
vinc
hand
ra
Dal
al*
1-Ju
l-02
60,
944,
191
BE
, CA
, PG
DB
A, C
FA
(US
A),
CG
MA
(UK
), C
MA
4420
GE
Indi
aS
enio
r Vic
e P
resi
dent
and
Chi
ef
Fina
ncia
l Offi
cer
5S
aura
bh G
ovil
11-M
ay-0
9 5
4,28
3,11
5 B
.Sc.
, PG
DM
-PM
& IR
5130
GE
Ind
iaP
resi
den
t &
Chi
ef H
uman
R
esou
rces
Offi
cer
6M
ilan
Rao
3-O
ct-1
7 5
0,70
9,82
0 B
Tec
h C
S&
E, M
BA
-Fi
nanc
e &
Mar
keti
ng48
26W
ipro
GE
Pre
side
nt-M
IT
7A
nand
Pad
man
abha
n2-
May
-94
42,
300,
606
BE
5329
Alm
oaye
d D
ata
Gro
upP
resi
de
nt-
Str
ate
gic
Sa
les
an
d
Geo
grap
hies
8S
ubra
man
ian
L3-
Aug
-92
39,
612,
013
B.S
c., M
E51
26Fi
rst
Em
plo
ymen
tS
enio
r Vi
ce P
resi
den
t
9A
nil R
aib
agi
16-O
ct-0
2 3
6,51
0,20
7 B
.Com
, MB
A48
27IB
MS
enio
r Vi
ce P
resi
den
t an
d H
ead
-
M &
A
10S
anjiv
K R
16-N
ov-8
8 3
1,24
3,49
8 M
MS
5531
DC
M D
ata
Pro
duct
sC
hief
Tec
hnol
ogy
Offi
cer

82 Wipro Limited
B)
Em
ploy
ees
draw
ing
sala
ry o
f ` 1
02 la
khs
or a
bove
per
ann
um a
nd p
oste
d in
Indi
a
Nam
e of
the
E
mpl
oyee
Dat
e of
Jo
inin
g G
ross
R
emun
erat
ion
(in
`)
Edu
cati
onal
Q
ualifi
cati
onA
geE
xper
ienc
e (y
rs)
Last
Em
ploy
men
tD
esig
nati
on
Aja
y B
hask
ar8-
Jul-
02 1
1,84
4,39
2 B
E, M
BA
4624
Hin
dus
tan
Leve
r Li
mit
edVi
ce P
resi
den
t -
Hea
d o
f C
orp
orat
e S
trat
egy
and
IP
Am
it B
ajor
ia30
-Oct
-00
17,
196,
211
CA
4118
Firs
t E
mp
loym
ent
Vice
Pre
sid
ent
Ane
esh
Gar
g2-
Feb
-17
11,
029,
419
Bus
ines
s M
anag
emen
t S
cien
ce
4622
Wip
ro L
imit
edS
enio
r Vi
ce P
resi
den
t
Anu
j Bha
lla15
-May
-96
21,
153,
736
BE
, MB
A48
23Fi
rst
Em
plo
ymen
tS
enio
r Vi
ce P
resi
den
t &
Glo
bal
D
eliv
ery
Hea
d, G
IS
Anu
rag
Set
h3-
May
-90
14,
942,
258
BE
, PG
DB
M -
Info
rmat
ion
Man
agem
ent
5229
Firs
t E
mp
loym
ent
Vice
Pre
sid
ent
& H
ead
-Tal
ent
Tran
sfor
mat
ion
Ara
vind
V S
22-A
pr-
02 1
9,51
0,82
4 P
GD
BM
3917
Firs
t E
mp
loym
ent
Vice
Pre
sid
ent
Arj
un R
amar
aju
8-N
ov-9
4 1
6,46
8,13
3 B
E46
24Fi
rst
Em
plo
ymen
tS
enio
r Vi
ce P
resi
den
t
Aya
skan
t S
aran
gi3-
Dec
-12
26,
217,
412
PG
DB
M44
21G
E In
dia
Sen
ior
Vice
Pre
sid
ent
- H
uman
R
esou
rces
Azi
m H
Pre
mji
17-A
ug-6
618
,123
,644
Gra
dua
te D
egre
e in
Ele
ctri
cal
Eng
inee
ring
7352
Firs
t E
mp
loym
ent
Exe
cuti
ve C
hair
man
and
M
anag
ing
Dir
ecto
r
Bal
asub
ram
ania
n K
17-A
pr-
02 1
7,60
2,43
9 B
.Com
, CA
3917
Firs
t E
mp
loym
ent
Vice
Pre
sid
ent
Bha
vani
Pad
man
abha
n9-
May
-16
12,
813,
227
MB
L50
26S
AB
Mill
er In
dia
Lim
ited
Dep
uty
Gen
eral
Cou
nsel
Cha
ndra
She
kar
S N
6-N
ov-9
5 1
5,89
6,42
2 B
E
4623
Ind
ian
Ind
ustr
ial
Mac
hnin
esVi
ce P
resi
den
t
Dav
id D
lima
23-A
pr-
15 1
5,73
7,59
1 B
.Tec
h, M
S in
Com
put
er
Eng
inee
ring
54
30IB
M g
lob
al s
ervi
ces
Vice
Pre
sid
ent
& C
IS C
onsu
ltin
g H
ead
Dee
pak
Ach
arya
1-Fe
b-1
8 2
8,26
9,28
8 B
Sc,
LLB
, FC
S51
23P
roct
er &
Gam
ble
S
inga
por
eS
enio
r Vi
ce P
resi
den
t &
Gen
eral
C
ouns
el
Dev
end
er M
alho
tra
23-A
ug-0
2 1
5,74
6,96
6 B
E, P
GD
4724
Sat
yam
GE
Sof
twar
eVi
ce P
resi
den
t an
d G
lob
al H
ead
Q
ualit
y an
d E
RM
Dip
ak K
umar
Boh
ra14
-Jun
-02
30,
555,
299
B C
om, C
A, I
CW
AI
4622
Ad
itya
Bir
la G
roup
Sen
ior
Vice
Pre
sid
ent,
Glo
bal
C
ontr
olle
r, Fi
nanc
e
Har
i Kis
han
Bur
le15
-Mar
-94
17,
499,
268
B.T
ech,
M.T
ech
4725
Firs
t E
mp
loym
ent
Vice
Pre
sid
ent
Har
i Men
on27
-Jun
-94
10,
377,
055
B.S
c., M
CA
4926
Son
ata
Sof
twar
eVi
ce P
resi
den
t -
Ind
ustr
ial
Man
ufac
turi
ng V
erti
cal
Har
ipra
sad
Heg
de
22-A
pr-
02 1
3,96
8,86
2 B
.Tec
h, B
.Sc.
, PG
Dip
lom
a57
35S
atya
m C
omp
uter
S
ervi
ces
Lim
ited
Sen
ior
Vice
Pre
sid
ent
Har
ish
Kum
ar B
aliv
ada
4-A
ug-0
8 1
2,37
5,74
2 B
E47
23Ta
ta C
onsu
ltan
cy
Ser
vice
s D
eliv
ery
Hea
d
Jaya
nt P
rab
hu K
5-A
ug-9
6 1
9,37
7,46
9 B
E
4322
Firs
t E
mp
loym
ent
Vice
Pre
sid
ent
Jaya
nta
Dey
13-O
ct-8
8 1
4,94
4,89
7 B
E, M
BA
5331
Firs
t E
mp
loym
ent
Vice
Pre
sid
ent
Key
ur M
ania
r12
-Mar
-07
20,
218,
059
BE
, MB
A49
25C
apit
al O
ne F
inan
cial
Sen
ior
Vice
Pre
sid
ent
Kir
an K
Des
ai21
-Sep
-98
21,
168,
482
BE
, PG
Dip
lom
a53
32U
nico
rp In
dus
trie
sS
enio
r Vi
ce P
resi
den
t -
GIS
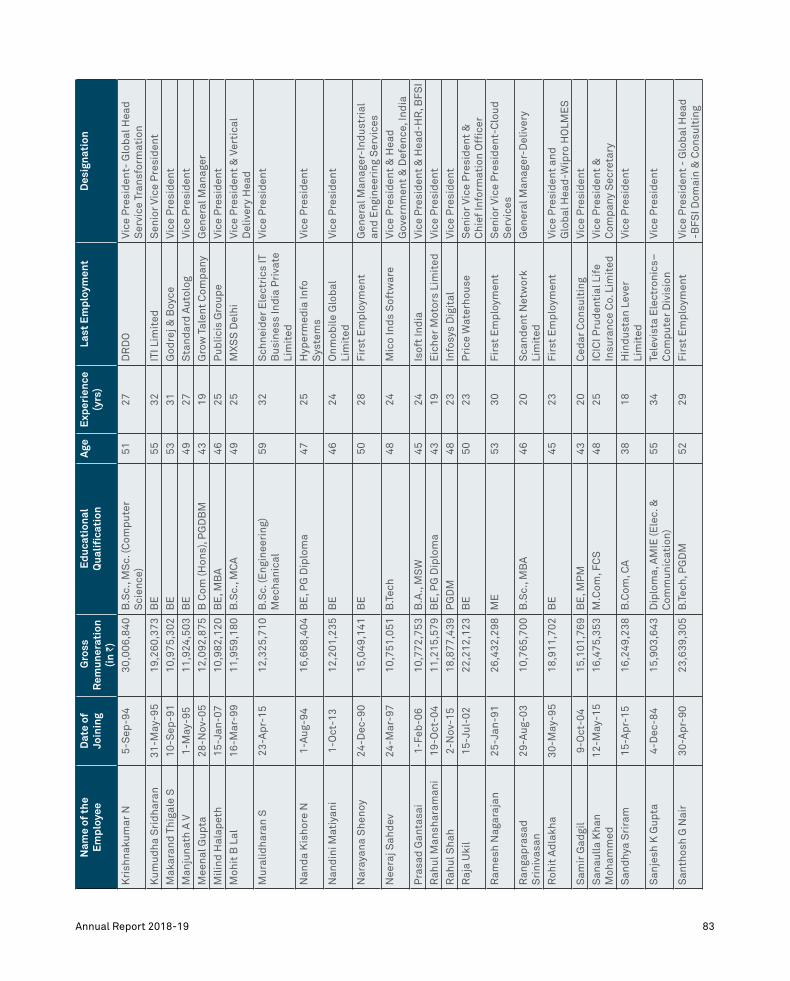
83Annual Report 2018-19
Nam
e of
the
E
mpl
oyee
Dat
e of
Jo
inin
g G
ross
R
emun
erat
ion
(in
`)
Edu
cati
onal
Q
ualifi
cati
onA
geE
xper
ienc
e (y
rs)
Last
Em
ploy
men
tD
esig
nati
on
Kri
shna
kum
ar N
5-S
ep-9
4 3
0,00
6,84
0 B
.Sc.
, MS
c. (C
omp
uter
S
cien
ce)
5127
DR
DO
Vice
Pre
sid
ent-
Glo
bal
Hea
d
Ser
vice
Tra
nsfo
rmat
ion
Kum
udha
Sri
dha
ran
31-M
ay-9
5 1
9,26
0,37
3 B
E55
32IT
I Lim
ited
Sen
ior
Vice
Pre
sid
ent
Mak
aran
d T
higa
le S
10-S
ep-9
1 1
0,97
5,30
2 B
E
5331
God
rej &
Boy
ce
Vice
Pre
sid
ent
Man
juna
th A
V1-
May
-95
11,
924,
503
BE
49
27S
tand
ard
Aut
olog
Vi
ce P
resi
den
t
Mee
nal G
upta
28-N
ov-0
5 1
2,09
2,87
5 B
Com
(Hon
s), P
GD
BM
43
19G
row
Tal
ent
Com
pan
y G
ener
al M
anag
er
Mili
nd H
alap
eth
15-J
an-0
7 1
0,98
2,12
0 B
E, M
BA
4625
Pub
licis
Gro
upe
Vice
Pre
sid
ent
Moh
it B
Lal
16-M
ar-9
9 1
1,95
9,18
0 B
.Sc.
, MC
A49
25M
XSS
Del
hiVi
ce P
resi
den
t &
Ver
tica
l D
eliv
ery
Hea
d
Mur
alid
hara
n S
23-A
pr-
15 1
2,32
5,71
0 B
.Sc.
(Eng
inee
ring
) M
echa
nica
l59
32S
chne
ider
Ele
ctri
cs IT
B
usin
ess
Ind
ia P
riva
te
Lim
ited
Vice
Pre
sid
ent
Nan
da
Kis
hore
N1-
Aug
-94
16,
668,
404
BE
, PG
Dip
lom
a47
25H
yper
med
ia In
fo
Sys
tem
sVi
ce P
resi
den
t
Nan
din
i Mat
iyan
i1-
Oct
-13
12,
201,
235
BE
4624
Onm
obile
Glo
bal
Li
mit
edVi
ce P
resi
den
t
Nar
ayan
a S
heno
y24
-Dec
-90
15,
049,
141
BE
50
28Fi
rst
Em
plo
ymen
tG
ener
al M
anag
er-I
ndus
tria
l an
d E
ngin
eeri
ng S
ervi
ces
Nee
raj S
ahd
ev24
-Mar
-97
10,
751,
051
B.T
ech
4824
Mic
o In
ds
Sof
twar
e Vi
ce P
resi
den
t &
Hea
d
Gov
ernm
ent
& D
efen
ce, I
ndia
Pra
sad
Gan
tasa
i1-
Feb
-06
10,
772,
753
B.A
., M
SW
4524
Isof
t In
dia
Vice
Pre
sid
ent
& H
ead
-HR
, BFS
I
Rah
ul M
ansh
aram
ani
19-O
ct-0
4 1
1,21
5,57
9 B
E, P
G D
iplo
ma
4319
Eic
her
Mot
ors
Lim
ited
Vice
Pre
sid
ent
Rah
ul S
hah
2-N
ov-1
5 1
8,87
7,43
9 P
GD
M48
23In
fosy
s D
igit
al
Vice
Pre
sid
ent
Raj
a U
kil
15-J
ul-0
2 2
2,21
2,12
3 B
E50
23P
rice
Wat
erho
use
Sen
ior
Vice
Pre
sid
ent
&
Chi
ef In
form
atio
n O
ffice
r
Ram
esh
Nag
araj
an25
-Jan
-91
26,
432,
298
ME
5330
Firs
t E
mp
loym
ent
Sen
ior
Vice
Pre
sid
ent-
Clo
ud
Ser
vice
s
Ran
gap
rasa
d
Sri
niva
san
29-A
ug-0
3 1
0,76
5,70
0 B
.Sc.
, MB
A
4620
Sca
nden
t N
etw
ork
Lim
ited
Gen
eral
Man
ager
-Del
iver
y
Roh
it A
dla
kha
30-M
ay-9
5 1
8,91
1,70
2 B
E45
23Fi
rst
Em
plo
ymen
tVi
ce P
resi
den
t an
d
Glo
bal
Hea
d-W
ipro
HO
LME
S
Sam
ir G
adgi
l9-
Oct
-04
15,
101,
769
BE
, MP
M43
20C
edar
Con
sult
ing
Vice
Pre
sid
ent
San
aulla
Kha
n M
oham
med
12-M
ay-1
5 1
6,47
5,35
3 M
.Com
, FC
S48
25IC
ICI P
rud
enti
al L
ife
Insu
ranc
e C
o. L
imit
edVi
ce P
resi
den
t &
C
omp
any
Sec
reta
ry
San
dhy
a S
rira
m15
-Ap
r-15
16,
249,
238
B.C
om, C
A38
18H
ind
usta
n Le
ver
Lim
ited
Vice
Pre
sid
ent
San
jesh
K G
upta
4-D
ec-8
4 1
5,90
3,64
3 D
iplo
ma,
AM
IE (E
lec.
&
Com
mun
icat
ion)
5534
Tele
vist
a E
lect
roni
cs–
C
omp
uter
Div
isio
nVi
ce P
resi
den
t
San
thos
h G
Nai
r30
-Ap
r-90
23,
639,
305
B.T
ech,
PG
DM
5229
Firs
t E
mp
loym
ent
Vice
Pre
sid
ent
- G
lob
al H
ead
-B
FSI D
omai
n &
Con
sult
ing

84 Wipro Limited
Nam
e of
the
E
mpl
oyee
Dat
e of
Jo
inin
g G
ross
R
emun
erat
ion
(in
`)
Edu
cati
onal
Q
ualifi
cati
onA
geE
xper
ienc
e (y
rs)
Last
Em
ploy
men
tD
esig
nati
on
Sat
ish
Y19
-Ap
r-00
11,
887,
685
BE
46
23Ji
ndal
Vija
yana
gar
Ste
el L
imit
edG
ener
al M
anag
er &
P
ract
ice
Hea
d
Sat
yaki
Ban
erje
e3-
Ap
r-03
11,
841,
139
BA
, LLB
4716
Pra
ctis
ing
Law
yer
Dep
uty
Gen
eral
Cou
nsel
Sha
rad
a N
and
akum
ar8-
Nov
-10
13,
444,
203
B.S
c.53
31A
md
ocs
Vice
Pre
sid
ent
She
etal
Sha
rad
Meh
ta16
-Sep
-94
15,
696,
128
BE
4625
Firs
t E
mp
loym
ent
Sen
ior
Vice
Pre
sid
ent
Sre
enat
h A
Ven
kap
pia
h29
-Nov
-02
14,
886,
077
BE
5431
Ksh
ema
Tech
nolo
gies
Sen
ior
Vice
Pre
sid
ent
& In
dia
B
usin
ess
Uni
t H
ead
Sri
niva
san
G14
-Ap
r-99
14,
213,
026
BE
4928
Ind
chem
Ele
ctro
nics
Vice
Pre
sid
ent
Sri
vats
an
Venk
atar
aman
i12
-Jan
-12
10,
605,
108
AC
A, P
GD
M50
24O
racl
e Fi
nanc
ial
Ser
vice
s Li
mit
edG
ener
al M
anag
er
Sud
hees
h B
abu
C2-
Ap
r-01
12,
743,
757
B.C
om, A
CA
, CIS
A
5132
Pri
ce W
ater
Hou
se
Hea
d, S
trat
egy
and
M&
A-C
yber
S
ecur
ity
& R
isk
Ser
vice
s
Sun
ita
Che
rian
4-N
ov-9
6 2
5,22
1,41
6 B
Tec
h, P
GD
BA
4522
Firs
t E
mp
loym
ent
Sen
ior
Vice
Pre
sid
ent-
Hum
an
Res
ourc
es
Sur
end
rana
th
Gar
imel
la10
-Jul
-06
24,
317,
490
B.S
c., M
CA
5129
MS
G S
yste
ms
Vice
Pre
sid
ent
Sur
esh
Kol
ati
15-J
un-1
6 1
3,29
6,89
0 B
E49
22S
trat
egic
Bus
ines
s U
nit
P&
LVi
ce P
resi
den
t
V J
Nit
hin
6-N
ov-0
2 1
3,76
6,98
7 B
Com
(Hon
s.),
CA
43
18A
.F. F
ergu
son
& C
o.
Vice
Pre
sid
ent
Vasu
dev
an A
31-M
ar-8
6 1
9,63
8,44
6 B
E, M
Tec
h57
33Fi
rst
Em
plo
ymen
tVi
ce P
resi
den
t
Venk
at S
rira
mag
iri
10-A
pr-
08 1
0,52
6,59
4 B
Tech
, ME
4827
Pol
aris
Sof
twar
e Te
chno
logy
Vice
Pre
sid
ent
Venk
atar
aman
M
ahad
evan
10-A
ug-0
4 1
0,33
9,53
0 B
.Sc.
, Ad
vanc
e D
iplo
ma
in
SM
GT
4814
NIIT
Vice
Pre
sid
ent
Vija
yasi
mha
Alil
ugha
tta
28-F
eb-1
4 2
3,59
7,00
6 B
E45
23In
fosy
s Li
mit
edS
enio
r Vi
ce P
resi
den
t
Vish
al K
umar
Sha
h1-
Oct
-10
12,
235,
086
Fello
w P
rogr
amm
e in
M
anag
emen
t (P
hD),
PG
DM
47
19R
ight
Man
agem
ent
Vice
Pre
sid
ent
Vish
was
Dee
p1-
Mar
-92
11,
906,
627
BE
, M T
ech
5027
Firs
t E
mp
loym
ent
Vice
Pre
sid
ent
and
Glo
bal
H
ead
-Tal
ent
Acq
uisi
tion
Visw
anat
han
Ram
asw
amy
6-Fe
b-1
4 1
5,97
8,82
5 M
Tec
h52
32Vo
daf
one
Ind
ia L
imit
edVi
ce P
resi
den
t
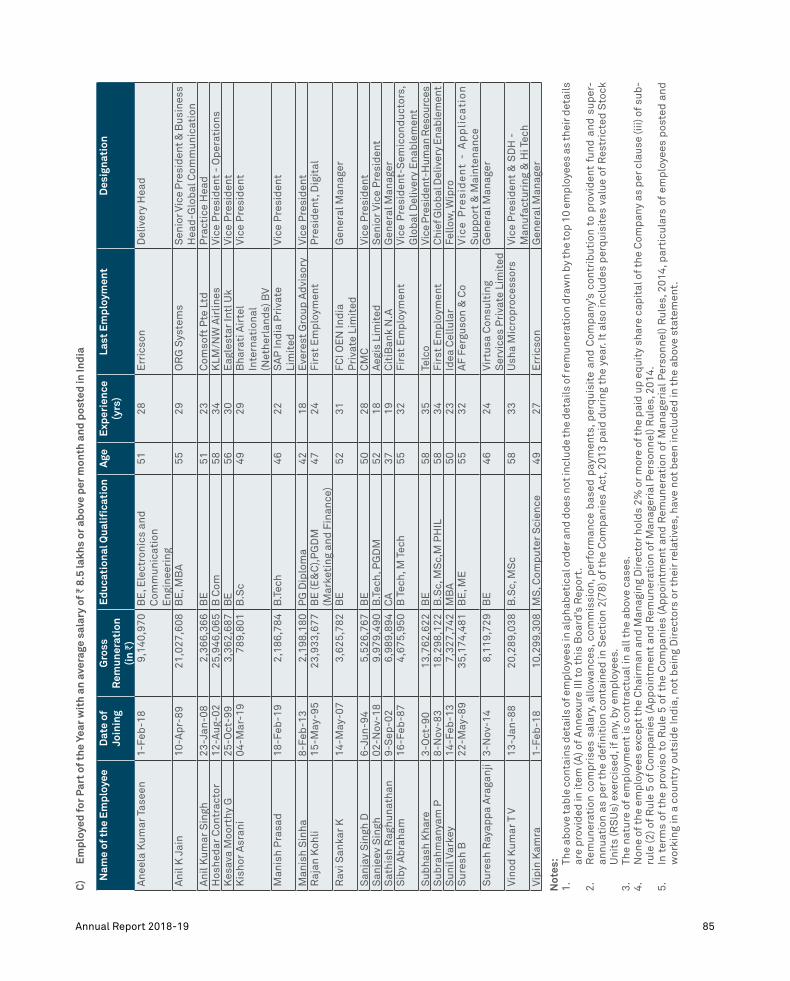
85Annual Report 2018-19
Not
es:
1.
The
abov
e ta
ble
con
tain
s d
etai
ls o
f em
plo
yees
in a
lpha
bet
ical
ord
er a
nd d
oes
not i
nclu
de
the
det
ails
of r
emun
erat
ion
dra
wn
by th
e to
p 1
0 em
plo
yees
as
thei
r det
ails
ar
e p
rovi
ded
in it
em (A
) of
Ann
exur
e III
to
this
Boa
rd’s
Rep
ort.
2.
Rem
uner
atio
n co
mp
rise
s sa
lary
, allo
wan
ces,
com
mis
sion
, per
form
ance
bas
ed p
aym
ents
, per
qui
site
and
Com
pan
y’s
cont
rib
utio
n to
pro
vid
ent
fund
and
sup
er-
annu
atio
n as
per
the
defi
niti
on c
onta
ined
in S
ecti
on 2
(78)
of
the
Com
pan
ies
Act
, 201
3 p
aid
dur
ing
the
year
. It
also
incl
udes
per
qui
site
s va
lue
of R
estr
icte
d S
tock
U
nits
(RS
Us)
exe
rcis
ed, i
f an
y, b
y em
plo
yees
.3.
Th
e na
ture
of
emp
loym
ent
is c
ontr
actu
al in
all
the
abov
e ca
ses.
4.
Non
e of
the
em
plo
yees
exc
ept
the
Cha
irm
an a
nd M
anag
ing
Dir
ecto
r ho
lds
2% o
r m
ore
of t
he p
aid
up
eq
uity
sha
re c
apit
al o
f the
Com
pan
y as
per
cla
use
(iii)
of s
ub-
rule
(2) o
f R
ule
5 of
Com
pan
ies
(Ap
poi
ntm
ent
and
Rem
uner
atio
n of
Man
ager
ial P
erso
nnel
) Rul
es, 2
014.
5.
In t
erm
s of
the
pro
viso
to
Rul
e 5
of t
he C
omp
anie
s (A
pp
oint
men
t an
d R
emun
erat
ion
of M
anag
eria
l Per
sonn
el) R
ules
, 201
4, p
arti
cula
rs o
f em
plo
yees
pos
ted
and
w
orki
ng in
a c
ount
ry o
utsi
de
Ind
ia, n
ot b
eing
Dir
ecto
rs o
r th
eir
rela
tive
s, h
ave
not
bee
n in
clud
ed in
the
ab
ove
stat
emen
t.
C)
Em
ploy
ed fo
r Par
t of
the
Yea
r wit
h an
ave
rage
sal
ary
of `
8.5
lakh
s or
abo
ve p
er m
onth
and
pos
ted
in In
dia
Nam
e of
the
Em
ploy
eeD
ate
of
Join
ing
Gro
ss
Rem
uner
atio
n (i
n `)
Edu
cati
onal
Qua
lifica
tion
Age
Exp
erie
nce
(yrs
)La
st E
mpl
oym
ent
Des
igna
tion
Ane
ela
Kum
ar T
asee
n1-
Feb
-18
9,1
40,9
70
BE
, Ele
ctro
nics
and
C
omm
unic
atio
n E
ngin
eeri
ng
5128
Err
icso
nD
eliv
ery
Hea
d
Ani
l K J
ain
10-A
pr-
89 2
1,02
7,60
8 B
E, M
BA
5529
OR
G S
yste
ms
Sen
ior V
ice
Pre
sid
ent &
Bus
ines
s H
ead
-Glo
bal
Com
mun
icat
ion
Ani
l Kum
ar S
ingh
23-J
an-0
8 2
,366
,366
B
E51
23C
omso
ft P
te L
td
Pra
ctic
e H
ead
H
oshe
dar
Con
trac
tor
12-A
ug-0
2 2
5,94
6,06
5 B
Com
5834
KLM
/NW
Air
lines
Vice
Pre
sid
ent
- O
per
atio
nsK
esav
a M
oort
hy G
25-O
ct-9
9 3
,362
,687
B
E56
30E
agle
star
Intl
Uk
Vice
Pre
sid
ent
Kis
hor
Asr
ani
04-M
ar-1
978
9,80
1B
.Sc
4929
Bha
rati
Air
tel
Inte
rnat
iona
l (N
ethe
rlan
ds)
BV
Vice
Pre
sid
ent
Man
ish
Pra
sad
18-F
eb-1
92,
186,
784
B.T
ech
4622
SA
P In
dia
Pri
vate
Li
mit
edVi
ce P
resi
den
t
Man
ish
Sin
ha8-
Feb
-13
2,1
98,1
80
PG
Dip
lom
a42
18E
vere
st G
roup
Ad
viso
ry
Vice
Pre
sid
ent
Raj
an K
ohli
15-M
ay-9
5 2
3,93
3,67
7 B
E (E
&C
),PG
DM
(M
arke
ting
and
Fin
ance
)47
24Fi
rst
Em
plo
ymen
tP
resi
den
t, D
igit
al
Rav
i San
kar
K14
-May
-07
3,6
25,7
82
BE
5231
FCI O
EN
Ind
ia
Pri
vate
Lim
ited
Gen
eral
Man
ager
San
jay
Sin
gh D
6-Ju
n-94
5,5
26,7
67
BE
5028
CM
CVi
ce P
resi
den
tS
anje
ev S
ingh
02-N
ov-1
89,
979,
490
B.T
ech,
PG
DM
5218
Aeg
is L
imit
edS
enio
r Vi
ce P
resi
den
tS
athi
sh R
aghu
nath
an9-
Sep
-02
6,9
89,8
94
CA
3719
Cit
iBan
k N
.A
Gen
eral
Man
ager
S
iby
Ab
raha
m16
-Feb
-87
4,6
75,9
50
B T
ech,
M T
ech
5532
Firs
t E
mp
loym
ent
Vice
Pre
sid
ent-
Sem
icon
duc
tors
, G
lob
al D
eliv
ery
Ena
ble
men
tS
ubha
sh K
hare
3-O
ct-9
0 1
3,76
2,62
2 B
E58
35Te
lco
Vice
Pre
side
nt-H
uman
Res
ourc
es
Sub
rahm
anya
m P
8-N
ov-8
3 1
8,29
8,12
2 B
.Sc,
MS
c,M
PH
IL58
34Fi
rst
Em
plo
ymen
tC
hief
Glo
bal D
eliv
ery
Ena
blem
ent
Sun
il Va
rkey
14-F
eb-1
3 7
,327
,742
M
BA
5023
Idea
Cel
lula
rFe
llow
, Wip
roS
ures
h B
22-M
ay-8
9 3
5,17
4,48
1 B
E, M
E55
32A
F Fe
rgus
on &
Co
Vic
e P
resi
de
nt
- A
pp
lic
ati
on
Sup
por
t &
Mai
nten
ance
Sur
esh
Ray
app
a A
raga
nji
3-N
ov-1
4 8
,119
,729
B
E46
24Vi
rtus
a C
onsu
ltin
g S
ervi
ces
Pri
vate
Lim
ited
Gen
eral
Man
ager
Vino
d K
umar
T V
13-J
an-8
8 2
0,28
9,03
8 B
.Sc,
MS
c58
33U
sha
Mic
rop
roce
ssor
sVi
ce P
resi
den
t &
SD
H -
M
anuf
actu
ring
& H
i Tec
hVi
pin
Kam
ra1-
Feb
-18
10,
299,
308
MS
, Com
put
er S
cien
ce49
27E
rric
son
Gen
eral
Man
ager

86 Wipro Limited
Annexure IVForm No. MR-3
SECRETARIAL AUDIT REPORT[Pursuant to Sub-Section (1) of Section 204 of the Companies Act, 2013 and Rule 9 of the
Companies (Appointment and Remuneration of Managerial Personnel) Rules, 2014]
FOR THE FINANCIAL YEAR ENDED MARCH 31, 2019
To,The Members,Wipro Limited, Doddakannelli,Sarjapur Road, Bengaluru - 560035
We have conducted the secretarial audit of the compliance of applicable statutory provisions and the adherence to good corporate practices by Wipro Limited (the “Company”). Secretarial Audit was conducted in a manner that provided us a reasonable basis for evaluating the corporate conducts/statutory compliances and expressing our opinion thereon.
Based on our verification of the Company’s books, papers, minute books, forms and returns filed and other records maintained by the Company and also the information provided by the Company, its officers, agents and authorized representatives during the conduct of secretarial audit, we hereby report that in our opinion, the Company has, during the audit period covering the financial year ended on March 31, 2019 (the audit period) complied with the statutory provisions listed hereunder and also that the Company has proper Board-processes and compliance-mechanism in place to the extent, in the manner and subject to the reporting made hereinafter:
We have examined the books, papers, minute books, forms and returns filed and other records maintained by the Company for the financial year ended on March 31, 2019 according to the provisions of:
i. The Companies Act, 2013 (the Act) and the rules made thereunder;
ii. The Securities Contracts (Regulation) Act, 1956 (‘SCRA’) and the rules made thereunder;
iii. The Depositories Act, 1996 and the regulations and Bye-laws framed thereunder;
iv. Foreign Exchange Management Act, 1999 and the rules and regulations made thereunder to the extent of Foreign Direct Investment and Overseas Direct Investment. There was no External Commercial Borrowing by the Company during the period under review;
v. The following Regulations and Guidelines prescribed under the Securities and Exchange Board of India Act, 1992 (‘SEBI Act’):-
a. The Securities and Exchange Board of India (Substantial Acquisition of Shares and Takeovers) Regulations, 2011;
b. The Securities and Exchange Board of India (Prohibition of Insider Trading) Regulations, 2015;
c. The Securities and Exchange Board of India (Issue of Capital and Disclosure Requirements) Regulations, 2009 (SEBI ICDR Regulations), upto September 10, 2018 and SEBI ICDR Regulations, 2018 w.e.f September 11, 2018;
d. The Securities and Exchange Board of India (Share Based Employee Benefits) Regulations, 2014;
e. The Securities and Exchange Board of India (Issue and Listing of Debt Securities) Regulations, 2008 (Not Applicable to the Company during the Audit Period);
f. The Securities and Exchange Board of India (Registrars to an Issue and Share Transfer Agents) Regulations, 1993 regarding the Companies Act and dealing with client;
g. The Securities and Exchange Board of India (Delisting of Equity Shares) Regulations, 2009 (Not Applicable to the Company during the Audit Period);
h. The Securities and Exchange Board of India (Buyback of Securities) Regulations, 1998 (SEBI Buyback of Securities Regulations) upto September 10, 2018 and SEBI Buyback of Securities Regulations, 2018 w.e.f. September 11, 2018; (Not Applicable to the Company during the Audit Period); and
i. Securities and Exchange Board of India (Listing Obligations and Disclosure Requirements) Regulations, 2015.
vi. Other laws applicable specifically to the Company namely:
a. Information Technology Act, 2000 and the rules made thereunder
b. Special Economic Zones Act, 2005 and the rules made thereunder

87Annual Report 2018-19
c. Software Technology Parks of India rules and regulations
We have also examined compliance with the applicable clauses of the following:
i. Secretarial Standards issued by The Institute of Company Secretaries of India on Meetings of the Board of Directors and General Meetings.
ii. Listing Agreements entered into by the Company with BSE Limited and National Stock Exchange of India Limited.
We have not examined compliance by the Company with applicable financial laws, like direct and indirect tax laws, since the same have been subject to review by statutory financial auditor and other designated professionals.
During the period under review, the Company has complied with the provisions of the Act, Rules, Regulations, Guidelines, etc. mentioned above.
We further report that:
The Board of Directors of the Company is duly constituted with proper balance of Executive Directors, Non-Executive Directors and Independent Directors. The changes in the composition of the Board of Directors that took place during the period under review were carried out in compliance with the provisions of the Act.
Adequate notice is given to all directors to schedule the Board Meetings, agenda and detailed notes on agenda were sent at least seven days in advance, and a system exists for seeking and obtaining further information and clarifications on the agenda items before the meeting and for meaningful participation at the meeting.
As per the minutes of the meetings duly recorded and signed by the Chairman, the decisions of the Board were unanimous and no dissenting views have been recorded.
We further report that based on the review of the compliance reports/certificates which were taken on record by the Board of Directors, there are adequate systems and processes in the Company commensurate with the size and operations of the Company to monitor and ensure compliance with applicable laws, rules, regulations and guidelines.
We further report that during the audit period, except for the following events, there was no event/action having a major bearing on the Company’s affairs in pursuance of the above referred laws, rules, regulations, guidelines etc.,
a. Bonus issue of 150,84,69,180 (One Hundred and Fifty Crores Eighty Four Lakhs Sixty Nine Thousand One Hundred and Eighty) Equity Shares of ` 2/- (Rupees Two) each (For every 3 Equity Shares 1 Bonus Equity Share was allotted) aggregating to ̀ 301,69,38,360/- (Rupees Three Hundred and One Crores Sixty Nine Lakhs Thirty Eight Thousand Three Hundred and Sixty).
b. Amalgamation of Wipro Technologies Austria GmbH, Wipro Information Technology Austria GmbH, Newlogic Technologies SARL and Appirio India Cloud Solutions Private Limited with Wipro Limited.
For V. SREEDHARAN & ASSOCIATES Company Secretaries
(V. Sreedharan)Bengaluru PartnerDate: April 15, 2019 FCS: 2347; CP No: 833

88 Wipro Limited
Annexure V
Corporate Social Responsibility Report for the year 2018-19
We present our report on Wipro’s social and ecological initiatives for the year 2018-19. Our journey began in 2001 with our first intervention in school education. Since then we have added new domains, and increased the scale of our programs and partnerships. However, what has remained constant underlying all our social initiatives has been our core principles and values. We start this report by reiterating the core values and strategic drivers of our Corporate Social Responsibility charter:
1. The values of Spirit of Wipro guide all our actions. Our values ‘Respect for every individual’, ‘Being global and responsible’ and ‘Unyielding integrity’ are essential tenets of the letter and spirit of a responsible business.
2. To conduct our business on the basis of sound ethical principles and widely accepted principles of good corporate governance. While this starts with compliance with laws and regulations of the countries we operate in, it goes far beyond that.
3. To continually evolve and progress in our journey of making Wipro more sustainable as defined by the triple bottom-line framework. The primary areas of focus are (i) to reduce our ecological footprint on energy, water and waste (ii) to foster a more diverse, empowered fair and safe workplace (iii) to enhance employees’ individual development that aligns with larger organizational goals and (iv) to actively influence our supply-chain in making them more responsible and sustainable organizations.
4. To combine work that is systemic and long-term with more direct, tangible programs. The nature of challenges in the social sector require both approaches and over the years, we have evolved a carefully crafted strategy that blends both. For example, in education, we support deep work that seeks to improve the quality of subject learning using the teacher as the pivotal center. Such work takes years and decades to show results. On the other hand, we also support more tangible, specific initiatives that help children from underprivileged communities with access to schooling.
5. To work with communities proximate to our operational centers in India and overseas. As a global organization, we would like to emphasize that the imperative of working on societal issues is a central plank of our approach not just in India but everywhere in the world we operate in.
We present the salient highlights of our initiatives for 2018-19 below. In addition, you will find a more detailed summary of our sustainability and social initiatives as part of the ‘Management Discussion and Analysis’(MD&A) section that is based on the principle of integrated reporting. Our integrated reporting covers financial, human, intellectual, natural and social capitals and reinforces the fundamental principle of continuity and connectedness between business and society. Our work in CSR creates social value by contributing to social inclusion, empowerment of the disadvantaged and mitigating of ecological degradation. This has cascading impacts on all the five capitals. For example, our work in education generates positive social, human and intellectual capital. For a fuller understanding, you may also want to refer to our comprehensive annual sustainability reports based on Global Reporting Initiative principles. These and various other details are available at our primary website www.wipro.com and at www.wipro.org, our website focusing exclusively on our social initiatives.
A. Education
We believe good education empowers people, enables genuine progress and is the foundation for a society’s well-being. Two of the key challenges for education are ensuring universal access and good quality of education. All our work in education tries to address either or both of these challenges. Started in 2001, our education initiatives cover a wide range of thematic areas across school and higher education which are highlighted below. The main geographies of our work are in India, USA and UK.
A.1 Systemic reforms in school education: Since 2001, we have worked to contribute to systemic reform in school education in India. The strategy for this has been to support the development and strengthening of good organizations working in in this space. We have partnered with over 116 organizations across 22 states in India with an effective reach of 20,000 schools, 40,000 educators and a million children. The impact of this wide network of education organizations has been in the areas of curriculum development, text books, teacher development and school leadership. The Wipro Education Seeding Fellowship program is a recent initiative started to catalyze the passion and energy of young individuals who want to make a difference to education. Currently, we have a network of 90 such Fellows working on several innovative areas of school

89Annual Report 2018-19
education including arts, sports, science and math in education.
A.2 Education for underprivileged children: Complementing the above initiative is a large program designed for more direct impact on children from underprivileged communities. The focus here is on ensuring access to good education. A specific priority within this larger canvas is to address the needs of children with disability from socio-economically underprivileged backgrounds. Our effective reach is to more than 40,000 children and 2,200 children with disability. The program is run through Wipro Cares, the employee-supported trust of Wipro.
A.3. Science education in U.S.A. and UK: Started in 2012, the Wipro Science Education Fellowship (SEF) is a program designed to develop teachers’ capacities to teach better in their schools and also help other teachers in the school district teach better. The program is focused on contributing to improving Science and Math education in schools that primarily serve disadvantaged communities in US cities.
We expanded our program significantly during FY19 – we now work with 7 university partners across the US who under the stewardship of University of Massachusetts engage intensively with 500 school teachers across 35 schools districts in 7 states. Our program has received wide and enthusiastic support and represents one of the largest such investments made by a non-US company to the cause of improving science and math education.
In 2018, we started a similar program in the UK in partnership with Kings College, London and Sheffield Hallam University with the core objective of building professional capacities of in-service school teachers of Science and Math.
We would like to state that while this expenditure is not allowed under the CSR rules of the Companies Act 2013, it is important to highlight it as part of our report. For it emphasizes a core principle that corporations must engage with social issues wherever they have large operational presence in the world and therefore restricting it to India would present an incomplete and partial picture of what we do.
A.4 Sustainability Education: Wipro-earthian is our India-wide flagship program that brings together two of our key concerns, Education and Sustainability. The program works at multiple levels – with schools and colleges, students and faculty all woven together through a narrative that our educational institutes must lead the change in our mindsets, attitudes and knowledge when it comes
to reversing the damage to our natural environment and to making our planet more habitable again. In the schools segment, the Wipro-earthian program has a large reach to more than 2,200 schools and 2,600 teachers across 32 states and union territories in India. In the colleges segment, our work is characterized by very interesting faculty-led initiatives in some of India’s leading institutes in the fields of Engineering, Management and Urban Planning. In addition, college students get to participate in the Wipro-earthian quiz which is now the country’s premier such program with more than 3,300 students from 28 of India’s leading colleges participating in a multi-tier exercise spread over six months. We also anchor an internship program for selected college students where they get to work with some of India’s leading organizations in sustainability.
A.5 Technology Education: People with the right skills and competencies form the bedrock of IT services organizations. The challenge for the Indian IT industry has always been to respond fast enough to the ever changing dynamics of the industry. The present times are no different, in fact even more so with the challenge of a bewilderingly fast changing landscape which is often characterized as Industry 4.0. We have always owned this as our primary responsibility. In 1995, we started a program for science graduates that would enable them to study for a post-graduate degree in engineering and technology. Called the Wipro Academy of Software Excellence (WASE) program, it helps Science graduates to study for a Master’s degree in Software Engineering. Run in partnership with the Birla Institute of Technology & Science (BITS), Pilani, India. This unique program blends rigorous academic exposure with practical professional learning at the workplace. We recently launched another program with BITS Pilani, called Wipro Infrastructure Management School (WIMS) to develop and nurture exclusive talent in IT infrastructure business, keeping Cloud Computing as the technology theme. We also run a program called WISTA in collaboration with Vellore Institute of Technology (VIT) for science graduates to offer specific courses around Data Science, VLSI and Embedded Technology programs. In total, more than 10,200 students are enrolled in these programs.
B. Community Care
A core principle of our CSR strategy is that we must engage meaningfully with disadvantaged communities who are proximate to our facilities. Our work is channeled through Wipro Cares, a unique platform that is based on the operating model of employee contributions which are matched by Wipro

90 Wipro Limited
Limited 1:1. Our work spans primary health-care, school education, community ecology and disaster rehabilitation. Of these, we have already spoken about our work on community education in Section A2 above. We present below updates on the other dimensions.
B.1 Primary health care: Access to primary health care is a key determinant of an individual’s future trajectory in life, including the ability to engage in productive livelihoods and responsible citizenship. Wipro Cares works with partners who provide good quality primary health care services to underserved communities. Our work focuses on maternal and child health, community hygiene and nutrition. Our six projects in this area have an effective reach of 72,000 people.
B.2 Disaster rehabilitation: Natural disasters like earthquakes, floods and cyclonic storms are an unfortunate fact of life, especially in a climatically and geologically diverse country like India. Whenever these happen, the disadvantaged sections get affected the most as the already fragile nature of their livelihoods gets disrupted further. Starting with the Gujarat earthquake in 2001,we have responded to several natural calamities in which Wipro’s employees have played a central role by way of contributions and volunteering. As a matter of choice, we focus on the more difficult challenge of long term rehabilitation of the affected communities. In 2018, Kerala was hit by a rare flooding event of catastrophic magnitude. Our employees rallied immediately in terms of relief and rehabilitation - 800 boxes of relief material were distributed in the immediate aftermath of the event followed by the launch of two long-term rehabilitation programs that seek to restore livelihoods of 300 families including 150 women and 30 persons with disability.
B.3 International Chapters: Our employees across the world are keen and enthusiastic participants in local community initiatives. In the US, First Book continues to be our anchor community program. During the year, more than 400 Wipro employees volunteered hundreds of hours helping distribute more than 109,000 books impacting more than 50,000 at-risk and rural students throughout North America. Our chapters in Philippines, UK, Europe and Asia-Pacific have also been very active in engaging with local communities on a range of initiatives that include disaster rehabilitation, biodiversity conservation, health care and education for disadvantaged children. The UK chapter started a new volunteering initiative for Special Education Needs (SEN) children and with Westminster Council to work with public schools on STEAM education (STEM+Arts). The Spirit of Wipro
Run in September 2018, like every year provided a unifying platform for employees across the world to contribute and volunteer with community initiatives.
C. Ecology & Environment
Managing economic development in a manner that does not compromise ecological integrity is one of the biggest challenges facing humanity currently. It is no surprise therefore that 7 of the 17 U.N. Sustainable Development Goals are directly related to ecology while the remaining 10 goals intersect with ecology and environment in indirect ways. Responsible corporations can make a significant difference by aligning their leadership commitment and resources with these problems in a purposeful way. Wipro’s engagement with sustainability issues goes back several years. Our approach embraces the continuum of (a) initiatives ‘within the organization’ that focus on reducing the energy, water, waste and biodiversity footprint of our business operations and (b) engaging through partners on key external programs in urban and community ecology. We present below some salient highlights of our external CSR work in 2018-19.
C.1 Urban Water: Water stress and scarcity is a critical challenge facing large parts of the world, exacerbated by climate change and loss of forest cover. In the context of cities, rapid urbanization and population growth has put enormous pressure on securing clean and affordable water for all sections of the population. Our work focuses on developing a robust collective understanding of urban water in the cities we operate in. This approach blends together the science of hydrogeology and citizen participation to co-create a solid body of advocacy work that then forms the basis for informed decision making. For example, in Bengaluru, we have a long running program of more than 5 years where we have implemented this approach covering 70 sq. km of prime suburban areas. We have started a similar program in Pune in collaboration with 7 different stakeholder groups that includes citizens.
C.2 Urban Biodiversity: Our urban biodiversity program addresses the twin goals of creating biodiversity in our urban campuses while also using it as a platform for wider education and advocacy. Our campuses in Electronic City, Bengaluru and Pune are exemplars of biodiversity spots in an urban setting with a large variety of native species of trees and flora that in turn support a range of insect and bird species.
C.3 Urban Waste Management: Accelerated by growing urban density and changing lifestyles, mushrooming urban solid waste is a fundamental challenge for most cities in India. Internally, as a

91Annual Report 2018-19
responsible corporation we take care to ensure that more than 90% of our waste is either converted for reuse (food waste converted to compost) or recycled for safe disposal. The work of the informal sector is critical in India in waste management, though they go largely unrecognized in the margins. One of our initiatives has been to provide access to social, nutritional and health security to the informal sector in solid waste management in the city of Bengaluru.
We recognize that our urban centers can simultaneously be hubs of economic prosperity as well as of inequality and exclusion. Therefore, the role of public spaces in our cities that foster inclusion and citizen participation becomes crucial. In our eyes, this is so important that we decided to include it formally as part of our CSR policy in 2018. An early initiative we supported in this regard was the Bengaluru International Center (BIC), a public institution in Bengaluru that is a space for participative and inclusive endeavors in arts and culture.
We also convened the Bengaluru Sustainability Forum (BSF) in collaboration with the National Center for Biological Sciences and Biome. BSF is a platform that brings together a wide range of different stakeholders and perspectives to further critical conversations on urban sustainability issues. In 2018-19, BSF convened three national level retreats on the themes of Urban Water, Biodiversity and Climate Change. We also initiated a small grants program that seeks to catalyze innovative experimental work in urban sustainability.
D. The power of engaged employees
Our employees are integral to our social programs in multiple ways. Providing them a platform to engage and volunteer develops a sense of citizenship and
larger responsibility towards society. From our experience, employees see this as a workplace differentiator. The Wipro Cares trust is built on a model of employee contribution that is matched by Wipro. Employees also volunteer their time beyond work-hours with many of our partners. During 2018-19, more than 12,500 employees spent around 30,000 hours of volunteering time with our partner organizations in 20 locations chapters in India, US, UK, Philippines, Japan and Australia.
E. Governance and Management
Wipro Foundation, a separate entity we created in 2017 to manage our CSR programs, is progressing well in terms of its governance and management processes. We have a robust governance process led by a 5-member board of trustees which reviews plans and progress against goals on a quarterly basis. Over the last 12 months, there has been an intensive focus on improving and streamlining operational practices along with people and talent development.
Our operating model of working through a network of good and credible partners in our chosen domains has stood us well all these years. We work with more than 175 of the most outstanding partners across India and in the US and UK. They bring competence, character and values to the difficult work they do and thus greatly enhance value to our communities in multiple ways.
We would like to conclude this year’s report on CSR by saying that Wipro engages with social issues for the simple reason that it is the right thing to do and that it resonates deeply with our own values. Our strategy and direction in the future will therefore continue to draw deeply from this essential principle and our vision of a more humane, inclusive and sustainable society.
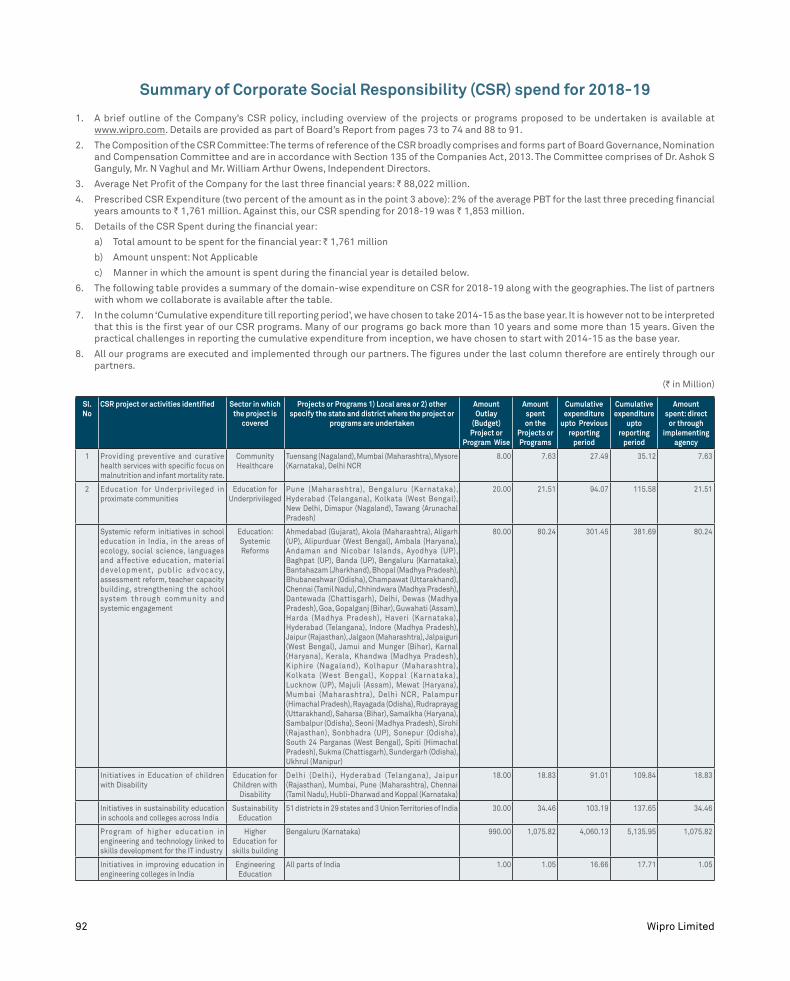
92 Wipro Limited
Summary of Corporate Social Responsibility (CSR) spend for 2018-19
1. A brief outline of the Company’s CSR policy, including overview of the projects or programs proposed to be undertaken is available at www.wipro.com. Details are provided as part of Board’s Report from pages 73 to 74 and 88 to 91.
2. The Composition of the CSR Committee: The terms of reference of the CSR broadly comprises and forms part of Board Governance, Nomination and Compensation Committee and are in accordance with Section 135 of the Companies Act, 2013. The Committee comprises of Dr. Ashok S Ganguly, Mr. N Vaghul and Mr. William Arthur Owens, Independent Directors.
3. Average Net Profit of the Company for the last three financial years: ` 88,022 million.
4. Prescribed CSR Expenditure (two percent of the amount as in the point 3 above): 2% of the average PBT for the last three preceding financial years amounts to ` 1,761 million. Against this, our CSR spending for 2018-19 was ` 1,853 million.
5. Details of the CSR Spent during the financial year:
a) Total amount to be spent for the financial year: ` 1,761 million
b) Amount unspent: Not Applicable
c) Manner in which the amount is spent during the financial year is detailed below.
6. The following table provides a summary of the domain-wise expenditure on CSR for 2018-19 along with the geographies. The list of partners with whom we collaborate is available after the table.
7. In the column ‘Cumulative expenditure till reporting period’, we have chosen to take 2014-15 as the base year. It is however not to be interpreted that this is the first year of our CSR programs. Many of our programs go back more than 10 years and some more than 15 years. Given the practical challenges in reporting the cumulative expenditure from inception, we have chosen to start with 2014-15 as the base year.
8. All our programs are executed and implemented through our partners. The figures under the last column therefore are entirely through our partners.
(` in Million)
Sl. No
CSR project or activities identified Sector in which the project is
covered
Projects or Programs 1) Local area or 2) other specify the state and district where the project or
programs are undertaken
Amount Outlay
(Budget) Project or
Program Wise
Amount spent on the
Projects or Programs
Cumulative expenditure
upto Previous reporting
period
Cumulative expenditure
upto reporting
period
Amount spent: direct
or through implementing
agency
1 Providing preventive and curative health services with specific focus on malnutrition and infant mortality rate.
Community Healthcare
Tuensang (Nagaland), Mumbai (Maharashtra), Mysore (Karnataka), Delhi NCR
8.00 7.63 27.49 35.12 7.63
2 Education for Underprivileged in proximate communities
Education for Underprivileged
Pune (Maharashtra), Bengaluru (Karnataka), Hyderabad (Telangana), Kolkata (West Bengal), New Delhi, Dimapur (Nagaland), Tawang (Arunachal Pradesh)
20.00 21.51 94.07 115.58 21.51
Systemic reform initiatives in school education in India, in the areas of ecology, social science, languages and affective education, material development , public advocacy, assessment reform, teacher capacity building, strengthening the school system through community and systemic engagement
Education: Systemic Reforms
Ahmedabad (Gujarat), Akola (Maharashtra), Aligarh (UP), Alipurduar (West Bengal), Ambala (Haryana), Andaman and Nicobar Islands, Ayodhya (UP), Baghpat (UP), Banda (UP), Bengaluru (Karnataka), Bantahazam (Jharkhand), Bhopal (Madhya Pradesh), Bhubaneshwar (Odisha), Champawat (Uttarakhand), Chennai (Tamil Nadu), Chhindwara (Madhya Pradesh), Dantewada (Chattisgarh), Delhi, Dewas (Madhya Pradesh), Goa, Gopalganj (Bihar), Guwahati (Assam), Harda (Madhya Pradesh), Haveri (Karnataka), Hyderabad (Telangana), Indore (Madhya Pradesh), Jaipur (Rajasthan), Jalgaon (Maharashtra), Jalpaiguri (West Bengal), Jamui and Munger (Bihar), Karnal (Haryana), Kerala, Khandwa (Madhya Pradesh), Kiphire (Nagaland), Kolhapur (Maharashtra), Kolkata (West Bengal), Koppal (Karnataka), Lucknow (UP), Majuli (Assam), Mewat (Haryana), Mumbai (Maharashtra), Delhi NCR, Palampur (Himachal Pradesh), Rayagada (Odisha), Rudraprayag (Uttarakhand), Saharsa (Bihar), Samalkha (Haryana), Sambalpur (Odisha), Seoni (Madhya Pradesh), Sirohi (Rajasthan), Sonbhadra (UP), Sonepur (Odisha), South 24 Parganas (West Bengal), Spiti (Himachal Pradesh), Sukma (Chattisgarh), Sundergarh (Odisha), Ukhrul (Manipur)
80.00 80.24 301.45 381.69 80.24
Initiatives in Education of children with Disability
Education for Children with
Disability
Delhi (Delhi), Hyderabad (Telangana), Jaipur (Rajasthan), Mumbai, Pune (Maharashtra), Chennai (Tamil Nadu), Hubli-Dharwad and Koppal (Karnataka)
18.00 18.83 91.01 109.84 18.83
Initiatives in sustainability education in schools and colleges across India
Sustainability Education
51 districts in 29 states and 3 Union Territories of India 30.00 34.46 103.19 137.65 34.46
Program of higher education in engineering and technology linked to skills development for the IT industry
Higher Education for skills building
Bengaluru (Karnataka) 990.00 1,075.82 4,060.13 5,135.95 1,075.82
Initiatives in improving education in engineering colleges in India
Engineering Education
All parts of India 1.00 1.05 16.66 17.71 1.05

93Annual Report 2018-19
Sl. No
CSR project or activities identified Sector in which the project is
covered
Projects or Programs 1) Local area or 2) other specify the state and district where the project or
programs are undertaken
Amount Outlay
(Budget) Project or
Program Wise
Amount spent on the
Projects or Programs
Cumulative expenditure
upto Previous reporting
period
Cumulative expenditure
upto reporting
period
Amount spent: direct
or through implementing
agency
3 Ensuring environmental sustainability, ecological balance, Agroforestry
Water Bengaluru (Karnataka), Pune (Maharashtra) 3.00 2.74 22.35 25.09 2.74
Biodiversity Bengaluru (Karnataka), Pune (Maharashtra) 3.00 3.68 26.51 30.19 3.68
Energy Bengaluru (Karnataka), Pune (Maharashtra), Hyderabad (Telangana), Chennai (Tamil Nadu)
605.00 511.00 1,831.10 2,342.10 511.00
Waste Management
Bengaluru (Karnataka) 2.00 1.72 7.67 9.39 1.72
Sustainability Advocacy and
Research
Bengaluru (Karnataka), New Delhi, Bhubhaneshwar (Odisha), Chennai (Tamil Nadu), Kurnool (Andhra Pradesh), Guwahati (Assam), Jharkhand and others
30.00 33.58 54.94 88.52 33.58
4 Rural Development projects Rural livelihood programs
Uttarkashi (Uttarakhand), Cuddalore, Coimbatore (Tamil Nadu), Kottapuram, Thrissur, Kottayam (Kerala)
5.00 7.41 13.81 21.22 7.41
5 Initiatives in Art and Culture and the urban public space
Protection and Promotion
of national heritage, art and culture
Bengaluru (Karnataka) 50.00 50.00 - 50.00 50.00
6 Wipro Foundation reserve Education and Ecology
All parts of India 3.33 3.33 - 3.33 3.33
Total 1,848.33 1,853.00 6,650.38 8,503.38 1,853.00
Note : List of implementing partners are provided below.
9. A responsibility statement of the CSR Committee that the implementation and monitoring of CSR Policy is in compliance with CSR objectives and policy of the Company: Yes, it is in compliance with CSR Policy and Objectives of the Company.
Sd/-
Azim H Premji(Executive Chairman and Managing Director)
Sd/-
Ashok S Ganguly(Chairman of Board Governance,
Nomination and Compensation Committee)
Sl No.
Name of Agency/Foundation/Trust Location
1 Army Navy Airforce Wives Activity Trust (ANAWA) Delhi NCR2 Aseema Charitable Trust Mumbai3 Asha Community Health Development Society Delhi NCR4 ASHA Foundation Bengaluru5 Ashray Akruti Hyderabad6 Association for Rural and Urban Needy (ARUN) Kolkata7 Association for the Welfare of Persons with a
Mental Handicap in Maharashtra (AWMH)Mumbai
8 Astha Trust Delhi NCR9 CBM India Trust Kottayam
10 Community Educational Centre Society (CECS) Dimapur11 Dnyangangotri Pratishthan Pune12 Door Step School (DSS) Pune13 Eleutheros Christian Society (ECS) Tuensang14 Foundation for Mother and Child Health (FMCH) Mumbai15 Fourth Wave Foundation (FWF) Dharwad, Koppal16 Gosaba Panchayat Committee Sundarbans, WB17 Gubbachi Learning Community Bengaluru18 Hasiru Dala Bengaluru19 Jhamtse Gatsal Children’s Community Tawang, Arunachal20 Kottapuram Integrated Development Society
(KIDS)Kottapuram, Thrissur
21 Legal Aid to Women (LAW) Trust Cuddalore22 Makkala Jagriti Bengaluru23 National Association for the Blind (NAB) Delhi NCR24 National Centre for Promotion of Employment for
Disabled People (NCPEDP)Delhi NCR
25 Navanirmana Charitable Trust Mayasandra, Tumakuru26 Niramaya Health Foundation Mumbai27 Olcott Education Society Chennai28 Prayas Society Jaipur29 Rehoboth Sustainable Development Foundation Coimbatore30 Rural Literacy and Health Programme (RLHP) Mysore31 Sahasra Deepika International for Education (SDIE) Bengaluru32 Samridhdhi Trust Bengaluru33 Shri Bhuvaneshwari Mahila Ashram (SBMA) Uttarakashi34 Shri Sadguru Saibaba Seva Trust Pune
Sl No.
Name of Agency/Foundation/Trust Location
35 Society of Parents of Children with Autistic Disorders (SOPAN)
Mumbai
36 Sugra Humayun Mirza Wakf Hyderabad
37 Swadhar IDWC Pune
38 The Institution of Social Studies Trust (ISST) Delhi NCR
39 Towards Future Kolkata
40 Urmi Foundation Mumbai
41 V-Excel Education Trust Chennai
42 Vikramshila Education Resource Society Kolkata
43 ACWADAM Pune
44 Batti Ghar Bhubaneshwar
45 BIOME Environmental Trust Bengaluru
46 Carbon Disclosure Project India New Delhi
47 Centre for Environment Research and Education (CERE)
Mumbai, Maharashtra
48 Confederation of Indian Industry (CII) New Delhi
49 Cotton University Guwahati
50 Global Reporting Initiative Pvt Ltd New Delhi
51 Hasiru Dala Bengaluru
52 Humane Koraput, Odisha
53 In Season Fish Chennai
54 IUCN New Delhi
55 National center for Biological Sciences Bengaluru
56 Nature Forever Society Nashik
57 RUDRA Chattra, Jharkhand
58 VIVASWA Kurnool, AP
59 Waste Impact Trust Bengaluru
60 Arunachal State Council for Science & Technology Itanagar, Arunachal
61 Ashoka Trust for Energy and Environment (ATREE) Bengaluru, Karnataka
62 Assam State Council for Science & Technology Guwahati, Assam
63 BIOME Environmental Solutions Bengaluru, Karnataka
64 BITS PILANI Goa Campus Goa
65 C P Ramaswamy Environmental Education Centre (CPREEC)
Chennai, Tamil Nadu
66 Carbon Disclosure Project India Delhi
67 Centre for Environment Education (CEE) Ahmedabad, Gujarat

94 Wipro Limited
Sl No.
Name of Agency/Foundation/Trust Location
68 Centre for Environment Research and Education (CERE)
Mumbai, Maharashtra
69 Centre of Study for Sceince Technology and Policy (CSTEP)
Bengaluru, Karnataka
70 CEPT University Ahmedabad, Gujarat
71 Dakshin Foundation Bengaluru, Karnataka
72 Delhi state Environment Education Department Delhi
73 FAWES Nature Club Chennai, Tamil Nadu
74 Goa Institute of Management (GIM) Sanquelim, Goa
75 Himachal State Council for Science & Technology Simla, Himachal Pradesh
76 IIM Kozhikode Kozhikode, Kerala
77 IIM Ahmedabad Ahmedabad, Gujarat
78 IIM Bengaluru Bengaluru, Karnataka
79 IIM Lucknow Lucknow
80 IIT Delhi Delhi
81 IIT Kharagpur Kharagpur, West Bengal
82 IIT Bombay Mumbai, Maharashtra
83 Institute of Chemical Technology (ICT) Mumbai, Maharashtra
84 Madhya Pradesh Environmental Planning and Coordination Organization
Bhopal, Madhya Pradesh
85 Manipal Academy of Higher Education Manipal, Karnataka
86 Meghalaya State Council for Science & Technology Shillong, Meghalaya
87 Mizoram State Council for Science & Technology Aizawl, Mizoram
88 Nagaland State Council for Science & Technology Kohima, Nagaland
89 Nature Conservation Foundation Bengaluru, Karnataka
90 NIT Trichy Trichy, Tamil Naadu
91 Quizbrain Bengaluru, Karnataka
92 SELCO Foundation Bengaluru, Karnataka
93 Sikkim ENVIS and Forest Department Gangtok, Sikkim
94 Tripura State Council for Science & Technology Agartala, Tripura
95 Trucost Mumbai, Maharashtra
96 Wild Ecologues Gurgaon, Delhi NCR
97 World Reseources Institute Mumbai, Maharashtra
98 Xavier University Bhubaneshwar (XUB) Bhubaneshwar, Odisha
99 Yuvasatta Chandigarh, Punjab
100 Aavishkaar Yaatraa Palampur, Himachal Pradesh
101 Aawaj Jankalyan Samiti Bhopal, Madhya Pradesh
102 Agragamee Rayagada, Odisha
103 Agrani Seoni, Madhya Pradesh
104 Antral Bantahazam, Jharkhand
105 Antral Theatre Delhi
106 Apni Shala Mumbai, Maharashtra
107 Art of Play Ambala, Haryana
108 ArtSparks Bengaluru, Karnataka
109 ASWA Hyderabad, Telangana
110 Awadh Peoples Forum Ayodhya, UP
111 Ayang Majuli, Assam
112 Bachpan Banao Dantewada, Chattisgarh
113 Barefoot Mumbai, Maharashtra
114 Bookworm Goa
115 Chale Chalo Sundergarh, Odisha
116 Dakshin Foundation Andaman and Nicobar Islands
117 Digantar Shiksha Evam Khelkud Samiti Jaipur, Rajasthan
118 Dooars Jagron Jalpaiguri, West Bengal
119 Gramothan Sonepur, Odisha
120 Gubbachi Learning Community Bengaluru, Karnataka
121 Had Anhad Indore, Madhya Pradesh
122 Happy Horizon Trust Saharsa Bihar
123 Head Held High Bengaluru, Karnataka
124 Innovation and Science Promotion Foundation (ISPF) Bengaluru , Karnataka
Sl No.
Name of Agency/Foundation/Trust Location
125 Isaksham Jamui, Bihar
126 Jan Sahas Social Development Society Dewas, Madhya Pradesh
127 Jodo Gyan Shiksha Delhi
128 Joy of Learning Delhi
129 KeyEd Education Foundation Bengaluru, Karnataka
130 Khel Khel Mein Delhi
131 Kshamtalaya Sirohi, Rajasthan
132 Lets Open a Book Spiti, Himachal Pradesh
133 Library for All Ukhrul, Manipur
134 Loop Hyderabad, Telangana
135 Maarga Bengaluru, Karnataka
136 Mantra4Change Bengaluru, Karnataka
137 Mobile Pathshala in Sunderbans South 24 Paraganas, West Bengal
138 Musht Khandwa, Madhya Pradesh
139 Muskaan Bhopal, Madhya Pradesh
140 Nagaland Centre for HD-IT Kiphire, Nagaland
141 Nature Conservation Foundation (NCF) Bengaluru, Karnataka
142 North East Education Trust Guwahati, Assam
143 Pararth Samiti Chhindwara, Madhya Pradesh
144 Patang Sambalpur, Odisha
145 Pratyaya EduResearch Lab Chindwara, Madhya Pradesh
146 Prayog Gopalganj, Bihar
147 Roshni Trust Haveri, Karnataka
148 Rural Aid Alipurduar, West Bengal
149 Sajag Mumbai, Maharashtra
150 Samait Shala Ahmedabad, Gujarat
151 Samerth Charitable Trust Ahmedabad, Gujarat
152 School Education Trust for the Disadvantaged Aligarh, UP
153 School Social Science Initiative Bhubaneshwar, Odisha
154 Shaheed Virender Smarak Samiti (SVSS) Samalkha, Haryana
155 Shiksharth Sukma, Chattisgarh
156 Simple Education Foundation Delhi
157 Space for Nurturing Creativity Rudraprayag, Uttarakhand
158 SwaTalim Mewat, Haryana
159 Swatantra Talim Lucknow, UP
160 Synergy Harda, Madhya Pradesh
161 Tarkeybein Baghpat, UP
162 Teach for Green Champawat, Uttarakhand
163 The Ferdinand Centre (TFC) Delhi
164 Thrive Chennai, Tamil Nadu
165 Umoya Delhi
166 Universe Simplified Mumbai, Maharashtra
167 Unnati Institute for Social and Economic Change Akola, Maharashtra
168 Upkram Sonbhadra, UP
169 Vanangana Banda, UP
170 Vardishnu Jalgaon, Maharashtra
171 Varitra Karnal, Haryana
172 Vidya Mytri Trust (VMT) Koppal, Karnataka
173 Vidya Vidhai Chennai, Tamil Nadu
174 Vidyodaya Kolhapur, Maharashtra
175 Vikramshila Education Resource Society Kolkata, West Bengal
176 Virasat-E-Hind Bhubaneshwar, Odisha
177 Vision Empower Bengaluru, Karnataka
178 We, The people Delhi NCR
179 Wipro Cares Bengaluru, Karnataka
180 Wipro Foundation Bengaluru, Karnataka

95Annual Report 2018-19
Annexure VIForm No. MGT-9
EXTRACT OF ANNUAL RETURN
as on the financial year ended March 31, 2019
[Pursuant to Section 92(3) of the Companies Act, 2013 and rule12(1) of the Companies(Management and Administration) Rules, 2014]
I. REGISTRATION AND OTHER DETAILS:
i. CIN L32102KA1945PLC020800ii. Registration Date December 29, 1945iii. Name of the Company Wipro Limitediv. Category/Sub-Category of the Company Public Limited Company - Limited by Shares
Indian Non-Government Companyv. Address of the Registered office and
contact detailsWipro Limited, Doddakannelli, Sarjapur Road, Bengaluru – 560 035Ph: 080 28440011, Fax: 080 28440054Website: www.wipro.comEmail: [email protected]
vi. Whether listed company Yesvii. Name, Address and Contact details of
Registrar and Transfer Agent, if anyKarvy Fintech Private Limited,Karvy Selenium Tower B, Plot 31-32, Gachibowli, Financial District, Nanakramguda, Hyderabad – 500 032Contact Person:Mr. B Srinivas ManagerTel: 040-6716 2222Fax: 040-2300 1153Email: [email protected]
II. PRINCIPAL BUSINESS ACTIVITIES OF THE COMPANY
All the business activities contributing 10% or more of the total turnover of the company shall be stated:-
Sl. No.
Name and Description of main products/services
NIC Code of the Product/service
% to total turnover of the company
1 IT Software, Services and related activities
6201362020
100%
III. PARTICULARS OF HOLDING, SUBSIDIARY AND ASSOCIATE COMPANIES
Sr. No.
Name of the Company Address of the Company CIN/GLN Holding/ Subsidiary /Associate
% of shares
held
Applicable Section
1. Wipro, LLC 2 Tower Center Blvd, Suite 2200 East Brunswick, NJ 08816, USA
N/A Subsidiary 100 2(87)
2. Wipro Gallagher Solutions, LLC
18001, Old Cutler Road, Suite 651, Palmetto Bay, Florida 33157, USA
N/A Subsidiary 100 2(87)
3. Opus Capital Market Consultants LLC
100 Tri State International, Ste, 300A Lincolnshire, IL 60069, USA
N/A Subsidiary 100 2(87)
4. Wipro Promax Analytics Solutions, LLC
2 Tower Center Blvd, Suite 2200; East Brunswick, NJ 08816, USA
N/A Subsidiary 100 2(87)
5. Wipro Insurance Solutions, LLC
1209, Orange St, Wilmington, New Castle Country-19801, USA
N/A Subsidiary 100 2(87)
6. Wipro IT Services, LLC 251, Little Falls Drive, Wilmington 19808 N/A Subsidiary 100 2(87)

96 Wipro Limited
Sr. No.
Name of the Company Address of the Company CIN/GLN Holding/ Subsidiary /Associate
% of shares
held
Applicable Section
7. Wipro Solutions Canada Limited
Atco Center, 909 11th Ave SW, Calgary, AB T2R 1L7, Canada
N/A Subsidiary 100 2(87)
8. Wipro Japan KK Yokohama Landmark Tower 26F #2605, 2-2-1-1 Minato-Mirai 2208126 Yokohama, Kanagawa, Japan
N/A Subsidiary 100 2(87)
9. Wipro Shanghai Limited F3, Bldg 9, Zhangjiang Hi-Tech Park, Shanghai, China
N/A Subsidiary 100 2(87)
10. Wipro Information Technology Netherlands BV
Hoogoorddreef 15, 1101 BA Amsterdam, The Netherlands
N/A Subsidiary 100 2(87)
11. Wipro Chengdu Limited 3/F, A3 Building, Tianfu Software Park, Tianfu Avenue, Hi-Tech zone, Chengdu, China – 610041
N/A Subsidiary 100 2(87)
12. Wipro (Thailand) Co. Limited
152, Chartered Square Building, Unit 17-02B, North Sathorn Road, Kwaeng Silom, Khet Bangrak, Bangkok, Thailand
N/A Subsidiary 100 2(87)
13. Wipro Technologies Limited
Str. 1, 109028, Dom 13, Khokhlovsky Pereulok Moscow, Russia
N/A Subsidiary 100 2(87)
14. Wipro Technologies Australia Pty Ltd
Unit 1, 7 Sky Close, Taylors Beach NSW 2316, Australia
N/A Subsidiary 100 2(87)
15. PT WT Indonesia Regus-Jakarta Menara Standard Chartered 30/F Menara Standard Chartered Jl. 164 Jakarta. 12930. Indonesia
N/A Subsidiary 100 2(87)
16. Wipro Travel Services Limited
Sarjapur Road, Doddakannelli, Bengaluru - 560035, India
U91200KA1996PLC020622 Subsidiary 100 2(87)
17. Wipro Trademarks Holding Limited
Sarjapur Road, Doddakannelli, Bengaluru - 560035, India
U93090KA1982PLC021795 Subsidiary 100 2(87)
18. Wipro Networks Pte Limited
31, Cantonment Road, Singapore 089747 N/A Subsidiary 100 2(87)
19. Wipro Technologies SDN BHD
Suite 702, 7th floor, Wisma Hangsam,Jalan Hang lekir, 50000, Kualalumpur, Malaysia
N/A Subsidiary 100 2(87)
20. Wipro Philippines, Inc. (formerly known as Wipro BPO Philippines Limited Inc.)
Cebu IT Tower 1 Corner Archbishop Reyes Avenue and Mindanao Street, Cebu Business Park, 6000 Cebu City, Cebu, Philippines
N/A Subsidiary 100 2(87)
21. Wipro Information Technology Kazakhstan LLP
7, Azattyk Ave., Atyrau city, Kazakhstan N/A Subsidiary 100 2(87)
22. Wipro IT Services Ukraine, LLC
Regus - 42 - 44 Shovkovychna Street, Kiev 01601, Ukraine
N/A Subsidiary 100 2(87)
23. Wipro Arabia Co. Limited Suite No. 209, Jarrir, Book Store Building, Alkhobar, PO Box 31349, 31952, Saudi Arabia.
N/A Subsidiary 66.67 2(87)
24. Women’s Business Park Technologies Limited
PO Box 47033, Riyadh 11552, Kingdom of Saudi Arabia
N/A Subsidiary 55 2(87)
25. Wipro Information Technology Egypt SAE(a)
B-124, Smart Village, Cairo-Alex Desert Road, Giza, Egypt
N/A Subsidiary 100 2(87)
26. Wipro Bahrain Limited Co. S.P.C (formerly known as Wipro Bahrain Limited WLL)
Seef Business Centre Building, #2795 5th Floor, # 510 Road 2835 , Kingdom of Bahrain
N/A Subsidiary 100 2(87)
27. Wipro Gulf LLC 322 Office # 28, KOM 4 Ground Floor, Knowledge Oasis Muscat, Sultanate of Oman
N/A Subsidiary 100 2(87)
28. Wipro Doha LLC Servcorp, Level 22, Tomado Tower, West Bay, Doha N/A Subsidiary 49 2(87)
29. Rainbow Software LLC D603, St.14, Building 43, Al Mansour, Baghdad, Iraq N/A Subsidiary 100 2(87)
30. Wipro Technologies SA DE CV
Ave. Pedro Ramírez Vázquez 200-1, 4º Piso Valle Oriente, Garza García, N.L., México 66269
N/A Subsidiary 100 2(87)

97Annual Report 2018-19
Sr. No.
Name of the Company Address of the Company CIN/GLN Holding/ Subsidiary /Associate
% of shares
held
Applicable Section
31. Wipro Do Brasil Technologia LTDA
João Marchesini street, No. 139 - 5th and 6th floor Post Code: 80215-432 Curitiba/Parana – Brazil
N/A Subsidiary 100 2(87)
32. Wipro Do Brasil Sistemetas De Informatica Ltd
Av.Maria Coelho Aguiar,215 – Bloco B– 6º. Andar – Jd. São LuisSão Paulo – SP zip code.: 05804-900, Brazil
N/A Subsidiary 100 2(87)
33. Wipro Technologies SA Carlos Pellegrini, 581 (Piso 7) 1009 Capital Federal, Buenos Aires – Argentina
N/A Subsidiary 100 2(87)
34. Wipro Technologies Peru SAC
Av.De la Floresta No. 497, Piso 5, San Borja, Lima, Peru
N/A Subsidiary 100 2(87)
35. Wipro do Brasil Servicos de Tecnologia S.A (Formerly known as Infoserver SA)
Dr .Yajiro Takaoka 4.348, 8th floor, Room 809, Alphaville, CEP 06541-038, City of Santana do Parniba, Sao Paulo, Brazil
N/A Subsidiary 100 2(87)
36. Wipro Technologies Vz, C.A
Av. Blandin, Torre B.O.D. La Castellana. Caracas, Venezuela.
N/A Subsidiary 100 2(87)
37. Wipro Technologies W.T Sociedad Anonima
Escalante, Calle 31, Avenida 13, #2575, 7813-1000 San José, Costa Rica
N/A Subsidiary 100 2(87)
38. Wipro Technologies Chile SPA
Andrés Bello 2711, 8th floor, Las Condes, Torre Costanera, CP 7550611, Santiago, CHILE.
N/A Subsidiary 100 2(87)
39. Wipro Poland SP Z.O.O Arkonska Business Park, ul. Arkońska 6/A2, 2 Floor, 80-387 Gdansk, Poland
N/A Subsidiary 100 2(87)
40. Wipro IT Services Poland SP Z.O.O
16th Flr, (Millennium Plaza), Al. Jerozolimskie 123a, Warsaw 02-017, Poland
N/A Subsidiary 100 2(87)
41. Wipro Portugal SA Rua Engo,Frederico Ulrich, 2650, Edificio Wipro,4470- 605 Moreira- Maia, Portugal
N/A Subsidiary 100 2(87)
42. Wipro Technologies SRL TRUST CENTER Splaiul Independentei, nr 319C, Sector 6, Bucharest, Romania.
N/A Subsidiary 100 2(87)
43. Wipro Technologies GmbH
Dusseldorferstr 71B, 40667 Meerbusch, Germany N/A Subsidiary 100 2(87)
44. Cellent GmbH Ringtrabe, 70, 70736 Fellbach, Germany N/A Subsidiary 100 2(87)
45. Cellent GmbH Lassallestraße 7b,1020 Vienna, Austria N/A Subsidiary 100 2(87)
46. Wipro Digital APS Philip Heymans Alle 7, 2900 Hellerup, Denmark N/A Subsidiary 100 2(87)
47. Designit A/S Bygmestervej 61, 2400 Copenhagen NV, Denmark N/A Subsidiary 100 2(87)
48. Designit Denmark A/S Bygmestervej 61, 2400 Copenhagen NV, Denmark N/A Subsidiary 100 2(87)
49. Designit Germany GmbH (formerly known as Designit Munich GmbH)
Gabrielenstrasse 9, 80636 Munich N/A Subsidiary 100 2(87)
50. Designit Spain Digital S.L C/ Mártires de Alcalá 4, 1º, 28015 Madrid N/A Subsidiary 100 2(87)
51. Designit Colombia S A S Carrera 48 20 114 Oficina 834, Medellin, Antioquia. Columbia
N/A Subsidiary 100 2(87)
52. Designit Peru SAC Av. Alberto del Campo 409, Oficina 503
Distrito Magdalena del Mar
N/A Subsidiary 100 2(87)
53. Designit Oslo A/S Akkersbakken 12, 0172 Oslo, Norway N/A Subsidiary 100 2(87)
54. Designit Sweden AB Gustavslundsvägen 143, 167 51, Bromma, Sweden N/A Subsidiary 100 2(87)
55. Designit T.L.V Limited 18 Raoul Wallenberg Street, Tel Aviv, Israel N/A Subsidiary 100 2(87)
56. Designit Tokyo Co., Limited
The Park Rex Koamicho Bldg 8F, 11-8 Koamicho Nihombashi Chuo-ku Tokyo 103-0016
N/A Subsidiary 100 2(87)
57. Frontworx Informationstechnologie GmbH
Lassallestraße 7b, 1020 Vienna, Austria N/A Subsidiary 100 2(87)

98 Wipro Limited
Sr. No.
Name of the Company Address of the Company CIN/GLN Holding/ Subsidiary /Associate
% of shares
held
Applicable Section
58. Wipro Cyprus SE (Formerly known as Wipro Cyprus Public Limited)
Kings Court, 185 Kings Road, Reading, Berkshire RG1 4EX, United Kingdom
N/A Subsidiary 100 2(87)
59. Wipro Holdings Hungary Korlátolt Felelősségű Társaság
H-1143 Budapest, Stefánia út 101-103, Hungary N/A Subsidiary 100 2(87)
60. Wipro Holdings Investment Korlátolt Felelősségű Társaság
H-1143 Budapest, Stefánia út 101-103, Hungary N/A Subsidiary 100 2(87)
61. Wipro Outsourcing Services (Ireland) Limited
Dromore House, # 3rd Floor, Eastpark Business Centre, Shannon , Co. Clare, Ireland
N/A Subsidiary 100 2(87)
62. Wipro Holdings (UK) Limited
Devonshire House, 60 Goswell Road, London,EC1M 7AD, United Kingdom
N/A Subsidiary 100 2(87)
63. Wipro Europe Limited Devonshire House, 60 Goswell Road, London,EC1M 7AD, United Kingdom
N/A Subsidiary 100 2(87)
64. Wipro UK Limited Devonshire House, 60 Goswell Road, London,EC1M 7AD, United Kingdom
N/A Subsidiary 100 2(87)
65. Wipro Financial Services UK Limited
Devonshire House, 60 Goswell Road, London, United Kingdom, EC1M 7AD
N/A Subsidiary 100 2(87)
66. Wipro IT Services S.R.L (b) Bucharest, 169A Calea Floreasca, Building B, 1st, 2nd and 3rd floor, 1st District, Romania
N/A Subsidiary 100 2(87)
67. Wipro Technologies South Africa (Proprietary) Limited
The Forum, 10th Floor Office 162 Maude Street, Sandton, 2198 Johannesburg, South Africa
N/A Subsidiary 100 2(87)
68. Wipro Technologies Nigeria Limited
7th Floor, Mulliner Towers, 39 Alfred Rewane Road, (Kingsway Road), Ikoyi Lagos, Nigeria
N/A Subsidiary 100 2(87)
69. Wipro Corporate Technologies Ghana Ltd
2nd Floor, Opeibea House, 37 Liberation Road, ACCRA, PO. BOX. CT 9347 Cantonments, ACCRA, Ghana
N/A Subsidiary 100 2(87)
70. Wipro (Dalian) Limited D7, Spring-Field Park, Ganjingzi District, Dalian, China, Peoples Republic of China, Pin-116034
N/A Subsidiary 100 2(87)
71. Wipro Overseas IT Services Private Limited
Sarjapur Road, Doddakannelli, Bengaluru - 560035,India
U72200KA2015PTC080266 Subsidiary 100 2(87)
72. Healthplan Services Insurance Agency, LLC
3501 E Frontage Rd., Tampa, FL 33607, USA N/A Subsidiary 100 2(87)
73. Healthplan Services, LLC 3501 E Frontage Rd, Tampa, FL 33607, USA N/A Subsidiary 100 2(87)
74. Appirio, Inc. 201 S. Capitol Ave., #1100 Indianapolis, IN 46225, USA
N/A Subsidiary 100 2(87)
75. Cooper Software,LLC 85 2nd Street, 8th Floor San Francisco, CA 94105, USA
N/A Subsidiary 100 2(87)
76. Infocrossing, LLC 425 National Ave STE 200, Mountain View, CA 94043, USA
N/A Subsidiary 100 2(87)
77. Wipro US Foundation(c) 251, Little Falls Drive, Wilmington, country of New Castle, Delware19908
N/A Subsidiary 100 2(87)
78. Appirio, K.K METLIFE Aoyama Building 8F, 2-11-16, Minami Aoyama, Minato-ku, Tokyo, Japan
N/A Subsidiary 100 2(87)
79. Topcoder, LLC 251 Little Falls Drive, Wilmington - 19808-1674 N/A Subsidiary 100 2(87)
80. Appirio GmbH(d) TorstraBe, 138, 10119, Berlin, Germany N/A Subsidiary 100 2(87)
81. Appirio Limited 92-93- St. Stephens Green, Dublin-2, Ireland N/A Subsidiary 100 2(87)
82. Appirio Limited Longcraft House, 2-8 Victoria Avenue, London, EC2M4NS, UK
N/A Subsidiary 100 2(87)
83. Wipro IT Services Bangladesh Limited
Grand Delvista, Level-4, Plot 1/A, Road 113, Gulshan Dhaka, 1212, Bangladesh
N/A Subsidiary 100 2(87)

99Annual Report 2018-19
Sr. No.
Name of the Company Address of the Company CIN/GLN Holding/ Subsidiary /Associate
% of shares
held
Applicable Section
84. Wipro HR Services India Private Limited (formerly known as Alight HR Services India Private Limited)(e)
710, Ansal Chambers II 6 Bhikaji Cama Place, New Delhi 110066
U74999DL2016PTC305940 Subsidiary 100 2(87)
85. Wipro SA Broad Based Ownership Scheme SPV (RF) (PTY) LTD
The Forum, 10th Floor Office 162 Maude Street, Sandton, 2198 Johannesburg, South Africa
N/A Subsidiary 100 2(87)
86. Drivestream, Inc. 45610 Woodland Road, Suite 150 Sterling, VA 20166, USA
N/A Associate 47.3 2(6)
87. Denim Group Limited 1354 North Loop 1604 E, Suite 110, San Antonio, Texas 78232
N/A Associate 33 2(6)
88. Denim Group Management, LLC
1354 North Loop 1604 E, Suite 110, San Antonio, Texas 78232
N/A Associate 33.33 2(6)
(a) Wipro Information Technology Egypt SAE has been put into liquidation with effect from September 30, 2016.
(b) Wipro IT Services S.R.L, Romania, was incorporated on November 1, 2018.
(c) Wipro US Foundation, USA, was incorporated on January 25, 2019.
(d) Appirio GmbH has been put into liquidation with effect from December 10, 2018.
(e) Wipro HR Services India Private Limited (formerly known as Alight HR Services India Private Limited) was acquired on August 31, 2018.
Pursuant to order dated March 29, 2019, the Hon’ble National Company Law Tribunal, Bengaluru bench, approved the scheme of amalgamation for the merger of our wholly-owned subsidiaries, Wipro Information Technology Austria GmbH, Wipro Technologies Austria GmbH, NewLogic Technologies SARL and Appirio India Cloud Solutions Private Limited, with and into Wipro Limited. As per the said scheme, the appointed date is April 1, 2018. Therefore, particulars of these entities are not included in the above list.
Cellent Mittelstandsberatung GmbH was merged with and into Cellent GmbH, Germany with effect from November 6, 2018. Therefore, particulars of the entity are not included in the above list.
Appirio Singapore Pte Ltd was liquidated with effect from February 4, 2019. Therefore, particulars of the entity are not included in the above list.
The Company reduced its shareholding in WAISL Limited (formerly known as Wipro Airport IT Services Limited) from 74% to 11% on April 5, 2018. Hence, particulars of the entity are not included in the above list.

100 Wipro Limited
IV. SHARE HOLDING PATTERN (Equity Share Capital Breakup as percentage of Total Equity)
i. Category-wise Share Holding
Category Code
Category of Shareholder No. of shares held at the beginning of the year (April 1, 2018)
No. of shares held at the end of the year (March 31, 2019)
% Change during the
yearDemat Physical Total % of Total shares
Demat Physical Total % of Total shares
(A) PROMOTER AND PROMOTER GROUP
(1) INDIAN
(a) Individual /HUF 190,838,864 - 190,838,864 4.22 254,451,816 - 254,451,816 4.22 0
(b) Central Government/State Government(s)
- - - - - - - - -
(c) Bodies Corporate (Promoter in his capacity as Director of Private Limited/Section 25 Companies)
16,732,153 - 16,732,153 0.37 22,309,537 - 22,309,537 0.37 -
(d) Financial Institutions / Banks - - - - - - - - -
(e) Any Other -Partnership firms (Promoter in his capacity as partner of Partnership firms)
2,535,965,162 - 2,535,965,162 56.06 3,381,286,878 - 3,381,286,878 56.04 (0.02)
(f) Others - Trust 618,461,626 - 618,461,626 13.67 797,948,834 - 797,948,834 13.22 (0.45)
Sub-Total A(1) 3,361,997,805 - 3,361,997,805 74.32 4,455,997,065 - 4,455,997,065 73.85 (0.47)
(2) FOREIGN
(a) Individuals (NRIs/Foreign Individuals)
- - - - - - - - -
(b) Bodies Corporate - - - - - - - - -
(c) Institutions - - - - - - - - -
(d) Qualified Foreign Investor - - - - - - - - -
(e) Others - - - - - - - - -
Sub-Total A(2) : - - - - - - - - -
Total A=A(1)+A(2) : 33,619,97,805 - 33,619,97,805 74.32 4,455,997,065 - 4,455,997,065 73.85 (0.47)
(B) PUBLIC SHAREHOLDING
(1) INSTITUTIONS
(a) Mutual Funds /UTI 101,258,173 - 101,258,173 2.24 94,005,955 - 94,005,955 1.56 (0.68)
(b) Financial Institutions /Banks 17,500,460 - 17,500,460 0.39 29,674,597 - 29,674,597 0.49 0.10
(c) Central Government / State Government(s)
- - - - - - - - -
(d) Venture Capital Funds - - - - - - - - -
(e) Insurance Companies 142,560,401 - 142,560,401 3.15 267,932,933 - 267,932,933 4.44 1.29
(f) Foreign Institutional Investors 419,150,036 419,150,036 9.27 538,940,494 - 538,940,494 8.94 (0.33)
(g) Foreign Venture Capital Investors
- - - - - - - - -
(h) Qualified Foreign Investor - - - - - - - - -
(i) Others -Alternate Investment Fund
- - - - 528,918 - 528,918 0.01 0.01
Sub-Total B(1) 680,469,070 680,469,070 15.05 931,082,897 - 931,082,897 15.44 0.39
(2) NON-INSTITUTIONS
(a) Bodies Corporate 48,147,139 83,230 48,230,369 1.07 126,246,943 110,455 126,357,398 2.09 1.02
(b) NBFCs Registered with RBI 43,869 - 43,869 0.00 661,552 - 661,552 0.01 0.01
Overseas Corporate Bodies 12,544 - 12,544 0.00 - - - - 0.00
Individuals
(i) Individuals holding nominal share capital upto ` 1 lakh
76,209,953 10,88,350 77,298,303 1.71 99,179,142 1,127,021 100,306,163 1.66 (0.05)
(ii) Individuals holding nominal share capital in excess of ` 1 lakh
144,144,215 13,789,767 157,933,982 3.49 195,849,721 11,021,921 206,871,642 3.43 (0.06)
(c) Qualified Foreign Investor - - - - - - - - -
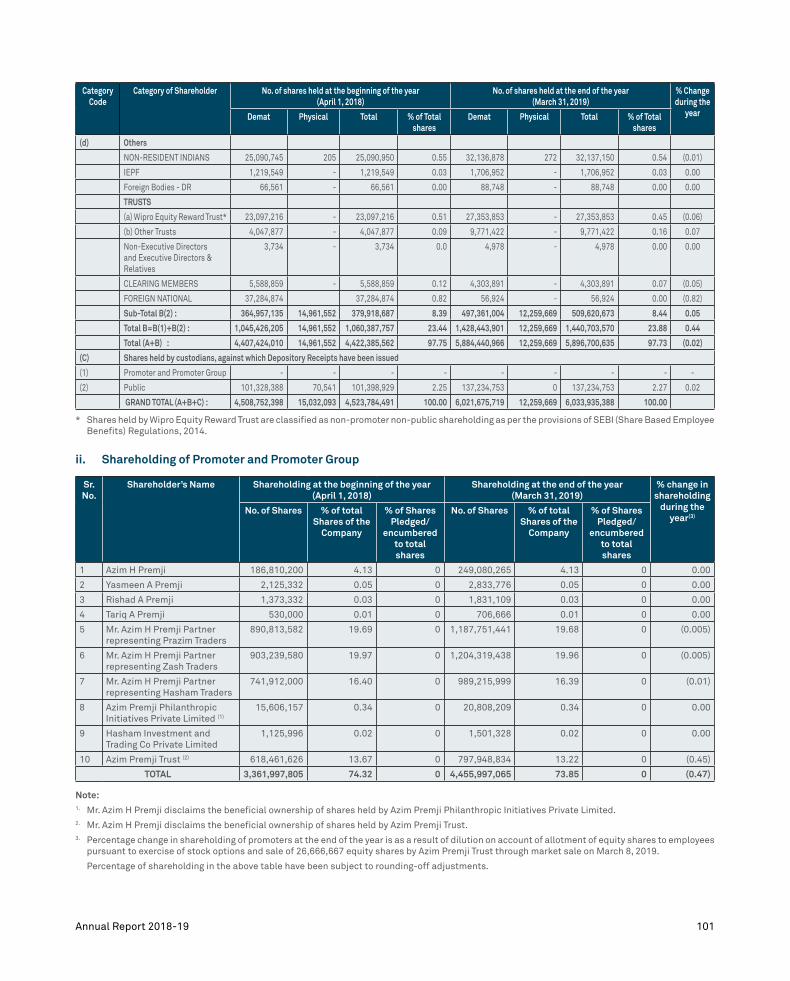
101Annual Report 2018-19
Category Code
Category of Shareholder No. of shares held at the beginning of the year (April 1, 2018)
No. of shares held at the end of the year (March 31, 2019)
% Change during the
yearDemat Physical Total % of Total shares
Demat Physical Total % of Total shares
(d) Others
NON-RESIDENT INDIANS 25,090,745 205 25,090,950 0.55 32,136,878 272 32,137,150 0.54 (0.01)
IEPF 1,219,549 - 1,219,549 0.03 1,706,952 - 1,706,952 0.03 0.00
Foreign Bodies - DR 66,561 - 66,561 0.00 88,748 - 88,748 0.00 0.00
TRUSTS
(a) Wipro Equity Reward Trust* 23,097,216 - 23,097,216 0.51 27,353,853 - 27,353,853 0.45 (0.06)
(b) Other Trusts 4,047,877 - 4,047,877 0.09 9,771,422 - 9,771,422 0.16 0.07
Non-Executive Directors and Executive Directors & Relatives
3,734 - 3,734 0.0 4,978 - 4,978 0.00 0.00
CLEARING MEMBERS 5,588,859 - 5,588,859 0.12 4,303,891 - 4,303,891 0.07 (0.05)
FOREIGN NATIONAL 37,284,874 37,284,874 0.82 56,924 - 56,924 0.00 (0.82)
Sub-Total B(2) : 364,957,135 14,961,552 379,918,687 8.39 497,361,004 12,259,669 509,620,673 8.44 0.05
Total B=B(1)+B(2) : 1,045,426,205 14,961,552 1,060,387,757 23.44 1,428,443,901 12,259,669 1,440,703,570 23.88 0.44
Total (A+B) : 4,407,424,010 14,961,552 4,422,385,562 97.75 5,884,440,966 12,259,669 5,896,700,635 97.73 (0.02)
(C) Shares held by custodians, against which Depository Receipts have been issued
(1) Promoter and Promoter Group - - - - - - - - -
(2) Public 101,328,388 70,541 101,398,929 2.25 137,234,753 0 137,234,753 2.27 0.02
GRAND TOTAL (A+B+C) : 4,508,752,398 15,032,093 4,523,784,491 100.00 6,021,675,719 12,259,669 6,033,935,388 100.00
* Shares held by Wipro Equity Reward Trust are classified as non-promoter non-public shareholding as per the provisions of SEBI (Share Based Employee Benefits) Regulations, 2014.
ii. Shareholding of Promoter and Promoter Group
Sr. No.
Shareholder’s Name Shareholding at the beginning of the year(April 1, 2018)
Shareholding at the end of the year(March 31, 2019)
% change in shareholding
during the year(3)
No. of Shares % of total Shares of the
Company
% of Shares Pledged/
encumbered to total shares
No. of Shares % of total Shares of the
Company
% of Shares Pledged/
encumbered to total shares
1 Azim H Premji 186,810,200 4.13 0 249,080,265 4.13 0 0.00
2 Yasmeen A Premji 2,125,332 0.05 0 2,833,776 0.05 0 0.00
3 Rishad A Premji 1,373,332 0.03 0 1,831,109 0.03 0 0.00
4 Tariq A Premji 530,000 0.01 0 706,666 0.01 0 0.00
5 Mr. Azim H Premji Partner representing Prazim Traders
890,813,582 19.69 0 1,187,751,441 19.68 0 (0.005)
6 Mr. Azim H Premji Partner representing Zash Traders
903,239,580 19.97 0 1,204,319,438 19.96 0 (0.005)
7 Mr. Azim H Premji Partner representing Hasham Traders
741,912,000 16.40 0 989,215,999 16.39 0 (0.01)
8 Azim Premji Philanthropic Initiatives Private Limited (1)
15,606,157 0.34 0 20,808,209 0.34 0 0.00
9 Hasham Investment and Trading Co Private Limited
1,125,996 0.02 0 1,501,328 0.02 0 0.00
10 Azim Premji Trust (2) 618,461,626 13.67 0 797,948,834 13.22 0 (0.45)
TOTAL 3,361,997,805 74.32 0 4,455,997,065 73.85 0 (0.47)
Note: 1. Mr. Azim H Premji disclaims the beneficial ownership of shares held by Azim Premji Philanthropic Initiatives Private Limited.2. Mr. Azim H Premji disclaims the beneficial ownership of shares held by Azim Premji Trust.3. Percentage change in shareholding of promoters at the end of the year is as a result of dilution on account of allotment of equity shares to employees
pursuant to exercise of stock options and sale of 26,666,667 equity shares by Azim Premji Trust through market sale on March 8, 2019.
Percentage of shareholding in the above table have been subject to rounding-off adjustments.

102 Wipro Limited
iii. Change in Promoters’ Shareholding (please specify, if there is no change)
Sr. No Shareholding at thebeginning of the
year (April 1, 2018)
Date Reason Increase/Decrease in Shareholding
Cumulative Shareholding during the year
No. of shares
% of total shares of the
company
No. of Shares
% total shares of the
Company(1)
No. of shares
% of total shares of the
Company (2)
At the beginning of the year (April 1, 2018)
3,361,997,805 74.32
Date wise Increase / Decrease in Promoters Share holding during the year specifying the reasons for increase/ decrease (e.g. allotment / transfer / bonus/ sweat equity etc):
1 Azim Hasham Premji 186,810,200 4.13 08/03/2019 Bonus allotment
62,270,065 - 249,080,265 4.13
2 Yasmeen A Premji 2,125,332 0.05 08/03/2019 Bonus allotment
708,444 - 2,833,776 0.05
3 Rishad Azim Premji 1,373,332 0.03 08/03/2019 Bonus allotment
457,777 - 18,31,109 0.03
4 Tariq Azim Premji 530,000 0.01 08/03/2019 Bonus allotment
176,666 - 7,06,666 0.01
5 Mr Azim Hasham Premji Partner Representing Hasham Traders
741,912,000 16.40 08/03/2019 Bonus allotment
247,303,999 - 989,215,999 16.39
6 Mr Azim Hasham Premji Partner Representing Prazim Traders
890,813,582 19.69 08/03/2019 Bonus allotment
296,937,859 - 1,187,751,441 19.68
7 Mr Azim Hasham Premji Partner Representing Zash Traders
903,239,580 19.97 08/03/2019 Bonus allotment
301,079,858 - 1,204,319,438 19.96
8 Hasham Investment and Trading Co Private Limited
1,125,996 0.02 08/03/2019 Bonus allotment
375,332 - 1,501,328 0.02
9 Azim Premji Trust 61,846,1626 13.67 08/03/2019 Bonus allotment
206,153,875 -
797,948,834 13.2208/03/2019 Sale of
shares(26,666,667) (0.45)
10 Azim Premji Philanthropic Initiatives Private Limited
15,606,157 0.34 08/03/2019 Bonus allotment
5,202,052 - 20,808,209 0.34
At the End of the year (March 31, 2019)
4,455,997,065 73.85
(1) The issue of bonus equity shares was in the ratio of 1:3 to all shareholders. Consequently, there was no change in the percentage shareholding post issue of bonus equity shares.
(2) Percentage change in shareholding of promoters at the end of the year is as a result of dilution on account of allotment of equity shares to employees pursuant to exercise of stock options and sale of 26,666,667 equity shares by Azim Premji Trust through market sale on March 8, 2019.
iv. Shareholding Pattern of top ten Shareholders (other than Directors, Promoters and Holders of ADRs):
Sl.No.
For Each of the Top 10 Shareholders Shareholding at the beginning of the year
Cumulative Shareholding duringthe year (2018-19)
No.of shares % of total shares of the Company
No.of shares % of total shares of the Company
1. At the beginning of the year
Refer Annexure A
2. Date wise Increase/Decrease in Shareholding during the year specifying the reasons for increase/decrease (e.g. allotment/transfer/bonus/sweat equity etc):
3, At the End of the year ( or on the date of separation, if separated during the year)

103Annual Report 2018-19
v. Shareholding of Directors and Key Managerial Personnel:
Sl.No.
For Each of the Directors and KMP Shareholding at the beginning of the year (April 1, 2018)
Cumulative Shareholding duringthe year (2018-19)
No. of shares % of total shares of the Company
No. of shares % of total shares of the Company
1. At the beginning of the year
Refer Annexure B
2. Date wise Increase/Decrease in Shareholding during the year specifying the reasons for increase/ decrease (e.g. allotment/transfer/bonus/sweat equity etc):
3. At the end of the year (March 31, 2019)
V. INDEBTEDNESS
Indebtedness of the Company including interest outstanding/accrued but not due for payment. (` in Million)
Secured Loans excluding deposits
Unsecured Loans
Deposits Total Indebtedness
Indebtedness at the beginning of the financial yeari) Principal Amountii) Interest due but not paidiii) Interest accrued but not due
1,407- -
56,621 -
130
- - -
58,028 -
130 Total (i+ii+iii) 1,407 56,751 - 58,158 Change in Indebtedness during the financial year• Addition• Reduction
- 805
56,537 63,871
- -
56,537 64,676
ERF (Gain)/Loss for foreign currency loans (6) 1,396 - 1,390 Net Change (811) (5,938) - (6,749)Indebtedness at the end of the financial yeari) Principal Amountii) Interest due but not paidiii) Interest accrued but not due
596 - -
50,683 -
35
---
51,279 -
35
Total (i+ii+iii) 596 50,718 - 51,314
Note: Obligation under finance lease is secured by underlying fixed assets. These obligations are repayable in monthly, quarterly and yearly installments up to year ending March 31, 2021. The interest rate for these obligations ranges from 1.82% to 10.61%.

104 Wipro Limited
VI. REMUNERATION OF DIRECTORS AND KEY MANAGERIAL PERSONNEL
A. Remuneration to Managing Director, Whole-time Directors and/or Manager (` in Crores)
Sl.No.
Particulars of Remuneration Name of MD/WTD/ManagerAzim H Premji Abidali Z
Neemuchwala(1)(2)
Rishad A Premji(3)
1. Gross salary(a) Salary as per provisions contained in
section 17(1) of the Income-tax Act, 1961(b) Value of perquisites u/s 17(2) Income-tax
Act, 1961(c) Profits in lieu of salary under section 17(3)
Income-Tax Act, 1961
0.30
0.38
-
7.20
-
-
1.07
0.02
-
2. Stock Options - 13.92 -3. Sweat Equity - - -4. Commission
- as % of net profits- others
--
--
--
5. Others- Variable Pay 0.91 6.17 4.826 Allowances & Other Annual Compensation 0.13 - 0.617 Retirals 0.09 0.03 0.31
Total (A) 1.81 27.32 6.83Ceiling as per the Act ` 10,478 (being 10% of Net Profits of the Company as calculated
as under Section 198 of the Companies Act, 2013)(1) Figures mentioned in ` are equivalent of amounts paid in US$(2) Computation of remuneration to Chief Executive Officer and Executive Director is on an accrual basis and includes
amortisation of ADS Restricted Stock Units (RSUs) granted to him, which vests over a period a time. This also includes RSUs that vest based on performance parameters the Company.
(3) Computation of remuneration to Executive Director and Chief Strategy Officer includes cash based bonus (part of his variable pay) on an accrual basis, which is payable over a period of time.
B. Remuneration to Other Directors 2018-19: (` in Crores)
Sl.no.
Particulars of Remuneration Name of Directors
1. Independent Directors
• Fee for attending board committee meetings
• Commission
• Others, please specify
Refer Annexure CTotal (1)2. Other Non-Executive Directors
• Fee for attending board committee meetings
• Commission
• Others, please specifyTotal (2)Total (B)=(1+2) Total Managerial RemunerationOverall Ceiling as per the Act ` 104.78 (being 1% of Net Profits of the Company as
calculated as under Section 198 of the Companies Act, 2013).
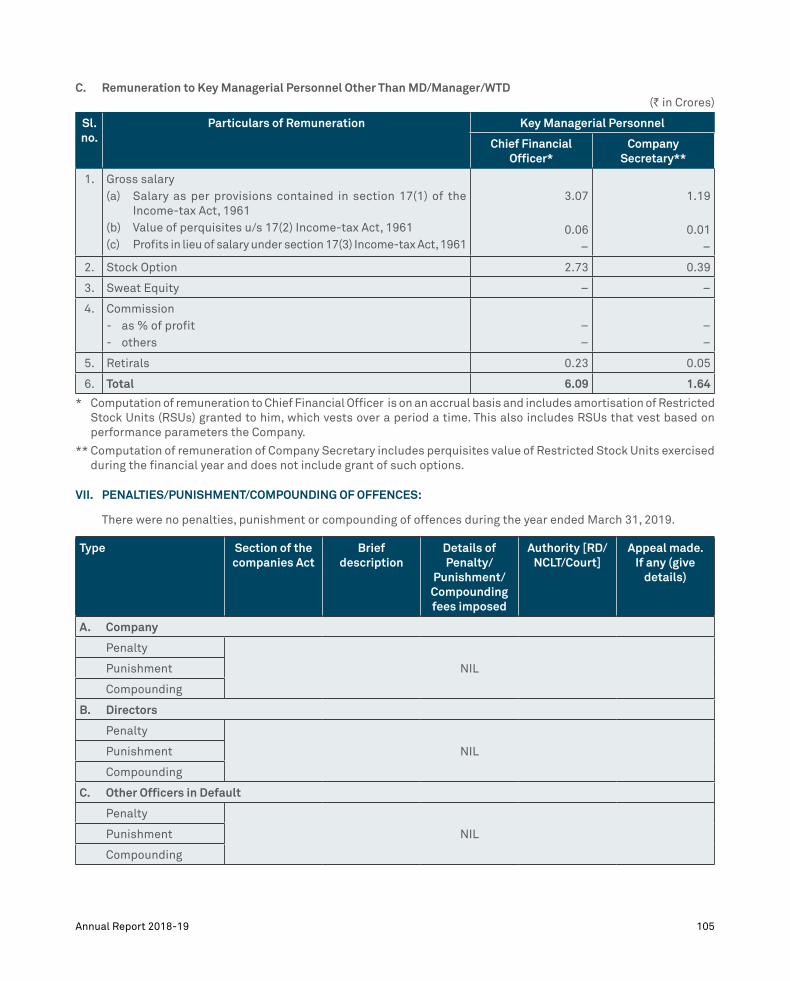
105Annual Report 2018-19
C. Remuneration to Key Managerial Personnel Other Than MD/Manager/WTD (` in Crores)
Sl. no.
Particulars of Remuneration Key Managerial Personnel
Chief Financial Officer*
Company Secretary**
1. Gross salary(a) Salary as per provisions contained in section 17(1) of the
Income-tax Act, 1961(b) Value of perquisites u/s 17(2) Income-tax Act, 1961(c) Profits in lieu of salary under section 17(3) Income-tax Act, 1961
3.07
0.06–
1.19
0.01–
2. Stock Option 2.73 0.39
3. Sweat Equity – –
4. Commission- as % of profit- others
––
––
5. Retirals 0.23 0.05
6. Total 6.09 1.64
* Computation of remuneration to Chief Financial Officer is on an accrual basis and includes amortisation of Restricted Stock Units (RSUs) granted to him, which vests over a period a time. This also includes RSUs that vest based on performance parameters the Company.
** Computation of remuneration of Company Secretary includes perquisites value of Restricted Stock Units exercised during the financial year and does not include grant of such options.
VII. PENALTIES/PUNISHMENT/COMPOUNDING OF OFFENCES:
There were no penalties, punishment or compounding of offences during the year ended March 31, 2019.
Type Section of the companies Act
Brief description
Details of Penalty/
Punishment/Compounding fees imposed
Authority [RD/NCLT/Court]
Appeal made. If any (give
details)
A. Company
Penalty
NIL Punishment
Compounding
B. Directors
Penalty
NIL Punishment
Compounding
C. Other Officers in Default
Penalty
NIL Punishment
Compounding
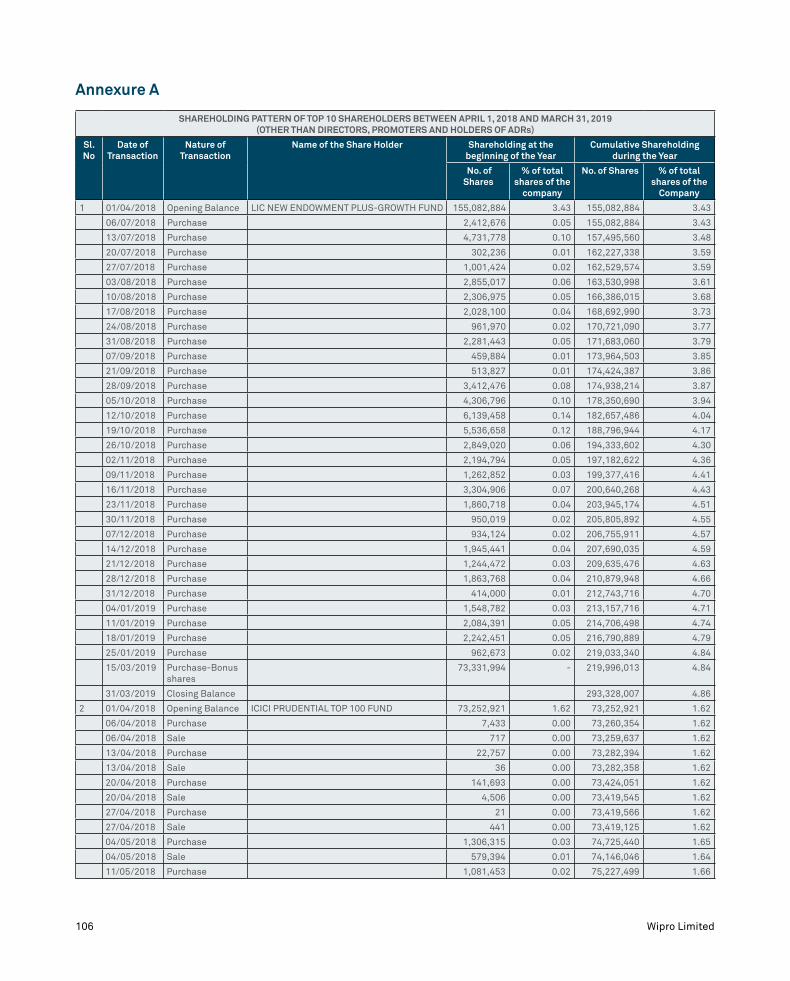
106 Wipro Limited
Annexure A
SHAREHOLDING PATTERN OF TOP 10 SHAREHOLDERS BETWEEN APRIL 1, 2018 AND MARCH 31, 2019 (OTHER THAN DIRECTORS, PROMOTERS AND HOLDERS OF ADRs)
Sl. No
Date of Transaction
Nature of Transaction
Name of the Share Holder Shareholding at the beginning of the Year
Cumulative Shareholding during the Year
No. of Shares
% of total shares of the
company
No. of Shares % of total shares of the
Company
1 01/04/2018 Opening Balance LIC NEW ENDOWMENT PLUS-GROWTH FUND 155,082,884 3.43 155,082,884 3.43
06/07/2018 Purchase 2,412,676 0.05 155,082,884 3.43
13/07/2018 Purchase 4,731,778 0.10 157,495,560 3.48
20/07/2018 Purchase 302,236 0.01 162,227,338 3.59
27/07/2018 Purchase 1,001,424 0.02 162,529,574 3.59
03/08/2018 Purchase 2,855,017 0.06 163,530,998 3.61
10/08/2018 Purchase 2,306,975 0.05 166,386,015 3.68
17/08/2018 Purchase 2,028,100 0.04 168,692,990 3.73
24/08/2018 Purchase 961,970 0.02 170,721,090 3.77
31/08/2018 Purchase 2,281,443 0.05 171,683,060 3.79
07/09/2018 Purchase 459,884 0.01 173,964,503 3.85
21/09/2018 Purchase 513,827 0.01 174,424,387 3.86
28/09/2018 Purchase 3,412,476 0.08 174,938,214 3.87
05/10/2018 Purchase 4,306,796 0.10 178,350,690 3.94
12/10/2018 Purchase 6,139,458 0.14 182,657,486 4.04
19/10/2018 Purchase 5,536,658 0.12 188,796,944 4.17
26/10/2018 Purchase 2,849,020 0.06 194,333,602 4.30
02/11/2018 Purchase 2,194,794 0.05 197,182,622 4.36
09/11/2018 Purchase 1,262,852 0.03 199,377,416 4.41
16/11/2018 Purchase 3,304,906 0.07 200,640,268 4.43
23/11/2018 Purchase 1,860,718 0.04 203,945,174 4.51
30/11/2018 Purchase 950,019 0.02 205,805,892 4.55
07/12/2018 Purchase 934,124 0.02 206,755,911 4.57
14/12/2018 Purchase 1,945,441 0.04 207,690,035 4.59
21/12/2018 Purchase 1,244,472 0.03 209,635,476 4.63
28/12/2018 Purchase 1,863,768 0.04 210,879,948 4.66
31/12/2018 Purchase 414,000 0.01 212,743,716 4.70
04/01/2019 Purchase 1,548,782 0.03 213,157,716 4.71
11/01/2019 Purchase 2,084,391 0.05 214,706,498 4.74
18/01/2019 Purchase 2,242,451 0.05 216,790,889 4.79
25/01/2019 Purchase 962,673 0.02 219,033,340 4.84
15/03/2019 Purchase-Bonus shares
73,331,994 - 219,996,013 4.84
31/03/2019 Closing Balance 293,328,007 4.86
2 01/04/2018 Opening Balance ICICI PRUDENTIAL TOP 100 FUND 73,252,921 1.62 73,252,921 1.62
06/04/2018 Purchase 7,433 0.00 73,260,354 1.62
06/04/2018 Sale 717 0.00 73,259,637 1.62
13/04/2018 Purchase 22,757 0.00 73,282,394 1.62
13/04/2018 Sale 36 0.00 73,282,358 1.62
20/04/2018 Purchase 141,693 0.00 73,424,051 1.62
20/04/2018 Sale 4,506 0.00 73,419,545 1.62
27/04/2018 Purchase 21 0.00 73,419,566 1.62
27/04/2018 Sale 441 0.00 73,419,125 1.62
04/05/2018 Purchase 1,306,315 0.03 74,725,440 1.65
04/05/2018 Sale 579,394 0.01 74,146,046 1.64
11/05/2018 Purchase 1,081,453 0.02 75,227,499 1.66

107Annual Report 2018-19
SHAREHOLDING PATTERN OF TOP 10 SHAREHOLDERS BETWEEN APRIL 1, 2018 AND MARCH 31, 2019 (OTHER THAN DIRECTORS, PROMOTERS AND HOLDERS OF ADRs)
Sl. No
Date of Transaction
Nature of Transaction
Name of the Share Holder Shareholding at the beginning of the Year
Cumulative Shareholding during the Year
No. of Shares
% of total shares of the
company
No. of Shares % of total shares of the
Company
18/05/2018 Purchase 2,098 0.00 75,229,597 1.66
18/05/2018 Sale 323 0.00 75,229,274 1.66
25/05/2018 Purchase 388 0.00 75,229,662 1.66
25/05/2018 Sale 617 0.00 75,229,045 1.66
01/06/2018 Purchase 1,786,169 0.04 77,015,214 1.70
01/06/2018 Sale 1,054 0.00 77,014,160 1.70
08/06/2018 Purchase 504,678 0.01 77,518,838 1.71
15/06/2018 Purchase 741,713 0.02 78,260,551 1.73
15/06/2018 Sale 23,544 0.00 78,237,007 1.73
22/06/2018 Purchase 3,164,410 0.07 81,401,417 1.80
22/06/2018 Sale 147 0.00 81,401,270 1.80
29/06/2018 Purchase 4,901,700 0.11 86,302,970 1.91
29/06/2018 Sale 327,900 0.01 85,975,070 1.90
06/07/2018 Purchase 2,514,354 0.06 88,489,424 1.96
06/07/2018 Sale 7,181 0.00 88,482,243 1.96
13/07/2018 Purchase 2,338 0.00 88,484,581 1.96
13/07/2018 Sale 67 0.00 88,484,514 1.96
20/07/2018 Purchase 874,691 0.02 89,359,205 1.98
20/07/2018 Sale 1,615,172 0.04 87,744,033 1.94
27/07/2018 Purchase 723 0.00 87,744,756 1.94
27/07/2018 Sale 463,815 0.01 87,280,941 1.93
03/08/2018 Purchase 12,642 0.00 87,293,583 1.93
03/08/2018 Sale 740 0.00 87,292,843 1.93
10/08/2018 Purchase 574 0.00 87,293,417 1.93
10/08/2018 Sale 5,848 0.00 87,287,569 1.93
17/08/2018 Purchase 529 0.00 87,288,098 1.93
17/08/2018 Sale 34,911 0.00 87,253,187 1.93
24/08/2018 Purchase 60,078 0.00 87,313,265 1.93
24/08/2018 Sale 248,568 0.01 87,064,697 1.92
31/08/2018 Purchase 1,373 0.00 87,066,070 1.92
31/08/2018 Sale 1,401,540 0.03 85,664,530 1.89
07/09/2018 Purchase 1,466 0.00 85,665,996 1.89
07/09/2018 Sale 6,987,734 0.15 78,678,262 1.74
14/09/2018 Purchase 1,140,029 0.03 79,818,291 1.76
14/09/2018 Sale 4,392,312 0.10 75,425,979 1.67
21/09/2018 Purchase 8,155 0.00 75,434,134 1.67
21/09/2018 Sale 1,532,859 0.03 73,901,275 1.63
28/09/2018 Purchase 859 0.00 73,902,134 1.63
28/09/2018 Sale 13,561,243 0.30 60,340,891 1.33
05/10/2018 Purchase 1,977 0.00 60,342,868 1.33
05/10/2018 Sale 3,788,432 0.08 56,554,436 1.25
12/10/2018 Purchase 827,951 0.02 57,382,387 1.27
12/10/2018 Sale 1,445,883 0.03 55,936,504 1.24
19/10/2018 Purchase 5,812 0.00 55,942,316 1.24
19/10/2018 Sale 2,890,659 0.06 53,051,657 1.17
26/10/2018 Purchase 190,170 0.00 53,241,827 1.18
26/10/2018 Sale 1,855,821 0.04 51,386,006 1.14
02/11/2018 Purchase 161,393 0.00 51,547,399 1.14

108 Wipro Limited
SHAREHOLDING PATTERN OF TOP 10 SHAREHOLDERS BETWEEN APRIL 1, 2018 AND MARCH 31, 2019 (OTHER THAN DIRECTORS, PROMOTERS AND HOLDERS OF ADRs)
Sl. No
Date of Transaction
Nature of Transaction
Name of the Share Holder Shareholding at the beginning of the Year
Cumulative Shareholding during the Year
No. of Shares
% of total shares of the
company
No. of Shares % of total shares of the
Company
02/11/2018 Sale 1,419,699 0.03 50,127,700 1.11
09/11/2018 Purchase 896 0.00 50,128,596 1.11
09/11/2018 Sale 340,997 0.01 49,787,599 1.10
16/11/2018 Purchase 1,703 0.00 49,789,302 1.10
16/11/2018 Sale 1,038,535 0.02 48,750,767 1.08
23/11/2018 Purchase 494,691 0.01 49,245,458 1.09
23/11/2018 Sale 1,160,165 0.03 48,085,293 1.06
30/11/2018 Purchase 1,636 0.00 48,086,929 1.06
30/11/2018 Sale 3,216,800 0.07 44,870,129 0.99
07/12/2018 Purchase 239,359 0.01 45,109,488 1.00
07/12/2018 Sale 2,739,953 0.06 42,369,535 0.94
14/12/2018 Purchase 4,414 0.00 42,373,949 0.94
14/12/2018 Sale 2,379,336 0.05 39,994,613 0.88
21/12/2018 Purchase 2,786 0.00 39,997,399 0.88
21/12/2018 Sale 796,200 0.02 39,201,199 0.87
28/12/2018 Sale 758,292 0.02 38,442,907 0.85
31/12/2018 Purchase 1,120 0.00 38,444,027 0.85
31/12/2018 Sale 657,327 0.01 37,786,700 0.84
04/01/2019 Purchase 3,100 0.00 37,789,800 0.84
04/01/2019 Sale 1,953,981 0.04 35,835,819 0.79
11/01/2019 Purchase 1,307 0.00 35,837,126 0.79
11/01/2019 Sale 1,077,608 0.02 34,759,518 0.77
18/01/2019 Purchase 1,993 0.00 34,761,511 0.77
18/01/2019 Sale 1,357,231 0.03 33,404,280 0.74
25/01/2019 Purchase 1,035 0.00 33,405,315 0.74
25/01/2019 Sale 455,922 0.01 32,949,393 0.73
01/02/2019 Purchase 1,331 0.00 32,950,724 0.73
01/02/2019 Sale 4,425,517 0.10 28,525,207 0.63
08/02/2019 Purchase 129,682 0.00 28,654,889 0.63
08/02/2019 Sale 516,004 0.01 28,138,885 0.62
15/02/2019 Purchase 3,136 0.00 28,142,021 0.62
15/02/2019 Sale 575,390 0.01 27,566,631 0.61
22/02/2019 Purchase 50,705 0.00 27,617,336 0.61
22/02/2019 Sale 183,774 0.00 27,433,562 0.61
01/03/2019 Purchase 1,771 0.00 27,435,333 0.61
01/03/2019 Sale 1,184,725 0.03 26,250,608 0.58
08/03/2019 Purchase 588 0.00 26,251,196 0.58
08/03/2019 Sale 1,516,082 0.03 24,735,114 0.55
15/03/2019 Purchase-Bonus shares
8,289,334 - 33,024,448 0.55
22/03/2019 Purchase 63,180 0.00 33,087,628 0.55
22/03/2019 Sale 114,214 0.00 32,973,414 0.55
29/03/2019 Purchase 366,818 0.01 33,340,232 0.55
29/03/2019 Sale 1,431,709 0.02 31,908,523 0.53
31/03/2019 Closing Balance 31,908,523 0.53
3 01/04/2018 Opening Balance ABDULREHMAN HAJI EBRAHIM COCHINWALA 37,242,180 0.82 37,242,180 0.82
25/01/2019 Purchase 37,242,180 0.82 74,484,360 1.65
25/01/2019 Sale 37,242,180 0.82 37,242,180 0.82

109Annual Report 2018-19
SHAREHOLDING PATTERN OF TOP 10 SHAREHOLDERS BETWEEN APRIL 1, 2018 AND MARCH 31, 2019 (OTHER THAN DIRECTORS, PROMOTERS AND HOLDERS OF ADRs)
Sl. No
Date of Transaction
Nature of Transaction
Name of the Share Holder Shareholding at the beginning of the Year
Cumulative Shareholding during the Year
No. of Shares
% of total shares of the
company
No. of Shares % of total shares of the
Company
01/03/2019 Sale 2,798,544 0.06 34,443,636 0.76
15/03/2019 Purchase-Bonus Shares
11,481,212 - 45,924,848 0.76
31/03/2019 Closing Balance 45,924,848 0.76
4 01/04/2018 Opening Balance ALCO COMPANY PRIVATE LIMITED 31,400,000 0.69 31,400,000 0.69
15/03/2019 Purchase-Bonus Shares
10,466,666 - 41,866,666 0.69
31/03/2019 Closing Balance 41,866,666 0.69
5 01/04/2018 Opening Balance WIPRO EQUITY REWARD TRUST 23,097,216 0.51 23,097,216 0.51
01/04/2018 to 14/03/2019
Transfer of shares pursuant to exercise of vested stock options
2,529,756 0.06 20,567,460 0.45
15/03/2019 Purchase-Bonus shares
6,855,820 - 27,423,280 0.45
16/03/2019to31/03/2019
Transfer of shares pursuant to exercise of vested stock options
69,427 0.00 27,353,853 0.45
31/03/2019 Closing Balance 27,353,853 0.45
6 01/04/2018 Opening Balance GOVERNMENT PENSION FUND GLOBAL 21,581,595 0.48 21,581,595 0.48
22/06/2018 Purchase 628,784 0.01 22,210,379 0.49
29/06/2018 Sale 498,666 0.01 21,711,713 0.48
06/07/2018 Purchase 291,745 0.01 22,003,458 0.49
13/07/2018 Purchase 291,719 0.01 22,295,177 0.49
20/07/2018 Purchase 352,555 0.01 22,647,732 0.50
27/07/2018 Purchase 306,383 0.01 22,954,115 0.51
03/08/2018 Purchase 117,171 0.00 23,071,286 0.51
14/12/2018 Sale 1,266,208 0.03 21,805,078 0.48
25/01/2019 Purchase 635,107 0.01 22,440,185 0.50
01/02/2019 Sale 1,090,240 0.02 21,349,945 0.47
08/02/2019 Sale 749,170 0.02 20,600,775 0.46
15/02/2019 Sale 755,250 0.02 19,845,525 0.44
15/03/2019 Purchase-Bonus shares
8,146,255 - 27,991,780 0.44
22/03/2019 Purchase 612,252 0.01 28,604,032 0.47
31/03/2019 Closing Balance 28,604,032 0.47
7 01/04/2018 Opening Balance SBI - ETF SENSEX 12,264,855 0.27 12,264,855 0.27
06/04/2018 Purchase 80,786 0.00 12,345,641 0.27
06/04/2018 Sale 6,017 0.00 12,339,624 0.27
13/04/2018 Purchase 14,116 0.00 12,353,740 0.27
13/04/2018 Sale 65,152 0.00 12,288,588 0.27
20/04/2018 Purchase 96,833 0.00 12,385,421 0.27
27/04/2018 Purchase 122,714 0.00 12,508,135 0.28
04/05/2018 Purchase 347,713 0.01 12,855,848 0.28
11/05/2018 Purchase 147,024 0.00 13,002,872 0.29
18/05/2018 Purchase 121,239 0.00 13,124,111 0.29
25/05/2018 Purchase 80,565 0.00 13,204,676 0.29
01/06/2018 Purchase 136,363 0.00 13,341,039 0.29

110 Wipro Limited
SHAREHOLDING PATTERN OF TOP 10 SHAREHOLDERS BETWEEN APRIL 1, 2018 AND MARCH 31, 2019 (OTHER THAN DIRECTORS, PROMOTERS AND HOLDERS OF ADRs)
Sl. No
Date of Transaction
Nature of Transaction
Name of the Share Holder Shareholding at the beginning of the Year
Cumulative Shareholding during the Year
No. of Shares
% of total shares of the
company
No. of Shares % of total shares of the
Company
08/06/2018 Purchase 254,723 0.01 13,595,762 0.30
15/06/2018 Purchase 75,392 0.00 13,671,154 0.30
22/06/2018 Purchase 57,171 0.00 13,728,325 0.30
22/06/2018 Sale 6 0.00 13,728,319 0.30
29/06/2018 Purchase 64,147 0.00 13,792,466 0.30
29/06/2018 Sale 11,214 0.00 13,781,252 0.30
06/07/2018 Purchase 122,126 0.00 13,903,378 0.31
13/07/2018 Purchase 131,215 0.00 14,034,593 0.31
13/07/2018 Sale 1,349 0.00 14,033,244 0.31
20/07/2018 Purchase 398,861 0.01 14,432,105 0.32
27/07/2018 Purchase 77,080 0.00 14,509,185 0.32
27/07/2018 Sale 153 0.00 14,509,032 0.32
03/08/2018 Purchase 55,222 0.00 14,564,254 0.32
03/08/2018 Sale 1,874 0.00 14,562,380 0.32
10/08/2018 Purchase 106,000 0.00 14,668,380 0.32
10/08/2018 Sale 2 0.00 14,668,378 0.32
17/08/2018 Purchase 37,448 0.00 14,705,826 0.33
24/08/2018 Purchase 1,031,671 0.02 15,737,497 0.35
31/08/2018 Purchase 1,556,136 0.03 17,293,633 0.38
31/08/2018 Sale 1,068 0.00 17,292,565 0.38
07/09/2018 Purchase 150,170 0.00 17,442,735 0.39
07/09/2018 Sale 118 0.00 17,442,617 0.39
14/09/2018 Purchase 135,522 0.00 17,578,139 0.39
14/09/2018 Sale 3,179 0.00 17,574,960 0.39
21/09/2018 Purchase 111,763 0.00 17,686,723 0.39
21/09/2018 Sale 1,150,000 0.03 16,536,723 0.37
28/09/2018 Purchase 2,635 0.00 16,539,358 0.37
28/09/2018 Sale 178,506 0.00 16,360,852 0.36
05/10/2018 Purchase 104,207 0.00 16,465,059 0.36
12/10/2018 Purchase 127,443 0.00 16,592,502 0.37
19/10/2018 Purchase 58,256 0.00 16,650,758 0.37
26/10/2018 Purchase 110,403 0.00 16,761,161 0.37
02/11/2018 Purchase 284,244 0.01 17,045,405 0.38
02/11/2018 Sale 2 0.00 17,045,403 0.38
09/11/2018 Purchase 72,093 0.00 17,117,496 0.38
16/11/2018 Purchase 118,836 0.00 17,236,332 0.38
16/11/2018 Sale 989 0.00 17,235,343 0.38
23/11/2018 Purchase 68,632 0.00 17,303,975 0.38
30/11/2018 Purchase 53,861 0.00 17,357,836 0.38
07/12/2018 Purchase 6,439 0.00 17,364,275 0.38
07/12/2018 Sale 16,505 0.00 17,347,770 0.38
14/12/2018 Purchase 19,883 0.00 17,367,653 0.38
14/12/2018 Sale 88,579 0.00 17,279,074 0.38
21/12/2018 Purchase 80,372 0.00 17,359,446 0.38
28/12/2018 Purchase 943,850 0.02 18,303,296 0.40
28/12/2018 Sale 4,203,849 0.09 14,099,447 0.31
31/12/2018 Purchase 131 0.00 14,099,578 0.31
31/12/2018 Sale 414 0.00 14,099,164 0.31

111Annual Report 2018-19
SHAREHOLDING PATTERN OF TOP 10 SHAREHOLDERS BETWEEN APRIL 1, 2018 AND MARCH 31, 2019 (OTHER THAN DIRECTORS, PROMOTERS AND HOLDERS OF ADRs)
Sl. No
Date of Transaction
Nature of Transaction
Name of the Share Holder Shareholding at the beginning of the Year
Cumulative Shareholding during the Year
No. of Shares
% of total shares of the
company
No. of Shares % of total shares of the
Company
04/01/2019 Purchase 132,709 0.00 14,231,873 0.31
11/01/2019 Purchase 130,201 0.00 14,362,074 0.32
18/01/2019 Purchase 104,199 0.00 14,466,273 0.32
18/01/2019 Sale 168,383 0.00 14,297,890 0.32
25/01/2019 Purchase 114,210 0.00 14,412,100 0.32
25/01/2019 Sale 144 0.00 14,411,956 0.32
01/02/2019 Purchase 123,639 0.00 14,535,595 0.32
08/02/2019 Purchase 124,257 0.00 14,659,852 0.32
15/02/2019 Purchase 66,759 0.00 14,726,611 0.33
15/02/2019 Sale 291 0.00 14,726,320 0.33
22/02/2019 Purchase 72,532 0.00 14,798,852 0.33
01/03/2019 Purchase 150,547 0.00 14,949,399 0.33
08/03/2019 Purchase 123,685 0.00 15,073,084 0.33
08/03/2019 Sale 277,949 -0.01 14,795,135 0.33
15/03/2019 Purchase-Bonus shares
4,991,221 - 19,786,356 0.33
15/03/2019 Sale 124,233 0.00 19,662,123 0.33
22/03/2019 Purchase 250,439 0.00 19,912,562 0.33
22/03/2019 Sale 38,724 0.00 19,873,838 0.33
29/03/2019 Purchase 118,654 0.00 19,992,492 0.33
29/03/2019 Sale 41,762 0.00 19,950,730 0.33
31/03/2019 Closing Balance 19,950,730 0.33
8 01/04/2018 Opening Balance FIRST STATE INVESTMENTS ICVC- STEWART INVESTORS AS
18,519,204 0.41 18,519,204 0.41
27/04/2018 Sale 5,012,178 0.11 13,507,026 0.30
25/05/2018 Sale 4,723,833 0.10 8,783,193 0.19
01/06/2018 Sale 741,234 0.02 8,041,959 0.18
08/06/2018 Sale 569,303 0.01 7,472,656 0.17
15/06/2018 Sale 2,710,538 0.06 4,762,118 0.11
22/06/2018 Sale 1,873,028 0.04 2,889,090 0.06
06/07/2018 Sale 1,085,421 0.02 1,803,669 0.04
13/07/2018 Sale 1,803,669 0.04 - 0.00
31/03/2019 Closing Balance - -
9 01/04/2018 Opening Balance CHANDRAKUWARBA K VANSIA 17,144,500 0.38 17,144,500 0.38
15/03/2019 Purchase-Bonus Shares
5,714,833 - 22,859,333 0.38
31/03/2019 Closing Balance 22,859,333 0.38
10 01/04/2018 Opening Balance GOVERNMENT OF SINGAPORE 10,147,461 0.22 10,147,461 0.22
06/04/2018 Purchase 12,776 0.00 10,160,237 0.22
20/04/2018 Sale 146,415 0.00 10,013,822 0.22
27/04/2018 Sale 7,129 0.00 10,006,693 0.22
04/05/2018 Purchase 194,554 0.00 10,201,247 0.23
11/05/2018 Purchase 16,798 0.00 10,218,045 0.23
18/05/2018 Sale 327,448 0.01 9,890,597 0.22
25/05/2018 Sale 386,334 0.01 9,504,263 0.21
01/06/2018 Purchase 325,506 0.01 9,829,769 0.22
08/06/2018 Purchase 626,433 0.01 10,456,202 0.23
15/06/2018 Purchase 473,447 0.01 10,929,649 0.24
22/06/2018 Purchase 108,572 0.00 11,038,221 0.24

112 Wipro Limited
SHAREHOLDING PATTERN OF TOP 10 SHAREHOLDERS BETWEEN APRIL 1, 2018 AND MARCH 31, 2019 (OTHER THAN DIRECTORS, PROMOTERS AND HOLDERS OF ADRs)
Sl. No
Date of Transaction
Nature of Transaction
Name of the Share Holder Shareholding at the beginning of the Year
Cumulative Shareholding during the Year
No. of Shares
% of total shares of the
company
No. of Shares % of total shares of the
Company
13/07/2018 Sale 30,876 0.00 11,007,345 0.24
20/07/2018 Purchase 125,222 0.00 11,132,567 0.25
27/07/2018 Sale 9,073 0.00 11,123,494 0.25
03/08/2018 Sale 11,465 0.00 11,112,029 0.25
10/08/2018 Sale 123,023 0.00 10,989,006 0.24
24/08/2018 Purchase 287,935 0.01 11,276,941 0.25
31/08/2018 Purchase 663,066 0.01 11,940,007 0.26
07/09/2018 Purchase 778,751 0.02 12,718,758 0.28
14/09/2018 Purchase 2,797,251 0.06 15,516,009 0.34
21/09/2018 Purchase 669,212 0.01 16,185,221 0.36
12/10/2018 Sale 410,456 0.01 15,774,765 0.35
19/10/2018 Purchase 59,341 0.00 15,834,106 0.35
26/10/2018 Sale 1,049,046 0.02 14,785,060 0.33
02/11/2018 Sale 145,946 0.00 14,639,114 0.32
09/11/2018 Sale 468,701 0.01 14,170,413 0.31
16/11/2018 Sale 18,739 0.00 14,151,674 0.31
23/11/2018 Sale 108,639 0.00 14,043,035 0.31
30/11/2018 Purchase 418,844 0.01 14,461,879 0.32
07/12/2018 Sale 247,372 0.01 14,214,507 0.31
14/12/2018 Sale 868 0.00 14,213,639 0.31
21/12/2018 Purchase 124,648 0.00 14,338,287 0.32
28/12/2018 Sale 394,363 0.01 13,943,924 0.31
04/01/2019 Purchase 113,576 0.00 14,057,500 0.31
11/01/2019 Sale 223,759 0.00 13,833,741 0.31
25/01/2019 Sale 279,241 0.01 13,554,500 0.30
01/02/2019 Sale 333,946 0.01 13,220,554 0.29
08/02/2019 Purchase 349,442 0.01 13,569,996 0.30
15/02/2019 Sale 7,370 0.00 13,562,626 0.30
01/03/2019 Sale 652,979 0.01 12,909,647 0.29
08/03/2019 Sale 403,540 0.01 12,506,107 0.28
15/03/2019 Purchase-Bonus Shares
3,847,113 - 16,353,220 0.28
22/03/2019 Purchase 146,877 0.00 16,500,097 0.27
29/03/2019 Sale 418,270 0.01 16,081,827 0.27
31/03/2019 Closing Balance 16,081,827 0.27

113Annual Report 2018-19
Annexure BShareholding of Directors and Key Managerial Personnel
Name Shareholding at the beginning of the year
April 01, 2018
Cumulative Shareholding of the year (2018-19)
No. of Shares % of total shares of the Company (1)
No. of Shares % of total shares of the
Company
Azim Premji@
Executive Chairman & Managing Director
Opening Balance - 01/04/ 2018 190,838,864 4.22 - -
Purchase-Bonus Allotment – 08/03/2019 63,612,952 - 254,451,816 4.22
Closing Balance 31/03/2019 - - 254,451,816 4.22
Rishad A Premji#
Executive Director and Chief Strategy Officer
Opening Balance - 01/04/ 2018 1,373,332 0.03 - -
Purchase-Bonus Allotment- 08/03/2019 457,777 - 1,831,109 0.03
Closing Balance 31/03/2019 - - 1,831,109 0.03
Ashok S Ganguly
Independent Director Opening Balance - 01/04/ 2018 3,734 0.00 - -
Purchase-Bonus Allotment- 08/03/2019 1,244 - 4,978 0.00
Closing Balance 31/03/2019 - - 4,978 0.00
N Vaghul
Independent Director Opening Balance - 01/04/ 2018 - - - -
Purchase/ Sales - - - -
Closing Balance 31/03/2019 - - - -
William A Owens
Independent Director Opening Balance - 01/04/ 2018 - - - -
Purchase/ Sales - - - -
Closing Balance 31/03/2019 - - - -
Abidali Z Neemuchwala* Opening Balance - 01/04/ 2018 160,000 0.00 - -
Chief Executive Officer and Executive Director
Purchase - 19/12/2018 (Exercise of RSU)
160,000 0.00 320,000 0.01
Purchase-Bonus Allotment- 08/03/2019 106,666 - 426,666 0.01
Closing Balance 31/03/2019 - - 426,666 0.01
M K Sharma
Independent Director Opening Balance - 01/04/ 2018 - - - -
Purchase/ Sales - - - -
Closing Balance 31/03/2019 - - - -
Ireena Vittal - -
Independent Director Opening Balance - 01/04/ 2018 - - - -
Purchase/ Sales - - - -
Closing Balance 31/03/2019 - -
Patrick J Ennis - -
Independent Director Opening Balance - 01/04/ 2018 - - - -
Purchase/ Sales - - - -
Closing Balance 31/03/2019 - - - -

114 Wipro Limited
Name Shareholding at the beginning of the year
April 01, 2018
Cumulative Shareholding of the year (2018-19)
No. of Shares % of total shares of the Company (1)
No. of Shares % of total shares of the
Company
Patrick A Dupuis - -
Independent Director Opening Balance - 01/04/ 2018 - - - -
Purchase/ Sales - - - -
Closing Balance 31/03/2019 - - - -
Arundhati Bhattacharya
Independent Director Opening Balance - 01/04/ 2018 - - - -
Purchase/ Sales - - - -
Closing Balance 31/03/2019 - - - -
Jatin Pravinchandra Dalal $
Chief Financial Officer Opening Balance- 1/04/2018 6,676 0.00 - -
Purchase- 25/05/2018 – (Exercise of RSU) 11,212 0.00 17,888 0.00
Purchase-Bonus Allotment- 8/03/2019 5,962 - 23,850 0.00
Closing Balance- 31/03/2019 23,850 0.00
M Sanaulla Khan
Company Secretary Opening Balance - 01/04/ 2018 - - - -
Purchase- 11/01/2019 (Exercise of RSU) 12,000 0.00 12,000 0.00
Purchase- Bonus Allotment- 8/03/2019 4,000 0.00 16,000 0.00
Closing Balance 31/03/2019 - - 16,000 0.00
@ Includes shares held jointly by Mr. Azim H Premji and members of his immediate family.# Shares are held jointly with a member of his immediate family.
* Represents ADSs having equivalent underlying equity shares.$ Includes shares held jointly by Mr. Jatin Pravinchandra Dalal and a member of his immediate family.(1) The issue of bonus equity shares was in the ratio of 1:3 to all shareholders. Consequently, there was no change in the percentage
shareholding post issue of bonus equity shares.
Annexure C
Remuneration to other Directors 2018-19: (` in Crores)^
Particulars ofRemuneration
Name of Independent Directors
Independent Directors Mr. N Vaghul
Dr. Ashok Ganguly
Mr. M K Sharma
Mr. William A
Owens*
Mrs. Ireena Vittal
Mr. Patrick Dupuis*
Dr. Patrick J
Ennis*
Mrs. Arundhati Bhattacharya#
Fee for attending board and committee meetings
0.05 0.03 0.05 0.04 0.04 0.04 0.04 0.01
Commission 0.87 0.68 0.68 2.30 0.69 1.81 1.81 0.02Others, please specify - - - - - - - -TOTAL 0.92 0.71 0.73 2.34 0.73 1.85 1.85 0.21
^ Figures rounded-off to two decimals
* Figure mentioned are rupee equivalent of amount paid in USD# Mrs. Arundhati Bhattacharya was appointed as Independent Director with effect from January 1, 2019. Apart from Independent Directors as detailed above, the Company does not have any other Non-Executive Directors.

Annual Report 2018-19 115
Be passionate about clients’ success
Treat each person with respect
Be globaland responsible
Unyielding integrity in everything we do
I. Wipro’s Philosophy on Corporate Governance
Wipro’s governance framework is driven by the objective of enhancing long term stakeholder value without compromising on ethical standards and corporate social responsibilities. Efficient corporate governance requires a clear understanding of the respective roles of the Board of Directors (“Board”) and of senior management and their relationships with others in the corporate structure. Sincerity, fairness, good citizenship and commitment to compliance are key characteristics that drive relationships of the Board and senior management with other stakeholders.
Corporate governance philosophy of Wipro flows from the “Spirit of Wipro” which represents core values by which policies and practices of the organization are guided. The values encapsulated in the “Spirit of Wipro” are:
Corporate governance at Wipro is implemented through robust board governance processes, internal control systems and processes, and strong audit mechanisms. These are articulated through the Company’s Code of Business Conduct, Corporate Governance Guidelines and charters of various sub- committees of the Board and Company’s Disclosure Policy. Wipro’s corporate governance practices can be described through the following four layers:
a. Governance by Shareholders
b. Governance by Board
c. Governance by Sub-committees of Board, and
d. Governance through management process
In this report, we have provided details on how the corporate governance principles are put in to practice within Wipro.
II. Shareholders
The Companies Act, 2013, Securities and Exchange Board of India (Listing Obligations and Disclosure Requirements) Regulations, 2015 as amended, (“Listing Regulations”), and New York Stock Exchange (NYSE) Listed Company Manual prescribes the governance mechanism by shareholders in terms of passing of ordinary and special resolutions, voting rights, participation in the corporate actions such as bonus, buyback of shares, declaration of dividend, etc. Your Company follows a robust process to ensure that the shareholders of the Company are well informed of Board decisions both on financial and non-financial parameters. Adequate notice with a detailed explanation is sent to the shareholders well in advance to obtain necessary approvals.
III. Board of Directors
Composition of Board
As at March 31, 2019, our Board had eight Non-Executive Directors and three Executive Directors. Out of the three Executive Directors, the Executive Chairman and Managing Director and Executive Director and Chief Strategy Officer are Promoter Directors. The Chief Executive Officer (CEO) and Executive Director is a professional CEO who is responsible for the day to day operations of the Company. All the eight Non-Executive Directors are Independent Directors, free from any business or other relationship that could materially influence their judgment. In the opinion of the Board, all the Independent Directors satisfy the criteria of
Corporate Governance Report

116 Wipro Limited
independence as defined under the Companies Act, 2013, the Listing Regulations and the NYSE Listed Company manual.
The Board is well diversified and consists of two Women Independent Directors and three Directors who are foreign nationals. The profiles of our Directors are available on our website at https://www.wipro.com/leadership.
Board Meetings
We decide about the Board meeting dates in consultation with Board Governance, Nomination and Compensation Committee and all our Directors. Once approved by the Board Governance, Nomination and Compensation Committee, the schedule of the Board meetings and Board Committee meetings is communicated in advance to the Directors to enable them to attend the meetings. Our Board meetings are normally scheduled over two days. In addition, every quarter, Independent Directors meet amongst themselves exclusively and provide a feedback to the management team.
The Board met five times during the financial year 2018-19 on April 24-25, 2018, June 8, 2018, July 19-20, 2018, October 23-24, 2018 and January 17-18, 2019. The necessary quorum was present for all the meetings. The maximum interval between any two meetings did not exceed 120 days. In line with Paragraph 4 of Schedule B of Securities and Exchange Board of India (Prohibition of Insider Trading) Regulations, 2015, it is the endeavor of the Company that the gap between the clearance of accounts by audit committee and board meeting is as narrow as possible.
Details of attendance of Directors at the Board Meetings during the year 2018-19 is provided below:
Name Designation Number of Board Meetings attended
Mr. Azim H Premji Executive Chairman and Managing Director
5
Mr. Abidali Z Neemuchwala
Chief Executive Officer and Executive Director
4(1)
Mr. Rishad A Premji
Executive Director and Chief Strategy Officer
5
Mr. N Vaghul Independent Director 5Mr. M K Sharma Independent Director 5Mrs. Ireena Vittal Independent Director 4(1)
Dr. Ashok S Ganguly
Independent Director 3(1)(2)
Mr. William Arthur Owens
Independent Director 4(1)
Dr. Patrick J Ennis Independent Director 4(1)
Name Designation Number of Board Meetings attended
Mr. Patrick Dupuis Independent Director 4(1)
Mrs. Arundhati Bhattacharya
Independent Director 1(3)
(1) Mrs. Ireena Vittal, Dr. Ashok S Ganguly, Mr. Abidali Z Neemuchwala, Mr. William Arthur Owens, Mr. Patrick Dupuis and Dr. Patrick J Ennis did not attend the Board Meeting held on June 8, 2018.
(2) Dr. Ashok S Ganguly did not attend the Board Meeting held over October 23-24, 2018.
(3) Mrs. Arundhati Bhattacharya was appointed to the Board with effect from January 1, 2019. She attended the Board meeting held on January 18, 2019 which was the only meeting conducted after her appointment till March 31, 2019.
Information Flow to the Board Members
Information is provided to the Board Members on a continuous basis for their review, inputs and approval from time to time. More specifically, we present annual Strategic Plan and Operating Plans of our business to the Board for their review, inputs and approval. Likewise, our quarterly financial statements and annual financial statements are first presented to the Audit Committee and subsequently to the Board for their approval. In addition, specific cases of acquisitions, important managerial decisions, material positive/negative developments and statutory matters are presented to the respective Committees of the Board and later with the recommendation of Committees to the Board for their approval.
As a system, in most cases, information to Directors is submitted along with the agenda papers well in advance of the Board meeting. Inputs and feedback of Board Members are taken and considered while preparation of agenda and documents for the Board meeting.
Documents containing unpublished price sensitive information are submitted to the Board and Committee Members, at a shorter notice, as per the general consent taken from the Board, from time to time.
Post-Meeting Follow-up System
After the Board meeting, we have formal system of follow up, review and reporting on actions taken by the management on the decisions of the Board and sub-committees of the Board.
Appointment of Directors
As per the provisions of the Companies Act, 2013, the Independent Directors shall be appointed for not more than two terms of maximum of five years each and shall not be liable to retire by rotation.

Annual Report 2018-19 117
Your Board has adopted the provisions with respect to appointment and tenure of Independent Directors consistent with the Companies Act, 2013 and the Listing Regulations.
At the time of appointment of an Independent Director, the Company issues a formal letter of appointment outlining his/her role, function, duties and responsibilities as a Director. The template of the letter of appointment is available on our website at https://www.wipro.com/corporate-governance.
Details of Directors proposed for appointment and re-appointment at the ensuing Annual General Meeting is provided at page 69 of the Board’s Report and in Annexure A to the notice convening the 73rd Annual General Meeting (AGM).
Lead Independent Director
The Board has designated Mr. N Vaghul as the Lead Independent Director. The role of the Lead Independent Director is described in the Corporate Governance guidelines of your Company and is available on the Company’s website at https://www.wipro.com/corporate-governance.
Policy for Selection and Appointment of Directors and their Remuneration
Board Governance, Nomination and Compensation Committee has adopted a policy which, inter alia, deals with the manner of selection of Board and payment of their remuneration.
Criteria of Selection of Independent Directors and Key Skills, Expertise, and Core Competencies of the Board
The Board of the Company comprises of eminent personalities and leaders in their respective fields. These members bring in the required skills, competence and expertise to the Board. These Directors are nominated based on well-defined selection criteria. The Board Governance, Nomination and Compensation Committee considers, inter alia, key qualifications, skills, expertise and competencies, whilst recommending to the Board the candidature for appointment of an Independent Director.
In case of appointment of Independent Directors, the Board Governance, Nomination and Compensation Committee satisfies itself about the independence of the Directors vis-à-vis the Company to enable the Board to discharge its functions and duties effectively.
The Board Governance, Nomination and Compensation Committee ensures that the candidates identified for appointment as Directors are not disqualified for appointment under Section 164 and other applicable provisions of the Companies Act, 2013.
In case of re-appointment of Independent Directors, the Board takes into consideration the performance evaluation of the Independent Directors and their engagement level.
In the opinion of the Board and the Board Governance, Nomination and Compensation Committee, the following is a list of core skills/expertise/competencies required in the context of the Company’s business and which are available with the Board:
Wide management and leadership experience
Strong management and leadership experience including in areas of business development, strategic p l a n n i n g a n d m e r g e r s a n d acquisitions, ideally with major public companies with successful m u l t i n a t i o n a l o p e r a t i o n s i n t e c h n o l o g y, m a n u f a c t u r i n g , banking, investments and finance, international business, scientific research and development, senior level government experience and academic background.
Information Technology
Expertise or experience in information technology business, technology consulting and operations, emerging areas of technology such as digital, artificial intelligence, cloud and cyber security, intellectual property in information technology domain, and knowledge of technology trends.
Diversity Diversity of thought, experience, knowledge, perspective, gender and culture. Varied mix of strategic perspectives, and geographical focus with knowledge and understanding of key geographies.
Functional and managerial experience
Knowledge and skills in accounting and finance, business judgment, general management practices and processes, crisis response and management, industry knowledge, macro-economic perspectives, human resources, labour laws, international markets, sales and marketing, and risk management.
Personal values Personal characteristics matching the Company’s values, such as integrity, accountability, and high performance standards.
Corporate governance
Experience in developing and implementing good corporate governance practices, maintaining board and management accountability, managing stakeholders’ interests and Company’s responsibilities towards customers, employees, suppliers, regulatory bodies and the communities in which it operates.

118 Wipro Limited
Given below is a list of core skills, expertise and competencies of the individual Directors:
Name of Director Skills/Expertise/Competencies
Wide Management and Leadership
experience*
Information Technology
Diversity Functional and Managerial
Experience*
Personal Values
Corporate Governance
Mr. Azim H Premji
Mr. Abidali Z Neemuchwala
Mr. Rishad A Premji
Mr. N Vaghul -
Dr. Ashok S Ganguly -
Mr. William Arthur Owens
Mr. M K Sharma -
Mrs. Ireena Vittal
Dr. Patrick J Ennis
Mr. Patrick Dupuis
Mrs. Arundhati Bhattacharya
* These skills/competencies are broad-based, encompassing several areas of expertise/experience. Each Director may possess varied combinations of skills/experience within the described set of parameters, and it is not necessary that all Directors possess all skills/experience listed therein.
Familiarization Programme and Training for Independent Directors
The Company has an orientation process/familiarization programme for its Independent Directors that includes:
a. Briefing on their role, responsibilities, duties, and obligations as a member of the Board.
b. Nature of business and business model of the Company, Company’s strategic and operating plans.
c. Matters relating to Corporate Governance, Code of Business Conduct , Risk Management, Compliance Programs, Internal Audit, etc.
As a process when a new independent director is appointed on the Board of the Company, a familiarization programme as described above is conducted by the senior management team and whenever a new member is appointed to a Board Committee, information relevant to the functioning of the Committee and the role and responsibility of Committee members is informed. Each of our Independent Directors have attended such orientation process/familiarization programme when they were inducted into the Board and these programs are generally spread over two days.
As part of ongoing training, the Company schedules quarterly meetings of business heads and functional heads with the Independent Directors. During these meetings, comprehensive presentations are made on the various aspects such as business models,
new business strategies and initiatives by business leaders, risk minimization procedures, recent trends in technology, changes in domestic/overseas industry scenario, digital transformation, state of Global IT Services industry, and regulatory regime affecting the Company globally. These meetings also facilitate Independent Directors to provide their inputs and suggestions on various strategic and operational matters directly to the business and functional heads. The details of the familiarization programme are also available on the website of the Company at https://www.wipro.com/corporate-governance.
Some of our Board members also participated in our executive customer event WINNOVATE held on May 20-21, 2019 where topics of current relevance in the context of technology, leadership and business strategy were discussed. Discussions were also held on digital transformation, cybersecurity, emerging technologies, talent transformation, start-up culture, open innovation strategies, and more.
Board Evaluation
Details of methodology adopted for Board evaluation has been provided at page 70 of the Board’s Report.
Remuneration Policy and Criteria of Making Payments to Directors, Senior Management and Key Managerial Personnel
The Independent Directors are entitled to receive remuneration by way of sitting fees, reimbursement of expenses for participation in the Board/Committee meetings and commission as detailed hereunder:

Annual Report 2018-19 119
a. sitting fees for each meeting of the Board or Committee of the Board attended by him or her, of such sum as may be approved by the Board within the overall limits prescribed under the Companies Act, 2013.
b. commission on a quarterly basis, of such sum as may be approved by the Board and Members on the recommendation of the Board Governance, Nomination and Compensation Committee. The total commission payable to the Independent Directors shall not exceed 1% of the net profit of the Company during any financial year. The commission is payable on a pro-rata basis to those Directors who occupy office of Director for part of the year.
c. reimbursement of expenses for participation in Board/Committee meetings.
d. Independent Directors are not entitled to participate in the stock option schemes of the Company.
In determining the remuneration of Executive Directors, Senior Management Employees and Key Managerial Personnel, the Board Governance, Nomination and Compensation Committee and the Board shall ensure/consider the following:
a. the balance between fixed and variable pay reflecting short and long-term performance objectives, appropriate to the working of the Company and its goals.
b. the alignment of remuneration of Key Managerial Personnel and Directors with long-term interests of the Company.
c. Directors forming part of the Promoter and Promoter group shall not be entitled to receive stock options.
d. Company’s performance vis-à-vis the annual achievement, individuals’ performance vis-à-vis KRAs/KPIs, industry benchmark and current compensation trends in the market.
T h e B o a rd G o v e r n a n c e, N o m i n a t i o n a n d Compensation Committee recommends the remuneration payable to the Executive Directors, Senior Management and Key Managerial Personnel. The payment of remuneration to the Executive Directors is approved by the Board and Members. Prior approval of Members is also obtained in case of remuneration to Non-Executive Directors. During the financial year, there has been no change in the remuneration policy adopted by the Company.
Details of Remuneration to Directors
Details of remuneration paid to the Directors for the services rendered and stock options granted during the financial year 2018-19 are given below. No stock options were granted to any of the Independent Directors and Promoter Directors during the year 2018-19.
(Amount in INR)Azim H Premji Abidali Z
Neemuchwala^*Rishad A Premji**
N Vaghul Dr. Ashok S Ganguly
William Arthur Owens*
M K Sharma
Ireena Vittal
Patrick J Ennis*
Patrick Dupuis*
Arundhati Bhattacharya#
Relationship with directors
Father of Rishad A Premji
None Son of Azim H Premji
None None None None None None None None
Salary 3,000,000 72,032,808 10,666,656 - - - - - - - -
Allowances 1,310,184 - 6,069,369 - - - - - - - -
Commission/ Incentives/ Variable Pay
9,075,918 61,674,122 48,241,232 8,662,500 6,825,000 22,995,700 6,825,000 6,933,333 18,068,050 18,068,050 2,031,250
Other annual compensation
3,852,542 139,179,859 182,096 - - - - - - - -
Retirals 885,000 331,967 3,146,664 - - - - - - - -
Sitting fees - - - 500,000 300,000 400,000 500,000 400,000 400,000 400,000 100,000
TOTAL 18,123,644 273,218,756 68,306,017 9,162,500 7,125,000 23,395,700 7,325,000 7,333,333 18,468,050 18,468,050 2,131,250
Grant of ADS Restricted Stock Units
- 800,000*** - - - - - - - - -
Notice period Up to 180 days
Up to 180 days
Up to 180 days
- - - - - - - -
* Figures mentioned in ` are equivalent of amounts paid in US$** Computation of remuneration to Executive Director and Chief Strategy Officer includes cash based bonus (part of his variable pay) on an accrual
basis, which is payable over a period of time.*** The ADS Restricted Stock Units (RSUs) granted to Mr. Abidali Z Neemuchwala, Chief Executive Officer and Executive Director, will vest as per the
vesting pattern approved by the Board Governance, Nomination and Compensation Committee. The options granted during 2018-19, along with the expiration period of these grants are as under:
For 4,00,000 ADS RSUs- December 2021 For 4,00,000 ADS RSUs- August 2023^ Computation of remuneration to Chief Executive Officer and Executive Director is on an accrual basis and includes amortization of ADS Restricted Stock
Units (RSUs) granted to him, which vests over a period a time. This also includes RSUs that vest based on performance parameters of the Company.# Appointed w.e.f. January 1, 2019.

120 Wipro Limited
Terms of Employment Arrangements
Under the Companies Act, 2013, our shareholders must approve the salary, bonus and benefits of all Executive Directors. Each of our Executive Directors has signed an agreement containing the terms and conditions of employment, including a monthly salary, performance bonus and benefits including medical reimbursement and pension fund contributions. These agreements have varying terms ranging from two to five-year periods, but either we or the Executive Director can generally terminate the agreement upon six months’ notice to the other party.
The terms of our employment arrangements with Mr. Azim H Premji, Mr. Abidali Z Neemuchwala and Mr. Rishad A Premji provide for up to a 180 days’ notice period, up to 21 days of leave per year in addition to statutory holidays, and an annual compensation review. Additionally, these officers are required to relocate as we may determine, and to comply with confidentiality provisions. Service contracts with our Executive Directors and Officers
provide for our standard retirement benefits that consist of a pension, provident fund and gratuity which are offered to all our employees, but no other benefits upon termination of employment except as mentioned below.
Pursuant to the terms of Mr. Abidali Z Neemuchwala’s employment, if the agreement is terminated by the Company, the Company is required to pay Mr. Neemuchwala severance pay equivalent of 12 months’ base pay.
We also indemnify our Directors and Officers for claims brought under any rule of law to the fullest extent permitted by applicable law. Among other things, we agree to indemnify our Directors and Officers for certain expenses, judgments, fines and settlement amounts incurred by any such person in any action or proceeding, including any action by or in the right of the Company, arising out of such person’s services as Director or Officer. The Company also has a Director’s and Officer’s liability insurance which covers all Directors and Officers for liability arising out of fiduciary acts.
Key Information pertaining to Directors as on March 31, 2019 is given below:
Sl. No.
Name of the Director
Designation Date of initial appointment
Date of appointment
as Independent Director under
Companies Act, 2013 and SEBI Listing Regulations,
(first term)1 of Board
Directorship in other
Companies2
Chairmanship in Committees
of Board of other
Companies3
Membership in
Committees of the Board
of other Companies
Attendance at the last AGM held on July 19,
2018
No. of shares held as on March 31,
2019
Director Identification
Number
Other Listed Companies where
the Director is appointed as Independent
Director
1 Mr. Azim H Premji
Chairman and Managing Director (designated as ‘Executive Chairman’)
01-Sep-1968 - 10 - - Yes 254,451,816^ 00234280 -
2 Mr. Abidali Z Neemuchwala
Chief Executive Officer and Executive Director
01-Feb-2016 - - - - Yes 426,666* 02478060 -
3 Mr. Rishad A Premji
Executive Director and Chief Strategy Officer
01-May-2015 - 4 - - Yes 1,831,109# 02983899 -
4 Mr. N Vaghul Independent Director
09-Jun-1997 23-Jul-2014 8 2 - Yes - 00002014 1. Piramal Enterprises Limited
2. Apollo Hospitals Enterprises Limited@
5 Dr. Ashok S Ganguly
Independent Director
01-Jan-1999 23-Jul-2014 - - - Yes 4,978 00010812 -
6 Mr. William Arthur Owens
Independent Director
01-Jul-2006 23-Jul-2014 - - - Yes - 00422976 -

Annual Report 2018-19 121
Sl. No.
Name of the Director
Designation Date of initial appointment
Date of appointment
as Independent Director under
Companies Act, 2013 and SEBI Listing Regulations,
(first term)1 of Board
Directorship in other
Companies2
Chairmanship in Committees
of Board of other
Companies3
Membership in
Committees of the Board
of other Companies
Attendance at the last AGM held on July 19,
2018
No. of shares held as on March 31,
2019
Director Identification
Number
Other Listed Companies where
the Director is appointed as Independent
Director
7 Mr. M K Sharma
Independent Director
01-Jul-2011 23-Jul-2014 8 2 3 Yes - 00327684 1. United Spirits Limited
2. Asian Paints Limited
8 Mrs. Ireena Vittal
Independent Director
01-Oct-2013 23-Jul-2014 7 - 5 Yes - 05195656 1. The Indian Hotels Company Limited
2. Godrej Consumer Products Limited
3. Titan Company Limited
4. Housing Finance Development Corporation Limited
9 Dr. Patrick J Ennis
Independent Director
01-Apr-2016 01-Apr-2016 - - - Yes - 07463299 -
10 Mr. Patrick Dupuis
Independent Director
01-Apr-2016 01-Apr-2016 - - - Yes - 07480046 -
11 Mrs. Arundhati Bhattacharya
Independent Director
01-Jan-2019 01-Jan-2019 4 - 2 - - 02011213 1. Reliance Industries Limited
2. Crisil Limited3. Piramal
Enterprises Limited
1 At the 70th Annual General Meeting, Mr. N Vaghul, Dr. Ashok S Ganguly and Mr. M K Sharma were re-appointed as Independent Directors for a second term as under: Mr. N Vaghul - From August 1, 2016 to July 31, 2019 Dr. Ashok S Ganguly - From August 1, 2016 to July 31, 2019 Mr. M K Sharma - From July 1, 2016 to June 30, 2021 At the 71st Annual General Meeting, Mr. William Arthur Owens was re-appointed as Independent Director for a second term from August 1, 2017 to July 31, 2022. At the 72nd Annual General Meeting, Mrs. Ireena Vittal was re-appointed as Independent Director for a second term from October 1, 2018 to September 30, 2023.2 This does not include position in foreign companies and position as an advisory board member but includes position in private companies and companies under
Section 8 of the Companies Act, 2013. None of our Directors hold directorship in more than 8 listed Companies.3 In accordance with Regulation 26 of the Listing Regulations, Membership/Chairmanship of only Audit committees and Stakeholders’ Relationship committees
in all public limited companies have been considered.^ includes shares held jointly with immediate family members.* Represents ADSs having equivalent underlying equity shares.# Shares are held jointly with Mr. Azim H Premji.@ Mr. N Vaghul ceased to be a Director w.e.f. March 31, 2019.
Succession Planning
We have an effective mechanism for succession planning which focuses on orderly succession of Directors, including Executive Directors and other senior management team and other executive officers. The Board Governance, Nomination and Compensation Committee implements this mechanism in concurrence with the Board.
The Board Governance, Nomination and Compensation Committee presents to the Board on a periodic basis, succession plans for appointments to the Board based on various factors such as current tenure of
Directors, outcome of performance evaluation, Board diversity and business requirements. In addition, the Company conducts an annual Talent Review Process for senior management and other executive officers which provides a leadership-level talent inventory and capability map that reflects the extent to which critical talent needs are fulfilled vis-a-vis business drivers.
The Board Governance, Nomination and Compensation Committee reviews the outcome of this process and presents the succession plan for senior management and other executive officers to the Board.

122 Wipro Limited
IV. Committees of the Board
Our Board has constituted sub-committees to focus on specific areas and make informed decisions within the authority delegated to each of the Committees. Each Committee of the Board is guided by its charter, which defines the scope, powers and composition of the Committee. All decisions and recommendations of the Committees are placed before the Board for information or approval.
During the financial year, the Board has accepted the recommendations of Committees on matters where such a recommendation is mandatorily required. There have been no instances where such recommendations have not been considered.
We have the following four sub-committees of the Board as at March 31, 2019:
a. Audit, Risk and Compliance Committee, which also acts as Risk Management Committee
b. Board Governance, Nomination and Compensation Committee, which also oversees the CSR initiatives of the Company
c. Strategy Committee
d. Administrative and Shareholders/Investors Grievance Committee (Stakeholders Relationship Committee)
Audit, Risk and Compliance Committee
The Audit, Risk and Compliance Committee of our Board reviews, acts on and reports to our Board with respect to various auditing and accounting matters. The primary responsibilities include overseeing:
a. Auditing and accounting matters, including recommending the appointment of our independent auditors to the shareholders;
b. Compliance with legal and statutory requirements;
c. Integrity of the Company’s financial statements, discussions with the independent auditors regarding the scope of the annual audits, and fees to be paid to the independent auditors;
d. Performance of the Company’s internal audit function, independent auditors and accounting practices;
e. Review of related party transactions and functioning of whistle blower mechanism;
f. Implementation of the applicable provisions of the Sarbanes Oxley Act of 2002 (the “Sarbanes Oxley Act”), including review of the progress of internal control mechanisms to prepare for certification under Section 404 of the Sarbanes Oxley Act;
g. Evaluation of internal financial controls, risk management systems and policies including review of cyber-security; and.
h. Review of utilization of loans and advances from, and investment by, the Company in its subsidiaries exceeding ` 100 crores or 10% of the asset size of the subsidiary, whichever is lower, including existing loans, advances and investments.
The Chairman of the Audit, Risk and Compliance Committee was present at the Annual General Meeting held on July 19, 2018. The charter of the Audit, Risk and Compliance Committee was amended in January 2019 to align with amendments to the Listing Regulations. The detailed charter of the Committee is available on our website at https://www.wipro.com/corporate-governance. All members of our Audit, Risk and Compliance Committee are Non-Executive Independent Directors and financially literate. The Chairman of our Audit, Risk and Compliance Committee possesses the accounting and financial management related expertise.
Statutory Auditors as well as Internal Auditors always have independent meetings with the Audit, Risk and Compliance Committee and also participate in the Audit, Risk and Compliance Committee meetings. Our Chief Financial Officer, General Counsel and other Corporate Officers make periodic presentations to the Audit, Risk and Compliance Committee on various issues.
The Audit, Risk and Compliance Committee met five times during the financial year 2018-19 on April 24, 2018, June 8, 2018, July 19, 2018, October 23, 2018, and January 17, 2019. Composition of the Audit, Risk and Compliance Committee and details of attendance of members at its meetings during the year 2018-19 are given below:
Name Position Number of Meetings Attended
Mr. N Vaghul Chairman 5
Mr. M K Sharma Member 5
Mrs. Ireena Vittal Member 4*
Mrs. Arundhati Bhattacharya** Member 0^
* Mrs. Ireena Vittal was not present at the meeting held on June 8, 2018.
** Mrs. Arundhati Bhattacharya was appointed as a member of Audit Committee w.e.f. January 1, 2019. There was only one Audit Committee meeting held on January 17, 2019 after her appointment till March 31, 2019.
^ Mrs. Arundhati Bhattacharya participated in the meeting held on January 17, 2019 through video conference and the attendance for the same was not recorded.

Annual Report 2018-19 123
Board Governance, Nomination and Compensation Committee
The Board Governance, Nomination and Compensation Committee reviews, acts on and reports to our Board with respect to various governance, nomination and compensation matters. The primary responsibilities include:
a. Developing and recommending to the Board corporate governance guidelines applicable to the Company;
b. Evaluating the Board on a continuing basis, including an assessment of the effectiveness of the full Board, operations of the Board Committees and contributions of individual Directors;
c. Establishing policies and procedures to assess the requirements for induction of new members to the Board;
d. Implementing policies and processes relating to corporate governance principles;
e. Ensuring that appropriate procedures are put in place to assess Board membership needs and Board effectiveness;
f. Reviewing the Company’s policies that relate to matters of Corporate Social Responsibility (CSR), including public issues of significance to the Company and its shareholders;
g. Formulating the Disclosure Policy, its review and approval of disclosures;
h. Approving and evaluating the compensation plans, policies and programs for full-time Directors and senior management;
i. Acting as Administrator of the Company’s Employee Stock Option Plans and Employee Stock Purchase Plans drawn up from time to time; and
j. R e v i e w i n g a n d r e c o m m e n d i n g o f a l l remuneration, in whatever form, payable to senior management.
The charter of the Board Governance, Nomination and Compensation Committee was amended in January 2019 to align with amendments to the Listing Regulations. The detailed charter of Board Governance, Nomination and Compensation Committee is available on our website at https://www.wipro.com/corporate-governance.
Our Head of Human Resources makes periodic presentations to the Board Governance, Nomination and Compensation Committee on compensation reviews and performance linked compensation
recommendations. All members of the Board Governance, Nomination and Compensation Committee are Non-Executive Independent Directors. The Board Governance, Nomination and Compensation Committee is the apex body that oversees our Corporate Social Responsibility policy and programs.
Pursuant to the provisions of the Companies Act, 2013 and the Listing Regulations, the Board has carried out an Annual Performance Evaluation of its own performance and the Directors individually as well as the evaluation of the working of its Board Governance, Nomination and Compensation Committee and other Committees. Further details on Board evaluation have been provided on page 70 of the Board’s Report.
The Board Governance, Nomination and Compensation Committee met four times during the year 2018-19 on April 24, 2018, July 19, 2018, October 23, 2018 and January 17, 2019. Composition of the Board Governance, Nomination and Compensation Committee and details of attendance of members at its meetings during the year 2018-19 are given below:
Name Position Number of Meetings Attended
Dr. Ashok S Ganguly Chairman 3*
Mr. N Vaghul Member 4
Mr. William Arthur Owens Member 4
* Dr. Ashok S Ganguly was not present at the meeting held on October 23, 2018.
Strategy Committee
The Strategy Committee reviews, acts and reports to our Board with respect to various strategic matters. The primary responsibilities of this Committee, inter alia, are:
a. Making recommendations to the Board relating to the Company’s mission, vision, strategic initiatives, major programs and services;
b. Ensuring management has established an effective strategic planning process, including development of a three to five year strategic plan with measurable goals and time targets;
c. Annually reviewing the strategic plan for the Company and/or for each division and entity and recommending updates to the Board;
d. Establishing criteria for management to evaluate potential strategic investments, reviewing proposals for acquisition or divestment opportunities for the Company and making appropriate recommendations to the Board, and reviewing post-transaction integration matters; and

124 Wipro Limited
e. Monitoring the Company performance against measurable targets (e.g. market share, increase in revenue, or operating margin) or progress points (such as emerging technologies).
The Strategy Committee met three times during the financial year 2018-19 on April 24, 2018, July 19, 2018 and January 17, 2019. Subsequently, the Strategy Committee reviewed the progress on strategy initiatives as part of meetings of the Board. Composition of the Strategy Committee and details of attendance of members at its meetings during the year 2018-19 are given below:
Name Position Number of Meetings Attended
Mr. William Arthur Owens Chairman 3
Mr. Azim H Premji Member 3
Mrs. Ireena Vittal Member 3
Dr. Patrick J Ennis Member 3
Mr. Patrick Dupuis Member 3
Mr. Abidali Z Neemuchwala Member 3
Mr. Rishad A Premji Member 3
Administrative and Shareholders/Investors Grievance Committee (Stakeholders Relationship Committee)
The Administrative and Shareholders/Investors Grievance Committee carries out the role of Stakeholders Relationship Committee in compliance with Section 178 of the Companies Act, 2013 and the Listing Regulations.
The Administrative and Shareholders/Investors Grievance Committee reviews, acts on and reports to our Board with respect to various matters relating to stakeholders. The primary responsibilities include:
a. Considering and resolving the grievances of the shareholders of the Company including complaints related to the transfer or transmission of shares, non-receipt of annual report, non-receipt of declared dividends, issue of new or duplicate share certificates, non-receipt of notice of general meetings, and corporate actions;
b. Approving consolidation, split or sub-division of share certificates, transmission of shares,
issue of dupl icate share cer t if icates, re-materialization of shares;
c. Reviewing the grievance redressal mechanism implemented by the Company in co-ordination with Company’s Registrar and Transfer Agent (“RTA”) from time to time;
d. Reviewing the measures taken by the Company for effective exercise of voting rights by shareholders;
e. Implementing and overseeing the procedures and processes in handling and maintenance of records, transfer of securities and payment of dividend by the Company, RTA and dividend processing bank;
f. Reviewing the various measures and initiatives taken by the Company for reducing the quantum of unclaimed dividends and ensuring timely receipt of dividend warrants, annual reports and statutory notices by the shareholders of the Company.
g. Overseeing administrative matters like opening and closure of Company’s bank accounts, grant and revocation of general, specific and banking powers of attorney; and
h. Considering and approving allotment of equity shares pursuant to exercise of stock options, setting up branch offices and other administrative matters as delegated by the Board from time to time.
Mr. M K Sharma, Independent Director, is the Chairman of the Administrative and Shareholders/ Investors Grievance Committee.
The charter of the Administrative and Shareholders/Investors Grievance Committee was adopted in January 2019 to align with amendments to the Listing Regulations and is available under the investor relations section on our website at https://www.wipro.com/corporate-governance.
The Administrative and Shareholders/Investors Grievance Committee met four times during the year 2018-19 on April 24, 2018, July 19, 2018, October 23, 2018 and January 17, 2019. In addition, the management updates the Committee regarding investor complaints and redressal of shareholders’ queries once in 15 days. Composition of the Administrative and Shareholders/Investors Grievance Committee and details of attendance of members at its meetings during the year 2018-19 are given below:
Name Position Number of meetings attended
Mr. M K Sharma Chairman 4Mrs. Ireena Vittal Member 4Mr. Rishad A Premji Member 4

Annual Report 2018-19 125
Status Report of investor queries and complaints for the period from April 1, 2018 to March 31, 2019 is given below:
Sl. No.
Particulars No. of Complaints
1. Investor complaints pending at the beginning of the year
NIL
2. Investor complaints received during the year
470
3. Investor complaints disposed of during the year
470
4. Investor complaints remaining unresolved at the end of the year
NIL
Apart from these queries/complaints, there are certain pending cases relating to dispute over title to shares in which in certain cases the Company has been made a party. However, these cases are not material in nature.
Mr. M Sanaulla Khan, Company Secretary, is our Compliance Officer under the Listing Regulations.
V. Governance through Management process
Code of Business Conduct
In the year 1983, we articulated ‘Wipro Beliefs’ consisting of six statements. At the core of beliefs was integrity, according to which “individual and company relationship should be governed by the highest standard of conduct and integrity”.
Over the years, this articulation has evolved in form but remained constant in substance. Today, we articulate it as Code of Business Conduct.
The Board and all employees have a responsibility to understand and follow the Code of Business Conduct. All employees are expected to perform their work with honesty and integrity. Wipro’s Code of Business Conduct reflects general principles to guide employees in making ethical decisions. This Code is also applicable to our representatives. This Code outlines fundamental ethical considerations as well as specific considerations that need to be maintained for professional conduct. This Code has been made available on the Company’s website at https://www.wipro.com/corporate-governance.
Internal Audit
The Company has a robust internal audit function with the stated vision “To be the best in class Internal Audit function globally”. In pursuit of this vision, the function provides an independent,
objective assurance and consulting services to value-add and improve operations of business units and processes by:
a. Financial, Business Process and Compliance Audit
b. Operation Reviews
c. Best Practices and Benchmarking
d. Leadership Development
The Head of Internal Audit reports to the Chairman of the Audit, Risk and Compliance Committee and administratively to the Chief Financial Officer. Head of Internal Audit has regular and exclusive meetings with the Audit, Risk and Compliance Committee.
The internal audit function is guided by its charter, as approved by the Audit, Risk and Compliance Committee. The internal audit function formulates an annual risk based audit plan based on consultations and inputs from the Board and business leaders and presents it to the Audit, Risk and Compliance Committee for approval. Findings of various audits carried out during the financial year are also periodically presented to the Audit, Risk and Compliance Committee. The internal audit function adopts a risk based audit approach and covers core areas such as compliance audits, financial audits, technology audits, third party risk audits, M&A audits, etc.
The internal audit team comprises of personnel with professional qualifications and certifications in audit and is rich in diversity. The audit team hones its skills through a robust knowledge management program to continuously assimilate the latest trends and skills in the domain and to retain the knowledge gained for future reference and dissemination.
The function, which was the first Indian internal audit unit to get ISO certified in 1998 and win international award from Institute of Internal Auditors (IIA) in 2002, recently added one more first, by being an early adopter of the new ISO 9001:2015 Version. Testimony to the functions’ innovation and excellence are the IIA awards won in these categories continuously over the last few years.
Code for Prevention of Insider Trading
On December 31, 2018, Securities and Exchange Board of India amended the Securities and Exchange Board of India (Prohibition of Insider Trading) Regulations, 2015, prescribing various new requirements with

126 Wipro Limited
effect from April 1, 2019. In line with the amendments, the Company has adopted an amended Code of Conduct to regulate, monitor and report trading by Designated Persons and their Immediate Relatives under the Securities and Exchange Board of India (Prohibition of Insider Trading) Regulations, 2015. This Code of Conduct also includes code of practices and procedures for fair disclosure of unpublished price sensitive information which has been made available on the Company’s website at https://www.wipro.com/corporate-governance.
Disclosure Policy
In line with requirements under Regulation 30 of the Listing Regulations, the Company has framed a policy on disclosure of material events and information as per the Listing Regulations, which is available on our website at https://www.wipro.com/corporate-governance. The objective of this policy is to have uniform disclosure practices and ensure timely, adequate and accurate disclosure of information on an ongoing basis. The Company has constituted a Disclosure Committee consisting of senior officials, which approves all disclosures required to be made by the Company.
The Company Secretary acts as Secretary to the Disclosure Committee. Considering that the Company’s securities are listed on NYSE, parity in disclosures are maintained through simultaneous disclosure on National Stock Exchange of India Limited, the BSE Limited and the NYSE.
Ombuds Policy
The Company has adopted an Ombuds process which is a channel for receiving and redressing complaints from employees and Directors. Under this policy, we encourage our employees to report any fraudulent financial or other information to the stakeholders, reporting of instance(s) of leak or suspected leak of unpublished price sensitive information, any conduct that results in violation of the Company’s Code of Business Conduct, to the management (on an anonymous basis, if employees so desire). Likewise, under this policy, we have prohibited discrimination, retaliation or harassment of any kind against any employee who, based on the employee’s reasonable belief that such conduct or practice have occurred or are occurring, reports that information or participates in the investigation.
Mechanism followed under Ombuds process is appropriately communicated within the Company across all levels and is also available under the
investor relations section on our website at https://www.wipro.com/investors/corporate-governance/#WiprosOmbudsProcess.
Policy for Preservation of Documents
Pursuant to the requirements under Regulation 9 of the Listing Regulations, the Board has formulated and approved a Document Retention Policy prescribing the manner of retaining the Company’s documents and the time period up to certain documents are to be retained. The policy percolates to all levels of the organization who handle the prescribed categories of documents.
Policy for Prevention, Prohibition & Redressal of Sexual Harassment of Women at Workplace
Wipro has a policy and framework for employees to report sexual harassment cases at workplace and our process ensures complete anonymity and confidentiality of information. Adequate workshops and awareness programmes against sexual harassment are conducted across the organization. The below table provides details of complaints received/disposed during the financial year 2018-19 and includes all cases reported in the system, even if unsubstantiated. In some cases, a clear action has been taken (warning or separation) and the rest of the cases have been resolved through counselling or other specific actions.
a. number of complaints filed during the financial year
142
b. number of complaints disposed of during the financial year
156*
c. number of complaints pending as at end of the financial year
38
* This includes complaints which remained unresolved during the previous year.
Risk Committee
The Company has a risk committee which oversees and monitors organization-wide risk management practices including developing strategies, policies, procedures, processes, and systems to identify, assess, measure, monitor, and manage major risks. These major risks include compliance risk, fraud risk, financial, credit, market and liquidity risk, operational risk, information security/cyber security risk, technology risk, business-continuity risk, reputation risk and strategic risk.
The Committee meets at least on a quarterly basis, as may be necessary.

Annual Report 2018-19 127
VI. Disclosures
Disclosure of Materially Significant Related Party Transactions
All related party transactions that were entered during the financial year were at an arm’s length basis and were in the ordinary course of business. There are no materially significant related party transactions made by the Company with Promoters, Directors, Key Managerial Personnel or other designated persons which may have a potential conflict with the interest of the Company at large.
As required under Regulation 23 of the Listing Regulations, the Company has adopted a policy on Related Party Transactions. The abridged policy on Related Party Transactions is available on the Company’s website at https://www.wipro.com/corporate-governance.
Apart from receiving director remuneration, none of the Directors has any pecuniary relationship or transaction with the Company. During the year 2018-19, no transactions of material nature were entered by the Company with the Management or their relatives that may have a potential conflict of interest with the Company and the concerned officials have given undertakings to that effect as per the provisions of the Listing Regulations.
The Register under Section 189 of the Companies Act, 2013 is maintained and particulars of the transactions have been entered in the Register, as applicable.
Subsidiary Monitoring Framework
All the subsidiary companies of the Company are managed by their Boards having the rights and obligations to manage these companies in the best interest of respective stakeholders. The Company nominates its representatives on the Board of subsidiary companies and monitors performance of such companies, inter alia, by reviewing:
a. Financial statements, the investment made by the unlisted subsidiary companies, statement containing all significant transactions and arrangements entered by the unlisted subsidiary companies forming part of the financials.
b. Minutes of the meetings of the unlisted subsidiary companies, if any, are placed before the Company’s Board regularly.
c. Providing necessary guarantees, letter of comfort and other support for their day-to-day operations from time-to-time.
The Company does not have any subsidiary whose income or net worth exceeds 10% of the consolidated
income or net worth of the Company in the immediately preceding financial year.
Certificate on Corporate Governance
The certificate dated June 5, 2019, issued by Mr. V Sreedharan, Partner, V Sreedharan & Associates, Practising Company Secretaries, is given at page 135 of this Annual Report in compliance with corporate governance norms prescribed under the Listing Regulations.
Details of non-compliance by the Company, penalties and strictures imposed on the Company by Stock Exchanges or SEBI or any statutory authority, on any matter related to capital markets, during the last three years.
The Company has complied with the requirements of the Stock Exchanges or SEBI on matters related to Capital Markets, as applicable, during the last three years. No penalties or strictures have been imposed on the Company.
Whistle Blower Policy and affirmation that no personnel have been denied access to the Audit, Risk & Compliance Committee
As mentioned earlier in this report, the Company has adopted an Ombuds process which is a channel for receiving and redressing employees’ complaints. No personnel in the Company has been denied access to the Audit, Risk and Compliance Committee or its Chairman.
Disclosures with respect to demat suspense account/unclaimed suspense account (Unclaimed Shares)
Pursuant to Regulation 39 of the Listing Regulations, reminder letters have been sent to shareholders whose shares remain unclaimed from the Company. Based on their response, such shares will be transferred to “unclaimed suspense account” as per the provisions of Schedule VI of the Listing Regulations. The disclosure as required under Schedule V of the Listing Regulations is given below:
Sl. No.
Particulars No. of Shareholders
Number of Shares
1. Aggregate number of shareholders and the outstanding shares in the suspense account lying at the beginning of the year
307 377,332
2. Number of shareholders who approached the Company for transfer of shares from suspense account during the year
4 150,338
128 Wipro Limited
Sl. No.
Particulars No. of Shareholders
Number of Shares
3. Number of shareholders to whom shares were t r a n s f e r r e d f r o m s u s p e n s e a c c o u n t during the year
4 150,338
4. Aggregate number of shareholders and the outstanding shares in the suspense account lying at the end of the year
303 302,659*
5. Voting rights on these shares shall remain frozen till the rightful owner of such shares claim the same
Yes
* Adjusted for the Bonus equity shares issued by the Company in March 2019.
Shareholder Information
Various shareholder information required to be disclosed pursuant to Schedule V of the Listing Regulations are provided at Annexure I to this report.
Compliance with Mandatory Requirements
Your Company has complied with all the mandatory corporate governance requirements under the Listing Regulations. Specifically, your Company confirms compliance with corporate governance requirements specified in Regulation 17 to 27 and clauses (b) to (i) of Sub-Regulation (2) of Regulation 46 of the Listing Regulations.
Certificate by Practicing Company Secretary
The Company has received certificate from Mr. V Sreedharan, Partner, V Sreedharan & Associates, Practising Company Secretaries, confirming that none of the Directors of the Company have been debarred or disqualified from being appointed or continuing as director of companies by the SEBI/Ministry of Corporate of Affairs or any such authority. The certificate is given at page 136 of this Annual Report.
VII. Compliance Report on Discretionary requirements under Regulation 27(1) of the Listing Regulations
1. The Board
As per para A of Part E of Schedule II of the Listing Regulations, a non-executive Chairman of the
Board may be entitled to maintain a Chairman’s Office at the company’s expense and also allowed reimbursement of expenses incurred in performance of his duties. The Chairman of the Company is an Executive Director and hence this provision is not applicable to us.
2. Shareholders rights
We display our quarterly and half yearly financial results on our web site www.wipro.com and also publish our financial results in widely circulated newspapers. We have communicated the payment of dividend by e-mail to shareholders in addition to dispatch of letters to all shareholders. We publish the voting results of shareholder meetings and make it available on our website www.wipro.com, and report the same to Stock Exchanges in terms of Regulation 44 of the Listing Regulations.
3. Modified Opinion(s) in Audit Report
The Auditors have issued an un-modified opinion on the financial statements of the Company.
4. Reporting of Internal Auditor
Reporting of Head of Internal Audit is to the Chairman of the Audit Committee of the Board and administratively to the Chief Financial Officer. Head of Internal Audit has regular and exclusive meetings with the Audit Committee.
5. NYSE Corporate Governance Listing Standards
The Company has made this disclosure in compliance with the NYSE Listing Standards and NYSE Listed Company Manual on its website https://www.wipro.com/corporate-governance and has filed the same with the NYSE.
Declaration as required under Regulation 34(3) and Schedule V of the Listing Regulations
All Directors and senior management personnel of the Company have affirmed compliance with Wipro’s Code of Business Conduct for the financial year ended March 31, 2019.
Place: Bengaluru Azim H PremjiDate: June 6, 2019 Executive Chairman

Annual Report 2018-19 129
ANNEXURE I
Shareholder Information
Corporate Identity Number (CIN)
Our Corporate Identity Number (CIN), allotted by the Ministry of Company Affairs, Government of India is L32102KA1945PLC020800, and our Company Registration Number is 20800.
Annual General Meeting
The 73rd Annual General Meeting for the year ended March 31, 2019 is scheduled to be held on Tuesday, July 16, 2019 at 4.00 PM at Wipro Campus, Cafeteria Hall EC-3, Ground Floor, Opp. Tower 8, No. 72, Keonics Electronic City, Hosur Road, Bengaluru - 561229.
The facility to appoint a proxy to represent the members at the meeting is also available for the members who may be unable to attend the meeting. Shareholders are required to fill a proxy form and send it to us latest by July 14, 2019 before 4:00 PM. Shareholders can also cast their vote electronically by following the instructions of e-voting sent separately.
Webcast of the Annual General Meeting Proceedings
The proceedings of the 73rd Annual General Meeting will be webcasted live for all the shareholders as on the cut-off date i.e. July 9, 2019. The shareholders can visit https://corpreg.karvy.com/agmlive/liveevents.aspx and login through existing user id and password to watch the live proceedings of the 73rd Annual General Meeting on July 16, 2019, 4:00 PM onwards.
Annual General Meetings and Other General Body meeting of the Last Three Years and Special Resolutions, if any
For the Financial Years 2015-16, 2016-17 and 2017-18, we held our Annual General Meeting on July 18, 2016 at 4:00 PM, July 19, 2017 at 4:00 PM and July 19, 2018 at 4:00 PM respectively, at Wipro Campus, Cafeteria Hall EC-3, Ground Floor, Opp. Tower 8, No. 72, Keonics, Electronic City, Hosur Road, Bengaluru – 561229.
Financial Year 2015-16
The following special resolutions were passed at the annual general meeting:
a. Re-appointment of Mr. N Vaghul as an Independent Director
b. Re-appointment of Dr. Ashok S Ganguly as an Independent Director
c. Re-appointment of Mr.M K Sharma as an Independent Director
Financial Year 2016-17
The following special resolutions were passed at the annual general meeting:
a. Re-appointment of Mr. Azim H Premji (DIN 00234280) as Executive Chairman and Managing Director of the Company.
b. Re-appointment of Mr. William Arthur Owens (DIN 00422976) as Independent Director of the Company.
Financial Year 2017-18
The following special resolution was passed at the annual general meeting:
a. Re-appointment of Mrs. Ireena Vittal (DIN: 05195656) as an Independent Director of the Company.
Tribunal Convened Meeting of Shareholders and Unsecured Creditors of the Company
Pursuant to the order of the Hon’ble National Company Law Tribunal, Bengaluru Bench, dated August 10, 2018, the meeting of the shareholders and unsecured creditors of the Company was convened and held on September 19, 2018 at the Company’s registered office at Sarjapur Road, Doddakannelli, Bengaluru-560035. The following special resolution was passed at the said meeting of shareholders and unsecured creditors. The details of voting pattern and copy of Scrutinizer’s report is available at https://www.wipro.com/investors/scheme-of-amalgamation/.
a. To approve the scheme of amalgamation of Wipro Technologies Austria GmbH, Wipro Information Technology Austria GmbH, NewLogic Technologies SARL and Appirio India Cloud Solutions Private Limited with and into Wipro Limited
Details of resolutions passed through postal ballot during Financial Year 2018-19 and details of the voting pattern
The Company sought the approval of shareholders by way of ordinary resolutions through notice of postal ballot dated January 18, 2019 for increase in authorized share capital and consequent amendment to Memorandum of Association of the Company and issue of bonus shares, which were duly passed vide resolution dated February 22, 2019 and the results of which were announced on February 24, 2019. Mr. V Sreedharan, Partner of V Sreedharan & Associates, Practising Company Secretaries, was appointed as the Scrutinizer to scrutinize the postal ballot and remote e-voting process in a fair and transparent manner.

130 Wipro Limited
Procedure for Postal Ballot
The postal ballot is conducted in accordance with the provisions contained in Section 110 and other applicable provisions, if any, of the Companies Act, 2013,read with Rule 22 of the Companies (Management and Administration) Rules, 2014. The Shareholders are provided the facility to vote either by physical ballot or through e-voting. The postal ballot notice is sent to shareholders in electronic form to the email addresses registered with the depository (in case of electronic shareholding)/the Company’s Registrar and Share Transfer Agent (in case of physical shareholding). For shareholders whose email IDs are not registered, physical copies of the postal ballot notice are sent by permitted mode along with a postage prepaid self-addressed business reply envelope. The Company also publishes a notice in the newspapers in accordance with the requirements under the Companies Act, 2013.
The Company fixes a cut-off date to reckon paid-up value of equity shares registered in the name of shareholders for the purpose of voting. Shareholders may cast their votes through e-voting during the voting period fixed for this purpose. Alternatively, shareholders may exercise their votes through physical ballot by sending duly completed and signed forms so as to reach the scrutinizer before a specified date and time. After completion of scrutiny of votes, the scrutinizer submits his report to the Chairman and the results of voting by postal ballot are announced by the Chairman or any Director of the Company duly authorized within 48 hours of conclusion of the voting period. The results are also displayed on the website of the Company (www.wipro.com), besides being communicated to the Stock Exchanges, Depositories and Registrar and Share Transfer Agents. The resolutions, if passed by the requisite majority are deemed to have been passed on the last date specified for receipt of duly completed postal ballot forms or e-voting.
Means of Communication with Shareholders/Analysts
We have established procedures to disseminate, in a planned manner, relevant information to our shareholders, analysts, employees and the society at large.
Our Audit, Risk and Compliance Committee reviews the earnings press releases, Securities Exchange Commission (SEC) filings and annual and quarterly reports of the Company, before they are presented to the Board for their approval for release.
News Releases and Presentations: All our news releases and presentations made at investor conferences and to analysts are posted on the Company’s website at https://www.wipro.com/investors.
Quarterly results: Our quarterly results are published in widely circulated national newspapers such as Financial Express and the local daily Kannada Prabha.
Website: The Company’s website contains a separate dedicated section “Investors” where information sought by shareholders is available. The Annual Report of the Company, earnings, press releases, SEC filings and quarterly reports of the Company, apart from the details about the Company, Board of Directors and Management, are also available on the website in a user friendly and downloadable form at https://www.wipro.com/investors.
Annual Report: Annual Report containing audited standalone financial statements, consolidated financial statements together with Board’s Report, Auditors Report and other important information are circulated to members entitled thereto.
Other Disclosures/Filings: Our Form 20-F filed with SEC containing detailed disclosures and along with other disclosures including Press Releases etc. are available at https://www.wipro.com/investors.
Communication of Results:
Means of Communications
Number of Times During 2018-19
Earnings Calls 4
Publication of results 4
Analysts/Investors Meetings
Details are provided in the MD&A Report forming part of this Annual Report.
Resolution No. of Votes Polled
No. of Votes Cast in Favour
No. of Votes Cast
Against
% of Votes Cast in Favour
on Votes Polled
% of Votes Cast Against on Votes
Polled
a. Increase in authorized share capital and consequentamendment to the Memorandum of Association of the Company
3,400,716,814 3,360,689,826 40,026,988 98.82 1.18
b. Issue of Bonus Shares 3,400,825,372 3,394,437,323 6,388,049 99.81 0.19

Annual Report 2018-19 131
Financial Calendar
The financial year of the Company starts from the 1st day of April and ends on 31st day of March of next year. Our tentative calendar for declaration of results for the financial year 2019-20 are as given below:
Quarter Ending Release of ResultsFor the Quarter ending June 30, 2019
Third week of July, 2019
For the Quarter and half year ending September 30, 2019
Second week of October, 2019
For the Quarter and nine months ending December 31, 2019
Second week of January, 2020
For the year ending March 31, 2020
Second week of April, 2020
In addition, the Board may meet on other dates as and when required.
Unclaimed Dividends and Transfer to IEPF
Pursuant to Section 124 of Companies Act, 2013 and Investor Education and Protection Fund Authority (Accounting, Audit, Transfer and Refund) Rules, 2016 (as amended from time to time), the Company has transferred the unpaid or unclaimed final dividend and the underlying equity shares, for the financial year 2010-11 and unpaid or unclaimed interim dividend and the underlying equity
shares for the financial year 2011-12, on the due date to the Investor Education and Protection Fund (IEPF) administered by the Central Government.
Pursuant to the Rule 5(8) of Investor Education and Protection Authority (Accounting, Audit, Transfer and Refund) Rules, 2016, the Company has uploaded the details of unpaid and unclaimed amounts lying with the Company as on July 19, 2018 (date of last Annual General Meeting) on the website of the Company (www.wipro.com/investors) and also on the website of the Ministry of Corporate Affairs.
Fees Paid to Statutory Auditors
The details of total fees for all services paid by the Company and its subsidiaries, on a consolidated basis, to the statutory auditor and all the entities in the network firm/network entity of which the statutory auditor is a part, are as follows:
` In Million
Type of Service Financial Year Ended
March 31, 2019
Financial Year Ended
March 31, 2018Audit Fees 73 62Tax Fees 40 52Others 12 -Total 125 114
Listing on Stock Exchanges, Stock Codes, International Securities Identification Number (ISIN) and Cusip Number for ADRs
Your Company’s securities are listed on the following exchanges as on March 31, 2019 and the stock codes are:
Equity shares Stock Codes AddressBSE Limited (BSE) 507685 BSE Limited, Phiroze Jeejeebhoy Towers Dalal
Street, Mumbai - 400001National Stock Exchange of India Limited (NSE) WIPRO Exchange Plaza, C-1, Block G, Bandra Kurla
Complex, Bandra (E), Mumbai - 400051American Depository ReceiptsNew York Stock Exchange (NYSE) WIT 11 Wall St, New York, NY 10005, United States of
AmericaNotes:1. Listing fees for the year 2019-20 have been paid to the Indian Stock Exchanges as on date of this report.2. Listing fees to NYSE for the calendar year 2019 has been paid as on date of this report.3. The stock code on Reuters is WIPR.NS and on Bloomberg is WPRO: IN.
International Securities Identification Number (ISIN)
ISIN is an identification number for traded shares. This number needs to be quoted in each transaction relating to the dematerialized equity shares of the Company. ISIN number for our equity shares is INE075A01022.
CUSIP Number for American Depository Shares
The Committee on Uniform Security Identification Procedures (CUSIP) of the American Bankers Association has developed a unique numbering system for American Depository Shares. This number identifies a security and its issuer and is recognized globally by organizations adhering to standards issued by the International Securities Organization. Cusip number for Wipro American Depository Scrip is 97651M109.

132 Wipro Limited
Description of Voting Rights
All our equity shares carry voting rights on a pari-passu basis.
Distribution of Shareholding as on March 31, 2019
Category(No. of
Shares)
31-Mar-19 31-Mar-18
No. of Shareholders
% of Shareholders
No. of Shares
% of Total Equity
Category(No. of Shares)
No. of Shareholders
% of Shareholders
No. of Shares
1-5000 329,830 97.55 49,167,404 0.82 2,63,566 97.73 3,57,05,960 0.79
5001- 10000 1,793 0.53 12,691,399 0.21 2,234 0.83 79,43,841 0.18
10001- 20000 758 0.22 9,416,449 0.16 1,411 0.52 1,00,53,160 0.22
20001- 30000 373 0.11 6,554,524 0.11 556 0.21 68,35,088 0.15
30001- 40000 258 0.08 5,781,677 0.10 323 0.12 56,34,614 0.12
40001- 50000 642 0.19 22,529,224 0.37 202 0.07 45,29,721 0.10
50001- 100000 3,180 0.94 10,973,418 0.18 467 0.17 1,61,70,373 0.36
100001& Above 1,266 0.37 5,916,821,293 98.06 935 0.35 4,43,69,11,734 98.08
Total 338,100 100.00 6,033,935,388 100.00 2,69,694 100.00 4,52,37,84,491 100.00
Dematerialisation of Shares and Liquidity
99.80% of outstanding equity shares have been dematerialized as at March 31, 2019.
Outstanding ADR/GDR/Warrants or any other Convertible instruments, Conversion Date and Likely Impact on Equity
The Company has 2.27% of outstanding ADRs as on March 31, 2019.
Market Share Price Data
The performance of our stock during the financial year 2018-19 is tabulated below:
Month April May June July August September October November December January February March
Volume Traded NSE 79,056,139 74,176,475 71,747,895 119,026,881 72,939,020 190,244,795 112,442,243 88,802,792 103,521,996 185,302,347 97,701,501 162,350,001
Price in NSE during the month (in ` per share)
High 225.75 210.60 202.50 217.95 229.88 253.50 250.99 251.55 257.96 278.55 291.71 285.90
Date 23-Apr-18 17-May-18 13-Jun-18 20-Jul-18 31-Aug-18 24-Sep-18 30-Oct-18 19-Nov-18 13-Dec-18 31-Jan-19 26-Feb-19 06-Mar-19
Volume Traded NSE 5,330,247 3,474,859 2,050,453 6,983,199 9,043,661 4,987,824 4,940,176 3,756,673 6,864,124 10,258,761 5,070,049 21,507,060
Low 205.50 193.50 190.13 193.58 205.28 229.73 222.00 226.99 239.51 233.51 270.90 253.40
Date 26-Apr-18 31-May-18 06-Jun-18 04-Jul-18 08-Aug-18 03-Sep-18 25-Oct-18 26-Nov-18 26-Dec-18 14-Jan-19 20-Feb-19 26-Mar-19
Volume Traded NSE 12,775,068 6,864,716 2,539,760 5,112,425 2,109,787 34,312,893 18,902,088 9,328,560 3,140,693 9,217,764 5,880,645 3,850,516
S&P CNX Nifty Index during each month
High 10759.00 10929.20 10893.25 11366.00 11760.20 11751.80 11035.65 10922.45 10985.15 10987.45 11118.10 11630.35
Low 10111.30 10417.80 10550.90 10604.65 11234.95 10850.30 10004.55 10341.90 10333.85 10583.65 10585.65 10817.00
Wipro Price movement vis-a-vis Previous Month High/Low (%)
High % -0.33% -6.71% -3.85% 7.63% 5.47% 10.28% -0.99% 0.22% 2.55% 7.98% 4.73% -1.99%
Low % 0.61% -5.84% -1.74% 1.81% 6.04% 11.91% -3.36% 2.25% 5.52% -2.51% 16.01% -6.46%
S&P CNX Nifty Index vis-a-vis Previous Month High/Low (%)
High % 2.22% 1.58% -0.33% 4.34% 3.47% -0.07% -6.09% -1.03% 0.57% 0.02% 1.19% 4.61%
Low % 1.60% 3.03% 1.28% 0.51% 5.94% -3.42% -7.79% 3.37% -0.08% 2.42% 0.02% 2.19%
* Market price for FY 2018-19 has been restated to reflect the Bonus issue in March 2019.

Annual Report 2018-19 133
ADS Share Price during the Financial Year 2018-19
April May June July August September October November December January February March
Wipro ADS Price in NYSE during each month closing ($)
3.59 3.45 3.59 3.80 3.86 3.91 3.88 3.92 3.85 4.27 4.20 3.98
NYSE TMT index during each month closing 8394 8288 8356 8591 8828 8931 8390 8576 8039 8519 8750 8816
Wipro ASD Price Movement (%) Via a via Previous month Closing $
-7.36% -3.77% 4.13% 5.64% 1.78% 1.17% -0.77% 0.97% -1.72% 10.92% -1.58% -5.24%
W i p r o N Y S E T M T I n d e x Movement (%) V ia a v ia Previous month Closing $
-0.66% -1.27% 0.82% 2.82% 2.76% 1.17% -6.06% 2.22% -6.26% 5.98% 2.71% 0.75%
* Market price for FY 2018-19 has been restated to reflect the Bonus issue in March 2019.
Performance of Wipro equity shares relative to the SENSEX and NYSE Composite index during the period April 1, 2018 to March 31, 2019 is given in the following chart:
Commodity Price Risk and Foreign Exchange Risk and Hedging Activities
The Company had no exposure to commodity and commodity risks for the financial year 2018-19. For Foreign exchange risk and hedging activities, please refer the Management Discussion and Analysis Report for details.
Credit Ratings
Wipro is rated A- by Standard & Poor (outlook stable) and 5A1 by Dun & Bradstreet (condition strong) as at March 31, 2019. There has been no change in ratings during the year.
Registrar and Transfer Agents
Company’s share transfer and related operations is operated through its Registrar and Share Transfer Agents Karvy Fintech Private Limited, Hyderabad.
Share Transfer System
In accordance with the proviso to Regulation 40(1) of the Listing Regulations, effective from April 1, 2019, transfers of shares of the Company shall not be processed unless the shares are held in the dematerialized form with a depository. Accordingly, shareholders holding equity shares in physical form are urged to have their shares dematerialized so as to be able to freely transfer them and participate in various corporate actions.
80
90
100
110
120
130
140
1-M
ar-2
019
1-Fe
b-20
19
1-Ja
n-20
19
1-D
ec-2
018
1-No
v-20
18
1-O
ct-2
018
1-Se
pt-2
018
1-Au
gust
-201
8
1-Ju
ly-2
018
1-Ju
ne-2
018
1-M
ay-2
018
1-Ap
r-201
8
Wipro Sensex NYSE Composite Index

134 Wipro Limited
Investor Queries and Grievances Redressal
Shareholders may write either to the Company or the Registrar and Transfer Agents for redressal of queries and grievances. The address and contact details of the concerned officials are given below.
Registrar and Share Transfer Agents
Karvy Fintech Private Limited Unit: Wipro LimitedKarvy Selenium Tower B, Plot 31-32, Gachibowli, Financial District, Nanakramguda, Hyderabad – 500 032. Phone: 040-23420818 Fax: 040 23420814
Contact Person:
Mr. B. Srinivas - E-mail id: [email protected]. Rajitha Cholleti - E-mail id: [email protected]
Shareholders Grievance can also be sent through email to the following designated E-mail id: [email protected].
Overseas Depository for ADSs J.P. Morgan Chase & Co.P.O. Box 64504, St. Paul MN 55164-0504, USA Tel: +1-651-453 2128
Indian Custodian for ADSsIndia Sub CustodyJ.P. Morgan, J.P. Morgan Towers, 1st Floor, off C.S.T. Road, Kalina, Santacruz (East), Mumbai - 400 098Tel: 022-61573484Fax: 022-61573910
Web-Based Query Redressal System
Members may utilize this facility extended by the Registrar & Transfer Agents for redressal of their queries.
Please visit https://karisma.karvy.com and click on “investors” option for query registration through free identity registration to log on. Investor can submit the query in the “QUERIES” option provided on the website, which will generate the grievance registration number. For accessing the status/response to your query, please use the same number at the option “VIEW REPLY” after 24 hours. The investors can continue to put additional queries relating to the case till they are satisfied.
Shareholders can also send their correspondence to the Company with respect to their shares, dividend, request for annual reports and shareholder grievances. The contact details are provided below:
Mr. M Sanaulla Khan Company Secretary Wipro Limited Doddakannelli, Sarjapur Road, Bengaluru - 560 035
Ph: +91-80-28440011(Extn: 226185)Fax: +91-080-28440054Email: [email protected]
Mr. G Kothandaraman General Manager- FinanceWipro Limited Doddakannelli, Sarjapur Road, Bengaluru - 560 035
Ph: +91-80-28440011(Extn: 226183)Fax: +91-080-28440054Email: [email protected]
Analysts can reach our Investor Relations Team for any queries and clarification on financial/investor relations related matters:
Mrs. Aparna C IyerVice President - FinanceWipro Limited Doddkannelli, Sarjapur Road,Bengaluru - 560 035
Ph: +91-80-28440011(Extn: 227139)
Fax: +91-80-28440054
Email: [email protected]
Mr. Abhishek Kumar Jain Senior Manager,Investor RelationsWipro Limited Doddkannelli, Sarjapur Road, Bengaluru - 560 035
Ph: +91-98457 91363
Fax: +91-80-2844 0054
Email: [email protected]
Plant Locations
The Company has various office in India and abroad. Details of these locations as on March 31, 2019 are available on our website www.wipro.com.

Annual Report 2018-19 135
Corporate Identity Number: L32102KA1945PLC020800
Nominal Capital: INR 2527.40 crores
(Post-Merger Order dated 29.03.2019 passed by Hon’ble NCLT, Bengaluru)
To the Members of Wipro LimitedDoddakannelli, Sarjapur Road, Bengaluru - 560035
We have examined all the relevant records of Wipro Limited for the purpose of certifying compliance of the conditions of the Corporate Governance under the SEBI (Listing Obligations and Disclosure Requirements) Regulations, 2015, for the financial year ended March 31, 2019. We have obtained all the information and explanations which to the best of our knowledge and belief were necessary for the purposes of certification.
The compliance of conditions of corporate governance is the responsibility of the Management. Our examination was limited to the procedure and implementation process adopted by the Company for ensuring the compliance of the conditions of the corporate governance.
This certificate is neither an assurance as to the future viability of the Company nor of the efficacy or effectiveness with which the management has conducted the affairs of the Company.
In our opinion and to the best of our information and according to the explanations and information furnished to us, we certify that the Company has complied with all the mandatory requirements of Corporate Governance as stipulated in Schedule II of the said Regulations. As regards Discretionary Requirements specified in Part E of Schedule II of the SEBI (Listing Obligations and Disclosure Requirements) Regulations, 2015, the Company has complied with items C, D and E.
For V. Sreedharan & Associates Company Secretaries
Sd/- V. SreedharanJune 5, 2019 PartnerBengaluru F.C.S.2347; C.P. No. 833
Corporate Governance Compliance Cerfiticate

136 Wipro Limited
Certificate of Non-Disqualification of Directors
To,
The Board of Directors Wipro LimitedDoddakkannelli, Sarjapur RoadBengaluru- 560035
I/We have examined the relevant registers, records, forms, returns and disclosures received from Wipro Limited having CIN L32102KA1945PLC020800 and having registered office at Doddakkannelli, Sarjapur Road, Bengaluru- 560035 (hereinafter referred to as ‘the Company’), produced before me/us by the Company for the purpose of issuing this Certificate, in accordance with Regulation 34(3) read with Schedule V Para-C Sub clause 10 (i) of the Securities Exchange Board of India (Listing Obligations and Disclosure Requirements) Regulations, 2015.
In my/our opinion and to the best of my/our information and according to the verifications (including Directors Identification Number (DIN) status at the portal www.mca.gov.in) as considered necessary and explanations furnished to me by the Company & its officers, I/We hereby certify that none of the Directors on the Board of the Company as stated below for the Financial Year ending on March 31, 2019 have been debarred or disqualified from being appointed or continuing as Directors of companies by the Securities and Exchange Board of India, Ministry of Corporate Affairs, or any such other Statutory Authority.
Sl. No. Name of Director DIN Date of appointment in Company1 Mr. Azim Premji Hasham 00234280 01/09/19682 Mr. Narayanan Vaghul 00002014 09/06/19973 Dr. Ashok Sekhar Ganguly 00010812 01/01/19994 Mr. Mahendrakumar Sharma 00327684 01/07/20115 Mr. William Arthur Owens 00422976 01/07/20066 Mrs. Ireena Vittal 05195656 01/10/20137 Mr. Rishad Premji Azim 02983899 01/05/20158 Mr. Abidali Z Neemuchwala 02478060 01/02/20169 Dr. Patrick John Ennis 07463299 01/04/2016
10 Mr. Patrick Lucien Andre Dupuis 07480046 01/04/201611 Mrs. Arundhati Bhattacharya 02011213 01/01/2019
Ensuring the eligibility of for the appointment/continuity of every Director on the Board is the responsibility of the management of the Company. Our responsibility is to express an opinion on these based on our verification. This certificate is neither an assurance as to the future viability of the Company nor of the efficiency or effectiveness with which the management has conducted the affairs of the Company.
For V. Sreedharan & Associates Company Secretaries
Sd/- V. SreedharanJune 5, 2019 PartnerBengaluru F.C.S.2347; C.P. No. 833
[pursuant to Regulation 34(3) and Schedule V Para C clause (10)(i) of the SEBI (Listing Obligations and Disclosure Requirements) Regulations, 2015]

Standalone Financial Statements under Ind AS
Annual Report 2018-19 137
Independent Auditor’s ReportTo The Members of Wipro Limited
Report on the Audit of the Standalone Financial Statements
Opinion
We have audited the accompanying standalone financial statements of Wipro Limited (“the Company”), which comprise the Balance Sheet as at March 31, 2019, the Statement of Profit and Loss (including Other Comprehensive Income), the Statement of Changes in Equity and the Statement of Cash Flows for the year then ended, and a summary of significant accounting policies and other explanatory information (herein after referred to as “the standalone financial statements”).
In our opinion and to the best of our information and according to the explanations given to us, the aforesaid standalone financial statements give the information required by the Companies Act, 2013 (“the Act”) in the manner so required and give a true and fair view in conformity with the Indian Accounting Standards prescribed under section 133 of the Act read with the Companies (Indian Accounting Standards) Rules, 2015, as amended, (“Ind AS”) and other accounting principles generally accepted in India, of the state of affairs of the Company as at March 31, 2019, its profit, total comprehensive income, changes in equity and its cash flows for the year ended on that date.
Basis for Opinion
We conducted our audit of the standalone financial statements in accordance with the Standards on Auditing specified under section 143(10) of the Act (SAs). Our responsibilities under those Standards are further described in the Auditor’s Responsibility for the Audit of the Standalone Financial Statements section of our report. We are independent of the Company in accordance with the Code of Ethics issued by the Institute of Chartered Accountants of India (ICAI) together with the ethical requirements that are relevant to our audit of the standalone financial statements under the provisions of the Act and the Rules made thereunder, and we have fulfilled our other ethical responsibilities in accordance with these requirements and the ICAI’s Code of Ethics. We believe that the audit evidence obtained by us is sufficient and appropriate to provide a basis for our audit opinion on the standalone financial statements.
Key Audit Matters
Key audit matters are those matters that, in our professional judgment, were of most significance in our audit of the standalone financial statements of the current period. These matters were addressed in the context of our audit of the standalone financial statements as a whole, and in forming our opinion thereon, and we do not provide a separate opinion on these matters. We have determined the matters described below to be the key audit matters to be communicated in our report.
Sr. No. Key Audit Matter Auditor’s Response1 Accuracy of recognition, measurement,
presentation and disclosures of revenues and other related balances in view of adoption of Ind AS 115 “Revenue from Contracts with Customers” (new revenue accounting standard)
The application of the new revenue a c c o u n t i n g st a n d a rd i nvo l ve s certain key judgements relating to identification of distinct performance o b l i g a t i o n s , d e te r m i n a t i o n o f transaction price of the identified p e r fo r m a n c e o b l i g a t i o n s , t h e appropriateness of the basis used to measure revenue recognized over a period. Additionally, new re v e n u e a c c o u n t i n g s t a n d a rd contains disclosures which involves collation of information in respect of
Principal Audit Procedures
We assessed the Company’s process to identify the impact of adoption of the new revenue accounting standard.
Our audit approach consisted testing of the design and operating effectiveness of the internal controls and substantive testing which included the following among others:
• Evaluated the design of internal controls relating to implementation of the new revenue accounting standard.
• Selected a sample of continuing and new contracts, and tested the operating effectiveness of the internal control, relating to identification of the distinct performance obligations and determination of transaction price. We carried out a combination of procedures involving inquiry and observation, reperformance and inspection of evidence in respect of operation of these controls.
• Tested the relevant information technology systems’ access and change management controls relating to contracts and related information used in recording and disclosing revenue in accordance with the new revenue accounting standard.

Standalone Financial Statements under Ind AS
138 Wipro Limited
Sr. No. Key Audit Matter Auditor’s Responsedisaggregated revenue and periods over which the remaining performance o b l i g a t i o n s w i l l b e s a t i s f i e d subsequent to the balance sheet date.
Refer Note 3 to the Standalone Financial Statements.
• Selected a sample of continuing and new contracts and performed the following procedures among others:
• Read, analysed and identified the distinct performance obligations in these contracts.
• Compared these performance obligations with that identified and recorded by the Company.
• Samples in respect of revenue recorded for time and material contracts were tested using a combination of approved time sheets including customer acceptances, subsequent invoicing and historical trend of collections and disputes.
• In respect of samples relating to fixed price contracts, progress towards satisfaction of performance obligation used to compute recorded revenue was verified with actual and estimated costs from the revenue recognition systems.
• Sample of revenues disaggregated by type and service offerings were tested with the performance obligations specified in the underlying contracts.
• Performed analytical procedures for reasonableness of revenues disclosed by type and service offerings.
• We reviewed the collation of information and the logic of the report generated from the revenue recognition system used to prepare the disclosure relating to the periods over which the remaining performance obligations will be satisfied subsequent to the balance sheet date.
2 Accuracy of revenue recognition in respect of fixed price contracts involves critical estimates.
Estimated effort is a critical estimate to determine revenues and liabilities for onerous obligations. This estimate has a high inherent uncertainty as it requires consideration of progress of the contract, efforts incurred till date and efforts required to complete the remaining contract performance obligations.
Refer Notes 3and 20to the Standalone Financial Statements.
Principal Audit Procedures
Our audit approach was a combination of test of internal controls and substantive procedures which included the following, among others:
• Evaluated the design of internal controls relating to recording of efforts incurred and estimation of efforts required to complete the performance obligations.
• Tested the access and application controls pertaining to time recording and allocation systems which prevents unauthorised changes to recording of efforts incurred.
• Selected a sample of contracts and through inspection of evidence of performance of these controls, tested the operating effectiveness of the internal controls relating to efforts incurred and estimated.
• Selected a sample of contracts and performed a retrospective review of completed efforts and activities with the planned efforts and activities to identify significant variations and verifiedwhether those variations have been considered in estimating the remaining efforts to complete the contract.
• Reviewed a sample of contracts with unbilled revenues to identify possible delays in achieving milestones, which require change in estimated efforts to complete the remaining performance obligations.
• Performed analytical procedures and test of details for reasonableness of incurred and estimated efforts.

Standalone Financial Statements under Ind AS
Annual Report 2018-19 139
Sr. No. Key Audit Matter Auditor’s Response3 Evaluation of uncertain tax positions.
The Company has material uncertain tax positions including matters under dispute which involves significant judgment to determine the possible outcome of these disputes.
Refer Notes 3(xvi) and 33to the standalone Financial Statements.
Principal Audit Procedures
Obtained details of completed tax assessments and demands during the year ended March 31, 2019 from management. We involved our internal tax experts to challenge the management’s underlying assumptions in estimating the tax provision and the possible outcome of the disputes. Our internal tax experts also considered legal precedence and other rulings in evaluating management’s position on these uncertain tax positions. Additionally, we considered the effect of new information in respect of uncertain tax positions as at April 1, 2018 to evaluate whether any change was required to management’s position on these uncertainties.
Information Other than the Financial Statements and Auditor’s Report Thereon
• The Company’s Board of Directors are responsible for the other information. The other information comprises the Baord’s Report and the Corporate Governance Report, but does not include the consolidated financial statements, standalone financial statements and our auditor’s report thereon.
• Our opinion on the standalone financial statements does not cover the other information and we do not express any form of assurance conclusion thereon.
• In connection with our audit of the standalone financial statements, our responsibility is to read the other informationand, in doing so, consider whether the other information is materially inconsistent with the standalone financial statements or our knowledge obtained during the course of our audit or otherwise appears to be materially misstated.
• If, based on the work we have performed, we conclude that there is a material misstatement of this other information, we are required to report that fact. We have nothing to report in this regard.
Management’s Responsibility for the Standalone Financial Statements
The Company’s Board of Directors are responsible for the matters stated in section 134(5) of the Act with respect to the preparation of these standalone financial statements that give a true and fair view of the financial position, financial performance including other comprehensive income, changes in equity and cash flows of the Company in accordance with the Ind AS and other accounting principles generally accepted in India. This responsibility also includes maintenance of adequate accounting records in accordance with the provisions of the Act for safeguarding the assets of the Company and for preventing and detecting frauds and other irregularities; selection and application of appropriate accounting policies; making judgments and estimates that are reasonable and prudent; and design, implementation and maintenance of
adequate internal financial controls, that were operating effectively for ensuring the accuracy and completeness of the accounting records, relevant to the preparation and presentation of the standalone financial statement that give a true and fair view and are free from material misstatement, whether due to fraud or error.
In preparing the standalone financial statements, management is responsible for assessing the Company’s ability to continue as a going concern, disclosing, as applicable, matters related to going concern and using the going concern basis of accounting unless management either intends to liquidate the Company or to cease operations, or has no realistic alternative but to do so.
Those Board of Directors are also responsible for overseeing the Company’s financial reporting process.
Auditor’s Responsibility for the Audit of the Standalone Financial Statements
Our objectives are to obtain reasonable assurance about whether the standalone financial statements as a whole are free from material misstatement, whether due to fraud or error, and to issue an auditor’s report that includes our opinion. Reasonable assurance is a high level of assurance, but is not a guarantee that an audit conducted in accordance with SAs will always detect a material misstatement when it exists. Misstatements can arise from fraud or error and are considered material if, individually or in the aggregate, they could reasonably be expected to influence the economic decisions of users taken on the basis of these standalone financial statements.
As part of an audit in accordance with SAs, we exercise professional judgment and maintain professional skepticism throughout the audit. We also:
• Identify and assess the risks of material misstatement of the standalone financial statements, whether due to fraud or error, design and perform audit procedures responsive to those risks, and obtain audit evidence that is sufficient and appropriate to provide a basis for our opinion. The risk of not
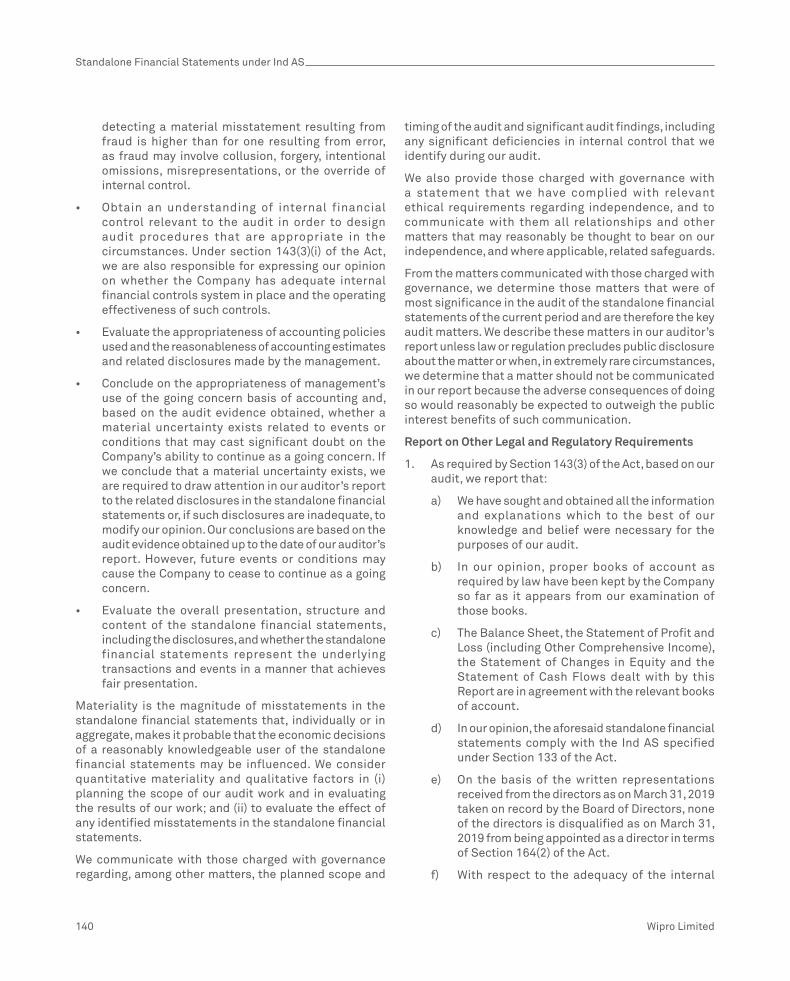
Standalone Financial Statements under Ind AS
140 Wipro Limited
detecting a material misstatement resulting from fraud is higher than for one resulting from error, as fraud may involve collusion, forgery, intentional omissions, misrepresentations, or the override of internal control.
• Obtain an understanding of internal financial control relevant to the audit in order to design audit procedures that are appropriate in the circumstances. Under section 143(3)(i) of the Act, we are also responsible for expressing our opinion on whether the Company has adequate internal financial controls system in place and the operating effectiveness of such controls.
• Evaluate the appropriateness of accounting policies used and the reasonableness of accounting estimates and related disclosures made by the management.
• Conclude on the appropriateness of management’s use of the going concern basis of accounting and, based on the audit evidence obtained, whether a material uncertainty exists related to events or conditions that may cast significant doubt on the Company’s ability to continue as a going concern. If we conclude that a material uncertainty exists, we are required to draw attention in our auditor’s report to the related disclosures in the standalone financial statements or, if such disclosures are inadequate, to modify our opinion. Our conclusions are based on the audit evidence obtained up to the date of our auditor’s report. However, future events or conditions may cause the Company to cease to continue as a going concern.
• Evaluate the overall presentation, structure and content of the standalone financial statements, including the disclosures, and whether the standalone financial statements represent the underlying transactions and events in a manner that achieves fair presentation.
Materiality is the magnitude of misstatements in the standalone financial statements that, individually or in aggregate, makes it probable that the economic decisions of a reasonably knowledgeable user of the standalone financial statements may be influenced. We consider quantitative materiality and qualitative factors in (i) planning the scope of our audit work and in evaluating the results of our work; and (ii) to evaluate the effect of any identified misstatements in the standalone financial statements.
We communicate with those charged with governance regarding, among other matters, the planned scope and
timing of the audit and significant audit findings, including any significant deficiencies in internal control that we identify during our audit.
We also provide those charged with governance with a statement that we have complied with relevant ethical requirements regarding independence, and to communicate with them all relationships and other matters that may reasonably be thought to bear on our independence, and where applicable, related safeguards.
From the matters communicated with those charged with governance, we determine those matters that were of most significance in the audit of the standalone financial statements of the current period and are therefore the key audit matters. We describe these matters in our auditor’s report unless law or regulation precludes public disclosure about the matter or when, in extremely rare circumstances, we determine that a matter should not be communicated in our report because the adverse consequences of doing so would reasonably be expected to outweigh the public interest benefits of such communication.
Report on Other Legal and Regulatory Requirements
1. As required by Section 143(3) of the Act, based on our audit, we report that:
a) We have sought and obtained all the information and explanations which to the best of our knowledge and belief were necessary for the purposes of our audit.
b) In our opinion, proper books of account as required by law have been kept by the Company so far as it appears from our examination of those books.
c) The Balance Sheet, the Statement of Profit and Loss (including Other Comprehensive Income), the Statement of Changes in Equity and the Statement of Cash Flows dealt with by this Report are in agreement with the relevant books of account.
d) In our opinion, the aforesaid standalone financial statements comply with the Ind AS specified under Section 133 of the Act.
e) On the basis of the written representations received from the directors as on March 31, 2019 taken on record by the Board of Directors, none of the directors is disqualified as on March 31, 2019 from being appointed as a director in terms of Section 164(2) of the Act.
f) With respect to the adequacy of the internal

Standalone Financial Statements under Ind AS
Annual Report 2018-19 141
financial controls over financial reporting of the Company and the operating effectiveness of such controls, refer to our separate Report in “Annexure A”. Our report expresses an unmodified opinion on the adequacy and operating effectiveness of the Company’s internal financial controls over financial reporting.
g) With respect to the other matters to be included in the Auditor’s Report in accordance with the requirements of section 197(16) of the Act, as amended, in our opinion and to the best of our information and according to the explanations given to us, the remuneration paid by the Company to its directors during the year is in accordance with the provisions of section 197 of the Act.
h) With respect to the other matters to be included in the Auditor’s Report in accordance with Rule 11 of the Companies (Audit and Auditors) Rules, 2014, as amended, in our opinion and to the best of our information and according to the explanations given to us:
i. The Company has disclosed the impact of pending litigations on its financial position in its standalone financial statements;
ii. The Company has made provision, as required under the applicable law or accounting standards, for material foreseeable losses, if any, on long-term contracts including derivative contracts;
iii. There has been no delay in transferring amounts, required to be transferred, to the Investor Education and Protection Fund by the Company.
2. As required by the Companies (Auditor’s Report) Order, 2016 (“the Order”) issued by the Central Government in terms of Section 143(11) of the Act, we give in “Annexure B” a statement on the matters specified in paragraphs 3 and 4 of the Order.
For DELOITTE HASKINS & SELLS LLPChartered AccountantsFirm Registration Number: 117366W/W-100018
N. VenkatramPartnerMembership number: 71387
Mumbai June 06, 2019
(Referred to in paragraph (f) under ‘Report on Other Legal and Regulatory Requirements’ section of our report of even date)
Report on the Internal Financial Controls Over Financial Reporting under Clause (i) of Sub-section 3 of Section 143 of the Companies Act, 2013 (“the Act”)
We have audited the internal financial controls over financial reporting of Wipro Limited (“the Company”) as of March 31, 2019 in conjunction with our audit of the standalone financial statements of the Company for the year ended on that date.
Management’s Responsibility for Internal Financial Controls
The Board of Directors of the Company are responsible for establishing and maintaining internal financial controls based on the internal control over financial reporting criteria established by the Company considering the essential components of internal control stated in the Guidance Note on Audit of Internal Financial Controls Over Financial Reporting issued by the Institute of Chartered
Annexure A to the Independent Auditor’s ReportAccountants of India. These responsibilities include the design, implementation and maintenance of adequate internal financial controls that were operating effectively for ensuring the orderly and efficient conduct of its business, including adherence to company’s policies, the safeguarding of its assets, the prevention and detection of frauds and errors, the accuracy and completeness of the accounting records, and the timely preparation of reliable financial information, as required under the Act.
Auditor’s Responsibility
Our responsibility is to express an opinion on the Company’s internal financial controls over financial reporting of the Company based on our audit. We conducted our audit in accordance with the Guidance Note on Audit of Internal Financial Controls Over Financial Reporting (the “Guidance Note”) issued by the Institute of Chartered Accountants of India and the Standards on Auditing prescribed under Section 143(10) of the Companies Act, 2013, to the extent applicable to an audit of internal financial controls. Those Standards and the Guidance Note require that we comply with ethical requirements and plan and perform the audit

Standalone Financial Statements under Ind AS
142 Wipro Limited
of unauthorised acquisition, use, or disposition of the company’s assets that could have a material effect on the financial statements.
Inherent Limitations of Internal Financial Controls Over Financial Reporting
Because of the inherent limitations of internal financial controls over financial reporting, including the possibility of collusion or improper management override of controls, material misstatements due to error or fraud may occur and not be detected. Also, projections of any evaluation of the internal financial controls over financial reporting to future periods are subject to the risk that the internal financial control over financial reporting may become inadequate because of changes in conditions, or that the degree of compliance with the policies or procedures may deteriorate.
Opinion
In our opinion, to the best of our information and according to the explanations given to us, the Company has, in all material respects, an adequate internal financial controls system over financial reporting and such internal financial controls over financial reporting were operating effectively as at March 31, 2019, based on, the internal control over financial reporting criteria established by the Company considering the essential components of internal control stated in the Guidance Note on Audit of Internal Financial Controls Over Financial Reporting issued by the Institute of Chartered Accountants of India.
For DELOITTE HASKINS & SELLS LLPChartered AccountantsFirm Registration Number: 117366W/W-100018
N. VenkatramPartnerMembership number: 71387
Mumbai June 06, 2019
to obtain reasonable assurance about whether adequate internal financial controls over financial reporting was established and maintained and if such controls operated effectively in all material respects.
Our audit involves performing procedures to obtain audit evidence about the adequacy of the internal financial controls system over financial reporting and their operating effectiveness. Our audit of internal financial controls over financial reporting included obtaining an understanding of internal financial controls over financial reporting, assessing the risk that a material weakness exists, and testing and evaluating the design and operating effectiveness of internal control based on the assessed risk. The procedures selected depend on the auditor’s judgement, including the assessment of the risks of material misstatement of the financial statements, whether due to fraud or error.
We believe that the audit evidence we have obtained, is sufficient and appropriate to provide a basis for our audit opinion on the Company’s internal financial controls system over financial reporting.
Meaning of Internal Financial Controls Over Financial Reporting
A company’s internal financial control over financial reporting is a process designed to provide reasonable assurance regarding the reliability of financial reporting and the preparation of financial statements for external purposes in accordance with generally accepted accounting principles. A company’s internal financial control over financial reporting includes those policies and procedures that (1) pertain to the maintenance of records that, in reasonable detail, accurately and fairly reflect the transactions and dispositions of the assets of the company; (2) provide reasonable assurance that transactions are recorded as necessary to permit preparation of financial statements in accordance with generally accepted accounting principles, and that receipts and expenditures of the company are being made only in accordance with authorisations of management and directors of the company; and (3) provide reasonable assurance regarding prevention or timely detection

Standalone Financial Statements under Ind AS
Annual Report 2018-19 143
(Referred to in paragraph 2 under ‘Report on Other Legal and Regulatory Requirements’ section of our report to the members of Wipro Limited of even date)
(i) In respect of the Company’s fixed assets:
(a) The Company has maintained proper records showing full particulars, including quantitative details and situation of fixed assets.
(b) The Company has a program of verification to cover all the items of fixed assets in a phased manner over a period of 3 years which, in our opinion, is reasonable having regard to the size of the Company and the nature of its assets. Pursuant to the program, certain fixed assets were physically verified by the Management during the year. According to the information and explanations given to us, no material discrepancies were noticed on such verification.
(c) According to the information and explanations given to us, the records examined by us and based on the examination of the conveyance deeds/registered sale deeds provided to us, we report that, the title deeds, comprising all the immovable properties of land and buildings which are freehold, are held in the name of the Company as at the balance sheet date.
(ii) As explained to us, the inventories were physically verified during the year by the Management at reasonable intervals. There were no material discrepancies noticed on physical verification during the year.
(iii) The Company has not granted any loans, secured or unsecured, to companies, firms, Limited Liability Partnerships or other parties covered in the register maintained under section 189 of the Companies Act, 2013.
(iv) In our opinion and according to the information and explanations given to us, the Company has complied
with the provisions of Sections 185 and 186 of the Act in respect of grant of loans, making investments and providing guarantees and securities, as applicable.
(v) The Company has not accepted deposits during the year and does not have any unclaimed deposits as at March 31, 2018 and therefore, the provisions of the clause 3 (v) of the Order are not applicable to the Company.
(vi) The maintenance of cost records has not been specified by the Central Government under Section 148(1) of the Companies Act, 2013 for the business activities carried out by the Company. Thus reporting under Clause 3(vi) of the order is not applicable to the Company.
(vii) According to the information and explanations given to us, in respect of statutory dues:
(a) The Company has generally been regular in depositing undisputed statutory dues, including Provident Fund, Employees’ State Insurance, Income Tax, Sales Tax, Service Tax, Goods and Service Tax, Value Added Tax, Customs Duty, Excise Duty, Cess and other material statutory dues applicable to it with the appropriate authorities.
(b) There were no undisputed amounts payable in respect of Provident Fund, Employees’ State Insurance, Income Tax, Sales Tax, Service Tax, Value Added Tax, Goods and Service Tax, Customs Duty, Excise Duty, Cess and other material statutory dues in arrears as at March 31, 2019 for a period of more than six months from the date they became payable.
(c) Details of dues of Income Tax, Sales Tax, Service Tax, Customs Duty, Excise Duty and Value Added Tax which have not been deposited as at March 31, 2019on account of dispute are given below:
Annexure B to the Independent Auditor’s Report
` in millions
Name of Statue Nature of dues
Forum where dispute is pending
Period to which the amount relates
Amount Involved
Amount not deposited as
atMarch 31, 2019
The Central Excise Act, 1944
Excise Duty Assistant Commissioner
1990-91 to 2014-15 64 59
The Central Excise Act, 1944
Excise Duty Commissioner 2004-05 to 2014-15 10 10
The Central Excise Act, 1944
Excise Duty Commissioner Appeals
1994-95 to 2012-13 13 13

Standalone Financial Statements under Ind AS
144 Wipro Limited
Name of Statue Nature of dues
Forum where dispute is pending
Period to which the amount relates
Amount Involved
Amount not deposited as
atMarch 31, 2019
The Central Excise Act, 1944
Excise Duty CESTAT 1999-2000 to 2012-13 193 180
The Central Excise Act, 1944
Excise Duty High Court 2007-08,
2008-09
1 1
The Customs Act, 1962 Customs Duty Asst. Commissioner of customs
1994-95 to 2010-11 49 45
The Customs Act, 1962 Customs Duty CESTAT 1991-92 to
2011-12
11 4
The Customs Act, 1962 Customs Duty Commissioner 2005-06 6 6
The Customs Act, 1962 Customs Duty Commissioner Appeals
1997-98 to
2009-10
383 327
The Customs Act, 1962 Customs Duty Deputy Commissioner - Air Customs –
Chennai
2009-10 5 5
The Customs Act, 1962 Customs Duty Madras HC 2009-10 5 4
The Customs Act, 1962 Penalty Karnataka High court 2001-02 to 2005-06 2,951 2,871
Finance Act, 1994 Service tax Assistant commissioner
2003-04 to -2015-16 341 340
Finance Act, 1994 Service tax Commissioner Appeals
2003-04 to
2015-16
371 371
Finance Act, 1994 Penalty Commissioner Appeals
2005-06 to
2015-16
24 24
Finance Act, 1994 Service tax CESTAT 2001-02 to
2011-12
1,789 1,088
Finance Act, 1994 Penalty CESTAT 2001-02 to
2011-12
1,034 1,034
Sales Tax / VAT Sales Tax / VAT
Assistant commissioner/
Deputy Commissioner
1986-87 to 2015-16 1,358 1,165
Sales Tax / VAT Sales Tax / VAT
Commissioner appeals
1988-89 to
2016-17
2,306 2,138
Sales Tax / VAT Sales Tax / VAT
Customs Excise And Service Tax Appellate
Tribunal
1986-87 to 2010-11 706 660
Sales Tax / VAT Sales Tax / VAT
High Court 1998-99 to
2013-14
81 27
Sales Tax / VAT Sales Tax / VAT
Supreme Court 2001-02 12 12
The Income Tax Act, 1961 Income Tax - TDS
CIT(A) - TDS 2003-04 2 1
The Income Tax Act, 1961 Income Tax - TDS
Income Tax Appellate Tribunal
2009-10 13 5
The Income Tax Act, 1961 Income Tax - TDS
High Court 2010-11 61 61

Standalone Financial Statements under Ind AS
Annual Report 2018-19 145
Name of Statue Nature of dues
Forum where dispute is pending
Period to which the amount relates
Amount Involved
Amount not deposited as
atMarch 31, 2019
The Income Tax Act, 1961 Income Tax Assessing Officer 2013-14 ^ ^
The Income Tax Act, 1961 Income Tax Commissioner of Income tax (Appeals)
2011-12, 2012-13 20 20
The Income Tax Act, 1961 Income Tax Income Tax Appellate Tribunal
2006-07,2009-10,2010-11 to 2013-14
5,097 1,220
^ Amount less than 1 million
(viii) In our opinion and according to the information and explanations given to us, the Company has not defaulted in the repayment of loans or borrowings to financial institutions, banks and government. The Company has not issued any debentures.
(ix) The Company has not raised moneys by way of initial public offer or further public offer (including debt instruments or term loans) during the year, hence reporting under clause 3(ix) of the Order is not applicable to the company.
(x) To the best of our knowledge and according to the information and explanations given to us, no fraud by the Company or no material fraud on the Company by its officers or employees has been noticed or reported during the year.
(xi) In our opinion and according to the information and explanations given to us, the Company has paid/provided managerial remuneration in accordance with the requisite approvals mandated by the provisions of section 197 read with Schedule V to the Act.
(xii) The Company is not a Nidhi Company and hence reporting under clause 3 (xii) of the Order is not applicable to the Company.
(xiii) In our opinion and according to the information and explanations given to us, the Company is in compliance with Section 177 and 188 of the Companies Act, 2013 where applicable, for all
transactions with the related parties and the details of related party transactions have been disclosed in the standalone financial statements as required by the applicable accounting standards.
(xiv) During the year, the Company has not made any preferential allotment or private placement of shares or fully or partly paid convertible debentures and hence, reporting under clause 3 (xiv) of the Order is not applicable to the Company.
(xv) In our opinion and according to the information and explanations given to us, during the year the Company has not entered into any non-cash transactions with its Directors or persons connected to its directors and hence provisions of section 192 of the Companies Act, 2013 are not applicable to the Company.
(xvi) The Company is not required to be registered under section 45-IA of the Reserve Bank of India Act, 1934.
For DELOITTE HASKINS & SELLS LLPChartered AccountantsFirm Registration Number: 117366W/W-100018
N. VenkatramPartnerMembership number: 71387
Mumbai June 06, 2019
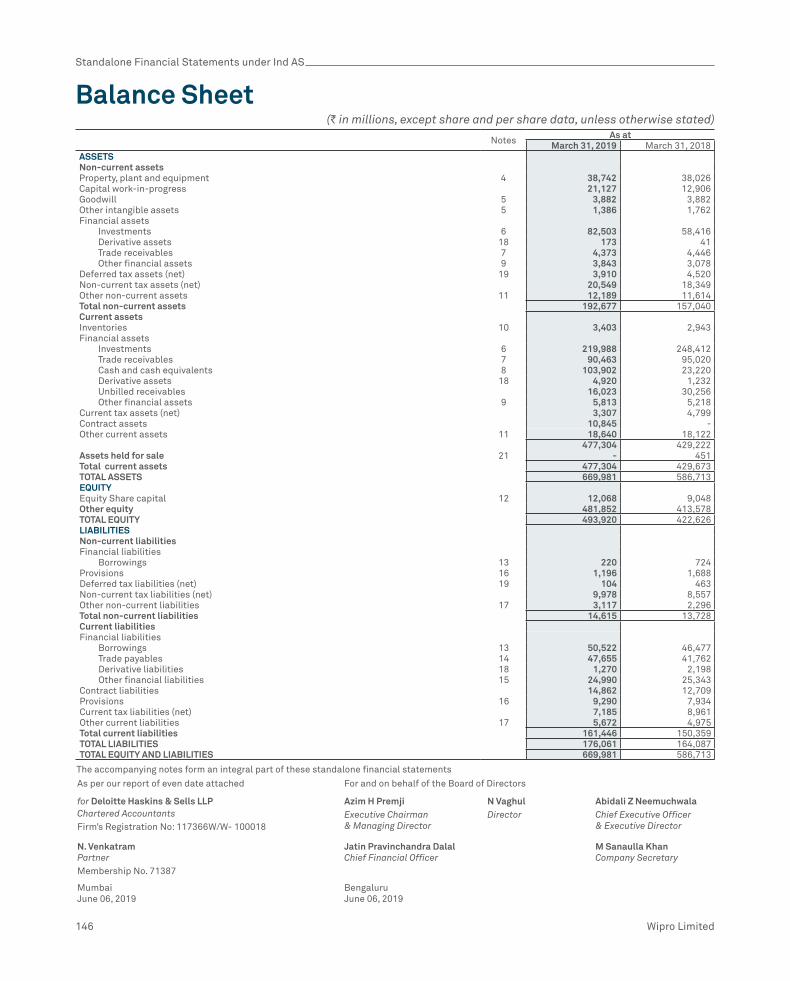
Standalone Financial Statements under Ind AS
146 Wipro Limited
Balance Sheet(` in millions, except share and per share data, unless otherwise stated)
Notes As atMarch 31, 2019 March 31, 2018
ASSETSNon-current assetsProperty, plant and equipment 4 38,742 38,026Capital work-in-progress 21,127 12,906Goodwill 5 3,882 3,882Other intangible assets 5 1,386 1,762Financial assets Investments 6 82,503 58,416 Derivative assets 18 173 41 Trade receivables 7 4,373 4,446 Other financial assets 9 3,843 3,078Deferred tax assets (net) 19 3,910 4,520Non-current tax assets (net) 20,549 18,349Other non-current assets 11 12,189 11,614Total non-current assets 192,677 157,040Current assetsInventories 10 3,403 2,943Financial assets Investments 6 219,988 248,412 Trade receivables 7 90,463 95,020 Cash and cash equivalents 8 103,902 23,220 Derivative assets 18 4,920 1,232 Unbilled receivables 16,023 30,256 Other financial assets 9 5,813 5,218Current tax assets (net) 3,307 4,799Contract assets 10,845 -Other current assets 11 18,640 18,122
477,304 429,222Assets held for sale 21 - 451Total current assets 477,304 429,673TOTAL ASSETS 669,981 586,713EQUITYEquity Share capital 12 12,068 9,048Other equity 481,852 413,578TOTAL EQUITY 493,920 422,626LIABILITIESNon-current liabilitiesFinancial liabilities Borrowings 13 220 724Provisions 16 1,196 1,688Deferred tax liabilities (net) 19 104 463Non-current tax liabilities (net) 9,978 8,557Other non-current liabilities 17 3,117 2,296Total non-current liabilities 14,615 13,728Current liabilitiesFinancial liabilities Borrowings 13 50,522 46,477 Trade payables 14 47,655 41,762 Derivative liabilities 18 1,270 2,198 Other financial liabilities 15 24,990 25,343Contract liabilities 14,862 12,709Provisions 16 9,290 7,934Current tax liabilities (net) 7,185 8,961Other current liabilities 17 5,672 4,975Total current liabilities 161,446 150,359TOTAL LIABILITIES 176,061 164,087TOTAL EQUITY AND LIABILITIES 669,981 586,713
The accompanying notes form an integral part of these standalone financial statements
As per our report of even date attached For and on behalf of the Board of Directors
for Deloitte Haskins & Sells LLP Azim H Premji N Vaghul Abidali Z NeemuchwalaChartered Accountants Executive Chairman
& Managing DirectorDirector Chief Executive Officer
& Executive DirectorFirm’s Registration No: 117366W/W- 100018
N. Venkatram Jatin Pravinchandra Dalal M Sanaulla KhanPartner Chief Financial Officer Company SecretaryMembership No. 71387
Mumbai BengaluruJune 06, 2019 June 06, 2019

Standalone Financial Statements under Ind AS
Annual Report 2018-19 147
Statement of Profit and Loss(` in millions, except share and per share data, unless otherwise stated)
Notes Year endedMarch 31, 2019 March 31, 2018
INCOMERevenue from operations 20 480,298 447,100Other operating income 21 940 -Other income 22 25,686 24,796Total Income 506,924 471,896EXPENSESPurchases of stock-in-trade 11,420 14,696Changes in inventories of finished goods and stock-in-trade 23 (553) 577Employee benefits expense 24 238,085 217,562Finance costs 25 5,249 3,843Depreciation and amortisation expense 9,343 10,148Sub-contracting / technical fees / third party application 89,225 78,623Travel 15,005 14,607Facility expenses 14,598 13,397Communication 3,698 4,136Legal and professional charges 2,525 3,078Marketing and brand building 2,304 2,596Other expenses 26 17,320 8,290Total expenses 408,219 371,553Profit before tax 98,705 100,343Tax expenseCurrent tax 19 22,725 24,345Deferred tax 19 (160) (1,230)Total tax expense 22,565 23,115Profit for the year 76,140 77,228Other comprehensive income (OCI)Items that will not be reclassified to profit or loss:Defined benefit plan actuarial gains/(losses) 24 169 746Net change in fair value of financial instruments through OCI 18 (1,473) (1,760)Income tax relating to items that will not be reclassified to profit or loss 19 34 160Items that will be reclassified to profit or loss:Net change in time value of option contracts designated as cash flow hedges 18 579 2Net change in intrinsic value of option contracts designated as cash flow hedges 18 1,014 (95)Net change in fair value of forward contracts designated as cash flow hedges 18 1,567 (7,368)Net change in fair value of financial instruments through OCI (8) (663)Income tax relating to items that will be reclassified to profit or loss 19 (636) 1,678Total other comprehensive (loss)/ income for the year, net of taxes 1,246 (7,300)Total comprehensive income for the year 77,386 69,928Earnings per equity share: (Equity shares of par value ` 2 each) 27Basic 12.67 12.19Diluted 12.64 12.17Number of sharesBasic 6,007,376,837 6,333,391,200Diluted 6,022,304,367 6,344,482,633
The accompanying notes form an integral part of these standalone financial statements
As per our report of even date attached For and on behalf of the Board of Directors
for Deloitte Haskins & Sells LLP Azim H Premji N Vaghul Abidali Z NeemuchwalaChartered Accountants Executive Chairman
& Managing DirectorDirector Chief Executive Officer
& Executive DirectorFirm’s Registration No: 117366W/W- 100018
N. Venkatram Jatin Pravinchandra Dalal M Sanaulla KhanPartner Chief Financial Officer Company SecretaryMembership No. 71387
Mumbai BengaluruJune 06, 2019 June 06, 2019

Standalone Financial Statements under Ind AS
148 Wipro Limited
Equ
ity
shar
e ca
pita
l
Bal
ance
as
at A
pril
1, 2
018
Cha
nge
in e
quit
y sh
are
capi
tal #
Bal
ance
as
at M
arch
31,
201
9
9,04
83,
020
12,0
68
Bal
ance
as
at A
pril
1, 2
017
Cha
nge
in e
quit
y sh
are
capi
tal #
Bal
ance
as
at M
arch
31,
201
8
4,86
14,
187
9,04
8
Oth
er e
quit
y
Res
erve
s an
d S
urpl
us
Par
ticu
lars
Shar
e ap
plic
atio
n m
oney
pe
ndin
g al
lotm
ent
Secu
ritie
s pr
emiu
m
rese
rve
Capi
tal
rese
rve
Capi
tal
rede
mpt
ion
rese
rve
Reta
ined
ea
rnin
gs
Com
mon
Co
ntro
l Tr
ansa
ctio
ns
Capi
tal
Rese
rve
Shar
e op
tions
ou
tsta
ndin
g re
serv
e
Spec
ial
econ
omic
Zon
e re
-inve
stm
ent
rese
rve
Fore
ign
curr
ency
tr
ansl
atio
n re
serv
e
Cash
flo
w
hedg
ing
rese
rve
Othe
r res
erve
Tota
l oth
er
equi
tyB
alan
ce a
s at
Apr
il 1,
201
8 ^
41
21,
139
781
407,
612
1,77
2-
1,88
2(1
07)
8741
3,57
8A
dju
stm
ent o
n ad
opti
on o
f Ind
AS
115
##
(1,6
05)
(1,6
05)
Ad
just
men
t on
acc
ount
of
mer
ger*
*(3
,448
)2,
473
(975
)A
djus
ted
bala
nce
as a
t A
pril
1, 2
018
-41
21,
139
781
402,
559
2,47
31,
772
-1,
882
(107
)87
410,
998
Pro
fit
for
the
year
--
--
76,1
40-
--
--
76,1
40O
ther
com
pre
hens
ive
inco
me
/ (l
oss)
--
--
--
--
2,53
1(1
,285
)1,
246
Tota
l com
preh
ensi
ve in
com
e fo
r the
yea
r-
--
-76
,140
--
-2,
531
(1,2
85)
77,3
86Is
sue
of e
qu
ity
sha
res
on
exe
rcis
e of
op
tion
s52
8(5
28)
-
Issu
e of
sh
ares
by
con
trol
led
tru
st o
n ex
erci
se o
f op
tion
s *
565
(565
)-
Cas
h d
ivid
end
pai
d (
incl
ud
ing
div
iden
d
tax
ther
eon)
(5,4
54)
(5,4
54)
Bon
us is
sue
of e
qui
ty s
hare
s(7
95)
(767
)(1
,454
)(3
,016
)
Com
pen
sati
on c
ost
rela
ted
to
emp
loye
e sh
are
bas
ed p
aym
ent
tran
sact
ions
1,93
81,
938
Tran
sfer
red
to
spec
ial
econ
omic
zon
e re
-inv
estm
ent
rese
rve
(28,
565)
28,5
65-
Bal
ance
as
at M
arch
31,
201
9 ^
14
51,
139
1444
3,79
12,
473
2,61
728
,565
1,88
22,
424
(1,1
98)
481,
852
# R
efer
not
e 28
## R
efer
Not
e 3
* 2,
599,
183
and
4,3
51,7
75 s
hare
s ha
ve b
een
issu
ed b
y th
e co
ntro
lled
tru
st t
o el
igib
le e
mp
loye
es o
n ex
erci
se o
f op
tion
s d
urin
g th
e ye
ar e
nded
Mar
ch 3
1, 2
019
and
201
8 re
spec
tive
ly.
** P
rofi
t on
tra
nsfe
r of
bus
ines
s b
etw
een
enti
ties
und
er c
omm
on c
ontr
ol t
aken
to
rese
rve.
^ Va
lue
is le
ss t
han
` 1
STA
TEM
EN
T O
F C
HA
NG
ES
IN E
QU
ITY
(` in
mill
ions
, exc
ept
shar
e an
d pe
r sha
re d
ata,
unl
ess
othe
rwis
e st
ated
)

Standalone Financial Statements under Ind AS
Annual Report 2018-19 149
STA
TEM
EN
T O
F C
HA
NG
ES
IN E
QU
ITY
(` in
mill
ions
, exc
ept
shar
e an
d pe
r sha
re d
ata,
unl
ess
othe
rwis
e st
ated
)
Res
erve
s an
d S
urp
lus
Par
ticu
lars
Sha
re
app
licat
ion
mon
ey
pen
din
g al
lotm
ent
Sha
re
pre
miu
m
rese
rve
Cap
ital
re
serv
e
Cap
ital
re
dem
pti
on
rese
rve
Ret
aine
d
earn
ings
Sha
re
bas
ed
pay
men
t re
serv
e
Sp
ecia
l ec
onom
ic
Zon
e re
-in
vest
men
t re
serv
e
Fore
ign
curr
ency
tr
ansl
atio
n re
serv
e
Cas
h fl
ow
hed
ging
re
serv
eO
ther
res
erve
Tota
l oth
er
equi
ty
Bala
nce
as a
t Apr
il 1,
201
7 ^
81
1,13
994
448,
164
3,55
5-
1,88
25,
906
1,37
446
2,19
5
Profi
t for
the
year
--
--
77,2
28-
--
--
77,2
28
Othe
r com
preh
ensi
ve in
com
e / (
loss
)-
--
--
--
-(6
,013
)(1
,287
)(7
,300
)
Tota
l com
preh
ensi
ve in
com
e fo
r the
year
--
--
77,2
28-
--
(6,0
13)
(1,2
87)
69,9
28
Issu
e of
equ
ity s
hare
s on
exe
rcis
e of
opt
ions
-1,
987
--
-(1
,971
)-
--
-16
Issu
e of
sha
res
by c
ontr
olle
d tr
ust
on e
xerc
ise
of o
ptio
ns
--
--
1,18
2(1
,182
)-
--
--
Cash
div
iden
d pa
id (i
nclu
ding
div
iden
d ta
x the
reon
)-
--
-(5
,446
)-
--
--
(5,4
46)
Buyb
ack
of e
quity
sha
res
-(1
,656
)-
687
(108
,344
)-
--
--
(109
,313
)
Tran
sact
ion
cost
rela
ted
to b
uyba
ck-
--
-(3
12)
--
--
-(3
12)
Bonu
s is
sue
of e
quity
sha
res
--
--
(4,8
66)
--
--
-(4
,866
)
Com
pens
atio
n cos
t rel
ated
to em
ploy
ee sh
are b
ased
pa
ymen
t tra
nsac
tions
--
--
61,
370
--
--
1,37
6
Tran
sfer
red
to sp
ecia
l eco
nom
ic zo
ne re
-inve
stm
ent
rese
rve
--
--
(20,
037)
-20
,037
--
--
Tran
sfer
red
from
spe
cial
eco
nom
ic z
one
re-
inve
stm
ent r
eser
ve o
n ut
ilisa
tion
--
--
20,0
37-
(20,
037)
--
--
Bala
nce
as a
t Mar
ch 3
1, 2
018
^
412
1,13
978
140
7,61
21,
772
-1,
882
(107
)87
413,
578
^ Va
lue
is le
ss th
an `
1
The
acco
mp
anyi
ng n
otes
form
an
inte
gral
par
t of
the
se s
tand
alon
e fi
nanc
ial s
tate
men
ts
As
per
our
rep
ort
of e
ven
dat
e at
tach
edFo
r an
d o
n b
ehal
f of
the
Boa
rd o
f D
irec
tors
for D
eloi
tte
Has
kins
& S
ells
LLP
Azi
m H
Pre
mji
N V
aghu
lA
bida
li Z
Nee
muc
hwal
a
Cha
rter
ed A
ccou
ntan
tsE
xecu
tive
Cha
irm
an
& M
anag
ing
Dir
ecto
rD
irec
tor
Chi
ef E
xecu
tive
Offi
cer
& E
xecu
tive
Dir
ecto
rFi
rm’s
Reg
istr
atio
n N
o: 1
1736
6W
/W-
1000
18
N. V
enka
tram
Jati
n P
ravi
ncha
ndra
Dal
alM
San
aulla
Kha
n
Par
tner
Chi
ef F
inan
cial
Offi
cer
Com
pany
Sec
reta
ry
Mem
ber
ship
No.
713
87
Mum
bai
Ben
galu
ru
June
06,
201
9Ju
ne 0
6, 2
019
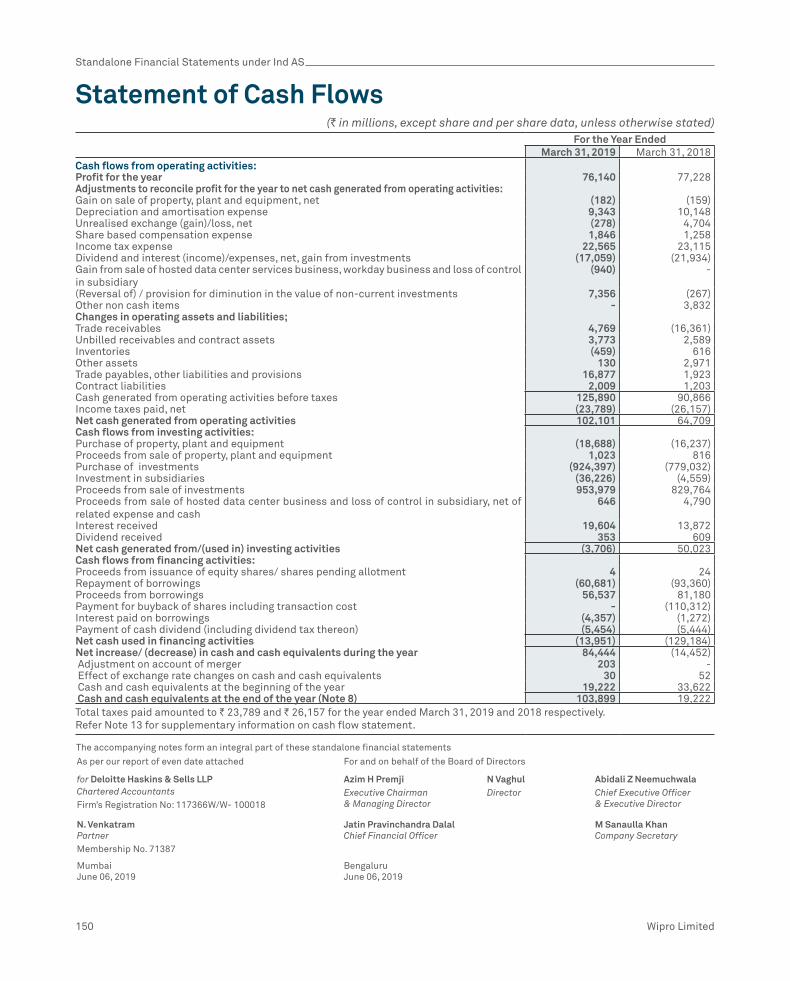
Standalone Financial Statements under Ind AS
150 Wipro Limited
Statement of Cash Flows(` in millions, except share and per share data, unless otherwise stated)
For the Year EndedMarch 31, 2019 March 31, 2018
Cash flows from operating activities:Profit for the year 76,140 77,228Adjustments to reconcile profit for the year to net cash generated from operating activities:Gain on sale of property, plant and equipment, net (182) (159)Depreciation and amortisation expense 9,343 10,148Unrealised exchange (gain)/loss, net (278) 4,704Share based compensation expense 1,846 1,258Income tax expense 22,565 23,115Dividend and interest (income)/expenses, net, gain from investments (17,059) (21,934)Gain from sale of hosted data center services business, workday business and loss of control in subsidiary
(940) -
(Reversal of) / provision for diminution in the value of non-current investments 7,356 (267)Other non cash items - 3,832Changes in operating assets and liabilities; Trade receivables 4,769 (16,361)Unbilled receivables and contract assets 3,773 2,589Inventories (459) 616Other assets 130 2,971Trade payables, other liabilities and provisions 16,877 1,923Contract liabilities 2,009 1,203Cash generated from operating activities before taxes 125,890 90,866Income taxes paid, net (23,789) (26,157)Net cash generated from operating activities 102,101 64,709Cash flows from investing activities:Purchase of property, plant and equipment (18,688) (16,237)Proceeds from sale of property, plant and equipment 1,023 816Purchase of investments (924,397) (779,032)Investment in subsidiaries (36,226) (4,559)Proceeds from sale of investments 953,979 829,764Proceeds from sale of hosted data center business and loss of control in subsidiary, net of related expense and cash
646 4,790
Interest received 19,604 13,872Dividend received 353 609Net cash generated from/(used in) investing activities (3,706) 50,023Cash flows from financing activities:Proceeds from issuance of equity shares/ shares pending allotment 4 24Repayment of borrowings (60,681) (93,360)Proceeds from borrowings 56,537 81,180Payment for buyback of shares including transaction cost - (110,312)Interest paid on borrowings (4,357) (1,272)Payment of cash dividend (including dividend tax thereon) (5,454) (5,444)Net cash used in financing activities (13,951) (129,184)Net increase/ (decrease) in cash and cash equivalents during the year 84,444 (14,452) Adjustment on account of merger 203 - Effect of exchange rate changes on cash and cash equivalents 30 52 Cash and cash equivalents at the beginning of the year 19,222 33,622 Cash and cash equivalents at the end of the year (Note 8) 103,899 19,222Total taxes paid amounted to ` 23,789 and ` 26,157 for the year ended March 31, 2019 and 2018 respectively.Refer Note 13 for supplementary information on cash flow statement.
The accompanying notes form an integral part of these standalone financial statements
As per our report of even date attached For and on behalf of the Board of Directors
for Deloitte Haskins & Sells LLP Azim H Premji N Vaghul Abidali Z NeemuchwalaChartered Accountants Executive Chairman
& Managing DirectorDirector Chief Executive Officer
& Executive DirectorFirm’s Registration No: 117366W/W- 100018
N. Venkatram Jatin Pravinchandra Dalal M Sanaulla KhanPartner Chief Financial Officer Company SecretaryMembership No. 71387
Mumbai BengaluruJune 06, 2019 June 06, 2019
Standalone Financial Statements under Ind AS
Annual Report 2018-19 151
(` in millions, except share and per share data, unless otherwise stated)
Notes to the Standalone financial statements
1. The Company overview
Wipro Limited (“Wipro” or the “Company”), is a global information technology (IT), consulting and business process services (BPS) company.
Wipro is a public limited company incorporated and domiciled in India. The address of its registered office is Wipro Limited, Doddakannelli, Sarjapur Road, Bengaluru – 560 035, Karnataka, India. Wipro has its primary listing with BSE Ltd. (Bombay Stock Exchange) and National Stock Exchange of India Ltd. The Company’s American Depository Shares representing equity shares are also listed on the New York Stock Exchange.
These financial statements were authorised for issue by the Board of Directors on June 6, 2019.
2. Basis of preparation of financial statements
(i) Statement of compliance and basis of preparation
The Standalone financial statements have been prepared in accordance with Indian Accounting Standards (“Ind AS”), the provisions of the Companies Act, 2013 (“the Companies Act”), as applicable and guidelines issued by the Securities and Exchange Board of India (“SEBI”). The Ind AS are prescribed under Section 133 of the Act read with Rule 3 of the Companies (Indian Accounting Standards) Rules, 2015 and Companies (Indian Accounting Standards) Amendment Rules, 2016.
Accounting policies have been applied consistently to all periods presented in these financial statements, except for new accounting standards adopted by the Company.
The financial statements correspond to the classification provisions contained in Ind AS 1, “Presentation of Financial Statements”. For clarity, various items are aggregated in the statement of profit and loss and balance sheet. These items are disaggregated separately in the notes to the financial statements, where applicable.
All amounts included in the financial statements are reported in millions of Indian rupees (` in millions) except share and per share data, unless otherwise stated. Due to rounding off, the numbers presented throughout the document may not add up precisely to the totals and percentages may not precisely reflect the absolute figures. Previous year figures have been regrouped/re-arranged, wherever necessary.
(ii) Basis of measurement
These financial statements have been prepared on a historical cost convention and on an accrual basis,
except for the following material items which have been measured at fair value as required by relevant Ind AS:
a) Derivative financial instruments;
b) Financial instruments classified as fair value through other comprehensive income or fair value through profit or loss; and
c) The defined benefit asset/(liability) is recognised as the present value of defined benefit obligation less fair value of plan assets.
(iii) Use of estimates and judgment
The preparation of the financial statements in conformity with Ind AS requires management to make judgments, estimates and assumptions that affect the application of accounting policies and the reported amounts of assets, liabilities, income and expenses. Actual results may differ from those estimates.
Estimates and underlying assumptions are reviewed on an ongoing basis. Revisions to accounting estimates are recognised in the period in which the estimates are revised and in any future periods affected. In particular, information about significant areas of estimation, uncertainty and critical judgments in applying accounting policies that have the most significant effect on the amounts recognised in the financial statements are included in the following notes:
a) Revenue recognition:The Company applies judgement to determine whether each product or service promised to a customer is capable of being distinct, and are distinct in the context of the contract, if not, the promised product or services are combined and accounted as a single performance obligation. The Company allocates the arrangement consideration to separately identifiable performance obligation deliverables based on their relative stand-alone selling price. In cases where the Company is unable to determine the stand-alone selling price, the Company uses expected cost-plus margin approach in estimating the stand-alone selling price. The Company uses the percentage of completion method using the input (cost expended) method to measure progress towards completion in respect of fixed price contracts. Percentage of completion method accounting relies on estimates of total expected contract revenue and costs. This method is followed when reasonably
Standalone Financial Statements under Ind AS
152 Wipro Limited
dependable estimates of the revenues and costs applicable to various elements of the contract can be made. Key factors that are reviewed in estimating the future costs to complete include estimates of future labor costs and productivity efficiencies. Because the financial reporting of these contracts depends on estimates that are assessed continually during the term of these contracts, revenue recognised, profit and timing of revenue for remaining performance obligations are subject to revisions as the contract progresses to completion. When estimates indicate that a loss will be incurred, the loss is provided for in the period in which the loss becomes probable. Volume discounts are recorded as a reduction of revenue. When the amount of discount varies with the levels of revenue, volume discount is recorded based on estimate of future revenue from the customer.
b) Impairment testing: Investments in subsidiaries, goodwill and intangible assets are tested for impairment at least annually and when events occur or changes in circumstances indicate that the recoverable amount of the asset or the cash generating unit to which these pertain is less than its carrying value. The recoverable amount of the asset or the cash generating units is higher of value in use and fair value less cost of disposal. The calculation of value in use of a cash generating unit involves use of significant estimates and assumptions which includes turnover, growth rates and net margins used to calculate projected future cash flows, risk-adjusted discount rate, future economic and market conditions.
c) Income taxes: The major tax jurisdictions for the Company are India and the United States of America. Significant judgments are involved in determining the provision for income taxes including judgment on whether tax positions are probable of being sustained in tax assessments. A tax assessment can involve complex issues, which can only be resolved over extended time periods.
d) Deferred taxes: Deferred tax is recorded on temporary differences between the tax bases of assets and liabilities and their carrying amounts, at the rates that have been enacted or substantively enacted at the reporting date. The ultimate realization of deferred tax assets is dependent upon the generation of future taxable profits during the periods in which those temporary differences and tax loss carry-forwards become deductible. The Company considers the expected reversal of deferred tax liabilities and projected future taxable income in making this assessment. The amount of
the deferred tax assets considered realisable, however, could be reduced in the near term if estimates of future taxable income during the carry-forward period are reduced.
e) Defined benefit plans and compensated absences: The cost of the defined benefit plans, compensated absences and the present value of the defined benefit obligations are based on actuarial valuation using the projected unit credit method. An actuarial valuation involves making various assumptions that may differ from actual developments in the future. These include the determination of the discount rate, future salary increases and mortality rates. Due to the complexities involved in the valuation and its long-term nature, a defined benefit obligation is highly sensitive to changes in these assumptions. All assumptions are reviewed at each reporting date.
f) Expected credit losses on financial assets: The impairment provisions of financial assets are based on assumptions about risk of default and expected timing of collection. The Company uses judgment in making these assumptions and selecting the inputs to the impairment calculation, based on the Company’s history of collections, customer’s creditworthiness, existing market conditions as well as forward looking estimates at the end of each reporting period.
g) Measurement of fair value of non-marketable equity investments: These instruments are initially recorded at cost and subsequently measured at fair value. Fair value of investments is determined using the market and income approaches. The market approach includes the use of financial metrics and ratios of comparable companies, such as revenue, earnings, comparable performance multiples, recent financial rounds and the level of marketability of the investments. The selection of comparable companies requires management judgment and is based on a number of factors, including comparable company sizes, growth rates and development stages. The income approach includes the use of discounted cash flow model, which requires significant estimates regarding the investees’ revenue, costs, and discount rates based on the risk profile of comparable companies. Estimates of revenue and costs are developed using available historical and forecast data.
h) Useful lives of property, plant and equipment: The Company depreciates property, plant and equipment on a straight-line basis over estimated useful lives of the assets. The charge in respect of periodic depreciation is derived

Standalone Financial Statements under Ind AS
Annual Report 2018-19 153
based on an estimate of an asset’s expected useful life and the expected residual value at the end of its life. The lives are based on historical experience with similar assets as well as anticipation of future events, which may impact their life, such as changes in technology. The estimated useful life is reviewed at least annually.
i) Useful lives of intangible assets:The Company amortises intangible assets on a straight-line basis over estimated useful lives of the assets. The useful life is estimated based on a number of factors including the effects of obsolescence, demand, competition and other economic factors such as the stability of the industry and known technological advances and the level of maintenance expenditures required to obtain the expected future cash flows from the assets. The estimated useful life is reviewed at least annually.
j) Other estimates: The share-based compensation expense is determined based on the Company’s estimate of equity instruments that will eventually vest. Fair valuation of derivative hedging instruments designated as cash flow hedges involves significant estimates relating to the occurrence of forecast transaction.
3. Significant accounting policies
(i) Functional and presentation currency
These financial statements are presented in Indian rupees, which is the functional currency of the Company.
(ii) Foreign currency transactions and translation
Transactions in foreign currency are translated into the functional currency using the exchange rates prevailing at the date of the transaction. Foreign exchange gains and losses resulting from the settlement of such transactions and from translation at the exchange rates prevailing at the reporting date of monetary assets and liabilities denominated in foreign currencies are recognised in the statement of profit and loss and reported within foreign exchange gains/(losses), net, within results of operating activities except when deferred in other comprehensive income as qualifying cash flow hedges and qualifying net investment hedges. Gains/(losses), net, relating to translation or settlement of borrowings denominated in foreign currency are reported within finance expense. Non-monetary assets and liabilities denominated in foreign currency and measured at historical cost are translated at the exchange rate prevalent at the date of transaction. Translation differences on non-monetary financial assets measured at fair value at the reporting date, such as equities classified as financial instruments
measured at fair value through other comprehensive income are included in other comprehensive income, net of taxes.
(iii) Financial instruments
a) Non-derivative financial instruments:
Non-derivative financial instruments consist of:
• financial assets, which include cash and cash equivalents, trade receivables, unbilled receivables, finance lease receivables, employee and other advances, investments in equity and debt securities and eligible current and non-current assets; Financial assets are derecognised when substantial risks and rewards of ownership of the financial asset have been transferred. In cases where substantial risks and rewards of ownership of the financial assets are neither transferred nor retained, financial assets are derecognised only when the Company has not retained control over the financial asset.
• financial liabilities, which include long and short-term loans and borrowings, bank overdrafts, trade payables, eligible current and non-current liabilities.
• Non- derivative financial instruments are recognised initially at fair value.
Subsequent to initial recognition, non-derivative financial instruments are measured as described below:
A. Cash and cash equivalents
The Company’s cash and cash equivalents consist of cash on hand and in banks and demand deposits with banks, which can be withdrawn at any time, without prior notice or penalty on the principal.
For the purposes of the cash flow statement, cash and cash equivalents include cash on hand, in banks and demand deposits with banks, net of outstanding bank overdrafts that are repayable on demand and are considered part of the Company’s cash management system. In the balance sheet, bank overdrafts are presented under borrowings within current liabilities.
B. Investments
Financial instruments measured at amortised cost:
Debt instruments that meet the following criteria are measured at amortised cost (except for debt instruments that are designated at fair value through Profit or Loss (FVTPL) on initial recognition):
• the asset is held within a business model

Standalone Financial Statements under Ind AS
154 Wipro Limited
whose objective is to hold assets in order to collect contractual cash flows; and
• the contractual terms of the instrument give rise on specified dates to cash flows that are solely payment of principal and interest on the principal amount outstanding.
Financial instruments measured at fair value through other comprehensive income (FVTOCI):
Debt instruments that meet the following criteria are measured at fair value through other comprehensive income (FVTOCI) (except for debt instruments that are designated at fair value through Profit or Loss (FVTPL) on initial recognition)
• the asset is held within a business model whose objective is achieved both by collecting contractual cash flows and selling the financial asset; and
• the contractual terms of the instrument give rise on specified dates to cash flows that are solely payment of principal and interest on the principal amount outstanding.
Interest income is recognised in statement of profit and loss for FVTOCI debt instruments. Other changes in fair value of FVTOCI financial assets are recognised in other comprehensive income. When the investment is disposed of, the cumulative gain or loss previously accumulated in reserves is transferred to statement of profit and loss.
Financial instruments measured at fair value through profit or loss (FVTPL):
Instruments that do not meet the amortised cost or FVTOCI criteria are measured at FVTPL. Financial assets at FVTPL are measured at fair value at the end of each reporting period, with any gains or losses arising on re-measurement recognised in statement of profit and loss. The gain or loss on disposal is recognised in statement of profit and loss.
Interest income is recognised in statement of profit and loss for FVTPL debt instruments. Dividend on financial assets at FVTPL is recognised when the Company’s right to receive dividend is established.
Investments in equity instruments designated to be classified as FVTOCI:
The Company carries certain equity instruments which are not held for trading. The Company has elected the FVTOCI irrevocable option for these instruments. Movements in fair value
of these investments are recognised in other comprehensive income and the gain or loss is not reclassified to statement of profit and loss on disposal of these investments. Dividends from these investments are recognised in statement of profit and loss when the Company’s right to receive dividends is established.
Investments in subsidiaries:
Investment in subsidiaries are measured at cost less impairment.
C. Other financial assets:
Other financial assets are non-derivative financial assets with fixed or determinable payments that are not quoted in an active market. They are presented as current assets, except for those maturing later than 12 months after the reporting date which are presented as non-current assets. These are initially recognised at fair value and subsequently measured at amortised cost using the effective interest method, less any impairment losses. These comprise trade receivables, unbilled receivables and other assets.
D. Trade and other payables
Trade and other payables are initially recognised at fair value, and subsequently carried at amortised cost using the effective interest method. For these financial instruments, the carrying amounts approximate fair value due to the short-term maturity of these instruments.
b) Derivative financial instruments
The Company is exposed to foreign currency fluctuations on foreign currency assets, liabilities, net investment in foreign operations and forecasted cash flows denominated in foreign currency.
The Company limits the effect of foreign exchange rate fluctuations by following established risk management policies including the use of derivatives. The Company enters into derivative financial instruments where the counterparty is primarily a bank.
Derivatives are recognised and measured at fair value. Attributable transaction costs are recognised in statement of profit and loss as cost.
Subsequent to initial recognition, derivative financial instruments are measured as described below:
A. Cash flow hedges
Changes in the fair value of the derivative hedging instrument designated as a cash flow hedge are recognised in other comprehensive income and held in cash flow hedging reserve, net of taxes, a component of equity, to the

Standalone Financial Statements under Ind AS
Annual Report 2018-19 155
extent that the hedge is effective. To the extent that the hedge is ineffective, changes in fair value are recognised in the statement of profit and loss and reported within foreign exchange gains/(losses), net, within results from operating activities. If the hedging instrument no longer meets the criteria for hedge accounting, then hedge accounting is discontinued prospectively. If the hedging instrument expires or is sold, terminated or exercised, the cumulative gain or loss on the hedging instrument recognised in cash flow hedging reserve till the period the hedge was effective remains in cash flow hedging reserve until the forecasted transaction occurs. The cumulative gain or loss previously recognised in the cash flow hedging reserve is transferred to the statement of profit and loss upon the occurrence of the related forecasted transaction. If the forecasted transaction is no longer expected to occur, such cumulative balance is immediately recognised in the statement of profit and loss.
B. Others
Changes in fair value of foreign currency derivative instruments not designated as cash flow hedges are recognised in the statement of profit and loss and reported within foreign exchange gains/(losses), net, within results from operating activities.
Changes in fair value and gains/(losses), net, on settlement of foreign currency derivative instruments relating to borrowings, which have not been designated as hedges are recorded in finance expense.
c) Derecognition of financial instruments
The Company derecognises a financial asset when the contractual rights to the cash flows from the financial asset expires or it transfers the financial asset and the transfer qualifies for derecognition under Ind AS 109. If the Company retains substantially all the risks and rewards of a transferred financial asset, the Company continues to recognise the financial asset and also recognises a borrowing for the proceeds received. A financial liability (or a part of a financial liability) is derecognised from the Company’s balance sheet when the obligation specified in the contract is discharged or cancelled or expires.
(iv) Equity
a) Share capital and securities premium reserve
The authorised share capital of the Company as at March 31, 2019 is ` 25,274 divided into 12,504,500,000 equity shares of ̀ 2 each, 25,000,000 preference shares of ` 10 each and 150,000, 10% optionally convertible cumulative preference shares of ` 100 each. Par value of the equity shares is
recorded as share capital and the amount received in excess of par value is classified as securities premium.
Every holder of the equity shares, as reflected in the records of the Company as of the date of the shareholder meeting shall have one vote in respect of each share held for all matters submitted to vote in the shareholder meeting.
b) Capital Reserve
Capital reserve amounting to ̀ 1,139 (March 31, 2018: ` 1,139) is not freely available for distribution.
c) Capital Redemption Reserve
Capital redemption reserve amounting to ̀ 14 (March 31, 2018: ̀ 781) is not freely available for distribution.
d) Retained earnings
Retained earnings comprises of the Company’s undistributed earnings after taxes.
e) Common Control Transactions Capital Reserve
The Common Control Transactions Capital Reserve is on account of merger as explained in footnotes to Note 32. This reserve amounting to ̀ 2,473 (March 31, 2018: ` Nil) is not freely available for distribution.
f) Share options outstanding account
The share options oustanding account is used to record the value of equity-settled share-based payment transactions with employees. The amounts recorded in share options oustanding account are transferred to securities premium upon exercise of stock options and restricted stock unit options by employees.
g) Special Economic Zone Re-Investment reserve
The Special Economic Zone Re-Investment Reserve has been created out of profit of eligible SEZ units as per provisions of section 10AA (1)(ii) of the Income–tax Act, 1961 for acquiring new plant and machinery. The reserve has also been utilised for other business purposes of SEZ units as per provisions of section 10AA of the Income-tax Act, 1961 till the time the said reserve is utilised completely for the purposes of purchasing new plant and machinery. This reserve is not freely available for distribution.
h) Other reserves
Changes in the fair value of financial instruments measured at fair value through other comprehensive income and actuarial gains and losses on defined benefit plans are recognised in other comprehensive income (net of taxes) and presented within equity as other reserves.
i) Cash flow hedging reserve
Changes in fair value of derivative hedging instruments designated and effective as a cash flow hedge are recognised in other comprehensive income (net of

Standalone Financial Statements under Ind AS
156 Wipro Limited
taxes) and presented within equity as cash flow hedging reserve.
j) Foreign currency translation reserve (FCTR)
The exchange differences arising from the translation of financial statements of foreign operations with functional currency other than Indian rupees is recognised in other comprehensive income, net of taxes and is presented within equity in the FCTR.
k) Dividend
A final dividend, including tax thereon, on equity shares is recorded as a liability on the date of approval by the shareholders. An interim dividend, including tax thereon, is recorded as a liability on the date of declaration by the Board of directors.
l) Buyback of equity shares
The buyback of equity shares and related transaction costs are recorded as a reduction of free reserves. Further, capital redemption reserves is created as an apportionment from retained earnings.
m) Bonus Issue
For the purpose of bonus issue, the amount is transferred from capital redemption reserves, securities premium reserve and retained earnings to the share capital.
(v) Property, plant and equipment
a) Recognition and measurement
Property, plant and equipment are measured at cost less accumulated depreciation and impairment losses, if any. Cost includes expenditures directly attributable to the acquisition of the asset. General and specific borrowing costs directly attributable to the construction of a qualifying asset are capitalised as part of the cost.
b) Depreciation
The Company depreciates property, plant and equipment over the estimated useful life on a straight-line basis from the date the assets are available for use. Assets acquired under finance lease and leasehold improvements are amortised over the shorter of estimated useful life of the asset or the related lease term. Term licenses are amortised over their respective contract term. Freehold land is not depreciated. The estimated useful life of assets is reviewed and where appropriate are adjusted, annually. The estimated useful lives of assets are as follows:
Category Useful lifeBuildings 28 to 40 yearsPlant and machinery 5 to 21 yearsComputer equipment and software
2 to 7 years
Furniture, fixtures and equipment 3 to 10 yearsVehicles 4 to 5 years
When parts of an item of property, plant and equipment have different useful lives, they are accounted for as separate items (major components) of property, plant and equipment. Subsequent expenditure relating to property, plant and equipment is capitalised only when it is probable that future economic benefits associated with these will flow to the Company and the cost of the item can be measured reliably.
Deposits and advances paid towards the acquisition of property, plant and equipment outstanding as at each reporting date and the cost of property, plant and equipment not available for use before such date are disclosed under capital work- in-progress.
(vi) Business combination, Goodwill and Intangible assets
a) Business combination
Business combinations are accounted for using the purchase (acquisition) method. The cost of an acquisition is measured as the fair value of the assets transferred, liabilities incurred or assumed and equity instruments issued at the date of exchange by the Company. Identifiable assets acquired and liabilities and contingent liabilities assumed in a business combination are measured initially at fair value at the date of acquisition. Transaction costs incurred in connection with a business acquisition are expensed as incurred.
The cost of an acquisition also includes the fair value of any contingent consideration measured as at the date of acquisition. Any subsequent changes to the fair value of contingent consideration classified as liabilities, other than measurement period adjustments, are recognised in the statement of profit and loss.
Common Control business combinations
The Company accounts for business combinations involving entities or businesses under common control using the pooling of interests method. The assets and liabilities of the combining entities are reflected at their carrying amounts. The identity of the reserves are preserved and appear in the financial statements of the transferee in the same form in which they appeared in the financial statements of the transferor. The difference, if any, between the amount recorded as share capital issued plus any additional consideration in the form of cash or other assets and the amount of share capital of the transferor is transferred to capital reserve and is presented separately as Common Control Transactions Capital reserve.
b) Goodwill
The excess of the cost of an acquisition over the Company’s share in the fair value of the acquiree’s identifiable assets and liabilities is recognised as

Standalone Financial Statements under Ind AS
Annual Report 2018-19 157
goodwill. If the excess is negative, a bargain purchase gain is recognised in equity as capital reserve. Goodwill is measured at cost less accumulated impairment (if any).
Goodwill associated with the disposal of an operation that is part of cash-generating unit is measured on the basis of the relative values of the operation disposed of and the portion of the cash-generating unit retained, unless the entity can demonstrate that some other method better reflects the goodwill associated with the operation disposed of.
c) Intangible assets
Intangible assets acquired separately are measured at cost of acquisition. Intangible assets acquired in a business combination are measured at fair value as at the date of acquisition. Following initial recognition, intangible assets are carried at cost less accumulated amortization and impairment losses, if any.
The amortization of an intangible asset with a finite useful life reflects the manner in which the economic benefit is expected to be generated.
The estimated useful life of amortisable intangibles is reviewed and where appropriate are adjusted, annually. The estimated useful lives of the amortisable intangible assets for the current and comparative periods are as follows:
Category Useful lifeCustomer related intangibles 5 to 10 yearsMarketing related intangibles 3 to 5 years
Goodwill and intangible assets, if any, associated with an operation disposed shall be measured on the basis of the relative values of the operation disposed of and the portion of the cash-generating unit retained, unless the entity can demonstrate that some other method better reflects the goodwill associated with the operation disposed of.
(vii) Leases
The determination of whether an arrangement is, or contains, a lease is based on the substance of the arrangement at the inception date. The arrangement is, or contains a lease if, fulfillment of the arrangement is dependent on the use of a specific asset or assets or the arrangement conveys a right to use the asset or assets, even if that right is not explicitly specified in an arrangement.
a) Arrangements where the Company is the lessee
Leases of property, plant and equipment, where the Company assumes substantially all the risks and rewards of ownership are classified as finance leases. Finance leases are capitalised at lower of the fair value of the leased property and the present value
of the minimum lease payments. Lease payments are apportioned between the finance charge and the outstanding liability. The finance charge is allocated to periods during the lease term at a constant periodic rate of interest on the remaining balance of the liability.
Leases where the lessor retains substantially all the risks and rewards of ownership are classified as operating leases. Payments made under operating leases are recognised in the statement of profit and loss on a straight-line basis over the lease term.
b) Arrangements where the Company is the lessor
In certain arrangements, the Company recognises revenue from the sale of products given under finance leases. The Company records gross finance receivables, unearned income and the estimated residual value of the leased equipment on consummation of such leases. Unearned income represents the excess of the gross finance lease receivable plus the estimated residual value over the sales price of the equipment. The Company recognises unearned income as finance income over the lease term using the effective interest method.
(viii) Inventories
Inventories are valued at lower of cost and net realisable value, including necessary provision for obsolescence. Cost is determined using the weighted average method.
(ix) Impairment
A) Financial assets
The Company applies the expected credit loss model for recognizing impairment loss on financial assets measured at amortised cost, debt instruments classified as FVTOCI, lease receivables, trade receivables, contract assets and other financial assets. Expected credit loss is the difference between the contractual cash flows and the cash flows that the entity expects to receive discounted using effective interest rate.
Loss allowances for trade receivables, contract assets and lease receivables are measured at an amount equal to lifetime expected credit losses. Lifetime expected credit losses are the expected credit losses that result from all possible default events over the expected life of a financial instrument. Lifetime expected credit loss is computed based on a provision matrix which takes in to the account risk profiling of customers and historical credit loss experience adjusted for forward looking information. For other financial assets, expected credit loss is measured at the amount equal to twelve months expected credit loss unless there has been a significant increase in credit risk from initial

Standalone Financial Statements under Ind AS
158 Wipro Limited
recognition, in which case those are measured at lifetime expected credit loss.
B) Impairment of Investment in subsidiaries
The Company assesses investments in subsidiaries for impairment whenever events or changes in circumstances indicate that the carrying amount of the investment may not be recoverable. If any such indication exists, the Company estimates the recoverable amount of the investment in subsidiary. The recoverable amount of such investment is the higher of its fair value less cost of disposal (FVLCD) and its value-in-use (VIU). The VIU of the investment is calculated using projected future cash flows. If the recoverable amount of the investment is less than its carrying amount, the carrying amount is reduced to its recoverable amount. The reduction is treated as an impairment loss and is recognised in the statement of profit and loss.
C) Non - financial assets
The Company assesses long-lived assets such as property, plant and equipment and acquired intangible assets for impairment whenever events or changes in circumstances indicate that the carrying amount of an asset or group of assets may not be recoverable. If any such indication exists, the Company estimates the recoverable amount of the asset or group of assets. The recoverable amount of an asset or cash generating unit is the higher of its fair value less cost of disposal (FVLCD) and its value-in-use (VIU). The VIU of long-lived assets is calculated using projected future cash flows. FVLCD of a cash generating unit is computed using turnover and earnings multiples. If the recoverable amount of the asset or the recoverable amount of the cash generating unit to which the asset belongs is less than its carrying amount, the carrying amount is reduced to its recoverable amount. The reduction is treated as an impairment loss and is recognised in the statement of profit and loss. If at the reporting date, there is an indication that a previously assessed impairment loss no longer exists, the recoverable amount is reassessed and the impairment losses previously recognised are reversed such that the asset is recognised at its recoverable amount but not exceeding written down value which would have been reported if the impairment losses had not been recognised initially.
Goodwill is tested for impairment at least annually at the same time and when events occur or changes in circumstances indicate that the recoverable amount of the cash generating unit is less than its carrying value. The goodwill impairment test is performed at the level of cash-generating unit or groups of
cash-generating units which represent the lowest level at which goodwill is monitored for internal management purposes. An impairment in respect of goodwill is not reversed.
(x) Employee benefits
a) Post-employment and pension plans
The Company participates in various employee benefit plans. Pensions and other post-employment benefits are classified as either defined contribution plans or defined benefit plans. Under a defined contribution plan, the Company’s only obligation is to pay a fixed amount with no obligation to pay further contributions if the fund does not hold sufficient assets to pay all employee benefits. The related actuarial and investment risks are borne by the employee. The expenditure for defined contribution plans is recognised as an expense during the period when the employee provides service. Under a defined benefit plan, it is the Company’s obligation to provide agreed benefits to the employees. The related actuarial and investment risks are borne by the Company. The present value of the defined benefit obligations is calculated by an independent actuary using the projected unit credit method.
Re-measurement comprising actuarial gains or losses and the return on plan assets (excluding interest) are immediately recognised in other comprehensive income, net of taxes and permanently excluded from profit or loss. Instead net interest recognised in profit or loss is calculated by applying the discount rate used to measure the defined benefit obligation to the net defined benefit liability or asset. The actual return on the plan assets above or below the discount rate is recognised as part of re-measurement of net defined liability or asset through other comprehensive income, net of taxes.
The Company has the following employee benefit plans:
A. Provident fund
Employees receive benefits from a provident fund, which is a defined benefit plan. The employer and employees each make periodic contributions to the plan. A portion of the contribution is made to the approved provident fund trust managed by the Company while the remainder of the contribution is made to the government administered pension fund. The contributions to the trust managed by the Company is accounted for as a defined benefit plan as the Company is liable for any shortfall in the fund assets based on the government specified minimum rates of return.
B. Superannuation
Superannuation plan, a defined contribution scheme is administered by third party fund

Standalone Financial Statements under Ind AS
Annual Report 2018-19 159
managers. The Company makes annual contributions based on a specified percentage of each eligible employee’s salary.
C. Gratuity
In accordance with the Payment of Gratuity Act, 1972, applicable for Indian companies, the Company provides for a lump sum payment to eligible employees, at retirement or termination of employment based on the last drawn salary and years of employment with the Company. The gratuity fund is managed by the third-party fund managers. The Company’s obligation in respect of the gratuity plan, which is a defined benefit plan, is provided for based on actuarial valuation using the projected unit credit method. The Company recognises actuarial gains and losses in other comprehensive income, net of taxes.
b) Termination benefits
Termination benefits are expensed when the Company can no longer withdraw the offer of those benefits.
c) Short-term benefits
Short-term employee benefit obligations are measured on an undiscounted basis and are recorded as expense as the related service is provided. A liability is recognised for the amount expected to be paid under short-term cash bonus or profit-sharing plans, if the Company has a present legal or constructive obligation to pay this amount as a result of past service provided by the employee and the obligation can be estimated reliably.
d) Compensated absences
The employees of the Company are entitled to compensated absences. The employees can carry forward a portion of the unutilised accumulating compensated absences and utilise it in future periods or receive cash at retirement or termination of employment. The Company records an obligation for compensated absences in the period in which the employee renders the services that increases this entitlement. The Company measures the expected cost of compensated absences as the additional amount that the Company expects to pay as a result of the unused entitlement that has accumulated at the end of the reporting period. The Company recognises accumulated compensated absences based on actuarial valuation using the projected unit credit method. Non-accumulating compensated absences are recognised in the period in which the absences occur.
(xi) Share based payment transactions
Selected employees of the Company receive remuneration in the form of equity settled instruments, for rendering services over a defined
vesting period and for company’s performance-based stock options over the defined period. Equity instruments granted are measured by reference to the fair value of the instrument at the date of grant. In cases, where equity instruments are granted at a nominal exercise price, the intrinsic value on the date of grant approximates the fair value. The expense is recognised in the statement of profit and loss with a corresponding increase to the share options outstanding account, a component of equity.
The equity instruments generally vest in a graded manner over the vesting period. The fair value determined at the grant date is expensed over the vesting period of the respective tranches of such grants (accelerated amortisation). The stock compensation expense is determined based on the Company’s estimate of equity instruments that will eventually vest.
(xii) Provisions
Provisions are recognised when the Company has a present obligation (legal or constructive) as a result of a past event, it is probable that an outflow of economic benefits will be required to settle the obligation and a reliable estimate can be made of the amount of the obligation.
The amount recognised as a provision is the best estimate of the consideration required to settle the present obligation at the end of the reporting period, taking into account the risks and uncertainties surrounding the obligation.
When some or all of the economic benefits required to settle a provision are expected to be recovered from a third party, the receivable is recognised as an asset, if it is virtually certain that reimbursement will be received and the amount of the receivable can be measured reliably.
Provisions for onerous contracts are recognised when the expected benefits to be derived by the Company from a contract are lower than the unavoidable costs of meeting the future obligations under the contract. Provisions for onerous contracts are measured at the present value of lower of the expected net cost of fulfilling the contract and the expected cost of terminating the contract.
(xiii) Revenue
The Company derives revenue primarily from software development, maintenance of software/hardware and related services, business process services, sale of IT and other products.
Revenue is recognised upon transfer of control of promised products or services to customers in an amount that reflects the consideration the Company expects to receive in exchange for those products or services. To recognise revenues, the Company applies

Standalone Financial Statements under Ind AS
160 Wipro Limited
the following five step approach: (1) identify the contract with a customer, (2) identify the performance obligations in the contract, (3) determine the transaction price, (4) allocate the transaction price to the performance obligations in the contract, and (5) recognise revenues when a performance obligation is satisfied.
At contract inception, the Company assesses its promise to transfer products or services to a customer to identify separate performance obligations. The Company applies judgement to determine whether each product or service promised to a customer is capable of being distinct, and are distinct in the context of the contract, if not, the promised products or services are combined and accounted as a single performance obligation. The Company allocates the arrangement consideration to separately identifiable performance obligations based on their relative stand-alone selling price or residual method. Stand-alone selling prices are determined based on sale prices for the components when it is regularly sold separately. In cases where the Company is unable to determine the stand-alone selling price, the Company uses third-party prices for similar deliverables or the company uses expected cost-plus margin approach in estimating the stand-alone selling price.
For performance obligations where control is transferred over time, revenues are recognised by measuring progress towards completion of the performance obligation. The selection of the method to measure progress towards completion requires judgment and is based on the nature of the promised products or services to be provided.
The method for recognizing revenues and costs depends on the nature of the services rendered:
A. Time and materials contracts
Revenues and costs relating to time and materials contracts are recognised as the related services are rendered.
B. Fixed-price contracts
i) Fixed-price development contracts
Revenues from fixed-price contracts, including software development, and integration contracts, where the performance obligations are satisfied over time, are recognised using the “percentage-of-completion” method. Percentage of completion is determined based on project costs incurred to date as a percentage of total estimated project costs required to complete the project. The cost expended (or input) method has been used to measure progress towards completion as there is a direct relationship between input and productivity. If the Company is not able to reasonably measure the progress of completion,
revenue is recognised only to the extent of costs incurred for which recoverability is probable. When total cost estimates exceed revenues in an arrangement, the estimated losses are recognised in the statement of profit and loss in the period in which such losses become probable based on the current contract estimates as an onerous contract provision.
A contract asset is a right to consideration that is conditional upon factors other than the passage of time. Contract assets primarily relate to unbilled amounts on fixed-price development contracts and are classified as non-financial asset as the contractual right to consideration is dependent on completion of contractual milestones.
A contract liability is an entity’s obligation to transfer goods or services to a customer for which the entity has received consideration (or the amount is due) from the customer.
Unbilled revenues on other than fixed price development contracts are classified as a financial asset where the right to consideration is unconditional upon passage of time.
ii) Maintenance contracts
Revenues related to fixed-price maintenance, testing and business process services are recognised based on our right to invoice for services performed for contracts in which the invoicing is representative of the value being delivered. If our invoicing is not consistent with value delivered, revenues are recognised as the service is performed using the percentage of completion method. When services are performed through an indefinite number of repetitive acts over a specified period, revenue is recognised on a straight-line basis over the specified period unless some other method better represents the stage of completion.
In certain projects, a fixed quantum of service or output units is agreed at a fixed price for a fixed term. In such contracts, revenue is recognised with respect to the actual output achieved till date as a percentage of total contractual output. Any residual service unutilised by the customer is recognised as revenue on completion of the term.
iii) Volume based contracts
Revenues and costs are recognised as the related services are rendered.
C. Products
Revenue on product sales are recognised when the customer obtains control of the specified asset.

Standalone Financial Statements under Ind AS
Annual Report 2018-19 161
D. Others
Any change in scope or price is considered as a contract modification. The Company accounts for modifications to existing contracts by assessing whether the services added are distinct and whether the pricing is at the stand-alone selling price. Services added that are not distinct are accounted for on a cumulative catch up basis, while those that are distinct are accounted for prospectively, either as a separate contract if the additional services are priced at the stand-alone selling price, or as a termination of the existing contract and creation of a new contract if not priced at the stand-alone selling price.
T h e C o m p a n y a c c o u n t s f o r v a r i a b l e considerations l ike, volume discounts, rebates and pricing incentives to customers as reduction of revenue on a systematic and rational basis over the period of the contract. The Company estimates an amount of such variable consideration using expected value method or the single most likely amount in a range of possible consideration depending on which method better predicts the amount of consideration to which the Company may be entitled.
Revenues are shown net of allowances/ returns, sales tax, value added tax, goods and services tax and applicable discounts and allowances.
The Company accrues the estimated cost of warranties at the time when the revenue is recognised. The accruals are based on the Company’s historical experience of material usage and service delivery costs.
Incremental costs that relate directly to a contract and incurred in securing a contract with a customer are recognised as an asset when the Company expects to recover these costs and amortised over the contract term.
The Company recognises contract fulfilment cost as an asset if those costs specifically relate to a contract or to an anticipated contract, the costs generate or enhance resources that will be used in satisfying performance obligations in future; and the costs are expected to be recovered. The asset so recognised is amortised on a systematic basis consistent with the transfer of goods or services to customer to which the asset relates.
The Company assesses the timing of the transfer of goods or services to the customer as compared to the timing of payments to determine whether a significant financing component exists. As a practical expedient, the Company does not assess the existence
of a significant financing component when the difference between payment and transfer of deliverables is a year or less. If the difference in timing arises for reasons other than the provision of finance to either the customer or us, no financing component is deemed to exist.
The Company may enter into arrangements with third party suppliers to resell products or services. In such cases, the Company evaluates whether the Company is the principal (i.e. report revenues on a gross basis) or agent (i.e. report revenues on a net basis). In doing so, the Company first evaluates whether the Company controls the good or service before it is transferred to the customer. If Company controls the good or service before it is transferred to the customer, Company is the principal; if not, the Company is the agent.
(xiv) Finance cost
Finance cost comprise interest cost on borrowings, gain or losses arising on re-measurement of financial assets at FVTPL, gains/ (losses) on translation or settlement of foreign currency borrowings and changes in fair value and gains/ (losses) on settlement of related derivative instruments. Borrowing costs that are not directly attributable to a qualifying asset are recognised in the statement of profit and loss using the effective interest method.
(xv) Other income
Other income comprises interest income on deposits, dividend income and gains / (losses), net, on disposal of investments. Interest income is recognised using the effective interest method. Dividend income is recognised when the right to receive payment is established.
(xvi) Income tax
Income tax comprises current and deferred tax. Income tax expense is recognised in the statement of profit and loss except to the extent it relates to a business combination, or items directly recognised in equity or in other comprehensive income.
a) Current income tax
Current income tax for the current and prior periods are measured at the amount expected to be recovered from or paid to the taxation authorities based on the taxable income for the period. The tax rates and tax laws used to compute the current tax amount are those that are enacted or substantively enacted as at the reporting date and applicable for the period. The Company offsets current tax assets and current tax liabilities, where it has a legally enforceable right to set off the recognised amounts and where it intends either to settle on a net basis, or to realise the asset and liability simultaneously.

Standalone Financial Statements under Ind AS
162 Wipro Limited
b) Deferred income tax
Deferred income tax is recognised using the balance sheet approach. Deferred income tax assets and liabilities are recognised for deductible and taxable temporary differences arising between the tax base of assets and liabilities and their carrying amount in financial statements, except when the deferred income tax arises from the initial recognition of goodwill or an asset or liability in a transaction that is not a business combination and affects neither accounting nor taxable profits or loss at the time of the transaction.
Deferred income tax assets are recognised to the extent it is probable that taxable profit will be available against which the deductible temporary differences and the carry forward of unused tax credits and unused tax losses can be utilised.
Deferred income tax liabilities are recognised for all taxable temporary differences except in respect of taxable temporary differences that is expected to reverse within the tax holiday period, taxable temporary differences associated with investments in subsidiaries, associates and foreign branches where the timing of the reversal of the temporary difference can be controlled and it is probable that the temporary difference will not reverse in the foreseeable future.
The carrying amount of deferred income tax assets is reviewed at each reporting date and reduced to the extent that it is no longer probable that sufficient taxable profit will be available to allow all or part of the deferred income tax asset to be utilised.
Deferred income tax assets and liabilities are measured at the tax rates that are expected to apply in the period when the asset is realised or the liability is settled, based on tax rates (and tax laws) that have been enacted or substantively enacted at the reporting date.
The Company offsets deferred income tax assets and liabilities, where it has a legally enforceable right to offset current tax assets against current tax liabilities, and they relate to taxes levied by the same taxation authority on either the same taxable entity, or on different taxable entities where there is an intention to settle the current tax liabilities and assets on a net basis or their tax assets and liabilities will be realised simultaneously.
(xvii) Earnings per share
Basic earnings per share is computed using the weighted average number of equity shares outstanding during the period adjusted for treasury
shares held. Diluted earnings per share is computed using the weighted-average number of equity and dilutive equivalent shares outstanding during the period, using the treasury stock method for options, except where the results would be anti-dilutive.
The number of equity shares and potentially dilutive equity shares are adjusted retrospectively for all periods presented for any splits and bonus shares issues including for change effected prior to the approval of the financial statements by the Board of Directors.
(xviii) Cash flow statement
Cash flow are reported using the indirect method, whereby profit for the period is adjusted for the effects of transactions of a non-cash nature, any deferrals or accruals of past or future operating cash receipts or payments and item of income or expenses associated with investing or financing cash flows. The cash from operating, investing and financing activities of the Company are segregated.
The amendment to Ind AS 7, require entities to provide disclosures about changes in their liabilities arising from financing activities, including both changes arising from cash flows and non-cash changes (such as foreign exchange gains or losses).
(xix) Assets held for sale
Sale of business is classified as held for sale, if their carrying amount is intended to be recovered principally through sale rather than through continuing use. The condition for classification as held for sale is met when disposal business is available for immediate sale and the same is highly probable of being completed within one year from the date of classification as held for sale.
(xx) Discontinued operations
A discontinued operation is a component of the Company’s business that represents a separate line of business that has been disposed of or is held for sale, or is a subsidiary acquired exclusively with a view to resale. Classification as a discontinued operation occurs upon the earlier of disposal or when the operation meets the criteria to be classified as held for sale.
(xxi) Non-current assets and disposal groups held for sale
Assets of disposal groups that is available for immediate sale and where the sale is highly probable of being completed within one year from the date of classification are considered and classified as assets held for sale. Non-current assets and disposal groups held for sale are measured at the lower of carrying amount and fair value less costs to sell.
(xxii) Disposal of assets
The gain or loss arising on disposal or retirement of

Standalone Financial Statements under Ind AS
Annual Report 2018-19 163
assets are recognised in the statement of profit and loss.
New Accounting standards adopted by the Company:
Ind AS 115 – Revenue from Contract with Customers
On April 1, 2018, the Company adopted Ind AS 115, “Revenue from Contracts with Customers” using the cumulative catch-up transition method applied to contracts that were not completed as at April 1, 2018. In accordance with the cumulative catch-up transition method, the comparatives have not been retrospectively adjusted.
The adoption of the new standard has resulted in a reduction of ` 1,605 in opening retained earnings, primarily relating to certain contract costs because these do not meet the criteria for recognition as costs to fulfil a contract.
On account of adoption of Ind AS 115, unbilled revenues pertaining to fixed price development contracts of ` 10,845 as at March 31, 2019 has been considered as non-financial Contract assets, which are billable on completion milestones specified in the contracts.
Unbilled revenues of ` 16,023, which are billable based on passage of time been classified as unbilled receivables.
The adoption of Ind AS 115, did not have any material impact on the statement of profit and loss for the year ended March 31, 2019.
A. Contract Asset and Liabilities
The Company classifies its right to consideration in exchange for deliverables as either a receivable or a contract asset.
A receivable is a right to consideration that is unconditional. A right to consideration is unconditional if only the passage of time is required before payment of that consideration is due. For example, the company recognises a receivable for revenues related to time and materials contracts or volume-based contracts. The Company presents such receivables as part of unbilled receivables at their net estimated realizable value. The same is tested for impairment as per the guidance in Ind AS 109 using expected credit loss method.
During the year ended March 31, 2019, the Company recognised revenue of ` 10,671 arising from opening unearned revenue as at April 1, 2018
During the year ended March 31, 2019, ` 9,369 of unbilled revenue pertaining to fixed-price development contracts (contract assets) which had an amount of ` 12,417 as at April 1, 2018, has been reclassified to trade receivables on completion of milestones.
Contract assets and liabilities are reported in a net position on a contract by contract basis at the end of each reporting period.
B. Remaining Performance Obligations
Revenue allocated to remaining performance obligations represents contracted revenue that has not yet been recognised which includes unearned revenue and amounts that will be invoiced and recognised as revenue in future periods. Applying the practical expedient, the Company has not disclosed its right to consideration from customer in an amount that corresponds directly with the value to the customer of the Company’s performance completed to date which are, contracts invoiced on time and material basis and volume based.
As at March 31, 2019, the aggregate amount of transaction price allocated to remaining performance obligations, other than those meeting the exclusion criteria above, was ̀ 224,184, of which approximately 72% is expected to be recognised as revenues within 2 years, and the remainder thereafter. This includes contracts that can be terminated for convenience without a substantive penalty since, based on current assessment, the occurrence of the same is expected to be remote.
C. Disaggregation of Revenues
The table below presents disaggregated revenues from contracts with customers by business segment, customer location and contract-type. The Company believes that the below disaggregation best depicts the nature, amount, timing and uncertainty of revenue and cash flows from economic factors.
Total
Revenue
Sales of services 468,529
Sales of products 11,769
480,298
Revenue by nature of contract
Fixed price and volume based 270,640
Time and materials 197,889
Products 11,769
480,298
Appendix B to Ind AS 21 - Foreign Currency Transactions and Advance Consideration
The Company has applied Appendix B to Ind AS 21 - Foreign Currency Transactions and Advance Consideration prospectively effective April 1, 2018. The effect on adoption of this amendment on the financial statements is insignificant.

Standalone Financial Statements under Ind AS
164 Wipro Limited
New accounting standards not yet adopted:
Certain new standards, amendments to standards and interpretations are not yet effective for annual periods beginning after April 1 2018, and have not been applied in preparing these financial statements. New standards, amendments to standards and interpretations that could have potential impact on the financial statements of the Company are:
Ind AS 116
On March 30, 2019, the Ministry of Corporate Affairs issued Ind AS 116, Leases. Ind AS 116 will replace the existing leases Standard, Ind AS 17 Leases, and related interpretations. The standard sets out the principles for the recognition, measurement, presentation and disclosure of leases. IND AS 116 introduces a single lessee accounting model and requires a lessee to recognised assets and liabilities for all leases with a term of more than 12 months, unless the underlying asset is of low value. The Standard also contains enhanced disclosure requirements for lessees.
The standard allows for two methods of transition: the full retrospective approach, requires entities to retrospectively apply the new standard to each prior reporting period presented and the entities need to adjust equity at the beginning of the earliest comparative period presented, or the modified retrospective approach, under which the date of initial application of the new leases standard, lessees recognise the cumulative effect of initial application as an adjustment to the opening balance of equity as at annual periods beginning on or after January 1, 2019.
The Company will adopt this standard using modified retrospective method effective April 1, 2019, and accordingly, the comparative for year ended March 31, 2018 and 2019, will not be retrospectively adjusted. The Company has elected certain available practical expedients on transition.
Based on assessment, the adoption of the new standard is expected to recognise a right-of-use assets and corresponding lease liabilities of approximately ̀ 5,579 and ̀ 6,799 respectively. There will be reclassification in the cash flow categories in the statement of cash flows.
Appendix C to Ind AS 12 - Uncertainty over income tax treatments
On March 30, 2019, Ministry of Corporate Affairs issued Appendix C to Ind AS 12, which clarifies the accounting for uncertainties in income taxes. The interpretation is to be applied to the determination of taxable profit (tax loss), tax bases, unused tax losses, unused tax credits and tax rates, when there is uncertainty over income tax treatments under Ind AS 12. The entity has to consider the probability of the relevant taxation authority accepting the tax treatment and the determination of taxable profit (tax loss), tax bases, unused tax losses, unused tax credits and tax rates would depend upon the probability. The effective date for adoption of Appendix C to Ind AS 12 is April 1, 2019. The Company will apply Appendix C to Ind AS 12 prospectively from the effective date and the effect on adoption of Ind AS 12 on the financial statement is insignificant.
Amendment to Ind AS 12 – Income Taxes
On March 30, 2019, Ministry of Corporate Affairs issued amendments to Ind AS 12 – Income Taxes. The amendments clarify that an entity shall recognise the income tax consequences of dividends on financial instruments classified as equity should be recognised according to where the entity originally recognised those past transactions or events that generated distributable profits were recognised. The effective date of these amendments is annual periods beginning on or after April 1, 2019. The Company is currently assessing the impact of this amendment on the Company’s consolidated financial statements.
Amendment to Ind AS 19 - Plan Amendment, Curtailment or Settlement
On March 30, 2019, Ministry of Corporate Affairs issued amendments to Ind AS 19, ‘Employee Benefits’, in connection with accounting for plan amendments, curtailments and settlements requiring an entity to determine the current service costs and the net interest for the period after the remeasurement using the assumptions used for the remeasurement; and determine the net interest for the remaining period based on the remeasured net defined benefit liability or asset. These amendments are effective for annual reporting periods beginning on or after April 1, 2019. The Company will apply the amendment from the effective date and the effect on adoption of the amendment on the consolidated financial statement is insignificant.

Standalone Financial Statements under Ind AS
Annual Report 2018-19 165
4. Property, Plant and Equipment
Land Buildings Plant and machinery *
Furniture and
fixtures
Office equipment
Vehicles Total
Gross carrying value:
As at April 1, 2017 ` 3,490 ` 22,112 ` 64,729 ` 8,927 ` 4,047 ` 331 ` 103,636
Additions - 1,202 7,428 811 517 943 10,901
Disposals/ adjustments - (175) (6,247) (589) (220) (267) (7,498)
Assets reclassified as held for sale
- - (305) - - - (305)
As at March 31, 2018 ` 3,490 ` 23,139 ` 65,605 ` 9,149 ` 4,344 ` 1,007 ` 106,734
Accumulated depreciation/ impairment:
As at April 1, 2017 - ` 4,566 ` 50,980 ` 7,111 ` 3,105 ` 319 ` 66,081
Depreciation - 740 7,690 552 349 358 9,689
Disposals/ adjustments - (57) (5,847) (490) (215) (232) (6,841)
Assets reclassified as held for sale
- - (221) - - - (221)
As at March 31, 2018 - ` 5,249 ` 52,602 ` 7,173 ` 3,239 ` 445 ` 68,708
Net book value as at March 31, 2018 ` 3,490 ` 17,890 ` 13,003 ` 1,976 ` 1,105 ` 562 ` 38,026
Gross carrying value:
As at April 1, 2018 ` 3,490 ` 23,139 ` 65,605 ` 9,149 ` 4,344 ` 1,007 ` 106,734
Additions 65 2,193 6,875 863 332 2 10,330
Additions due to merger - 66 114 38 10 - 228
Disposals/ adjustments - (161) (4,438) (511) (103) (135) (5,348)
As at March 31, 2019 ` 3,555 ` 25,237 ` 68,156 ` 9,539 ` 4,583 ` 874 ` 111,944
Accumulated depreciation/ impairment:
As at April 1, 2018 - ` 5,249 ` 52,602 ` 7,173 ` 3,239 ` 445 ` 68,708
Additions due to merger - 6 43 - 14 - 63
Depreciation - 807 6,849 612 387 282 8,937
Disposals/ adjustments - (80) (3,821) (431) (79) (95) (4,506)
As at March 31, 2019 - ` 5,982 ` 55,673 ` 7,354 ` 3,561 ` 632 ` 73,202
Net book value as at March 31, 2019 ` 3,555 ` 19,255 ` 12,483 ` 2,185 ` 1,022 ` 242 ` 38,742
* Including net carrying value of computer equipment and software amounting to ` 8,893 and ` 9,461 as at March 31, 2019 and 2018 respectively.

Standalone Financial Statements under Ind AS
166 Wipro Limited
5. Goodwill and other intangible assets
The Company is organised by three operating segments: IT Services, IT Products and India State Run Enterprise services. Goodwill as at March 31, 2019 and 2018 has been allocated to the IT Services operating segment.
During the year ended March 31, 2019, the company realigned its CGUs. This realignment did not have any impact on allocation of goodwill to the CGUs. Below is the allocation of the goodwill to the CGUs:
CGUs
As at
March 31, 2019 March 31, 2018
Energy, Natural Resources and Utilities (ENU) ` 3,782 ` 3,782
Banking Financial Services and Insurance (BFSI) 100 100
Total ` 3,882 ` 3,882
For the purpose of impairment testing, goodwill is allocated to a CGU representing the lowest level within the company at which goodwill is monitored for internal management purposes, and which is not higher than the Company’s operating segment. Goodwill is tested for impairment at least annually in accordance with the Company’s procedure for determining the recoverable value of each CGU.
The recoverable amount of the CGU is determined on the basis of Fair Value Less Cost of Disposal (FVLCD). The FVLCD of the CGU is determined based on the market capitalization approach, using the turnover and earnings multiples derived from observable market data. The fair value measurement is categorised as a level 2 fair value based on the inputs in the valuation techniques used.
Based on the above testing, no impairment was identified as at March 31, 2019 and 2018 as the recoverable value of the CGUs exceeded the carrying value. Further, none of the CGU’s tested for impairment as at March 31, 2019 and 2018 were at risk of impairment. An analysis of the calculation’s sensitivity to a change in the key parameters (turnover and earnings multiples), did not identify any probable scenarios where the CGU’s recoverable amount would fall below its carrying amount.
Movement in intangible assets is given below:
Intangible assetsCustomer
relatedMarketing
related * TotalGross carrying value:As at April 1, 2017 ` 2,913 ` 78 ` 2,991Additions - - -Disposal/ adjustment - - -As at March 31, 2018 2,913 78 2,991Accumulated amortization/ impairment:As at April 1, 2017 ` 754 ` 52 ` 806Amortization 397 26 423Disposal/ adjustment - - -As at March 31, 2018 1,151 78 1,229Net carrying value as at March 31, 2018 ` 1,762 ` - ` 1,762Gross carrying value:As at April 1, 2018 ` 2,913 ` 78 ` 2,991Additions - - -Additions due to merger - 407 407Disposal/ adjustment - - -
As at March 31, 2019 ` 2,913 ` 485 ` 3,398
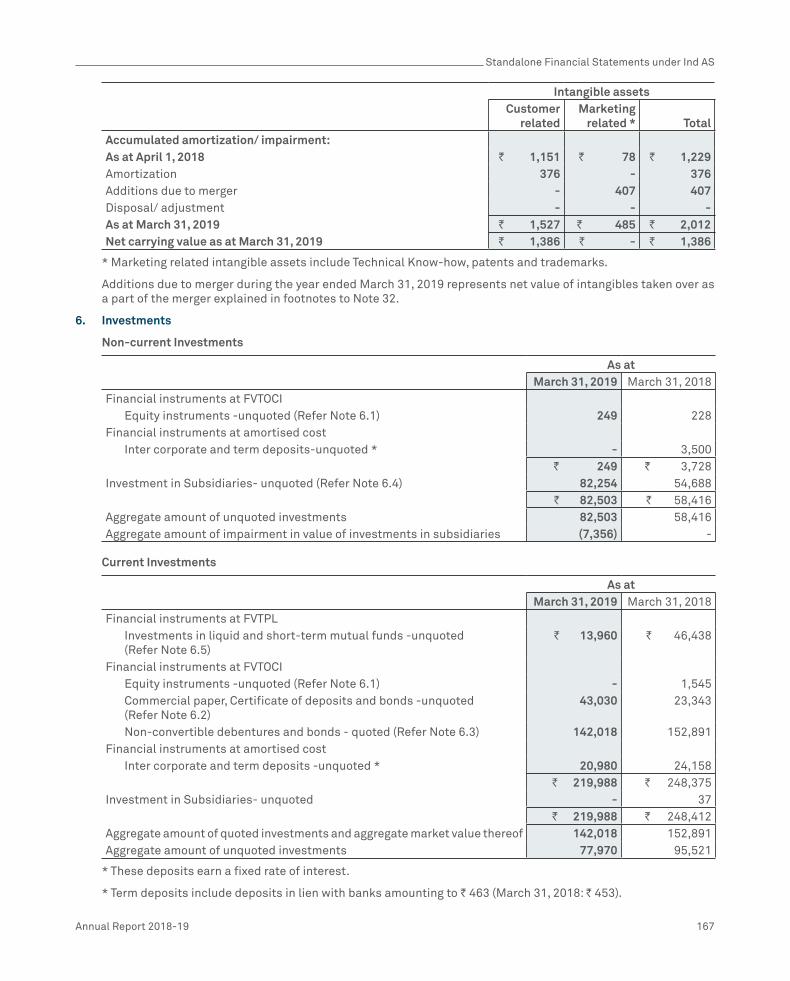
Standalone Financial Statements under Ind AS
Annual Report 2018-19 167
Intangible assetsCustomer
relatedMarketing
related * TotalAccumulated amortization/ impairment:As at April 1, 2018 ` 1,151 ` 78 ` 1,229Amortization 376 - 376Additions due to merger - 407 407Disposal/ adjustment - - -As at March 31, 2019 ` 1,527 ` 485 ` 2,012Net carrying value as at March 31, 2019 ` 1,386 ` - ` 1,386
* Marketing related intangible assets include Technical Know-how, patents and trademarks.
Additions due to merger during the year ended March 31, 2019 represents net value of intangibles taken over as a part of the merger explained in footnotes to Note 32.
6. Investments
Non-current Investments
As atMarch 31, 2019 March 31, 2018
Financial instruments at FVTOCI Equity instruments -unquoted (Refer Note 6.1) 249 228Financial instruments at amortised cost Inter corporate and term deposits-unquoted * - 3,500
` 249 ` 3,728Investment in Subsidiaries- unquoted (Refer Note 6.4) 82,254 54,688
` 82,503 ` 58,416Aggregate amount of unquoted investments 82,503 58,416Aggregate amount of impairment in value of investments in subsidiaries (7,356) -
Current Investments
As atMarch 31, 2019 March 31, 2018
Financial instruments at FVTPL Investments in liquid and short-term mutual funds -unquoted (Refer Note 6.5)
` 13,960 ` 46,438
Financial instruments at FVTOCI Equity instruments -unquoted (Refer Note 6.1) - 1,545 Commercial paper, Certificate of deposits and bonds -unquoted (Refer Note 6.2)
43,030 23,343
Non-convertible debentures and bonds - quoted (Refer Note 6.3) 142,018 152,891Financial instruments at amortised cost Inter corporate and term deposits -unquoted * 20,980 24,158
` 219,988 ` 248,375Investment in Subsidiaries- unquoted - 37
` 219,988 ` 248,412Aggregate amount of quoted investments and aggregate market value thereof 142,018 152,891Aggregate amount of unquoted investments 77,970 95,521
* These deposits earn a fixed rate of interest.
* Term deposits include deposits in lien with banks amounting to ` 463 (March 31, 2018: ` 453).

Standalone Financial Statements under Ind AS
168 Wipro Limited
Details of investments:
6.1 Details of investments in equity instruments-other than subsidiaries(fully paid-up) - classified as FVTOCI
Particulars Number of Shares Carrying valueAs at As at
March 31, 2019
March 31, 2018
March 31, 2019
March 31, 2018
Non-CurrentMycity Technology Limited 44,935 44,935 ` - ` -Wep Peripherals Limited 306,000 306,000 40 39Wep Solutions Limited 1,836,000 1,836,000 40 72Drivestream India Private Limited 267,600 267,600 19 19Altizon Systems Private Limited 23,758 16,018 144 98WAISL Limited (Refer Note 21) 550,000 6 -
` 249 ` 228CurrentOpera Solutions LLC 2,390,433 2,390,433 ` - ` 1,545
` - ` 1,545Total ` 249 ` 1,773
6.2 Investment in certificate of deposits/ commercial papers and bonds (unquoted)– classified as FVTOCI
Particulars of issuer
As at
March 31, 2019 March 31, 2018
Current
ICICI Bank ` 11,311 ` -
Kotak Mahindra Bank 9,362 -
Axis Bank 4,309 -
Small Industries Development Bank of India 4,302 -
Kotak Mahindra Investments Limited 2,864 4,808
Kotak Mahindra Prime Limited 2,585 3,333
Aditya Birla Finance Limited 1,988 -
Tata Capital Housing Finance Limited 1,881 -
Tata Capital Financial Services Limited 1,499 -
National Bank for Agriculture and Rural Development 1,000 -
HDFC Bank Limited 992 -
HDB Financial Services Limited 937 1,980
Can Fin Homes Limited - 4,545
IDFC Limited - 3,223
L&T Finance Limited - 2,143
LIC Housing Finance Limited - 1,532
L&T Infrastructure Finance Company Limited - 931
Mahindra & Mahindra Financial Services Limited - 495
Bajaj Finance Limited - 299
Sundaram Finance Limited - 54
Total ` 43,030 ` 23,343

Standalone Financial Statements under Ind AS
Annual Report 2018-19 169
6.3 Investment in non-convertible deposits and bonds (quoted) – classified as FVTOCI
Particulars of issuer
As at
March 31, 2019 March 31, 2018
Current
National Highways Authority Of India ` 18,055 ` 18,456
Tata Capital Financial Services Limited 13,708 6,962
National Bank for Agriculture and Rural Development 13,460 968
Power Finance Corporation Limited 13,169 960
HDB Financial Services Limited 13,038 10,969
Aditya Birla Finance Limited 11,596 5,202
Kotak Mahindra Prime Limited 10,855 10,288
LIC Housing Finance Limited 7,408 21,231
Housing Development Finance Corporation Limited 7,151 18,667
Government Security 6,862 1,951
Tata Capital Housing Finance Limited 5,765 5,045
Kotak Mahindra Investments Limited 5,238 1,842
Rural Electrification Corporation Limited 4,929 423
Small Industries Development Bank of India 4,912 -
Indian Railway Finance Corporation Limited 4,473 3,796
Axis Bank 517 -
HDFC Bank Limited 462 -
NTPC Limited 417 427
ANZ Bank 3 -
Hero Fincorp Limited - 6,923
Sundaram Finance Limited - 6,643
L&T Finance Limited - 6,169
L&T Infrastructure Finance Company Limited - 6,126
Mahindra & Mahindra Financial Services Limited - 5,899
L&T Housing Finance Limited - 4,986
IDFC Limited - 1,569
Bajaj Finance Limited - 4,238
Can Fin Homes Limited - 1,904
Gruh Finance Limited - 1,247
Total ` 142,018 ` 152,891

Standalone Financial Statements under Ind AS
170 Wipro Limited
6.4 Details of investment in unquoted equity and preference instruments of subsidiaries (fully paid up)
Name of the subsidiary
Number of Units as at Balances as at
Currency Face Value
March 31, 2019
March 31, 2018
March 31, 2019
March 31, 2018
Non-Current
Equity Instrument
Wipro Trademarks Holding Limited ` 10 93,250 93,250 22 22
Wipro Travel Services Limited ` 10 66,171 66,171 1 1
Wipro LLC USD 2,500 180,378 180,378 50,496 23,135
Wipro Japan KK JPY Note 1 650 650 6 6
Wipro Japan KK USD 16 16 641 641
Wipro Shanghai Limited Note 2 - - 9 9
Wipro Cyprus SE EUR 1 163,611 163,611 18,903 18,903
Wipro Networks Pte Limited SGD 1 28,126,108 28,126,108 1,339 1,339
Wipro Chengdu Limited Note 2 - - 24 24
Wipro Overseas IT Services Pvt. Ltd.
` 10 50,000 50,000 ^ ^
Appirio India Cloud Solutions Private Limited
` 10 - 800,000 - 995
Wipro Holdings UK Limited USD 1 130,151,974 130,151,974 4,480 4,480
Wipro IT Services Bangladesh Limited
BDT 10 334,999,990 10,000,000 359 78
Wipro HR Services India Private Limited USD 10 70,10,000 - 8,275 -
(formerly known as Alight HR Services India Private Limited)
Sub-total 84,555 49,633
Preference Shares
Wipro Cyprus Private Limited(Redeemable) EUR 1 45,000 45,000 5,055 5,055
Sub-total 5,055 5,055
Total Non-Current 89,610 54,688
Current
Wipro Airport IT Services Limited (Refer Note 21)
` 10 5,50,000 3,700,000 - 37
Total Current - 37
Total investment in unquoted equity and preference instruments of subsidiaries 89,610 54,725
Less: Impairment in value of investments in subsidiaries * (7,356) -
Net investment in unquoted equity and preference instruments of subsidiaries 82,254 54,725
Note 1- As per the local laws of Japan, the Shares do not have face value.
Note 2 - As per the local laws of People’s Republic of China, there is no requirement of number of shares and face value thereof. Hence the investment by the Company is considered as equity contribution.
*The impairment is on account of diminution in the value of a step subsidiary of Wipro LLC due to the uncertainties around the Affordable Healthcare Act.
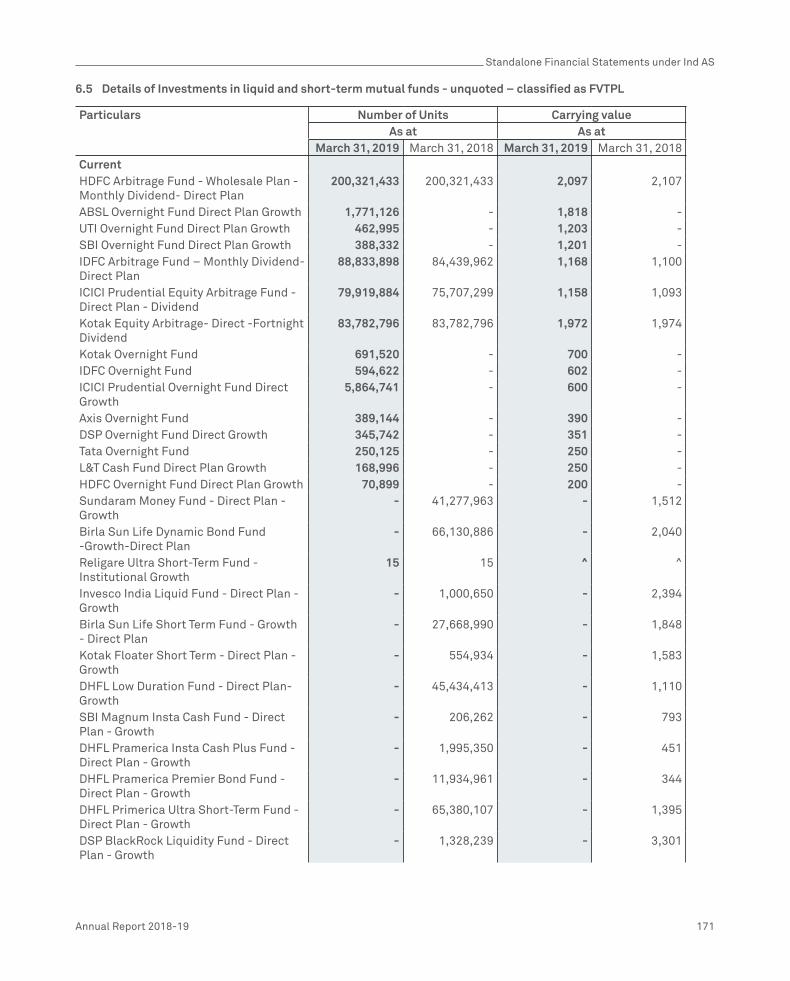
Standalone Financial Statements under Ind AS
Annual Report 2018-19 171
6.5 Details of Investments in liquid and short-term mutual funds - unquoted – classified as FVTPL
Particulars Number of Units Carrying valueAs at As at
March 31, 2019 March 31, 2018 March 31, 2019 March 31, 2018CurrentHDFC Arbitrage Fund - Wholesale Plan - Monthly Dividend- Direct Plan
200,321,433 200,321,433 2,097 2,107
ABSL Overnight Fund Direct Plan Growth 1,771,126 - 1,818 -UTI Overnight Fund Direct Plan Growth 462,995 - 1,203 -SBI Overnight Fund Direct Plan Growth 388,332 - 1,201 -IDFC Arbitrage Fund – Monthly Dividend- Direct Plan
88,833,898 84,439,962 1,168 1,100
ICICI Prudential Equity Arbitrage Fund - Direct Plan - Dividend
79,919,884 75,707,299 1,158 1,093
Kotak Equity Arbitrage- Direct -Fortnight Dividend
83,782,796 83,782,796 1,972 1,974
Kotak Overnight Fund 691,520 - 700 -IDFC Overnight Fund 594,622 - 602 -ICICI Prudential Overnight Fund Direct Growth
5,864,741 - 600 -
Axis Overnight Fund 389,144 - 390 -DSP Overnight Fund Direct Growth 345,742 - 351 -Tata Overnight Fund 250,125 - 250 -L&T Cash Fund Direct Plan Growth 168,996 - 250 -HDFC Overnight Fund Direct Plan Growth 70,899 - 200 -Sundaram Money Fund - Direct Plan - Growth
- 41,277,963 - 1,512
Birla Sun Life Dynamic Bond Fund -Growth-Direct Plan
- 66,130,886 - 2,040
Religare Ultra Short-Term Fund - Institutional Growth
15 15 ^ ^
Invesco India Liquid Fund - Direct Plan - Growth
- 1,000,650 - 2,394
Birla Sun Life Short Term Fund - Growth - Direct Plan
- 27,668,990 - 1,848
Kotak Floater Short Term - Direct Plan - Growth
- 554,934 - 1,583
DHFL Low Duration Fund - Direct Plan- Growth
- 45,434,413 - 1,110
SBI Magnum Insta Cash Fund - Direct Plan - Growth
- 206,262 - 793
DHFL Pramerica Insta Cash Plus Fund - Direct Plan - Growth
- 1,995,350 - 451
DHFL Pramerica Premier Bond Fund - Direct Plan - Growth
- 11,934,961 - 344
DHFL Primerica Ultra Short-Term Fund - Direct Plan - Growth
- 65,380,107 - 1,395
DSP BlackRock Liquidity Fund - Direct Plan - Growth
- 1,328,239 - 3,301

Standalone Financial Statements under Ind AS
172 Wipro Limited
Particulars Number of Units Carrying valueAs at As at
March 31, 2019 March 31, 2018 March 31, 2019 March 31, 2018LIC MF Liquid Fund - Direct Plan- Growth - 1,133,576 - 3,573DSP BlackRock Money Manager Fund - Direct Plan- Growth
- 651,470 - 1,557
Axis Treasury Advantage Fund - Direct Growth
- 704,635 - 1,396
HDFC Cash Management Fund - Savings Plan - Direct Plan - Growth Option
- 166,062 - 602
HDFC Floating Rate Income Fund - Short Term Plan - Wholesale Option - Direct Plan - Dividend Reinvestment
- 17,330,061 - 527
Birla Sun Life Cash Plus - Growth-Direct Plan
- 3,227,122 - 901
L&T Liquid Fund Direct Plan - Daily Dividend Reinvestment Plan
- 596,664 - 605
ICICI Prudential Money Market Fund Direct - Growth
- 6,234,174 - 1,499
ICICI Prudential Short Term - Direct Growth
- 25,355,979 - 951
Reliance Interval Fund - Monthly Series I - IP - Dividend
15 15 ^ ^
IDFC Cash Fund-Growth-(Direct Plan) - 239,279 - 505SBI Magnum Insta Cash Fund Liquid Floater -Direct Plan- Growth
- 86,382 - 251
Franklin India Low Duration Fund - Direct - 851,573 - 17Axis Liquid Fund - Direct Plan - Growth - 1,249,174 - 2,407Franklin India Treasury Management Account Super Institutional Plan - Direct
- 239,418 - 622
Tata Money Market Fund-Direct-Daily Dividend
- 1,352,426 - 1,354
Tata Money Market Fund Direct Plan - Growth
- 193,818 - 531
Inveco India Active Income Fund DP Growth
- 124,330 - 253
UTI-Money Market Fund -Institutional Plan - Direct Plan - Growth
- 2,007,075 - 3,913
IDFC Super Saver Income Fund-Short Term Plan-Growth (Direct Plan)
- 17,085,745 - 625
UTI - Liquid Cash Plan - Institutional - Direct Plan - Growth
- 281,877 - 802
IDFC Ultra Short-Term Fund Growth (Direct Plan)
- 20,233,167 - 502
` 13,960 ` 46,438^ Value of Investment is less than ` 1

Standalone Financial Statements under Ind AS
Annual Report 2018-19 173
7. Trade receivables
As atMarch 31, 2019 March 31, 2018
UnsecuredConsidered good ` 94,836 ` 99,466Considered doubtful 11,631 11,514
` 106,467 ` 110,980Less: Allowance for lifetime expected credit loss (Refer Note 26) (11,631) (11,514)
` 94,836 ` 99,466Included in the financial statement as follows:Non-current 4,373 4,446Current 90,463 95,020
The activity in the allowance for lifetime expected credit loss is given below:As at
March 31, 2019 March 31, 2018Balance at the beginning of the year ` 11,514 ` 7,722Additions during the year, net 729 3,792Uncollectable receivables charged against allowance (575) -Translation adjustment (37) -Balance at the end of the year ` 11,631 ` 11,514
8. Cash and cash equivalents
Cash and cash equivalents as of March 31, 2019 and 2018 consists of cash and balances on deposit with banks. Cash and cash equivalents consists of the following:
As atMarch 31, 2019 March 31, 2018
Balances with banksCurrent accounts ` 18,838 ` 10,897Unclaimed dividend 93 43Demand deposits * 84,818 12,035
Cheques, drafts on hand 153 245` 103,902 ` 23,220
* These deposits can be withdrawn by the Company at any time without prior notice and without any penalty on the principal.
Cash and cash equivalents consists of the following for the purpose of the cash flow statement:
As atMarch 31, 2019 March 31, 2018
Cash and cash equivalents ` 103,902 ` 23,220Bank overdrafts (3) (3,998)
` 103,899 ` 19,222

Standalone Financial Statements under Ind AS
174 Wipro Limited
9. Other Financial Assets
As atMarch 31, 2019 March 31, 2018
Non-currentSecurity deposits ` 1,043 ` 984Other deposits 337 247Interest receivable 1,139 -Finance lease receivables 1,324 1,847
` 3,843 ` 3,078CurrentDue from officers and employees ` 591 ` 559Finance lease receivables 908 1,381Interest receivable 1,714 426Security Deposits 949 1,099Others 1,651 1,753Considered doubtful 810 790
` 6,623 ` 6,008Less : Provision for doubtful advances (810) (790)
` 5,813 ` 5,218Total ` 9,656 ` 8,296
The activities in the provision for doubtful advances is given below:
As atMarch 31, 2019 March 31, 2018
Balance at the beginning of the year ` 790 ` 469Addition during the year, net 218 327Uncollectable advances charged against allowance (198) (6)Balance at the end of the year ` 810 ` 790
Finance lease receivables
Leasing arrangements
Finance lease receivables consist of assets that are leased to customers for contract terms ranging from 1 to 5 years, with lease payments due in monthly or quarterly installments.
Amounts receivable under finance leases:
The components of finance lease receivables are as follows:
Minimum lease payments Present value of minimum lease payment
As at As atMarch 31, 2019 March 31, 2018 March 31, 2019 March 31, 2018
Not later than one year ` 999 ` 1,484 ` 908 ` 1,381Later than one year but not later than five years 1,330 1969 1,283 1,847Later than five years 44 - 42 -Unguaranteed residual values - - - -Gross investment in lease 2,373 3,453 2,232 3,228Less: Unearned finance income (141) (225) - -Present value of minimum lease payment receivables ` 2,232 ` 3,228 ` 2,232 ` 3,228
Included in the balance sheet as follows:- Non-current finance lease receivables 1,324 1,847- Current finance lease receivables 908 1,381

Standalone Financial Statements under Ind AS
Annual Report 2018-19 175
10. Inventories
As atMarch 31, 2019 March 31, 2018
Finished goods [including goods in transit- ` 1 (` 3 for March 31, 2018)] ` 3 ` 3Stock-in-trade 2,723 2,171Stores and spares 677 769
` 3,403 ` 2,943
11. Other assets
As atMarch 31, 2019 March 31, 2018
Non-currentCapital advances ` 1,354 ` 1,389Prepaid expenses including rentals for leasehold land and Deposits 4,970 5,870Cost to obtain contract 528 -Others 5,337 4,468Assets reclassified as held for sale - (113)
` 12,189 ` 11,614CurrentPrepaid expenses ` 10,120 ` 9,750Due from officers and employees 882 1,147Advances to suppliers 2,000 1,191Cost to obtain contract 731 -Deferred contract costs - 2,846Balance with excise, customs and other authorities 4,907 3,442Assets reclassified as held for sale - (254)
` 18,640 ` 18,122Total ` 30,829 ` 29,736
12. Share Capital
As atMarch 31, 2019 March 31, 2018
Authorised capital12,504,500,000 (March 31, 2018: 5,500,000,000) equity shares ` 25,009 ` 11,000[Par value of ` 2 per share]25,000,000 (March 31, 2018: 25,000,000) preference shares [Par value of ` 10 per share]
250 250
150,000 (March 31, 2018:1,50,000) 10% Optionally convertible cumulative preference shares [Par value of ` 100 per share]
15 15
` 25,274 ` 11,265Issued, subscribed and fully paid-up capital6,033,935,388 (March 31, 2018: 4,523,784,491) equity shares of ` 2 each 12,068 9,048
` 12,068 ` 9,048
Terms / Rights attached to equity shares
The Company has only one class of equity shares having a par value of ` 2 per share. Each shareholder of equity shares is entitled to one vote per share. The Company declares and pays dividend in Indian Rupees. The dividend proposed by the Board of Directors is subject to shareholders approval in the ensuing Annual General Meeting.

Standalone Financial Statements under Ind AS
176 Wipro Limited
Following is the summary of per share dividends recognised as distributions to equity shareholders:
For the year endedMarch 31, 2019 March 31, 2018
Interim dividend ` 1 ` 1
In the event of liquidation of the Company, the equity shareholders will be entitled to receive the remaining assets of the Company, after distribution of all preferential amounts, if any, in proportion to the number of equity shares held by the shareholders.
i. Reconciliation of number of shares
As at March 31, 2019 As at March 31, 2018No. of shares ` million No. of shares ` million
Opening number of equity shares / American Depository Receipts (ADRs) outstanding 4,523,784,491 9,048 2,430,900,565 4,861Equity shares issued pursuant to Employee Stock Option Plan * 1,681,717 4 3,559,599 8Issue of bonus shares (Refer Note 28) 1,508,469,180 3,016 2,433,074,327 4,866Buyback of equity shares (Refer Note 28) - - (343,750,000) (687)Closing number of equity shares / ADRs outstanding 6,033,935,388 12,068 4,523,784,491 9,048
* 2,599,183 shares have been issued by the Controlled trust on exercise of options during the year ended March 31, 2019.
ii. Details of shareholders holding more than 5% of the total equity shares of the Company
Name of the ShareholderAs at March 31, 2019 As at March 31, 2018No. of shares % held No. of shares % held
Mr. Azim Hasham Premji Partner representing Hasham Traders 989,215,999 16.39 741,912,000 16.40Mr. Azim Hasham Premji Partner representing Prazim Traders 1,187,751,441 19.68 890,813,582 19.69Mr. Azim Hasham Premji Partner representing Zash Traders 1,204,319,438 19.96 903,239,580 19.97Azim Premji Trust 797,948,834 13.22 618,461,626 13.67
iii. Other details of equity shares for a period of five years immediately preceding March 31, 2019
(a) 1,508,469,180 bonus shares were issued during the year ended March 31, 2019. Refer Note 28.
(b) 2,433,074,327 bonus shares were issued during the year ended March 31, 2018. Refer Note 28.
(c) 343,750,000 equity shares and 40,000,000 equity shares were bought back by the company during the year ended March 31, 2018 and 2017, respectively. Refer Note 28.
iv. Shares reserved for issue under option
For details of shares reserved for issue under the employee stock option plan of the Company, refer Note 30.
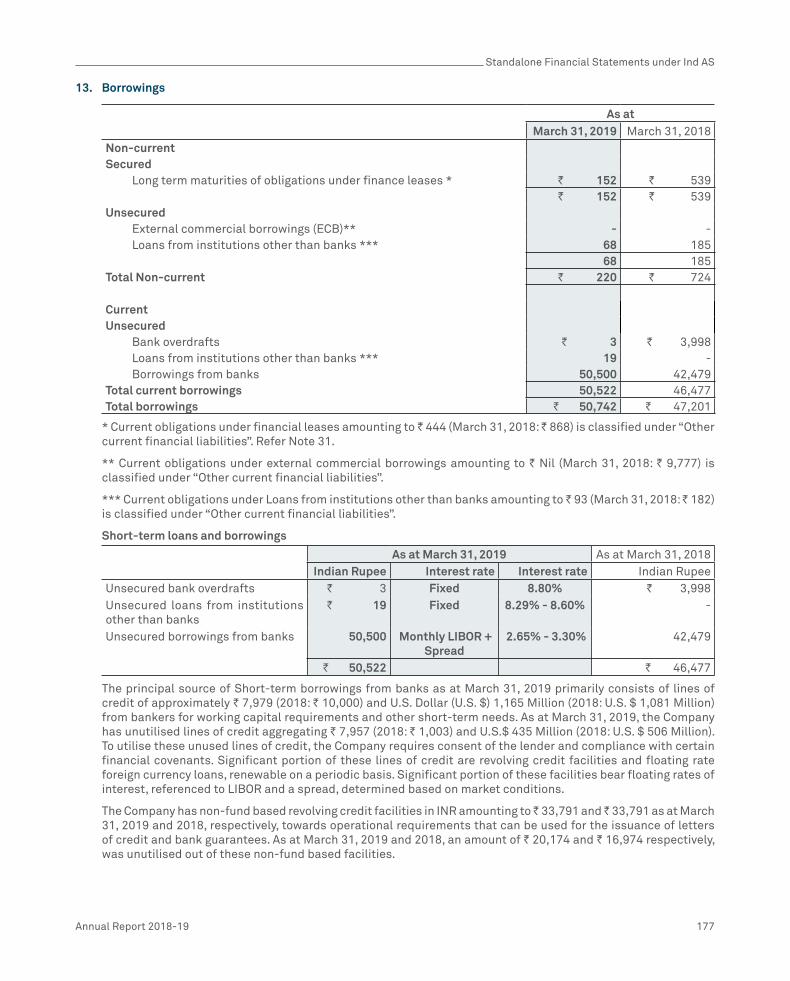
Standalone Financial Statements under Ind AS
Annual Report 2018-19 177
13. Borrowings
As atMarch 31, 2019 March 31, 2018
Non-currentSecured Long term maturities of obligations under finance leases * ` 152 ` 539
` 152 ` 539Unsecured External commercial borrowings (ECB)** - - Loans from institutions other than banks *** 68 185
68 185Total Non-current ` 220 ` 724
CurrentUnsecured Bank overdrafts ` 3 ` 3,998 Loans from institutions other than banks *** 19 - Borrowings from banks 50,500 42,479Total current borrowings 50,522 46,477Total borrowings ` 50,742 ` 47,201
* Current obligations under financial leases amounting to ` 444 (March 31, 2018: ` 868) is classified under “Other current financial liabilities”. Refer Note 31.
** Current obligations under external commercial borrowings amounting to ` Nil (March 31, 2018: ` 9,777) is classified under “Other current financial liabilities”.
*** Current obligations under Loans from institutions other than banks amounting to ̀ 93 (March 31, 2018: ̀ 182) is classified under “Other current financial liabilities”.
Short-term loans and borrowings
As at March 31, 2019 As at March 31, 2018Indian Rupee Interest rate Interest rate Indian Rupee
Unsecured bank overdrafts ` 3 Fixed 8.80% ` 3,998Unsecured loans from institutions other than banks
` 19 Fixed 8.29% - 8.60% -
Unsecured borrowings from banks 50,500 Monthly LIBOR + Spread
2.65% - 3.30% 42,479
` 50,522 ` 46,477
The principal source of Short-term borrowings from banks as at March 31, 2019 primarily consists of lines of credit of approximately ` 7,979 (2018: ` 10,000) and U.S. Dollar (U.S. $) 1,165 Million (2018: U.S. $ 1,081 Million) from bankers for working capital requirements and other short-term needs. As at March 31, 2019, the Company has unutilised lines of credit aggregating ` 7,957 (2018: ` 1,003) and U.S.$ 435 Million (2018: U.S. $ 506 Million). To utilise these unused lines of credit, the Company requires consent of the lender and compliance with certain financial covenants. Significant portion of these lines of credit are revolving credit facilities and floating rate foreign currency loans, renewable on a periodic basis. Significant portion of these facilities bear floating rates of interest, referenced to LIBOR and a spread, determined based on market conditions.
The Company has non-fund based revolving credit facilities in INR amounting to ̀ 33,791 and ̀ 33,791 as at March 31, 2019 and 2018, respectively, towards operational requirements that can be used for the issuance of letters of credit and bank guarantees. As at March 31, 2019 and 2018, an amount of ` 20,174 and ` 16,974 respectively, was unutilised out of these non-fund based facilities.
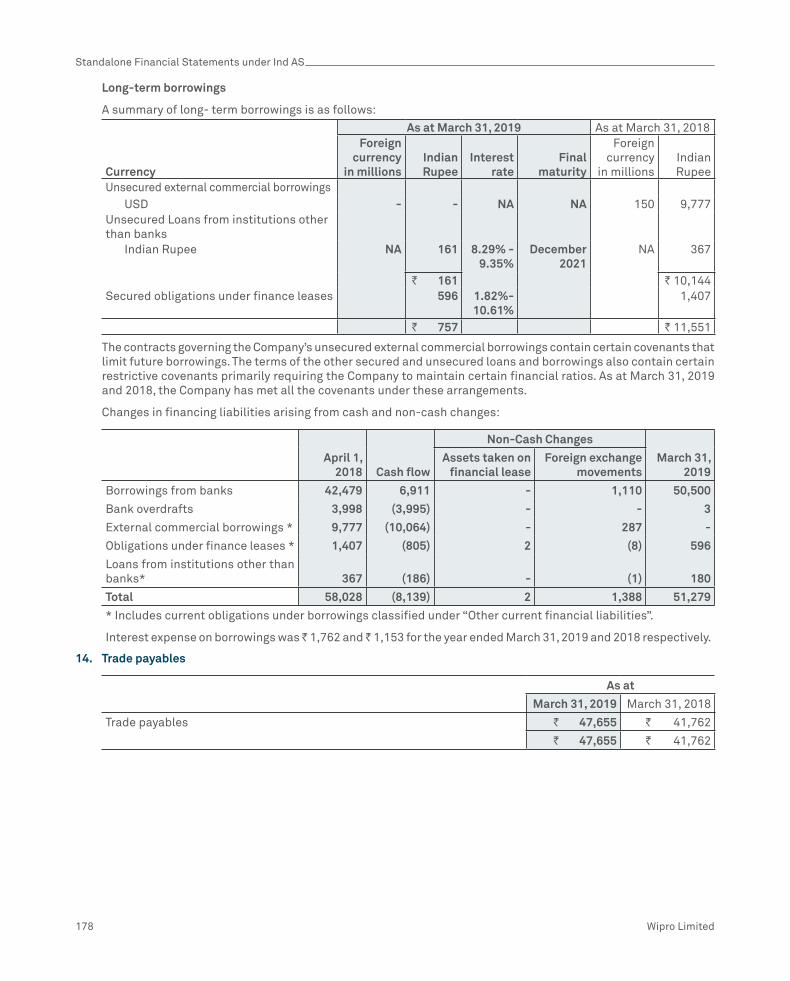
Standalone Financial Statements under Ind AS
178 Wipro Limited
Long-term borrowings
A summary of long- term borrowings is as follows:
Currency
As at March 31, 2019 As at March 31, 2018Foreign
currency in millions
Indian Rupee
Interest rate
Final maturity
Foreign currency
in millionsIndian Rupee
Unsecured external commercial borrowings USD - - NA NA 150 9,777Unsecured Loans from institutions other than banks Indian Rupee NA 161 8.29% -
9.35% December
2021 NA 367
` 161 ` 10,144Secured obligations under finance leases 596 1.82%-
10.61% 1,407
` 757 ` 11,551
The contracts governing the Company’s unsecured external commercial borrowings contain certain covenants that limit future borrowings. The terms of the other secured and unsecured loans and borrowings also contain certain restrictive covenants primarily requiring the Company to maintain certain financial ratios. As at March 31, 2019 and 2018, the Company has met all the covenants under these arrangements.
Changes in financing liabilities arising from cash and non-cash changes:
April 1, 2018 Cash flow
Non-Cash Changes
March 31, 2019
Assets taken on financial lease
Foreign exchange movements
Borrowings from banks 42,479 6,911 - 1,110 50,500
Bank overdrafts 3,998 (3,995) - - 3
External commercial borrowings * 9,777 (10,064) - 287 -
Obligations under finance leases * 1,407 (805) 2 (8) 596
Loans from institutions other than banks* 367 (186) - (1) 180
Total 58,028 (8,139) 2 1,388 51,279
* Includes current obligations under borrowings classified under “Other current financial liabilities”.
Interest expense on borrowings was ̀ 1,762 and ̀ 1,153 for the year ended March 31, 2019 and 2018 respectively.
14. Trade payables
As at
March 31, 2019 March 31, 2018
Trade payables ` 47,655 ` 41,762
` 47,655 ` 41,762

Standalone Financial Statements under Ind AS
Annual Report 2018-19 179
Trade payables include due to suppliers under The Micro, Small and Medium Enterprises Development Act, 2006, [MSMED Act] as at March 31, 2019 and March 31, 2018. The disclosure pursuant to the said Act is as under:
ParticularsAs at
March 31, 2019 March 31, 2018
Principal amount remaining unpaid ` 37 ` 38
Interest due thereon remaining unpaid 1 ^
Interest paid by the Company in terms of Section 16 of the MSMED Act, along with the amount of the payment made to the supplier beyond the appointed day
437 197
Interest due and payable for the period of delay in making payment (which have been paid but beyond the appointed day during the period) but without adding interest specified under the MSMED Act
- -
Interest accrued and remaining unpaid 4 14
Interest remaining due and payable even in the succeeding years, until such date when the interest dues as above are actually paid to the small enterprises
1 ^
^ Value is less than ` 1.
This information has been determined to the extent such parties have been identified on the basis of information available with the Company.
15. Other financial liabilities
As at
March 31, 2019 March 31, 2018
Current
Salary Payable ` 21,873 ` 13,989
Current maturities of long-term borrowings (Refer Note 13) 93 9,959
Current maturities of obligation under finance lease (Refer Note 13) 444 868
Interest accrued but not due on borrowing 35 130
Unclaimed dividends 93 43
Others 2,452 354
` 24,990 ` 25,343
16. Provisions
As at
March 31, 2019 March 31, 2018
Non-current: ` 1,194 ` 1,685
Provision for employee benefits 2 3
Provision for warranty ` 1,196 ` 1,688
Current: ` 8,300 ` 6,787
Provision for employee benefits 274 269
Provision for warranty 716 878
Others ` 9,290 ` 7,934
Total ` 10,486 ` 9,622
Provision for warranty represents costs associated with providing sales support services which are accrued at the time of recognition of revenues and are expected to be utilised over a period of 1 to 2 years. Other provisions primarily include provisions for indirect tax related contingencies and litigations. The timing of cash outflows in respect of such provisions cannot be reasonably determined.

Standalone Financial Statements under Ind AS
180 Wipro Limited
A summary of activity for provision for warranty and other provisions is as follows:
Particulars
As at March 31, 2019 As at March 31, 2018 Provision for
warranty Others Total Provision for
warranty Others Total Provision at the beginning of the year ` 272 ` 878 ` 1,150 ` 311 ` 1,195 ` 1,506Additions during the year, net 291 13 304 282 17 299Utilised/ reversed during the year (287) (175) (462) (321) (334) (655)Provision at the end of the year ` 276 ` 716 ` 992 ` 272 ` 878 ` 1,150Included in the balance sheet as follows:Non-current portion ` 2 ` - ` 2 ` 3 ` - ` 3Current portion ` 274 ` 716 ` 990 ` 269 ` 878 ` 1,147
17. Other liabilities
As atMarch 31, 2019 March 31, 2018
Non-currentOthers ` 3,117 ` 2,296
` 3,117 ` 2,296CurrentStatutory and other liabilities ` 3,780 ` 3,067Advance from customers 1,077 1,224Others 815 684
` 5,672 ` 4,975Total ` 8,789 ` 7,271
18. Financial instruments
Financial assets and liabilities (carrying value / fair value)
As atMarch 31, 2019 March 31, 2018
AssetsCash and cash equivalents ` 103,902 ` 23,220Investments Financial instruments at FVTPL 13,960 46,438 Financial instruments at FVTOCI 185,297 178,007 Financial instruments at Amortised cost 20,980 27,658Investment in Subsidiaries 82,254 54,725Other financial assets Trade receivables 94,836 99,466 Unbilled receivables* 16,023 30,256 Other assets 9,656 8,296Derivative assets 5,093 1,273
` 532,001 ` 469,339LiabilitiesTrade payables and other payables Trade payables ` 47,655 ` 41,762 Other financial liabilities** 24,453 14,516Borrowings** 51,279 58,028Derivative liabilities 1,270 2,198
` 124,657 ` 116,504
* On account of adoption of Ind AS 115, unbilled revenues pertaining to fixed price development contracts of ` 10,845, as at March 31, 2019, has been considered as non-financial Contract assets, which are billable upon completion of milestones specified in the contracts.
** Includes current obligation under borrowings classified under ‘other current financial liabilities’.

Standalone Financial Statements under Ind AS
Annual Report 2018-19 181
Offsetting financial assets and liabilities
The following table contains information on other financial assets and trade payables and other payables subject to offsetting:
As at
March 31, 2019 March 31, 2018
Financial Assets:
Gross amounts of recognised other financial assets ` 126,612 ` 144,104
Gross amounts of recognised trade payables and other liabilities set off in the balance sheet
(6,097) (6,086)
Net amounts of recognised other financial assets presented in the balance sheet ` 120,515 ` 138,018
Financial liabilities
Gross amounts of recognised trade payables and other payables ` 78,205 ` 62,364
Gross amounts of recognised trade payables and other liabilities set off in the balance sheet
(6,097) (6,086)
Net amounts of recognised trade payables and other payables presented in the balance sheet
` 72,108 ` 56,278
For the financial assets and liabilities subject to offsetting or similar arrangements, each agreement between the Company and the counterparty allows for net settlement of the relevant financial assets and liabilities when both elect to settle on a net basis. In the absence of such an election, financial assets and liabilities will be settled on a gross basis and hence are not offset.
Fair value
The fair value of cash and cash equivalents, trade receivables, unbilled revenues, borrowings, trade payables, other current financial assets and liabilities approximate their carrying amount largely due to the short-term nature of these instruments. The Company’s long-term debt has been contracted at market rates of interest. Accordingly, the carrying value of such long-term debt approximates fair value. Further, finance lease receivables that are overdue are periodically evaluated based on individual credit worthiness of customers. Based on this evaluation, the Company records allowance for estimated losses on these receivables. As at March 31, 2019, and 2018, the carrying value of such receivables, net of allowances approximates the fair value.
Investments in liquid and short-term mutual funds, which are classified as FVTPL are measured using net asset values at the reporting date multiplied by the quantity held. Fair value of investments in certificate of deposits, commercial papers and bonds classified as FVTOCI is determined based on the indicative quotes of price and yields prevailing in the market at the reporting date. Fair value of investments in equity instruments classified as FVTOCI is determined using market and income approaches.
The fair value of derivative financial instruments is determined based on observable market inputs including currency spot and forward rates, yield curves, currency volatility etc.
. Fair value hierarchy
The table below analyses financial instruments carried at fair value, by valuation method. The different levels have been defined as follows:
Level 1 – Quoted prices (unadjusted) in active markets for identical assets or liabilities.
Level 2 – Inputs other than quoted prices included within Level 1 that are observable for the asset or liability, either directly (i.e., as prices) or indirectly (i.e., derived from prices).
Level 3 – Inputs for the assets or liabilities that are not based on observable market data (unobservable inputs).

Standalone Financial Statements under Ind AS
182 Wipro Limited
. The following table presents fair value of hierarchy of assets and liabilities measured at fair value on a recurring basis:
Particulars
As at March 31, 2019 As at March 31, 2018
Total
Fair value measurements at reporting date
Total
Fair value measurements at reporting date
Level 1 Level 2 Level 3 Level 1 Level 2 Level 3AssetsDerivative instruments: Cash flow hedges 3,149 3,149 1,139 - 1,139 - Others 1,944 1,944 134 - 134 -Investments: Investment in liquid and
short-term mutual funds13,960 13,960 46,438 46,438 - -
Other investments- Debentures
- - - - -
Investment in equity instruments-other than subsidiaries
249 249 1,773 - - 1,773
Commercial paper, Certificate of deposits and bonds
185,048 6,865 178,183 176,234 1,951 174,283 -
LiabilitiesDerivative instruments: Cash flow hedges (130) (130) (1,269) - (1,269) - Others (1,140) (1,140) (929) - (929) -
The following methods and assumptions were used to estimate the fair value of the level 2 financial instruments included in the above table.
Derivative instruments (assets and liabilities): The Company enters into derivative financial instruments with various counter-parties, primarily, banks with investment grade credit ratings. Derivatives valued using valuation techniques with market observable inputs are mainly interest rate swaps, foreign exchange forward contracts and foreign exchange option contracts. The most frequently applied valuation techniques include forward pricing, swap models and Black Scholes models (for option valuation), using present value calculations. The models incorporate various inputs including the credit quality of counterparties, foreign exchange spot and forward rates, interest rate curves and forward rate curves of the underlying. As at March 31, 2019, the changes in counterparty credit risk had no material effect on the hedge effectiveness assessment for derivatives designated in hedge relationships and other financial instruments recognised at fair value.
Investment in commercial papers, certificate of deposits and bonds: Fair value of these instruments is derived based on the indicative quotes of price and yields prevailing in the market as at reporting date.
Details of assets and liabilities considered under Level 3 classification
Particulars Investments in equity instruments
Derivative Assets – Others
Balance as at April 1, 2017 ` 3,533 ` 426Gain/(loss) recognised in statement of profit and loss - (426)Gain/(loss) recognised in other comprehensive income (1,760) -Balance as at March 31, 2018 ` 1,773 ` -Balance as at April 1, 2018 ` 1,773 ` -Additions 51Additions on account of merger 352Disposals (454)Gain/(loss) recognised in other comprehensive income (1,473)Balance as at March 31, 2019 ` 249 ` -

Standalone Financial Statements under Ind AS
Annual Report 2018-19 183
As at March 31, 2019 and 2018, a one percentage point change in the unobservable inputs used in fair valuation of Level 3 assets does not have a significant impact in its value.
Derivative assets and liabilities:
The Company is exposed to foreign currency fluctuations on foreign currency assets / liabilities and forecasted cash flows denominated in foreign currency and net investment in foreign operations. The Company follows established risk management policies, including the use of derivatives to hedge foreign currency assets / liabilities and foreign currency forecasted cash flows and net investment in foreign operations. The counter parties in these derivative instruments are primarily banks and the Company considers the risks of non-performance by the counterparty as non-material.
The following table presents the aggregate contracted principal amounts of the Company’s derivative contracts outstanding:
(in millions)As at
March 31, 2019 March 31, 2018Notional Fair value Notional Fair value
Designated derivatives instruments Sell : Forward contracts USD 333 ` 1,410 USD 904 ` 951
€ - - € 134 ` (531)£ - - £ 147 ` (667)AUD 97 ` 15 AUD 77 ` 29
Range forward options contracts USD 1,067 ` 1,149 USD 182 ` 5AUD 56 ` 39 AUD - -€ 153 ` 349 € 10 ` 2£ 191 ` 68 £ 13 ` 5
Non-designated derivatives instruments Sell : Forward contracts USD 1,065 ` 1,377 USD 919 ` (348)
€ 32 ` 55 € 58 ` 6£ 1 ` (1) £ 95 ` (56)AUD 82 ` 28 AUD 77 ` 68SGD 11 ` 1 SGD 6 ` (1)ZAR 56 ` 14 ZAR 132 ` (16)CAD 56 ` 40 CAD 14 ` 32CHF 10 ^ CHF 6 ` 3SAR 123 ` (1) SAR 62 ^AED 9 ^ AED 8 ^PLN 38 ` 15 PLN 36 ` 12QAR 3 ` (1) QAR 11 ` (3)TRY 28 ` 12 TRY 10 ` 8MXN - - MXN 61 ` (6)NOK 29 ` 4 NOK 34 ` 3OMR 1 ` (1) OMR 3 ` (1)SEK 35 ` 5 SEK - -
Range forward options contracts USD 150 ` 161 USD 50 ` (6)£ 71 ` 57 £ 20 ` (2)€ 31 ` 12 € - -
Buy : Forward contracts USD 730 ` (971) USD 575 ` (417)MXN 9 ^ MXN - -JPY 154 ^ JPY 399 ` 6DKK 75 ` (13) DKK 9 ` (1)
` 3,824 ` (925)
^ Value is less than ` 1.
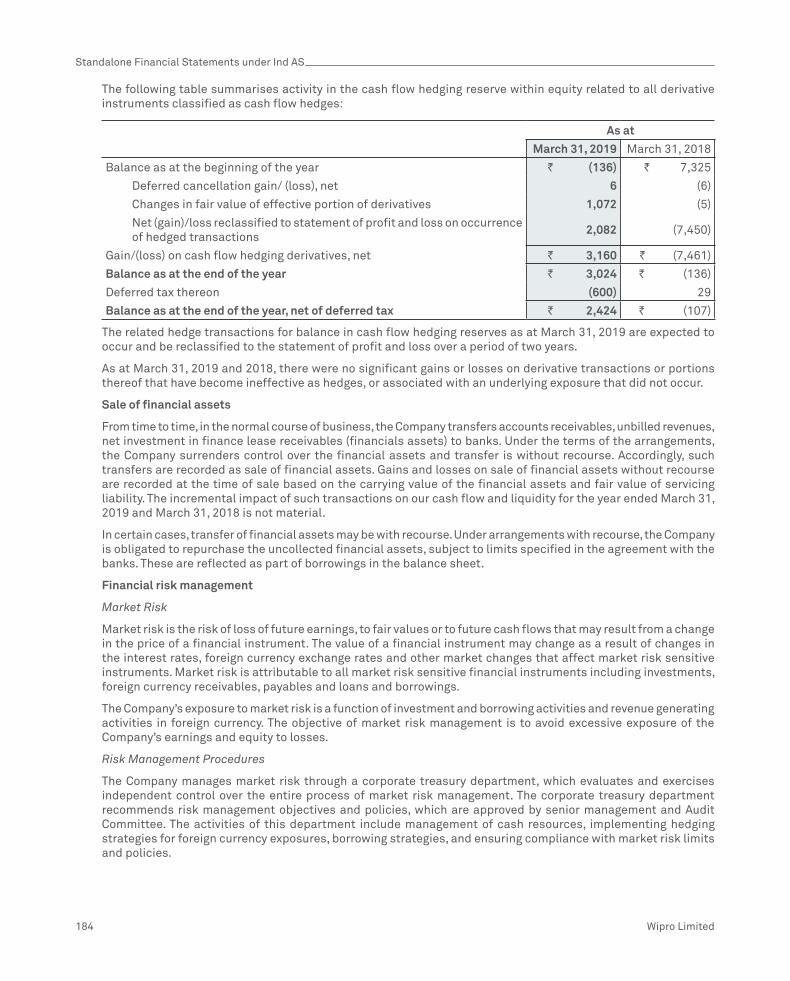
Standalone Financial Statements under Ind AS
184 Wipro Limited
The following table summarises activity in the cash flow hedging reserve within equity related to all derivative instruments classified as cash flow hedges:
As at
March 31, 2019 March 31, 2018
Balance as at the beginning of the year ` (136) ` 7,325
Deferred cancellation gain/ (loss), net 6 (6)
Changes in fair value of effective portion of derivatives 1,072 (5)
Net (gain)/loss reclassified to statement of profit and loss on occurrence of hedged transactions
2,082 (7,450)
Gain/(loss) on cash flow hedging derivatives, net ` 3,160 ` (7,461)
Balance as at the end of the year ` 3,024 ` (136)
Deferred tax thereon (600) 29
Balance as at the end of the year, net of deferred tax ` 2,424 ` (107)
The related hedge transactions for balance in cash flow hedging reserves as at March 31, 2019 are expected to occur and be reclassified to the statement of profit and loss over a period of two years.
As at March 31, 2019 and 2018, there were no significant gains or losses on derivative transactions or portions thereof that have become ineffective as hedges, or associated with an underlying exposure that did not occur.
Sale of financial assets
From time to time, in the normal course of business, the Company transfers accounts receivables, unbilled revenues, net investment in finance lease receivables (financials assets) to banks. Under the terms of the arrangements, the Company surrenders control over the financial assets and transfer is without recourse. Accordingly, such transfers are recorded as sale of financial assets. Gains and losses on sale of financial assets without recourse are recorded at the time of sale based on the carrying value of the financial assets and fair value of servicing liability. The incremental impact of such transactions on our cash flow and liquidity for the year ended March 31, 2019 and March 31, 2018 is not material.
In certain cases, transfer of financial assets may be with recourse. Under arrangements with recourse, the Company is obligated to repurchase the uncollected financial assets, subject to limits specified in the agreement with the banks. These are reflected as part of borrowings in the balance sheet.
Financial risk management
Market Risk
Market risk is the risk of loss of future earnings, to fair values or to future cash flows that may result from a change in the price of a financial instrument. The value of a financial instrument may change as a result of changes in the interest rates, foreign currency exchange rates and other market changes that affect market risk sensitive instruments. Market risk is attributable to all market risk sensitive financial instruments including investments, foreign currency receivables, payables and loans and borrowings.
The Company’s exposure to market risk is a function of investment and borrowing activities and revenue generating activities in foreign currency. The objective of market risk management is to avoid excessive exposure of the Company’s earnings and equity to losses.
Risk Management Procedures
The Company manages market risk through a corporate treasury department, which evaluates and exercises independent control over the entire process of market risk management. The corporate treasury department recommends risk management objectives and policies, which are approved by senior management and Audit Committee. The activities of this department include management of cash resources, implementing hedging strategies for foreign currency exposures, borrowing strategies, and ensuring compliance with market risk limits and policies.

Standalone Financial Statements under Ind AS
Annual Report 2018-19 185
Foreign currency risk
The Company operates internationally and a major portion of its business is transacted in several currencies. Consequently, the Company is exposed to foreign exchange risk through receiving payment for sales and services in the United States and elsewhere, and making purchases from overseas suppliers in various foreign currencies. The exchange rate risk primarily arises from foreign exchange revenue, receivables, cash balances, forecasted cash flows, payables and foreign currency loans and borrowings. A significant portion of the Company’s revenue is in the U.S. Dollar, the United Kingdom Pound Sterling, the Euro, the Canadian Dollar and the Australian Dollar, while a large portion of costs are in Indian rupees. The exchange rate between the rupee and these currencies has fluctuated significantly in recent years and may continue to fluctuate in the future. Appreciation of the rupee against these currencies can adversely affect the Company’s results of operations.
The Company evaluates exchange rate exposure arising from these transactions and enters into foreign currency derivative instruments to mitigate such exposure. The Company follows established risk management policies, including the use of derivatives like foreign exchange forward/option contracts to hedge forecasted cash flows denominated in foreign currency.
The Company has designated certain derivative instruments as cash flow hedges to mitigate the foreign exchange exposure of forecasted highly probable cash flows.
As at March 31, 2019 and 2018, respectively, a ` 1 increase/decrease in the spot exchange rate of the Indian rupee with the U.S. dollar would result in approximately ̀ 1,885 (Statement of profit and loss ̀ 485 and other comprehensive income ̀ 1,400) and ̀ 1,500 (Statement of profit and loss ̀ 414 and other comprehensive income ̀ 1,086), respectively, decrease/increase in the fair value of foreign currency dollar denominated derivative instruments.
The below table presents foreign currency risk from non-derivative financial instruments as of March 31, 2019 and 2018:
(` in millions)
As at March 31, 2019
ParticularsUS $ Euro Pound
SterlingAustralian
DollarCanadian
DollarOther
currencies #Total
Trade receivables 44,265 8,677 5,779 3,730 2,208 9,023 73,682Unbilled receivables 7,209 1,564 3,145 1,225 199 660 14,002Contract Asset 4,495 1,390 2,270 836 150 476 9,617Cash and cash equivalents 9,295 1,771 1,574 975 1,929 1,989 17,533Other assets 1,483 958 124 764 17 259 3,605Borrowings * (50,516) (20) (21) (33) - (21) (50,611)Trade payables and other financial liabilities
(27,899) (3,836) (4,365) (1,520) (801) (2,768) (41,189)
Net assets/ (liabilities) (11,668) 10,504 8,506 5,977 3,702 9,618 26,639
As at March 31, 2018
ParticularsUS $ Euro Pound
SterlingAustralian
DollarCanadian
DollarOther
currencies #
Total
Trade receivables 43,954 8,929 6,736 3,423 1,625 7,674 72,342Unbilled receivables 12,384 2,375 5,175 2,094 338 1,480 23,846Cash and cash equivalents 3,824 2,055 1,685 786 34 2,177 10,561Other assets 1,393 1,710 279 1,122 1 308 4,813
Borrowings * (47,302) (41) (37) (165) - (137) (47,682)
Trade payables and other financial liabilities*
(17,539) (3,199) (6,059) (1,515) (654) (3,070) (32,036)
Net assets/ (liabilities) (3,286) 11,829 7,779 5,745 1,344 8,432 31,844
# Other currencies reflect currencies such as Saudi Arabian Riyals,UAE Dirhams, Swiss francs, Singapore Dollars etc.
* Includes current obligation under borrowings classified under “Other current financial liabilities”

Standalone Financial Statements under Ind AS
186 Wipro Limited
As at March 31, 2019 and 2018, respectively, every 1% increase/decrease of the respective foreign currencies compared to functional currency of the Company would impact results by approximately ̀ 267 and ̀ 318 respectively.
Interest rate risk
Interest rate risk primarily arises from floating rate borrowing, including various revolving and other lines of credit. The Company’s investments are primarily in short-term investments, which do not expose it to significant interest rate risk. The Company manages its net exposure to interest rate risk relating to borrowings by entering into interest rate swap agreements, which allows it to exchange periodic payments based on a notional amount and agreed upon fixed and floating interest rates. Certain borrowings are also transacted at fixed interest rates. If interest rates were to increase by 100 bps from March 31, 2019, additional net annual interest expense on floating rate borrowing would amount to approximately ` 505.
Credit risk
Credit risk arises from the possibility that customers may not be able to settle their obligations as agreed. To manage this, the Company periodically assesses the financial reliability of customers, taking into account the financial condition, current economic trends, analysis of historical bad debts and ageing of accounts receivable. Individual risk limits are set accordingly. No single customer accounted for more than 10% of the accounts receivable as at March 31, 2019 and 2018, respectively and revenues for the year ended March 31, 2019 and 2018, respectively. There is no significant concentration of credit risk.
Counterparty risk
Counterparty risk encompasses issuer risk on marketable securities, settlement risk on derivative and money market contracts and credit risk on cash and time deposits. Issuer risk is minimised by only buying securities which are at least AA rated in India based on Indian rating agencies. Settlement and credit risk is reduced by the policy of entering into transactions with counterparties that are usually banks or financial institutions with acceptable credit ratings. Exposure to these risks are closely monitored and maintained within predetermined parameters. There are limits on credit exposure to any financial institution. The limits are regularly assessed and determined based upon credit analysis including financial statements and capital adequacy ratio reviews.
Liquidity risk
Liquidity risk is defined as the risk that the Company will not be able to settle or meet its obligations on time or at a reasonable price. The Company’s corporate treasury department is responsible for liquidity and funding as well as settlement management. In addition, processes and policies related to such risks are overseen by senior management. Management monitors the Company’s net liquidity position through rolling forecasts on the basis of expected cash flows. As at March 31, 2019, cash and cash equivalents are held with major banks and financial institutions.
The table below provides details regarding the remaining contractual maturities of significant financial liabilities at the reporting date. The amounts include estimated interest payments and exclude the impact of netting agreements, if any.
As at March 31, 2019
Contractual cash flows Carrying value
Less than 1 year
1-2 years
2-4 years
4-7 years
Total
Borrowings* ` 51,816 ` 51,872 ` 207 ` 21 ` ` 52,100
Trade payables and other financial liabilities* 72,108 72,108 - - - 72,108
Derivative liabilities 1,270 1,270 - - - 1,270

Standalone Financial Statements under Ind AS
Annual Report 2018-19 187
As at March 31, 2018
Contractual cash flows Carrying value
Less than 1 year
1-2 years
2-4 years
4-7 years
Total
Borrowings* ` 58,028 ` 58,134 ` 541 ` 226 ` - ` 58,901
Trade payables and other financial liabilities* 56,278 56,278 - - - 56,278
Derivative liabilities 2,198 2,198 - - - 2,198
* Includes current obligation under borrowings and financial leases classified under “Other current financial liabilities”.
The balanced view of liquidity and financial indebtedness is stated in the table below. This calculation of the net cash position is used by the management for external communication with investors, analysts and rating agencies:
As at
March 31, 2019 March 31, 2018
Cash and cash equivalent ` 103,902 ` 23,220
Investment 219,988 248,412
Borrowings* (51,816) (58,028)
Loans to subsidiaries - -
` 272,074 ` 213,604
* Includes current obligation under borrowings and financial leases classified under “Other current financial liabilities”.
19. Income tax
Income tax expense has been allocated as follows:
Year endedMarch 31, 2019 March 31, 2018
Income tax expense Current taxes 22,725 ` 24,345 Deferred taxes (160) (1,230)Income tax included in Other comprehensive income on: Unrealised gains/ (losses) on investment securities 69 (645) Gains/(losses) on cash flow hedging derivatives (629) (1,448) Defined benefit plan actuarial gains (42) 255Total income taxes ` 21,963 ` 21,277
Income tax expenses consists of the following:
Year endedMarch 31, 2019 March 31, 2018
Current taxes Domestic 17,766 18,591 Foreign 4,959 5,754
22,725 24,345Deferred taxes Domestic (196) (286) Foreign 36 (944)
(160) (1,230) Total income tax expense ` 22,565 ` 23,115

Standalone Financial Statements under Ind AS
188 Wipro Limited
Income tax expenses are net of reversal of provisions pertaining to earlier periods, amounting to ̀ 1,092 and ̀ 436 for the year ended March 31, 2019 and 2018 respectively.
The reconciliation between the provision of income tax and amounts computed by applying the Indian statutory income tax rate to profit before taxes is as follows:
Year endedMarch 31, 2019 March 31, 2018
Profit before tax ` 98,705 ` 100,343 Enacted income tax rate in India 34.94% 34.61% Computed expected tax expense 34,488 34,729 Effect of: Income exempt from tax (16,057) (12,346) Basis differences that will reverse during a tax holiday period (796) (183) Income taxed at higher/ (lower) rates 212 277 Reversal of deferred tax liability for past years due to rate reduction * - (347) Taxes related to prior years (1,092) (436) Changes in unrecognised deferred tax assets 4,399 - Expenses disallowed for tax purpose 1,415 1,422 Others, net (4) (2)Total income taxes expenses ` 22,565 ` 23,115Effective income tax rate 22.86% 23.04%
*The “Tax Cuts and Jobs Act,” was signed into law on December 22, 2017 (‘US Tax Reforms’) which among other things, makes significant changes to the rules applicable to the taxation of corporations, such as changing the corporate tax rate from 35% to 21% rate effective January 1, 2018. For the year ended March 2018, the Company took a positive impact of ` 347 on account of re-statement of deferred tax items pursuant to US Tax Reforms.
The components of deferred tax assets and liabilities are as follows:
As at
March 31, 2019 March 31, 2018
Carry-forward losses ` 100 ` 407
Other liabilities 2,743 2,761
Allowances for lifetime expected credit losses 4,366 4,405
Cash flow hedges - 29
Others 203 -
` 7,412 ` 7,602
Property, plant and equipment ` (333) ` (1,320)
Amortisable goodwill (77) (90)
Interest on bonds and fair value movement of investments (1,463) (1,739)
Cash flow hedges (600) -
Others (1,133) (396)
` (3,606) ` (3,545)
Net deferred tax assets / (liabilities) ` 3,806 ` 4,057
Amounts presented in the balance sheet
Deferred tax assets ` 3,910 ` 4,520
Deferred tax liabilities ` 104 ` 463

Standalone Financial Statements under Ind AS
Annual Report 2018-19 189
Movement in deferred tax assets and liabilities
Movement during the year ended March 31, 2019
Particulars As at April 1, 2018
Credit/ (charge) in the
statement of profit and loss
Credit/ (charge) in the Other
comprehensive income
Others* As at March 31, 2019
Carry-forward losses 407 (307) - 100
Other liabilities 2,761 12 (42) 13 2,744
Allowances for lifetime expected credit losses 4,405 (39) - 4,366
Cash flow hedges 28 - (629) (601)
Property, plant and equipment (1,319) 983 - 3 (333)
Amortisable goodwill (90) 13 - (77)
Interest on bonds and fair value movement of investments (1,739) 207 69 (1,463)
Others (396) (709) - 175 (930)
Total 4,057 160 (602) 191 3,806
* Includes additions on account of merger as explained in footnotes to Note 32.
Movement during the year ended March 31, 2018
ParticularsAs at April 1,
2017
Credit/ (charge) in the statement of profit and loss
Credit/ (charge) in the Other
comprehensive income
As at March 31, 2018
Carry-forward losses - 407 - 407Other liabilities 2,882 134 (255) 2,761Allowances for lifetime expected credit losses 2,783 1,622 - 4,405Minimum alternate tax 1,469 (1,469) - -Cash flow hedges (1,420) - 1,448 28Property, plant and equipment (1,682) 363 - (1,319)Amortisable goodwill (899) 809 - (90)Interest on bonds and fair value movement of investments (2,245) (139) 645 (1,739)Deferred / unbilled revenue (62) 62 - -Others 135 (531) - (396)Total 961 1,258 1,838 4,057
Deferred taxes on unrealised foreign exchange gain / loss relating to cash flow hedges, fair value movements in investments and actuarial gains/losses on defined benefit plans are recognised in other comprehensive income and presented within equity. Other than these, the change in deferred tax assets and liabilities is primarily recorded in the statement of profit and loss.
In assessing the realisability of deferred tax assets, the Company considers the extent to which it is probable that the deferred tax asset will be realised. The ultimate realization of deferred tax assets is dependent upon the generation of future taxable profits during the periods in which those temporary differences and tax loss carry-forwards become deductible. The Company considers the expected reversal of deferred tax liabilities, projected future taxable income and tax planning strategies in making this assessment. Based on this, the Company believes that it is probable that the Company will realise the benefits of these deductible differences. The amount of deferred tax asset considered realisable, however, could be reduced in the near term if the estimates of future taxable income during the carry-forward period are reduced.

Standalone Financial Statements under Ind AS
190 Wipro Limited
The Company has recognised deferred tax assets of ` 100 and ` 407 as at March 31, 2019 and 2018 in respect of capital loss incurred on account of liquidation of a subsidiary. Management’s projections of future taxable capital gain support the assumption that it is probable that sufficient taxable income will be available to utilise this deferred tax asset.
The Company has calculated its tax liability for current domestic taxes after considering MAT. The excess tax paid under MAT provisions over and above normal tax liability can be carried forward and set-off against future tax liabilities computed under normal tax provisions. The Company is not carrying any deferred tax assets as at March 31, 2019 relating to MAT.
A substantial portion of the profits of the Company’s India operations are exempt from Indian income taxes being profits attributable to export operations and profits from units established under Special Economic Zone, 2005 scheme. Units in designated special economic zones providing service on or after April 1, 2005 will be eligible for a deduction of 100 percent of profits or gains derived from the export of services for the first five years from commencement of provision of services and 50 percent of such profits and gains for a further five years. Certain tax benefits are also available for a further five years subject to the unit meeting defined conditions. Profits from certain other undertakings are also eligible for preferential tax treatment. The tax holiday period being currently available to the Company expires in various years through fiscal 2032-33. The expiration period of tax holiday for each unit within a SEZ is determined based on the number of years that have lapsed following year of commencement of production by that unit. The impact of tax holidays has resulted in a decrease of current tax expense of `15,390 and ̀ 11,598 for the year ended March 31, 2019 and 2018, respectively, compared to the effective tax amounts that we estimate we would have been required to pay if these incentives had not been available. The effect of these tax incentives on earnings per share for the year ended March 31, 2019 and 2018 was ` 2.56 and `1.83, respectively.
Deferred income tax liabilities are recognised for all taxable temporary differences except in respect of taxable temporary differences associated with US branch profit tax where the timing of the reversal of the temporary difference can be controlled and it is probable that the temporary difference will not reverse in the foreseeable future. Accordingly, deferred income tax liabilities on branch profit tax @ 15% of the US branch profits have not been recognised as the Company intends to reinvest the earnings in the branch operations. Further, it is not practicable to estimate the amount of the unrecognised deferred tax liabilities for these undistributed earnings.
20. Revenue from operations
Year endedMarch 31, 2019 March 31, 2018
Sale of Services ` 468,529 ` 430,638 Sales of Products 11,769 16,462
` 480,298 ` 447,100
21. Other operating income
Sale of hosted data center service business: During the year ended March 31, 2019, the Company has concluded the sale of its hosted data center business in Singapore and United Kingdom.
The assets and liabilities associated with the transaction were classified as assets held for sale and liabilities directly associated with assets held for sale amounting to ` 451 as at March 31, 2018.
Loss of control in subsidiary: During the year ended March 31, 2019, the Company has reduced its equity holding from 74% to 11% in Wipro Airport IT Services Limited.
Sale of Workday and Cornerstone OnDemand business: During the year ended March 31, 2019, the Company has concluded the sale of Workday and Cornerstone OnDemand business.
The loss/ gain on these transactions is insignificant.

Standalone Financial Statements under Ind AS
Annual Report 2018-19 191
22. Other income
Year endedMarch 31, 2019 March 31, 2018
Interest income ` 19,729 ` 17,300Dividend income 353 609Net Gain on sale of investments classified as FVTPL 2,014 5,410Net Gain on sale of investments classified as FVTOCI 311 174Finance and other income 22,407 23,493
Foreign exchange gain/(loss), net on financial instruments measured at FVTPL 1,263 (82)Other foreign exchange differences, net 2,016 1,385Foreign exchange gain/(loss), net 3,279 1,303
` 25,686 ` 24,796
23. Changes in inventories of finished goods and stock-in-trade
Year endedMarch 31, 2019 March 31, 2018
Opening stockFinished products ` 3 ` 5Traded goods 2,171 2,746
2,174 2,751Less: Closing StockFinished products 3 3Traded goods 2,724 2,171
2,727 2,174Decrease/ (Increase) ` (553) ` 577
24. Employee benefits
(a) Employee costs include:
Year endedMarch 31, 2019 March 31, 2018
Salaries and bonus (Refer Note 26) ` 229,693 ` 209,617 Employee benefits plans
Gratuity and other defined benefit plans 1,193 1,413 Defined contribution plans 5,353 5,274
Share based compensation 1,846 1,258` 238,085 ` 217,562
Defined benefit plan actuarial (gains)/ losses recognised in other comprehensive income include:
Year endedMarch 31, 2019 March 31, 2018
Re-measurement of net defined benefit liability/(asset) Return on plan assets excluding interest income ` (35) ` (60) Actuarial (gains)/loss arising from financial assumptions 106 (195) Actuarial (gains)/loss arising from demographic assumptions (17) (41) Actuarial (gains)/loss arising from experience adjustments (223) (450)
` (169) ` (746)

Standalone Financial Statements under Ind AS
192 Wipro Limited
b) Defined benefit plans- Gratuity:
In accordance with the Payment of Gratuity Act, 1972, applicable for Indian companies, the Company provides for a lump sum payment to eligible employees, at retirement or termination of employment based on the last drawn salary and years of employment with the Company. The gratuity fund is managed by certain third party fund managers. The Company’s obligation in respect of the gratuity plan, which is a defined benefit plan, is provided for based on actuarial valuation using the projected unit credit method. The Company recognises actuarial gains and losses immediately in other comprehensive income, net of taxes. Amount recognised in the statement of profit and loss in respect of gratuity cost (defined benefit plan) is as follows:
Year endedMarch 31, 2019 March 31, 2018
Current service cost ` 1,205 ` 1,413Net interest on net defined benefit liability/(asset) (12) ^ Net gratuity cost/(benefit) 1,193 1,413Actual return on plan assets ` 573 ` 526
^ Value is less than ` 1.
Gratuity is applicable only to employees drawing a salary in Indian rupees and there are no other foreign defined benefit gratuity plans.
Change in present value of defined benefit obligation is summarised below:
As atMarch 31, 2019 March 31, 2018
Defined benefit obligation at the beginning of the year ` 7,539 ` 6,856Transfer in 25 ` 349Current service cost 1,205 1,413Interest on obligation 526 466Benefits paid (912) (859)Remeasurement (gains)/loss Actuarial (gains)/loss arising from financial assumptions 106 (195) Actuarial (gains)/loss arising from demographic assumptions (17) (41) Actuarial (gains)/loss arising from experience adjustments (223) (450)Defined benefit obligation at the end of the year ` 8,249 ` 7,539
Change in plan assets is summarised below:
As atMarch 31, 2019 March 31, 2018
Fair value of plan assets at the beginning of the year ` 7,673 ` 6,820Transfer in - 312Expected return on plan assets 538 466Employer contributions 34 15Benefits paid (6) -Remeasurement (gains)/loss Return on plan assets excluding interest income 35 60Fair value of plan assets at the end of the year ` 8,274 ` 7,673Present value of unfunded obligation 25 134Recognised asset/(liability) 25 134
As at March 31, 2019 and 2018, plan assets were primarily invested in insurer managed funds.
The Company has established an income tax approved irrevocable trust fund to which it regularly contributes to finance the liabilities of the gratuity plan. The fund’s investments are managed by certain insurance companies as per the mandate provided to them by the trustees and the asset allocation is within the permissible limits prescribed in the insurance regulations.

Standalone Financial Statements under Ind AS
Annual Report 2018-19 193
The principal assumptions used for the purpose of actuarial valuation of these defined benefit plans are as follows:
As at
March 31, 2019 March 31, 2018
Discount rate 6.63% 6.93%
Expected return on plan assets 6.63% 6.93%
Expected rate of salary increase 7.52% 7.51%
Duration of defined benefit obligations 6 years 5 years
The expected return on plan assets is based on expectation of the average long term rate of return expected on investments of the fund during the estimated term of the obligations.
The discount rate is primarily based on the prevailing market yields of Indian government securities for the estimated term of the obligations. The estimates of future salary increases considered takes into account the inflation, seniority, promotion and other relevant factors. Attrition rate considered is the management’s estimate, based on previous years’ employee turnover of the Company.
The expected future contribution and estimated future benefit payments from the fund are as follows:
Expected contribution to the fund during the year ending March 31, 2020 1,286Estimated benefit payments from the fund for the year ending March 31: 2020 1,381 2021 1,060 2022 1,055 2023 1,051 2024 1,048Thereafter 6,712Total 12,307
The expected benefits are based on the same assumptions used to measure the Company’s benefit obligations as at March 31, 2019.
Sensitivity for significant actuarial assumptions is computed to show the movement in defined benefit obligation by 0.5 percentage.
As at March 31, 2019, every 0.5 percentage point increase/ (decrease) in discount rate will result in (decrease)/increase of gratuity benefit obligation by approximately ` (242) and `265 respectively.
As at March 31, 2019 every 0.5 percentage point increase/ (decrease) in expected rate of salary will result in increase/ (decrease) of gratuity benefit obligation by approximately ` 217 and ` (204) respectively.
c) Provident fund:
The details of fund and plan assets are given below:
As at
March 31, 2019 March 31, 2018
Fair value of plan assets ` 53,015 ` 46,016
Present value of defined benefit obligation 53,015 46,016
Net (shortfall)/ excess ` - ` -
The plan assets have been primarily invested in government securities and corporate bonds.

Standalone Financial Statements under Ind AS
194 Wipro Limited
The principal assumptions used in determining the present value obligation of interest guarantee under the deterministic approach are as follows:
As at
March 31, 2019 March 31, 2018
Discount rate for the term of the obligation 7.00% 7.35%
Average remaining tenure of investment portfolio 8 years 7 years
Guaranteed rate of return 8.65% 8.55%
Also refer Note 30 for details of employee stock options.
25. Finance costs
Year endedMarch 31, 2019 March 31, 2018
Interest expense ` 3,320 ` 1,559 Exchange fluctuation on foreign currency borrowings, net (to the extent regarded as borrowing cost)
1,929 2,284
` 5,249 ` 3,843
26. Other Expenses
Year ended
March 31, 2019 March 31, 2018
Rates, taxes and insurance 712 1,530 Lifetime expected credit loss and provision for deferred contract cost * 729 5,013 Provision for diminution in value of investments in subsidiaries 7,356 (268) Auditors' remuneration Audit fees 60 50 For taxation matters 4 9 Out of pocket expenses 4 4 Miscellaneous expenses ** 8,455 1,952
` 17,320 ` 8,290
* Consequent to insolvency of two customers, the Company has recognised a provision of ` 3,832 for impairment of receivables and deferred contract cost. ` 416 and ` 3,146 of these provisions have been included in employee benefits expense and allowance for lifetime expected credit loss respectively for the year ended March 31, 2018.
** Miscellaneous expenses for the year ended March 31, 2019 include an amount of ` 5,141 paid to National Grid on settlement of a legal claim against the company.
27. Earnings per equity share
A reconciliation of profit for the year and equity shares used in the computation of basic and diluted earnings per equity share is set out below:
Basic: Basic earnings per share is calculated by dividing the profit attributable to equity shareholders of the Company by the weighted average number of equity shares outstanding during the year, excluding equity shares purchased by the Company and held as treasury shares.
Year endedMarch 31, 2019 March 31, 2018
Profit attributable to equity holders of the Company ` 76,140 ` 77,228Weighted average number of equity shares outstanding 6,007,376,837 6,333,391,200Basic earnings per share ` 12.67 ` 12.19

Standalone Financial Statements under Ind AS
Annual Report 2018-19 195
Diluted: Diluted earnings per share is calculated by adjusting the weighted average number of equity shares outstanding during the year for assumed conversion of all dilutive potential equity shares. Employee share options are dilutive potential equity shares for the Company.
The calculation is performed in respect of share options to determine the number of shares that could have been acquired at fair value (determined as the average market price of the Company’s shares during the year). The number of shares calculated as above is compared with the number of shares that would have been issued assuming the exercise of the share options.
Year endedMarch 31, 2019 March 31, 2018
Profit attributable to equity holders of the Company ` 76,140 ` 77,228Weighted average number of equity shares outstanding 6,007,376,837 6,333,391,200Effect of dilutive equivalent share options 14,927,530 11,091,433Weighted average number of equity shares for diluted earnings per share 6,022,304,367 6,344,482,633Diluted earnings per share ` 12.64 ` 12.17
Earnings per share and number of share outstanding for the year ended March 31, 2018 have been proportionately adjusted for the bonus issue in the ratio of 1:3 i.e.1 (One) bonus equity share of ` 2 each for every 3 (three) fully paid-up equity shares held. Refer Note 28.
28. Dividends, Bonus and Buyback of equity shares
The Company declares and pays dividends in Indian rupees. According to the Companies Act, 2013 any dividend should be declared out of accumulated distributable profits. A Company may, before the declaration of any dividend, transfer a percentage of its profits for that financial year as it may consider appropriate to the reserves.
The cash dividends paid per equity share were ` 1 and ` 1, during the year ended March 31, 2019 and 2018, respectively, including an interim dividend of ` 1 and ` 1 for the year ended March 31, 2019 and 2018.
During the year ended March 31, 2019, the bonus issue in the proportion of 1:3 i.e.1 (One) bonus equity share of ̀ 2 each for every 3 (three) fully paid-up equity shares held (including ADS holders) was approved by the shareholders of the Company on February 22, 2019, through Postal Ballot /e-voting. Subsequently, on March 8, 2019, the Company allotted 1,508,469,180 equity shares to shareholders who held equity shares as on the record date of March 7, 2019 and ̀ 3,016 (representing par value of ̀ 2 per share) was transferred from capital redemption reserves, securities premium and retained earnings to the share capital.
During the year ended March 31, 2018, the bonus issue in the proportion of 1:1 i.e.1 (One) bonus equity share of ` 2 each for every 1 (one) fully paid-up equity share held (including ADS holders) had been approved by the shareholders of the Company on June 03, 2017 through Postal Ballot /e-voting. For this purpose, June 14, 2017, was fixed as the record date. Consequently, on June 15, 2017, the Company allotted 2,433,074,327 shares and ` 4,866 (representing par value of ` 2 per share) has been transferred from retained earnings to share capital.
During the year ended March 31, 2018, the Company had concluded the buyback of 343,750,000 equity shares as approved by the Board of Directors on July 20, 2017. This had resulted in a total cash outflow of ` 110,000. In line with the requirement of the Companies Act 2013, an amount of ` 1,656 and ` 108,344 has been utilised from the securities premium reserve and retained earnings respectively. Further, capital redemption reserves of ` 687 (representing the nominal value of the shares bought back) has been created as an apportionment from retained earnings. Consequent to such buyback, share capital has reduced by ` 687.
29. Additional capital disclosures
The key objective of the Company’s capital management is to ensure that it maintains a stable capital structure with the focus on total equity to uphold investor, creditor, and customer confidence and to ensure future development of its business. The Company focused on keeping strong total equity base to ensure independence, security, as well as a high financial flexibility for potential future borrowings, if required without impacting the risk profile of the Company.
The Company’s goal is to continue to be able to return excess liquidity to shareholders by continuing to distribute annual dividends in future periods.

Standalone Financial Statements under Ind AS
196 Wipro Limited
The amount of future dividends/ buyback of equity shares will be balanced with efforts to continue to maintain an adequate liquidity status.
The capital structure as of March 31, 2019 and 2018 was as follows:
As at
March 31, 2019 March 31, 2018 % Change
Total equity (A) ` 493,920 ` 422,626 16.87%As percentage of total capital 90.59% 87.93%Current borrowings * 51,059 57,304Non-current borrowings 220 724Total borrowings (B) ` 51,279 ` 58,028 (11.63%)As percentage of total capital 9.41% 12.07%Total capital (A) + (B) ` 545,199 ` 480,654 13.43%
* Includes current obligation under borrowings classified under “Other current financial liabilities” (Refer Note 13).
30. Employee stock option
The stock compensation expense recognised for employee services received during the year ended year ended March 31, 2019 and March 31, 2018 were ` 1,846 and ` 1,258, respectively.
Wipro Equity Reward Trust (“WERT”)
In 1984, the Company established a controlled trust called the Wipro Equity Reward Trust (“WERT”). In the earlier years, WERT purchased shares of the Company out of funds borrowed from the Company. The Company’s Board Governance, Nomination and Compensation Committee recommends to WERT certain officers and key employees, to whom WERT issues shares from its holdings at nominal price. Such shares are then held by the employees subject to vesting conditions.
Wipro Employee Stock Option Plans and Restricted Stock Unit Option Plans
A summary of the general terms of grants under stock option plans and restricted stock unit option plans are as follows:
Name of Plan No. of options reserved under
the Plan
Range of Exercise Prices
Wipro Employee Stock Option Plan 2000 (2000 Plan) 747,474,747 ` 171 - 490Wipro ADS Restricted Stock Unit Plan (WARSUP 2004 plan) 59,797,979 US $ 0.03Wipro employee Restricted Stock Unit Plan 2005 (WSRUP 2005 plan) 59,797,979 ` 2Wipro employee Restricted Stock Unit Plan 2007 (WSRUP 2007 plan) 49,831,651 ` 2Wipro Equity Reward Trust Employee Stock Purchase Plan, 2013 39,546,197 ` 2

Standalone Financial Statements under Ind AS
Annual Report 2018-19 197
The activity in these stock option plans is summarised below:
Particulars Range of Exercise
prices
Year endedMarch 31, 2019 March 31, 2018
Number Weight Average exercise price
Number Weight Average exercise price
Outstanding at the beginning of the year
` 480.20 - ` 480.20 20,181 ` 480.20
` 2 13,543,997 ` 2 7,952,083 ` 2US $ 0.03 10,199,054 US $ 0.03 5,288,783 US $ 0.03
Bonus on outstanding ` 480.20 - ` 480.20 - ` 480.20(Refer Note 28) ` 2 4,773,755 ` 2 6,968,406 ` 2
US $ 0.03 3,957,434 US $ 0.03 4,077,070 US $ 0.03Granted * ` 480.20 - ` 480.20 - ` 480.20
` 2 4,607,000 ` 2 4,612,400 ` 2US $ 0.03 4,849,000 US $ 0.03 3,897,000 US $ 0.03
Exercised ` 480.20 - ` 480.20 (20,181) ` 480.20` 2 (2,739,097) ` 2 (5,325,217) ` 2
US $ 0.03 (1,541,803) US $ 0.03 (2,565,976) US $ 0.03Forfeited and expired ` 480.20 - ` 480.20 - ` 480.20
` 2 (2,578,192) ` 2 (663,675) ` 2US $ 0.03 (3,016,895) US $ 0.03 (497,823) US $ 0.03
Outstanding at the end of the year ` 480.20 - ` 480.20 - ` 480.20` 2 17,607,463 ` 2 13,543,997 ` 2
US $ 0.03 14,446,790 US $ 0.03 10,199,054 US $ 0.03Exercisable at the end of the year ` 480.20 - ` 480.20 - ` 480.20
` 2 1,300,781 ` 2 1,875,994 ` 2US $ 0.03 948,877 US $ 0.03 789,962 US $ 0.03
The following table summarises information about outstanding stock options:
Range of exercise price
2019 2018Numbers Weighted Average
Remaining Life (Months)
Weight Average
Exercise Price
Numbers Weighted Average Remaining Life
(Months)
Weight Average
Exercise Price` 480.20 - - ` 480.20 - - ` 480.20
` 2 17,607,463 24 ` 2 13,543,997 27 ` 2
US $ 0.03 14,446,790 26 US $ 0.03 10,199,054 28 US $ 0.03
The weighted-average grant-date fair value of options granted during the year ended March 31, 2019, and 2018 was ` 349.81 and ` 337.74 for each option, respectively. The weighted average share price of options exercised during the year ended March 31, 2019 and 2018 was ` 325.85 and ` 303.44 for each option, respectively.
* Includes 1,567,000 and 1,097,600 Performance based stock options (RSU) granted during the year ended March 31, 2019 and 2018 respectively. 1,673,000 and 1,113,600 Performance based stock options (ADS) granted during the year ended March 31, 2019 and 2018 respectively. Performance based stock options (RSU) were issued under Wipro Employee Restricted Stock Unit plan 2007 (WSRUP 2007 plan) and Performance based stock options (ADS) were issued under Wipro ADS Restricted Stock Unit Plan (WARSUP 2004 plan).
31. Assets taken on lease
Obligation under finance lease is secured by underlying assets leased. The legal title of these assets vests with the lessors. These obligations are repayable in monthly, quarterly and yearly installments up to year ending March 31, 2022. The interest rate for these obligations ranges from 1.82% to 10.61%.

Standalone Financial Statements under Ind AS
198 Wipro Limited
Finance lease payables consist of liabilities that are taken on lease for a contract term ranging from 1 to 5 years. Details of finance lease payable is as follows:
As at March 312019 2018 2019 2018
Minimum lease payments
Present value of minimum lease payment
Not later than one year ` 471 ` 933 ` 444 ` 868Later than one year but not later than five years 158 573 152 539Total minimum lease payments 629 1,506 596 1,407Less: Amount representing interest (33) (99) - -Present value of minimum lease payment payables ` 596 ` 1,407 ` 596 ` 1,407Included in the balance sheet as follows:- Long term maturities of finance lease obligations 152 539- Current maturities of obligation under finance lease 444 868
Operating leases: The Company has taken office, vehicle and IT equipment under cancellable and non-cancellable operating lease agreements that are renewable on a periodic basis at the option of both the lessor and the lessee. The operating lease agreements extend up a maximum of fifteen years from their respective dates of inception and some of these lease agreements have price escalation clause. Rental payments under such leases were ` 3,494 and ` 3,299 during the years ended March 31, 2019 and 2018.
Details of contractual payments under non-cancellable leases are given below: :
As at
March 31, 2019 March 31, 2018Not later than one year ` 4,018 ` 3,263Later than one year and not later than five years 4,991 5,476Later than five years 702 1,037Total ` 9,711 ` 9,776
32. Related party relationship and transactions
List of subsidiaries as of March 31, 2019
Subsidiaries Subsidiaries Subsidiaries Country of Incorporation
Wipro LLC USAWipro Gallagher Solutions, LLC. USA
Opus Capital Markets Consultants LLC
USA
Wipro Promax Analytics Solutions LLC
USA
Wipro Insurance Solutions LLC USAWipro IT Services, LLC. USA
HealthPlan Services, Inc. *** USA
Appirio, Inc. *** USACooper Software, LLC. USAInfocrossing, LLC USAWipro US Foundation USA
Wipro Overseas IT Services Pvt. Ltd
India
Wipro Japan KK Japan

Standalone Financial Statements under Ind AS
Annual Report 2018-19 199
Subsidiaries Subsidiaries Subsidiaries Country of Incorporation
Wipro Shanghai Limited ChinaWipro Trademarks Holding Limited
India
Wipro Travel Services Limited
India
Wipro Holdings (UK) Limited U.K. Wipro Digital Aps Denmark
Designit A/S *** Denmark Wipro Europe Limited U.K.
Wipro UK Limited U.K. Wipro Financial Services UK
Limited U.K.Wipro IT Services S.R.L. Romania
Wipro Information Technology Austria GmbH **
Austria
Wipro Technologies Austria GmbH **
Austria
NewLogic Technologies SARL **
France
Wipro Cyprus SE Cyprus Wipro Doha LLC # Qatar Wipro Technologies SA DE CV Mexico
Wipro Philippines, Inc. PhilippinesWipro Holdings Hungary Korlátolt Felelosségu Társaság Hungary
Wipro Holdings Investment Korlátolt Felelősségű Társaság
Hungary
Hungary Wipro Information Technology
Egypt SAE
Egypt Wipro Arabia Co. Limited * Saudi Arabia
Women’s Business Park Technologies Limited * Saudi Arabia
Wipro Poland Sp. Z.O.O. Poland Wipro IT Services Poland
Sp. Z.O.O.
Poland Wipro Technologies Australia
Pty Ltd
Australia Wipro Corporate Technologies
Ghana LimitedWipro Technologies South Africa (Proprietary) Limited
Wipro Technologies Nigeria Limited
Ghana
South Africa
Nigeria Wipro IT Service Ukraine LLC
Wipro Information Technology Netherlands BV.
Ukraine
Netherlands

Standalone Financial Statements under Ind AS
200 Wipro Limited
Subsidiaries Subsidiaries Subsidiaries Country of Incorporation
Wipro Technologies SA Argentina Wipro Portugal S.A.*** Portugal
Limited Liability Company Wipro Technologies Limited Russia
Wipro Technology Chile SPA Chile
Wipro Solutions Canada Limited Canada
Wipro Information Technology Kazakhstan LLP Kazakhstan
Wipro Technologies W.T. Sociedad Anonima Costa Rica
Wipro Outsourcing Services (Ireland) Limited Ireland
Wipro Technologies VZ, C.A. Venezuela
Wipro Technologies Peru S.A.CInfoSERVER S.A.Wipro do Brasil Technologia Ltda***
PeruBrazil
Brazil
Wipro Technologies SRL Romania
PT. WT Indonesia Indonesia
Wipro (Thailand) Co Limited Thailand
Wipro Bahrain Limited WLL Bahrain
Wipro Gulf LLC Sultanate of Oman
Rainbow Software LLC Iraq
Cellent GmbH Germany
Cellent Gmbh *** Austria
Wipro Networks Pte Limited
Singapore
Wipro (Dalian) Limited China
Wipro Technologies SDN BHD Malaysia
Wipro Chengdu Limited China
Appirio India Cloud Solutions Private Limited **
India
Wipro IT Services Bangladesh Limited Bangladesh
Wipro HR Services India Private Limited
India
* All the above direct subsidiaries are 100% held by the Company except that the Company holds 66.67% of the equity securities of Wipro Arabia Co. Limited and 55% of the equity securities of Women’s Business Park Technologies Limited are held by Wipro Arabia Co. Limited.
# 51% of equity securities of Wipro Doha LLC are held by a local shareholder. However, the beneficial interest in these holdings is with the Company.
The Company controls ‘The Wipro SA Broad Based Ownership Scheme Trust’, ‘Wipro SA Broad Based Ownership Scheme SPV (RF) (PTY) LTD incorporated in South Africa

Standalone Financial Statements under Ind AS
Annual Report 2018-19 201
** Vide its order dated March 29, 2019, the Hon’ble National Company Law Tribunal, Bengaluru bench, approved the scheme of amalgamation for the merger of wholly owned subsidiaries Wipro Information Technology Austria GmbH, Wipro Technologies Austria GmbH, NewLogic Technologies SARL and Appirio India Cloud Solutions Private Limited with Wipro Limited. As per the said scheme, the appointed date is April 1, 2018.
*** Step Subsidiary details of Wipro Portugal S.A, Wipro do Brasil Technologia Ltda, Designit A/S, Cellent GmbH, HealthPlan Services, Inc. and Appirio, Inc. are as follows:
Subsidiaries Subsidiaries Subsidiaries Country of Incorporation
Wipro Portugal S.A. Portugal Wipro Technologies Gmbh GermanyWipro do Brasil Technologia Ltda Wipro Do Brasil Sistemetas De
Informatica Ltd
BrazilBrazil
Designit A/S Denmark Designit Denmark A/S Denmark Designit Germany GmbH Germany Designit Oslo A/S Norway Designit Sweden AB Sweden Designit T.L.V Ltd. Israel Designit Tokyo Lt.d Japan Denextep Spain Digital, S.L Spain Designit Colombia S A S
Designit Peru SACColombiaPeru
Cellent GmbHFrontworx Informations technologie GmbH
Austria
AustriaHealthPlan Services, Inc.
HealthPlan Services Insurance Agency, LLC
USA
USAAppirio, Inc.
Appirio, K.KTopcoder, Inc.Appirio Ltd
Appirio GmbHApprio Ltd (UK)
USAJapanUSAIrelandGermanyU.K.
As at March 31, 2019, the Company held 43.7% interest in Drivestream Inc, 33% interest in Denim Group Limited and 33.3% in Denim Group Management, LLC, investments accounted for using the equity method.
The list of controlled trusts are:
Name of entity Country of incorporation
Wipro Equity Reward Trust India
Wipro Foundation India

Standalone Financial Statements under Ind AS
202 Wipro Limited
The other related parties are:
Name of the related parties Nature
Azim Premji Foundation Entity controlled by Director
Azim Premji Foundation for Development Entity controlled by Director
Hasham Traders Entity controlled by Director
Prazim Traders Entity controlled by Director
Zash Traders Entity controlled by Director
Hasham Investment and Trading Co. Pvt. Ltd Entity controlled by Director
Azim Premji Philanthropic Initiatives Pvt. Ltd Entity controlled by Director
Azim Premji Trust Entity controlled by Director
Wipro Enterprises (P) Limited Entity controlled by Director
Wipro GE Healthcare Private Limited Entity controlled by Director
Key management personnel
Azim H Premji Executive Chairman and Managing Director
Abidali Z Neemuchwala Chief Executive Officer and Executive Director
Dr. Ashok Ganguly Non-Executive Director
N Vaghul Non-Executive Director
William Arthur Owens Non-Executive Director
M.K. Sharma Non-Executive Director
Ireena Vittal Non-Executive Director
Rishad A Premji Executive Director and Chief Strategy Officer
Dr. Patrick J. Ennis Non-Executive Director
Patrick Dupuis Non-Executive Director
Arundhati Bhattacharya Additional Director (i)
Jatin Pravinchandra Dalal Chief Financial Officer
M Sanaullah Khan Company Secretary
(i) Effective January 1, 2019
Relative of key management personnel
- Yasmeen H. Premji
- Tariq Azim Premji

Standalone Financial Statements under Ind AS
Annual Report 2018-19 203
The Company has the following related party transactions for the year ended March 31, 2019 and 2018:
Transaction / balances Subsidiaries / Trusts
Entities controlled by Directors
Key Management Personnel#
2019 2018 2019 2018 2019 2018
Sales of services 54,498 43,733 102 69 - -
Purchase of services 21,084 19,250 ^ ^ - -
Assets purchased/ capitalised - - 240 290 - -
Dividend paid 21 24 3,171 3,171 191 191
Commission paid 1,133 1,147 - - - -
Rent Paid 109 112 8 7 5 6
Rent Income 182 272 43 42 - -
Others 3,455 6,717 63 31 - -
Buyback of shares - - - 63,745 - 1
Interest Income ^ - - - - -
Interest Expense 6 - - - - -
Corporate guarantee commission 203 185 - - - -
Key management personnel *
Remuneration and short-term benefits - - 356 248
Other benefits - - 174 130
Balance as at the year end
Receivables ** 18,263 23,273 80 2 - -
Payables 3,301 2,299 8 26 156 55
* Post employment benefit comprising compensated absences is not disclosed as these are determined for the Company as a whole. Benefits include the prorated value of Restricted Stock Units (“RSU’s”) granted to the personnel, which vest over a period of time.
Other benefits include share based compensation ` 166 and ` 124 for the year ended March 31, 2019 and 2018 respectively.
# Including relative of key management personnel.
** Includes the following balances being in the nature of loans given to subsidiaries of the Company including interest accrued, where applicable and inter-corporate deposits with subsidiary.
^ Value is less than ` 1.
Loan amounts outstanding from subsidiaries:
Name of the entity Balance As at March 31,
Maximum amount due during the year
2019 2018 2019 2018
Wipro Cyprus Private Limited - - - 1,930

Standalone Financial Statements under Ind AS
204 Wipro Limited
The following are the significant related party transactions during the year ended March 31, 2019 and 2018:
Particulars Year ended March 31, 2019 March 31, 2018
Sale of services Wipro LLC 35,074 25,260 Wipro Technologies South Africa (Proprietary) Limited 1,089 1,654 Wipro Gallagher Solutions Inc 1,459 1,316 Appirio Inc. (US) 1,469 228 Wipro Information Technology Netherlands BV. 1,458 909 Wipro Technologies Gmbh 1,673 1,753 Wipro Networks Pte Limited 1,839 1,518 Wipro Solutions Canada Limited 2,297 2,039 Wipro Data Center and Cloud Services, Inc. - 1,694 Wipro Holdings UK Limited 1,511 2,086Purchase of services Appirio Inc. (US) 2,390 825 Wipro Data Center and Cloud Services, Inc. - 2,844 Wipro LLC 1,832 1,831 Wipro do Brasil Technologia Ltda 2,374 2,542 Wipro Technologies Gmbh 1,275 1,724 Wipro BPO Philippines Limited Inc 2,338 1,668 Wipro Technologies SRL 2,314 1,622 Wipro Technologies S.A DE C. V 1,680 965 Wipro Portugal S.A. 934 1,198 Wipro IT Services Poland Sp. Zo.o. 901 791Asset purchased/ capitalised Wipro Enterprises (P) Limited 240 290Dividend paid Prazim Traders 891 891 Zash Traders 903 903 Azim Premji Trust 618 618 Hasham Traders 742 742Commission paid Wipro Japan KK 203 457 Wipro Technologies Gmbh 876 624Rent paid Wipro LLC 59 49 Wipro Holdings UK Limited 34 31Buyback of shares Azim Premji Trust - 57,494Rental income Wipro Enterprises (P) Limited 42 40 Designit Denmark A/S 33 56 Wipro LLC 139 206Remuneration paid to key management personnel Azim Premji 18 9 Abidali Z. Neemuchwala 273 182 Rishad Azim Premji 68 59 Jatin Pravinchandra Dalal 61 47 M Sanaullah Khan 16 12Corporate guarantee commission Wipro Gulf LLC 49 45 Wipro Solutions Canada Ltd 45 38 Wipro LLC 69 38 Infocrossing Inc - 15 Wipro Arabia Limited 18 17

Standalone Financial Statements under Ind AS
Annual Report 2018-19 205
33. Commitments and contingencies
Capital commitments: As at March 31, 2019 and 2018 the Company had committed to spend approximately ̀ 12,005 and ̀ 12,545 respectively, under agreements to purchase/ construct property and equipment. These amounts are net of capital advances paid in respect of these purchases..
Contingent liabilities to the extent not provided for:
As at
March 31, 2019 March 31, 2018Performance and financial guarantees given by the banks on behalf of the company ` 13,617 ` 16,817Guarantees given by the Company on behalf of subsidiaries 567 1,400
Contingencies and lawsuits:
The Company is subject to legal proceedings and claims (including tax assessment orders/ penalty notices) which have arisen in the ordinary course of its business. Some of the claims involve complex issues and it is not possible to make a reasonable estimate of the expected financial effect, if any, that will result from ultimate resolution of such proceedings. However, the resolution of these legal proceedings is not likely to have a material and adverse effect on the results of operations or the financial position of the Company. The significant of such matters are discussed below.
In March 2004, the Company received a tax demand for year ended March 31, 2001 arising primarily on account of denial of deduction under section 10A of the Income Tax Act, 1961 (Act) in respect of profit earned by the Company’s undertaking in Software Technology Park at Bangalore. The same issue was repeated in the successive assessments for the years ended March 31, 2002 to March 31, 2011 and the aggregate demand is ̀ 47,583 (including interest of ` 13,832). The appeals filed against the said demand before the Appellate authorities have been allowed in favor of the Company by the second appellate authority for the years up to March 31, 2008. Further appeals have been filed by the Income tax authorities before the Hon’ble High Court. The Hon’ble High Court has heard and disposed-of majority of the issues in favor of the Company up to years ended March 31, 2004. Department has filed a Special Leave Petition (SLP) before the Supreme Court of India for the year ended March 31, 2001 to March 31, 2004.
On similar issues for years up to March 31, 2000, the Hon’ble High Court of Karnataka has upheld the claim of the Company under section 10A of the Act. For the year ended March 31, 2009, the appeals are pending before Income Tax Appellate Tribunal (ITAT). For years ended March 31, 2010 and March 31, 2011, the Dispute Resolution Panel (DRP) allowed the claim of the Company under section 10A of the Act. The Income tax authorities have filed an appeal before the ITAT.
For year ended March 31, 2013, the Company received the final assessment order in November 2017 with a demand of ̀ 3,286 (including interest of ̀ 1,166), arising primarily on account of section 10AA issues with respect to exclusion from Export Turnover. The Company has filed an appeal before Hon’ble ITAT, Bengaluru within the prescribed timelines.
For year ended March 31, 2014, the Company received the final assessment order in September 2018 with a demand of ` 1,030 (including Nil interest), arising primarily on account of transfer pricing issues. The Company has filed an appeal before the Hon’ble ITAT, Bengaluru within the prescribed timelines.
For year ended March 31, 2015, the Company received the Draft assessment order in December 2018 with a demand of ̀ 6,467 (including interest of ̀ 2,007), arising primarily on account of Capitalization of wages. The Company has filed objections before the Dispute Resolution Panel (Bengaluru) within the prescribed timelines.
Income tax demands against the Company amounting to ` 101,440 and ` 66,441 are not acknowledged as debt as at March 31, 2018 and March 31, 2019, respectively. The contingent liability has been reworked on the basis of recent judicial pronouncements and updates. These matters are pending before various Appellate Authorities and the management expects its position will likely be upheld on ultimate resolution and will not have a material adverse effect on the Company’s financial position and results of operations.
The contingent liability in respect of disputed demands for excise duty, custom duty, sales tax and other matters amounts to ̀ 7,745 and ̀ 8,477 as at March 31, 2018 and 2019. However, the resolution of these legal proceedings is not likely to have a material and adverse effect on the results of operations or the financial position of the Company.

Standalone Financial Statements under Ind AS
206 Wipro Limited
34. Corporate Social Responsibility
a. Gross amount required to be spend by the Wipro during the year ` 1,761 (March 31, 2018: ` 1,833).
b. Amount spent during the year on:
Particulars For the year ended March 31, 2019
In cash Yet to be paid in cash
Total
(i) Construction/ acquisition of any asset ` - ` - ` -
(ii) On purpose other than above (i) above 1,476 377 1,853
Total amount spent during the year ` 1,476 ` 377 ` 1,853
Particulars For the year ended March 31, 2018
In cash Yet to be paid in cash
Total
(i) Construction/ acquisition of any asset ` - ` - ` -
(ii) On purpose other than above (i) above 1,630 236 1,866
Total amount spent during the year ` 1,630 ` 236 ` 1,866
35. Segment information
The Company publishes this financial statement along with the consolidated financial statements. In accordance with Ind AS 108, Operating Segments, the Company has disclosed the segment information in the consolidated financial statements.
36. Events after the reporting period
On April 16, 2019, the Board of Directors approved a proposal to buy back up to 323,076,923 equity shares of the Company for an aggregate amount not exceeding ` 105,000 million, being 5.35% of total paid-up equity share capital as at March 31, 2019, at a price of ` 325 per equity share. Subsequently, vide resolution dated June 1, 2019 the shareholders approved the buyback of equity shares through postal ballot/e-voting. The Company will file the draft letter of offer with the Securities and Exchange Board of India in due course for its approval and will open the buyback offer for tendering of shares by the shareholders, following approval from the Securities and Exchange Board of India. The buyback is proposed to be made from all existing shareholders of the Company as on the record date for the buyback, i.e., June 21, 2019, on a proportionate basis under the “tender offer” route in accordance with the provisions contained in the Securities and Exchange Board of India (Buy-back of Securities) Regulations, 2018 and the Companies Act, 2013 and rules made thereunder.
As per our report of even date attached For and on behalf of the Board of Directors
for Deloitte Haskins & Sells LLP Azim H Premji N Vaghul Abidali Z NeemuchwalaChartered Accountants Executive Chairman
& Managing DirectorDirector Chief Executive Officer
& Executive DirectorFirm’s Registration No: 117366W/W- 100018
N. Venkatram Jatin Pravinchandra Dalal M Sanaulla KhanPartner Chief Financial Officer Company SecretaryMembership No. 71387
Mumbai BengaluruJune 06, 2019 June 06, 2019

Consolidated Financial Statements under Ind AS
Annual Report 2018-19 207
Independent Auditor’s Report on Consolidated Financial StatementsTo The Members of Wipro Limited
Report on the Audit of the Consolidated Financial Statements
Opinion
We have audited the accompanying consolidated financial statements of Wipro Limited (“the Company”) and its subsidiaries, (the Company and its subsidiaries together referred to as “the Group”), which comprise the Consolidated Balance Sheet as at March 31, 2019, and the Consolidated Statement of Profit and Loss (including Other Comprehensive Income), the Consolidated Statement of Changes in Equity and the Consolidated Statement of Cash Flows for the year then ended, and a summary of significant accounting policies and other explanatory information (herein after referred to as “the Consolidated financial statements”).
In our opinion and to the best of our information and according to the explanations given to us, the aforesaid consolidated financial statements give the information required by the Companies Act, 2013 (“the Act”) in the manner so required and give a true and fair view in conformity with the Indian Accounting Standards prescribed under section 133 of the Act read with the Companies (Indian Accounting Standards) Rules, 2015, as amended (‘Ind AS’), and other accounting principles generally accepted in India, of the consolidated state of affairs of the Group as at March 31,2019, consolidated profit, consolidated total comprehensive income, consolidated changes in equity and consolidated cash flows for the year ended on that date.
Basis for Opinion
We conducted our audit of the consolidated financial statements in accordance with the Standards on Auditing specified under section 143 (10) of the Act (SAs). Our responsibilities under those Standards are further described in the Auditor’s Responsibility for the Audit of the Consolidated Financial Statements section of our report. We are independent of the Group in accordance with the Code of Ethics issued by the Institute of Chartered Accountants of India (ICAI) together with the ethical requirements that are relevant to our audit of the consolidated financial statements under the provisions of the Act and the Rules made thereunder, and we have fulfilled our other ethical responsibilities in accordance with these requirements and the ICAI’s Code of Ethics. We believe that the audit evidence obtained by us is sufficient and appropriate to provide a basis for our audit opinion on the consolidated financial statements.
Key Audit Matters
Key audit matters are those matters that, in our professional judgment, were of most significance in our audit of the consolidated financial statements of the current period. These matters were addressed in the context of our audit of the consolidated financial statements as a whole, and in forming our opinion thereon, and we do not provide a separate opinion on these matters. We have determined the matters described below to be the key audit matters to be communicated in our report.
Sr. No. Key Audit Matter Auditor’s Response1 Accuracy of recognition, measurement,
presentation and disclosures of revenues and other related balances in view of adoption of Ind AS 115 “Revenue from Contracts with Customers” (new revenue accounting standard)
The application of the new revenue a c c o u n t i n g st a n d a rd i nvo l ve s certain key judgements relating to identification of distinct performance o b l i g a t i o n s , d e te r m i n a t i o n o f transaction price of the identified p e r fo r m a n c e o b l i g a t i o n s , t h e appropriateness of the basis used to measure revenue recognized over
Principal Audit Procedures
We assessed the Group’s process to identify the impact of adoption of the new revenue accounting standard.
Our audit approach consisted testing of the design and operating effectiveness of the internal controls and substantive testing as follows:
• Evaluated the design of internal controls relating to implementation of the new revenue accounting standard.
• Selected a sample of continuing and new contracts, and tested the operating effectiveness of the internal control, relating to identification of the distinct performance obligations and determination of transaction price. We carried out a combination of procedures involving inquiry and observation, reperformance and inspection of evidence in respect of operation of these controls.

Consolidated Financial Statements under Ind AS
208 Wipro Limited
Sr. No. Key Audit Matter Auditor’s Responsea period. Additionally, new revenue accounting standard contains disclosures which involves collation of information in respect of disaggregated revenue and periods over which the remaining performance obligations will be satisfied subsequent to the balance sheet date.Refer Note 3 to the Consolidated Financial Statements.
• Tested the relevant information technology systems’ access and change management controls relating to contracts and related information used in recording and disclosing revenue in accordance with the new revenue accounting standard.
• Selected a sample of continuing and new contracts and performed the following procedures among others:
• Read, analysed and identified the distinct performance obligations in these contracts.
• Compared these performance obligations with that identified and recorded by the Group.
• Samples in respect of revenue recorded for time and material contracts were tested using a combination of approved time sheets including customer acceptances, subsequent invoicing and historical trend of collections and disputes.
• In respect of samples relating to fixed price contracts, progress towards satisfaction of performance obligation used to compute recorded revenue was verified with actual and estimated costs from the revenue recognition systems.
• Sample of revenues disaggregated by type and service offerings were tested with the performance obligations specified in the underlying contracts.
• Performed analytical procedures for reasonableness of revenues disclosed by type and service offerings.
• We reviewed the collation of information and the logic of the report generated from the revenue recognition system used to prepare the disclosure relating to the periods over which the remaining performance obligations will be satisfied subsequent to the balance sheet date.
2 Accuracy of revenue recognition in respect of fixed price contracts involves critical estimates.Estimated effort is a critical estimate to determine revenues and liabilities for onerous obligations. This estimate has a high inherent uncertainty as it requires consideration of progress of the contract, efforts incurred till date and efforts required to complete the remaining contract performance obligations.R e f e r N o t e s 3 a n d 2 0 t o t h e Consolidated Financial Statements.
Principal Audit ProceduresOur audit approach was a combination of test of internal controls and substantive procedures which included the following, among others:• Evaluated the design of internal controls relating to recording of
efforts incurred and estimation of efforts required to complete the performance obligations.
• Tested the access and application controls pertaining to time recording and allocation systems which prevents unauthorised changes to recording of efforts incurred.
• Selected a sample of contracts and through inspection of evidence of performance of these controls, tested the operating effectiveness of the internal controls relating to efforts incurred and estimated.
• Selected a sample of contracts and performed a retrospective review of completed efforts and activities with the planned efforts and activities to identify significant variations and verifiedwhether those variations have been considered in estimating the remaining efforts to complete the contract.
• Reviewed a sample of contracts with unbilled revenues to identify possible delays in achieving milestones, which require change in estimated efforts to complete the remaining performance obligations.
• Performed analytical procedures and test of details for reasonableness of incurred and estimated efforts.
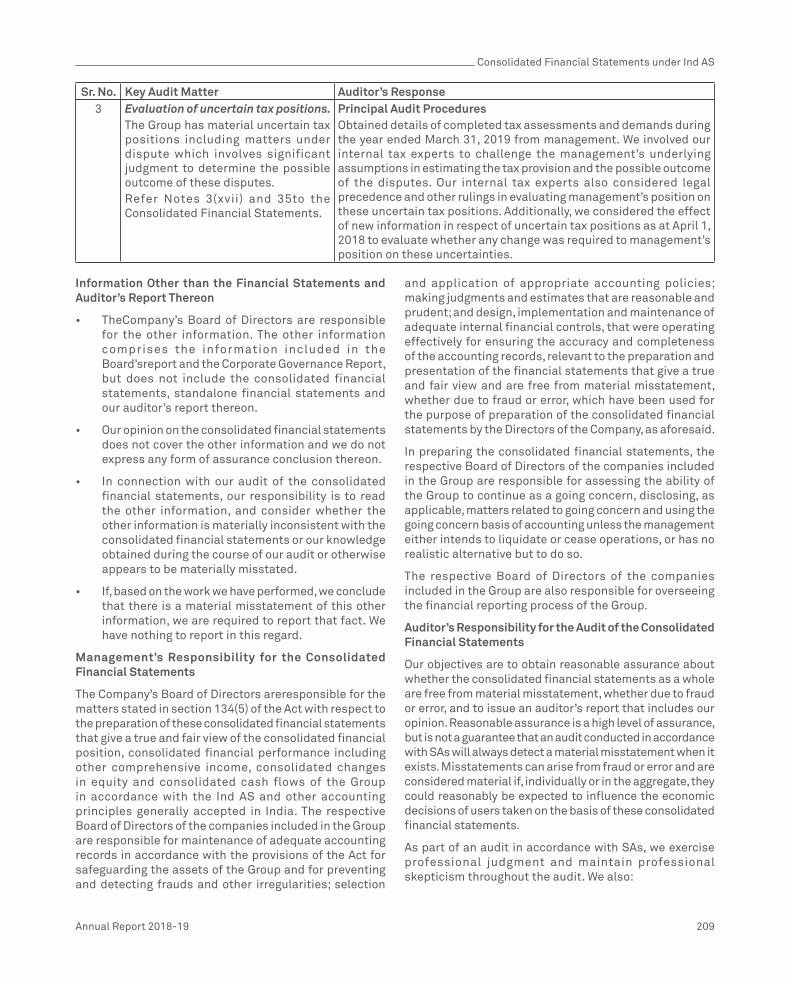
Consolidated Financial Statements under Ind AS
Annual Report 2018-19 209
Sr. No. Key Audit Matter Auditor’s Response3 Evaluation of uncertain tax positions.
The Group has material uncertain tax positions including matters under dispute which involves significant judgment to determine the possible outcome of these disputes.Refer Notes 3(xvii) and 35to the Consolidated Financial Statements.
Principal Audit ProceduresObtained details of completed tax assessments and demands during the year ended March 31, 2019 from management. We involved our internal tax experts to challenge the management’s underlying assumptions in estimating the tax provision and the possible outcome of the disputes. Our internal tax experts also considered legal precedence and other rulings in evaluating management’s position on these uncertain tax positions. Additionally, we considered the effect of new information in respect of uncertain tax positions as at April 1, 2018 to evaluate whether any change was required to management’s position on these uncertainties.
Information Other than the Financial Statements and Auditor’s Report Thereon
• TheCompany’s Board of Directors are responsible for the other information. The other information comprises the information included in the Board’sreport and the Corporate Governance Report, but does not include the consolidated financial statements, standalone financial statements and our auditor’s report thereon.
• Our opinion on the consolidated financial statements does not cover the other information and we do not express any form of assurance conclusion thereon.
• In connection with our audit of the consolidated financial statements, our responsibility is to read the other information, and consider whether the other information is materially inconsistent with the consolidated financial statements or our knowledge obtained during the course of our audit or otherwise appears to be materially misstated.
• If, based on the work we have performed, we conclude that there is a material misstatement of this other information, we are required to report that fact. We have nothing to report in this regard.
Management’s Responsibility for the Consolidated Financial Statements
The Company’s Board of Directors areresponsible for the matters stated in section 134(5) of the Act with respect to the preparation of these consolidated financial statements that give a true and fair view of the consolidated financial position, consolidated financial performance including other comprehensive income, consolidated changes in equity and consolidated cash flows of the Group in accordance with the Ind AS and other accounting principles generally accepted in India. The respective Board of Directors of the companies included in the Group are responsible for maintenance of adequate accounting records in accordance with the provisions of the Act for safeguarding the assets of the Group and for preventing and detecting frauds and other irregularities; selection
and application of appropriate accounting policies; making judgments and estimates that are reasonable and prudent; and design, implementation and maintenance of adequate internal financial controls, that were operating effectively for ensuring the accuracy and completeness of the accounting records, relevant to the preparation and presentation of the financial statements that give a true and fair view and are free from material misstatement, whether due to fraud or error, which have been used for the purpose of preparation of the consolidated financial statements by the Directors of the Company, as aforesaid.
In preparing the consolidated financial statements, the respective Board of Directors of the companies included in the Group are responsible for assessing the ability of the Group to continue as a going concern, disclosing, as applicable, matters related to going concern and using the going concern basis of accounting unless the management either intends to liquidate or cease operations, or has no realistic alternative but to do so.
The respective Board of Directors of the companies included in the Group are also responsible for overseeing the financial reporting process of the Group.
Auditor’s Responsibility for the Audit of the Consolidated Financial Statements
Our objectives are to obtain reasonable assurance about whether the consolidated financial statements as a whole are free from material misstatement, whether due to fraud or error, and to issue an auditor’s report that includes our opinion. Reasonable assurance is a high level of assurance, but is not a guarantee that an audit conducted in accordance with SAs will always detect a material misstatement when it exists. Misstatements can arise from fraud or error and are considered material if, individually or in the aggregate, they could reasonably be expected to influence the economic decisions of users taken on the basis of these consolidated financial statements.
As part of an audit in accordance with SAs, we exercise professional judgment and maintain professional skepticism throughout the audit. We also:

Consolidated Financial Statements under Ind AS
210 Wipro Limited
• Identify and assess the risks of material misstatement of the consolidated financial statements, whether due to fraud or error, design and perform audit procedures responsive to those risks, and obtain audit evidence that is sufficient and appropriate to provide a basis for our opinion. The risk of not detecting a material misstatement resulting from fraud is higher than for one resulting from error, as fraud may involve collusion, forgery, intentional omissions, misrepresentations, or the override of internal control.
• Obtain an understanding of internal financial control relevant to the audit in order to design audit procedures that are appropriate in the circumstances. Under section 143(3)(i) of the Act, we are also responsible for expressing our opinion on whether the Company and its subsidiary companies which are companies incorporated in India, has adequate internal financial controls system in place and the operating effectiveness of such controls.
• Evaluate the appropriateness of accounting policies used and the reasonableness of accounting estimates and related disclosures made by the management.
• Conclude on the appropriateness of management’s use of the going concern basis of accounting and, based on the audit evidence obtained, whether a material uncertainty exists related to events or conditions that may cast significant doubt on the ability of the Group to continue as a going concern. If we conclude that a material uncertainty exists, we are required to draw attention in our auditor’s report to the related disclosures in the consolidated financial statements or, if such disclosures are inadequate, to modify our opinion. Our conclusions are based on the audit evidence obtained up to the date of our auditor’s report. However, future events or conditions may cause the Group to cease to continue as a going concern.
• Evaluate the overall presentation, structure and content of the consolidated financial statements, including the disclosures, and whether the consolidated financial statements represent the underlying transactions and events in a manner that achieves fair presentation.
• Obtain sufficient appropriate audit evidence regarding the financial information of the entities and business activities within Group to express an opinion on the consolidated financial statements.
Materiality is the magnitude of misstatements in the consolidated financial statements that, individually or in aggregate, makes it probable that the economic decisions of a reasonably knowledgeable user of the consolidated
financial statements may be influenced. We consider quantitative materiality and qualitative factors in (i) planning the scope of our audit work and in evaluating the results of our work; and (ii) to evaluate the effect of any identified misstatements in the consolidated financial statements.
We communicate with those charged with governance of the Company regarding, among other matters, the planned scope and timing of the audit and significant audit findings, including any significant deficiencies in internal control that we identify during our audit.
We also provide those charged with governance with a statement that we have complied with relevant ethical requirements regarding independence, and to communicate with them all relationships and other matters that may reasonably be thought to bear on our independence, and where applicable, related safeguards.
From the matters communicated with those charged with governance, we determine those matters that were of most significance in the audit of the consolidated financial statements of the current period and are therefore the key audit matters. We describe these matters in our auditor’s report unless law or regulation precludes public disclosure about the matter or when, in extremely rare circumstances, we determine that a matter should not be communicated in our report because the adverse consequences of doing so would reasonably be expected to outweigh the public interest benefits of such communication.
Report on Other Legal and Regulatory Requirements
1. As required by Section 143(3) of the Act, based on our audit, we report that:
a) We have sought and obtained all the information and explanations which to the best of our knowledge and belief were necessary for the purposes of our audit of the aforesaid consolidated financial statements.
b) In our opinion, proper books of account as required by law relating to preparation of the aforesaid consolidated financial statements have been kept so far as it appears from our examination of those books.
c) The Consol idated Balance Sheet , the Consolidated Statement of Profit and Loss (including Other Comprehensive Income), the Consolidated Statement of Changes in Equity and the Consolidated Statement of Cash Flows dealt with by this Report are in agreement with the relevant books of account maintained for the purpose of preparation of the consolidated financial statements.

Consolidated Financial Statements under Ind AS
Annual Report 2018-19 211
d) In our opinion, the aforesaid consolidated financial statements comply with the IndAS specified under Section 133 of the Act.
e) On the basis of the written representations received from the directors of the Company as on March 31, 2019 taken on record by the Board of Directors of the Company and its subsidiaries incorporated in India, and the reports of the statutory auditors of its Subsidiary Companies incorporated in India, none of the directors of the Group companies, incorporated in India is disqualified as on March 31, 2019 from being appointed as a director in terms of Section 164 (2) of the Act.
f) With respect to the adequacy of the internal financial controls over financial reporting and the operating effectiveness of such controls, refer to our separate Report in “Annexure A” which is based on the auditors’ reports of the company andits subsidiary companies incorporated in India. Our report expresses an unmodified opinion on the adequacy and operating effectiveness of internal financial controls over financial reporting of those companies.
g) With respect to the other matters to be included in the Auditor’s Report in accordance with the requirements of section 197(16) of the Act, as amended, in our opinion and to the best of our information and according to the explanations given to us, the remuneration paid by the Company to its directors during the year is in accordance with the provisions of section 197 of the Act.
h) With respect to the other matters to be included in the Auditor’s Report in accordance with Rule 11 of the Companies (Audit and Auditors) Rules, 2014,as amended in our opinion and to the best of our information and according to the explanations given to us:
i) The consolidated financial statements disclose the impact of pending litigations on the consolidated financial position of the Group,
ii) Provision has been made in the consolidated financial statements, as required under the applicable law or accounting standards, for material foreseeable losses, if any, on long-term contracts including derivative contracts;
iii) There has been no delay in transferring amounts, required to be transferred, to the Investor Education and Protection Fund by the Company and its Subsidiary Companies incorporated in India.
For DELOITTE HASKINS & SELLS LLPChartered AccountantsFirm Registration Number: 117366W/W-100018
N. VenkatramPartnerMembership number: 71387
Mumbai June 06, 2019

Consolidated Financial Statements under Ind AS
212 Wipro Limited
(Referred to in paragraph (f)under ‘Report on Other Legal and Regulatory Requirements’section of our report of even date)
Report on the Internal Financial Controls Over Financial Reporting under Clause (i) of Sub-section 3 of Section 143 of the Companies Act, 2013 (“the Act”)
In conjunction with our audit of the consolidated financial statements of the Company as of and for the year ended March 31, 2019, we have audited the internal financial controls over financial reporting of Wipro Limited (hereinafter referred to as “the Company”) and its subsidiary companies, which are companies incorporated in India,as of that date.
Management’s Responsibility for Internal Financial Controls
The Board of Directors of the company, and its subsidiary companies, which are companies incorporated in India, are responsible for establishing and maintaining internal financial controls based on the internal control over financial reporting criteria established by the respective Companies considering the essential components of internal control stated in the Guidance Note on Audit of Internal Financial Controls Over Financial Reporting issued by the Institute of Chartered Accountants of India (“the ICAI”). These responsibilities include the design, implementation and maintenance of adequate internal financial controls that were operating effectively for ensuring the orderly and efficient conduct of its business, including adherence to the respective company’s policies, the safeguarding of its assets, the prevention and detection of frauds and errors, the accuracy and completeness of the accounting records, and the timely preparation of reliable financial information, as required under the Act.
Auditor’s Responsibility
Our responsibility is to express an opinion on the internal financial controls over financial reporting of the Company, and its subsidiary companies, which are companies incorporated in India, based on our audit. We conducted our audit in accordance with the Guidance Note on Audit of Internal Financial Controls Over Financial Reporting (the “Guidance Note”) issued by the Institute of Chartered Accountants of India and the Standards on Auditing, prescribed under Section 143(10) of the Companies Act, 2013, to the extent applicable to an audit of internal financial controls. Those Standards and the Guidance Note require that we comply with ethical requirements and plan and perform the audit to obtain reasonable assurance about whether adequate internal financial controls over
Annexure “A” to the Independent Auditor’s Report financial reporting was established and maintained and if such controls operated effectively in all material respects.
Our audit involves performing procedures to obtain audit evidence about the adequacy of the internal financial controls system over financial reporting and their operating effectiveness. Our audit of internal financial controls over financial reporting included obtaining an understanding of internal financial controls over financial reporting, assessing the risk that a material weakness exists, and testing and evaluating the design and operating effectiveness of internal control based on the assessed risk. The procedures selected depend on the auditor’s judgement, including the assessment of the risks of material misstatement of the financial statements, whether due to fraud or error.
We believe that the audit evidence we have obtained, is sufficient and appropriate to provide a basis for our audit opinion on the internal financial controls system over financial reporting of the Company, and its subsidiary companies which are companies incorporated in India.
Meaning of Internal Financial Controls Over Financial Reporting
A company’s internal financial control over financial reporting is a process designed to provide reasonable assurance regarding the reliability of financial reporting and the preparation of financial statements for external purposes in accordance with generally accepted accounting principles. A company’s internal financial control over financial reporting includes those policies and procedures that (1) pertain to the maintenance of records that, in reasonable detail, accurately and fairly reflect the transactions and dispositions of the assets of the company; (2) provide reasonable assurance that transactions are recorded as necessary to permit preparation of financial statements in accordance with generally accepted accounting principles, and that receipts and expenditures of the company are being made only in accordance with authorisations of management and directors of the company; and (3) provide reasonable assurance regarding prevention or timely detection of unauthorised acquisition, use, or disposition of the company’s assets that could have a material effect on the financial statements.
Inherent Limitations of Internal Financial Controls Over Financial Reporting
Because of the inherent limitations of internal financial controls over financial reporting, including the possibility of collusion or improper management override of controls, material misstatements due to error or fraud may occur
Consolidated Financial Statements under Ind AS
Annual Report 2018-19 213
and not be detected. Also, projections of any evaluation of the internal financial controls over financial reporting to future periods are subject to the risk that the internal financial control over financial reporting may become inadequate because of changes in conditions, or that the degree of compliance with the policies or procedures may deteriorate.
Opinion
In our opinion to the best of our information and according to the explanations given to us, the Company, and its subsidiary companies, which are companies incorporated in India, have, in all material respects, an adequate internal financial controls system over financial reporting and such internal financial controls over financial reporting were operating effectively as at March 31, 2019, based on, theinternal control over financial reporting criteria established by the respective companies considering the
essential components of internal control stated in the Guidance Note on Audit of Internal Financial Controls Over Financial Reporting issued by the Institute of Chartered Accountants of India.
For DELOITTE HASKINS & SELLS LLPChartered AccountantsFirm Registration Number: 117366W/W-100018
N. VenkatramPartnerMembership number: 71387
Mumbai June 06, 2019

Consolidated Financial Statements under Ind AS
214 Wipro Limited
The accompanying notes form an integral part of these consolidated financial statementsAs per our report of even date attached For and on behalf of the Board of Directorsfor Deloitte Haskins & Sells LLP Azim H Premji N Vaghul Abidali Z NeemuchwalaChartered Accountants Executive Chairman
& Managing DirectorDirector Chief Executive Officer
& Executive DirectorFirm’s Registration No: 117366W/W-100018
N. Venkatram Jatin Pravinchandra Dalal M Sanaulla KhanPartner Chief Financial Officer Company SecretaryMembership No. 71387Mumbai BengaluruJune 06, 2019 June 06, 2019
(` in millions, except share and per share data, unless otherwise stated)As at
Notes March 31, 2019 March 31, 2018ASSETSNon-current assetsProperty, plant and equipment 4 47,665 49,108Capital work-in-progress 21,418 13,777Goodwill 5 113,220 114,046Other intangible assets 5 13,762 18,113Investments accounted for using the equity method 7 1,235 1,206Financial assets
Investments 7 6,916 7,668Derivative assets 8 173 41Trade receivables 9 4,373 4,446Other financial assets 10 5,146 4,186
Deferred tax assets (net) 27 5,604 6,908Non-current tax assets (net) 20,603 18,349Other non-current assets 11 17,227 12,929Total non-current assets 257,342 250,777Current assetsInventories 12 3,951 3,370Financial assets
Investments 7 220,716 249,094Trade receivables 9 100,489 100,990Cash and cash equivalents 13 158,529 44,925Derivative assets 8 4,931 1,232Unbilled receivables 22,880 42,486Other financial assets 10 14,611 7,429
Current tax assets (net) 7,435 6,262Contract assets 15,038 -Other current assets 11 23,086 23,167
571,666 478,955Assets held for sale 21 240 27,201Total current assets 571,906 506,156TOTAL ASSETS 829,248 756,933EQUITY AND LIABILITIESEQUITYEquity share capital 14 12,068 9,048Other equity 552,158 470,215Equity attributable to the equity holders of the Company 564,226 479,263Non-controlling interest 2,637 2,410TOTAL EQUITY 566,863 481,673LIABILITIESNon-current liabilities Financial liabilities
Borrowings 15 28,368 45,268Derivative liabilities 8 - 7Other financial liabilities 16 - 7
Deferred tax liabilities (net) 27 3,384 3,025Non-current tax liabilities (net) 11,023 9,220Other non-current liabilities 18 3,176 2,432Provisions 17 2,084 1,794Total non-current liabilities 48,035 61,753Current liabilities Financial liabilities
Borrowings 15 68,085 79,598Trade payables 19 62,660 51,203Derivative liabilities 8 1,310 2,210Other financial liabilities 16 29,302 31,369
Contract liabilities 24,768 17,139Current tax liabilities (net) 9,541 9,417Other current liabilities 18 7,627 6,656Provisions 17 11,057 9,703
214,350 207,295Liabilities directly associated with assets held for sale 21 - 6,212Total current liabilities 214,350 213,507TOTAL LIABILITIES 262,385 275,260TOTAL EQUITY AND LIABILITIES 829,248 756,933
Consolidated Balance Sheet
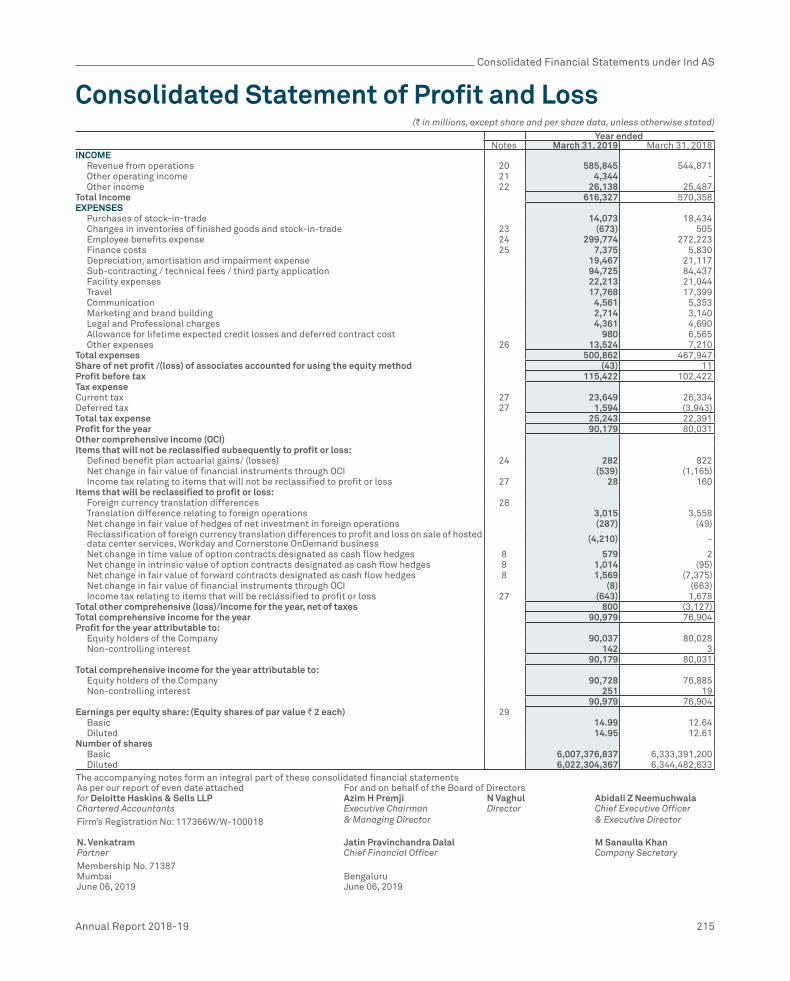
Consolidated Financial Statements under Ind AS
Annual Report 2018-19 215
The accompanying notes form an integral part of these consolidated financial statementsAs per our report of even date attached For and on behalf of the Board of Directorsfor Deloitte Haskins & Sells LLP Azim H Premji N Vaghul Abidali Z NeemuchwalaChartered Accountants Executive Chairman
& Managing DirectorDirector Chief Executive Officer
& Executive DirectorFirm’s Registration No: 117366W/W-100018
N. Venkatram Jatin Pravinchandra Dalal M Sanaulla KhanPartner Chief Financial Officer Company SecretaryMembership No. 71387Mumbai BengaluruJune 06, 2019 June 06, 2019
(` in millions, except share and per share data, unless otherwise stated)
Year endedNotes March 31, 2019 March 31, 2018
INCOMERevenue from operations 20 585,845 544,871Other operating income 21 4,344 -Other income 22 26,138 25,487
Total Income 616,327 570,358EXPENSES
Purchases of stock-in-trade 14,073 18,434Changes in inventories of finished goods and stock-in-trade 23 (673) 505Employee benefits expense 24 299,774 272,223Finance costs 25 7,375 5,830Depreciation, amortisation and impairment expense 19,467 21,117Sub-contracting / technical fees / third party application 94,725 84,437Facility expenses 22,213 21,044Travel 17,768 17,399Communication 4,561 5,353Marketing and brand building 2,714 3,140Legal and Professional charges 4,361 4,690Allowance for lifetime expected credit losses and deferred contract cost 980 6,565Other expenses 26 13,524 7,210
Total expenses 500,862 467,947Share of net profit /(loss) of associates accounted for using the equity method (43) 11Profit before tax 115,422 102,422Tax expenseCurrent tax 27 23,649 26,334Deferred tax 27 1,594 (3,943)Total tax expense 25,243 22,391Profit for the year 90,179 80,031Other comprehensive income (OCI)Items that will not be reclassified subsequently to profit or loss:
Defined benefit plan actuarial gains/ (losses) 24 282 822Net change in fair value of financial instruments through OCI (539) (1,165)Income tax relating to items that will not be reclassified to profit or loss 27 28 160
Items that will be reclassified to profit or loss:Foreign currency translation differences 28Translation difference relating to foreign operations 3,015 3,558Net change in fair value of hedges of net investment in foreign operations (287) (49)Reclassification of foreign currency translation differences to profit and loss on sale of hosted data center services, Workday and Cornerstone OnDemand business (4,210) -
Net change in time value of option contracts designated as cash flow hedges 8 579 2Net change in intrinsic value of option contracts designated as cash flow hedges 8 1,014 (95)Net change in fair value of forward contracts designated as cash flow hedges 8 1,569 (7,375)Net change in fair value of financial instruments through OCI (8) (663)Income tax relating to items that will be reclassified to profit or loss 27 (643) 1,678
Total other comprehensive (loss)/income for the year, net of taxes 800 (3,127)Total comprehensive income for the year 90,979 76,904Profit for the year attributable to:
Equity holders of the Company 90,037 80,028Non-controlling interest 142 3
90,179 80,031Total comprehensive income for the year attributable to:
Equity holders of the Company 90,728 76,885Non-controlling interest 251 19
90,979 76,904Earnings per equity share: (Equity shares of par value ` 2 each) 29
Basic 14.99 12.64Diluted 14.95 12.61
Number of sharesBasic 6,007,376,837 6,333,391,200Diluted 6,022,304,367 6,344,482,633
Consolidated Statement of Profit and Loss

Consolidated Financial Statements under Ind AS
216 Wipro Limited
CO
NS
OLI
DAT
ED
STA
TEM
EN
T O
F C
HA
NG
ES
IN E
QU
ITY
(` in
mill
ions
, exc
ept
shar
e an
d pe
r sha
re d
ata,
unl
ess
othe
rwis
e st
ated
)
Equ
ity
shar
e ca
pita
l
Bal
ance
as
at A
pril
1, 2
018
Cha
nge
in e
quit
y sh
are
capi
tal
Bal
ance
as
at M
arch
31,
201
99,
048
3,02
012
,068
Bal
ance
as
at A
pril
1, 2
017
Cha
nge
in e
quit
y sh
are
capi
tal
Bal
ance
as
at M
arch
31,
201
84,
861
4,18
79,
048
Oth
er e
quit
y
Part
icul
ars
Shar
e ap
plic
atio
n m
oney
pe
ndin
g al
lotm
ent
Res
erve
s an
d Su
rplu
sFo
reig
n cu
rren
cy
tran
slat
ion
rese
rve
Cash
flow
he
dgin
g re
serv
e
Oth
er
com
preh
ensi
ve
inco
me
Tota
l at
trib
utab
le
to e
quit
y ho
lder
s of
the
Com
pany
Non
-co
ntro
lling
in
tere
st
Tota
l
Secu
riti
es
prem
ium
re
serv
e
Capi
tal
rese
rve
Capi
tal
rede
mpt
ion
rese
rve
Ret
aine
d ea
rnin
gsSh
are
Opt
ions
O
utst
andi
ng
Acco
unt
Spec
ial
econ
omic
Zo
ne re
-in
vest
men
t re
serv
e
Bal
ance
as
at A
pril
1, 2
018
^
871
1,13
978
144
9,34
71,
772
-15
,639
(114
)78
047
0,21
52,
410
472,
625
Adju
stm
ent o
n ad
opti
on o
f Ind
AS
115
--
-(2
,279
)-
--
--
(2,2
79)
-(2
,279
)
Adju
sted
bal
ance
s as
at A
pril
1,
2018
871
1,13
978
144
7,06
81,
772
-15
,639
(114
)78
046
7,93
62,
410
470,
346
Pro
fit f
or th
e ye
ar-
--
-90
,037
--
--
-90
,037
142
90,1
79
Oth
er c
ompr
ehen
sive
inco
me
--
--
--
-(1
,591
)2,
529
(247
)69
110
980
0
Tota
l com
preh
ensi
ve in
com
e fo
r th
e ye
ar-
--
-90
,037
--
(1,5
91)
2,52
9(2
47)
90,7
2825
190
,979
Issu
e of
equ
ity
shar
es o
n ex
erci
se
of o
ptio
ns-
528
--
-(5
28)
--
--
--
-
Loss
of c
ontr
ol in
sub
sidi
ary
--
--
--
--
--
-(5
2)(5
2)
Infu
sion
of c
apit
al-
--
--
--
--
--
2828
Cas
h di
vide
nd p
aid
(incl
udin
g di
vide
nd ta
x th
ereo
n)-
--
-(5
,434
)-
--
--
(5,4
34)
-(5
,434
)
Bon
us is
sue
of e
quit
y sh
ares
-(7
95)
-(7
67)
(1,4
54)
--
--
-(3
,016
)-
(3,0
16)
Tran
sfer
red
to s
peci
al e
cono
mic
zo
ne re
-inv
estm
ent r
eser
ve-
--
-(2
8,56
5)-
28,5
65-
--
--
-
Issu
e of
sha
res
by c
ontr
olle
d tr
ust
on e
xerc
ise
of o
ptio
ns*
--
-56
5(5
65)
--
--
--
-
Com
pens
atio
n co
st re
late
d to
em
ploy
ee s
hare
bas
ed p
aym
ent
--
--
61,
938
--
--
1,94
4-
1,94
4
Bal
ance
as
at M
arch
31,
201
9 ^
60
41,
139
1450
2,22
32,
617
28,5
6514
,048
2,41
553
355
2,15
82,
637
554,
795
* In
clud
es 2
7,35
3,85
3 an
d 23
,097
,216
trea
sury
sha
res
held
as
at M
arch
31,
201
9 an
d 20
18, r
espe
ctiv
ely
by a
con
trol
led
trus
t. 2
,599
,183
and
4,3
51,7
75 s
hare
s ha
ve b
een
tran
sfer
red
by th
e co
ntro
lled
trus
t to
elig
ible
em
ploy
ees
on e
xerc
ise
of o
ptio
ns d
urin
g th
e ye
ar e
nded
Mar
ch 3
1, 2
019
and
2018
resp
ecti
vely
.

Consolidated Financial Statements under Ind AS
Annual Report 2018-19 217
CO
NS
OLI
DAT
ED
STA
TEM
EN
T O
F C
HA
NG
ES
IN E
QU
ITY
(` in
mill
ions
, exc
ept
shar
e an
d pe
r sha
re d
ata,
unl
ess
othe
rwis
e st
ated
)
Part
icul
ars
Res
erve
s an
d Su
rplu
s
Shar
e ap
plic
atio
n m
oney
pe
ndin
g al
lotm
ent
Secu
riti
es
prem
ium
re
serv
e
Capi
tal
rese
rve
Capi
tal
rede
mpt
ion
rese
rve
Ret
aine
d ea
rnin
gsSh
are
Opt
ions
O
utst
andi
ng
Acco
unt
Spec
ial
econ
omic
Zo
ne re
-in
vest
men
t re
serv
e
Fore
ign
curr
ency
tr
ansl
atio
n re
serv
e
Cash
flow
he
dgin
g re
serv
e
Oth
er
com
preh
ensi
ve
inco
me
Tota
l at
trib
utab
le
to e
quit
y ho
lder
s of
th
e Co
mpa
ny
Non
-co
ntro
lling
in
tere
st
Tota
l
Bal
ance
as
at A
pril
1, 2
017
^
54
01,
139
9448
7,06
53,
555
-12
,146
5,90
61,
396
511,
841
2,39
151
4,23
2
Pro
fit f
or th
e ye
ar-
--
-80
,028
--
--
-80
,028
380
,031
Oth
er c
ompr
ehen
sive
inco
me
--
--
--
-3,
493
(6,0
20)
(616
)(3
,143
)16
(3,1
27)
Tota
l co
mp
reh
ensi
ve i
nco
me
for t
he y
ear
--
--
80,0
28-
-3,
493
(6,0
20)
(616
)76
,885
1976
,904
Issu
e of
sha
res
by c
ontr
olle
d tr
ust o
n ex
erci
se o
f opt
ions
--
--
1,18
2(1
,971
)-
--
-(7
89)
-(7
89)
Issu
e o
f e
qu
ity
sha
res
on
exer
cise
of o
ptio
ns-
1,98
7-
--
(1,1
82)
--
--
805
-80
5
Bon
us is
sue
of e
quit
y sh
ares
--
--
(4,8
66)
--
--
-(4
,866
)-
(4,8
66)
Buy
back
of e
quit
y sh
ares
-(1
,656
)-
-(1
08,3
44)
--
--
-(1
10,0
00)
-(1
10,0
00)
Tra
nsa
ctio
n c
ost
re
late
d t
o bu
ybac
k-
--
(312
)-
--
--
(312
)-
(312
)
Tra
ns
ferr
ed
to
C
ap
ita
l R
edem
ptio
n R
eser
ve p
ursu
ant
to B
uyba
ck
--
-68
7-
--
--
-68
7-
687
Cas
h D
ivid
end
paid
(in
clud
ing
divi
dend
tax
ther
eon)
--
--
(5,4
20)
--
--
-(5
,420
)-
(5,4
20)
Tra
ns
ferr
ed
fro
m s
pe
cia
l ec
onom
ic z
one
re-i
nves
tmen
t re
serv
e on
uti
lisat
ion
--
--
20,0
37-
(20,
037)
--
--
--
Tran
sfer
red
to s
peci
al e
cono
mic
zo
ne re
-inv
estm
ent r
eser
ve-
--
-(2
0,03
7)-
20,0
37-
--
--
-
Com
pens
atio
n co
st r
elat
ed t
o em
ploy
ee s
hare
bas
ed p
aym
ent
--
--
141,
370
--
--
1,38
4-
1,38
4
Bal
ance
as
at M
arch
31,
201
8 ^
87
11,
139
781
449,
347
1,77
2-
15,6
39(1
14)
780
470,
215
2,41
047
2,62
5
^ Va
lue
is le
ss th
an `
1Th
e ac
com
pany
ing
note
s fo
rm a
n in
tegr
al p
art o
f the
se c
onso
lidat
ed fi
nanc
ial s
tate
men
ts
The
acco
mp
anyi
ng n
otes
form
an
inte
gral
par
t of
the
se c
onso
lidat
ed fi
nanc
ial s
tate
men
tsA
s p
er o
ur r
epor
t of
eve
n d
ate
atta
ched
For
and
on
beh
alf
of t
he B
oard
of
Dir
ecto
rsfo
r Del
oitt
e H
aski
ns &
Sel
ls L
LPA
zim
H P
rem
jiN
Vag
hul
Abi
dali
Z N
eem
uchw
ala
Cha
rter
ed A
ccou
ntan
tsE
xecu
tive
Cha
irm
an
& M
anag
ing
Dir
ecto
rD
irec
tor
Chi
ef E
xecu
tive
Offi
cer
& E
xecu
tive
Dir
ecto
rFi
rm’s
Reg
istr
atio
n N
o: 1
1736
6W
/W-1
0001
8
N. V
enka
tram
Jati
n P
ravi
ncha
ndra
Dal
alM
San
aulla
Kha
nP
artn
erC
hief
Fin
anci
al O
ffice
rC
ompa
ny S
ecre
tary
Mem
ber
ship
No.
713
87M
umb
aiB
enga
luru
June
06,
201
9Ju
ne 0
6, 2
019

Consolidated Financial Statements under Ind AS
218 Wipro Limited
(` in millions, except share and per share data, unless otherwise stated)For the year ended
March 31, 2019 March 31, 2018Cash flows from operating activities:Profit for the year 90,179 80,031Adjustments to reconcile the profit for the year to net cash generated from operating activities:
(Gain) / loss on sale of property, plant and equipment and intangible assets, net (309) (334)Depreciation, amortisation and impairment expense 19,467 21,117Unrealised exchange loss, net (546) 4,794Gain on sale of investments, net - (5,978)Share based compensation expense 1,938 1,347Share of net (profit) /loss of associates accounted for using the equity method 43 11Income tax expense 25,243 22,391Dividend and interest (income)/expenses, net, gain from investments (17,371) (14,569)Gain from sale of hosted data center services, Workday and Cornerstone OnDemand business and loss of control in subsidiary (4,344) -Other non cash items - 4,405
Changes in operating assets and liabilities; net of effects from acquisitions:Trade receivables 1,392 (9,735)Unbilled receivables and Contract assets 4,580 2,192Inventories (566) 545Other assets (6,909) (111)Trade payables, other liabilities and provisions 20,844 4,499Contract liabilities 7,824 1,733Cash generated from operating activities before taxes 141,465 112,338Income taxes paid, net (25,149) (28,105)
Net cash generated from operating activities 116,316 84,233Cash flows from investing activities:
Purchase of property, plant and equipment (22,781) (21,870)Proceeds from sale of property, plant and equipment 1,940 1,171Purchase of investments (930,614) (782,475)Proceeds from sale of investments 954,954 830,448Proceeds from sale of hosted data center services business and loss of control in subsidiary, net of related expenses and cash 26,103 -Payment for business acquisitions including deposits and escrow, net of cash acquired - (6,652)Interest received 20,163 14,347Dividend received 361 609
Net cash generated from investing activities 50,126 35,578Cash flows from financing activities:
Proceeds from issuance of equity shares/shares pending allotment 4 24Repayment of borrowings (104,039) (155,254)Proceeds from borrowings 65,161 144,271Payment for deferred contingent consideration in respect of business combination (265) (164)Payment for buyback of shares including transaction cost - (110,312)Interest paid on borrowings (4,796) (3,123)Payment of cash dividend (including dividend tax thereon) (5,434) (5,420)
Net cash used in financing activities (49,369) (129,978)Net increase/ (decrease) in cash and cash equivalents during the year 117,073 (10,167)Effect of exchange rate changes on cash and cash equivalents 526 375Cash and cash equivalents at the beginning of the year 40,926 50,718
Cash and cash equivalents at the end of the year (Note 13) 158,525 40,926Total taxes paid amounted to ` 25,149 and ` 28,105 for the year ended March 31, 2019 and 2018, respectively.Refer Note 15 for supplementary information on cash flow statement
The accompanying notes form an integral part of these consolidated financial statementsAs per our report of even date attached For and on behalf of the Board of Directorsfor Deloitte Haskins & Sells LLP Azim H Premji N Vaghul Abidali Z NeemuchwalaChartered Accountants Executive Chairman
& Managing DirectorDirector Chief Executive Officer
& Executive DirectorFirm’s Registration No: 117366W/W-100018
N. Venkatram Jatin Pravinchandra Dalal M Sanaulla KhanPartner Chief Financial Officer Company SecretaryMembership No. 71387Mumbai BengaluruJune 06, 2019 June 06, 2019
Consolidated Statement of Cash Flows

Consolidated Financial Statements under Ind AS
Annual Report 2018-19 219
1. The Company overview
Wipro Limited (“Wipro” or the “Parent Company”), together with its subsidiaries and controlled trusts (collectively, “the Company” or the “Group”) is a global information technology (IT), consulting and business process services (BPS) company.
Wipro is a public limited company incorporated and domiciled in India. The address of its registered office is Wipro Limited, Doddakannelli, Sarjapur Road, Bengaluru – 560 035, Karnataka, India. Wipro has its primary listing with BSE Ltd. (Bombay Stock Exchange) and National Stock Exchange of India Ltd. The Company’s American Depository Shares representing equity shares are also listed on the New York Stock Exchange.
These consolidated financial statements were authorised for issue by the Board of Directors on June 6, 2019.
2. Basis of preparation of consolidated financial statements
(i) Statement of compliance and basis of preparation
The consolidated financial statements are prepared in accordance with Indian Accounting Standards (“Ind AS”), the provisions of the Companies Act, 2013 (“the Companies Act”), as applicable and guidelines issued by the Securities and Exchange Board of India (“SEBI”). The Ind AS are prescribed under Section 133 of the Act read with Rule 3 of the Companies (Indian Accounting Standards) Rules, 2015 and Companies (Indian Accounting Standards) Amendment Rules, 2016.
Accounting policies have been applied consistently to all periods presented in these financial statements except for new accounting standards adopted by the company.
The consolidated financial statements correspond to the classification provisions contained in Ind AS 1, “Presentation of Financial Statements”. For clarity, various items are aggregated in the statements of profit and loss and balance sheet. These items are disaggregated separately in the notes to the consolidated financial statements, where applicable.
All amounts included in the consolidated financial statements are reported in Indian rupees (` in millions) except share and per share data, unless otherwise stated. Due to rounding off, the numbers presented throughout the document may not add
up precisely to the totals and percentages may not precisely reflect the absolute figures. Previous year figures have been regrouped/re-arranged, wherever necessary.
(ii) Basis of measurement
The consolidated financial statements have been prepared on a historical cost convention and on an accrual basis, except for the following material items which have been measured at fair value as required by relevant Ind AS:-
a. Derivative financial instruments;
b. Financial instruments classified as fair value through other comprehensive income or fair value through profit or loss;
c. The defined benefit asset/ (liability) is recognised as the present value of defined benefit obligation less fair value of plan assets; and
d. Contingent consideration.
(iii) Use of estimates and judgment
The preparation of the consolidated financial statements in conformity with Ind AS requires management to make judgments, estimates and assumptions that affect the application of accounting policies and the reported amounts of assets, liabilities, income and expenses. Actual results may differ from those estimates.
Estimates and underlying assumptions are reviewed on an ongoing basis. Revisions to accounting estimates are recognised in the period in which the estimates are revised and in any future periods affected. In particular, information about significant areas of estimation, uncertainty and critical judgments in applying accounting policies that have the most significant effect on the amounts recognised in the consolidated financial statements are included in the following notes:
a) Revenue recognition: The Company applies judgement to determine whether each product or services promised to a customer are capable of being distinct, and are distinct in the context of the contract, if not, the promised product or services are combined and accounted as a single performance obligation. The Company allocates the arrangement consideration to separately identifiable performance obligation deliverables based on their relative stand-alone selling price. In cases where the Company is
(` in millions, except share and per share data, unless otherwise stated)
Notes to the consolidated financial statements

Consolidated Financial Statements under Ind AS
220 Wipro Limited
unable to determine the stand-alone selling price the company uses expected cost-plus margin approach in estimating the stand-alone selling price. The Company uses the percentage of completion method using the input (cost expended) method to measure progress towards completion in respect of fixed price contracts. Percentage of completion method accounting relies on estimates of total expected contract revenue and costs. This method is followed when reasonably dependable estimates of the revenues and costs applicable to various elements of the contract can be made. Key factors that are reviewed in estimating the future costs to complete include estimates of future labor costs and productivity efficiencies. Because the financial reporting of these contracts depends on estimates that are assessed continually during the term of these contracts, revenue recognised, profit and timing of revenue for remaining performance obligations are subject to revisions as the contract progresses to completion. When estimates indicate that a loss will be incurred, the loss is provided for in the period in which the loss becomes probable. Volume discounts are recorded as a reduction of revenue. When the amount of discount varies with the levels of revenue, volume discount is recorded based on estimate of future revenue from the customer
b) Impairment testing: Goodwill and intangible assets with infinite useful life recognised on business combination are tested for impairment at least annually and when events occur or changes in circumstances indicate that the recoverable amount of the asset or the cash generating unit to which these pertain is less than the carrying value. The recoverable amount of the asset or the cash generating units is higher of value-in-use and fair value less cost of disposal. The calculation of value in use of a cash generating unit involves use of significant estimates and assumptions which includes turnover, growth rates and net margins used to calculate projected future cash flows, risk-adjusted discount rate, future economic and market conditions.
c) Income taxes: The major tax jurisdictions for the Company are India and the United States of America. Significant judgments are involved in determining the provision for income taxes including judgment on whether tax positions are probable of being sustained in tax assessments. A tax assessment can involve complex issues, which can only be resolved over extended time periods.
d) Deferred taxes: Deferred tax is recorded on temporary differences between the tax bases of assets and liabilities and their carrying amounts, at the rates that have been enacted or substantively enacted at the reporting date. The ultimate realisation of deferred tax assets is dependent upon the generation of future taxable profits during the periods in which those temporary differences and tax loss carry-forwards become deductible. The Company considers the expected reversal of deferred tax liabilities and projected future taxable income in making this assessment. The amount of the deferred tax assets considered realisable, however, could be reduced in the near term if estimates of future taxable income during the carry-forward period are reduced.
e) Business combination: In accounting for business combinations, judgment is required in identifying whether an identifiable intangible asset is to be recorded separately from goodwill. Additionally, estimating the acquisition date fair value of the identifiable assets (including useful life estimates) and liabilities acquired, and contingent consideration assumed involves management judgment. These measurements are based on information available at the acquisition date and are based on expectations and assumptions that have been deemed reasonable by management. Changes in these judgments, estimates, and assumptions can materially affect the results of operations.
f) Defined benefit plans and compensated absences: The cost of the defined benefit plans, compensated absences and the present value of the defined benefit obligations are based on actuarial valuation using the projected unit credit method. An actuarial valuation involves making various assumptions that may differ from actual developments in the future. These include the determination of the discount rate, future salary increases and mortality rates. Due to the complexities involved in the valuation and its long-term nature, a defined benefit obligation is highly sensitive to changes in these assumptions. All assumptions are reviewed at each reporting date.
g) Expected credit losses on financial assets: The impairment provisions of financial assets and contract assets are based on assumptions about risk of default and expected timing of collection. The Company uses judgment in making these assumptions and selecting the inputs to the impairment calculation, based on the Company’s past history of collections,

Consolidated Financial Statements under Ind AS
Annual Report 2018-19 221
customer’s creditworthiness, existing market conditions as well as forward looking estimates at the end of each reporting period.
h) Measurement of fair value of non-marketable equity investments: These instruments are initially recorded at cost and subsequently measured at fair value. Fair value of investments is determined using the market and income approaches. The market approach includes the use of financial metrics and ratios of comparable companies, such as revenue, earnings, comparable performance multiples, recent financial rounds and the level of marketability of the investments. The selection of comparable companies requires management judgment and is based on a number of factors, including comparable company sizes, growth rates, and development stages. The income approach includes the use of discounted cash flow model, which requires significant estimates regarding the investees’ revenue, costs, and discount rates based on the risk profile of comparable companies. Estimates of revenue and costs are developed using available historical and forecast data.
i) Useful lives of property, plant and equipment: The Company depreciates property, plant and equipment on a straight-line basis over estimated useful lives of the assets. The charge in respect of periodic depreciation is derived based on an estimate of an asset’s expected useful life and the expected residual value at the end of its life. The lives are based on historical experience with similar assets as well as anticipation of future events, which may impact their life, such as changes in technology. The estimated useful life is reviewed at least annually.
j) Useful lives of intangible assets: The Company amortises intangible assets on a straight-line basis over estimated useful lives of the assets. The useful life is estimated based on a number of factors including the effects of obsolescence, demand, competition and other economic factors such as the stability of the industry and known technological advances and the level of maintenance expenditures required to obtain the expected future cash flows from the assets. The estimated useful life is reviewed at least annually.
k) Other estimates: The share-based compensation expense is determined based on the Company’s estimate of equity instruments that will eventually vest. Fair valuation of derivative
hedging instruments designated as cash flow hedges involves significant estimates relating to the occurrence of forecast transaction.
3. Significant accounting policies
(i) Basis of consolidation
Subsidiaries and controlled trusts
The Company determines the basis of control in line with the requirements of Ind AS 110, Consolidated Financial Statements. Subsidiaries and controlled trusts are entities controlled by the Group. The Group controls an entity when the parent has power over the entity, it is exposed to, or has rights to, variable returns from its involvement with the entity and has the ability to affect those returns through its power over the entity. The financial statements of subsidiaries and controlled trusts are included in the consolidated financial statements from the date on which control commences until the date on which control ceases.
All intra-Group balances, transactions, income and expenses are eliminated in full on consolidation.
Non-controlling interest
Non-controlling interests in the net assets (excluding goodwill) of consolidated subsidiaries are identified separately from the Company’s equity. The interest of non-controlling shareholders may be initially measured either at fair value or at the non-controlling interest’s proportionate share of the fair value of the acquiree’s identifiable net assets. The choice of measurement basis is made on an acquisition to acquisition basis. Subsequent to acquisition, the carrying amount of non-controlling interest is the amount of those interests at initial recognition plus the non-controlling interest’s share of subsequent changes in equity. Total comprehensive income is attributed to non-controlling interests even if it results in the non-controlling interest having a deficit balance.
Investments accounted for using the equity method
Investments accounted for using the equity method are entities in respect of which, the Company has significant influence, but not control, over the financial and operating policies. Generally, a Company has a significant influence if it holds between 20 and 50 percent of the voting power of another entity. Investments in such entities are accounted for using the equity method and are initially recognised at cost. The carrying amount of investment is increased/ decreased to recognised investors share of profit or loss of the investee after the acquisition date.
Non-current assets and disposal groups held for sale
Assets of disposal groups that is available for

Consolidated Financial Statements under Ind AS
222 Wipro Limited
immediate sale and where the sale is highly probable of being completed within one year from the date of classification are considered and classified as assets held for sale. Non-current assets and disposal groups held for sale are measured at the lower of carrying amount and fair value less costs to sell.
(ii) Functional and presentation currency
Items included in the financial statements of each of the Company’s entities are measured using the currency of the primary economic environment in which these entities operate (i.e. the “functional currency”). These consolidated financial statements are presented in Indian rupees, which is the functional currency of the Company.
(iii) Foreign currency transactions and translation
a) Transactions and balances
Transactions in foreign currency are translated into the respective functional currencies using the exchange rates prevailing at the date of the transaction. Foreign exchange gains and losses resulting from the settlement of such transactions and from translation at the exchange rates prevailing at the reporting date of monetary assets and liabilities denominated in foreign currencies are recognised in the consolidated statement of profit and loss and reported within foreign exchange gains/(losses), net, within results of operating activities except when deferred in other comprehensive income as qualifying cash flow hedges and qualifying net investment hedges. Gains/(losses), net, relating to translation or settlement of borrowings denominated in foreign currency are reported within finance costs. Non-monetary assets and liabilities denominated in foreign currency and measured at historical cost are translated at the exchange rate prevalent at the date of transaction. Translation differences on non-monetary financial assets measured at fair value at the reporting date, such as equities classified as financial instruments measured at fair value through other comprehensive income are included in other comprehensive income, net of taxes.
b) Foreign operations
For the purpose of presenting consolidated financial statements, the assets and liabilities of the Company’s foreign operations that have a functional currency other than Indian rupees are translated into Indian rupees using exchange rates prevailing at the reporting date. Income and expense items are translated at the average exchange rates for the period. Exchange
differences arising, if any, are recognised in other comprehensive income and held in foreign currency translation reserve (FCTR), a component of equity, except to the extent that the translation difference is allocated to non-controlling interest. When a foreign operation is disposed of, the relevant amount recognised in FCTR is transferred to the consolidated statement of profit and loss as part of the profit or loss on disposal. Goodwill and fair value adjustments arising on the acquisition of a foreign operation are treated as assets and liabilities of the foreign operation and translated at the exchange rate prevailing at the reporting date.
c) Others
Foreign currency differences arising on the translation or settlement of a financial liability designated as a hedge of a net investment in a foreign operation are recognised in other comprehensive income and presented within equity in the FCTR to the extent the hedge is effective. To the extent the hedge is ineffective, such differences are recognised in the consolidated statement of profit and loss.
When the hedged part of a net investment is disposed of, the relevant amount recognised in FCTR is transferred to the consolidated statement of profit and loss as part of the profit or loss on disposal. Foreign currency differences arising from translation of intercompany receivables or payables relating to foreign operations, the settlement of which is neither planned nor likely in the foreseeable future, are considered to form part of net investment in foreign operation and are recognised in FCTR.
(iv) Financial instruments
A) Non-derivative financial instruments:
Non derivative financial instruments consist of:
• financial assets, which include cash and cash equivalents, trade receivables, unbilled receivables, finance lease receivables, employee and other advances, investments in equity and debt securities and eligible current and non-current assets; Financial assets are derecognised when substantial risks and rewards of ownership of the financial asset have been transferred. In cases where substantial risks and rewards of ownership of the financial assets are neither transferred nor retained, financial assets are derecognised only when the Company has not retained control over the financial asset.

Consolidated Financial Statements under Ind AS
Annual Report 2018-19 223
• financial liabilities, which include long and short-term loans and borrowings, bank overdrafts, trade payables, eligible current and non-current liabilities.
Non derivative financial instruments are recognised initially at fair value. Subsequent to initial recognition, non-derivative financial instruments are measured as described below:
a. Cash and cash equivalents
The Company’s cash and cash equivalents consist of cash on hand and in banks and demand deposits with banks, which can be withdrawn at any time, without prior notice or penalty on the principal.
For the purposes of the cash flow statement, cash and cash equivalents include cash on hand, in banks and demand deposits with banks, net of outstanding bank overdrafts that are repayable on demand and are considered part of the Company’s cash management system. In the consolidated balance sheet, bank overdrafts are presented under borrowings within current liabilities.
b. Investments
Financial instruments measured at amortised cost:
Debt instruments that meet the following criteria are measured at amortised cost (except for debt instruments that are designated at fair value through Profit or Loss (FVTPL) on initial recognition):
• the asset is held within a business model whose objective is to hold assets in order to collect contractual cash flows; and
• the contractual terms of the instrument give rise on specified dates to cash flows that are solely payment of principal and interest on the principal amount outstanding.
Financial instruments measured at fair value through other comprehensive income (FVTOCI):
Debt instruments that meet the following criteria are measured at fair value through other comprehensive income (FVTOCI) (except for debt instruments that are designated at fair value through Profit or Loss (FVTPL) on initial recognition):
• the asset is held within a business model whose objective is achieved both by collecting contractual cash flows and selling the financial asset; and
• the contractual terms of the instrument give rise on specified dates to cash flows that are solely payment of principal and interest on the principal amount outstanding.
Interest income is recognised in the consolidated statement of profit and loss for FVTOCI debt instruments. Other changes in fair value of FVTOCI financial assets are recognised in other comprehensive income. When the investment is disposed of, the cumulative gain or loss previously accumulated in reserves is transferred to the consolidated statement of profit and loss.
Financial instruments measured at fair value through profit or loss (FVTPL):
Instruments that do not meet the amortised cost or FVTOCI criteria are measured at FVTPL. Financial assets at FVTPL are measured at fair value at the end of each reporting period, with any gains or losses arising on re-measurement recognised in consolidated statement of profit and loss. The gain or loss on disposal is recognised in the consolidated statement of profit and loss.
Interest income is recognised in the consolidated statement of profit and loss for FVTPL debt instruments. Dividend on financial assets at FVTPL is recognised when the Group’s right to receive dividend is established.
Investments in equity instruments designated to be classified as FVTOCI:
The Company carries certain equity instruments which are not held for trading. The Company has elected the FVTOCI irrevocable option for these instruments. Movements in fair value of these investments are recognised in other comprehensive income and the gain or loss is not transferred to consolidated statement of profit and loss on disposal of these investments. Dividends from these investments are recognised in the consolidated statement of profit and loss when the Company’s right to receive dividends is established.
c. Other financial assets:
Other financial assets are non-derivative financial assets with fixed or determinable payments that are not quoted in an active market. They are presented as current assets, except for those maturing later than 12 months after the reporting date which are presented as non-current assets. These are initially recognised at fair value and subsequently

Consolidated Financial Statements under Ind AS
224 Wipro Limited
measured at amortised cost using the effective interest method, less any impairment losses. These comprise trade receivables, unbilled revenues and other assets.
d. Trade and other payables
Trade and other payables are initially recognised at fair value, and subsequently carried at amortised cost using the effective interest method. For these financial instruments, the carrying amounts approximate fair value due to the short term maturity of these instruments. Contingent consideration recognised in the business combination is subsequently measured at fair value through profit or loss.
B) Derivative financial instruments
The Company is exposed to foreign currency fluctuations on foreign currency assets, liabilities, net investment in foreign operations and forecasted cash flows denominated in foreign currency.
The Company limits the effect of foreign exchange rate fluctuations by following established risk management policies including the use of derivatives. The Company enters into derivative financial instruments where the counterparty is primarily a bank.
Derivatives are recognised and measured at fair value. Attributable transaction costs are recognised in consolidated statement of profit and loss as cost.
Subsequent to initial recognition, derivative financial instruments are measured as described below:
a. Cash flow hedges
Changes in the fair value of the derivative hedging instrument designated as a cash flow hedge are recognised in other comprehensive income and held in cash flow hedging reserve, net of taxes, a component of equity, to the extent that the hedge is effective. To the extent that the hedge is ineffective, changes in fair value are recognised in the consolidated statement of profit and loss and reported within foreign exchange gains/(losses), net within results from operating activities. If the hedging instrument no longer meets the criteria for hedge accounting, then hedge accounting is discontinued prospectively. If the hedging instrument expires or is sold, terminated or exercised, the cumulative gain or loss on the hedging instrument recognised in cash flow hedging reserve till the period the hedge was effective remains in cash flow hedging reserve until the forecasted transaction occurs. The cumulative gain or loss previously recognised in the cash flow hedging reserve is transferred to the consolidated statement
of profit and loss upon the occurrence of the related forecasted transaction. If the forecasted transaction is no longer expected to occur, such cumulative balance is immediately recognised in the consolidated statement of profit and loss.
b. Hedges of net investment in foreign operations
The Company designates derivative financial instruments as hedges of net investments in foreign operations. The Company has also designated a foreign currency denominated borrowing as a hedge of net investment in foreign operations. Changes in the fair value of the derivative hedging instruments and gains/losses on translation or settlement of foreign currency denominated borrowings designated as a hedge of net investment in foreign operations are recognised in other comprehensive income and presented within equity in the FCTR to the extent that the hedge is effective. To the extent that the hedge is ineffective, changes in fair value are recognised in the consolidated statement of profit and loss and reported within foreign exchange gains/(losses), net within results from operating activities.
c. Others
Changes in fair value of foreign currency derivative instruments neither designated as cash flow hedges nor hedges of net investment in foreign operations are recognised in the consolidated statement of profit and loss and reported within foreign exchange gains/(losses), net within results from operating activities. Changes in fair value and gains/(losses), net, on settlement of foreign currency derivative instruments relating to borrowings, which have not been designated as hedges are recorded in finance costs.
C) Derecognition of financial instruments
The Company derecognises a financial asset when the contractual rights to the cash flows from the financial asset expire or it transfers the financial asset and the transfer qualifies for derecognition under Ind AS 109. If the Company retains substantially all the risks and rewards of a transferred financial asset, the Company continues to recognise the financial asset and also recognises a borrowing for the proceeds received. A financial liability (or a part of a financial liability) is derecognised from the group’s balance sheet when the obligation specified in the contract is discharged or cancelled or expires.
(v) Equity and share capital
a) Share capital and Securities premium reserve
The authorised share capital of the Company as at

Consolidated Financial Statements under Ind AS
Annual Report 2018-19 225
March 31, 2019 is ̀ 25,274 divided into 12,504,500,000 equity shares of `2 each, 25,000,000 preference shares of `10 each and 150,000 10% optionally convertible cumulative preference shares of `100 each. Par value of the equity shares is recorded as share capital and the amount received in excess of par value is classified as Securities premium reserve.
Every holder of the equity shares, as reflected in the records of the Company as of the date of the shareholder meeting shall have one vote in respect of each share held for all matters submitted to vote in the shareholder meeting.
b) Shares held by controlled trust (Treasury shares)
The Company’s equity shares held by the controlled trust, which is consolidated as a part of the Group are classified as Treasury shares. The Company has 27,353,853 and 23,097,216 treasury shares as at March 31, 2019 and 2018, respectively. Treasury shares are recorded at acquisition cost.
c) Capital Reserve
Capital Reserve amounting to ̀ 1,139 (March 31, 2018: ` 1,139) is not freely available for distribution.
d) Capital Redemption Reserve
Capital Redemption Reserve amounting to ` 14 (March 31, 2018: ` 781) is not freely available for distribution.
e) Retained earnings
Retained earnings comprises of the Company’s undistributed earnings after taxes which is not freely available for distribution.
f) Share options outstanding account
The Share options outstanding account is used to record the value of equity-settled share based payment transactions with employees. The amounts recorded in share options outstanding account are transferred to securities premium reserve upon exercise of stock options and restricted stock unit options by employees.
g) Special Economic Zone Re-Investment reserve
The Special Economic Zone Re-Investment Reserve has been created out of profit of eligible SEZ units as per provisions of section 10AA (1)(ii) of the Income–tax Act, 1961 for acquiring new plant and machinery. The reserve has also been utilised for other business purposes of SEZ units as per provisions of section 10AA of the Income-tax Act, 1961 till the time the said reserve is utilised completely for the purposes of purchasing new plant and machinery. This reserve is not freely available for distribution
h) Foreign currency translation reserve (FCTR)
The exchange differences arising from the translation of financial statements of foreign subsidiaries, differences arising from translation of long-term inter-company receivables or payables relating to foreign operations settlement of which is neither planned nor likely in the foreseeable future, changes in fair value of the derivative hedging instruments and gains/losses on translation or settlement of foreign currency denominated borrowings designated as hedge of net investment in foreign operations are recognised in other comprehensive income, net of taxes and presented within equity in the FCTR.
i) Cash flow hedging reserve
Changes in fair value of derivative hedging instruments designated and effective as a cash flow hedge are recognised in other comprehensive income (net of taxes), and presented within equity as cash flow hedging reserve.
j) Other reserves
Changes in the fair value of financial instruments measured at fair value through other comprehensive income and actuarial gains and losses on defined benefit plans are recognised in other comprehensive income (net of taxes), and presented within equity in other reserves.
k) Dividend
A final dividend, including tax thereon, on common stock is recorded as a liability on the date of approval by the shareholders. An interim dividend, including tax thereon, is recorded as a liability on the date of declaration by the board of directors.
l) Buyback of equity shares
The buyback of equity shares and related transaction costs are recorded as a reduction of free reserves. Further, capital redemption reserves is created as an apportionment from retained earnings.
(vi) Property, plant and equipment
a) Recognition and measurement
Property, plant and equipment are measured at cost less accumulated depreciation and impairment losses, if any. Cost includes expenditures directly attributable to the acquisition of the asset. General and specific borrowing costs directly attributable to the construction of a qualifying asset are capitalised as part of the cost.
Capital work-in-progress are measured at cost less accumulated impairment losses, if any.
Consolidated Financial Statements under Ind AS
226 Wipro Limited
b) Depreciation
The Company depreciates property, plant and equipment over the estimated useful life on a straight-line basis from the date the assets are available for use. Assets acquired under finance lease and leasehold improvements are amortised over the shorter of estimated useful life of the asset or the related lease term. Term licenses are amortised over their respective contract term. Freehold land is not depreciated. The estimated useful life of assets are reviewed and where appropriate are adjusted, annually. The estimated useful lives of assets are as follows:
Category Useful lifeBuildings 28 to 40 yearsPlant and machinery 5 to 21 yearsComputer equipment and software 2 to 7 yearsFurniture, fixtures and equipment 3 to 10 yearsVehicles 4 to 5 years
When parts of an item of property, plant and equipment have different useful lives, they are accounted for as separate items (major components) of property, plant and equipment. Subsequent expenditure relating to property, plant and equipment is capitalised only when it is probable that future economic benefits associated with these will flow to the Company and the cost of the item can be measured reliably.
The cost of property, plant and equipment not available for use before such date are disclosed under capital work-in-progress.
(vii) Business combination, Goodwill and Intangible assets
a) Business combination
Business combinations are accounted for using the purchase (acquisition) method. The cost of an acquisition is measured as the fair value of the assets transferred, liabilities incurred or assumed, and equity instruments issued at the date of exchange by the Company. Identifiable assets acquired and liabilities and contingent liabilities assumed in a business combination are measured initially at fair value at the date of acquisition. Transaction costs incurred in connection with a business acquisition are expensed as incurred.
The cost of an acquisition also includes the fair value of any contingent consideration measured as at the date of acquisition. Any subsequent changes to the fair value of contingent consideration classified as liabilities, other than measurement period adjustments, are recognised in the consolidated statement of profit and loss.
b) Goodwill
The excess of the cost of an acquisition over the Company’s share in the fair value of the acquiree’s identifiable assets, liabilities and contingent liabilities is recognised as goodwill. If the excess is negative, a bargain purchase gain is recognised in equity as capital reserve. Goodwill is measured at cost less accumulated impairment (if any).
Goodwill associated with disposal of an operation that is part of cash-generating unit is measured on the basis of the relative values of the operation disposed of and the portion of the cash-generating unit retained, unless some other method better reflects the goodwill associated with the operation disposed of.
c) Intangible assets
Intangible assets acquired separately are measured at cost of acquisition. Intangible assets acquired in a business combination are measured at fair value as at the date of acquisition. Following initial recognition, intangible assets are carried at cost less accumulated amortisation and impairment losses, if any.
The amortisation of an intangible asset with a finite useful life reflects the manner in which the economic benefit is expected to be generated and is included in selling and marketing expenses in the consolidated statement of profit and loss.
The estimated useful life of amortisable intangibles are reviewed and where appropriate are adjusted, annually. The estimated useful lives of the amortisable intangible assets for the current and comparative periods are as follows:
Category Useful lifeCustomer-related intangibles 5 to 15 yearsMarketing related intangibles 3 to 5 years
(viii) Leases
The determination of whether an arrangement is, or contains, a lease is based on the substance of the arrangement at the inception date. The arrangement is, or contains a lease if, fulfillment of the arrangement is dependent on the use of a specific asset or assets or the arrangement conveys a right to use the asset or assets, even if that right is not explicitly specified in an arrangement.
a) Arrangements where the Company is the lessee
Leases of property, plant and equipment, where the Company assumes substantially all the risks and rewards of ownership are classified as finance leases. Finance leases are capitalised at lower of the fair value of the leased property and the present value of the minimum lease payments. Lease payments are apportioned between the finance charge and the

Consolidated Financial Statements under Ind AS
Annual Report 2018-19 227
outstanding liability. The finance charge is allocated to periods during the lease term at a constant periodic rate of interest on the remaining balance of the liability.
Leases where the lessor retains substantially all the risks and rewards of ownership are classified as operating leases. Payments made under operating leases are recognised in the consolidated statement of profit and loss on a straight-line basis over the lease term.
b) Arrangements where the Company is the lessor
In certain arrangements, the Company recognises revenue from the sale of products given under finance leases. The Company records gross finance receivables, unearned income and the estimated residual value of the leased equipment on consummation of such leases. Unearned income represents the excess of the gross finance lease receivable plus the estimated residual value over the sales price of the equipment. The Company recognises unearned income as finance income over the lease term using the effective interest method.
(ix) Inventories
Inventories are valued at lower of cost and net realisable value, including necessary provision for obsolescence. Cost is determined using the weighted average method.
(x) Impairment
A) Financial assets
The Company applies the expected credit loss model for recognising impairment loss on financial assets measured at amortised cost, debt instruments classified as FVTOCI, trade receivables, lease receivables, contract assets and other financial assets. Expected credit loss is the difference between the contractual cash flows and the cash flows that the entity expects to receive, discounted using the effective interest rate.
Loss allowances for trade receivables and lease receivables are measured at an amount equal to lifetime expected credit loss. Lifetime expected credit losses are the expected credit losses that result from all possible default events over the expected life of a financial instrument. Lifetime expected credit loss is computed based on a provision matrix which takes in to account risk profiling of customers and historical credit loss experience adjusted for forward looking information. For other financial assets, expected credit loss is measured at the amount equal to twelve months expected credit loss unless there has been a significant increase in credit risk from initial recognition, in which case those are measured at lifetime expected credit loss.
B) Non-financial assets
The Company assesses long-lived assets such as property, plant and equipment and acquired intangible assets for impairment whenever events or changes in circumstances indicate that the carrying amount of an asset or group of assets may not be recoverable. If any such indication exists, the Company estimates the recoverable amount of the asset or group of assets. The recoverable amount of an asset or cash generating unit is the higher of its fair value less cost of disposal (FVLCD) and its value-in-use (VIU). The VIU of long-lived assets is calculated using projected future cash flows. FVLCD of a cash generating unit is computed using turnover and earnings multiples. If the recoverable amount of the asset or the recoverable amount of the cash generating unit to which the asset belongs is less than its carrying amount, the carrying amount is reduced to its recoverable amount. The reduction is treated as an impairment loss and is recognised in the consolidated statement of profit and loss. If at the reporting date, there is an indication that a previously assessed impairment loss no longer exists, the recoverable amount is reassessed and the impairment losses previously recognised are reversed such that the asset is recognised at its recoverable amount but not exceeding written down value which would have been reported if the impairment losses had not been recognised initially.
Goodwill is tested for impairment at least annually at the same time and when events occur or changes in circumstances indicate that the recoverable amount of the cash generating unit is less than its carrying value. The goodwill impairment test is performed at the level of cash-generating unit or groups of cash -generating units which represents the lowest level at which goodwill is monitored for internal management purposes. An impairment in respect of goodwill is not reversed.
(xi) Employee benefits
Post-employment and pension plans
The Group participates in various employee benefit plans. Pensions and other post-employment benefits are classified as either defined contribution plans or defined benefit plans. Under a defined contribution plan, the Company’s only obligation is to pay a fixed amount with no obligation to pay further contributions if the fund does not hold sufficient assets to pay all employee benefits. The related actuarial and investment risks are borne by the employee. The expenditure for defined contribution plans is recognised as an expense during the period when the employee provides service. Under a defined benefit plan, it is the Company’s obligation to provide agreed benefits to the employees. The
Consolidated Financial Statements under Ind AS
228 Wipro Limited
related actuarial and investment risks are borne by the Company. The present value of the defined benefit obligations is calculated by an independent actuary using the projected unit credit method.
Remeasurement comprising actuarial gains or losses and the return on plan assets (excluding interest) are immediately recognised in other comprehensive income, net of taxes and permanently excluded from profit or loss. Instead net interest recognised in profit or loss is calculated by applying the discount rate used to measure the defined benefit obligation to the net defined benefit liability or asset. The actual return on the plan assets above or below the discount rate is recognised as part of re-measurement of net defined liability or asset through other comprehensive income, net of taxes.
The Company has the following employee benefit plans:
a. Provident fund
Employees receive benefits from a provident fund, which is a defined benefit plan. The employer and employees each make periodic contributions to the plan. A portion of the contribution is made to the approved provident fund trust managed by the Company while the remainder of the contribution is made to the government administered pension fund. The contributions to the trust managed by the Company is accounted for as a defined benefit plan as the Company is liable for any shortfall in the fund assets based on the government specified minimum rates of return.
b. Superannuation
Superannuation plan, a defined contribution scheme is administered by third party fund managers. The Company makes annual contributions based on a specified percentage of each eligible employee’s salary.
c. Gratuity
In accordance with the Payment of Gratuity Act, 1972, applicable for Indian companies, the Company provides for a lump sum payment to eligible employees, at retirement or termination of employment based on the last drawn salary and years of employment with the Company. The gratuity fund is managed by third party fund managers. The Company’s obligation in respect of the gratuity plan, which is a defined benefit plan, is provided for based on actuarial valuation using the projected unit credit method. The Company recognises actuarial gains and losses in other comprehensive income, net of taxes.
d. Termination benefits
Termination benefits are expensed when the
Company can no longer withdraw the offer of those benefits.
e. Short-term benefits
Short-term employee benefit obligations are measured on an undiscounted basis and are recorded as expense as the related service is provided. A liability is recognised for the amount expected to be paid under short-term cash bonus or profit-sharing plans, if the Company has a present legal or constructive obligation to pay this amount as a result of past service provided by the employee and the obligation can be estimated reliably.
f. Compensated absences
The employees of the Company are entitled to compensated absences. The employees can carry forward a portion of the unutilised accumulating compensated absences and utilise it in future periods or receive cash at retirement or termination of employment. The Company records an obligation for compensated absences in the period in which the employee renders the services that increases this entitlement. The Company measures the expected cost of compensated absences as the additional amount that the Company expects to pay as a result of the unused entitlement that has accumulated at the end of the reporting period. The Company recognises accumulated compensated absences based on actuarial valuation using the projected unit credit method. Non-accumulating compensated absences are recognised in the period in which the absences occur.
(xii) Share based payment transactions
Selected employees of the Company receive remuneration in the form of equity settled instruments, for rendering services over a defined vesting period and for company’s performance-based stock options over the defined period. Equity instruments granted are measured by reference to the fair value of the instrument at the date of grant. In cases, where equity instruments are granted at a nominal exercise price, the intrinsic value on the date of grant approximates the fair value. The expense is recognised in the consolidated statement of profit and loss with a corresponding increase to the share options outstanding account, a component of equity.
The equity instruments generally vest in a graded manner over the vesting period. The fair value determined at the grant date is expensed over the vesting period of the respective tranches of such grants (accelerated amortisation). The stock compensation expense is determined based on the Company’s estimate of equity instruments that will eventually vest.
Consolidated Financial Statements under Ind AS
Annual Report 2018-19 229
(xiii) Provisions
Provisions are recognised when the Company has a present obligation (legal or constructive) as a result of a past event, it is probable that an outflow of economic benefits will be required to settle the obligation and a reliable estimate can be made of the amount of the obligation.
The amount recognised as a provision is the best estimate of the consideration required to settle the present obligation at the end of the reporting period, taking into account the risks and uncertainties surrounding the obligation.
When some or all of the economic benefits required to settle a provision are expected to be recovered from a third party, the receivable is recognised as an asset, if it is virtually certain that reimbursement will be received and the amount of the receivable can be measured reliably.
Provisions for onerous contracts are recognised when the expected benefits to be derived by the Company from a contract are lower than the unavoidable costs of meeting the future obligations under the contract. Provisions for onerous contracts are measured at the present value of lower of the expected net cost of fulfilling the contract and the expected cost of terminating the contract.
(xiv) Revenue
The Company derives revenue primarily from software development, maintenance of software/hardware and related services, business process services, sale of IT and other products.
Revenue is recognised upon transfer of control of promised products or services to customers in an amount that reflects the consideration the Company expects to receive in exchange for those products or services. To recognise revenues, the Company apply the following five step approach: (1) identify the contract with a customer, (2) identify the performance obligations in the contract, (3) determine the transaction price, (4) allocate the transaction price to the performance obligations in the contract, and (5) recognise revenues when a performance obligation is satisfied.
At contract inception, the Company assesses its promise to transfer products or services to a customer to identify separate performance obligations. The Company applies judgement to determine whether each product or services promised to a customer are capable of being distinct, and are distinct in the context of the contract, if not, the promised product or services are combined and accounted as a single performance obligation. The Company allocates the arrangement consideration to separately identifiable performance obligation based on their relative stand-
alone selling price or residual method. Stand-alone selling prices are determined based on sale prices for the components when it is regularly sold separately, in cases where the Company is unable to determine the stand-alone selling price the Company uses third-party prices for similar deliverables or the company uses expected cost-plus margin approach in estimating the stand-alone selling price.
For performance obligations where control is transferred over time, revenues are recognised by measuring progress towards completion of the performance obligation. The selection of the method to measure progress towards completion requires judgment and is based on the nature of the promised products or services to be provided.
The method for recognising revenues and costs depends on the nature of the services rendered:
A. Time and materials contracts
Revenues and costs relating to time and materials are recognised as the related services are rendered.
B. Fixed-price contracts
i. Fixed-price development contracts
Revenues from fixed-price contracts, including software development, and integration contracts, where the performance obligations are satisfied over time, are recognised using the “percentage-of-completion” method. Percentage of completion is determined based on project costs incurred to date as a percentage of total estimated project costs required to complete the project. The cost expended (or input) method has been used to measure progress towards completion as there is a direct relationship between input and productivity. If the Company is not able to reasonably measure the progress of completion, revenue is recognised only to the extent of costs incurred for which recoverability is probable. When total cost estimates exceed revenues in an arrangement, the estimated losses are recognised in the consolidated statement of profit and loss in the period in which such losses become probable based on the current contract estimates as an onerous contract provision.
A contract asset is a right to consideration that is conditional upon factors other than the passage of time. Contract assets primarily relate to unbilled amounts on fixed-price development contracts and are classified as non-financial asset as the contractual right to consideration is dependent on completion of contractual milestones.
A contract liability is an entity’s obligation to transfer goods or services to a customer for which the entity has received consideration (or the amount is due) from the customer.

Consolidated Financial Statements under Ind AS
230 Wipro Limited
Unbilled revenue on other than fixed price development contracts are classified as a financial asset where the right to consideration is unconditional upon passage of time
ii. Maintenance contracts
Revenues related to fixed-price maintenance, testing and business process services are recognised based on our right to invoice for services performed for contracts in which the invoicing is representative of the value being delivered. If our invoicing is not consistent with value delivered, revenues are recognised as the service is performed using the percentage of completion method. When services are performed through an indefinite number of repetitive acts over a specified period, revenue is recognised on a straight-line basis over the specified period unless some other method better represents the stage of completion.
In certain projects, a fixed quantum of service or output units is agreed at a fixed price for a fixed term. In such contracts, revenue is recognised with respect to the actual output achieved till date as a percentage of total contractual output. Any residual service unutilised by the customer is recognised as revenue on completion of the term.
iii. Volume based contracts
Revenues and costs are recognised as the related services are rendered.
C. Products
Revenue on product sales are recognised when the customer obtains control of the specified asset.
D. Others
• Any change in scope or price is considered as a contract modification. The Company accounts for modifications to existing contracts by assessing whether the services added are distinct and whether the pricing is at the stand-alone selling price. Services added that are not distinct are accounted for on a cumulative catch up basis, while those that are distinct are accounted for prospectively, either as a separate contract if the additional services are priced at the stand-alone selling price, or as a termination of the existing contract and creation of a new contract if not priced at the stand-alone selling price.
• The Company accounts for variable considerations like, volume discounts, rebates and pricing incentives to customers as reduction of revenue on a systematic and rational basis over the period of the contract. The Company estimates an amount of such variable consideration using expected value method or the single most likely
amount in a range of possible consideration depending on which method better predicts the amount of consideration to which the Company may be entitled.
• Revenues are shown net of allowances/ returns sales tax, value added tax, goods and services tax and applicable discounts and allowances.
• The Company accrues the estimated cost of warranties at the time when the revenue is recognised. The accruals are based on the Company’s historical experience of material usage and service delivery costs.
• Incremental costs that relate directly to a contract and incurred in securing a contract with a customer are recognised as an asset when the Company expects to recover these costs and amortised over the contract term.
• The Company recognises contract fulfilment cost as an asset if those costs specifically relate to a contract or to an anticipated contract, the costs generate or enhance resources that will be used in satisfying performance obligations in future; and the costs are expected to be recovered. The asset so recognised is amortised on a systematic basis consistent with the transfer of goods or services to customer to which the asset relates.
• The Company assesses the timing of the transfer of goods or services to the customer as compared to the timing of payments to determine whether a significant financing component exists. As a practical expedient, the Company does not assess the existence of a significant financing component when the difference between payment and transfer of deliverables is a year or less. If the difference in timing arises for reasons other than the provision of finance to either the customer or us, no financing component is deemed to exist.
• The Company may enter into arrangements with third party suppliers to resell products or services. In such cases, the Company evaluates whether the Company is the principal (i.e. report revenues on a gross basis) or agent (i.e. report revenues on a net basis). In doing so, the Company first evaluates whether the Company controls the good or service before it is transferred to the customer. If Company controls the good or service before it is transferred to the customer, Company is the principal; if not, the Company is the agent.
(xv) Finance costs
Finance costs comprises interest cost on borrowings, gains or losses arising on re-measurement of financial assets measured at FVTPL, gains/ (losses),

Consolidated Financial Statements under Ind AS
Annual Report 2018-19 231
net, on translation or settlement of foreign currency borrowings and changes in fair value and gains/ (losses), net, on settlement of related derivative instruments. Borrowing costs that are not directly attributable to a qualifying asset are recognised in the consolidated statement of profit and loss using the effective interest method.
(xvi) Finance and other income
Finance and other income comprise interest income on deposits, dividend income and gains / (losses) on disposal of investments. Interest income is recognised using the effective interest method. Dividend income is recognised when the right to receive payment is established.
(xvii) Income tax
Income tax comprises current and deferred tax. Income tax expense is recognised in the consolidated statement of profit and loss except to the extent it relates to a business combination, or items directly recognised in equity or in other comprehensive income.
a) Current income tax
Current income tax for the current and prior periods are measured at the amount expected to be recovered from or paid to the taxation authorities based on the taxable income for the period. The tax rates and tax laws used to compute the current tax amounts are those that are enacted or substantively enacted as at the reporting date and applicable for the period. The Company offsets current tax assets and current tax liabilities, where it has a legally enforceable right to set off the recognised amounts and where it intends either to settle on a net basis, or to realise the asset and liability simultaneously.
b) Deferred income tax
Deferred income tax is recognised using the balance sheet approach. Deferred income tax assets and liabilities are recognised for deductible and taxable temporary differences arising between the tax base of assets and liabilities and their carrying amount in financial statements, except when the deferred income tax arises from the initial recognition of goodwill or an asset or liability in a transaction that is not a business combination and affects neither accounting nor taxable profits or loss at the time of the transaction.
Deferred income tax assets are recognised to the extent it is probable that taxable profit will be available against which the deductible temporary differences and the carry forward of unused tax credits and unused tax losses can be utilised.
Deferred income tax liabilities are recognised for all taxable temporary differences except in respect of taxable temporary differences that is expected to reverse within the tax holiday period, taxable temporary differences associated with investments in subsidiaries, associates and foreign branches where the timing of the reversal of the temporary difference can be controlled and it is probable that the temporary difference will not reverse in the foreseeable future.
The carrying amount of deferred income tax assets is reviewed at each reporting date and reduced to the extent that it is no longer probable that sufficient taxable profit will be available to allow all or part of the deferred income tax asset to be utilised.
Deferred income tax assets and liabilities are measured at the tax rates that are expected to apply in the period when the asset is realised or the liability is settled, based on tax rates (and tax laws) that have been enacted or substantively enacted at the reporting date.
The Company offsets deferred income tax assets and liabilities, where it has a legally enforceable right to offset current tax assets against current tax liabilities, and they relate to taxes levied by the same taxation authority on either the same taxable entity, or on different taxable entities where there is an intention to settle the current tax liabilities and assets on a net basis or their tax assets and liabilities will be realised simultaneously.
(xviii) Earnings per share
Basic earnings per share is computed using the weighted average number of equity shares outstanding during the period adjusted for treasury shares held. Diluted earnings per share is computed using the weighted-average number of equity and dilutive equivalent shares outstanding during the period, using the treasury stock method for options, except where the results would be anti-dilutive.
The number of equity shares and potentially dilutive equity shares are adjusted retrospectively for all periods presented for any splits and bonus shares issues including for change effected prior to the approval of the consolidated financial statements by the Board of Directors.
(xix) Cash flow statement
Cash flow are reported using the indirect method, whereby profit for the period is adjusted for the effects of transactions of a non-cash nature, any deferrals or accruals of past operating cash receipts or payments and item of income or expenses associated with investing or financing cash flows. The cash from operating, investing and financing

Consolidated Financial Statements under Ind AS
232 Wipro Limited
activities of the Company are segregated.
The amendment to Ind AS 7, require entities to provide disclosures about changes in their liabilities arising from financing activities, including both changes arising from cash flows and non-cash changes (such as foreign exchange gains or losses).
(xx) Assets held for sale
Sale of business is classified as held for sale, if their carrying amount is intended to be recovered principally through sale rather than through continuing use. The condition for classification as held for sale is met when disposal business is available for immediate sale and the same is highly probable of being completed within one year from the date of classification as held for sale.
(xxi) Discontinued operations
A discontinued operation is a component of the Company’s business that represents a separate line of business that has been disposed of or is held for sale, or is a subsidiary acquired exclusively with a view to resale. Classification as a discontinued operation occurs upon the earlier of disposal or when the operation meets the criteria to be classified as held for sale.
(xxii) Disposal of assets
The gain or loss arising on disposal or retirement of assets are recognised in the consolidated statement of profit and loss.
New Accounting standards adopted by the Company:
Ind AS 115- Revenue from Contract with Customers
On April 1, 2018, the Company adopted Ind AS 115, “Revenue from Contracts with Customers” using the cumulative catch-up transition method applied to contracts that were not completed as at April 1, 2018. In accordance with the cumulative catch-up transition method, the comparatives have not been retrospectively adjusted.
The adoption of the new standard has resulted in a reduction of ` 2,279 in opening retained earnings, primarily relating to certain contract costs because these do not meet the criteria for recognition as costs to fulfil a contract.
On account of adoption of Ind AS 115, unbilled revenues pertaining to fixed price development contracts of ` 15,038 as at March 31, 2019, has been considered as non-financial Contract assets, which are billable on completion of milestones specified in the contracts.
Unbilled revenues ` 22,880 which are billable based on passage of time has been classified as unbilled
receivables.
The adoption of Ind AS 115, did not have any material impact on the consolidated statement of profit and loss and earnings per share for year ended March 31, 2019.
A. Contract Asset and Liabilities
The Company classifies its right to consideration in exchange for deliverables as either a receivable or a contract asset.
A receivable is a right to consideration that is unconditional. A right to consideration is unconditional if only the passage of time is required before payment of that consideration is due. For example, the company recognises a receivable for revenues related to time and materials contracts or volume-based contracts. The Company present such receivables as part of unbilled receivables at their net estimated realisable value.
Contract liabilities: During the year ended March 31, 2019, the Company recognised revenue of ` 14,570 arising from opening unearned revenue as at April 1, 2018.
Contract Assets: During the year ended March 31, 2019, ` 13,558 of unbilled revenue pertaining to fixed-price development contracts (balance as at April 1, 2018: ̀ 17,469), has been reclassified to trade receivables on completion of milestones.
Contract assets and liabilities are reported in a net position on a contract by contract basis at the end of each reporting period.
B. Remaining Performance Obligations
Revenue allocated to remaining performance obligations represents contracted revenue that has not yet been recognised which includes unearned revenue and amounts that will be invoiced and recognised as revenue in future periods. Applying the practical expedient, the Company has not disclosed its right to consideration from customer in an amount that corresponds directly with the value to the customer of the Company’s performance completed to date which are, contracts invoiced on time and material basis and volume based. As at March 31, 2019, the aggregate amount of transaction price allocated to remaining performance obligations, other than those meeting the exclusion criteria above, was ` 373,879 of which approximately 59% is expected to be recognised as revenues within 2 years, and the remainder thereafter. This includes contracts that can be terminated for convenience without a substantive penalty since, based on current assessment, the occurrence of the same is expected to be remote.

Consolidated Financial Statements under Ind AS
Annual Report 2018-19 233
C. Disaggregation of Revenues
The table below presents disaggregated revenues from contracts with customers by business segment, customer location and contract-type. The Company believes that the below disaggregation best depicts the nature, amount, timing and uncertainty of revenue and cash flows from economic factors.
IT Services Products ISRE Total
BFSI Health BU CBU ENU TECH MFG COMM Total A. Revenue Sale of services 173,516 73,942 88,797 72,329 76,108 46,155 32,489 563,336 - 7,965 571,301
Sales of products - - - - - - - - 14,544 - 14,544
173,516 73,942 88,797 72,329 76,108 46,155 32,489 563,336 14,544 7,965 585,845B. Revenue by geography India 3,868 2,295 1,006 1,690 1,392 1,534 3,095 14,880 8,154 7,965 30,999
Americas 98,428 57,204 59,262 22,739 54,679 21,541 7,694 321,547 2,112 - 323,659
Europe 46,856 7,591 17,636 29,795 16,441 18,211 7,420 143,950 2,240 - 146,190
Rest of World 24,364 6,852 10,893 18,105 3,596 4,869 14,280 82,959 2,038 - 84,997
173,516 73,942 88,797 72,329 76,108 46,155 32,489 563,336 14,544 7,965 585,845C. Revenue by nature of
contract Fixed price and volume
based 89,378 53,462 50,425 51,799 47,055 31,843 19,847 343,809 - 6,176 349,985
Time and materials 84,138 20,480 38,372 20,530 29,053 14,312 12,642 219,527 - 1,789 221,316
Products - - - - - - - - 14,544 - 14,544
173,516 73,942 88,797 72,329 76,108 46,155 32,489 563,336 14,544 7,965 585,845
Appendix B to Ind AS 21, Foreign Currency Transactions and Advance Consideration
The Company has applied Appendix B to Ind AS 21 prospectively effective April 1,2018. The effect on adoption of the amendment on the consolidated financial statements is insignificant.
New accounting standards not yet adopted:
Certain new standards, amendments to standards and interpretations are not yet effective for annual periods beginning after April 1 2018, and have not been applied in preparing these consolidated financial statements. New standards, amendments to standards and interpretations that could have potential impact on the consolidated financial statements of the Company are:
Ind AS 116 –Leases
On March 30, 2019, Ministry of Corporate Affairs notified Ind AS 116, Leases. Ind AS 116 will replace the existing leases Standard, Ind AS 17 Leases, and related interpretations. The standard sets out the principles for the recognition, measurement, presentation and disclosure of leases. Ind AS 116 introduces a single lessee accounting model and requires a lessee to recognise assets and liabilities for all leases with a term of more than 12 months, unless the underlying asset is of low value. The Standard also contains enhanced disclosure requirements for lessees.
The standard allows for two methods of transition: the full retrospective approach, requires entities to retrospectively apply the new standard to each prior reporting period presented and the entities need to adjust equity at the beginning of the earliest comparative period presented, or the modified retrospective approach, under which the date of initial application of the new leases standard, lessees recognise the cumulative effect of initial application as an adjustment to the opening balance of equity as of annual periods beginning on or after April 1, 2019.
The Company will adopt this standard using modified retrospective method effective April 1, 2019, and accordingly, the comparative for year ended March 31, 2018 and 2019, will not be retrospectively adjusted. The Company has elected certain available practical expedients on transition.
Based on assessment, the effect of adoption as on transition date would majorly result in recognising a right-of-use assets and corresponding lease liabilities approximately ` 13,266 and ` 15,867 respectively. There will be reclassification in the cash flow categories in the statement of cash flows.
Appendix C to Ind AS 12 - Uncertainty over income tax treatments
On March 30, 2019, Ministry of Corporate Affairs issued Appendix C to Ind AS 12, which clarifies the accounting for uncertainties in income taxes. The interpretation is

Consolidated Financial Statements under Ind AS
234 Wipro Limited
to be applied to the determination of taxable profit (tax loss), tax bases, unused tax losses, unused tax credits and tax rates, when there is uncertainty over income tax treatments under Ind AS 12. The entity has to consider the probability of the relevant taxation authority accepting the tax treatment and the determination of taxable profit (tax loss), tax bases, unused tax losses, unused tax credits and tax rates would depend upon the probability. The effective date for adoption of Appendix C to Ind AS 12 is April 1, 2019. The Company will apply Appendix C to Ind AS 12 prospectively from the effective date and the effect on adoption of Appendix C to Ind AS 12 on the consolidated financial statement is insignificant.
Amendment to Ind AS 12 – Income Taxes
On March 30, 2019, Ministry of Corporate Affairs issued amendments to Ind AS 12 – Income Taxes. The amendments clarify that an entity shall recognise the income tax consequences of dividends on financial instruments classified as equity should be recognised according to where the entity originally recognised those past transactions or events that generated distributable
profits were recognised. The effective date of these amendments is annual periods beginning on or after April 1, 2019. The Company is currently assessing the impact of this amendment on the Company’s consolidated financial statements.
Amendment to Ind AS 19 - Plan Amendment, Curtailment or Settlement
On March 30, 2019, Ministry of Corporate Affairs issued amendments to Ind AS 19, ‘Employee Benefits’, in connection with accounting for plan amendments, curtailments and settlements requiring an entity to determine the current service costs and the net interest for the period after the remeasurement using the assumptions used for the remeasurement; and determine the net interest for the remaining period based on the remeasured net defined benefit liability or asset. These amendments are effective for annual reporting periods beginning on or after April 1, 2019. The Company will apply the amendment from the effective date and the effect on adoption of the amendment on the consolidated financial statement is insignificant.
4. Property, plant and equipment
Land Buildings Plant and machinery *
Furniture fixtures
Office equipment
Vehicles Total
Gross carrying value:As at April 1, 2018 ` 3,637 ` 24,949 ` 87,142 ` 9,858 ` 5,817 ` 1,139 ` 132,542Translation adjustment (5) (8) 613 2 (2) (6) 594Additions 65 2,684 10,402 1,477 474 4 15,106Disposals - (331) (5,871) (837) (381) (189) (7,609)As at March 31, 2019 ` 3,697 ` 27,294 ` 92,286 ` 10,500 ` 5,908 ` 948 ` 140,633Accumulated depreciation/ impairment:As at April 1, 2018 ` - ` 5,771 ` 65,269 ` 7,795 ` 4,093 ` 506 ` 83,434Translation adjustment - 8 332 (4) (2) (3) 331Depreciation and impairment ** - 1,031 12,295 788 575 304 14,993Disposals - (151) (4,767) (416) (331) (125) (5,790)As at March 31, 2019 - 6,659 73,129 8,163 4,335 682 92,968Net book value as at March 31, 2019 ` 3,697 ` 20,635 ` 19,157 ` 2,337 ` 1,573 ` 266 ` 47,665Gross carrying value:As at April 1, 2017 ` 3,814 ` 27,385 ` 108,887 ` 10,224 ` 5,427 ` 432 ` 156,169Translation adjustment 28 265 904 77 111 2 1,387Additions 2 1,197 11,767 1,073 703 1,003 15,745Acquisition through business combinations - 13 4 7 4 1 29Disposals - (190) (7,302) (641) (231) (294) (8,658)Assets reclassified as held for sale (207) (3,721) (27,118) (882) (197) (5) (32,130)As at March 31, 2018 ` 3,637 ` 24,949 ` 87,142 ` 9,858 ` 5,817 ` 1,139 ` 132,542

Consolidated Financial Statements under Ind AS
Annual Report 2018-19 235
Land Buildings Plant and machinery *
Furniture fixtures
Office equipment
Vehicles Total
Accumulated depreciation/ impairment:As at April 1, 2017 ` - ` 6,312 ` 76,952 ` 7,963 ` 3,910 ` 365 ` 95,502Translation adjustment - 49 509 49 55 - 662Depreciation - 1,019 14,075 846 535 387 16,862Disposals - (70) (6,640) (533) (225) (242) (7,710)Assets reclassified as held for sale (1,539) (19,627) (530) (182) (4) (21,882)As at March 31, 2018 - 5,771 65,269 7,795 4,093 506 83,434Net book value as at March 31, 2018 ` 3,637 ` 19,178 ` 21,873 ` 2,063 ` 1,724 ` 633 ` 49,108
* Including net carrying value of computer equipment and software amounting to ̀ 16,375 and ̀ 17,765 as at March 31, 2019 and 2018 respectively.
** Includes impairment charge on software platform recognised on acquisitions, amounting to ` 1,480 and Nil, for the year ended March 31, 2019 and 2018 respectively.
5. Goodwill and Other intangible assets
The movement in goodwill balance is given below:
As at March 31, 2019 March 31, 2018
Balance at the beginning of the year ` 114,046 `122,276Translation adjustment 4,307 2,952Disposal (Refer Note 21) (4,893) -Acquisition through business combination, net - 1,172Assets reclassified as held for sale (240) (12,354)Balance at the end of the year ` 113,220 `114,046
Acquisition through business combinations for the year ended March 31, 2018, includes goodwill recognised on four acquisitions. Also,Refer Note 6 to the consolidated financial statements.
The Company is organised by three operating segments: IT Services and IT Products and India State Run Enterprise. Goodwill as at March 31, 2019 and 2018 has been allocated to the IT Services operating segment.
Goodwill recognised on business combinations is allocated to Cash Generating Units (CGUs), within the IT Services operating segment,which are expected to benefit from the synergies of the acquisitions.
During the year ended March 31, 2019, the company realigned its CGUs (also Refer Note 36). Consequently, goodwill has been allocated to the new CGUs as at March 31, 2019 as follows:
CGUs March 31, 2019 Banking Financial Services and Insurance (BFSI) ` 17,713Healthcare and Life Sciences (Health BU) 50,671Consumer (CBU) 13,587Energy, Natural Resources and Utilities (ENU) 15,203Manufacturing (MFG) 5,370Technology (TECH) 9,707Communication (COMM) 970
` 113,220

Consolidated Financial Statements under Ind AS
236 Wipro Limited
Following table presents the allocation of goodwill to the CGUs for the year ended March 31, 2018:
CGUs March 31, 2018 Banking Financial Services and Insurance (BFSI) ` 17,475Healthcare and Life Sciences (HLS) 49,085Consumer (CBU) 14,776Energy, Natural Resources and Utilities (ENU) 14,863Manufacturing and Technology (MNT) 16,868Communication (COMM) 979
` 114,046
For the purpose of impairment testing, goodwill is allocated to a CGU representing the lowest level within the Group at which goodwill is monitored for internal management purposes, and which is not higher than the Company’s operating segment. Goodwill is tested for impairment at least annually in accordance with the Company’s procedure for determining the recoverable value of each CGU.
The recoverable amount of the CGU is determined on the basis of Fair Value Less Cost of Disposal (FVLCD). The FVLCD of the CGU is determined based on the market capitalisation approach, using the turnover and earnings multiples derived from observable market data. The fair value measurement is categorised as a level 2 fair value based on the inputs in the valuation techniques used.
Based on the above testing, no impairment was identified as at March 31, 2019 and 2018 as the recoverable value of the CGUs exceeded the carrying value. Further, none of the CGU’s tested for impairment as at March 31, 2019 and 2018 were at risk of impairment. An analysis of the calculation’s sensitivity to a change in the key parameters (turnover and earnings multiples), did not identify any probable scenarios where the CGU’s recoverable amount would fall below its carrying amount.
The movement in intangible assets is given below:
Intangible assetsCustomer
relatedMarketing
relatedTotal
Gross carrying value:As at April 1, 2018 ` 26,586 ` 6,551 ` 33,137Translation adjustment 555 217 772Disposal (Refer Note 21) (217) (823) (1,040)As at March 31, 2019 ` 26,924 ` 5,945 ` 32,869Accumulated depreciation/ impairment:As at April 1, 2018 ` 12,263 ` 2,761 ` 15,024Translation adjustment 35 64 99Amortisation and impairment* 3,148 1,136 4,284Disposal (Refer Note 21) (101) (199) (300)As at March 31, 2019 ` 15,345 ` 3,762 ` 19,107Net carrying value as at March 31, 2019 ` 11,579 ` 2,183 ` 13,762Gross carrying value:As at April 1, 2017 ` 20,528 ` 6,279 ` 26,807Translation adjustment 493 103 596Acquisition through business combinations 5,565 169 5,734As at March 31, 2018 26,586 6,551 33,137Accumulated depreciation/ impairment:As at April 1, 2017 ` 9,264 ` 1,621 ` 10,885Translation adjustment 14 11 25Amortisation and impairment* 2,985 1,129 4,114As at March 31, 2018 12,263 2,761 15,024Net carrying value as at March 31, 2018 ` 14,323 ` 3,790 ` 18,113

Consolidated Financial Statements under Ind AS
Annual Report 2018-19 237
* includes impairment charge on certain intangible assets recognised on acquisitions, amounting to ̀ 838 and ` 643 for the year ended March 31, 2019 and 2018, respectively.
Acquisition through business combinations for the year ended March 31, 2018, includes intangible assets recognised on four acquisitions. Also Refer Note 6 to the consolidated financial statements.
As at March 31, 2019, the estimated remaining amortisation period for intangible assets acquired on acquisition are as follows:
Acquisition Estimated remaining amortisation period
Global oil and gas information technology practice of the Commercial Business 1.25 – 2.25 years
Services Business Unit of Science Applications International CorporationPromax Application Group 3.25 years Opus Capital Markets Consultants LLC 1.75 years ATCO I-Tek 5.50 years Designit AS 1.25 years Cellent AG 1.75 – 3.75 years Appirio Inc. 2.75 years Other entities 1 – 13.25 years
6. Business combination
Summary of material acquisitions during the year ended March 31, 2018 is given below:
During the year ended March 31,2018, the Company has completed four business combinations (which both individually and in aggregate are not material) for a total consideration of ` 6,924. These transactions include (a) an acquisition of IT service provider which is focused on Brazilian markets, (b) an acquisition of a design and business strategy consultancy firm based in the United States, and (c) acquisition of intangible assets, assembled workforce and a multi-year service agreement which qualify as business combinations.
The following table presents the provisional allocation of purchase price:
Description Purchase price allocated
Net assets ` 5Customer related intangibles 5,565Other intangible assets 169Total ` 5,739Goodwill 1,185Total purchase price ` 6,924
The goodwill of ̀ 1,185 comprises value of acquired workforce and expected synergies arising from the acquisition. The goodwill was allocated among the reportable operating segments and is partially deductible for U.S. federal income tax purpose.
Net assets acquired include ` 58 of cash and cash equivalents and trade receivables valued at ` 215.
Summary of material acquisitions during the year ended March 31, 2017 is given below:
Appirio Inc.
On November 23, 2016, the Company obtained full control of Appirio Inc. (“Appirio”). Appirio is a global services company that helps customers create next-generation employee and customer experiences using latest cloud technology services. This acquisition will strengthen Wipro’s cloud application service offerings. The acquisition was consummated for a consideration of ` 32,402 (USD 475.7 million).

Consolidated Financial Statements under Ind AS
238 Wipro Limited
The following table presents the allocation of purchase price:
Description Pre-acquisition carrying amount
Fair value adjustments
Purchase price allocated
Net assets ` 526 (29) ` 497Technology platform 436 (89) 347Customer related intangibles - 2,323 2,323Brand 180 2,968 3,148Alliance relationship - 858 858Deferred tax liabilities on other intangible assets - (2,791) (2,791)Total ` 1,142 ` 3,240 ` 4,382Goodwill 28,020Total purchase price 32,402
Net assets acquired include ` 85 of cash and cash equivalents and trade receivables valued at ` 2,363.
The goodwill of ̀ 28,020 comprises value of acquired workforce and expected synergies arising from the acquisition. Goodwill is not deductible for income tax purposes.
If the acquisition had occurred on April 1, 2016, management estimates that consolidated revenue for the Company would have been ` 559,575 and the profit after taxes would have been ` 85,460 for twelve months ended March 31, 2017. The pro-forma amounts are not necessarily indicative of the results that would have occurred if the acquisition had occurred on date indicated or that may result in the future.
7. Investments
As atMarch 31, 2019 March 31, 2018
Non-currentFinancial instruments at FVTOCI Equity instruments - unquoted (Refer note 7.1) ` 6,916 ` 4,140Financial instruments at amortised cost Inter corporate and term deposits - unquoted * - 3,528
` 6,916 ` 7,668Aggregate amount of unquoted investments 6,916 7,668CurrentFinancial instruments at FVTOCI Equity instruments - unquoted (Refer note 7.1) ` - ` 1,545 Commercial papers, Certificate of deposits and bonds - unquoted
(Refer note 7.2)43,030 23,343
Non-convertible debentures and bonds - quoted (Refer note 7.3) 142,018 152,891Financial instruments at amortised cost Inter corporate and term deposits -unquoted * 21,708 24,877Financial instruments at FVTPL Investments in liquid and short-term mutual funds - unquoted
(Refer note 7.4)13,960 46,438
` 220,716 ` 249,094Aggregate amount of quoted investments and aggregate market value thereof 177,686 225,751Aggregate amount of unquoted investments 43,030 23,343
* These deposits earn a fixed rate of interest.Term deposits include deposits in lien with banks amounting to ` 463 (March 31, 2018: ` 453).
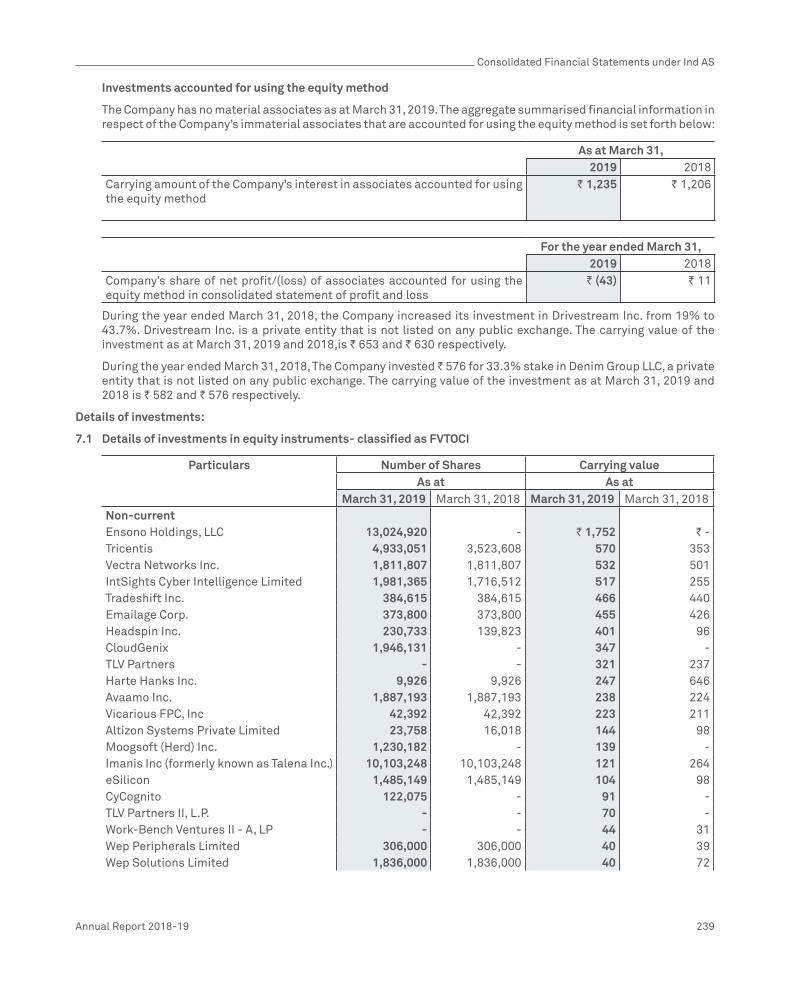
Consolidated Financial Statements under Ind AS
Annual Report 2018-19 239
Investments accounted for using the equity method
The Company has no material associates as at March 31, 2019. The aggregate summarised financial information in respect of the Company’s immaterial associates that are accounted for using the equity method is set forth below:
As at March 31, 2019 2018
Carrying amount of the Company’s interest in associates accounted for using the equity method
` 1,235 ` 1,206
For the year ended March 31, 2019 2018
Company’s share of net profit/(loss) of associates accounted for using the equity method in consolidated statement of profit and loss
` (43) ` 11
During the year ended March 31, 2018, the Company increased its investment in Drivestream Inc. from 19% to 43.7%. Drivestream Inc. is a private entity that is not listed on any public exchange. The carrying value of the investment as at March 31, 2019 and 2018,is ` 653 and ` 630 respectively.
During the year ended March 31, 2018, The Company invested ̀ 576 for 33.3% stake in Denim Group LLC, a private entity that is not listed on any public exchange. The carrying value of the investment as at March 31, 2019 and 2018 is ` 582 and ` 576 respectively.
Details of investments:
7.1 Details of investments in equity instruments- classified as FVTOCI
Particulars Number of Shares Carrying valueAs at As at
March 31, 2019 March 31, 2018 March 31, 2019 March 31, 2018Non-currentEnsono Holdings, LLC 13,024,920 - ` 1,752 ` -Tricentis 4,933,051 3,523,608 570 353Vectra Networks Inc. 1,811,807 1,811,807 532 501IntSights Cyber Intelligence Limited 1,981,365 1,716,512 517 255Tradeshift Inc. 384,615 384,615 466 440Emailage Corp. 373,800 373,800 455 426Headspin Inc. 230,733 139,823 401 96CloudGenix 1,946,131 - 347 -TLV Partners - - 321 237Harte Hanks Inc. 9,926 9,926 247 646Avaamo Inc. 1,887,193 1,887,193 238 224Vicarious FPC, Inc 42,392 42,392 223 211Altizon Systems Private Limited 23,758 16,018 144 98Moogsoft (Herd) Inc. 1,230,182 - 139 -Imanis Inc (formerly known as Talena Inc.) 10,103,248 10,103,248 121 264eSilicon 1,485,149 1,485,149 104 98CyCognito 122,075 - 91 -TLV Partners II, L.P. - - 70 -Work-Bench Ventures II - A, LP - - 44 31Wep Peripherals Limited 306,000 306,000 40 39Wep Solutions Limited 1,836,000 1,836,000 40 72

Consolidated Financial Statements under Ind AS
240 Wipro Limited
Particulars Number of Shares Carrying valueAs at As at
March 31, 2019 March 31, 2018 March 31, 2019 March 31, 2018Boldstart Ventures IV, L.P. - - 28 -Drivestream India Private Limited 267,600 267,600 19 19Wipro Airport IT Services Limited (Refer Note 21) 550,000 - 6 -Glilot Capital Partners III, L.P. - - 1 -Demisto - 330,578 - 130Mycity Technology Limited 44,935 44,935 - -
6,916 4,140CurrentOpera Solutions LLC 2,390,433 2,390,433 ` - ` 1,545Total ` 6,916 ` 5,685
7.2 Investment in certificate of deposits/ commercial papers and bonds (unquoted)– classified as FVTOCI
Particulars of issuer As atMarch 31, 2019 March 31, 2018
CurrentICICI Bank ` 11,311 ` -Kotak Mahindra Bank 9,362 -Axis Bank 4,309 -Small Industries Development Bank of India 4,302 -Kotak Mahindra Investments Limited 2,864 4,808Kotak Mahindra Prime Limited 2,585 3,333Aditya Birla Finance Limited 1,988 -Tata Capital Housing Finance Limited 1,881 -Tata Capital Financial Services Limited 1,499 -National Bank for Agriculture and Rural Development 1,000 -HDFC Bank Limited 992 -HDB Financial Services Limited 937 1,980Can Fin Homes Limited - 4,545IDFC Limited - 3,223L&T Finance Limited - 2,143LIC Housing Finance Limited - 1,532L&T Infrastructure Finance Company Limited - 931Mahindra & Mahindra Financial Services Limited - 495Bajaj Finance Limited - 299Sundaram Finance Limited - 54Total ` 43,030 ` 23,343

Consolidated Financial Statements under Ind AS
Annual Report 2018-19 241
7.3 Investment in non-convertible deposits and bonds (quoted) – classified as FVTOCI
Particulars of issuerAs at
March 31, 2019 March 31, 2018CurrentNational Highways Authority of India ` 18,055 `18,456Tata Capital Financial Services Limited 13,708 6,962National Bank for Agricultural and Rural Development 13,460 968Power Finance Corporation Limited 13,169 960HDB Financial Services Limited 13,038 10,969Aditya Birla Finance Limited 11,596 5,202Kotak Mahindra Prime Limited 10,855 10,288LIC Housing Finance Limited 7,408 21,231Housing Development Finance Corporation Limited 7,151 18,6676.79% GOI Security 2027 6,862 1,951Tata Capital Housing Finance Limited 5,765 5,045Kotak Mahindra Investments Limited 5,238 1,842Rural Electrification Corporation Limited 4,929 423Small Industries Development Bank of India 4,912 -Indian Railway Finance Corporation Limited 4,473 3,796Axis Bank 517 -HDFC Bank Limited 462 -NTPC Limited 417 427ANZ Bank 3 -Hero Fincorp Limited - 6,923Sundaram Finance Limited - 6,643L&T Finance Limited - 6,169L&T Infrastructure Finance Company Limited - 6,126Mahindra & Mahindra Financial Services Limited - 5,899L&T Housing Finance Limited - 4,986IDFC Limited - 1,569Bajaj Finance Limited - 4,238Can Fin Homes Limited - 1,904Gruh Finance Limited - 1,247Total `142,018 `152,891

Consolidated Financial Statements under Ind AS
242 Wipro Limited
7.4 Investments in liquid and short-term mutual funds - unquoted – classified as FVTPL
Particulars of Issuer Number of Units Carrying valueAs at As at
March 31, 2019 March 31, 2018 March 31, 2019 March 31, 2018CurrentHDFC Arbitrage Fund - Wholesale Plan - Monthly Dividend- Direct Plan
200,321,433 200,321,433 2,097 2,107
ABSL Overnight Fund Direct Plan Growth 1,771,126 - 1,818 -UTI Overnight Fund Direct Plan Growth 462,995 - 1,203 -SBI Overnight Fund Direct Plan Growth 388,332 - 1,201 -IDFC Arbitrage Fund – Monthly Dividend- Direct Plan
88,833,898 84,439,962 1,168 1,100
ICICI Prudential Equity Arbitrage Fund - Direct Plan - Dividend
79,919,884 75,707,299 1,158 1,093
Kotak Equity Arbitrage- Direct -Fortnight Dividend
83,782,796 83,782,796 1,972 1,974
Kotak Overnight Fund 691,520 - 700 -IDFC Overnight Fund 594,622 - 602 -ICICI Prudential Overnight Fund Direct Growth
5,864,741 - 600 -
Axis Overnight Fund 389,144 - 390 -DSP Overnight Fund Direct Growth 345,742 - 351 -Tata Overnight Fund 250,125 - 250 -L&T Cash Fund Direct Plan Growth 168,996 - 250 -HDFC Overnight Fund Direct Plan Growth 70,899 - 200 -Sundaram Money Fund - Direct Plan - Growth
- 41,277,963 - 1,512
Birla Sun Life Dynamic Bond Fund -Growth-Direct Plan
- 66,130,886 - 2,040
Religare Ultra Short-Term Fund - Institutional Growth
15 15 ^ ^
Invesco India Liquid Fund - Direct Plan - Growth
- 1,000,650 - 2,394
Birla Sun Life Short Term Fund - Growth - Direct Plan
- 27,668,990 - 1,848
Kotak Floater Short Term - Direct Plan - Growth
- 554,934 - 1,583
DHFL Low Duration Fund - Direct Plan- Growth
- 45,434,413 - 1,110
SBI Magnum Insta Cash Fund - Direct Plan - Growth
- 206,262 - 793
DHFL Pramerica Insta Cash Plus Fund - Direct Plan - Growth
- 1,995,350 - 451
DHFL Pramerica Premier Bond Fund - Direct Plan - Growth
- 11,934,961 - 344
DHFL Primerica Ultra Short-Term Fund - Direct Plan - Growth
- 65,380,107 - 1,395
DSP BlackRock Liquidity Fund - Direct Plan - Growth
- 1,328,239 - 3,301
LIC MF Liquid Fund - Direct Plan- Growth - 1,133,576 - 3,573

Consolidated Financial Statements under Ind AS
Annual Report 2018-19 243
Particulars of Issuer Number of Units Carrying valueAs at As at
March 31, 2019 March 31, 2018 March 31, 2019 March 31, 2018DSP BlackRock Money Manager Fund - Direct Plan- Growth
- 651,470 - 1,557
Axis Treasury Advantage Fund - Direct Growth
- 704,635 - 1,396
HDFC Cash Management Fund - Savings Plan - Direct Plan - Growth Option
- 166,062 - 602
HDFC Floating Rate Income Fund - Short Term Plan - Wholesale Option - Direct Plan - Dividend Reinvestment
- 17,330,061 - 527
Birla Sun Life Cash Plus - Growth-Direct Plan
- 3,227,122 - 901
L&T Liquid Fund Direct Plan - Daily Dividend Reinvestment Plan
- 596,664 - 605
ICICI Prudential Money Market Fund Direct - Growth
- 6,234,174 - 1,499
ICICI Prudential Short Term - Direct Growth
- 25,355,979 - 951
Reliance Interval Fund - Monthly Series I - IP - Dividend
15 15 ^ ^
IDFC Cash Fund-Growth-(Direct Plan) - 239,279 - 505SBI Magnum Insta Cash Fund Liquid Floater -Direct Plan- Growth
- 86,382 - 251
Franklin India Low Duration Fund - Direct - 851,573 - 17Axis Liquid Fund - Direct Plan - Growth - 1,249,174 - 2,407Franklin India Treasury Management Account Super Institutional Plan - Direct
- 239,418 - 622
Tata Money Market Fund-Direct-Daily Dividend
- 1,352,426 - 1,354
Tata Money Market Fund Direct Plan - Growth
- 193,818 - 531
Inveco India Active Income Fund DP Growth
- 124,330 - 253
UTI-Money Market Fund -Institutional Plan - Direct Plan - Growth
- 2,007,075 - 3,913
IDFC Super Saver Income Fund-Short Term Plan-Growth (Direct Plan)
- 17,085,745 - 625
UTI - Liquid Cash Plan - Institutional - Direct Plan - Growth
- 281,877 - 802
IDFC Ultra Short-Term Fund Growth (Direct Plan)
- 20,233,167 - 502
` 13,960 ` 46,438^ Value is less than ` 1

Consolidated Financial Statements under Ind AS
244 Wipro Limited
8. Financial instruments
Financial assets and liabilities (carrying value / fair value)
As atMarch 31, 2019 March 31, 2018
Assets:Cash and cash equivalents ` 158,529 ` 44,925Investments Financial instruments at FVTPL 13,960 46,438 Financial instruments at FVTOCI 191,964 181,919 Financial instruments at Amortised cost 21,708 28,405Other financial assets Trade receivables 104,862 105,436 Unbilled receivables * 22,880 42,486 Other assets 19,757 11,615Derivative assets 5,104 1,273
` 538,764 ` 462,497Liabilities:Trade payables and other payables Trade payables ` 62,660 ` 51,203 Other financial liabilities 26,288 17,983Borrowings ** 99,467 138,259Derivative liabilities 1,310 2,217
` 189,725 ` 209,662
* On account of adoption of Ind AS 115, unbilled revenues pertaining to fixed price development contracts of ` 15,038 as at March 31, 2019, has been considered as non-financial Contract assets, which are billable on completion of milestones specified in the contracts.
** Includes current obligation under borrowings classified under “Other current financial liabilities”
Offsetting financial assets and liabilities
The following table contains information on other financial assets and trade payables and other payables, subject to offsetting:
As atMarch 31, 2019 March 31, 2018
Financial Assets:Gross amount of recognised other financial assets ` 154,129 ` 165,985Gross amount of recognised trade payables and other payables set off in the consolidated balance sheet (6,630) (6,448)Net amount of other financial assets presented in the consolidated balance sheet ` 147,499 ` 159,537Financial liabilitiesTrade payables Gross amount recognised as Trade payables and other payables ` 95,578 ` 75,634Gross amount of recognised trade payables and other payables set off in the consolidated balance sheet (6,630) (6,448)Net amounts of Trade payables and other payables presented in the consolidated balance sheet ` 88,948 ` 69,186
For the financial assets and liabilities subject to offsetting or similar arrangements, each agreement between the Company and the counterparty allows for net settlement of the relevant financial assets and liabilities when both

Consolidated Financial Statements under Ind AS
Annual Report 2018-19 245
elect to settle on a net basis. In the absence of such an election, financial assets and liabilities will be settled on a gross basis and hence are not offset.
Fair value
Financial assets and liabilities include cash and cash equivalents, trade receivables, unbilled revenues, finance lease receivables, employee and other advances and eligible current and non-current assets, long and short-term loans and borrowings, finance lease payables, bank overdrafts, trade payable, eligible current liabilities and non-current liabilities.
The fair value of cash and cash equivalents, trade receivables, unbilled revenues, borrowings, trade payables, other current financial assets and liabilities approximate their carrying amount largely due to the short-term nature of these instruments. The Company’s long-term debt has been contracted at market rates of interest. Accordingly, the carrying value of such long-term debt approximates fair value. Further, finance lease receivables that are overdue are periodically evaluated based on individual credit worthiness of customers. Based on this evaluation, the Company records allowance for estimated losses on these receivables. As at March 31, 2019 and 2018, the carrying value of such receivables, net of allowances approximates the fair value.
Investments in liquid and short-term mutual funds, which are classified as FVTPL are measured using net asset values at the reporting date multiplied by the quantity held. Fair value of investments in commercial papers, certificate of deposits and bonds classified as FVTOCI is determined based on the indicative quotes of price and yields prevailing in the market at the reporting date. Fair value of investments in equity instruments classified as FVTOCI is determined using market and income approaches.
The fair value of derivative financial instruments is determined based on observable market inputs including currency spot and forward rates, yield curves, currency volatility etc.
Fair value hierarchy
The table below analyses financial instruments carried at fair value, by valuation method. The different levels have been defined as follows:
Level 1 – Quoted prices (unadjusted) in active markets for identical assets or liabilities.
Level 2 – Inputs other than quoted prices included within Level 1 that are observable for the asset or liability, either directly (i.e. as prices) or indirectly (i.e. derived from prices).
Level 3 – Inputs for the assets or liabilities that are not based on observable market data (unobservable inputs).
The following table presents fair value of hierarchy of assets and liabilities measured at fair value on a recurring basis:
Particulars As at March 31, 2019 As at March 31, 2018 Fair value measurements
at reporting date Fair value measurements
at reporting date Total Level 1 Level 2 Level 3 Total Level 1 Level 2 Level 3
AssetsDerivative instruments: Cash flow hedges 3,149 - 3,149 - 1,139 - 1,139 - Others 1,955 - 1,955 - 134 - 134 -Investments:Investment in liquid and short-term mutual funds 13,960 13,960 - - 46,438 46,438 - -Investment in equity instruments 6,916 - 248 6,668 5,685 - - 5,685Commercial paper, Certificate of deposits and bonds 185,048 6,865 178,183 - 176,234 1,951 174,283 -Liabilities Derivative instruments: Cash flow hedges (130) - (130) - (1,276) - (1,276) - Others (1,180) - (1,180) - (941) - (941) -

Consolidated Financial Statements under Ind AS
246 Wipro Limited
The following methods and assumptions were used to estimate the fair value of the level 2 financial instruments included in the above table.
Derivative instruments (assets and liabilities): The Company enters into derivative financial instruments with various counter-parties, primarily banks with investment grade credit ratings. Derivatives valued using valuation techniques with market observable inputs are mainly interest rate swaps, foreign exchange forward contracts and foreign exchange option contracts. The most frequently applied valuation techniques include forward pricing, swap models and Black Scholes models (for option valuation), using present value calculations. The models incorporate various inputs including the credit quality of counterparties, foreign exchange spot and forward rates, interest rate curves and forward rate curves of the underlying. As at March 31, 2019, the changes in counterparty credit risk had no material effect on the hedge effectiveness assessment for derivatives designated in hedge relationships and other financial instruments recognised at fair value.
Investment in commercial papers, certificate of deposits and bonds: Fair value of these instruments is derived based on the indicative quotes of price and yields prevailing in the market as at reporting date.
Details of assets and liabilities considered under Level 3 classification
Particulars Investment in equity
instruments
Derivative Assets - others
Liabilities - Contingent
consideration Balance as at April 1, 2018 5,685 - -Additions 2,869 - -Transfers out of level 3 (647) - -Disposal (1,341) - -Gain/loss recognised in foreign currency translation reserve 203 - -Gain/loss recognised in other comprehensive income (101) - -Balance as at March 31, 2019 6,668 - -Balance as at April 1, 2017 5,303 426 (339)Additions 1,851 - -Payouts - - 164Transferred to Investments accounted for using the equity method
(357) - -
Gain/loss recognised in consolidated statement of profit and loss
- (426) 167
Gain/loss recognised in foreign currency translation reserve 53 - (32)Gain/loss recognised in other comprehensive income (1,165) - -Finance expense recognised in consolidated statement of profit and loss
- - 40
Balance as at March 31, 2018 5,685 - -
Description of significant unobservable inputs to valuation:
As at March 31, 2019
Items Valuation technique
Significant unobservable input
Movement by
Increase (`)
Decrease (`)
Unquoted equity Discounted Long term growth rate 0.5% 201 (187)investments cash flow model Discount rate 0.5% (243) 256
As at March 31, 2018
Items Valuation technique
Significant unobservable input
Movement by
Increase (`)
Decrease (`)
Unquoted equity Third party quote Revenue achievement 1.0% 18 (18)investments*
* Carrying value of ` 1,545 as at March 31, 2018.

Consolidated Financial Statements under Ind AS
Annual Report 2018-19 247
Derivative assets and liabilities:
The Company is exposed to foreign currency fluctuations on foreign currency assets / liabilities, forecasted cash flows denominated in foreign currency and net investment in foreign operations. The Company follows established risk management policies, including the use of derivatives to hedge foreign currency assets / liabilities, foreign currency forecasted cash flows and net investment in foreign operations. The counter parties in these derivative instruments are primarily banks and the Company considers the risks of non-performance by the counterparty as non-material.
The following table presents the aggregate contracted principal amounts of the Company’s derivative contracts outstanding:
(in million)
As atMarch 31, 2019 March 31, 2018
Notional Fair value Notional Fair valueDesignated derivatives instrumentsSell: Forward contracts USD 333 ` 1,410 USD 904 ` 951
€ - - € 134 ` (531)£ - - £ 147 ` (667)AUD 97 ` 15 AUD 77 ` 29
Range forward options contracts USD 1,067 ` 1,149 USD 182 ` 5£ 191 ` 68 £ 13 ` 5€ 153 ` 349 € 10 ` 2AUD 56 ` 39 AUD - -
Interest rate swaps USD 75 ` (11) USD 75 ` (7)
Non-designated derivatives instrumentsSell: Forward contracts USD 1,182 ` 1,359 USD 939 ` (360)
€ 32 ` 55 € 58 ` 6£ 1 ` (1) £ 95 ` (56)AUD 82 ` 28 AUD 77 ` 68SGD 11 ` 1 SGD 6 ` (1)ZAR 56 ` 14 ZAR 132 ` (16)CAD 56 ` 40 CAD 14 ` 32SAR 123 (1) SAR 62 ^ AED 9 ^ AED 8 ^ PLN 38 ` 15 PLN 36 ` 12CHF 10 ^ CHF 6 ` 3QAR 3 ` (1) QAR 11 ` (3)TRY 28 ` 12 TRY 10 ` 8MXN - - MXN 61 ` (6)NOK 29 ` 4 NOK 34 ` 3OMR 1 ` (1) OMR 3 ` (1)SEK 35 ` 5
Range forward options contracts USD 150 ` 161 USD 50 ` (6)€ 31 ` 12 € - -£ 71 ` 57 £ 20 ` (2)
Buy: Forward contracts USD 730 ` (971) USD 575 ` (417)JPY 154 ^ JPY 399 ` 6MXN 9 ^ MXN - -DKK 75 ` (13) DKK 9 ` (1)
^ Value is less than ` 1
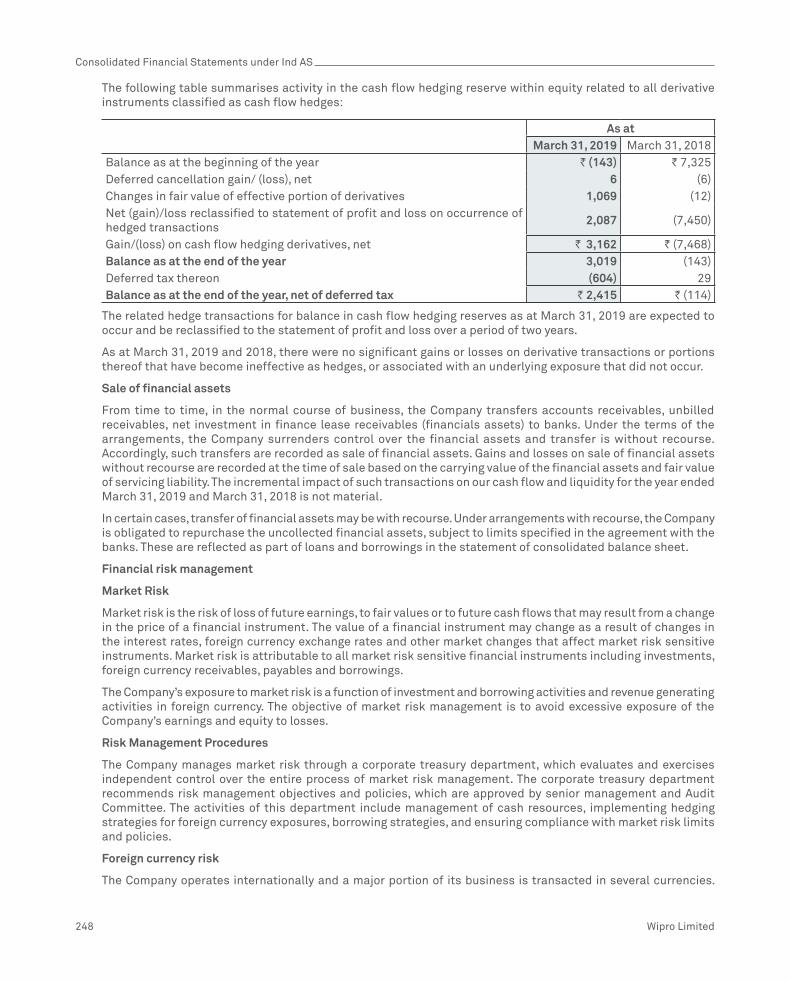
Consolidated Financial Statements under Ind AS
248 Wipro Limited
The following table summarises activity in the cash flow hedging reserve within equity related to all derivative instruments classified as cash flow hedges:
As atMarch 31, 2019 March 31, 2018
Balance as at the beginning of the year ` (143) ` 7,325Deferred cancellation gain/ (loss), net 6 (6)Changes in fair value of effective portion of derivatives 1,069 (12)Net (gain)/loss reclassified to statement of profit and loss on occurrence of hedged transactions
2,087 (7,450)
Gain/(loss) on cash flow hedging derivatives, net ` 3,162 ` (7,468)Balance as at the end of the year 3,019 (143)Deferred tax thereon (604) 29Balance as at the end of the year, net of deferred tax ` 2,415 ` (114)
The related hedge transactions for balance in cash flow hedging reserves as at March 31, 2019 are expected to occur and be reclassified to the statement of profit and loss over a period of two years.
As at March 31, 2019 and 2018, there were no significant gains or losses on derivative transactions or portions thereof that have become ineffective as hedges, or associated with an underlying exposure that did not occur.
Sale of financial assets
From time to time, in the normal course of business, the Company transfers accounts receivables, unbilled receivables, net investment in finance lease receivables (financials assets) to banks. Under the terms of the arrangements, the Company surrenders control over the financial assets and transfer is without recourse. Accordingly, such transfers are recorded as sale of financial assets. Gains and losses on sale of financial assets without recourse are recorded at the time of sale based on the carrying value of the financial assets and fair value of servicing liability. The incremental impact of such transactions on our cash flow and liquidity for the year ended March 31, 2019 and March 31, 2018 is not material.
In certain cases, transfer of financial assets may be with recourse. Under arrangements with recourse, the Company is obligated to repurchase the uncollected financial assets, subject to limits specified in the agreement with the banks. These are reflected as part of loans and borrowings in the statement of consolidated balance sheet.
Financial risk management
Market Risk
Market risk is the risk of loss of future earnings, to fair values or to future cash flows that may result from a change in the price of a financial instrument. The value of a financial instrument may change as a result of changes in the interest rates, foreign currency exchange rates and other market changes that affect market risk sensitive instruments. Market risk is attributable to all market risk sensitive financial instruments including investments, foreign currency receivables, payables and borrowings.
The Company’s exposure to market risk is a function of investment and borrowing activities and revenue generating activities in foreign currency. The objective of market risk management is to avoid excessive exposure of the Company’s earnings and equity to losses.
Risk Management Procedures
The Company manages market risk through a corporate treasury department, which evaluates and exercises independent control over the entire process of market risk management. The corporate treasury department recommends risk management objectives and policies, which are approved by senior management and Audit Committee. The activities of this department include management of cash resources, implementing hedging strategies for foreign currency exposures, borrowing strategies, and ensuring compliance with market risk limits and policies.
Foreign currency risk
The Company operates internationally and a major portion of its business is transacted in several currencies.

Consolidated Financial Statements under Ind AS
Annual Report 2018-19 249
Consequently, the Company is exposed to foreign exchange risk through receiving payment for sales and services in the United States and elsewhere, and making purchases from overseas suppliers in various foreign currencies. The exchange rate risk primarily arises from foreign exchange revenue, receivables, cash balances, forecasted cash flows, payables and foreign currency loans and borrowings. A significant portion of the Company’s revenue is in the U.S. Dollar, the United Kingdom Pound Sterling, the Euro, the Canadian Dollar and the Australian Dollar, while a large portion of costs are in Indian rupees. The exchange rate between the rupee and these currencies has fluctuated significantly in recent years and may continue to fluctuate in the future. Appreciation of the rupee against these currencies can adversely affect the Company’s results of operations.
The Company evaluates exchange rate exposure arising from these transactions and enters into foreign currency derivative instruments to mitigate such exposure. The Company follows established risk management policies, including the use of derivatives like foreign exchange forward/option contracts to hedge forecasted cash flows denominated in foreign currency.
The Company has designated certain derivative instruments as cash flow hedges to mitigate the foreign exchange exposure of forecasted highly probable cash flows. The Company has also designated foreign currency borrowings as hedge against respective net investments in foreign operations.
As at March 31, 2019 and 2018 respectively, a ` 1 increase/decrease in the spot exchange rate of the Indian rupee with the U.S. dollar would result in approximately ` 2,002 (consolidated statement of profit and loss ` 602 and other comprehensive income ` 1,400) and ` 1,500 (consolidated statement of profit and loss ` 414 and other comprehensive income ` 1,086) decrease/increase in the fair value of foreign currency dollar denominated derivative instruments.
The below table presents foreign currency risk from non-derivative financial instruments as at March 31, 2019 and 2018:
Particulars As at March 31, 2019 US $ Euro Pound
Sterling Australian
Dollar Canadian
Dollar Other
currencies# Total
Trade receivables ` 39,896 ` 8,030 ` 5,212 ` 3,542 ` 1,528 ` 3,880 ` 62,088Unbilled receivables 8,038 1,609 3,146 1,225 204 743 14,965Contract assets 4,706 1,445 2,270 836 150 598 10,005Cash and cash equivalents 21,997 2,884 1,573 1,003 1,928 2,204 31,589Other assets 8,553 1,173 4,056 1,038 1,033 4,544 20,397Borrowings* (50,516) (20) (21) (33) - (21) (50,611)Trade payables and other financial liabilities (27,202) (5,779) (4,646) (1,526) (806) (2,787) (42,746)Net assets/ (liabilities) ` 5,472 ` 9,342 ` 11,590 ` 6,085 ` 4,037 ` 9,161 ` 45,687
Particulars As at March 31, 2018 US $ Euro Pound
Sterling Australian
Dollar Canadian
Dollar Other
currencies# Total
Trade receivables ` 32,948 ` 7,273 ` 6,585 ` 3,459 ` 990 ` 3,651 ` 54,906Unbilled revenues 13,893 2,571 5,189 2,094 338 1,609 25,694Cash and cash equivalents 9,144 3,791 1,685 786 34 2,241 17,681Other assets 13,796 1,993 4,061 1,164 940 4,459 26,413Borrowings* (49,257) (41) (37) (165) - (137) (49,637)Trade payables and other financial liabilities (23,561) (3,962) (5,958) (1,516) (652) (2,942) (38,591)Net assets/ (liabilities) ` (3,037) ` 11,625 ` 11,525 ` 5,822 ` 1,650 ` 8,881 ` 36,466
# Other currencies reflect currencies such as Saudi Riyal, Singapore Dollars, Danish Krone, etc.
* Includes current obligation under borrowings classified under “Other current financial liabilities”

Consolidated Financial Statements under Ind AS
250 Wipro Limited
As at March 31, 2019 and 2018, respectively, every 1% increase/decrease of the respective foreign currencies compared to functional currency of the Company would impact results by approximately ` 457 and ` 365, respectively.
Interest rate risk
Interest rate risk primarily arises from floating rate borrowing, including various revolving and other lines of credit. The Company’s investments are primarily in short-term investments, which do not expose it to significant interest rate risk. The Company manages its net exposure to interest rate risk relating to borrowings by entering into interest rate swap agreements, which allows it to exchange periodic payments based on a notional amount and agreed upon fixed and floating interest rates. Certain borrowings are also transacted at fixed interest rates. If interest rates were to increase by 100 bps from March 31, 2019, additional net annual interest expense on floating rate borrowing would amount to approximately ` 866.
Credit risk
Credit risk arises from the possibility that customers may not be able to settle their obligations as agreed. To manage this, the Company periodically assesses the financial reliability of customers, taking into account the financial condition, current economic trends, analysis of historical bad debts and ageing of accounts receivable. Individual risk limits are set accordingly. No single customer accounted for more than 10% of the accounts receivable as of March 31, 2019 and 2018, respectively and revenues for the year ended March 31, 2019 and 2018, respectively. There is no significant concentration of credit risk.
Counterparty risk
Counterparty risk encompasses issuer risk on marketable securities, settlement risk on derivative and money market contracts and credit risk on cash and time deposits. Issuer risk is minimised by only buying securities which are at least AA rated in India based on Indian rating agencies. Settlement and credit risk is reduced by the policy of entering into transactions with counterparties that are usually banks or financial institutions with acceptable credit ratings. Exposure to these risks are closely monitored and maintained within predetermined parameters. There are limits on credit exposure to any financial institution. The limits are regularly assessed and determined based upon credit analysis including financial statements and capital adequacy ratio reviews.
Liquidity risk
Liquidity risk is defined as the risk that the Company will not be able to settle or meet its obligations on time or at a reasonable price. The Company’s corporate treasury department is responsible for liquidity and funding as well as settlement management. In addition, processes and policies related to such risks are overseen by senior management. Management monitors the Company’s net liquidity position through rolling forecasts on the basis of expected cash flows. As of March 31, 2019, cash and cash equivalents are held with major banks and financial institutions.
The table below provides details regarding the remaining contractual maturities of significant financial liabilities at the reporting date. The amounts include estimated interest payments and exclude the impact of netting agreements, if any.
As at March 31, 2019 Contractual cash flows Carrying
value Less than
1 year 1-2 years 2-4 years 4-7 years Total
Borrowings * ` 99,467 ` 73,559 ` 24,887 ` 4,309 ` - ` 102,755Trade payables and Other financial liabilities *
88,948 88,948 - - - 88,948
Derivative liabilities 1,310 1,310 - - - 1,310
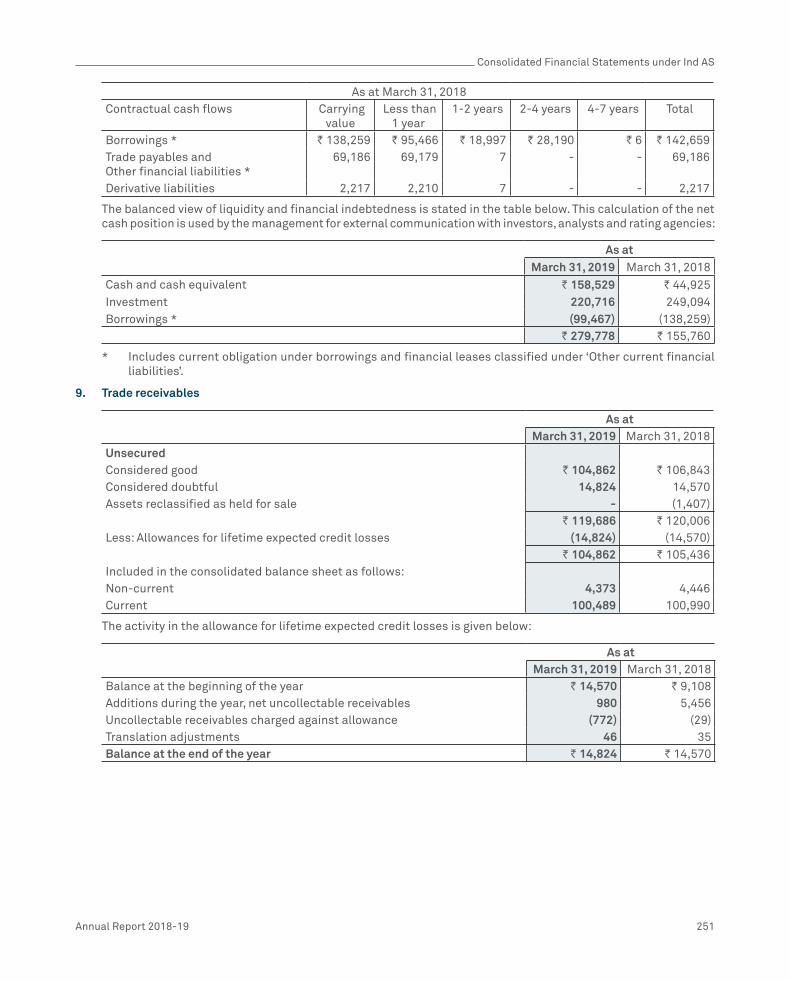
Consolidated Financial Statements under Ind AS
Annual Report 2018-19 251
As at March 31, 2018 Contractual cash flows Carrying
value Less than
1 year 1-2 years 2-4 years 4-7 years Total
Borrowings * ` 138,259 ` 95,466 ` 18,997 ` 28,190 ` 6 ` 142,659Trade payables and Other financial liabilities *
69,186 69,179 7 - - 69,186
Derivative liabilities 2,217 2,210 7 - - 2,217
The balanced view of liquidity and financial indebtedness is stated in the table below. This calculation of the net cash position is used by the management for external communication with investors, analysts and rating agencies:
As atMarch 31, 2019 March 31, 2018
Cash and cash equivalent ` 158,529 ` 44,925Investment 220,716 249,094Borrowings * (99,467) (138,259)
` 279,778 ` 155,760
* Includes current obligation under borrowings and financial leases classified under ‘Other current financial liabilities’.
9. Trade receivables
As atMarch 31, 2019 March 31, 2018
UnsecuredConsidered good ` 104,862 ` 106,843Considered doubtful 14,824 14,570Assets reclassified as held for sale - (1,407)
` 119,686 ` 120,006Less: Allowances for lifetime expected credit losses (14,824) (14,570)
` 104,862 ` 105,436Included in the consolidated balance sheet as follows:Non-current 4,373 4,446Current 100,489 100,990
The activity in the allowance for lifetime expected credit losses is given below:
As atMarch 31, 2019 March 31, 2018
Balance at the beginning of the year ` 14,570 ` 9,108Additions during the year, net uncollectable receivables 980 5,456Uncollectable receivables charged against allowance (772) (29)Translation adjustments 46 35Balance at the end of the year ` 14,824 ` 14,570

Consolidated Financial Statements under Ind AS
252 Wipro Limited
10. Other Financial Assets
As atMarch 31, 2019 March 31, 2018
Non-currentSecurity deposits ` 1,436 ` 1,197Other deposits 777 250Interest receivables 1,139 -Finance lease receivables 1,794 2,739
` 5,146 ` 4,186CurrentSecurity Deposits ` 1,050 ` 1,238Other deposits 33 59Due from officers and employees 738 697Finance lease receivables 1,618 2,271Others 11,172 3,164Considered doubtful 854 815
` 15,465 ` 8,244Less : Provision for doubtful advances (854) (815)
` 14,611 ` 7,429Total ` 19,757 ` 11,615
The activities in the provision for doubtful advances is given below:
As atMarch 31, 2019 March 31, 2018
Balance at the beginning of the year ` 815 ` 492Addition during the year, net 243 409Reversals/Uncollectable advances charged against allowance (204) (86)Balance at the end of the year ` 854 ` 815
11. Other assets
As atMarch 31, 2019 March 31, 2018
Non-currentPrepaid expenses including rentals for leasehold land ` 6,323 ` 7,602Cost to obtain contract 4,212Capital advances 1,355 1,389Others 5,337 4,468Assets reclassified as held for sale - (530)
` 17,227 ` 12,929CurrentPrepaid expenses ` 12,148 ` 14,407Due from officers and employees 871 1,175Advances to suppliers 3,247 1,819Deferred contract costs - 3,211Balance with excise, customs and other authorities 5,543 3,886Cost to obtain contract 1,170 -Others 107 50Assets reclassified as held for sale - (1,381)
` 23,086 ` 23,167Total ` 40,313 ` 36,096

Consolidated Financial Statements under Ind AS
Annual Report 2018-19 253
12. Inventories
As atMarch 31, 2019 March 31, 2018
Finished goods [including goods-in-transit - ` 1 (` 3 for March 31, 2018)] ` 3 ` 3Traded goods 3,273 2,600Stores and spares 675 767
` 3,951 ` 3,370
13. Cash and cash equivalents
Cash and cash equivalents as of March 31, 2019 and 2018 consists of cash and balances on deposit with banks. Cash and cash equivalents consist of the following:
As atMarch 31, 2019 March 31, 2018
Balances with banks Current accounts ` 29,087 ` 23,005 Unclaimed dividend - 43 Demand deposits * 116,563 21,625Cheques, drafts on hand 12,879 251Cash in hand - 1
` 158,529 ` 44,925
* These deposits can be withdrawn by the Company at any time without prior notice and without any penalty on the principal.
Cash and cash equivalents consist of the following for the purpose of the cash flow statement:
As atMarch 31, 2019 March 31, 2018
Cash and cash equivalents (as above) ` 158,529 ` 44,925Bank overdrafts (4) (3,999)
` 158,525 ` 40,926
14. Share Capital
As atMarch 31, 2019 March 31, 2018
Authorised capital12,504,500,000 (March 31, 2018: 5,500,000,000) equity shares [Par value of ` 2 per share]
` 25,009 ` 11,000
25,000,000 (March 31, 2018: 25,000,000) preference shares [Par value of ` 10 per share]
250 250
150,000 (March 31, 2018:1,50,000) 10% Optionally convertible cumulative preference shares [Par value of ` 100 per share]
15 15
` 25,274 ` 11,265Issued, subscribed and fully paid-up capital6,033,935,388 (March 31, 2018: 4,523,784,491) equity shares of ` 2 each 12,068 9,048
` 12,068 ` 9,048
Terms / Rights attached to equity shares
The Company has only one class of equity shares having a par value of ` 2 per share. Each shareholder of equity shares is entitled to one vote per share. The Company declares and pays dividend in Indian Rupees. The dividend proposed by the Board of Directors is subject to shareholders approval in the ensuing Annual General Meeting.

Consolidated Financial Statements under Ind AS
254 Wipro Limited
Following is the summary of per share dividends recognised as distributions to equity shareholders:
For the year endedMarch 31, 2019 March 31, 2018
Interim dividend ` 1 ` 1
In the event of liquidation of the Company, the equity shareholders will be entitled to receive the remaining assets of the Company, after distribution of all preferential amounts, if any, in proportion to the number of equity shares held by the shareholders.
i. Reconciliation of number of shares
As at March 31, 2019 As at March 31, 2018No. of Shares ` Million No. of Shares ` Million
Opening number of equity shares / American Depository Receipts (ADRs) outstanding 4,523,784,491 9,048 2,430,900,565 4,861Equity shares issued pursuant to Employee Stock Option Plan * 1,681,717 4 3,559,599 8Issue of bonus shares (Refer Note 33) 1,508,469,180 3,016 2,433,074,327 4,866Buyback of equity shares (Refer Note 33) - - (343,750,000) (687)Closing number of equity shares / ADRs outstanding 6,033,935,388 12,068 4,523,784,491 9,048
* 2,599,183 shares have been transferred by the controlled trust to eligible employees on exercise of options during the year ended March 31, 2019
ii. Details of shareholders holding more than 5% of the total equity shares of the Company
Name of the Shareholder As at March 31, 2019 As at March 31, 2018No. of Shares % held No. of Shares % held
Mr. Azim Hasham Premji Partner representing Hasham Traders
989,215,999 16.39 741,912,000 16.40
Mr. Azim Hasham Premji Partner representing Prazim Traders
1,187,751,441 19.68 890,813,582 19.69
Mr. Azim Hasham Premji Partner representing Zash Traders
1,204,319,438 19.96 903,239,580 19.97
Azim Premji Trust 797,948,834 13.22 618,461,626 13.67
iii. Other details of equity shares for a period of five years immediately preceding March 31, 2019
(a) 1,508,469,180 bonus shares and 2,433,074,327 bonus shares were issued during the year ended March 31, 2019 and 2018 respectively. Refer note 33.
(b) 343,750,000 equity shares and 40,000,000 equity shares were bought back by the company during the year ended March 31, 2018 and 2017 respectively. Refer note 33.
iv. Shares reserved for issue under option
For details of shares reserved for issue under the employee stock option plan of the Company, Refer Note 30.

Consolidated Financial Statements under Ind AS
Annual Report 2018-19 255
15. Borrowings
As atMarch 31, 2019 March 31, 2018
Non-currentSecured Obligations under finance leases * ` 496 ` 2,438 Less: Liabilities directly associated with assets held for sale - (716)
` 496 ` 1,722UnsecuredTerm loans: External commercial borrowing** ` - ` - Borrowings from banks 27,666 43,070 Loans from institutions other than banks 206 476
27,872 43,546Total Non-current ` 28,368 ` 45,268CurrentUnsecured Bank overdrafts ` 4 ` 3,999 Borrowings from Banks *** 68,041 75,597 Loans from institutions other than banks **** 40 2Total Current ` 68,085 ` 79,598Total Borrowings ` 96,453 ` 124,866
* Current obligations under financial leases amounting to ` 1,506 (March 31, 2018: ` 3,004) is classified under “Other current financial liabilities”.
** Current obligations under external commercial borrowings amounting to Nil (March 31, 2018: ` 9,777) is classified under “Other current financial liabilities”.
*** Current obligations under borrowings from banks amounting to ̀ 1,272 (March 31, 2018: ̀ 1,022) is classified under “Other current financial liabilities”.
**** Current maturities of loans from institutions other than bank amounting to ` 236 (March 31, 2018: ` 343) is classified under “Other current financial liabilities”.
Short-term borrowings
The Company had short-term borrowings including bank overdrafts amounting to ` 68,085 and ` 79,598 as at March 31, 2019 and 2018 respectively. The principal source of Short-term borrowings from banks as of March 31, 2019 primarily consists of lines of credit of approximately ` 7,979 million, U.S. Dollar (U.S.$) 1,410 million, Canadian Dollar (CAD) 57 million, EURO 20 million and Indonesian Rupiah (IDR) 13,000 million from bankers for working capital requirements and other short term needs. As of March 31, 2019, the Company has unutilised lines of credit aggregating U.S.$ 440 million, EURO 20 million, CAD 38 million, ` 7,957 million and IDR 13,000 million. To utilise these unused lines of credit, the Company requires consent of the lender and compliance with certain financial covenants. Significant portion of these lines of credit are revolving credit facilities and floating rate foreign currency loans, renewable on a periodic basis. Significant portion of these facilities bear floating rates of interest, referenced to LIBOR and a spread, determined based on market conditions.
The Company has non-fund based revolving credit facilities in various currencies equivalent to ` 40,470 and ` 44,022 as of March 31, 2019 and 2018, respectively, towards operational requirements that can be used for the issuance of letters of credit and bank guarantees. As of March 31, 2019, and 2018, an amount of ` 22,014 and ` 22,476,respectively, was unutilised out of these non-fund based facilities.

Consolidated Financial Statements under Ind AS
256 Wipro Limited
Long-term loans and borrowings
A summary of long- term loans and borrowings is as follows:
Currency As at March 31, 2019 As at March 31, 2018 Foreign
currency in millions
Indian Rupee
Interest rate Final maturity Foreign currency in
millions
Indian Rupee
Unsecured external commercial borrowing U.S. Dollar - - - - 150 9,777Unsecured term loans USD 382 26,395 3.01% - 3.81% July 2021 625 40,715 Canadian Dollar (CAD) 52 2,701 1.48% - 3.26% July 2021 72 3,660 Indian Rupee - 162 8.29% - 9.35% December 2021 NA 366 Australian Dollar (AUD) 1 70 4.65% January 2022 2 92 Great British Pound (GBP) ^ 31 2.93% February 2022 ^ 42 Euro ^ 19 2.98% December 2020 ^ 24 Brazilian Real (BRL) ^ 2 14.04% May 2019 1 12
` 29,380 ` 54,688Obligations under finance leases
2,002 5,442
Liabilities directly associated with assets held for sale
- - (1,469)
`31,382 `58,661Non-current portion of long term loans and borrowings
28,368 45,268
Current portion of long term loans and borrowings
3,014 13,393
^ Value is less than ` 1
Changes in financing liabilities arising from cash and non-cash changes:
April 1, 2018
Cash flow
Non-cash changes March 31, 2019 Assets taken
on financial lease
Foreign exchange
movements Borrowings from banks ` 119,689 ` (26,228) ` - ` 3,518 ` 96,979Bank overdrafts 3,999 (3,995) - - 4External commercial borrowings
9,777 (10,064) - 287 -
Obligations under finance leases (Refer Note 32)
3,973 (2,234) 14 249 2,002
Loans from other than bank 821 (352) - 13 482` 138,259 ` (42,873) ` 14 ` 4,067 ` 99,467

Consolidated Financial Statements under Ind AS
Annual Report 2018-19 257
April 1, 2017
Cash flow
Non-cash changes March 31, 2018 Assets
taken on financial
lease
Foreign exchange
movements
Less: Liabilities directly associated
with assets held for sale
Borrowings from banks ` 120,911 ` (6,661) ` - ` 5,439 ` - ` 119,689Bank overdrafts 1,992 2,007 - - - 3,999External commercial borrowings 9,728 - - 49 - 9,777Obligations under finance leases (Refer Note 32) 8,280 (3,627) 766 23 (1,469) 3,973Loans from other than bank 1,501 (695) - 15 - 821
` 142,412 ` (8,976) ` 766 ` 5,526 ` (1,469) ` 138,259
The terms of the other secured and unsecured loans and borrowings also contain certain restrictive covenants primarily requiring the Company to maintain certain financial ratios. As of March 31, 2019 and 2018 the Company has met all the covenants under these arrangements.
Obligations under finance leases amounting to ` 2,002 and ` 5,442 as at March 31, 2019 and 2018 respectively, are secured by underlying property, plant and equipment.
Interest expense on borrowings was ` 4,058 and ` 3,045 for the year ended March 31, 2019 and 2018 respectively.
16. Other financial liabilities
As atMarch 31, 2019 March 31, 2018
Non-currentDeposits and others ` - ` 7
` - ` 7CurrentSalary payable ` 25,644 ` 16,926Current maturities of long term borrowings * 1,508 11,142Current maturities of obligation under finance lease * 1,506 3,004Interest accrued but not due on borrowing 166 336Unclaimed dividends 93 43Deposits and others 385 671Liabilities directly associated with assets held for sale - (753)
` 29,302 ` 31,369Total ` 29,302 ` 31,376
* For rate of interest and other terms and conditions, refer to note 15.

Consolidated Financial Statements under Ind AS
258 Wipro Limited
17. Provisions
As atMarch 31, 2019 March 31, 2018
Non-currentEmployee benefits obligations ` 2,082 ` 1,791Provision for warranty 2 3
` 2,084 ` 1,794CurrentEmployee benefits obligations ` 10,065 ` 8,535Provision for warranty 275 290Others 717 878
` 11,057 ` 9,703Total ` 13,141 ` 11,497
Provision for warranty represents cost associated with providing sales support services which are accrued at the time of recognition of revenues and are expected to be utilised over a period of 1 to 2 years. Other provisions primarily include provisions for indirect tax related contingencies and litigations. The timing of cash outflows in respect of such provision cannot be reasonably determined.
Particulars
As at March 31, 2019 As at March 31, 2018 Provision
for warranty Others Total
Provision for
warranty Others Total Provision at the beginning of the year ` 293 ` 878 ` 1,171 ` 440 ` 1,197 ` 1,637Additions during the year, net 295 620 915 317 17 334Utilised/ reversed during the year (311) (781) (1,092) (464) (336) (800)Provision at the end of the year ` 277 ` 717 ` 994 ` 293 ` 878 ` 1,171Included in the consolidated balance sheet as follows:Non-current portion ` 2 ` - ` 2 ` 3 ` - ` 3Current portion 275 717 992 290 878 1,168
18. Other liabilities
As atMarch 31, 2019 March 31, 2018
Non-currentOthers ` 3,176 ` 2,440Liabilities directly associated with assets held for sale - (8)
` 3,176 ` 2,432CurrentStatutory and other liabilities ` 5,430 ` 4,263Advance from customers 1,361 1,901Others 836 769Liabilities directly associated with assets held for sale - (277)
` 7,627 ` 6,656Total ` 10,803 ` 9,088

Consolidated Financial Statements under Ind AS
Annual Report 2018-19 259
19. Trade payables
As atMarch 31, 2019 March 31, 2018
Trade payables ` 62,660 ` 53,112Liabilities directly associated with assets held for sale - (1,909)
` 62,660 ` 51,203
Trade payables includes due to suppliers under The Micro, Small and Medium Enterprises Development Act, 2006, [MSMED Act] as at March 31, 2019 and March 31, 2018. The disclosure pursuant to the said Act is as under:
Particulars As atMarch 31, 2019 March 31, 2018
Principal amount remaining unpaid ` 37 ` 39Interest due thereon remaining unpaid 1 ^ Interest paid by the Company in terms of Section 16 of the MSMED Act, along with the amount of the payment made to the supplier beyond the appointed day
437 197
Interest due and payable for the period of delay in making payment (which have been paid but beyond the appointed day during the period) but without adding interest specified under the MSMED Act
^ -
Interest accrued and remaining unpaid 4 14Interest remaining due and payable even in the succeeding years, until such date when the interest dues as above are actually paid to the small enterprises
1 ^
^ Value is less than ` 1
This information has been determined to the extent such parties have been identified on the basis of information available with the Company.
20. Revenue from operations
Year ended March 31, 2019 March 31, 2018
Sale of Services ` 571,301 ` 524,543 Sales of Products 14,544 20,328
` 585,845 ` 544,871
21. Other operating income
Sale of hosted data center services business: During the year ended March 31, 2019, the Company has concluded the divestment of its hosted data center services business.
The calculation of the gain on sale is shown below:
Particulars TotalCash considerations (net of disposal costs ` 660) ` 25,432Less: Carrying amount of net assets disposed (including goodwill of ` 13,009) (26,455)Add: Reclassification of exchange difference on foreign currency translation 4,131Gain on sale ` 3,108
In accordance with the sale agreement, total cash consideration is ` 28,124 and the Company paid ` 3,766 to subscribe for units issued by the buyer. Units amounting to ` 2,032 are callable by the buyer if certain business targets committed by the Company are not met over a period of three years. The fair value of these callable units is estimated to be insignificant as at reporting date. Consequently, the sale consideration accounted of ` 24,358 and units amounting to `1,734 units issued by the buyer.
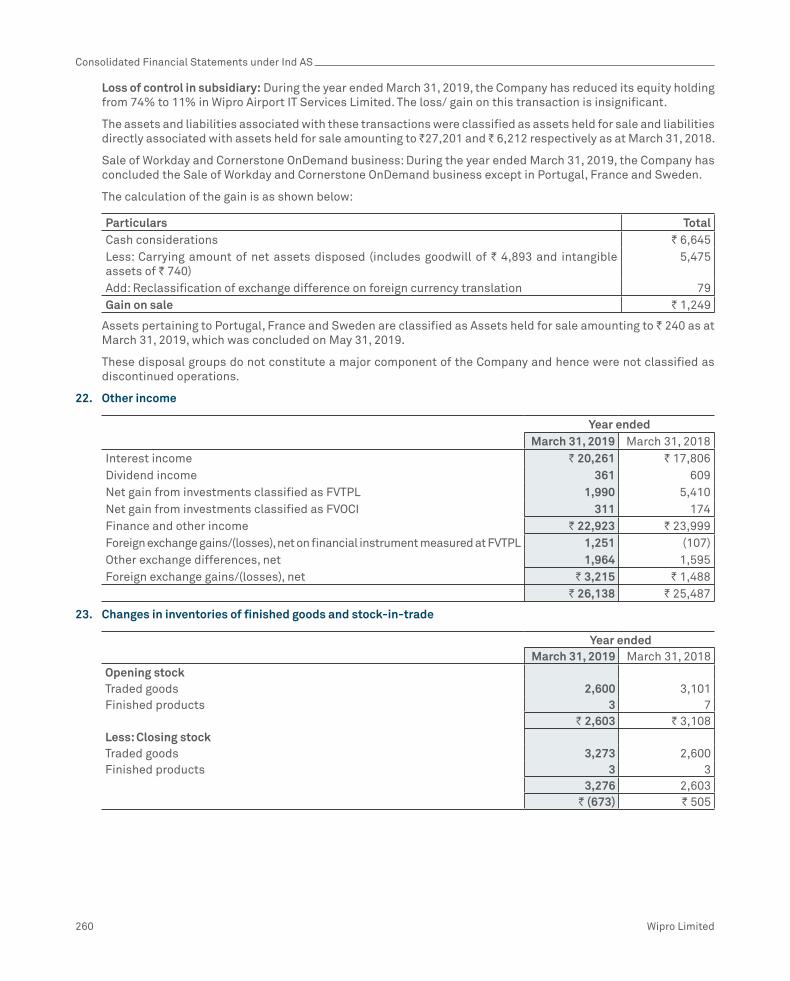
Consolidated Financial Statements under Ind AS
260 Wipro Limited
Loss of control in subsidiary: During the year ended March 31, 2019, the Company has reduced its equity holding from 74% to 11% in Wipro Airport IT Services Limited. The loss/ gain on this transaction is insignificant.
The assets and liabilities associated with these transactions were classified as assets held for sale and liabilities directly associated with assets held for sale amounting to `27,201 and ` 6,212 respectively as at March 31, 2018.
Sale of Workday and Cornerstone OnDemand business: During the year ended March 31, 2019, the Company has concluded the Sale of Workday and Cornerstone OnDemand business except in Portugal, France and Sweden.
The calculation of the gain is as shown below:
Particulars TotalCash considerations ` 6,645Less: Carrying amount of net assets disposed (includes goodwill of ` 4,893 and intangible assets of ` 740)
5,475
Add: Reclassification of exchange difference on foreign currency translation 79Gain on sale ` 1,249
Assets pertaining to Portugal, France and Sweden are classified as Assets held for sale amounting to ` 240 as at March 31, 2019, which was concluded on May 31, 2019.
These disposal groups do not constitute a major component of the Company and hence were not classified as discontinued operations.
22. Other income
Year ended March 31, 2019 March 31, 2018
Interest income ` 20,261 ` 17,806Dividend income 361 609Net gain from investments classified as FVTPL 1,990 5,410Net gain from investments classified as FVOCI 311 174Finance and other income ` 22,923 ` 23,999Foreign exchange gains/(losses), net on financial instrument measured at FVTPL 1,251 (107)Other exchange differences, net 1,964 1,595Foreign exchange gains/(losses), net ` 3,215 ` 1,488
` 26,138 ` 25,487
23. Changes in inventories of finished goods and stock-in-trade
Year ended March 31, 2019 March 31, 2018
Opening stockTraded goods 2,600 3,101Finished products 3 7
` 2,603 ` 3,108Less: Closing stockTraded goods 3,273 2,600Finished products 3 3
3,276 2,603` (673) ` 505

Consolidated Financial Statements under Ind AS
Annual Report 2018-19 261
24. Employee benefits
a) Employee costs includes
Year ended March 31, 2019 March 31, 2018
Salaries and bonus ` 289,005 ` 261,981 Employee benefits plans Gratuity and other defined benefit plans 1,459 1,532 Defined contribution plans 7,372 7,363Share based compensation 1,938 1,347
` 299,774 ` 272,223
Defined benefit plan actuarial (gains)/ losses recognised in other comprehensive income include:
Year ended March 31, 2019 March 31, 2018
Re-measurement of net defined benefit liability/(asset) Return on plan assets excluding interest income ` (49) ` (18) Actuarial (gain)/loss arising from financial assumptions 73 (296) Actuarial (gain)/loss arising from demographic assumptions (40) (54) Actuarial (gain)/loss arising from experience adjustments (266) (454)
` (282) ` (822)
b) Defined benefit plans
Defined benefit plans include gratuity for employees drawing salary in Indian rupees and certain benefits plans in foreign jurisdictions
Amount recognised in the consolidated statement of profit and loss in respect of defined benefit plans is as follows:
Year ended March 31, 2019 March 31, 2018
Current service cost ` 1,434 ` 1,525Net interest on net defined benefit liability/(asset) 25 7Net gratuity cost 1,459 1,532Actual return on plan assets ` 607 ` 501
Change in present value of defined benefit obligation is summarised below:
As at March 31, 2019 March 31, 2018
Defined benefit obligation at the beginning of the year ` 8,654 ` 8,270Acquisitions (Refer Note 40) 1,094 38Current service cost 1,434 1,525Interest on obligation 583 490Benefits paid (1,047) (865)Remeasurement (gains)/losses Actuarial (gain)/loss arising from financial assumptions 73 (296) Actuarial (gain)/loss arising from demographic assumptions (40) (54) Actuarial (gain)/loss arising from experience adjustments (266) (454)Defined benefit obligation at the end of the year ` 10,485 ` 8,654
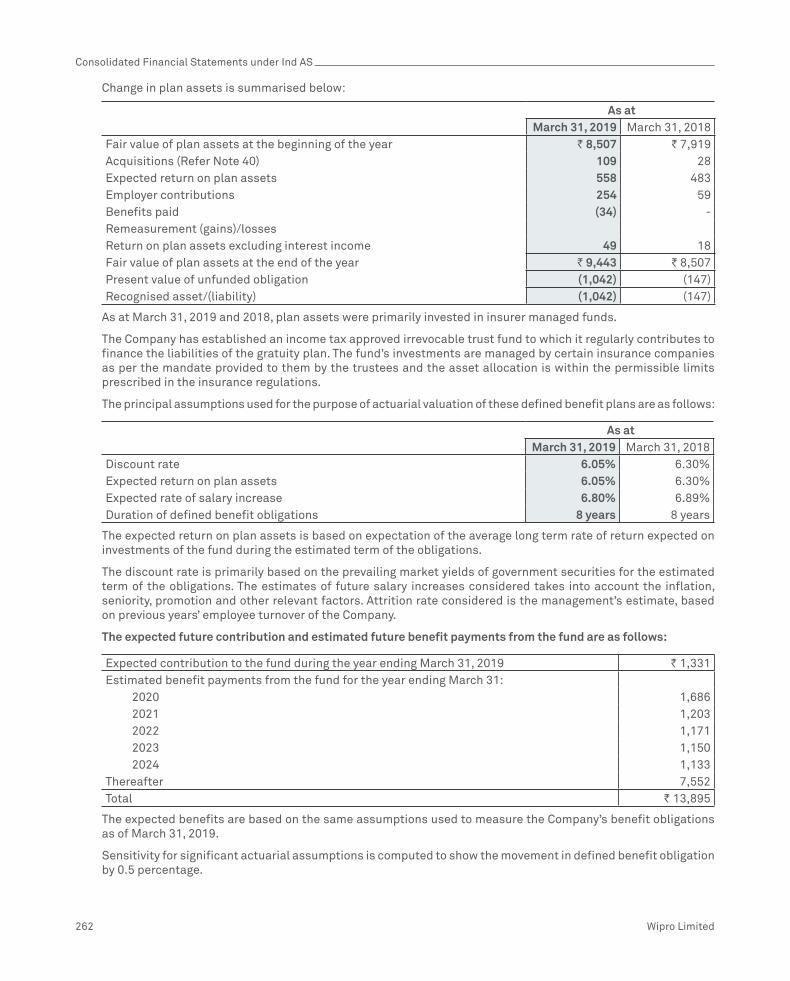
Consolidated Financial Statements under Ind AS
262 Wipro Limited
Change in plan assets is summarised below:
As at March 31, 2019 March 31, 2018
Fair value of plan assets at the beginning of the year ` 8,507 ` 7,919Acquisitions (Refer Note 40) 109 28Expected return on plan assets 558 483Employer contributions 254 59Benefits paid (34) -Remeasurement (gains)/lossesReturn on plan assets excluding interest income 49 18Fair value of plan assets at the end of the year ` 9,443 ` 8,507Present value of unfunded obligation (1,042) (147)Recognised asset/(liability) (1,042) (147)
As at March 31, 2019 and 2018, plan assets were primarily invested in insurer managed funds.
The Company has established an income tax approved irrevocable trust fund to which it regularly contributes to finance the liabilities of the gratuity plan. The fund’s investments are managed by certain insurance companies as per the mandate provided to them by the trustees and the asset allocation is within the permissible limits prescribed in the insurance regulations.
The principal assumptions used for the purpose of actuarial valuation of these defined benefit plans are as follows:
As at March 31, 2019 March 31, 2018
Discount rate 6.05% 6.30%Expected return on plan assets 6.05% 6.30%Expected rate of salary increase 6.80% 6.89%Duration of defined benefit obligations 8 years 8 years
The expected return on plan assets is based on expectation of the average long term rate of return expected on investments of the fund during the estimated term of the obligations.
The discount rate is primarily based on the prevailing market yields of government securities for the estimated term of the obligations. The estimates of future salary increases considered takes into account the inflation, seniority, promotion and other relevant factors. Attrition rate considered is the management’s estimate, based on previous years’ employee turnover of the Company.
The expected future contribution and estimated future benefit payments from the fund are as follows:
Expected contribution to the fund during the year ending March 31, 2019 ` 1,331Estimated benefit payments from the fund for the year ending March 31: 2020 1,686 2021 1,203 2022 1,171 2023 1,150 2024 1,133Thereafter 7,552Total ` 13,895
The expected benefits are based on the same assumptions used to measure the Company’s benefit obligations as of March 31, 2019.
Sensitivity for significant actuarial assumptions is computed to show the movement in defined benefit obligation by 0.5 percentage.

Consolidated Financial Statements under Ind AS
Annual Report 2018-19 263
As of March 31, 2019, every 0.5 percentage point increase/ (decrease) in discount rate will result in (decrease)/increase of defined benefit obligation by approximately ` (405) and ` 435 respectively (March 31, 2018: ` (320) and ` 341 respectively).
As of March 31, 2019, every 0.5 percentage point increase/ (decrease) in expected rate of salary will result in increase/ (decrease) of defined benefit obligation by approximately ` 245 and ` (229) respectively (March 31, 2018: ` 184 and ` (173) respectively).
c) Provident fund:
The details of fund and plan assets are given below:
As at March 31, 2019 March 31, 2018
Fair value of plan assets ` 53,015 ` 46,016Present value of defined benefit obligation (53,015) (46,016)Net (shortfall)/ excess ` - ` -
The plan assets have been primarily invested in government securities and corporate bonds.
The principal assumptions used in determining the present value obligation of interest guarantee under the deterministic approach are as follows:
As at March 31, 2019 March 31, 2018
Discount rate for the term of the obligation 7.00% 7.35%Average remaining tenure of investment portfolio 8 years 7 yearsAverage guaranteed rate of return 8.65% 8.55%
Also refer note 30 for details of employee stock options.
25. Finance costs
Year ended March 31, 2019 March 31, 2018
Interest expense ` 5,616 ` 3,451Exchange fluctuation on foreign currency borrowings, net(to the extent regarded as borrowing cost)
1,759 2,379
` 7,375 ` 5,830
26. Other Expenses
Year ended March 31, 2019 March 31, 2018
Rates, taxes and insurance ` 1,621 ` 2,400 Auditors' remuneration Audit fees 65 57 For tax matters 4 9 Out of pocket expenses 4 4 Miscellaneous expenses 11,830 4,740
` 13,524 ` 7,210

Consolidated Financial Statements under Ind AS
264 Wipro Limited
27. Income tax
Income tax expense has been allocated as follows:
Year ended March 31, 2019 March 31, 2018
Income tax expense as per the statement of profit and loss ` 25,243 ` 22,391Income tax included in Other comprehensive income on: Unrealised gains/ (losses) on investment securities (65) (645) Gains/(losses) on cash flow hedging derivatives 633 (1,448) Defined benefit plan actuarial gains/(losses) 47 255Total income taxes ` 25,858 ` 20,553
Income tax expense consists of the following:
Year ended March 31, 2019 March 31, 2018
Current taxes Domestic ` 17,986 ` 18,500 Foreign 5,663 7,834
23,649 26,334Deferred taxes Domestic (178) 3 Foreign 1,772 (3,946)
1,594 (3,943)Total income taxes ` 25,243 ` 22,391
Income tax expenses are net of reversal of provisions pertaining to earlier periods, amounting to ̀ 2,267 and ̀ 380 for the year ended March 31, 2019 and 2018, respectively.
The reconciliation between the provision of income tax and amounts computed by applying the Indian statutory income tax rate to profit before tax is as follows:
Year ended March 31, 2019 March 31, 2018
Profit before tax ` 115,422 ` 102,422 Enacted income tax rate in India 34.94% 34.61% Computed expected tax expense 40,328 35,448 Effect of: Income exempt from tax (18,469) (12,878) Basis differences that will reverse during a tax holiday period (796) 167 Income taxed at higher/ (lower) rates (1,002) (111) Reversal of deferred tax liability for past years due to rate reduction* - (1,563) Income taxes related to prior years (2,267) (380) Changes in unrecognised deferred tax assets 3,972 239 Expenses disallowed for tax purpose 3,503 1,431 Others, net (26) 38 Total income taxes expenses ` 25,243 ` 22,391 Effective tax rate 21.87% 21.86%
* The “Tax Cuts and Jobs Act,” was signed into law on December 22, 2017 (‘US tax reforms’) which among other things, makes significant changes to the rules applicable to the taxation of corporations, such as changing the corporate tax rate from 35% to 21% rate effective January 1, 2018. For the year ended March 2018, the Company took a positive impact of ̀ 1,563 on account of re-statement of deferred tax items pursuant to US tax reforms.
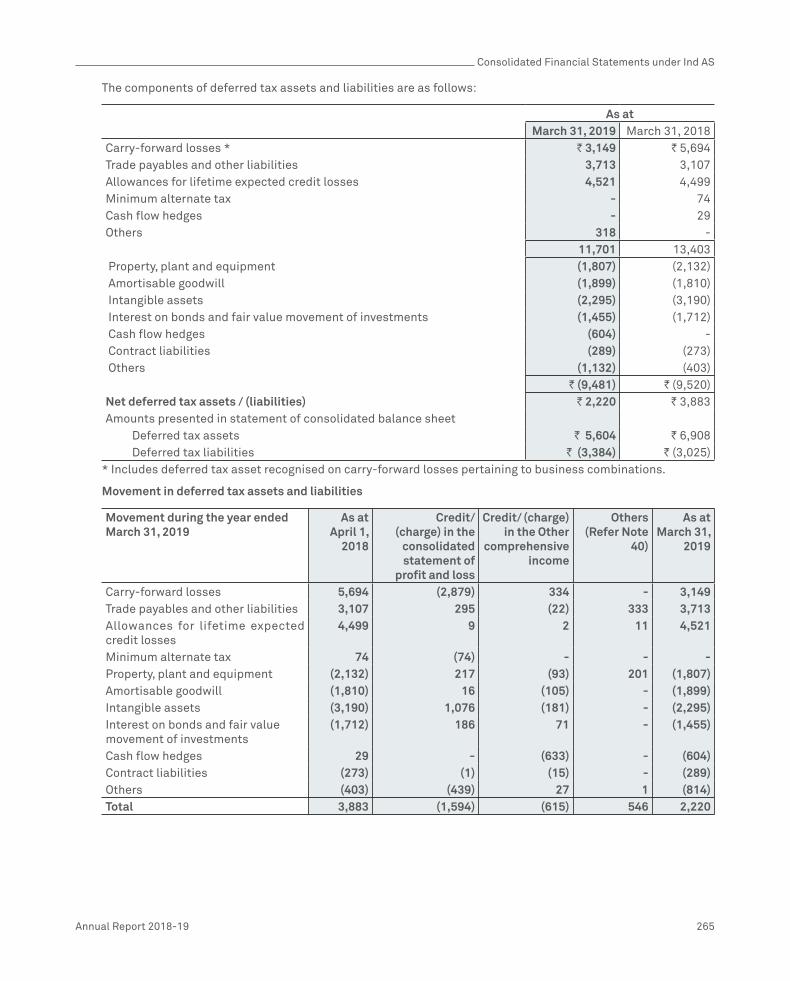
Consolidated Financial Statements under Ind AS
Annual Report 2018-19 265
The components of deferred tax assets and liabilities are as follows:
As at March 31, 2019 March 31, 2018
Carry-forward losses * ` 3,149 ` 5,694Trade payables and other liabilities 3,713 3,107Allowances for lifetime expected credit losses 4,521 4,499Minimum alternate tax - 74Cash flow hedges - 29Others 318 -
11,701 13,403 Property, plant and equipment (1,807) (2,132) Amortisable goodwill (1,899) (1,810) Intangible assets (2,295) (3,190) Interest on bonds and fair value movement of investments (1,455) (1,712) Cash flow hedges (604) - Contract liabilities (289) (273) Others (1,132) (403)
` (9,481) ` (9,520)Net deferred tax assets / (liabilities) ` 2,220 ` 3,883Amounts presented in statement of consolidated balance sheet Deferred tax assets ` 5,604 ` 6,908 Deferred tax liabilities ` (3,384) ` (3,025)
* Includes deferred tax asset recognised on carry-forward losses pertaining to business combinations.
Movement in deferred tax assets and liabilities
Movement during the year ended March 31, 2019
As at April 1,
2018
Credit/ (charge) in the
consolidated statement of
profit and loss
Credit/ (charge) in the Other
comprehensive income
Others (Refer Note
40)
As at March 31,
2019
Carry-forward losses 5,694 (2,879) 334 - 3,149Trade payables and other liabilities 3,107 295 (22) 333 3,713Allowances for lifetime expected credit losses
4,499 9 2 11 4,521
Minimum alternate tax 74 (74) - - -Property, plant and equipment (2,132) 217 (93) 201 (1,807)Amortisable goodwill (1,810) 16 (105) - (1,899)Intangible assets (3,190) 1,076 (181) - (2,295)Interest on bonds and fair value movement of investments
(1,712) 186 71 - (1,455)
Cash flow hedges 29 - (633) - (604)Contract liabilities (273) (1) (15) - (289)Others (403) (439) 27 1 (814)Total 3,883 (1,594) (615) 546 2,220

Consolidated Financial Statements under Ind AS
266 Wipro Limited
Movement during the year ended March 31, 2018
As at April 1, 2017
Credit/ (charge) in the consolidated
statement of profit and loss
Credit/ (charge) in the Other
comprehensive income
On account of business
combination
Assets held
for sale
As at March
31, 2018
Carry-forward losses 5,513 133 48 - - 5,694Trade payables and other liabilities
3,151 243 (246) - (41) 3,107
Allowances for lifetime expected credit losses
2,955 1,564 2 - (22) 4,499
Minimum alternate tax 1,520 (1,446) - - - 74Property, plant and equipment
(4,117) 911 (76) - 1,150 (2,132)
Amortisable goodwill (4,057) 1,522 (53) - 778 (1,810)Intangible assets (4,511) 1,546 (112) (113) - (3,190)Interest on bonds and fair value movement of investments
(2,245) (112) 645 - - (1,712)
Cash flow hedges (1,419) - 1,448 - - 29Contract liabilities (183) (35) (9) - (46) (273)Others (87) (383) (75) - 142 (403)Total (3,480) 3,943 1,572 (113) 1,961 3,883
Deferred taxes on unrealised foreign exchange gain / loss relating to cash flow hedges, fair value movements in investments and actuarial gains/losses on defined benefit plans are recognised in other comprehensive income. Deferred tax liability on the intangible assets identified and carry forward losses on acquisitions is recorded by an adjustment to goodwill. Other than these, the change in deferred tax assets and liabilities is primarily recorded in the consolidated statement of profit and loss.
In assessing the realisability of deferred tax assets, the Company considers the extent to which it is probable that the deferred tax asset will be realised. The ultimate realisation of deferred tax assets is dependent upon the generation of future taxable profits during the periods in which those temporary differences and tax loss carry-forwards become deductible. The Company considers the expected reversal of deferred tax liabilities, projected future taxable income and tax planning strategies in making this assessment. Based on this, the Company believes that it is probable that the Company will realise the benefits of these deductible differences. The amount of deferred tax asset considered realisable, however, could be reduced in the near term if the estimates of future taxable income during the carry-forward period are reduced.
Deferred tax asset amounting to ` 6,769 and ` 3,756 as at March 31, 2019 and 2018, respectively in respect of unused tax losses have not been recognised by the Company. The tax loss carry-forwards of ̀ 24,355 and ̀ 14,510 as at March 31, 2019 and 2018, respectively, relates to certain subsidiaries on which deferred tax asset has not been recognised by the Company, because there is a lack of reasonable certainty that these subsidiaries may generate future taxable profits. Approximately, ̀ 8,191 and ̀ 6,223 as at March 31, 2019 and 2018, respectively, of these tax loss carry-forwards is not currently subject to expiration dates. The remaining tax loss carry-forwards of approximately, ` 16,164 and ` 8,287 as at March 31, 2019 and 2018, respectively, expires in various years through fiscal 2038.
The Company has recognised deferred tax assets of ̀ 3,149 and ̀ 5,694 primarily in respect of carry forward losses of its various subsidiaries as at March 31, 2019 and 2018, respectively. Management’s projections of future taxable income and tax planning strategies support the assumption that it is probable that sufficient taxable income will be available to utilise these deferred tax assets.
The Company has calculated its tax liability for current domestic taxes after considering MAT. The excess tax paid under MAT provisions over and above normal tax liability can be carried forward and set-off against future tax liabilities computed under normal tax provisions. The Company was required to pay MAT and accordingly, a deferred tax asset of ` Nil and ` 74 has been recognised in the statement of consolidated balance sheet as of March 31, 2019 and 2018 respectively.

Consolidated Financial Statements under Ind AS
Annual Report 2018-19 267
A substantial portion of the profits of the Company’s India operations are exempt from Indian income taxes being profits attributable to export operations and profits from units established under the Special Economic Zone Act, 2005 scheme. Units designated in special economic zones providing service on or after April 1, 2005 will be eligible for a deduction of 100 percent of profits or gains derived from the export of services for the first five years from commencement of provision of services and 50 percent of such profits and gains for a further five years. Certain tax benefits are also available for a further five years subject to the unit meeting defined conditions. Profits from certain other undertakings are also eligible for preferential tax treatment. The tax holiday period being currently available to the Company expires in various years through fiscal 2032-33. The expiration period of tax holiday for each unit within a SEZ is determined based on the number of years that have lapsed following year of commencement of production by that unit. The impact of tax holidays has resulted in a decrease of current tax expense of ` 15,390 and ` 11,635 for the years ended March 31, 2019 and 2018, respectively, compared to the effective tax amounts that we estimate we would have been required to pay if these incentives had not been available. The per share effect of these tax incentives for the years ended March 31, 2019 and 2018 was ` 2.56 and ` 1.84, respectively.
Deferred income tax liabilities are recognised for all taxable temporary differences except in respect of taxable temporary differences associated with investments in subsidiaries where the timing of the reversal of the temporary difference can be controlled and it is probable that the temporary difference will not reverse in the foreseeable future. Accordingly, deferred income tax liabilities on cumulative earnings of subsidiaries amounting to ` 52,488 and ` 51,432 as of March 31, 2019 and 2018, respectively and branch profit tax @ 15% of the US branch profit have not been recognised. Further, it is not practicable to estimate the amount of the unrecognised deferred tax liabilities for these undistributed earnings.
28. Foreign currency translation reserve
The movement in foreign currency translation reserve attributable to equity holders of the Company is summarised below:
As atMarch 31, 2019 March 31, 2018
Balance at the beginning of the year ` 15,639 ` 12,146Translation difference related to foreign operations, net 2,906 3,542Reclassification of foreign currency translation differences to profit and loss on sale of hosted data center services business
(4,131) -
Reclassification of foreign currency translation differences to profit and loss on sale of Workday and Cornerstone OnDemand business
(79) -
Change in effective portion of hedges of net investment in foreign operations (287) (49)Total change during the year (1,591) 3,493Balance at the end of the year ` 14,048 ` 15,639
29. Earnings per equity share
A reconciliation of profit for the year and equity shares used in the computation of basic and diluted earnings per equity share is set out below:
Basic: Basic earnings per share is calculated by dividing the profit attributable to equity shareholders of the Company by the weighted average number of equity shares outstanding during the year, excluding equity shares purchased by the Company and held as treasury shares.
Year ended March 31, 2019 March 31, 2018
Profit attributable to equity holders of the Company ` 90,037 ` 80,028Weighted average number of equity shares outstanding 6,007,376,837 6,333,391,200Basic earnings per share ` 14.99 ` 12.64
Diluted: Diluted earnings per share is calculated by adjusting the weighted average number of equity shares outstanding during the year for assumed conversion of all dilutive potential equity shares. Employee share options are dilutive potential equity shares for the Company.
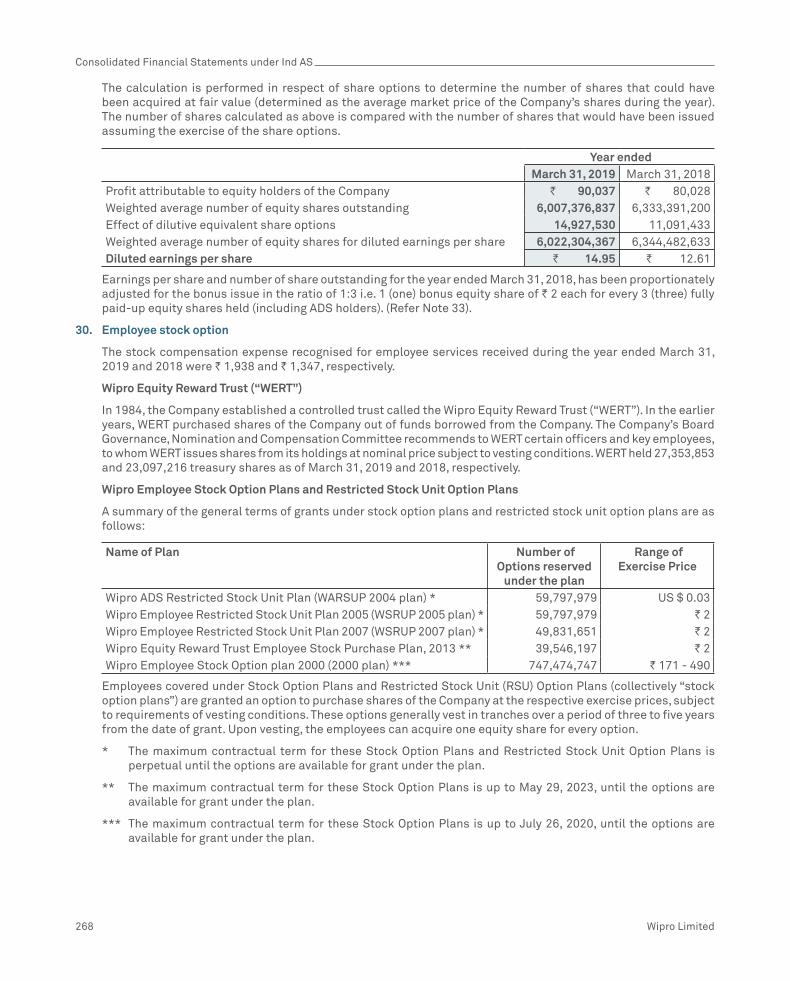
Consolidated Financial Statements under Ind AS
268 Wipro Limited
The calculation is performed in respect of share options to determine the number of shares that could have been acquired at fair value (determined as the average market price of the Company’s shares during the year). The number of shares calculated as above is compared with the number of shares that would have been issued assuming the exercise of the share options.
Year ended March 31, 2019 March 31, 2018
Profit attributable to equity holders of the Company ` 90,037 ` 80,028Weighted average number of equity shares outstanding 6,007,376,837 6,333,391,200Effect of dilutive equivalent share options 14,927,530 11,091,433Weighted average number of equity shares for diluted earnings per share 6,022,304,367 6,344,482,633Diluted earnings per share ` 14.95 ` 12.61
Earnings per share and number of share outstanding for the year ended March 31, 2018, has been proportionately adjusted for the bonus issue in the ratio of 1:3 i.e. 1 (one) bonus equity share of ` 2 each for every 3 (three) fully paid-up equity shares held (including ADS holders). (Refer Note 33).
30. Employee stock option
The stock compensation expense recognised for employee services received during the year ended March 31, 2019 and 2018 were ` 1,938 and ` 1,347, respectively.
Wipro Equity Reward Trust (“WERT”)
In 1984, the Company established a controlled trust called the Wipro Equity Reward Trust (“WERT”). In the earlier years, WERT purchased shares of the Company out of funds borrowed from the Company. The Company’s Board Governance, Nomination and Compensation Committee recommends to WERT certain officers and key employees, to whom WERT issues shares from its holdings at nominal price subject to vesting conditions. WERT held 27,353,853 and 23,097,216 treasury shares as of March 31, 2019 and 2018, respectively.
Wipro Employee Stock Option Plans and Restricted Stock Unit Option Plans
A summary of the general terms of grants under stock option plans and restricted stock unit option plans are as follows:
Name of Plan Number of Options reserved
under the plan
Range ofExercise Price
Wipro ADS Restricted Stock Unit Plan (WARSUP 2004 plan) * 59,797,979 US $ 0.03Wipro Employee Restricted Stock Unit Plan 2005 (WSRUP 2005 plan) * 59,797,979 ` 2Wipro Employee Restricted Stock Unit Plan 2007 (WSRUP 2007 plan) * 49,831,651 ` 2Wipro Equity Reward Trust Employee Stock Purchase Plan, 2013 ** 39,546,197 ` 2Wipro Employee Stock Option plan 2000 (2000 plan) *** 747,474,747 ` 171 - 490
Employees covered under Stock Option Plans and Restricted Stock Unit (RSU) Option Plans (collectively “stock option plans”) are granted an option to purchase shares of the Company at the respective exercise prices, subject to requirements of vesting conditions. These options generally vest in tranches over a period of three to five years from the date of grant. Upon vesting, the employees can acquire one equity share for every option.
* The maximum contractual term for these Stock Option Plans and Restricted Stock Unit Option Plans is perpetual until the options are available for grant under the plan.
** The maximum contractual term for these Stock Option Plans is up to May 29, 2023, until the options are available for grant under the plan.
*** The maximum contractual term for these Stock Option Plans is up to July 26, 2020, until the options are available for grant under the plan.

Consolidated Financial Statements under Ind AS
Annual Report 2018-19 269
The activity in these stock option plans is summarised below:
Particulars Range of exercise
price
Year ended March 31, 2019 March 31, 2018
Number Weighted Average Exercise
Price
Number Weighted Average Exercise
Price
Outstanding at the beginning of the year
` 480.20 - ` 480.20 20,181 ` 480.20
` 2 13,543,997 ` 2 7,952,083 ` 2US $ 0.03 10,199,054 US $ 0.03 5,288,783 US $ 0.03
Bonus on outstanding(Refer note 33)
` 480.20 - ` 480.20 - ` 480.20 ` 2 4,773,755 ` 2 6,968,406 ` 2US $ 0.03 3,957,434 US $ 0.03 4,077,070 US $ 0.03
Granted* ` 480.20 - ` 480.20 - ` 480.20 ` 2 4,607,000 ` 2 4,612,400 ` 2US $ 0.03 4,849,000 US $ 0.03 3,897,000 US $ 0.03
Exercised ` 480.20 - ` 480.20 (20,181) ` 480.20 ` 2 (2,739,097) ` 2 (5,325,217) ` 2US $ 0.03 (1,541,803) US $ 0.03 (2,565,976) US $ 0.03
Forfeited and expired ` 480.20 - ` 480.20 - ` 480.20 ` 2 (2,578,192) ` 2 (663,675) ` 2US $ 0.03 (3,016,895) US $ 0.03 (497,823) US $ 0.03
Outstanding at the end of the year ` 480.20 - ` 480.20 - ` 480.20 ` 2 17,607,463 ` 2 13,543,997 ` 2US $ 0.03 14,446,790 US $ 0.03 10,199,054 US $ 0.03
Exercisable at the end of the year ` 480.20 - ` 480.20 - ` 480.20 ` 2 1,300,781 ` 2 1,875,994 ` 2US $ 0.03 948,877 US $ 0.03 789,962 US $ 0.03
The following table summarises information about outstanding stock options and restricted stock unit option plan:
Range of exercise price Year ended March 31, 2019 2018
Numbers Weighted Average
Remaining life (months)
Weighted Average
Exercise Price
Numbers Weighted Average
Remaining life (months)
Weighted Average
Exercise Price
` 480.20 - - ` 480.20 - - ` 480.20 ` 2 17,607,463 24 ` 2 13,543,997 27 ` 2US $ 0.03 14,446,790 26 US $ 0.03 10,199,054 28 US $ 0.03
The weighted-average grant-date fair value of options granted during the year ended March 31, 2019 and 2018 was ` 349.81 and ` 337.74 for each option, respectively. The weighted average share price of options exercised during the year ended March 31, 2019 and 2018 was ` 325.85 and ` 303.44 for each option, respectively.
* Includes 1,567,000, 1,097,600 and 79,000 Performance based stock options (RSU) granted during the year ended March 31, 2019, 2018 and 2017, respectively. 1,673,000, 1,113,600 and 188,000 Performance based stock options (ADS) during the year ended March 31, 2019, 2018 and 2017, respectively. Performance based stock options (RSU) were issued under Wipro Employee Restricted Stock Unit plan 2007 (WSRUP 2007 plan) and Performance based stock options (ADS) were issued under Wipro granted ADS Restricted Stock Unit Plan (WARSUP 2004 plan).

Consolidated Financial Statements under Ind AS
270 Wipro Limited
31. Finance lease receivables
Finance lease receivables consist of assets that are leased to customers for a contract term ranging from 1 to 7 years, with lease payments due in monthly or quarterly installments. Details of finance lease receivables are given below:
As atMarch 31,
2019March 31,
2018March 31,
2019March 31,
2018Minimum lease
paymentsPresent value of
minimum lease paymentNot later than one year ` 1,742 ` 2,414 ` 1,618 ` 2,271Later than one year but not later than five years 1,813 2,890 1,752 2,739Later than five years 44 - 42 -Gross investment in lease 3,599 5,304 3,412 5,010Less: Unearned finance income (187) (294) - -Present value of minimum lease payment receivables ` 3,412 ` 5,010 ` 3,412 ` 5,010Included in the consolidated balance sheet as follows: Non-current 1,794 2,739Current 1,618 2,271
32. Assets taken on lease
Finance leases: The following is a schedule of future minimum lease payments under finance leases, together with the present value of minimum lease payment as of March 31, 2019 and 2018:
As atMarch 31,
2019March 31,
2018March 31,
2019March 31,
2018Minimum lease
paymentsPresent value of
minimum lease paymentNot later than one year ` 1,555 ` 3,838 ` 1,506 ` 3,720Later than one year but not later than five years 506 1,784 496 1,722Later than five years - - - -Total minimum lease payments 2,061 5,622 2,002 5,442Less: Amounts representing interest (59) (180) - -Present value of minimum lease payment receivables 2,002 5,442 2,002 5,442Included in the consolidated balance sheet as follows: - (1,469) - (1,469)Obligation under finance lease ` 2,002 ` 3,973 ` 2,002 ` 3,973Included in the consolidated balance sheet as follows:Non-current 496 1,722Current 1,506 2,251
Operating leases: The Company has taken offices, vehicles and IT equipments under cancellable and non-cancelable operating lease agreements that are renewable on a periodic basis at the option of both the lessor and the lessee. The operating lease agreements extend up a maximum of fifteen years from their respective dates of inception and some of these lease agreements have price escalation clause. Rental payments under such leases were ` 6,490 and ` 6,236 during the years ended March 31, 2019 and March 31, 2018, respectively.

Consolidated Financial Statements under Ind AS
Annual Report 2018-19 271
Details of contractual payments under non-cancelable leases are given below:
As atMarch 31, 2019 March 31, 2018
Not later than one year ` 7,006 ` 6,186Later than one year and not later than five years 11,106 12,470Later than five years 1,629 2,354Total ` 19,741 ` 21,010
33. Dividends, Bonus and Buyback of equity shares
The Company declares and pays dividends in Indian rupees. According to the Companies Act, 2013 any dividend should be declared out of accumulated distributable profits. A Company may, before the declaration of any dividend, transfer a percentage of its profits for that financial year as it may consider appropriate to the reserves.
The cash dividends paid per equity share were ` 1, and ` 1, during the years ended March 31, 2019 and 2018, respectively, including an interim dividend of ̀ 1 and ̀ 1 for the year ended March 31, 2019 and 2018, respectively.
During the year ended March 31, 2019, the bonus issue in the proportion of 1:3 i.e.1 (One) bonus equity share of ̀ 2 each for every 3 (three) fully paid-up equity shares held (including ADS holders) was approved by the shareholders of the Company on February 22, 2019, through Postal Ballot /e-voting. Subsequently, on March 8, 2019, the Company allotted 1,508,469,180 equity shares to shareholders who held equity shares as on the record date of March 7, 2019 and ̀ 3,016 (representing par value of ̀ 2 per share) was transferred from capital redemption reserves, share Options Outstanding Account and retained earnings to the share capital.
During the year ended March 31, 2018, the bonus issue in the proportion of 1:1 i.e.1 (One) bonus equity share of ` 2 each for every 1 (one) fully paid-up equity share held (including ADS holders) had been approved by the shareholders of the Company on June 03, 2017 through Postal Ballot /e-voting. For this purpose, June 14, 2017, was fixed as the record date. Consequently, on June 15, 2017, the Company allotted 2,433,074,327 shares and ` 4,866 (representing par value of ` 2 per share) has been transferred from retained earnings to share capital.
During the year ended March 31, 2018, the Company has concluded the buyback of 343,750,000 equity shares as approved by the Board of Directors on July 20, 2017. This has resulted in a total cash outflow of ` 110,000. In line with the requirement of the Companies Act 2013, an amount of ` 1,656 and ` 108,344 has been utilised from the share Options Outstanding Account account and retained earnings respectively. Further, capital redemption reserves (included in other reserves) of ̀ 687 (representing the nominal value of the shares bought back) has been created as an apportionment from retained earnings. Consequent to such buyback, share capital has reduced by ` 687.
34. Additional capital disclosures
The key objective of the Company’s capital management is to ensure that it maintains a stable capital structure with the focus on total equity to uphold investor, creditor, and customer confidence and to ensure future development of its business. The Company focused on keeping strong total equity base to ensure independence, security, as well as a high financial flexibility for potential future borrowings, if required without impacting the risk profile of the Company.
The Company’s goal is to continue to be able to return excess liquidity to shareholders by continuing to distribute annual dividends in future periods.
The amount of future dividends/ buyback of equity shares will be balanced with efforts to continue to maintain an adequate liquidity status.

Consolidated Financial Statements under Ind AS
272 Wipro Limited
The capital structure as of March 31, 2019 and 2018 was as follows:
As at March 31, 2019 March 31, 2018 % Change
Equity attributable to the equity shareholders of the Company (A) ` 564,226 ` 479,263 17.73%As percentage of total capital 85% 78%
Current borrowings * 71,099 92,991Non-current borrowings 28,368 45,268Total borrowings (B) ` 99,467 ` 138,259 (28.06)%As percentage of total capital 15% 22% Total capital (A) + (B) ` 663,693 ` 617,522 7.48%
* Includes current obligation under borrowings classified under “Other current financial liabilities”
Borrowings represents 15 % and 22 % of total capital as of March 31, 2019 and 2018, respectively. The Company is not subjected to any externally imposed capital requirements.
35. Commitments and contingencies
Capital commitments: As at March 31, 2019 and 2018 the Company had committed to spend approximately ̀ 12,443 and ̀ 13,091 respectively, under agreements to purchase/ construct property and equipment. These amounts are net of capital advances paid in respect of these purchases.
Guarantees: As at March 31, 2019 and 2018, performance and financial guarantees provided by banks on behalf of the Company to the Indian Government, customers and certain other agencies amount to approximately ` 18,546 and ` 21,546 respectively, as part of the bank line of credit.
Contingencies and lawsuits: The Company is subject to legal proceedings and claims (including tax assessment orders/ penalty notices) which have arisen in the ordinary course of its business. Some of the claims involve complex issues and it is not possible to make a reasonable estimate of the expected financial effect, if any, that will result from ultimate resolution of such proceedings. However, the resolution of these legal proceedings is not likely to have a material and adverse effect on the results of operations or the financial position of the Company. The significant of such matters are discussed below.
In March 2004, the Company received a tax demand for year ended March 31, 2001 arising primarily on account of denial of deduction under section 10A of the Income Tax Act, 1961 (Act) in respect of profit earned by the Company’s undertaking in Software Technology Park at Bangalore. The same issue was repeated in the successive assessments for the years ended March 31, 2002 to March 31, 2011 and the aggregate demand is ̀ 47,583 (including interest of ` 13,832). The appeals filed against the said demand before the Appellate authorities have been allowed in favor of the Company by the second appellate authority for the years up to March 31, 2008. Further appeals have been filed by the Income tax authorities before the Hon’ble High Court. The Hon’ble High Court has heard and disposed-off majority of the issues in favor of the Company up to years ended March 31, 2004. Department has filed a Special Leave Petition (SLP) before the Supreme Court of India for the year ended March 31, 2001 to March 31, 2004.
On similar issues for years up to March 31, 2000, the Hon’ble High Court of Karnataka has upheld the claim of the Company under section 10A of the Act. For the year ended March 31, 2009, the appeals are pending before Income Tax Appellate Tribunal (ITAT). For years ended March 31, 2010 and March 31, 2011, the Dispute Resolution Panel (DRP) allowed the claim of the Company under section 10A of the Act. The Income tax authorities have filed an appeal before the ITAT.
For year ended March 31, 2013, the Company received the final assessment order in November 2017 with a demand of ̀ 3,286 (including interest of ̀ 1,166), arising primarily on account of section 10AA issues with respect to exclusion from Export Turnover. The Company has filed an appeal before Hon’ble ITAT, Bengaluru within the prescribed timelines.
For year ended March 31, 2014, the Company received the final assessment order in September 2018 with a demand of ` 1,030 (including Nil interest), arising primarily on account of transfer pricing issues. The Company has filed an appeal before the Hon’ble ITAT, Bengaluru within the prescribed timelines.

Consolidated Financial Statements under Ind AS
Annual Report 2018-19 273
For year ended March 31, 2015, the Company received the Draft assessment order in December 2018 with a demand of ̀ 6,467 (including interest of ̀ 2,007), arising primarily on account of Capitalization of wages. The Company has filed objections before the Dispute Resolution Panel (Bengaluru) within the prescribed timelines.
Income tax demands against the Company amounting to ` 66,441 and ` 101,440 are not acknowledged as debt as at March 31, 2019 and March 31, 2018, respectively. The contingent liability has been reworked on the basis of recent judicial pronouncements and updates. These matters are pending before various Appellate Authorities and the management expects its position will likely be upheld on ultimate resolution and will not have a material adverse effect on the Company’s financial position and results of operations.
The contingent liability in respect of disputed demands for excise duty, custom duty, sales tax and other matters amounts to ̀ 8,477 and ̀ 7,745 as at March 31, 2019 and 2018. However, the resolution of these legal proceedings is not likely to have a material and adverse effect on the results of operations or the financial position of the Company.
36. Segment information
During the year ended March 31, 2019, the Company have organised India State Run Enterprise segment (ISRE) as a separate segment, which was earlier part of IT Services segment.
The Company is now organised by the following operating segments: IT Services, IT Products and India State Run Enterprise segment (ISRE).
Comparative information has been restated to give effect to the above changes.
IT Services: The IT Services segment primarily consists of IT Service offerings to customers organised by industry verticals. Effective April 1, 2018, consequent to change in organisation structure, the Company reorganised its industry verticals. The Manufacturing (MFG) and Technology Business unit (TECH) are split from the former Manufacturing & Technology (MNT) business unit.
The revised industry verticals are as follows: Banking, Financial Services and Insurance (BFSI), Health Business unit (Health BU) previously known as Health Care and Life Sciences Business unit (HLS), Consumer Business unit (CBU), Energy, Natural Resources & Utilities (ENU), Manufacturing (MFG), Technology (TECH) and Communications (COMM). Key service offerings to customers includes software application development and maintenance, research and development services for hardware and software design, business application services, analytics, consulting, infrastructure outsourcing services and business process services.
Comparative information has been restated to give effect to the above changes.
IT Products: The Company is a value-added reseller of desktops, servers, notebooks, storage products, networking solutions and packaged software for leading international brands. In certain total outsourcing contracts of the IT Services segment, the Company delivers hardware, software products and other related deliverables. Revenue relating to the above items is reported as revenue from the sale of IT Products.
India State Run Enterprise segment (ISRE): This segment consists of IT Services offerings to entities/ departments owned or controlled by Government of India and/ or any State Governments.
The Chairman and Managing Director of the Company has been identified as the Chief Operating Decision Maker (CODM) as defined by Ind AS 108, “Operating Segments.” The Chairman of the Company evaluates the segments based on their revenue growth and operating income.
Assets and liabilities used in the Company’s business are not identified to any of the operating segments, as these are used interchangeably between segments. Management believes that it is currently not practicable to provide segment disclosures relating to total assets and liabilities since a meaningful segregation of the available data is onerous.
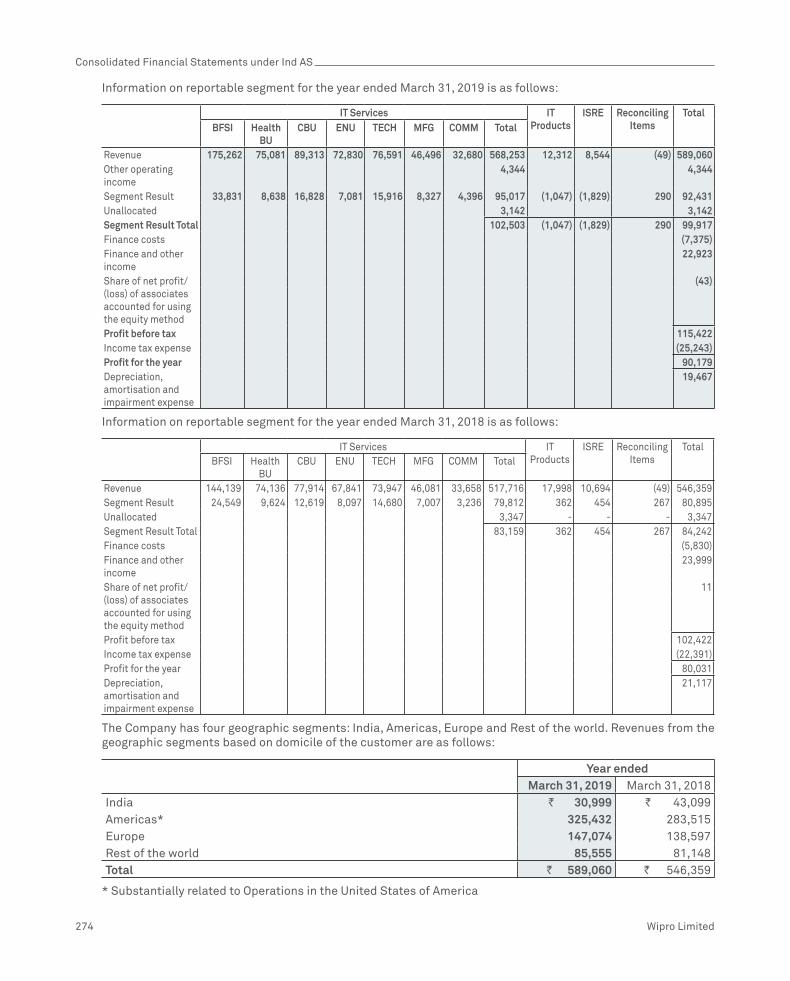
Consolidated Financial Statements under Ind AS
274 Wipro Limited
Information on reportable segment for the year ended March 31, 2019 is as follows:
IT Services IT Products
ISRE Reconciling Items
TotalBFSI Health
BUCBU ENU TECH MFG COMM Total
Revenue 175,262 75,081 89,313 72,830 76,591 46,496 32,680 568,253 12,312 8,544 (49) 589,060Other operating income
4,344 4,344
Segment Result 33,831 8,638 16,828 7,081 15,916 8,327 4,396 95,017 (1,047) (1,829) 290 92,431Unallocated 3,142 3,142Segment Result Total 102,503 (1,047) (1,829) 290 99,917Finance costs (7,375)Finance and other income
22,923
Share of net profit/(loss) of associates accounted for using the equity method
(43)
Profit before tax 115,422Income tax expense (25,243)Profit for the year 90,179Depreciation, amortisation and impairment expense
19,467
Information on reportable segment for the year ended March 31, 2018 is as follows:
IT Services IT Products
ISRE Reconciling Items
TotalBFSI Health
BUCBU ENU TECH MFG COMM Total
Revenue 144,139 74,136 77,914 67,841 73,947 46,081 33,658 517,716 17,998 10,694 (49) 546,359Segment Result 24,549 9,624 12,619 8,097 14,680 7,007 3,236 79,812 362 454 267 80,895Unallocated 3,347 - - - 3,347Segment Result Total 83,159 362 454 267 84,242Finance costs (5,830)Finance and other income
23,999
Share of net profit/(loss) of associates accounted for using the equity method
11
Profit before tax 102,422Income tax expense (22,391)Profit for the year 80,031Depreciation, amortisation and impairment expense
21,117
The Company has four geographic segments: India, Americas, Europe and Rest of the world. Revenues from the geographic segments based on domicile of the customer are as follows:
Year ended March 31, 2019 March 31, 2018
India ` 30,999 ` 43,099Americas* 325,432 283,515Europe 147,074 138,597Rest of the world 85,555 81,148Total ` 589,060 ` 546,359
* Substantially related to Operations in the United States of America

Consolidated Financial Statements under Ind AS
Annual Report 2018-19 275
No customer individually accounted for more than 10% of the revenues during the year ended March 31, 2019 and 2018.
Management believes that it is currently not practicable to provide disclosure of geographical location wise assets, since the meaningful segregation of the available information is onerous.
Notes:
a) “Reconciling items” includes elimination of inter-segment transactions and other corporate activities.
b) Revenue from sale of traded cloud based licenses is reported as part of IT Services revenues.
c) For the purpose of segment reporting, the Company has included the impact of “foreign exchange gains / (losses), net” in revenues (which is reported as a part of operating profit in the consolidated statement of profit and loss).
d) For evaluating performance of the individual operating segments, stock compensation expense is allocated on the basis of straight line amortisation. The differential impact of accelerated amortisation of stock compensation expense over stock compensation expense allocated to the individual operating segments is reported in reconciling items.
e) The Company generally offers multi-year payment terms in certain total outsourcing contracts. These payment terms primarily relate to IT hardware, software and certain transformation services in outsourcing contracts. The finance income on deferred consideration earned under these contracts is included in the revenue of the respective segment and is eliminated under reconciling items.
f) Segment results for ENU and COMM industry vertical for year ended March 31, 2018 is after considering the impact of provision by ` 3,175 and ` 1,437 for impairment of receivables and deferred contract costs.
g) Net gain from the sale of hosted data center services, Workday and Cornerstone OnDemand business and disposal of Wipro Airport IT Services Limited, amounting to ̀ 4,344, is included as part of IT services segment result for the year ended March 31, 2019, respectively. Refer Note 21.
h) Segment results for ENU industry vertical for the year ended March 31, 2019, is after considering the impact of ` 5,141 ($ 75) paid to National Grid on settlement of a legal claim against the Company.
i) Segment results of Health BU industry vertical for the year ended March 31, 2019 and 2018, is after considering the impact of impairment charges recorded on certain software platform and intangible assets recognised on acquisition (Refer Note 4 and 5).
j) Segment results of IT services segment is after recognition of share-based compensation expense of ̀ 1,841 and ` 1,402 for the year ended March 31, 2019 and 2018 are respectively. The share-based compensation expense pertaining to other segments is not material.
37. Related party relationship and transactions
List of subsidiaries and associates as of March 31, 2019 are provided in the table below:
Subsidiaries Subsidiaries Subsidiaries Country of Incorporation
Wipro LLC USAWipro Gallagher Solutions, LLC. USA
Opus Capital Markets Consultants LLC
USA
Wipro Promax Analytics Solutions Americas LLC
USA
Wipro Insurance Solutions LLC USAWipro IT Services, LLC. USA
HealthPlan Services, Inc. *** USAAppirio, Inc. *** USACooper Software, LLC. USAInfocrossing, LLC USAWipro US Foundation USA

Consolidated Financial Statements under Ind AS
276 Wipro Limited
Subsidiaries Subsidiaries Subsidiaries Country of Incorporation
Wipro Overseas IT Services Pvt. Ltd
India
Wipro Japan KK JapanWipro Shanghai Limited ChinaWipro Trademarks Holding Limited
India
Wipro Travel Services Limited IndiaWipro Holdings (UK) Limited U.K.
Wipro Digital Aps DenmarkDesignit A/S *** Denmark
Wipro Europe Limited U.K.Wipro UK Limited U.K.
Wipro Financial Services UK Limited U.K.Wipro IT Services S.R.L. Romania
Wipro Information Technology Austria GmbH **
Austria
Wipro Technologies Austria GmbH **
Austria
NewLogic Technologies SARL ** FranceWipro Cyprus SE Cyprus
Wipro Doha LLC # QatarWipro Technologies SA DE CV MexicoWipro Philippines, Inc. PhilippinesWipro Holdings Hungary Korlátolt Felelosségu Társaság
Hungary
Wipro Holdings Hungary Korlátolt Felelosségu Társaság
Hungary
Wipro Information Technology Egypt SAE
Egypt
Wipro Arabia Co. Limited * Saudi ArabiaWomen’s Business Park Technologies Limited *
Saudi Arabia
Wipro Poland SP Z.O.O PolandWipro IT Services Poland SP Z.O.O PolandWipro Technologies Australia Pty Ltd AustraliaWipro Corporate Technologies Ghana Limited
Ghana
Wipro Technologies South Africa (Proprietary) Limited
South Africa
Wipro Technologies Nigeria Limited NigeriaWipro IT Service Ukraine LLC UkraineWipro Information Technology Netherlands BV.
Netherlands
Wipro Technologies SA ArgentinaWipro Portugal S.A. *** PortugalLimited Liability Company Wipro Technologies Limited
Russia
Wipro Technology Chile SPA ChileWipro Solutions Canada Limited Canada

Consolidated Financial Statements under Ind AS
Annual Report 2018-19 277
Subsidiaries Subsidiaries Subsidiaries Country of Incorporation
Wipro Information Technology Kazakhstan LLP
Kazakhstan
Wipro Technologies W.T. Sociedad Anonima
Costa Rica
Wipro Outsourcing Services (Ireland) Limited
Ireland
Wipro Technologies VZ, C.A. VenezuelaWipro Technologies Peru S.A.C PeruWipro do BrasilServicos de Tecnologia S.A.
Brazil
Wipro do BrasilTechnologiaLtda *** BrazilWipro Technologies S.R.L. RomaniaPT. WT Indonesia IndonesiaWipro (Thailand) Co. Limited ThailandWipro Bahrain Limited Co. S.P.C BahrainWipro Gulf LLC Sultanate of
OmanRainbow Software LLC IraqCellent GmbH Germany
Cellent GmbH *** AustriaWipro Networks Pte Limited Singapore
Wipro (Dalian) Limited ChinaWipro Technologies SDN BHD Malaysia
Wipro Chengdu Limited ChinaAppirio India Cloud Solutions Private Limited **
India
Wipro IT Services Bangladesh Limited
Bangladesh
Wipro HR Services India Private Limited
India
* All the above direct subsidiaries are 100% held by the Company except that the Company holds 66.67% of the equity securities of Wipro Arabia Co. Limited and 55% of the equity securities of Women’s Business Park Technologies Limited are held by Wipro Arabia Co. Limited.
# 51% of equity securities of Wipro Doha LLC are held by a local shareholder. However, the beneficial interest in these holdings is with the Company.
The Company controls ‘The Wipro SA Broad Based Ownership Scheme Trust’, ‘Wipro SA Broad Based Ownership Scheme SPV (RF) (PTY) LTD incorporated in South Africa
*** Step Subsidiary details of Wipro Portugal S.A, Wipro do Brasil Technologia Ltda, Designit A/S, Cellent GmbH, HealthPlan Services, Inc. and Appirio, Inc. are as follows
Subsidiaries Subsidiaries Subsidiaries Country of Incorporation
Wipro Portugal S.A. PortugalWipro Technologies GmbH Germany
Wipro do Brasil Technologia Ltda
Brazil
Wipro Do Brasil Sistemetas De Informatica Ltd
Brazil

Consolidated Financial Statements under Ind AS
278 Wipro Limited
Subsidiaries Subsidiaries Subsidiaries Country of Incorporation
Designit A/S DenmarkDesignit Denmark A/S DenmarkDesignit Germany GmbH GermanyDesignit Oslo A/S NorwayDesignit Sweden AB SwedenDesignit T.L.V Ltd. IsraelDesignit Tokyo Ltd. JapanDenextep Spain Digital, S.L Spain
Designit Colombia S A S ColombiaDesignit Peru SAC Peru
Cellent GmbH AustriaFrontworx Informations
technologie GmbH
Austria
HealthPlan Services, Inc. USAHealthPlan Services Insurance Agency, LLC.
USA
Appirio, Inc. USAAppirio, K.K JapanTopcoder, LLC. USAAppirio Ltd Ireland
Appirio GmbH GermanyApprio Ltd (UK) U.K.
** Vide its order dated March 29, 2019, the Hon’ble National Company Law Tribunal, Bengaluru bench, approved the scheme of amalgamation for the merger of wholly owned subsidiaries Wipro Information Technology Austria GmbH, Wipro Technologies Austria GmbH, NewLogic Technologies SARL and Appirio India Cloud Solutions Private Limited with Wipro Limited. As per the said scheme, the appointed date is April 1, 2018.
As at March 31, 2019, the Company held 43.7% interest in Drivestream Inc, 33% interest in Denim Group Limited and 33.3% in Denim Group Management, LLC, investments accounted for using the equity method.
The list of controlled trusts are:
Name of the entity Country of incorporationWipro Equity Reward Trust IndiaWipro Foundation India
The other related parties are:
Name of the related parties: NatureAzim Premji Foundation Entity controlled by DirectorAzim Premji Foundation for Development Entity controlled by DirectorHasham Traders Entity controlled by DirectorPrazim Traders Entity controlled by DirectorZash Traders Entity controlled by DirectorHasham Investment and Trading Co. Pvt. Ltd Entity controlled by DirectorAzim Premji Philanthropic Initiatives Pvt. Ltd Entity controlled by DirectorAzim Premji Trust Entity controlled by DirectorWipro Enterprises (P) Limited Entity controlled by DirectorWipro GE Healthcare Private Limited Entity controlled by Director

Consolidated Financial Statements under Ind AS
Annual Report 2018-19 279
Name of the related parties: NatureKey management personnelAzim H Premji Executive Chairman and Managing DirectorT K Kurien Executive Vice Chairman (vii)
Abidali Z Neemuchwala Chief Executive Officer and Executive Director (iii)
Dr. Ashok Ganguly Non-Executive DirectorN Vaghul Non-Executive DirectorDr. Jagdish N Sheth Non-Executive Director (v)
William Arthur Owens Non-Executive DirectorM.K. Sharma Non-Executive DirectorVyomesh Joshi Non-Executive Director (vi)
Ireena Vittal Non-Executive DirectorRishad A Premji Executive Director and Chief Strategy Officer (ii)
Dr. Patrick J. Ennis Non-Executive Director (iv)
Patrick Dupuis Non-Executive Director (iv)
Arundhati Bhattacharya Additional Director (viii)
Jatin Pravinchandra Dalal Chief Financial Officer (i)
M Sanaulla Khan Company Secretary
(i) Effective April 1, 2015 (ii) Effective May 1, 2015 (iii) Effective February 1, 2016 (iv) Effective April 1, 2016 (v) Up to July 18, 2016 (vi) Up to July 19, 2016 (vii) Up to January 31, 2017 (viii) Effective January 1, 2019
Relatives of key management personnel:
- Yasmeen H. Premji
- Tariq Azim Premji
The Company has the following related party transactions:
Transaction / balances Entities controlled by Directors Key Management Personnel
March 31, 2019 March 31, 2018 March 31, 2019 March 31, 2018Sales of goods and services 102 136 - -Assets purchased 240 290 - -Dividend 3,171 3,171 191 191Buyback of shares - 63,745 - ^ Rental Income 43 42 - -Rent Paid 8 7 5 6Others 63 31 - -Key management personnel *Remuneration and short-term benefits - - 356 260Other benefits - - 174 131Balance as at the year endReceivables 132 39 - -Payables 8 57 156 55
^ Value is less than ` 1
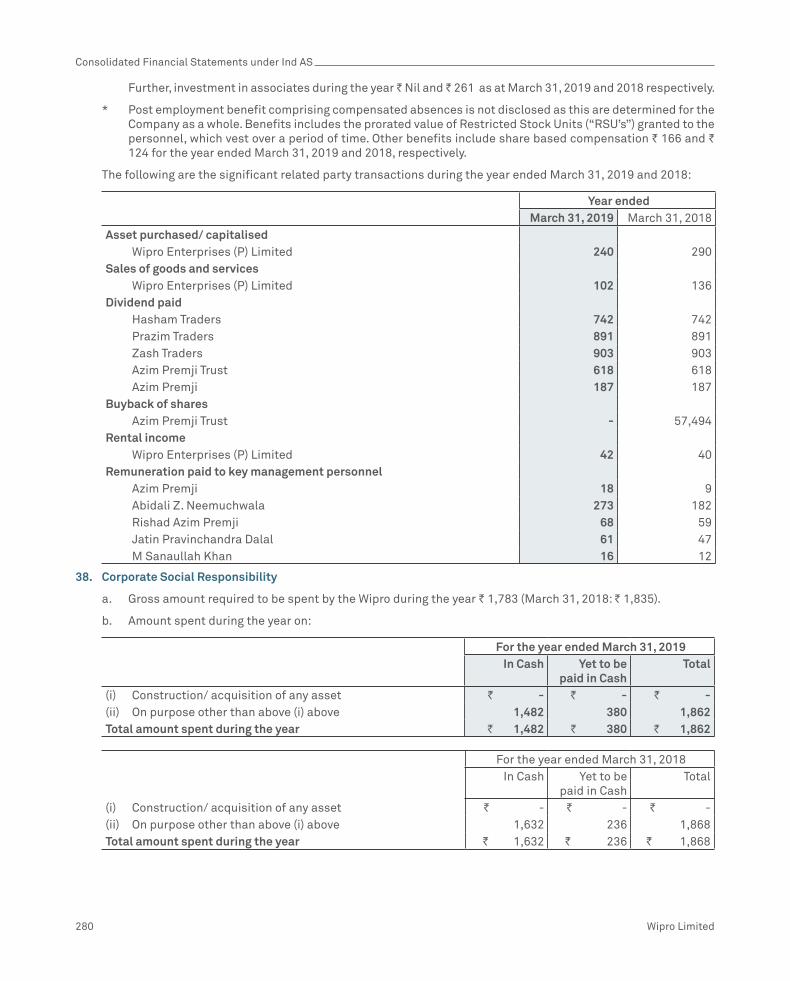
Consolidated Financial Statements under Ind AS
280 Wipro Limited
Further, investment in associates during the year ̀ Nil and ̀ 261 as at March 31, 2019 and 2018 respectively.
* Post employment benefit comprising compensated absences is not disclosed as this are determined for the Company as a whole. Benefits includes the prorated value of Restricted Stock Units (“RSU’s”) granted to the personnel, which vest over a period of time. Other benefits include share based compensation ` 166 and ` 124 for the year ended March 31, 2019 and 2018, respectively.
The following are the significant related party transactions during the year ended March 31, 2019 and 2018:
Year ended March 31, 2019 March 31, 2018
Asset purchased/ capitalised Wipro Enterprises (P) Limited 240 290Sales of goods and services Wipro Enterprises (P) Limited 102 136Dividend paid Hasham Traders 742 742 Prazim Traders 891 891 Zash Traders 903 903 Azim Premji Trust 618 618 Azim Premji 187 187Buyback of shares Azim Premji Trust - 57,494Rental income Wipro Enterprises (P) Limited 42 40Remuneration paid to key management personnel Azim Premji 18 9 Abidali Z. Neemuchwala 273 182 Rishad Azim Premji 68 59 Jatin Pravinchandra Dalal 61 47 M Sanaullah Khan 16 12
38. Corporate Social Responsibility
a. Gross amount required to be spent by the Wipro during the year ` 1,783 (March 31, 2018: ` 1,835).
b. Amount spent during the year on:
For the year ended March 31, 2019 In Cash Yet to be
paid in Cash Total
(i) Construction/ acquisition of any asset ` - ` - ` -(ii) On purpose other than above (i) above 1,482 380 1,862Total amount spent during the year ` 1,482 ` 380 ` 1,862
For the year ended March 31, 2018 In Cash Yet to be
paid in Cash Total
(i) Construction/ acquisition of any asset ` - ` - ` -(ii) On purpose other than above (i) above 1,632 236 1,868Total amount spent during the year ` 1,632 ` 236 ` 1,868

Consolidated Financial Statements under Ind AS
Annual Report 2018-19 281
39. Additional information pursuant to para 2 of general instructions for the preparation of consolidated financial statements
Name of the Subsidiary Net Asset Share in Profit or Loss
Share in Other comprehensive
income
Share in total comprehensive
income
As % of total
Amount in `
As % of total
Amount in `
As % of total
Amount in `
As % of total
Amount in `
ParentWipro Limited 75.8% 493,920 172.3% 76,140 20.0% 1,246 153.5% 77,386Indian SubsidiariesWipro Overseas IT Services Pvt. Ltd - - - - - - - -Wipro Trademarks Holding Limited 0.0% 44 0.0% 2 - - 0.0% 2Wipro Travel Services Limited 0.0% 126 0.0% 1 - - 0.0% 1Wipro HR Services India Private Limited
0.7% 4,521 0.9% 397 (0.1)% (5) 0.8% 392
Foreign SubsidiariesWipro LLC 2.9% 18,748 (56.3)% (24,868) 222.7% 13,906 (21.7)% (10,962)Wipro Gallagher Solutions, LLC. 0.6% 3,686 1.6% 708 3.1% 192 1.8% 900Opus Capital Markets Consultants LLC
0.1% 380 (0.3)% (153) 0.5% 32 (0.2)% (121)
Wipro Promax Analytics Solutions Americas LLC
(0.1)% (414) (0.3)% (136) (0.2)% (13) (0.3)% (149)
Wipro Insurance Solutions LLC 0.0% 137 0.0% 3 0.1% 8 0.0% 11Wipro IT Services, LLC. (0.7)% (4,280) (48.6)% (21,461) (152.6)% (9,531) (61.5)% (30,992)HealthPlan Services, Inc. (0.5)% (3,391) (11.4)% (5,039) 0.9% 56 (9.9)% (4,983)Appirio, Inc. 1.4% 8,967 14.1% 6,237 (0.2)% (12) 12.3% 6,225Cooper Software, LLC. (0.0)% (11) 0.0% 2 (0.0)% (1) 0.0% 1Infocrossing, LLC (0.5)% (3,273) 3.4% 1,510 (1.8)% (113) 2.8% 1,397Wipro US Foundation - - - - - - - -Wipro Japan KK 0.1% 601 0.0% 12 0.1% 9 0.0% 21Wipro Shanghai Limited 0.1% 388 0.1% 58 (0.0)% (2) 0.1% 56Wipro Holdings (UK) Limited 0.4% 2,442 0.0% 1 1.7% 106 0.2% 107Wipro Digital Aps 0.6% 4,052 (0.0)% (5) (0.4)% (22) (0.1)% (27)Designit A/S 0.1% 954 (0.4)% (198) 0.3% 20 (0.4)% (178)Wipro Europe Limited 0.0% 57 0.0% 15 - - 0.0% 15Wipro UK Limited 0.0% 145 0.0% 18 0.4% 23 0.1% 41Wipro Financial Services UK Limited
(0.0)% (41) (0.0)% (4) 0.0% 1 (0.0)% (3)
Wipro IT Services S.R.L. (0.0)% (27) (0.1)% (29) 0.0% 2 (0.1)% (27)Wipro Cyprus SE 4.5% 29,143 1.2% 548 - - 1.1% 548Wipro Doha LLC 0.1% 352 0.6% 274 0.1% 5 0.6% 279Wipro Technologies SA DE CV (0.0)% (272) (0.5)% (215) 0.5% 33 (0.4)% (182)Wipro Philippines, Inc. 1.3% 8,767 8.7% 3,865 4.0% 248 8.2% 4,113Wipro Holdings Hungary Korlátolt Felelosségu Társaság
5.6% 36,377 1.1% 492 - - 1.0% 492
Wipro Holdings Investment Korlátolt Felelosségu Társaság
3.7% 24,056 3.9% 1,717 - - 3.4% 1,717
Wipro Information Technology Egypt SAE
(0.0)% (122) (0.0)% (1) (0.1)% (9) (0.0)% (10)

Consolidated Financial Statements under Ind AS
282 Wipro Limited
Name of the Subsidiary Net Asset Share in Profit or Loss
Share in Other comprehensive
income
Share in total comprehensive
income
As % of total
Amount in `
As % of total
Amount in `
As % of total
Amount in `
As % of total
Amount in `
Wipro Arabia Co. Limited 1.3% 8,411 1.0% 431 8.0% 500 1.8% 931Women’s Business Park Technologies Limited
0.0% 66 (0.0)% (4) 0.0% 2 (0.0)% (2)
Wipro Poland SP Z.O.O 0.1% 392 0.1% 39 (0.4)% (26) 0.0% 13Wipro IT Services Poland SP Z.O.O 0.1% 530 0.5% 214 (0.5)% (31) 0.4% 183Wipro Technologies Australia Pty Ltd
(0.1)% (479) (0.0)% (6) 0.2% 10 0.0% 4
Wipro Corporate Technologies Ghana Limited
0.0% 31 0.0% 6 (0.1)% (5) 0.0% 1
Wipro Technologies South Africa (Proprietary) Limited
0.1% 489 (0.1)% (57) (1.4)% (88) (0.3)% (145)
Wipro Technologies Nigeria Limited 0.0% 78 0.1% 39 0.0% 2 0.1% 41Wipro IT Service Ukraine LLC (0.0)% (3) - - - - - -Wipro Information Technology Netherlands BV.
0.6% 3,594 1.1% 491 (0.4)% (27) 0.9% 464
Wipro Technologies SA 0.0% 203 0.1% 48 (1.6)% (101) (0.1)% (53)Wipro Portugal S.A. 0.6% 3,646 0.2% 82 (3.0)% (186) (0.2)% (104)Limited Liability Company Wipro Technologies Limited
0.0% 201 0.1% 56 (0.1)% (9) 0.1% 47
Wipro Technology Chile SPA (0.0)% (50) (0.1)% (61) 0.0% 3 (0.1)% (58)Wipro Solutions Canada Limited (0.7)% (4,704) 1.1% 505 (1.7)% (108) 0.8% 397Wipro Information Technology Kazakhstan LLP
(0.0)% (20) 0.0% 18 0.0% 3 0.0% 21
Wipro Technologies W.T. Sociedad Anonima
(0.1)% (421) (0.6)% (262) 0.1% 9 (0.5)% (253)
Wipro Outsourcing Services (Ireland) Limited
0.0% 210 (0.1)% (50) (0.1)% (8) (0.1)% (58)
Wipro Technologies VZ, C.A. - - (0.0)% (1) 0.0% 1 - -Wipro Technologies Peru S.A.C 0.0% 96 0.1% 34 - - 0.1% 34Wipro do Brasil Servicos de Tecnologia S.A.
0.0% 240 0.2% 97 (0.2)% (15) 0.2% 82
Wipro do Brasil Technologia Ltda 0.3% 2,070 1.4% 617 (3.0)% (190) 0.8% 427Wipro Technologies S.R.L. 0.1% 958 0.9% 378 (1.0)% (61) 0.6% 317PT. WT Indonesia 0.1% 854 0.8% 338 0.2% 12 0.7% 350Wipro (Thailand) Co. Limited 0.1% 418 (0.0)% (7) 0.3% 18 0.0% 11Wipro Bahrain Limited Co. S.P.C 0.1% 497 (0.2)% (99) 0.6% 35 (0.1)% (64)Wipro Gulf LLC 0.1% 934 0.7% 308 0.9% 58 0.7% 366Rainbow Software LLC (0.0)% (5) (0.0)% (2) - - (0.0)% (2)Cellent GmbH 0.2% 1,310 (0.6)% (269) 0.4% 27 (0.5)% (242)Cellent GmbH 0.1% 396 (0.1)% (26) (0.6)% (36) (0.1)% (61)Wipro Networks Pte Limited 0.3% 1,684 (0.5)% (226) 1.0% 60 (0.3)% (166)Wipro (Dalian) Limited 0.1% 586 0.4% 182 (0.1)% (4) 0.4% 178Wipro Technologies SDN BHD 0.0% 6 - - - - - -Wipro Chengdu Limited 0.2% 1,033 1.2% 532 (0.1)% (5) 1.0% 527

Consolidated Financial Statements under Ind AS
Annual Report 2018-19 283
Name of the Subsidiary Net Asset Share in Profit or Loss
Share in Other comprehensive
income
Share in total comprehensive
income
As % of total
Amount in `
As % of total
Amount in `
As % of total
Amount in `
As % of total
Amount in `
Wipro IT Services Bangladesh Limited
0.1% 479 0.3% 120 (0.2)% (11) 0.2% 109
Wipro Technologies GmbH (0.0)% (60) 0.1% 42 3.0% 187 0.5% 229Wipro Do Brasil Sistemetas De Informatica Ltd
(0.0)% (34) (0.1)% (60) - - (0.1)% (60)
Designit Denmark A/S 0.1% 666 1.0% 434 (0.8)% (52) 0.8% 382Designit Germany GmbH (0.0)% (181) (0.1)% (61) 0.1% 7 (0.1)% (54)Designit Oslo A/S 0.0% 54 (0.0)% (16) (0.0)% (2) (0.0)% (18)Designit Sweden AB (0.0)% (9) 0.1% 40 0.0% 1 0.1% 41Designit T.L.V Ltd. 0.0% 141 0.0% 21 0.1% 4 0.0% 25Designit Tokyo Ltd. (0.0)% (58) 0.1% 34 (0.0)% (2) 0.1% 32Denextep Spain Digital, S.L 0.0% 37 (0.0)% (11) (0.0)% (2) (0.0)% (13)Designit Colombia S A S (0.0)% (7) (0.0)% (8) - - (0.0)% (8)Designit Peru SAC (0.0)% (26) 0.0% 9 (0.0)% (2) 0.0% 7Front worx Information stechnologie GmbH
0.0% 114 0.0% 6 (0.1)% (5) 0.0% 1
HealthPlan Services Insurance Agency, LLC.
0.0% 41 0.1% 63 (0.1)% (7) 0.1% 56
Appirio, K.K (0.0)% (205) 0.1% 54 (0.1)% (4) 0.1% 50Topcoder, LLC. (0.0)% (38) - - (0.0)% (2) (0.0)% (2)Appirio Ltd 0.0% 23 0.0% 12 (0.0)% (1) 0.0% 11Appirio GmbH 0.0% 2 - - - - - -Appirio Ltd (UK) (0.1)% (442) 0.4% 188 0.1% 9 0.4% 197TrustsWipro Equity Reward Trust 0.2% 1,221 0.2% 69 - - 0.1% 69Wipro Foundation 0.0% 16 0.0% 17 (0.0)% (1) 0.0% 16Wipro SA Broad based Ownership Scheme SPV(RF)(Pty) Ltd.
0.1% 775 (0.0)% (1) - - (0.0)% (1)
Wipro SA Broad based Ownership Scheme Trust
0.0% 134 (0.0)% (3) 1.7% 109 0.2% 106
Total 100% 651,927 100% 44,185 100% 6,245 100% 50,430Non-controlling interest (2,637) (142) (109) (251)Adjustment arising out of consolidation
(85,064) 45,994 (5,445) 40,549
Grand Total 564,226 90,037 691 90,728
40. As part of a customer contract with Alight LLC, Wipro has acquired Alight HR Services India Private Limited (currently known as Wipro HR Services India Private Limited) for a consideration of ̀ 8,275 (USD 117). Considering the terms and conditions of the agreement, the Company has concluded that this transaction does not meet the definition of Business under Ind AS 103. The transaction was consummated on September 1, 2018. Net assets taken over was ̀ 4,128. The excess of consideration paid and net assets taken over is accounted as ‘costs to obtain contract’, which will be amortised over the tenure of the contract as reduction in revenues.
41. Events after the reporting period
On April 16, 2019, the Board of Directors approved a proposal to buy back up to 323,076,923 equity shares of the Company for an aggregate amount not exceeding ` 105,000 million, being 5.35% of total paid-up equity share

Consolidated Financial Statements under Ind AS
284 Wipro Limited
capital as at March 31, 2019, at a price of ` 325 per equity share. Subsequently, vide resolution dated June 1, 2019 the shareholders approved the buyback of equity shares through postal ballot/e-voting. The Company will file the draft letter of offer with the Securities and Exchange Board of India in due course for its approval and will open the buyback offer for tendering of shares by the shareholders, following approval from the Securities and Exchange Board of India. The buyback is proposed to be made from all existing shareholders of the Company as on the record date for the buyback, i.e., June 21, 2019, on a proportionate basis under the “tender offer” route in accordance with the provisions contained in the Securities and Exchange Board of India (Buy-back of Securities) Regulations, 2018 and the Companies Act, 2013 and rules made thereunder.
On June 4, 2019, the Company entered into a definitive agreement to acquire International TechneGroup Incorporated, a global digital engineering and manufacturing solutions company for a consideration of US$ 45 million. The acquisition is subject to customary closing conditions and regulatory approvals and is expected to close in the quarter ending September 30, 2019.
The accompanying notes form an integral part of these consolidated financial statements
As per our report of even date attached For and on behalf of the Board of Directors
for Deloitte Haskins & Sells LLP Azim H Premji N Vaghul Abidali Z NeemuchwalaChartered Accountants Executive Chairman
& Managing DirectorDirector Chief Executive Officer
& Executive DirectorFirm’s Registration No: 117366W/W-100018
N. Venkatram Jatin Pravinchandra Dalal M Sanaulla KhanPartner Chief Financial Officer Company Secretary
Membership No. 71387
Mumbai Bengaluru
June 06, 2019 June 06, 2019

Consolidated Financial Statements under Ind AS
Annual Report 2018-19 285
Pur
suan
t to
firs
t pr
ovis
o to
sub
-sec
tion
(3) o
f sec
tion
129
of C
ompa
nies
Act
, 201
3, re
ad w
ith
rule
5 o
f Com
pani
es (A
ccou
nts)
Rul
es, 2
014
- A
OC
-1,
the
Com
pany
is p
rese
ntin
g su
mm
aris
ed fi
nanc
ial i
nfor
mat
ion
abou
t in
divi
dual
sub
sidi
arie
s as
at
Mar
ch 3
1, 2
019
/Dec
embe
r 31,
201
8.In
form
atio
n re
lati
ng to
Sub
sidi
arie
s as
at
Mar
ch 3
1, 2
019/
Dec
embe
r 31,
201
8P
art
A -
Sub
sidi
arie
sSl
. N
o.Na
me
of th
e Su
bsid
iary
Date
of b
ecom
ing
subs
idia
ry/
acqu
isiti
on
Repo
rtin
g pe
riod
Repo
rtin
g Cu
rren
cy E
xcha
nge
rate
as o
n
Mar
ch
31, 2
019/
Dece
mbe
r 31
, 201
8
Sha
re
Capi
tal(j)
R
eser
ves
& Su
rplu
s(j)
Tota
l As
sets
(j)
Tota
l Li
abili
ties
Excl
udin
g (6
) & (7
)(j)
Inve
st-
men
ts(i)
%
Hold
ing
Turn
over
(k)
P
rofit
Be
fore
Ta
xatio
n(k)
Pro
visi
on
For
Taxa
tion(k
)
Pro
fit A
fter
Ta
xatio
n(k)
Pro
pose
d Di
vide
nd
(incl
. di
vide
nd
tax)
(k)
(1)
(2)
(3)
(4)
(5)
(6)
(7)
(8)
(9)
(10)
(11)
(12)
(13)
(14)
(15)
(16)
1 W
ipro
, LLC
7-Ju
l-98
31-M
ar-1
9U
SD
69
62,
434
(42,
804)
52,
557
32,
927
-
100%
57,
081
(24,
637)
(42)
(24,
596)
-
2 A
pp
irio
, Inc
.23
-Nov
-16
31-M
ar-1
9U
SD
69
*
7,0
29
11,
019
3,9
90
-
100%
14,
070
5,5
53
(684
) 6
,237
-
3
Wip
ro A
rab
ia C
o.Li
mit
ed19
-Jun
-07
31-D
ec-1
8S
AR
19
558
7
,806
1
6,59
1 8
,228
-
67
% 1
0,72
2 6
0 8
5 (2
5) -
4
Wip
ro H
R S
ervi
ces
Ind
ia P
riva
te L
imit
ed
(for
mer
ly k
now
n as
A
light
HR
Ser
vice
s In
dia
P
riva
te L
imit
ed)(a
)
31-A
ug-1
831
-Mar
-19
INR
1
70
4,4
50
6,8
20
2,2
99
-
100%
10,
645
928
3
10
618
-
5 H
ealt
hpla
n S
ervi
ces,
Inc
29-F
eb-1
631
-Mar
-19
US
D 6
9 *
(1
,072
) 4
,558
5
,630
-
10
0% 1
0,14
7 (2
,461
) *
(2
,461
) -
6
Wip
ro P
hilip
pin
es, I
nc.
(for
mer
ly k
now
n as
W
ipro
BP
O P
hilip
pin
es
Ltd
. Inc
.)
16-O
ct-0
731
-Mar
-19
PH
P 1
.32
249
8
,508
9
,874
1
,117
6
,338
10
0% 8
,772
3
,936
9
5 3
,842
-
7 W
ipro
Sol
utio
ns C
anad
a Li
mit
ed16
-Aug
-14
31-M
ar-1
9C
AD
52
1,6
49
(6,3
53)
4,6
19
9,3
23
-
100%
7,9
68
357
(1
48)
505
-
8 In
focr
ossi
ng, L
LC20
-Sep
-07
31-M
ar-1
9U
SD
69
*
2,9
45
5,7
32
2,7
87
-
100%
6,7
09
1,9
38
428
1
,510
-
9
Wip
ro T
echn
olog
ies
Gm
bH
30-J
un-0
631
-Mar
-19
EU
R 7
8 5
84
(552
) 4
,051
4
,019
-
10
0% 6
,426
8
8 2
6 6
2 -
10
Wip
ro d
o B
rasi
l Te
chno
logi
a Lt
da
29-M
ay-0
131
-Dec
-18
BR
L 1
8 4
61
1,4
26
3,0
71
1,1
84
-
100%
5,6
34
885
3
37
549
-
11
Cel
lent
Gm
bH
15-J
an-1
631
-Mar
-19
EU
R 7
8 4
19
912
2
,302
9
72
-
100%
5,2
80
(266
) 7
(2
73)
-
12
Wip
ro T
echn
olog
ies
SA
D
E C
V13
-Jun
-07
31-M
ar-1
9M
XN 4
7
18
(990
) 1
,906
2
,178
-
10
0% 4
,554
(2
15)
*
(215
) -
13
Wip
ro G
alla
gher
S
olut
ions
, LLC
1-Ju
l-08
31-M
ar-1
9U
SD
69
3,4
13
673
5
,290
1
,205
-
10
0% 3
,650
8
52
144
7
08
-
14
Wip
ro T
echn
olog
ies
S.R
.L17
-Aug
-06
31-M
ar-1
9R
ON
16
176
7
81
1,5
80
623
-
10
0% 3
,478
4
59
81
378
-
15
Wip
ro G
ulf
LLC
1-Ju
n-11
31-M
ar-1
9O
MR
180
2
7 8
56
2,4
26
1,5
43
-
100%
2,7
34
399
9
9 3
00
384
16
O
pus
Cap
ital
Mar
kets
C
onsu
ltan
ts L
LC14
-Jan
-14
31-M
ar-1
9U
SD
69
70
310
1
,688
1
,308
-
10
0% 2
,730
(6
4) 8
9 (1
53)
-
17
Wip
ro N
etw
orks
Pte
Li
mit
ed15
-Dec
-99
31-M
ar-1
9U
SD
69
1,5
47
(279
) 3
,725
2
,457
-
10
0% 2
,532
(2
36)
(9)
(226
) -
18
Wip
ro IT
Ser
vice
s P
olan
d
SP
Z.O
.O6-
Ap
r-12
31-M
ar-1
9P
LN 1
8 *
5
33
2,0
63
1,5
31
-
100%
2,2
50
74
(142
) 2
16
-
19
Wip
ro H
old
ings
(UK
) Li
mit
ed9-
Dec
-02
31-M
ar-1
9G
BP
91
7,1
94
(4,2
51)
10,
956
8,01
4 5
70
100%
2,1
84
60
35
25
-
20
Wip
ro T
echn
olog
ies
Sou
th A
fric
a (P
rop
riet
ary)
Lim
ited
2-N
ov-1
031
-Mar
-19
ZA
R 5
2
5 4
63
931
4
43
-
100%
1,9
55
(60)
(4)
(57)
-
21
Wip
ro C
heng
du
Lim
ited
13-O
ct-0
831
-Dec
-18
RM
B 1
0 3
86
536
1
,444
5
22
-
100%
1,7
81
598
9
1 5
08
-
22
Wip
ro In
form
atio
n Te
chno
logy
Net
herl
and
s B
V
30-J
un-0
631
-Mar
-19
EU
R 7
8 1
,712
2
,202
6
,447
2
,533
-
10
0% 1
,605
4
94
3
491
-
23
Wip
ro T
echn
olog
ies
Aus
tral
ia P
ty L
td30
-Ap
r-12
31-M
ar-1
9A
UD
49
*
(479
) 1
,014
1
,493
-
10
0% 1
,562
(6
) *
(6
) -

Consolidated Financial Statements under Ind AS
286 Wipro Limited
Sl.
No.
Nam
e of
the
Subs
idia
ryDa
te o
f bec
omin
g su
bsid
iary
/ac
quis
ition
Repo
rtin
g pe
riod
Repo
rtin
g Cu
rren
cy E
xcha
nge
rate
as o
n
Mar
ch
31, 2
019/
Dece
mbe
r 31
, 201
8
Sha
re
Capi
tal(j)
R
eser
ves
& Su
rplu
s(j)
Tota
l As
sets
(j)
Tota
l Li
abili
ties
Excl
udin
g (6
) & (7
)(j)
Inve
st-
men
ts(i)
%
Hold
ing
Turn
over
(k)
P
rofit
Be
fore
Ta
xatio
n(k)
Pro
visi
on
For
Taxa
tion(k
)
Pro
fit A
fter
Ta
xatio
n(k)
Pro
pose
d Di
vide
nd
(incl
. di
vide
nd
tax)
(k)
24
Wip
ro d
o B
rasi
l Ser
vico
s d
e Te
cnol
ogia
S.A
(F
orm
erly
kno
wn
as
Info
serv
er S
A)
10-A
pr-
1731
-Dec
-18
BR
L 1
8 2
65
(41)
636
4
12
-
100%
1,5
38
163
4
3 1
20
-
25
PT
WT
Ind
ones
ia24
-Jul
-09
31-M
ar-1
9ID
R 0
.005
6
5 8
55
1,7
22
802
-
10
0% 1
,415
4
50
97
353
-
26
W
ipro
Por
tuga
l SA
30-J
un-0
631
-Mar
-19
EU
R 7
8 4
2
,789
3
,012
2
19
-
100%
1,2
89
220
1
8 2
02
-
27
Ap
pir
io L
td. (
UK
)23
-Nov
-16
31-M
ar-1
9G
BP
91
*
(442
) 7
93
1,2
35
-
100%
1,2
88
230
4
2 1
88
-
28
Wip
ro D
oha
LLC
26-F
eb-1
431
-Mar
-19
QA
R 1
9 4
3
98
715
3
13
-
49%
1,2
72
315
2
8 2
87
-
29
Wip
ro IT
Ser
vice
s B
angl
ades
h Li
mit
ed9-
Jan-
1831
-Mar
-19
BD
T 0
.82
348
1
31
1,6
68
1,1
89
-
100%
1,1
87
184
6
5 1
20
-
30
Wip
ro (D
alia
n) L
imit
ed25
-Dec
-15
31-D
ec-1
8R
MB
10
535
2
6
91
154
-
10
0% 1
,093
1
06
14
92
-
31
Cel
lent
Gm
bH
15-J
an-1
631
-Mar
-19
EU
R 7
8 6
4
15
570
1
49
-
100%
1,0
64
(8)
3
(11)
-
32
Coo
per
Sof
twar
e, L
LC23
-Oct
-17
31-M
ar-1
9U
SD
69
15
(610
) 5
00
1,0
95
-
100%
951
(2
6) (2
8) 2
-
33
D
esig
nit
Ger
man
y G
mb
H
(for
mer
ly k
now
n as
D
esig
nit
Mun
ich
Gm
bH
)
7-N
ov-0
731
-Mar
-19
EU
R 7
8 2
(2
01)
130
3
29
-
100%
719
(2
3) *
(2
3) -
34
Ap
pir
io, K
.K.
23-N
ov-1
631
-Mar
-19
JPY
0.6
2 6
(2
10)
355
5
60
-
100%
675
5
4 *
5
4 -
35
W
ipro
Tec
hnol
ogie
s S
A22
-Ap
r-08
31-M
ar-1
9A
RS
2
173
3
1 3
37
133
-
10
0% 6
10
79
45
34
-
36
Ap
pir
io L
td.
23-N
ov-1
631
-Mar
-19
EU
R 7
8 8
66
(843
) 7
78
755
-
10
0% 5
23
26
14
12
-
37
Des
igni
t O
slo
A/S
1-D
ec-0
631
-Mar
-19
NO
K 8
1
5
7 1
85
127
-
10
0% 5
23
(18)
(4)
(14)
-
38
Des
igni
t S
wed
en A
B11
-Jun
-07
31-M
ar-1
9S
EK
7
1
38
169
1
30
-
100%
442
4
0 *
4
0 -
39
W
ipro
Cyp
rus
SE
(F
orm
erly
kno
wn
as
Wip
ro C
ypru
s P
ublic
Li
mit
ed)
27-A
pr-
0631
-Mar
-19
INR
1
10
29,
133
37,
807
8,6
64
-
100%
442
6
04
55
548
-
40
Des
igni
t S
pai
n D
igit
al S
L4-
Nov
-10
31-M
ar-1
9E
UR
78
*
45
197
1
52
-
100%
406
(2
0) 1
(2
2) -
41
D
esig
nit
T.L.
V Lt
d.
1-M
ar-0
531
-Mar
-19
ILS
19
*
137
1
82
45
-
100%
362
2
7 6
2
1 -
42
H
ealt
hpla
n S
ervi
ces
Insu
ranc
e A
genc
y, L
LC29
-Feb
-16
31-M
ar-1
9U
SD
69
*
81
87
6
-
100%
352
6
3 (4
1) 1
03
-
43
Wip
ro T
echn
olog
y C
hile
S
PA19
-Dec
-11
31-M
ar-1
9C
LP 0
.10
123
(1
73)
286
3
36
-
100%
303
(5
9) 1
(6
1) -
44
Wip
ro T
echn
olog
ies
Nig
eria
Lim
ited
15-A
ug-1
231
-Mar
-19
NG
N 0
.19
3
75
577
4
99
-
100%
290
8
0 4
8 3
3 -
45
Wip
ro B
ahra
in L
imit
ed
Co.
S.P
.C28
-Oct
-09
31-M
ar-1
9B
HD
183
9
4
88
679
1
83
-
100%
231
(9
9) *
(9
9) -
46
Wip
ro O
utso
urci
ng
Ser
vice
s (I
rela
nd)
Lim
ited
14-M
ay-1
231
-Mar
-19
EU
R 7
8 *
2
10
390
1
80
-
100%
493
(4
7) 3
(5
0) -
47
Wip
ro P
olan
d S
p Z
.o.o
.1-
Jul-
0831
-Mar
-19
PLN
18
1
391
4
57
65
-
100%
217
4
5 7
3
9 -
48
W
ipro
Tec
hnol
ogie
s P
eru
SA
C15
-Aug
-12
31-M
ar-1
9P
EN
21
39
57
161
6
6 -
10
0% 2
12
52
18
34
-
49
Wip
ro (T
haila
nd) C
o,
Lim
ited
30-J
ul-0
731
-Mar
-19
THB
2
224
2
18
470
2
7 -
10
0% 2
03
19
8
11
-
50
Wip
ro J
apan
KK
1-M
ay-9
831
-Mar
-19
JPY
0.6
2 2
69
337
6
34
27
-
100%
202
1
9 *
1
8 -
51
W
ipro
Tec
hnol
ogie
s W
T S
ocie
dad
Ano
nim
a15
-Oct
-10
31-M
ar-1
9C
RC
0.1
1 *
(4
21)
149
5
70
-
100%
195
(2
62)
*
(262
) -
52
Des
igni
t C
olom
bia
S A
S21
-Dec
-15
31-D
ec-1
8C
OP
0.0
2 4
(2
4) 7
0 8
9 -
10
0% 1
69
(2)
11
(12)
-
53
Wip
ro In
form
atio
n Te
chno
logy
Kaz
akhs
tan
LLP
27-S
ep-0
631
-Mar
-19
KZ
T 0
.18
5
(25)
238
2
58
-
100%
169
2
4 6
1
8 -
54
Des
igni
t To
kyo
Ltd
6-M
ay-1
331
-Mar
-19
JPY
0.6
2 1
0 (6
8) 7
6 1
34
-
100%
156
5
0 1
6 3
4 -
55
W
ipro
Sha
ngha
i Lim
ited
27-A
pr-
0431
-Dec
-18
RM
B 1
0 1
09
242
6
68
316
-
10
0% 1
54
10
3
6
-
56
Des
igni
t P
eru
S. A
. C
1-S
ep-1
631
-Mar
-19
PE
N 2
1 2
(3
4) 5
0 8
1 -
10
0% 1
41
(8)
1
(8)
-

Consolidated Financial Statements under Ind AS
Annual Report 2018-19 287
Sl.
No.
Nam
e of
the
Subs
idia
ryDa
te o
f bec
omin
g su
bsid
iary
/ac
quis
ition
Repo
rtin
g pe
riod
Repo
rtin
g Cu
rren
cy E
xcha
nge
rate
as o
n
Mar
ch
31, 2
019/
Dece
mbe
r 31
, 201
8
Sha
re
Capi
tal(j)
R
eser
ves
& Su
rplu
s(j)
Tota
l As
sets
(j)
Tota
l Li
abili
ties
Excl
udin
g (6
) & (7
)(j)
Inve
st-
men
ts(i)
%
Hold
ing
Turn
over
(k)
P
rofit
Be
fore
Ta
xatio
n(k)
Pro
visi
on
For
Taxa
tion(k
)
Pro
fit A
fter
Ta
xatio
n(k)
Pro
pose
d Di
vide
nd
(incl
. di
vide
nd
tax)
(k)
57
Fron
twor
x In
form
atio
nste
chno
logi
e G
mb
H
15-J
an-1
631
-Mar
-19
EU
R 7
8 9
3 2
1 1
78
64
-
100%
103
6
1
5
-
58
Wip
ro In
sura
nce
Sol
utio
ns L
LC30
-Nov
-12
31-M
ar-1
9U
SD
69
28
109
1
85
48
-
100%
79
4
1
3
-
59
Wip
ro T
echn
olog
ies
Lim
ited
8-Fe
b-0
831
-Dec
-18
RU
B 1
1
0 2
02
259
4
7 -
10
0% 7
5 7
1
6
-
60
Wip
ro T
rave
l Ser
vice
s Li
mit
ed10
-Jun
-96
31-M
ar-1
9IN
R 1
1
1
23
549
4
26
-
100%
54
4
1
3
-
61
Wip
ro D
o B
rasi
l S
iste
met
as D
e In
form
atic
a Lt
d
22-A
ug-1
431
-Dec
-18
BR
L 1
8 2
5 (3
8) 8
4 9
7 -
10
0% 4
9 (4
0) *
(4
0) -
62
Wip
ro P
rom
ax A
naly
tics
S
olut
ions
Am
eric
as, L
LC30
-Ap
r-12
31-M
ar-1
9U
SD
69
2
(416
) 1
10
524
-
10
0% 3
3 (9
9) 3
8 (1
36)
-
63
Wip
ro T
echn
olog
ies
SD
N
BH
D16
-Nov
-06
31-M
ar-1
9M
YR 1
7 *
7
9
3
-
10
0% 1
8 *
*
*
-
64
Wip
ro H
old
ings
In
vest
men
t K
orlá
tolt
Fe
lelő
sség
ű Tá
rsas
ág
23-M
ar-1
731
-Dec
-18
US
D 7
0 1
2
4,60
3 2
4,63
9 3
5 -
10
0% *
6
74
61
614
-
65
Des
igni
t D
enm
ark
A/S
13-S
ep-9
031
-Mar
-19
DK
K 1
0 1
3 9
37
1,6
38
688
-
10
0% *
5
21
(35)
556
-
66
D
esig
nit
A/S
31-M
ay-1
331
-Mar
-19
DK
K 1
0 1
04
673
1
,761
9
83
-
100%
*
303
(3
) 3
06
-
67
Wip
ro C
orp
orat
e Te
chno
logi
es G
hana
Li
mit
ed
9-Ju
l-14
31-M
ar-1
9G
HS
13
29
2
32
1
-
100%
*
6
*
6
-
68
Wip
ro T
rad
emar
ks
Hol
din
g Li
mit
ed30
-Oct
-82
31-M
ar-1
9IN
R 1
1
4
3 4
4 *
-
10
0% *
3
1
2
-
69
Wip
ro E
urop
e Li
mit
ed
1-Ju
n-11
31-M
ar-1
9G
BP
91
9
156
1
65
*
-
100%
*
*
*
*
-
70
Ap
pir
io G
mb
H23
-Nov
-16
31-M
ar-1
9E
UR
78
2
*
2
*
-
100%
*
*
*
*
-
71
Top
Cod
er In
c.
23-N
ov-1
631
-Mar
-19
US
D 6
9 1
,211
(1
,248
) 2
0 5
7 -
10
0% *
*
*
*
-
72
W
ipro
Ove
rsea
s IT
S
ervi
ces
Pri
vate
Lim
ited
12-M
ay-1
531
-Mar
-19
INR
1
1
*
*
*
-
100%
*
*
*
*
-
73
Wip
ro IT
Ser
vice
s U
krai
ne, L
LC6-
Oct
-14
31-M
ar-1
9U
AH
3
*
(3)
*
3
-
100%
*
*
*
*
-
74
Wip
ro In
form
atio
n Te
chno
logy
Egy
pt
SA
E(b
)22
-May
-08
31-M
ar-1
9E
GP
4
3
(125
) 2
7 1
49
-
100%
*
(1)
*
(1)
-
75
Wip
ro S
A B
road
Bas
ed
Ow
ners
hip
Sch
eme
SP
V (R
f) (P
ty) L
td
17-J
an-1
431
-Mar
-19
ZA
R 5
6
55
1
659
2
-
10
0% *
(1
) *
(1
) -
76
Wip
ro T
echn
olog
ies
VZ,
C.A
.13
-Jun
-13
31-M
ar-1
9VE
S 0
.02
*
*
*
*
-
100%
*
(1)
*
(1)
-
77
Rai
nbow
Sof
twar
e LL
C10
-Jan
-16
31-D
ec-1
8IQ
D 0
.06
*
(4)
*
4
-
100%
*
(2)
*
(2)
-
78
Wom
en’s
Bus
ines
s P
ark
Tech
nolo
gies
Lim
ited
26
-Oct
-17
31-M
ar-1
9S
AR
18
69
(3)
68
2
-
55%
*
(3)
*
(3)
-
79
Wip
ro F
inan
cial
s se
rvic
es U
K L
imit
ed
30-A
pr-
1231
-Mar
-19
GB
P 9
1 *
(4
1) 1
0 5
1 -
10
0% *
(5
) (1
) (4
) -
80
Wip
ro IT
Ser
vice
s S
.R.L
(c)
1-N
ov-1
831
-Mar
-19
RO
N 1
6 *
(2
7) 6
6 9
3 -
10
0% *
(2
9) *
(2
9) -
81
W
ipro
UK
Lim
ited
1-Ju
n-11
31-M
ar-1
9G
BP
91
64
64
1,1
50
1,0
22
-
100%
*
(30)
(45)
15
-
82
Wip
ro D
igit
al A
ps
29-J
un-1
531
-Mar
-19
DK
K 1
0 1
3
,093
3
,131
3
8 -
10
0% *
(1
67)
(5)
(162
) -
83
W
ipro
Hol
din
gs H
unga
ry
Kor
láto
lt F
elel
őssé
gű
Társ
aság
17-S
ep-0
731
-Dec
-18
US
D 7
0 1
,919
3
6,29
5 3
8,21
9 6
-
10
0% *
(2
40)
9
(249
) -
84
Wip
ro IT
Ser
vice
s, In
c6-
Ap
r-15
31-M
ar-1
9U
SD
69
26,
054
(23,
560)
44,
773
42,
279
-
100%
*
(21,
451)
11
(21,
461)
1,7
45
85
Wip
ro U
S F
ound
atio
n(d
)25
-Jan
-19
31-M
ar-1
9U
SD
69
*
*
*
*
-
100%
*
*
*
*
-

Consolidated Financial Statements under Ind AS
288 Wipro Limited
Azi
m H
Pre
mji
N V
aghu
l
Exe
cuti
ve C
hair
man
& M
anag
ing
Dir
ecto
r D
irec
tor
Abi
dali
Z N
eem
uchw
ala
Jati
n P
Dal
alM
San
aulla
Kha
nC
hief
Exe
cuti
ve O
ffic
er &
Exe
cuti
ve D
irec
tor
Chi
ef F
inan
cial
Off
icer
Com
pany
Sec
reta
ry
Ben
galu
ruJu
ne 6
, 201
9
Not
e:
(a)
Wip
ro H
R S
ervi
ces
Ind
ia P
riva
te L
imit
ed (f
orm
erly
kno
wn
as A
light
HR
Ser
vice
s In
dia
Pri
vate
Lim
ited
) was
acq
uire
d o
n A
ugus
t 31
, 201
8.
(b)
Wip
ro In
form
atio
n Te
chno
logy
Egy
pt
SA
E h
as b
een
put
into
liq
uid
atio
n w
ith
effe
ct f
rom
Sep
tem
ber
30,
201
6.
(c)
Wip
ro IT
Ser
vice
s S
.R.L
, Rom
ania
was
inco
rpor
ated
on
Nov
emb
er 1
, 201
8.
(d)
Wip
ro U
S F
ound
atio
n w
as in
corp
orat
ed o
n Ja
nuar
y 25
, 201
9 an
d is
yet
to
com
men
ce o
per
atio
ns.
(e)
Pur
suan
t to
ord
er d
ated
Mar
ch 2
9, 2
019,
the
Hon
’ble
Nat
iona
l C
omp
any
Law
Tri
bun
al, B
enga
luru
ben
ch, a
pp
rove
d t
he s
chem
e of
am
alga
mat
ion
for
the
mer
ger
of o
ur w
holly
-ow
ned
su
bsi
dia
ries
, Wip
ro In
form
atio
n Te
chno
logy
Aus
tria
Gm
bH
, Wip
ro T
echn
olog
ies
Aus
tria
Gm
bH
, New
Logi
c Te
chno
logi
es S
AR
L an
d A
pp
irio
Ind
ia C
loud
Sol
utio
ns P
riva
te L
imit
ed, w
ith
and
in
to W
ipro
Lim
ited
. As
per
the
sai
d s
chem
e, t
he a
pp
oint
ed d
ate
is A
pri
l 1, 2
018.
Hen
ce, fi
nanc
ial i
nfor
mat
ion
for
the
said
ent
itie
s ar
e no
t in
clud
ed in
the
ab
ove
list.
(f)
Cel
lent
Mit
tels
tand
sber
atun
g G
mb
H g
ot m
erge
d w
ith
and
into
Cel
lent
GM
BH
. wit
h ef
fect
fro
m N
ovem
ber
6, 2
018.
Hen
ce, fi
nanc
ial i
nfor
mat
ion
of t
he e
ntit
y is
not
incl
uded
in t
he a
bov
e lis
t
(g)
Ap
pir
io S
inga
por
e P
te L
td w
as li
qui
dat
ed w
ith
effe
ct f
rom
Feb
ruar
y 4,
201
9. H
ence
, fina
ncia
l inf
orm
atio
n of
the
ent
ity
is n
ot in
clud
ed in
the
ab
ove
list.
(h)
The
Com
pan
y re
duc
ed it
s sh
areh
old
ing
in W
AIS
L Li
mit
ed (f
orm
erly
kno
wn
as W
ipro
Air
por
t IT
Ser
vice
s Li
mit
ed) f
rom
74%
to 1
1% o
n A
pri
l 5, 2
018.
Hen
ce, p
arti
cula
rs o
f WA
ISL
Lim
ited
are
no
t in
clud
ed in
the
ab
ove
list.
(i)
Inve
stm
ents
exc
lud
es in
vest
men
ts in
sub
sid
iari
es a
nd a
ssoc
iate
s.
(j)
Ind
ian
rup
ee e
qui
vale
nts
of t
he fi
gure
s in
fore
ign
curr
enci
es o
f ac
coun
ts o
f th
e su
bsi
dia
ry c
omp
anie
s ar
e b
ased
on
the
exch
ange
rat
es a
s of
the
res
pec
tive
rep
orti
ng p
erio
d e
nd d
ates
.
(k)
Ind
ian
rup
ee e
qui
vale
nts
of t
he fi
gure
s in
fore
ign
curr
enci
es o
f ac
coun
ts o
f th
e su
bsi
dia
ry c
omp
anie
s ar
e co
nver
ted
on
the
year
ly a
vera
ge e
xcha
nge
rate
s.
* Va
lue
is le
ss t
han
One
Mill
ion
Rup
ees
Par
t B
- A
ssoc
iate
s an
d Jo
int V
entu
res
Nam
e of
the
asso
ciat
es/J
oint
Ve
ntur
es
Late
st a
udite
d Ba
lanc
e S
heet
da
te
Date
on
whi
ch
the
Asso
ciat
e or
Jo
int V
entu
re w
as
asso
ciat
ed o
r ac
quire
d
No. o
f sha
res h
eld
by th
e Co
mpa
ny in
Ass
ocia
te o
n th
e ye
aren
d
Amou
nt o
f in
vest
men
t in
Asso
ciat
es
Exte
nt o
f Ho
ldin
g (in
pe
rcen
tage
)
Desc
riptio
n of
how
ther
e is
sign
ifica
nt in
fluen
ceRe
ason
why
the
asso
ciat
e/jo
int
vent
ure
is n
ot
cons
olid
ated
Netw
orth
at
trib
utab
le to
sh
areh
oldi
ng a
s pe
r lat
est a
udite
d Ba
lanc
e Sh
eet
Profi
t or L
oss f
or th
e ye
ar
Cons
ider
ed in
Co
nsol
idat
ion
Not C
onsi
dere
d in
Con
solid
atio
n
Dri
vest
ream
, In
c.31
-Dec
-17
12-J
un-1
794
,527
Ser
ies
A
Pre
ferr
ed S
tock
27
,865
com
mon
sto
ck
190,
525
Ser
ies
B
Pre
ferr
ed s
tock
US
D
9,48
0,03
243
.75%
Ext
ent
of e
qui
ty
hold
ing
in t
he
asso
ciat
e co
mp
any
exce
eds
20%
Not
A
pp
licab
leU
SD
(1,0
88,9
37)
US
D
(199
,450
)U
SD
(2
56,4
64)
Den
im G
roup
Lt
d.
31-D
ec-1
71-
Mar
-18
510
Ser
ies
A P
refe
rred
U
nits
US
D
8,63
3,33
333
.33%
Ext
ent
of e
qui
ty
hold
ing
in t
he
asso
ciat
e co
mp
any
exce
eds
20%
Not
A
pp
licab
leU
SD
729
,214
US
D
(328
,470
)U
SD
(6
56,9
41)
Den
im G
roup
M
anag
emen
t,
LLC
-1-
Mar
-18
500
Mem
ber
ship
U
nits
US
D
200,
000
33.0
0%E
xten
t of
eq
uity
ho
ldin
g in
the
as
soci
ate
com
pan
y ex
ceed
s 20
%
Not
A
pp
licab
le-
--

Consolidated Financial Statements Under IFRS
Annual Report 2018-19 289
Report of Independent Registered Public Accounting Firm
To the Shareholders and the Board of Directors of Wipro Limited
Opinion on the Financial Statements
We have audited the accompanying consolidated statements of financial position of Wipro Limited and subsidiaries (the “Company”) as of March 31, 2019 and 2018, the related consolidated statements of income, consolidated statements of comprehensive income, consolidated statements of changes in equity, and consolidated statements of cash flows for each of the two years in the period ended March 31, 2019 and the related notes (collectively referred to as the “financial statements”). In our opinion, the financial statements present fairly, in all material respects, the financial position of the Company as of March 31, 2019 and March 31, 2018, and the results of its operations and its cash flows for each of the two years in the period ended March 31, 2019, in conformity with the International Financial Reporting Standards as issued by the International Accounting Standards Board (“IFRS”).
We have also audited, in accordance with the standards of the Public Company Accounting Oversight Board (United States) (PCAOB), the Company’s internal control over financial reporting as of March 31, 2019, based on criteria established in Internal Control — Integrated Framework (2013) issued by the Committee of Sponsoring Organizations of the Treadway Commission and our report dated June 7, 2019, expressed an unqualified opinion on the Company’s internal control over financial reporting.
Change in Accounting Principle
As discussed in Note 3 to the financial statements, the Company has changed its method of accounting for
revenue from contracts with customers in fiscal year 2019 due to the adoption of International Financial Reporting Standard 15, Revenue from Contracts with Customers.
Basis for Opinion
These financial statements are the responsibility of the Company’s management. Our responsibility is to express an opinion on the Company’s financial statements based on our audits. We are a public accounting firm registered with the PCAOB and are required to be independent with respect to the Company in accordance with the U.S. federal securities laws and the applicable rules and regulations of the Securities and Exchange Commission and the PCAOB.
We conducted our audits in accordance with the standards of the PCAOB. Those standards require that we plan and perform the audit to obtain reasonable assurance about whether the financial statements are free of material misstatement, whether due to error or fraud. Our audits included performing procedures to assess the risks of material misstatement of the financial statements, whether due to error or fraud, and performing procedures that respond to those risks. Such procedures included examining, on a test basis, evidence regarding the amounts and disclosures in the financial statements. Our audits also included evaluating the accounting principles used and significant estimates made by management, as well as evaluating the overall presentation of the financial statements. We believe that our audits provide a reasonable basis for our opinion.
Deloitte Haskins & Sells LLP
Bengaluru, India
June 11, 2019
Independent Auditor’s Report

Consolidated Financial Statements Under IFRS
290 Wipro Limited
WIPRO LIMITED AND SUBSIDIARIES CONSOLIDATED STATEMENT OF FINANCIAL POSITION
(` in millions, except share and per share data, unless otherwise stated)
Notes As at March 31,2018 2019 2019
Convenience translation into US
dollar in millions (unaudited) Refer
Note 2(iii) ASSETS Goodwill .......................................................................... 5 117,584 116,980 1,691 Intangible assets .............................................................. 5 18,113 13,762 199 Property, plant and equipment ........................................... 4 64,443 70,601 1,021 Financial assets ............................................................... Derivative assets ..................................................... 15 41 173 3 Investments ............................................................ 7 7,668 6,916 100 Trade receivables ..................................................... 8 4,446 4,373 63 Other financial assets .............................................. 11 4,186 5,146 74 Investments accounted for using the equity method ........... 7 1,206 1,235 18 Deferred tax assets 17 6,908 5,604 81 Non-current tax assets ..................................................... 18,349 20,603 298 Other non-current assets .................................................. 11 11,540 15,872 229Total non-current assets ........................................................... 254,484 261,265 3,777 Inventories ....................................................................... 9 3,370 3,951 57 Financial assets ............................................................... Derivative assets ..................................................... 15 1,232 4,931 71 Investments ............................................................ 7 249,094 220,716 3,191 Cash and cash equivalents ....................................... 10 44,925 158,529 2,292 Trade receivables ..................................................... 8 100,990 100,489 1,453 Unbilled receivables ................................................. 42,486 22,880 331 Other financial assets .............................................. 11 7,429 14,611 211 Contract assets ................................................................ - 15,038 217 Current tax assets ............................................................ 6,262 7,435 108 Other current assets ......................................................... 11 23,167 23,086 334
478,955 571,666 8,265 Assets held for sale .......................................................... 22 27,201 240 3Total current assets .................................................................. 506,156 571,906 8,268TOTAL ASSETS 760,640 833,171 12,045EQUITY Share capital .................................................................... 9,048 12,068 174 Securities premium reserve ............................................... 800 533 8 Retained earnings ............................................................ 453,265 534,700 7,731 Share-based payment reserve ........................................... 1,772 2,617 38 Other components of equity .............................................. 18,051 18,198 263Equity attributable to the equity holders of the Company ............ 482,936 568,116 8,214Non-controlling interest ............................................................ 2,410 2,637 38TOTAL EQUITY 485,346 570,753 8,252LIABILITIES Financial liabilities ........................................................... Long - term loans and borrowings .............................. 12 45,268 28,368 410 Derivative liabilities .................................................. 15 7 - - Other financial liabilities .......................................... 14 7 - - Deferred tax liabilities....................................................... 17 3,059 3,417 49 Non-current tax liabilities ................................................. 9,220 11,023 159 Other non-current liabilities .............................................. 14 4,223 5,258 76 Provisions ........................................................................ 14 3 2 ^ Total non-current liabilities ...................................................... 61,787 48,068 694 Financial liabilities ........................................................... Loans, borrowings and bank overdrafts ...................... 12 92,991 71,099 1,028 Derivative liabilities .................................................. 15 2,210 1,310 19 Trade payables and accrued expenses ....................... 13 68,129 88,304 1,277 Other financial liabilities .......................................... 14 1,050 644 9 Contract liabilities ............................................................ 17,139 24,768 358 Current tax liabilities ........................................................ 9,417 9,541 138 Other current liabilities ..................................................... 14 15,563 18,046 261 Provisions 14 796 638 9
207,295 214,350 3,099 Liabilities directly associated with assets held for sale........ 22 6,212 - -Total current liabilities .............................................................. 213,507 214,350 3,099TOTAL LIABILITIES 275,294 262,418 3,793TOTAL EQUITY AND LIABILITIES 760,640 833,171 12,045^ Value is less than ` 1
The accompanying notes form an integral part of these consolidated financial statements.

Consolidated Financial Statements Under IFRS
Annual Report 2018-19 291
Year ended March 31, Notes 2017 2018 2019 2019
Convenience translation
into US dollar in millions
(unaudited) Refer Note
2(iii) Revenues ................................................ 20 550,402 544,871 585,845 8,471 Cost of revenues ..................................... 21 (391,544) (385,575) (413,033) (5,972)Gross profit 158,858 159,296 172,812 2,499 Selling and marketing expenses ............. 21 (40,817) (42,349) (44,510) (644) General and administrative expenses ..... 21 (32,021) (34,141) (35,951) (520) Foreign exchange gains/(losses), net ...... 24 3,777 1,488 3,215 46 Other operating income .......................... 22 4,082 - 4,344 63Results from operating activities 93,879 84,294 99,910 1,444 Finance expenses ................................... 23 (5,942) (5,830) (7,375) (107) Finance and other income ....................... 24 22,419 23,999 22,923 331 Share of net profit /(loss) of associates
accounted for using the equity method ... 7 - 11 (43) (1)Profit before tax 110,356 102,474 115,415 1,667 Income tax expense ................................ 17 (25,213) (22,390) (25,242) (365)Profit for the year 85,143 80,084 90,173 1,302Profit attributable to: Equity holders of the Company ............... 84,895 80,081 90,031 1,300 Non-controlling interest ......................... 248 3 142 2Profit for the year 85,143 80,084 90,173 1,302Earnings per equity share: 25Attributable to equity shareholders of the Company Basic ...................................................... 13.11 12.64 14.99 0.22 Diluted .................................................... 13.07 12.62 14.95 0.22Weighted average number of equity shares used in computing earnings per equity share Basic ...................................................... 6,476,108,013 6,333,391,200 6,007,376,837 6,007,376,837 Diluted .................................................... 6,495,129,517 6,344,482,633 6,022,304,367 6,022,304,367
The accompanying notes form an integral part of these consolidated financial statements.
WIPRO LIMITED AND SUBSIDIARIES CONSOLIDATED STATEMENT OF INCOME
(` in millions, except share and per share data, unless otherwise stated)

Consolidated Financial Statements Under IFRS
292 Wipro Limited
WIPRO LIMITED AND SUBSIDIARIESCONSOLIDATED STATEMENT OF COMPREHENSIVE INCOME
(` in millions, except share and per share data, unless otherwise stated)
Year ended March 31, Notes 2017 2018 2019 2019
Convenience translation
into US dollar in millions
(unaudited) Refer Note
2(iii)Profit for the year ..................................................... 85,143 80,084 90,173 1,302Other comprehensive income (OCI)Items that will not be reclassified to profit and loss in subsequent periodsDefined benefit plan actuarial gains/(losses) ........... 169 567 235 3Net change in fair value of financial instruments through OCI .............................................................. (168) (750) (464) (7)
1 (183) (229) (4)Items that may be reclassified to profit and loss in subsequent periodsForeign currency translation differences 16 Translation difference relating to foreign
operations ........................................................ (3,354) 3,576 3,238 47 Net change in fair value of hedges of net
investment in foreign operations ...................... 276 (49) (287) (4) Reclassification of foreign currency translation
differences to profit and loss on sale of hosted data center services, Workday and Cornerstone OnDemand business ......................................... - - (4,210) (61)
Net change in time value of option contracts designated as cash flow hedges ................................................. 9 1 463 7Net change in intrinsic value of option contracts designated as cash flow hedges ............................... 77 (76) 811 12Net change in fair value of forward contracts designated as cash flow hedges ............................... 3,910 (5,945) 1,255 18Net change in fair value of financial instruments through OCI .............................................................. 1,179 (433) (18) ^
2,097 (2,926) 1,252 19Total other comprehensive income, net of taxes ...... 2,098 (3,109) 1,023 15Total comprehensive income for the year ................. 87,241 76,975 91,196 1,317Total comprehensive income attributable to:Equity holders of the Company ................................ 87,062 76,956 90,945 1,315Non-controlling interest .......................................... 179 19 251 4
87,241 76,975 91,196 1,319^ Value is less than ` 1
The accompanying notes form an integral part of these consolidated financial statements.

Consolidated Financial Statements Under IFRS
Annual Report 2018-19 293
WIP
RO
LIM
ITE
D A
ND
SU
BS
IDIA
RIE
SC
ON
SO
LID
ATE
D S
TATE
ME
NT
OF
CH
AN
GE
S IN
EQ
UIT
Y ( `
in m
illio
ns, e
xcep
t sh
are
and
per s
hare
dat
a, u
nles
s ot
herw
ise
stat
ed)
Num
ber
of
Sha
res*
Sha
re
cap
ital
, fu
lly p
aid
-up
Sec
urit
ies
pre
miu
mre
serv
eR
etai
ned
ea
rnin
gs
Sha
re-
bas
ed
pay
men
t re
serv
e
Oth
er c
omp
onen
ts o
f eq
uity
Eq
uity
at
trib
utab
le
to t
he e
qui
ty
hold
ers
of t
he
Com
pan
y
Non
-co
ntro
lling
in
tere
stTo
tal
equi
tyP
arti
cula
rs
Fore
ign
curr
ency
tr
ansl
atio
n re
serv
e
Cas
h fl
ow
hed
ging
re
serv
eO
ther
re
serv
es
As
at A
pri
l 1, 2
016
......
......
......
......
......
......
......
......
..2,
470,
713,
290
4,94
114
,642
425,
118
2,22
916
,116
1,91
021
646
5,17
22,
212
467,
384
Tota
l com
pre
hens
ive
inco
me
for
the
year
Pro
fit
for
the
year
.....
......
......
......
......
......
......
.....
--
-84
,895
--
--
84,8
9524
885
,143
Oth
er c
omp
rehe
nsiv
e in
com
e ...
......
......
......
......
--
--
-(3
,009
)3,
996
1,18
02,
167
(69)
2,09
8
Tota
l com
pre
hens
ive
inco
me
for
the
year
--
-84
,895
-(3
,009
)3,
996
1,18
087
,062
179
87,2
41
Tran
sact
ion
wit
h ow
ners
of
the
Com
pan
y,
reco
gniz
ed d
irec
tly
in e
qui
ty ..
......
......
......
......
......
..
Con
trib
utio
ns b
y an
d d
istr
ibut
ions
to
owne
rs o
f th
e C
omp
any
......
......
......
......
......
......
......
......
......
......
....
Cas
h d
ivid
end
pai
d (i
nclu
din
g d
ivid
end
tax
the
reon
)-
--
(8,7
34)
--
--
(8,7
34)
-(8
,734
)
Issu
e of
eq
uity
sha
res
on e
xerc
ise
of o
pti
ons
......
...18
7,27
5 ^
81
-(8
1)-
--
--
-
Issu
e of
sha
res
by c
ontr
olle
d t
rust
on
exer
cise
of
opti
ons .
......
......
......
......
......
......
......
......
......
......
.....
.-
--
384
(384
)-
--
--
-
Buy
bac
k of
eq
uity
sha
res
......
......
......
......
......
......
...
(40,
000,
000)
(80)
(14,
254)
(10,
746)
--
-80
(25,
000)
-(2
5,00
0)
Com
pen
sati
on c
ost
rela
ted
to
emp
loye
e sh
are-
bas
ed p
aym
ent
......
......
......
......
......
......
......
......
.....
.-
--
131,
791
--
-1,
804
-1,
804
Tota
l tra
nsac
tion
s w
ith
ow
ners
of
the
Com
pan
y ...
.(3
9,81
2,72
5)(8
0)(1
4,17
3)(1
9,08
3)1,
326
--
80(3
1,93
0)-
(31,
930)
As
at M
arch
31,
201
7 ...
......
......
......
......
......
......
.....
..2,
430,
900,
565
4,86
146
949
0,93
03,
555
13,1
075,
906
1,47
652
0,30
42,
391
522,
695
The
acco
mp
anyi
ng n
otes
form
an
inte
gral
par
t of
the
se c
onso
lidat
ed fi
nanc
ial s
tate
men
ts.

Consolidated Financial Statements Under IFRS
294 Wipro Limited
WIP
RO
LIM
ITE
D A
ND
SU
BS
IDIA
RIE
SC
ON
SO
LID
ATE
D S
TATE
ME
NT
OF
CH
AN
GE
S IN
EQ
UIT
Y ( `
in m
illio
ns, e
xcep
t sh
are
and
per s
hare
dat
a, u
nles
s ot
herw
ise
stat
ed)
Num
ber
of
Sha
res*
Sha
re
cap
ital
, fu
lly p
aid
-up
Sec
urit
ies
pre
miu
m
rese
rve
Ret
aine
d
earn
ings
Sha
re-
bas
ed
pay
men
t re
serv
e
Oth
er c
omp
onen
ts o
f eq
uity
Eq
uity
at
trib
utab
le
to t
he e
qui
ty
hold
ers
of t
he
Com
pan
y
Non
-co
ntro
lling
in
tere
stTo
tal
equi
tyP
arti
cula
rs
Fore
ign
curr
ency
tr
ansl
atio
n re
serv
e
Cas
h fl
ow
hed
ging
re
serv
eO
ther
re
serv
es
As
at A
pri
l 1, 2
017
2,43
0,90
0,56
54,
861
469
490,
930
3,55
513
,107
5,90
61,
476
520,
304
2,39
152
2,69
5
Tota
l com
pre
hens
ive
inco
me
for
the
year
Pro
fit
for
the
year
.....
......
......
......
......
......
......
.....
--
-80
,081
--
--
80,0
813
80,0
84
Oth
er c
omp
rehe
nsiv
e in
com
e ...
......
......
......
......
--
--
-3,
511
(6,0
20)
(616
)(3
,125
)16
(3,1
09)
Tota
l com
pre
hens
ive
inco
me
for
the
year
--
-80
,081
-3,
511
(6,0
20)
(616
)76
,956
1976
,975
Tran
sact
ion
wit
h ow
ners
of
the
Com
pan
y,
reco
gniz
ed d
irec
tly
in e
qui
ty
Con
trib
utio
ns b
y an
d d
istr
ibut
ions
to
owne
rs o
f th
e C
omp
any
Cas
h d
ivid
end
pai
d (i
nclu
din
g d
ivid
end
tax
th
ereo
n) ..
......
......
......
......
......
......
......
......
......
......
...-
--
(5,4
20)
--
--
(5,4
20)
-(5
,420
)
Issu
e of
eq
uity
sha
res
on e
xerc
ise
of o
pti
ons
3,55
9,59
98
1,98
7-
(1,9
71)
--
-24
-24
Issu
e of
sha
res
by c
ontr
olle
d t
rust
on
exer
cise
of
opti
ons .
......
......
......
......
......
......
......
......
......
......
.....
.-
--
1,18
2(1
,182
)-
--
--
-
Buy
bac
k of
eq
uity
sha
res
# ..
......
......
......
......
......
....
(343
,750
,000
)(6
87)
(1,6
56)
(108
,344
)-
--
687
(110
,000
)-
(110
,000
)
Tran
sact
ion
cost
rel
ated
to
buy
bac
k ...
......
......
......
..-
--
(312
)-
--
-(3
12)
(312
)
Bon
us is
sue
of e
qui
ty s
hare
s2,
433,
074,
327
4,86
6-
(4,8
66)
--
--
--
Com
pen
sati
on c
ost
rela
ted
to
emp
loye
e sh
are
bas
ed p
aym
ent
......
......
......
......
......
......
......
......
.....
.-
--
141,
370
--
-1,
384
-1,
384
Tota
l tra
nsac
tion
s w
ith
ow
ners
of
the
Com
pan
y2,
092,
883,
926
4,18
733
1(1
17,7
46)
(1,7
83)
--
687
(114
,324
)-
(114
,324
)
As
at M
arch
31,
201
84,
523,
784,
491
9,04
880
045
3,26
51,
772
16,6
18(1
14)
1,54
748
2,93
62,
410
485,
346
The
acco
mp
anyi
ng n
otes
form
an
inte
gral
par
t of
the
se c
onso
lidat
ed fi
nanc
ial s
tate
men
ts.

Consolidated Financial Statements Under IFRS
Annual Report 2018-19 295
WIP
RO
LIM
ITE
D A
ND
SU
BS
IDIA
RIE
SC
ON
SO
LID
ATE
D S
TATE
ME
NT
OF
CH
AN
GE
S IN
EQ
UIT
Y ( `
in m
illio
ns, e
xcep
t sh
are
and
per s
hare
dat
a, u
nles
s ot
herw
ise
stat
ed)
Num
ber o
f S
hare
s*
Sha
re
capi
tal,
fully
pai
d- up
Sec
urit
ies
prem
ium
re
serv
eR
etai
ned
earn
ings
Sha
re-
base
d pa
ymen
t re
serv
e
Oth
er c
ompo
nent
s of
equ
ity
Equ
ity
attr
ibut
able
to
the
equ
ity
hold
ers
of t
he
Com
pany
Non
-co
ntro
lling
in
tere
stTo
tal
equi
tyP
arti
cula
rs
Fore
ign
curr
ency
tr
ansl
atio
n re
serv
e
Cas
h fl
ow
hedg
ing
rese
rve
Oth
er
rese
rves
As
at A
pril
1, 2
018
......
......
......
......
......
......
......
......
..4,
523,
784,
491
9,04
880
045
3,26
51,
772
16,6
18(1
14)
1,54
748
2,93
62,
410
485,
346
Ad
just
men
t on
ad
opti
on o
f IF
RS
15
......
......
......
......
--
-(2
,279
)-
--
-(2
,279
)-
(2,2
79)
Ad
just
ed b
alan
ce a
s at
Ap
ril 1
, 201
8 ...
......
......
......
..4,
523,
784,
491
9,04
880
045
0,98
61,
772
16,6
18(1
14)
1,54
748
0,65
72,
410
483,
067
Tota
l com
preh
ensi
ve in
com
e fo
r the
yea
r
Pro
fit
for
the
year
--
-90
,031
--
--
90,0
3114
290
,173
Oth
er c
omp
rehe
nsiv
e in
com
e-
--
--
(1,3
68)
2,52
9(2
47)
914
109
1,02
3
Tota
l com
preh
ensi
ve in
com
e fo
r the
yea
r-
--
90,0
31-
(1,3
68)
2,52
9(2
47)
90,9
4525
191
,196
Tran
sact
ion
wit
h ow
ners
of t
he C
ompa
ny,
reco
gniz
ed d
irec
tly
in e
quit
y
Con
trib
utio
ns b
y an
d di
stri
buti
ons
to o
wne
rs o
f th
e C
ompa
ny
Issu
e of
eq
uity
sha
res
on e
xerc
ise
of o
pti
ons
......
...
1,68
1,71
74
528
-(5
28)
--
-4
-4
Issu
e of
sha
res
by c
ontr
olle
d t
rust
on
exer
cise
of
opti
ons .
......
......
......
......
......
......
......
......
......
......
.....
.-
--
565
(565
)-
--
--
-
Cas
h di
vide
nd p
aid
(incl
udin
g di
vide
nd ta
x th
ereo
n) #
--
-(5
,434
)-
--
-(5
,434
)-
(5,4
34)
Bon
us is
sue
of e
qui
ty s
hare
s #
.....
......
......
......
......
.1,
508,
469,
180
3,01
6(7
95)
(1,4
54)
--
-(7
67)
--
-
Loss
of
cont
rol i
n su
bsi
dia
ry ..
......
......
......
......
......
...-
--
--
--
--
(52)
(52)
Infu
sion
of
cap
ital
.....
......
......
......
......
......
......
......
...-
--
--
--
--
2828
Com
pen
sati
on c
ost
rela
ted
to
emp
loye
e sh
are-
bas
ed p
aym
ent
......
......
......
......
......
......
......
......
.....
.-
--
61,
938
--
-1,
944
-1,
944
Tota
l tra
nsac
tion
s w
ith
ow
ners
of t
he C
ompa
ny ...
. 1,
510,
150,
897
3,02
0(2
67)
(6,3
17)
845
--
(767
)(3
,486
)(2
4)(3
,510
)
As
at M
arch
31,
201
9 ...
......
......
......
......
......
......
......
.6,
033,
935,
388
12,0
6853
353
4,70
02,
617
15,2
502,
415
533
568,
116
2,63
757
0,75
3
Con
veni
ence
tra
nsla
tion
into
US
dol
lar i
n m
illio
ns
(una
udit
ed) R
efer
Not
e 2(
iii).
......
......
......
......
......
....
87,2
46,0
2917
48
7,73
138
221
357
8,21
438
8,25
2
*
Incl
udes
23,
097,
216
and
27,
353,
853
trea
sury
sha
res
held
as
at M
arch
31,
201
8 an
d 2
019,
resp
ecti
vely
by
a co
ntro
lled
trus
t. 1
,101
,217
, 4,3
51,7
75 a
nd 2
,599
,183
sha
res
have
bee
n tr
ansf
erre
d
by t
he c
ontr
olle
d t
rust
to
elig
ible
em
plo
yees
on
exer
cise
of
opti
ons
dur
ing
the
year
end
ed M
arch
31,
201
7, 2
018
and
201
9, r
esp
ecti
vely
.
#
Ref
er N
ote
18
^ Va
lue
is le
ss t
han
` 1.
.
The
acco
mp
anyi
ng n
otes
form
an
inte
gral
par
t of
the
se c
onso
lidat
ed fi
nanc
ial s
tate
men
ts.

Consolidated Financial Statements Under IFRS
296 Wipro Limited
WIPRO LIMITED AND SUBSIDIARIES CONSOLIDATED STATEMENT OF CASH FLOWS
(` in millions, except share and per share data, unless otherwise stated)
Year ended March 31, 2017 2018 2019 2019
Convenience translation
into US dollar in millions
(unaudited) Refer Note 2(iii)
Cash flows from operating activities:Profit for the year ........................................................................................... 85,143 80,084 90,173 1,302Adjustments to reconcile profit for the year to net cash generated from operating activities: (Gain)/ loss on sale of property, plant and equipment and intangible
assets, net .............................................................................................117 (334) (309) (4)
Depreciation, amortization and impairment ........................................... 23,107 21,124 19,474 282 Unrealized exchange loss, net ................................................................ 3,945 4,794 (546) (8) Share based compensation expense...................................................... 1,742 1,347 1,938 28 Share of net (profit) /loss of associates accounted for using the equity
method ..................................................................................................- 11 43 1
Income tax expense ............................................................................... 25,213 22,390 25,242 365 Dividend and interest (income)/expenses, net, gain from investments ... (19,745) (20,547) (17,371) (251) Gain from sale of EcoEnergy division ..................................................... (4,082) - - - Gain from sale of hosted data center services, Workday and Cornerstone OnDemand business and loss of control in subsidiary .......
- - (4,344) (63)
Other non-cash items ............................................................................ (1,732) 4,405 - -Changes in operating assets and liabilities; net of effects from acquisitions: Trade receivables ................................................................................... 3,346 (9,735) 1,392 20 Unbilled receivables and Contract assets .............................................. 3,813 2,192 4,580 66 Inventories ............................................................................................. 1,475 545 (566) (8) Other assets .......................................................................................... 4,054 (170) (6,909) (100) Trade payables, accrued expenses, other liabilities and provisions ........ (5,202) 4,499 20,844 301 Contract liabilities ................................................................................. (2,945) 1,733 7,824 113Cash generated from operating activities before taxes ................................... 118,249 112,338 141,465 2,044 Income taxes paid, net ........................................................................... (25,476) (28,105) (25,149) (364)Net cash generated from operating activities 92,773 84,233 116,316 1,680Cash flows from investing activities: Purchase of property, plant and equipment ........................................... (20,853) (21,870) (22,781) (329) Proceeds from sale of property, plant and equipment ............................ 1,207 1,171 1,940 28 Proceeds from sale of EcoEnergy division, net of related expenses........ 4,372 - - - Purchase of investments ....................................................................... (813,439) (782,475) (930,614) (13,456) Proceeds from sale of investments ........................................................ 729,755 830,448 954,954 13,808 Proceeds from sale of hosted data center services business and loss of control in subsidiary, net of related expenses and cash .....................
- - 26,103 377
Impact of investment hedging activities, net .......................................... (226) - - - Payment for business acquisitions including deposits and escrow, net of cash acquired ..............................................................................
(33,608) (6,652) - -
Interest received .................................................................................... 17,069 14,347 20,163 292 Dividend received .................................................................................. 311 609 361 5 Income taxes paid on sale of EcoEnergy division ................................... (871) - - -Net cash (used)/ generated in investing activities (116,283) 35,578 50,126 725Cash flows from financing activities: Proceeds from issuance of equity shares/shares pending allotment ..... ^ 24 4 ^ Repayment of loans and borrowings ...................................................... (112,803) (155,254) (104,039) (1,504) Proceeds from loans and borrowings ..................................................... 125,922 144,271 65,161 942 Payment for deferred contingent consideration in respect of business combination ..........................................................................................
(138) (164) (265) (4)
Payment for buyback of shares including transaction cost .................... (25,000) (110,312) - - Interest paid on loans and borrowings ................................................... (1,999) (3,123) (4,796) (69) Payment of cash dividend (including dividend tax thereon) .................... (8,734) (5,420) (5,434) (79)Net cash generated/ (used) in financing activities (22,752) (129,978) (49,369) (714) Net increase/ (decrease) in cash and cash equivalents during the year . (46,262) (10,167) 117,073 1,691 Effect of exchange rate changes on cash and cash equivalents ............. (1,412) 375 526 8 Cash and cash equivalents at the beginning of the year ......................... 98,392 50,718 40,926 592 Cash and cash equivalents at the end of the year (Note 10) 50,718 40,926 158,525 2,291Total taxes paid amounted to ` 26,347, ` 28,105 and ` 25,149 for the year ended March 31, 2017, 2018 and 2019, respectively.Refer Note 12 for supplementary information on cash flow statement.^ Value is less than ` 1
The accompanying notes form an integral part of these consolidated financial statements.

Consolidated Financial Statements Under IFRS
Annual Report 2018-19 297
WIPRO LIMITED AND SUBSIDIARIES NOTES TO THE CONSOLIDATED FINANCIAL STATEMENTS
(` in millions, except share and per share data, unless otherwise stated)
1. The Company overview
Wipro Limited (“Wipro” or the “Parent Company”), together with its subsidiaries and controlled trusts (collectively, “the Company” or the “Group”) is a global information technology (IT), consulting and business process services (BPS) company.
Wipro is a public limited company incorporated and domiciled in India. The address of its registered office is Wipro Limited, Doddakannelli, Sarjapur Road, Bengaluru – 560 035, Karnataka, India. Wipro has its primary listing with BSE Ltd. and National Stock Exchange of India Ltd. The Company’s American Depository Shares representing equity shares are also listed on the New York Stock Exchange.
These consolidated financial statements were authorized for issue by the Audit Committee on June 11, 2019.
2. Basis of preparation of consolidated financial statements
(i) Statement of compliance and basis of preparation
The consolidated financial statements have been prepared in accordance with International Financial Reporting Standards and its interpretations (“IFRS”), as issued by the International Accounting Standards Board (“IASB”). All accounting policies have been applied consistently to all periods presented in these consolidated financial statements except for new accounting standards adopted by the Company.
The consolidated financial statements correspond to the classification provisions contained in IAS 1(revised), “Presentation of Financial Statements”. For clarity, various items are aggregated in the statement of income and statement of financial position. These items are disaggregated separately in the notes to the consolidated financial statements, where applicable.
All amounts included in the consolidated financial statements are reported in millions of Indian rupees (` in millions) except share and per share data, unless otherwise stated. Due to rounding off, the numbers presented throughout the document may not add up precisely to the totals and percentages may not precisely reflect the absolute figures.
(ii) Basis of measurement
The consolidated financial statements have been prepared on a historical cost convention and on an accrual basis, except for the following material items which have been measured at fair value as required by relevant IFRS:
a. Derivative financial instruments;
b. Financial instruments classified as fair value through other comprehensive income or fair value through profit or loss;
c. The defined benefit asset/ (liability) is recognized as the present value of defined benefit obligation less fair value of plan assets; and
d. Contingent consideration.
(iii) Convenience translation (unaudited)
The accompanying consolidated financial statements have been prepared and reported in Indian rupees, the functional currency of the Parent Company. Solely for the convenience of the readers, the consolidated financial statements as at and for the year ended March 31, 2019, have been translated into United States dollars at the certified foreign exchange rate of US$1 = ` 69.16 as published by Federal Reserve Board of Governors on March 31, 2019. No representation is made that the Indian rupee amounts have been, could have been or could be converted into United States dollars at such a rate or any other rate. Due to rounding off, the translated numbers presented throughout the document may not add up precisely to the totals.
(iv) Use of estimates and judgment
The preparation of the consolidated financial statements in conformity with IFRS requires management to make judgments, estimates and assumptions that affect the application of accounting policies and the reported amounts of assets, liabilities, income and expenses. Actual results may differ from those estimates.
Estimates and underlying assumptions are reviewed on an ongoing basis. Revisions to accounting estimates are recognized in the period in which the estimates are revised and in any future periods affected. In particular, information about significant areas of estimation uncertainty and critical judgments in applying accounting policies that have the most significant effect on the amounts recognized in the consolidated financial statements are included in the following notes:
a) Revenue recognition: The Company applies judgement to determine whether each product or services promised to a customer are capable of being distinct, and are distinct in the context of the contract, if not, the promised product or services are combined and accounted as a single performance obligation. The Company allocates the arrangement consideration to separately identifiable performance obligation deliverables based on their relative stand-alone selling price. In cases where the Company is unable to determine the stand-alone selling price the company uses expected cost-plus margin approach in estimating the stand-alone selling price. The Company uses the percentage of completion method using the input (cost expended) method to measure progress towards completion in respect of fixed price contracts. Percentage of completion method accounting relies on estimates of total expected contract revenue and costs. This method is followed when reasonably dependable estimates of the

Consolidated Financial Statements Under IFRS
298 Wipro Limited
revenues and costs applicable to various elements of the contract can be made. Key factors that are reviewed in estimating the future costs to complete include estimates of future labor costs and productivity efficiencies. Because the financial reporting of these contracts depends on estimates that are assessed continually during the term of these contracts, revenue recognized, profit and timing of revenue for remaining performance obligations are subject to revisions as the contract progresses to completion. When estimates indicate that a loss will be incurred, the loss is provided for in the period in which the loss becomes probable. Volume discounts are recorded as a reduction of revenue. When the amount of discount varies with the levels of revenue, volume discount is recorded based on estimate of future revenue from the customer
b) Impairment testing: Goodwill and intangible assets with infinite useful life recognized on business combination are tested for impairment at least annually and when events occur or changes in circumstances indicate that the recoverable amount of the asset or the cash generating unit to which these pertain is less than the carrying value. The recoverable amount of the asset or the cash generating units is higher of value-in-use and fair value less cost of disposal. The calculation of value in use of a cash generating unit involves use of significant estimates and assumptions which includes turnover, growth rates and net margins used to calculate projected future cash flows, risk-adjusted discount rate, future economic and market conditions.
c) Income taxes:The major tax jurisdictions for the Company are India and the United States of America. Significant judgments are involved in determining the provision for income taxes including judgment on whether tax positions are probable of being sustained in tax assessments. A tax assessment can involve complex issues, which can only be resolved over extended time periods.
d) Deferred taxes: Deferred tax is recorded on temporary differences between the tax bases of assets and liabilities and their carrying amounts, at the rates that have been enacted or substantively enacted at the reporting date. The ultimate realization of deferred tax assets is dependent upon the generation of future taxable profits during the periods in which those temporary differences and tax loss carry-forwards become deductible. The Company considers the expected reversal of deferred tax liabilities and projected future taxable income in making this assessment. The amount of the deferred tax assets considered realizable, however, could be reduced in the near term if estimates of future taxable income during the carry-forward period are reduced.
e) Business combination: In accounting for business combinations, judgment is required in identifying whether an identifiable intangible asset is to be recorded separately from goodwill. Additionally, estimating the acquisition date fair value of the identifiable assets (including useful life estimates) and liabilities acquired, and contingent consideration assumed involves management judgment. These measurements are based on information available
at the acquisition date and are based on expectations and assumptions that have been deemed reasonable by management. Changes in these judgments, estimates, and assumptions can materially affect the results of operations.
f) Defined benefit plans and compensated absences: The cost of the defined benefit plans, compensated absences and the present value of the defined benefit obligations are based on actuarial valuation using the projected unit credit method. An actuarial valuation involves making various assumptions that may differ from actual developments in the future. These include the determination of the discount rate, future salary increases and mortality rates. Due to the complexities involved in the valuation and its long-term nature, a defined benefit obligation is highly sensitive to changes in these assumptions. All assumptions are reviewed at each reporting date.
g) Expected credit losses on financial assets: The impairment provisions of financial assets and contract assets are based on assumptions about risk of default and expected timing of collection. The Company uses judgment in making these assumptions and selecting the inputs to the impairment calculation, based on the Company’s past history of collections, customer’s credit-worthiness, existing market conditions as well as forward looking estimates at the end of each reporting period.
h) Measurement of fair value of non-marketable equity investments: These instruments are initially recorded at cost and subsequently measured at fair value. Fair value of investments is determined using the market and income approaches. The market approach includes the use of financial metrics and ratios of comparable companies, such as revenue, earnings, comparable performance multiples, recent financial rounds and the level of marketability of the investments. The selection of comparable companies requires management judgment and is based on a number of factors, including comparable company sizes, growth rates, and development stages. The income approach includes the use of discounted cash flow model, which requires significant estimates regarding the investees’ revenue, costs, and discount rates based on the risk profile of comparable companies. Estimates of revenue and costs are developed using available historical and forecast data.
i) Useful lives of property, plant and equipment:The Company depreciates property, plant and equipment on a straight-line basis over estimated useful lives of the assets. The charge in respect of periodic depreciation is derived based on an estimate of an asset’s expected useful life and the expected residual value at the end of its life. The life are based on historical experience with similar assets as well as anticipation of future events, which may impact their life, such as changes in technology. The estimated useful life is reviewed at least annually.
j) Useful lives of intangible assets:The Company amortizes intangible assets on a straight-line basis over estimated useful lives of the assets. The useful life is

Consolidated Financial Statements Under IFRS
Annual Report 2018-19 299
estimated based on a number of factors including the effects of obsolescence, demand, competition and other economic factors such as the stability of the industry and known technological advances and the level of maintenance expenditures required to obtain the expected future cash flows from the assets. The estimated useful life is reviewed at least annually.
k) Other estimates: The share-based compensation expense is determined based on the Company’s estimate of equity instruments that will eventually vest. Fair valuation of derivative hedging instruments designated as cash flow hedges involves significant estimates relating to the occurrence of forecast transaction.
3. Significant accounting policies
(i) Basis of consolidation
Subsidiaries and controlled trusts
The Company determines the basis of control in line with the requirements of IFRS 10, Consolidated Financial Statements. Subsidiaries and controlled trusts are entities controlled by the Group. The Group controls an entity when the parent has power over the entity, it is exposed to, or has rights to, variable returns from its involvement with the entity and has the ability to affect those returns through its power over the entity. The financial statements of subsidiaries and controlled trusts are included in the consolidated financial statements from the date on which control commences until the date on which control ceases.
All intra-Group balances, transactions, income and expenses are eliminated in full on consolidation.
Non-controlling interest
Non-controlling interests in the net assets (excluding goodwill) of consolidated subsidiaries are identified separately from the Company’s equity. The interest of non-controlling shareholders may be initially measured either at fair value or at the non-controlling interest’s proportionate share of the fair value of the acquiree’s identifiable net assets. The choice of measurement basis is made on an acquisition to acquisition basis. Subsequent to acquisition, the carrying amount of non-controlling interest is the amount of those interests at initial recognition plus the non-controlling interest’s share of subsequent changes in equity. Total comprehensive income is attributed to non-controlling interests even if it results in the non-controlling interest having a deficit balance.
Investments accounted for using the equity method
Investments accounted for using the equity method are entities in respect of which, the Company has significant influence, but not control, over the financial and operating policies. Generally, a Company has a significant influence if it holds between 20 and 50 percent of the voting power of another entity. Investments in such entities are accounted for using the equity method and are initially recognized at cost. The carrying amount of investment is increased/ decreased to recognized investors share of profit or loss of the investee after the acquisition date.
Non current assets and disposal groups held for sale
Assets of disposal groups that is available for immediate sale and where the sale is highly probable of being completed within one year from the date of classification are considered and classified as assets held for sale. Non current assets and disposal groups held for sale are measured at the lower of carrying amount and fair value less costs to sell.
(ii) Functional and presentation currency
Items included in the financial statements of each of the Company’s entities are measured using the currency of the primary economic environment in which these entities operate (i.e. the “functional currency”). These consolidated financial statements are presented in Indian rupees, which is the functional currency of the Parent Company.
(iii) Foreign currency transactions and translation
a) Transactions and balances
Transactions in foreign currency are translated into the respective functional currencies using the exchange rates prevailing at the date of the transaction. Foreign exchange gains and losses resulting from the settlement of such transactions and from translation at the exchange rates prevailing at the reporting date of monetary assets and liabilities denominated in foreign currencies are recognized in the consolidated statement of income and reported within foreign exchange gains/(losses), net, within results of operating activities except when deferred in other comprehensive income as qualifying cash flow hedges and qualifying net investment hedges. Gains/(losses), net relating to translation or settlement of borrowings denominated in foreign currency are reported within finance expense. Non-monetary assets and liabilities denominated in foreign currency and measured at historical cost are translated at the exchange rate prevalent at the date of transaction. Translation differences on non-monetary financial assets measured at fair value at the reporting date, such as equities classified as financial instruments measured at fair value through other comprehensive income are included in other comprehensive income, net of taxes.
b) Foreign operations
For the purpose of presenting consolidated financial statements, the assets and liabilities of the Company’s foreign operations that have a functional currency other than Indian rupees are translated into Indian rupees using exchange rates prevailing at the reporting date. Income and expense items are translated at the average exchange rates for the period. Exchange differences arising, if any, are recognized in other comprehensive income and held in foreign currency translation reserve (FCTR), a component of equity, except to the extent that the translation difference is allocated to non-controlling interest. When a foreign operation is disposed of, the relevant amount recognized in FCTR is transferred to the consolidated statement of income as part of the profit or loss on disposal. Goodwill and fair value adjustments arising on the acquisition of a foreign operation are treated as assets and liabilities of

Consolidated Financial Statements Under IFRS
300 Wipro Limited
the foreign operation and translated at the exchange rate prevailing at the reporting date.
c) Others
Foreign currency differences arising on the translation or settlement of a financial liability designated as a hedge of a net investment in a foreign operation are recognized in other comprehensive income and presented within equity in the FCTR to the extent the hedge is effective. To the extent the hedge is ineffective, such differences are recognized in the consolidated statement of income.
When the hedged part of a net investment is disposed of, the relevant amount recognized in FCTR is transferred to the consolidated statement of income as part of the profit or loss on disposal. Foreign currency differences arising from translation of intercompany receivables or payables relating to foreign operations, the settlement of which is neither planned nor likely in the foreseeable future, are considered to form part of net investment in foreign operation and are recognized in FCTR.
(iv) Financial instruments
A) Non-derivative financial instruments:
Non-derivative financial instruments consist of:
• financial assets include cash and cash equivalents, trade receivables, unbilled receivables, finance lease receivables, employee and other advances, investments in equity and debt securities and eligible current and non-current assets; Financial assets are derecognized when substantial risks and rewards of ownership of the financial asset have been transferred. In cases where substantial risks and rewards of ownership of the financial assets are neither transferred nor retained, financial assets are derecognized only when the Company has not retained control over the financial asset.
• financial liabilities include long and short-term loans and borrowings, bank overdrafts, trade payables, eligible current and non-current liabilities.
Non-derivative financial instruments are recognized initially at fair value. Subsequent to initial recognition, non-derivative financial instruments are measured as described below:
a. Cash and cash equivalents
The Company’s cash and cash equivalents consist of cash on hand and in banks and demand deposits with banks, which can be withdrawn at any time, without prior notice or penalty on the principal.
For the purposes of the cash flow statement, cash and cash equivalents include cash on hand, in banks and demand deposits with banks, net of outstanding bank overdrafts that are repayable on demand and are considered part of the Company’s cash management system. In the consolidated statement of financial position, bank overdrafts are presented under borrowings within current liabilities.
b. Investments
Financial instruments measured at amortized cost:
Debt instruments that meet the following criteria are measured at amortized cost (except for debt instruments that are designated at fair value through Profit or Loss (FVTPL) on initial recognition):
• the asset is held within a business model whose objective is to hold assets in order to collect contractual cash flows; and
• the contractual terms of the instrument give rise on specified dates to cash flows that are solely payment of principal and interest on the principal amount outstanding.
Financial instruments measured at fair value through other comprehensive income (FVTOCI):
Debt instruments that meet the following criteria are measured at fair value through other comprehensive income (FVTOCI) (except for debt instruments that are designated at fair value through Profit or Loss (FVTPL) on initial recognition):
• the asset is held within a business model whose objective is achieved both by collecting contractual cash flows and selling the financial asset; and
• the contractual terms of the instrument give rise on specified dates to cash flows that are solely payment of principal and interest on the principal amount outstanding.
Interest income is recognized in the consolidated statement of income for FVTOCI debt instruments. Other changes in fair value of FVTOCI financial assets are recognized in other comprehensive income. When the investment is disposed of, the cumulative gain or loss previously accumulated in reserves is transferred to the consolidated statement of income.
Financial instruments measured at fair value through profit or loss (FVTPL):
Instruments that do not meet the amortized cost or FVTOCI criteria are measured at FVTPL. Financial assets at FVTPL are measured at fair value at the end of each reporting period, with any gains or losses arising on re-measurement recognized in consolidated statement of income. The gain or loss on disposal is recognized in the consolidated statement of income.
Interest income is recognized in the consolidated statement of income for FVTPL debt instruments. Dividend on financial assets at FVTPL is recognized when the Group’s right to receive dividend is established.
Investments in equity instruments designated to be classified as FVTOCI:
The Company carries certain equity instruments which are not held for trading. The Company has elected the FVTOCI irrevocable option for these instruments. Movements in fair value of these investments are recognized in other comprehensive income and the gain or loss is not transferred to consolidated statement of income on

Consolidated Financial Statements Under IFRS
Annual Report 2018-19 301
disposal of these investments. Dividends from these investments are recognized in the consolidated statement of income when the Company’s right to receive dividends is established.
c. Other financial assets:
Other financial assets are non-derivative financial assets with fixed or determinable payments that are not quoted in an active market. They are presented as current assets, except for those maturing later than 12 months after the reporting date which are presented as non-current assets. These are initially recognized at fair value and subsequently measured at amortized cost using the effective interest method, less any impairment losses. These comprise trade receivables, unbilled receivables and other assets.
d. Trade and other payables
Trade and other payables are initially recognized at fair value, and subsequently carried at amortized cost using the effective interest method. For these financial instruments, the carrying amounts approximate fair value due to the short-term maturity of these instruments. Contingent consideration recognized in the business combination is subsequently measured at fair value through profit or loss.
B) Derivative financial instruments
The Company is exposed to foreign currency fluctuations on foreign currency assets, liabilities, net investment in foreign operations and forecasted cash flows denominated in foreign currency.
The Company limits the effect of foreign exchange rate fluctuations by following established risk management policies including the use of derivatives. The Company enters into derivative financial instruments where the counterparty is primarily a bank.
Derivatives are recognized and measured at fair value. Attributable transaction costs are recognized in consolidated statement of income as cost.
Subsequent to initial recognition, derivative financial instruments are measured as described below:
a. Cash flow hedges
Changes in the fair value of the derivative hedging instrument designated as a cash flow hedge are recognized in other comprehensive income and held in cash flow hedging reserve, net of taxes, a component of equity, to the extent that the hedge is effective. To the extent that the hedge is ineffective, changes in fair value are recognized in the consolidated statement of income and reported within foreign exchange gains/(losses), net within results from operating activities. If the hedging instrument no longer meets the criteria for hedge accounting, then hedge accounting is discontinued prospectively. If the hedging instrument expires or is sold, terminated or exercised, the cumulative gain or loss on the hedging instrument recognized in cash flow hedging reserve till the period the hedge was effective remains in cash flow hedging reserve until the forecasted transaction
occurs. The cumulative gain or loss previously recognized in the cash flow hedging reserve is transferred to the consolidated statement of income (gross revenues) upon the occurrence of the related forecasted transaction. If the forecasted transaction is no longer expected to occur, such cumulative balance is immediately recognized in the consolidated statement of income.
b. Hedges of net investment in foreign operations
The Company designates derivative financial instruments as hedges of net investments in foreign operations. The Company has also designated a foreign currency denominated borrowing as a hedge of net investment in foreign operations. Changes in the fair value of the derivative hedging instruments and gains/losses on translation or settlement of foreign currency denominated borrowings designated as a hedge of net investment in foreign operations are recognized in other comprehensive income and presented within equity in the FCTR to the extent that the hedge is effective. To the extent that the hedge is ineffective, changes in fair value are recognized in the consolidated statement of income and reported within foreign exchange gains/(losses), net within results from operating activities.
c. Others
Changes in fair value of foreign currency derivative instruments neither designated as cash flow hedges nor hedges of net investment in foreign operations are recognized in the consolidated statement of income and reported within foreign exchange gains/(losses), net within results from operating activities. Changes in fair value and gains/(losses), net on settlement of foreign currency derivative instruments relating to borrowings, which have not been designated as hedges are recorded in finance expense.
C) Derecognition of financial instruments
The Company derecognizes a financial asset when the contractual rights to the cash flows from the financial asset expire or it transfers the financial asset and the transfer qualifies for derecognition under IFRS 9. If the Company retains substantially all the risks and rewards of a transferred financial asset, the Company continues to recognize the financial asset and also recognizes a borrowing for the proceeds received. A financial liability (or a part of a financial liability) is derecognized from the group’s balance sheet when the obligation specified in the contract is discharged or cancelled or expires.
(v) Equity and share capital
a) Share capital and Securities premium reserve
The authorized share capital of the Company as at March 31, 2019 is ` 25,274 divided into 12,504,500,000 equity shares of ` 2 each, 25,000,000 preference shares of ` 10 each and 150,000 10% optionally convertible cumulative preference shares of ` 100 each. Par value of the equity shares is recorded as share capital and the amount received in excess of par value is classified as securities premium reserve.

Consolidated Financial Statements Under IFRS
302 Wipro Limited
Every holder of the equity shares, as reflected in the records of the Company, as at the date of the shareholder meeting shall have one vote in respect of each share held for all matters submitted to vote in the shareholder meeting.
b) Shares held by controlled trust (Treasury shares)
The Company’s equity shares held by the controlled trust, which is consolidated as a part of the Group are classified as Treasury shares. The Company has 13,728,607, 23,097,216 and 27,353,853 treasury shares as at March 31, 2017, 2018 and 2019, respectively. Treasury shares are recorded at acquisition cost.
c) Retained earnings
Retained earnings comprises of the Company’s undistributed earnings after taxes. A portion of these earnings amounting as at March 31, 2017, 2018 and 2019 to ` 1,139, ` 1,139, and ` 1,139 respectively, represents capital reserve and Nil, Nil and ̀ 28,565 as at March 31, 2017, 2018 and 2019, respectively, represents Special economic zone re-investment reserve which is not freely available for distribution.
d) Share-based payment reserve
The share-based payment reserve is used to record the value of equity-settled share-based payment transactions with employees. The amounts recorded in share-based payment reserve are transferred to securities premium reserve upon exercise of stock options and restricted stock unit options by employees.
e) Foreign currency translation reserve (FCTR)
The exchange differences arising from the translation of financial statements of foreign subsidiaries, differences arising from translation of long-term inter-company receivables or payables relating to foreign operations settlement of which is neither planned nor likely in the foreseeable future, changes in fair value of the derivative hedging instruments and gains/losses on translation or settlement of foreign currency denominated borrowings designated as hedge of net investment in foreign operations are recognized in other comprehensive income, net of taxes and presented within equity in the FCTR.
f) Cash flow hedging reserve
Changes in fair value of derivative hedging instruments designated and effective as a cash flow hedge are recognized in other comprehensive income (net of taxes) and presented within equity as cash flow hedging reserve.
g) Other reserves
Changes in the fair value of financial instruments measured at fair value through other comprehensive income and actuarial gains and losses on defined benefit plans are recognized in other comprehensive income (net of taxes) and presented within equity in other reserves.
Other reserves also include Capital redemption reserve as at March 31, 2017, 2018 and 2019 amounting to ` 80, ` 767 and Nil, respectively, which is not freely available for distribution.
h) Dividend
A final dividend, including tax thereon, on common stock is recorded as a liability on the date of approval by the shareholders. An interim dividend, including tax thereon, is recorded as a liability on the date of declaration by the board of directors.
i) Buyback of equity shares
The buyback of equity shares and related transaction costs are recorded as a reduction of free reserves. Further, capital redemption reserves are created as an apportionment from retained earnings.
(vi) Property, plant and equipment
a) Recognition and measurement
Property, plant and equipment are measured at cost less accumulated depreciation and impairment losses, if any. Cost includes expenditures directly attributable to the acquisition of the asset. General and specific borrowing costs directly attributable to the construction of a qualifying asset are capitalized as part of the cost.
Capital work- in-progress are measured at cost less accumulated impairment losses, if any.
b) Depreciation
The Company depreciates property, plant and equipment over the estimated useful life on a straight-line basis from the date the assets are available for use. Assets acquired under finance lease and leasehold improvements are amortized over the shorter of estimated useful life of the asset or the related lease term. Term licenses are amortized over their respective contract term. Freehold land is not depreciated. The estimated useful life of assets is reviewed and where appropriate are adjusted, annually. The estimated useful lives of assets are as follows:
Category Useful life Buildings 28 to 40 yearsPlant and machinery 5 to 21 yearsComputer equipment and software 2 to 7 yearsFurniture, fixtures and equipment 3 to 10 yearsVehicles 4 to 5 years
When parts of an item of property, plant and equipment have different useful lives, they are accounted for as separate items (major components) of property, plant and equipment. Subsequent expenditure relating to property, plant and equipment is capitalized only when it is probable that future economic benefits associated with these will flow to the Company and the cost of the item can be measured reliably.
Deposits and advances paid towards the acquisition of property, plant and equipment outstanding as at each reporting date and the cost of property, plant and equipment not available for use before such date are disclosed under capital work- in-progress.

Consolidated Financial Statements Under IFRS
Annual Report 2018-19 303
(vii) Business combination, Goodwill and Intangible assets
a) Business combination Business combinations are accounted for using the purchase (acquisition) method. The cost of an acquisition is measured as the fair value of the assets transferred, liabilities incurred or assumed, and equity instruments issued at the date of exchange by the Company. Identifiable assets acquired, and liabilities and contingent liabilities assumed in a business combination are measured initially at fair value at the date of acquisition. Transaction costs incurred in connection with a business acquisition are expensed as incurred.
The cost of an acquisition also includes the fair value of any contingent consideration measured as at the date of acquisition. Any subsequent changes to the fair value of contingent consideration classified as liabilities, other than measurement period adjustments, are recognized in the consolidated statement of income.
b) Goodwill The excess of the cost of an acquisition over the Company’s share in the fair value of the acquiree’s identifiable assets, liabilities and contingent liabilities is recognized as goodwill. If the excess is negative, a bargain purchase gain is recognized immediately in the consolidated statement of income. Goodwill is measured at cost less accumulated impairment (if any).
Goodwill associated with disposal of an operation that is part of cash-generating unit is measured on the basis of the relative values of the operation disposed of and the portion of the cash-generating unit retained, unless some other method better reflects the goodwill associated with the operation disposed.
c) Intangible assets Intangible assets acquired separately are measured at cost of acquisition. Intangible assets acquired in a business combination are measured at fair value as at the date of acquisition. Following initial recognition, intangible assets are carried at cost less accumulated amortization and impairment losses, if any.
The amortization of an intangible asset with a finite useful life reflects the manner in which the economic benefit is expected to be generated and is included in selling and marketing expenses in the consolidated statement of income.
The estimated useful life of amortizable intangibles are reviewed and where appropriate are adjusted, annually. The estimated useful lives of the amortizable intangible assets for the current and comparative periods are as follows:
Category Useful life Customer-related intangibles 5 to 15 yearsMarketing related intangibles 3 to 5 years
(viii) Leases
The determination of whether an arrangement is, or contains, a lease is based on the substance of the
arrangement at the inception date. The arrangement is, or contains a lease if, fulfillment of the arrangement is dependent on the use of a specific asset or assets or the arrangement conveys a right to use the asset or assets, even if that right is not explicitly specified in an arrangement.
a) Arrangements where the Company is the lessee
Leases of property, plant and equipment, where the Company assumes substantially all the risks and rewards of ownership are classified as finance leases. Finance leases are capitalized at lower of the fair value of the leased property and the present value of the minimum lease payments. Lease payments are apportioned between the finance charge and the outstanding liability. The finance charge is allocated to periods during the lease term at a constant periodic rate of interest on the remaining balance of the liability.
Leases where the lessor retains substantially all the risks and rewards of ownership are classified as operating leases. Payments made under operating leases are recognized in the consolidated statement of income on a straight-line basis over the lease term.
b) Arrangements where the Company is the lessor
In certain arrangements, the Company recognizes revenue from the sale of products given under finance leases. The Company records gross finance receivables, unearned income and the estimated residual value of the leased equipment on consummation of such leases. Unearned income represents the excess of the gross finance lease receivable plus the estimated residual value over the sales price of the equipment. The Company recognizes unearned income as finance income over the lease term using the effective interest method.
(ix) Inventories
Inventories are valued at lower of cost and net realizable value, including necessary provision for obsolescence. Cost is determined using the weighted average method.
(x) Impairment
A) Financial assets
The Company applies the expected credit loss model for recognizing impairment loss on financial assets measured at amortized cost, debt instruments classified as FVTOCI, trade receivables, lease receivables, contract assets and other financial assets. Expected credit loss is the difference between the contractual cash flows and the cash flows that the entity expects to receive, discounted using the effective interest rate.
Loss allowances for trade receivables and lease receivables are measured at an amount equal to lifetime expected credit loss. Lifetime expected credit losses are the expected credit losses that result from all possible default events over the expected life of a financial instrument. Lifetime expected credit loss is computed based on a provision matrix which takes in to account risk profiling of customers and historical credit loss experience adjusted for forward looking information. For

Consolidated Financial Statements Under IFRS
304 Wipro Limited
other financial assets, expected credit loss is measured at the amount equal to twelve months expected credit loss unless there has been a significant increase in credit risk from initial recognition, in which case those are measured at lifetime expected credit loss.
B) Non-financial assets
The Company assesses long-lived assets such as property, plant, equipment and acquired intangible assets for impairment whenever events or changes in circumstances indicate that the carrying amount of an asset or group of assets may not be recoverable. If any such indication exists, the Company estimates the recoverable amount of the asset or group of assets. The recoverable amount of an asset or cash generating unit is the higher of its fair value less cost of disposal (FVLCD) and its value-in-use (VIU). The VIU of long-lived assets is calculated using projected future cash flows. FVLCD of a cash generating unit is computed using turnover and earnings multiples. If the recoverable amount of the asset or the recoverable amount of the cash generating unit to which the asset belongs is less than its carrying amount, the carrying amount is reduced to its recoverable amount. The reduction is treated as an impairment loss and is recognized in the consolidated statement of income. If at the reporting date, there is an indication that a previously assessed impairment loss no longer exists, the recoverable amount is reassessed and the impairment losses previously recognized are reversed such that the asset is recognized at its recoverable amount but not exceeding written down value which would have been reported if the impairment losses had not been recognized initially.
Goodwill is tested for impairment at least annually at the same time and when events occur or changes in circumstances indicate that the recoverable amount of the cash generating unit is less than its carrying value. The goodwill impairment test is performed at the level of cash-generating unit or groups of cash -generating units which represents the lowest level at which goodwill is monitored for internal management purposes. An impairment in respect of goodwill is not reversed.
(xi) Employee benefits
Post-employment and pension plans
The Group participates in various employee benefit plans. Pensions and other post-employment benefits are classified as either defined contribution plans or defined benefit plans. Under a defined contribution plan, the Company’s only obligation is to pay a fixed amount with no obligation to pay further contributions if the fund does not hold sufficient assets to pay all employee benefits. The related actuarial and investment risks are borne by the employee. The expenditure for defined contribution plans is recognized as an expense during the period when the employee provides service. Under a defined benefit plan, it is the Company’s obligation to provide agreed benefits to the employees. The related actuarial and investment risks are borne by the Company. The present value of the defined benefit obligations is calculated by an independent actuary using the projected unit credit method.
Remeasurement comprising actuarial gains or losses and the return on plan assets (excluding interest) are immediately recognized in other comprehensive income, net of taxes and permanently excluded from profit or loss. Instead net interest recognized in profit or loss is calculated by applying the discount rate used to measure the defined benefit obligation to the net defined benefit liability or asset. The actual return on the plan assets above or below the discount rate is recognized as part of remeasurement of net defined liability or asset through other comprehensive income, net of taxes.
The Company has the following employee benefit plans:
a. Provident fund
Employees receive benefits from a provident fund, which is a defined benefit plan. The employer and employees each make periodic contributions to the plan. A portion of the contribution is made to the approved provident fund trust managed by the Company while the remainder of the contribution is made to the government administered pension fund. The contributions to the trust managed by the Company is accounted for as a defined benefit plan as the Company is liable for any shortfall in the fund assets based on the government specified minimum rates of return.
b. Superannuation
Superannuation plan, a defined contribution scheme is administered by third party fund managers. The Company makes annual contributions based on a specified percentage of each eligible employee’s salary.
c. Gratuity
In accordance with the Payment of Gratuity Act, 1972, applicable for Indian companies, the Company provides for a lump sum payment to eligible employees, at retirement or termination of employment based on the last drawn salary and years of employment with the Company. The gratuity fund is managed by third party fund managers. The Company’s obligation in respect of the gratuity plan, which is a defined benefit plan, is provided for based on actuarial valuation using the projected unit credit method. The Company recognizes actuarial gains and losses in other comprehensive income, net of taxes.
d. Termination benefits
Termination benefits are expensed when the Company can no longer withdraw the offer of those benefits.
e. Short-term benefits
Short-term employee benefit obligations are measured on an undiscounted basis and are recorded as expense as the related service is provided. A liability is recognized for the amount expected to be paid under short-term cash bonus or profit-sharing plans, if the Company has a present legal or constructive obligation to pay this amount as a result of past service provided by the employee and the obligation can be estimated reliably.
f. Compensated absences
The employees of the Company are entitled to compensated

Consolidated Financial Statements Under IFRS
Annual Report 2018-19 305
absences. The employees can carry forward a portion of the unutilized accumulating compensated absences and utilize it in future periods or receive cash at retirement or termination of employment. The Company records an obligation for compensated absences in the period in which the employee renders the services that increases this entitlement. The Company measures the expected cost of compensated absences as the additional amount that the Company expects to pay as a result of the unused entitlement that has accumulated at the end of the reporting period. The Company recognizes accumulated compensated absences based on actuarial valuation using the projected unit credit method. Non-accumulating compensated absences are recognized in the period in which the absences occur.
(xii) Share-based payment transactions
Selected employees of the Company receive remuneration in the form of equity settled instruments, for rendering services over a defined vesting period and for company’s performance-based stock options over the defined period. Equity instruments granted are measured by reference to the fair value of the instrument at the date of grant. In cases, where equity instruments are granted at a nominal exercise price, the intrinsic value on the date of grant approximates the fair value. The expense is recognized in the consolidated statement of income with a corresponding increase to the share-based payment reserve, a component of equity.
The equity instruments generally vest in a graded manner over the vesting period. The fair value determined at the grant date is expensed over the vesting period of the respective tranches of such grants (accelerated amortization). The stock compensation expense is determined based on the Company’s estimate of equity instruments that will eventually vest.
(xiii) Provisions
Provisions are recognized when the Company has a present obligation (legal or constructive), as a result of a past event, it is probable that an outflow of economic benefits will be required to settle the obligation and a reliable estimate can be made of the amount of the obligation.
The amount recognized as a provision is the best estimate of the consideration required to settle the present obligation at the end of the reporting period, taking into account the risks and uncertainties surrounding the obligation.
When some or all of the economic benefits required to settle a provision are expected to be recovered from a third party, the receivable is recognized as an asset, if it is virtually certain that reimbursement will be received, and the amount of the receivable can be measured reliably.
Provisions for onerous contracts are recognized when the expected benefits to be derived by the Company from a contract are lower than the unavoidable costs of meeting the future obligations under the contract. Provisions for onerous contracts are measured at the present value of lower of the expected net cost of fulfilling the contract and the expected cost of terminating the contract.
(xiv) Revenue
The Company derives revenue primarily from software development, maintenance of software/hardware and related services, business process services, sale of IT and other products.
Revenue is recognized upon transfer of control of promised products or services to customers in an amount that reflects the consideration the Company expects to receive in exchange for those products or services. To recognize revenues, the Company applies the following five step approach: (1) identify the contract with a customer, (2) identify the performance obligations in the contract, (3) determine the transaction price, (4) allocate the transaction price to the performance obligations in the contract, and (5) recognize revenues when a performance obligation is satisfied.
At contract inception, the Company assesses its promise to transfer products or services to a customer to identify separate performance obligations. The Company applies judgement to determine whether each product or service promised to a customer is capable of being distinct, and are distinct in the context of the contract, if not, the promised products or services are combined and accounted as a single performance obligation. The Company allocates the arrangement consideration to separately identifiable performance obligation based on their relative stand-alone selling price or residual method. Stand-alone selling prices are determined based on sale prices for the components when it is regularly sold separately, in cases where the Company is unable to determine the stand-alone selling price the Company uses third-party prices for similar deliverables or the company uses expected cost-plus margin approach in estimating the stand-alone selling price.
For performance obligations where control is transferred over time, revenues are recognized by measuring progress towards completion of the performance obligation. The selection of the method to measure progress towards completion requires judgment and is based on the nature of the promised products or services to be provided.
The method for recognizing revenues and costs depends on the nature of the services rendered:
A. Time and materials contracts
Revenues and costs relating to time and materials are recognized as the related services are rendered.
B. Fixed-price contracts
i. Fixed-price development contracts
Revenues from fixed-price contracts, including software development, and integration contracts, where the performance obligations are satisfied over time, are recognized using the “percentage-of-completion” method. Percentage of completion is determined based on project costs incurred to date as a percentage of total estimated project costs required to complete the project. The cost expended (or input) method has been used to measure progress towards completion as there is a

Consolidated Financial Statements Under IFRS
306 Wipro Limited
direct relationship between input and productivity. If the Company is not able to reasonably measure the progress of completion, revenue is recognized only to the extent of costs incurred, for which recoverability is probable. When total cost estimates exceed revenues in an arrangement, the estimated losses are recognized in the consolidated statement of income in the period in which such losses become probable based on the current contract estimates as an onerous contract provision.
A contract asset is a right to consideration that is conditional upon factors other than the passage of time. Contract assets primarily relate to unbilled amounts on fixed-price development contracts and are classified as non-financial asset as the contractual right to consideration is dependent on completion of contractual milestones.
A contract liability is an entity’s obligation to transfer goods or services to a customer for which the entity has received consideration (or the amount is due) from the customer.
Unbilled revenues on other than fixed price development contracts are classified as a financial asset where the right to consideration is unconditional upon passage of time
ii. Maintenance contracts
Revenues related to fixed-price maintenance, testing and business process services are recognized based on our right to invoice for services performed for contracts in which the invoicing is representative of the value being delivered. If our invoicing is not consistent with value delivered, revenues are recognized as the service is performed using the percentage of completion method. When services are performed through an indefinite number of repetitive acts over a specified period, revenue is recognized on a straight-line basis over the specified period unless some other method better represents the stage of completion.
In certain projects, a fixed quantum of service or output units is agreed at a fixed price for a fixed term. In such contracts, revenue is recognized with respect to the actual output achieved till date as a percentage of total contractual output. Any residual service unutilized by the customer is recognized as revenue on completion of the term.
iii. Volume based contracts
Revenues and costs are recognized as the related services are rendered.
C. Products
Revenue on product sales are recognized when the customer obtains control of the specified asset.
D. Others
• Any change in scope or price is considered as a contract modification. The Company accounts for modifications to existing contracts by assessing whether the services added are distinct and whether the pricing is at the stand-alone selling price.
Services added that are not distinct are accounted for on a cumulative catch up basis, while those that are distinct are accounted for prospectively, either as a separate contract if the additional services are priced at the stand-alone selling price, or as a termination of the existing contract and creation of a new contract if not priced at the stand-alone selling price.
• The Company accounts for variable considerations like, volume discounts, rebates and pricing incentives to customers as reduction of revenue on a systematic and rational basis over the period of the contract. The Company estimates an amount of such variable consideration using expected value method or the single most likely amount in a range of possible consideration depending on which method better predicts the amount of consideration to which the Company may be entitled.
• Revenues are shown net of allowances/ returns, sales tax, value added tax, goods and services tax and applicable discounts and allowances.
• The Company accrues the estimated cost of warranties at the time when the revenue is recognized. The accruals are based on the Company’s historical experience of material usage and service delivery costs.
• Incremental costs that relate directly to a contract and incurred in securing a contract with a customer are recognized as an asset when the Company expects to recover these costs and amortized over the contract term.
• The Company recognizes contract fulfilment cost as an asset if those costs specifically relate to a contract or to an anticipated contract, the costs generate or enhance resources that will be used in satisfying performance obligations in future; and the costs are expected to be recovered. The asset so recognized is amortized on a systematic basis consistent with the transfer of goods or services to customer to which the asset relates.
• The Company assesses the timing of the transfer of goods or services to the customer as compared to the timing of payments to determine whether a significant financing component exists. As a practical expedient, the Company does not assess the existence of a significant financing component when the difference between payment and transfer of deliverables is a year or less. If the difference in timing arises for reasons other than the provision of finance to either the customer or us, no financing component is deemed to exist.
• The Company may enter into arrangements with third party suppliers to resell products or services. In such cases, the Company evaluates whether the Company is the principal (i.e. report revenues on a gross basis) or agent (i.e. report revenues on a net basis). In doing so, the Company first evaluates whether the Company controls the good or service before it is transferred to the customer. If Company controls the good or service

Consolidated Financial Statements Under IFRS
Annual Report 2018-19 307
before it is transferred to the customer, Company is the principal; if not, the Company is the agent.
(xv) Finance expenses
Finance expenses comprises interest cost on borrowings, gains or losses arising on re-measurement of financial assets measured at FVTPL, gains/ (losses) on translation or settlement of foreign currency borrowings and changes in fair value and gains/ (losses) on settlement of related derivative instruments. Borrowing costs that are not directly attributable to a qualifying asset are recognized in the consolidated statement of income using the effective interest method.
(xvi) Finance and other income
Finance and other income comprise interest income on deposits, dividend income and gains / (losses) on disposal of investments. Interest income is recognized using the effective interest method. Dividend income is recognized when the right to receive payment is established.
(xvii) Income tax
Income tax comprises current and deferred tax. Income tax expense is recognized in the consolidated statement of income except to the extent it relates to a business combination, or items directly recognized in equity or in other comprehensive income.
a) Current income tax
Current income tax for the current and prior periods are measured at the amount expected to be recovered from or paid to the taxation authorities based on the taxable income for the period. The tax rates and tax laws used to compute the current tax amounts are those that are enacted or substantively enacted as at the reporting date and applicable for the period. The Company offsets current tax assets and current tax liabilities, where it has a legally enforceable right to set off the recognized amounts and where it intends either to settle on a net basis, or to realize the asset and liability simultaneously.
b) Deferred income tax
Deferred income tax is recognized using the balance sheet approach. Deferred income tax assets and liabilities are recognized for deductible and taxable temporary differences arising between the tax base of assets and liabilities and their carrying amount in financial statements, except when the deferred income tax arises from the initial recognition of goodwill or an asset or liability in a transaction that is not a business combination and affects neither accounting nor taxable profits or loss at the time of the transaction.
Deferred income tax assets are recognized to the extent it is probable that taxable profit will be available against which the deductible temporary differences and the carry forward of unused tax credits and unused tax losses can be utilized.
Deferred income tax liabilities are recognized for all taxable temporary differences except in respect of taxable temporary differences that is expected to reverse within
the tax holiday period, taxable temporary differences associated with investments in subsidiaries, associates and foreign branches where the timing of the reversal of the temporary difference can be controlled and it is probable that the temporary difference will not reverse in the foreseeable future.
The carrying amount of deferred income tax assets is reviewed at each reporting date and reduced to the extent that it is no longer probable that sufficient taxable profit will be available to allow all or part of the deferred income tax asset to be utilized.
Deferred income tax assets and liabilities are measured at the tax rates that are expected to apply in the period when the asset is realized, or the liability is settled, based on tax rates (and tax laws) that have been enacted or substantively enacted at the reporting date.
The Company offsets deferred income tax assets and liabilities, where it has a legally enforceable right to offset current tax assets against current tax liabilities, and they relate to taxes levied by the same taxation authority on either the same taxable entity, or on different taxable entities where there is an intention to settle the current tax liabilities and assets on a net basis or their tax assets and liabilities will be realized simultaneously.
(xviii) Earnings per share
Basic earnings per share is computed using the weighted average number of equity shares outstanding during the period adjusted for treasury shares held. Diluted earnings per share is computed using the weighted-average number of equity and dilutive equivalent shares outstanding during the period, using the treasury stock method for options, except where the results would be anti-dilutive.
The number of equity shares and potentially dilutive equity shares are adjusted retrospectively for all periods presented for any splits and bonus shares issues including for change effected prior to the approval of the consolidated financial statements by the Board of Directors.
(xix) Cash flow statement
Cash flow are reported using the indirect method, whereby profit for the period is adjusted for the effects of transactions of a non-cash nature, any deferrals or accruals of past or future operating cash receipts or payments and item of income or expenses associated with investing or financing cash flows. The cash from operating, investing and financing activities of the Company are segregated.
The amendment to IAS 7, require entities to provide disclosures about changes in their liabilities arising from financing activities, including both changes arising from cash flows and non-cash changes (such as foreign exchange gains or losses).
(xx) Assets held for sale
Sale of business is classified as held for sale, if their carrying amount is intended to be recovered principally through sale rather than through continuing use. The

Consolidated Financial Statements Under IFRS
308 Wipro Limited
condition for classification as held for sale is met when disposal business is available for immediate sale and the same is highly probable of being completed within one year from the date of classification as held for sale.
(xxi) Discontinued operations
A discontinued operation is a component of the Company’s business that represents a separate line of business that has been disposed off or is held for sale, or is a subsidiary acquired exclusively with a view to resale. Classification as a discontinued operation occurs upon the earlier of disposal or when the operation meets the criteria to be classified as held for sale.
(xxii) Disposal of assets
The gain or loss arising on disposal or retirementof assets are recognized in the consolidated statement of income.
New Accounting standards adopted by the Company:
IFRS 15 – Revenue from Contracts with Customers
On April 1, 2018, the Company adopted IFRS 15, “Revenue from Contracts with Customers” using the cumulative catch-up transition method applied to contracts that were not completed as at April 1, 2018. In accordance with the cumulative catch-up transition method, the comparatives have not been retrospectively adjusted.
The adoption of the new standard has resulted in a reduction of ̀ 2,279 in opening retained earnings, primarily relating to certain contract costs because these do not meet the criteria for recognition as costs to fulfil a contract.
On account of adoption of IFRS 15, unbilled revenues pertaining to fixed price development contracts of ` 15,038 as at March 31, 2019, has been considered as non-financial Contract assets, which are billable on completion of milestones specified in the contracts.
Unbilled revenues ` 22,880 which are billable based on passage of time has been classified as unbilled receivables.
The adoption of IFRS 15, did not have any material impact on the consolidated statement of income and earnings per share for year ended March 31, 2019.
A. Contract Asset and Liabilities
The Company classifies its right to consideration in exchange for deliverables as either a receivable or a contract asset.
A receivable is a right to consideration that is unconditional. A right to consideration is unconditional if only the passage of time is required before payment of that consideration is due. For example, the company recognizes a receivable for revenues related to time and materials contracts or volume-based contracts. The Company present such receivables as part of unbilled receivables at their net estimated realizable value.
Contract liabilities: During the year ended March 31, 2019, the Company recognized revenue of ̀ 14,570 arising from opening unearned revenue as at April 1, 2018.
Contract assets:During the year ended March 31, 2019, ` 13,558 of unbilled revenue pertaining to fixed-price development contracts (balance as at April 1, 2018: ` 17,469), has been reclassified to trade receivables on completion of milestones.
Contract assets and liabilities are reported in a net position on a contract by contract basis at the end of each reporting period.
B. Remaining Performance Obligations
Revenue allocated to remaining performance obligations represents contracted revenue that has not yet been recognized which includes unearned revenue and amounts that will be invoiced and recognized as revenue in future periods. Applying the practical expedient, the Company has not disclosed its right to consideration from customer in an amount that corresponds directly with the value to the customer of the Company’s performance completed to date which are, contracts invoiced on time and material basis and volume based. As at March 31, 2019, the aggregate amount of transaction price allocated to remaining performance obligations, other than those meeting the exclusion criteria above, was ` 373,879 of which approximately 59% is expected to be recognized as revenues within two years, and the remainder thereafter. This includes contracts that can be terminated for convenience without a substantive penalty since, based on current assessment, the occurrence of the same is expected to be remote.

Consolidated Financial Statements Under IFRS
Annual Report 2018-19 309
C.
Dis
aggr
egat
ion
of R
even
ues
Th
e ta
ble
bel
ow p
rese
nts
dis
aggr
egat
ed r
even
ues
from
con
trac
ts w
ith
cust
omer
s by
bus
ines
s se
gmen
t, c
usto
mer
loca
tion
and
con
trac
t-ty
pe.
Th
e C
omp
any
bel
ieve
s th
at t
he b
elow
dis
aggr
egat
ion
bes
t d
epic
ts t
he n
atur
e, a
mou
nt, t
imin
g an
d u
ncer
tain
ty o
f re
venu
e an
d c
ash
flow
s fr
om
econ
omic
fac
tors
.
IT S
ervi
ces
BFS
IH
ealt
h B
UC
BU
EN
UTE
CH
MFG
CO
MM
Tot
al
Pro
duct
s IS
RE
T
otal
A.
Rev
enue
R
end
erin
g of
ser
vice
s17
3,51
673
,942
88,7
9772
,329
76,1
0846
,155
32,4
8956
3,33
6-
7,96
557
1,30
1
S
ales
of
pro
duc
ts-
--
--
--
-14
,544
-14
,544
173,
516
73,9
4288
,797
72,3
2976
,108
46,1
5532
,489
563,
336
14,5
447,
965
585,
845
B.
Rev
enue
by
geog
rap
hy
In
dia
3,86
82,
295
1,00
61,
690
1,39
21,
534
3,09
514
,880
8,15
47,
965
30,9
99
Am
eric
as98
,428
57,2
0459
,262
22,7
3954
,679
21,5
417,
694
321,
547
2,11
2-
323,
659
Eur
ope
46,8
567,
591
17,6
3629
,795
16,4
4118
,211
7,42
014
3,95
02,
240
-14
6,19
0
Res
t of
Wor
ld24
,364
6,85
210
,893
18,1
053,
596
4,86
914
,280
82,9
592,
038
-84
,997
173,
516
73,9
4288
,797
72,3
2976
,108
46,1
5532
,489
563,
336
14,5
447,
965
585,
845
C.
Rev
enue
by
natu
re o
f co
ntra
ct
Fix
ed p
rice
and
vol
ume
base
d89
,378
53,4
6250
,425
51,7
9947
,055
31,8
4319
,847
343,
809
-6,
176
349,
985
Ti
me
and
mat
eria
ls84
,138
20,4
8038
,372
20,5
3029
,053
14,3
1212
,642
219,
527
-1,
789
221,
316
P
rod
ucts
--
--
--
--
14,5
44-
14,5
44
173,
516
73,9
4288
,797
72,3
2976
,108
46,1
5532
,489
563,
336
14,5
447,
965
585,
845

Consolidated Financial Statements Under IFRS
310 Wipro Limited
IFRIC 22- Foreign currency transactions and Advance consideration
The Company has applied IFRIC 22 prospectively effective April 1, 2018. The effect on adoption of IFRIC 22 on the consolidated financial statements is insignificant.
New accounting standards not yet adopted:
Certain new standards, amendments to standards and interpretations are not yet effective for annual periods beginning after April 1 2018, and have not been applied in preparing these consolidated financial statements. New standards, amendments to standards and interpretations that could have potential impact on the consolidated financial statements of the Company are:
IFRS 16 – Leases
On January 13, 2016, the International Accounting Standards Board issued IFRS 16, Leases. IFRS 16 will replace the existing leases Standard, IAS 17 Leases, and related interpretations. The standard sets out the principles for the recognition, measurement, presentation and disclosure of leases. IFRS 16 introduces a single lessee accounting model and requires a lessee to recognize assets and liabilities for all leases with a term of more than 12 months, unless the underlying asset is of low value. The Standard also contains enhanced disclosure requirements for lessees.
The standard allows for two methods of transition: the full retrospective approach, requires entities to retrospectively apply the new standard to each prior reporting period presented and the entities need to adjust equity at the beginning of the earliest comparative period presented, or the modified retrospective approach, under which the date of initial application of the new leases standard, lessees recognize the cumulative effect of initial application as an adjustment to the opening balance of equity as at annual periods beginning on or after January 1, 2019.
The Company will adopt this standard using modified retrospective method effective April 1, 2019, and accordingly, the comparative for year ended March 31, 2018 and 2019, will not be retrospectively adjusted. The Company has elected certain available practical expedients on transition.
Based on assessment, the effect of adoption as on transition date would majorly result in recognizing a right-of-use assets and corresponding lease liabilities approximately ` 13,266 and ` 15,867 respectively. There will be reclassification in the cash flow categories in the statement of cash flows.
IFRIC 23 – Uncertainty over Income Tax treatments
On June 7, 2017, the International Accounting Standards Board issued IFRIC 23 which clarifies the accounting for uncertainties in income taxes. The interpretation is to be applied to the determination of taxable profit (tax loss), tax bases, unused tax losses, unused tax credits and tax rates, when there is uncertainty over income tax treatments
under IAS 12. The entity has to consider the probability of the relevant taxation authority accepting the tax treatment and the determination of taxable profit (tax loss), tax bases, unused tax losses, unused tax credits and tax rates would depend upon the probability. The effective date for adoption of IFRIC 23 for annual periods beginning on or after January 1, 2019, though early adoption is permitted. The Company will apply IFRIC 23 prospectively from the effective date and the effect on adoption of IFRIC 23 on the consolidated financial statement is insignificant.
Amendment to IAS 12 – Income Taxes
In December 2017, the International Accounting Standard Board had issued amendments to IAS 12 – Income Taxes. The amendments clarify that an entity shall recognize the income tax consequences of dividends on financial instruments classified as equity according to where the entity originally recognized those past transactions or events that generated distributable profits were recognized. The effective date of these amendments is annual periods beginning on or after January 1, 2019, though earlier adoption is permitted. The Company does not plan to early adopt this amendment and is currently assessing the impact of this amendment on the Company’s consolidated financial statements.
Amendment to IAS 19 - Plan Amendment, Curtailment or Settlement
On 7 February 2018, the International Accounting Standard Board has issued amendments to IAS 19, ‘Employee Benefits’, in connection with accounting for plan amendments, curtailments and settlements requiring an entity to determine the current service costs and the net interest for the period after the remeasurement using the assumptions used for the remeasurement; and determine the net interest for the remaining period based on the remeasured net defined benefit liability or asset. These amendments are effective for annual reporting periods beginning on or after January 1, 2019, with early application permitted. The Company will apply the amendment to IAS 19 prospectively from the effective date and the effect on adoption of the amendment on the consolidated financial statement is insignificant.
Amendment to IFRS 3 - Business combination
On October 22, 2018, the International Accounting Standard Board has issued amendments to IFRS 3, ‘Business Combinations’, in connection with clarification of business definition, which help in determining whether an acquisition made is of a business or a group of assets. The amendment added a test that makes it easier to conclude that a company has acquired a group of assets, rather than a business, if the value of the assets acquired is substantially all concentrated in a single asset or group of similar assets. These amendments are effective for annual reporting periods beginning on or after January 1, 2020, with early application permitted. The Company is currently evaluating the impact of amendment to IFRS 3 on the Company’s consolidated financial statement.

Consolidated Financial Statements Under IFRS
Annual Report 2018-19 311
4. Property, plant and equipment
Land Buildings Plant and machinery*
Furniture fixtures
and equipment
Vehicles Total
Gross carrying value:As at April 1, 2017 ` 3,814 ` 27,581 ` 108,967 ` 15,748 ` 432 ` 156,542Translation adjustment 28 265 904 188 2 1,387Additions 2 1,197 11,767 1,776 1,003 15,745Acquisition through business combinations - 13 4 11 1 29Disposals - (190) (7,302) (872) (294) (8,658)Assets reclassified as held for sale (207) (3,721) (27,118) (1,079) (5) (32,130)As at March 31, 2018 3,637 25,145 87,222 15,772 1,139 132,915Accumulated depreciation/ impairment:As at April 1, 2017 - ` 6,361 ` 77,005 ` 11,968 ` 365 ` 95,699Translation adjustment - 49 509 104 - 662Depreciation - 1,023 14,078 1,381 387 16,869Disposals - (70) (6,640) (758) (242) (7,710)Assets reclassified as held for sale (1,539) (19,627) (712) (4) (21,882)As at March 31, 2018 - 5,824 65,325 11,983 506 83,638Capital work-in-progress ` 15,680Assets reclassified as held for sale (514) Net carrying value including Capital work-in-progress as at March 31, 2018 ` 64,443Gross carrying value:As at April 1, 2018 ` 3,637 ` 25,145 ` 87,222 ` 15,772 ` 1,139 ` 132,915Translation adjustment (5) (8) 613 - (6) 594Additions 65 2,684 10,402 1,951 4 15,106Disposals - (331) (5,871) (1,218) (189) (7,609)As at March 31, 2019 ` 3,697 ` 27,490 ` 92,366 ` 16,505 ` 948 ` 141,006Accumulated depreciation/ impairment:As at April 1, 2018 - 5,824 65,325 11,983 506 ` 83,638Translation adjustment - 8 332 (6) (3) 331Depreciation and impairment ** - 1,034 12,298 1,363 304 14,999Disposals - (151) (4,767) (747) (125) (5,790)As at March 31, 2019 - 6,715 73,188 12,593 682 93,178Capital work-in-progress ` 22,773 Net carrying value including Capital work-in-progress as at March 31, 2019 ` 70,601
* Including net carrying value of computer equipment and software amounting to ` 17,765 and ` 16,375, as at March 31, 2018 and 2019, respectively.
** Includes impairment charge on software platform recognized on acquisitions, amounting to Nil, Nil and ` 1,480, for the year ended March 31, 2017, 2018 and 2019, respectivelyis included in Cost of revenues in the consolidated statement of income.

Consolidated Financial Statements Under IFRS
312 Wipro Limited
5. Goodwill and intangible assets
The movement in goodwill balance is given below:
Year ended March 31,2018 2019
Balance at the beginning of the year ` 125,796 ` 117,584Translation adjustment 2,970 4,529Disposal (Refer Note 22) - (4,893)Acquisition through business combination 1,172 -Assets reclassified as held for sale (12,354) (240)Balance at the end of the year ` 117,584 ` 116,980
Acquisition through business combinations for the year ended March 31, 2018, includes goodwill recognized on four acquisitions. Also refer Note 6 to the consolidated financial statements.
The Company is organized by three operating segments: IT Services, IT Products and India State Run Enterprise. Goodwill as at March 31, 2018 and 2019 has been allocated to the IT Services operating segment.
Goodwill recognized on business combinations is allocated to Cash Generating Units (CGUs), within the IT Services operating segment, which are expected to benefit from the synergies of the acquisitions.
During the year ended March 31, 2019, the Company realigned its CGUs (also refer Note 30). Consequently, goodwill has been allocated to the new CGUs as at March 31, 2019 as follows:
CGUs
As at March 31,
2019Banking Financial Services and Insurance (BFSI) ` 17,713Healthcare and Life Sciences (Health BU) 50,670Consumer (CBU) 13,587Energy, Natural Resources and Utilities (ENU) 15,203Manufacturing (MFG) 8,991Technology (TECH) 9,846Communication (COMM) 970
` 116,980
Following table presents the allocation of goodwill to the CGUs for the year ended March 31, 2018:
CGUs
As at March 31,
2018Banking Financial Services and Insurance (BFSI) ` 17,475Healthcare and Life Sciences (HLS) 49,085Consumer (CBU) 14,776Energy, Natural Resources and Utilities (ENU) 14,863Manufacturing and Technology (MNT) 20,406Communication (COMM) 979
` 117,584
For the purpose of impairment testing, goodwill is allocated to a CGU representing the lowest level within the Group at which goodwill is monitored for internal management purposes, and which is not higher than the Company’s operating segment. Goodwill is tested for impairment at least annually in accordance with the Company’s procedure for determining the recoverable value of each CGU.
The recoverable amount of the CGU is determined on the basis of Fair Value Less Cost of Disposal (FVLCD). The FVLCD of the CGU is determined based on the market capitalization approach, using the turnover and earnings multiples derived from observable market data. The fair value measurement is categorized as a level 2 fair value based on the inputs in the valuation techniques used.
Based on the above testing, no impairment was identified as at March 31, 2018 and 2019, as the recoverable value of the CGUs exceeded the carrying value. Further, none of the CGU’s tested for impairment as at March 31, 2018 and 2019 were at risk of impairment. An analysis of the calculation’s sensitivity to a change in the key parameters (turnover and earnings multiples), did not identify any probable scenarios where the CGU’s recoverable amount would fall below its carrying amount.

Consolidated Financial Statements Under IFRS
Annual Report 2018-19 313
The movement in intangible assets is given below:
Intangible assets
Customer related Marketing related TotalGross carrying value:As at April 1, 2017 ` 20,528 ` 6,279 ` 26,807Translation adjustment 493 103 596Acquisition through business combinations 5,565 169 5,734As at March 31, 2018 ` 26,586 ` 6,551 ` 33,137Accumulated amortization/impairment:As at April 1, 2017 ` 9,264 ` 1,621 ` 10,885Translation adjustment 14 11 25Amortization and impairment * 2,985 1,129 4,114As at March 31, 2018 ` 12,263 ` 2,761 ` 15,024Net carrying value as at March 31, 2018 ` 14,323 ` 3,790 ` 18,113Gross carrying value:As at April 1, 2018 ` 26,586 ` 6,551 ` 33,137Translation adjustment 555 217 772Disposal (Refer Note 22) (217) (823) (1,040)As at March 31, 2019 ` 26,924 ` 5,945 ` 32,869Accumulated amortization/impairment:As at April 1, 2018 ` 12,263 ` 2,761 ` 15,024Translation adjustment 35 64 99Amortization and impairment * 3,148 1,136 4,284Disposal (Refer Note 22) (101) (199) (300)As at March 31, 2019 ` 15,345 ` 3,762 ` 19,107Net carrying value as at March 31, 2019 ` 11,579 ` 2,183 ` 13,762
* includes impairment charge on certain intangible assets recognized on acquisitions, amounting to ̀ 3,056, ̀ 643 and ` 838 for the year ended March 31, 2017, 2018 and 2019, respectively.
Amortization and impairment expense on intangible assets is included in selling and marketing expenses in the consolidated statement of income.
Acquisition through business combinations for the year ended March 31, 2018, primarily includes intangible assets recognized on four acquisitions. Also refer Note 6 to the Consolidated financial statements.
As at March 31, 2019, the estimated remaining amortization period for intangible assets acquired on acquisition are as follows:
AcquisitionEstimated remaining
amortization periodGlobal oil and gas information technology practice of the Commercial Business Services 1.25 – 2.25 yearsBusiness Unit of Science Applications International CorporationPromax Application Group 3.25 years Opus Capital Markets Consultants LLC 1.75 years ATCO I-Tek 5.50 years Designit AS 1.25 years Cellent AG 1.75 – 3.75 years Appirio Inc. 2.75 years Other entities 1 – 13.25 years
6. Business combination
Summary of material acquisitions during the year ended March 31, 2017 is given below:
Appirio Inc.
On November 23, 2016, the Company obtained full control of Appirio Inc. (“Appirio”). Appirio is a global services company that helps customers create next-generation employee and customer experiences using latest cloud technology services. This acquisition will strengthen Wipro’s cloud application service offerings. The acquisition was consummated for a consideration of ` 32,402 (USD 475.7 million).

Consolidated Financial Statements Under IFRS
314 Wipro Limited
The following table presents the allocation of purchase price:
DescriptionPre-acquisition
carrying amountFair value
adjustmentsPurchase price
allocatedNet assets ` 526 ` (29) ` 497Technology platform 436 (89) 347Customer related intangibles - 2,323 2,323Brand 180 2,968 3,148Alliance relationship - 858 858Deferred tax liabilities on intangible assets - (2,791) (2,791)Total ` 1,142 ` 3,240 ` 4,382Goodwill 28,020Total purchase price ` 32,402
Net assets acquired include ` 85 of cash and cash equivalents and trade receivables valued at ` 2,363.
The goodwill of ` 28,020 comprises value of acquired workforce and expected synergies arising from the acquisition. Goodwill is not deductible for income tax purposes.
If the acquisition had occurred on April 1, 2016, management estimates that consolidated revenue for the Company would have been ` 559,575 and the profit after taxes would have been ` 85,424 for twelve months ended March 31, 2017. The pro-forma amounts are not necessarily indicative of the results that would have occurred if the acquisition had occurred on date indicated or that may result in the future.
Summary of material acquisitions during the year ended March 31, 2018 is given below:
During the year ended March 31, 2018, the Company has completed four business combinations (which individually and in aggregate are not material) for a total consideration of ` 6,924. These transactions include (a) an acquisition of IT service provider which is focused on Brazilian markets, (b) an acquisition of a design and business strategy consultancy firm based in United States, and (c) acquisition of intangible assets, assembled workforce and a multi-year service agreement which qualify as business combinations.
The following table presents the allocation of purchase price:
DescriptionPurchase price
allocatedNet assets ` 5Customer related intangibles 5,565Other intangible assets 169Total ` 5,739Goodwill 1,185Total purchase price ` 6,924
The goodwill of ̀ 1,185 comprises value of acquired workforce and expected synergies arising from the acquisition. The goodwill was allocated among the reportable operating segments and is partially deductible for U.S. federal income tax purpose.
Net assets acquired include ` 58 of cash and cash equivalents and trade receivables valued at ` 215.
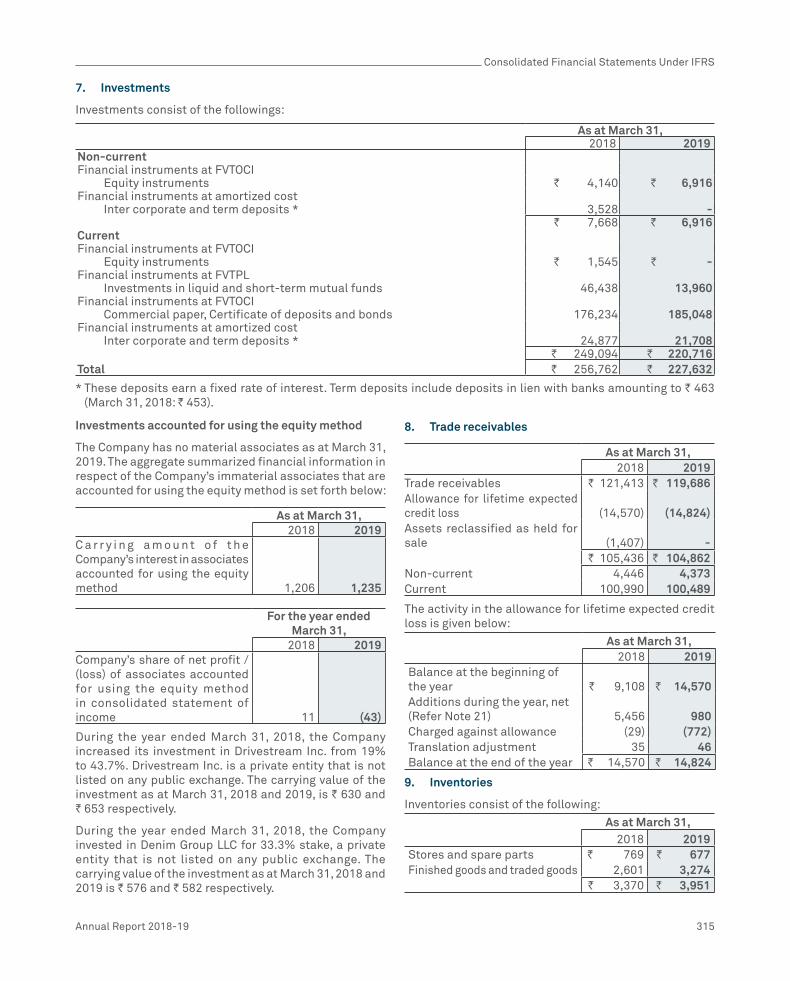
Consolidated Financial Statements Under IFRS
Annual Report 2018-19 315
7. Investments
Investments consist of the followings:
As at March 31,
2018 2019Non-currentFinancial instruments at FVTOCI Equity instruments ` 4,140 ` 6,916Financial instruments at amortized cost Inter corporate and term deposits * 3,528 -
` 7,668 ` 6,916CurrentFinancial instruments at FVTOCI Equity instruments ` 1,545 ` -Financial instruments at FVTPL Investments in liquid and short-term mutual funds 46,438 13,960Financial instruments at FVTOCI Commercial paper, Certificate of deposits and bonds 176,234 185,048Financial instruments at amortized cost Inter corporate and term deposits * 24,877 21,708
` 249,094 ` 220,716Total ` 256,762 ` 227,632
* These deposits earn a fixed rate of interest. Term deposits include deposits in lien with banks amounting to ` 463 (March 31, 2018: ` 453).
Investments accounted for using the equity method
The Company has no material associates as at March 31, 2019. The aggregate summarized financial information in respect of the Company’s immaterial associates that are accounted for using the equity method is set forth below:
As at March 31,
2018 2019C a r r y i n g a m o u n t o f t h e Company’s interest in associates accounted for using the equity method 1,206 1,235
For the year endedMarch 31,
2018 2019Company’s share of net profit /(loss) of associates accounted for using the equity method in consolidated statement of income 11 (43)
During the year ended March 31, 2018, the Company increased its investment in Drivestream Inc. from 19% to 43.7%. Drivestream Inc. is a private entity that is not listed on any public exchange. The carrying value of the investment as at March 31, 2018 and 2019, is ` 630 and ` 653 respectively.
During the year ended March 31, 2018, the Company invested in Denim Group LLC for 33.3% stake, a private entity that is not listed on any public exchange. The carrying value of the investment as at March 31, 2018 and 2019 is ` 576 and ` 582 respectively.
8. Trade receivables
As at March 31,
2018 2019Trade receivables ` 121,413 ` 119,686Allowance for lifetime expected credit loss (14,570) (14,824)Assets reclassified as held for sale (1,407) -
` 105,436 ` 104,862Non-current 4,446 4,373Current 100,990 100,489
The activity in the allowance for lifetime expected credit loss is given below:
As at March 31,2018 2019
Balance at the beginning of the year ` 9,108 ` 14,570Additions during the year, net (Refer Note 21) 5,456 980Charged against allowance (29) (772)Translation adjustment 35 46Balance at the end of the year ` 14,570 ` 14,824
9. Inventories
Inventories consist of the following:
As at March 31,2018 2019
Stores and spare parts ` 769 ` 677Finished goods and traded goods 2,601 3,274 ` 3,370 ` 3,951

Consolidated Financial Statements Under IFRS
316 Wipro Limited
10. Cash and cash equivalents
Cash and cash equivalents as at March 31, 2017, 2018 and 2019, consist of cash and balances on deposit with banks. Cash and cash equivalents consist of the following:
As at March 31,
2017 2018 2019
Cash and bank balances ` 27,808 ` 23,300 ` 41,966
Demand deposits with banks * 24,902 21,625 116,563
` 52,710 ` 44,925 `158,529
* These deposits can be withdrawn by the Company at any time without prior notice and any penalty on the principal.
Cash and cash equivalents consist of the following for the purpose of the cash flow statement:
As at March 31,
2017 2018 2019
Cash and cash equivalents (as above) ` 52,710 ` 44,925 `158,529
Bank overdrafts (1,992) (3,999) (4)
` 50,718 ` 40,926 `158,525
11. Other assets
As at March 31,2018 2019
Non-currentFinancial assetSecurity deposits ` 1,197 ` 1,436Other deposits 250 777Interest receivables - 1,139Finance lease receivables 2,739 1,794
` 4,186 ` 5,146
As at March 31,2018 2019
Non-Financial assetPrepaid expenses including rentals for leasehold land ` 7,602 ` 6,323Cost to obtain contract - 4,212Others 4,468 5,337Assets reclassified as held for sale (530) -
` 11,540 ` 15,872Other non-current assets ` 15,726 ` 21,018CurrentFinancial assetSecurity deposits ` 1,238 ` 1,050Other deposits 59 33Due from officers and employees 697 738Finance lease receivables 2,271 1,618Interest receivables 491 1,789Others 2,673 9,383
` 7,429 ` 14,611Non-Financial assetPrepaid expenses ` 14,407 ` 12,148Due from officers and employees 1,175 871Advance to suppliers 1,819 3,247Deferred contract costs 3,211 -Balance with excise, customs and other authorities 3,886 5,543Cost to obtain contract - 1,170Others 50 107Assets reclassified as held for sale (1,381) -
` 23,167 ` 23,086Other current assets ` 30,596 ` 37,697Total ` 46,322 ` 58,715
Finance lease receivables
Finance lease receivables consist of assets that are leased to customers for a contract term normally ranging 1 to 7 years, with lease payments due in monthly or quarterly installments. Details of finance lease receivables are given below:
Minimum lease payments
Present value of minimum lease payments
As at March 31, As at March 31,2018 2019 2018 2019
Not later than one year ` 2,414 ` 1,742 ` 2,271 ` 1,618Later than one year but not later than five years 2,890 1,813 2,739 1,752Later than five years - 44 - 42Gross investment in lease 5,304 3,599 5,010 3,412Less: Unearned finance income (294) (187) - -Present value of minimum lease payment receivables ` 5,010 ` 3,412 ` 5,010 ` 3,412Non-current finance lease receivables 2,739 1,794Current finance lease receivables 2,271 1,618

Consolidated Financial Statements Under IFRS
Annual Report 2018-19 317
12. Loans, borrowings and bank overdrafts
Short-term loans, borrowings and bank overdrafts
The Company had loans, borrowings and bank overdrafts amounting to ` 79,598 and ` 68,085, as at March 31, 2018 and 2019, respectively. The principal source of borrowings from banks as at March 31, 2019 primarily consists of lines of credit of approximately ̀ 7,979 million, U.S. Dollar (U.S.$) 1,410 million, Canadian Dollar (CAD) 57 million, EURO 20 million and Indonesian Rupiah (IDR) 13,000 million from bankers for working capital requirements and other short-term needs. As at March 31, 2019, the Company has unutilized lines of credit aggregating U.S.$ 440 million, EURO 20 million, CAD 38 million, ̀ 7,957 million and IDR 13,000 million. To utilize these unused lines of
credit, the Company requires consent of the lender and compliance with certain financial covenants. Significant portion of these lines of credit are revolving credit facilities and floating rate foreign currency loans, renewable on a periodic basis. Significant portion of these facilities bear floating rates of interest, referenced to LIBOR and a spread, determined based on market conditions.
The Company has non-fund based revolving credit facilities in various currencies equivalent to ` 44,022 and ` 40,470, as at March 31, 2018 and 2019, respectively, towards operational requirements that can be used for the issuance of letters of credit and bank guarantees. As at March 31, 2018, and 2019, an amount of ` 22,476, and ` 22,014, respectively, was unutilized out of these non-fund based facilities.
Long-term loans and borrowings
Currency
As at March 31, 2018 As at March 31, 2019
Foreign currency
in millions
Indian Rupee
Foreign currency
in millions
Indian Rupee
Interest rate Final maturity
Unsecured external commercial borrowing
U.S. Dollar 150 9,777 - - - -
Unsecured loans
U.S. Dollar 625 40,715 382 26,395 3.01% - 3.81% July 2021
Canadian Dollar (CAD) 72 3,660 52 2,701 1.48% - 3.26% July 2021
Indian Rupee - 366 - 162 8.29% - 9.35% December 2021
Australian Dollar (AUD) 2 92 1 70 4.65% January 2022
Great British Pound (GBP) ^ 42 ^ 31 2.93% February 2022
Euro ^ 24 ^ 19 2.98% December 2020
Brazilian Real (BRL) 1 12 ^ 2 14.04% May 2019
` 54,688 ` 29,380
Obligations under finance leases 5,442 2,002
Liabilities directly associated with assets held for sale (1,469) -
3,973 2,002
` 58,661 ` 31,382
Non-current portion of long-term loans and borrowings 45,268 28,368
Current portion of long-term loans and borrowings 13,393 3,014
^ Value is less than ` 1.

Consolidated Financial Statements Under IFRS
318 Wipro Limited
Changes in financing liabilities arising from cash and non-cash changes:
Non-cash changes
April 1, 2017
Cash flow
Assets taken on financial
lease
Foreign exchange
movements
Less: Liabilities directly associated
with assets held for sale
March 31, 2018
Borrowings from banks ` 120,911 ` (6,661) ` - ` 5,439 ` - ` 119,689Bank overdrafts 1,992 2,007 - - - 3,999External commercial borrowings 9,728 - - 49 - 9,777Obligations under finance leases 8,280 (3,627) 766 23 (1,469) 3,973Loans from other than bank 1,501 (695) - 15 - 821
` 142,412 ` (8,976) ` 766 ` 5,526 ` (1,469) ` 138,259
Non-cash changes
April 1, 2018
Cash flow
Assets taken on financial
lease
Foreign exchange
movements March 31,
2019 Borrowings from banks ` 119,689 `(26,228) ` - ` 3,518 ` 96,979Bank overdrafts 3,999 (3,995) - - 4External commercial borrowings 9,777 (10,064) - 287 -Obligations under finance leases 3,973 (2,234) 14 249 2,002Loans from other than bank 821 (352) - 13 482
` 138,259 `(42,873) ` 14 ` 4,067 ` 99,467
The terms of the other secured and unsecured loans and borrowings also contain certain restrictive covenants primarily requiring the Company to maintain certain financial ratios. As at March 31, 2018 and 2019, the Company has met all the covenants under these arrangements.
Obligations under finance leases amounting to ` 5,442 and ` 2,002 as at March 31, 2018 and 2019, respectively, are secured by underlying property, plant and equipment.
Interest expense on borrowings was ` 1,916, ` 3,045 and ` 4,058 for the year ended March 31, 2017, 2018 and 2019, respectively.
Finance lease payables consist of liabilities that are taken on lease for a contract term ranging from 1 to 5 years, with lease payments due in monthly or quarterly installments. Details of finance lease payables are given below:
Minimum lease payments
Present value of minimum lease payments
As at March 31, As at March 31,2018 2019 2018 2019
Not later than one year ` 3,838 ` 1,555 ` 3,720 ` 1,506Later than one year but not later than five years 1,784 506 1,722 496Later than five years - - - -Total minimum lease payments 5,622 2,061 5,442 2,002Less: Amounts representing interest (180) (59) - -Present value of minimum lease payment payables ` 5,442 ` 2,002 ` 5,442 ` 2,002Liabilities directly associated with assets held for sale (1,469) - (1,469) -Obligation under finance lease ` 3,973 ` 2,002 ` 3,973 ` 2,002Non-current finance lease payables 1,722 496Current finance lease payables 2,251 1,506

Consolidated Financial Statements Under IFRS
Annual Report 2018-19 319
14. Other liabilities and provisions
As at March 31,
2018 2019Other liabilitiesNon-currentFinancial liabilitiesDeposits and others ` 7 ` -
` 7 ` -Non-Financial liabilitiesEmployee benefits obligations ` 1,791 ` 2,083Others 2,440 3,175Liabilities directly associated with assets held for sale
(8) -
` 4,223 ` 5,258Other non-current liabilities ` 4,230 ` 5,258CurrentFinancial liabilitiesDeposits and others ` 1,050 ` 644
` 1,050 ` 644Non-Financial liabilitiesStatutory and other liabilities ` 4,263 ` 5,430Employee benefits obligations 8,537 10,065Advance from customers 1,901 1,361Others 1,139 1,190
As at March 31,
2018 2019Liabilities directly associated with assets held for sale
(277) -
` 15,563 ` 18,046Other current liabilities ` 16,613 ` 18,690Total ` 20,843 ` 23,948
ProvisionsNon-currentProvision for warranty ` 3 ` 2
` 3 ` 2CurrentProvision for warranty ` 290 ` 275Others 506 363
` 796 ` 638` 799 ` 640
Provision for warranty represents cost associated with providing sales support services which are accrued at the time of recognition of revenues and are expected to be utilized over a period of 1 to 2 years. Other provisions primarily include provisions for indirect tax related contingencies and litigations. The timing of cash outflows in respect of such provision cannot be reasonably determined.
A summary of activity for provision for warranty and other provisions is as follows:
Year ended March 31, 2018 Year ended March 31, 2019
Provision for
warranty
Others Total Provision for
warranty
Others Total
Balance at the beginning of the year ` 440 ` 834 ` 1,274 ` 293 ` 506 ` 799
Additional provision during the year 317 7 324 295 13 308
Provision used during the year (464) (335) (799) (311) (156) (467)
Balance at the end of the year ` 293 ` 506 ` 799 ` 277 ` 363 ` 640
13. Trade payables and accrued expenses
As at March 31,
2018 2019
Trade payables ` 24,406 ` 28,527
Accrued expenses 45,632 59,777
Liabilities directly associated with assets held for sale (1,909) -
` 68,129 ` 88,304
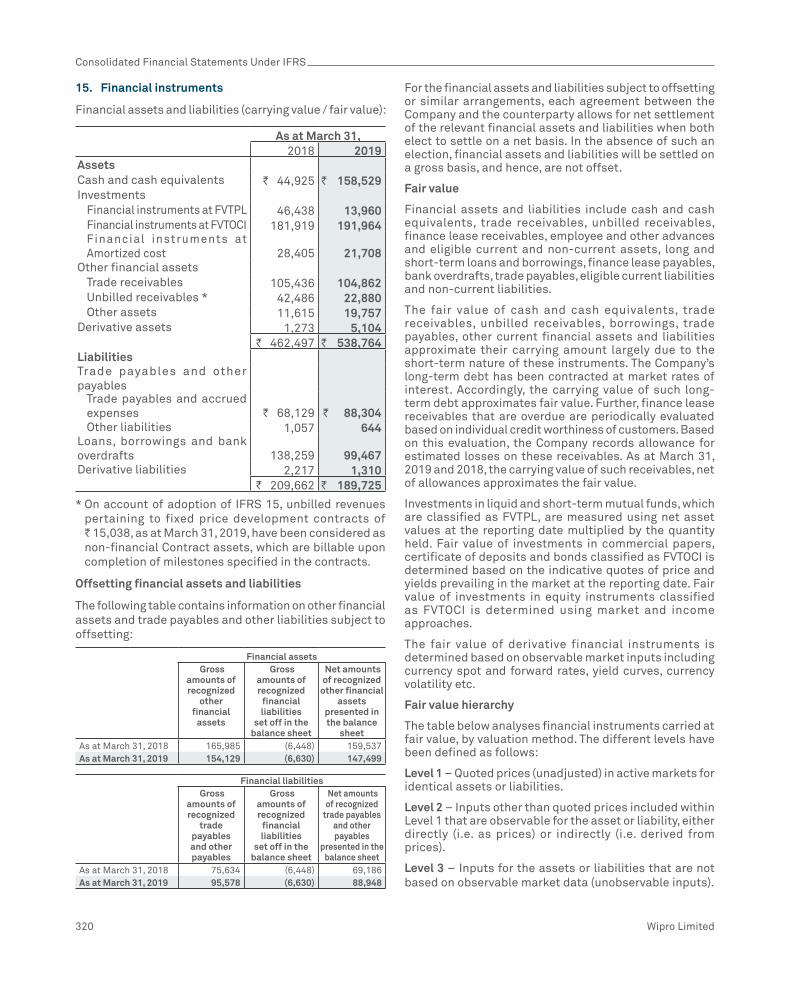
Consolidated Financial Statements Under IFRS
320 Wipro Limited
15. Financial instruments
Financial assets and liabilities (carrying value / fair value):
As at March 31,
2018 2019AssetsCash and cash equivalents ` 44,925 ` 158,529Investments
Financial instruments at FVTPL 46,438 13,960Financial instruments at FVTOCI 181,919 191,964Financial instruments at Amortized cost 28,405 21,708
Other financial assetsTrade receivables 105,436 104,862Unbilled receivables * 42,486 22,880Other assets 11,615 19,757
Derivative assets 1,273 5,104` 462,497 ` 538,764
LiabilitiesTrade payables and other payables
Trade payables and accrued expenses ` 68,129 ` 88,304Other liabilities 1,057 644
Loans, borrowings and bank overdrafts 138,259 99,467Derivative liabilities 2,217 1,310
` 209,662 ` 189,725
* On account of adoption of IFRS 15, unbilled revenues pertaining to fixed price development contracts of ` 15,038, as at March 31, 2019, have been considered as non-financial Contract assets, which are billable upon completion of milestones specified in the contracts.
Offsetting financial assets and liabilities
The following table contains information on other financial assets and trade payables and other liabilities subject to offsetting:
Financial assets Gross
amounts of recognized
other financial
assets
Gross amounts of recognized
financial liabilities
set off in the balance sheet
Net amounts of recognized
other financial assets
presented in the balance
sheet As at March 31, 2018 165,985 (6,448) 159,537As at March 31, 2019 154,129 (6,630) 147,499
Financial liabilities Gross
amounts of recognized
trade payables and other payables
Gross amounts of recognized
financial liabilities
set off in the balance sheet
Net amounts of recognized
trade payables and other payables
presented in the balance sheet
As at March 31, 2018 75,634 (6,448) 69,186As at March 31, 2019 95,578 (6,630) 88,948
For the financial assets and liabilities subject to offsetting or similar arrangements, each agreement between the Company and the counterparty allows for net settlement of the relevant financial assets and liabilities when both elect to settle on a net basis. In the absence of such an election, financial assets and liabilities will be settled on a gross basis, and hence, are not offset.
Fair value
Financial assets and liabilities include cash and cash equivalents, trade receivables, unbilled receivables, finance lease receivables, employee and other advances and eligible current and non-current assets, long and short-term loans and borrowings, finance lease payables, bank overdrafts, trade payables, eligible current liabilities and non-current liabilities.
The fair value of cash and cash equivalents, trade receivables, unbilled receivables, borrowings, trade payables, other current financial assets and liabilities approximate their carrying amount largely due to the short-term nature of these instruments. The Company’s long-term debt has been contracted at market rates of interest. Accordingly, the carrying value of such long-term debt approximates fair value. Further, finance lease receivables that are overdue are periodically evaluated based on individual credit worthiness of customers. Based on this evaluation, the Company records allowance for estimated losses on these receivables. As at March 31, 2019 and 2018, the carrying value of such receivables, net of allowances approximates the fair value.
Investments in liquid and short-term mutual funds, which are classified as FVTPL, are measured using net asset values at the reporting date multiplied by the quantity held. Fair value of investments in commercial papers, certificate of deposits and bonds classified as FVTOCI is determined based on the indicative quotes of price and yields prevailing in the market at the reporting date. Fair value of investments in equity instruments classified as FVTOCI is determined using market and income approaches.
The fair value of derivative financial instruments is determined based on observable market inputs including currency spot and forward rates, yield curves, currency volatility etc.
Fair value hierarchy
The table below analyses financial instruments carried at fair value, by valuation method. The different levels have been defined as follows:
Level 1 – Quoted prices (unadjusted) in active markets for identical assets or liabilities.
Level 2 – Inputs other than quoted prices included within Level 1 that are observable for the asset or liability, either directly (i.e. as prices) or indirectly (i.e. derived from prices).
Level 3 – Inputs for the assets or liabilities that are not based on observable market data (unobservable inputs).

Consolidated Financial Statements Under IFRS
Annual Report 2018-19 321
The following table presents fair value of hierarchy of assets and liabilities measured at fair value on a recurring basis:
Particulars
As at March 31, 2018 As at March 31, 2019 Fair value measurements at
reporting date Fair value measurements at
reporting dateTotal Level 1 Level 2 Level 3 Total Level 1 Level 2 Level 3
Assets Derivative instruments: Cash flow hedges 1,139 - 1,139 - 3,149 - 3,149 - Others 134 - 134 - 1,955 - 1,955 - Investments: Investment in liquid and short-term
mutual funds 46,438 46,438 - - 13,960 13,960 - - Investment in equity instruments 5,685 - - 5,685 6,916 - 248 6,668 Commercial paper, Certificate of
deposits and bonds 176,234 1,951 174,283 - 185,048 6,865 178,183Liabilities Derivative instruments: Cash flow hedges (1,276) - (1,276) - (130) - (130) - Others (941) - (941) - (1,180) - (1,180) -
The following methods and assumptions were used to estimate the fair value of the level 2 financial instruments included in the above table.
Derivative instruments (assets and liabilities): The Company enters into derivative financial instruments with various counter-parties, primarily banks with investment grade credit ratings. Derivatives valued using valuation techniques with market observable inputs are mainly interest rate swaps, foreign exchange forward contracts and foreign exchange option contracts. The most frequently applied valuation techniques include forward pricing, swap models and Black Scholes models (for option valuation), using present value calculations. The models incorporate various inputs including the credit quality of counterparties, foreign exchange spot and forward rates, interest rate curves and forward rate curves of the underlying. As at March 31, 2019, the changes in counterparty credit risk had no material effect on the hedge effectiveness assessment for derivatives designated in hedge relationships and other financial instruments recognized at fair value.Investment in commercial papers, certificate of deposits and bonds: Fair value of these instruments is derived based on the indicative quotes of price and yields prevailing in the market as at reporting date.
Details of assets and liabilities considered under Level 3 classification
Investment in equity
instruments
Derivative Assets –
Others
Liabilities- Contingent
consideration Balance as at April 1, 2017 ` 5,303 ` 426 ` (339) Additions 1,851 - - Payouts - - 164 Transferred to Investments accounted for using the equity method (357) - - Gain/loss recognized in consolidated statement of income - (426) 167 Gain/loss recognized in foreign currency translation reserve 53 - (32) Gain/loss recognized in other comprehensive income (1,165) - - Finance expense recognized in consolidated statement of income - - 40 Balance as at March 31, 2018 ` 5,685 ` - ` - Balance as at April 1, 2018 ` 5,685 ` - ` - Additions 2,869 - - Transfers out of level 3 (647) - - Disposal (1,341) - - Gain/loss recognized in foreign currency translation reserve 203 - - Gain/loss recognized in other comprehensive income (101) - - Balance as at March 31, 2019 ` 6,668 ` - -

Consolidated Financial Statements Under IFRS
322 Wipro Limited
Description of significant unobservable inputs to valuation:
As at March 31, 2019Items Valuation
techniqueSignificant unobservable
input Movement
by Increase
(`)Decrease
(`)Unquoted equity Discounted
cash flow model Long term growth rate 0.5% 201 (187)
Investments Discount rate 0.5% (243) 256
As at March 31, 2018Items Valuation
technique Significant unobservable
input Movement
by Increase
(`)Decrease
(`)Unquoted equity Third party quote Revenue achievement 1.0% 18 (18)Investments ** Carrying value ` 1,545 as at March 31, 2018.
Derivative assets and liabilities:
The Company is exposed to foreign currency fluctuations on foreign currency assets / liabilities, forecasted cash flows denominated in foreign currency and net investment in foreign operations. The Company follows established risk management policies, including the use of derivatives to hedge foreign currency assets / liabilities, foreign currency forecasted cash flows and net investment in foreign operations. The counter parties in these derivative instruments are primarily banks and the Company considers the risks of non-performance by the counterparty as non-material.
The following table presents the aggregate contracted principal amounts of the Company’s derivative contracts outstanding:
(in million)As at March 31,
2018 2019Notional Fair value Notional Fair value
Designated derivatives instruments
Sell : Forward contracts USD 904 ` 951 USD 333 ` 1410
€ 134 ` (531) € - -
£ 147 ` (667) £ - -
AUD 77 ` 29 AUD 97 ` 15
Range forward options contracts USD 182 ` 5 USD 1,067 ` 1,149
£ 13 ` 5 £ 191 ` 68
€ 10 ` 2 € 153 ` 349
AUD - ` - AUD 56 ` 39
Interest rate swaps USD 75 ` (7) USD 75 ` (11)
Non-designated derivatives instruments
Sell : Forward contracts USD 939 ` (360) USD 1,182 ` 1,359
€ 58 ` 6 € 32 ` 55
£ 95 ` (56) £ 1 ` (1)
AUD 77 ` 68 AUD 82 ` 28
SGD 6 ` (1) SGD 11 ` 1
ZAR 132 ` (16) ZAR 56 ` 14
CAD 14 ` 32 CAD 56 ` 40
SAR 62 - SAR 123 (1)

Consolidated Financial Statements Under IFRS
Annual Report 2018-19 323
(in million)As at March 31,
2018 2019Notional Fair value Notional Fair value
AED 8 - AED 9 ^ PLN 36 ` 12 PLN 38 ` 15CHF 6 ` 3 CHF 10 ^QAR 11 ` (3) QAR 3 ` (1)TRY 10 ` 8 TRY 28 ` 12MXN 61 ` (6) MXN - -NOK 34 ` 3 NOK 29 ` 4OMR 3 ` (1) OMR 1 ` (1)
SEK 35 ` 5
Range forward options contracts USD 50 ` (6) USD 150 ` 161€ - - € 31 ` 12£ 20 ` (2) £ 71 ` 57
Buy : Forward contracts USD 575 ` (417) USD 730 ` (971)JPY 399 ` 6 JPY 154 ^MXN - - MXN 9 ^DKK 9 ` (1) DKK 75 ` (13)
` (944) ` 3,794^ Value is less than ` 1.
The following table summarizes activity in the cash flow hedging reserve within equity related to all derivative instruments classified as cash flow hedges:
As at March 31,
2018 2019
Balance as at the beginning of the year ` 7,325 ` (143)
Deferred cancellation gain/ (loss), net (6) 6
Changes in fair value of effective portion of derivatives (12) 1,069
Net (gain)/loss reclassified to consolidated statement of income on occurrence of hedged transactions (7,450) 2,087
Gain/(loss) on cash flow hedging derivatives, net ` (7,468) ` 3,162
Balance as at the end of the year (143) 3,019
Deferred tax thereon 29 (604)
Balance as at the end of the year, net of deferred tax ` (114) ` 2,415
The related hedge transactions for balance in cash flow hedging reserves as at March 31, 2019 are expected to occur and be reclassified to the consolidated statement of income over a period of two years.
As at March 31, 2018 and 2019 there were no significant gains or losses on derivative transactions or portions thereof that have become ineffective as hedges or associated with an underlying exposure that did not occur.
Sale of financial assets
From time to time, in the normal course of business, the Company transfers accounts receivables, unbilled receivables, net investment in finance lease receivables (financials assets) to banks. Under the terms of the arrangements, the Company surrenders control over the financial assets and transfer is without recourse. Accordingly, such transfers are recorded as sale of financial assets. Gains and losses on sale of financial assets without recourse are recorded at the time of sale based on the carrying value of the financial assets and fair value of servicing liability. The incremental impact of such transactions on our cash flow and liquidity for the year ended March 31, 2018 and 2019 is not material.
In certain cases, transfer of financial assets may be with recourse. Under arrangements with recourse, the Company is obligated to repurchase the uncollected financial assets, subject to limits specified in the agreement with the banks. These are reflected as part of loans and borrowings in the consolidated statement of financial position.

Consolidated Financial Statements Under IFRS
324 Wipro Limited
Financial risk management
Market Risk
Market risk is the risk of loss of future earnings, to fair values or to future cash flows that may result from a change in the price of a financial instrument. The value of a financial instrument may change as a result of changes in the interest rates, foreign currency exchange rates and other market changes that affect market risk sensitive instruments. Market risk is attributable to all market risk sensitive financial instruments including investments, foreign currency receivables, payables and loans and borrowings.
The Company’s exposure to market risk is a function of investment and borrowing activities and revenue generating activities in foreign currency. The objective of market risk management is to avoid excessive exposure of the Company’s earnings and equity to losses.
Risk Management Procedures
The Company manages market risk through a corporate treasury department, which evaluates and exercises independent control over the entire process of market risk management. The corporate treasury department recommends risk management objectives and policies, which are approved by senior management and Audit Committee. The activities of this department include management of cash resources, implementing hedging strategies for foreign currency exposures, borrowing strategies, and ensuring compliance with market risk limits and policies.
Foreign currency risk
The Company operates internationally, and a major portion of its business is transacted in several currencies. Consequently, the Company is exposed to foreign exchange risk through receiving payment for sales and services in
the United States and elsewhere and making purchases from overseas suppliers in various foreign currencies. The exchange rate risk primarily arises from foreign exchange revenue, receivables, cash balances, forecasted cash flows, payables and foreign currency loans and borrowings. A significant portion of the Company’s revenue is in the U.S. Dollar, the United Kingdom Pound Sterling, the Euro, the Canadian Dollar and the Australian Dollar, while a large portion of costs are in Indian rupees. The exchange rate between the rupee and these currencies has fluctuated significantly in recent years and may continue to fluctuate in the future. Appreciation of the rupee against these currencies can adversely affect the Company’s results of operations.
The Company evaluates exchange rate exposure arising from these transactions and enters into foreign currency derivative instruments to mitigate such exposure. The Company follows established risk management policies, including the use of derivatives like foreign exchange forward/option contracts to hedge forecasted cash flows denominated in foreign currency.
The Company has designated certain derivative instruments as cash flow hedges to mitigate the foreign exchange exposure of forecasted highly probable cash flows. The Company has also designated foreign currency borrowings as hedge against respective net investments in foreign operations.
As at March 31, 2018, and 2019 respectively, a ̀ 1 increase/decrease in the spot exchange rate of the Indian rupee with the U.S. dollar would result in approximately ` 1,500 (consolidated statement of income ` 414 and other comprehensive income ̀ 1,086) and ̀ 2,002 (consolidated statement of income ` 602 and other comprehensive income ̀ 1,400) respectively decrease/increase in the fair value of foreign currency dollar denominated derivative instruments.
The below table presents foreign currency risk from non-derivative financial instruments as at March 31, 2018 and 2019:
As at March 31, 2018 US $ Euro Pound
Sterling Australian
Dollar Canadian
Dollar Other
currencies#
Total
Trade receivables ` 32,948 ` 7,273 ` 6,585 ` 3,459 ` 990 ` 3,651 ` 54,906 Unbilled revenues 13,893 2,571 5,189 2,094 338 1,609 25,694 Cash and cash equivalents 9,144 3,791 1,685 786 34 2,241 17,681 Other assets 13,796 1,993 4,061 1,164 940 4,459 26,413 Loans, borrowings and bank overdrafts (49,257) (41) (37) (165) - (137) (49,637) Trade payables accrued expenses and other liabilities
(23,561) (3,962) (5,958) (1,516) (652) (2,942) (38,591)
Net assets/ (liabilities) ` (3,037) ` 11,625 ` 11,525 ` 5,822 ` 1,650 ` 8,881 ` 36,466

Consolidated Financial Statements Under IFRS
Annual Report 2018-19 325
As at March 31, 2019 US $ Euro Pound
Sterling Australian
Dollar Canadian
Dollar Other
currencies#Total
Trade receivables ` 39,896 ` 8,030 ` 5,212 ` 3,542 ` 1,528 ` 3,880 ` 62,088 Unbilled receivables 8,038 1,609 3,146 1,225 204 743 14,965 Contract assets 4,706 1,445 2,270 836 150 598 10,005 Cash and cash equivalents 21,997 2,884 1,573 1,003 1,928 2,204 31,589 Other assets 8,553 1,173 4,056 1,038 1,033 4,544 20,397Loans, borrowings and bank overdrafts (50,516) (20) (21) (33) - (21) (50,611)Trade payables accrued expenses and other liabilities
(27,202) (5,779) (4,646) (1,526) (806) (2,787) (42,746)
Net assets/ (liabilities) ` 5,472 ` 9,342 ` 11,590 ` 6,085 ` 4,037 ` 9,161 ` 45,687
# Other currencies reflect currencies such as Saudi Riyal, Singapore Dollars, Danish Krone, etc.
As at March 31, 2018 and 2019, respectively, every 1% increase/decrease of the respective foreign currencies compared to functional currency of the Company would impact results by approximately ` 365 and ` 457, respectively.
Interest rate risk
Interest rate risk primarily arises from floating rate borrowing, including various revolving and other lines of credit. The Company’s investments are primarily in short-term investments, which do not expose it to significant interest rate risk. The Company manages its net exposure to interest rate risk relating to borrowings by entering into interest rate swap agreements, which allows it to exchange periodic payments based on a notional amount and agreed upon fixed and floating interest rates. Certain borrowings are also transacted at fixed interest rates. If interest rates were to increase by 100 bps from March 31, 2019, additional net annual interest expense on floating rate borrowing would amount to approximately ` 866.
Credit risk
Credit risk arises from the possibility that customers may not be able to settle their obligations as agreed. To manage this, the Company periodically assesses the financial reliability of customers, taking into account the financial condition, current economic trends, analysis of historical bad debts and ageing of accounts receivable. Individual risk limits are set accordingly. No single customer accounted for more than 10% of the accounts receivable as at March 31, 2018 and 2019, respectively, or revenues for the year ended March 31, 2017, 2018 and
2019, respectively. There is no significant concentration of credit risk.
Counterparty risk
Counterparty risk encompasses issuer risk on marketable securities, settlement risk on derivative and money market contracts and credit risk on cash and time deposits. Issuer risk is minimized by only buying securities which are at least AA rated in India based on Indian rating agencies. Settlement and credit risk is reduced by the policy of entering into transactions with counterparties that are usually banks or financial institutions with acceptable credit ratings. Exposure to these risks are closely monitored and maintained within predetermined parameters. There are limits on credit exposure to any financial institution. The limits are regularly assessed and determined based upon credit analysis including financial statements and capital adequacy ratio reviews.
Liquidity risk
Liquidity risk is defined as the risk that the Company will not be able to settle or meet its obligations on time or at a reasonable price. The Company’s corporate treasury department is responsible for liquidity and funding as well as settlement management. In addition, processes and policies related to such risks are overseen by senior management. Management monitors the Company’s net liquidity position through rolling forecasts on the basis of expected cash flows. As at March 31, 2019, cash and cash equivalents are held with major banks and financial institutions.

Consolidated Financial Statements Under IFRS
326 Wipro Limited
The table below provides details regarding the remaining contractual maturities of significant financial liabilities at the reporting date. The amounts include estimated interest payments and exclude the impact of netting agreements, if any.
As at March 31, 2018
Carrying value
Less than 1 year
1-2 years 2-4 years 4-7 years Total
Loans, borrowings and bank overdrafts ` 138,259 ` 95,466 ` 18,997 ` 28,190 ` 6 ` 142,659Trade payables and accrued expenses 68,129 68,129 - - - 68,129Derivative liabilities 2,217 2,210 7 - - 2,217Other liabilities 1,057 1,050 7 - - 1,057
As at March 31, 2019
Carrying value
Less than 1 year 1-2 years 2-4 years 4-7 years Total
Loans, borrowings and bank overdrafts ` 99,467 ` 73,559 ` 24,887 ` 4,309 ` - ` 102,755Trade payables and accrued expenses 88,304 88,304 - - - 88,304Derivative liabilities 1,310 1,310 - - - 1,310Other liabilities 644 644 - - - 644
The balanced view of liquidity and financial indebtedness is stated in the table below. This calculation of the net cash position is used by the management for external communication with investors, analysts and rating agencies:
As at March 31,
2018 2019Cash and cash equivalents ` 44,925 ` 158,529Investment 249,094 220,716Loans and borrowings (138,259) (99,467)
` 155,760 ` 279,778
16. Foreign currency translation reserve
The movement in foreign currency translation reserve attributable to equity holders of the Company is summarized below:
As at March 31,
2018 2019Balance at the beginning of the year ` 13,107 ` 16,618
Translation difference related to foreign operations, net 3,560 3,129Reclassification of foreign currency translation differences to profit and loss on sale of hosted Data center services business - (4,131)Reclassification of foreign c u r r e n c y t r a n s l a t i o n differences to profit and loss on sale of Workday and C o r n e r s t o n e O n D e m a n d business - (79)Change in effective portion of hedges of net investment in foreign operations (49) (287)
Total change during the year 3,511 (1,368)Balance at the end of the year ` 16,618 ` 15,250
17. Income taxes
Income tax expenses has been allocated as follows:
Year ended March 31,2017 2018 2019
Income tax expense as per the consol idated statement of income ` 25,213 ` 22,390 ` 25,242 Income tax included in Other comprehensive income on:
Unrealized gains/ (losses) on investment securities 594 (644) (65)Gains/(losses) on cash flow hedging derivatives 962 (1,448) 633Defined benefit plan actuarial gains/(losses) 43 255 47
` 26,812 ` 20,553 ` 25,857
Income tax expenses consists of the following:
Year ended March 31,2017 2018 2019
Current taxesDomestic ` 21,089 ` 18,500 ` 17,987Foreign 5,412 7,834 5,663
26,501 26,334 23,650Deferred taxes (63) 3 (180)
Domestic (1,225) (3,947) 1,772Foreign (1,288) (3,944) 1,592
` 25,213 ` 22,390 ` 25,242

Consolidated Financial Statements Under IFRS
Annual Report 2018-19 327
Income tax expenses are net of reversal of provisions pertaining to earlier periods, amounting to ` 593, ` 380 and ` 2,267 for the year ended March 31, 2017, 2018 and 2019, respectively.
The reconciliation between the provision of income tax and amounts computed by applying the Indian statutory income tax rate to profit before taxes is as follows:
Year ended March 31,2017 2018 2019
Profit before taxes `110,356 `102,474 `115,415
Enacted income tax rate in India 34.61% 34.61% 34.94%
Computed expected tax expense 38,194 35,466 40,326
Effect of:
Income exempt from tax (12,684) (12,878) (18,469)
Basis differences that will reverse during a tax holiday period (274) 167 (796)
Income taxed at higher/ (lower) rates (1,105) (111) (1,002)
Reversal of deferred tax for past years due to rate reduction * - (1,563) -
Taxes related to prior years (593) (380) (2,267)
Changes in unrecognized deferred tax assets 40 239 3,972
Expenses disallowed for tax purpose 1,787 1,431 3,503
Others, net (152) 19 (25)
Income tax expense ` 25,213 ` 22,390 ` 25,242
Effective income tax rate 22.85% 21.85% 21.87%
* The “Tax Cuts and Jobs Act,” was signed into law on December 22, 2017 (‘US tax reforms’) which among other things, makes significant changes to the rules applicable to the taxation of corporations, such as changing the corporate tax rate from 35% to 21% rate effective January 1, 2018. For the year ended March 2018, the Company took a positive impact of ` 1,563 on account of re-statement of deferred tax items pursuant to US tax reforms.
The components of deferred tax assets and liabilities are as follows:
As at March 31,2018 2019
Carry-forward losses * ` 5,694 ` 3,149
Trade payables, accrued expenses and other liabilities
3,107 3,713
Allowances for lifetime expected credit loss
4,499 4,521
Minimum alternate tax 74 -Cash flow hedges 29 -Others - 318
13,403 11,701Property, plant and equipment (2,166) (1,840)Amortizable goodwill (1,810) (1,899)Intangible assets (3,190) (2,295)Interest on bonds and fair value movement of investments
(1,712) (1,455)
Cash flow hedges - (604)Contract liablities (273) (289)Others (403) (1,132)
(9,554) (9,514)Net deferred tax assets/(liabilities) ` 3,849 ` 2,187Amounts presented in statement of financial position:
Deferred tax assets ` 6,908 ` 5,604Deferred tax liabilities ` (3,059) ` (3,417)
* Includes deferred tax asset recognized on carry forward losses pertaining to business combinations.

Consolidated Financial Statements Under IFRS
328 Wipro Limited
Movement in deferred tax assets and liabilities
Movement during the year ended March 31, 2017
As at April 1,
2016
Credit/ (charge) in the consolidated
statement of income
Credit/ (charge) in
the Other comprehensive
income
On account of business
combination
As at March 31,
2017
Carry forward losses 5,250 825 (562) - 5,513
Trade payables, accrued expenses and other liabilities 3,270 (44) (75) - 3,151
Allowances for lifetime expected credit loss 3,039 (77) (7) - 2,955
Minimum alternate tax 1,457 63 - - 1,520
Property, plant and equipment (4,262) (249) 358 - (4,153)
Amortizable goodwill (3,963) (401) 307 - (4,057)
Intangible assets (4,665) 2,639 279 (2,764) (4,511)
Interest on bonds and fair value movement of investments (814) (837) (594) - (2,245)
Cash flow hedges (458) - (961) - (1,419)
Contract liabilities (4) (192) 13 - (183)
Others 328 (439) 24 - (87)
Total (822) 1,288 (1,218) (2,764) (3,516)
Movement during the year ended March 31, 2018
As at April 1,
2017
Credit/ (charge) in the
consolidated statement of
income
Credit/ (charge) in
the Other comprehensive
income
On account of business
combination
Assets held for sale
As at March
31, 2018
Carry forward losses 5,513 133 48 - - 5,694
Trade payables, accrued expenses and other liabilities 3,151 243 (246) - (41) 3,107
Allowances for lifetime expected credit loss 2,955 1,564 2 - (22) 4,499
Minimum alternate tax 1,520 (1,446) - - - 74
Property, plant and equipment (4,153) 912 (75) - 1,150 (2,166)
Amortizable goodwill (4,057) 1,522 (53) - 778 (1,810)
Intangible assets (4,511) 1,546 (112) (113) - (3,190)
Interest on bonds and fair value movement of investments (2,245) (112) 645 - - (1,712)
Cash flow hedges (1,419) - 1,448 - - 29
Contract liabilities (183) (35) (9) - (46) (273)
Others (87) (383) (75) - 142 (403)
Total (3,516) 3,944 1,573 (113) 1,961 3,849

Consolidated Financial Statements Under IFRS
Annual Report 2018-19 329
Deferred taxes on unrealized foreign exchange gain / loss relating to cash flow hedges, fair value movements in investments and actuarial gains/losses on defined benefit plans are recognized in other comprehensive income. Deferred tax liability on the intangible assets identified and carry forward losses on acquisitions is recorded by an adjustment to goodwill. Other than these, the change in deferred tax assets and liabilities is primarily recorded in the consolidated statement of income. In assessing the realizability of deferred tax assets, the Company considers the extent to which it is probable that the deferred tax asset will be realized. The ultimate realization of deferred tax assets is dependent upon the generation of future taxable profits during the periods in which those temporary differences and tax loss carry-forwards become deductible. The Company considers the expected reversal of deferred tax liabilities, projected future taxable income and tax planning strategies in making this assessment. Based on this, the Company believes that it is probable that the Company will realize the benefits of these deductible differences. The amount of deferred tax asset considered realizable, however, could be reduced in the near term if the estimates of future taxable income during the carry-forward period are reduced.
Deferred tax asset amounting to ` 3,756 and ` 6,769 as at March 31, 2018 and 2019, respectively in respect of unused tax losses have not been recognized by the Company. The tax loss carry-forwards of ` 14,510 and ` 24,355 as at March 31, 2018 and 2019, respectively, relates to certain subsidiaries on which deferred tax asset has not been recognized by the Company, because there is a lack of reasonable certainty that these subsidiaries may generate future taxable profits. Approximately, ̀ 6,223 and ̀ 8,191 as
at March 31, 2018 and 2019, respectively, of these tax loss carry-forwards is not currently subject to expiration dates. The remaining tax loss carry-forwards of approximately ` 8,287 and ` 16,164 as at March 31, 2018 and 2019, respectively, expire in various years through fiscal 2038.
The Company has recognized deferred tax assets of ` 5,694 and ` 3,149 primarily in respect of carry forward losses of its various subsidiaries as at March 31, 2018 and 2019, respectively. Management’s projections of future taxable income and tax planning strategies support the assumption that it is probable that sufficient taxable income will be available to utilize these deferred tax assets.
The Company has calculated its tax liability for current domestic taxes after considering MAT. The excess tax paid under MAT provisions over and above normal tax liability can be carried forward and set-off against future tax liabilities computed under normal tax provisions. The Company was required to pay MAT and accordingly, a deferred tax asset of ` 74 and Nil has been recognized in the statement of consolidated financial position as at March 31, 2018 and 2019, respectively.
A substantial portion of the profits of the Company’s India operations are exempt from Indian income taxes being profits attributable to export operations and profits from units established under the Special Economic Zone Act, 2005 scheme. Units designated in special economic zones providing service on or after April 1, 2005 will be eligible for a deduction of 100 percent of profits or gains derived from the export of services for the first five years from commencement of provision of services and 50 percent of such profits and gains for a further five years. Certain tax benefits are also available for a further five years subject
Movement during the year ended March 31, 2019
As at April 1,
2018
Credit/ (charge) in the consolidated
statement of income
Credit/ (charge) in
the Other comprehensive
income
Others (Note 32)
As at March 31,
2019
Carry forward losses 5,694 (2,879) 334 - 3,149
Trade payables, accrued expenses and other liabilities 3,107 295 (22) 333 3,713
Allowances for lifetime expected credit loss 4,499 9 2 11 4,521
Minimum alternate tax 74 (74) - - -
Property, plant and equipment (2,166) 219 (94) 201 (1,840)
Amortizable goodwill (1,810) 16 (105) - (1,899)
Intangible assets (3,190) 1,076 (181) - (2,295)
Interest on bonds and fair value movement of investments (1,712) 186 71 - (1,455)
Cash flow hedges 29 - (633) - (604)
Contract liabilities (273) (1) (15) - (289)
Others (403) (439) 27 1 (814)
Total 3,849 (1,592) (616) 546 2,187

Consolidated Financial Statements Under IFRS
330 Wipro Limited
to the unit meeting defined conditions. Profits from certain other undertakings are also eligible for preferential tax treatment. The tax holiday period being currently available to the Company expires in various years through fiscal 2032-33. The expiration period of tax holiday for each unit within a SEZ is determined based on the number of years that have lapsed following year of commencement of production by that unit. The impact of tax holidays has resulted in a decrease of current tax expense of ` 11,958, ` 11,635 and ̀ 15,390 for the years ended March 31, 2017, 2018 and 2019, respectively, compared to the effective tax amounts that we estimate the Company would have been required to pay if these incentives had not been available. The per share effect of these tax incentives for the years ended March 31, 2017, 2018 and 2019 was ` 1.85, ` 1.84 and ` 2.56, respectively.
Deferred income tax liabilities are recognized for all taxable temporary differences except in respect of taxable temporary differences associated with investments in subsidiaries where the timing of the reversal of the temporary difference can be controlled and it is probable that the temporary difference will not reverse in the foreseeable future. Accordingly, deferred income tax liabilities on cumulative earnings of subsidiaries amounting to ` 51,432 and ` 52,488 as at March 31, 2018 and 2019, respectively and branch profit tax @ 15% of the US branch profit have not been recognized. Further, it is not practicable to estimate the amount of the unrecognized deferred tax liabilities for these undistributed earnings.
18. Dividends, Bonus and Buyback of equity shares
The Company declares and pays dividends in Indian rupees. According to the Companies Act, 2013 any dividend should be declared out of accumulated distributable profits. A Company may, before the declaration of any dividend, transfer a percentage of its profits for that financial year as it may consider appropriate to the reserves.
The cash dividends paid per equity share were ` 3, ` 1 and ` 1, during the years ended March 31, 2017, 2018 and 2019, respectively, including an interim dividend of ` 2, ` 1 and ` 1 for the years ended March 31, 2017, 2018 and 2019, respectively.
During the year ended March 31, 2018, the bonus issue in the proportion of 1:1 i.e.1 (One) bonus equity share of ` 2 each for every 1 (one) fully paid-up equity share held (including ADS holders) had been approved by the shareholders of the Company on June 03, 2017 through Postal Ballot /e-voting. For this purpose, June 14, 2017, was fixed as the record date. Consequently, on June 15, 2017, the Company allotted 2,433,074,327 shares and ` 4,866 (representing par value of ` 2 per share) has been transferred from retained earnings to share capital.
During the year ended March 31, 2019, the bonus issue in the proportion of 1:3 i.e.1 (One) bonus equity share of ` 2 each for every 3 (three) fully paid-up equity shares held (including ADS holders) was approved by the shareholders of the Company on February 22, 2019, through Postal Ballot
/e-voting. Subsequently, on March 8, 2019, the Company allotted 1,508,469,180 equity shares to shareholders who held equity shares as on the record date of March 7, 2019 and ` 3,016 (representing par value of ` 2 per share) was transferred from capital redemption reserves, securities premium reserve and retained earnings to the share capital.
During the year ended March 31, 2018, the Company has concluded the buyback of 343,750,000 equity shares as approved by the Board of Directors on July 20, 2017. This has resulted in a total cash outflow of ` 110,000. In line with the requirement of the Companies Act 2013, an amount of ` 1,656 and ` 108,344 has been utilized from the securities premium reserve and retained earnings respectively. Further, capital redemption reserves (included in other reserves) of ` 687 (representing the nominal value of the shares bought back) has been created as an apportionment from retained earnings. Consequent to such buyback, share capital has reduced by ` 687.
19. Additional capital disclosures
The key objective of the Company’s capital management is to ensure that it maintains a stable capital structure with the focus on total equity to uphold investor, creditor and customer confidence and to ensure future development of its business. The Company focused on keeping strong total equity base to ensure independence, security as well as a high financial flexibility for potential future borrowings, if required without impacting the risk profile of the Company.
The Company’s goal is to continue to be able to return excess liquidity to shareholders by continuing to distribute annual dividends in future periods.
The amount of future dividends/ buyback of equity shares will be balanced with efforts to continue to maintain an adequate liquidity status.
The capital structure as at March 31, 2018 and 2019 was as follows:
As at March 31,2018 2019 % Change
Equity attributable to the equity shareholders of the Company ` 482,936 `568,116 17.64% As percentage of total capital 78% 85% Current loans, borrowings and bank overdrafts 92,991 71,099 Long-term loans and borrowings 45,268 28,368 Total loans, borrowings and bank overdrafts ` 138,259 ` 99,467 (28.06%) As percentage of total capital 22% 15% Total capital (loans, borrowings and bank overdrafts and equity) ` 621,195 `667,583 7.47%

Consolidated Financial Statements Under IFRS
Annual Report 2018-19 331
Loans and borrowings represent 22% and 15% of total capital as at March 31, 2018 and 2019, respectively. The Company is not subjected to any externally imposed capital requirements.
20. Revenue
Year ended March 31,2017 2018 2019
Rendering of services ` 522,061 ` 524,543 ` 571,301Sales of products 28,341 20,328 14,544
` 550,402 ` 544,871 ` 585,845
21. Expenses by nature
Year ended March 31,
2017 2018 2019
Employee compensation ` 268,081 ` 272,223 ` 299,774
Sub-contracting/ technical fees 82,747 84,437 94,725
Cost of hardware and software 27,216 18,985 13,567
Travel 20,147 17,399 17,768
Facility expenses 19,297 21,044 22,213
Depreciation, amortization and impairment * 23,107 21,124 19,474
Communication 5,370 5,353 4,561
Legal and professional fees 4,957 4,690 4,361
Rates, taxes and insurance 2,261 2,400 1,621
Marketing and brand building 2,936 3,140 2,714
Lifetime expected credit loss and provision for deferred contract cost ** 2,427 6,565 980
Miscellaneous expenses *** 5,836 4,705 11,736
Total cost of revenues, selling and marketing expenses and general and administrative expenses ` 464,382 ` 462,065 ` 493,494
* Depreciation, amortization and impairment includes impairment on certain software platform and intangible assets recognized on acquisitions, amounting to ̀ 3,056, ` 643, ` 2,318, for the years ended March 31, 2017, 2018 and 2019, respectively.
** Consequent to insolvency of two of our customers, the Company has recognized provision of ` 4,612 for impairment of receivables and deferred contract cost. ` 416 and ` 4,196 of these provisions have been included in cost of revenue and General and administrative expenses, respectively for the year ended March 31, 2018.
** Miscellaneous expenses for the year ended March 31, 2019, includes an amount of ̀ 5,141 ($ 75) paid to National Grid on settlement of a legal claim against the Company.
22. Other operating income
Sale of hosted data center services business: During the year ended March 31, 2019, the Company has concluded the divestment of its hosted data center services business.
The calculation of the gain on sale is shown below:
Particulars Total
Cash considerations (net of disposal costs ` 660) ` 25,432
Less: Carrying amount of net assets disposed (including goodwill of ` 13,009) (26,455)
Add: Reclassification of exchange difference on foreign currency translation 4,131
Gain on sale ` 3,108
In accordance with the sale agreement, total cash consideration is ̀ 28,124 and the Company paid ̀ 3,766 to subscribe for units issued by the buyer. Units amounting to ` 2,032 are callable by the buyer if certain business targets committed by the Company are not met over a period of three years. The fair value of these callable units is estimated to be insignificant as at reporting date. Consequently, the sale consideration accounted of ` 24,358 and units amounting to ` 1,734 units issued by the buyer.
Loss of control in subsidiary: During the year ended March 31, 2019, the Company has reduced its equity holding from 74% to 11% in Wipro Airport IT Services Limited. The loss/ gain on this transaction is insignificant.
The assets and liabilities associated with these transactions were classified as assets held for sale and liabilities directly associated with assets held for sale amounting to ` 27,201 and ` 6,212 respectively as at March 31, 2018.
Sale of Workday and Cornerstone OnDemand business: During the year ended March 31, 2019, the Company has concluded the Sale of Workday and Cornerstone OnDemand business except in Portugal, France and Sweden.

Consolidated Financial Statements Under IFRS
332 Wipro Limited
The calculation of the gain is as shown below:
Particulars TotalCash considerations ` 6,645Less: Carrying amount of net assets disposed (includes goodwill of ` 4,893 and intangible assets of ` 740) 5,475Add: Reclassification of exchange difference on foreign currency translation 79Gain on sale ` 1,249
Assets pertaining to Portugal, France and Sweden are classified as Assets held for sale ` 240 as at March 31, 2019, which was concluded on May 31, 2019.
These disposal groups do not constitute a major component of the Company and hence were not classified as discontinued operations.
23. Finance expense
Year ended March 31,2017 2018 2019
Interest expense ` 2,675 ` 3,451 ` 5,616Exchange fluctuation on foreign currency borrowings, net 3,267 2,379 1,759
` 5,942 ` 5,830 ` 7,375
24. Finance and other income and Foreign exchange gains/(losses), net
Year ended March 31,2017 2018 2019
Interest income ` 18,066 ` 17,806 ` 20,261 Dividend income 311 609 361 Net gain from investments classified as FVTPL 3,822 5,410 1,990 Net gain from investments classified as FVOCI 220 174 311 Finance and other income ` 22,419 ` 23,999 ` 22,923 Foreign exchange gains/(losses), net on financial instrument measured at FVTPL 6,975 (107) 1,251 Other Foreign exchange gains/(losses), net (3,198) 1,595 1,964 Foreign exchange gains/(losses), net ` 3,777 ` 1,488 ` 3,215
` 26,196 ` 25,487 ` 26,138
25. Earnings per equity share
A reconciliation of profit for the year and equity shares used in the computation of basic and diluted earnings per equity share is set out below:
Basic: Basic earnings per share is calculated by dividing the profit attributable to equity shareholders of the Company by the weighted average number of equity shares outstanding during the year, excluding equity shares purchased by the Company and held as treasury shares.
Year ended March 31,
2017 2018 2019
Profit attributable to equity holders of the Company ` 84,895 ` 80,081 ` 90,031
Weighted average number of equity shares outstanding 6,476,108,013 6,333,391,200 6,007,376,837
Basic earnings per share ` 13.11 ` 12.64 ` 14.99
Diluted: Diluted earnings per share is calculated by adjusting the weighted average number of equity shares outstanding during the year for assumed conversion of all dilutive potential equity shares. Employee share options are dilutive potential equity shares for the Company.
The calculation is performed in respect of share options to determine the number of shares that could have been acquired at fair value (determined as the average market price of the Company’s shares during the year). The number of shares calculated as above is compared with the number of shares that would have been issued assuming the exercise of the share options.

Consolidated Financial Statements Under IFRS
Annual Report 2018-19 333
Year ended March 31,
2017 2018 2019
Profit attributable to equity holders of the Company ` 84,895 ` 80,081 ` 90,031
Weighted average number of equity shares outstanding 6,476,108,013 6,333,391,200 6,007,376,837
Effect of dilutive equivalent share options 19,021,504 11,091,433 14,927,530
Weighted average number of equity shares for diluted earnings per share 6,495,129,517 6,344,482,633 6,022,304,367
Diluted earnings per share ` 13.07 ` 12.62 ` 14.95
Earnings per share and number of share outstanding for the years ended March 31, 2017 and 2018, have been proportionately adjusted for the bonus issue in the ratio of 1:3 i.e.1 (One) bonus equity share of ` 2 each for every 3 (three) fully paid-up equity shares held (including ADS holders). Refer Note 18.
26. Employee stock incentive plans
The stock compensation expense recognized for employee services received during the year ended March 31, 2017, 2018 and 2019, were ` 1,742, ` 1,347 and ` 1,938, respectively.
Wipro Equity Reward Trust (“WERT”)
In 1984, the Company established a controlled trust called the Wipro Equity Reward Trust (“WERT”). In the earlier years, WERT purchased shares of the Company out of funds borrowed from the Company. The Company’s Board Governance, Nomination and Compensation Committee recommends to WERT certain officers and key employees, to whom WERT issues shares from its holdings at nominal price subject to vesting conditions. WERT held 13,728,607, 23,097,216 and 27,353,853 treasury shares as at March 31, 2017, 2018 and 2019, respectively.
Wipro Employee Stock Option Plans and Restricted Stock Unit Option Plans
A summary of the general terms of grants under stock option plans and restricted stock unit option plans are as follows:
Name of Plan Number of Options reserved under the plan
Range of Exercise Price
Wipro ADS Restricted Stock Unit Plan (WARSUP 2004 plan) * 59,797,979 US $ 0.03
Wipro Employee Restricted Stock Unit Plan 2005 (WSRUP 2005 plan) * 59,797,979 ` 2
Wipro Employee Restricted Stock Unit Plan 2007 (WSRUP 2007 plan) * 49,831,651 ` 2
Wipro Equity Reward Trust Employee Stock Purchase Plan, 2013 ** 39,546,197 ` 2
Wipro Employee Stock Option plan 2000 (2000 plan) *** 747,474,747 ` 171 - 490
Employees covered under Stock Option Plans and Restricted Stock Unit (RSU) Option Plans (collectively “stock option plans”) are granted an option to purchase shares of the Company at the respective exercise prices, subject to requirements of vesting conditions. These options generally vest in tranches over a period of three to five years from the date of grant. Upon vesting, the employees can acquire one equity share for every option.
* The maximum contractual term for these Stock Option Plans and Restricted Stock Unit Option Plans is perpetual until the options are available for grant under the plan.
** The maximum contractual term for these Stock Option Plans is up to May 29, 2023 until the options are available for grant under the plan.
*** The maximum contractual term for these Stock Option Plans is up to July26, 2020 until the options are available for grant under the plan.

Consolidated Financial Statements Under IFRS
334 Wipro Limited
The activity in these stock option plans and restricted stock unit option plan is summarized below:
Year ended March 31,2017 2018 2019
Particulars Range of exercise
price
Numbers Weighted Average
Exercise Price
Numbers Weighted Average
Exercise Price
Numbers Weighted Average
Exercise Price
Outstanding at the ` 480.20 20,181 ` 480.20 20,181 ` 480.20 - ` 480.20beginning of ` 2 7,254,326 ` 2 7,952,083 ` 2 13,543,997 ` 2the year US $ 0.03 3,747,430 US $ 0.03 5,288,783 US $ 0.03 10,199,054 US $ 0.03Bonus on outstanding ` 480.20 - ` 480.20 - ` 480.20 - ` 480.20Refer Note 18 ` 2 - ` 2 6,968,406 ` 2 4,773,755 ` 2
US $ 0.03 - US $ 0.03 4,077,070 US $ 0.03 3,957,434 US $ 0.03Granted * ` 480.20 - ` 480.20 - ` 480.20 - ` 480.20
` 2 2,398,000 ` 2 4,612,400 ` 2 4,607,000 ` 2US $ 0.03 2,379,500 US $ 0.03 3,897,000 US $ 0.03 4,849,000 US $ 0.03
Exercised ` 480.20 - ` 480.20 (20,181) ` 480.20 - ` 480.20` 2 (1,113,775) ` 2 (5,325,217) ` 2 (2,739,097) ` 2
US $ 0.03 (174,717) US $ 0.03 (2,565,976) US $ 0.03 (1,541,803) US $ 0.03Forfeited and ` 480.20 - ` 480.20 - ` 480.20 - ` 480.20Expired ` 2 (586,468) ` 2 (663,675) ` 2 (2,578,192) ` 2
US $ 0.03 (663,430) US $ 0.03 (497,823) US $ 0.03 (3,016,895) US $ 0.03Outstanding at the ` 480.20 20,181 ` 480.20 - ` 480.20 - ` 480.20end of the year ` 2 7,952,083 ` 2 13,543,997 ` 2 17,607,463 ` 2
US $ 0.03 5,288,783 US $ 0.03 10,199,054 US $ 0.03 14,446,790 US $ 0.03Exercisable at the ` 480.20 20,181 ` 480.20 - ` 480.20 - ` 480.20end of the year ` 2 698,320 ` 2 1,875,994 ` 2 1,300,781 ` 2
US $ 0.03 141,342 US $ 0.03 789,962 US $ 0.03 948,877 US $ 0.03
The following table summarizes information about outstanding stock options and restricted stock unit option plan :
Year ended March 31,2017 2018 2019
Range of exercise price
Numbers Weighted Average
Remaining life
(months)
Weighted Average
Exercise Price
Numbers Weighted Average
Remaining life
(months)
Weighted Average
Exercise Price
Numbers Weighted Average
Remaining life
(months)
Weighted Average
Exercise Price
` 480.20 20,181 - ` 480.20 - - ` 480.20 - - ` 480.20` 2 7,952,083 19 ` 2 13,543,997 27 ` 2 17,607,463 24 ` 2
US $ 0.03 5,288,783 24 US $ 0.03 10,199,054 28 US $ 0.03 14,446,790 26 US $ 0.03
The weighted-average grant-date fair value of options granted during the years ended March 31, 2017, 2018 and 2019 was ̀ 569.52, ̀ 337.74 and ̀ 349.81 for each option, respectively. The weighted average share price of options exercised during the years ended March 31, 2017, 2018 and 2019 was ̀ 536.80, ̀ 303.44 and ̀ 325.85 for each option, respectively.
* Includes 79,000, 1,097,600 and 1,567,000 Performance based stock options (RSU) during the years ended March 31, 2017, 2018 and 2019, respectively. 188,000, 1,113,600 and 1,673,000 Performance based stock options (ADS) during the years ended March 31, 2017, 2018 and 2019, respectively. Performance based stock options (RSU) were issued under Wipro Employee Restricted Stock Unit plan 2007 (WSRUP 2007 plan) and Performance based stock options (ADS) were issued under Wipro ADS Restricted Stock Unit Plan (WARSUP 2004 plan).

Consolidated Financial Statements Under IFRS
Annual Report 2018-19 335
27. Employee benefits
a) Employee costs includes
Year ended March 31,2017 2018 2019
Salaries and bonus ` 258,207 ` 261,981 ` 289,005Employee benefits plans
Gratuity and other defined benefit plans 1,095 1,532 1,459Defined contribution plans 7,037 7,363 7,372
Share based compensation 1,742 1,347 1,938
` 268,081 ` 272,223 ` 299,774
The employee benefit cost is recognized in the following line items in the consolidated statement of income:
Year ended March 31,2017 2018 2019
Cost of revenues ` 226,595 ` 228,937 ` 251,818Selling and marketing expenses 26,051 28,070 30,972General and administrative expenses 15,435 15,216 16,984
` 268,081 ` 272,223 ` 299,774
Defined benefit plan actuarial (gains)/ losses recognized in other comprehensive income include:
Year ended March 31,2017 2018 2019
Re-measurement of net defined benefit liability/(asset)
Return on plan assets excluding interest income ` (189) ` (18) ` (49)Actuarial loss/ (gain) arising from financial assumptions 363 (296) 73Actuarial loss/ (gain) arising from demographic assumptions (73) (54) (40)Actuarial loss/ (gain) arising from experience adjustments (313) (454) (266)
` (212) ` (822) ` (282)
b) Defined benefit plans
Defined benefit plans include gratuity for employees drawing salary in Indian rupees and certain benefits plans in foreign jurisdictions
Amount recognized in the consolidated statement of income in respect of defined benefit plans is as follows:
Year ended March 31,2017 2018 2019
Current service cost ` 1,130 ` 1,525 ` 1,434Net interest on net defined benefit liability/(asset) (35) 7 25Net gratuity cost/(benefit) 1,095 1,532 1,459Actual return on plan assets ` 692 ` 501 ` 607
Change in present value of defined benefit obligation is summarized below:
As at March 31,
2018 2019 Defined benefit obligation at the beginning of the year ` 8,270 ` 8,654Acquisitions (Note 32) 38 1,094Current service cost 1,525 1,434Interest on obligation 490 583Benefits paid (865) (1,047) Remeasurement loss/(gains)
Actuarial loss/(gain) arising from financial assumptions (296) 73Actuarial loss/(gain) arising from demographic assumptions (54) (40)Actuarial loss/(gain) arising from experience adjustments (454) (266)
Defined benefit obligation at the end of the year ` 8,654 ` 10,485
Change in plan assets is summarized below:
As at March 31,
2018 2019 Fair value of plan assets at the beginning of the year ` 7,919 ` 8,507Acquisitions (Note 32) 28 109Expected return on plan assets 483 558Employer contributions 59 254Benefits paid - (34)Remeasurement (loss)/gains
Return on plan assets excluding interest income 18 49
Fair value of plan assets at the end of the year ` 8,507 ` 9,443Present value of unfunded obligation (147) ` (1,042)Recognized asset/(liability) (147) ` (1,042)
As at March 31, 2018 and 2019, plan assets were primarily

Consolidated Financial Statements Under IFRS
336 Wipro Limited
invested in insurer managed funds
The Company has established an income tax approved irrevocable trust fund to which it regularly contributes to finance the liabilities of the gratuity plan. The fund’s investments are managed by certain insurance companies as per the mandate provided to them by the trustees and the asset allocation is within the permissible limits prescribed in the insurance regulations.
The principal assumptions used for the purpose of actuarial valuation of these defined benefit plans are as follows:
As at March 31, 2018 2019
Discount rate 6.30% 6.05%Expected return on plan assets 6.30% 6.05%Expected rate of salary increase 6.89% 6.80%Duration of defined benefit obligations 8 years 8 years
The expected return on plan assets is based on expectation of the average long-term rate of return expected on investments of the fund during the estimated term of the obligations.
The discount rate is primarily based on the prevailing market yields of government securities for the estimated term of the obligations. The estimates of future salary increase considered takes into account the inflation, seniority, promotion and other relevant factors. Attrition rate considered is the management’s estimate, based on previous years’ employee turnover of the Company.
The expected future contribution and estimated future benefit payments from the fund are as follows:
Expected contribution to the fund during the year ending March 31, 2020 ` 1,162Estimated benefit payments from the fund for the year ending March 31:
2020 ` 1,6862021 1,2032022 1,1712023 1,1502024 1,133
Thereafter 7,552Total ` 13,895
The expected benefits are based on the same assumptions
used to measure the Company’s benefit obligations as at March 31, 2019.
Sensitivity for significant actuarial assumptions is computed to show the movement in defined benefit obligation by 0.5 percentage.
As at March 31, 2019, every 0.5 percentage point increase/(decrease) in discount rate will result in (decrease)/increase of defined benefit obligation by approximately ` (405) and ̀ 435 respectively (March 31, 2018: ̀ (320) and ` 341 respectively).
As at March 31, 2019, every 0.5 percentage point increase/(decrease) in expected rate of salary will result in increase/(decrease) of defined benefit obligation by approximately ` 245 and ` (229) respectively (March 31, 2018: ` 184 and ` (173) respectively).
c) Provident fund:
The details of fund and plan assets are given below:
As at March 31,
2018 2019
Fair value of plan assets ` 46,016 ` 53,015
Present value of defined benefit obligation (46,016) (53,015)
Net (shortfall)/ excess ` - ` -
The plan assets have been primarily invested in government securities and corporate bonds.
The principal assumptions used in determining the present value obligation of interest guarantee under the deterministic approach are as follows:
As at March 31,
2018 2019
Discount rate for the term of the obligation 7.35% 7.00%
Average remaining tenure of investment portfolio 7 years 8 years
Guaranteed rate of return 8.55% 8.65%

Consolidated Financial Statements Under IFRS
Annual Report 2018-19 337
28. Related party relationship and transactions
List of subsidiaries and associates as of March 31, 2019 are provided in the table below:
Subsidiaries Subsidiaries Subsidiaries Country of Incorporation
Wipro LLC USAWipro Gallagher Solutions, LLC. USA
Opus Capital Markets Consultants LLC USAWipro Promax Analytics Solutions Americas LLC USA
Wipro Insurance Solutions LLCWipro IT Services, LLC.
USAUSA
HealthPlan Services, Inc. *** USAAppirio, Inc. *** USACooper Software, LLC. USAInfocrossing, LLC USAWipro US Foundation USA
Wipro Overseas IT Services Pvt. Ltd IndiaWipro Japan KK JapanWipro Shanghai Limited ChinaWipro Trademarks Holding Limited IndiaWipro Travel Services Limited India Wipro Holdings (UK) Limited U.K.
Wipro Digital Aps DenmarkDesignit A/S *** Denmark
Wipro Europe Limited U.K.Wipro UK Limited U.K.
Wipro Financial Services UK Limited U.K.Wipro IT Services S.R.L. Romania
Wipro Information Technology Austria GmbH ** AustriaWipro Technologies Austria GmbH ** AustriaNewLogic Technologies SARL ** FranceWipro Cyprus SE Cyprus
Wipro Doha LLC # QatarWipro Technologies SA DE CV MexicoWipro Philippines, Inc. PhilippinesWipro Holdings Hungary Korlátolt Felelosségu Társaság
Wipro Holdings Investment Korlátolt Felelősségű Társaság
Hungary
HungaryWipro Information TechnologyEgypt SAE EgyptWipro Arabia Co. Limited * SaudiArabia
Women’s Business Park Technologies Limited * Saudi Arabia
Wipro Poland Sp. Z.O.O PolandWipro IT Services PolandSp Z.O.O PolandWipro Technologies Australia Pty Ltd Australia

Consolidated Financial Statements Under IFRS
338 Wipro Limited
Subsidiaries Subsidiaries Subsidiaries Country of Incorporation
Wipro Corporate Technologies Ghana LimitedWipro Technologies South Africa (Proprietary) Limited
Wipro Technologies Nigeria Limited
Ghana
South Africa
NigeriaWipro IT Service Ukraine LLCWipro Information Technology Netherlands BV.
Ukraine
NetherlandsWipro Technologies SA ArgentinaWipro Portugal S.A. *** PortugalLimited Liability Company Wipro Technologies Limited RussiaWipro Technology Chile SPA ChileWipro Solutions Canada Limited CanadaWipro Information Technology Kazakhstan LLP KazakhstanW i p ro Te c h n o l o g i e s W.T. Sociedad Anonima Costa RicaWipro Outsourcing Services (Ireland) Limited IrelandWipro Technologies VZ, C.A. VenezuelaWipro Technologies Peru S.A.C PeruWipro do BrasilServicos de Tecnologia S.A. BrazilWipro do Brasil Technologia Ltda *** Brazil
Wipro Technologies S.R.L. RomaniaPT. WT Indonesia IndonesiaWipro (Thailand) Co. Limited ThailandWipro Bahrain Limited Co. S.P.C BahrainWipro Gulf LLC Sultanate of
OmanRainbow Software LLC IraqCellent GmbH Germany
Cellent Gmbh *** AustriaWipro Networks Pte Limited Singapore
Wipro (Dalian) Limited China Wipro Technologies SDN
BHD MalaysiaWipro Chengdu Limited ChinaAppirio India Cloud Solutions Private Limited** IndiaWipro IT Services Bangladesh Limited BangladeshWipro HR Services India Private Limited India
* All the above direct subsidiaries are 100% held by the Company except that the Company holds 66.67% of the equity securities of Wipro Arabia Co. Limited and 55% of the equity securities of Women’s Business Park Technologies Limited are held by Wipro Arabia Co. Limited.
# 51% of equity securities of Wipro Doha LLC are held by a local shareholder. However, the beneficial interest in these holdings is with the Company.

Consolidated Financial Statements Under IFRS
Annual Report 2018-19 339
The Company controls ‘The Wipro SA Broad Based Ownership Scheme Trust’, ‘Wipro SA Broad Based Ownership Scheme SPV (RF) (PTY) LTD incorporated in South Africa.*** Step Subsidiary details of Wipro Portugal S.A, Wipro do Brasil Technologia Ltda, Designit A/S, Cellent GmbH, HealthPlan Services, Inc. and Appirio, Inc. are as follows:
Subsidiaries Subsidiaries Subsidiaries Country of Incorporation
Wipro Portugal S.A. Portugal
Wipro Technologies Gmbh Germany
Wipro do Brasil Technologia LtdaWipro Do Brasil Sistemetas De Informatica Ltd
Brazil
Brazil
Designit A/S Denmark
Designit Denmark A/S Denmark
Designit Germany GmbH Germany
Designit Oslo A/S Norway
Designit Sweden AB Sweden
Designit T.L.V Ltd. Israel
Designit Tokyo Ltd. Japan
Denextep Spain Digital, S.L Spain
Designit Colombia S A SDesignit Peru SAC
ColombiaPeru
Cellent GmbHFrontworx Informations technologie GmbH
Austria
Austria
HealthPlan Services, Inc. HealthPlan Services Insurance Agency, LLC.
USA
USA
Appirio, Inc. Appirio, K.K Topcoder, Inc. Appirio Ltd
Appirio GmbHApprio Ltd (UK)
USAJapanUSAIrelandGermanyU.K.
** Vide its order dated March 29, 2019, the Hon’ble National Company Law Tribunal, Bengaluru bench, approved the scheme of amalgamation for the merger of wholly owned subsidiaries Wipro Information Technology Austria GmbH, Wipro Technologies Austria GmbH, NewLogic Technologies SARL and Appirio India Cloud Solutions Private Limited with Wipro Limited. As per the said scheme, the appointed date is April 1, 2018.

Consolidated Financial Statements Under IFRS
340 Wipro Limited
As at March 31, 2019, the Company held 43.7% interest in Drivestream Inc, 33% interest in Denim Group Limited and 33.3% in Denim Group Management, LLC, investments accounted for using the equity method.
The list of controlled trustsare:
Name of entity Country of incorporationWipro Equity Reward Trust India Wipro Foundation India
The other related parties are:
Name of the related parties NatureAzim Premji Foundation Entity controlled by DirectorAzim Premji Foundation for Development Entity controlled by DirectorHasham Traders Entity controlled by DirectorPrazim Traders Entity controlled by DirectorZash Traders Entity controlled by DirectorHasham Investment and Trading Co. Pvt. Ltd Entity controlled by DirectorAzim Premji Philanthropic Initiatives Pvt. Ltd Entity controlled by DirectorAzim Premji Trust Entity controlled by DirectorWipro Enterprises (P) Limited Entity controlled by DirectorWipro GE Healthcare Private Limited Entity controlled by DirectorKey management personnel
Azim H Premji Executive Chairman and Managing DirectorT K Kurien Executive Vice Chairman (vii)Abidali Z Neemuchwala Chief Executive Officer and Executive Director (iii)
Dr. Ashok Ganguly Non-Executive DirectorN Vaghul Non-Executive DirectorDr. Jagdish N Sheth Non-Executive Director (v)
William Arthur Owens Non-Executive DirectorM.K. Sharma Non-Executive DirectorVyomesh Joshi Non-Executive Director (vi)
Ireena Vittal Non-Executive DirectorRishad A Premji Executive Director and Chief Strategy Officer (ii)
Dr. Patrick J. Ennis Non-Executive Director (iv)
Patrick Dupuis Non-Executive Director (iv)
Arundhati Bhattacharya Additional Director (viii)
Jatin Pravinchandra Dalal Chief Financial Officer (i)
(i) Effective April 1, 2015 (ii) Effective May 1, 2015 (iii) Effective February 1, 2016(iv) Effective April 1, 2016 (v) Up to July 18, 2016 (vi) Up to July 19, 2016 (vii) Up to January 31, 2017 (viii) Effective January 1, 2019
Relatives of key management personnel:
- Yasmeen H. Premji
- Tariq Azim Premji

Consolidated Financial Statements Under IFRS
Annual Report 2018-19 341
The Company has the following related party transactions:
Transaction / balances Entities controlled by Directors Key Management Personnel2017 2018 2019 2017 2018 2019
Sales of goods and services 114 136 102 - - -Assets purchased 106 290 240 - - -Dividend 5,087 3,171 3,171 287 191 191Buyback of shares 19,638 63,745 - 2 ^ -Rental Income 43 42 43 - - -Rent Paid 8 7 8 6 6 5Others 93 31 63 - - -Key management personnel *Remuneration and short-term benefits - - - 231 248 341Other benefits - - - 156 130 173Balance as at the year endReceivables 76 39 132 - - -Payables 22 57 8 27 55 155
^ Value is less than ` 1
Further investment in associates during the year ` 261 and Nil as at March 31, 2018 and 2019, respectively.
* Post employment benefit comprising compensated absences is not disclosed as this is determined for the Company as a whole. Benefits includes the prorated value of Restricted Stock Units (“RSU’s”) granted to the personnel, which vest over a period of time. Other benefits include share-based compensation ` 148, ` 124 and ` 166, as at March 31, 2017, 2018 and 2019, respectively.
29. Commitments and contingencies
Operating leases: The Company has taken office, vehicles and IT equipment under cancellable and non-cancellable operating lease agreements that are renewable on a periodic basis at the option of both the lessor and the lessee. The operating lease agreements extend up to a maximum of fifteen years from their respective dates of inception and some of these lease agreements have price escalation clause. Rental payments under such leases were ̀ 5,953, ̀ 6,236 and ̀ 6,490 for the years ended March 31, 2017, 2018 and 2019, respectively:
As at March 31,
2018 2019 Not later than one year ` 6,186 ` 7,006Later than one year but not later than five years 12,470 11,106Later than five years 2,354 1,629
` 21,010 ` 19,741
Capital commitments: As at March 31, 2018 and 2019, the Company had committed to spend approximately ̀ 13,091 and ̀ 12,443 respectively, under agreements to purchase/ construct property and equipment. These amounts are net of capital advances paid in respect of these purchases.
Guarantees: As at March 31, 2018 and 2019, performance and financial guarantees provided by banks on behalf of the Company to the Indian Government, customers and certain other agencies amount to approximately ` 21,546 and ̀ 18,456 respectively, as part of the bank line of credit.
Contingencies and lawsuits: The Company is subject to legal proceedings and claims (including tax assessment orders/ penalty notices) which have arisen in the ordinary course of its business. Some of the claims involve complex issues and it is not possible to make a reasonable estimate of the expected financial effect, if any, that will result from ultimate resolution of such proceedings. However, the resolution of these legal proceedings is not likely to have a material and adverse effect on the results of operations or the financial position of the Company. The significant of such matters are discussed below.
In March 2004, the Company received a tax demand for year ended March 31, 2001 arising primarily on account of denial of deduction under section 10A of the Income Tax Act, 1961 (Act) in respect of profit earned by the Company’s undertaking in Software Technology Park at Bengaluru. The same issue was repeated in the successive assessments for the years ended March 31, 2002 to March 31, 2011 and the aggregate demand is ` 47,583 (including interest of ` 13,832). The appeals filed against the said demand before the Appellate authorities have been allowed in favor of the Company by the second appellate authority for the years up to March 31, 2008. Further appeals have been filed by the Income tax authorities before the Hon’ble High Court. The Hon’ble High Court has heard and disposed-off majority of the issues in favor of the Company up to years ended March 31, 2004. Department has filed a Special Leave Petition (SLP) before the Supreme Court of India for the year ended March 31, 2001 to March 31, 2004.
On similar issues for years up to March 31, 2000, the
Consolidated Financial Statements Under IFRS
342 Wipro Limited
Hon’ble High Court of Karnataka has upheld the claim of the Company under section 10A of the Act. For the year ended March 31, 2009, the appeals are pending before Income Tax Appellate Tribunal (ITAT). For years ended March 31, 2010 and March 31, 2011, the Dispute Resolution Panel (DRP) allowed the claim of the Company under section 10A of the Act. The Income tax authorities have filed an appeal before the ITAT.
For year ended March 31, 2013, the Company received the final assessment order in November 2017 with a demand of ` 3,286 (including interest of ` 1,166), arising primarily on account of section 10AA issues with respect to exclusion from Export Turnover. The Company has filed an appeal before Hon’ble ITAT, Bengaluru within the prescribed timelines.
For year ended March 31, 2014, the Company received the final assessment order in September 2018 with a demand of ̀ 1,030 (including Nil interest), arising primarily on account of transfer pricing issues. The Company has filed an appeal before the Hon’ble ITAT, Bengaluru within the prescribed timelines.
For year ended March 31, 2015, the Company received the Draft assessment order in December 2018 with a demand of ` 6,467 (including interest of ` 2,007), arising primarily on account of Capitalization of wages. The Company has filed objections before the Dispute Resolution Panel (Bengaluru) within the prescribed timelines.
Income tax demands against the Company amounting to ` 101,440 and ` 66,441 are not acknowledged as debt as at March 31, 2018 and March 31, 2019, respectively. The contingent liability has been reworked on the basis of recent judicial pronouncements and updates. These matters are pending before various Appellate Authorities and the management expects its position will likely be upheld on ultimate resolution and will not have a material adverse effect on the Company’s financial position and results of operations.
The contingent liability in respect of disputed demands for excise duty, custom duty, sales tax and other matters amounts to ` 7,745 and ` 8,477 as at March 31, 2018 and 2019. However, the resolution of these legal proceedings is not likely to have a material and adverse effect on the results of operations or the financial position of the Company.
30. Segment information
During the year ended March 31, 2019, the Company has organized India State Run Enterprise segment (ISRE) as a separate segment, which was earlier part of IT Services segment.
The Company is now organized by the following operating segments: IT Services, IT Products and India State Run Enterprise segment (ISRE).
Comparative information has been restated to give effect to the above changes.
IT Services: The IT Services segment primarily consists of IT Service offerings to customers organized by industry verticals. Effective April 1, 2018, consequent to change in organization structure, the Company reorganized its industry verticals. The Manufacturing (MFG) and Technology Business unit (TECH) are split from the former Manufacturing & Technology (MNT) business unit.
The revised industry verticals are as follows: Banking, Financial Services and Insurance (BFSI), Health Business unit (Health BU) previously known as Health Care and Life Sciences Business unit (HLS), Consumer Business unit (CBU), Energy, Natural Resources & Utilities (ENU), Manufacturing (MFG), Technology (TECH) and Communications (COMM). Key service offerings to customers includes software application development and maintenance, research and development services for hardware and software design, business application services, analytics, consulting, infrastructure outsourcing services and business process services.
Comparative information has been restated to give effect to the above changes.
IT Products: The Company is a value added reseller of desktops, servers, notebooks, storage products, networking solutions and packaged software for leading international brands. In certain total outsourcing contracts of the IT Services segment, the Company delivers hardware, software products and other related deliverables. Revenue relating to the above items is reported as revenue from the sale of IT Products.
India State Run Enterprise segment (ISRE): This segment consists of IT Services offerings to entities/ departments owned or controlled by Government of India and/ or any State Governments.
The Chairman and Managing Director of the Company has been identified as the Chief Operating Decision Maker (CODM) as defined by IFRS 8, “Operating Segments.” The Chairman of the Company evaluates the segments based on their revenue growth and operating income.
Assets and liabilities used in the Company’s business are not identified to any of the operating segments, as these are used interchangeably between segments. Management believes that it is currently not practicable to provide segment disclosures relating to total assets and liabilities since a meaningful segregation of the available data is onerous.
.

Consolidated Financial Statements Under IFRS
Annual Report 2018-19 343
Information on reportable segment for the year ended March 31, 2017 is as follows:IT Services IT
ProductsISRE Reconciling
ItemsTotal
BFSI Health BU
CBU ENU TECH MFG COMM Total
Revenue 133,332 81,980 78,101 68,223 72,069 46,907 38,584 519,196 25,922 9,244 (183) 554,179Other operating income - - - - - - - 4,082 - - - 4,082
Segment Result 25,721 9,524 15,928 14,485 16,634 6,843 6,125 95,260 (1,680) (2,326) (506) 90,748
Unallocated (951) - - - (951)
Segment Result Total 98,391 (1,680) (2,326) (506) 93,879
Finance expense (5,942)Finance and other income 22,419
Profit before tax 110,356
Income tax expense (25,213)
Profit for the year 85,143Depreciation, amortization and impairment 23,107
Information on reportable segment for the year ended March 31, 2018 is as follows:IT Services IT
ProductsISRE Reconciling
ItemsTotal
BFSI Health BU
CBU ENU TECH MFG COMM Total
Revenue 144,139 74,136 77,914 67,841 73,947 46,081 33,658 517,716 17,998 10,694 (49) 546,359
Segment Result 24,549 9,624 12,619 8,097 14,680 7,007 3,236 79,812 362 454 319 80,947
Unallocated 3,347 - - - 3,347Segment Result Total 83,159 362 454 319 84,294
Finance expense (5,830)Finance and other income 23,999Share of net profit of associates accounted for using the equity method 11Profit before tax 102,474Income tax expense (22,390)
Profit for the year 80,084Depreciation, amortization and impairment 21,124

Consolidated Financial Statements Under IFRS
344 Wipro Limited
Information on reportable segment for the year ended March 31, 2019 is as follows:IT Services IT
ProductsISRE Reconciling
ItemsTotal
BFSI Health BU
CBU ENU TECH MFG COMM Total
Revenue 175,262 75,081 89,313 72,830 76,591 46,496 32,680 568,253 12,312 8,544 (49) 589,060Other operating income - - - - - - - 4,344 - - - 4,344Segment Result 33,831 8,638 16,828 7,081 15,916 8,327 4,396 95,017 (1,047) (1,829) 283 92,424Unallocated 3,142 - - - 3,142Segment Result Total 102,503 (1,047) (1,829) 283 99,910Finance expense (7,375)Finance and other income 22,923Share of net loss of associates accounted for using the equity method (43)Profit before tax 115,415Income tax expense (25,242)Profit for the year 90,173Depreciation, amortization and impairment 19,474
The Company has four geographic segments: India, Americas, Europe and Rest of the world. Revenues from the geographic segments based on domicile of the customer are as follows:
Year ended March 31,2017 2018 2019
India ` 46,555 ` 43,099 ` 30,999Americas * 290,719 283,515 325,432Europe 133,909 138,597 147,074Rest of the world 82,996 81,148 85,555
` 554,179 ` 546,359 ` 589,060* Substantially related to operations in the United States
of America. No customer individually accounted for more than 10% of the revenues during the years ended March 31, 2017, 2018 and 2019, respectively.Management believes that it is currently not practicable to provide disclosure of geographical location wise assets, since the meaningful segregation of the available information is onerous.Notes:a) “Reconciling items” includes elimination of inter-
segment transactions and other corporate activities. b) Revenue from sale of traded cloud-based licenses is
reported as part of IT Services revenues. c) For the purpose of segment reporting, the Company
has included the impact of “foreign exchange gains / (losses), net” in revenues (which is reported as a part of operating profit in the consolidated statement of income).
d) For evaluating performance of the individual
operating segments, stock compensation expense is allocated on the basis of straight-line amortization. The differential impact of accelerated amortization of stock compensation expense over stock compensation expense allocated to the individual operating segments is reported in reconciling items.
e) The Company generally offers multi-year payment terms in certain total outsourcing contracts. These payment terms primarily relate to IT hardware, software and certain transformation services in outsourcing contracts. The finance income on deferred consideration earned under these contracts is included in the revenue of the respective segment and is eliminated under reconciling items.
f) Segment results for ENU and COMM industry vertical for the year ended March 31, 2018, is after considering the impact of provision of ` 3,175 and ` 1,437, respectively, for impairment of receivables and deferred contract cost. Refer Note 21.
g) Net gain from the sale of hosted data center services, Workday and Cornerstone OnDemand business and disposal of Wipro Airport IT Services Limited, amounting to ̀ 4,344, is included as part of IT services segment result for the year ended March 31, 2019. Refer Note 22.
h) Segment results for ENU industry vertical for the year ended March 31, 2019, is after considering the impact of ` 5,141 ($ 75) paid to National Grid on settlement of a legal claim against the Company.
i) Segment results for Health BU industry vertical for the years ended March 31, 2018 and 2019, is after considering the impact of impairment charges on certain software platform and intangible assets recognized on acquisitions. Refer Note 21.

Consolidated Financial Statements Under IFRS
Annual Report 2018-19 345
j) Segment results of IT Services segment is after recognition of share-based compensationexpense ` 1,550, ̀ 1,402 and ̀ 1,841 for the years ended March 31, 2017, 2018 and 2019, respectively. The share-based compensation expense pertaining to other segments is not material.
31. Bank balanceDetails of balance with banks as at March 31, 2019 are as follows:
In Current
Account
In Deposit
Account
Total
Citi Bank ` 24,507 ` 14,737 ` 39,244HDFC Bank 1,309 25,152 26,461Axis Bank 1 21,551 21,552Kotak Mahindra Bank 28 17,221 17,249HSBC 9,776 4,112 13,888Saudi British Bank 845 7,006 7,851ANZ Bank 432 6,843 7,275ICICI Bank 28 5,555 5,583State Bank of India 156 5,110 5,266BNP Paribas 147 3,630 3,777IndusInd Bank - 2,800 2,800Canara Bank - 2,500 2,500Wells Fargo Bank 2,472 - 2,472Standard Chartered Bank 374 - 374Indian Overseas Bank 1 342 343Bank of Montreal 270 - 270MUFG Bank 180 - 180UniCredit Bank 169 - 169RABO Bank 102 - 102Others 1,169 4 1,173Total ` 41,966 `116,563 `158,529
32. As part of a customer contract with Alight LLC, Wipro has acquired Alight HR Services India Private Limited (currently known as Wipro HR Services India Private Limited) for a consideration of ` 8,275 (USD
117). Considering the terms and conditions of the agreement, the Company has concluded that this transaction does not meet the definition of Business under IFRS 3. The transaction was consummated on September 1, 2018. Net assets taken over was ` 4,128. The excess of consideration paid and net assets taken over is accounted as ‘costs to obtain contract’, which will be amortized over the tenure of the contract as reduction in revenues.
33. Events after the reporting period On April 16, 2019, the Board of Directors approved
a proposal to buyback up to 323,076,923 equity shares of the Company for an aggregate amount not exceeding ` 105,000 million, being 5.35% of total paid-up equity share capital as at March 31, 2019, at a price of ` 325 per equity share. Subsequently, vide resolution dated June 1, 2019 the shareholders approved the buyback of equity shares through postal ballot/e-voting. The Company will file the draft letter of offer with the Securities and Exchange Board of India in due course for its approval and will open the buyback offer for tendering of shares by the shareholders, following approval from the Securities and Exchange Board of India. The buyback is proposed to be made from all existing shareholders of the Company as on the record date for the buyback, i.e., June 21, 2019, on a proportionate basis under the “tender offer” route in accordance with the provisions contained in the Securities and Exchange Board of India (Buy-back of Securities) Regulations, 2018 and the Companies Act, 2013 and rules made thereunder.
On June 4, 2019, the Company entered into a definitive agreement to acquire International TechneGroup Incorporated, a global digital engineering and manufacturing solutions company for a consideration of US$ 45 million. The acquisition is subject to customary closing conditions and regulatory approvals and is expected to close in the quarter ending September 30, 2019.
The accompanying notes form an integral part of these consolidated financial statements.

346 Wipro Limited
Section A: General Information about the Company
1. Corporate Identity Number (CIN) of the Company
L32102KA1945PLC020800.
2. Name of the Company
Wipro Limited
3. Registered address
Doddakannelli, Sarjapur Road, Bengaluru - 560 035, Karnataka, India
4. Website
www.wipro.com
5. E-mail id
6. Financial Year reported
April 1, 2018 to March 31, 2019 (FY 2018-19)
7. Sector(s) that the Company is engaged in (industrial activity code-wise)
IT Software, Services and related activities. NIC Code-62013, 62020.
8. List three key products/services that the Company manufactures/provides (as in balance sheet)
Please refer pages from 22 to 26 of this Annual Report
9. Total number of locations where business activity is undertaken by the Company
i. Number of International Locations (Provide details of major 5)
202 office locations
Please refer complete list of locations available on the Company’s website at www.wipro.com.
ii. Number of National Locations
54 locations (including 3 data centers)
Please refer complete list of locations available on the Company’s website at www.wipro.com.
10. Markets served by the Company – Local/State/ National/International/
Please refer to “Geography Wise Performance” on page 33 of this Annual Report.
Section B: Financial Details of the Company
1. Paid up Capital
As at March 31, 2019, the paid up equity share capital of the Company stood at ` 12,067,870,776/- consisting of 6,033,935,388 equity shares of ` 2 each.
2. Total Turnover
For the financial year 2018-19, the total turnover of the Company on a consolidated basis was ` 585,845 million.
3. Total profit after taxes
For the financial year 2018-19, the net profit of the Company on a consolidated basis was ` 90,179 million.
4. Total Spending on Corporate Social Responsibility (CSR) as percentage of profit after tax
Please refer to Corporate Social Responsibility Report for the year on pages from 88 to 94 of this Annual Report.
5. List of activities in which expenditure in 4 above has been incurred:-
Please refer to Corporate Social Responsibility Report for the year on pages from 88 to 94 of this Annual Report.
Section C: Other Details
1. Does the Company have any Subsidiary Company/ Companies?
The Company has 85 subsidiaries as on March 31, 2019. Please refer the complete list on pages from 198 to 201 of this Annual Report.
2. Do the Subsidiary Company/Companies participate in the BR Initiatives of the parent company? If yes, then indicate the number of such subsidiary company(s).
As the BR Initiatives of the Company are run at global level, all subsidiaries participate in the BR Initiatives.
Business Responsibility Report

Annual Report 2018-19 347
3. Do any other entity/entities (e. g. suppliers, distributors etc.) that the Company does business with, participate in the BR initiatives of the Company? If yes, then indicate the percentage of such entity/entities? [Less than 30%, 30-60%, More than 60%]
Yes, less than 30%.
Section D: BR Information
1. Details of Director responsible for BR
a) Details of the Director responsible for implementation of the BR policy/policies
The “Board Governance, Nomination and Compensation Committee” is responsible for the implementation of the CSR policy. Please refer page 123 of this Annual Report.
b) Details of the BR head
DIN (if applicable) Not applicable
Name Anurag Behar
Designation Chief Sustainability Officer
Telephone No. 080 28440011
Email id [email protected]
2. Principle-wise (as per NVGs) BR Policy/policies (Reply in Y/N)
a) Do you have a policy /policies for:
• Principle 1: Yes. Wipro has a policy on Ethics, Transparency and Accountability. Our Code of Business Conduct (COBC) is applicable to our customers, suppliers, partners, competitors, employees and other stakeholders, which is available at
https://www.wipro.com/content/dam/nexus/en/investor/corporate-governance/policies-and-guidelines/ethical-guidelines/code-of-business-conduct-and-ethics.pdf.
• Principle 2: Yes. Our Policy on Ecological Sustainability is available at https://www.wipro.com/content/dam/nexus/en/sustainability/pdf/ecological-sustainability-policy.pdf.
• Principle 3: Yes. Wipro’s COBC and policy on Health and Safety is available at http://wiprofoundation.org/files/Health_and_Safety_Policy.pdf.
• Principle 4: Yes. Policy on Corporate Social Responsibility is available at
https://www.wipro.com/content/dam/nexus/en/investor/corporate-governance/policies-and-guidelines/ethical-guidelines/12773-policy-on-corporate-social-responsibility.pdf.
• Principle 5: Yes. Wipro’s COBC addresses principles of Human Rights as per the principles of the UN Global Compact and is available at
https://www.wipro.com/content/dam/nexus/en/sustainability/pdf/Human-Rights-Policy.pdf.
• Principle 6: Yes. Our Policy on Ecological Sustainability.
• Principle 7: There is no distinct policy on public advocacy. However, refer to human capital (page 38 to 44), natural capital (page 55) and social capital (page 47 to 54) for our engagements through various organizations on material issues.
• Principle 8: Wipro does not have a separate policy. However, these aspects are covered in the COBC, the Ecological Sustainability Commitment and policy on Corporate Social Responsibility.
• Principle 9: Yes. Wipro’s COBC covers this.
b) Has the policy being formulated in consultation with the relevant stakeholders?
Yes, for all principles.
c) Does the policy conform to any national/ international standards? If yes, specify? (50 words)
• Principle 1: Yes. Wipro’s COBC subscribes to the Foreign Corrupt Practices Act of USA. Our financial reporting, Internal Controls and Procedures and Disclosures are in compliance with Generally Accepted Accounting Principles (GAAP) and International Financial Reporting Standards (IFRS).
• Principle 2: Yes. Wipro has been following the ISO 14001 Standard and Guidelines for our Environmental Management System. For designing our Green Buildings, we have adhered to the international Leadership in Energy and Environmental Design (LEED) standard.

348 Wipro Limited
• Principle 3: Yes. We are certified against OHSAS 18001 Standard across our key locations.
• Principle 4: Yes, This report is assured against Global Reporting Initiative (GRI), IIRC guidelines and TCFD recommendations, which have a key stakeholder engagement requirement.
• Principle 5: The Human Right policy is guided by UN Global Compact, UNDHR and the ILO Declaration. Wipro also supports the UN guiding principles on Business and Human Rights.
• Principle 6: Yes. Our Environmental Management System is based on the ISO 14001 Standard and the Green Buildings complies with the international LEED standard.
• Principle 7: Not Applicable
• Principle 8: Yes. We subscribe to the UN Global Compact principles. We also disclose details of our programs and key outcomes as part of UNGC Communication on Progress.
• Principle 9: Yes. We subscribe to the UN Global Compact principles with respect to this principle.
d) Has the policy being approved by the Board? If yes, has it been signed by MD/owner/CEO/ appropriate Board Director?
• Principle 1: Yes. The COBC is approved by our Board of Directors and endorsed by our Chairman.
• Principle 2: Yes. The Policy on Ecological Sustainability is approved by the Board of Directors and signed by Mr. Abidali Z Neemuchwala, Chief Executive Officer and Executive Director.
• Principle 3: Yes. The COBC is approved by the Board of Directors. The Policy on Health and Safety has been signed by Mr. Saurabh Govil, President-Human Resources.
• Principle 4: Yes. The COBC is approved by our Board of Directors and endorsed by our Chairman. The Policy on Corporate Social Responsibility is approved by the Board.
• Principle 5: Yes. The COBC is approved by our Board of Directors and endorsed by our Chairman. The Human rights policy is endorsed by the board.
• Principle 6: Yes. The COBC is approved by our Board of Directors and endorsed by our Chairman. The Policy on Ecological Sustainability is signed by Mr. Abidali Z Neemuchwala, Chief Executive Officer and Executive Director.
• Principle 7: Not Applicable.
• Principle 8: Yes. The Policy on Corporate Social Responsibility (CSR) is approved by the Board of Directors. The COBC is approved by our Board of Directors and endorsed by our Chairman. The Policy on Ecological Sustainability is approved by the Board and signed by Mr. Abidali Z Neemuchwala, Chief Executive Officer and Executive Director.
• Principle 9: Yes. The COBC is approved by our Board of Directors and endorsed by our Chairman. The Policy on Ecological Sustainability is approved by the Board of Directors and signed by Mr. Abidali Z Neemuchwala, Chief Executive Officer and Executive Director.
e) Does the Company have a specified committee of the Board/Director/Official to oversee the implementation of the policy?
The “Board Governance, Nomination and Compensation Committee” oversees the implementation of policies and initiatives related to CSR. The CSR policy is available at
https://www.wipro.com/content/dam/nexus/en/investor/corporate-governance/policies-and-guidelines/ethical-guidelines/12773-policy-on-corporate-social-responsibility.pdf.
f) Indicate the link for the policy to be viewed online.
COBC-
https://www.wipro.com/content/dam/nexus/en/investor/corporate-governance/policies-and-guidelines/ethical-guidelines/code-of-business-conduct-and-ethics.pdf.
Policy on Health and Safety-
http://wiprofoundation.org/files/Health_and_Safety_Policy.pdf.

Annual Report 2018-19 349
Policy on Ecological Sustainability-
https://www.wipro.com/content/dam/nexus/en/sustainability/pdf/ecological-sustainability-policy.pdf.
Policy on Corporate Social Responsibility-
https://www.wipro.com/content/dam/nexus/en/investor/corporate-governance/policies-and-guidelines/ethical-guidelines/12773-policy-on-corporate-social-responsibility.pdf.
Policy on Human Rights-
https://www.wipro.com/content/dam/nexus/en/sustainability/pdf/Human-Rights-Policy.pdf.
GRI Report FY 2017-18
https://www.wipro.com/content/dam/nexus/en/sustainability/sustainability_reports/sustainability-report-fy-2017-18.pdf.
g) Has the policy been formally communicated to all relevant internal and external stakeholders?
Yes, the policies have been formally communicated to internal and external stakeholders. They are available online for all stakeholders to refer to in the above mentioned links.
h) Does the Company have in-house structure to implement the policy/policies?
Yes, for all principles, although Wipro does not have a policy on public policy and advocacy. The sustainability organization and government relations group oversees the public policy initiatives.
i) Does the Company have a grievance redressal mechanism related to the policy/policies to address stakeholders’ grievances related to the policy/policies?
Yes, for all principles. A 24x7 multi-lingual online and hotline ombuds process is in place to address grievances from stakeholders across the organization.
Analyst and Investors provide regular feedback through media, interviews and ratings. Employees have multiple channels for grievance redressal.
Suppliers can provide feedback either through the ombuds process, helpline, helpdesk or forums like the Annual Supplier Meet.
Customers have multiple channels for raising grievances–account managers, client engagement managers, the customer advocacy group and through independently administered satisfaction surveys. There are ongoing, project based and annual feedbacks from our Customers.
j) Has the Company carried out independent audit/evaluation of the working of this policy by an internal or external agency
This report is assured against BRR, Global Reporting Initiative (GRI) standard and IIRC guidelines by independent assurance provider DNV GL. Refer to pages from 353 to 355 of this Annual Report for Assurance Statement.
Internal Audit Function: The internal audit function carries out an audit of processes and practices across functions of the organization using the Code of Business Conduct as the guideline.
3. Governance related to BR
Indicate the frequency with which the Board of Directors, Committee of the Board or CEO assess the BR performance of the Company. Within 3 months, 3-6 months, Annually, More than 1 year.
Quarterly.
Does the Company publish a BR or a Sustainability Report? What is the hyperlink for viewing this report? How frequently it is published?
Wipro’s Annual Report includes an articulation of the 9 NVG principles. We also publish an annual Sustainability Report which is available at https://www.wipro.com/sustainability.
Section E: Principle-wise performance
Principle 1
1.1 Does the policy relating to ethics, bribery and corruption cover only the Company? COBC extends to the Group/Joint Ventures/ Suppliers/Contractors/NGOs/Others?
Yes, COBC extends to all.
1.2 How many stakeholder complaints have been received in the past financial year and what percentage was satisfactorily resolved by the management? If so, provide the details thereof, in about 50 words or so.
Please refer page 28 of this Annual Report.

350 Wipro Limited
Principle 2
2.1 List up to 3 of your products or services whose design has incorporated social or environmental concerns, risks and/or opportunities.
Our work in the space of IT services and consulting includes cloud based services, managed services, Internet of things, infrastructure services and digital offerings, all of which fundamentally are premised on improving resource efficiency and reducing environmental footprint. We work in the domains of health care and life sciences, government services, banking, transportation, energy and natural resources, helping enhance provisioning of services across all sections of the society.
2.2 For each such product, provide the following details in respect of resource use (energy, water, raw material etc.) per unit of product (optional): Reduction during sourcing/ production/ distribution achieved since the previous year throughout the value chain, Reduction during usage by consumers (energy, water) that has been achieved since the previous year?
1) Wipro offers a range of IT services and solutions like cloud based services, managed services, Internet of things, digital offerings which significantly help improve process efficiency and business outcomes for our customers. All these solutions directly or indirectly also improve the environmental impacts for our customers. However due to the nature of our services, it is difficult to quantify.
2) The natural capital valuation study (refer page 55) and the green initiatives in ICT hardware procurement cover initiatives across the value chain.
2.3 Does the Company have procedures in place for sustainable sourcing (including transportation)? If yes, what percentage of your inputs was sourced sustainably? Also, provide the details thereof, in about 50 words or so.
Green Procurement program for ICT Hardware and Electronic End of Life as part of which we sourced more than 6,000 Electronic Product
Environmental Assessment Tool (EPEAT) registered electronic products in calendar year 2018.
Please refer pages 48 and 49 of this Annual Report.
2.4 Has the Company taken any steps to procure goods and services from local & small producers, including communities surrounding their place of work? If yes, what steps have been taken to improve their capacity and capability of local and small vendors?
Local Procurement: Wipro encourages sourcing from the local economy. Local sourcing reduces costs, provides local employment benefits and reduced environmental footprint in sourcing.
Please refer pages 48 and 49 of this Annual Report.
2.5 Does the Company have a mechanism to recycle products and waste? If yes what is the percentage of recycling of products and waste (separately as <5%, 5-10%, >10%). Also, provide the details thereof, in about 50 words or so.
Please refer pages 61 and 62 of this Annual Report.
Principle 3
3.1 Please indicate the Total number of employees.
Please refer page 8 of this Annual Report.
3.2 Please indicate the Total number of employees hired on temporary/contractual/casual basis.
Please refer page 8 of this Annual Report.
3.3 Please indicate the Number of permanent women employees.
Please refer page 8 of this Annual Report.
3.4 Please indicate the Number of permanent employees with disabilities
Please refer page 8 of this Annual Report.
3.5 Do you have an employee association that is recognized by management?
Please refer page 42 of this Annual Report.
3.6 What percentage of your permanent employees are members of this recognized employee association?
Please refer to page 42 of this Annual report.

Annual Report 2018-19 351
3.7 Please indicate the number of complaints relating to child labor, forced labor, involuntary labor, sexual harassment, in the last financial year, and those that are pending, as on the end of the financial year.
Please refer page 28 of this Annual Report. Also, refer
http://wiprosustainabilityreport.com/18-19/AR-supportings.
3.8 What percentage of your under mentioned employees were given safety & skill up- gradation training in the last year?
1. Permanent Employees
2. Permanent Women Employees
3. Casual/Temporary/Contract employees
4. Employees with disability
Safety training is provided to 100% of the employees.
For information on skill up-gradation training, please refer pages 39 and 40 of this Annual Report.
Principle 4
4.1 Has the Company mapped its internal and external stakeholders?
Yes.
4.2 Out of the above, has the Company identified the disadvantaged, vulnerable & marginalized stakeholders?
Please refer pages 47 and 48 of this report.
4.3 Are there any special initiatives undertaken by the Company to engage with the disadvantaged, vulnerable and marginalized stakeholders? If so, provide the details thereof, in about 50 words or so.
Please refer pages 52 and 53 of this Annual Report.
Principle 5
5.1 Does the policy of the Company on human rights cover only the Company or extend to the Group/Joint Ventures/Suppliers/Contractors/ NGOs/Others?
Human Rights policy extends to the Group/Joint Ventures/Suppliers/Contractors/NGOs/others.
5.2 How many stakeholder complaints have been received in the past financial year, and what
percentage was satisfactorily resolved by the management?
Please refer page 28 of this Annual Report. Also refer to
http://wiprosustainabilityreport.com/18-19/AR-supportings. Also refer page 126 for compaints under Sexual Harassment of Women at Workplace (Prevention, Prohibition and Redressal) Act, 2013.
Principle 6
6.1 Does the policy related to Principle 6 cover only the Company or extends to the Group/Joint Ventures/Suppliers/Contractors/NGOs/others.
Yes, it extends to all.
6.2 Does the Company have strategies/initiatives to address global environmental issues such as climate change, global warming, etc? Yes/No. If yes, please give hyperlink for the webpage, etc.
Yes. Please refer to pages from 57 to 59 of this report.
https://www.wipro.com/annual-reports/.
6.3 Does the Company identify and assess potential environmental risks?
Yes.
6.4 Does the Company have any project related to Clean Development Mechanism? If so, provide the details thereof, in about 50 words or so. Also, if yes, whether any environmental compliance report has been filed?
No.
6.5 Has the Company undertaken any other initiatives on–clean technology, energy efficiency, renewable energy, etc? Yes/No. If yes, please give hyperlink for the web page, etc.
Yes. Please refer pages from 57 to 59 of this report. https://www.wipro.com/annual-reports/.
6.6 Are the emissions/waste generated by the Company within the permissible limits given by CPCB/SPCB for the financial year being reported?
Yes.
6.7 Number of show cause/legal notices received from CPCB/SPCB which are pending (i.e., not resolved to satisfaction) as on end of Financial Year.
None.

352 Wipro Limited
Principle 7
7.1 Is your Company a member of any trade and chamber or association? If yes, name only those major ones that your business deals with.
We are members of industry and business forums in countries where we have significant operations. NASSCOM (National Association of Software and Service Companies), U.S. Chamber of Commerce (USCC) and OFII (Organization for International Investments) are the top three by financial contribution. The total contribution made to NASSCOM, USCC, OFII is $133,527 during FY19.
7.2 Have you advocated/lobbied through the above associations for the advancement or improvement of public good? Yes/No. If yes, specify the broad areas (Governance and Administration, Economic Reforms, Inclusive Development Policies, Energy Security, Water, Food Security, Sustainable Business Principles, Others).
Yes. Through Industry forums and networks in India, we work on a range of issues related to sustainability and community aspects- including energy, water, green buildings, bio-diversity, waste management among others. We also support industries position for free movement of labor.
Principle 8
8.1 Does the Company have specified programs/ initiatives/projects in pursuit of the policy related to Principle 8? If yes, provide the details thereof.
Yes. Please refer pages 52 and 53 of this Annual Report.
8.2 Are the programs/projects undertaken through an in-house team/own foundation/external NGO/government structures/any other organization?
Wipro partners with non governmental organizations working on the areas of our focus.
8.3 Have you done any impact assessment of your initiative?
We do extensive due diligence of our partners and monitor and evaluate progress/outcomes during the course of the program, and on a
quarterly basis with the Chairman. Due to the nature of a large part of our work (systemic reform in education, for example), we have not conducted a formal impact assessment of our initiatives.
8.4 What is your Company’s direct contribution to community development projects- Amount in INR and the details of the projects undertaken.
Please refer pages 8, 9, 52 and 53 of this Annual Report.
8.5 Have you taken steps to ensure that this community development initiative is successfully adopted by the community? Please explain in 50 words or so.
The nature of the programs supported by Wipro ensures successful adoption by communities. Also, Wipro works with organizations which has a good connect and presence in the local communities.
For more details, please refer pages 52 and 53 of this Annual Report.
Principle 9
9.1 What percentage of customer complaints/ consumer cases are pending as on the end of financial year?
We do not have any complaint relating to violation of this principle. However, we would have routine customer related commercial litigations/disputes.
9.2 Does the Company display product information on the product label, over and above what is mandated as per local laws? Yes/No/N.A./ Remarks (additional information).
Not Applicable.
9.3 Is there any case filed by any stakeholder against the Company regarding unfair trade practices, irresponsible advertising and/or anti-competitive behavior during the last five years and pending as on end of financial year? If so, provide the details thereof, in about 50 words or so.
Not Applicable.
9.4 Did your Company carry out any consumer survey/consumer satisfaction trends?
Please refer pages 47 and 48 of this Annual Report.

Annual Report 2018-19 353
Scope and Approach
DNV GL Business Assurance India Private Limited has been commissioned by the management of Wipro Limited (‘Wipro’ or ‘the Company’, Corporate Identity Number L32102KA1945PLC020800) to carry out an independent assurance engagement on the non-financial - qualitative and quantitative information (sustainability performance) in its Annual Report 2018-19 (‘the Report’) in printed format and references to the Company’s website, for the financial year ending 31st March 2019.
The sustainability performance is presented based on the materiality determination exercise carried out by the Company covering Wipro’s Information Technology business operations in India and other geolocations, and considering the key requirements of:
- The International Integrated Reporting Council’s (IIRC’s) <IR> Framework;
- The Global Reporting Initiative (GRI) Sustainability Reporting Standards 2016 (‘GRI Standards’)
- the principles of the National Voluntary Guidelines (NVG) and Securities and Exchange Board of India’s (SEBI’s) requirements with respect to Business Responsibility Reporting (BRR) vide circular No. CIR/CFD/DIL/8/2012 dated August 13, 2012.
We performed a limited level of assurance based on our assurance methodology VeriSustainTM1, which is based on our professional experience, international assurance best practices including International Standard on Assurance Engagements 3000 (ISAE 3000) Revised* and the GRI Principles for Defining Report Content and Quality. Our assurance engagement was planned and carried out during April 2019 – June 2019.
Responsibilities of the Management of Wipro and of the Assurance Provider
The Management of Wipro has the sole responsibility for the preparation of the Report and are responsible
for all information disclosed in the Report as well as the processes for collecting, analysing and reporting the information presented in both the printed and web-based versions of the Report. Wipro is also responsible for the maintenance and integrity of its website. In performing this assurance work, our responsibility is to the Management; however, this statement represents our independent opinion and is intended to inform the outcome of the assurance to the stakeholders of the Company.
We provide a range of other services to Wipro, none of which in our opinion, constitute a conflict of interest with this assurance work. Our assurance engagements are based on the assumption that the data and information provided by the client to us as part of our review have been provided in good faith. We were not involved in the preparation of any statements or data included in the Report except for this Assurance Statement. We expressly disclaim any liability or co-responsibility for any decision a person or an entity may make based on this Assurance Statement.
Basis of our Opinion
We planned and performed our work to obtain the evidence considered necessary to provide a basis for our assurance opinion, and as part of the assurance,a multi-disciplinary team of sustainability and assurance specialists performed work at Wipro’s Corporate Office and sample operations and supply chain partners in India.
We undertook the following activities:
• Review of Wipro’s approach to identification of key capitals, the processes of stakeholder engagement and materiality determination, and its outcome as brought out in this Report. We did not have any direct engagement with external stakeholders;
• Interviews with selected senior managers responsible for management of sustainability issues and review of selected evidence to support issues disclosed in the Report. We were free to choose interviewees and interviewed those with overall responsibility to deliver the Company’s sustainability objectives;
(1) The VeriSustain protocol is available on www.dnvgl.com* Assurance Engagements other than Audits or Reviews of Historical Financial Information.
Independent Assurance Statement

354 Wipro Limited
• Visited Corporate office at Sarjapur Road, Bengaluru and carried out site visits to sample locations of the Company: (i) Kolkata Development Centre;(ii) Kochi Development Centre; (iii) Wipro - Airoli, Mumbai,(iv) Divyasree Chambers, Bengaluru and (v) Sarita Vihar, New Delhi, to review processes and systems for preparing site level sustainability data and implementation of sustain abilitystrategy. We were free to choose sites for conducting assessments;
• Reviewed the sustainability performance of three suppliers as part of supply chain assessment;
• Review of supporting evidence for key claims and data in the Report;
• Review of the processes for gathering and consolidating the performance data related to the chosen GRI Standards;
• Verification of the data consolidation of reported performance disclosures in context to the Principle of Completeness as per Veri Sustain for a limited level of verification;
• An independent review of Wipro’s reporting against its Business Responsibility Report for the year 2018-19 covering requirements under Section ‘a’ to ‘e’.
During the assurance process, we did not come across limitations to the scope of the agreed assurance engagement. The reported data on economic performance, expenditure towards Corporate Social Responsibility (CSR)and other financial data are based on audited financial statements issued by the Company’s statutory auditors.
Opinion
On the basis of the verification undertaken, nothing has come to our attention to suggest that the Report does not bring out the sustainability performance disclosures for the identified material topics and related capitals i.e. Financial, Intellectual, Human, Social and Relationship, and Natural (hereafter referred to as ‘Capitals’) and disclosure requirements as set out by SEBI for Business Responsibility Reporting through the following GRI Standards:
− GRI 201: Economic Performance 2016 – 201-1, 201-2, 201-3, 201-4;
− GRI 204: Procurement Practices 2016 – 204-1;
− GRI 205: Anti-corruption 2016 – 205-1, 205-2, 205-3;
− GRI 302: Energy 2016 – 302-1, 302-2, 302-3, 302-4, 302-5;
− GRI 303: Water 2016 – 303-1, 303-2, 303-3;
− GRI 305: Emissions 2016 – 305-1, 305-2, 305-3, 305-4, 305-4, 305-5, 305-6, 305-7;
− GRI 306: Effluents and Waste 2016 – 306-1, 306-2, 306-3;
− GRI 307: Environmental Compliance 2016 – 307-1;
− GRI 308: Supplier Environmental Assessment 2016 – 308-1, 308-2;
− GRI 401:Employment 2016 – 401-1, 401-2, 401-3;
− GRI 403: OccupationalHealth and Safety 2016 – 403-1, 403-2, 403-4;
− GRI 406: Non-discrimination 2016 – 406-1;
− GRI 407: Freedom of Association and Collective Bargaining – 407-1;
− GRI 413: Local Communities 2016 – 413-1, 413-2;
− GRI 414: Supplier Social Assessment 2016 – 414-1 ;
− GRI 418: Customer Privacy 2016 – 418-1;
− GRI 419: Socioeconomic Compliance 2016 – 419-1.
Observations
Without affecting our assurance opinion, we provide the following observations against the principles of Verisustain:
Materiality
The process of determining the issues that is most relevant to an organization and its stakeholders.
The Report brings out identified material topics on the basis of an internal materiality determination exercise, as well as through benchmarking with peers, sustainability rating agencies and applicable sustainability reporting frameworks and key concerns of identified stakeholders.On the basis of review of the non-financial disclosures in this Report, nothing has come to our attention to suggest that the Report does not meet the requirements related to the Principle of Materiality.
Stakeholder Inclusiveness
The participation of stakeholders in developing and achieving an accountable and strategic response to Sustainability.
Wipro has formal and informal processes in place for stakeholder identification and engagement, and
Annual Report 2018-19 355
DNV GL Business Assurance India(Private) Limited is part of DNV GL – Business Assurance, a global provider of certification, verification, assessment and training services, helping customers to build sustainable business performance. www.dnvgl.com
For DNV GL Business Assurance India Private Limited
Vadakepatth NandkumarAssurance Reviewer Head – Regional Sustainability OperationsDNV GL Business Assurance India Private Limited, India.
Kiran RadhakrishnanLead VerifierDNV GL Business Assurance India Private Limited, India
6th June 2019, Bengaluru, India.
responses to key concerns are brought out in the Report out through descriptions of appropriate strategies, policies and management approach. On the basis of review of the non-financial disclosures in this Report, nothing has come to our attention to suggest that the Report does not meet the requirements related to the Principle of Stakeholder Inclusiveness.
Responsiveness
The extent to which an organization responds to stakeholder issues.
The Report brings out Wipro’s responses on key concerns, expectations and issues raised by its key stakeholders, identified as material topics for value creation,through its policies, strategies, management systems and governance mechanisms, further, the Report also brings out Wipro’s approach towards value creation across identified Capitals in a coherent manner. On the basis of review of the non-financial disclosures in this Report, nothing has come to our attention to suggest that the responses related to identified material topics are not adequately represented in the Report.
Reliability
The accuracy and comparability of information presented in the report, as well as the quality of underlying data management systems.
The majority of data and information verified at Corporate Office and at sample locations visited by us were found to be fairly accurate and reliable. Some of the data inaccuracies identified during the verification process were found to be attributable to transcription, interpretation and aggregation errors and the errors
have been corrected. On the basis of review of the non-financial disclosures in this Report, nothing has come to our attention to suggest that the existing process of sustainability disclosure does not meet the requirements related to the Principle of Reliability.
Completeness
How much of all the information that has been identified as material to the organisation and its stakeholders is reported?
The reporting scope covers disclosures related to chosen guidelines for sustainability reporting i.e. Wipro’s Economic, Environmental and Social performance through topics it has identified as material, based on appropriate GRI Standards and requirements of the <IR> framework and National Voluntary Guidelines, within the identified reporting boundary. On the basis of review of the non-financial disclosures in this Report, nothing has come to our attention to suggest that the Report does not meet the Principle of Completeness with respect to scope, boundary and time.
Neutrality
The extent to which a report provides a balanced account of an organization’s performance, delivered in a neutral tone.
The disclosures related to sustainability performance and issues are presented in a neutral tone, in terms of content and presentation, along with key concerns and challenges faced during the period. On the basis of review of the non-financial disclosures in this Report,nothing has come to our attention to suggest that the Report does not meet the Principle of Neutrality.

356 Wipro Limited
Glossary
Abbreviations from Annual Report FY18-19
Sl. No Abbreviation Expansion
1 AAS As A Service
2 ADR American Depository Receipt
3 AED Application Engineering and DevOps
4 AI Artificial Intelligence
5 AI/ML Artificial Intelligence/Machine Learning
6 BFSI Banking, Financial Services & Insurance
7 BI Business Intelligence
8 BPS Basis Points
9 BSE BSE Limited
10 CAGR Compounded Annual Growth Rate
11 CDLI Carbon Disclosure Leadership Index
12 CDP Carbon disclosure Project
13 CDSB Climate disclosures Standards Board
14 CEO Chief Executive Officer
15 CEP Continuous Engagement Program
16 CEPT Centre for Environmental Planning and Technology
17 CFO Chief Financial Officer
18 CII Confederation of Indian Industry
19 CIN Corporate Identification Number
20 CIS Cloud and Infrastructure Services
21 CMSP Communication & Service Provider
22 COBC Code of Business Conduct
23 COSO Company of Sponsoring Trade way Organisation
24 CRS Cybersecurity and Risk Services
25 CSAT Customer Satisfaction
26 CSPs Communication Service Providers
27 CSR Corporate Social Responsibility
28 CTO Chief Technology Officer
29 CXO Chief Executive’s Office
30 D&I Diversity & Inclusion
31 DAAI Data Analytics and Artificial Intelligence
32 DDT Dividend distribution tax
33 DIN Director Identification Number
34 DJSI Dow Jones Sustainability Index
35 DO&P Digital Operations and Platforms
36 DSO Day Sales Outstanding
37 EAM Enterprise Applications and Modernisation
Sl. No Abbreviation Expansion
38 EDS Electronic Data Systems
39 ENU Energy, Natural Resources and Utilities
40 EPEAT Electronic Product Environmental Assessment Tool
41 EPI Energy Performance Indicator
42 EPI Energy Performance Index
43 EPS Earning Per Share
44 ERM Enterprise Risk Management
45 ESG Environmental, Social and Governance
46 ESOP Employee Stock Option
47 FCTR Foreign Currency Translation Reserve
48 FSSAI Food Safety Standards Authority of India
49 FTSE Russell ESG
Financial Times Stock Exchange Russell Environmnetal Social and Governance
50 GAAP Generally Accepted Accounting Principles
51 GDPR General Data Protection Regulation
52 GHG Green House Gases
53 GIS Global Infrastructure Services
54 GRI Global Reporting Initiative
55 HLS Healthcare and Life Sciences
56 HPS Health Plan Services
57 HSSE Health, Safety, Security and Environment
58 HUF Hindu Undivided Family
59 I&D Inclusion and Diversity
60 I&ES industrial and Engineering Services
61 IAAS Infrastructure as a Service
62 IAS International Accounting Standard
63 IASB International Accounting Standards Board
64 IBBI Biodiversity Initiative
65 ICT Information and communications technology
66 IFRIC IFRS Interpretations Committee
67 IFRS International Financial Reporting Standards
68 IIM Indian Institute of Management
69 IIRC International Integrated Reporting Council
70 IIT Indian Institute of Technology

Annual Report 2018-19 357
Sl. No Abbreviation Expansion
71 ILO International Labour Organization
72 IoT Internet of Things
73 IP Intellectual Property
74 ISO International Standards Organisation
75 ISRE India State Run Enterprises
76 IT Information Technology
77 IT-BPM Information Technology- Business Process Management
78 ITES Information Technology Enabled Services
79 IUCN International Union of Conservation Networks
80 JAC Joint Audit Consortium
81 KMP Key Managerial Personnel
82 LAN Local Area Network
83 LATAM Latin America
84 LED Light Emitting Diode
85 LEED Leadership in Energy and Environmental Designs
86 LIBOR London Inter Bank Offered Rate
87 MAS Modern application Services
88 MCA Ministry of Corporate Affairs
89 MFG Manufacturing and Technology
90 ML Machine Learning
91 MOU Memorandum of Understanding
92 MPS Managed Print Services
93 MSCI ESG Morgan Stanley Capital International Environmental Social and Governance
94 MTLCs Mission10X Technology Learning centers
95 NASSCOM National Association of Software and Services Companies
96 NIT National Institute of Technology
97 NPS Net Promoter Score
98 NRI Non-Resident Indian
99 NSE National Stock Exchange of India Limited
100 NVGs National Voluntary Guidelines
101 NYSE New York Stock Exchange
102 OEM Original Equipment Manufacturer
103 OHSAS Occupational Health and Safety Assessment Series
104 PaaS Platform as a Service
105 PLM Product Lifecycle Management
106 PSCI Pharmaceutical Supply Chain Initiative
107 PSH/POSH Prevention of Sexual Harrassment
108 PUF Physically Unclonable Function
Sl. No Abbreviation Expansion
109 QaaS Quality as a Service
110 REC Renewable Energy Certificate
111 RPA Robotic process automation
112 RPT Related Party Transactions
113 RSPM Respirable Suspended Particulate Matter
114 RSU Restricted Stock Unit
115 SaaS Software as a Service
116 SASB Sustainibilty Accounting Standard Board
117 SCOC Supplier Code of Conduct
118 SD Skills Development
119 SDx Software Defined Everything
120 SEBI Securities and Exchange Board of India
121 SEC Securities and Exchange Commission, USA
122 SEF Science Education Fellowship
123 SEZ Special Economic Zones
124 SI System Integrator
125 SoW Spirit of Wipro
126 SOX Sarbanes’ Oxley
127 STP Sewage Treatment Plants
128 SWM Solid Waste Management
129 T&D Transmission and Distribution
130 T&M Time and Material
131 TaaS Talent as a Service
132 TCFD Task Force on Climate related Financial disclosures
133 UN GCNI United Nations Global Compact Network India
134 USSEF United States Science Education Fellowship
135 VDI Virtual Desktop Infrastructure
136 VoC Voice of Customer
137 WASE Wipro Academy of Software Excellence
138 WATIS Wipro Applying Thought in Schools
139 WEP Women’s Empowerment Principles
140 WIMS Wipro Infrastructure Management School
141 Wipro SEF Wipro Science Education Fellowship
142 WiSTA Wipro Software Technology Academy
143 WOW Women of Wipro
144 WRI World Resource Institute
145 WTD Whole Time Director
146 WTT Well To Tank

Notes

Notes

Notes