CHILD LABOUR - ILO
88
GLOBAL ESTIMATES 2020, TRENDS AND THE ROAD FORWARD CHILD LABOUR © UNICEF/UNI123128/Khan
-
Upload
khangminh22 -
Category
Documents
-
view
4 -
download
0
Transcript of CHILD LABOUR - ILO

GLOBAL ESTIMATES 2020, TRENDS AND THE ROAD FORWARDCHILD LABOUR
© UNICEF/UNI123128/Khan

Copyright © International Labour Organization and United Nations Children’s Fund 2021
This is an open access work distributed under the Creative Commons Attribution 4.0 International License (https://creativecommons.org/licenses/by/4.0/). Users can reuse, share, adapt and build upon the original work, as detailed in the License. The International Labour Office (ILO) and the United Nations Children’s Fund (UNICEF) must be clearly credited as the owners of the original work. The use of the emblems or logos of the ILO and UNICEF is not permitted in connection with users’ work.
Suggested citation. International Labour Office and United Nations Children’s Fund, Child Labour: Global estimates 2020, trends and the road forward, ILO and UNICEF, New York, 2021. License: CC BY 4.0.
Translations – In case of a translation of this work, the following disclaimer must be added along with the attribution: This translation was not created by the International Labour Office (ILO) or the United Nations Children’s Fund (UNICEF) and should not be considered an official ILO or UNICEF translation. The ILO and UNICEF are not responsible for the content or accuracy of this translation.
Adaptations – In case of an adaptation of this work, the following disclaimer must be added along with the attribution: This is an adaptation of an original work by the International Labour Office (ILO) and the United Nations Children’s Fund (UNICEF). Responsibility for the views and opinions expressed in the adaptation rests solely with the author or authors of the adaptation and are not endorsed by the ILO or UNICEF.
UNICEF photographs – UNICEF photographs are copyrighted and are not to be reproduced in any medium without obtaining prior written permission. Permissions may be granted upon request for one-time use in a context that accurately represents the real situation and identity of all human beings depicted. UNICEF photographs are not to be used in any commercial context; content may not be digitally altered to change meaning or context; assets may not be archived by any non-UNICEF entity. Requests for permission to reproduce UNICEF photographs should be addressed to UNICEF, Division of Communication, 3 United Nations Plaza, New York 10017, USA (email: [email protected]).
ILO ISBN: 978-92-2-034878-9 (print); 978-92-2-034879-6 (web PDF)UNICEF ISBN: 978-92-806-5239-0 (print); 978-92-806-5240-6 (web PDF)
The designations employed in ILO and UNICEF publications, which are in conformity with United Nations practice, and the presentation of material therein do not imply the expression of any opinion whatsoever on the part of the ILO or UNICEF concerning the legal status of any country, area or territory or of its authorities, or concerning the delimitation of its frontiers.
The responsibility for opinions expressed in signed articles, studies and other contributions rests solely with their authors, and publication does not constitute an endorsement by the ILO or UNICEF of the opinions expressed in them. Reference to names of firms and commercial products and processes does not imply their endorsement by the ILO or UNICEF, and any failure to mention a particular firm, commercial product or process is not a sign of disapproval.
Acknowledgements This report has been jointly prepared by the ILO and UNICEF. Members of the core team included Federico Blanco (ILO), Claudia Cappa (UNICEF), Michaëlle De Cock (ILO), Lorenzo Guarcello (ILO) and Scott Lyon (ILO). The statistical work, including the development of the methodology and estimates, was conducted by Roger Gomis (ILO) and Chinmay Sharma (independent consultant) under the supervision of Steven Kapsos (ILO). Data preparation and analysis were carried out by David Bescond (ILO), Federico Blanco (ILO), Evangelia Bourmpoula (independent consultant), Claudia Cappa (UNICEF), William Cole (independent consultant), Lorenzo Guarcello (ILO), Munkhbadar Jugder (UNICEF), Donika Limani (independent consultant), Yves Perardel (ILO), Nicole Petrowski (UNICEF) and Mabelin Villarreal-Fuentes (ILO).
Many ILO and UNICEF colleagues provided valuable inputs and comments, in particular Christina Behrendt (ILO), Assefa Bequele (ILO, retired), Florence Bonnet (ILO), Joanne Bosworth (UNICEF), Caroline Chaigne-Hope (ILO), Sumaira A. Chowdhury (UNICEF), Francesco d’Ovidio (ILO), Monica Darer (UNICEF), Kirsten Di Martino (UNICEF), John Dombkins (ILO), Ruth Graham Goulder (UNICEF), Valeria Gruppo (UNICEF), Melanie Jeanroy (ILO), Josiah Kaplan (UNICEF), Muhammad Rafiq Khan (UNICEF), Aniruddha Kulkarni (UNICEF), Henrik Moller (ILO), Ian Orton (ILO), Brigid Kennedy Pfister (UNICEF), Victor Hugo Ricco (ILO), Dominic Richardson (UNICEF), Eshani Ruwanpura (UNICEF), Ben Smith (ILO), Ramya Subrahmanian (UNICEF), Philippe Vanhuynegem (ILO), Wongani Grace Taulo (UNICEF), Cornelius Williams (UNICEF), Thomas Wissing (ILO) and Alexandra Yuster (UNICEF). Gratitude goes to colleagues from ILO and UNICEF country offices for sharing relevant material.
Funding to this report is partly provided to the ILO by the United States Department of Labor under cooperative agreement number IL‐30147‐16‐75‐K‐11 (MAP16 project) (GLO/18/29/USA); and by the Government of France under the framework of the Entr’Alliance project (GLO/20/60/FRA).
One hundred per cent of the total costs of the MAP16 project is financed with federal funds, for a total of 22,4 million dollars.
This material does not necessarily reflect the views or policies of the United States Department of Labor or the Government of France, nor does mention of trade names, commercial products, or organizations imply endorsement by the United States Government or the Government of France.
The production of the report was coordinated by Claudia Cappa (UNICEF). The report was edited by Gretchen Luchsinger, Lois Jensen and Tina Johnson (Words for the World), fact-checked by Isabel Jijon and designed by Era Porth (independent consultants).
United Nations Children’s Fund (UNICEF)Data and Analytics Section Division of Data, Analytics, Planning and Monitoring 3 United Nations Plaza, New York, NY 10017, USA Telephone: +1 212 326 7000 Email: [email protected]
International Labour OfficeFundamental Principles and Rights at Work (FUNDAMENTALS)Route des Morillons 4, 1211 Geneva, SwitzerlandTelephone: + 41 (0) 22 799 6862Email: [email protected]

© U
NIC
EF/
UN
I138
971/
Haq
ue
3

© U
NIC
EF/
UN
0282
725/
LeM
oyne
4

CONTENTSExecutive summary 6
Introduction 14
Current levels and trends 20
Global and regional overview 21
Profile of children in child labour 28
Characteristics of child labour 37
Child labour and education 47
Child labour, national income and state fragility 50
The impact of COVID-19 54
The road forward 60
Annex 72
Statistical tables 74
Overview of the methodology 79
Endnotes 83
5

Executive summary
© U
NIC
EF/
UN
0643
60/F
eyiz
oglu
6

Executive summary
7

Child Labour: Global estimates 2020, trends and the road forward takes stock of where we stand
in the global effort to end child labour. Published
in the United Nations International Year for the
Elimination of Child Labour by the International
Labour Organization (ILO) and the United Nations
Children’s Fund (UNICEF), co-custodians of target
8.7 of the Sustainable Development Goals (SDGs),
the report describes the scale and key characteristics
of child labour today, and changes over time.
In line with child labour estimates produced by
the ILO every four years since 2000, the 2020
calculations are based on the extrapolation of
data from national household surveys. The new
estimates use more than 100 household surveys
covering two thirds of the world’s population of
children aged 5 to 17 years.
What the report tells us is alarming. Global progress
against child labour has stalled for the first time
since we began producing global estimates two
decades ago. In addition, without urgent mitigation
measures, the COVID-19 crisis is likely to push
millions more children into child labour.
These results constitute an important reality check
in meeting the international commitment to end
child labour by 2025. If we do not muster the will
and resources to act now on an unprecedented
scale, the timeline for ending child labour will
stretch many years into the future.
GLOBAL ESTIMATES AND TRENDSChild labour remains a persistent problem in the
world today. The latest global estimates indicate
that 160 million children – 63 million girls and 97
million boys – were in child labour globally at the
beginning of 2020, accounting for almost 1 in 10 of
all children worldwide. Seventy-nine million children
– nearly half of all those in child labour – were in
hazardous work that directly endangers their health,
safety and moral development.
Global progress against child labour has
stagnated since 2016. The percentage of children
in child labour remained unchanged over the four-
year period while the absolute number of children
in child labour increased by over 8 million. Similarly,
the percentage of children in hazardous work was
almost unchanged but rose in absolute terms by
6.5 million children.
The global picture masks continued progress
against child labour in Asia and the Pacific,
and Latin America and the Caribbean. In both
regions, child labour trended downward over the
last four years in percentage and absolute terms.
Similar progress in sub-Saharan Africa has proven
elusive. This region has seen an increase in both the
number and percentage of children in child labour
since 2012. There are now more children in child
labour in sub-Saharan Africa than in the rest of the
world combined. Global child labour goals will not
be achieved without a breakthrough in this region.
Continued progress was registered over the last
four years among children aged 12 to 14 and
15 to 17. Child labour in both age groups declined
in percentage and absolute terms, continuing
a consistent downward trend seen in previous
estimates. Child labour rose among young children
aged 5 to 11, however, after the 2016 global
estimates signalled slowing progress for this age
group. There were 16.8 million more children aged
5 to 11 in child labour in 2020 than in 2016.
The COVID-19 crisis threatens to further erode
global progress against child labour unless
urgent mitigation measures are taken. New
analysis suggests a further 8.9 million children will
be in child labour by the end of 2022 as a result of
rising poverty driven by the pandemic.
Yet the predicted additional rise in child labour is by
no means a foregone conclusion. The actual impact
will depend on policy responses. Two additional
scenarios demonstrate the huge influence of social
protection coverage on child labour in the near
term. Where social protection coverage is allowed
to slip, a significant further increase in child labour
8

could occur by the end of 2022. A rise in social
protection coverage, on the other hand, could more
than offset the impact of COVID-19 on child labour,
returning us to progress on the issue.
Other key results from the 2020 global estimates
include:
• Involvement in child labour is higher for boys
than girls at all ages. Among all boys, 11.2 per
cent are in child labour compared to 7.8 per cent
of all girls. In absolute numbers, boys in child
labour outnumber girls by 34 million. When the
definition of child labour expands to include
household chores for 21 hours or more each
week, the gender gap in prevalence among boys
and girls aged 5 to 14 is reduced by almost half.
• Child labour is much more common in rural
areas. There are 122.7 million rural children in
child labour compared to 37.3 million urban
children. The prevalence of child labour in rural
areas (13.9 per cent) is close to three times
higher than in urban areas (4.7 per cent).
• Most child labour – for boys and girls alike –
continues to occur in agriculture. Seventy per
cent of all children in child labour, 112 million
children in total, are in agriculture. Many are
younger children, underscoring agriculture as an
entry point to child labour. Over three quarters of
all children aged 5 to 11 in child labour work in
agriculture.
• The largest share of child labour takes place
within families. Seventy-two per cent of all
child labour and 83 per cent of child labour
among children aged 5 to 11 occurs within
families, primarily on family farms or in family
microenterprises. Family-based child labour
is frequently hazardous despite common
perceptions of the family as offering a safer work
environment. More than one in four children
aged 5 to 11 and nearly half of children aged
12 to 14 in family-based child labour are in work
likely to harm their health, safety or morals.
• Child labour is frequently associated with
children being out of school. A large share of
younger children in child labour are excluded
from school despite falling within the age range
for compulsory education. More than a quarter of
children aged 5 to 11 and over a third of children
aged 12 to 14 who are in child labour are out of
school. This severely constrains their prospects
for decent work in youth and adulthood as well
as their life potential overall. Many more children
in child labour struggle to balance the demands
of school and child labour at the same time,
which compromises their education and their
right to leisure.
THE ROAD FORWARD
The 2020 ILO-UNICEF global estimates indicate
a critical juncture in the worldwide effort against
child labour. Global progress has ground to a halt
over the last four years after having already slowed
considerably in the four years before that. The
ongoing COVID-19 crisis threatens to further erode
past gains. While there are nearly 86 million fewer
children in child labour now than when we began
measuring global levels in 2000, recent trends
suggest we are falling far behind on the collective
commitment to end child labour in all its forms by
2025. In this United Nations International Year for
the Elimination of Child Labour, we must act with
renewed urgency to put progress back on track.
Immediate steps are needed to avoid falling
further behind during the ongoing COVID-19
crisis. The pandemic has clearly heightened the
risk of child labour, above all through a sharp rise
in poverty that may increase families’ reliance on
child labour, and through school closures that
deny families the logical alternative to sending
children to work. To reduce these risks, expanded
income support measures for families in situations of
vulnerability, through child benefits and other means,
will be critical. So too will back-to-school campaigns
and stepped-up remedial learning to get children
9

back in the classroom and help them make up for
lost learning once there, when conditions permit.
During the acute and recovery phases of the crisis,
it will be important not to lose sight of broader
policy imperatives for ending child labour. These
have long been clear:
• Extending social protection for children and their
families to mitigate the poverty and economic
uncertainty that underpin child labour.
• Ensuring free and good-quality schooling at least
up to the minimum age for entering employment
to provide a viable alternative to child labour and
afford children a chance at a better future.
• Guaranteeing that every child’s birth is registered
so that children have a legal identity and can
enjoy their rights from birth.
• Promoting decent work that delivers a fair
income for young people (of legal working
age) and adults, with a particular emphasis on
workers in the informal economy, in order for
families to escape poverty-driven child labour.
• Promoting adequate rural livelihoods and
resilience, including through supporting
economic diversification, investing in basic
services infrastructure, extending social
protection and devising agricultural extension
policies for crop diversification. Family farms
and enterprises that depend on the (mostly
unpaid) labour of their children need greater
support to improve their livelihoods and end that
dependence.
• Ensuring that necessary laws and regulations
are in place to protect children, backed by
enforcement machinery and child protection
systems, and the services required to apply
them.
• Addressing gender norms and discrimination
that increase child labour risks, particularly
for girls, related to domestic work and unpaid
household chores.
Special attention should address the heightened
risk of child labour in growing crises, conflicts
and disasters. Child labour concerns should
factor in all phases of humanitarian action –
from crisis preparedness and contingency
plans to humanitarian responses to post-crisis
reconstruction and recovery efforts.
Addressing child labour risks in domestic and
global supply chains continues to be important.
Especially relevant are the informal micro- and small
enterprises operating at the lower tiers of supply
chains, where child labour and other human rights
risks are often most pronounced. Governments can
lead through public procurement that discourages
child labour risks in vendor supply chains.
The COVID-19 crisis has made actions across
all these policy areas and contexts even more
urgent at a time when governments are grappling
with restricted fiscal space. Sound policy
choices and resource allocation decisions will be
critical. Strengthening the country-level evidence
base on child labour can help to identify local
priorities and guide policy and spending decisions.
Social dialogue among governments, employers’
organizations and workers’ organizations is also key
to developing appropriate and responsive policies
for addressing child labour and related challenges,
wherever they occur.
Governments will need to adopt creative
resource mobilization strategies to expand their
fiscal space. Given budget shortfalls generated
by the pandemic, the international community will
need to fill the financing gap. Many industrialized
countries still fall short of long-standing
commitments to official development assistance
(ODA) and financing for sustainable development.
This needs to change.
Debt relief should be extended and debt re-
structured in already heavily indebted countries
so that social spending is not crowded out by
increasing debt service payments. We must
avoid the mistakes of the past that saw urgently
10

needed credit flows made contingent on austerity
measures that inflicted the most harm on children
and families in greatest need.
The COVID-19 crisis has served as an
important reminder of the need for international
cooperation and partnership in overcoming
global challenges. This is as true for ending
child labour as for other critical development
priorities in the 2030 Agenda for Sustainable
Development. Eliminating child labour is a
task too big for any one party to solve alone.
Countries must work together within the spirit of
article 8 of the universally ratified ILO Worst Forms
of Child Labour Convention (No. 182).
Alliance 8.7 plays an important role in facili-
tating cooperation on child labour among
governmental and non-governmental actors.
A global partnership launched in 2016, Alliance 8.7
groups governments, multilateral organizations,
workers’ organizations, employers’ organizations,
non-governmental organizations, academic
institutions and think tanks to find ways of
accelerating action on target 8.7. The alliance
focuses on three strategies: conducting research
and sharing knowledge, driving innovation, and
increasing and leveraging resources.
It is urgent to put action to end child labour
back on track, in line with global commitments
and goals. The evidence in this report outlines
the risks and points to the solutions. While
ambitious measures and investments are
required, the COVID-19 pandemic has amply
illustrated that these are possible when the
well-being of humanity is at stake. We have
made a promise to children to end child labour.
There is no time to lose.
11

Impact of COVID-19
Without mitigation measures, the number of children in child labour could rise from 160million in 2020 to 168.9 million by the end of 2022
If austerity measures or other factors cause a slippage in social protection coverage
Due to an increase in poverty and in the absence of additional mitigation measures
206.2million
168.9million
144.9million
If social protection coverage is increased
Child labour at a glance
Own-account workersEmployeesContributing family workers
We have made a promise to children to end child labour There is no time to lose
Worldwide, 160 million children are engaged in child labour; 79 million of them are performing hazardous work
Sub-Saharan Africa
Central andSouthern Asia
Northern Africa and Western Asia
Latin Americaand the
Caribbean Europe and NorthernAmerica
Eastern and South-Eastern Asia
23.9%86.6 million
5.5%26.3 million
7.8%10.1 million 6.0%
8.2 million2.3%
3.8 million
6.2%24.3 million
Sub-Saharan Africa stands out as the region with the highest prevalence and largest number of childrenin child labour
Notes: The size of the bubbles is proportionate to the absolute number of children in child labour. The figure shows regional groupings used for SDG reporting. The region of Oceania is omitted because of low data coverage. For this reason, region-specific numbers do not add up to the global total.
Current situationTrends
2008 2012 2016 2020
Sub-Saharan Africa
25.3%
13.3%
10.0% 9.3%
8.8%
21.4%
7.4%
7.3%
22.4%
6.0%
5.6%
23.9%
Latin America and the Caribbean
Asia and the Pacific ServicesIndustry
Agriculture
Percentage distribution of children aged 5 to 17 years in child labour, by status at work
The agricultural sector accounts for the largest share of child labour worldwide
Percentage distribution of children aged 5 to 17 years in child labour, by sector of economic activity
Most children in child labour work within their own family unit
Child labour is more prevalent among boys than girls at every age
Percentage of children aged 5 to 17 years in child labour, by region
Asia and the Pacific and Latin America and the Caribbeanhave seen steady progress on child labour since 2008; similar progress has eluded sub-Saharan Africa
Number of children aged 5 to 17 years in child labour and hazardous work
Percentage of children aged 5 to 17 years in child labour, by age and sex
72.1%
17.3%
10.7%World
70.0%
10.3%
19.7%
World
Girls
Total
Boys
Girls
Total
Boys
Girls
Total
Boys
Girls
Total
Boys
5–11years
12–14years
15–17years
5–17years
8.4%
10.9%
9.7%
7.5%
11.0%
9.3%
6.6%
12.2%
9.5%
7.8%
11.2%
9.6%
Percentage and number of children aged 5 to 17 years in child labour, by region
Number of children aged 5 to 17 years in child labour, projected to the end of 2022
Global progress against child labour has stalled since 2016
Notes: The figure shows regional groupings used for ILO reporting. Comparable historical data prior to 2016 were not available for other regions.
Percentage and number of children aged 5 to 17 years in child labour and hazardous work
2000 2004
222.3million
245.5million
2008
215.2million
2012
168.0million
2016
151.6million
2020
160.0million
79.0million72.5
million
85.3million
115.3million
128.4million
170.5million
16.0%
14.2%13.6%
10.6%9.6% 9.6%
11.1%
8.2%7.3%
5.4%4.6% 4.7%
Child labourHazardous work
Children inchild labour,
160.0 million
Children inhazardous work,
79.0 million
© UNICEF/UNI274800/Soumaila
Note: Due to rounding, figures in percentages do not add up to 100 per cent.
12

Impact of COVID-19
Without mitigation measures, the number of children in child labour could rise from 160million in 2020 to 168.9 million by the end of 2022
If austerity measures or other factors cause a slippage in social protection coverage
Due to an increase in poverty and in the absence of additional mitigation measures
206.2million
168.9million
144.9million
If social protection coverage is increased
Child labour at a glance
Own-account workersEmployeesContributing family workers
We have made a promise to children to end child labour There is no time to lose
Worldwide, 160 million children are engaged in child labour; 79 million of them are performing hazardous work
Sub-Saharan Africa
Central andSouthern Asia
Northern Africa and Western Asia
Latin Americaand the
Caribbean Europe and NorthernAmerica
Eastern and South-Eastern Asia
23.9%86.6 million
5.5%26.3 million
7.8%10.1 million 6.0%
8.2 million2.3%
3.8 million
6.2%24.3 million
Sub-Saharan Africa stands out as the region with the highest prevalence and largest number of childrenin child labour
Notes: The size of the bubbles is proportionate to the absolute number of children in child labour. The figure shows regional groupings used for SDG reporting. The region of Oceania is omitted because of low data coverage. For this reason, region-specific numbers do not add up to the global total.
Current situationTrends
2008 2012 2016 2020
Sub-Saharan Africa
25.3%
13.3%
10.0% 9.3%
8.8%
21.4%
7.4%
7.3%
22.4%
6.0%
5.6%
23.9%
Latin America and the Caribbean
Asia and the Pacific ServicesIndustry
Agriculture
Percentage distribution of children aged 5 to 17 years in child labour, by status at work
The agricultural sector accounts for the largest share of child labour worldwide
Percentage distribution of children aged 5 to 17 years in child labour, by sector of economic activity
Most children in child labour work within their own family unit
Child labour is more prevalent among boys than girls at every age
Percentage of children aged 5 to 17 years in child labour, by region
Asia and the Pacific and Latin America and the Caribbeanhave seen steady progress on child labour since 2008; similar progress has eluded sub-Saharan Africa
Number of children aged 5 to 17 years in child labour and hazardous work
Percentage of children aged 5 to 17 years in child labour, by age and sex
72.1%
17.3%
10.7%World
70.0%
10.3%
19.7%
World
Girls
Total
Boys
Girls
Total
Boys
Girls
Total
Boys
Girls
Total
Boys
5–11years
12–14years
15–17years
5–17years
8.4%
10.9%
9.7%
7.5%
11.0%
9.3%
6.6%
12.2%
9.5%
7.8%
11.2%
9.6%
Percentage and number of children aged 5 to 17 years in child labour, by region
Number of children aged 5 to 17 years in child labour, projected to the end of 2022
Global progress against child labour has stalled since 2016
Notes: The figure shows regional groupings used for ILO reporting. Comparable historical data prior to 2016 were not available for other regions.
Percentage and number of children aged 5 to 17 years in child labour and hazardous work
2000 2004
222.3million
245.5million
2008
215.2million
2012
168.0million
2016
151.6million
2020
160.0million
79.0million72.5
million
85.3million
115.3million
128.4million
170.5million
16.0%
14.2%13.6%
10.6%9.6% 9.6%
11.1%
8.2%7.3%
5.4%4.6% 4.7%
Child labourHazardous work
Children inchild labour,
160.0 million
Children inhazardous work,
79.0 million
© UNICEF/UNI274800/Soumaila
Note: Due to rounding, figures in percentages do not add up to 100 per cent.
13
© U
NIC
EF/
UN
0390
908/
LeM
oyne
Introduction
14

15

Every day, Archie wakes at 5 a.m., gets dressed,
has breakfast and walks to work. There he squeezes
himself into a narrow gap to dig blindly for gold in a
deep underground pit, often underwater, breathing
through a hose connected to a diesel-powered
compressor. After 10 or 12 hours of labour, he
returns home, has some dinner and goes to sleep.
Archie is 11. Some of his young friends who work at
the pit haul sacks of sand and gravel weighing more
than they do, all day long.
Rafael, 12, sleeps in a shack in the woods. He does
not have much to eat, mainly rice and black beans.
He drinks from the water pit that he shares with the
bulls on the farm where he has been working for
five years, helping to pay off his father’s debt.
Taisha, 16, cooks breakfast, cleans the house
and cares for her grandmothers, which takes up
most of her day. With her school closed during the
COVID-19 pandemic, her chores have increased.
She tries to watch educational programmes on
television but does not have enough time to keep
up. As the only member of her family ever to go to
school, she gets very little support.
Around the world, 160 million children like Archie,
Rafael and Taisha toil in child labour today. At an
age when they should be nurtured and supported
through education, adequate health and social
protection, and enough play and leisure time, they
have to work instead. The reasons vary: poverty,
few options for education, little energy after work
to study or no role models. The consequences,
however, are sadly consistent. With tired bodies
and weary minds, their chances to learn and thrive
are diminished along with their prospects for a
bright future.
This report presents numbers that tell the story of
what children in child labour experience. It offers
evidence crucial to making decisions to fulfil
obligations, both moral and legal, to end child labour.
Issued during the United Nations International Year
for the Elimination of Child Labour, the report takes
stock of the global drive to end child labour and the
impact of the COVID-19 crisis. What it reveals is
alarming. Global progress against child labour has
stalled for the first time since 2000. Further, without
urgent mitigation measures, the current crisis will
likely push millions more children into child labour.
These results are an important reality check in
assessing prospects for ending child labour by
2025, in line with target 8.7 of the SDGs. If we do
not muster the will and resources to act now on an
unprecedented scale, the timeline for ending child
labour will stretch many years into the future.
Jointly published for the first time by the ILO and
UNICEF as co-custodians of target 8.7, the report
details the scale and characteristics of child labour
in the world today, and tracks its evolution over
time. Like estimates produced every four years
since 2000, the 2020 calculations are based on
the extrapolation of data from national household
surveys. The new estimates use data from more
than 100 household surveys covering two thirds of
the world’s population of children aged 5 to 17.
The remainder of the report is structured as follows.
The next section provides an overview of the 2020
global and regional estimates, and trends since
2000. The third section profiles child labour today,
considering the age, sex and residence of children
in child labour, the characteristics of the work they
perform, and how child labour interferes with their
education. The fourth section assesses the likely
impact of the COVID-19 crisis on child labour
through the end of 2022. The report concludes
with a discussion of key policy priorities to return
to a path of progress as we navigate the COVID-19
crisis and rebuild in its aftermath.
If we do not muster the will and resources to act now on an unprecedented scale, the timeline for ending child labour will stretch many years into the future.
16
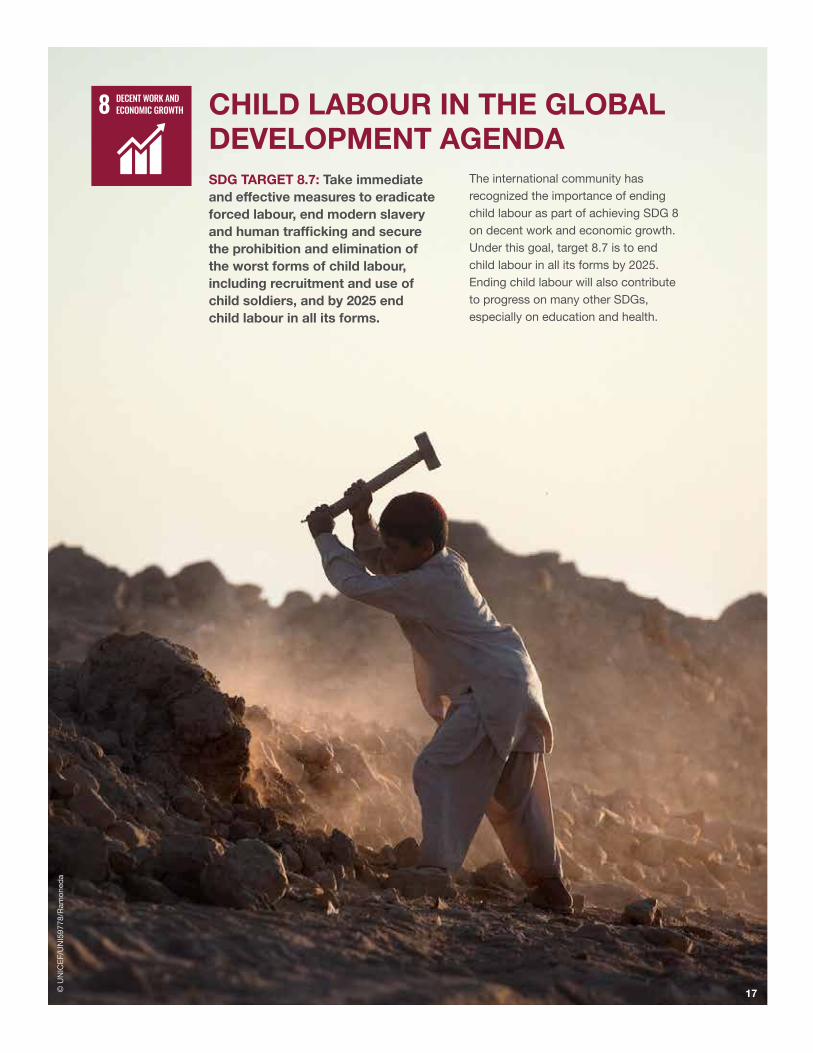
SDG TARGET 8.7: Take immediate and effective measures to eradicate forced labour, end modern slavery and human trafficking and secure the prohibition and elimination of the worst forms of child labour, including recruitment and use of child soldiers, and by 2025 end child labour in all its forms.
The international community has recognized the importance of ending child labour as part of achieving SDG 8 on decent work and economic growth. Under this goal, target 8.7 is to end child labour in all its forms by 2025. Ending child labour will also contribute to progress on many other SDGs, especially on education and health.
© U
NIC
EF/
UN
I597
78/R
amon
eda
CHILD LABOUR IN THE GLOBAL DEVELOPMENT AGENDA
17

Three main international human and labour rights
standards – the Convention on the Rights of
the Child, the ILO Minimum Age for Admission
to Employment Convention (No. 138) and the
universally ratified ILO Worst Forms of Child Labour
Convention (No. 182) – set legal boundaries for
child labour and provide grounds for national and
international actions to end it. In 2008, the 18th
International Conference of Labour Statisticians
approved a resolution on child labour statistics
that translates these legal standards into statistical
terms for measurement purposes.1 The statistical
concepts and definitions underpinning the 2020
estimates are consistent with this resolution.
Child labour comprises work that children are too
young to perform and/or work that, by its nature or
circumstances, is likely to harm children’s health,
safety or morals. In more technical terms, child
labour encompasses work performed by children
in any type of employment, with two important
exceptions: permitted light work for children within
the age range specified for light work; and work
that is not classified as among the worst forms of
child labour, particularly as hazardous work, for
children above the general minimum working age.
A broader statistical definition includes hazardous
unpaid household services, commonly referred to
as hazardous household chores.
Employment encompasses any form of market
production and certain types of non-market
production (principally that of goods such as
agricultural produce for own use). Employment
includes work in both the formal and informal
economy, inside and outside family settings, for pay
or profit (cash or in-kind, part-time or full-time) and
domestic work outside the child’s own household
for an employer (paid or unpaid).
The concept of permitted light work stems from
article 7 of ILO Convention No. 138, which states
that national laws or regulations may permit the
employment or work of persons from 13 years of
age (or 12 years in countries that have specified
the general minimum working age as 14 years)
in light work that is not likely to harm their health
© U
NIC
EF/
UN
I374
045/
Rom
enzi
Statistical concepts and definitions
18

or development. It should also not limit school
attendance, participation in vocational orientation
or training programmes, or the capacity to benefit
from instruction. For statistical measurement, light
work in this report includes employment and non-
hazardous work for less than 14 hours a week
performed by children aged 12 to 14.
The worst forms of child labour comprise
categories set out in article 3 of ILO Convention No.
182. These entail all forms of slavery or practices
similar to slavery, such as the sale and trafficking
of children, debt bondage and serfdom, and
forced or compulsory labour, including forced or
compulsory recruitment of children for use in armed
conflict; the use, procuring or offering of a child for
prostitution, for the production of pornography or
for pornographic performances; the use, procuring
or offering of a child for illicit activities, in particular
for the production and trafficking of drugs as
defined in the relevant international treaties; and
work that, by its nature or circumstances, is likely
to harm the health, safety or morals of children.
Hazardous work refers to work that, by its nature
or circumstances, is likely to harm children’s health,
safety or morals. When a country ratifies ILO
Convention No. 138 and ILO Convention No. 182,
they commit to determining their own hazardous
work list. While the list is decided by individual
countries after consultation with organizations of
employers and workers, the ILO Worst Forms of
Child Labour Recommendation, 1999 (No. 190),
supplementing ILO Convention No. 182, urges
consideration of work that exposes children
to physical, emotional or sexual abuse; work
underground, underwater, at dangerous heights
or in confined spaces with dangerous machinery,
equipment and tools, or that involves the manual
handling or transport of heavy loads; work in an
unhealthy environment that may, for example,
expose children to hazardous substances, agents
or processes or to temperatures, noise levels or
vibrations damaging to their health; and work
under particularly difficult conditions, such as for
long hours or during the night, or that does not
allow returning home each day. For statistical
measurement, in this report, hazardous work
includes that in designated hazardous industries
and/or hazardous occupations and/or that entails
43 hours or more per week.
Hazardous work by children is often treated as a
proxy category for the worst forms of child labour
for two reasons. First, reliable national data on the
worst forms of child labour other than hazardous
work, such as children in bonded and forced
labour or in commercial sexual exploitation, are still
difficult to find. Second, children in hazardous work
account for the overwhelming majority of those in
the worst forms of child labour.
Unpaid household services, or household chores,
refer to services children provide without pay for
their own households. These include caring for
household members, cleaning and minor household
repairs, cooking and serving meals, washing and
ironing clothes and transporting or accompanying
family members to and from work and school. In
more technical terms, these tasks constitute a ‘non-
economic’ form of production and are excluded
from consideration in the United Nations System
of National Accounts, the internationally agreed
guidelines for measuring national economic activity.
Hazardous unpaid household services involve
long hours, an unhealthy environment, unsafe
equipment or heavy loads and/or dangerous
locations. For statistical measurement, where
household chores are included in the calculation
of child labour in this report, hazardous household
chores refer to those performed by children below
the general minimum working age for 21 hours or
more per week.2 This broader definition is only used
in discussing differences in child labour by sex.
19

© U
NIC
EF/
UN
I617
48/R
amon
eda
Current levels and trends
20

GLOBAL AND REGIONAL OVERVIEW Child labour remains unacceptably common in the world today.
At the start of 2020, prior to the outbreak of the COVID-19
pandemic, 160 million children – 63 million girls and 97 million
boys – were in child labour, or 1 in 10 children worldwide.
Seventy-nine million children – nearly half of all those in child
labour – were in hazardous work directly endangering their
health, safety and moral development.
This global estimate masks large variations across regions. Child
labour prevalence stands at 24 per cent in sub-Saharan Africa,
three times that of Northern Africa and Western Asia, the region
with the second highest prevalence. In absolute terms, the nearly
87 million children in child labour in sub-Saharan Africa are more
than in the rest of the world combined.
Recent history provides cause for concern. In the last four years,
for the first time since 2000, the world did not make progress
in reducing child labour. The absolute number of children in
child labour increased by over 8 million to 160 million while
the proportion of children in child labour remained unchanged.
Children in hazardous work mirrored these patterns: The share
remained almost unchanged but the number rose by 6.5 million
to 79 million.
The pace of progress has varied dramatically across regions. The
proportion and number of children in child labour have declined
consistently since 20083 in Asia and the Pacific and Latin America
and the Caribbean. Similar progress has proved elusive in sub-
Saharan Africa, where child labour has actually gone up since
2012, a trend especially pronounced over the last four years
when the region accounted for much of the global increase.
At present, the world is not on track to eliminate child labour
by 2025. In order to meet this target, global progress would
need to be almost 18 times faster than the rate observed over
the past two decades. According to pre-COVID-19 projections
based on the pace of change from 2008 to 2016, close to 140
million children will be in child labour in 2025 without accelerated
action. The COVID-19 crisis is making these scenarios even more
worrisome, with many more children at risk of being pushed into
child labour.
Current levels and trends
21

Worldwide, 160 million children are engaged in child labour; 79 million of them are performing hazardous workFig 1. Number of children aged 5 to 17 years in child labour and hazardous work
Sub-Saharan Africa stands out as the region with the highest prevalence and largest number of children in child labourFig 2. Percentage and number of children aged 5 to 17 years in child labour, by region
Notes: The size of the bubbles is proportionate to the absolute number of children in child labour. The figure shows regional groupings used for SDG reporting. The region of Oceania is omitted because of low data coverage. For this reason, region-specific numbers do not add up to the global total.
Sub-Saharan Africa
Central and Southern Asia
Northern Africa and Western Asia Latin America and
the Caribbean
Europe and Northern America
Eastern and South-Eastern Asia
23.9%86.6 million
5.5%26.3 million
7.8%10.1 million 6.0%
8.2 million
2.3%3.8 million
6.2%24.3 million
Children in child labour,160.0 million
Children in hazardous work,79.0 million
22

2000 2004
222.3 million
245.5 million
2008
215.2 million
2012
168.0 million
2016
151.6 million
2020
160.0 million
79.0 million72.5 million
85.3 million
115.3 million
128.4 million
170.5 million
16.0%
14.2%13.6%
10.6%
9.6% 9.6%
11.1%
8.2%
7.3%
5.4%
4.6% 4.7%
© U
NIC
EF/
UN
I112
913/
Frou
tan
Global progress against child labour has stalled since 2016Fig 3. Percentage and number of children aged 5 to 17 years in child labour and hazardous work
Child labour
Hazardous work
23

Asia and the Pacific and Latin America and the Caribbean have seen steady progress on child labour since 2008; similar progress has eluded sub-Saharan Africa Fig 4. Percentage of children aged 5 to 17 years in child labour, by region
The number of children in child labour has increased in sub-Saharan Africa, while it has declined in other parts of the world Fig 5. Number of children aged 5 to 17 years in child labour, by region
2008 2012 2016 2020
113.6 million
65.1 million
14.1 million
59.0 million
12.5 million
77.7 million
62.1 million
10.5 million
70.0 million
48.7 million
8.2 million
86.6 million
2008 2012 2016 2020
Asia and the Pacific
Asia and the Pacific
Sub-Saharan Africa
Sub-Saharan Africa
Latin America and the Caribbean
Latin America and the Caribbean
25.3%
13.3%
10.0%
9.3%
8.8%
21.4%
7.4%
7.3%
22.4%
6.0%
5.6%
23.9%
Notes: The figure shows regional groupings used for ILO reporting. Comparable historical data prior to 2016 were not available for other regions.
Notes: The figure shows regional groupings used for ILO reporting. Comparable historical data prior to 2016 were not available for other regions.
24

Meeting the SDG target to eliminate child labour will require substantial acceleration Fig 7. Average annual rate of reduction in the percentage of children aged 5 to 17 years in child labour, observed and required for elimination
Notes: The observed average annual rates of reduction quantify the rate of progress in the prevalence of child labour over each period. A higher rate indicates faster progress. Required rates are calculated to illustrate rates necessary to end child labour by 2025 and 2030. These estimates do not take into account the possible impact of COVID-19. This figure shows regional groupings used for ILO reporting. Required rates could not be calculated for other regions due to the lack of historical data.
World
Latin America and the Caribbean
Asia and the Pacific
Sub-Saharan Africa
2000–2020
2008–2016
Observed:
Required for elimination by:
2025
2030
2.6%
4.4%
45.2%22.6%
4.0%35.8%
17.9%
7.3%
34.5%17.2%
1.5%
63.5%31.7%
Without accelerated action, close to 140 million children will be in child labour in 2025 and 125 million in 2030Fig 6. Projected number of children aged 5 to 17 years in child labour if progress from the 2008–2016 period continues
Notes: The projections build on trends in the percentage of children aged 5 to 17 years in child labour between 2008 and 2016, which is the period with the fastest reduction in child labour over the last two decades. They take into consideration demographic trends and show expected values if this progress were to continue. These estimates do not take into account the possible impact of COVID-19. The figure shows regional groupings used for ILO reporting. Required rates could not be calculated for other regions due to the lack of historical data.
2020 2025 2030
8.2 million
48.7 million
16.5 million
6.8 million
22.7 million5.3 million
86.6 million 88.9 million
33.4 million6.6 million
10.8 million
90.0 million
Asia and the Pacific
Sub-Saharan Africa
Latin America and the CaribbeanOther regions
25

What drives progress in reducing child labour?
Some insights come from looking at how regional
child labour patterns correlate with broader
demographic, economic and development trends.
Poverty reduction. Sub-Saharan Africa has
succeeded in reducing poverty in recent years
but levels remain high relative to other regions.
More than 40 per cent of the population in sub-
Saharan Africa still lives in extreme poverty.4
The region saw steady economic growth of over
2 per cent annually for all but one of the last five
years, but given rapid population growth, the
gross domestic product (GDP) per capita actually
declined and continues to be low relative to other
regions of the world.5 Rates of inequality remain
at persistently high levels in many sub-Saharan
African countries.6
Levels of informality. Regions making faster
progress in reducing child labour have had
greater success in reducing informal economic
© U
NIC
EF/
UN
I186
954/
Noo
rani
Explaining regional trends
26

activity although levels remain high. Many African
countries are improving the conditions of informal
workers7 but the region still lags behind in
transitioning to formality. Eighty-six per cent of
African jobs are in the informal economy, more
than any other region.8 Some of the worst labour
practices are clustered in the informal economy,
which is mostly unregulated. Informality is
associated with lower and less regular incomes,
inadequate and unsafe working conditions,
extreme job precarity and exclusion from social
security schemes, among other factors. All of these
can spur families to turn to child labour in the face
of financial distress.
Social protection. Despite progress in extending
social protection, coverage still falls short in all
regions in terms of universality and the adequacy
of benefits. A number of African countries have
made notable efforts,9 with spending on social
safety nets as a share of income equal to the world
average.10 The region as a whole, however, still has
much lower coverage than other regions. Only 17
per cent of the population in Africa is covered by at
least one social protection benefit, compared to 66
per cent in the Americas, 43 per cent in Asia and
the Pacific and 83 per cent in Europe and Central
Asia.11 Social protection in many cases determines
whether or not families resort to child labour.
Education exclusion. There has been a significant
net decline in children out of primary school in
recent years in all regions. Yet the gap in education
exclusion rates between sub-Saharan Africa and
other regions remains large.12 Although public
spending on education in sub-Saharan Africa as a
share of GDP has trended upwards in recent years,
it remains well below the world average.13
Population growth. Population growth patterns
influence child labour trends with stark differences
among regions. In Latin America and the
Caribbean, a drop in the number of children in child
labour by 6 million from 2008 to 2020 occurred
as the population aged 5 to 17 fell by 4.8 million.
Asia and the Pacific over the same period saw the
number of children in child labour decline by 64.9
million as the population aged 5 to 17 increased by
12.8 million. In sub-Saharan Africa, by contrast, the
child labour population grew by 21.5 million from
2008 to 2020, while the total population aged 5 to
17 rose by 104.8 million.14 Considering population
growth casts child labour in sub-Saharan Africa in
a very different light. The region has kept millions
of children out of child labour over the last 12
years even if it has not managed to keep pace with
population growth.
Other challenges. Multiple points of crisis con-
tribute to high levels of child labour in sub-Saharan
Africa. The region has the majority of fragile and
conflict-affected countries; at least one quarter
of all countries were fragile or in conflict in every
year from 2015 to 2020.15 Further, the region is
home to 39 per cent of the world’s refugees,
asylum seekers, returnees, stateless persons and
internally displaced persons, a higher share than
any other region.16 The Arab States region is also
particularly affected by crises linked to conflict and
state fragility.
The global HIV/AIDS pandemic also continues
to exact a disproportionate toll on sub-Saharan
Africa, which has the largest number of people
living with HIV and accounts for 59 per cent of
new infections.17 In addition, the region’s limited
resilience to climate change puts livelihoods at risk
and undercuts prospects for moving out of poverty.
Climate-related natural disasters, including floods
and droughts that cause large-scale crop and
livestock losses, occur with increasing regularity.
27

PROFILE OF CHILDREN IN CHILD LABOURChild labour across ages
The results of the global estimates make clear that
child labour remains an important concern across
the spectrum of children aged 5 to 17. Of the 160
million children in child labour, 89.3 million are young
children aged 5 to 11, 35.6 million are children aged
12 to 14, and 35 million are children aged 15 to 17.
Child labour among children aged 12 to 14 and 15 to
17 continued to fall in both absolute and percentage
terms over the last four years. By contrast, the
2016-2020 period saw a worrying rise in child
labour among young children aged 5 to 11. In 2016,
there were signs of slowing progress among young
children. Today the trend line is moving in the wrong
direction. The reason for backtracking is not clear
and needs to be investigated as a priority.
Hazardous work accounted for about two fifths
of the total number of additional children aged 5
to 11 in child labour during the four-year period.
While children of all ages must be protected from
hazardous work, its persistence and now growth
among younger children is a particular concern.
Boys and girls in child labour
Involvement in child labour is more common for
boys than girls at all ages. For children aged 5 to 17,
child labour prevalence is nearly one third higher for
boys. The gender gap grows with age, and boys are
roughly twice as likely as girls to be in child labour
in the 15 to 17 age range.
Comparisons of child labour estimates for boys and
girls must be accompanied by an important caveat.
The definition of child labour upon which the
estimates are based does not include involvement in
household chores in children’s own homes, an area
of work for which girls shoulder a disproportionate
burden of the responsibility in most societies.
The 2020 global estimates look for the first time
at how the inclusion of household chores affects
overall child labour estimates as well as estimates
of male child labour relative to female child labour.
The results are noteworthy. When the definition of
child labour is expanded to include involvement in
household chores for 21 hours or more per week,
child labour prevalence increases for both sexes,
but the rise in female child labour is much larger. As
a result, the gender gap in child labour prevalence
is reduced by almost half, from 2.8 percentage
points to 1.6 percentage points.
Child labour in rural and urban settings
Estimates of child labour by rural or urban
residence, available for the first time in the 2020
global estimates, indicate that child labour is much
more common in rural areas. The prevalence of
child labour there is about three times higher than
in urban areas. Child labour in rural economies
primarily takes place in agriculture.
© U
NIC
EF/
UN
0392
044/
Sat
u
28

The proportion of children in child labour is similar across age groups Fig 8. Percentage of children aged 5 to 17 years in child labour, by age
5–11 years 12–14 years 15–17 years
9.7%9.3% 9.5%
Sub-Saharan Africa has the highest share of young children in child labour, while Latin America and the Caribbean has the largest share of older children Fig 9. Percentage distribution of children aged 5 to 17 years in child labour, by age and region
55.8%
22.2%
21.9%35.0 million
35.6 million
89.3 million
World
60.0%
23.6%
16.4%
Sub-SaharanAfrica
54.0%
23.8%
22.3%
Northern Africaand Western Asia
50.7%
19.4%
29.9%
Central andSouthern Asia
54.2%
19.8%
26.0%
Eastern andSouth-Eastern Asia
37.9%
23.6%
38.5%
Latin Americaand the Caribbean
51.5%
20.0%
28.5%
Europe andNorthern America
15–17 years12–14 years5–11 years
Notes: Due to rounding, figures in percentages do not add up to 100 per cent and age-specific numbers do not add up to the global total. The figure shows regional groupings used for SDG reporting. The region of Oceania is omitted because of low data coverage. Caution is warranted when interpreting data for Europe and Northern America due to the small number of children in child labour.
29

Since 2008, child labour has declined steadily among children aged 12 and older; the last four years saw a worrying increase among younger childrenFig 10. Percentage of children aged 5 to 17 years in child labour, by age
2008 2012 2016 2020
10.7%
8.5% 8.3%
9.7%
17.0%
16.9%
13.0%
10.5% 9.5%
13.1%
11.7%
9.3%
5–11 years
15–17 years 12–14 years
© U
NIC
EF/
UN
I277
633/
Ber
ger
30

Child labour is more prevalent among boys than girls at every age Fig 11. Percentage of children aged 5 to 17 years in child labour, by age and sex
GirlsBoys GirlsBoys GirlsBoys GirlsBoys
5–11 years 12–14 years 15–17 years 5–17 years
8.4%
10.9%
7.5%
11.0%
6.6%
12.2%
7.8%
11.2%
Boys account for the largest share of children in child labour across all regionsFig 12. Percentage distribution of children aged 5 to 17 in child labour, by sex and region
World
BoysGirls
60.7%
39.3%
Sub-SaharanAfrica
56.1%
43.9%
Northern Africaand Western Asia
65.1%
34.9%
Central andSouthern Asia
67.5%
32.5%
Eastern andSouth-Eastern Asia
65.3%
34.7%
Latin Americaand the Caribbean
67.0%
33.0%
Europe andNorthern America
62.3%
37.7%
97.0 million
62.9 million
Notes: Due to rounding, sex-specific numbers do not add up to the global total. The figure shows regional groupings used for SDG reporting. The region of Oceania is omitted because of low data coverage. Caution is warranted when interpreting data for Europe and Northern America due to the small number of children in child labour.
31

Child labour has declined faster among girls than boysFig 13. Percentage of boys and girls aged 5 to 17 years in child labour, by sex
20082000 20122004 2016 2020
22.5%
23.4%
19.9%
21.3%
16.9%
21.4%
15.2%
18.1%
8.4%
10.7%
7.8%
11.2%Boys
Girls
© U
NIC
EF/
UN
0201
84/A
nmar
32

Child labour excluding household chores Child labour including household chores
BoysGirls
10.9%
12.5%
8.1%
10.9%
When household chores are taken into account, the gender gap in child labour prevalence narrowsFig 14. Percentage of children aged 5 to 14 years in child labour (including and excluding household chores performed for 21 hours or more per week), by sex
Notes: Household chores refer to services children provide without pay for their own households. These include caring for household members, cleaning and minor household repairs, cooking and serving meals, washing and ironing clothes, and transporting or accompanying family members to and from work and school. For statistical measurement, where household chores are included in the calculation of child labour, hazardous household chores refer to those performed by children below the general minimum working age for 21 hours or more per week.
© U
NIC
EF/
UN
0329
41/M
ukw
azhi
33

© U
NIC
EF/
UN
I771
57/H
olm
es
34

Child labour is more common in rural than in urban areas in almost all regions Fig 16. Percentage distribution of children aged 5 to 17 years in child labour, by residence and region
World
UrbanRural
Sub-SaharanAfrica
Northern Africaand Western Asia
Central andSouthern Asia
Eastern andSouth-Eastern Asia
Latin Americaand the Caribbean
Europe andNorthern America
76.7%82.1%
69.2%75.2% 75.2%
51.3% 47.3%
23.3%17.9%
30.8%24.8% 24.8%
48.7% 52.7%
37.3 million
122.7 million
The prevalence of child labour in rural areas is close to three times higher than in urban areas Fig 15. Percentage of children aged 5 to 17 years in child labour, by residence and sex
UrbanRural
Total Boys Girls
13.9%
11.6%
4.7%3.6%
5.7%
16.1%
Notes: The figure shows regional groupings used for SDG reporting. The region of Oceania is omitted because of low data coverage. Caution is warranted when interpreting data for Europe and Northern America due to the small number of children in child labour.
35

© U
NIC
EF/
UN
I116
799/
Frie
dm
an-R
udov
sky
36
CHARACTERISTICS OF CHILD LABOURMost child labour – for boys and girls alike – occurs in
agriculture. This is especially the case among younger
children, for whom agriculture often serves as an entry
point. Child labour takes place in family subsistence
and smallholder farming, commercial plantations and
other forms of commercial farming, agro-industrial
complexes, capture fisheries, aquaculture, post-
harvest fish processing and forestry.
Services and industry account for smaller but still
substantial shares of children in child labour. In
services, child labour includes domestic work and
work in commerce, transport and motor vehicle
repair. Child labour in industry comprises work in
construction, mining and manufacturing. While
agriculture has roughly equal shares of boys and
girls in child labour, a greater degree of gender
specialization occurs in services and industry. Girls
in child labour are much more likely to be in services,
including domestic work, and boys are more prone to
be in industry.
The sectoral composition of child labour differs
considerably across regions, although agriculture
accounts for the largest share everywhere. In sub-
Saharan Africa, agriculture plays the most important
role, accounting for over four of every five children
in child labour. Shares in services and industry are
higher in other regions, but only two, Latin America
and the Caribbean and Europe and Northern
America, have combined shares of these two sectors
exceeding that of agriculture. Not coincidently, these
two regions have the highest shares of children aged
15 to 17 in the overall child labour population.
Child labour is frequently hazardous wherever it takes
place, with many variations. In family smallholder
and commercial farming, common hazards include
exposure to inorganic fertilizers, pesticides and other
dangerous agrochemicals; physically strenuous
tasks such as carrying heavy loads; long periods of
standing, stooping and bending, and repetitive and
forceful movements in awkward body positions;
exposure to extreme temperatures; use of dangerous
cutting tools such as machetes and scythes; and
use of and exposure to farm vehicles and heavy farm
machinery.18 In capture fisheries, children can face
prolonged periods at sea, away from their families,
in situations of extreme vulnerability stemming from
their isolation on the fishing vessel, the tasks they
must perform, and the dangers of inclement weather
and extreme temperatures, among others.19
Artisanal and small-scale mining can force children
to work in deep underground shafts, haul heavy
loads of rock and use toxic chemicals to separate
minerals or precious metals from ore.20 The isolated
nature of domestic work renders children particularly
vulnerable to physical, verbal and sexual abuse.
Street vending hazards can include night work,
exposure to traffic and motor vehicle exhaust fumes
and, in extreme cases, the risk of being drawn into
illicit activities.
These are just a few examples of countless hazards
that children in child labour may confront, all of which
must be urgently addressed in line with the universally
ratified ILO Convention No. 182.
The largest share of child labour takes place within
the family, where hazardous work accounts for
a substantial portion, counter to the common
perception of the family as a safer working
environment. In sub-Saharan Africa, 82 per cent of
all child labour occurs within the family. The relative
importance of family work has grown in the last four
years, reflecting the growth in the shares of young
children and African children in the overall child
population. Both groups are especially likely to
engage in family work.
37

The agricultural sector accounts for the largest share of child labour worldwide Fig 17. Percentage distribution of children aged 5 to 17 years in child labour, by sector of economic activity, age and sex
Domestic workOther servicesIndustryAgriculture
70.0%76.6% 75.8%
47.6%
70.3% 69.9%
10.3%6.0% 7.5%
24.0%
5.5%13.4%
15.2% 12.8% 13.7%
22.8%17.3%
13.8%
4.5% 4.6% 3.0% 5.7% 6.9% 2.9%
5–17 years 5–11 years 12–14 years 15–17 years Girls Boys
Total Age Sex
The sectoral composition of child labour varies considerably across regions Fig 18. Percentage distribution of children aged 5 to 17 years in child labour, by sector of economic activity and region
World Sub-SaharanAfrica
Northern Africaand Western Asia
Central andSouthern Asia
Eastern andSouth-Eastern Asia
Latin Americaand the Caribbean
Europe andNorthern America
ServicesIndustryAgriculture
70.0%81.5%
61.5% 58.7% 56.5%48.7% 44.1%
10.3%
5.3%
11.1% 17.9%16.1%
17.0%16.8%
19.7%13.2%
27.4% 23.4% 27.3%34.4% 39.1%
31.4 million
16.5 million
112.1 million
Notes: Due to rounding, figures in percentages do not add up to 100 per cent. The figure shows regional groupings used for SDG reporting. The region of Oceania is omitted because of low data coverage. Caution is warranted when interpreting data for Europe and Northern America due to the small number of children in child labour.
Note: Due to rounding, figures in percentages do not add up to 100 per cent.
38
© U
NIC
EF/
UN
I816
47/P
irozz
i
39

© U
NIC
EF/
UN
I184
596/
Gril
e
Worldwide, 7.1 million children are engaged in forms of domestic work that constitute child labour Fig 19. Number of children aged 5 to 17 years in child labour in domestic work, by age and sex
15-17 years12-14 years5-11 years
4.4 million
Girls2.8 million
1.2million
Boys
0.6million
2.5 million
0.8million
0.4million
1.6million
Note: Due to rounding, age-specific numbers for girls do not add up to the total.
40
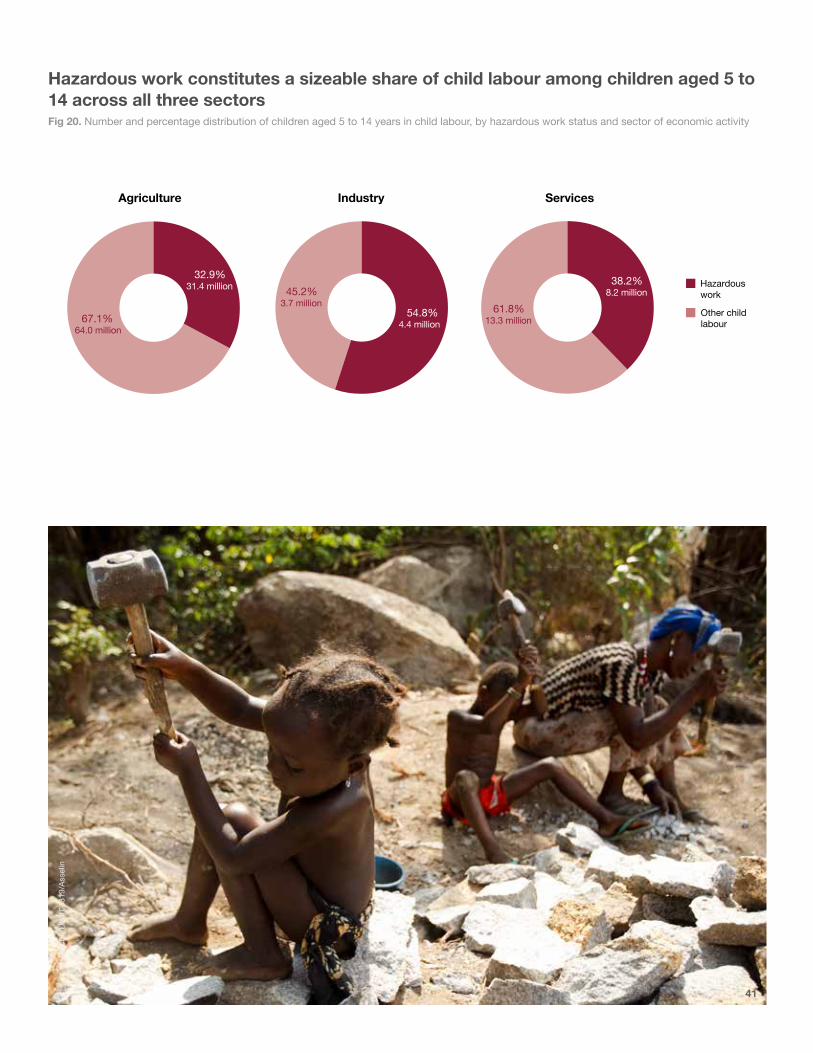
Hazardous work constitutes a sizeable share of child labour among children aged 5 to 14 across all three sectors Fig 20. Number and percentage distribution of children aged 5 to 14 years in child labour, by hazardous work status and sector of economic activity
Hazardouswork
Other childlabour
Agriculture Industry Services
32.9%31.4 million
67.1%64.0 million
54.8%4.4 million
45.2%3.7 million
38.2%8.2 million
61.8%13.3 million
© U
NIC
EF/
UN
I108
319/
Ass
elin
41

© U
NIC
EF/
UN
0401
745/
Faze
l
The sectoral composition of child labour changed only marginally between 2016 and 2020Fig 21. Percentage distribution of children aged 5 to 17 years in child labour, by sector of economic activity
70.9%
70.0%
11.9%
10.3%
17.2%
19.7%
2016
2020
ServicesIndustryAgriculture
42

Most children in child labour work within their own family unit Fig 22. Percentage distribution of children aged 5 to 17 years in child labour, by status at work, age and sex
Own-account workersEmployeesContributing family workers
72.1%82.6%
74.5%
42.8%
77.1%68.8%
17.3%
9.2%
12.9%
42.3%
12.4%20.4%
10.7% 8.2% 12.6% 15.0% 10.5% 10.8%
5–17 years 5–11 years 12–14 years 15–17 years Girls BoysTotal Age Sex
Family work predominates across all regions Fig 23. Percentage distribution of children aged 5 to 17 years in child labour, by status at work and region
Own-account workersEmployeesContributing family workers
72.1%82.4%
63.5% 60.6% 61.1%49.9%
57.1%
17.3%7.3%
26.9%24.4%
29.5%42.1%
36.4%
10.7% 10.2% 9.7%15.0%
9.4% 8.0% 6.5%
World Sub-SaharanAfrica
Northern Africaand Western Asia
Central andSouthern Asia
Eastern andSouth-Eastern Asia
Latin America and the Caribbean
Europe andNorthern America
17.0 million
27.6 million
115.3 million
Notes: Due to rounding, figures in percentages do not add up to 100 per cent and numbers do not add up to the global total. The figure shows regional groupings used for SDG reporting. The region of Oceania is omitted because of low data coverage. Caution is warranted when interpreting data for Europe and Northern America due to the small number of children in child labour.
Note: Due to rounding, figures in percentages do not add up to 100 per cent.
43

A significant share of child labour within the family is hazardous Fig 24. Percentage distribution of children aged 5 to 14 years in hazardous work and other forms of child labour, by status at work and age
28.6%36.3%
23.6%
47.2%
74.1%
49.5%
71.4%63.7%
76.4%
52.8%
25.9%
50.5%
Contributing family workers
Employees Own-accountworkers
Contributing family workers
Employees Own-accountworkers
5–11 years 12–14 years
Hazardouswork
Other forms of child labour
© U
NIC
EF/
UN
I880
65/C
rouc
h
44
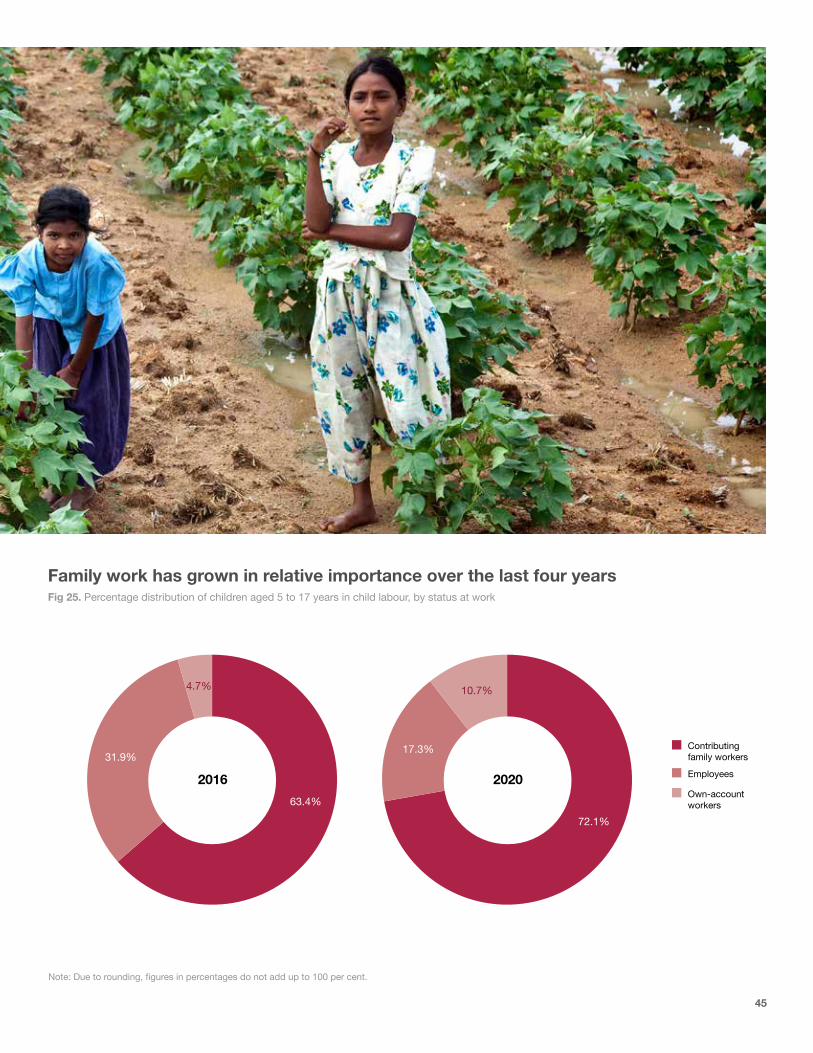
Family work has grown in relative importance over the last four years Fig 25. Percentage distribution of children aged 5 to 17 years in child labour, by status at work
Own-account workers
Employees
Contributing family workers
2016 202063.4%
31.9%
4.7%
72.1%
17.3%
10.7%
Note: Due to rounding, figures in percentages do not add up to 100 per cent.
45

© U
NIC
EF/
UN
I148
471/
Rom
ana
46
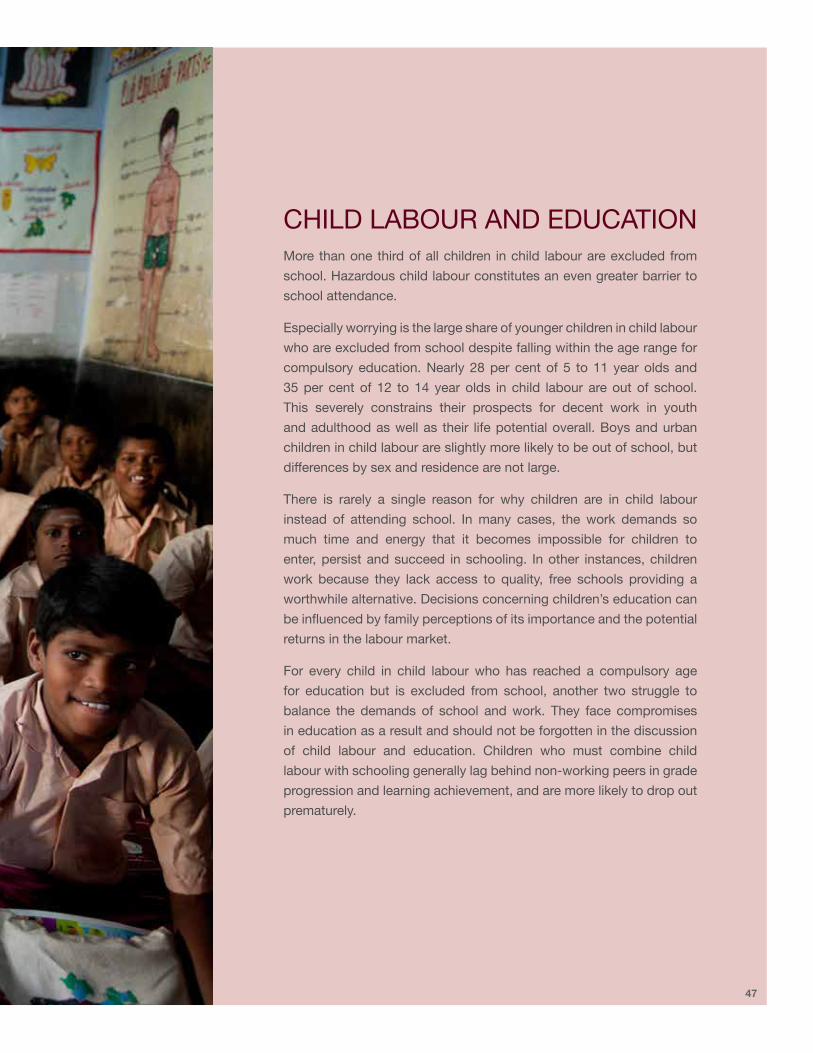
CHILD LABOUR AND EDUCATIONMore than one third of all children in child labour are excluded from
school. Hazardous child labour constitutes an even greater barrier to
school attendance.
Especially worrying is the large share of younger children in child labour
who are excluded from school despite falling within the age range for
compulsory education. Nearly 28 per cent of 5 to 11 year olds and
35 per cent of 12 to 14 year olds in child labour are out of school.
This severely constrains their prospects for decent work in youth
and adulthood as well as their life potential overall. Boys and urban
children in child labour are slightly more likely to be out of school, but
differences by sex and residence are not large.
There is rarely a single reason for why children are in child labour
instead of attending school. In many cases, the work demands so
much time and energy that it becomes impossible for children to
enter, persist and succeed in schooling. In other instances, children
work because they lack access to quality, free schools providing a
worthwhile alternative. Decisions concerning children’s education can
be influenced by family perceptions of its importance and the potential
returns in the labour market.
For every child in child labour who has reached a compulsory age
for education but is excluded from school, another two struggle to
balance the demands of school and work. They face compromises
in education as a result and should not be forgotten in the discussion
of child labour and education. Children who must combine child
labour with schooling generally lag behind non-working peers in grade
progression and learning achievement, and are more likely to drop out
prematurely.
47

Children engaged in hazardous work are even less likely to attend school Fig 27. Percentage of children aged 5 to 17 years in hazardous work not attending school, by age, sex and residence
Over one third of children in child labour are out of school Fig 26. Percentage of children aged 5 to 17 years in child labour not attending school, by age, sex and residence
Rural Urban5-17 years 5-11 years 12-14 years 15-17 years
Total Age
GirlsBoys
Sex Residence
35.0%
27.7%
35.2%
53.2%
36.3%32.8%
34.8% 35.5%
Rural Urban5-17 years 5-11 years 12-14 years 15-17 years
Total Age
GirlsBoys
Sex Residence
43.6%
33.0%
40.2%
53.2%
45.5%
40.3%43.6% 43.7%
48

Across all regions, significant shares of children in child labour are out of school Fig 28. Percentage of children aged 5 to 14 years in child labour not attending school, by region
Notes: The figure shows regional groupings used for SDG reporting. The region of Oceania is omitted because of low data coverage. The region of Europe and Northern America is omitted because of the low levels of children in child labour and out of school.
© U
NIC
EF/
UN
I236
036/
Noo
rani
Central and Southern Asia35.3%
Latin America and the Caribbean15.5%
Eastern and South-Eastern Asia37.2%
Northern Africa and Western Asia28.1%
Sub-Saharan Africa28.1%
49

CHILD LABOUR, NATIONAL INCOME AND STATE FRAGILITYThe percentage of children in child labour is
highest in low-income countries. This is not
surprising given a strong two-way link between
child labour and national income. High levels
of child labour hinder current income growth
by reducing unskilled wages and discouraging
skill-intensive technologies. They also dampen
future growth by interfering with children’s
education and physical development, leading
to a less productive adult workforce. Rising
national incomes improve the ability of families
to make adequate livelihoods and cope with
shocks without resorting to child labour.21
Child labour is by no means strictly a low-
income country problem, however. Three
of every five children in child labour live in
middle-income countries. For greater national
wealth to translate into reduced child labour,
economic growth must be inclusive and its
benefits equitably distributed. The tax revenues
it generates must be invested in programmes
and services that make a difference for children,
above all in education and social protection.
That large pockets of child labour persist even
in relatively rich countries points to important
remaining policy challenges.
Countries with high levels of institutional and
social fragility22 tend to have more child labour,
triple the global average. While this simple
correlation should not be overinterpreted, it
underscores the importance of stability, policies
for social inclusion and equity, and robust
public institutions to prevent child labour.
© U
NIC
EF/
UN
I198
335/
Qua
rmyn
e
50

Yet more than half of all child labour occurs in middle-income countries Fig 30. Number and percentage distribution of children aged 5 to 17 years in child labour, by national income group
Not surprisingly, child labour is most prevalent in low-income countries Fig 29. Percentage of children aged 5 to 17 years in child labour, by national income group
Notes: Low-income countries had a gross national income (GNI) per capita in 2020 of $1,045 or less, lower-middle-income countries of between $1,046 and $4,125, upper-middle-income countries of between $4,126 and $12,735, and high-income countries of $12,736 or more. Calculations used the World Bank Atlas method.
Notes: Low-income countries had a GNI per capita in 2020 of $1,045 or less, lower-middle-income countries of between $1,046 and $4,125, upper-middle-income countries of between $4,126 and $12,735, and high-income countries of $12,736 or more. Calculations used the World Bank Atlas method. Due to rounding, figures in percentages do not add up to 100 per cent.
Lower-middle income 69.7 million, 43.6%
Low income 65.0 million, 40.7%
Upper-middle income23.7 million, 14.8%
High income1.6 million, 1.0%
Low income High incomeLower-middle income Upper-middle income
26.2%
9.0%
4.9%0.9%
51

Child labour in situations of fragility is three times higher than the world average Fig 31. Percentage of children aged 5 to 17 years in child labour, worldwide and in countries with high levels of institutional and social fragility
© U
NIC
EF/
UN
0643
59/F
eyiz
oglu
Notes: According to the Revised Classification of Fragility and Conflict Situations for World Bank Group Engagement, fragile countries are defined as those with one or more of the following: (a) the weakest institutional and policy environment (as measured using a set of 16 criteria grouped into four clusters: economic management, structural policies, policies for social inclusion and equity, and public sector management and institutions); or (b) the presence of a UN peacekeeping operation, since this reflects a decision by the international community that a significant investment is needed to maintain peace and stability there; or (c) flight across borders of 2,000 or more per 100,000 population, who are internationally regarded as refugees in need of international protection, as this signals a major political or security crisis. Countries satisfying these criteria and also engaged in medium- or high-intensity conflicts are not considered, since such countries have gone beyond fragility.
Fragile countries World
30.9%
9.6%
52

Child labour declines as the level of human development increases Fig 32. Percentage of children aged 5 to 17 years in child labour, by the Human Development Index
24.8%
7.5%5.6%
2.9%
Low Medium High Very high
Notes: Countries are grouped into four categories according to the 2019 Human Development Index, which links measures of education, health and income. The ranges are: very high (0.800 or greater), high (0.700–0.799), medium (0.550–0.699) and low (less than 0.550).
53
© U
NIC
EF/
UN
0464
173/
Suj
an
The impact of COVID-19
54

The intersection of the COVID-19 pandemic with child
labour globally offers substantial cause for concern. In
2020, the pandemic increased the number of children in
income-poor households by an estimated 142 million,
adding to the 582 million children already in poverty
in 2019.23 Their families have suffered job and income
losses, seen cuts in remittances and experienced a
host of other shocks.
In such circumstances, a large body of evidence affirms
that families may turn to child labour as a coping
mechanism.24 School closures during lockdowns
add to the risks, especially for children in vulnerable
situations, as they are even more likely to work when
going to school is not a viable option. When children
leave school and enter paid employment, it can be very
difficult for them to resume their education.25
Growing anecdotal evidence sheds light on how the
COVID-19 crisis is affecting children. Human Rights
Watch, for example, collected testimonies from 81
children in Ghana, Nepal and Uganda who have been
newly pushed into child labour or endure more difficult
work circumstances. Some indicated that their families
no longer had sufficient food and they were working
to get enough to eat. Children said that their work was
frequently long and arduous – one third in each country
had to work for at least 10 hours a day, and some
described working for as many as 16 hours. Those
already working before the crisis struck said they were
working more since the closure of schools.26
Other accounts are emerging around the world. An
International Cocoa Initiative assessment of 263
communities in Côte d’Ivoire found a significant
increase in child labour in cocoa businesses from July
to September 2020 compared to the same period 12
months earlier.27 Data from Ecuador indicated a more
than one-third rise in child labour prevalence since the
pandemic began.28 In Egypt, children are reportedly
being sent to work in cotton cultivation and other
agricultural work.29 In São Paulo, Brazil, child labour
increased by 26 per cent between May and July 2020
in households assisted by UNICEF.30
55

Several reports have emphasized school closures
as driving child labour. In a survey of eight West
African countries, children consistently reported
working because there was no school. They said
that their presence at home raised the expectation
that they should work to help their families, which
made distance learning difficult even when it was
available.31 In Burkina Faso, reports of more children
working alongside their parents in granite mining have
indicated that this is in part because their parents did
not want to leave them at home unsupervised during
school closures.32
The impact of the pandemic on child labour,
however, does not always fit common assumptions.
Preliminary analysis of the limited number of
countries with survey data from before and after
the pandemic suggests that the most common
immediate effect has been a decline in children’s
involvement in economic activity.33 The large-scale
destruction of jobs arising from the lockdowns
and from the fall-off in demand in some economic
sectors appears, at least in these countries, to have
affected jobs performed by children. These results,
however, refer to children’s economic activity, which
is a broader concept than child labour as it includes
permitted forms of children’s work. The results also
relate primarily to older children, aged 15 to 17, in
middle-income countries.
A modelling exercise provides further insights into
the likely near-term impact of COVID-19 on child
labour. Based on a simple model that uses the
latest poverty projections to predict changes in
child labour up to 2022,34 it suggests that the net
effect of the pandemic during this period is likely to
be a substantial additional rise in child labour. Any
immediate decline due to disruptions in the broader
labour market is likely to be significantly outweighed
by a poverty-driven rise in child labour over a slightly
longer time horizon.
The model predicts 8.9 million more children in child
labour by the end of 2022. Young children aged 5
to 11 account for over half (4.9 million) of the total
predicted additional children in child labour. This
escalation reflects only the poverty effects of the
crisis; the calculation likely understates the total
impact of COVID-19 on child labour, such as through
unprecedented disruptions to children’s education.
Yet the increase in child labour is by no means a
foregone conclusion. In addition to the ‘baseline’
scenario reported above, in which social protection
remains constant, two additional scenarios were
considered. Both demonstrate the substantial
influence of social protection coverage on child
labour. In the first ‘downside’ scenario, social
protection coverage slips from the current level in each
national income group by an amount proportional to
the standard deviation of current coverage levels
in each group (Table 1). In the second ‘mitigated’
scenario, the opposite occurs. Globally, the goal for
social protection is much more ambitious, calling for
nationally appropriate social protection systems and
measures, including social protection floors, for all.
The results are dramatic. Extending social protection
by the amounts specified in Table 1 would reduce
the number of children in child labour by 15.1 million
by the end of 2022, more than offsetting the impact
of COVID-19 and accelerating progress towards
ending child labour altogether. If austerity measures
or other factors cause a slippage in coverage, again
by the amounts specified in Table 1, the outlook will
worsen. A predicted 46.2 million additional children
would enter child labour through the end of 2022. In
both scenarios, the biggest changes occur among
the youngest children in child labour. The potential
for expanding social protection for children, through
universal child benefits and other means, is further
explored in the final chapter of this report.
56

Income group
Average social protection
coverage level, percentage
Standard deviation,
percentage
Adjusted coverage levels, percentage
Percentage point change in
coverageMitigated scenario
Downside scenario
Low income 11.0 6.7 11.7 10.3 +/- 0.7
Lower-middle income 29.8 22.0 36.4 23.2 +/- 6.6
Upper-middle income 49.0 22.7 60.1 37.9 +/- 11.1
High income 78.1 25.4 97.9 58.3 +/- 19.8
Table 1
Adjustments in social protection coverage in the mitigated and downside scenarios
Without mitigation measures, 8.9 million more children will likely be engaged in child labour by the end of 2022 Fig 33. Number of children aged 5 to 17 years in child labour, observed and projected
168.0 million
151.6 million160.0 million
2012 2016 2020 2022
206.2 million
168.9 million
144.9 million
If austerity measures or other factors cause a slippage in social protection coverage
Due to an increase in poverty and in the absence of additional mitigation measures
If social protection coverage is increased
(downside scenario)
(mitigated scenario)
57

For once, we can be celebratory. In August 2020, the Worst Forms of Child Labour Convention (No. 182) became the first ILO convention ratified by all member states. This historic first means that all children now have legal protection against the worst forms of child labour. Importantly, this may also mark the beginning of the end of child labour as we know it.
The challengeThe ILO’s work on child labour for the first 60 years or so focused on the adoption of conventions on the minimum age for admission to employment in specific industries or occupations, culminating in the Minimum Age for Admission to Employment Convention (No. 138) in 1973. But the record of ratification and implementation through national laws and practices remained disappointing. Even the much acclaimed and comprehensive ILO Convention No. 138 was, by the 1990s, ratified by only 49 countries, mostly industrialized, with a few from Africa and Latin America. None were from Asia where half the world’s child workers were found. It was clear by the mid-1990s that the ILO had reached a cul-de-sac of sorts.
ILO Convention No. 138 was a marvellous intellectual construct – long on vision and robust in its conception
and practical relevance in a world with varying levels of development and cultures. It was explicit in its goal and held the moral high ground in calling for the eventual abolition of child labour. It was a model par excellence in its realism and conception as an international legal instrument. It gave a central recognition to differences in economic conditions and the reality of resource constraints and to the determination of varying minimum ages for employment to guide national policy. One seldom finds an international convention with such an elegant intellectual architecture, simple in its stated objective but quite varied and rich in its articulation of obligations and guidelines for action. Yet this richness was also one of the major reasons for its low and slow ratification. Even where there was political will, policymakers were overwhelmed by the enormity of the problem, the magnitude of the task and the challenge of where to begin.
The worst forms of child labour: A strategic breakthrough While progress in ratifying ILO Convention No. 138 stalled, by the mid-1990s, the worldwide movement against child labour had gained considerable strength and momentum. There was new recognition that the problem was vast and morally reprehensible, and that
The journey to universal ratification of the ILO Worst Forms of Child Labour Convention
© U
NIC
EF/
UN
0777
98/B
ona
58

it was bad not only for children and families but also
for society at large. All sides appreciated the need for
action and the challenges it posed. Advocates of total
abolition were growing sympathetic to the concerns
of the less developed countries and their constrained
capacity for action. For their part, developing countries
were becoming more concerned about growing
international pressure, especially as child labour came
to be an increasingly important consideration in trade
negotiations and a prominent item on the human
rights agenda. There was thus a need to find common
ground for global action. The question was, what and
how? Perhaps more specifically, where to begin? The
converging view and conclusion were simple, now so
obvious but at the time quite radical: first things first.
This led to a proposal for a convention that espoused
priority national and global actions on the worst forms
of child labour.
A major concern among many advocates was the
possibly negative impact of the proposed convention on
the overall objective to abolish child labour in general
and ratify ILO Convention No. 138 in particular. Although
there was considerable apprehension, there was finally
an overwhelming consensus that a new convention on
the worst forms of child labour would not only reinforce
and accelerate the campaign against child labour but
also give impetus to the ratification of ILO Convention No.
138, the most important and foundational international
instrument on the subject.
The discussions and debates surrounding the draft
proposal were on the whole smooth. There were no
fundamental changes. The ILO had been considering
use of the terms ‘extreme’ or ‘intolerable’ forms of
child labour but the International Labour Conference
Committee decided to call the new instrument, in
retrospect wisely, the Worst Forms of Child Labour
Convention. The result was a well-conceived, logically
structured and clearly written draft.
Even so, no one dreamed of what would happen later. The
Convention was adopted unanimously, without a single
abstention, a first in the ILO’s history. The thunderous
applause and spontaneous explosion of joy that saw
committee members hugging on the conference floor
were probably unique in the history of the organization.
What followed has been an even greater surprise – the
universal ratification of the Convention. It is a journey and
a milestone that should be celebrated, for ratification is
far more than a symbolic act. When a country ratifies ILO
Convention No. 182, it commits to taking immediate and
effective measures to prohibit and eliminate the worst
forms of child labour. Ratification is thus a powerful
stimulus to action.
What of the future?
Universal ratification of ILO Convention No. 182 is one
important step in the global effort against child labour.
Yet it is only one step. We must also defend and promote
ILO Convention No. 138 to achieve universal ratification
of this foundational instrument on child labour. And we
must continue the hard work of implementing these
conventions, everywhere, all together.
The challenge of child labour continues, in old forms and
new. There are still many pockets of exploitation and
abuse that remain hidden, such as child domestic work
and child trafficking. There are also emerging problems of
sexual abuse and exploitation associated with the reach
of the Internet and other new technologies. Children will
remain vulnerable for one reason or another. It is our
duty to stay vigilant and establish mechanisms to detect,
monitor and take effective action for their protection.
Poverty remains a persistent and ever-present danger,
to borrow from the language and spirit of the ILO 1944
Declaration of Philadelphia concerning the aims and
purposes of the International Labour Organisation.35 We
have to think big and have the courage to envision a
world free from child poverty, one that provides social
protection for all from cradle to grave. Only then will
children truly be protected from the scourge of child
labour.
Assefa Bequele Assefa Bequele was the representative of the ILO Director-General on the International Labour Conference Committee that finalized the Worst Forms of Child Labour Convention.
59

The road forward
© U
NIC
EF/
UN
I235
404/
Noo
rani
60

We are at a critical juncture in the worldwide drive to
stop child labour. Global progress has ground to a
halt over the last four years after slowing considerably
in the four years before that. COVID-19 threatens
to further erode past gains. While nearly 86 million
fewer children are in child labour now than when
we began measuring the phenomenon globally in
2000, recent trends affirm we have fallen far behind
on our collective commitment to ending all forms
by 2025. In 2021, the United Nations International
Year for the Elimination of Child Labour, we must
urgently put progress back on track.
A first imperative is to prevent further regression
amid the COVID-19 crisis. The pandemic has clearly
heightened the threat of child labour.36 This stems
from a sharp rise in poverty and school closures
that have denied families logical alternatives. To
reduce these risks, expanded income support
measures for families in situations of vulnerability,
through child benefits and other means, will be
critical. So are back-to-school campaigns and
stepped up remedial learning that bring children
back to classrooms and help them make up for lost
learning, as conditions permit.
An evidence-based policy roadmapAs the world seeks to respond to and build forward
from the COVID-19 crisis, we should not lose sight
of broader policy measures to end child labour.37
Extending social protection can mitigate the poverty
and economic uncertainty that underlie child labour,
while investing in free, good-quality schooling can
provide a viable alternative and open doors to a
better future. Every birth should be registered so
that children have a legal identity and can enjoy their
rights from birth. Expanding decent work would
deliver a fair income for all adult workers and their
families, including those in the informal economy
where vulnerability to child labour is greatest. A
cross-section of policies should recognize the
equal worth of girls and boys and tackle harmful
gender norms. And necessary laws and regulations
must be in place to protect children, backed by
enforcement and child protection systems to apply
them. Information and communication technology
can be leveraged in efforts across all these areas.
The pandemic has made such actions more urgent
even as governments are grappling with growing
budgetary pressure. Much depends on making
sound policy choices and resource allocation
decisions. Strengthening national evidence on
child labour can help to identify local priorities and
guide policy and spending choices. Social dialogue
among governments and employers’ and workers’
organizations is essential to shape responsive
policies to address child labour and related
challenges wherever they occur.
While governments can and should adopt resource
mobilization strategies to expand their fiscal space,38
the profound impact of the pandemic further
increases the urgency of international support
to help fill the financing gap. Many industrialized
countries still fall short on their long-standing
commitment to ODA and to financing sustainable
development.39 This needs to change. Debt relief
should be extended and debt restructured in heavily
indebted countries so that increasing debt service
payments do not crowd out social spending.40 We
must avoid the mistakes of the past, where urgently
needed credit flows hinged on austerity measures
that cut essential services and inflicted enduring
harm on children and families in greatest need.
Make social protection universal Most children who work do so because their families
depend on their wages, production or domestic
work (including unpaid, often by girls) to make ends
meet. Household economic shocks and the loss of
a parent or caregiver can increase the chance that
a child will go to work.41 Even before the COVID-19
pandemic, nearly one in three children in low- and
middle-income countries lived in families below
national poverty lines. The pandemic exacerbated
child poverty, with the number of children in
income-poor households increasing by over 142
million in 2020.42
Adequate social protection mitigates the socio-
economic vulnerability underpinning child labour43
and offsets poverty, gender inequality and
deprivation in childhood.44 Yet even before the
pandemic, nearly three quarters of children, 1.47
61

billion, lacked social protection.45 Despite the
unprecedented social protection response to the
COVID-19 crisis,46 most measures are temporary
and insufficiently sensitive to children and gender.47
Few, if any, address the heightened risks of child
labour among children forced to move or affected
by disabilities, among other vulnerable groups.
Universal child benefits offer one critical component
of the solution. Defined as cash (or tax) transfers
provided on a regular basis to all families with
children, these benefits are a simple and proven
means of cushioning children and their families from
poverty and improving access to education and
health care. They can incentivize birth registration,
making children and their physical whereabouts
more visible to state institutions,48 and can con-
tribute to integrated social and child protection
systems. As children grow, benefit payments can
be linked with care services and provide further
incentives for families to stay in contact with state
institutions and services. This allows for better
planning and resource allocation for these services,
including child protection systems. Quasi-universal
child benefits, designed to exclude only the
wealthiest families, are another option.
The potential for cash transfers to limit child
labour is straightforward and well documented.49
Regular cash transfers improve school attendance
and discourage child labour by providing income
security. They free families from reliance on
children’s earnings or production, enabling them to
send their children to school instead. Cash transfers
also help offset out-of-pocket schooling costs that
can be an important barrier to school attendance.
Cash benefits are not a panacea. While they help
reduce child labour, there is a risk that families will
invest transfers in microenterprises and actually
stimulate demand for child labour.50 Preventing
such outcomes requires integrating child labour
and gender considerations into the design and
implementation of benefit schemes along with other
dimensions of marginality.51 Also important are
measures to address the dependency of household
microenterprises, particularly small family farms, on
child labour.
An effective social protection floor for children
involves a combination of social insurance and tax-
financed benefits.52 Elements of comprehensive
systems that benefit children include unemploy-
ment protection, old-age pensions, maternity/
parental leave benefits, sick leave and disability
benefits. All stem the chances that families will
resort to negative coping mechanisms, including
child labour, in the face of shocks.
Financing remains a major concern, with funding
gaps in social protection widening by about 30
per cent since the onset of COVID-19.53 Despite
unprecedented fiscal stimulus measures, only 2
per cent of these supported children and families.54
Additional investment in social protection can
come from multiple sources, including progressive
taxation and reallocations of existing spending,
such as away from harmful fossil fuel subsidies.
The ILO and UNICEF, as well as the Global Coalition
for Social Protection Floors, have developed ideas,
strategies and tools for developing sustainable
financing.
Safeguard and advance children’s educationCOVID-19 has dealt an enormous setback to
education. At their peak, pandemic-related school
closures affected over 90 per cent of the world’s
students.55 Substitute remote learning failed to
reach 463 million learners.56
This education emergency could spiral into a child
labour emergency. Since schools provide crucial
services, such as school meals,57 interruptions
can intensify household food insecurity and
financial stress, which increase the risk of child
labour. Once children are out of school and enter
paid employment, it can be very difficult to get
them back.58
As schools reopen, back-to-school campaigns and
outreach will be vital in making sure children are
able to return, particularly those already working
62

and those without access to remote learning.
Outreach will require close collaboration between
schools and social service workforces.
The reopening of schools is an opportunity to
reimagine education that is higher quality and
helps young people develop skills for work and a
productive life.59 Low-quality education otherwise
propels dropouts and early entry into paid work.
Six out of 10 students lack basic literacy and
numeracy skills even after several years in school.60
One essential step is having an adequate, qualified,
professional and competent teaching force with
decent working conditions.61 Opportunities for
strengthening informal education and formal
classroom settings should be fully explored. Digital
learning should be integrated into education for
every child and young person so that never again
are the world’s disadvantaged children left on the
wrong side of the digital divide.
For children not reached by remote learning, catch-
up and remedial programmes will help prevent them
from dropping out of school and entering work
prematurely. Even before COVID-19, more than
258 million children and youth were out of school
worldwide.62 Many were in child labour or at risk of
it. This group must not be forgotten.
There are some well-known solutions for getting
and keeping children in school.63 These include
aligning the minimum working age and the end
of compulsory schooling, and establishing early
childhood development, childcare and pre-primary
education, which increase the chance that students
not only stay in school but also succeed. Abolishing
school fees and eliminating costs for books,
uniforms and transport keeps education affordable.
Universal child benefits can help offset such costs.
Gathering more evidence about the links between
education and child labour can more precisely
define the most effective interventions for keeping
children in school.
Much depends on financing. Even before the crisis,
few governments met the international benchmarks
of allocating 15-20 per cent of public expenditure
and 4-6 per cent of GDP to education.64 Addressing
entrenched spending inequities should begin with
prioritizing lower levels of education so poor children
© U
NIC
EF/
UN
I377
095/
Pra
sad
Nga
khus
i
63

get their fair share and are less vulnerable to child
labour.65 Maintaining and increasing ODA will make
the difference in many low-income countries.
Register every child at birth Birth registration gives children a legal identity so
they can enjoy all of their rights from birth. A birth
certificate with proof of legal identity and age is often
required to access social services, including social
protection, health, education and justice. Without
this, children are at risk of multiple deprivations
and vulnerable to violence, abuse and exploitation,
including the worst forms of child labour.
Globally, 237 million children do not have a birth
certificate. To register all children from birth,
states should adopt policies and laws for free
and universal registration; link civil registration to
other systems, including for identity management,
health, social protection and education as entry
points for identifying and registering children;
invest in safe and innovative technology to facilitate
birth registration and ensure timely, accurate and
permanent records; and engage communities and
families, especially the hard-to-reach, to encourage
registration for every child through communication
on its benefits.
End gender norms and discrimination Gender roles often determine the type, conditions
and hours of work performed by boys and girls.
Within families, girls typically perform more
household chores, a burden likely to increase
during school closures. When the calculation of
child labour factors in such chores, the gender
gap in child labour prevalence is reduced. Girls
are also more likely to engage in domestic work in
third-party households. This form of child labour is
normally hidden from public view and beyond the
scope of labour inspectorates, leaving children
especially vulnerable to abuse.
Explicit laws, enforcement mechanisms and child
protection interventions are needed to counter
the risks faced by girls and boys engaged in
domestic work. Social or public works programmes
can include information and behaviour change
components to prevent gender-based violence and
other abuses.
Community-based dialogue, social and behaviour
change interventions, and parenting programmes
can help counter unequal gender norms that
encourage overburdening girls with household
chores in their own homes.66 Cash transfers and
other social assistance programmes, which help
reduce the economic insecurity that leads to child
labour, can be explicitly designed to diminish
financial barriers to quality learning for girls.
The education sector has a crucial role in
overturning harmful gender norms and stereotypes
that influence child labour. Girls need support to
pursue education that leads to equal employment
opportunities in all sectors, including in fields such
as science and technology. Governments must
increase flexible learning paths so that all girls
and boys benefit from quality education, including
in humanitarian crises. Schools should deliver
gender-transformative education programmes that
build job skills and counter gender bias for certain
types of work, generating incentives to keep both
girls and boys in school.
Other important measures encompass a better
distribution of female and male teachers from pre-
primary through secondary education, gender-
responsive policies advancing the careers of
both male and female teachers, and investing in
professional development that equips teachers
with skills to create safe learning environments and
transform harmful gender norms in the classroom
and beyond.
Orient child protection systems around prevention and responseEliminating child labour requires actions on multiple
fronts. Child protection systems, which bring
together different actors, can catalyse policies and
legislation to reduce child labour risks. They can
mobilize human and financial resources, service
delivery structures, coordination mechanisms,
and monitoring and data systems to identify
vulnerabilities.
64

Brokering links among education, health, social
protection and justice systems can trigger
comprehensive, large-scale prevention of and
responses to child labour. The COVID-19 crisis,
however, has further stretched already resource-
constrained child protection systems. Pandemic
response and recovery plans must prioritize
strengthening them, including by investing in the
social service workforce so that it can sustain child
protection and other essential services.
Responding to child labour also calls for aligning
child protection systems with systems to enforce
labour standards. Both child protection and
labour laws should extend adequate legislative
protections, and child protection services and labour
inspectorates should work in tandem to detect and
respond to child labour. Effective coordination is
especially urgent given the concerning increase in
hazardous child labour.
Children, families and communities are central
to child protection systems and efforts to stop
child labour. Well-functioning, community-based
mechanisms can stir awareness of the harms
of child labour, and promote care and positive
parenting. They can help child protection services
to identify vulnerable children and families and
make links to other services, such as those to end
poverty and diversify rural livelihoods.
Expand decent work and accelerate the transition to formalityThe COVID-19 crisis has cast a glaring light on the
vulnerability of workers in the informal economy,
where rights routinely go unprotected. Workers in
the informal economy, often in self-employment
and subsistence work, have little opportunity to
organize and bargain collectively, have limited or
no assurances of occupational health and safety,
and lack adequate social protection, all of which
amplify the devastating impact of the pandemic.
At the height of the first wave of the virus, an
estimated 1.6 billion informal economy workers
were labouring in the hardest-hit sectors and/or
suffered income losses from lockdown measures.67
Massive income declines led to spikes in poverty
among these workers and their families, even as
enhanced income protection measures adopted in
the wake of COVID-19 largely excluded the informal
economy.
The fallout on child labour starts with the poverty
and economic instability associated with informal
work, which make it more likely that families will
resort to child labour. If informality increases,
demand for child labour may intensify, given that
informal work requires few skills and is largely
unregulated. Informality also undermines the
economic base for taxation to finance social
protection, education and health care, all of which
deter child labour in crises and more generally.
Finally, the informal economy has few structures
for social dialogue and labour relations, both
antithetical to child labour.
The COVID-19 crisis has reinforced the imperative
for labour market policies to accelerate transitions
from the informal to the formal economy and
ultimately to decent work. Multiple policies are
typically required, adapted to specific national and
local contexts.68 Some overarching priorities always
apply, however, starting with labour and social
security laws that cover all workers and economic
units without exception as well as productive policies
that enable a conducive business environment to
create formal jobs.
Widening the collective, representative voice of
women and men who earn their living in the informal
economy is an almost universal precondition for the
transition to formality, enabling them to influence
working conditions, productivity and incomes. A
growing global body of experience offers guidance
in building collective representation structures for
different informal economy workers.69 Extending
social protection to them and their families is
another core element that can draw on a wealth of
existing practices.70
The ILO Centenary Declaration for the Future of
Work, 2019 was adopted at the 108th International
Labour Conference. It calls for investing in people
65

through a human-centred approach to the future of
work. This means investing in jobs, skills and social
protection, and actively advancing gender equality.
It requires investing in labour market institutions
so that wages are adequate, working hours are
limited, and safety, health and fundamental rights
at work are ensured. Policies must systematically
back sustainable enterprises, economic growth
and decent work for all.
Improve rural livelihoodsThe 2020 global child labour estimates reconfirm
what we have long known: Child labour occurs
most often in agriculture, at 70 per cent of the total
worldwide and up to 82 per cent in sub-Saharan
Africa. It is especially common among younger
children, for whom the physical demands and
hazards of farm work can be particularly damaging.
COVID-19 may increase child labour in agriculture,
at least in the short term, as families who have lost
jobs elsewhere return to subsistence farming to
survive. Broader progress in ending child labour
thus largely centres on improving rural livelihoods
and building more diversified economies, including
in rural areas.
Child labour in agriculture takes many forms, each
requiring specific strategies. On family smallholder
farms, which host the largest share, families need to
be able to reduce their dependency on child labour
to sustain their livelihoods. Such farms must secure
a fair price for what they produce and be able to
enhance productivity by investing in labour-saving
technologies or hiring adult workers instead of
relying on children.71 Small producer associations
and well-functioning cooperatives can boost
market and bargaining power in agricultural value
chains and uphold price stability. Such groups can
also pool adult labour and agricultural inputs, share
knowledge and introduce new farming methods
and technology.72
On larger commercial agricultural entities, children
can often be found working alongside their parents.
Piecework payment schemes, where income
depends on kilos of crops picked or number of
rows weeded, for example, can incentivize the
use of children – especially if that means families
will earn a living wage. Adequate and nearby day-
care and school facilities can provide parents with
a safe and worthwhile alternative to bringing their
© U
NIC
EF/
UN
I277
430/
Ber
ger
66
children with them to the fields. Expanding workers’
collective voice can be critical to combating child
labour in such settings.
Systemic approaches to promote rural development
and enhance rural livelihoods and resilience can
diminish reliance on child labour. These should
include specific attention to eliminating child labour
in food systems,73 which encompass production,
aggregation, processing, distribution, consumption
and disposal of food products, and creating
opportunities for sustainable adult livelihoods.
A well-designed social protection strategy com-
bining contributory social insurance and tax-
based social assistance can sustain the adequate
protection of rural populations throughout their lives,
including in confronting risks and contingencies
specific to rural areas.74 Employment-intensive
investment in rural infrastructure and basic services,
such as water and power systems, can offer jobs
off the farm while improving farm productivity and
reducing the need for tasks often done by children,
such as hauling water and gathering fuel.75
Investment in developing the skills of rural youth
can bolster farm productivity and contribute to
a structural shift towards higher value added
manufacturing and services.76 Youth skills training
is also an entry point for imparting key occupational
health and safety information, which can in turn help
in reducing hazardous child labour in agriculture
and elsewhere.
Agricultural extension policies for crop
diversification, the introduction of more resistant
crop or livestock varieties, disaster risk reduction
and insurance against weather-related crop failures
can all enhance resilience to climate change. This is
a growing concern in many rural agricultural zones
where child labour occurs,77 adding pressure on
already poor families.
Reduce heightened risks of child labour in domestic and global supply chainsChild labour is more common in domestic
production but appears also in global supply
chains.78 The pandemic should not add to this
risk. Governments need to continue strengthening
laws and enforcement mechanisms that require
transparency and human rights due diligence in
business operations and supply chains for firms of
all sizes, nationally and internationally. This includes
governments in wealthy countries where many
international firms are based.
Public capacity to enforce labour laws and
regulations has been strained as financial and
human resources have been diverted to meet
urgent needs linked to the pandemic.
The crisis also underscores how businesses must
fulfil their responsibility to apply laws and take
further measures to prevent, identify, mitigate and
remediate child labour in their operations and supply
chains, in accordance with the United Nations
Guiding Principles on Business and Human Rights,
ILO conventions and the Tripartite Declaration of
Principles Concerning Multinational Enterprises
and Social Policy.79
Assessments of child labour risks in supply chains
can steer business responses to the COVID-19
crisis. These must include identifying and prioritizing
‘hotspots’ where risks are highest in terms of
severity and scale. Special attention should be given
to informal micro- and small enterprises operating
on the lower tiers of supply chains, where child
labour and other human rights risks are often most
pronounced,80 and fallout from the crisis has been
particularly devastating. Such assessments require
meaningful engagement by stakeholders, including
workers, their representative organizations and
community members, as they are best positioned
to identify local risks and help formulate the most
appropriate mitigation strategies.
Short-term crises may require immediate actions.
But these should be accompanied by longer-
term, systemic responses that make global supply
chains more resilient, ethical and sustainable, and,
concomitantly, more impervious to child labour and
other human rights violations in future crises. Well-
established, responsible business and purchasing
67

practices can help keep firms afloat and reduce
child labour. Examples include long-term supplier
contracts, clarity on future contracts, honouring
commitments on orders and payments, fair
payment schedules, and pricing capturing the true
production costs and market values of products
and services.
Industry-wide and cross-industry collaboration
must aim to cut off the roots of child labour at
lower tiers of supply chains, since individual
companies often have limited leverage. A wide
range of voluntary, business-led initiatives have
emerged in recent years in recognition of this reality.
Sustainability and effectiveness depend largely on
integrating company action into existing efforts
by governments, social partners, civil society and
others active on ending child labour.
Address child labour in conflicts, disasters and other crisesWorldwide, one in every four children lives in a
country struck by conflict, fragility and/or disaster.81
The resulting displacement and disruptions to
livelihoods, schooling, social protection, family
support networks and the rule of law all heighten
the risk of child labour.82 The COVID-19 pandemic
has dealt another blow to families already in acute
distress.
Child labour concerns must inform all phases
of humanitarian action: crisis preparation and
contingency plans, humanitarian responses and
post-crisis reconstruction and recovery. Before a
crisis hits, preparedness planning should draw on
existing data on prevalent forms of child labour, the
strength of economic markets, the reach of social
protection and essential services, and community-
based supports. This evidence – combined with
similar data on the economic impact of a crisis at
the national, local, family and individual levels – can
help formulate appropriate responses during and
after the most acute phases.
In all fragile and crisis situations, particular attention
should be paid to sexual exploitation, trafficking
and forced labour, including through abduction.
Where armed conflict occurs, additional attention
should go to the recruitment and use of children
by armed forces or groups. Getting children back
to school is essential to preventing a fall into child
labour, including the worst forms.83
Measures to prevent and respond to child labour
during a crisis should make links among the
humanitarian, development and peace dimensions.
They should help build social cohesion, resilience
and peace, and strengthen existing government,
economic and social structures. Supporting
meaningful economic and livelihood opportunities
for adult members of families in crisis situations is
essential. The ILO Employment and Decent Work for
Peace and Resilience Recommendation, 2017 (No.
205) calls for inclusive measures to promote decent
work and income generation, including through
employment-intensive investment strategies such
as public employment programmes. Universal child
benefits make practical sense in fragile places with
limited capacities and very high shares of vulnerable
children. They can help lay the foundations for
elaborating a social protection system later on.
Responses to child labour should build on,
strengthen and adapt existing humanitarian and
development coordination mechanisms, partner-
ships and plans. The same applies to government
and economic structures. Important resources to
guide this work include the Minimum Standards for
Child Protection in Humanitarian Action84 and the
Inter-Agency Toolkit on Preventing and Responding
to Child Labour in Humanitarian Action,85 both
produced by the Alliance for Child Protection in
Humanitarian Action.
Adopt adequate legal frameworks and promote complianceRatification of international legal standards on
eliminating child labour is a powerful statement of
government intent. In 2020, ILO Convention No. 182
became the first ILO convention to achieve universal
ratification.86 The United Nations Convention on the
Rights of the Child has almost reached universal
ratification, while 173 states have ratified ILO
68
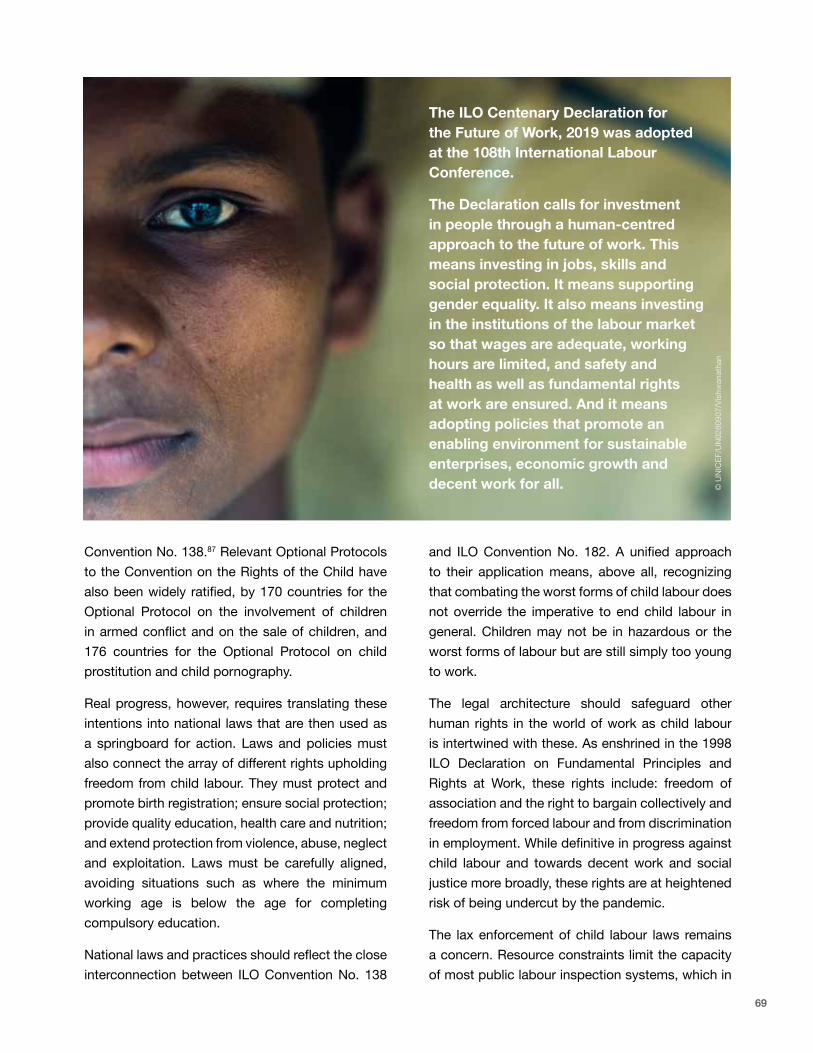
Convention No. 138.87 Relevant Optional Protocols
to the Convention on the Rights of the Child have
also been widely ratified, by 170 countries for the
Optional Protocol on the involvement of children
in armed conflict and on the sale of children, and
176 countries for the Optional Protocol on child
prostitution and child pornography.
Real progress, however, requires translating these
intentions into national laws that are then used as
a springboard for action. Laws and policies must
also connect the array of different rights upholding
freedom from child labour. They must protect and
promote birth registration; ensure social protection;
provide quality education, health care and nutrition;
and extend protection from violence, abuse, neglect
and exploitation. Laws must be carefully aligned,
avoiding situations such as where the minimum
working age is below the age for completing
compulsory education.
National laws and practices should reflect the close
interconnection between ILO Convention No. 138
and ILO Convention No. 182. A unified approach
to their application means, above all, recognizing
that combating the worst forms of child labour does
not override the imperative to end child labour in
general. Children may not be in hazardous or the
worst forms of labour but are still simply too young
to work.
The legal architecture should safeguard other
human rights in the world of work as child labour
is intertwined with these. As enshrined in the 1998
ILO Declaration on Fundamental Principles and
Rights at Work, these rights include: freedom of
association and the right to bargain collectively and
freedom from forced labour and from discrimination
in employment. While definitive in progress against
child labour and towards decent work and social
justice more broadly, these rights are at heightened
risk of being undercut by the pandemic.
The lax enforcement of child labour laws remains
a concern. Resource constraints limit the capacity
of most public labour inspection systems, which in
The ILO Centenary Declaration for the Future of Work, 2019 was adopted at the 108th International Labour Conference.
The Declaration calls for investment in people through a human-centred approach to the future of work. This means investing in jobs, skills and social protection. It means supporting gender equality. It also means investing in the institutions of the labour market so that wages are adequate, working hours are limited, and safety and health as well as fundamental rights at work are ensured. And it means adopting policies that promote an enabling environment for sustainable enterprises, economic growth and decent work for all. ©
UN
ICE
F/U
N02
8090
7/V
ishw
anat
han
69
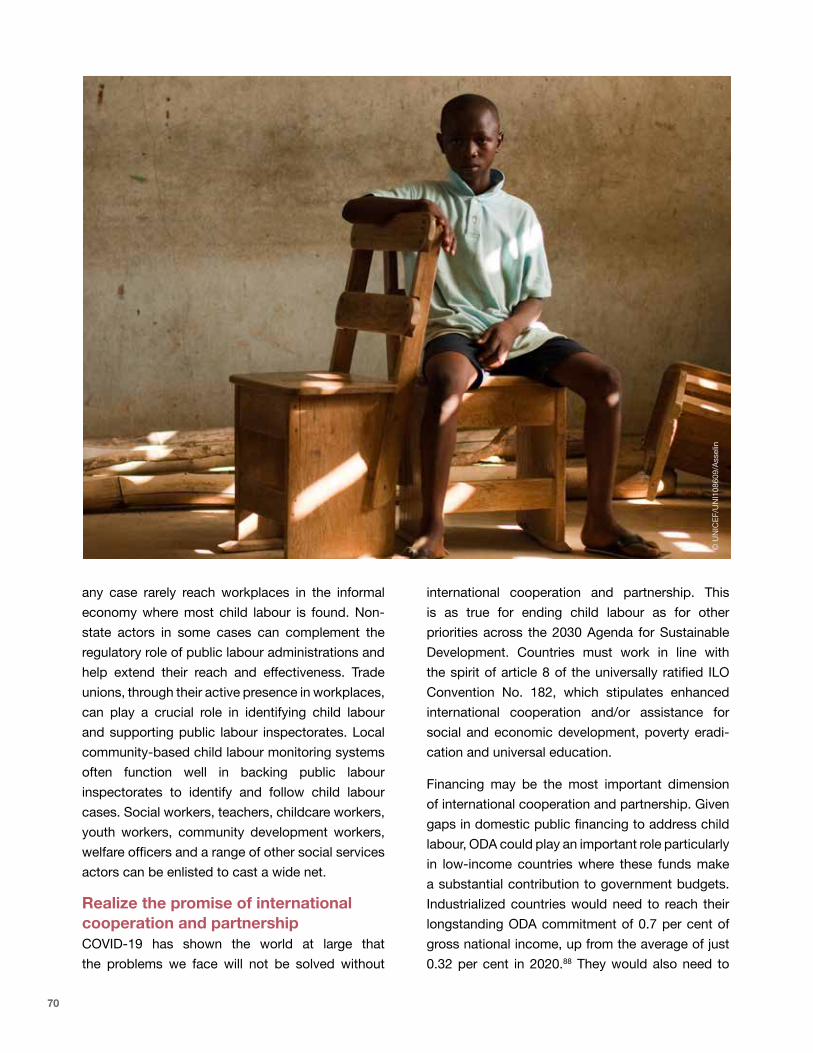
any case rarely reach workplaces in the informal
economy where most child labour is found. Non-
state actors in some cases can complement the
regulatory role of public labour administrations and
help extend their reach and effectiveness. Trade
unions, through their active presence in workplaces,
can play a crucial role in identifying child labour
and supporting public labour inspectorates. Local
community-based child labour monitoring systems
often function well in backing public labour
inspectorates to identify and follow child labour
cases. Social workers, teachers, childcare workers,
youth workers, community development workers,
welfare officers and a range of other social services
actors can be enlisted to cast a wide net.
Realize the promise of international cooperation and partnership
COVID-19 has shown the world at large that
the problems we face will not be solved without
international cooperation and partnership. This
is as true for ending child labour as for other
priorities across the 2030 Agenda for Sustainable
Development. Countries must work in line with
the spirit of article 8 of the universally ratified ILO
Convention No. 182, which stipulates enhanced
international cooperation and/or assistance for
social and economic development, poverty eradi-
cation and universal education.
Financing may be the most important dimension
of international cooperation and partnership. Given
gaps in domestic public financing to address child
labour, ODA could play an important role particularly
in low-income countries where these funds make
a substantial contribution to government budgets.
Industrialized countries would need to reach their
longstanding ODA commitment of 0.7 per cent of
gross national income, up from the average of just
0.32 per cent in 2020.88 They would also need to
© U
NIC
EF/
UN
I108
609/
Ass
elin
70

allocate more funding specifically to eliminate child
labour; in 2018, the issue drew only $60 million in
ODA.89 International financial institutions are active
in many sectors critical to elimination and can make
important contributions to required resources,
including by providing and promoting debt relief and
by continued support for essential social spending.
Founded in 2016, Alliance 8.7 facilitates cooperation
on stopping child labour. It groups more than
240 partners from governments, multilateral
organizations, workers’ organizations, employers’
organizations, non-governmental organizations,
academic institutions and think tanks to define
effective ways of accelerating progress towards
SDG target 8.7 on ending child labour, modern
slavery and human trafficking. The alliance
focuses on increasing collaborative action, driving
innovation and scaling up solutions that work. It
also provides a platform for engaging in dialogue
and sharing experience and information.90
Partnerships to prevent the exploitation of children
in armed conflicts are integral to ending child labour.
The Paris Commitments and Principles on Children
Associated with Armed Forces or Armed Groups
and the related Paris Principles Steering Group, the
Global Coalition for Reintegration of Child Soldiers
and the Task Force on Children Associated with
Armed Forces and Armed Groups of the Alliance
for Child Protection in Humanitarian Action each
bring together governments, practitioners, donors,
advocates, United Nations entities and technical
experts determined to stop children from fighting
wars, as one of the most egregious types of
child labour.
Exchanging experiences and good practices
among countries can accelerate change. The
Pathfinder Country initiative91 includes over 20
member countries from the Global North and
South. They commit to going further and faster
towards achieving target 8.7, and to documenting
and sharing experiences and lessons in ending
child labour, forced labour and modern slavery.
Other key initiatives align government, multilateral
and business partners. The International Partnership
for Cooperation on Child Labour in Agriculture brings
together the Food and Agriculture Organization
of the United Nations, the ILO, the International
Fund for Agricultural Development, trade union
groups92 and others to eliminate child labour in
agriculture. The Child Labour Platform, co-chaired
by the International Organisation of Employers and
the International Trade Union Confederation, and
including the ILO and UNICEF, tackles child labour
in supply chains. The Global Partnership to End
Violence Against Children also supports ending
child labour. Global partnerships around education
and universal social protection play valuable roles
as well.
Getting back on trackIt is urgent to put action to end child labour back on
track, in line with global commitments and goals. The
evidence in this report outlines the risks and points
to the solutions. While ambitious measures and
investments are required, the COVID-19 pandemic
has amply illustrated that these are possible when
the well-being of humanity is at stake.
We have made a promise to children to end child labour. There is no time to lose.
71

Annex
© U
NIC
EF/
UN
0777
79/B
ona
72

73

Total Boys Girls
5-11 years 12-14 years 15-17 years 5-17 years 5-11 years 12-14 years 15-17 years 5-17 years 5-11 years 12-14 years 15-17 years 5-17 years
% No. % No. % No. % No. % No. % No. % No. % No. % No. % No. % No. % No.
World total 9.7 89,300 9.3 35,600 9.5 35,000 9.6 160,000 10.9 52,000 11.0 21,800 12.2 23,300 11.2 97,000 8.4 37,400 7.5 13,800 6.6 11,800 7.8 62,900
Residence
Rural 14.6 72,400 13.7 27,700 12.4 22,600 13.9 122,700 16.3 42,000 16.1 16,800 15.7 15,000 16.1 73,700 12.7 30,500 11.2 10,800 8.8 7,700 11.6 49,000
Urban 4.0 16,900 4.4 7,900 6.6 12,400 4.7 37,300 4.6 10,000 5.4 4,900 8.6 8,300 5.7 23,300 3.3 6,900 3.4 3,000 4.5 4,100 3.6 14,000
ILO regions
Africa 22.1 54,900 23.5 21,800 18.2 15,500 21.6 92,200 24.3 30,600 26.8 12,600 20.7 8,900 24.1 52,100 19.9 24,300 20.1 9,200 15.6 6,600 19.1 40,100
Sub-Saharan Africa 24.7 51,900 25.8 20,500 19.5 14,200 23.9 86,600 27.1 28,800 29.3 11,700 22.0 8,000 26.5 48,600 22.3 23,100 22.2 8,700 17.1 6,100 21.2 38,000
Arab States 4.8 1,200 6.4 600 7.8 700 5.8 2,400 6.8 800 8.8 400 11.0 500 8.1 1,800 2.7 300 3.8 200 4.4 200 3.3 700
Asia and the Pacific 5.4 25,000 4.8 9,600 7.1 14,100 5.6 48,700 6.4 15,700 6.0 6,400 10.1 10,500 7.2 32,500 4.2 9,400 3.3 3,200 3.8 3,600 3.9 16,200
Americas 3.0 3,100 4.3 1,900 7.2 3,300 4.3 8,300 3.6 1,900 5.6 1,300 10.2 2,400 5.6 5,600 2.3 1,200 2.8 600 4.2 900 2.9 2,700
Latin America and the Caribbean 4.2 3,100 6.1 1,900 9.8 3,100 6.0 8,200 5.1 1,900 8.1 1,300 13.9 2,300 7.9 5,500 3.3 1,200 4.1 600 5.6 900 4.0 2,700
Europe and Central Asia 6.4 5,200 5.1 1,700 4.6 1,400 5.7 8,300 7.2 3,000 6.4 1,100 6.2 1,000 6.8 5,100 5.6 2,200 3.8 600 2.9 400 4.6 3,200
SDG regions
Sub-Saharan Africa 24.7 51,900 25.8 20,500 19.5 14,200 23.9 86,600 27.1 28,800 29.3 11,700 22.0 8,000 26.5 48,600 22.3 23,100 22.2 8,700 17.1 6,100 21.2 38,000
Central and Southern Asia 5.2 13,300 4.5 5,100 7.1 7,900 5.5 26,300 5.8 7,800 5.9 3,500 11.1 6,500 7.1 17,800 4.5 5,500 3.0 1,600 2.7 1,400 3.7 8,500
Eastern and South-Eastern Asia 6.1 13,200 5.4 4,800 7.1 6,300 6.2 24,300 7.7 8,700 6.6 3,100 8.7 4,100 7.7 15,900 4.4 4,500 4.0 1,700 5.3 2,200 4.5 8,400
Northern Africa and Western Asia 7.3 5,400 8.5 2,400 8.5 2,200 7.8 10,100 8.9 3,400 10.9 1,600 11.4 1,500 9.9 6,500 5.5 2,000 5.9 800 5.3 700 5.6 3,500
Latin America and the Caribbean 4.2 3,100 6.1 1,900 9.8 3,100 6.0 8,200 5.1 1,900 8.1 1,300 13.9 2,300 7.9 5,500 3.3 1,200 4.1 600 5.6 900 4.0 2,700
Europe and Northern America 2.2 2,000 2.0 800 3.0 1,100 2.3 3,800 2.5 1,100 2.5 500 4.0 800 2.8 2,400 1.9 800 1.5 300 1.8 300 1.8 1,400
UNICEF regions East Asia and Pacific 6.2 13,600 5.4 5,000 7.2 6,500 6.2 25,100 7.7 8,900 6.6 3,200 8.8 4,200 7.7 16,300 4.5 4,700 4.0 1,800 5.4 2,300 4.6 8,800
Europe and Central Asia 6.5 5,200 5.2 1,700 4.6 1,400 5.8 8,300 7.3 3,000 6.5 1,100 6.2 1,000 6.9 5,100 5.7 2,200 3.8 600 2.9 400 4.7 3,200
Latin America and Caribbean 4.2 3,100 6.1 1,900 9.8 3,100 6.0 8,200 5.1 1,900 8.1 1,300 13.9 2,300 7.9 5,500 3.3 1,200 4.1 600 5.6 900 4.0 2,700
Middle East and North Africa 5.5 3,600 7.2 1,700 8.6 1,900 6.5 7,200 7.2 2,400 9.5 1,200 11.8 1,300 8.6 4,900 3.7 1,200 4.7 500 5.3 600 4.2 2,300
North America - - - - 1.2 200 0.3 200 - - - - 1.6 100 0.4 100 - - - - 0.7 - 0.2 -
South Asia 4.4 10,400 4.0 4,200 6.9 7,200 4.9 21,800 4.9 6,100 5.3 2,900 11.1 6,100 6.5 15,100 3.8 4,300 2.6 1,300 2.3 1,200 3.2 6,800
Sub-Saharan Africa 24.6 53,500 25.5 21,100 19.4 14,700 23.7 89,200 26.9 29,700 29.0 12,100 21.8 8,300 26.4 50,100 22.1 23,800 22.0 9,000 16.9 6,300 21.1 39,200
Children in child labour who are not attending school
Total 27.7 24,700 35.2 12,500 53.2 18,700 35.0 55,900 27.8 14,400 35.7 7,800 56.0 13,000 36.3 35,300 27.5 10,300 34.4 4,700 47.7 5,600 32.8 20,700
Rural 28.3 20,500 35.8 9,900 54.1 12,200 34.8 42,700 28.4 11,900 36.2 6,100 57.2 8,600 36.0 26,600 28.3 8,600 35.2 3,800 48.0 3,700 32.9 16,100
Urban 24.9 4,200 33.1 2,600 51.6 6,400 35.5 13,300 25.4 2,500 34.0 1,700 53.7 4,500 37.3 8,700 24.2 1,700 31.6 900 47.2 1,900 32.5 4,500
Children in child labour by sector of economic activity
Agriculture 76.6 68,400 75.8 27,000 47.6 16,700 70.0 112,100 77.7 40,400 76.1 16,600 46.7 10,900 69.9 67,800 75.1 28,100 75.3 10,400 49.3 5,800 70.3 44,300
Industry 6.0 5,400 7.5 2,700 24.0 8,400 10.3 16,500 8.8 4,600 8.7 1,900 28.2 6,600 13.4 13,000 2.2 800 5.6 800 15.7 1,800 5.5 3,500
Services 17.4 15,500 16.7 5,900 28.4 10,000 19.6 31,400 13.5 7,000 15.2 3,300 25.1 5,800 16.7 16,200 22.7 8,500 19.0 2,600 35.1 4,100 24.2 15,200
Of which domestic work 4.6 4,100 3.0 1,100 5.6 2,000 4.5 7,100 3.1 1,600 1.9 400 3.3 800 2.8 2,800 6.7 2,500 4.7 600 10.4 1,200 7.0 4,400
Children in child labour by employment status
Employees 9.2 8,200 12.9 4,600 42.3 14,800 17.3 27,600 11.6 6,000 16.2 3,500 43.9 10,200 20.4 19,800 5.8 2,200 7.7 1,100 38.9 4,600 12.4 7,800
Own-account workers 8.2 7,300 12.6 4,500 15.0 5,300 10.7 17,000 7.5 3,900 12.8 2,800 16.1 3,800 10.8 10,400 9.1 3,400 12.3 1,700 12.7 1,500 10.5 6,600
Contributing family workers 82.6 73,800 74.5 26,500 42.8 15,000 72.1 115,300 80.9 42,000 71.0 15,500 39.9 9,300 68.8 66,800 85.1 31,800 80.0 11,000 48.4 5,700 77.1 48,500
CHILD LABOUR Percentage and number of children aged 5 to 17 years in child labour
STATISTICAL TABLES
Notes: Numbers are expressed in thousands and have been rounded. Because of the rounding, disaggregated numbers do not always add up to total values and figures in percentages do not always add up to 100 per cent. For the same reason, the values presented in earlier pages of the report do not always match the values presented in this table. The regional groupings used by ILO and UNICEF, as well as those used for SDG reporting, vary slightly. This explains why the values for some regions differ, even if the labels are the same. The dash for North America indicates that, in the absence of data, values are assumed to be null. Caution is warranted when interpreting values for Europe and Northern America due to low data coverage for children aged 5 to 14.
74

Total Boys Girls
5-11 years 12-14 years 15-17 years 5-17 years 5-11 years 12-14 years 15-17 years 5-17 years 5-11 years 12-14 years 15-17 years 5-17 years
% No. % No. % No. % No. % No. % No. % No. % No. % No. % No. % No. % No.
World total 9.7 89,300 9.3 35,600 9.5 35,000 9.6 160,000 10.9 52,000 11.0 21,800 12.2 23,300 11.2 97,000 8.4 37,400 7.5 13,800 6.6 11,800 7.8 62,900
Residence
Rural 14.6 72,400 13.7 27,700 12.4 22,600 13.9 122,700 16.3 42,000 16.1 16,800 15.7 15,000 16.1 73,700 12.7 30,500 11.2 10,800 8.8 7,700 11.6 49,000
Urban 4.0 16,900 4.4 7,900 6.6 12,400 4.7 37,300 4.6 10,000 5.4 4,900 8.6 8,300 5.7 23,300 3.3 6,900 3.4 3,000 4.5 4,100 3.6 14,000
ILO regions
Africa 22.1 54,900 23.5 21,800 18.2 15,500 21.6 92,200 24.3 30,600 26.8 12,600 20.7 8,900 24.1 52,100 19.9 24,300 20.1 9,200 15.6 6,600 19.1 40,100
Sub-Saharan Africa 24.7 51,900 25.8 20,500 19.5 14,200 23.9 86,600 27.1 28,800 29.3 11,700 22.0 8,000 26.5 48,600 22.3 23,100 22.2 8,700 17.1 6,100 21.2 38,000
Arab States 4.8 1,200 6.4 600 7.8 700 5.8 2,400 6.8 800 8.8 400 11.0 500 8.1 1,800 2.7 300 3.8 200 4.4 200 3.3 700
Asia and the Pacific 5.4 25,000 4.8 9,600 7.1 14,100 5.6 48,700 6.4 15,700 6.0 6,400 10.1 10,500 7.2 32,500 4.2 9,400 3.3 3,200 3.8 3,600 3.9 16,200
Americas 3.0 3,100 4.3 1,900 7.2 3,300 4.3 8,300 3.6 1,900 5.6 1,300 10.2 2,400 5.6 5,600 2.3 1,200 2.8 600 4.2 900 2.9 2,700
Latin America and the Caribbean 4.2 3,100 6.1 1,900 9.8 3,100 6.0 8,200 5.1 1,900 8.1 1,300 13.9 2,300 7.9 5,500 3.3 1,200 4.1 600 5.6 900 4.0 2,700
Europe and Central Asia 6.4 5,200 5.1 1,700 4.6 1,400 5.7 8,300 7.2 3,000 6.4 1,100 6.2 1,000 6.8 5,100 5.6 2,200 3.8 600 2.9 400 4.6 3,200
SDG regions
Sub-Saharan Africa 24.7 51,900 25.8 20,500 19.5 14,200 23.9 86,600 27.1 28,800 29.3 11,700 22.0 8,000 26.5 48,600 22.3 23,100 22.2 8,700 17.1 6,100 21.2 38,000
Central and Southern Asia 5.2 13,300 4.5 5,100 7.1 7,900 5.5 26,300 5.8 7,800 5.9 3,500 11.1 6,500 7.1 17,800 4.5 5,500 3.0 1,600 2.7 1,400 3.7 8,500
Eastern and South-Eastern Asia 6.1 13,200 5.4 4,800 7.1 6,300 6.2 24,300 7.7 8,700 6.6 3,100 8.7 4,100 7.7 15,900 4.4 4,500 4.0 1,700 5.3 2,200 4.5 8,400
Northern Africa and Western Asia 7.3 5,400 8.5 2,400 8.5 2,200 7.8 10,100 8.9 3,400 10.9 1,600 11.4 1,500 9.9 6,500 5.5 2,000 5.9 800 5.3 700 5.6 3,500
Latin America and the Caribbean 4.2 3,100 6.1 1,900 9.8 3,100 6.0 8,200 5.1 1,900 8.1 1,300 13.9 2,300 7.9 5,500 3.3 1,200 4.1 600 5.6 900 4.0 2,700
Europe and Northern America 2.2 2,000 2.0 800 3.0 1,100 2.3 3,800 2.5 1,100 2.5 500 4.0 800 2.8 2,400 1.9 800 1.5 300 1.8 300 1.8 1,400
UNICEF regions East Asia and Pacific 6.2 13,600 5.4 5,000 7.2 6,500 6.2 25,100 7.7 8,900 6.6 3,200 8.8 4,200 7.7 16,300 4.5 4,700 4.0 1,800 5.4 2,300 4.6 8,800
Europe and Central Asia 6.5 5,200 5.2 1,700 4.6 1,400 5.8 8,300 7.3 3,000 6.5 1,100 6.2 1,000 6.9 5,100 5.7 2,200 3.8 600 2.9 400 4.7 3,200
Latin America and Caribbean 4.2 3,100 6.1 1,900 9.8 3,100 6.0 8,200 5.1 1,900 8.1 1,300 13.9 2,300 7.9 5,500 3.3 1,200 4.1 600 5.6 900 4.0 2,700
Middle East and North Africa 5.5 3,600 7.2 1,700 8.6 1,900 6.5 7,200 7.2 2,400 9.5 1,200 11.8 1,300 8.6 4,900 3.7 1,200 4.7 500 5.3 600 4.2 2,300
North America - - - - 1.2 200 0.3 200 - - - - 1.6 100 0.4 100 - - - - 0.7 - 0.2 -
South Asia 4.4 10,400 4.0 4,200 6.9 7,200 4.9 21,800 4.9 6,100 5.3 2,900 11.1 6,100 6.5 15,100 3.8 4,300 2.6 1,300 2.3 1,200 3.2 6,800
Sub-Saharan Africa 24.6 53,500 25.5 21,100 19.4 14,700 23.7 89,200 26.9 29,700 29.0 12,100 21.8 8,300 26.4 50,100 22.1 23,800 22.0 9,000 16.9 6,300 21.1 39,200
Children in child labour who are not attending school
Total 27.7 24,700 35.2 12,500 53.2 18,700 35.0 55,900 27.8 14,400 35.7 7,800 56.0 13,000 36.3 35,300 27.5 10,300 34.4 4,700 47.7 5,600 32.8 20,700
Rural 28.3 20,500 35.8 9,900 54.1 12,200 34.8 42,700 28.4 11,900 36.2 6,100 57.2 8,600 36.0 26,600 28.3 8,600 35.2 3,800 48.0 3,700 32.9 16,100
Urban 24.9 4,200 33.1 2,600 51.6 6,400 35.5 13,300 25.4 2,500 34.0 1,700 53.7 4,500 37.3 8,700 24.2 1,700 31.6 900 47.2 1,900 32.5 4,500
Children in child labour by sector of economic activity
Agriculture 76.6 68,400 75.8 27,000 47.6 16,700 70.0 112,100 77.7 40,400 76.1 16,600 46.7 10,900 69.9 67,800 75.1 28,100 75.3 10,400 49.3 5,800 70.3 44,300
Industry 6.0 5,400 7.5 2,700 24.0 8,400 10.3 16,500 8.8 4,600 8.7 1,900 28.2 6,600 13.4 13,000 2.2 800 5.6 800 15.7 1,800 5.5 3,500
Services 17.4 15,500 16.7 5,900 28.4 10,000 19.6 31,400 13.5 7,000 15.2 3,300 25.1 5,800 16.7 16,200 22.7 8,500 19.0 2,600 35.1 4,100 24.2 15,200
Of which domestic work 4.6 4,100 3.0 1,100 5.6 2,000 4.5 7,100 3.1 1,600 1.9 400 3.3 800 2.8 2,800 6.7 2,500 4.7 600 10.4 1,200 7.0 4,400
Children in child labour by employment status
Employees 9.2 8,200 12.9 4,600 42.3 14,800 17.3 27,600 11.6 6,000 16.2 3,500 43.9 10,200 20.4 19,800 5.8 2,200 7.7 1,100 38.9 4,600 12.4 7,800
Own-account workers 8.2 7,300 12.6 4,500 15.0 5,300 10.7 17,000 7.5 3,900 12.8 2,800 16.1 3,800 10.8 10,400 9.1 3,400 12.3 1,700 12.7 1,500 10.5 6,600
Contributing family workers 82.6 73,800 74.5 26,500 42.8 15,000 72.1 115,300 80.9 42,000 71.0 15,500 39.9 9,300 68.8 66,800 85.1 31,800 80.0 11,000 48.4 5,700 77.1 48,500
75

Total Boys Girls
5-11 years 12-14 years 15-17 years 5-17 years 5-11 years 12-14 years 15-17 years 5-17 years 5-11 years 12-14 years 15-17 years 5-17 years
% No. % No. % No. % No. % No. % No. % No. % No. % No. % No. % No. % No.
World total 2.8 25,900 4.8 18,100 9.5 35,000 4.7 79,000 3.3 15,500 5.8 11,400 12.2 23,300 5.8 50,200 2.3 10,300 3.7 6,700 6.6 11,800 3.6 28,800
Residence
Rural 4.0 20,000 6.8 13,700 12.4 22,600 6.4 56,300 4.7 12,000 8.2 8,600 15.7 15,000 7.8 35,600 3.3 7,900 5.3 5,200 8.8 7,700 4.9 20,800
Urban 1.4 5,900 2.5 4,400 6.6 12,400 2.9 22,700 1.6 3,500 3.1 2,800 8.6 8,300 3.6 14,700 1.1 2,400 1.8 1,600 4.5 4,100 2.1 8,100
ILO regions
Africa 6.4 15,700 10.9 10,200 18.2 15,500 9.7 41,400 7.3 9,200 12.8 6,000 20.7 8,900 11.2 24,200 5.3 6,500 9.0 4,100 15.6 6,600 8.2 17,200
Sub-Saharan Africa 7.1 14,900 12.0 9,500 19.5 14,200 10.7 38,600 8.2 8,700 14.0 5,600 22.0 8,000 12.2 22,400 6.0 6,200 9.9 3,900 17.1 6,100 9.1 16,300
Arab States 3.1 800 4.9 500 7.8 700 4.5 1,900 4.5 600 6.9 300 11.0 500 6.3 1,400 1.7 200 2.8 100 4.4 200 2.5 500
Asia and the Pacific 0.7 3,300 2.3 4,700 7.1 14,100 2.6 22,200 0.9 2,200 3.0 3,100 10.1 10,500 3.5 15,800 0.5 1,200 1.7 1,600 3.8 3,600 1.6 6,400
Americas 1.1 1,200 2.6 1,200 7.2 3,300 2.9 5,700 1.5 800 3.7 900 10.2 2,400 4.1 4,000 0.7 400 1.4 300 4.2 900 1.7 1,600
Latin America and the Caribbean 1.6 1,200 3.7 1,200 9.8 3,100 4.0 5,500 2.2 800 5.4 900 13.9 2,300 5.7 3,900 1.0 400 2.1 300 5.6 900 2.3 1,600
Europe and Central Asia 6.0 4,800 4.9 1,600 4.6 1,400 5.5 7,900 6.8 2,800 6.2 1,000 6.2 1,000 6.5 4,800 5.2 2,000 3.6 600 2.9 400 4.4 3,100
SDG regions
Sub-Saharan Africa 7.1 14,900 12.0 9,500 19.5 14,200 10.7 38,600 8.2 8,700 14.0 5,600 22.0 8,000 12.2 22,400 6.0 6,200 9.9 3,900 17.1 6,100 9.1 16,300
Central and Southern Asia 1.2 3,200 2.6 2,900 7.1 7,900 2.9 14,000 1.4 1,900 3.3 2,000 11.1 6,500 4.1 10,300 1.1 1,300 1.8 1,000 2.7 1,400 1.6 3,700
Eastern and South-Eastern Asia 0.9 1,900 2.4 2,200 7.1 6,300 2.6 10,400 1.1 1,300 3.0 1,400 8.7 4,100 3.3 6,800 0.6 600 1.8 800 5.3 2,200 1.9 3,600
Northern Africa and Western Asia 3.7 2,800 5.5 1,500 8.5 2,200 5.1 6,500 4.7 1,800 7.3 1,000 11.4 1,500 6.6 4,400 2.7 1,000 3.6 500 5.3 700 3.4 2,200
Latin America and the Caribbean 1.6 1,200 3.7 1,200 9.8 3,100 4.0 5,500 2.2 800 5.4 900 13.9 2,300 5.7 3,900 1.0 400 2.1 300 5.6 900 2.3 1,600
Europe and Northern America 2.1 1,800 2.0 700 3.0 1,100 2.2 3,700 2.3 1,100 2.4 500 4.0 800 2.7 2,300 1.8 800 1.5 300 1.8 300 1.7 1,400
UNICEF regions East Asia and Pacific 0.9 1,900 2.4 2,200 7.2 6,500 2.7 10,700 1.1 1,300 3.0 1,500 8.8 4,200 3.3 7,000 0.6 600 1.8 800 5.4 2,300 2.0 3,700
Europe and Central Asia 6.1 4,800 5.0 1,600 4.6 1,400 5.5 7,900 6.8 2,800 6.3 1,000 6.2 1,000 6.6 4,800 5.3 2,000 3.7 600 2.9 400 4.4 3,100
Latin America and Caribbean 1.6 1,200 3.7 1,200 9.8 3,100 4.0 5,500 2.2 800 5.4 900 13.9 2,300 5.7 3,900 1.0 400 2.1 300 5.6 900 2.3 1,600
Middle East and North Africa 2.0 1,300 4.2 1,000 8.6 1,900 3.8 4,200 2.7 900 5.7 700 11.8 1,300 5.2 2,900 1.1 400 2.6 300 5.3 600 2.3 1,200
North America - - - - 1.2 200 0.3 200 - - - - 1.6 100 0.4 100 - - - - 0.7 - 0.2 -
South Asia 0.5 1,300 2.2 2,300 6.9 7,200 2.4 10,800 0.6 800 2.8 1,600 11.1 6,100 3.6 8,400 0.4 500 1.5 700 2.3 1,200 1.1 2,400
Sub-Saharan Africa 7.1 15,400 11.9 9,800 19.4 14,700 10.6 39,800 8.1 9,000 13.9 5,800 21.8 8,300 12.1 23,100 5.9 6,400 9.8 4,000 16.9 6,300 9.0 16,800
Children in hazardous work who are not attending school
Total 33.0 8,500 40.2 7,300 53.2 18,700 43.6 34,500 33.3 5,200 40.9 4,700 56.0 13,000 45.5 22,900 32.5 3,400 39.1 2,600 47.7 5,600 40.3 11,600
Rural 33.3 6,600 41.2 5,700 54.1 12,200 43.6 24,500 33.6 4,000 41.9 3,600 57.2 8,600 45.5 16,200 32.7 2,600 40.0 2,100 48.0 3,700 40.2 8,300
Urban 31.9 1,900 37.3 1,600 51.6 6,400 43.7 9,900 32.0 1,100 38.0 1,100 53.7 4,500 45.5 6,700 31.7 800 36.1 600 47.2 1,900 40.5 3,300
Children in hazardous work by sector of economic activity
Agriculture 71.9 18,600 70.5 12,800 47.6 16,700 60.8 48,100 75.2 11,700 71.1 8,100 46.7 10,900 61.0 30,700 67.0 6,900 69.5 4,700 49.3 5,800 60.3 17,400
Industry 9.1 2,300 11.5 2,100 24.0 8,400 16.3 12,800 11.2 1,700 13.2 1,500 28.2 6,600 19.6 9,800 5.8 600 8.6 600 15.7 1,800 10.5 3,000
Services 19.0 4,900 18.0 3,300 28.4 10,000 23.0 18,100 13.6 2,100 15.8 1,800 25.1 5,800 19.4 9,700 27.2 2,800 21.9 1,500 35.1 4,100 29.2 8,400
Of which domestic work 2.6 700 3.5 600 5.6 2,000 4.2 3,300 0.7 100 2.2 300 3.3 800 2.2 1,100 5.7 600 5.7 400 10.4 1,200 7.6 2,200
Children in hazardous work by employment status
Employees 11.5 3,000 18.8 3,400 42.3 14,800 26.8 21,200 14.5 2,300 23.9 2,700 43.9 10,200 30.3 15,200 7.0 700 10.2 700 38.9 4,600 20.8 6,000
Own-account workers 6.7 1,700 12.2 2,200 15.0 5,300 11.6 9,200 8.4 1,300 13.9 1,600 16.1 3,800 13.2 6,700 4.1 400 9.4 600 12.7 1,500 8.8 2,500
Contributing family workers 81.8 21,100 69.0 12,500 42.8 15,000 61.5 48,600 77.1 12,000 62.2 7,100 39.9 9,300 56.5 28,400 88.9 9,200 80.4 5,400 48.4 5,700 70.4 20,300
HAZARDOUS WORK Percentage and number of children aged 5 to 17 years in hazardous work
Notes: Numbers are expressed in thousands and have been rounded. Because of the rounding, disaggregated numbers do not always add up to total values and figures in percentages do not always add up to 100 per cent. For the same reason, the values presented in earlier pages of the report do not always match the values presented in this table. The regional groupings used by ILO and UNICEF, as well as those used for SDG reporting, vary slightly. This explains why the values for some regions differ, even if the labels are the same. The dash for North America indicates that, in the absence of data, values are assumed to be null. Caution is warranted when interpreting values for Europe and Northern America due to low data coverage for children aged 5 to 14.
76
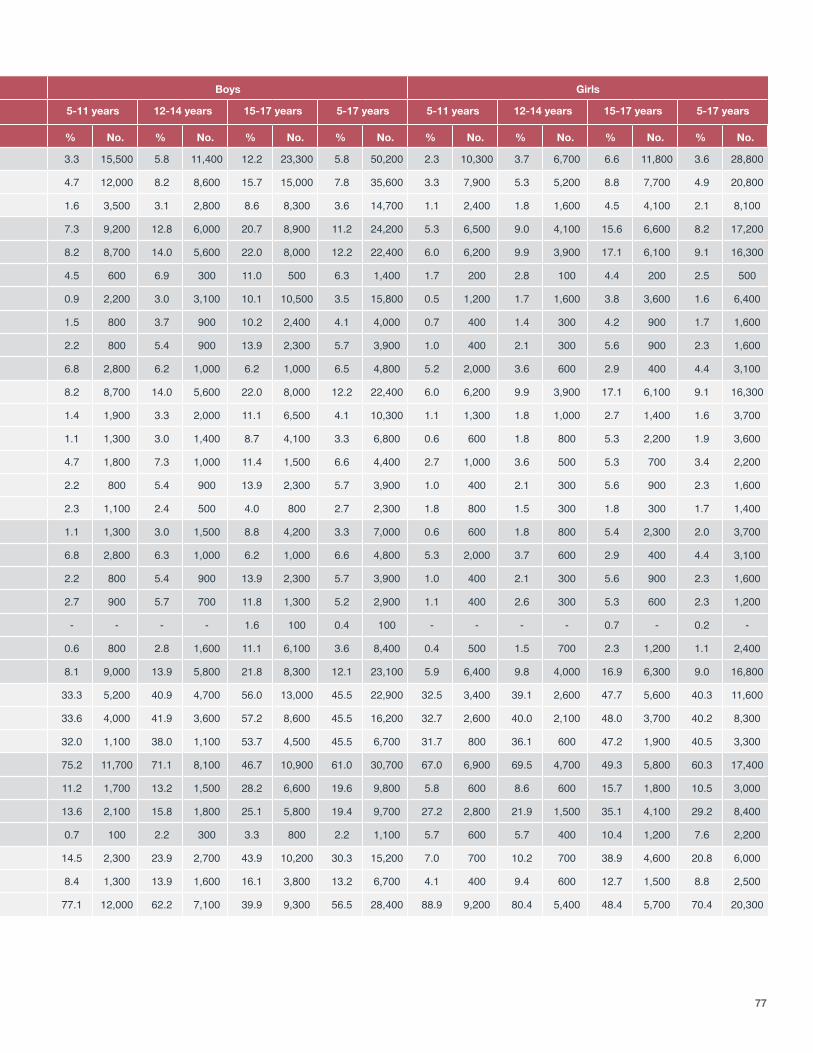
Total Boys Girls
5-11 years 12-14 years 15-17 years 5-17 years 5-11 years 12-14 years 15-17 years 5-17 years 5-11 years 12-14 years 15-17 years 5-17 years
% No. % No. % No. % No. % No. % No. % No. % No. % No. % No. % No. % No.
World total 2.8 25,900 4.8 18,100 9.5 35,000 4.7 79,000 3.3 15,500 5.8 11,400 12.2 23,300 5.8 50,200 2.3 10,300 3.7 6,700 6.6 11,800 3.6 28,800
Residence
Rural 4.0 20,000 6.8 13,700 12.4 22,600 6.4 56,300 4.7 12,000 8.2 8,600 15.7 15,000 7.8 35,600 3.3 7,900 5.3 5,200 8.8 7,700 4.9 20,800
Urban 1.4 5,900 2.5 4,400 6.6 12,400 2.9 22,700 1.6 3,500 3.1 2,800 8.6 8,300 3.6 14,700 1.1 2,400 1.8 1,600 4.5 4,100 2.1 8,100
ILO regions
Africa 6.4 15,700 10.9 10,200 18.2 15,500 9.7 41,400 7.3 9,200 12.8 6,000 20.7 8,900 11.2 24,200 5.3 6,500 9.0 4,100 15.6 6,600 8.2 17,200
Sub-Saharan Africa 7.1 14,900 12.0 9,500 19.5 14,200 10.7 38,600 8.2 8,700 14.0 5,600 22.0 8,000 12.2 22,400 6.0 6,200 9.9 3,900 17.1 6,100 9.1 16,300
Arab States 3.1 800 4.9 500 7.8 700 4.5 1,900 4.5 600 6.9 300 11.0 500 6.3 1,400 1.7 200 2.8 100 4.4 200 2.5 500
Asia and the Pacific 0.7 3,300 2.3 4,700 7.1 14,100 2.6 22,200 0.9 2,200 3.0 3,100 10.1 10,500 3.5 15,800 0.5 1,200 1.7 1,600 3.8 3,600 1.6 6,400
Americas 1.1 1,200 2.6 1,200 7.2 3,300 2.9 5,700 1.5 800 3.7 900 10.2 2,400 4.1 4,000 0.7 400 1.4 300 4.2 900 1.7 1,600
Latin America and the Caribbean 1.6 1,200 3.7 1,200 9.8 3,100 4.0 5,500 2.2 800 5.4 900 13.9 2,300 5.7 3,900 1.0 400 2.1 300 5.6 900 2.3 1,600
Europe and Central Asia 6.0 4,800 4.9 1,600 4.6 1,400 5.5 7,900 6.8 2,800 6.2 1,000 6.2 1,000 6.5 4,800 5.2 2,000 3.6 600 2.9 400 4.4 3,100
SDG regions
Sub-Saharan Africa 7.1 14,900 12.0 9,500 19.5 14,200 10.7 38,600 8.2 8,700 14.0 5,600 22.0 8,000 12.2 22,400 6.0 6,200 9.9 3,900 17.1 6,100 9.1 16,300
Central and Southern Asia 1.2 3,200 2.6 2,900 7.1 7,900 2.9 14,000 1.4 1,900 3.3 2,000 11.1 6,500 4.1 10,300 1.1 1,300 1.8 1,000 2.7 1,400 1.6 3,700
Eastern and South-Eastern Asia 0.9 1,900 2.4 2,200 7.1 6,300 2.6 10,400 1.1 1,300 3.0 1,400 8.7 4,100 3.3 6,800 0.6 600 1.8 800 5.3 2,200 1.9 3,600
Northern Africa and Western Asia 3.7 2,800 5.5 1,500 8.5 2,200 5.1 6,500 4.7 1,800 7.3 1,000 11.4 1,500 6.6 4,400 2.7 1,000 3.6 500 5.3 700 3.4 2,200
Latin America and the Caribbean 1.6 1,200 3.7 1,200 9.8 3,100 4.0 5,500 2.2 800 5.4 900 13.9 2,300 5.7 3,900 1.0 400 2.1 300 5.6 900 2.3 1,600
Europe and Northern America 2.1 1,800 2.0 700 3.0 1,100 2.2 3,700 2.3 1,100 2.4 500 4.0 800 2.7 2,300 1.8 800 1.5 300 1.8 300 1.7 1,400
UNICEF regions East Asia and Pacific 0.9 1,900 2.4 2,200 7.2 6,500 2.7 10,700 1.1 1,300 3.0 1,500 8.8 4,200 3.3 7,000 0.6 600 1.8 800 5.4 2,300 2.0 3,700
Europe and Central Asia 6.1 4,800 5.0 1,600 4.6 1,400 5.5 7,900 6.8 2,800 6.3 1,000 6.2 1,000 6.6 4,800 5.3 2,000 3.7 600 2.9 400 4.4 3,100
Latin America and Caribbean 1.6 1,200 3.7 1,200 9.8 3,100 4.0 5,500 2.2 800 5.4 900 13.9 2,300 5.7 3,900 1.0 400 2.1 300 5.6 900 2.3 1,600
Middle East and North Africa 2.0 1,300 4.2 1,000 8.6 1,900 3.8 4,200 2.7 900 5.7 700 11.8 1,300 5.2 2,900 1.1 400 2.6 300 5.3 600 2.3 1,200
North America - - - - 1.2 200 0.3 200 - - - - 1.6 100 0.4 100 - - - - 0.7 - 0.2 -
South Asia 0.5 1,300 2.2 2,300 6.9 7,200 2.4 10,800 0.6 800 2.8 1,600 11.1 6,100 3.6 8,400 0.4 500 1.5 700 2.3 1,200 1.1 2,400
Sub-Saharan Africa 7.1 15,400 11.9 9,800 19.4 14,700 10.6 39,800 8.1 9,000 13.9 5,800 21.8 8,300 12.1 23,100 5.9 6,400 9.8 4,000 16.9 6,300 9.0 16,800
Children in hazardous work who are not attending school
Total 33.0 8,500 40.2 7,300 53.2 18,700 43.6 34,500 33.3 5,200 40.9 4,700 56.0 13,000 45.5 22,900 32.5 3,400 39.1 2,600 47.7 5,600 40.3 11,600
Rural 33.3 6,600 41.2 5,700 54.1 12,200 43.6 24,500 33.6 4,000 41.9 3,600 57.2 8,600 45.5 16,200 32.7 2,600 40.0 2,100 48.0 3,700 40.2 8,300
Urban 31.9 1,900 37.3 1,600 51.6 6,400 43.7 9,900 32.0 1,100 38.0 1,100 53.7 4,500 45.5 6,700 31.7 800 36.1 600 47.2 1,900 40.5 3,300
Children in hazardous work by sector of economic activity
Agriculture 71.9 18,600 70.5 12,800 47.6 16,700 60.8 48,100 75.2 11,700 71.1 8,100 46.7 10,900 61.0 30,700 67.0 6,900 69.5 4,700 49.3 5,800 60.3 17,400
Industry 9.1 2,300 11.5 2,100 24.0 8,400 16.3 12,800 11.2 1,700 13.2 1,500 28.2 6,600 19.6 9,800 5.8 600 8.6 600 15.7 1,800 10.5 3,000
Services 19.0 4,900 18.0 3,300 28.4 10,000 23.0 18,100 13.6 2,100 15.8 1,800 25.1 5,800 19.4 9,700 27.2 2,800 21.9 1,500 35.1 4,100 29.2 8,400
Of which domestic work 2.6 700 3.5 600 5.6 2,000 4.2 3,300 0.7 100 2.2 300 3.3 800 2.2 1,100 5.7 600 5.7 400 10.4 1,200 7.6 2,200
Children in hazardous work by employment status
Employees 11.5 3,000 18.8 3,400 42.3 14,800 26.8 21,200 14.5 2,300 23.9 2,700 43.9 10,200 30.3 15,200 7.0 700 10.2 700 38.9 4,600 20.8 6,000
Own-account workers 6.7 1,700 12.2 2,200 15.0 5,300 11.6 9,200 8.4 1,300 13.9 1,600 16.1 3,800 13.2 6,700 4.1 400 9.4 600 12.7 1,500 8.8 2,500
Contributing family workers 81.8 21,100 69.0 12,500 42.8 15,000 61.5 48,600 77.1 12,000 62.2 7,100 39.9 9,300 56.5 28,400 88.9 9,200 80.4 5,400 48.4 5,700 70.4 20,300
77

Children aged 5 to 17 years in child labour
Children aged 5 to 17 years in hazardous work
2016 2020 2016 2020
% No. % No. % No. % No.
World total 9.6 151,600 9.6 160,000 4.6 72,500 4.7 79,000
Sex Girls 8.4 64,100 7.8 62,900 3.6 27,800 3.6 28,800
Boys 10.7 87,500 11.2 97,000 5.5 44,800 5.8 50,200
Age 5-11 years 8.3 72,600 9.7 89,300 2.2 19,000 2.8 25,900
12-14 years 11.7 41,900 9.3 35,600 4.6 16,400 4.8 18,100
15-17 years 10.5 37,100 9.5 35,000 10.5 37,100 9.5 35,000
ILO regions Africa 19.6 72,100 21.6 92,200 8.6 31,500 9.7 41,400
Sub-Saharan Africa 22.4 70,000 23.9 86,600 9.8 30,500 10.7 38,600
Arab States 2.9 1,200 5.8 2,400 1.5 600 4.5 1,900
Asia and the Pacific 7.4 62,100 5.6 48,700 3.4 28,500 2.6 22,200
Americas 5.3 10,700 4.3 8,300 3.2 6,600 2.9 5,700
Latin America and the Caribbean 7.3 10,500 6.0 8,200 4.4 6,300 4.0 5,500
Europe and Central Asia 4.1 5,500 5.7 8,300 4.0 5,300 5.5 7,900
National income grouping
Low income 19.4 65,200 26.2 65,000 8.8 29,700 11.6 28,700
Lower-middle income 8.5 58,200 9.0 69,700 4.9 33,500 4.3 33,600
Upper-middle income 6.6 26,200 4.9 23,700 2.0 7,800 3.2 15,300
High income 1.2 2,000 0.9 1,600 1.0 1,600 0.8 1,500
CHILD LABOUR AND HAZARDOUS WORK: TRENDS
Notes: Numbers are expressed in thousands and have been rounded. Because of the rounding, disaggregated numbers do not always add up to total values.Trend data are not available for SDG and UNICEF regions.
78
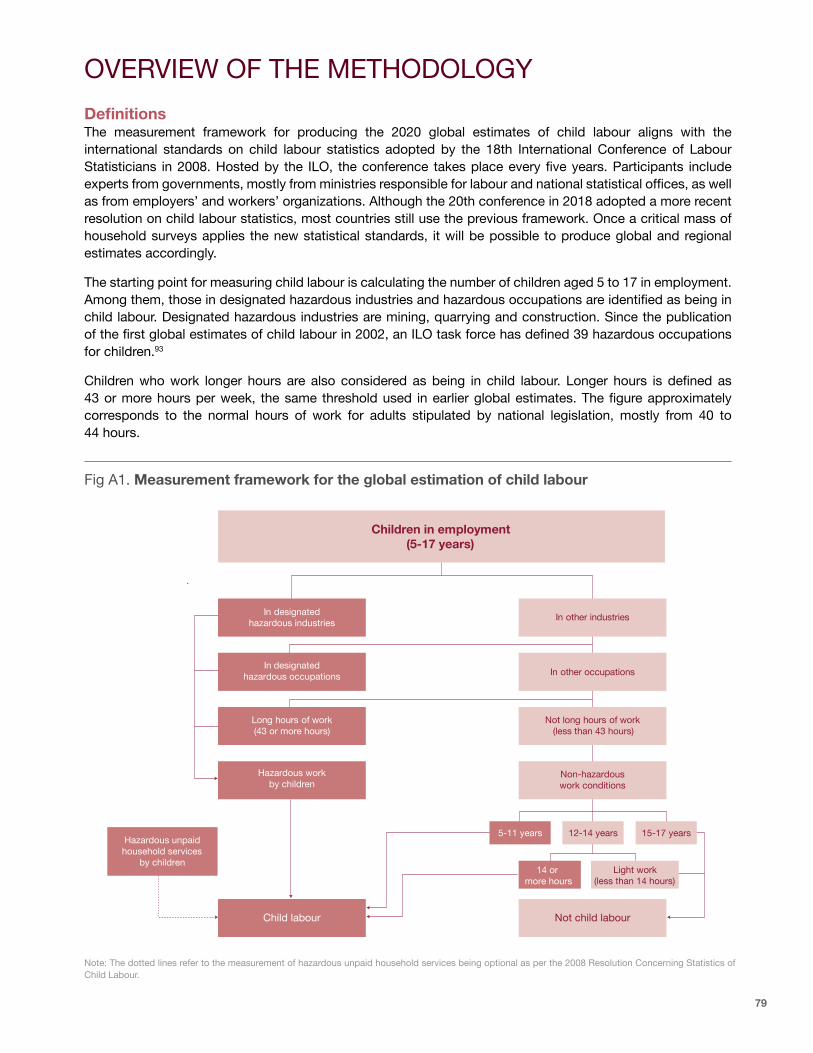
Definitions The measurement framework for producing the 2020 global estimates of child labour aligns with the international standards on child labour statistics adopted by the 18th International Conference of Labour Statisticians in 2008. Hosted by the ILO, the conference takes place every five years. Participants include experts from governments, mostly from ministries responsible for labour and national statistical offices, as well as from employers’ and workers’ organizations. Although the 20th conference in 2018 adopted a more recent resolution on child labour statistics, most countries still use the previous framework. Once a critical mass of household surveys applies the new statistical standards, it will be possible to produce global and regional estimates accordingly.
The starting point for measuring child labour is calculating the number of children aged 5 to 17 in employment. Among them, those in designated hazardous industries and hazardous occupations are identified as being in child labour. Designated hazardous industries are mining, quarrying and construction. Since the publication of the first global estimates of child labour in 2002, an ILO task force has defined 39 hazardous occupations for children.93
Children who work longer hours are also considered as being in child labour. Longer hours is defined as 43 or more hours per week, the same threshold used in earlier global estimates. The figure approximately corresponds to the normal hours of work for adults stipulated by national legislation, mostly from 40 to 44 hours.
Children in employment(5-17 years)
In other industries
In other occupations
Not long hours of work (less than 43 hours)
Non-hazardouswork conditions
Not child labour
In designatedhazardous industries
In designatedhazardous occupations
Long hours of work(43 or more hours)
Hazardous workby children
Child labour
5-11 years 12-14 years 15-17 years
14 or more hours
Light work (less than 14 hours)
Hazardous unpaidhousehold services
by children
Fig A1. Measurement framework for the global estimation of child labour
OVERVIEW OF THE METHODOLOGY
Note: The dotted lines refer to the measurement of hazardous unpaid household services being optional as per the 2008 Resolution Concerning Statistics of Child Labour.
79

The total number of children in designated hazardous industries, in hazardous occupations or working longer hours constitutes the overall number of children in hazardous work.
Obtaining the final estimate of child labour involves adding two more categories to the calculation: children aged 5 to 11 engaged in any form of employment and children aged 12 to 14 working 14 hours or more per week (see Figure A1). For those aged 12 to 14, the 14-hour threshold distinguishes between permissible light work and other work. The same threshold was used in earlier estimates. It corresponds to two hours of work per day over a calendar week, covering both school days and holidays.
The child labour statistical framework of the International Conference of Labour Statisticians provides a separate measurement of hazardous unpaid household services by children. The indicator captures the performance of household chores by children aged 5 to 14 for 21 or more hours per week. There are no hour thresholds for children aged 15 to 17.
Data sources The estimates are based on a wide range of nationally representative household surveys that fully or partially cover children aged 5 to 17. In total, the estimates used 106 national data sets, tracking 66 per cent of the world’s population of children in that age group. The data sets came from 32 national Multiple Indicator Cluster Surveys implemented with UNICEF’s support; 30 national labour force surveys conducted under Eurostat regulations with figures specific to children aged 15 to 17; 22 additional national labour force surveys or other national household surveys; 16 child labour surveys implemented with the ILO; and 6 Demographic and Health Surveys implemented mostly with funding from the United States Agency for International Development.
Eighty per cent of surveys were within the reference period of 2016 to 2020.
The harmonization of reference years was carried out as part of the calculation of extrapolation weights. The main means of harmonizing national data sets was by processing national household survey data according to a pre-defined framework favouring comparability across countries and over time, following internationally agreed standards, concepts and definitions. Population data came from the United Nations World Population Prospects, with annual indicators by broad age groups and sex, and for different countries and years based on the latest 2020 data.
Modelling strategy for imputationFor countries without data, an imputation model was constructed, premised on the understanding that data were not missing at random and that variables describing country characteristics contained useful information.
Two broad classes of indicators were produced on rates and distributions. Rates included children in employment (CiE), child labour, hazardous work, domestic work and the two indicators used for reporting on SDG target 8.7 (the proportion of children engaged in economic activity, and the proportion of children engaged in economic activity and household chores). The rates were computed based on the proportion of a relevant population. For instance, the CiE rate was calculated as a share of children in employment in the total population of children.
Distribution indicators were further breakdowns of the CiE, child labour and hazardous work rates, comprising status in employment, school attendance and economic activity.
Except for domestic work,94 the rate indicators were defined at the country, sex, age and geographic levels as follows:
Age groups• 5 to 11• 12 to 14 • 15 to 17 • 5 to 17
Sex• Male• Female• Total
Geography• Rural • Urban • National
80
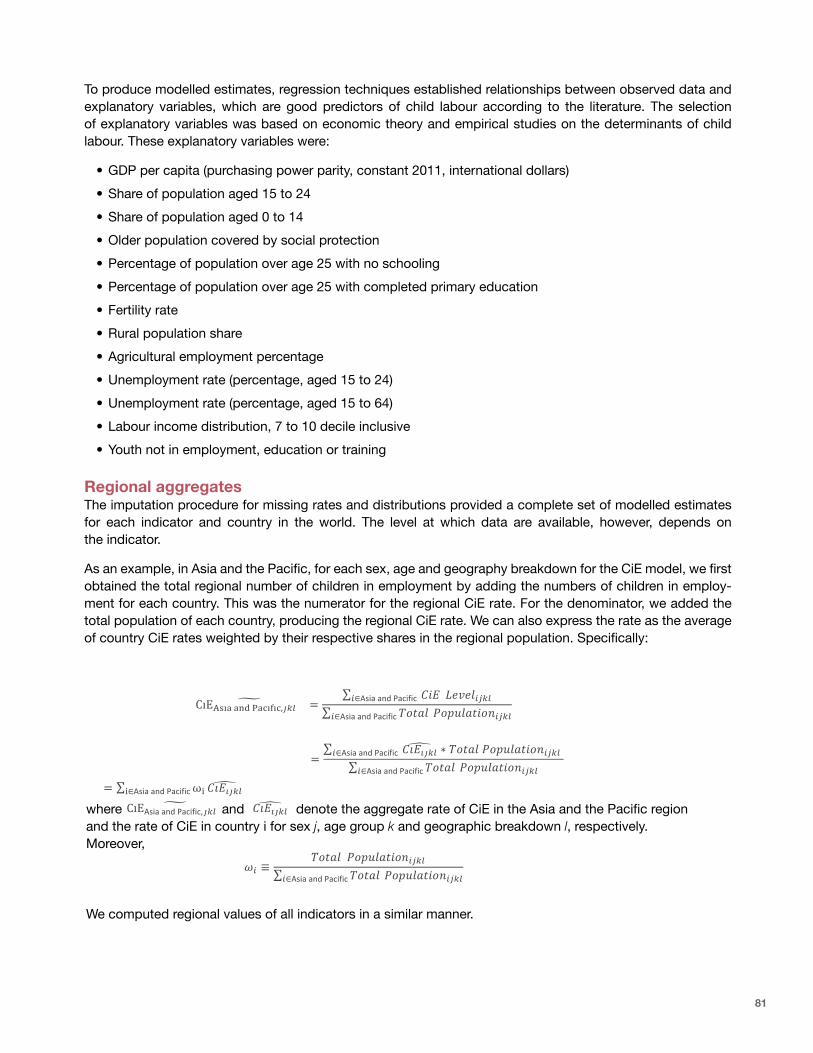
To produce modelled estimates, regression techniques established relationships between observed data and explanatory variables, which are good predictors of child labour according to the literature. The selection of explanatory variables was based on economic theory and empirical studies on the determinants of child labour. These explanatory variables were:
• GDP per capita (purchasing power parity, constant 2011, international dollars)
• Share of population aged 15 to 24
• Share of population aged 0 to 14
• Older population covered by social protection
• Percentage of population over age 25 with no schooling
• Percentage of population over age 25 with completed primary education
• Fertility rate
• Rural population share
• Agricultural employment percentage
• Unemployment rate (percentage, aged 15 to 24)
• Unemployment rate (percentage, aged 15 to 64)
• Labour income distribution, 7 to 10 decile inclusive
• Youth not in employment, education or training
Regional aggregates The imputation procedure for missing rates and distributions provided a complete set of modelled estimates for each indicator and country in the world. The level at which data are available, however, depends on the indicator.
As an example, in Asia and the Pacific, for each sex, age and geography breakdown for the CiE model, we first obtained the total regional number of children in employment by adding the numbers of children in employ-ment for each country. This was the numerator for the regional CiE rate. For the denominator, we added the total population of each country, producing the regional CiE rate. We can also express the rate as the average of country CiE rates weighted by their respective shares in the regional population. Specifically:
• Share of population aged 0-‐14 • Older population covered by social protection
• Percentage of population over age 25 with no schooling
• Percentage of population over age 25 with completed primary education
• Fertility rate
• Rural population share
• Agricultural employment percentage
• Unemployment rate (percentage, aged 15-‐24) • Unemployment rate (percentage, aged 15-‐64) • Labour income distribution, 7-‐10 decile inclusive
• Youth not in employment, education or training Regional aggregates
The imputation procedure for missing rates and distributions provided a complete set of modelled estimates for each indicator and country in the world. The level at which data are available, however, depends on the indicator.
As an example, in Asia and the Pacific, for each gender, age and geography breakdown for the CiE model, we first obtained the total regional number of children in employment by adding the numbers of children in employment for each country. This was the numerator for the regional CiE rate. For the denominator, we added the total population of each country, producing the regional CiE rate. We can also express the rate as the average of country CiE rates weighted by their respective shares in the regional population. Specifically:
CıE!"#$ !"# !"#$%$#,!"# =𝐶𝐶𝐶𝐶𝐶𝐶!∈Asia and Pacific 𝐿𝐿𝐿𝐿𝐿𝐿𝐿𝐿𝐿𝐿!"#$
𝑇𝑇𝑇𝑇𝑇𝑇𝑇𝑇𝑇𝑇!∈Asia and Pacific 𝑃𝑃𝑃𝑃𝑃𝑃𝑃𝑃𝑃𝑃𝑃𝑃𝑃𝑃𝑃𝑃𝑃𝑃𝑛𝑛!"#$
=𝐶𝐶𝐶𝐶𝐸𝐸!"#$!∈Asia and Pacific ∗ 𝑇𝑇𝑇𝑇𝑇𝑇𝑇𝑇𝑇𝑇 𝑃𝑃𝑃𝑃𝑝𝑝𝑝𝑝𝑝𝑝𝑝𝑝𝑝𝑝𝑝𝑝𝑝𝑝𝑛𝑛!"#$
𝑇𝑇𝑇𝑇𝑇𝑇𝑇𝑇𝑇𝑇!∈Asia and Pacific 𝑃𝑃𝑃𝑃𝑃𝑃𝑃𝑃𝑃𝑃𝑃𝑃𝑃𝑃𝑃𝑃𝑃𝑃𝑛𝑛!"#$
= ω!!∈Asia and Pacific 𝐶𝐶𝐶𝐶𝐸𝐸!"#$ where CıEAsia and Pacific,!"# and 𝐶𝐶𝐶𝐶𝐸𝐸!"#$ denote the aggregate rate of CiE in the Asia and the Pacific region and the rate of CiE in country i for sex j, age group k and geographic breakdown l, respectively. Moreover,
𝜔𝜔! ≡𝑇𝑇𝑇𝑇𝑇𝑇𝑇𝑇𝑇𝑇 𝑃𝑃𝑃𝑃𝑃𝑃𝑃𝑃𝑃𝑃𝑃𝑃𝑃𝑃𝑃𝑃𝑃𝑃𝑃𝑃!"#$
𝑇𝑇𝑇𝑇𝑇𝑇𝑇𝑇𝑇𝑇!∈Asia and Pacific 𝑃𝑃𝑃𝑃𝑃𝑃𝑃𝑃𝑃𝑃𝑃𝑃𝑃𝑃𝑃𝑃𝑃𝑃𝑛𝑛!"#$
We computed regional values of all indicators in a similar manner.
Evaluation of the results The 106 countries used to generate the estimates are a sample of all the countries in the world. If another sample had been selected, the results would have differed to a degree that is important to determine in order to understand the robustness of estimated results. This can be done through the calculation of standard deviations associated with different global and regional estimates.
Gretchen Luchsinger 5/21/2021 1:35 PMComment [68]: Is this correct?
Tina Johnson 5/24/2021 7:58 AMComment [69]: Or is it the total number of children?
where and denote the aggregate rate of CiE in the Asia and the Pacific region and the rate of CiE in country i for sex j, age group k and geographic breakdown l, respectively. Moreover,
We computed regional values of all indicators in a similar manner.
81

Evaluation of the results The 106 countries used to generate the estimates are a sample of all the countries in the world. If another sample had been selected, the results would have differed to a degree that is important to determine in order to understand the robustness of the estimated results. This can be done through the calculation of standard deviations associated with different global and regional estimates.
Accordingly, the standard deviations of the 2020 global and regional estimates were calculated to assess the change in estimates caused by sampling variability. This indicator of uncertainty does not account for the uncertainty associated with actual observations. Furthermore, the exercise cannot account for unknown bias in the modelling procedure. These limitations notwithstanding, the results indicate the margin of error resulting from the imputation of countries that has been excluded in a pseudo out-of-sample exercise.
The variation in the indicator of children in employment was estimated by running the econometric model 150 times. In each run, countries with a probability of 15 per cent were removed from the sample, which resulted on average in 15 countries dropped per run. This yielded the standard deviation of the global and regional estimates (see Table A1). Whereas this exercise did not compute a confidence interval (as we were not accounting for all sources of uncertainty, including input data uncertainty), it quantified the robustness of the modelled estimates.
Children in employment (thousands)
Children in employment (percentage)
Standard deviation (percentage points)
World 222,088 13.3 1.0
Africa 124,122 29.1 0.8
Sub-Saharan Africa 115,766 32.0 0.8
Americas 14,672 7.5 0.6
Latin America and the Caribbean
12,422 9.1 0.7
Arab States 3,447 8.1 -
Asia and the Pacific 67,960 7.8 1.8
Europe and Central Asia 11,886 8.2 0.7
Table A1. Children aged 5 to 17 years in employment
Notes: The table shows regional groupings used for ILO reporting. The dash for the Arab States indicates that the standard deviation could not be calculated due to the small number of available data sets for this region.
82

1. See Resolution II concerning statistics on child labour in: International Labour Organization, ‘Report of the Conference: 18th International Conference of Labour Statisticians, Geneva, 24 November–5 December 2008’, ICLS/18/2008/IV/FINAL, ILO, Geneva, 2009. Although there is a more recent resolution concerning statistics on child labour (20th International Conference of Labour Statisticians, 2018), most countries still use the previous statistical framework (18th International Conference of Labour Statisticians, 2008). The ILO is actively supporting the efforts of countries to transition to the most recent statistical standards. Once a critical mass of household surveys uses the new statistical standards, it will be possible to produce global and regional estimates based on them.
2. Two indicators are used for reporting on SDG target 8.7. The first is based on the production boundary of the United Nations System of National Accounts (Indicator 8.7.1) and the second on the general production boundary (Indicator 8.7.2). The 21 weekly hours threshold for household chores hours is consistent with the number used for indicator 8.7.2.
3. Prior to 2008, global estimates were limited to children in economic activity in the narrower 5 to 14 age range.
4. The World Bank, ‘World Development Indicators’, World Bank, Washington, DC, <https://datatopics.worldbank.org/world-development-indicators>, accessed 7 June 2021. Latest years available. Extreme poverty is defined as living on less than $1.90 per person per day in 2011 purchasing power parity. The percentage of the population living in extreme poverty is 1 per cent in East Asia and the Pacific and 3.7 per cent in Latin America and the Caribbean.
5. ‘World Development Indicators’.
6. Ibid.
7. United Nations Development Programme, ‘Informality and Social Protection in African Countries: A forward-looking assessment’, UNDP, New York, 2021.
8. International Labour Organization, Women and Men in the Informal Economy: A statistical picture, International Labour Office, Geneva, 2018, <www.ilo.org/wcmsp5/groups/public/---dgreports/---dcomm/documents/publication/wcms_626831.pdf>, accessed 17 May 2021.
9. International Labour Organization, World Social Protection Report 2017-19: Universal social protection to achieve the Sustainable Development Goals, International Labour Office, Geneva, 2017.
10. World Bank, The State of Social Safety Nets 2018, World Bank, Washington, DC, 2018, <https://openknowledge.worldbank.org/handle/10986/29115>, accessed 7 June 2021.
11. World Social Protection Report 2017-19.
12. United Nations Educational, Scientific and Cultural Organization Institute for Statistics, ‘Education in Africa’, UIS, Montreal, Quebec, 2021, <http://uis.unesco.org/en/topic/education-africa>, accessed 7 June 2021.
13. ‘World Development Indicators’.
14. Figures for 2008 are from Diallo, Yacouba, et al., Global Child Labour Developments: Measuring trends from 2004 to 2008, International Programme on the Elimination of Child Labour, International Labour Office, Geneva, 2010. Figures for 2020 are from United Nations, 2019 Revision of World Population Prospects, Department of Economic and Social Affairs, New York, 2019, <https://population.un.org/wpp/>, accessed 7 June 2021.
15. World Bank, ‘Classification of Fragile and Conflict-Affected Situations’, World Bank, Washington, DC, July 2020, <www.
worldbank.org/en/topic/fragilityconflictviolence/brief/harmonized-list-of-fragile-situations>, accessed 4 June 2021.
16. United Nations General Assembly, ‘Assistance to Refugees, Returnees and Displaced Persons in Africa: Report of the Secretary-General’, A/75/322, United Nations, New York, 24 August 2020, <https://digitallibrary.un.org/record/3886099>, accessed 4 June 2021.
17. Joint United Nations Programme on HIV/AIDS, Seizing the Moment: Tackling entrenched inequalities to end epidemics – Global AIDS update 2020, UNAIDS, Geneva, 2020.
18. See, for example, International Labour Organization, ‘An Overview of Child Labour in Agriculture’, ILO and the International Programme on the Elimination of Child Labour, Geneva, 2007, <www.ilo.org/wcmsp5/groups/public/---asia/---ro-bangkok/documents/publication/wcms_098346.pdf>, accessed 26 May 2021.
19. See, for example, International Labour Organization, ‘Fishing and Aquaculture’, ILO, Geneva, <www.ilo.org/ipec/areas/Agriculture/WCMS_172419/lang--en/index.htm#:~:text=The%20ILO%20considers%20fishing%20a,time%20far%20away%20from%20home>, accessed 26 May 2021.
20. See, for example, Child Labour Platform and International Labour Organization, Child Labour in Mining and Global Supply Chains, ILO, Geneva, May 2019, <www.ilo.org/wcmsp5/groups/public/---asia/---ro-bangkok/---ilo-manila/documents/publication/wcms_720743.pdf>, accessed 26 May 2021.
21. Edmonds, Eric V., ‘Economic Growth and Child Labor in Low Income Economies’, GLM|LIC Synthesis Paper No. 3, IZA Institute of Labor Economics, Bonn, April 2016, <https://g2lm-lic.iza.org/wp-content/uploads/2017/06/glmlic_sp003.pdf>, accessed 26 May 2021.
22. ‘Classification of Fragile and Conflict-Affected Situations’.
23. United Nations Children’s Fund and Save the Children, ‘Children in Monetary Poor Households and COVID-19: Technical note’, UNICEF, New York, November 2020, <https://data.unicef.org/resources/children-in-monetary-poor-households-and-covid-19>, accessed 24 May 2021.
24. See, for example: Brazil: Duryea, Suzanne, David Lam and Deborah Levison, ‘Effects of Economic Shocks on Children’s Employment and Schooling in Brazil’, Journal of Development Economics, vol. 84, no. 1, 2007, pp. 188-214; Guatemala: Guarcello, Lorenzo, Fabrizia Mealli and Furio C. Rosati, ‘Household Vulnerability and Child Labor: The effect of shocks, credit rationing, and insurance’, Journal of Population Economics, vol. 23, no. 1, 2010, pp. 169-198; India: Jacoby, Hanan G., and Emmanuel Skoufias, ‘Risk, Financial Markets, and Human Capital in a Developing Country’, The Review of Economic Studies, vol. 64, no. 3, 1997, pp. 311-335; Mexico: De Janvry, Alain, et al., ‘Can Conditional Cash Transfer Programs Serve as Safety Nets in Keeping Children at School and from Working When Exposed to Shocks?’, Journal of Development Economics, vol. 79, no. 2, 2006, pp. 349-373; United Republic of Tanzania: Beegle, Kathleen, Rajeev H. Dehejia and Roberta Gatti, ‘Child Labor and Agricultural Shocks’, Journal of Development Economics, vol. 81, no. 1, 2006, pp. 80-96.
25. One example: Edmonds, Eric V., and Norbert Schady, ‘Poverty Alleviation and Child Labor’, American Economic Journal: Economic Policy, vol. 4, no. 4, 2012, pp. 100-124.
26. Human Rights Watch, ‘“I Must Work to Eat”: COVID-19, poverty, and child labor in Ghana, Nepal, and Uganda’, Human Rights Watch, New York, 2021, <www.hrw.org/report/2021/05/26/i-must-work-eat/covid-19-poverty-and-child-labor-ghana-nepal-and-uganda#>, accessed 4 June 2021.
ENDNOTES
83

27. International Cocoa Initiative, ‘Changes in Hazardous Child Labour in Côte d’Ivoire’s Cocoa Communities Before and After COVID-19 Partial Lockdown’, ICI, Châtelaine, Switzerland, November 2020, <https://cocoainitiative.org/knowledge-centre-post/changes-in-hazardous-child-labour-in-cote-divoires-cocoa-communities-before-and-after-covid-19-partial-lockdown>, accessed 14 May 2021.
28. United Nations Children’s Fund Ecuador and Inclusión SAS, ‘El Choque COVID-19 en la Pobreza, Desigualdad y Clases Sociales en el Ecuador: Una mirada a los hogares con niñas, niños y adolescentes’, UNICEF, Quito, 21 October 2020, <www.unicef.org/ecuador/informes/el-choque-covid-19-en-la-pobreza-desigualdad-y-clases-sociales-en-el-ecuador>, accessed 14 May 2021.
29. International Labour Organization, ‘Parents Send Their Children to Child Labour to Overcome the Economic Crisis of COVID-19’, Our Impact, Their Voices feature, ILO, Geneva, 25 June 2020, <www.ilo.org/africa/media-centre/articles/WCMS_749347/lang--en/index.htm>, accessed 14 May 2021.
30. United Nations Children’s Fund Brazil, ‘UNICEF Alerta para Aumento de Incidência do Trabalho Infantil Durante a Pandemia em São Paulo’, UNICEF, São Paulo, August 2020, <www.unicef.org/brazil/comunicados-de-imprensa/unicef-alerta-para-aumento-de-incidencia-do-trabalho-infantil-durante-pandemia-em-sao-paulo>, accessed 14 May 2021.
31. World Vision, ‘Act Now: Experiences and recommendations of girls and boys in West Africa during COVID-19’, 2020, <www.wvi.org/sites/default/files/2020-11/5-WV-WARO-Report-29-10-20.pdf>, accessed 14 May 2021.
32. Franceinfo Afrique, ‘Burkina Faso: Malgré le coronavirus, les enfants travaillent toujours dans la carrière de Pissy’, 2 July 2020, <www.francetvinfo.fr/monde/afrique/burkina-faso/burkina-faso-malgre-le-coronavirus-les-enfants-travaillent-toujours-dans-la-carriere-de-pissy_4023037.html>, accessed 14 May 2021.
33. International Labour Organization and United Nations Children’s Fund, ‘Technical Report on Global Estimates’, forthcoming.
34. The selected model includes a single poverty line ($3.20 a day line in 2011 purchasing power parity dollars), two control variables (age group and region) and social protection coverage (proportion of the population protected in at least one area of social protection). The poverty data are from the World Bank, Macro and Poverty Outlook: Country-by-country analysis and projections for the developing world, World Bank, Washington, DC, 2021, <https://www.worldbank.org/en/publication/macro-poverty-outlook>, accessed 15 July 2021, combined with World Bank estimates of the impact of COVID-19 on poverty. For a discussion of the methodology to estimate the impact, see Gerszon Mahler, Daniel, et al., ‘Updated Estimates of the Impact of COVID-19 on Global Poverty: Turning the corner on the pandemic in 2021?’, World Bank Blogs, 24 June 2021, <https://blogs.worldbank.org/opendata/updated-estimates-impact-covid-19-global-poverty-turning-corner-pandemic-2021>, accessed 10 February 2021.
35. International Labour Organization, ‘Declaration Concerning the Aims and Purposes of the International Labour Organisation (Declaration of Philadelphia)‘, Annex, ILO Constitution, ILO, Geneva, 1944, <www.ilo.org/legacy/english/inwork/cb-policy-guide/declarationofPhiladelphia1944.pdf>, accessed 7 June 2021.
36. International Labour Organization and United Nations Children’s Fund, ‘COVID-19 and Child Labour: A time of crisis, a time to act’, ILO and UNICEF, New York, 2020, <www.ilo.org/wcmsp5/groups/public/---ed_norm/---ipec/documents/publication/wcms_747421.pdf>, accessed 24 May 2021.
37. See, for example, International Labour Organization, Ending Child Labour by 2025: A review of policies and programmes, 2nd ed., International Labour Office, Geneva, 2018, <www.ilo.org/
wcmsp5/groups/public/---ed_norm/---ipec/documents/publication/wcms_653987.pdf>, accessed 24 May 2021; United Nations Children’s Fund, ‘Child Protection Advocacy Brief: Child labour’, UNICEF, New York, 2018, <www.unicef.org/media/73651/file/Child-Protection-Advocacy-Child-Labour-2018.pdf.pdf>, accessed 24 May 2021.
38. International Labour Organization, ‘Financing Gaps in Social Protection: Global estimates and strategies for developing countries in light of COVID-19 and beyond’, ILO Brief: Social Protection Spotlight, ILO, Geneva, 17 September 2020, <www.ilo.org/wcmsp5/groups/public/---ed_protect/---soc_sec/documents/publication/wcms_755475.pdf>, accessed 24 May 2021.
39. United Nations General Assembly, ‘Addis Ababa Action Agenda of The Third International Conference on Financing for Development’, A/RES/69/313, United Nations, New York, 27 July 2015.
40. United Nations Children’s Fund Office of Research–Innocenti, ‘COVID-19 and the Looming Debt Crisis’, UNICEF-IRC, Florence, 2021, <www.unicef-irc.org/publications/pdf/Social-spending-series_COVID-19-and-the-looming-debt-crisis.pdf>, accessed 24 May 2021.
41. Bakrania, Shivit and Ramya Subrahmanian, ‘Impacts of Pandemics and Epidemics on Child Protection: Lessons learned from a rapid review in the context of COVID-19’, Innocenti Research Briefs no. 2020-16, UNICEF-IRC, Florence, 2020.
42. ‘Children in Monetary Poor Households and COVID-19’.
43. See, for example, Dammert, Ana C., Jacobus de Hoop, Eric Mvukiyehe and Furio C. Rosati, ‘Effects of Public Policy on Child Labor: Current knowledge, gaps, and implications for program design’, World Development, vol. 110, 2018, pp. 104-123.
44. See, for example, International Labour Organization and United Nations Children’s Fund, Towards Universal Social Protection for Children: Achieving SDG 1.3 – ILO-UNICEF joint report on social protection for children, ILO and UNICEF, Geneva and New York, 2019.
45. International Labour Organization, World Social Protection Report 2020-2022, ILO, Geneva, forthcoming.
46. Bastagli, Francesca, Ian Orton and David Stewart, ‘From COVID-19 Response to Recovery: What role for universal child benefits?’, United Nations Children’s Fund blog, October 2020, <https://blogs.unicef.org/evidence-for-action/from-covid-19-response-to-recovery-what-role-for-universal-child-benefits>, accessed 24 May 2021.
47. World Social Protection Report 2020-2022; see also United Nations Development Programme and United Nations Entity for Gender Equality and the Empowerment of Women, ‘COVID-19 Global Gender Response Tracker’, UNDP and UN Women, New York, <https://data.undp.org/gendertracker>, accessed 24 May 2021.
48. See, for example, Towards Universal Social Protection for Children.
49. See, for example, Dammert, et al., ‘Effects of Public Policy on Child Labor’; De Hoop, Jacobus, and Furio C. Rosati, ‘Cash Transfers and Child Labor’, The World Bank Research Observer, vol. 29, no. 2, 2014, pp. 202-234; Rosati, Furio C., ‘Can Cash Transfers Reduce Child Labor?’ IZA World of Labour, April 2016, <https://wol.iza.org/uploads/articles/293/pdfs/can-cash-transfers-reduce-child-labor.pdf>, accessed 24 May 2021.
50. de Hoop, Jacobus, Valeria Groppo and Sudhanshu Handa, ‘Cash Transfers, Microentrepreneurial Activity, and Child Work: Evidence from Malawi and Zambia’, The World Bank Economic Review, vol. 34, no. 3, pp. 670-697, <https://doi.org/10.1093/wber/lhz004>, accessed 24 May 2021; Rosati, ‘Can Cash Transfers Reduce Child Labor?’.
51. Bastagli, Francesca, et al., Cash Transfers: What does the evidence
84

say? A rigorous review of programme impact and of the role of design and implementation features, Overseas Development Institute, London, July 2016, <https://cdn.odi.org/media/documents/11316.pdf>, accessed 24 May 2021.
52. This is particularly relevant to achieve SDG target 1.3 in line with the ILO Social Protection Floors Recommendation. International Labour Conference, ‘ILO Social Protection Floors Recommendation, 2012 (No. 202)’, 2012, <www.social-protection.org/gimi/ShowRessource.action?ressource.ressourceId=31088#:~:text=202)%20was%20adopted%20by%20the,national%20floors%20of%20social%20protection>, accessed 24 May 2021.
53. ‘Financing Gaps in Social Protection: Global estimates’.
54. Richardson, Dominic, Alessandro Carraro, Victor Cebotari and Anna Gromada, ‘Supporting Families and Children Beyond COVID-19: Social protection in high-income countries’, Innocenti Research Report, UNICEF-IRC, Florence, December 2020, <www.unicef-irc.org/publications/1165-supporting-families-and-children-beyond-covid-19-social-protection-in-high-income-countries.html>, accessed 24 May 2021.
55. United Nations Educational, Scientific and Cultural Organization, ‘Education: From disruption to recovery’, UNESCO, Paris, 2021, <https://en.unesco.org/covid19/educationresponse#durationschoolclosures>, accessed 24 May 2021.
56. United Nations Children’s Fund, ‘COVID-19: Are children able to continue learning during school closures? A global analysis of the potential reach of remote learning policies using data from 100 countries’, UNICEF, New York, August 2020, <https://data.unicef.org/resources/remote-learning-reachability-factsheet>, accessed 24 May 2021; ‘Education: From disruption to recovery’.
57. Nordtveit, Bjorn Harald, ‘Schools as Agencies of Protection in Namibia and Swaziland: Can they prevent dropout and child labor in the context of HIV/AIDS and poverty?’, Comparative Education Review, vol. 54, no. 2, 2010, pp. 223-242.
58. One example: Edmonds and Schady, ‘Poverty Alleviation and Child Labor’.
59. United Nations Children’s Fund, ‘Reimagine Education’, UNICEF, New York, undated, <www.unicef.org/media/87286/file/Reimagine Education Brochure-2020.pdf>, accessed 24 May 2021.
60. United Nations Educational, Scientific and Cultural Organization, ‘Leading SDG 4 - Education 2030’, UNESCO, Paris, 2019, <https://en.unesco.org/themes/education2030-sdg4>, accessed 24 May 2021.
61. United Nations Educational, Scientific and Cultural Organization, ‘Close to 69 Million New Teachers Needed to Reach 2030 Education Goals’, UNESCOPRESS, UNESCO, Paris, 15 October 2016, <www.unesco.org/new/en/media-services/single-view/news/close_to_69_million_new_teachers_needed_to_reach_2030_educat>, accessed 24 May 2021.
62. See, for example, United Nations Educational, Scientific and Cultural Organization, ‘New Methodology Shows that 258 Million Children, Adolescents and Youth Are Out of School’, Fact Sheet no. 56, UIS/2019/ED/FS/56, UNESCO, Paris, September 2019, <http://uis.unesco.org/sites/default/files/documents/new-methodology-shows-258-million-children-adolescents-and-youth-are-out-school.pdf>, accessed 24 May 2021.
63. See, for example, Ending Child Labour by 2025; United Nations Children’s Fund, Every Child Learns: UNICEF education strategy 2019-2030, UNICEF, New York, 2019, <www.unicef.org/media/59856/file/UNICEF-education-strategy-2019-2030.pdf>, accessed 24 May 2021.
64. United Nations Educational, Scientific and Cultural Organization, Unpacking Sustainable Development Goal 4: Education 2030 – Guide,
UNESCO, Paris, September 2016, <www.unesco.ch/wp-content/uploads/2017/01/Unpacking-sdg4.pdf>, accessed 24 May 2021.
65. United Nations Children’s Fund, Addressing the Learning Crisis: An urgent need to better finance education for the poorest children, UNICEF, New York, January 2020, <www.unicef.org/media/63896/file/Addressing-the-learning-crisis-advocacy-brief-2020.pdf>, accessed 24 May 2021.
66. See, for example, United Nations Children’s Fund Office of Research–Innocenti, ‘Gender-Responsive and Age-Sensitive Social Protection’, UNICEF-IRC, Florence, <www.unicef-irc.org/research/gender-responsive-and-age-sensitive-social-protection>, accessed 24 May 2021.
67. International Labour Organization, ‘ILO Monitor: COVID-19 and the world of work – Updated estimates and analysis’, ILO, Geneva, April 2020, <www.ilo.org/wcmsp5/groups/public/---dgreports/---dcomm/documents/briefingnote/wcms_743146.pdf>, accessed 7 June 2021.
68. For a more detailed discussion of this point, see ILO Recommendation No. 204, which provides guidance to governments and employers’ and workers’ organizations on the multiple policy dimensions of the transition from the informal to the formal economy. International Labour Organization, ‘Transition from the Informal to the Formal Economy Recommendation, 2015 (No. 204)’, ILO, Geneva, 2015, <www.ilo.org/dyn/normlex/en/f?p=NORMLEXPUB:12100:0::NO::P12100_ILO_CODE:R204>, accessed 24 May 2021.
69. International Labour Organization, Interactions Between Workers’ Organizations and Workers in the Informal Economy: A compendium of practice, ILO, Geneva, 2019, <www.ilo.org/wcmsp5/groups/public/---ed_protect/---protrav/---travail/documents/publication/wcms_735630.pdf>, accessed 24 May 2021.
70. International Labour Organization, ‘Extending Social Security Coverage to Workers in the Informal Economy: Lessons from international experience’, ILO, Geneva, 2021, <www.social-protection.org/gimi/RessourcePDF.action?id=55728>, accessed 7 June 2021.
71. Ending Child Labour by 2025.
72. See also International Labour Organization Cooperative Programme, International Programme on the Elimination of Child Labour and International Co-operative Alliance, Cooperating out of Child Labour: Harnessing the untapped potential of cooperatives and the cooperative movement to eliminate child labour, ILO, Geneva, 2009, <www.ilo.org/ipecinfo/product/download.do?type=document&id=23875>, accessed 24 May 2021.
73. See also Food and Agriculture Organization of the United Nations, ‘Sustainable Food Systems: Concept and framework’, FAO, Rome, 2018, <www.fao.org/3/ca2079en/CA2079EN.pdf>, accessed 24 May 2021.
74. International Labour Organization and Food and Agriculture Organization of the United Nations, Extending Social Protection to Rural Populations: Perspectives for a common FAO and ILO approach, ILO and FAO, Geneva, 2021, <www.fao.org/3/cb2332en/CB2332EN.pdf>, accessed 24 May 2021.
75. International Labour Organization, ‘Employment-Intensive Investment in Rural Infrastructure for Economic Development, Social and Environmental Protection and Inclusive Growth’, Policy guidance note, ILO, Geneva, 2019, <www.ilo.org/global/topics/economic-and-social-development/rural-development/WCMS_437195/lang--en/index.htm>, accessed 24 May 2021.
76. Ibid.
77. Food and Agriculture Organization of the United Nations, ‘Ending Child Labour: The decisive role of agricultural stakeholders’, FAO, Rome, 2017, <www.fao.org/3/i8177e/i8177e.pdf>, accessed 24 May 2021.
85
78. International Labour Organization, Organisation for Economic Co-operation and Development, International Organization for Migration and United Nations Children’s Fund, Ending Child Labour, Forced Labour and Human Trafficking in Global Supply Chains, ILO, OECD, IOM and UNICEF, Geneva, 2019, <www.ilo.org/wcmsp5/groups/public/---ed_norm/---ipec/documents/publication/wcms_716930.pdf>, accessed 24 May 2021.
79. United Nations and United Nations Office of the High Commissioner for Human Rights, Guiding Principles on Business and Human Rights: Implementing the United Nations ‘Protect, Respect and Remedy’ Framework, United Nations, New York and Geneva, 2011, <www.ohchr.org/documents/publications/guidingprinciplesbusinesshr_en.pdf>, accessed 24 May 2021.
80. Ending Child Labour, Forced Labour and Human Trafficking.
81. United Nations Children’s Fund, UNICEF Humanitarian Action for Children 2017, UNICEF, New York, 2017, <www.unicef.org/reports/humanitarian-action-children-2017-overview>, accessed 24 May 2021.
82. One ILO study showed that child labour in situations of armed conflict was 77 per cent higher than the global average. See: International Labour Organization, ‘Global Estimates of Child Labour: Results and trends 2012-2016’, International Labour Office, Geneva, 2017, <www.ilo.org/wcmsp5/groups/public/---dgreports/---dcomm/documents/publication/wcms_575499.pdf>, accessed 24 May 2021.
83. United Nations Children’s Fund, ‘Education in Emergencies: Education is a lifeline for children in crisis’, <www.unicef.org/education/emergencies#:~:text=UNICEF%27s%20work%20to%20deliver%20education,displaced%20children%2C%20refugees%20and%20migrants>, accessed 24 May 2021.
84. Alliance for Child Protection in Humanitarian Action, ‘Minimum Standards for Child Protection in Humanitarian Action’, 2nd ed., Alliance for Child Protection in Humanitarian Action, 2019, <https://alliancecpha.org/en/CPMS_home>, accessed 24 May 2021.
85. Alliance for Child Protection in Humanitarian Action, Inter-Agency Toolkit: Preventing and responding to child labour in humanitarian action, Alliance for Child Protection in Humanitarian Action, 2020, <https://alliancecpha.org/en/system/tdf/library/attachments/child_labour_toolkit_1.pdf?file=1&type=node&id=42551>, accessed 24 May 2021.
86. As of 11 May 2021, 196 countries are party to it, including every member state of the United Nations except the United States.
87. International Labour Organization, ‘NORMLEX: Information system on international labour statistics’, ILO, Geneva, <www.ilo.org/dyn/
normlex/en/f?p=NORMLEXPUB:1:0>, accessed 24 May 2021.
88. Kapoor, Sony, ‘Frontloading Finance Can Save Lives, Tackle Climate Change and Generate Real Impact’, OECD Development Matters, OECD, Paris, 28 April 2021, <https://oecd-development-matters.org/2021/04/28/frontloading-finance-can-save-lives-tackle-climate-change-and-generate-real-impact>, accessed 24 May 2021.
89. World Vision International, et al., Counting Pennies 2: A review of official development assistance to end violence against children, World Vision International, Uxbridge, United Kingdom, 2021, <https://reliefweb.int/report/world/counting-pennies-2-analysis-official-development-assistance-end-violence-against>, accessed 24 May 2021.
90. Alliance 8.7, ‘Partners’, 2018, <www.alliance87.org/partners/#tab-2>, accessed 24 May 2021.
91. Alliance 8.7, ‘Pathfinder Countries: Leading the way to achieve target 8.7’, 2018, <www.alliance87.org/pathfinder-countries>, accessed 24 May 2021.
92. Specifically, the International Union of Food, Agricultural, Hotel, Restaurant, Catering, Tobacco and Allied Workers’ Associations.
93. For the purpose of global estimates of child labour, designated hazardous occupations are those defined in ISCO-88 codes 313, 322, 323, 516, 614, 615, 711-713, 721-724, 731, 732, 811-816, 821-823, 825-829, 832-834, 911, 912, 915, 916, 921, 931 and 933. As a large number of countries have adopted the new ISCO-08 classification system, these ISCO-88 codes have been converted into the corresponding three- and four-digit ISCO-08 codes. The list for ISCO-08 includes 223, 224, 226, 312, 313, 321-322, 324-325, 352, 541, 621-622, 711-712, 721-723, 731, 741, 742, 754, 811-818, 821, 832-835, 921, 931, 933, 951, 961, 962, 2230, 2240, 2264-2267, 2269, 3121-3123, 3131-3135, 3211, 3213, 3214, 3221, 3222, 3240, 3251, 3253-3257, 3259, 3431, 3521, 5212, 5243, 5244, 5411-5414, 5419, 6210, 6221-6224, 7111-7115, 7119, 7121-7127, 7211-7215, 7221-7224, 7231-7234, 7311-7316, 7411-7413, 7421, 7422, 7541, 7542, 7549, 8111-8114, 8121, 8122, 8131, 8141-8143, 8151, 8153-8157, 8159, 8160, 8171, 8172, 8181-8183, 8189, 8211, 8212, 8219, 8321, 8322, 8331, 8332, 8341- 8344, 8350, 9211-9216, 9311-9313, 9331-9334, 9510, 9520, 9611-9613, 9621-9624 and 9629. International Labour Organization, ‘International Standard Classification of Occupations’, ILO, Geneva, <https://ilostat.ilo.org/resources/concepts-and-definitions/classification-occupation>, accessed 5 June 2021.
94. The domestic work rate does not have breakdowns by geography as data are only available for the national level.
86

© U
NIC
EF/
UN
0392
097/
Sat
u
87