Child Labour Situation in Nepal - ILO
122
International Programme for the Elimination of Child Labour (IPEC) International Labour Organization (ILO) Kathmandu, Nepal CHILD LABOUR SITUATION IN NEPAL (Report From Migration and Employment Survey, 1995/96) by Bhim Raj Suwal Bal Kumar KC Keshab Prasad Adhikari CENTRAL DEPARTMENT OF POPULATION STUDIES TRIBHUVAN UNIVERSITY KATHMANDU NEPAL September, 1997
-
Upload
khangminh22 -
Category
Documents
-
view
0 -
download
0
Transcript of Child Labour Situation in Nepal - ILO

International Programme for the Elimination of Child Labour (IPEC) International Labour Organization (ILO) Kathmandu, Nepal
CHILD LABOUR SITUATION IN NEPAL
(Report From Migration and Employment Survey, 1995/96)
by Bhim Raj Suwal Bal Kumar KC
Keshab Prasad Adhikari
CENTRAL DEPARTMENT OF POPULATION STUDIES TRIBHUVAN UNIVERSITY
KATHMANDU NEPAL
September, 1997

i
Acknowledgments
The study on Child Labour Situation in Nepal was carried out in 1996 as a sub-set of a larger study on Employment Situation in Nepal. While administering questionnaire survey in the field, children between ages 5-14 years were given special attention. The overall questionnaire content was the same as that for the larger survey. Dummy tables for the child labour study were from the ILO Office which sponsored this particular study. No attempt was made to go over and beyond the scope of the questionnaire content of the Employment Survey. All faculty members of the Central Department of Population Studies (CDPS) have been involved in the overall operation and finalization of the larger baseline survey on Employment of which this particular study is a sub-set. Their contribution is highly commendable. I am very grateful to Mr. H. Ghosh, Sub-regional Advisor of ILO for initiating the project and providing every assistance available. I am highly indebted to Dr. R. H. Choudhary, Member of CST, UNFPA Regional Office in Kathmandu for conceptualizing the project and finalizing the questionnaire. Mr. Kebebew Ashagrie, Chief, Statistics of Employment & Unemployment and Technical Cooperation, Bureau of Statistics, International Labour Office, Geneva, had been instrumental in guiding our faculty through various steps of write up to finalize the report. CDPS owes tremendous debt to him. Finally, Mr. Bhim Raj Suwal, Lecturer of CDPS, deserves special thanks for tabulating and preparing the report in consultation with Mr. Ashagrie. Any further correction or comment by ILO to improve the report will be highly appreciated.
Dr. Bal Kumar KC Project Director

ii
NATIONAL MIGRATION AND EMPLOYMENT (ME) AND BIRTH, DEATH AND CONTRACEPTION (BDC) STUDY, 1995/96
Research Team
SN Name Status Study
1 Dr. Bal Kumar KC Project Director Principal Investigator
MEBDC Study Migration and Child Labour Study
2 Dr. Parthiveshor P. Timilsina Principal Investigator Employment Study
3 Dr. Devendra Chhetry Chief Data Management Expert
MEBDC Study
4 Dr. Pitamber Rawal Co-Investigator Employment Study
5 Dr. Prakash D. Pant Principal Investigator BDC Study
6 Dr. Bhim Prasad Subedi Co-Investigator Migration Study
7 Mr. Bhim Raj Suwal Co-Investigator Research Team Member
Child Labour Study ME Study
8 Mr. Govinda Subedi Co-Investigator Research Team Member
BDC Study ME Study
9 Mr. Prem Singh Bisht Research Team Member MEBDC Study
10 Mr. Pushp Kamal Subedi Research Team Member MEBDC Study
11 Mr. Rudra Prasad Gautam Research Team Member MEBDC Study
12 Mr. Bidhan Acharya Research Team Member MEBDC Study
13 Mr. Yogendra B. Gurung Research Team Member MEBDC Study
14 Mr. Keshab P. Adhikari Research Team Member MEBDC Study
15 Mr. Bal K. Mabuhang Research Team Member MEBDC Study
16 Mr. Dhanendra V. Shakya Research Assistant MEBDC Study
17 Ms. Laxmi Limbu Research Assistant MEBDC Study
18 Ms. Indira Phuyal Research Assistant MEBDC Study

iii
Table of Contents Page
Acknowledgements
i Research Team
Table of Contents ii
iii List of Tables v Executive Summary vii
Chapter I BACKGROUND 1
1.1 The Context 1 1.2 Conceptual Issues 3 1.3 The Survey 4 1.4 Objectives 6 1.5 Concepts and Definitions 6
Chapter II METHODOLOGY 7
2.1 Stratification 7 2.2 Selection Procedure 8 2.3 Sample Size 8 2.3.1 Household Selection Rule 10 2.4 Sample Information 10 2.5 Operational Procedure 12 2.5.1 Contents of Questionnaire 12 2.5.2 Pre-testing 13 2.5.3 Hiring and Training of Supervisors and Interviewers 13 2.5.4 Field Enumeration 14 2.5.5 Data Management 16 2.6 Weight 17 2.7 Techniques of Data Analysis 17 2.8 Sample Statistics 18 2.9 Demographic-Socioeconomic Characteristics of Sample Population 20 Chapter III
ACTIVITIES OF THE CHILDREN
24
A. How Many Children Work? 29 B. Economically Active Children 37

iv
C. Economically Active Children by Paid and Unpaid Activities 43 D. Economically Active Children by Types of work 50 E. Economically Active Children by Number of Working Hours 56 F. Children in Noneconomic Activities 63 G. Idle (Doing Nothing) Children 67 Chapter IV
SUMMARY AND CONCLUSIONS
70
References 77 Annexes 78

v
List of Tables
Page
Table 2.1 Sample Selection Stages for the M/E Survey, 1995/96
9
Table 2.2 Distribution of Sample Households for Ecological Zones and Development Regions by Rural/Urban Residence, M/E Survey, 1995/96
11
Table 2.3 Distribution of Sample Households with at Least One Child Aged 5-14 Years Out of the Households Selected for M/E Survey, 1995/96
11
Table 2.4 Sample Statistics for Some Selected Variables by Rural-Urban Residence, M/E Survey, 1995/96
19
Table 2.5 Age-Sex Composition of the Household Population, Nepal, 1995/96
20
Table 2.6 Children 5-14 Years Old by Literacy and Education Attainment, Nepal, 1995/96
21
Table 2.7 Children 5-14 Years Old by Principal Occupation Status, Nepal, 1995/96
22
Table 2.8 Children 5-14 Years Old by Migration Status, Nepal, 1995/96
23
Table 3.1 Estimates of the Working Children Aged 5-14 Years Who Worked Most of the Year and Their Work Participation Rate by Background Characteristics, Nepal, 1995/96
34
Table 3.2 Estimates of the Economically Active Children Aged 5-14 Years Who Worked Most of the Year by Type of Activities and Background Characteristics, Nepal, 1995/96
35
Table 3.3 Work Participation Rate of the Children Aged 5-14 Years Who Worked During Most of the Year by Type of Activities and Background Characteristics, Nepal, 1995/96
36
Table 3.4 Estimates of the Economically Active Children Aged 5-14 Years Who Worked Most of the Year by Type of Activities and Background Characteristics, Nepal, 1995/96
41
Table 3.5 Economic Participation Rate of the Children Aged 5-14 Years Who Worked Most of the Years by Types of Activities and Background Characteristics, Nepal, 1995/96
42
Table 3.6 Estimates of the Children Aged 5-14 Years Engaged in Paid Activities Most of the Year by Types of Activities and Background Characteristics, Nepal, 1995/96
46
Table 3.7 Participation Rate of the Children Aged 5-14 Years Engaged in Paid Economic Activities Most of the Year by Types of Activities and Background Characteristics, Nepal, 1995/96
47
Table 3.8 Estimates of the Children Aged 5-14 Years Engaged in Unpaid Activities 48

vi
Most of the Years by Types of Activities and Background Characteristics, Nepal, 1995/96
Table 3.9 Participation Rate of the Children Aged 5-14 Year Engaged in Unpaid Economic Activities Most of the Year by Type of Activities and Background Characteristics, Nepal, 1995/96
49
Table 3.10 Estimates of the Economically Active Children Aged 5-14 years by Types of Work During Last Week of the Survey by Background Characteristics, Nepal, 1995/96
53
Table 3.11 Percentage Distribution of the Economically Active Children Aged 5-14 Years by Types of Work During the Last Week of the Survey by Background Characteristics, Nepal, 1995/96
54
Table 3.12 Estimates of the Economically Active Children Aged 5-14 Years by Number of Working Hours During the Last Week of the Survey and Background Characteristics, Nepal, 1995/96
59
Table 3.13 Percentage Distribution of the Economically Active Children Aged 5-14 Years by Number of Working Hours During the Last Week of the Survey and Background Characteristics, Nepal, 1995/96
61
Table 3.14 Estimates of the Number of Children Engaged in Noneconomic Activities Most of the Year by Types of Activities and Background Characteristics, Nepal, 1995/96
65
Table 3.15 Participation Rate of the Children 5-14 Years in Noneconomic Activities Most of the Year by Types of Activities and Background Characteristics, Nepal, 1995/96
66
Table 3.16 Estimates of the Idle Children (Doing Nothing) Aged 5-14 Years Most of the Year by Background Characteristics, Nepal, 1995/96
69
vii
EXECUTIVE SUMMARY
This report focuses on the study on child labour situation in Nepal with nationally representative
sample. The present study is not from a separate survey on child labour but as a piggy bag of the
Employment Survey, 1995/96. Samples were selected separately from rural and urban areas of
Nepal. Probability proportionate to size, pps, procedure was adopted for the selection of sample
from both rural and urban areas where the measure of size being the household counts of
rural/urban wards.
The main objective of this study is to find out level, pattern, and differentials in child labour in
Nepal. This study is based on the economic explanation of child labour. Estimates of child labour
is primarily based on their participation in economic activities in both absolute as well as relative
terms. However, the report provides further analysis of economically active children by their
current school attendance, types of work and number of working hours in assessing the extent of
child labour in the country. For this purpose, decomposition techniques are applied to make the
sample values as equivalent to population.
There are 2.6 M Working Children in Nepal
It is estimated that there are 6.2 M child population (29.1% of total population) in Nepal as of
early 1996, out of which approximately 2.6 M children worked during one year preceding the
survey. The corresponding work participation of children is estimated to be 41.7 per cent. As
compared to the male children (36.1%) , work participation rate is found to be remarkably higher
among female children (47.6%). It is demonstrated that higher work participation of female
children is mainly due to their higher participation in noneconomic activities. However, male and
female children do not vary much in terms of economic participation rate (27.9% for males and
25.5% for females).
Work participation of the rural children is nearly 2 times higher than that of urban children. Work
participation rate for rural children is estimated to be 43.4 cent. The corresponding figure for the
urban children is 23.0 per cent. Mountain zone has the highest work participation rate of 52.2 per
cent and it is lowest in the Tarai (36.6%). Among the development regions, the lowest work
participation rate of children is found in the Western region (33.2%), and the highest in the Mid
western (50.4%) and Farwestern regions (48.7%). All the zones and regions demonstrate a higher
work participation rate for female children.

x
'5-9 '10-14 Total0
1000
2000
3000
4000
5000
6000
7000N
umbe
r of h
ildre
n ('0
00)
'5-9 '10-14 Total
Age
Estimates of Total Children by Sex, Nepal, 1996
Both Male Female
'5-9 '10-14 Total0
500
1000
1500
2000
2500
3000
Wor
king
Chi
ldre
n ('0
00)
'5-9 '10-14 Total
Age
Estimates of Working Children by Age and Sex, Nepal, 1995/96
Both Male Female
Work participation rate of children decreases as educational level of household heads increases.
Households with nonagricultural occupation have children with lower work participation rate.
Work participation rate of children tends to decrease with increasing family size. But work
participation of children does not appear to vary with respect to size of household's landholdings.
Child Labour Under Different Criteria
Criterion I: Child Labour as of Economic Participation Rate of the Children
It is estimated that, of the 2.6 M working children in Nepal, 1.7 M participate economic
activities. This comprises of 26.7 per cent of the total children in the country. If the term child
labour is defined merely in terms of their participation in economic activities irrespective or their
current school attendance, type of activities and duration of work, child labour in Nepal
constitutes 26.7 per cent. The corresponding figures for male and female children are 27.9 and
25.5 per cent respectively. As there is a marginal difference in the economic participation rate by
sex of the children, incidence of child labour in Nepal does not vary much among male and
female children. However, incidence of child labour among children aged 10-14 years (40.8% or
1,150 T) is more than 3 times higher as compared to the younger children aged 5-9 years (12.5%
or 426 T).

x
'5-9 '10-14 Total0
200
400
600
800
1000
1200
1400
1600
1800
Eco
nom
ical
ly A
ctiv
e C
hild
ren
('000
)
'5-9 '10-14 Total
Age
Number of Economically Active Children by Age ande Sex, Nepal,
1995/96
Total Male Female
Urban Rural Total0
5
10
15
20
25
30
Parti
cipa
tion
Rat
e (%
)
Urban Rural Total
Residence
Economic Participation Rate of the Children by Residence, Nepal,
1995/96
Total Male Female
'5-9 '10-14 Total0
5
10
15
20
25
30
35
40
45
Parti
cipa
tion
Rat
e (%
)
'5-9 '10-14 Total
Age
Economic Participation Rate of Children by Age and Sex, Nepal,
1995/96
Total Male Female
Economic Participation Rate of the Children by Ecological Zones,
Nepal, 1995/96
0
5
10
15
20
25
30
35
40
45
Mountain Hill Tarai
Ecological Zones
Parti
cipa
tion
Rat
e (%
)
Male Female Total

x
Children in mountain zone constituted 38
per cent who participated in economic
activities followed by 30.5 (862 T) per cent
in the hill, and 21.2 per cent (622 T) in the
Tarai. As compared to male children
(35.6%), child labour in mountain is higher
among female children (40.6%). Incidence
ofchild labour is the highest in Midwestern
and Farwestern development regions. Child
labour in these regions is estimated to be
about 33 per cent as compared to 24.2 per
cent in Central and 29.8 per cent in Eastern
region. The lowest incidence of child labour
is found in Western region (20.7%).
Economic Participation Rate of the Children by Development Regions,Nepal, 1995/96
0 10 20 30 40
Eastern
Central
Western
Midw estern
Farw estern
Dev
elop
men
t Reg
ions
Partcipation Rate (%)
Total Male Female
Incidence of child labour is found to be higher among male than female children in all the
development regions except Farwestern region. Incidence of child labour is found to be reduced
with increasing level of household head's education and shift of their occupation from
agricultural to nonagricultural activities and increasing family size. However, it increases with
increasing size of household's landholdings.
Criterion II: Child Labour as of Economic Participation Rate of the Children Without
School Attendance
Of the 1.7 M economically active children, 673 T or 10.8 per cent do not attend school. Number
of economically active male and female children not attending school comprise of 7.6 (242 T)
and 14.3 per cent (432 T) respectively. Thus, if we consider child labour as of economic
participation of the children without school attendance irrespective of types and duration of work,
incidence of child labour in Nepal is 10.8 per cent, 7.6 per cent for male children and 14.3 per
cent for female children. Thus, under this definition, incidence of child labour among female
children is nearly two times higher than among male children.

x
'5-9 '10-14 Total0
100
200
300
400
500
600
700
Num
ber o
f Chi
ldre
n ('0
00)
'5-9 '10-14 TotalAge
Economically Active Children Who Do Not Go To School by Age and Sex,
Nepal, 1995/96
Both Male Female
'5-9 '10-14 Total0
5
10
15
20
25
Num
ber o
f Chi
ldre
n (%
)
'5-9 '10-14 Total
Age
Economic Participation of the Children Who Do Not Attend School by Age and
Sex, Nepal, 1995/96
Both Male Female
In rural areas, 11.6 per cent of the children involved in economic activities without school
attendance. The corresponding figure for the urban areas is estimated to be 2.3 per cent. It implies
that incidence of child labour in rural areas is about 6 times higher than in urban areas under this
definition of child labour. Considering the sex of the children according to the current place of
residence, rural areas (15.5%) show that incidence of child labour among female children in rural
areas (15.5%) is more than 7 times higher than in urban areas (2.3%). For males, it is just 4 times
higher in rural areas than in urban areas.
Under this criterion, mountain has 18.1 per cent of the incidence of child labour, 9.7 per cent for
male children and 26.8 per cent for female children. However, hill (9.9%) and Tarai (10.6%) do
not vary much in terms of child labour under this definition. Similarly, child labour is highest in
Mid and Farwestern development regions. Child labour under this criterion is about 16 per cent in
these regions, followed by 11.4 per cent in Central and 10.5 per cent in Eastern region. Western
region has 5.0 per cent child labour. As compared to male children, child labour is higher among
female children in all the regions. Gender disparity in child labour is more pronounced in Mid
and Farwestern regions.
Under this definition, child labour is found to be 2 times higher among children belonging to the
illiterate heads as compared to those belonging to households with primary level education of
household heads. Incidence of children labour among children of either sexes decreases with
increasing level of household head's education. Similarly, child labour is found reduced as the

xi
occupation of household heads shifts from agriculture to nonagriculture. Incidence of child
labour under this criterion does not vary with respect to increasing family size, and the size of
household's landholdings.
Criterion III: Child Labour as of Participation Rate of the Children in Paid Activities
Of the economically active children, 278 T
are involved in paid activities which
comprise of 4.5 per cent of the total children
in the country. The corresponding figures
for male and female children are 4.3 and 4.6
per cent respectively. If child labour is
considered as participating in paid activities
irrespective of current school attendance,
types and duration of work, it constitutes 4.5
per cent in the country, 4.3 per cent for male
children and 4.6 for female children.
Incidence of child labour increases with
increasing age of the children with respect
to this criterion too. For instance, 1.6 per
cent of children of either sex aged 5-9
Total '5-9 '10-14 M ale Female0
200
400
600
800
1000
1200
1400
1600
1800
Num
ber o
f Chi
ldre
n (%
)Total '5-9 '10-14 M ale Female
Age Sex
Number of Economically Active Children by Paid and Unpaid Activities, Total,
Nepal, 1995/96
Paid Unpaid
years involved in paid activities as compared to about 7 per cent among older children aged 10-14
years with higher incidence of child labour among female children in this age group.
Rural areas show about 2 times higher incidence of child labour especially of female child labour.
Urban areas show lower female child labour. Thus, a higher incidence of female child labour
under this criterion is mainly due to higher incidence of female child labour in rural children. It is
because higher proportion of female children in rural areas do not attend school, and, as
compared to the male children, a larger number of female children in rural areas might have been
working as agricultural labour.
Mountain zone shows highest incidence of child labour under this criterion. Under this criterion,
incidence of child labour in mountain is 6.3 per cent, 4.4 per cent in the hill and 4.3 per cent in
the Tarai. Mountain and Tarai zones also show a higher incidence of child labour among female
children than males children. The incidence of child labour is highest in the Eastern region
(6.3%) under this criterion and the lowest in the Western region (2.5%).

xi
Criterion IV: Child Labour as of Participation Rate of the Children in Unpaid
Economic Activities
An overwhelmingly majority of the
economically active children are involved in
unpaid activities (1,383 T) comprising of
22.2 per cent of the total child population in
the country. If child labour is defined in
terms of children's participation in unpaid
economic activities irrespective of current
school attendance and type and duration of
work, incidence of child labour in Nepal is
22.2 per cent, 23.5 per cent for male
children, and 20.8 per cent for female
children. Again, the incidence of child
labour among older children aged 10-14
years is higher (33.4%) than among
younger children aged 5-9
Total '5-9 '10-14 Male Female0
5
10
15
20
25
30
35
40
45
Parti
cipa
tion
Rat
e (%
)Total '5-9 '10-14 Male Female
Age Sex
Economic Participation Rate of the Children by Paid and Unpaid Activities,
Total, Nepal, 1995/96
Paid Unpaid
years (10.9%). Child labour under this criterion is about 11 per cent for the children of either sex
aged 5-9 years. For the children aged 10-14 years, it is 35.9 per cent for male children and 30.7
per cent for female children.
This criterion also demonstrates a higher incidence of child labour in rural areas among the
children of either sex. In general, 23.7 per cent of children in rural areas involved in unpaid
economic activities as compared to 6.1 per cent in urban areas. It implies that incidence of child
labour under this criterion is about 4 times higher in rural areas. Mountain shows the highest
incidence of child labour with 31.8 per cent. The corresponding figure for hill and Tarai is 26.1
per cent and 16.8 per cent respectively. Except in the mountain, incidence of child labour is lower
among female children in hill and Tarai under this criterion. This criterion also shows lowest
incidence of child labour for Western development region and highest for Mid and Farwestern
regions. Under this criterion, child labour is more or less the same in the Central and Western
regions for male children. The highest incidence of male child labour is found in Midwestern
region (28.6%), whereas for female children it is in the Farwestern region (30.6%).
xi
Incidence of child labour under this criterion substantially declines with increasing level of
household head's education. Similarly, shift of the occupation of household heads from
agriculture to nonagriculture also reduces the incidence of child labour by about 2 times.
Similarly, increasing family size tends to lower down the incidence of child labour under this
criterion. On the contrary, incidence of child labour under this criterion increases with increasing
size of household landholdings.
Criterion V: Child Labour as of Economic Participation Rate of the Children With 2 or
More Working Hours Per Day.
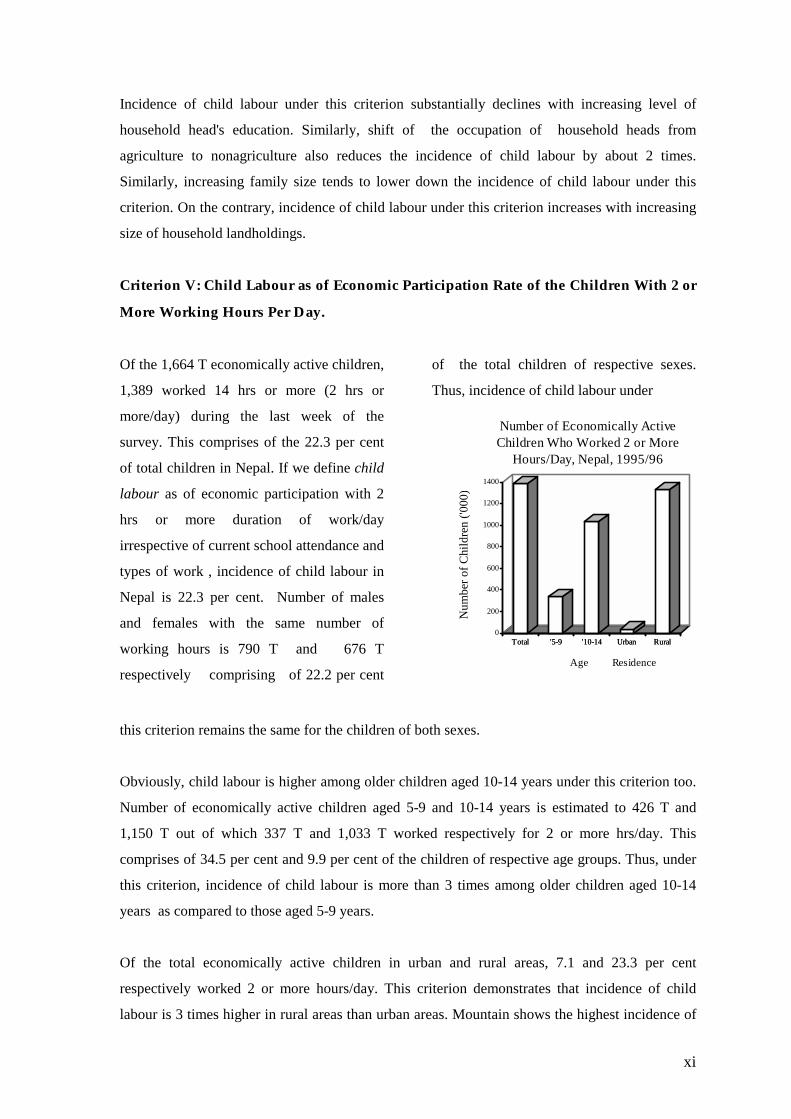
Of the 1,664 T economically active children,
1,389 worked 14 hrs or more (2 hrs or
more/day) during the last week of the
survey. This comprises of the 22.3 per cent
of total children in Nepal. If we define child
labour as of economic participation with 2
hrs or more duration of work/day
irrespective of current school attendance and
types of work , incidence of child labour in
Nepal is 22.3 per cent. Number of males
and females with the same number of
working hours is 790 T and 676 T
respectively comprising of 22.2 per cent
of the total children of respective sexes.
Thus, incidence of child labour under
Total '5-9 '10-14 Urban Rural0
200
400
600
800
1000
1200
1400
Num
ber o
f Chi
ldre
n ('0
00)
Total '5-9 '10-14 Urban Rural
Age Residence
Number of Economically Active Children Who Worked 2 or More
Hours/Day, Nepal, 1995/96
this criterion remains the same for the children of both sexes.
Obviously, child labour is higher among older children aged 10-14 years under this criterion too.
Number of economically active children aged 5-9 and 10-14 years is estimated to 426 T and
1,150 T out of which 337 T and 1,033 T worked respectively for 2 or more hrs/day. This
comprises of 34.5 per cent and 9.9 per cent of the children of respective age groups. Thus, under
this criterion, incidence of child labour is more than 3 times among older children aged 10-14
years as compared to those aged 5-9 years.
Of the total economically active children in urban and rural areas, 7.1 and 23.3 per cent
respectively worked 2 or more hours/day. This criterion demonstrates that incidence of child
labour is 3 times higher in rural areas than urban areas. Mountain shows the highest incidence of

xi
child labour under this definition (29.1%) followed by hill (25.4%), and Tarai (18.2%). Among
the development regions, Western region shows the lowest incidence of child labour (17.1%),
and the highest 31.0 per cent in the Midwestern region.
Like the other criteria for child labour, this criterion also demonstrates the incidence of child
labour decreasing with increasing level of household head's education. Under this criterion,
incidence of child labour tends to decrease from 26.2 per cent among households with illiterate
heads to 10.5 per cent among secondary and above level of head's education. It also decreases
from 25.4 per cent to 16.7 per cent with shift in head's occupation from agriculture to
nonagriculture.
Agriculture is the Largest Sector Absorbing Child Labour in Nepal
Overwhelming majority of the economically
ective children do agriculture related works.
Of the 1,664 T economically active
children, 1,576 T (94.7%) are estimated to
have been involved in agricultural related
works and the rest 87 T (5.3%) in
nonagricultural works. Estimates reveal that
27 T (12.6%) economically active children
worked as service workers, and another 26 T
(1.6%) as communication, transportation
and communication workers. Number of
economically active children who worked as
general technical workers constituted of 14
T (0.8%), and another 13 T (0.8%) of
production workers. The least 7 T (0.4%) is
constituted of sales workers.
Nepal '5-9 '10-14 Male Female91
92
93
94
95
96
97
98
99
100
Perc
ent
Nepal '5-9 '10-14 Male Female
Age Sex
Percentage Distribution of Economically Active Children by Types
Work, Total, Nepal, 1995/96
Agriculture General TechnicalSales Workers Service WorkersProduction Workers Cons, Trans, Communi.

xi
Older children participate more in nonagricultural works, whereas younger children in
agricultural works. Similarly, Urban children more likely to involve in nonagricultural works as
compared to urban children. Economically active children of different zones and regions do not
vary much in terms of types of works they do.

xii
Summary Table of the Estimates of the Child Labour in Terms of Economic Participation Rate and Corresponding Estimated Total (in parentheses) under Different Criteria, Nepal, 1995/96.
(numbers in '000 and Rates in per cent) Background
Criterion I
Criterion II
Criterion III
Criterion IV
Criterion V
Characteristics Both Male Female Both Male Female Both Male Female Both Male Female Both SexesNepal 26.7 27.9 25.5 10.8 7.6 14.3 4.5 4.3 4.6 22.2 23.5 20.8 22.3 (1,664) (894) (770) (673) (242) (432) (278) (138) (140) (1,383) (753) (629) (1,389) Age
05-09 12.5 12.4 12.6 5.9 4.1 7.8 1.6 1.6 1.6 10.9 10.7 11.0 9.9 (426) (215) (211) (200) (70) (130) (55) (28) (27) (370) (186) (184) (337) 10-14 40.8 42.9 38.4 15.7 11.0 20.8 7.3 6.9 7.7 33.4 35.9 30.7 34.2
(1,150) (629) (521) (443) (161) (282) (206) (101) (104) (943) (526) (416) (1,033) Residence
Urban 8.5 9.7 7.2 2.3 2.2 2.3 2.4 2.9 1.8 6.1 6.8 5.3 7.1 (44) (27) (18) (12) (6) (6) (12) (8) (4) (32) (19) (13) (37) Rural 28.4 29.6 27.1 11.6 8.1 15.4 4.7 4.4 4.9 23.7 25.1 22.2 23.2
(1,620) (867) (752) (662) (237) (426) (266) (130) (136) (1,351) (734) (616) (1,330) Ecological Zones
Mountain 38.0 35.6 40.6 18.1 9.7 26.8 6.2 5.8 6.6 31.8 29.8 33.9 29.1 (176) (84) (92) (83) (23) (61) (29) (14) (15) (147) (70) (77) (135) Hill 30.5 31.9 29.1 9.9 6.2 14.0 4.4 4.1 4.7 26.1 27.7 24.4 25.4 (862) (457) (405) (281) (89) (194) (124) (59) (65) (737) (397) (339) (717) Tarai 21.2 22.7 19.5 10.6 8.6 12.6 4.3 4.3 4.3 16.8 18.3 15.2 18.2 (622) (348) (275) (311) (132) (178) (126) (65) (61) (494) (281) (214) (535)
Development Region
Eastern 29.8 32.8 26.6 10.5 8.1 12.9 6.3 6.2 6.5 23.5 26.7 20.1 25.0 (449) (253) (196) (158) (63) (95) (96) (48) (48) (353) (206) (148) (366) Central 24.2 25.2 23.2 11.4 8.4 14.8 4.6 4.4 4.8 19.6 20.7 18.4 19.0 (489) (266) (223) (231) (89) (142) (92) (47) (46) (397) (219) (177) (383) Western 20.7 22.4 18.8 5.0 3.7 6.5 2.5 2.4 2.6 18.2 20.0 16.3 17.1 (268) (148) (119) (65) (24) (41) (32) (16) (16) (235) (132) (103) (222) Midwestern 33.4 33.4 33.5 15.5 9.9 21.3 4.7 4.5 5.0 28.5 28.6 28.4 31.0 (276) (140) (137) (128) (41) (87) (39) (19) (20) (236) (120) (116) (256) Farwestern 32.6 30.8 34.3 16.9 9.4 24.6 3.8 3.8 3.8 28.7 26.9 30.6 26.8 (189) (91) (97) (98) (28) (70) (22) (11) (11) (166) (80) (86) (156)
Source: Migration and Employment Survey, 1995/96.

13
CHAPTER I
BACKGROUND
The economics of human development suggests that human factor is the main instrument of
development and investment in children as a principal means of breaking out of the poverty
syndrome (UNICEF, 1988). The idea is that healthy upbringing of children can safeguard the
healthy development of the nation. As a matter of fact, at the present time, there is a general
consensus among national and international communities that children should be protected from
all forms of social and economic exploitation, and discrimination whereby they can enjoy
childhood and have opportunities to develop. Therefore, children should not be deprived of basic
facilities which are necessary for their survival, protection, and development.
However, in practice, socioeconomic condition of the large majority of the children of today's
developing countries is very tragic. In many instances, children are seen as a source of cheap
labour to augment profits/incomes in various enterprises and families. Children have been the
victim of the prevailing social, economic and political systems that exploit and supress them. As
a result, remarkably high proportion of children are being deprived of minimum basic facilities
needed for their overall development.
As an example, about five million children are dying each year from preventable diseases around
the developing world, some 3 million children under five years of age are seriously disabled each
year by diseases which could be prevented by immunization, about 20 per cent of the population
aged 15 years and younger lived under "especially difficult circumstances" as victims of armed
conflict, natural disasters or broken family system (UNICEF, 1991). Likewise, about 20 per cent
of the children of school going age either did not have access to formal schooling or drop out
before completing the primary level. There is no authoritative estimate on working children.
However, it is recently estimated that some 250 million children work throughout the world and
98 per cent of economically active children are found in developing countries (ILO, 1996).
1.1 The Context
14
Nepal is not an exception to these anomalies. In fact, among other factors of child
underdevelopment, practice of child labour is a widespread phenomenon in Nepal. It is common
to all the sectors of employment - both formal and informal sectors. Studies have shown that no
labour market is completely free from child labour exploitation. It is recognized as a major social
problem incompatible with the overall development of the children.
Estimates have revealed that 24.8 per cent of the children aged 10-14 years are economically
active in Nepal (CBS, 1995). This figure was even higher in 1981. Child labour practice in Nepal
is gender biased; for every 100 economically active boys (aged 10-14 years) 143 girls are
economically active (Thakurathi et al., 1996). School attendance among children is found to be
low. Only one third of the children aged 6-9 years were attending school in 1991. The
corresponding figure for aged 10-14 years is reported to be 55.5 per cent (CBS, 1995). The
literacy rate among children aged 6-14 is as high as 63.2 per cent.
Agricultural sector is identified as the largest sector absorbing child labour in Nepal. As a matter
of fact, 97 per cent of economically active children are engaged in agriculture related works.
Children working in this sector are generally involved in collecting fodder and firewood, animal
care, weeding, planting and harvesting. Children working in this sector generally work as unpaid
family workers to provide help to their seniors in domestic and farm works. It is indicated that
female children are more involved in such agricultural as well as other domestic works such as
looking after siblings, fetching water, preparation of meals and other household related works.
For instance, girls aged 5-9 years and 10-14 years worked 3.4 and 7.3 hours respectively per day,
whereas boys in the same age groups spent 2.3 hours and 4.9 hours respectively.
Children are also at work in service sectors especially in urban areas. Service sector generally
consists of domestic service (as servants), hotel/restaurants, manufacturing/industries, and trade.
Unlike the children working in agricultural sectors, children working in this sector are generally
directly paid or can earn some money. Studies have shown that children working in the
agricultural sector are severely underpaid for their relatively long hours of work.
Child labour in Nepal is not a new phenomenon. The child labour situation in Nepal is said to be
worsening as development activities are getting expanded. Migration of children to urban areas
for employment is aggravating the child labour situation in the urban areas of Nepal. However,

15
there was not much concern over the practice and use of child labour in Nepal before 1990 when
World Summit for Children highlighted the need of elimination of child labour from the
respective countries for healthy development of the children.
1.2 Conceptual Issues
Child labour can be considered as one of the phenomena caused by underdevelopment and
poverty and it is not the problem - but a symptom of the problem of poverty and inequality (ILO,
1994). A vicious circle persists between underdevelopment and child labour (Fig. 1). Child
labour is a product of low living standards of the population resulting from the low level of
income, illiteracy and increasingly lack of means of subsistence - food, shelter, and clothing and
inadequate basic schooling or education system. Thus, practice of child labour is considered as
an effective means of augmenting current level of income among poor families so as to enhance,
by and large, their economic well being.
Lack of investment in basic services and labour-saving technologies in an underdeveloped
economy makes a large number of children desirable, even essential, as a source of help in fields
and homes (UNICEF, 1994). Practice of child labour prevents children from going to schools
resulting in low school attendance rate and low level of general and vocational education among
children. As a result, the consequence of child labour has adverse impact on productive capacity
of the children themselves and also when they reach adulthood. They are underpaid which makes
them unable to meet the requirement of housing and fooding. Thus, vicious circle between
underdevelopment and child labour is self-perpetuating.
Studies have indicated that poverty is the crux of the problem of child labour in Nepal. There is a
direct link between poverty and child labour in Nepal. For example, majority of the children
working as rag pickers, shoe cleaners, hotel kanchha, street children, carpet weavers in
Kathmandu Municipality, reported poverty as a main reason for their work (CWIN, n.d.).
Majority of them were illiterate and belonged to less educated families. Likewise, except in the
mountains, the work burden of children of both sexes aged 6-9 years is heaviest in the ultra poor
family and lightest in the non-poor family (Singh, 1990). However, the same study has shown

16
that heavy work burden of a girl child is not entirely due to poverty but gender bias against the
girl child which in turn, is influenced by other factors such as cultural values.

17
Fig 1: The vicious circle of underdevelopment and child labour
ECONOMIC
UNDERDEVELOPMENT
Low school attendance rate Low production and productivity Low level of general and Low living standards, general vocational education poverty of the population Low wages Low incomes Many things lacking: food, Many things lacking: food, educa- housing, health tion, training, housing, hygiene, sanitation, health care Low capacity to work and to consume Reduced capacity to work Fatigue, premature aging, acciden- ts, diseases, absence from work, dismissal Reduced income, indebtedness, increased poverty
CHILD
LABOUR
Source: ILO, 1994.
A study by Chhetry (1996) indicates that, in Nepal, districts with high child labour rates tend to
have high illiteracy rate and the districts with high incidence of poverty tend to have high child
labour rate. He concluded that poverty compels children to participate in the labour force, which
in turn deprives them from their right to education.
1.3 The Survey
Most of the statistical information used in the above analysis come from the localized studies
carried out at different points in time. Study on child labour in Nepal is mostly concentrated in
urban areas. They generally cover child labour situation in the service sectors only. Virtually no
study on child labour situation in the agricultural sector exists in Nepal. Population censuses
could be one of the major sources of information for this. But no censuses collected information

18
on working status of the children less than 10 years of age. Again, it may not be feasible, by scale
or cost, to incorporate wider range of questions on child labour in the censuses.
Furthermore, by definition, census estimate on activity rates does not take into account those
children who are usually involve in housekeeping activities in parents home but which may have
been causing hindrance for children to develop in full potential. They are omitted as an
economically inactive population. So, information from various censuses to study child labour in
Nepal is incomplete. Even this situation existed, no survey ever conducted in Nepal covered all
the ecological zones, development regions, and rural-urban residence to study the level as well as
the differential in child labour practice in Nepal. To be exact, up to this point, the country is
lacking reliable database for the study on the level, pattern and differential in child labour
practice. There is a big information gap in this respect.
In this context, the main features of this survey are the followings:
1. There is no separate survey on child labour for this study. This study is carried out as part of
the employment study. Therefore, data for this study come from the Employment Survey
which is the largest survey ever conducted in Nepal to cover children aged 5-14 years of age
(see methodology for sample size).
2. This survey covers all the major geographic subdivisions, development regions and rural
urban residence. There is no particular focus on any aspect of child employment/labour on
sectoral basis. This survey does not provide information on work related health and safety
aspects. However, information from this survey can be utilized to explore child labour
practice extensively in agricultural sector also.
3. This survey provides a wider range of information useful for the study on child labour in the
context of Nepal. Therefore, it is possible to study the child labour in the wider context of
socioeconomic-demographic background of the family/individuals, family size, migration
status, size of landholding, and other household assets that a family possesses.
4. It is expected that information from this survey would be able to fulfill the information gap
pertaining to the child labour in Nepal. For the first time, this survey provides the largest and
the most reliable database for the study on child labour situation in Nepal.

19
20
1.4 Objectives
The long-term objective of this study is to provide reliable database for the study on child
labour/work in the country. The immediate objectives of this study are as followings.
1. To provide estimates of child labour for the country by residence, ecological zones and
development regions.
2. To assess the regional variation in child labour.
3. To assess the relationship between child labour and some selected household and individual
characteristics of the children.
1.5 Concepts and Definitions
In this study, "child" is defined in terms of age. Accordingly, only the population aged 5-14 is
taken as "child" population in this study like most of the child labour surveys do.
There are two similar terms - "child labour" and "child work" - that need to be distinguished for
the survey purpose. According to the ILO, most children work but all the works by children can
not be considered "child labour". "Child labour" is something different - that young people are
being exploited, or overworked, or deprived of their right to health or education - or just to
childhood. United Nations (1990) also define "child labour" in the similar fashion. In some
instances, "child worker/labour" is defined as a person in the age group of 5-14 employed for hire
or reward, on a full time basis and includes a self-employed child and a child assisting his/her
parents in their occupations for two or more hours a day.

21
CHAPTER II
METHODOLOGY*
This survey was conducted as part of the Migration and Employment (M/E) Survey. Therefore,
methodology of the M/E survey is also the same for the present study on child labour/work.
The basic features of the present sampling methodology is same as the same one developed by
Turner1 in 1994 working together with the Population Division of the National Planning
Commission. In particular, the present sampling methodology borrows several pertinent concepts
and principles from Turner's technical report.
2.1 Stratification
Before proceeding to the process of sample selection, the whole country was divided into two
strata: rural and urban. The division or stratification is required for two basic reasons. First, it is
envisaged that the reliable estimates can be obtained from urban areas only if the urban areas are
disproportionately oversampled, which in the present sampling scheme is possible only if the
samples are drawn separately from two areas. Second, the rural and urban areas of Nepal have
shown sharp variations in those variables which are pertinent to the two studies mentioned
above.
The division is carried out by grouping all municipalities together (urban areas) and all village
development committees together (rural areas). The basic information based on the 1991
Population Census (hereafter refer to as PC91) regarding the rural/urban areas are summarized
below.
- The urban area of Nepal consisted of 33 municipalities2 458 wards and 313,342 households.
The average number of households per municipality was 9,495 with the range of 1,624
* Prof. Devendra Chhetry is highly acknowledged for partially contributing to this Chapter. 1. See Technical Mission Report NEP/93/P13 of UNFPA 2. Due to unavoidable circumstances the three municipalities Gaur, Byas and Tulsipur were not included in urban areas.

22
households to 81,139 households. The average number of households per ward in urban area
was 684. The number of households per ward varied from 73 to 8,345.
- The rural area of Nepal consisted of 4,015 village development committees (VDCs), 36,126
wards and 3,015,379 households. The average number of households per VDC was 751 with
a range of 43 households to 5,135 households. The average number of households per ward
in rural area was 83. The number of households per ward varied from 1 to 1,663.
2.2 Selection Procedure
Samples are selected separately from rural and urban areas of Nepal. The sample procedure
adopted for the selection of PSUs3 from rural/urban area is the probability proportionate to size
(pps) where the measure of size being the household counts of rural/urban wards. The sample
frame, therefore, in the selection of PSUs from rural/urban areas consists of the household counts
of each ward of rural/urban areas.
A total of 600 sample clusters (or PSUs) were selected from the whole country, out of which 450
clusters were allocated for rural areas and the remainder 150 for urban areas. The multistage
sampling procedure was applied to select sample clusters. Excluding the last stage for selecting
secondary sampling units (SSUs) as households, selection of the PSUs in rural areas was
completed in 3 stages, whereas in urban areas it was completed in 2 stages (Table 2.1)
2.3 Sample Size
The ultimate or secondary sampling units (SSUs) being households, it was decided to select
approximately 20,000 households for the M/E surveys. In order to have complete cross-
classification of the results of M/E surveys it was decided to combine them, in the sense that the
data for two surveys will be collected from each of the 20,000 households. This strategy would
reduce the survey cost and broaden scope of the studies. Although, the M/E survey collected data
from the same households, the two surveys are different in the sense that the target populations
3. Primary Sampling Units (PSUs) are well defined location consisting of a cluster of households. Throughout this section, such location is termed interchangeably as "ward", "subward", "segment" and "cluster".

23
of the two surveys are not the same. The allocation of the total number of household to urban and
rural areas is in the ratio of 1 to 3. This will ensure the allocation of 25 per cent of the total
sample to urban areas.

24
Table 2.1: Sample Selection Stages for the M/E Survey, 1995/96 Stages Rural Urban First Stage
Selection of Districts: Out of 75 districts, 73 districts were selected in this stage. The two districts - Manang and Dolpa were not selected.
Selection of Municipalities: All the 33 municipalities were selected in this stage.
SecondStage
Selection of Village Development Committees (VDCs): Four hundred and fifty VDCs were selected from the 73 districts selected in the first stage.
Selection of Wards (PSUs): Wards (as cluster) of the municipalities were selected in this stage. Like in the rural areas, one ward was selected from each of the 33 municipalities. As 150 clusters were allocated for the urban areas, selected wards in this stage had to be segmented if necessary. Segmentation of ward was done according to the equal size rule and required number of sub division (s) of ward were selected randomly
Third Stage
Selection of Wards (PSUs): One ward (as cluster) was selected from each of the four hundred and fifty VDCs selected in the second stage. Wards were segmented, if necessary, according to the equal size rule and one of the sub- divisions of ward was selected randomly.
Selection of Households: Required number of households were selected from the wards or sub-divisions of ward. It was done according to the household selection rule (see household selection rule).
Fourth Stage
Selection of Households: Required number of households was selected from the ward or sub-division of ward selected in the third stage (see household selection rule).
When the total sample size is fixed in advance, the total number of PSUs to be selected depends
upon the cluster size, that is the number of households to be selected from each PSU, since the
relationship between them is
N = n * m
where N is the total sample size, n is the number of PSUs and m is the cluster size. The cluster
size in the presence of intraclass correlation jointly produces an effect on the efficiency of the
sample design, known as the design effect.4 Therefore, one can not select too many or too small
number of households from each PSU. This situation is resolved by selecting 33 households from
each PSU.
4. see Technical Mission Report NEP/93/P13 of UNFPA for detail.

25

26
2.3.1 Household Selection Rule
The number of households to be selected from each PSU selected for M/E survey is determined
by the following rule.
1. If the number of households (based on PC91) in a PSU is less than 33, SSUs is equal to total
count of the households in the PSU.
2. If the number of households in a PSU is greater than or equal to 33, SSUs is equal to 33.
The process of selection of households or SSUs was carried out in the field while conducting the
survey. Systematic random sampling procedure was applied to select households (or SSUs). This
procedure had to be applied only to those PSUs with its size greater than or equal to 33.
However, this process required the following information.
a. Exact locations of the selected PSUs
b. Current as well as PC91 household counts of each PSU
The exact locations of the selected PSUs were identified by the district's name, VDC or
municipality's name, and the household counts associated with the wards.
2.4 Sample Information
Table 2.2 and 2.3 provide basic sample information for the M/E and child labour study for
various ecological zones and development regions by rural/urban residence .
Number of households thus selected constitutes the total sample household for the M/E survey.
There is close resemblance between the number of expected and actual sample households
(Table 2.2). Actual number of sample households for migration and employment study comes out
to be 19,613, out of which 19,200 households were successfully interviewed.

27
Table 2.2: Distribution of Sample Households for Ecological Zones and Development Regions by Rural/Urban Residence, M/E Survey, 1995/96
Expected Actual Actually Interviewed Zones/Regions Rural Urban Total Rural Urban Total Rural Urban Total
Total 14,690 4,950 19,640 14,668 4,945 19,613 14,391 4,809 19,200 Ecological Zones
Mountain 1,262 1,262 1,245 1,245 1,234 1,234Hill 6,746 2,574 9,320 6,735 2,574 9,309 6,610 2,492 9,102Tarai 6,682 2,376 9,058 6,688 2,371 9,059 6,547 2,317 8,864
Development Region
Eastern 3,671 1,023 4,694 3,658 1,023 4,681 3,590 1,013 4,603Central 4,658 2,673 7,331 4,662 2,673 7,335 4,540 2,569 7,109Western 3,127 660 3,787 3,142 660 3,802 3,108 645 3,753Mid Western 1,972 297 2,203 1,953 294 2,247 1,929 290 2,219Far Western 1,262 297 1,625 1,253 295 1,548 1,224 292 1,516
Table 2.3: Distribution of Sample Households with at Least One Child Aged 5-14 Years Out of
the Households Selected for M/E Survey, 1995/96 Children Aged 5-14 Years
Households Eligible Actually Interviewed Zones/Regions Rural Urban Total Rural Urban Total Rural Urban TotalTotal 10,122 2,904 13,026 22,770 6,197 28,967 21,885 5,926 27,811 Ecological Zones
Mountain 812 812 1,781 1,781 1,694 1,694Hill 4,674 1,396 6,070 10,535 2,863 13,398 10,146 2,724 12,870Tarai 4,636 1,508 6,144 10,454 3,334 13,788 10,045 3,202 13,247
Development Regions
Eastern 2,492 625 3,117 5,388 1,327 6,715 5,206 1,257 6,463Central 3,119 1,460 4,579 6,792 3,042 9,834 6,575 2,892 9,467Western 2,229 404 2,633 5,243 830 6,073 5,056 806 5,862Mid Western 1,398 191 1,589 3,222 441 3,663 3,061 420 3,481Far Western 884 224 1,108 2,125 557 2,682 1,987 551 2,538
The total sample population for the employment study is a subset of the population aged five
years and above out of which population aged 5-14 years constitutes the total sample population
for the present study. The actual number of households with at least one individual aged 5-14
years comes out to be 13,026 containing 28,967 children, out of which, information were
successfully collected for 27,811 (96.0 %) children.

28
2.5 Operational Procedure
All the survey plannings were done at the headquarter, i. e., Office of the Central Department of
Population Studies, Tribhuvan University, by its staff. The initial stage of the survey planning at
headquarter involved activities related to the sample design (discussed earlier in this Chapter),
and design of questionnaires. Specialized functional groups were formed within the CDPS
according to the need for the planning of the above-mentioned activities. By this scheme,
division of work was maintained among the CDPS staff.
The specialized group for the sample design involved in selecting sample. The 1991 population
census is the main source in providing information on sample frame for the selection of PSUs
from rural/urban Nepal. The Central Bureau of Statistics provided the hard copy of the sample
frame to the CDPS and the CDPS created two database files, one for rural areas and another for
urban areas. The database file for rural areas contained 36,126 records and file for the urban
areas contained 458 records, one record for each ward. When sample selection was completed,
all the selected PSU's were identified in maps. For this purpose, Village Development Committee
(VDC) level maps were made available from the Department of Topography, His Majesty's
Government of Nepal. Three specialized sub-groups of the experts were formed within the
functional group for the questionnaire design: one for designing questionnaire for migration
study, second for designing questionnaire for employment and child labour study, and third
group for designing questionnaire for Birth, Death and Contraception study.
In the initial stage of the questionnaire design, discussion programmes were frequently organized
at the office of the CDPS to bring these specialized groups and other experts in the related field
of migration, employment and child labour together to discuss about the structure and contents of
the questionnaires. Seminars were also organized in different points of time to gather inputs from
the various experts outside CDPS. Finally, questionnaires were printed for pre-test upon the
concurrence of the Technical Committee of the then Population Division, National Planning
Commission.
2.5.1 Contents of the Questionnaires

29
The Migration and Employment Survey contained two types of questionnaire schedule:
Household Schedule and Individual Schedule. Questionnaire on household schedule listed all
usual/permanent resident staying home for at least 6 months in a year including the domestic
servant meeting the residence criterion. In addition to permanent resident, also listed were the
persons who slept the previous night in the household to work, to look for work and to study but
were not the members of the family.
The household schedule contained information on household member's sex, relationship to the
head of the household, age, education, marital status, occupation, migration status and use of any
method of family planning for currently married women aged 15-49 or her spouse. The
household schedule also contained information on socio-economic status of the household
concerning highest level of education, land holding and its use, livestock, sources of drinking
water, latrine facility, utility, nature of dwelling units, rooms, and building materials.
Information for the present study was collected from household head. Specifically, individual
schedule of the employment survey generated data for the present study on child labour situation
in Nepal. Hence, sets of questions were designed for the children aged 5-14 years in integrated
manner with employment survey. Most important questions were basically related to: current
status of school attendance, reasons for not attending school, helping in household activities, type
of activities, children involvement in paid activities, type of paid activities, children's status in
employment, sectors of employment, number of day and hours of work during the last week of
the survey, and reasons for not working.
2.5.2 Pre-testing
Questionnaires were pretested in three different sample districts. Altogether 120 households were
enumerated from ward number 1 of Nagarkot VDC in Bhaktapur district, ward number 5 of
Gorakhkali VDC in Gorkha district, ward number 7 of Ramche VDC in Sindhupalchowk district.
The pretested questionnaires for all three surveys were modified upon field experience and
finalized with the concurrence of the Technical Committee of the Population Division of
National Planning Commission. The pretesting of questionnaires also involved the practice of
sample selection procedure in the field.
30
2.5.3 Hiring and Training of Supervisors and Interviewers
All supervisors and interviewers were selected from the list of candidates who either completed
M.A. or were studying M.A. at Kirtipur Campus. All of the willing students from the Central
Department of Population Studies were selected for the purpose. The remaining students were
from Economics, Sociology, Statistics and Geography Central Department. These students were
assigned the role of either supervisor or enumerators depending upon their stage of study. One
category represented those who already completed M.A. at the time of the survey. The second
category represented those who completed the course work but had yet to complete their thesis.
The third category of students were largely continuing their course work at the Master's level.
The questionnaires were translated both into English and Nepali. Utmost care was taken to
reflect the two versions the same meaning. For training purposes modified pretested
questionnaires were used. Training for supervisors and enumerators took place for 15 days in
Kirtipur Campus. The training session began with the knowledge and exercise of filling out the
household schedule followed by socio-economic status of the household. After a week, the
training focused on employment survey questionnaires. Expert from Central Bureau of Statistics
were invited to assist the respective regional coordinator for training enumerators and
supervisors to interview household based on the pretested questionnaires.
Special focus was given for the training of supervisors about identification of the sample clusters,
methods of segmenting clusters if necessary, methods of selecting and mapping of the selected
segment, updating household lists, process of household selection, identification of sample
households, and field editing of the questionnaires. After the class room experience, the
supervisors and enumerators were taken to the local villages and urban periphery of Kathmandu
for actually interviewing households as a field exercise. This process took additional 3 days.
Only after the input from the training as well as from the problems encountered in the field
together with a knowledge from the pretest, questionnaires were finalized and printed upon the
concurrence of the Technical Committee of the Population Division.
2.5.4 Field Enumeration

31
For the survey purpose, Nepal was divided into seven survey regions. It was done before training
programme begun. Any district or regional boundary was not strictly followed to form these
survey regions but to a greater extent it was based on the size of the sample, closeness of the
sample clusters as well as convenience of the field personnels to travel from one sample cluster
to another.
All the hired field personnels were grouped into 7 sections representing seven survey regions for
which they were assigned. Two CDPS faculty members each were assigned a particular survey
region as regional coordinator for which he/she was fully responsible for training supervisors and
interviewers. Also the regional coordinators were responsible for coordinating, supervising and
monitoring of the field survey activities of the respective region. A mechanism was established
for the Central Monitoring System of the field activities underwhich various experts made
frequent spot-checks to supervise and monitor the field activities.
To ease the task of identifying the sample clusters, supervisors were provided maps of the
respective districts. They were also provided a list of sample clusters assigned to them. The list
contained basic information such as name of the sample cluster (as ward number), name of the
PSU's, name of district, cluster size according to the 1991 census, and number of households to
be interviewed. The list also contained information about whether a sample cluster is to be
segmented or not, and if it is to be segmented, number of segmentation to be made. As the
sample selection was based on the household counts of the 1991 census, i.e., 4 years earlier the
survey, it was evident to the headquarter that the current number of households in the sample
clusters might not be exactly the same as it was figured out by the 1991 census.
The headquarter discovered that there are basically three reasons for drastic change in the
number of households in any sample cluster: i. ward boundary change, ii. government's
resettlement programme, and iii. natural calamities. The headquarter decided that a minor
change in the cluster size for any reason should be taken as natural and household selection
should be made on the basis of the current size of the cluster. In the case of the clusters showing
drastic change in its size due to the any reason, supervisors were instructed to avoid the change
while preparing sampling frame and to base the household selection on the household counts of
1991 census as much as possible. Supervisors had to inform about such situation to the respective
regional coordinators, if not possible, the headquarter, when such abnormal situations was

32
evident. Our field experiences show that boundary change of the ward was the most frequent
cause for affecting the cluster size.
Updating of the sampling frame for household selection was done in the field by the supervisors.
For updating the sampling frame, supervisors were asked to make a visit all over the sample
cluster with the help of the most knowledgeable person of the area and sketch map of the sample
cluster. Supervisors and enumerators were asked to make maximum of three visits to the sample
households. If the third visit also failed to enumerate the sample household, supervisors and
enumerators were asked not to substitute for any case, but to enumerate such household as
nonresponse. In urban areas relatively higher number of respondents seemed indifferent to the
survey especially in big market centres.
The field enumeration was completed in two phases. The first phase enumeration was carried out
during the late December, 1995 to mid-February 1996. Since some of the districts of mountain
region were not included in the first phase of enumeration due to adverse climatic conditions,
field enumeration of those clusters were done in March/April, 1996.
2.5.5 Data Management
Questionnaire editings were done in two phases: a. Field editing, and b. Office editing. The first
phase editing was done by Supervisors immediately after the field enumeration was completed.
During the training period, supervisors were trained about checking internal consistencies of the
responses across the questions and methods to correct them. The second phase editing was done
at the office of the Central Department of Population Studies (CDPS) by Regional Coordinators
as well as other well-experienced personnels. In this phase, all the editors were provided basic
guidelines for identifying, verifying and correcting inconsistencies of responses across questions.
Uncoded questions were coded in this phase of the editing.
Computer facilities of the CDPS were utilized for managing data from the survey. Separate data
entry programmes were designed for each section of the questionnaire in dBASE IV+ by some
experts. Data entry programmes were designed in such a way to control possible errors in terms
of "out of range" values and "internal inconsistencies". A number of Computer Operators were
hired for data entry. Before data entry was commenced, Computer Operators were trained about

33
the nitty gritty of the questionnaires. Work of the Computer Operators were guided, supervised
and monitored by the concerning staff of the CDPS as well as by a computer programmer.
When data entry was completed, experienced staffs of the CDPS were involved in identifying
errors in data, if any. Computer experts designed several data editing programmes to verify and
correct the errors accordingly. Data editing were done in integrated manner for these surveys.
Data analysis were done utilizing the facilities of the SPSS/PC+ (Ver. 5). Before data analysis,
the whole data sets were transferred to SPSS/PC+ system files.

34
2.6 Weight
The urban areas were oversampled to ensure the separate analysis of the data for urban areas by
larger sample size. Therefore, to adjust the oversampling of the urban areas on aggregate
estimates, weight factor is estimated and used to deflate the urban sample in proportion to the
urban population observed in the 1991 census. Weight is estimated as a proportion of the ratio of
the urban to rural population in the 1991 census to the ratio in the sample. The weight for
national urban population is 0.336637, 0.362134 for hill urban, 0.317086 for Tarai urban.
Likewise, weight for Eastern urban is 0.325249, 0.349849 for Central urban, 0.338467 for
Western urban, 0.305073 for Midwestern urban and 0.278583 for Farwestern urban. Weight for
the rural sample is 1.
2.7 Techniques of Data Analysis
As this study primarily focuses on estimates of child labour for the country, decomposition
techniques are applied to make the sample values as equivalent to population. This requires the
following procedures: i. Projection of child population, ii. estimated proportion from sample, and
iii. decomposition.
i. Projection of Child Population: Child population for the survey date is estimated by
projection method. For this purpose, growth rate (exponential) for child population during the
1981-1991 intercensal period is estimated. It is found out that growth rate for the child
population for this period is 2.75 per cent per annum. Using this rate, again exponential growth
function, Pt = P0 ert , has been applied to the total count of the child population obtained from
1991 census to project the child population for the survey date. Projection is made for rural/urban
residence, ecological zones, and development regions separately using the same growth rate.
Since census does not provide distribution of the child population by other characteristics than
residence, zones and regions, distribution of child population by other characteristics is obtained
on the basis of sample distribution.
ii. Estimated Proportions from sample: Proportion based on the sample is estimated as, p = y/n,
where y is count-sum of the defined class either of binomial or multinomial variable, and n is
total sample children.

35
iii. Decomposition: In this stage, total estimated child population is decomposed into number of
working/labouring children using the value of p. If p represents the estimated proportion from
sample for working children, and c for total estimated children for the survey date, total working
children, w is equal to p*c.
2.8 Sample Statistics
To assess the level of precision of the sample estimates, this section presents sample statistics for
some selected variables (Table 2.4). Estimates of variance, var(p), are based on the formula for
equal cluster, though in practice it was a sampling of unequal clusters for which household
selection probabilities varied from one cluster to another. Similarly, it is assumed here that finite
population correction factor (fpc) is unity.
As compared to the rural areas, urban areas show fairly higher value for cv. On the other hand,
rural areas show higher value for deff and roh implying higher clustering effects on the estimates.
It may be firstly due to the fact that selection of sample was based on the households, and we
expect higher number of children per cluster in rural areas. Secondly, this estimates of variance
is not adjusted for the unequal probabilities for household selections that tend to overestimate the
variance.

36
Table 2.4: Sample Statistics for Some Selected Variables by Rural-Urban Residence, M/E Survey, 1995/96
Variables Confidence Interval p Var(p) se(p) cv% deff roh Upper LowerRural Male Sample 0.5161 0.00001360 0.00369 0.715 1.19 0.0040 0.5233 0.5089Urban Male Sample 0.5264 0.00005090 0.00713 1.436 1.20 0.0054 0.5404 0.5125Children 5-9 Years 0.4969 0.00001120 0.00335 0.675 1.07 0.0020 0.5034 0.4903 School Attendance
Rural 0.6345 0.00004346 0.00659 1.046 4.10 0.0653 0.6429 0.6171Urban 0.8451 0.00013000 0.01154 1.366 2.00 0.0830 0.8677 0.2825 Working Children
Rural 0.4337 0.00004144 0.00644 1.497 3.70 0.0568 0.4426 0.4174Urban 0.2300 0.00011900 0.01091 4.740 1.30 0.0270 0.2541 0.2086 Working and Schooling
Rural 0.2609 0.00002731 0.00523 2.010 3.10 0.0442 0.2702 0.2498Urban 0.1840 0.00011400 0.01066 5.743 1.50 0.0400 0.2065 0.1648 Work Only
Rural 0.1719 0.00002279 0.00477 2.808 3.50 0.0526 0.1794 0.1606Urban 0.0451 0.00003060 0.00553 13.210 0.10 -0.0730 0.0527 0.0310 Economic Activities
Rural 0.2839 0.00026941 0.01641 5.862 2.90 0.0400 0.3122 0.2478Urban 0.0851 0.00000645 0.00254 3.033 0.17 -0.0700 0.0880 0.0787 Noneconomic Activities
Rural 0.1498 0.00001571 0.00396 2.643 2.70 0.0358 0.1578 0.1422Urban 0.1438 0.00007020 0.00838 5.828 0.08 -0.0750 0.1602 0.1273 Schooling Only
Rural 0.3443 0.00002575 0.00507 1.492 2.50 0.0316 0.3499 0.3301Urban 0.6210 0.00019000 0.01377 2.216 1.60 0.0490 0.6480 0.5941 Idle
Rural 0.1556 0.00001920 0.00438 2.739 3.20 0.0463 0.1686 0.1514Urban 0.0772 0.00004470 0.00669 9.200 0.09 -0.0740 0.0857 0.0596Note: 1. Formula for estimating sample statistics: p = y/n; var(p) = 1/(a-1)*∑(pα - p)2, where, a =number of clusters,
pα = proportion for cluster a, p = proportion for total; se(p) = √var(p); cv% = se(p)/p*100; deff = var(p)/varsrs, where, varsrs = p(1-p)/n-1; roh = (deff-1)/( b-1), where b = n/a; CI =p±se(p)*tp , where, tp = 1.96 at 0.05 level of confidence from student's test distribution.

37
2.9 Demographic-Socioeconomic Characteristics of the Sample Population
2.9.1 Age - Sex Composition
The M/E survey enumerated 1,15,101 individuals, out of which number of males and females
accounted for 58,846 and 56,255 respectively (Table 2.5). Number of children aged 0-4 years
constituted 13.8 per cent of the total population. Likewise, total children aged 5-14 years
comprised of one-fourth of the total population. The economically active ages, i.e., 15-64, and
old ages, i. e., 65 and more years accounted for 56.9 per cent and 4.1 per cent of the total
population respectively.
Table 2.5: Age-Sex Composition of the Household Population, Nepal, 1995/961 Sex of the Children
Age Group Male Female Total
0-4 13.8 13.7 13.8 5-9 12.5 12.5 12.5 10-14 13.0 12.3 12.7 15-64 56.5 57.4 56.9 65&+ 4.1 4.0 4.1 Unidentified 0.1 0.1 0.1 Total 100.0 100.0 100.0 Total Population 58,846 56,255 115,101 1. This Table is based on the unweighted number of cases from the household schedule. Source: Migration and Employment Survey, 1995/96. Age distribution of the male as well as female population follow the distribution of the total
population. The overall sex ratio of the population is 104.6.
2.9.2 Literacy and Education of the Children Aged 5-14 years
It has been observed that 67.7 per cent of the total children aged 5-14 years are literate (Table
2.6). Among the literate, overwhelmingly majority of the children (81.1%) completed 0-5 grade
of education and another 17.2 per cent reported that they completed 6-9 grade of education. It is
evident that as compared to female children, a higher proportion of male children are literate.
About 75 per cent of the male children are reported as literate as compared to about 60 per cent
of the female children.

38

39
Table 2.6: Children 5-14 Years Old by Literacy and Education Attainment, Nepal, 1995/961 Literacy/ Age of the Children
Education 5-9 10-14 Total
Male Female Total Male Female Total Male Female Total
Illiterate 37.0 49.2 43.0 13.6 31.3 22.0 25.1 40.4 32.4
Literate 63.0 50.7 57.0 86.4 68.6 77.9 74.9 59.6 67.6
Total 100.0 100.0 100.0 100.0 100.0 100.0 100.0 100.0 100.0
Total Children 7,360 7,015 14,375 7,666 6,929 14,595 15,026 13,941 28,967
Completed Grade
0-5 grade 97.3 97.1 97.2 68.2 71.2 69.5 80.2 82.2 81.1
6-9 grade 0.8 0.8 0.7 30.4 27.2 29.1 18.2 15.9 17.2
10&+ grade 0.0 0.0 0.0 0.9 1.0 0.9 0.5 0.6 0.5
Unidentified 1.9 2.2 2.0 0.5 0.6 0.5 1.1 1.3 1.2
Total 100.0 100.0 100.0 100.0 100.0 100.0 100.0 100.0 100.0
Total Literates 4,639 3,560 8,196 6,621 4,755 11,376 11,257 8,315 19,572 1. This Table is based on the unweighted number of cases from the household schedule. Source: Migration and Employment Survey, 1995/96
Among the literates, male and female children do not vary much according to the completed
grade. However, a higher proportion of the male children reported to have completed higher
grade of education. There is a remarkable variation in the literacy by age of the children. The fact
that a higher proportion of the older children aged 10-14 years (77.9%) are reported as literate.
The corresponding figure for the children aged 5-9 years is 57.0 per cent.
2.9.3 Occupational Composition of the Children Aged 5-14 Years
Out of 5-14 years old children, the highest 63.4 per cent are reported as student. Another 18.0 per
cent of the children of this age group are reported that they do nothing (Table 2.7). It is evident
from the Table that about 9 per cent of the children are accounted for by housekeeping. Only a
small proportion of the children of this age group is reported with occupation in agricultural
(5.1%), and nonagricultural (1.7%) sectors.

40
Table 2.7: Children 5-14 Years Old by Principal Occupation Status, Nepal, 1995/961 Age of the Children
Occupational 5-9 10-14 Total
Categories Male Female Total Male Female Total Male Female Total
Agriculture 2.6 3.8 3.2 5.9 8.0 6.9 4.3 5.9 5.1
Nonagriculture 0.6 0.5 0.5 3.7 2.0 2.9 2.2 1.3 1.7
Household 2.7 9.9 6.2 4.4 21.4 12.5 3.6 15.6 9.4
Student 63.2 50.5 57.0 78.2 60.4 69.8 70.9 55.4 63.4
No Work 27.5 31.9 29.7 6.3 6.9 6.6 16.7 19.5 18.0
Unidentified 3.5 3.3 3.4 1.4 1.2 1.3 2.4 2.3 2.3
Total 100.0 100.0 100.0 100.0 100.0 100.0 100.0 100.0 100.0
Total Children 7,360 7,014 14,374 7,666 6,927 14,593 15,026 13,941 28,967
1 This Table is based on the unweighted number of cases from the household schedule. Source: Migration and Employment Survey, 1995/96
As compared to female children, a higher proportion of male children are student. For instances,
about 71 per cent of the male children are students as compared to 55.4 per cent of the female
children. Slightly higher proportion of female children have been reported with agricultural
occupants, but proportion of male children in nonagricultural sector is higher among male
children. Younger and older children of both sexes vary in terms of their main occupation. About
69.8 per cent of the children aged 10-14 years are reported as students as against 57.0 per cent
among 5-9 years old children. Nearly one-third of the children aged 5-9 years have been reported
without work as compared to about 7 per cent of the children without work among 10-14 years of
age.
2.9.4 Migration Status of the Children Aged 5-14 Years The household schedule of the survey questionnaire contained a question on migration status of
the persons listed in the schedule. The question was related to whether any household member is
residing in the area of enumeration (within the boundary of PSU) since birth. Any person not
residing in the place of enumeration since birth was identified as migrant, otherwise nonmigrant.

41
Table 2.8: Children 5-14 Years Old by Migration Status, Nepal, 1995/961 Age of the Children
Migration 5-9 10-14 Total
Status Male Female Total Male Female Total Male Female Total
Nonmigrants 92.2 92.3 92.3 89.7 88.1 88.9 90.9 90.2 90.6
Migrants 6.3 6.2 6.2 9.4 10.7 10.0 7.9 8.4 8.1
Unidentified 1.5 1.4 1.5 0.9 1.3 1.0 1.2 1.4 1.2
Total 100.0 100.0 100.0 100.0 100.0 100.0 100.0 100.0 100.0
Total Children 7,360 7,014 14,374 7,666 6,927 14,593 15,026 13,941 28,967
1 This Table is based on the unweighted number of cases from the household schedule. Source: Migration and Employment Survey, 1995/96.
Table 2.8 presents distribution of the children aged 5-14 years by migration status. The survey
identified that 8.1 per cent of the children aged 5-14 years as migrant. It is observed that male
and female children do not vary much according to migration status as about 8 per cent of the
children of respective sexes are identified as migrant. However, as compared to the younger
children aged 5-9 years (6.2%), a higher proportion of the older children of 5-14 ages (10.0%)
are migrants.

42
CHAPTER III
ACTIVITIES OF THE CHILDREN
The survey acquired information about children's status of current school attendance, reasons for
not attending school, work status, and type of activities they involve during most of the year.
Questions were designed to acquire information on their involvement in economic as well as
noneconomic activities. The following questions were related to their current school attendance,
reasons for not attending school, work status and type of activities5.
Q505. Do you go to school? If response is "No"
Q506. Why don't you go to school?
Q507. Do you help in household activities? If response is "Yes"
Q508. What type of activities?
Q509. Are you involved in activities outside the household? If response is "Yes"
Q510. What type of activities?
This study utilizes the information acquired from the above questions in analysing the activities
of the chidden.
Analytical Scheme
Children’s activities of domestic (household) nature here refer to the activities like care after
siblings, kitchen works, collecting firewood and fodder, cattle grazing, farm works, and "others"6
for which they are not directly paid, but they work as helper of their parents. For analytical
purpose, domestic activities are grouped under two main headings; economic and housekeeping
activities to represent principal activity status of the children. The activities - collecting firewood
and fodder, cattle grazing, farm work, and "others" - are grouped under the household economic
5 At the outset, questions were designed in such a way to collect information by addressing children
directly. However, due to practical difficulties in this regard, information were collected from household heads with proper modification of the questions to address head of the households in course of interview.
6 "others" category of work was designed for those children who work in the household economic
enterprises other than the agriculture for which they are not paid.

43
activities, whereas the first two - care after siblings and kitchen works - under housekeeping or
non-economic activities. Besides these, it has been evident from the survey that a sizeable
number of children have been reported to have been involved in all the above types of domestic
activities indicating children’s involvement in both the economic as well as housekeeping
activities. Such responses are also grouped under the economic activities on the ground that
economic activities will have priority over the housekeeping activities.
As the survey listed 59 types of children's economic activities outside home (as paid activities),
for analytical purpose, they are grouped under 6 main headings according to the type of
activities. They are: Agricultural Workers: agricultural labour, livestock keeping, poultry
farming, cattle grazing and ploughing, managers and workers in garden and nursery; General
Technical workers; Sales Workers: workers in wholesale or retail shops, mobile traders,
newspaper sellers and related workers; Service Workers: cook and waiter in hotels and
restaurants and related works, domestic servants, caretakers and sweepers, laundry, barber and
related works, and watchman; Production Workers: workers in rice mills, knitting and carpet
weaving, butchers, factory workers, tailoring, hosiery workers, plumbers, jewelry workers,
carving and painting and related workers; Construction, Transportation, and Communication
Workers: carpentry, transportation workers, construction labour and related workers.
Figure 1 presents the scheme for the activity analysis of the children. The conceptual scheme is
designed on the basis of two major activities of the children: work and current school attendance
status. Accordingly, at the outset, total children are dichotomously divided into working and not
working irrespective of their status of current school attendance. After having this classification,
not working children are classified into two categories according to their current school
attendance status. These are; schooling only, who attend school, and idle, who do not attend
school.
As evidences suggest that many working children in Nepal attend school, this study focuses on
the study of working children according to their status of current school attendance. Accordingly,
the group of working children is further classified into two categories: working and schooling
meaning group of children who participate in works and attend school, and work only refers to
group of children who participate in works but do not attend school. Thus, total number of
working children is the sum of the number of working children irrespective of current school

44
attendance status. Likewise, number of working children with, and without school attendance
have been further classified into two categories according to the type of works they do during
most of the year. These are classified broadly into economic and noneconomic activities. By
doing so, it is conceived that total number of working children with and without school
attendance is the sum of the number of children involved in economic and noneconomic
activities.
In general, economic activities of the children here involve all types of activities of economic
nature except housekeeping in parents'/guardians' home. Housekeeping activities of the children
are classified as noneconomic activities. In particular, total number of economic activities is
equal to the number of children involved in paid and unpaid activities. Accordingly, the above
classification is followed by further classification of the group of children involved in economic
activities into paid and unpaid activities. Paid activities of the children here refer to activities for
which they are paid either in cash or kind as wage but the work may be either regular or seasonal.
Contrarily, unpaid activities of the children are those activities in which children are not directly
paid in any form. This basically refers to activities of the children in household farms and other
household enterprises.
Children's activities are studied basically with reference to various household as well as
individual characteristics. The household characteristics involved in the analysis are current
place of residence, ecological zones, development regions, educational level of household
heads7, principal occupation of household heads8, family size, and size of household
7 Education level of household heads is categorized on the basis of completed grade as followings:
illiterate(no education); primary (0-5 grade); secondary (6-10 grade); above secondary (11 and higher grade).
8 Economically inactive categories of the occupation are not included in the analysis.

45
landholdings9. Similarly, the individual characteristics of the children involved in the analysis are
age and sex of the children, and their status of current school attendance.
9 Size of household landholdings is classified as following: landless (no land); marginal (0.0001-0.2094 acre); small (0.2095-1.045 acre); large (1.0452 acre and high). Classification is based on the National Planning Commission's definition.

27
Figure 1 - Analytical Scheme for the Activity Analysis of the Children1
Total Children (5-14 years) (6,225) Schooling Only Working Idle (2,287:36.7%) (irrespective of school attendance status) (Doing Nothing) (2,596:41.6%) (928:15.0%) Working & Working Only Schooling (No Schooling) (1,587:25.5%) (1,004:16.1%) Economic Noneconomic Economic Noneconomic (987:15.9%) (597: 9.6%) (673:10.8%) (331: 5.3%) Paid Unpaid Paid Unpaid (124:2.0%) (864: 13.9%) (155: 2.5%) (519: 8.3%)
1 Numbers in parentheses refer to estimates of the number (in ‘000) and percentage of the children associated with given activities based on projected child population and estimated proportion from the sample. Sub-totals of some of the entries do not add to total because of differences of nonresponse in the sample values as well as rounding effect in decomposition processes. For sample distribution see Annex I.

28
How Many Are They?
It is estimated that, as of December-February 1995-96, there are 6,225 T children in Nepal aged
5-14 years old which comprise of 29.1 per cent of the total estimated population to the period. Out of
6,225 T, number of male and female children are estimated to be 3,202 T and 3,024 T
respectively. Thus, the number of male children outnumbers females with sex ratio of 105.9
males per 100 females. It is estimated that 5,705 T (91.6%) Nepali children live in rural areas.
Of the total children, 2,939 T (47.2%) is estimated to live in Tarai (Table 3.1). The hill
accounted for 2,824 T (45.5%) and the least 462 T (7.4%) live in the mountain zone. Taking the
distribution of the children by development regions, the largest, 1,505 T children are in Eastern
region, followed by 1,293 T (20.8%) in Western region and 2,020 T in Central region. Similarly,
826 T children live in the Mid-western region, and the least 580 T (9.3%) in the Far-western
development region.
Based on the sample distribution of child population, about half of the children, i.e., 3,038 T
(48.8%) come from households with illiterate heads, another 1,867 T (30%) from households
with primary level of heads’ education and the rest 1,309 T (21.1%) from the households with
secondary or above secondary level of head's education. Similarly, based on the principal
occupation of household head, 3,817 T (61.3%) children come from the households with
agricultural occupation of the head's and the another 1,627 T (26.1%) come from the households
with nonagricultural occupation of the heads. Hand in hand, according to the family size, the
largest 2,180 T (34.7%) belong to the families with 5-6 members.
Distribution of the children by size of household landholding categories show that the largest
number of children 3,469 T (55.7%) live in households with large size of landholdings.
Altogether 1,326 T (21.3%) come from households with no land and small landholding size. As
of the December-February, 1995-96, 4,060 T (65.2%) children were attending schools
irrespective of their attending grade. Number of school not attending children is estimated to be
1,993 T (32%).

29
A. How Many Children Work?
There are 2.6 M Working Children in Nepal
Based on the estimated total child population for early 1996 and estimated proportion from the
sample, it is found out that there are approximately 2,596 T working children in Nepal with work
participation rate of 41.7 per cent. This comprises all the working children irrespective of their
current school attendance status, type and duration of work.
More Female Children Work Than Males
Of the total working children, males and females constitute 1,156 T and 1,439 T with
corresponding work participation rate of 36.1 per cent and 47.6 per cent respectively. Sex ratio of
the working children is 80.3 implying that about 80 male children are at work per 100 female
children.
As compared to males, a higher number of working female children don not have schooling. Of
the working children who do not attend school, number of female children comprised of 705 T in
comparison to 301 T male children. It is estimated that number of female children working
without schooling predominates over males in all the residences, zones, and regions. At the same
time, it is also estimated that there are a less number of working female children with schooling.
Of the total working children who were attending school, number of female children comprised
of 731 T as against 852 T males.
More Older Children Work Than Younger Ones
The work participation rate of children increases with age. For instance, participation rate of
24.8 per cent of the children aged 5-9 years increases to 58.3 per cent for the age group 10-14
years. Dominance of work participation rate of female children over male is apparent in both the
age groups. Increase in the participation rate as age shifts from 5-9 to 10-14 years is from 20.3
per cent to 51.5 per cent for males and 29.5 per cent to 65.9 per cent for female. Participation
rate of female children increased by 36.4 percentage point compared to 31.2 percentage points for
the male as the age shifts from 5-9 years to 10-14 years. It indicates that work participation of
girl children overwhelmingly dominates over boy children.
More Rural Children Work Than the Urban Children

30
Out of the total working children, 2,476 T (95.4%) are in rural areas and the rest 120 T (4.6%)
in urban areas. Out of 2,476 T working children in rural areas, 1,110 T are males and 1,366 T are
females. Likewise, out of 120 T working children in urban areas, 47 T are males and 73 T are
females. Work participation rate of the rural working children of either sexes exceeds that of the
corresponding rates for the urban children.
Of the one million working only children, rural areas alone comprise of 981 T which is 17.2 per
cent of the total rural children. Number of children working only in urban areas is fairly low, 23
T, which comes out to be 4.5 per cent of the total children in urban areas. However, urban areas
show fairly higher proportion of children working and attending school (18%). The
corresponding figure for rural areas is 26.1 per cent.
Similarly, the age group 10-14 years alone comprises of 590 T of the working only children
which comes out to be about 21 per cent of the total children in this age group. Another 37.3 per
cent of the total children of the same age group were working and attending school.
Correspondingly, the number of the working only children aged 5-9 years accounted for 11.3 per
cent of the total children of this age group. Another 13.4 per cent of the children of the same age
group are working and attending school.
Work Participation of Children Decreases From Mountain to Tarai Zone
Out of the 2,596 T estimated number of working children, hill zone alone comprised of about
1,282 T. Number of working children in the Tarai zone is estimated to be 1,067 T. Thus, hill
and Tarai comprised of about 95 per cent of the total working children in the country. However,
work participation rate of children is highest in the mountain zone (52.2%) followed by hill
(45.5%) and Tarai (36.3%). Work participation for female children exceeds those of male
children in all the zones.
Tarai alone comprises of 498 T of the total working only children in the country which comes out
to be about half of the total working only children. However, this number comprises of only 17.0
per cent of the total children in this zone in comparison to 23.0 per cent in the mountain. In
comparison to about one-third of the working and schooling children in the mountain and hill
zones, number of such children in Tarai accounted for only one-fifth of the total children of this
zone.
Highest Number of Working Children are in the Central Development Region

31
Central development region comprised of 784 T working children followed by 691 T in Eastern
region. Central region shows relatively lower work participation rate for the children of either
sexes. The highest work participation rate is found for Midwestern region (50.4%) followed by
Farwestern region (48.7%). Western development region shows the lowest work participation
rate of 33.4 per cent.
Of the one million working only children, Central development region contains 338 T followed
by 240 T in Eastern region. Western region contains 107 T of working only children which comes
out to be 8.3 per cent of the total children in the region. The corresponding figures for Eastern
and Central regions is found to be 15.9 and 16.8 per cent, and it is 23.8 and 22.7 per cent for
Midwestern and Far western regions. On the contrary, proportion of children working and
attending school is the lowest (22%) in the Central region and highest (30%) in Eastern region.
Work Participation of the Children of Either Sexes Decreases with Increase in the
Education Level of Household Heads
Of the total working children, 1,361 T (52.4%) belong to the households with illiterate heads
with the work participation rate of 44.8 per cent. In general, work participation rate of the
children decreases to 42.7 per cent with primary level of heads' education and further to 35.9 per
cent with secondary level of head's education. The lowest work participation rate is found among
children belonging to the households with above secondary level of heads' education. For all
level of household heads' education, work participation rate of female children is higher
compared to their male counterparts. Work participation rate of children of either sexes
decreases with increase in the level of heads' education. Work participation rate of male children
who belong to the households with illiterate heads is estimated to be 39.0 per cent. It decreases to
37.6 per cent with primary level of heads' education and further to 24.3 per cent with above
secondary level of heads' education. Likewise, work participation rate of female children
decreases from 51.0 per cent in households with illiterate heads to 33.9 per cent with above
secondary level of heads education.
Of the one million working only children, 708 T come from households with illiterate heads and
another 225 T from households with primary level of heads education. It is obviously seen that
proportion of working only children constantly declines with increasing level of head's education.
The proportion of the working only children (23.3%) among households with illiterate heads'
decreases to 12.1 per cent with primary level of heads education and further to 2.8 per cent with

32
above secondary level of heads education. However, the proportion of the children working and
attending school remain more or less same for all level of heads' education.
About Two-Third of the Working Children Belong to Households with Agricultural
Occupation of Household Heads with Remarkably Higher Work Participation Rate
Estimates have revealed that a total of 1,727 T (66.6%) working children belong to the
households with agricultural occupation. Number of working children in households with
nonagricultural occupation is estimated to be 590 T. About 45 per cent of the children in former
type of households worked as compared to 36.3 per cent in the latter. Likewise, work
participation of the children of either sexes is higher among households with agricultural
occupation of the heads. A lower proportion of the working only children is found among
households with nonagricultural occupation of the heads.
Work Participation of the Children Decreases with Increasing Size of the Family
Out of 2.6 M working children, 939 T (36.5%) come from families with size 5-6 persons and
another 767 T (29.5%) from families of size 7-8 persons. It is found that work participation of
children of either sexes in large sized households is relatively lower and vice versa. In general,
work participation rate of 63.9 per cent of the children with family size of 1-2 decreases to 37.5
per cent for 9 and above family size category. Participation rate of male children decreases from
67.4 per cent to 31.5 per cent across smallest to the largest family size categories. The decrease in
the participation rate for female children across these family size categories is 58.6 per cent to
43.4 per cent.
The highest 143 T working only children belong to the families of size 5-6 persons and another
312 T to the size of 7-8 persons. It is obviously seen that proportion of the working only children
of either sexes decreases with increasing family size (Table 3.3).

33
Work Participation of Children Does not Appear to Vary Much According to the Size
of Household Landholdings
Of the total working children, 1,505 T (58.0%) belong to households with large size of
landholdings. Except for landless households, work participation rate of the children is found be
more or less same for all landholding size categories.
School Not Attending Children Work More Than Those Attending Schools
Estimates suggest that about 1,586 T (62.0%) working children were attending schools at the
time of survey. The rest 1,005 T working children were not attending schools. Not surprisingly, a
higher work participation rate (50.4%) is observed among children of either sexes who do not
attend schools. The corresponding rate for the school attending children is found to be 39.0 per
cent. Work participation rate of male children vary from 36.3 per cent to 39.3 per cent between
school attending and not attending groups. Corresponding difference for the female children is
from 42.8 per cent to 57.4 per cent with respect to the schooling status.

34
Table 3.1: Estimates of the Working Children Aged 5-14 Years Who Worked Most of the Year and Their Work Participation Rate by Background Characteristics, Nepal, 1995/961
(estimates in '000 and rates in per cent) Estimates of
Background Total Children 2 Working Children 3 Participation Rate Characteristics Both Male Female Both Male Female Both Male Female Nepal 6,225 3,202 3,024 2,596 1,156 1,439 41.7 36.1 47.6 Age
05-09 3,403 1,734 1,668 844 352 492 24.8 20.3 29.5 10-14 2,822 1,467 1,355 1,645 756 893 58.3 51.5 65.9
Residence
Urban 520 272 248 120 47 73 23.0 17.2 29.4 Rural 5,705 2,929 2,776 2,476 1,110 1,366 43.4 37.9 49.2
Ecological Zones
Mountain 462 235 227 241 108 133 52.2 45.7 58.9 Hill 2,824 1,432 1,392 1,282 594 690 45.4 41.5 49.6 Tarai 2,939 1,534 1,405 1,067 448 617 36.3 29.2 43.9
Development Regions
Eastern 1,506 772 735 691 312 380 45.9 40.5 51.7 Central 2,020 1,056 964 784 350 436 38.8 33.1 45.2 Western 1,293 659 634 429 194 236 33.2 29.5 37.3 Midwestern 826 418 408 416 185 231 50.4 44.2 56.6 Farwestern 580 297 283 282 120 162 48.7 40.6 57.1
Education Level of the HH Head4
Illiterate 3,038 1,555 1,483 1,361 605 756 44.8 38.9 51.0 Primary 1,867 952 915 798 357 440 42.7 37.5 48.2 Secondary 795 414 380 285 126 160 35.9 30.3 42.0 Secondary &+ 514 273 241 148 66 82 28.8 24.3 33.9
Principal Occupation of the HH Head4
Agriculture 3,817 1,951 1,867 1,727 772 955 45.2 39.6 51.2 Nonagriculture 1,627 856 770 590 262 328 36.3 30.6 42.6
Family Size4
1-2 19 11 8 12 8 4 63.9 67.4 58.6 3-4 603 352 250 254 128 125 42.1 36.4 50.1 5-6 2,180 1,164 1,015 939 441 498 43.1 37.8 49.0 7-8 1,762 861 901 767 324 443 43.6 37.6 49.2 9&+ 1,662 813 849 624 256 368 37.6 31.5 43.4
Size of Household Landholding4
Landless 1,065 559 506 359 149 210 33.7 26.7 41.5 Small 261 141 119 113 52 61 43.2 36.7 51.0 Marginal 1,416 722 694 614 273 340 43.3 37.8 49.0 Large 3,469 1,774 1,695 1,505 680 824 43.4 38.3 48.6
Current School Attendance Status4
Yes 4,060 2,349 1,708 1,586 852 732 39.1 36.3 42.8 No 1,993 768 1,228 1,005 301 705 50.4 39.2 57.4
1 Sub total of some of the entries in the Table do not add to total because of the differences of nonresponse in sample and rounding effect in decomposition processes.
2 Projected population. 3 Migration and Employment Survey, 1995/96. 4 Estimates for these categories are obtained by decomposing total projected child population of the
respective sexes using estimated proportion of the child population from the survey.

35
Table 3.2: Estimates of the Economically Active Children Aged 5-14 Years Who Worked Most of the Year by Type of Activities and Background Characteristics, Nepal, 1995/961
(in '000) Type of Activities
Background Working and Schooling Working Only Characteristics Both Male Female Both Male Female Nepal 1,584 852 731 1,004 301 705 Age
05-09 457 241 216 384 109 275 10-14 1,053 571 482 590 182 410
Residence
Urban 96 38 57 23 8 15 Rural 1,489 814 674 981 293 690
Ecological Zones
Mountain 135 80 55 106 27 79 Hill 877 479 397 402 115 292 Tarai 565 285 280 498 161 335
Development Region
Eastern 452 236 216 240 77 163 Central 444 239 205 338 109 230 Western 322 162 159 107 31 76 Midwestern 218 128 90 197 56 140 Farwestern 150 89 62 132 31 100
Education Level of HH Head
Illiterate 650 383 267 708 222 488 Primary 571 297 274 225 60 165 Secondary 228 111 117 56 14 42 Secondary &+ 133 61 72 14 5 9
Principal Occupation of the HH Head
Agriculture 1,020 560 459 703 211 494 Nonagriculture 398 203 194 191 58 133
Family Size
1-2 6 5 1 6 3 3 3-4 143 91 52 110 37 73 5-6 594 328 266 343 113 231 7-8 454 237 218 312 88 225 9&+ 387 193 194 233 60 173
Size of Household Landholding
Landless 180 84 97 178 65 113 Small 57 33 23 56 18 37 Marginal 343 195 148 268 78 191 Large 999 539 460 502 140 364
1 Sum of the numbers of the respective column in this Table should add to the respective column for the total working children in Table 3.1. Any difference is due to nonresponse in the sample and rounding effect in the decomposition processes.
Source: Based on the estimates of total children in Table 3.1 and estimated proportion from the sample by type of activities in Table 3.3.

36
Table 3.3: Work Participation Rate of the Children Aged 5-14 Years Who Worked During Most of the Year by Type of Activities and Background Characteristics, Nepal, 1995/961
(in percent) Participation Rate
Background Working and Schooling Working Only Characteristics Both Male Female Both Male Female Nepal 25.4 26.6 24.2 16.1 9.4 23.3 Age
05-09 13.4 13.9 13.0 11.3 6.3 16.5 10-14 37.3 38.9 35.5 20.9 12.4 30.2
Residence
Urban 18.4 14.1 23.2 4.5 3.0 6.1 Rural 26.1 27.8 24.3 17.2 10.0 24.9
Ecological Zones
Mountain 29.2 34.1 24.2 23.0 11.7 34.8 Hill 31.1 33.4 28.5 14.2 8.0 21.0 Tarai 19.2 18.6 19.9 17.0 10.5 23.8
Development Regions
Eastern 30.0 30.6 29.4 15.9 10.0 22.2 Central 22.0 22.6 21.2 16.8 10.3 23.9 Western 24.9 24.6 25.1 8.3 4.7 12.0 Midwestern 26.4 30.6 22.0 23.8 13.4 34.5 Farwestern 25.9 29.9 21.8 22.7 10.5 35.3
Education Level of the HH Head
Illiterate 21.4 24.6 18.0 23.3 14.3 32.9 Primary 30.6 31.2 30.0 12.1 6.3 18.1 Secondary 28.6 26.7 30.8 7.0 3.3 11.1 Secondary &+ 25.9 22.4 30.0 2.8 1.9 3.8
Principal Occupation of the HH Head
Agriculture 26.7 28.7 24.6 18.4 10.8 26.5 Nonagriculture 24.5 23.8 25.2 11.7 6.8 17.3
Family Size
1-2 31.9 41.9 17.2 31.9 25.6 41.4 3-4 23.7 25.8 20.8 18.2 10.6 29.0 5-6 27.3 28.1 26.2 15.7 9.7 22.7 7-8 25.8 27.5 24.1 17.7 10.2 25.0 9&+ 23.3 23.7 22.8 14.0 7.4 20.4
Size of Household Landholding
Landless 16.9 14.9 19.2 16.7 11.6 22.3 Small 21.7 23.5 19.6 21.3 12.8 31.4 Marginal 24.2 27.0 21.3 18.9 10.8 27.5 Large 28.8 30.4 27.1 14.5 7.9 21.5
1 Sum of the figures of respective columns of this Table should add to the respective column for work participation in Table 3.1. Any difference is due to rounding effects.
Source: Migration and Employment Survey, 1995/96.

37
B. Economically Active Children There are 1.7 M Economically Active Children in Nepal
It estimated that there are about 1.7 M economically active children aged 5-14 years of age in
Nepal (Table 3.4). The economic participation rate of the children is estimated to be 26.7 per
cent (Table 3.5) meaning these many children in Nepal participate in economic activities. About
987 T of the economically active children are attending schools and the rest 673 T are not.
Number of children who participated in economic activities with school attendance comprised
15.9 per cent of the total child population. It is revealed that another 10.8 per cent of the children
aged 5-14 years participating in economic activities do not attend schools.
Though More Numbers of Males are economically Active Than Females, Male and
Female Children do not Vary Much In Terms of Economic Participation Rate
Of the 1.7 M economically active children, number of male children comprised of 894 T, and the
rest 770 T females (Table 3.4). Economic participation rate of male children exceeds that of
female children. However, in general, male and female children do not vary much according to
economic participation rates. About 28 male children out of 100 participate in economic
activities as compared to 26 female children. It is estimated that 987 T of the economically active
male children attend schools. It implies that there is a higher number of economically active
female children who do not attend schools. Of the 673 T working only children, 432 T are
females comprising of 14.3 per cent of the total female children of 5-14 years of age. The
corresponding figures for the male children is found to be 242 T comprising of 7.6 per cent of the
total male children of the same age group.
About 1.2 M Economically Active Children are 10-14 Years Old
It is estimated that about 1.2 M economically active children are 10-14 years old. Economic
participation of the children of these ages is more than three times higher than those of younger
ones aged 5-9 years. For instances, there are 12.5 per cent children economically active in 5-9
years age group, and it increases to 40.8 per cent for the children of 10-14 years age group. Of
the 1.2 M economically active children in 10-14 years age group, 706 T (61.4%) are attending

38
schools and the rest are not. More number of economically active male children are attending
schools than female children in age group 10-14 years.

39
Rural Areas Comprise of 1.6 M Economically Active Children
It is estimated that there are approximately 1.6 M economically active children in rural areas out
of which 867 T are males and 752 T females. Altogether 44 T economically active children are
estimated to be in urban areas. Rural and urban areas vary significantly in terms of economic
participation rate of the children. About 28 per cent of the children aged 5-14 years are
economically active in rural areas as against 8.5 per cent in urban areas. Likewise, economic
participation of the rural children of either sexes is significantly higher as compared to that of
urban children.
Of the economically active children in rural areas, 955 T are attending schools and 662 T are not.
It is estimated that economically active children who are attending schools in rural areas
accounted for 16.7 per cent of the total rural children. About 12 per cent of the rural children are
reported to have been involved in economic activities without attending schools. The
corresponding figure for urban areas is as low as 2 per cent. About 21 per cent of the male
children involved in economic activities are attending schools as compared to 11.7 per cent of the
female children in rural areas. In contrast, about 15 per cent of the female children involved in
economic activities are not attending schools in comparison to 8.1 per cent of the male children
in rural areas.
Children's Economic Participation Rate is the Highest in Mountain Zone
Hill zone comprises of 862 T economically active children followed by the 622 T in the Tarai
zone. Though the least number of economically active children is estimated to be for the
mountain, this zone shows the highest economic participation rate for the children. According to
the estimates, economic participation rate of the children in mountain zone is 38.0 per cent. The
corresponding figures for the hill and Tarai are 30.5 per cent and 21.2 per cent respectively. For
either sexes, economic participation is highest in the mountain and lowest in the Tarai. Similarly,
mountain shows the highest proportion of its children of either sexes involved in economic
activities with and without attending schools.
40
Midwestern and Farwestern Development Regions Show the Highest Economic
Participation Rate for the Children
The highest number of economically active children is estimated for the Central development
region followed by the Eastern region. However, these regions show a relatively lower economic
participation rate as compared to some of the other regions. Mid and Farwestern regions show
the highest rate of economic participation for the children. About 33 per cent of the children of
the respective regions participated in economic activities. The lowest economic participation rate
of 20.7 per cent for the children is found in Western region. The corresponding figures for the
Eastern and Central regions are 29.8 per cent and 24.4 per cent respectively.
Eastern region shows the highest number of 291 T children involved in economic activities with
school attendance.. This is followed by 258 T such children in Central region. In relative terms,
Central region shows the lowest proportion of its children in economic activities with school
attendance. Contrarily, Mid and Farwestern regions show the highest proportion of the children
in economic activities without school attendance. The lowest proportion of such children is
found in Western region.
Economic Participation of the Children Decreases with Increasing Level of
Household Heads' Education
It is estimated that the highest 936 T of the economically active children belong to households
with illiterate heads and the another 505 T to households with primary level of heads' education.
Economic participation rate for the former type of households is found to be 30.8 per cent that
lowers down to 27.0 per cent for the latter type. Economic participation rate of 13.4 per cent for
the children is estimated to those households with above secondary level of heads' education.
Similarly, economic participation rates of the male and female children over these educational
categories decrease from 31.2 to 16.3 per cent and 30.4 to 10.1 per cent respectively. Also the
households with above secondary level of heads' education shows the lowest proportion of the
children of either sexes in economic activities without school attendance.

41
More than One Million Economically Active Children Belong to the Households with
Agricultural Occupation of the Heads
About 1.2 M of the economically active children come from households with agricultural
occupation of heads with economic participation rate of 30.8 per cent. Economic participation of
children is found to be lower for the households with nonagricultural occupation of the heads
(19.7%).
Economic Participation of the Children Decreases with Increasing Size of the Family
Estimates reveal that children's participation in the economic activities is highest for the families
of 1-2 size. About 42 per cent of the children from such families participated in economic
activities. The corresponding figure for the families of size 5-6 persons is about 27 per cent. The
lowest of 24.0 per cent children participate in economic activities in the families of size 9
persons and higher.
Larger Size of Household Landholdings Leads to Higher Economic Participation
Among Children
One million economically active children belong to households with large size of landholdings.
The lowest economic participation rate of 17.1 per cent is observed for the children living in the
households with no land. It increases to 25.8 per cent for the marginal landholding size category
and to 29.0 per cent for the large size of land holdings.

42
Table 3.4: Estimates of the Economically Active Children Aged 5-14 Years Who Worked Most of the Year by Type of Activities and Background Characteristics, Nepal, 1995/961
(in '000) Background Total Working & Schooling Working Only Characteristics Both Male Female Both Male Female Both Male Female Nepal 1,664 894 770 987 649 337 673 242 432 Age
05-09 426 215 211 224 144 80 200 70 130 10-14 1,150 629 521 706 467 238 443 161 282
Residence
Urban 44 27 18 32 20 12 12 6 6 Rural 1,620 867 752 955 628 326 662 237 426
Ecological Zones
Mountain 176 84 92 92 61 31 83 23 61 Hill 862 457 405 580 367 210 281 89 194 Tarai 622 348 275 309 214 97 311 132 178
Development Regions
Eastern 449 253 196 291 190 101 158 63 95 Central 489 266 223 258 176 81 231 89 142 Western 268 148 119 202 123 78 65 24 41 Midwestern 276 140 137 146 97 50 128 41 87 Farwestern 189 91 97 90 63 27 98 28 70
Education Level of the HH Head
Illiterate 936 485 451 449 303 145 485 180 305 Primary 505 273 232 359 226 133 145 46 99 Secondary 154 91 62 119 79 40 33 11 22 Secondary &+ 69 45 24 60 40 19 9 4 5
Principal Occupation of the HH Head
Agriculture 1,174 618 556 690 443 245 483 174 310 Nonagriculture 321 186 135 203 142 61 117 43 74
Family Size
1-2 8 6 2 4 3 1 4 3 2 3-4 163 99 64 91 68 23 72 31 41 5-6 587 336 250 359 246 112 227 89 138 7-8 507 253 254 296 187 109 211 67 145 9&+ 400 200 199 238 145 93 159 53 107
Size of Household Landholding
Landless 182 99 83 76 48 28 106 50 55 Small 67 37 31 31 22 9 36 14 22 Marginal 406 213 193 217 149 68 188 64 125 Large 1,004 544 461 660 428 231 343 115 229
1 Subtotal of some of the entries do not add to total due to nonresponse in sample values and rounding effect in decomposition processes.
Source: Based on estimates of total children in Table 3.1 and estimated proportion from the sample in Table 3.5.

43

44
Table 3.5: Economic Participation Rate of the Children Aged 5-14 Years Who Worked Most of the Years by Types of Activities and Background Characteristics, Nepal, 1995/1996
(in per cent) Economic Participation Rate Total Working & Schooling Working Only Both Male Female Both Male Female Both Male Female
Nepal 26.7 27.9 25.5 15.9 20.3 11.2 10.8 7.6 14.3 Age
05-09 12.5 12.4 12.6 6.6 8.3 4.8 5.9 4.1 7.8 10-14 40.8 42.9 38.4 25.0 31.8 17.6 15.7 11.0 20.8
Residence
Urban 8.5 9.7 7.2 6.2 7.5 4.8 2.3 2.2 2.3 Rural 28.4 29.6 27.1 16.7 21.4 11.7 11.6 8.1 15.4
Ecological Zones
Mountain 38.0 35.6 40.6 20.0 25.9 13.8 18.1 9.7 26.8 Hill 30.5 31.9 29.1 20.6 25.6 15.1 9.9 6.2 14.0 Tarai 21.2 22.7 19.5 10.5 13.9 6.9 10.6 8.6 12.6
Development Regions
Eastern 29.8 32.8 26.6 19.3 24.7 13.7 10.5 8.1 12.9 Central 24.2 25.2 23.2 12.8 16.7 8.4 11.4 8.4 14.8 Western 20.7 22.4 18.8 15.6 18.7 12.3 5.0 3.7 6.5 Midwestern 33.4 33.4 33.5 17.7 23.2 12.2 15.5 9.9 21.3 Farwestern 32.6 30.8 34.3 15.6 21.3 9.7 16.9 9.4 24.6
Education Level of the HH Head
Illiterate 30.8 31.2 30.4 14.8 19.5 9.8 16.0 11.6 20.6 Primary 27.0 28.6 25.4 19.3 23.7 14.6 7.8 4.8 10.8 Secondary 19.3 22.0 16.4 15.0 19.0 10.6 4.2 2.7 5.9 Secondary &+ 13.4 16.3 10.1 11.6 14.7 8.1 1.8 1.6 2.1
Principal Occupation of the HH Head
Agriculture 30.8 31.7 29.8 18.1 22.7 13.1 12.6 8.9 16.6 Nonagriculture 19.7 21.7 17.5 12.5 16.6 7.9 7.2 5.0 9.6
Family Size
1-2 41.7 51.2 27.6 19.4 27.9 6.9 22.2 23.3 20.7 3-4 27.1 28.1 25.7 15.1 19.3 9.0 11.9 8.8 16.4 5-6 26.9 28.8 24.7 16.5 21.1 11.1 10.4 7.7 13.6 7-8 28.8 29.4 28.2 16.8 21.7 12.1 12.0 7.8 16.1 9&+ 24.0 24.6 23.5 14.3 17.8 10.9 9.6 6.5 12.6
Size of Household Landholding
Landless 17.1 17.7 16.4 7.2 8.7 5.5 9.9 9.0 10.9 Marginal 25.8 25.9 25.7 11.9 15.8 7.3 13.8 9.7 18.7 Small 28.7 29.5 27.9 15.4 20.6 9.9 13.3 8.8 18.0 Large 29.0 30.6 27.2 19.0 24.1 13.6 9.9 6.5 13.5
Source: Migration and Employment Survey, 1995/96.
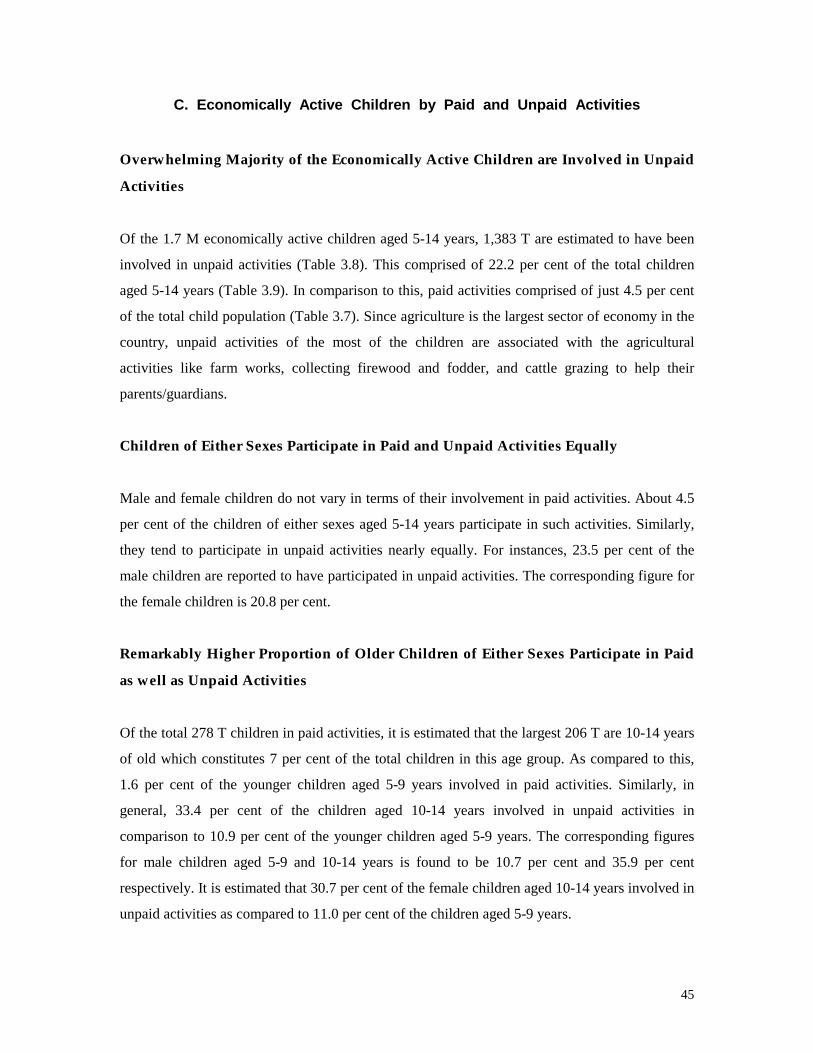
45
C. Economically Active Children by Paid and Unpaid Activities Overwhelming Majority of the Economically Active Children are Involved in Unpaid
Activities
Of the 1.7 M economically active children aged 5-14 years, 1,383 T are estimated to have been
involved in unpaid activities (Table 3.8). This comprised of 22.2 per cent of the total children
aged 5-14 years (Table 3.9). In comparison to this, paid activities comprised of just 4.5 per cent
of the total child population (Table 3.7). Since agriculture is the largest sector of economy in the
country, unpaid activities of the most of the children are associated with the agricultural
activities like farm works, collecting firewood and fodder, and cattle grazing to help their
parents/guardians.
Children of Either Sexes Participate in Paid and Unpaid Activities Equally
Male and female children do not vary in terms of their involvement in paid activities. About 4.5
per cent of the children of either sexes aged 5-14 years participate in such activities. Similarly,
they tend to participate in unpaid activities nearly equally. For instances, 23.5 per cent of the
male children are reported to have participated in unpaid activities. The corresponding figure for
the female children is 20.8 per cent.
Remarkably Higher Proportion of Older Children of Either Sexes Participate in Paid
as well as Unpaid Activities
Of the total 278 T children in paid activities, it is estimated that the largest 206 T are 10-14 years
of old which constitutes 7 per cent of the total children in this age group. As compared to this,
1.6 per cent of the younger children aged 5-9 years involved in paid activities. Similarly, in
general, 33.4 per cent of the children aged 10-14 years involved in unpaid activities in
comparison to 10.9 per cent of the younger children aged 5-9 years. The corresponding figures
for male children aged 5-9 and 10-14 years is found to be 10.7 per cent and 35.9 per cent
respectively. It is estimated that 30.7 per cent of the female children aged 10-14 years involved in
unpaid activities as compared to 11.0 per cent of the children aged 5-9 years.

46
Children's Involvement in Paid as well as Unpaid Activities is Higher in Rural Areas
than in Urban Areas
Rural areas comprise an overwhelming majority of children involved in paid as well as unpaid
activities. It estimated that there are 266 T children involved in paid activities in rural areas and
in urban areas it is 12 T. It implies that 4.7 per cent of rural children involved in paid activities in
comparison to 2.4 per cent in urban areas. Likewise, another 1,352 T children are estimated to
have been involved in unpaid activities in rural areas and another 32 T in urban areas.
A lower proportion of urban children in paid activities may be due to the fact that overwhelming
majority of urban children attend schools (85%) and there is a small proportion of children left
for works, whereas in rural areas the proportion of school attending children is as high as 63 per
cent. Furthermore, as compared to rural areas, we expect less proportion of the school attending
children to have been involved in paid activities in urban areas. Nevertheless, the number of
children involved in paid activities (12 T) in urban areas seems to be underestimated.
Tarai Zone Shows the Lowest Participation Rate of children in Paid as well as Unpaid
Activities
Among ecological zones, 126 T children are estimated to have been involved in paid activities in
the Tarai zone followed by 124 T in the hill. Contrarily, it is indicated that hill zone alone
comprises of 737 T children involved in unpaid activities. The corresponding figure for the Tarai
is estimated to be 494 T.
Tarai zone shows the lowest proportion of children to have been involved in paid as well as
unpaid activities. About 4.3 per cent of children in Tarai zone is estimated to have been involved
in paid activities and another 16.8 per cent in unpaid activities. Among the zones, mountain
shows the highest participation rate of children in paid as well as unpaid activities. It is estimated
that 6.3 per cent of the children in this zone involved in paid activities and the another 31.8 per
cent in unpaid activities. Correspondingly, in the hill zone, 4.4 per cent of its children is
estimated to have been involved in paid activities and 26.1 per cent in unpaid activities.

47
Participation of Children in Paid as well as Unpaid Activities is Lowest in Western
Development Region
Of the 278 T children in paid activities, Eastern development region comprises of the largest 96
T followed by 92 T in Central region. The lowest number of 32 T of such children is estimated
for Western region. It is indicated that participation of the chidden in paid as well as unpaid
activities is lowest in Western region. About 2.5 per cent of children in this region involved in
paid activities and another 18.2 per cent in unpaid activities. Eastern development region has 6.2
per cent of its child population involved in paid activities. Proportion of the children involved in
unpaid activities is estimated to have been highest in Mid and Farwestern regions where about 29
per cent of the children of respective regions involved in such activities.
Participation of Children in Paid and Unpaid Activities Decreases with Increasing
Level of Household Head's Education
Of the 278 T children involved in paid activities, the largest 163 T belong to households with
illiterate heads. This implies that more than 5 per cent of children from such households
participated in paid activities. Similarly, another largest 771 T children from such households are
estimated to have been involved in unpaid activities with a participation of 24.5 per cent. It is
indicated that participation of children in paid and unpaid activities decreases with increasing
level of household heads' education (Table 2.7 and Table 2.9). For instances, participation of
children in paid activities is estimated to be decreased from 5 per cent with no education of
household heads to 4.0 percent with primary level of heads' education and 3.1 per cent with
above primary level of heads' education. Correspondingly, children's participation in unpaid
activities lowers down from 24.5 per cent with no education of household heads to 23.1 per cent
with primary level of heads' education and to 10.2 per cent with above secondary level of
household head's education.
Children who belong to households with nonagricultural occupation of heads are less likely to
participate in unpaid activities. About 15.2 per cent of children from such households
participated in unpaid activities as compared to 26.0 per cent from the households with
agricultural occupation of the heads. Similarly, children from relatively larger family size
participate less in paid as well as unpaid activities, but participation of the children in such

48
activities particularly in unpaid activities increases with increasing size of household
landholdings.
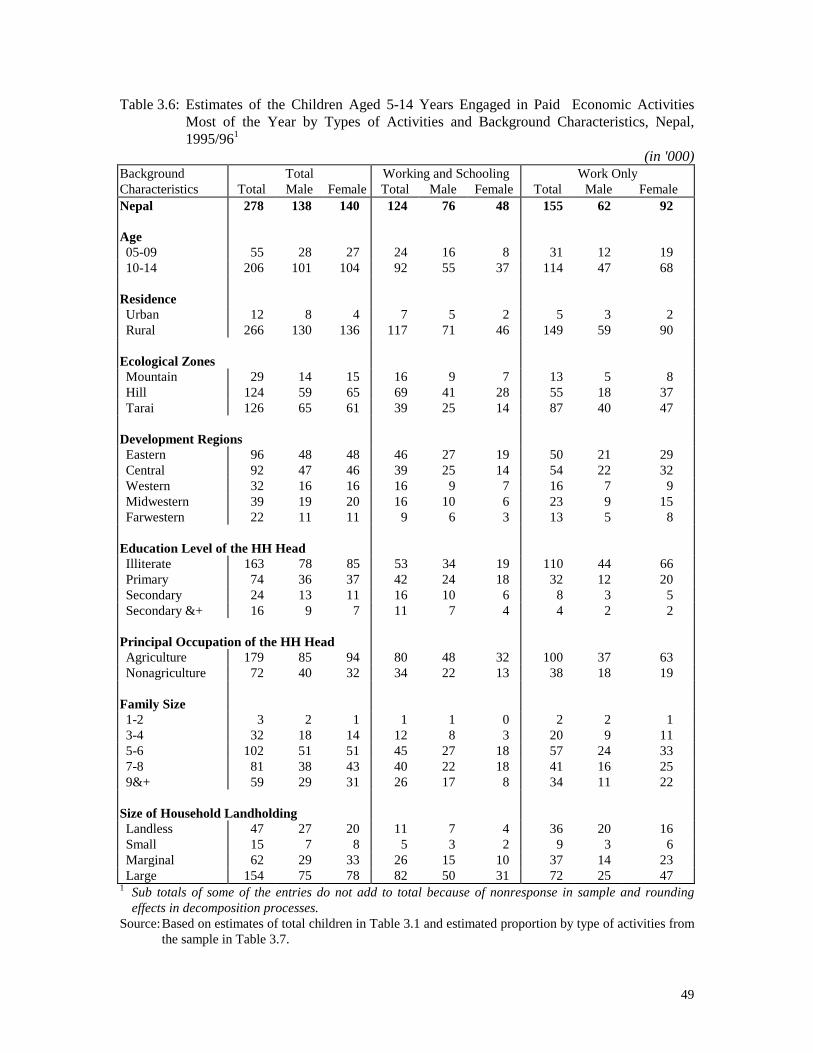
49
Table 3.6: Estimates of the Children Aged 5-14 Years Engaged in Paid Economic Activities Most of the Year by Types of Activities and Background Characteristics, Nepal, 1995/961
(in '000) Background Total Working and Schooling Work Only Characteristics Total Male Female Total Male Female Total Male Female Nepal 278 138 140 124 76 48 155 62 92 Age
05-09 55 28 27 24 16 8 31 12 19 10-14 206 101 104 92 55 37 114 47 68
Residence
Urban 12 8 4 7 5 2 5 3 2 Rural 266 130 136 117 71 46 149 59 90
Ecological Zones
Mountain 29 14 15 16 9 7 13 5 8 Hill 124 59 65 69 41 28 55 18 37 Tarai 126 65 61 39 25 14 87 40 47
Development Regions
Eastern 96 48 48 46 27 19 50 21 29 Central 92 47 46 39 25 14 54 22 32 Western 32 16 16 16 9 7 16 7 9 Midwestern 39 19 20 16 10 6 23 9 15 Farwestern 22 11 11 9 6 3 13 5 8
Education Level of the HH Head
Illiterate 163 78 85 53 34 19 110 44 66 Primary 74 36 37 42 24 18 32 12 20 Secondary 24 13 11 16 10 6 8 3 5 Secondary &+ 16 9 7 11 7 4 4 2 2
Principal Occupation of the HH Head
Agriculture 179 85 94 80 48 32 100 37 63 Nonagriculture 72 40 32 34 22 13 38 18 19
Family Size
1-2 3 2 1 1 1 0 2 2 1 3-4 32 18 14 12 8 3 20 9 11 5-6 102 51 51 45 27 18 57 24 33 7-8 81 38 43 40 22 18 41 16 25 9&+ 59 29 31 26 17 8 34 11 22
Size of Household Landholding
Landless 47 27 20 11 7 4 36 20 16 Small 15 7 8 5 3 2 9 3 6 Marginal 62 29 33 26 15 10 37 14 23 Large 154 75 78 82 50 31 72 25 47
1 Sub totals of some of the entries do not add to total because of nonresponse in sample and rounding effects in decomposition processes.
Source: Based on estimates of total children in Table 3.1 and estimated proportion by type of activities from the sample in Table 3.7.

50
Table 3.7: Participation Rate of the Children Aged 5-14 Years Engaged in Paid Economic Activities Most of the Year by Types of Activities and Background Characteristics, Nepal, 1995/96
(in per cent) Total Work and Schooling Work Only Total Male Female Total Male Female Total Male Female
Nepal 4.5 4.3 4.6 2.0 2.4 1.6 2.5 2.0 3.1 Age
05-09 1.6 1.6 1.6 0.7 0.9 0.5 0.9 0.7 1.1 10-14 7.3 6.9 7.7 3.2 3.7 2.7 4.0 3.2 5.0
Residence
Urban 2.4 2.9 1.8 1.3 1.8 0.8 1.0 1.1 1.0 Rural 4.7 4.4 4.9 2.0 2.4 1.7 2.6 2.0 3.2
Ecological Zones
Mountain 6.2 5.8 6.6 3.4 3.8 2.9 2.8 2.0 3.7 Hill 4.4 4.1 4.7 2.4 2.9 2.0 1.9 1.3 2.7 Tarai 4.3 4.3 4.3 1.3 1.6 1.0 3.0 2.6 3.3
Development Regions
Eastern 6.3 6.2 6.5 3.0 3.5 2.6 3.3 2.7 4.0 Central 4.6 4.4 4.8 1.9 2.4 1.4 2.6 2.1 3.3 Western 2.5 2.4 2.6 1.2 1.3 1.1 1.3 1.1 1.5 Midwestern 4.7 4.5 5.0 1.9 2.4 1.4 2.8 2.0 3.6 Farwestern 3.8 3.8 3.8 1.5 2.0 0.9 2.3 1.7 2.8
Education Level of the HH Head
Illiterate 5.4 5.0 5.7 1.8 2.2 1.3 3.6 2.9 4.4 Primary 4.0 3.8 4.1 2.2 2.5 1.9 1.7 1.3 2.1 Secondary 3.1 3.3 2.8 2.0 2.4 1.6 1.0 0.8 1.2 Secondary &+ 3.1 3.4 2.7 2.2 2.6 1.9 0.9 0.9 0.9
Principal Occupation of the HH Head
Agriculture 4.7 4.4 5.1 2.1 2.4 1.7 2.6 1.9 3.4 Nonagriculture 4.4 4.6 4.2 2.1 2.5 1.7 2.3 2.1 2.5
Family Size
1-2 15.3 18.6 10.3 4.2 4.7 3.4 11.1 14.0 6.9 3-4 5.3 5.0 5.8 1.9 2.4 1.4 3.4 2.7 4.4 5-6 4.7 4.4 5.0 2.1 2.3 1.8 2.6 2.1 3.3 7-8 4.6 4.5 4.7 2.3 2.6 2.0 2.3 1.9 2.8 9&+ 3.6 3.5 3.6 1.6 2.1 1.0 2.0 1.4 2.6
Size of Household Landholding
Landless 4.4 4.8 4.0 1.0 1.3 0.8 3.4 3.5 3.2 Small 5.6 4.8 6.6 2.1 2.4 1.8 3.5 2.4 4.8 Marginal 4.4 4.0 4.8 1.8 2.1 1.5 2.6 1.9 3.3 Large 4.4 4.3 4.6 2.4 2.8 1.8 2.1 1.4 2.8
Source: Migration and Employment Survey.1995/96.

51
Table 3.8: Estimates of the Children Age 5-14 Years Engaged in Unpaid Economic Most of the Year by Types of Activities and Background Characteristics, Nepal, 1995/961
(in '000) Background Total Working and Schooling Work Only Characteristics Total Male Female Total Male Female Total Male Female Nepal 1,383 753 629 864 573 290 519 180 340 Age
05-09 370 186 184 200 128 72 170 59 111 10-14 943 526 416 615 412 202 328 114 215
Residence
Urban 32 19 13 26 16 10 6 3 3 Rural 1,351 734 616 838 557 280 512 177 336
Ecological Zones
Mountain 147 70 77 77 52 25 70 18 52 Hill 737 397 339 511 326 182 226 71 157 Tarai 494 281 214 270 189 83 224 92 131
Development Regions
Eastern 353 206 148 246 164 82 108 42 66 Central 397 219 177 219 151 67 178 68 111 Western 235 132 103 186 114 71 49 17 32 Midwestern 236 120 116 131 87 44 105 33 72 Farwestern 166 80 86 81 57 25 85 23 62
Education Level of the HH Head
Illiterate 771 406 365 395 269 125 375 136 240 Primary 431 236 195 318 202 115 113 34 79 Secondary 128 77 52 103 69 34 25 8 18 Secondary &+ 53 35 18 48 33 15 5 2 3
Principal Occupation of the HH Head
Agriculture 993 532 461 610 395 214 383 136 247 Nonagriculture 248 145 103 169 120 48 79 24 55
Family Size
1-2 5 4 1 3 3 0 2 1 1 3-4 130 81 49 79 60 19 51 22 30 5-6 483 284 199 314 219 94 169 65 105 7-8 426 215 211 256 164 91 170 51 120 9&+ 338 169 169 212 128 84 126 42 84
Size of Household Landholding
Landless 135 72 63 65 41 24 70 31 39 Small 52 29 23 25 19 6 27 10 17 Marginal 343 183 160 192 134 58 151 50 102 Large 849 467 382 578 377 200 271 89 182
1 Subtotals of some of the entries do not add to total because of nonresponse in sample and rounding effects in decomposition processes.
Source: Based on estimates of total children in Table 3.1 and estimated proportion by types of activities in the sample in Table 3.9.

52
Table 3.9: Participation Rate of the Children Aged 5-14 Years Engaged in Unpaid Economic Activities Most of the Year by types of Activities and Background Characteristics, Nepal, 1995/96
(in per cent) Background Total Working and Schooling Work Only Characteristics Total Male Female Total Male Female Total Male Female Nepal 22.2 23.5 20.8 13.9 17.9 9.6 8.3 5.6 11.2 Age
05-09 10.9 10.7 11.0 5.9 7.4 4.3 5.0 3.4 6.7 10-14 33.4 35.9 30.7 21.8 28.1 14.9 11.6 7.8 15.8
Residence
Urban 6.1 6.8 5.3 4.9 5.7 4.0 1.2 1.1 1.4 Rural 23.7 25.1 22.2 14.7 19.0 10.1 9.0 6.0 12.1
Ecological Zones
Mountain 31.8 29.8 33.9 16.6 22.1 10.9 15.2 7.7 23.1 Hill 26.1 27.7 24.4 18.1 22.8 13.1 8.0 4.9 11.3 Tarai 16.8 18.3 15.2 9.2 12.3 5.9 7.6 6.0 9.3
Development Regions
Eastern 23.5 26.7 20.1 16.3 21.2 11.1 7.1 5.4 9.0 Central 19.6 20.7 18.4 10.8 14.3 6.9 8.8 6.4 11.5 Western 18.2 20.0 16.3 14.4 17.4 11.2 3.8 2.6 5.1 Midwestern 28.5 28.6 28.4 15.8 20.7 10.8 12.7 7.9 17.7 Farwestern 28.7 26.9 30.6 14.1 19.2 8.7 14.6 7.6 21.8
Education Level of the HH Head
Illiterate 25.4 26.1 24.6 13.0 17.3 8.4 12.3 8.8 16.2 Primary 23.1 24.8 21.3 17.0 21.2 12.6 6.1 3.6 8.7 Secondary 16.1 18.5 13.6 13.0 16.6 9.0 3.2 1.9 4.6 Secondary &+ 10.2 12.8 7.3 9.3 12.2 6.1 0.9 0.7 1.2
Principal Occupation of the HH Head
Agriculture 26.0 27.3 24.7 16.0 20.3 11.4 10.0 7.0 13.2 Nonagriculture 15.2 16.9 13.4 10.4 14.1 6.3 4.9 2.8 7.1
Family Size
1-2 26.4 32.6 17.2 15.3 23.3 3.4 11.1 9.3 13.8 3-4 21.6 23.1 19.6 13.1 16.9 7.6 8.5 6.1 11.9 5-6 22.2 24.4 19.6 14.4 18.8 9.3 7.8 5.6 10.3 7-8 24.2 25.0 23.4 14.5 19.1 10.1 9.6 5.9 13.3 9&+ 20.3 20.8 19.9 12.8 15.7 9.9 7.6 5.1 9.9
Size of Household Landholding
Landless 12.7 12.9 12.4 6.1 7.4 4.7 6.5 5.5 7.7 Small 20.0 20.7 19.1 9.7 13.4 5.3 10.3 7.3 13.8 Marginal 24.2 25.4 23.1 13.6 18.5 8.4 10.7 6.9 14.7 Large 24.5 26.3 22.5 16.7 21.3 11.8 7.8 5.0 10.7
Source: Migration and Employment Survey, 1995/96.

53
D. Economically Active Children by Types of Work Overwhelming Majority of the Economically Active Children Do Agriculture Related
Works
Of the 1,664 T economically active children, 1,576 T (94.7%) are estimated to have been
involved in agricultural related works and the rest 87 T (5.3%) in nonagricultural works (Table
3.10 & Table 3.11). Estimates reveal that 27 T (12.6%) economically active children worked as
service workers, and another 26 T (1.6%) as communication, transportation and communication
workers. Number of economically active children who worked as general technical workers
constituted of 14 T (0.8%), and another 13 T (0.8%) of production workers. The least 7 T (0.4%)
is constituted of sales workers.
Proportion of children involved in agricultural and nonagricultural works does not vary
according to the sex of children. However, in numbers, male children exceed those of female
children in all types of work except in service works.
Older Children Participate more in Nonagricultural Works, whereas Younger
Children in Agricultural Works
It is estimated that 96.1 per cent or 409 T children aged 5-9 years are involved in agricultural
related works and the rest 3.9 per cent or 1,085 T in nonagriculture related works. The
comparative figures for the older children aged 10-14 years is estimated to be 94.3 and 5.7 per
cent respectively. About 2 per cent (21 T) of the economically active children aged 10-14 years
worked as construction, transportation and communication workers. Children of either age
groups who worked as sales workers accounted for 1.6 per cent of the economically active
children.
Urban Children More Likely to Involve in Nonagricultural Works
It is observed that 78.5 per cent (35 T) of the economically active children in urban areas worked
as agriculture related workers in comparison to 95.2 per cent in rural areas. Among the
nonagriculture related works, service works accounted for 8.9 per cent of the economically active
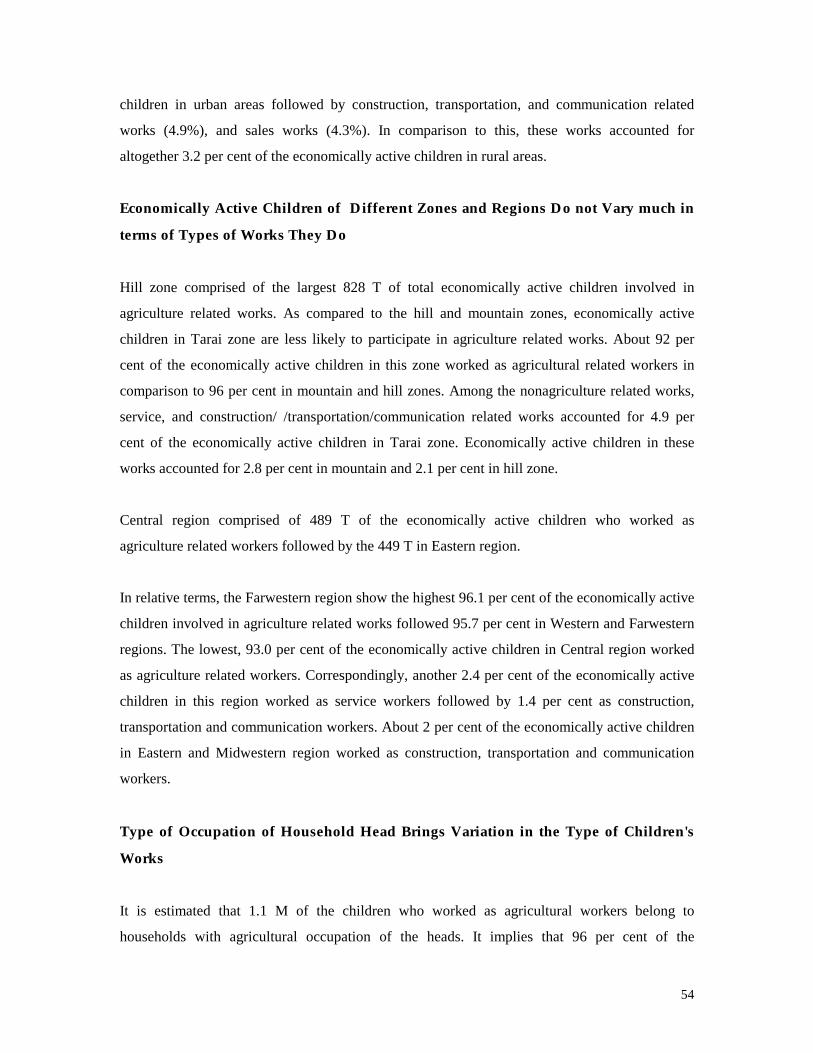
54
children in urban areas followed by construction, transportation, and communication related
works (4.9%), and sales works (4.3%). In comparison to this, these works accounted for
altogether 3.2 per cent of the economically active children in rural areas.
Economically Active Children of Different Zones and Regions Do not Vary much in
terms of Types of Works They Do
Hill zone comprised of the largest 828 T of total economically active children involved in
agriculture related works. As compared to the hill and mountain zones, economically active
children in Tarai zone are less likely to participate in agriculture related works. About 92 per
cent of the economically active children in this zone worked as agricultural related workers in
comparison to 96 per cent in mountain and hill zones. Among the nonagriculture related works,
service, and construction/ /transportation/communication related works accounted for 4.9 per
cent of the economically active children in Tarai zone. Economically active children in these
works accounted for 2.8 per cent in mountain and 2.1 per cent in hill zone.
Central region comprised of 489 T of the economically active children who worked as
agriculture related workers followed by the 449 T in Eastern region.
In relative terms, the Farwestern region show the highest 96.1 per cent of the economically active
children involved in agriculture related works followed 95.7 per cent in Western and Farwestern
regions. The lowest, 93.0 per cent of the economically active children in Central region worked
as agriculture related workers. Correspondingly, another 2.4 per cent of the economically active
children in this region worked as service workers followed by 1.4 per cent as construction,
transportation and communication workers. About 2 per cent of the economically active children
in Eastern and Midwestern region worked as construction, transportation and communication
workers.
Type of Occupation of Household Head Brings Variation in the Type of Children's
Works
It is estimated that 1.1 M of the children who worked as agricultural workers belong to
households with agricultural occupation of the heads. It implies that 96 per cent of the

55
economically active children from such households worked as agricultural workers. In
comparison to this, 89 per cent of the economically active children from households with
nonagricultural occupation of household heads worked as agricultural workers and the another 4
per cent as service workers followed by 2.9 per cent in construction, transportation, and
communication workers. The corresponding figures for the former type of households is 0.8 and
1.2 per cent respectively.
School Not Attending Children are More Likely to Participate in Nonagricultural
Works
It is observed that 92.2 per cent of the economically active children who do not attend schools
worked as agricultural workers in comparison to 96.5 per cent who attend schools. The highest,
1.7 per cent of the economically active children who do not attend schools worked as service
workers and another 1.7 per cent as construction, transportation and communication workers.
Not less than one per cent of the economically active children who attend schools worked as
nonagricultural workers.
More Than Three-Fourth of the Economically Active Children Worked All the Seven
Days of the Week
It is observed that 76.5 per cent of the economically active children worked all the 7 days of the
week during the last week of the survey. Proportion of the children working all the 7 days of the
week is 90.6 per cent among those who worked as service workers followed by 87 per cent
among those who worked as general technical workers.

56
Table 3.10: Estimates of the Economically Children Aged 5-14 Years by Types of Work During the Last Week of the Survey by Background Characteristics, Nepal, 1995/961
(in '000) Background Eco. Active Agriculture General Sales Service Production Construction, Tran-Characteristics Children Related Technical Workers Workers Workers sport, Communi. Nepal 1,664 1,576 14 7 27 13 26 Sex
Male 894 844 8 5 13 8 15 Female 770 732 6 2 13 5 11
Age
5-9 426 409 3 2 7 1 3 10-14 1,150 1,085 10 5 18 11 21
Residence
Urban 44 35 1 2 4 1 2 Rural 1,620 1,541 13 5 23 13 24
Ecological Zones
Mountain 176 169 1 0 2 1 3 Hill 862 828 6 3 9 7 9 Tarai 622 574 7 5 15 5 15
Development Regions
Eastern 449 425 3 3 8 2 8 Central 489 455 6 3 12 6 7 Western 268 256 1 0 3 3 4 Midwestern 276 264 4 1 2 1 5 Farwestern 189 181 0 1 3 2 2
Education Level of the Household Head
Illiterate 936 885 9 2 16 6 18 Primary 505 483 3 3 5 6 5 Secondary 154 145 2 2 2 1 2 Secondary + 69 63 0 1 4 0 1
Principal Occupation of the Household Head
Agriculture 1,174 1,132 10 1 9 8 14 Nonagriculture 321 286 4 5 13 4 9
Family Size
1-2 8 7 0 0 1 0 0 3-4 163 150 1 1 4 2 4 5-6 587 556 5 3 9 4 8 7-8 507 482 5 3 7 3 7 9&+ 400 381 2 0 6 5 7
Size of Household Landholding
Landless 182 159 2 2 8 4 6 Marginal 67 60 1 0 2 1 3 Small 406 388 2 2 4 3 7 Large 1,004 966 9 3 12 5 10
Current School Attendance Status
Yes 987 952 7 5 8 7 8 No 674 622 7 2 18 7 19
1 Subtotals of some of the entries do not add to total because of nonresponse in sample and rounding effect in decomposition processes.
Source: Based on estimates of total children in Table 3.1 and estimated proportion in the sample in Table 3.11.

57
Table 3.11: Percentage Distribution of the Economically Children Aged 5-14 Years by Types of Work During the Last Week of the Survey by Background Characteristics, Nepal, 1995/96
Background Agriculture General Sales Service Production Characteristics Related Technical Workers Workers Workers CTCW1 TEACS2 Nepal 94.7 0.8 0.4 1.6 0.8 1.6 6,384 Sex
Male 94.4 0.9 0.6 1.5 0.9 1.7 3,446 Female 95.0 0.8 0.2 1.7 0.7 1.5 2,938
Age
5-9 96.1 0.7 0.4 1.7 0.3 0.8 1,486 10-14 94.3 0.9 0.5 1.6 0.9 1.8 4,898
Residence
Urban 78.5 1.8 4.3 8.9 1.6 4.9 506 Rural 95.2 0.8 0.3 1.4 0.8 1.5 6,214
Ecological Zones
Mountain 96.1 0.5 0.0 1.2 0.6 1.6 644 Hill 96.1 0.7 0.3 1.1 0.8 1.0 3,398 Tarai 92.4 1.2 0.7 2.5 0.9 2.4 2,342
Development Regions
Eastern 94.7 0.7 0.7 1.7 0.4 1.9 1,674 Central 93.0 1.3 0.6 2.4 1.3 1.4 1,839 Western 95.7 0.3 0.1 1.2 1.2 1.4 1,104 Midwestern 95.7 1.4 0.2 0.6 0.3 1.9 1,066 Farwestern 96.1 0.1 0.4 1.4 0.9 1.1 696
Education Level of the Household Head
Illiterate 94.6 0.9 0.2 1.7 0.6 2.0 3,589 Primary 95.6 0.6 0.6 1.0 1.2 1.0 1,937 Secondary 94.6 1.2 1.2 1.2 0.7 1.2 590 Secondary + 90.6 0.4 1.1 6.0 0.4 1.5 265
Principal Occupation of the Household Head
Agriculture 96.4 0.8 0.1 0.8 0.6 1.2 4,504 Nonagriculture 89.0 1.1 1.5 4.0 1.4 2.9 1,231
Family Size
1-2 86.7 0.0 3.3 6.7 3.3 0.0 30 3-4 92.2 0.8 0.5 2.7 1.1 2.6 626 5-6 94.8 0.9 0.6 1.6 0.6 1.4 2,250 7-8 95.1 1.1 0.6 1.3 0.5 1.4 1,945 9&+ 95.3 0.5 0.0 1.4 1.2 1.6 1,532
Size of Household Landholding
Landless 87.2 1.3 1.3 4.6 2.0 3.6 701 Marginal 89.2 1.2 0.4 3.1 1.9 4.2 259 Small 95.4 0.5 0.5 1.1 0.8 1.7 1,560 Large 96.2 0.9 0.3 1.2 0.5 1.0 3,853
Current School Attendance Status
Yes 96.5 0.7 0.5 0.8 0.7 0.8 3,788 No 92.2 1.0 0.3 2.7 1.0 2.7 2,583
Table 3.11 contd........

58
Table 3.11 Contd........ Number of Working Days (during the last week of the survey)3
1 Day 3.2 0.0 0.0 0.0 0.0 3.4 3.1 2 Days 4.1 5.1 15.0 3.5 0.0 3.4 4.1 3 Days 3.4 2.6 10.0 0.0 3.2 8.0 3.5 4 Days 4.0 2.6 5.0 1.2 9.7 8.0 4.0 5 Days 4.5 2.6 0.0 3.5 3.2 3.4 4.4 6 Days 4.3 0.0 0.0 1.2 9.7 9.2 4.3 7 Days 76.4 87.2 70.0 90.6 74.2 64.4 76.5
Total 6,047 54 28 103 51 101 100.0 1 Construction, Transportation, and Communication Workers. 2 Total Economically Active Children in the Sample. 3 The last column is the percentage distribution of the Total. Source: Migration and Employment Survey, 1995/96.

59
E. Economically Active Children by Number of Working Hours
About Half of the Economically Active Children Worked for 14-34 Hours/Week and
Another One-Third Worked More than 35 Hours/Week
It is revealed that about half of the economically active children worked for 14-34 hrs. during
the last week of the survey. About 14 per cent (230 T) of the economically active children
worked 49 hrs. or more (or 7 hrs. or more/day) during the last week of the survey, another 21.3
per cent (355 T) 35-48 hrs. (or 5-6 hrs./day) (Table 3.12 & Table 3.13). This implies that about
35 per cent (585 T) of the economically active children worked more than 35 hrs. during the last
week of the survey. Number of economically active children who worked 21-34 hrs (3-4
hrs./day) accounted for 30.7 per cent (511 T) of the total economically active children. Similarly,
about 18 per cent (292 T) of the economically active children worked 14-20 hrs. and another 16.5
per cent worked less than 14 hrs. Altogether 83.5 per cent (1,389 T) of the economically active
children worked 14 hrs. or more (2 hrs. or more/day).
Older Children Worked Relatively Longer Hours
A higher proportion of the older children aged 10-14 years worked relatively longer hours. About
30 per cent of the children of this age group worked 42 or more hrs. (6 hrs. or more/day) and
another 15.3 per cent less than 14 hrs. The corresponding figures for the younger children of 5-9
years is about 20 per cent for both the work hrs. categories. It is to be noted that about 15 per
cent of the children of either age groups worked 28-34 hrs. during the last week of the survey.
A Higher Proportion of Female Children Has Relatively Longer Working Hours
The survey revealed that 42.9 per cent of the economically active female children worked 28 hrs.
or more (4 hrs. or more/day) in comparison to 28.3 per cent of the male children. Number of
economically active female children who had less than 14 hrs. of work accounted for 12.1 per
cent of the total economically active female children. The corresponding figure for male
children is 20.4 per cent.

60
Rural and Urban Children do not Vary Much in Terms of Their Working Hours
In rural areas, 35.2 per cent of the economically active children worked 35 hrs. or more during
the last week of the survey. The corresponding figure for the urban children is 34.3 per cent.
However, it is to be noted that urban children who worked 56 hrs. or more (16.4%) during the
week is remarkably higher as compared to rural children (10.3%). About 18 per cent of the
economically active children in rural areas worked less than 14 hrs. and, in urban areas, it is
about 16 per cent.
Relatively Higher Proportion of the Economically Active Children in Mountain Zone
Worked Relatively Shorter Hours
Mountain zone shows that a higher proportion of the economically active children working for
shorter working hours. About 36 per cent of the economically active children in this zone worked
less than 21 hrs. during the last week of the survey. The corresponding figure for hill is 34.6 per
cent. In Tarai zone, 32.5 per cent of the economically active children worked for less than 21 hrs.
Another 30 per cent of the economically active children in each zone worked 21-34 hrs.
Relatively higher proportion of the economically active children in Tarai (32%) worked 42 hrs.
and more as compared to about 25 per cent in the mountain and hill. Relatively higher
proportion of the children in Mid and Farwestern development regions worked relatively for
higher longer hours of work.
Higher proportion of children with relatively shorter hours of work in mountain and hill might be
due to seasonal variation in agricultural works since this survey was conducted in off-farming
season, i. e, December-January. In the month of December-January in Nepal, farmers and their
children are released from farm works and there are less opportunities available for them to be
involved in other types of activities during the agricultural slack seasons in these zones.
Children Associated with Uneducated Household Heads More Likely to Work
Longer Hours
About 15 per cent of the economically active children from the households with uneducated
heads worked less than 14 hrs. during the last week of the survey. The corresponding figures of

61
the children who belong to households with primary, secondary and above secondary level of
household head is 17.5 per cent, 22.6 per cent, 21.8 per cent respectively. Number of
economically active children associated with uneducated household heads who worked 35 hrs. or
more accounted for 32.1 per cent in comparison to 23.9 per cent with primary level of heads'
education, 21.6 per cent with secondary level of heads' education, and 16.3 per cent with above
secondary level of education of the household heads. Similarly, children from households with
nonagricultural occupation of the heads are less likely to participate relatively for longer hours.
Children Involved in Nonagricultural Works Tend to Have Longer Hours of Work
It is revealed that about 27 per cent of the economically active children in agriculture related
works worked 42 hrs. or more during the last week of the survey. In comparison to this, number
of economically active children who worked 42 hrs. or more as general technical workers
accounted for 38.5 per cent. The corresponding figure for those who worked as sales workers is
40.0 per cent, followed by the production workers 64.5 per cent, service workers 64.6 per cent,
and construction, transportation and communication workers 45.5 per cent. Again, a higher
proportion of the children with relatively shorter hours of work among agriculture related
workers may be due to seasonal variation. We can expect higher proportion of the children
working as agricultural related workers with relatively longer hours of works in the agricultural
peak season.

62
Table 3.12: Estimates of the Economically Active Children Aged 5-14 Years by Number of Working Hours During the Last Week of the Survey and Background Characteristics, Nepal, 1995/961
(in '000) Number of Working Hours ETEAC2 < 7 7-13 14-20 21-27 28-34 35-41 42-48 49-55 56&+
Nepal 1,664 108 167 292 264 247 117 238 56 174 Age
5-9 426 39 50 82 73 63 35 48 12 26 10-14 1,150 67 110 197 179 171 77 175 41 135
Sex
Male 894 75 108 177 150 132 57 98 20 78 Female 770 34 60 117 114 115 60 139 36 95
Residence
Urban 44 3 4 8 7 7 3 6 1 5 Rural 1,620 102 188 343 237 196 49 171 69 265
Ecological Zones
Mountain 176 22 19 24 22 32 9 26 7 14 Hill 862 60 85 152 144 122 75 116 31 77 Tarai 622 25 62 116 97 92 33 96 19 83
Development Regions
Eastern 449 29 44 81 71 82 30 58 15 39 Central 489 45 61 92 71 59 32 55 15 58 Western 268 13 33 60 47 39 15 36 6 20 Midwestern 276 7 13 42 45 39 29 58 12 31 Farwestern 189 15 18 23 31 29 10 30 8 25
Education Level of the Household Head
Illiterate 936 52 86 150 142 136 70 149 38 113 Primary 505 37 52 95 85 79 36 67 15 38 Secondary 154 15 20 31 28 18 7 17 3 14 Secondary + 69 5 10 17 10 13 3 4 0 7
Principal Occupation of the Household Head
Agriculture 1,174 81 122 200 181 176 85 172 39 118 Nonagriculture 321 19 30 60 54 48 21 40 9 39
Family Size
1-2 8 0 0 1 1 1 0 1 0 1 3-4 163 11 15 32 25 22 12 22 6 19 5-6 587 39 58 109 95 86 43 74 19 63 7-8 507 32 48 87 83 80 34 75 18 51 9&+ 400 27 46 63 60 57 28 68 12 40
Table 3.12 Contd.........

63
Table 3.12 Contd........ Size of Household Landholding
Landless 182 7 19 27 25 23 10 33 8 32 Marginal 67 7 5 10 11 11 4 7 3 9 Small 406 22 42 74 67 59 35 55 13 39 Large 1,004 73 101 181 160 153 67 144 32 94
Types of Work
Agriculture Related 1,576 106 160 285 253 236 113 225 52 147 General Technical 14 0 1 1 4 2 0 2 0 3 Sales Workers 7 1 1 0 1 1 0 0 0 2 Service Workers 27 0 1 2 3 3 1 5 1 12 Production Workers 13 0 1 1 1 1 1 3 1 4 CTCW3 26 1 3 2 3 4 1 3 1 7
1 Subtotals of some of the entries may not add to total because of nonresponse in the sample and rounding effects in decomposition processes.
2 Estimated Total Economically Active Children. 3 Construction, Transportation, and Communication Workers. Source: Based on estimates on economically active children in Table 3.4 and estimated proportion from the
sample in Table 3.13.

64
Table 3.13: Percentage Distribution of the Economically Active Children Aged 5-14 Years by Number of Working Hours During the Last Week of the Survey and Background Characteristics, Nepal, 1995/96
Number of Working Hours < 7 7-13 14-20 21-27 28-34 35-41 42-48 49-55 56&+ TEACS1
Nepal 6.5 10.0 17.6 15.9 14.8 7.0 14.3 3.4 10.4 6,384 Age
5-9 9.0 11.7 19.3 17.1 14.8 8.2 11.1 2.8 6.0 1,486 10-14 5.8 9.5 17.1 15.5 14.9 6.7 15.2 3.5 11.7 4,898
Sex
Male 8.4 12.0 19.8 16.8 14.7 6.4 11.0 2.2 8.7 3,446 Female 4.4 7.7 15.1 14.8 15.0 7.7 18.1 4.7 12.4 2,938
Residence
Urban 6.3 11.6 21.2 14.6 12.1 3.0 10.6 4.3 16.4 506 Rural 6.5 10.0 17.5 15.9 14.9 7.1 14.4 3.4 10.3 6,214
Ecological Zones
Mountain 12.6 10.8 13.7 12.8 18.3 5.1 14.7 3.9 8.0 644 Hill 6.9 9.9 17.6 16.7 14.1 8.7 13.4 3.5 9.0 3,398 Tarai 4.0 9.9 18.6 15.6 14.8 5.2 15.5 3.0 13.3 2,342
Development Regions
Eastern 6.5 9.8 17.9 15.9 18.2 6.6 12.9 3.4 8.7 1,674 Central 9.3 12.5 18.7 14.6 12.1 6.6 11.3 3.0 11.9 1,839 Western 4.8 12.4 22.3 17.6 14.4 5.6 13.5 2.2 7.3 1,104 Midwestern 2.5 4.8 15.1 16.3 14.0 10.5 21.0 4.4 11.3 1,066 Farwestern 8.0 9.6 12.1 16.2 15.4 5.5 15.9 4.1 13.3 696
Education Level of the Household Head
Illiterate 5.6 9.2 16.0 15.2 14.6 7.5 15.9 4.1 12.1 3,589 Primary 7.2 10.3 18.8 16.9 15.7 7.2 13.3 3.0 7.6 1,937 Secondary 9.7 12.9 20.3 17.9 12.0 4.6 11.4 1.9 9.3 590 Secondary + 7.4 14.4 25.0 13.9 18.5 4.6 5.6 0.5 10.2 265
Principal Occupation of the Household Head
Agriculture 6.9 10.4 17.0 15.4 15.0 7.3 14.6 3.3 10.0 4,504 Nonagriculture 6.1 9.3 18.8 16.8 15.1 6.6 12.4 2.8 12.1 1,231
Family Size
1-2 3.7 3.7 18.5 18.5 18.5 0.0 18.5 3.7 14.8 30 3-4 6.6 9.0 19.9 15.1 13.6 7.2 13.2 3.9 11.6 626 5-6 6.7 9.9 18.6 16.2 14.7 7.4 12.6 3.2 10.8 2,250 7-8 6.2 9.5 17.1 16.4 15.8 6.7 14.7 3.6 10.0 1,945 9&+ 6.7 11.5 15.7 14.9 14.3 6.9 16.9 3.1 10.0 1,532
Table 3.12 Contd........
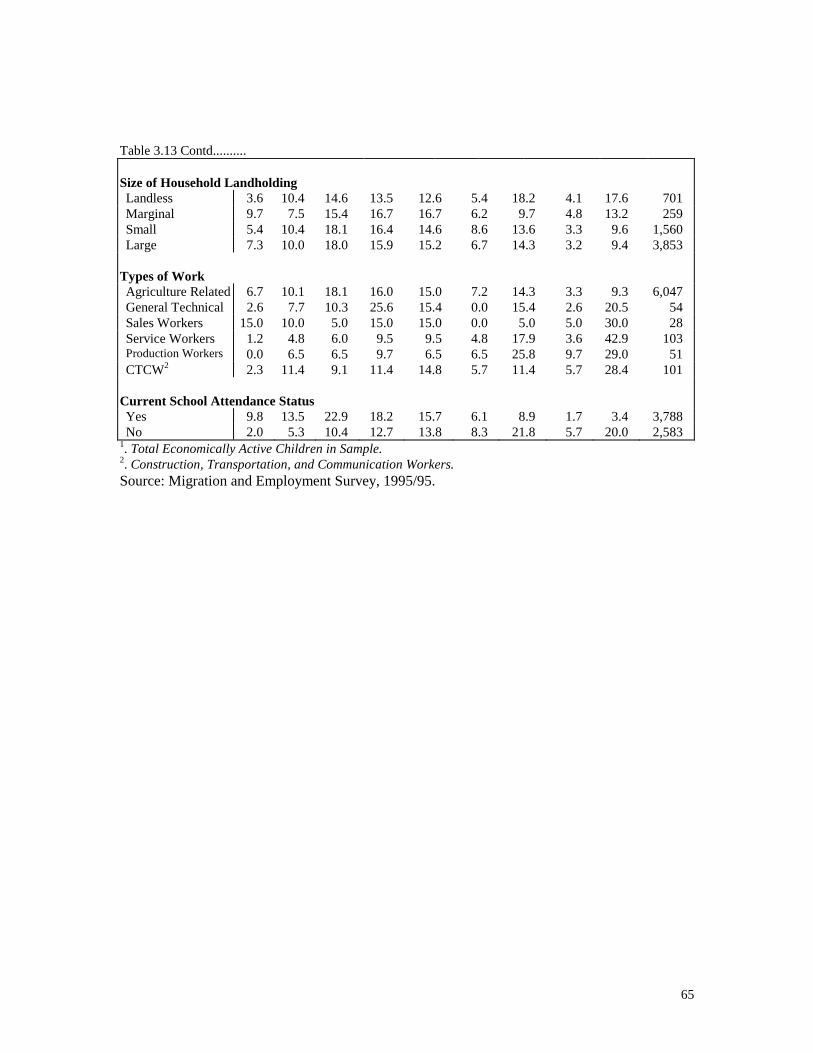
65
Table 3.13 Contd.......... Size of Household Landholding
Landless 3.6 10.4 14.6 13.5 12.6 5.4 18.2 4.1 17.6 701 Marginal 9.7 7.5 15.4 16.7 16.7 6.2 9.7 4.8 13.2 259 Small 5.4 10.4 18.1 16.4 14.6 8.6 13.6 3.3 9.6 1,560 Large 7.3 10.0 18.0 15.9 15.2 6.7 14.3 3.2 9.4 3,853
Types of Work
Agriculture Related 6.7 10.1 18.1 16.0 15.0 7.2 14.3 3.3 9.3 6,047 General Technical 2.6 7.7 10.3 25.6 15.4 0.0 15.4 2.6 20.5 54 Sales Workers 15.0 10.0 5.0 15.0 15.0 0.0 5.0 5.0 30.0 28 Service Workers 1.2 4.8 6.0 9.5 9.5 4.8 17.9 3.6 42.9 103 Production Workers 0.0 6.5 6.5 9.7 6.5 6.5 25.8 9.7 29.0 51 CTCW2 2.3 11.4 9.1 11.4 14.8 5.7 11.4 5.7 28.4 101
Current School Attendance Status
Yes 9.8 13.5 22.9 18.2 15.7 6.1 8.9 1.7 3.4 3,788 No 2.0 5.3 10.4 12.7 13.8 8.3 21.8 5.7 20.0 2,583
1. Total Economically Active Children in Sample. 2. Construction, Transportation, and Communication Workers. Source: Migration and Employment Survey, 1995/95.

66
F. Children in Noneconomic Activities It is estimated that there are 928 T children involved in noneconomic activities. It implies that,
of the 2.6 million working children in Nepal, 928 T children do not have economic participation
(Table 3.14). This comprises of 15 per cent of the children aged 5-14 years of age (Table 3.15).
Of the children who have participation in noneconomic activities, 597 T attend schools. This
comprises of about 10 per cent of the total children aged 5-14 years. Similarly, another 5 per cent
of children involved in noneconomic activities do not attend school.
Among 928 T children involved in noneconomic activities, 667 T (71.9%) are female children
and 263 T are males. The corresponding participation rate for female children is 22.1 per cent
and for male children it is 8.2 per cent. Number of male children involved in noneconomic
activities with school attendance comprised of 6.4 per cent of the total male children. Another
1.8 per cent of the male children participate in noneconomic activities without school attendance.
The corresponding figures for the female children with and without school attendance are 13.0
and 9.0 respectively.
Of the total children involved in noneconomic activities, 417 T are 5-9 years old and the rest 495
T are 10-14 years old. It implies that the corresponding participation rate of the children aged 5-9
and 10-14 years old in noneconomic activities is 12.2 per cent and 17.5 per cent respectively.
Male children of either age groups do not vary much in terms of participation in noneconomic
activities, but female children do vary. As compared to female children aged 5-9 years (16.8%),
remarkably higher proportion of the children of the same sex aged 10-14 years involved in
noneconomic activities (27.4%).
Children's participation in noneconomic activities in general does not vary much according to the
types of residence, ecological zones and development regions. About 15 per cent of the children
participate in noneconomic activities in both rural and urban areas. The same holds true for all
the ecological zones. However, among the development regions, Western region shows slightly
lower (12.5%) participation rate of children in noneconomic activities. The corresponding figure
for other regions is estimated to be not less than 14 per cent.

67
As compared to the male children, participation rate of female children in noneconomic activities
is higher for all types of residence, zones and regions. Considering the ecological zones,
noneconomic participation rate of male children decreases from mountain to Tarai, but, in the
contrary, it increases in the case of female children.
Noneconomic participation of children does not appear to vary much according to the level of
household heads' education. However, it is indicated that participation rate of children of either
sexes in noneconomic activities is slightly lower among households with illiterate heads. It may
be due to higher participation of the children from such households in economic activities.
Considering the household heads' occupation, children belonging to the households with
nonagricultural occupation tend to have slightly higher noneconomic participation.

68
Table 3.14: Estimates of the number of Children Engaged in Noneconomic Activities Most of Year by Types of Activities and Background Characteristics, Nepal, 1995/961
(in '000) Total Working and Schooling Working Only Total Male Female Total Male Female Total Male Female
Nepal 928 263 667 597 204 394 331 59 273 Age
05-09 417 136 281 233 97 136 184 39 145 10-14 495 125 371 347 104 243 148 21 127
Residence
Urban 75 20 55 63 18 45 12 2 9 Rural 853 242 613 534 186 349 319 57 264
Ecological Zones
Mountain 65 24 42 43 19 24 23 5 18 Hill 419 138 285 297 112 187 122 26 98 Tarai 444 100 341 256 71 183 188 29 157
Development Regions
Eastern 242 60 183 160 45 115 82 14 68 Central 293 83 212 186 63 124 107 20 88 Western 161 46 116 120 39 81 41 7 35 Midwestern 140 46 94 71 31 40 68 15 54 Farwestern 94 29 65 60 26 34 34 3 30
Education Level of the HH Head
Illiterate 425 121 305 202 79 122 223 41 182 Primary 292 85 208 212 71 141 80 14 66 Secondary 131 34 96 108 32 77 22 3 20 Secondary &+ 78 22 57 74 21 53 5 1 4
Principal Occupation of the HH Head
Agriculture 551 154 398 331 117 214 220 37 184 Nonagriculture 269 77 193 195 61 134 74 15 59
Family Size
1-2 4 2 2 2 2 1 2 0 2 3-4 90 29 61 52 23 30 38 6 31 5-6 351 105 247 235 81 154 116 24 93 7-8 259 71 189 158 50 109 101 21 81 9&+ 223 55 168 149 48 101 74 8 67
Size of Household Landholding
Landless 176 50 127 104 35 69 72 15 57 Small 45 15 30 26 11 15 20 4 15 Marginal 206 61 146 126 46 79 80 14 66 Large 498 136 363 339 111 229 159 25 134 1 Subtotals of some of the entries may not add to total due to nonresponse in sample and rounding effects
in decomposition processes. Source: Based on the estimates of working children in Table 3.1 and sample proportion by type of activities
in Table 3.15.

69
Table 3.15: Participation Rate of the Children Aged 5-14 Years in Noneconomic Activities Most
of the Year by Types of Activities and Background Characteristics, Nepal, 1995/96 (in per cent)
Background Total Working and Schooling Working Only Characteristics Total Male Female Total Male Female Total Male Female Nepal 14.9 8.2 22.1 9.6 6.4 13.0 5.3 1.8 9.0 Age
05-09 12.2 7.8 16.8 6.8 5.6 8.2 5.4 2.3 8.7 10-14 17.5 8.6 27.4 12.3 7.1 18.0 5.2 1.4 9.4
Residence
Urban 14.4 7.4 22.2 12.2 6.6 18.4 2.2 0.8 3.8 Rural 15.0 8.3 22.1 9.4 6.3 12.6 5.6 1.9 9.5
Ecological Zones
Mountain 14.2 10.2 18.4 9.3 8.2 10.4 4.9 2.0 8.0 Hill 14.8 9.6 20.5 10.5 7.8 13.4 4.3 1.8 7.0 Tarai 15.1 6.5 24.2 8.7 4.6 13.1 6.4 1.9 11.2
Development Regions
Eastern 16.1 7.7 25.0 10.6 5.9 15.7 5.5 1.8 9.3 Central 14.5 7.8 22.0 9.2 5.9 12.9 5.3 1.9 9.1 Western 12.5 7.0 18.3 9.3 6.0 12.8 3.2 1.1 5.5 Midwestern 16.9 10.9 23.1 8.7 7.5 9.9 8.3 3.5 13.2 Farwestern 16.2 9.8 22.9 10.4 8.6 12.1 5.8 1.1 10.7
Education Level of the HH Head
Illiterate 14.0 7.8 20.6 6.6 5.1 8.3 7.3 2.7 12.3 Primary 15.6 8.9 22.7 11.3 7.4 15.4 4.3 1.5 7.3 Secondary 16.4 8.3 25.4 13.6 7.7 20.1 2.8 0.6 5.2 Secondary &+ 15.3 8.0 23.6 14.3 7.7 21.9 1.0 0.3 1.7
Principal Occupation of the HH Head
Agriculture 14.4 7.9 21.3 8.7 6.0 11.5 5.8 1.9 9.9 Nonagriculture 16.5 8.9 25.0 12.0 7.2 17.4 4.6 1.8 7.7
Family Size
1-2 22.2 16.3 31.0 12.5 14.0 10.3 9.7 2.3 20.7 3-4 15.0 8.3 24.4 8.7 6.5 11.8 6.3 1.8 12.6 5-6 16.1 9.0 24.3 10.8 7.0 15.2 5.3 2.0 9.2 7-8 14.7 8.2 21.0 9.0 5.8 12.0 5.7 2.4 9.0 9&+ 13.4 6.8 19.8 9.0 5.9 11.9 4.4 0.9 7.8
Size of Household Landholding
Landless 16.5 8.9 25.0 9.8 6.3 13.7 6.8 2.6 11.3 Small 17.3 10.8 25.1 9.8 7.7 12.3 7.5 3.1 12.7 Marginal 14.5 8.4 21.0 8.9 6.4 11.5 5.7 2.0 9.6 Large 14.4 7.7 21.4 9.8 6.3 13.5 4.6 1.4 7.9
Source: Migration and Employment Survey, 1995/96.

70

71
G. Idle (Doing Nothing) Children Fifteen Out of 100 Children are Idle (doing nothing) in Nepal
It is estimated that 14.9 (928 T) per cent of the total children in Nepal are idle (doing nothing)
(Table 3.16). Proportion of idle children by sex does not vary much. However, as compared to
male children (13.9%), a higher proportion of female children (16.0%) are reported to have been
idle. An overwhelmingly majority of the idle children are in rural areas (888 T). About 16 out of
100 children are idle in rural areas as compared to about 8 in urban areas.
One-Fourth of the Younger Children are Idle
In numbers, out of 928 T idle children, 825 T are 5-9 years old and the rest, 137 T, are 10-14
years. In relative terms, one-fourth of younger children aged 5-9 years are idle, whereas only 5
per cent of the older children aged 10-14 years are reported as idle. As compared to male
children (23.1%), a higher proportion of female children (27.1%) are idle in 5-9 years age group.
Remarkably higher proportion of idle children among younger ages is mainly due to their low
school attendance as well as work participation as compared to that of older ones.
Hill Zone Shows Slightly Lower Proportion of Idle Children
The largest (525 T) number of idle children is estimated for the Tarai zone. However, hill zone
shows the largest proportion of its idle children. The least proportion of the idle children is found
in the hill. Mountain and Tarai zones have about an equal proportion of idle children. It might be
due to higher proportion of the school attending children in the hill zone with relatively higher
work participation rate.
Western region shows a relatively lower proportion of idle children. Contrarily, the highest
proportion of idle children is found in Midwestern and Farwestern regions for the children of
either sexes.

72
Proportion of Idle Children Decreases with Increasing Level of Education of
Household Heads
Of the total idle children, 639 T belong to households with illiterate heads implying one-fifth of
the idle children in such families. It is observed that children of either sexes associated with
educated households are less likely to be idle. As compared to one-fifth of the idle children in
households with illiterate heads, households with primary level of heads education demonstrate
only 11 per cent of idle children. The corresponding figures for the children associated with
secondary and above secondary level of heads' education is found to be 8.2 per cent and 3.6 per
cent respectively. Increasing school attendance with increasing level of household heads'
education might be responsible for reducing the proportion of idle children.
Proportion of the idle children do not vary much according to the principal occupation of the
household heads. However, households with nonagricultural occupation of heads demonstrate
slightly lower proportion of idle children (12.9%).
Children from Smaller Family Size Less Likely to be Idle
It is revealed that about 13.2 per cent of the children from family size of 3-4 persons are idle. The
proportion of idle children increases to 15.7 per cent in the families with size 7-8 persons and to
15.4 per cent with the family size of 9 persons and above. Increase in the idleness of the children
with increasing family size might be because, in larger families, adult family members are
available to replace children's work but in the smaller families it is not so. Contrarily, idleness of
the children is likely to reduce with increasing size of household landholidngs.

73
Table 3.16: Estimates of the Idle Children (Doing Nothing) Aged 5-14 Years Most of the Year
by Background Characteristics, Nepal, 1995/96 (estimates are in '000)
Background Estimates1 Percentage Characteristics Total Male Female Total Male Female Nepal 928 445 484 14.9 13.9 16.0 Age
05-09 854 401 453 25.1 23.1 27.1 10-14 137 72 64 4.9 4.9 4.8
Residence
Urban 40 20 21 7.7 7.2 8.3 Rural 888 425 463 15.6 14.5 16.7
Ecological Zones
Mountain 88 42 46 18.9 17.7 20.3 Hill 320 146 175 11.3 10.2 12.6 Tarai 525 261 264 17.9 17.0 18.8
Development Regions
Eastern 205 103 101 13.6 13.4 13.8 Central 316 151 165 15.6 14.3 17.1 Western 158 69 89 12.2 10.5 14.1 Midwestern 151 77 75 18.3 18.3 18.3 Farwestern 101 46 54 17.4 15.6 19.2
Education Level of HH the Head
Illiterate 639 308 332 21.0 19.8 22.4 Primary 205 96 109 11.0 10.1 12.0 Secondary 65 30 35 8.2 7.3 9.1 Secondary &+ 18 10 8 3.6 3.7 3.4
Principal Occupation of the HH Head
Agriculture 604 289 315 15.8 14.8 16.9 Nonagriculture 211 105 106 12.9 12.2 13.7
Family Size
1-2 1 1 0 4.2 4.7 3.4 3-4 81 44 36 13.4 12.5 14.6 5-6 315 155 161 14.5 13.3 15.9 7-8 276 128 148 15.7 14.9 16.4 9&+ 256 117 139 15.4 14.4 16.3
Size of Household Landholding
Landless 196 103 93 18.4 18.4 18.4 Small 47 24 23 18.2 17.2 19.3 Marginal 238 114 124 16.8 15.8 17.9 Large 444 202 242 12.8 11.4 14.3
1 Subtotals of some of the entries may not add to total because of nonresponse in sample and rounding effects in decomposition processes.
Source: Estimates are based on the estimates of the total children in Table 3.1 and estimated proportion from the sample given in this Table.

74

75
CHAPTER IV
SUMMARY AND CONCLUSIONS
Practice of child labour is a widespread phenomenon in Nepal. Studies have shown that, among
other things, poverty is the main reason for the practice of child labour in Nepal. There was not
much concern over the issue of child labour in Nepal before 1990. Most of the studies on child
labour in Nepal have been conducted, as localized studies, to focus on the study of child labour
situation in urban areas. Up to this point, virtually no study is devoted to estimate the extent of
child labour for the country with nationally representative samples. Since no census collected
information regarding work activities of the children aged 5-9 years, information from the
censuses are incomplete for the study on child labour in Nepal. Therefore, there is a big
information gap pertaining to this.
National Employment Survey, 1995/96 is the largest sample survey ever conducted in Nepal that
covers all the major geographic subdivisions, development regions and rural/urban residence to
examine employment situation in the country. The sample design of the survey involved
stratified multistage probability cluster sampling from rural and urban areas. Probability
proportionate to size (pps) technique was applied to select samples from both rural and urban
areas.
The survey on child labour was conducted as a piggy back of the Employment Survey, that
covered the population aged 5-14 years to examine the current child labour situation in the
country for the first time with nationally representative samples. Questions relating to child
labour were integrated with Employment Survey to acquire information on activities of the
children aged 5-14 years during most of the year. However, this survey did not acquire
information on other various aspects of child labour particularly working environment of
children, and health and safety aspects.
This report focuses on the study of the activities of the children in the country with reference to
various household and individual characteristics in general. In particular, primary focus of this
study is on providing estimates on child labour for the country by rural and urban areas,
ecological zones and development regions. As, in many instances, child labour is defined in
76
economic terms, obviously, this study is also based on the economic explanation of child labour.
Estimates of child labour is primarily based on their participation in economic activities
irrespective of schooling status in absolute as well as relative terms. However, the report
provides further analysis of economically active children by current school attendance status,
types of work and number of working hours to be able to incorporate other criteria too in
assessing the extent of child labour in the country.
Based on projected child population as of early 1996 and estimated proportion from the sample,
it is estimated that there are 2.6 M working children irrespective of current school attendance
status, type of activities and duration of work. The number comprises of 41.7 per cent of the total
child population in the country. Thus, the work participation rate of the Nepali children is 41.7
per cent. The estimates reveal that number of working female children (1,439 T) outnumbers the
number of working male children (1,156 T) with a sex ratio of 80.3. In relative terms, work
participation of the female and male children is estimated to be 47.6 and 36.1 per cent
respectively.
It is evident that, among the 2.6 M working children, approximately 1.7 million children are
economically active with economic participation rate of 26.7 per cent. Of the 1.7 million
economically active children, 894 T are males and 770 T females. The corresponding economic
participation rate is estimated to be 27.9 per cent for male children and 25.5 per cent for female
children. This clearly indicates that economic participation is slightly lower among female
children though they demonstrate higher overall work participation rate. It implies that higher
work participation of the female children is mainly due to their higher participation in
noneconomic activities.
Child Labour Under Different Criterion
Criterion I: Child Labour as of Economic Participation Rate
If the term child labour is defined merely in terms of children's economic participation rate
irrespective of current school attendance status, type of activities, duration of work, child labour
in Nepal is 26.7 per cent in totality. The corresponding figure for male and female children is
27.9 per cent and 25.5 per cent respectively. As there is a marginal difference in the economic

77
participation rate by sex of the children, this leads to conclude that incidence of child labour does
not vary much among male and female children in Nepal.
Taking the age of the children, incidence of child labour among older children aged 10-14 years
(40.8% or 1,150 T) is more than 3 times higher as compared to the younger children aged 5-9
years (12.5% or 426 T). Child labour of male (12.4%) and female (12.6%) children of younger
ages does not appear to vary much. However, it varies among older children (42.9% for male and
38.4% for female children). Incidence of child labour in rural areas (28.4% or 1,620 T) is more
than three times higher than in urban areas (8.5 % or 44 T). Incidence of child labour is higher
among male children in both the areas.
Incidence of child labour is the highest in the mountain (38.0% or 176 T), followed by 30.5 (862
T) per cent in the hill, and 21.2 (622 T) in the Tarai. As compared to male children (35.6%),
child labour in mountain is higher among female children (40.6%). A reverse pattern is observed
in the hill and Tarai zone. Incidence of child labour is highest in Mid and Farwestern
development regions. Under this definition, child labour in these regions is estimated to be about
33 per cent as compared to 24.2 per cent in the Central region, and 29.8 per cent in the Eastern.
The lowest incidence of child labour is found to be in the Western region (20.7%). Except in the
Farwestern region, incidence of child labour is found to be higher among male children.
Incidence of child labour is found to be lower with increasing level of household heads education
and shift of their occupation from agriculture to nonagriculture, and increasing family size.
However, it increases with increasing size of household landholdings.
Criterion II: Child Labour as of Economic Participation of School Not Attending
Children
If we restrict the definition of child labour to refer to the economic participation of the children
aged 5-14 years who do not attend school irrespective of types and duration of work, child labour
is Nepal is 10.8 per cent or 673 T. The corresponding figure for male and female children is 7.6
per cent or 242 T and 14.3 per cent or 432 T respectively. Thus, under this definition of child
labour, incidence of child labour among female children is nearly two times more than that of
male children.
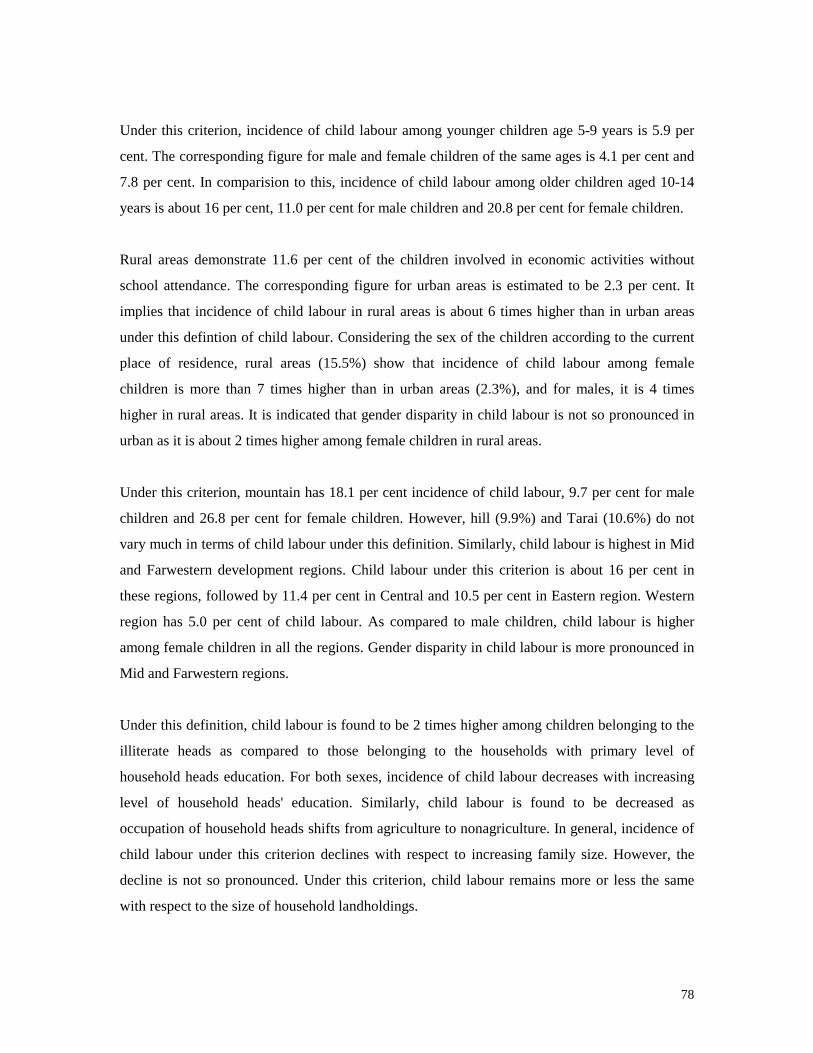
78
Under this criterion, incidence of child labour among younger children age 5-9 years is 5.9 per
cent. The corresponding figure for male and female children of the same ages is 4.1 per cent and
7.8 per cent. In comparision to this, incidence of child labour among older children aged 10-14
years is about 16 per cent, 11.0 per cent for male children and 20.8 per cent for female children.
Rural areas demonstrate 11.6 per cent of the children involved in economic activities without
school attendance. The corresponding figure for urban areas is estimated to be 2.3 per cent. It
implies that incidence of child labour in rural areas is about 6 times higher than in urban areas
under this defintion of child labour. Considering the sex of the children according to the current
place of residence, rural areas (15.5%) show that incidence of child labour among female
children is more than 7 times higher than in urban areas (2.3%), and for males, it is 4 times
higher in rural areas. It is indicated that gender disparity in child labour is not so pronounced in
urban as it is about 2 times higher among female children in rural areas.
Under this criterion, mountain has 18.1 per cent incidence of child labour, 9.7 per cent for male
children and 26.8 per cent for female children. However, hill (9.9%) and Tarai (10.6%) do not
vary much in terms of child labour under this definition. Similarly, child labour is highest in Mid
and Farwestern development regions. Child labour under this criterion is about 16 per cent in
these regions, followed by 11.4 per cent in Central and 10.5 per cent in Eastern region. Western
region has 5.0 per cent of child labour. As compared to male children, child labour is higher
among female children in all the regions. Gender disparity in child labour is more pronounced in
Mid and Farwestern regions.
Under this definition, child labour is found to be 2 times higher among children belonging to the
illiterate heads as compared to those belonging to the households with primary level of
household heads education. For both sexes, incidence of child labour decreases with increasing
level of household heads' education. Similarly, child labour is found to be decreased as
occupation of household heads shifts from agriculture to nonagriculture. In general, incidence of
child labour under this criterion declines with respect to increasing family size. However, the
decline is not so pronounced. Under this criterion, child labour remains more or less the same
with respect to the size of household landholdings.

79
Criterion III: Child Labour as of Participation Rate in Paid Activities
It is revealed that 4.5 per cent (278 T), of the children in Nepal are involved in paid activities, 4.3
per cent male children and 4.6 per cent female children. If child labour is defined as of
participation rate of children in paid activities irrespective of school attendance, and types and
duration of works, child labour in Nepal is 4.5 per cent, 4.3 per cent for male children and 4.6 per
cent for female children. Child labour under this criterion is 1.6 per cent for the children of
either sexes aged 5-9 years. It increases to about 7 per cent among older children aged 10-14
years. The age group 10-14 years demonstrates slightly higher incidence of child labour among
female children. Considering the current place of residence, rural areas show about 2 times
higher incidence of children labour with higher incidence for the female children. Urban areas
show the lower incidence of child labour for female children. Thus, a higher incidence of child
labour among female children under this criterion is mainly due to its higher incidence among
rural children. It might be due to firstly, a higher proportion of female children in rural areas do
not attend schools, and secondly, as compared to male children, a larger number of female
children in rural areas might have been working as agricultural labourers.
Among the ecological zones, mountain zone shows the highest incidence of child labour under
this creterion. According to this criterion, incidence of child labour in mountain is 6.3 per cent,
4.4 per cent in the hill and 4.3 per cent in the Tarai. Except Tarai zone, mountain and Tarai
demonstrate a higher incidence of child labour among female children. Considering the
development regions, incidence of child labour is highest in the Eastern region (6.3%) under this
criterion and the lowest in the Western region (2.5%).
Criterion IV: Child Labour as of Participation Rate in Unpaid Activities
If child labour is defined in terms of children involvement in unpaid economic activities
irrespective of school attendance and types and duration of works, incidence of child labour in
Nepal is 22.2 per cent, 23.5 per cent for male children, and 20.8 per cent for female children.
Again, the incidence of child labour among older children aged 10-14 years (33.4%) is higher
compared to that of younger children aged 5-9 years (10.9%). Child labour under this criterion is
about 11 per cent for the children of either sexes aged 5-9 years. For the children aged 10-14

80
years, it is 35.9 per cent for male children and 30.7 per cent for female children. Thus, under this
definition, child labour does not vary much with respect to the age of the children.
Like under the above criteria, this criterion also demonstrates a higher incidence of child labour
in rural areas among the children of either sexes. In general, 23.7 per cent of the children in this
area involved in upaid economic activities as compared to 6.1 per cent in urban areas. It implies
that incidence of child labour under this criterion is about 4 times higher in rural areas. Taking
the ecological zones, mountain shows the highest child labour of 31.8 per cent. The
corresponding figure for the hill and Tarai is 26.1 per cent and 16.8 per cent respectively. Except
in the mountain, incidence of child labour is higher among female children in hill and Tarai
under this criterion. Like the other criterion, this criterion shows the lowest incidence of child
labour for western development region and the highest for Mid and Farwestern regions. Under
this criterion, child labour is more or less the same in the Central and Western regions for male
children. The highest incidence of child labour for male children is found in the Midwestern
region (28.6%), whereas for female children it is in Farwestern region (30.6%).
Incidence of child labour under this criterion substantially declines with increasing level of
household heads' education. Similarly, shift of the occupation of the household heads from
agriculture to nonagriculture is likely to reduce the incidence of child labour by about 2 times.
Similarly, increasing family size tends to lower down the incidence of child labour under this
criterion. In the contrary, incid`ence of child labour increases with increasing size of household
landholdings.
Criterion V: Child Labour as of Economic Participation Rate With 2 Hours or More
Working Hours per day
It is evident that, of the 1,664 T economically active children, 1,389 worked 14 hrs. or more (2
hrs. or more/day) during the last week of the survey. This comprises of the 22.3 per cent of the
total children. It implies that if child labour is defined as of economic participation rate of
children with 2 hours or more working hours per day irrespective of school attendance and types
of work, incidence of child labour is 22.3 per cent in Nepal. Number of males and females with
the same number of working hours is 790 T and 676 T respectively. This comprises of 22.2 per

81
cent of the total children of respective sexes. Thus, incidence of child labour under this criteria
remains the same for the children of both sexes.
Obviously, child labour is higher among older children aged 10-14 years under this criterion too.
Number of economically active children aged 5-9 and 10-14 years is estimated to 426 T and
1,150 T out of which 1,033 T and 337 T worked respectively for 2 or more hrs/day. This
comprises of 34.5 per cent and 9.9 per cent of the children of respective age groups. Thus, under
this criterion, incidence of child labour is more than 3 times among older children aged 10-14
years as compared to those aged 5-9 years.
Taking the current place of residence, of the 44 T economically active children, 37 T worked 2 or
more hours/day. The comparative figure for the rural areas is estimated to be 1,330 T. This
comprises of 7.1 per cent and 23.3 per cent of the total children in the respective areas. Thus, this
criterion demonstrates that incidence of child labour is 3 times higher in rural areas than in urban
areas. In the similar manner, mountain zone shows the highest incidencc of child labour under
this definition (29.1%) followed by hill (25.4%), and Tarai (18.2%). Among the development
regions, Western region shows the lowest incidence of child labour (17.1%), and the highest,
31.0 per cent in the Midwestern region.
Like the other criteria for child labour, this criterion also demonstrates the incidence of child
labour to be decreased with increasing level of household heads' education. Under this criterion,
incidence of child labour tends to decrease from 26.2 per cent with among households with
illiterate heads to 10.5 per cent with above secondary level of heads education. Likewise, it
deminishes from 25.4 per cent to 16.7 per cent with the shift of head's occupation from
agriculture to nonagriculture.
Agriculture is the Largest Sector Absorbing Child Labour in Nepal
Overwhelming majority of the economically ective children do agriculture related works. Of the
1,664 T economically active children, 1,576 T (94.7%) are estimated to have been involved in
agricultural related works and the rest 87 T (5.3%) in nonagricultural works. Estimates reveal
that 27 T (12.6%) economically active children worked as service workers, and another 26 T
(1.6%) as communication, transportation and communication workers. Number of economically

82
active children who worked as general technical workers constituted of 14 T (0.8%), and another
13 T (0.8%) of production workers. The least 7 T (0.4%) is constituted of sales workers.
Older children participate more in nonagricultural works, whereas younger children in
agricultural works. Similarly, Urban children more likely to involve in nonagricultural works as
compared to urban children. Economically active children of different zones and regions do not
vary much in terms of types of works they do.

83
References Central Bureau of Statistics (CBS), 1995, Population Monograph of Nepal (Kathmandu: CBS). Chhetry, D. B., 1996, Child Issues and Poverty in Nepal (Kathmandu: MIMAP Project,
APROSC). Child Workers in Nepal (CWIN), n.d, Urban Child Labour in Nepal (Kathmandu: CWIN). International Labour Organization (ILO), 1994, Action for the Elimination of Child Labour
(Geneva: ILO). Singh, S. L., 1990, Work Burden of A Girl Child in Nepal: An Analysis of Poverty Levels
(Kathmandu: Ministry of Labour). Thakurathi, M. et al., 1996, Intervention to Abolish Child Labour Programmes for
Kavrepalanchowk and Nuwakot (Kathmandu: INSEC). UNICEF, 1988, The Child in South Asia, Issues in Development as if Children Mattered (New
Delhi: UNICEF). UNICEF, 1991, UNICEF, Annual Report (New York: UNICEF). UNICEF, 1994, The State of the World's Children (New York: Oxford University Press). UNICEF, 1997, The State of the World's Children (New York: Oxford University Press). United Nations, 1990, World Declaration on the Survival, Protection and Development of
Children and Plan of Action for Implementing the World Declaration on the Survival, Protection and Development of Children in the 1990s (New York: United Nations).

84
Annex I Conceptual Scheme for Activity Analysis of the Children Based on the Sample Cases
Total Children (5-14 years) (23,880)
Schooling Only Working Idle (8,774:36.7%) (irrespective of Schol Attendance Status) (Doing Nothing) (9,931:41.6%) (3,560:15.0%) Working & Working Only Schooling (No Schooling) (6078:25.5%) (3853:16.1%) Economic Noneconomic Economic Noneconomic (3,788:15.9%) (2,290:9.6%) (2583:10.8%) (1270:5.3%) Paid Unpaid Paid Unpaid (474:2.0%) (3,314:13.9%) (593:2.5%) (1990:8.3%) Note: Subtotals of some of the entries may not add to total because of nonresponse. Source: Migration and Employment Survey, 1995/96.

79
Annex II Distribution of Total Sample Children by Background Characteristics, Nepal, 1995/961
Total Both Sexes Male Female
Nepal 23,880 12,345 11,535 Age
05-09 11,867 6,068 5,799 10-14 12,014 6,278 5,736
Residence
Rural 21,885 11,295 10,590 Urban 5,926 3,120 2,806
Ecological Zones
Mountain 1,694 866 828 Hill 11,132 5,786 5,346 Tarai 11,060 5,697 5,363
Development Regions
Eastern 5,614 2,889 2,725 Central 7,586 3,994 3,592 Western 5,329 2,755 2,574 Midwestern 3,189 1,610 1,579 Farwestern 2,141 1,087 1,054
Eduation Level of the HH Head
Illiterate 11,654 5,996 5,658 Primary 7,161 3,672 3,489 Secondary 3,048 1,598 1,450 Abover Secondary 1,971 1,053 918
Principal Occupation of the HH Head
Agriculture 14,643 7,522 7,121 Nonagriculture 6,240 3,301 2,939
Family Size
1-2 72 43 29 3-4 2,312 1,357 955 5-6 8,363 4,490 3,873 7-8 6,758 3,320 3,438 9&+ 6,375 3,135 3,240
Size of Household Landholding
Landless 4,087 2,155 1,932 Small 1,000 545 455 Marginal 5,431 2,785 2,646 Large 13,307 6,840 6,467
Current Schooling Status of the Children Yes 15,574 9,057 6,517 No 7,646 2,960 4,686
1 Subtotal of some of the entries do not add to total because of the exclusion of nonresponse category. Source: Migration and Employment Survey, 1995/96.

80
ANNEX III
QUESTIONNAIRE
TRIBHUVAN UNIVERSITY CENTRAL DEPARTMENT OF POPULATION
(A SURVEY ON MIGRATION AND EMPLOYMENT CONDUCTED FOR HIS MAJESTY’S GOVERNMENT, NATIONAL PLANNING COMMISSION)
1995/96 Time at the start of Interview
Introductory Particulars 01. District _________________________________
02. Village / Town (1: Village, 2:Town) .......
03. Name of village ____________________ Name of town ___________________
04. Ward number ................................ Number of Segments .................
Segment No ................................... Cluster No .................................
05. Name of locality [Tole] ___________________________________________
06. Selected household number ...........................................................................
07. To be interviewed (Migration / Employment : 1, Birth, Death & Contraception : 2) ........
08. Name of the household head ...................................................................................
09. Name of the respondent ..........................................................................................
10. Caste / Ethnicity of the household head .................................................................
11. Religion of the household head (Hindu : 1, Buddhist : 2, Islam : 3, Christian.: 4) ........
Other specify_________________
No. of times, interview attempted Particulars 1 2 3
Date Interviewer’s name Results [see code below]
Date for next visit
*Result Code
1 Completed
2 Respondent not at home
3 Nobody at home
4 Partly completed
5 Refused to respond
6 Domain not found
7 Other (specify)_________
Code
1
2
3
4
5
6
7
Total family size ................... Eligible for migration study ........ Male ........ Female ........ Eligible for employment study Male ........ Female ........ Eligible women (ever married women aged 15-49) for BDC study. Female ..........
Questionnaire edited by :
Supervisor Office Data entry personnel Name Signature Date

81
M.E.B.: HOUSEHOLD SCHEDULE Name Only for 5 years and above Ask this to (For
Interviewer) Indi-vidu-al
(Please give all the names of persons who *usually live in this household).
Relationship to household
head
Sex Age Pres- ence
Education Mari-tal
Status
Occupation Migration currently married women aged 15-49 or her spouse
Circle eligible interviewee
Num-ber
*An usual/permanent resident is one who stays home for at least 6 months in a year. If a domestic servant also lives there he / she should be counted as the usual resident of the household provided he / she has been living in this household for at least six months in a year. (Let’s start with the head of the house-hold. What is this person’s name ?)
Relationship to the head of the house-hold (Use appropriate code given at the end of household schedule) (see code
Is this person male or female ?
How old is this person? (Age should be recorded in completed years. If less than one year old record them as 00)
Is this person present now ?
Can this person read and write in any language?
What is the highest grade completed by this person ? (see code below)
What is the marital status of this person? (see code below)
What is the principle occupation (i.e. The activity in which he/ she spends most of the time in a year) of this person? (see code
For how long have you been living in this current VDC / Municipality ? 1. Since birth (S B) 2. Less than life long (L T L L)
**Family Planning Are you or your spouse currently using any method of family planning ?
Ever marr-ied wo-men aged 15 to 49. years.
Employ-ment (Only for 5 years and above)
below) Male
Femal Year Month Yes No Yes No below) S B L T L L
Yes No BDC Emp
01 02 ** 03 04 05 06 07 08 09 10 11 12 13 14 01 0 1 1 2 1 2 1 2 1 2 1 2 01 01 02 1 2 1 2 1 2 1 2 1 2 02 02 03 1 2 1 2 1 2 1 2 1 2 03 03 04 1 2 1 2 1 2 1 2 1 2 04 04 05 1 2 1 2 1 2 1 2 1 2 05 05 06 1 2 1 2 1 2 1 2 1 2 06 06 07 1 2 1 2 1 2 1 2 1 2 07 07 08 1 2 1 2 1 2 1 2 1 2 08 08 09 1 2 1 2 1 2 1 2 1 2 09 09 10 1 2 1 2 1 2 1 2 1 2 10 10 11 1 2 1 2 1 2 1 2 1 2 11 11 12 1 2 1 2 1 2 1 2 1 2 12 12 13 1 2 1 2 1 2 1 2 1 2 13 13 14 1 2 1 2 1 2 1 2 1 2 14 14 15 1 2 1 2 1 2 1 2 1 2 15 15 16 1 2 1 2 1 2 1 2 1 2 16 16 17 1 2 1 2 1 2 1 2 1 2 17 17 18 1 2 1 2 1 2 1 2 1 2 18 18 19 1 2 1 2 1 2 1 2 1 2 19 19 If additional pages are used to record the information of this family mark as here [ ] ** To identify the husband of currently married women, put the individual serial no. of her husband in the box attached to her name. Just to make sure I have a complete listing of all the persons (Interviewer: Read all the names that you have listed one by one and then ask the following questions):
1. Are there any other person(s), such as small children infant or old person that we have not listed ? I. Yes (If yes, enter their names in the table and mention the line numbers ... ... ... ... ... ... ... ); II. No. 2. Are there any other person(s), who may not be member(s) of your family such as friends, domestic servant or lodgers or relatives who usually live here but we have not listed ? I. Yes (If yes, enter their names in the table and mention the line numbers ... ... ... ... ... ... ... ); II. No. 3. Are there any members of the family who usually live here and are away at the present for a vacation, travelling somewhere, business trip or for any work (for less than 6 months) but we have not listed ? I. Yes (If yes, enter their names in the table and mention the line numbers ... ... ... ... ... ... ... ); II. No. 4. In addition, are there any persons not mentioned in this table who slept last night in this household, to work, to look for work and to study but are not the members of the family? If yes, enter the name of the person(s) in the table and mention the line number ... ... ...
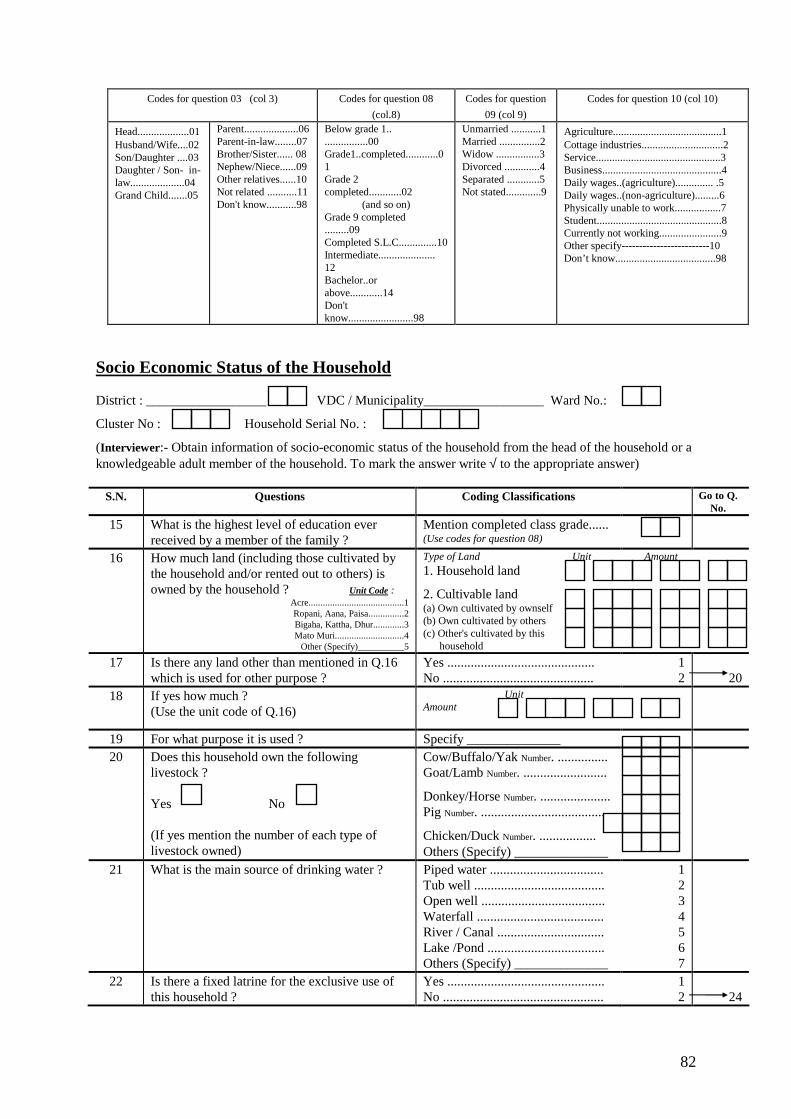
82
Codes for question 03 (col 3) Codes for question 08
(col.8) Codes for question
09 (col 9) Codes for question 10 (col 10)
Head...................01 Husband/Wife....02 Son/Daughter ....03 Daughter / Son- in-law....................04 Grand Child.......05
Parent....................06 Parent-in-law........07 Brother/Sister...... 08 Nephew/Niece......09 Other relatives......10 Not related ...........11 Don't know...........98
Below grade 1.. ................00 Grade1..completed............01 Grade 2 completed............02
(and so on) Grade 9 completed .........09 Completed S.L.C..............10 Intermediate..................... 12 Bachelor..or above............14 Don't know........................98
Unmarried ...........1 Married ...............2 Widow ................3 Divorced .............4 Separated ............5 Not stated.............9
Agriculture........................................1 Cottage industries..............................2 Service..............................................3 Business............................................4 Daily wages..(agriculture).............. .5 Daily wages..(non-agriculture).........6 Physically unable to work.................7 Student..............................................8 Currently not working.......................9 Other specify-------------------------10 Don’t know.....................................98
Socio Economic Status of the Household District : __________________ VDC / Municipality__________________ Ward No.:
Cluster No : Household Serial No. :
(Interviewer:- Obtain information of socio-economic status of the household from the head of the household or a knowledgeable adult member of the household. To mark the answer write √ to the appropriate answer)
S.N. Questions Coding Classifications Go to Q. No.
15 What is the highest level of education ever received by a member of the family ?
Mention completed class grade...... (Use codes for question 08)
16 How much land (including those cultivated by the household and/or rented out to others) is owned by the household ? Unit Code :
Acre........................................1 Ropani, Aana, Paisa...............2 Bigaha, Kattha, Dhur.............3 Mato Muri.............................4
Other (Specify)__________5
Type of Land Unit 1. Household land
2. Cultivable land (a) Own cultivated by ownself (b) Own cultivated by others (c) Other's cultivated by this household
Amount
17 Is there any land other than mentioned in Q.16 which is used for other purpose ?
Yes ............................................ No .............................................
1 2
20
18 If yes how much ? (Use the unit code of Q.16)
Unit Amount
19 For what purpose it is used ? Specify ______________ 20 Does this household own the following
livestock ? Yes No (If yes mention the number of each type of livestock owned)
Cow/Buffalo/Yak Number. ............... Goat/Lamb Number. .........................
Donkey/Horse Number. ..................... Pig Number. .....................................
Chicken/Duck Number. ................. Others (Specify) ______________
21 What is the main source of drinking water ? Piped water .................................. Tub well ....................................... Open well ..................................... Waterfall ...................................... River / Canal ................................ Lake /Pond ................................... Others (Specify) ______________
1 2 3 4 5 6 7
22 Is there a fixed latrine for the exclusive use of this household ?
Yes ............................................... No ................................................
1 2
24

83
23 If yes , mention the main type of latrine used ? Flush System ................................ Water flow.................................... Closed pit...................................... Open pit System ........................... Others (Specify) ______________
1 2 3 4 5
24
Have you owned or installed the following facilities in this dwelling ?
Electricity ..................................... Bio-gas plant ................................ Telephone ..................................... Radio ............................................ Television .....................................
Yes No 1 2 1 2 1 2 1 2 1 2
25 Do you own or rent this dwelling ? Own ............................................. Rent ............................................. Others (Specify) _____________
1 2 3
26 How many rooms are there in this dwelling ? (Exclude kitchen and bath room)
Total no. of rooms . ......................
27 What is the main type of materials used in the walls of this building ?
Cement, Stone, Bricks .................. Tin ............................................... Wood (Including plywood) ........... Bamboo ........................................ Straw ............................................ Mud / Slate / Brick (unbaked) ...... Mud / Slate / Brick (baked) ......... Others (Specify) ______________
1 2 3 4 5 6 7 8
28 What is the main type of materials used in the roof of this building ?
Concrete, Stone, Bricks (slab) ....... Tin ............................................... Wood (Including plywood) ........... Bamboo ........................................ Straw ............................................ Mud / Slate / Stone ....................... Tile .............................................. Others (Specify) ______________
1 2 3 4 5 6 7 8


85
Employment Questionnaire Questions to be asked to all members of Household aged 5 years and above (Based on Household Schedule) District .............................[ ][ ] Village Development Committee ....................... Ward Number . [ ][ ] Village/Tole (Name).................... Cluster Number ......[ ][ ][ ] Household Number ....... [ ][ ] Number of persons aged 5 years and above in the household:- Male:- [ ][ ], Female:- [ ][ ], Total:- [ ][ ] Ser- I.D. No. Name Age Sex Marital Highest Questions to be asked only for the aged 5 to 14 years ial No.
of family members 5
years & above
(Based on Household Schedule)
(Based on Household Schedule)
(Based on Household Schedule)
(Based on Household Schedule)
Status (Based on Household Schedule)
Grade Comp-leted (Based on Household Schedule)
Do you go to school ? 1. Yes →507 2. No
What was the main reasons for not atten-ding school ? (See Code)
Do you help in household activities ? 1. Yes, 2. No →509
If yes, what type of activi-ties? (See code)
Are you involved in activities outside the household ? 1. Yes, 2. No → 511 (If aged 5-9 years and response is 2 in Qs. 507 &509 go to next person)
If yes, what type of activ-ities ? (Write exactly as reported and code later)
Yes No Yes No
Yes No
501 502 503 504 505 506 507 508 509 510 01 1 2 1 2 1 2 02 1 2 1 2 1 2 03 1 2 1 2 1 2 04 1 2 1 2 1 2 05 1 2 1 2 1 2 06 1 2 1 2 1 2 07 1 2 1 2 1 2 08 1 2 1 2 1 2 09 1 2 1 2 1 2 10 1 2 1 2 1 2 11 1 2 1 2 1 2 12 1 2 1 2 1 2 13 1 2 1 2 1 2 14 1 2 1 2 1 2 15 1 2 1 2 1 2 16 1 2 1 2 1 2 506. 1. Don't want to go, 2. School is far away, 3. Can not afford school expenses, 4. To help in household work/farm activities, 5. Not necessary to study, 6. Not necessary to educate daughters, 7. Others (Specify)_________________ 508. 1. Care after sibling, 2. Help in kitchen work, 3. Fodder and fuel wood collection, 4. Farm activities, 5. Cattle grazing, 6. All of the above works, 7. Others (Specify)_________________

86
Questions to be asked to all members of Household aged 5 years and above (Based on Household Schedule) I.D. No.
I want to ask you some questions about work you did last week
Why did you not work last week ?
of family mem-bers 5 years & above (Based on House-hold Sche-dule)
Last week, were you working for payment in cash or kind for an employer even for one hour on any day ? 1. Yes → 514 2. No 3. Disabled→Go to next person
Last week, did you do any work for payment or profit in your own or a family business even for one hour on any day ? 1. Yes→ 514 2. No
Last week, did you do any work without pay or profit in a family business even for one hour on any day ? 1. Yes, 2. No (If answer is 2 in 511, 512 & 513 then go to 517)
How many days did you work last week?
How many hours a day did you work last week ?
How many hours did you work in total last week ? 1.>= 36 → 527 2. < 36 (1-35) →520 (Verify it with the answers of 514 & 515)
Even though you did no work last week, for some reason do you usually work for an employer or in your own or a family business ? 1. Yes, 2. No → 523
1. Laid off < 1 month →525 2 Laid off >= 1 month →523 3. Did not work last week for some other reasons
What was the main reason for being temporarily away from work ? (See code)
Do you usually work less than 36 hours a week ? 1. Yes 2. No (Go to 526 only if 3 in Q. 518 otherwise continue)
Would you prefer to work 36 hours or more a week ? 1. Yes, 2. No→527
Are you available to work 36 hours or more a week ? 1. Yes →527 2. No →527
Have you looked for work in the last month ? 1. Yes 2. No (Interviewer: if 2 in Qs. 517 & 518 then only this Q is valid)
Yes No
Disab.
Yes No Yes No >36 <36 Yes No <1 >= 1 Oth.
Yes No Yes No
Yes No
Yes No
511 512 513 514 515 516 517 518 519 520 521 522 523 1 2 3 1 2 1 2 1 2 1 2 1 2 3 1 2 1 2 1 2 1 2 1 2 3 1 2 1 2 1 2 1 2 1 2 3 1 2 1 2 1 2 1 2 1 2 3 1 2 1 2 1 2 1 2 1 2 3 1 2 1 2 1 2 1 2 1 2 3 1 2 1 2 1 2 1 2 1 2 3 1 2 1 2 1 2 1 2 1 2 3 1 2 1 2 1 2 1 2 1 2 3 1 2 1 2 1 2 1 2 1 2 3 1 2 1 2 1 2 1 2 1 2 3 1 2 1 2 1 2 1 2 1 2 3 1 2 1 2 1 2 1 2 1 2 3 1 2 1 2 1 2 1 2 1 2 3 1 2 1 2 1 2 1 2 1 2 3 1 2 1 2 1 2 1 2 1 2 3 1 2 1 2 1 2 1 2 1 2 3 1 2 1 2 1 2 1 2 1 2 3 1 2 1 2 1 2 1 2 1 2 3 1 2 1 2 1 2 1 2 1 2 3 1 2 1 2 1 2 1 2 1 2 3 1 2 1 2 1 2 1 2 1 2 3 1 2 1 2 1 2 1 2 1 2 3 1 2 1 2 1 2 1 2 1 2 3 1 2 1 2 1 2 1 2 1 2 3 1 2 1 2 1 2 1 2 1 2 3 1 2 1 2 1 2 1 2 1 2 3 1 2 1 2 1 2 1 2 1 2 3 1 2 1 2 1 2 1 2 1 2 3 1 2 1 2 1 2 1 2 1 2 3 1 2 1 2 1 2 1 2 1 2 3 1 2 1 2 1 2 1 2 518. 1. No work for less than a month (Go to 525), 2. No work for more than a month (Go to 523), 3. Not worked for other reasons. 519. 1. On leave, 2. No work available, 3. Engaged in household job, 4. Sick, 5. Student, 6. Strike/lockouts, 7. Left work voluntarily, 8. Others (specify)_____________________

87
Questions to be asked to all members of Household aged 5 years and above (Based on Household Schedule) I.D. No. of family memb-ers 5 years & above (Based on House-hold Sche-dule)
Were you available to work last week ? 1. Yes 2. No → 535
How many weeks is it since you last worked ? (If "never worked" enter 00, & Go to 535)
What kind of work did you do in last main job? (See the code sheet and enter an appropriate job code) ( If 2 in Q.517 & 1,2,3 in Q. 518 then go to 535)
What kind of work did you do in the main job that you had last week ? (Interviewer: Write exactly the kind of work and then see code sheet and enter an appropriate job code)
What kind of business did you do in the main job that you had last week ? (Interviewer: Write exactly the kind of work and then see code sheet and enter an appropriate job code)
In what kind of institution did you work last week ? (See code)
In what capacity did you work ? (See code)
Where did you carry out the work last week ? (See code)
What was the daily wage you were getting last week? In Rs. (If in kind approximate value in Rs.) (Interviewer: Applicable only for wage earners)
How much did you earn In total from all jobs last month (in cash / salary or compensation) ? In Rs. (If in kind approximate value in Rupees)
What do you do with most of your earnings? (See code)
In most of the weeks of the last three months what was your employment status ? (See code)
Yes No 524 525 526 527 528 529 530 531 532 533 534 535
1 2 1 2 1 2 1 2 1 2 1 2 1 2 1 2 1 2 1 2 1 2 1 2 1 2 1 2 1 2 1 2 528. 1. Agriculture, Forestry and Fishing, 2. Mining and Quarring, 3. Manufacturing, 4. Electricity, Gas and Water Supply, 5. Commerce, Finance and Business Services, 6. Construction, Transportation and Communication Services, 7. Personal and Community Services, 8. Others (Specify)_______________ 529. 1. Government, 2. Semi-government, 3. Private Own, 4. Private Others, 5. NGO, 6. Others (Specify)_______________ 530. 1. Regular Salary Earner, 2. Temporary Wage Earner, 3. Contractual Worker (Piece Basis), 4. Paid Apprentice, 5. Employer, 6. Own Account Worker (Non-agricultural), 7. Owner Cultivator, 8. Share Cropper, 9. Tenant, 10. Unpaid Family Worker, 11. Others (Specify) ________________ 531. 1. Own Dwelling, 2. Employers Dwelling, 3. Factory/ Workshop, 4. Farm, 5. Others (Specify) _______________ 534. 1. Keep it myself, 2. Give it to guardians, 3. Give it to husband/wife, 4. Give it to descendants or care-takers, 5. Others (Specify)_________ 535. 1. Employed, 2. Unemployed but willing to work, 3. Unemployed and not willing to work, 4. Searching for work and worked when work was available, 5. Worked only when work was available, 6. Others (Specify)________________

88
Annex IV
List of Manpower Involved in Field Survey, Migration and Employment Survey, 1995/1996
Biratnagar Region Janakpur Region Regional Coordinator Regional Coordinator 1. Mr. Uma Nath Rijal 1. Dr. Prakash Dev Pant 2. Mr. Bhim Raj Suwal 2. Dr. Bhim Raj Adhikari 3. Mr. Bidhan Acharya
SN NAME STATUS SN NAME STATUS 1 TAPLEJUNG/PANCHTHAR 10 SAPTARI
1 RABINDRA BHATTARAI Supervisor 35 MAHESH P DEO Supervisor 2 GOPAL POKHREL Interviewer 36 MAHANANDA JHA Interviewer 3 YUBA RAJ BASNET Interviewer 37 SATYA N. CHAUDHARI Interviewer 4 NARENDRA SUBBA Interviewer 11 SAPTARI/SIRAHA/RAUTAHAT
2 ILAM 38 MADAN P. DEO Supervisor 5 SOM KUMAR NEPAL Supervisor 39 CHITRA REKHA GAUTAM Interviewer 6 DRAUPADA BHANDARI Interviewer 40 JYOTI PRADHAN Interviewer 7 LATA PAUDEL Interviewer 41 SABNAM SHRESTHA Interviewer
3 JHAPA 12 SIRAHA 8 GITA SHARMA Supervisor 42 RAJ KUMAR POKHAREL Supervisor 9 CHANDRA P. DHAKAL Interviewer 43 GANASHYAM S. SHRESTHA Interviewer
10 BIJAYA SUBBA Interviewer 44 MAHESH K MISHRA Interviewer 11 RAM SARAN SEDAIN Interviewer 13 DHANUSHA 12 URMILA DAHAL Interviewer 45 PRADIP K. MAHATO Supervisor
4 MORANG 46 MANOJ K. MISHRA Interviewer 13 LAXMAN SINGH KUNWAR Supervisor 47 MANOJ K. GOIT Interviewer 14 BIRENDRA KUMAR SHAH Interviewer 14 DHANUSHA/MAHOTTARI 15 NIRMALA SHRESTHA Interviewer 48 IRA SHARMA Supervisor 16 NIRMAL GURUNG Interviewer 49 JUNU SHARMA Interviewer
5 JHAPA 2/MORANG 2 50 USHA DAHAL Interviewer 17 CHARAN RAJ BHATTARAI Supervisor 15 MAHOTTARI 18 DILIP BHATTARAI Interviewer 51 RAM SAGAR PANDIT Supervisor 19 BALA RAM BHANDARI Interviewer 52 DINESH YADAV Interviewer 20 KRISHNA KUMAR PAUDYAL Interviewer 16 MAHOTTARI/SARLAHI
6 SUNSARI 53 SHYAM P. BHANDARI Supervisor 21 CHANDANI RANA Supervisor 17 SARLAHI 22 DEEPA GURUNG Interviewer 54 SANJU POUDEL Supervisor 23 PADMA ADHIKARI Interviewer 55 RANJANA UPADHYAYA Interviewer 24 INDRA KUMARI PRADHAN Interviewer 56 TILAK YADAV Interviewer 25 BED PRASAD NEUPANE Interviewer 57 BASANTA K. DEO Interviewer
7 DHANKUTA/BHOJPUR 18 SINDHULI/DHANUSHA 26 NIR KUMAR RAI Supervisor 58 NAVA RAJ THAPA Supervisor 27 GOPAL RAI Interviewer 59 KESHAV P. BHANDARI Interviewer 28 ANOOP THAPALIYA Interviewer 60 SUNITA SHAKYA Interviewer
8 TERATHUM/SANKHUWA 61 PRIYA GAUTAM Interviewer 29 BINOD NEPAL Supervisor 19 RAUTAHAT 30 ARJUN ADHIKARI Interviewer 62 SHANTI P. UPRETY Supervisor 31 RAMESHOR PRADHAN Interviewer 63 SUDESH SINGH Interviewer
9 UDAYAPUR/SAPTARI 64 JAMUNA SITAULA Interviewer 32 KESHAB BAGALE Supervisor 65 REENA ADHIKARI Interviewer 33 SASHI PANDIT Interviewer 20 BARA 34 SNJAYA CHHATKULLI Interviewer 66 PUSHPA R. POKHAREL Supervisor
67 KAMALA GIRI Interviewer 68 KAMALA SHRESTHA Interviewer

89
69 GAGAN DHAKAL Interviewer 70 KOPILA KAFLE Interviewer
Annex IV Continued ………… SN NAME STATUS SN NAME STATUS 21 PARSA 30 GROUP B
71 KESHAV K. YADAV Supervisor 103 PRABHA RAJBHANDARI Supervisor 72 RUBY DAS Interviewer 104 NARAYAN MAHARJAN Interviewer 73 JYOTI SHRESTHA Interviewer 105 KRISHNA KHANAL Interviewer 74 KEWAL ADHIKARI Interviewer 106 SUBHADRA SUBEDI Interviewer
107 SABITA MAHARJAN Interviewer Kathmandu Non-valley Region 31 GROUP C Regional Coordinator 108 LAXMI LIMBU Supervisor
Mr. Yogendra B. Gurung 109 DEVENDRA MAHARJAN Interviewer 22 DHADING 110 SABITRI GYAWALI Interviewer
75 VED RAJ GYAWALI Supervisor 111 RACHANA GHIMIRE Interviewer 76 KHAG RAJ SHARMA Interviewer 112 KUMAR P POKHREL Interviewer 77 JIT BAHADUR KUNWAR Interviewer 32 GROUP D
23 NUWAKOT/RASUWA 113 NARAYANI TIWARI Supervisor 78 PRADIP THAPA Supervisor 114 SHAMSHER KHADKA Interviewer 79 SHANKAR LOHANI Interviewer 115 KAMALA GHIMIRE Interviewer 80 KALPANA ARYAL Interviewer 116 GHAGAWATI SANGRAULA Interviewer
24 SINDHUPALCHOWK 81 PREM NARAYAN SHERSTHA Supervisor Pokhara Region 82 LOK HARI KARKI Interviewer Regional Coordinator 83 NARBADA MAINALI Interviewer 1. Mr. Govind Subedi
25 KAVRE/BHAKTAPUR 2. Mr. Bal Krishna Mabuhang 84 LAXMI SINGH Supervisor 33 MAKAWANPUR 85 BINDU ADHIKARI Interviewer 117 KRISHNA P. SHARMA Supervisor 86 RAM P. LAMSAL Interviewer 118 DIL PRAJAPATI Interviewer 87 TIKA JUNG KARKI Interviewer 119 SARADA LALCHAN Interviewer
26 RAMECHHAP/DOLAKHA 120 RADHIKA SYNGBO Interviewer 88 DILLI RAM PAHADI Supervisor 34 BAGLUNG/MYAGDI 89 ANG NGAWANG SHERPA Interviewer 121 PUSPA BASNET Supervisor 90 RAMESH DAWADI Interviewer 122 RAMESH ADHIKARI Interviewer91 KUPER GIRI Interviewer 123 SHIVA POKHAREL Interviewer
27 KHOTANG 124 SURENDRA GAUTAM Interviewer92 SIBENDRA RAI Supervisor 35 CHITWAN 93 AMRIT PURI Interviewer 125 SUSHILA NEPAL Supervisor 94 BINDRA K. TAMANG Interviewer 126 BIMALESHOWARI KARM Interviewer
28 SOLU/OKHALDHUNGA 127 DEVIMAYA DHAKAL Interviewer95 PAWAN K. BUDHATHOKI Supervisor 128 PRAKASH CHANDRA PAUDEL Interviewer96 BHANU BHATTARAI Interviewer 129 MANI RAM DHAKAL Interviewer97 MANI ADHIKARI Interviewer 36 GORKHA
130 SURESH MALLA Supervisor Kathmandu Valley Region 131 DINESH PRADASH ADHIKARI Interviewer
(Kathmandu+Bhaktapur+Lalitpur) 132 NARENDRA GURUNG Interviewer Regional Coordinator 37 NAWALPARASI Mr. Bed Raj Gyawali 133 NANI RAM RISAL Supervisor
29 GROUP A 134 DEVENDRA THAKUR Interviewer98 BIJU BAJRACHARYA Supervisor 135 AMBIKA NEPAL Interviewer99 SUDHA POUDEL Interviewer 136 MANJU KOIRALA Interviewer

90
100 INDU BHATTARAI Interviewer 38 LAMJUNG/TANAHU 101 MAHENDRA SITAULA Interviewer 137 SOBHA NATH GAUTAM Supervisor 102 SUMAN PANT Interviewer 138 OM KUMARI SHRESTHA Interviewer
139 BISHNU DHITAL Interviewer 140 SARBENDRA ADHIKARI Interviewer
Annex IV Continued ………… SN NAME STATUS SN NAME STATUS 39 GULMI 50 RUKUM/SALYAN
141 STHANESHOWAR ADHIKARI Supervisor 177 KAMAL RAJ SHARMA Supervisor 142 GOVIND LAMSAL Interviewer 178 GURU GAUTAM Interviewer143 JIT BAHADUR CHAUHAN Interviewer 179 KESHAV GYAWALI Interviewer
40 KASKI 51 JAJARKOT/DAILEKH 144 GITA GYAWALI Supervisor 180 BASANTA KARKI Supervisor 145 RAM PRASAD GAUTAM Interviewer 181 NIRAJ NEPAL Interviewer146 DAMODAR SAPKOTA Interviewer 182 BISHNU DAHAL Interviewer147 INDIRA GURUNG Interviewer 52 SURKHET
41 PARBAT/SYANJA 183 NARAYAN P. SAPKOTA Supervisor 148 NARAYAN HARI GHIMIRE Supervisor 184 HOM NATH CHALISE Interviewer149 BHOJ B. ACHARYA Interviewer 185 BIRENDRA LAMSAL Interviewer150 DEEPEN GURUNG Interviewer
42 PALPA Dhangadhi Region 151 KHIM RANA Supervisor Regional Coordinator 152 SURESH ADHIKARI Interviewer 1. Mr. Prem Singh Bist 153 HOM NATH NEPAL Interviewer 2. Mr. Rudra Prasad Gautam
SN NAME STATUS Nepalgunj Region 53 KAILALI Regional Coordinator 186 SABITRA PANT Supervisor 1. Mr. Keshav Prasad Adhikari 187 RUDRA P. KHAREL Interviewer 2. Mr. Pushp Kamal Subedi 188 SHANTA DAHAL Interviewer
SN NAME STATUS 189 BHARAT P BHATTA Interviewer43 RUPENDEHI 54 KANCHANPUR/DADELDHURA
154 BABU RAM DAHAL Supervisor 190 BHESH NATH SAPKOTA Supervisor155 RITU GYAWALI Interviewer 191 BASANTI BHATTA Interviewer156 RIDDHI SHARMA Interviewer 192 CHAKRA B. BAM Interviewer157 SUJAN RAJ WONTA Interviewer 193 DIGBIJAYA DHAKAL Interviewer158 BIRENDRA PRASAD RAM Interviewer 194 GOMATI BHANDARI Interviewer
44 KAPILBASTU 55 ACHHAM/BAJHURA 159 GOMA GHIMIRE Supervisor 195 SUNDAR RAI Supervisor160 JAYA NARAYAN RAUT Interviewer 196 DEVI P. DOTEL Interviewer161 UMA SHANKER DEO Interviewer 197 NARSINGH RAWAL Interviewer
45 DANG 56 DOTI/BAJHANG 162 SHIVA PRASAD KHANAL Supervisor 198 LOK B. DWARIYA Supervisor163 SHASHI SHARMA Interviewer 199 SURENDRA PANERU Interviewer164 TIRTHA RAJ NEUPANE Interviewer 200 HARI K. KOIRALA Interviewer165 KRISHNA BHATTARAI Interviewer 57 BAITADI/DARCHULA Interviewer
46 ARGHAKANCHI/PYUTHAN 201 HARIHAR PANDEY Supervisor166 MADAN GOPAL SHRESTHA Supervisor 202 MAHENDRA RAJ HOSHI Interviewer167 RISHI BHAKTA WAGLE Interviewer 203 GHANASHYAM PANTA Interviewer168 TEJ BAHADUR SUNAR Interviewer
47 BANKE

91
169 RAM CHANDRA BASNET Supervisor 170 BISHNU JOSHI Interviewer 171 SHRIJANA SHRESTHA Interviewer
48 BARDIYA 172 RAM PRASAD ARYAL Supervisor 173 SHIVA NARAYAN YADAV Interviewer 174 OM PRAKASH MAHARJAN Interviewer
49 SALYAN/ROLPA 175 PAWAN S. SHRESTHA Supervisor 176 UDAYA RAM OLI Interviewer
Annex IV Continued …………
Mountain Region
SN NAME STATUS 58 KALIKOT 204 KAMAL RAJ SHARMA Supervisor 205 PRADIP THAPA Supervisor
59 HUMLA/MUGU 206 DILLI RAM PAHADI Supervisor 207 KESHAV KUMAR YADAV Supervisor
60 JUMLA 208 NARAYAN MAHARJAN Supervisor 209 KHIM BAHADUR RANA Supervisor
61 MUSTANG/BAGLUNG 210 BINOD NEPAL Supervisor 211 KRISHNA P. ACHARYA Supervisor
62 TAPLEJUNG 212 BABU RAM DAHAL Supervisor
Data Management 1 Mr. Harihar Nath Regmi Data Management Expert 2 Mr. Dipesh Sharma Computer Programmer 3 Mr. Bijaya K. Ojha Data Entry 4 Mr. Kamal Chhetry Data Entry 5 Mr. Suman Neupane Data Entry 6 Ms. Sabari Malla Data Entry 7 Mr. Kapindra Regmi Data Entry 8 Mr. Ajaya K. Ojha Data Entry 9 Ms. Shanti Shakya Data Entry
10 Mr. Rajeev K.C. Data Entry