Jordan 2012 - ILO
368
Jordan Population and Family Health Survey 2012
-
Upload
khangminh22 -
Category
Documents
-
view
1 -
download
0
Transcript of Jordan 2012 - ILO

Jordan
Population and Family Health Survey 2012

THE HASHEMITE KINGDOM OF JORDAN
Jordan Population and Family
Health Survey 2012
Department of Statistics Amman, Jordan
ICF International Calverton, Maryland, USA
October 2013

CONTRIBUTORS
DEPARTMENT OF STATISTICS
Fathi Nsour Kamal Saleh Ikhlas Aranki Batoul Obaid
Manal Sweidan Dr. Ahmad Abu-Haidar
Ahmad Mowafi Ghaida Khasawneh Eman Bny Mfarej
MINISTRY OF HEALTH
Dr. Kareman Al-Zain Dr. Ahlam Abodiab Dr. Bassam Hijawi
ARAB INSTITUTE FOR TRAINING & RESEARCH IN STATISTICS
Dr. Issa Al-Masarweh
ICF INTERNATIONAL
Dr. Pav Govindasamy Bernard Barrère Dr. Ruilin Ren
Nourredine Abderrahim Anne Cross
This report summarizes the findings of the 2012 Jordan Population and Family Health Survey (JPFHS) carried out by the Department of Statistics (DoS). The survey was funded by the government of Jordan. Additional funding was provided by the U.S. Agency for International Development (USAID), the United Nations Population Fund (UNFPA) and the United Nations Children’s Fund (UNICEF). ICF International provided technical assistance through the MEASURE DHS program. The JPFHS is part of the worldwide Demographic and Health Surveys Program, which is designed to collect data on fertility, family planning, and maternal and child health. Additional information about the Jordan survey may be obtained from the Department of Statistics, P.O. Box 2015, Amman 11181, Jordan (Telephone (962) 6-5-300-700; Fax (962) 6-5-300-710; e-mail [email protected]). Additional information about the MEASURE DHS program may be obtained from ICF International, 11785 Beltsville Drive, Suite 300, Calverton, MD 20705 (Telephone 301-572-0200; Fax 301-572-0999; E-mail [email protected]). Suggested citation: Department of Statistics [Jordan] and ICF International. 2013. Jordan Population and Family Health Survey 2012. Calverton, Maryland, USA: Department of Statistics and ICF International.

Contents • iii
CONTENTS LIST OF TABLES AND FIGURES ......................................................................................................... vii PREFACE ................................................................................................................................................. xiii MILLENIUM DEVELOPMENT GOALS INDICATORS .................................................................... xv MAP OF JORDAN ................................................................................................................................... xvi
1 INTRODUCTION 1.1 History, Geography, and Economy ............................................................................................ 1 1.2 Population .................................................................................................................................. 2 1.3 Population and Family Planning Policies and Programs ............................................................ 3 1.4 Health Priorities and Programs .................................................................................................. 4 1.5 Objectives of the Survey ............................................................................................................ 5 1.6 Methodology and Organization of the Survey ........................................................................... 5
1.6.1 Sample Design ............................................................................................................. 6 1.6.2 Updating of Sampling Frame ....................................................................................... 6 1.6.3 Questionnaires ............................................................................................................. 7 1.6.4 Recruitment of Staff .................................................................................................... 7 1.6.5 Pretest and Training ..................................................................................................... 8 1.6.6 Main Fieldwork ........................................................................................................... 8 1.6.7 Data Processing ........................................................................................................... 8
1.7 Results of the Household and Individual Interviews .................................................................. 9
2 HOUSEHOLD CHARACTERISTICS 2.1 Housing Characteristics ........................................................................................................... 11 2.2 Household Wealth .................................................................................................................... 16 2.3 Population by Age and Sex ...................................................................................................... 17 2.4 Household Composition ........................................................................................................... 19 2.5 Birth Registration ..................................................................................................................... 20 2.6 Education of the Household Population ................................................................................... 23
3 RESPONDENTS’ BACKGROUND CHARACTERISTICS 3.1 General Characteristics ............................................................................................................ 27 3.2 Respondents’ Level of Education ............................................................................................ 29 3.3 Exposure to Mass Media .......................................................................................................... 31 3.4 Respondents’ Employment Characteristics .............................................................................. 32
3.4.1 Working Status .......................................................................................................... 32 3.4.2 Occupation ................................................................................................................. 34
3.5 Smoking Tobacco .................................................................................................................... 36
4 MARRIAGE AND EXPOSURE TO THE RISK OF PREGNANCY 4.1 Current Marital Status .............................................................................................................. 39 4.2 Polygyny .................................................................................................................................. 40 4.3 Consanguinity .......................................................................................................................... 42 4.4 Age at First Marriage ............................................................................................................... 43 4.5 Recent Sexual Activity ............................................................................................................. 45
iv • Contents
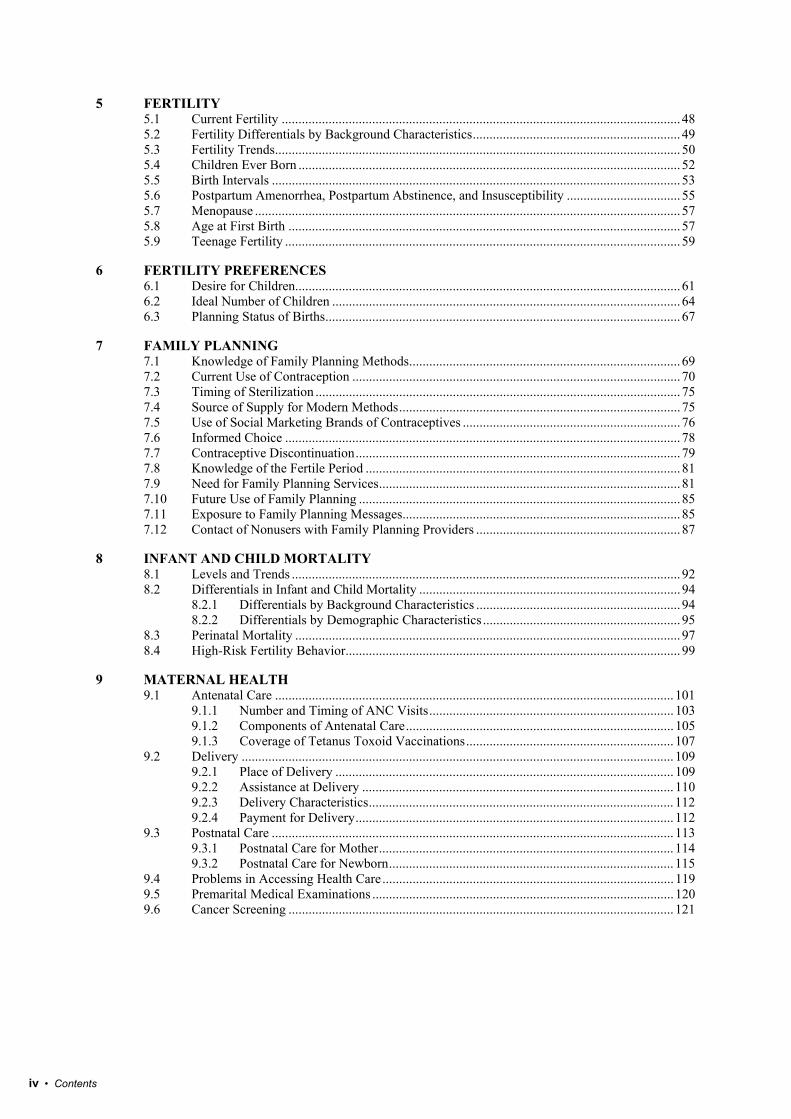
5 FERTILITY 5.1 Current Fertility ....................................................................................................................... 48 5.2 Fertility Differentials by Background Characteristics .............................................................. 49 5.3 Fertility Trends ......................................................................................................................... 50 5.4 Children Ever Born .................................................................................................................. 52 5.5 Birth Intervals .......................................................................................................................... 53 5.6 Postpartum Amenorrhea, Postpartum Abstinence, and Insusceptibility .................................. 55 5.7 Menopause ............................................................................................................................... 57 5.8 Age at First Birth ..................................................................................................................... 57 5.9 Teenage Fertility ...................................................................................................................... 59
6 FERTILITY PREFERENCES 6.1 Desire for Children................................................................................................................... 61 6.2 Ideal Number of Children ........................................................................................................ 64 6.3 Planning Status of Births .......................................................................................................... 67
7 FAMILY PLANNING 7.1 Knowledge of Family Planning Methods ................................................................................. 69 7.2 Current Use of Contraception .................................................................................................. 70 7.3 Timing of Sterilization ............................................................................................................. 75 7.4 Source of Supply for Modern Methods .................................................................................... 75 7.5 Use of Social Marketing Brands of Contraceptives ................................................................. 76 7.6 Informed Choice ...................................................................................................................... 78 7.7 Contraceptive Discontinuation ................................................................................................. 79 7.8 Knowledge of the Fertile Period .............................................................................................. 81 7.9 Need for Family Planning Services .......................................................................................... 81 7.10 Future Use of Family Planning ................................................................................................ 85 7.11 Exposure to Family Planning Messages ................................................................................... 85 7.12 Contact of Nonusers with Family Planning Providers ............................................................. 87
8 INFANT AND CHILD MORTALITY 8.1 Levels and Trends .................................................................................................................... 92 8.2 Differentials in Infant and Child Mortality .............................................................................. 94
8.2.1 Differentials by Background Characteristics ............................................................. 94 8.2.2 Differentials by Demographic Characteristics ........................................................... 95
8.3 Perinatal Mortality ................................................................................................................... 97 8.4 High-Risk Fertility Behavior.................................................................................................... 99
9 MATERNAL HEALTH 9.1 Antenatal Care ....................................................................................................................... 101
9.1.1 Number and Timing of ANC Visits ......................................................................... 103 9.1.2 Components of Antenatal Care ................................................................................ 105 9.1.3 Coverage of Tetanus Toxoid Vaccinations .............................................................. 107
9.2 Delivery ................................................................................................................................. 109 9.2.1 Place of Delivery ..................................................................................................... 109 9.2.2 Assistance at Delivery ............................................................................................. 110 9.2.3 Delivery Characteristics ........................................................................................... 112 9.2.4 Payment for Delivery ............................................................................................... 112
9.3 Postnatal Care ........................................................................................................................ 113 9.3.1 Postnatal Care for Mother ........................................................................................ 114 9.3.2 Postnatal Care for Newborn ..................................................................................... 115
9.4 Problems in Accessing Health Care ....................................................................................... 119 9.5 Premarital Medical Examinations .......................................................................................... 120 9.6 Cancer Screening ................................................................................................................... 121

Contents • v
10 CHILD HEALTH 10.1 Birth Weight ........................................................................................................................... 123 10.2 Vaccination Coverage ............................................................................................................ 125
10.2.1 Additional Doses of Polio and DPT ......................................................................... 127 10.2.2 Additional Vaccinations .......................................................................................... 128 10.2.3 Trends in Vaccination Coverage .............................................................................. 130
10.3 Acute Respiratory Infection ................................................................................................... 131 10.4 Prevalence of Fever ................................................................................................................ 133 10.5 Prevalence of Diarrhea ........................................................................................................... 135
10.5.1 Diarrhea Treatment .................................................................................................. 136 10.5.2 Nutritional Practices during Diarrhea ...................................................................... 138 10.5.3 Knowledge of Diarrhea Treatment Solutions .......................................................... 141
11 NUTRITIONAL STATUS AND PREVALENCE OF ANEMIA 11.1 Nutritional Status of Children ................................................................................................ 143
11.1.1 Measurement of Nutritional Status among Young Children .................................... 144 11.1.2 Results of Data Collection ....................................................................................... 145 11.1.3 Levels of Child Malnutrition ................................................................................... 145 11.1.4 Trends in Children’s Nutritional Status ................................................................... 149
11.2 Breastfeeding and Complementary Feeding .......................................................................... 149 11.2.1 Initiation of Breastfeeding ....................................................................................... 149 11.2.2 Breastfeeding Status by Age .................................................................................... 152 11.2.3 Duration of Breastfeeding ........................................................................................ 154 11.2.4 Types of Complementary Foods .............................................................................. 155
11.3 Appropriate Infant and Young Child Feeding (IYCF) Practices ............................................ 155 11.4 Prevalence of Anemia in Children ......................................................................................... 159 11.5 Micronutrient Intake among Children .................................................................................... 162 11.6 Nutritional Status of Women ................................................................................................. 163 11.7 Prevalence of Anemia in Women .......................................................................................... 165 11.8 Micronutrient Intake among Mothers .................................................................................... 167
12 HIV/AIDS-RELATED KNOWLEDGE, ATTITUDES, AND BEHAVIOR 12.1 Knowledge of HIV/AIDS and Methods of HIV Prevention .................................................. 170 12.2 Stigma Associated with AIDS ............................................................................................... 176 12.3 Attitudes towards Negotiating Safer Sexual Relations .......................................................... 177 12.4 Knowledge of Sexually Transmitted Infections ..................................................................... 179 12.5 Exposure to Media Messages about AIDS ............................................................................. 180 12.6 AIDS-Related Knowledge among Youth ............................................................................... 181 12.7 Knowledge of Tuberculosis ................................................................................................... 182
13 WOMEN’S EMPOWERMENT 13.1 Women’s Work Status ........................................................................................................... 185 13.2 Women’s Control Over Their Own Earnings and Relative Magnitude of
Women’s Earnings ................................................................................................................. 186 13.3 Control Over Husbands’ Earnings ......................................................................................... 187 13.4 Women’s Ownership of Assets .............................................................................................. 189 13.5 Women’s Participation in Decision Making .......................................................................... 190 13.6 Women’s Attitudes toward Wife Beating .............................................................................. 193 13.7 Women’s Empowerment Indicators ....................................................................................... 195 13.8 Current Use of Contraception by Women’s Empowerment ................................................... 195 13.9 Ideal Family Size and Unmet Need by Women’s Empowerment .......................................... 196

vi • Contents
14 DOMESTIC VIOLENCE 14.1 Physical Violence ................................................................................................................... 199 14.2 Sexual Violence ..................................................................................................................... 202 14.3 Physical and Sexual Violence ................................................................................................ 204 14.4 Violence during Pregnancy .................................................................................................... 204 14.5 Marital Control by Husband................................................................................................... 206 14.6 Spousal Violence ................................................................................................................... 208 14.7 Spousal Violence and Women’s Empowerment .................................................................... 210 14.8 Spousal Violence in the Past 12 Months ................................................................................ 211 14.9 Injuries from Spousal Violence .............................................................................................. 213 14.10 Help-Seeking Behavior by Abused Women .......................................................................... 213
15 EARLY CHILDHOOD DEVELOPMENT AND CHILD DISCIPLINE 15.1 Early Childhood Education and Learning .............................................................................. 218 15.2 Early Childhood Development ............................................................................................... 224 15.3 Child Discipline ..................................................................................................................... 226
REFERENCES ......................................................................................................................................... 229
APPENDIX A SAMPLE IMPLEMENTATION A.1 Objectives of the Survey ........................................................................................................ 233 A.2 Sampling Frame ..................................................................................................................... 233 A.3 Sample Allocation and Sample Selection .............................................................................. 234 A.4 Selection Probability and Sampling Weight .......................................................................... 236 A.5 Sample Implementation ......................................................................................................... 237
APPENDIX B ESTIMATES OF SAMPLING ERRORS ................................................................... 239
APPENDIX C DATA QUALITY TABLES ......................................................................................... 265
APPENDIX D QUESTIONNAIRES ..................................................................................................... 271

List of Tables and Figures • vii
LIST OF TABLES AND FIGURES
1 INTRODUCTION Table 1.1 Basic demographic indicators ...................................................................................... 2 Table 1.2 Results of the household and individual interviews ..................................................... 9
2 HOUSEHOLD CHARACTERISTICS Table 2.1 Household drinking water .......................................................................................... 12 Table 2.2 Household sanitation facilities ................................................................................... 12 Table 2.3 Household characteristics .......................................................................................... 14 Table 2.4 Household possessions .............................................................................................. 15 Table 2.5 Wealth quintiles ......................................................................................................... 16 Table 2.6 Household population by age, sex, and residence...................................................... 18 Table 2.7 Household composition ............................................................................................. 20 Table 2.8 Birth registration of children under age five .............................................................. 21 Table 2.9 Children's living arrangements and orphanhood ........................................................ 22 Table 2.10.1 Educational attainment of the female household population ..................................... 24 Table 2.10.2 Educational attainment of the male household population ........................................ 25 Figure 2.1 Male and female population by single year of age, 2012 .......................................... 17 Figure 2.2 Population pyramid .................................................................................................... 18 Figure 2.3 Population by broad age groups, various surveys, 1983-2012 ................................... 19 Figure 2.4 Age-specific attendance rates, 2012 (percentage of the population age
6-24 attending school) ............................................................................................... 26
3 RESPONDENTS’ BACKGROUND CHARACTERISTICS Table 3.1 Background characteristics of women ....................................................................... 28 Table 3.2 Educational attainment .............................................................................................. 30 Table 3.3 Exposure to mass media ............................................................................................ 32 Table 3.4 Employment status ..................................................................................................... 33 Table 3.5 Occupation ................................................................................................................. 35 Table 3.6 Use of tobacco ........................................................................................................... 37 Figure 3.1 Women’s current employment status ......................................................................... 36
4 MARRIAGE AND EXPOSURE TO THE RISK OF PREGNANCY Table 4.1 Current marital status ................................................................................................. 39 Table 4.2 Trends in the proportion of ever-married women by age group ................................ 40 Table 4.3 Number of women's co-wives .................................................................................... 41 Table 4.4 Consanguinity ............................................................................................................ 42 Table 4.5 Age at first marriage .................................................................................................. 44 Table 4.6 Median age at first marriage by background characteristics ...................................... 45 Table 4.7 Recent sexual activity ................................................................................................ 46
5 FERTILITY Table 5.1 Current fertility .......................................................................................................... 48 Table 5.2 Fertility by background characteristics ...................................................................... 49 Table 5.3 Trends in age-specific fertility rates .......................................................................... 50 Table 5.4 Trends in fertility ....................................................................................................... 51 Table 5.5 Children ever born and living .................................................................................... 52 Table 5.6 Birth intervals ............................................................................................................ 54 Table 5.7 Postpartum amenorrhea, abstinence, and insusceptibility .......................................... 55 Table 5.8 Median duration of amenorrhea, postpartum abstinence, and postpartum
insusceptibility ........................................................................................................... 56

viii • List of Tables and Figures
Table 5.9 Menopause ................................................................................................................. 57 Table 5.10 Age at first birth ......................................................................................................... 57 Table 5.11 Median age at first birth ............................................................................................. 58 Table 5.12 Teenage pregnancy and motherhood ......................................................................... 59 Figure 5.1 Age-specific fertility rates by urban-rural residence .................................................. 48 Figure 5.2 Total fertility rates by background characteristics ..................................................... 50 Figure 5.3 Age-specific fertility rates for five-year periods preceding the survey ...................... 51 Figure 5.4 Trends in age-specific fertility rates, various sources, 1990-2012 ............................. 52
6 FERTILITY PREFERENCES Table 6.1 Fertility preferences by number of living children .................................................... 62 Table 6.2 Desire to limit childbearing ....................................................................................... 63 Table 6.3 Ideal number of children by number of living children ............................................. 65 Table 6.4 Mean ideal number of children by background characteristics .................................. 66 Table 6.5 Fertility planning status ............................................................................................. 67 Table 6.6 Wanted fertility rates ................................................................................................. 68 Figure 6.1 Fertility preferences of currently married women age 15-49 ..................................... 62
7 FAMILY PLANNING Table 7.1 Knowledge of contraceptive methods ........................................................................ 70 Table 7.2 Current use of contraception by age .......................................................................... 71 Table 7.3 Current use of contraception by background characteristics ..................................... 74 Table 7.4 Source of modern contraception methods .................................................................. 75 Table 7.5 Use of social marketing brand pills ........................................................................... 77 Table 7.6 Informed choice ......................................................................................................... 78 Table 7.7 Twelve-month contraceptive discontinuation rates ................................................... 79 Table 7.8 Reasons for discontinuation ....................................................................................... 80 Table 7.9 Knowledge of fertile period ....................................................................................... 81 Table 7.10 Need and demand for family planning among currently married women ................. 84 Table 7.11 Future use of contraception ........................................................................................ 85 Table 7.12 Exposure to family planning messages ...................................................................... 86 Table 7.13 Meaning of Hayatee Ahla message ............................................................................ 88 Table 7.14 Contact of nonusers with family planning providers ................................................. 89 Figure 7.1 Current use of contraception among currently married women, various
surveys, 1990-2012 .................................................................................................... 72 Figure 7.2 Sources of family planning methods among current users of modern
methods, 2012 ............................................................................................................ 76
8 INFANT AND CHILD MORTALITY Table 8.1 Early childhood mortality rates .................................................................................. 93 Table 8.2 Early childhood mortality rates by socioeconomic characteristics ............................ 95 Table 8.3 Early childhood mortality rates by demographic characteristics ............................... 96 Table 8.4 Perinatal mortality ..................................................................................................... 98 Table 8.5 High-risk fertility behavior ........................................................................................ 99 Figure 8.1 Trends in childhood mortality, Jordan 2012 .............................................................. 93 Figure 8.2 Trends in under-5 mortality, 1990-2012 .................................................................... 94 Figure 8.3 Under-5 mortality rates by selected demographic characteristics .............................. 96
9 MATERNAL HEALTH Table 9.1 Antenatal care .......................................................................................................... 102 Table 9.2 Number of antenatal care visits................................................................................ 104 Table 9.3 Timing of first antenatal care visit ........................................................................... 105 Table 9.4 Components of antenatal care .................................................................................. 106 Table 9.5 Tetanus toxoid injections ......................................................................................... 108 Table 9.6 Place of delivery ...................................................................................................... 110 Table 9.7 Assistance during delivery ....................................................................................... 111

List of Tables and Figures • ix
Table 9.8 Cost of delivery........................................................................................................ 113 Table 9.9 Timing of first postnatal checkup for the mother .................................................... 114 Table 9.10 Timing of first postnatal checkup for the newborn .................................................. 116 Table 9.11 Heel prick and hearing test for the newborn ............................................................ 117 Table 9.12 Cost of postnatal checkup ........................................................................................ 118 Table 9.13 Problems in accessing health care ............................................................................ 119 Table 9.14 Premarital medical exams by background characteristics ....................................... 120 Table 9.15 Breast cancer exam and Pap smear .......................................................................... 122
10 CHILD HEALTH Table 10.1 Child's size and weight at birth ................................................................................ 124 Table 10.2 Vaccinations by source of information .................................................................... 125 Table 10.3 Basic vaccinations of children age 12-23 months by background
characteristics .......................................................................................................... 127 Table 10.4 Basic and booster vaccinations of children 24-59 months by background
characteristics .......................................................................................................... 128 Table 10.5 Additional vaccinations of children 24-59 months by background
characteristics .......................................................................................................... 129 Table 10.6 Vaccinations in first year of life............................................................................... 130 Table 10.7 Prevalence and treatment of symptoms of ARI ....................................................... 132 Table 10.8 Prevalence and treatment of fever ............................................................................ 133 Table 10.9 Children taken for treatment of fever by number of days ........................................ 134 Table 10.10 Prevalence of diarrhea ............................................................................................. 135 Table 10.11 Diarrhea treatment ................................................................................................... 137 Table 10.12 Feeding practices during diarrhea ............................................................................ 139 Table 10.13 Children taken for treatment of diarrhea by number of days ................................... 140 Table 10.14 Knowledge of ORS packets or pre-packaged liquids .............................................. 141 Figure 10.1 Percentage of children age 12-23 months with specific vaccinations ...................... 126
11 NUTRITIONAL STATUS AND PREVALENCE OF ANEMIA Table 11.1 Nutritional status of children ................................................................................... 146 Table 11.2 Initial breastfeeding ................................................................................................. 151 Table 11.3 Breastfeeding status by age ...................................................................................... 152 Table 11.4 Median duration of breastfeeding ............................................................................ 154 Table 11.5 Foods and liquids consumed by children in the day or night preceding
the interview ............................................................................................................ 156 Table 11.6 Infant and young child feeding (IYCF) practices .................................................... 157 Table 11.7 Prevalence of anemia in children ............................................................................. 160 Table 11.8 Micronutrient intake among children ....................................................................... 162 Table 11.9 Nutritional status of women ..................................................................................... 164 Table 11.10 Prevalence of anemia in women .............................................................................. 166 Table 11.11 Micronutrient intake among mothers ....................................................................... 168 Figure 11.1 Nutritional status of children by age ........................................................................ 148 Figure 11.2 Trends in nutritional status of children under age five, 2002, 2009, and 2012 ........ 149 Figure 11.3 Breastfeeding status, 2002, 2007, 2012 ................................................................... 153 Figure 11.4 Trends in anemia status among children 6-59 months ............................................. 161 Figure 11.5 Trends in anemia status among women age 15-49 .................................................. 167
12 HIV/AIDS-RELATED KNOWLEDGE, ATTITUDES, AND BEHAVIOR Table 12.1 Knowledge of AIDS ................................................................................................ 170 Table 12.2 Knowledge of HIV prevention methods .................................................................. 171 Table 12.3 Comprehensive knowledge about AIDS .................................................................. 172 Table 12.4 Knowledge of prevention of mother-to-child transmission of HIV ......................... 174 Table 12.5 Knowledge of where to get an HIV test ................................................................... 175 Table 12.6 Accepting attitudes toward those living with HIV/AIDS ........................................ 176 Table 12.7 Attitudes toward negotiating safer sexual relations with husband ........................... 177 Table 12.8 Talked about AIDS with husband ............................................................................ 178 Table 12.9 Knowledge of sexually transmitted infections (STIs) .............................................. 179

x • List of Tables and Figures
Table 12.10 Exposure to media messages about AIDS ............................................................... 180 Table 12.11 Comprehensive knowledge about AIDS and of a source of condoms among
young women .......................................................................................................... 181 Table 12.12 Knowledge of tuberculosis ...................................................................................... 182 Table 12.13 Comprehensive knowledge of tuberculosis and willingness to be tested ................ 183
13 WOMEN’S EMPOWERMENT Table 13.1 Employment of currently married women ............................................................... 185 Table 13.2 Control over women's cash earnings and relative magnitude of women's cash
earnings .................................................................................................................... 187 Table 13.3 Control over husband's earnings .............................................................................. 188 Table 13.4 Women's control over their own earnings and over those of their husbands ........... 189 Table 13.5 Ownership of assets ................................................................................................. 190 Table 13.6 Participation in decision making .............................................................................. 191 Table 13.7 Women's participation in decision making by background characteristics .............. 192 Table 13.8 Attitude toward wife beating ................................................................................... 194 Table 13.9 Indicators of women's empowerment ...................................................................... 195 Table 13.10 Current use of contraception by women's empowerment ........................................ 196 Table 13.11 Ideal number of children and unmet need for family planning by women’s
empowerment .......................................................................................................... 197 Figure 13.1 Number of decisions in which currently married women participate ...................... 191
14 DOMESTIC VIOLENCE Table 14.1 Experience of physical violence .............................................................................. 201 Table 14.2 Persons committing physical violence ..................................................................... 202 Table 14.3 Experience of sexual violence ................................................................................. 203 Table 14.4 Experience of different forms of violence ............................................................... 204 Table 14.5 Experience of violence during pregnancy ................................................................ 205 Table 14.6 Marital control exercised by husbands .................................................................... 207 Table 14.7 Forms of spousal violence ....................................................................................... 208 Table 14.8 Spousal violence by background characteristics ...................................................... 209 Table 14.9 Spousal violence by husband's characteristics and empowerment indicators .......... 211 Table 14.10 Frequency of physical or sexual violence ................................................................ 212 Table 14.11 Injuries to women due to spousal violence .............................................................. 213 Table 14.12 Help seeking to stop violence .................................................................................. 214 Table 14.13 Sources for help to stop violence ............................................................................. 215
15 EARLY CHILDHOOD DEVELOPMENT AND CHILD DISCIPLINE Table 15.1 Early childhood education ....................................................................................... 218 Table 15.2 Support for learning ................................................................................................. 220 Table 15.3 Learning materials ................................................................................................... 222 Table 15.4 Inadequate care ........................................................................................................ 223 Table 15.5 Early child development index ................................................................................ 225 Table 15.6 Child discipline ........................................................................................................ 227
APPENDIX A SAMPLE IMPLEMENTATION Table A.1 Enumeration areas ................................................................................................... 234 Table A.2 Households .............................................................................................................. 234 Table A.3 Sample allocation of enumeration areas .................................................................. 235 Table A.4 Sample allocation of households ............................................................................. 236 Table A.5 Sample allocation of expected interviews with women ........................................... 236 Table A.6 Sample implementation ........................................................................................... 238
APPENDIX B ESTIMATES OF SAMPLING ERRORS Table B.1 List of indicators for sampling errors, Jordan 2012 ................................................. 241 Table B.2 Sampling errors: Total sample, Jordan 2012 ........................................................... 242 Table B.3 Sampling errors: Urban sample, Jordan 2012 .......................................................... 243 Table B.4 Sampling errors: Rural sample, Jordan 2012 ........................................................... 244 Table B.5 Sampling errors: Central sample, Jordan 2012 ........................................................ 245 Table B.6 Sampling errors: North sample, Jordan 2012 ........................................................... 246

List of Tables and Figures • xi
Table B.7 Sampling errors: South sample, Jordan 2012 ........................................................... 247 Table B.8 Sampling errors: Amman sample, Jordan 2012 ....................................................... 248 Table B.9 Sampling errors: Balqa sample, Jordan 2012 ........................................................... 249 Table B.10 Sampling errors: Zarqa sample, Jordan 2012 ........................................................... 250 Table B.11 Sampling errors: Madaba sample, Jordan 2012 ....................................................... 251 Table B.12 Sampling errors: Irbid sample, Jordan 2012 ............................................................ 252 Table B.13 Sampling errors: Mafraq sample, Jordan 2012 ........................................................ 253 Table B.14 Sampling errors: Jarash sample, Jordan 2012 .......................................................... 254 Table B.15 Sampling errors: Ajloun sample, Jordan 2012 ......................................................... 255 Table B.16 Sampling errors: Karak sample, Jordan 2012 .......................................................... 256 Table B.17 Sampling errors: Tafiela sample, Jordan 2012 ......................................................... 257 Table B.18 Sampling errors: Ma'an sample, Jordan 2012 .......................................................... 258 Table B.19 Sampling errors: Aqaba sample, Jordan 2012 ......................................................... 259 Table B.20 Sampling errors: Non Badia sample, Jordan 2012 ................................................... 260 Table B.21 Sampling errors: Badia sample, Jordan 2012 ........................................................... 261 Table B.22 Sampling errors: Non camp sample, Jordan 2012 ................................................... 262 Table B.23 Sampling errors: Camp sample, Jordan 2012 .......................................................... 263
APPENDIX C DATA QUALITY TABLES Table C.1 Household age distribution ...................................................................................... 265 Table C.2 Age distribution of eligible and interviewed women ............................................... 266 Table C.3 Completeness of reporting ....................................................................................... 266 Table C.4 Births by calendar years ........................................................................................... 267 Table C.5 Reporting of age at death in days ............................................................................. 267 Table C.6 Reporting of age at death in months ........................................................................ 268 Table C.7 Nutritional status of children based on the NCHS/CDC/WHO International
Reference Population ............................................................................................... 269


Preface • xiii
PREFACE
he Department of Statistics (DoS) takes pleasure in presenting the principal report of the 2012 Jordan Population and Family Health Survey (JPFHS), which includes the detailed main results. The survey was conducted from September to December 2012. The 2012 Jordan Population and
Family Health Survey (JPFHS) is the sixth Demographic and Health Survey conducted in Jordan. Like the first five JPFHS, conducted respectively in 1990, 1997, 2002, 2007, and 2009, the 2012 JPFHS was carried out by the Department of Statistics (DoS). The main objective of the survey is to provide comprehensive data on fertility, mortality, family planning, and fertility preferences, as well as maternal and child health and nutrition, that can be used by program managers and policymakers to evaluate and improve existing programs. In addition, the JPFHS data will be useful for researchers and scholars interested in analyzing trends in demographic parameters in Jordan as well as conducting comparative, regional or cross-national studies and in-depth analyses.
The sample is nationally representative and has been designed to produce estimates of major survey variables at the national level, for urban and rural areas, for the country’s three regions (Central, North, and South) and 12 governorates, and for Badia areas and refugee camp areas. Over 15,000 households and more than 11,000 ever-married women age 15-49 were interviewed.
The 2012 JPFHS was funded by the Government of Jordan. Additional funding was provided by the U.S. Agency for International Development (USAID), the United Nations Population Fund (UNFPA), and the United Nations Children’s Fund (UNICEF). ICF International provided technical assistance through the worldwide MEASURE Demographic and Health Surveys (DHS) program.
It is hoped that the 2012 JPFHS data will meet the survey’s objective of facilitating important government policies and programs promoting maternal and child health. Furthermore, the survey will also be useful to those interested in the fields of population, family planning, and health.
The DoS would like to express its thanks and appreciation to the individuals and organizations that contributed to the success of the survey. The timely and high-quality data are the result of hard work from all of the survey staff. Thanks go to all of the households interviewed during the survey for their time and willingness to provide the required information. Acknowledgment also goes to the Ministry of Health for its technical and logistical assistance. In addition, thanks are due to USAID, UNFPA and UNICEF in Amman for their financial and technical support. Thanks also go to the ICF International team: Bernard Barrere, DHS Deputy Director for Survey Operations; Pav Govindasamy, Technical Director, who participated in all stages of the survey; Ruilin Ren, for his contribution in the sampling design; Anne Cross, who assisted in preparing the preliminary results; and Noureddine Abderrahim for his valuable assistance in data processing. Finally, thanks are due to the local and international experts who prepared the present report.
Fathi Nsour Director General
T


Millennium Development Goal Indicators • xv
MILLENNIUM DEVELOPMENT GOAL INDICATORS Millennium Development Goal Indicators
Jordan 2012
Indicator Sex
Total Male Female 1. Eradicate extreme poverty and hunger 1.8 Prevalence of underweight children under age five1 3.3 2.7 3.0
4. Reduce child mortality 4.1 Under-five mortality rate2 22 19 21 4.2 Infant mortality rate2 19 16 17 4.3 Percentage of children age one immunized against measles 94.9 93.9 94.4
5. Improve maternal health 5.2 Percentage of births attended by skilled health personnel3 na na 99.6 5.3 Contraceptive prevalence rate4 na 61.2 na 5.4 Adolescent birth rate5 na 25.6 na 5.5 Antenatal care coverage 5.5a At least one visit6 na 99.1 na 5.5b Four or more visits7 na 94.5 na 5.6 Unmet need for family planning na 11.7 na
6. Combat HIV/AIDS, malaria, and other diseases 6.3 Percentage of the population age 15-24 with comprehensive correct knowledge
of HIV/AIDS8 na 8.6 na 6.4 Ratio of school attendance of orphans to school attendance of non-orphans age
10-14 1.03 0.55 0.80
Urban Rural Total
7. Ensure environmental sustainability 7.8 Percentage of population using an improved water source9 99.4 95.9 98.8 7.9 Percentage of population using an improved sanitation facility10 99.9 100.0 99.9
na = Not applicable 1 Proportion of children age 0-59 months who are below -2 standard deviations from the median of the WHO Child Growth Standards in weight-for-age. 2 Expressed in terms of deaths per 1,000 live births. Mortality by sex refers to a 10-year reference period preceding the survey. Mortality rates for males and females combined refer to the 5-year period preceding the survey. 3 Among births in the five years preceding the survey. 4 Percentage of currently married women age 15-49 using any method of contraception. 5 Equivalent to the age-specific fertility rate for women age 15-19 for the 3-year period preceding the survey, expressed in terms of births per 1,000 women age 15-19. 6 With a skilled provider. 7 With any health care provider. 8 Comprehensive knowledge means knowing that consistent use of a condom during sexual intercourse and having just one uninfected faithful partner can reduce the chance of getting the AIDS virus, knowing that a healthy-looking person can have the AIDS virus, and rejecting the two most common local misconceptions about transmission or prevention of the AIDS virus. 9 Percentage of de jure population whose main source of drinking water is a household connection (piped), public tap or standpipe, tubewell or borehole, protected dug well, protected spring, rainwater collection, or bottled water. 10 Percentage of de jure population whose household has a flush toilet, ventilated improved pit latrine, pit latrine with a slab, or composting toilet and does not share this facility with other households.

xvi • Map of Jordan

Introduction • 1
INTRODUCTION 1
1.1 HISTORY, GEOGRAPHY, AND ECONOMY
ordan, one of the most modern countries in the Middle East, was part of the Ottoman Empire until the end of World War I. It was declared a political entity known as Transjordan under the mandate of the British government in 1923, until it gained independence and was declared a kingdom in 1946. In
1950, Transjordan and the West Bank were united and assumed the current name of the Hashemite Kingdom of Jordan. The next major change for the kingdom came in 1967, when the occupation of the West Bank and Gaza Strip by Israeli forces caused a massive wave of migrants to flow into the East Bank. Two decades later, in accordance with the desires of the Arab states and the Palestinian National Authority, the West Bank was administratively disengaged from the kingdom in order to facilitate the establishment of the Palestinian state.
Geographically, Jordan is almost entirely landlocked. The port of Aqaba in the far south is Jordan’s only outlet to the sea, as Palestine and Israel separate Jordan from the Mediterranean. Saudi Arabia lies to the south and east, Iraq to the northeast, and Syria to the north. Three climatic zones characterize Jordan, running from the west to the east of the country. These include the Jordan Valley, which is largely below sea level and considered semitropical; the highlands east of the Jordan Valley, which range in elevation from 100 to 1,500 meters above sea level, and can be considered to have a Mediterranean climate; and the low-lying desert to the east of the highlands. The total area of Jordan is about 89,000 square kilometers, of which over 80 percent is characterized by semidesert conditions; however, there do exist some wetlands, including the Azraq Basin.
Administratively, the country is divided into 12 governorates, which are then grouped into three regions—the North region (Irbid, Jarash, Ajloun, and Mafraq), the Central region (Amman, Zarqa, Balqa, and Madaba), and the South region (Karak, Tafielah, Ma’an, and Aqaba). The major cities are Amman (the capital), Zarqa, and Irbid.
With regard to the economy, the Jordanian government still controls most community services; however, Jordan is moving towards a free market economy. There has been a slight shift in the economic sectoral shares of gross domestic product (GDP) in the last two decades. The share of agriculture in GDP at constant prices dropped from 7 percent in 1992 to 3 percent in 2002, and remained at 3 percent in 2012. The contribution of wholesale and retail trade, restaurants, and hotels to the GDP has not changed
J
Key Findings
• The 2012 Jordan Population and Family Health Survey (JPFHS) is a nationally representative survey of 15,190 households and 11,352 ever- married women age 15-49.
• The 2012 JPFHS is the sixth comprehensive survey conducted in Jordan as part of the worldwide Demographic and Health Surveys project.
• The primary purpose of the JPFHS is to furnish policymakers and planners with detailed information on fertility and family planning; infant and child mortality; maternal and child health; nutrition; and knowledge of HIV/AIDS and other sexually transmitted infections.
• In two-thirds of the selected households, women age 15-49 and children age 6-59 months were weighed and measured and tested for anemia.

2 • Introduction
significantly; these sectors made up 9 percent of GDP in 1992 and 10 percent in 2012. There was a concomitant rise in the share of the manufacturing sector, from 12 percent in 1992 to 16 percent in 2002 and 17 percent in 2012. The share of the community and personal services sector also rose slightly during this period, from 2 percent in 1992 to 4 percent in 2012. The contribution of the transportation, storage, and communication sector to the GDP has changed little over the past 20 years, rising about 2 percentage points between 1992 and 2002, and was 15 percent in 2012 (Department of Statistics [DoS], 2013a).
The GDP per capita at current prices has risen steadily over time from US$ 1,381 in 1992 to US$ 1,880 in 2002, to an average of US$ 4,850 in 2012. The cost of living index increased, by 20 percent between 1992 and 1997, 8 percent between 1997 and 2002, and 36 percent between 2006 and 2012. The balance of trade deficit rose sharply, by 72 percent between 1990 and 1996, but declined by 14 percent between 1997 and 2001. While the deficit rose by 86 percent between 2002 and 2004 and remained stable between 2006 and 2012, it reached about 30 percent between 2004 and 2006. The rate of economic growth at constant prices has increased steadily over time: growth was 3.3 percent in 1997, 5.8 percent in 2002, 8.1 percent in 2006, and 2.7 percent in 2012 (DoS, 2013a).
To restructure economic activities in the country, the government began a reformation program in the early 1990s. Since the mid-1990s, the government has actively encouraged the privatization of certain community services as part of the program, and in 2000 issued the Privatization Act No. 25 to establish the legal and institutional framework for privatization in Jordan. The government has launched the process of integration and consolidation in the world economy by joining the World Trade Organization, signing a free trade agreement with the United States, a partnership agreement with the European Union, the Greater Arab Free Trade Agreement, and the Qualified Industrial Zones Agreement. The government has also established several development areas, such as the Aqaba Special Economic Zone Authority. The government has launched initiatives to fairly distribute the earnings generated from the progress made in the economic sector among all citizens through the Socioeconomic Transition Program, the E-government Initiative, the National Agenda, and the All of Us: the Jordan Initiative. Private local and foreign investments have significantly increased, reaching levels never previously achieved, as a result of continued implementation of privatization programs and a healthy environment for investment. The government, in response to the directives of His Majesty, the King of Jordan, has expanded the provision of decent housing for tens of thousands of poor and low-income households.
1.2 POPULATION
The first comprehensive population census in Jordan was carried out in 1961. The population then totaled 901,000 (Table 1.1). As a result of the Arab-Israeli wars in 1948 and 1967, and the subsequent Israeli occupation of the West Bank and the Gaza Strip, a large number of Palestinians moved into the East Bank. In 1979, the population of Jordan numbered 2.1 million; it nearly doubled to 4.1 million by 1994. According to the 2004 census, the population was 5.1 million, while it is estimated to have reached 6.3 million in 2012 (DoS, 2013b).
Table 1.1 Basic demographic indicators
Demographic indicators from selected sources, Jordan
Indicators 1961
census 1979
census 1994
census 2004
census 2012
estimates
Population (millions) 0.9 2.1 4.1 5.1 6.3 Intercensal growth rate (percent) u 4.8 4.4 2.6 2.2 Density (population/km2) 10.1 24 46.6 60.3 71.9 Percent urban 59.1 70.0 78.7 82.6 82.6 Life expectancy (years) u u 69.3 71.5 73.0
Male u u 68.5 70.6 71.6 Female u u 69.2 72.4 74.1
Source: Department of Statistics, 1997; Department of Statistics, 2006; Department of Statistics, 2013a; Department of Statistics, 2013b. u = No information

Introduction • 3
Population growth averaged 4.8 percent during the period 1961-1979, 4.4 percent between 1979 and 1994, 2.6 percent between 1994 and 2004, and 2.2 percent between 2004 and 2012 (DoS, 2013b). The high rates of growth have been due to the influx of immigrants to the East Bank from the West Bank and Gaza Strip in the late 1960s, the inflow of large numbers of foreign workers, the high rate of natural increase, and the return of about 300,000 Jordanians from the Gulf States as a result of the 1990 Gulf Crisis, as well as the return of some tens of thousands of Jordanians and the migration of hundreds of thousands of Iraqis as a result of the 2003 Second Gulf War. The rapid increase in the population has created several problems for the country—namely, shortages in food, water, housing and employment opportunities, as well as placing a heavy burden on the education system, health services, and urban infrastructure. Fertility declines in Jordan have contributed to a slowing down in the population growth rate from 3.2 percent in the second half of the 1990s, to 2.3 percent in 2007, and to 2.2 percent in 2012. The average size of private households decreased from 6.7 persons in 1979 to 6.0 persons in 1994 and to 5.4 persons in 2004. In 2012, the average is estimated at about 5.2 persons (DoS, 2013b).
Urbanization is particularly important in Jordan. Historically, rural-to-urban migration, as well as immigration, has contributed to rapid urban growth. The recent international crises in Iraq and Syria have also impacted urban growth in Jordan. The percentage of the population living in urban areas increased by 13 percent between 1979 and 1994, reaching 83 percent in 2004 and remaining there in 2012, about a 5 percent increase compared to 1994.
In 1994, the life expectancy was 69 years for males and females. This increased to 71 years for males and 72 years for females in 2004. In 2012, the estimated life expectancy was 72 years for males and 74 years for females (DoS, 2013b).
1.3 POPULATION AND FAMILY PLANNING POLICIES AND PROGRAMS
Until the 1990s, Jordan had no explicit and official population policy. In 1973, the National Population Commission (NPC) was established, with the mandate to formulate and implement a national population policy and to address all population-related activities. However, the designing of a satisfactory population policy was controversial and, due to its sensitive nature, the NPC took no specific actions. The commission was revitalized in the late 1980s to backstop several agencies working in the population field. From that period until 1993, both public and private sectors made clear efforts to provide family planning services. The Ministry of Health (MoH), through its Mother and Child Health Centers (MCH) located in the governorates, provided optional and predominantly free family planning services as an unofficial and indirect intervention. The efforts made by the Jordan Association of Family Planning and Protection (JAFPP), as well as by some voluntary nongovernmental organizations, were invaluable in this regard.
The first initiative for a proposed population policy was taken in 1993, when the NPC adopted the National Birth Spacing Program, in an effort to promote better maternal and child health and to reduce fertility through advocating increased birth intervals. This program was discussed nationwide and, in 1993, the government approved the program as an official population policy, taking into consideration the religious, social, national, and free-choice dimensions of Jordanian society.
The NPC created the National Population Strategy for Jordan, which was approved by the cabinet in 1996 and was updated in 2000 in the light of regional and international recommendations and national surveys. The strategy document comprised four main dimensions—namely, reproductive health, population and sustainable development, gender equality and equity and empowerment of women, and population and enhancing advocacy (Higher Population Council, 2013).
This updated strategy was activated by the establishment of the Higher Population Council (HPC) at the beginning of 2002, designed to face the population and development challenges and follow up on the implementation of the work plan. This council is headed by the Prime Minister and is comprised of several ministers, in addition to relevant members from both the public and private sectors. The HPC continues the work of the NPC, as it is the higher authority commissioned with proposing and formulating national

4 • Introduction
population policies, following up, presenting, updating, and providing the supporting environment for achieving its objectives. This is in line with the national socioeconomic plans, the socioeconomic transition program, and the National Agenda of Jordan.
The HPC works toward the promotion of public awareness in population and development issues and enhances advocacy in these areas. The HPC collaborates and coordinates with regional and international bodies interested in population issues, in addition to building national capacities for officials working in these areas in different institutions.
1.4 HEALTH PRIORITIES AND PROGRAMS
The Ministry of Health (MoH) is responsible for all health matters in the Hashemite Kingdom of Jordan according to the Public Health Law No. 47 of 2008. Its tasks include the provision of primary health care services (preventive health services) and secondary and tertiary health care services. Additionally, the MoH organizes health services provided by the public and private sectors, provides health insurance for Jordanian citizens, and establishes educational and health training institutes to support the health sector with graduates specialized in medical occupations.
In light of the challenges facing the health sector, the MoH has prepared a National Health Strategy for the years 2008-2012 and the years 2013-2017, in line with the comprehensive development goals stated in the National Agenda Document (MoH, 2013). Executive plans, programs, and policies from these strategy documents mainly focus on the following areas:
• Primary Healthcare
The main goals include enhancement of healthy lifestyle patterns (such as physical activity, tobacco prevention, and following safe nutrition habits), enhancement of reproductive health services and child health, decreasing chronic disease prevalence and its complications, improvement of mother and child nutrition status, and improvement of first aid and emergency care.
Its goals also include maintaining a low prevalence of HIV/AIDS and sexually transmitted infections; strengthening diseases and epidemics monitoring systems, setting up programs for screening for hereditary diseases among newborns, adding micronutrients to flour (flour fortification), fighting prevailing diseases and maintaining high vaccination coverage, introducing new vaccines to vaccination programs, and providing early diagnosis, evaluation, and health insurance coverage to those with special needs.
• Human Resources Management
Capacity building of staff is receiving considerable attention by the MoH. Activities include training courses (both internal and external) and on-the-job training and scholarships aimed at maintaining the provision of high-quality services.
• Secondary and Tertiary Care
MoH hospitals located in the governorates and districts provide basic curative health care services, such as medication disbursement, rehabilitation, and blood transfusions through the National Blood Bank.
The positive effects of these services are reflected in the decreases in child mortality and maternal mortality rates and increases in the life expectancy at birth for both sexes.
Introduction • 5
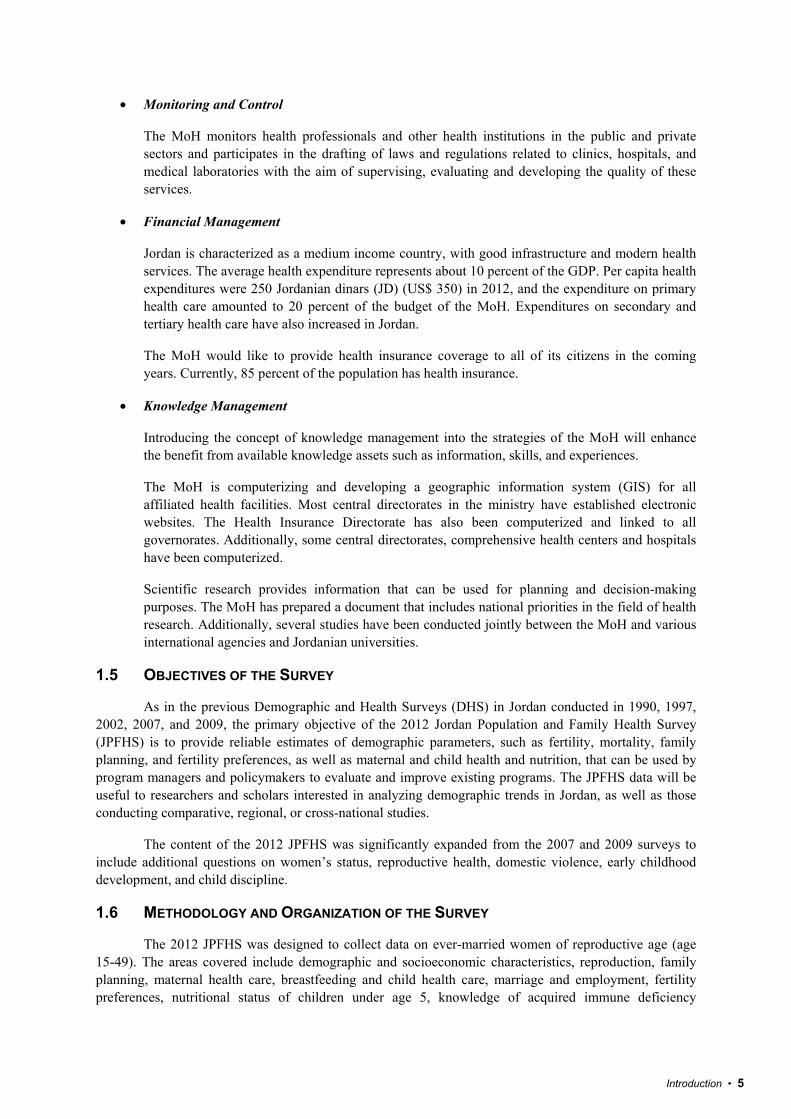
• Monitoring and Control
The MoH monitors health professionals and other health institutions in the public and private sectors and participates in the drafting of laws and regulations related to clinics, hospitals, and medical laboratories with the aim of supervising, evaluating and developing the quality of these services.
• Financial Management
Jordan is characterized as a medium income country, with good infrastructure and modern health services. The average health expenditure represents about 10 percent of the GDP. Per capita health expenditures were 250 Jordanian dinars (JD) (US$ 350) in 2012, and the expenditure on primary health care amounted to 20 percent of the budget of the MoH. Expenditures on secondary and tertiary health care have also increased in Jordan.
The MoH would like to provide health insurance coverage to all of its citizens in the coming years. Currently, 85 percent of the population has health insurance.
• Knowledge Management
Introducing the concept of knowledge management into the strategies of the MoH will enhance the benefit from available knowledge assets such as information, skills, and experiences.
The MoH is computerizing and developing a geographic information system (GIS) for all affiliated health facilities. Most central directorates in the ministry have established electronic websites. The Health Insurance Directorate has also been computerized and linked to all governorates. Additionally, some central directorates, comprehensive health centers and hospitals have been computerized.
Scientific research provides information that can be used for planning and decision-making purposes. The MoH has prepared a document that includes national priorities in the field of health research. Additionally, several studies have been conducted jointly between the MoH and various international agencies and Jordanian universities.
1.5 OBJECTIVES OF THE SURVEY
As in the previous Demographic and Health Surveys (DHS) in Jordan conducted in 1990, 1997, 2002, 2007, and 2009, the primary objective of the 2012 Jordan Population and Family Health Survey (JPFHS) is to provide reliable estimates of demographic parameters, such as fertility, mortality, family planning, and fertility preferences, as well as maternal and child health and nutrition, that can be used by program managers and policymakers to evaluate and improve existing programs. The JPFHS data will be useful to researchers and scholars interested in analyzing demographic trends in Jordan, as well as those conducting comparative, regional, or cross-national studies.
The content of the 2012 JPFHS was significantly expanded from the 2007 and 2009 surveys to include additional questions on women’s status, reproductive health, domestic violence, early childhood development, and child discipline.
1.6 METHODOLOGY AND ORGANIZATION OF THE SURVEY
The 2012 JPFHS was designed to collect data on ever-married women of reproductive age (age 15-49). The areas covered include demographic and socioeconomic characteristics, reproduction, family planning, maternal health care, breastfeeding and child health care, marriage and employment, fertility preferences, nutritional status of children under age 5, knowledge of acquired immune deficiency

6 • Introduction
syndrome (AIDS) and sexually transmitted infections (STIs), domestic violence, early childhood development, and child discipline.
The survey was implemented by the Department of Statistics (DoS) and funded by the Jordanian government and the U.S. Agency for International Development (USAID). Additional funding was provided by UNFPA and UNICEF. ICF International provided technical assistance, through the global Demographic and Health Surveys (DHS) program, in sample and questionnaire design, training activities, computer processing of survey data, and preparation of reports. A national technical committee was established to provide guidelines for the planning and implementation stages of the survey. The committee consisted of representatives from various government and non-government agencies involved in population and health issues.
The survey was executed in three stages; the first was the preparatory stage, which involved sample design, mapping, listing of households, and implementation of sampling procedures. At the same time, the survey questionnaires and instruction manuals were developed, pretested, and finalized. All of these activities were completed by August 2012. The second stage encompassed interviewing and the collection of data, while the third stage involved office editing of questionnaires, coding of open-ended questions, ensuring data completion and data consistency, data processing operations, final editing, and verification of data accuracy and consistency.
1.6.1 Sample Design
The 2012 JPFHS sample was designed to produce reliable estimates of major survey variables for the country as a whole, urban and rural areas, each of the 12 governorates, and for the two special domains: the Badia areas and people living in refugee camps. To facilitate comparisons with previous surveys, the sample was also designed to produce estimates for the three regions (North, Central, and South). The grouping of the governorates into regions is as follows: the North consists of Irbid, Jarash, Ajloun, and Mafraq governorates; the Central region consists of Amman, Madaba, Balqa, and Zarqa governorates; and the South region consists of Karak, Tafiela, Ma’an, and Aqaba governorates.
The 2012 JPFHS sample was selected from the 2004 Jordan Population and Housing Census sampling frame. The frame excludes the population living in remote areas (most of whom are nomads), as well as those living in collective housing units such as hotels, hospitals, work camps, prisons, and the like. For the 2004 census, the country was subdivided into convenient area units called census blocks. For the purposes of the household surveys, the census blocks were regrouped to form a general statistical unit of moderate size (30 households or more), called a “cluster”, which is widely used in surveys as a primary sampling unit (PSU).
Stratification was achieved by first separating each governorate into urban and rural areas and then, within each urban and rural area, by Badia areas, refugee camps, and other. A two-stage sampling procedure was employed. In the first stage, 806 clusters were selected with probability proportional to the cluster size, that is, the number of residential households counted in the 2004 census. A household listing operation was then carried out in all of the selected clusters, and the resulting lists of households served as the sampling frame for the selection of households in the second stage. In the second stage of selection, a fixed number of 20 households was selected in each cluster with an equal probability systematic selection. A subsample of two-thirds of the selected households was identified for anthropometry measurements. The sample design is described in Appendix A, and sampling errors are presented in Appendix B.
1.6.2 Updating of Sampling Frame
Prior to the main fieldwork, mapping operations were carried out and the sample clusters were selected and then identified and located in the field. The selected clusters were delineated and the outer boundaries were mapped. During this process, the numbers on buildings and housing units were updated,

Introduction • 7
listed, and documented, along with the name of the household head. These activities were completed during the second quarter of 2012.
1.6.3 Questionnaires
The 2012 JPFHS used two questionnaires, namely the Household Questionnaire and the Woman’s Questionnaire (see Appendix D). The Household Questionnaire was used to list all usual members of the sampled households, and visitors who slept in the household the night before the interview, and to obtain information on each household member’s age, sex, educational attainment, relationship to the head of the household, and marital status. In addition, questions were included on the socioeconomic characteristics of the household, such as source of water, sanitation facilities, and the availability of durable goods. Moreover, the questionnaire included questions about child discipline. The Household Questionnaire was also used to identify women who were eligible for the individual interview (ever-married women age 15-49 years). In addition, all women age 15-49 and children under age 5 living in the subsample of households were eligible for height and weight measurement and anemia testing.
The Woman’s Questionnaire was administered to ever-married women age 15-49 and collected information on the following topics:
• Respondent’s background characteristics • Birth history • Knowledge, attitudes, and practice of family planning and exposure to family planning
messages • Maternal health (antenatal, delivery, and postnatal care) • Immunization and health of children under age 5 • Breastfeeding and infant feeding practices • Marriage and husband’s background characteristics • Fertility preferences • Respondent’s employment • Knowledge of AIDS and sexually transmitted infections (STIs) • Other health issues specific to women • Early childhood development • Domestic violence
In addition, information on births, pregnancies, and contraceptive use and discontinuation during
the five years prior to the survey was collected using a monthly calendar.
The Household and Woman’s Questionnaires were based on the model questionnaires developed by the MEASURE DHS program. Additions and modifications to the model questionnaires were made in order to provide detailed information specific to Jordan. The questionnaires were then translated into Arabic.
Anthropometric data were collected during the 2012 JPFHS in a subsample of two-thirds of the selected households in each cluster. All women age 15-49 and children age 0-4 in these households were measured for height using Shorr height boards and for weight using electronic Seca scales. In addition, a drop of capillary blood was taken from these women and children in the field to measure their hemoglobin level using the HemoCue system. Hemoglobin testing was used to estimate the prevalence of anemia.
1.6.4 Recruitment of Staff
Different supervisory and executive levels of survey staff members were recruited according to specific criteria, such as experience, educational and personal qualifications, and familiarity with geographic areas. Fieldworkers for the main survey were recruited from among those who participated in

8 • Introduction
the many surveys as well as those who took part in other demographic surveys conducted by the DoS, especially the 2007 and 2009 JPFHS. The interviewers were all highly qualified women. Supervisors and field editors were selected from the DoS permanent staff or from those with experience in such surveys.
1.6.5 Pretest and Training
Training of the interviewers for the pretest and main fieldwork survey took place in Amman in two phases—July 26 to August 16, 2012, and August 26 to September 2, 2012—for four weeks. The training course consisted of instructions on interviewing techniques and field procedures, a detailed review of the questionnaires, instruction and practice in weighing and measuring children and women, anemia testing, mock interviews between participants in the classroom, and practice interviews. Field practice in anemia testing was also carried out by persons who were assigned as team health technicians. In addition, team members practiced their ability to weigh and measure women and children in health centers affiliated with the Ministry of Health (Amman Comprehensive Health Center, Abu Nsair Comprehensive Health Center, and Sahab Comprehensive Health Center). Prior to the start of fieldwork, the questionnaires were pretested to make sure that the translation into Arabic were clear and could be understood by the respondents. The pretest fieldwork was conducted over a period of one week from September 2 to September 6 in three urban and one rural cluster not selected for the main survey. Following the completion of pretest, debriefing sessions were held with the field staff and modifications to the questionnaires and instructions were made based on lessons drawn from the exercise. Also during this period, field editors and team supervisors were provided with additional training in methods of field editing, data quality control procedures, and fieldwork coordination.
1.6.6 Main Fieldwork
The fieldwork was organized to ensure control over field logistics by DoS field offices all over the country. The workload, the dispersion of sample units, and transportation facilities served as criteria for identifying the number of field staff in each area. The field staff consisted of 26 field teams, each made up of one supervisor, one field editor, one biomarker technician, and three to four interviewers; two field coordinators supervised the 26 teams. During field work, these teams were combined or reformulated as necessary. Fieldwork was carried out between 9 September and 20 December, 2012.
To facilitate data collection, each interviewing team was assigned a number of clusters in the sample area. Each field supervisor, in collaboration with the field coordinator, divided his team so as to ensure that all adjacent sampled households were completed by one interviewer. To ensure good data quality, interviewers were asked to conduct fewer interviews during the first three days of data collection; the completed questionnaires were then checked by the field editor and the supervisor to ensure completeness and consistency of data. Under the supervision of the survey director and field coordinators, the field editor and the supervisor conducted spot checks by randomly visiting some sampled households and reinterviewing respondents with the household schedule. The original questionnaires were then matched to the reinterview questionnaires, and any differences were discussed with the interviewer and reconciled where necessary.
Interviewers made at least three call backs to attempt to successfully complete the interview of eligible women. Once a cluster was finished, the questionnaires were delivered to the DoS central office in Amman for processing.
1.6.7 Data Processing
Fieldwork and data processing activities overlapped. Data processing began two weeks after the start of the fieldwork. After field editing of questionnaires for completeness and consistency, the questionnaires for each cluster were packaged together and sent to the central office in Amman, where they were registered and stored. Special teams were formed to carry out office editing and coding of the open-ended questions.

Introduction • 9
Data entry and verification started after two weeks of office data processing. The process of data entry, including 100 percent reentry, editing, and cleaning, was done by using PCs and the CSPro (Census and Survey Processing) computer package, developed specially for such surveys. The CSPro program allows data to be edited while being entered. Data processing operations were completed by early January 2013. A data processing specialist from ICF International made a trip to Jordan in February 2013 to follow up on data editing and cleaning and to work on the tabulation of results for the survey preliminary report, which was published in March 2013. The tabulations for this report were completed in April 2013.
1.7 RESULTS OF THE HOUSEHOLD AND INDIVIDUAL INTERVIEWS
Table 1.2 is a summary of the results from both the household and the individual interviews. In all, 16,120 households were selected for the survey and, of these, 15,722 were found to be occupied households. Of these households, 15,190 (97 percent) were successfully interviewed.
In the households interviewed, 11,673 ever-married women age 15-49 were identified and interviews were completed with 11,352 women, or 97 percent of all eligible women.
Table 1.2 Results of the household and individual interviews
Number of households, number of interviews, and response rates, according to residence (unweighted), Jordan 2012
Result
Residence
Total Urban Rural
Household interviews Households selected 11,480 4,640 16,120 Households occupied 11,161 4,561 15,722 Households interviewed 10,727 4,463 15,190
Household response rate (HRR)1 96.1 97.9 96.6
Interviews with women age 15-49 Number of eligible women 8,296 3,377 11,673 Number of eligible women interviewed 8,034 3,318 11,352
Eligible women response rate2 96.8 98.3 97.3 Overall women response rate (EWRR)3 93.1 96.1 94.0
1 Households interviewed/households occupied. 2 Respondents interviewed/eligible respondents. 3 HRR * EWRR/100.


Household Characteristics • 11
HOUSEHOLD CHARACTERISTICS 2
his chapter provides an overview of socioeconomic characteristics of the household population, including housing facilities and characteristics, sources of drinking water, sanitation facilities, availability of electricity, and possession of household durable goods. Information on household
assets is used to create an indicator of household economic status—the wealth index. This chapter also describes the demographic characteristics of the household population, including age, sex, educational attainment, and employment status.
In the 2012 Jordan Population and Family Health Survey (JPFHS), information was collected about all usual residents of a selected household (de jure population) as well as persons who stayed in the selected household the night before the interview (de facto population). The difference between these two populations is very small, and all tables in this report refer to the de facto population, unless otherwise specified, to maintain comparability with other JPFHS reports.
2.1 HOUSING CHARACTERISTICS
Water and Sanitation
Access to safe water and sanitation are basic determinants of better health. Limited access to safe drinking water and sanitation facilities and poor hygiene are associated with acute respiratory infections (ARIs) and diarrheal diseases.
Table 2.1 presents information on household drinking water by urban-rural residence. Access to an improved source of drinking water is universal in Jordan (99 percent). The table also indicates that 49 percent of households in urban areas use piped water compared with 52 percent in rural areas. Five percent of households in urban areas use rainwater compared with 13 percent of households in rural areas. About half of urban households (46 percent) and 31 percent of rural households use bottled water for drinking. Overall, all households in urban areas, compared with 96 percent in rural areas, use an improved source of water for drinking. Some households treat their water to make it safe for drinking. The table indicates that 1 percent of households in urban areas and 2 percent in rural areas boil water, whereas 25 percent of households in urban areas and 15 percent in rural areas use water filters for water purification. Nationally, 25 percent of households use an appropriate water treatment method. Rural households are much less likely than urban households to treat their water appropriately (17 percent and 26 percent, respectively). Table 2.2 shows that almost all households in Jordan have a private flush toilet, with little variation by place of residence.
T
Key Findings
• Access to safe drinking water is universal in Jordan (99 percent). • Almost all households in Jordan have a private flush toilet, with little
variation by place of residence. • More than half of households in Jordan own a private car or truck. • Fifty-eight percent of households are exposed daily to secondhand
smoke. • A large proportion of the Jordanian population (36 percent) is under age
15. • Thirteen percent of households are female-headed. • Ninety-nine percent of births in Jordan are registered.

12 • Household Characteristics
Table 2.1 Household drinking water
Percent distribution of households and de jure population by source of drinking water and treatment of drinking water, according to residence, Jordan 2012
Characteristic
Households Population
Urban Rural Total Urban Rural Total
Source of drinking water Improved source 99.5 96.2 98.9 99.4 95.9 98.8
Piped into dwelling 48.9 51.7 49.4 52.3 53.7 52.5 Piped to yard/plot 0.1 0.7 0.2 0.2 0.7 0.3 Rainwater 4.8 13.1 6.2 4.8 12.2 6.1 Bottled water 45.6 30.7 43.1 42.2 29.3 39.9
Non-improved source 0.5 3.8 1.1 0.6 4.1 1.2 Unprotected spring 0.2 1.9 0.4 0.2 1.8 0.5 Tanker truck 0.4 1.9 0.6 0.4 2.3 0.8
Total 100.0 100.0 100.0 100.0 100.0 100.0
Water treatment prior to drinking1 Boiled 1.1 1.6 1.2 1.0 1.6 1.1 Bleach/chlorine added 0.4 0.2 0.3 0.4 0.2 0.4 Water filter 24.9 15.0 23.3 26.4 16.1 24.6 Other 0.1 0.1 0.1 0.1 0.1 0.1 No treatment 73.5 83.2 75.1 72.0 82.1 73.8
Percentage using an appropriate treatment method2 26.4 16.7 24.8 27.9 17.8 26.1
Number 12,660 2,530 15,190 63,281 13,640 76,920 1 Respondents may report multiple treatment methods, so the sum of treatment may exceed 100 percent. 2 Appropriate water treatment methods include boiling, bleaching, straining, filtering, and solar disinfecting.
Table 2.2 Household sanitation facilities
Percent distribution of households and de jure population by type of toilet/latrine facilities, according to residence, Jordan 2012
Type of toilet/latrine facility Households Population
Urban Rural Total Urban Rural Total
Improved, not shared facility 99.8 99.5 99.7 99.7 99.6 99.7 Flush/pour flush to piped sewer system 71.3 4.8 60.2 68.5 4.9 57.2 Flush/pour flush to pit latrine 28.4 94.1 39.3 31.1 94.2 42.3 Ventilated improved pit (VIP) latrine 0.0 0.4 0.1 0.0 0.3 0.1 Pit latrine with slab 0.0 0.2 0.1 0.0 0.2 0.1
Shared facility1 0.2 0.4 0.2 0.2 0.3 0.3
Non-improved facility 0.0 0.1 0.0 0.1 0.0 0.1
Total 100.0 100.0 100.0 100.0 100.0 100.0 Number 12,660 2,530 15,190 63,281 13,640 76,920 1 Facilities that would be considered improved if they were not shared by two or more households.
Housing Characteristics
In the 2012 JPFHS, information on housing characteristics was collected in the household questionnaire. Table 2.3 indicates that more than three-quarters of housing units (77 percent) in urban areas are apartments, compared with more than one-third (35 percent) in rural areas. Dars, which are homes that are built with an enclosed central courtyard, form 64 percent of the dwellings in rural areas, compared with only 21 percent in urban areas. In general, 99 percent of all housing units in Jordan are either apartments or dars.
Table 2.3 indicates that access to electricity is universal in Jordan (100 percent), with no difference by place of residence.

Household Characteristics • 13
Table 2.3 shows that the vast majority (79 percent) of households in Jordan have tile flooring, with urban areas slightly less likely than rural households to have tile flooring (78 and 85 percent, respectively). On the other hand, urban households are more than twice as likely (18 percent) as rural households (7 percent) to have marble or ceramic tile flooring. Cement flooring is much more common in rural than urban households. The table also indicates that three-quarters of dwellings have walls built from cement bricks and about one in five dwellings have walls built from cut stone or cut stone and concrete (22 percent). Walls of dwellings are more likely to be built from cement bricks in rural areas than in urban areas (87 and 73 percent, respectively). Conversely, dwellings in urban areas are more likely to be built from cut stone or cut stone and concrete than those in rural areas (25 percent versus 8 percent). Almost all households in Jordan have concrete roofs (99 percent).
More than two-fifths of housing units (41 percent) have two or three rooms and more than one in two (51 percent) have four or five rooms, with 6 percent having six or more rooms; only 2 percent of housing units consist of one room. There are only slight differences in the number of rooms in a housing unit by place of residence. As for rooms used for sleeping, one in five housing units (23 percent) has one sleeping room, more than two-fifths (41 percent) have two, and about one-third (36 percent) have three sleeping rooms, with slight differences by place of residence.
The data also indicate that almost all households in Jordan have a separate room used as a kitchen (99 percent) and a separate bathroom (99 percent). In addition, nearly all households use natural gas for cooking regardless of the place of residence.
Information on smoking was collected in the 2012 JPFHS to assess the percentage of household members who are exposed to secondhand smoke (SHS), which is a risk factor for those who do not smoke. Pregnant women who are exposed to SHS have a higher risk of giving birth to a low birth weight baby (Windham et al., 1999). Also, children who are exposed to SHS are at a higher risk of respiratory and ear infections and poor lung development (U.S. Department of Health and Human Services, 2006). Table 2.3 provides information on the frequency of smoking in the home, which is used as a proxy for level of SHS exposure. Overall, 58 percent of households are exposed daily to SHS, with small differences by place of residence.

14 • Household Characteristics
Table 2.3 Household characteristics
Percent distribution of households by housing characteristics and frequency of smoking in the home, according to residence, Jordan 2012
Housing characteristic Residence
Total Urban Rural
Type of housing unit Apartment 77.3 35.0 70.3 Dar 21.1 64.2 28.2 Villa 1.6 0.8 1.5 Hut/barrack 0.0 0.1 0.0
Total 100.0 100.0 100.0
Electricity Yes 99.5 99.4 99.5 No 0.5 0.6 0.5
Total 100.0 100.0 100.0
Flooring material Earth 0.0 0.2 0.1 Parquet or polished wood 0.1 0.2 0.1 Tile 77.5 84.6 78.7 Marble/ceramic tile 18.4 7.4 16.6 Cement 3.9 7.6 4.5
Total 100.0 100.0 100.0
Main wall material Cement bricks 72.5 86.7 74.9 Cut stone 20.5 5.3 18.0 Cut stone and concrete 4.6 2.8 4.3 Concrete 2.1 4.6 2.5 Other 0.3 0.7 0.4
Total 100.0 100.0 100.0
Main roof material Concrete 99.0 98.9 99.0 Other 1.0 1.1 1.0
Total 100.0 100.0 100.0
Rooms in the house 1 1.6 1.5 1.6 2 10.4 10.4 10.4 3 30.9 29.1 30.6 4 30.2 34.1 30.9 5 20.7 17.6 20.2 6 or more 6.1 7.3 6.3
Total 100.0 100.0 100.0
Rooms used for sleeping 1 22.4 24.6 22.8 2 41.1 40.1 40.9 3 or more 36.5 35.3 36.3
Total 100.0 100.0 100.0
Has separate bathroom Yes 99.5 98.7 99.4 No 0.5 1.3 0.6
Total 100.0 100.0 100.0
Has separate room used as kitchen Yes 99.3 98.4 99.2 No 0.7 1.6 0.8
Total 100.0 100.0 100.0
Cooking fuel Natural gas 99.9 99.6 99.8 Other 0.1 0.4 0.2
Total 100.0 100.0 100.0
Frequency of smoking in the home Daily 57.3 58.2 57.5 Weekly 2.2 1.6 2.1 Monthly 0.6 0.4 0.5 Less than monthly 0.2 0.2 0.2 Never 39.7 39.6 39.7
Total 100.0 100.0 100.0 Number 12,660 2,530 15,190

Household Characteristics • 15
Household Possessions
Jordan is a modern society, and most of the population enjoys the convenience of electrical appliances. Table 2.4 indicates that almost all households have a television, a refrigerator, a washing machine, and a satellite.
Table 2.4 Household possessions
Percentage of households possessing various household effects and means of transportation, by residence, Jordan 2012
Possession
Residence
Total Urban Rural
Household effects Bed or sofa bed 84.6 70.1 82.2 Radio 39.1 27.8 37.3 Television 99.2 98.3 99.1 Mobile telephone 98.6 97.8 98.4 Land telephone 21.7 9.5 19.7 Refrigerator 98.4 97.8 98.3 Satellite 98.7 97.4 98.5 Freezer 18.0 10.2 16.7 Washing machine 97.7 96.3 97.4 Dishwasher 2.2 0.6 1.9 Solar heater 15.7 8.6 14.5 Air conditioner 28.1 15.9 26.1 Fan 93.3 90.0 92.7 Water cooler 45.9 25.2 42.4 Microwave 52.7 33.2 49.4 Digital camera 12.7 5.0 11.4 Computer 59.1 44.1 56.6 Internet access at home 44.7 32.1 42.6 Credit card 9.8 2.8 8.6
Means of transport Car/truck 51.6 54.1 52.0
Number 12,660 2,530 15,190
As further testament to the level of development in Jordan, possession of mobile phones has
increased from 90 percent of households in 2007 to 98 percent in 2012. The data also indicate that 57 percent of households own a computer, and four out of ten households (43 percent) have Internet access at home. The possession of computer-related assets varies considerably between urban and rural areas; urban households are more likely to own a computer than rural households (59 and 44 percent, respectively). Moreover, 45 percent of urban households have access to the Internet at home compared with 32 percent of rural households.
Fifteen percent of households have a solar heater. About one-quarter of households own an air conditioner, with marked differences between urban and rural households (28 and 16 percent, respectively). Eight in ten households possess beds or a sofa bed for sleeping, with significant variations by urban-rural residence (85 percent for urban areas compared with 70 percent in rural areas).
Households in urban areas are also more likely to have a water cooler (46 percent), a microwave (53 percent), and a digital camera (13 percent) than those in rural areas (25 percent, 33 percent, and 5 percent, respectively); urban households are also more likely to have a credit card than rural households (10 versus 3 percent). Of further interest is the fact that more than half of households in Jordan own a private car or truck.

16 • Household Characteristics
2.2 HOUSEHOLD WEALTH
One of the background characteristics used for analysis in this report is the household wealth index. The data required for calculating this index include household assets and property, and the index is used to represent the relative wealth of surveyed households.
The household wealth index was developed and has been used in several countries to demonstrate the unequal distribution of income, use of health services, and health outcomes (Rutstein, 1999).
The wealth index is constructed using household assets, such as the ownership of a television or a private car, as well as dwelling characteristics, such as source of drinking water; type of toilet; type of floor, wall, and roof; and other household characteristics. Each asset is assigned a weight (factor score) generated through principal components analysis, and the resulting asset scores are standardized in relation to a normal distribution with a mean of zero and standard deviation of one (Gwatkin et al., 2000). Each household is then assigned a score for each asset and the scores are summed for each household; individuals are ranked according to the score of the household in which they reside. The sample is then divided into quintiles from one (lowest) to five (highest). For this report, a single asset index was developed for the whole sample; separate indices were prepared for the urban and rural population. This classification of population by quintiles is used as a background variable in the report to assess the demographic and health outcomes in relation to socioeconomic status.
Table 2.5 shows the distribution of the household population according to wealth quintiles, from the lowest to the highest. Urban households are generally wealthier than rural households. Forty-five percent of the population in urban areas fall into either the fourth or the highest wealth quintiles, while six in ten (57 percent) people in rural areas fall into either the lowest or the second quintiles.
Table 2.5 Wealth quintiles
Percent distribution of the de jure population by wealth quintiles, and the Gini coefficient, according to place of residence, Jordan 2012
Place of residence
Wealth quintile
Total Number of persons
Gini coefficient Lowest Second Middle Fourth Highest
Residence Urban 18.4 18.0 19.0 21.2 23.4 100.0 63,281 0.15 Rural 27.7 29.2 24.6 14.6 3.9 100.0 13,640 0.06
Region Central 17.0 18.1 18.6 21.1 25.1 100.0 47,879 0.12 North 24.1 23.2 22.9 18.1 11.7 100.0 21,640 0.12 South 27.3 22.9 20.7 18.2 10.9 100.0 7,401 0.07
Governorate Amman 14.4 14.6 16.1 20.7 34.2 100.0 29,457 0.16 Balqa 23.4 23.4 18.9 21.3 13.0 100.0 5,446 0.12 Zarqa 19.7 24.1 24.2 22.8 9.3 100.0 10,853 0.13 Madaba 24.0 23.0 23.3 18.5 11.2 100.0 2,123 0.11 Irbid 18.9 20.5 24.6 21.2 14.9 100.0 13,739 0.11 Mafraq 37.4 28.4 17.7 11.0 5.5 100.0 3,882 0.12 Jarash 29.5 26.8 22.9 14.1 6.7 100.0 2,264 0.11 Ajloun 29.0 28.1 21.7 15.0 6.1 100.0 1,755 0.11 Karak 28.7 25.9 20.2 19.1 6.1 100.0 3,189 0.07 Tafiela 29.8 26.0 20.7 16.3 7.1 100.0 1,139 0.10 Ma'an 36.3 24.4 20.7 13.3 5.3 100.0 1,362 0.10 Aqaba 15.8 13.8 21.7 21.8 26.9 100.0 1,710 0.10
Badia Badia 44.0 28.6 17.9 7.0 2.5 100.0 5,001 0.10 Non Badia 18.3 19.4 20.2 20.9 21.2 100.0 71,920 0.14
Camps Camp 40.7 29.3 18.3 9.6 2.0 100.0 2,917 0.13 Non camp 19.2 19.6 20.1 20.4 20.7 100.0 74,003 0.13
Total 20.0 20.0 20.0 20.0 20.0 100.0 76,920 0.10
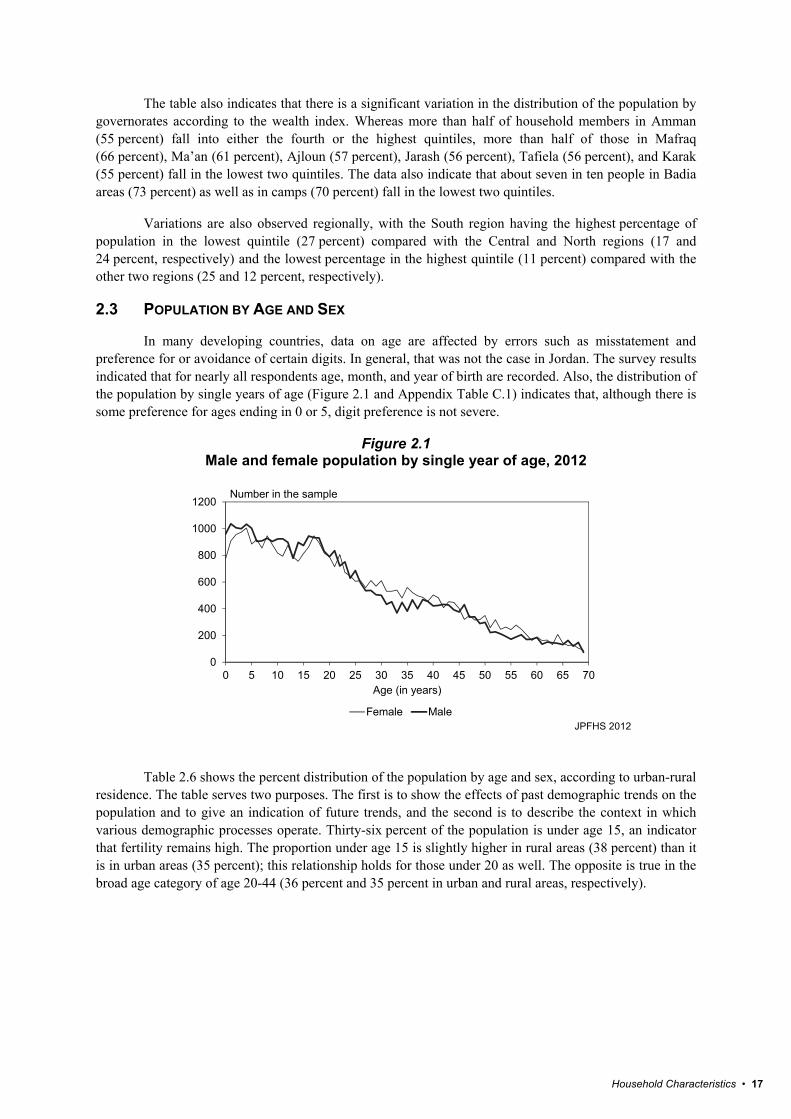
Household Characteristics • 17
The table also indicates that there is a significant variation in the distribution of the population by governorates according to the wealth index. Whereas more than half of household members in Amman (55 percent) fall into either the fourth or the highest quintiles, more than half of those in Mafraq (66 percent), Ma’an (61 percent), Ajloun (57 percent), Jarash (56 percent), Tafiela (56 percent), and Karak (55 percent) fall in the lowest two quintiles. The data also indicate that about seven in ten people in Badia areas (73 percent) as well as in camps (70 percent) fall in the lowest two quintiles.
Variations are also observed regionally, with the South region having the highest percentage of population in the lowest quintile (27 percent) compared with the Central and North regions (17 and 24 percent, respectively) and the lowest percentage in the highest quintile (11 percent) compared with the other two regions (25 and 12 percent, respectively).
2.3 POPULATION BY AGE AND SEX
In many developing countries, data on age are affected by errors such as misstatement and preference for or avoidance of certain digits. In general, that was not the case in Jordan. The survey results indicated that for nearly all respondents age, month, and year of birth are recorded. Also, the distribution of the population by single years of age (Figure 2.1 and Appendix Table C.1) indicates that, although there is some preference for ages ending in 0 or 5, digit preference is not severe.
Figure 2.1 Male and female population by single year of age, 2012
JPFHS 2012
Table 2.6 shows the percent distribution of the population by age and sex, according to urban-rural residence. The table serves two purposes. The first is to show the effects of past demographic trends on the population and to give an indication of future trends, and the second is to describe the context in which various demographic processes operate. Thirty-six percent of the population is under age 15, an indicator that fertility remains high. The proportion under age 15 is slightly higher in rural areas (38 percent) than it is in urban areas (35 percent); this relationship holds for those under 20 as well. The opposite is true in the broad age category of age 20-44 (36 percent and 35 percent in urban and rural areas, respectively).
0
200
400
600
800
1000
1200
0 5 10 15 20 25 30 35 40 45 50 55 60 65 70
Number in the sample
Age (in years)
Female Male

18 • Household Characteristics
Table 2.6 Household population by age, sex, and residence
Percent distribution of the de facto household population by five-year age groups, according to sex and residence, Jordan 2012
Age
Urban Rural Total
Male Female Total Male Female Total Male Female Total
<5 13.0 11.9 12.4 14.7 12.7 13.7 13.3 12.0 12.6 5-9 12.0 11.7 11.8 13.4 11.9 12.6 12.2 11.7 12.0 10-14 11.6 10.4 11.0 11.8 11.2 11.5 11.6 10.5 11.1 15-19 11.9 11.2 11.6 11.9 11.6 11.8 11.9 11.3 11.6 20-24 10.0 9.5 9.8 8.9 9.1 9.0 9.8 9.5 9.6 25-29 7.6 7.7 7.7 7.1 7.7 7.4 7.5 7.7 7.6 30-34 5.6 6.9 6.3 6.7 7.5 7.1 5.8 7.0 6.4 35-39 5.7 6.6 6.1 5.9 6.7 6.3 5.7 6.6 6.2 40-44 5.7 6.0 5.9 4.8 5.7 5.2 5.5 6.0 5.8 45-49 4.8 4.5 4.7 4.1 4.0 4.1 4.7 4.5 4.6 50-54 3.1 3.9 3.5 2.6 2.8 2.7 3.0 3.7 3.4 55-59 2.5 3.0 2.7 2.1 2.6 2.4 2.4 3.0 2.7 60-64 2.0 2.3 2.2 1.8 2.0 1.9 2.0 2.2 2.1 65-69 1.7 1.5 1.6 1.7 1.8 1.7 1.7 1.5 1.6 70-74 1.3 1.4 1.4 1.1 1.2 1.1 1.3 1.4 1.3 75-79 0.8 0.7 0.8 0.7 0.7 0.7 0.8 0.7 0.8 80 + 0.7 0.7 0.7 0.7 0.9 0.8 0.7 0.7 0.7
Total 100.0 100.0 100.0 100.0 100.0 100.0 100.0 100.0 100.0 Number 31,283 31,653 62,937 6,680 6,685 13,365 37,963 38,339 76,302
One may note that at the youngest ages in the population pyramid (Figure 2.2) there are more
children in the 0-4 and 5-9 age groups than in the 10-14 age group, indicating that the reduced population age 10-14 was the consequence of the fast decline in fertility in the 1990s, while the increased population in the 0-9 age group may be a result of a recent pause in the decline in fertility.
Figure 2.2
Population pyramid
8 6 4 2 0 2 4 6 8
<5
5-9
10-14
15-19
20-24
25-29
30-34
35-39
40-44
45-49
50-54
55-59
60-64
65-69
70-74
75-79
80 +
Percent
Age
Male Female
JPFHS 2012
8 6 4 2

Household Characteristics • 19
The percentage of the population under age 15 has declined substantially, from 51 percent in 1983 to 36 percent in 2012, with proportional increases in the 15-59 age group (Figure 2.3). This pattern is typical of populations that are experiencing a fertility decline (see Chapter 5 for more discussion on fertility in Jordan). The change in the age structure is favorable in economic terms. The dependency ratio, calculated as the ratio of persons in the “dependent” ages (under 15 and 60 and over) to those in the working-age category (15-59) on the basis of those figures, fell from 122 in 1983 to 73 in 2012.
Figure 2.3 Population by broad age groups, various surveys, 1983-2012
According to results from the 2012 JPFHS, there are more females than males in Jordan, with an overall sex ratio of 99 males for 100 females. The sex ratio varies by age: from 105 among those under age 30 to 87 in the middle age group (30-59) and about 98 among those age 60 and above.
2.4 HOUSEHOLD COMPOSITION
Household characteristics affect the social and economic well-being of the members of the household. Large household sizes may be associated with crowding, which can lead to unfavorable health conditions. Single-parent families, especially if they are headed by females, usually have limited financial resources.
Table 2.7 shows that the average number of members in a household is 5.1. Household size is smaller in urban areas (5.0) than in rural areas (5.4). Seven percent of households, on average, are composed of nine or more persons. The figure is higher in rural areas (10 percent) than in urban areas (7 percent). The table shows that 13 percent of households in urban areas are headed by females, compared with 12 percent in rural areas.
The table also shows that about 1 percent of households have at least one child under age 18 who doesn’t live with both parents. A very low percentage of households (0.1 percent) include double orphans (both parents deceased), while 3 percent include single orphans (one parent deceased). However, there are no significant differences among households with single orphans according to urban-rural residence.
51
4441 40 38 37 36
45
52 54 55 56 57 58
4 4 5 6 6 6 6
0
10
20
30
40
50
60
70
1983JFFHS
1990JPFHS
1997JPFHS
2002JPFHS
2007JPFHS
2009JPFHS
2012JPFHS
Percentage
Age groups
0-14 15-59 60+

20 • Household Characteristics
Table 2.7 Household composition
Percent distribution of households by sex of head of household and by household size, mean size of household, and percentage of households with orphans and foster children under 18 years of age, according to residence, Jordan 2012
Characteristic
Residence
Total Urban Rural
Household headship Male 86.9 88.1 87.1 Female 13.1 11.9 12.9
Total 100.0 100.0 100.0
Number of usual members 1 4.4 4.3 4.3 2 11.2 10.2 11.0 3 12.2 10.6 12.0 4 16.1 12.6 15.5 5 16.0 15.4 15.9 6 14.8 14.2 14.7 7 11.3 13.0 11.6 8 7.2 10.1 7.7 9+ 6.6 9.7 7.1
Total 100.0 100.0 100.0 Mean size of households 5.0 5.4 5.1
Percentage of households with orphans and foster children under 18 years of age Foster children1 1.3 1.2 1.3 Double orphans 0.1 0.2 0.1 Single orphans2 2.9 2.8 2.9 Foster and/or orphan children 4.0 3.8 3.9
Number of households 12,660 2,530 15,190
Note: Table is based on de jure household members (i.e., usual residents). 1 Foster children are those under age 18 living in households with neither their mother nor their father present. 2 Includes children with one dead parent and an unknown survival status of the other parent.
2.5 BIRTH REGISTRATION
The registration of births is the inscription of the facts of the birth into an official log kept at the registrar’s office. A birth certificate is issued at the time of registration or later as proof of registration of the birth. Birth registration is basic to ensuring a child’s legal status and, thus, basic rights and services (UNICEF, 2006; UNGASS, 2002). For the first time in the series of JPFHS surveys, the 2012 JPFHS Household Questionnaire included a question for all children under age 5 as to whether the child had a birth certificate or not.
Table 2.8 shows the percentage of children under age 5 whose births were officially registered. The data show that 99 percent of births in Jordan are registered, with birth certificates being shown to interviewers for 47 percent; for 52 percent, a birth certificate was not seen. Only a tiny fraction of births are not registered.
The proportion of children whose births are registered is above 97 percent by all background characteristics. Consequently, differentials in birth registration by background characteristics are very minor.

Household Characteristics • 21
Table 2.8 Birth registration of children under age five
Percentage of de jure children under five years of age whose births are registered with the civil authorities, according to background characteristics, Jordan 2012
Background characteristic
Children whose births are registered
Number of children
Percentage for whom a birth
certificate was seen
Percentage for whom a birth
certificate was not seen
Percentage registered
Age <2 48.1 49.8 98.0 3,541 2-4 46.1 53.7 99.7 5,796
Sex Male 47.5 51.7 99.3 4,870 Female 46.1 52.7 98.8 4,468
Residence Urban 44.5 54.5 99.0 7,546 Rural 56.9 42.6 99.5 1,792
Region Central 36.8 62.5 99.3 5,665 North 63.9 34.9 98.7 2,751 South 58.0 40.9 98.9 921
Governorate Amman 38.7 60.3 99.0 3,292 Balqa 36.1 63.6 99.7 691 Zarqa 30.3 69.5 99.7 1,407 Madaba 49.4 49.6 99.1 276 Irbid 59.4 39.2 98.6 1,648 Mafraq 73.7 24.8 98.6 558 Jarash 68.4 30.7 99.1 323 Ajloun 65.9 33.7 99.7 223 Karak 53.8 45.3 99.1 399 Tafiela 56.5 41.4 97.9 152 Ma'an 63.3 35.9 99.2 166 Aqaba 63.0 36.0 99.0 204
Badia Badia 65.0 34.0 98.9 748 Non Badia 45.3 53.8 99.1 8,590
Camps Camp 48.1 51.4 99.6 382 Non camp 46.8 52.2 99.0 8,956
Wealth quintile Lowest 47.2 51.1 98.3 2,139 Second 46.9 52.1 99.0 2,032 Middle 48.6 50.9 99.5 1,998 Fourth 43.2 55.8 99.0 1,820 Highest 48.6 51.2 99.8 1,349
Total 46.9 52.2 99.1 9,338
Table 2.9 indicates that the majority of children under age 18 (93 percent) are living with both parents: this proportion is 94 percent for children under age 15. The range is between 96 percent for children age 0-4 and 87 percent for children age 15-17. No variations were noted according to sex, region, or Badia or camp areas, while there are variations in these percentages by governorate (ranging from 89 percent in Ma’an to 96 percent in Tafiela and Ajloun) and urban-rural residence (93 and 95 percent, respectively). The proportion of children under 18 living with both parents tends to increase with wealth before falling at the highest quintile. In addition, 3 percent of children under age 18 have experienced the death of one or both parents.

22 • Household Characteristics
Table 2.9 Children's living arrangements and orphanhood
Percent distribution of de jure children under age 18 by living arrangements and survival status of parents, the percentage of children not living with a biological parent, and the percentage of children with one or both parents dead, according to background characteristics, Jordan 2012
Background characteristic
Living with both parents
Living with mother but not with father
Living with father but not with mother Not living with either parent
Percent- age not
living with a biolo-
gical parent
Percent- age with one or both
parents dead1
Number of
children Father alive
Father dead
Mother alive
Mother dead
Both alive
Only father alive
Only mother alive
Both dead Total
Age 0-4 96.3 2.7 0.4 0.2 0.1 0.2 0.0 0.0 0.0 100.0 0.3 0.6 9,338
<2 96.8 2.9 0.2 0.0 0.0 0.1 0.0 0.0 0.0 100.0 0.2 0.2 3,541 2-4 96.0 2.6 0.6 0.3 0.2 0.3 0.0 0.0 0.0 100.0 0.4 0.8 5,796
5-9 95.0 2.5 1.2 0.8 0.2 0.2 0.1 0.1 0.0 100.0 0.5 1.6 9,070 10-14 91.8 2.2 3.2 1.2 0.9 0.5 0.1 0.0 0.1 100.0 0.7 4.3 8,435 15-17 87.0 3.0 5.2 1.2 1.4 1.7 0.2 0.1 0.2 100.0 2.2 7.2 5,398
Sex Male 93.4 2.6 2.2 0.7 0.5 0.3 0.1 0.0 0.1 100.0 0.5 2.9 16,690 Female 93.0 2.5 2.1 0.9 0.5 0.8 0.1 0.1 0.1 100.0 1.0 2.9 15,550
Residence Urban 92.9 2.7 2.2 0.8 0.6 0.6 0.1 0.1 0.1 100.0 0.8 3.0 26,263 Rural 94.6 1.7 2.2 0.7 0.3 0.4 0.0 0.1 0.1 100.0 0.6 2.7 5,977
Region Central 93.1 2.7 2.2 0.7 0.5 0.5 0.1 0.1 0.1 100.0 0.7 2.9 19,715 North 93.1 2.7 1.7 0.9 0.8 0.5 0.2 0.0 0.1 100.0 0.8 2.8 9,260 South 93.7 1.6 3.0 0.8 0.2 0.6 0.1 0.1 0.0 100.0 0.8 3.4 3,265
Governorate Amman 92.5 3.1 2.3 0.9 0.6 0.5 0.1 0.0 0.0 100.0 0.6 3.1 11,582 Balqa 94.1 1.5 2.5 0.6 0.4 0.5 0.1 0.1 0.1 100.0 0.8 3.2 2,352 Zarqa 94.0 2.2 1.9 0.6 0.2 0.7 0.0 0.2 0.1 100.0 1.1 2.4 4,874 Madaba 94.2 1.9 2.9 0.2 0.4 0.4 0.0 0.0 0.0 100.0 0.5 3.3 906 Irbid 92.8 3.2 1.2 1.1 0.9 0.6 0.2 0.0 0.1 100.0 0.9 2.4 5,633 Mafraq 92.0 2.5 3.0 0.9 0.7 0.5 0.0 0.2 0.1 100.0 0.8 4.1 1,794 Jarash 94.5 1.4 2.0 0.6 0.8 0.4 0.0 0.1 0.2 100.0 0.7 3.1 1,052 Ajloun 96.0 1.0 2.2 0.2 0.3 0.2 0.0 0.1 0.0 100.0 0.4 2.6 780 Karak 95.0 0.9 2.5 0.5 0.1 0.7 0.2 0.2 0.0 100.0 1.0 2.9 1,358 Tafiela 96.0 1.5 1.7 0.3 0.2 0.2 0.1 0.0 0.0 100.0 0.3 2.0 513 Ma'an 89.3 2.2 6.0 1.5 0.2 0.7 0.0 0.1 0.0 100.0 0.8 6.3 627 Aqaba 93.5 2.4 2.1 1.1 0.3 0.5 0.0 0.1 0.0 100.0 0.7 2.6 767
Badia Badia 91.5 3.2 3.3 0.9 0.5 0.4 0.0 0.1 0.1 100.0 0.6 4.0 2,349 Non Badia 93.3 2.5 2.1 0.8 0.5 0.5 0.1 0.1 0.1 100.0 0.8 2.8 29,891
Camps Camp 93.7 2.3 1.7 0.6 0.3 1.0 0.0 0.2 0.0 100.0 1.2 2.3 1,365 Non camp 93.2 2.6 2.2 0.8 0.5 0.5 0.1 0.1 0.1 100.0 0.7 3.0 30,876
Wealth quintile Lowest 90.0 4.1 3.7 0.6 0.6 0.6 0.2 0.1 0.1 100.0 1.0 4.7 7,232 Second 93.3 1.5 2.4 1.1 0.6 0.7 0.1 0.1 0.2 100.0 1.1 3.4 6,767 Middle 94.7 2.7 1.3 0.4 0.2 0.5 0.1 0.0 0.0 100.0 0.7 1.7 6,668 Fourth 95.3 1.6 1.7 0.4 0.6 0.3 0.0 0.0 0.0 100.0 0.3 2.3 6,276 Highest 93.0 2.7 1.4 1.5 0.8 0.5 0.1 0.0 0.0 100.0 0.6 2.3 5,297
Total <18 93.2 2.6 2.2 0.8 0.5 0.5 0.1 0.1 0.1 100.0 0.8 2.9 32,240
Total <15 94.4 2.5 1.5 0.7 0.4 0.3 0.1 0.0 0.0 100.0 0.5 2.1 26,842
Note: Table is based on de jure members, i.e., usual residents. 1 Includes children with father dead, mother dead, both dead, and one parent dead but missing information on survival status of the other parent.

Household Characteristics • 23
2.6 EDUCATION OF THE HOUSEHOLD POPULATION
Education is an important variable with regard to its association with demographic behavior. Higher education is usually associated with greater knowledge and use of health practices and family planning methods. The education system in Jordan has been in place for a long time. Basic education is free and compulsory, starting at age six and lasting for 10 years. A further two-year period, known as the secondary cycle, is virtually cost-free. In the 2012 JPFHS, questions on education were asked for persons age 6 and older, to be used to calculate rates of school enrollment as well as overall education levels of the population.
Tables 2.10.1 and 2.10.2 present data on educational attainment as reported in the Household Questionnaire. In the 2012 JPFHS, information on educational attainment refers to the highest level of education attended and the highest grade completed at that level. An important observation is that women have less education than men: 98 percent of males in Jordan have had some schooling, compared with 92 percent of females.
More than half of males and females (54 and 52 percent, respectively) have attained secondary education or higher. Overall education levels have continued to increase for both men and women. In 2007 the percentages of men and women who attained secondary education or higher were 50 and 49 percent, respectively; in 2002 they were 46 percent and 43 percent among men and women, respectively, with a narrowing in the gender gap in overall educational attainment. There are variations in educational attainment by urban-rural residence and governorate. For example, educational attainment beyond preparatory school is higher in urban areas than in rural areas. The percentage varies from 38 percent for females in Ma’an to 55 percent in Amman; for males, it ranges from 44 percent in Ma’an to 57 percent in Amman. The difference in educational attainment is quite large between the Badia and non Badia areas. The percentages of women with at least some secondary education are 41 and 53 percent, respectively, and the percentages for men are 44 and 55 percent, respectively. A significant difference was also noted according to camp and non camp areas; the percentages of women who have at least some secondary education are 41 and 53 percent, respectively.
Medians presented in Tables 2.10.1 and 2.10.2 indicate an increase in the number of years of schooling as well as a reduction in the gender gap among the younger generations. Overall, men have a slightly longer stay in school than women, with a median of 9.5 years of education, compared with 9.4 for women. The medians have increased from 8.6 for men and 8.0 for women in 2002, to 9.1 for men and 8.8 for women in 2007, and further to 9.5 and 9.4, respectively, in 2012. At age 65 and over, men have an average of six years of schooling, with women having none. However, the male-female gender gap narrows, and by age 40-44 median years of schooling for women and men are identical at 10.7 years. Between ages 15 and 39, women have higher median years of schooling than men, with no gender gap among those age 6-14.
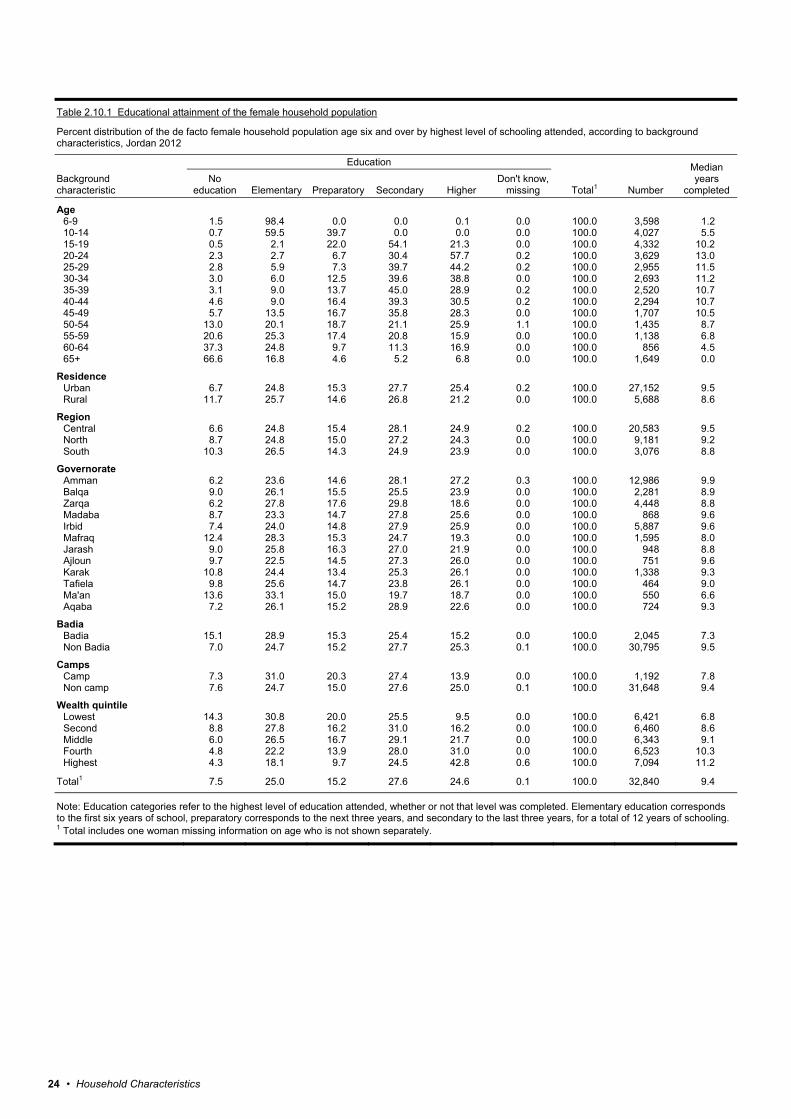
24 • Household Characteristics
Table 2.10.1 Educational attainment of the female household population
Percent distribution of the de facto female household population age six and over by highest level of schooling attended, according to background characteristics, Jordan 2012
Background characteristic
Education
Total1 Number
Median years
completed No
education Elementary Preparatory Secondary Higher Don't know,
missing
Age 6-9 1.5 98.4 0.0 0.0 0.1 0.0 100.0 3,598 1.2 10-14 0.7 59.5 39.7 0.0 0.0 0.0 100.0 4,027 5.5 15-19 0.5 2.1 22.0 54.1 21.3 0.0 100.0 4,332 10.2 20-24 2.3 2.7 6.7 30.4 57.7 0.2 100.0 3,629 13.0 25-29 2.8 5.9 7.3 39.7 44.2 0.2 100.0 2,955 11.5 30-34 3.0 6.0 12.5 39.6 38.8 0.0 100.0 2,693 11.2 35-39 3.1 9.0 13.7 45.0 28.9 0.2 100.0 2,520 10.7 40-44 4.6 9.0 16.4 39.3 30.5 0.2 100.0 2,294 10.7 45-49 5.7 13.5 16.7 35.8 28.3 0.0 100.0 1,707 10.5 50-54 13.0 20.1 18.7 21.1 25.9 1.1 100.0 1,435 8.7 55-59 20.6 25.3 17.4 20.8 15.9 0.0 100.0 1,138 6.8 60-64 37.3 24.8 9.7 11.3 16.9 0.0 100.0 856 4.5 65+ 66.6 16.8 4.6 5.2 6.8 0.0 100.0 1,649 0.0
Residence Urban 6.7 24.8 15.3 27.7 25.4 0.2 100.0 27,152 9.5 Rural 11.7 25.7 14.6 26.8 21.2 0.0 100.0 5,688 8.6
Region Central 6.6 24.8 15.4 28.1 24.9 0.2 100.0 20,583 9.5 North 8.7 24.8 15.0 27.2 24.3 0.0 100.0 9,181 9.2 South 10.3 26.5 14.3 24.9 23.9 0.0 100.0 3,076 8.8
Governorate Amman 6.2 23.6 14.6 28.1 27.2 0.3 100.0 12,986 9.9 Balqa 9.0 26.1 15.5 25.5 23.9 0.0 100.0 2,281 8.9 Zarqa 6.2 27.8 17.6 29.8 18.6 0.0 100.0 4,448 8.8 Madaba 8.7 23.3 14.7 27.8 25.6 0.0 100.0 868 9.6 Irbid 7.4 24.0 14.8 27.9 25.9 0.0 100.0 5,887 9.6 Mafraq 12.4 28.3 15.3 24.7 19.3 0.0 100.0 1,595 8.0 Jarash 9.0 25.8 16.3 27.0 21.9 0.0 100.0 948 8.8 Ajloun 9.7 22.5 14.5 27.3 26.0 0.0 100.0 751 9.6 Karak 10.8 24.4 13.4 25.3 26.1 0.0 100.0 1,338 9.3 Tafiela 9.8 25.6 14.7 23.8 26.1 0.0 100.0 464 9.0 Ma'an 13.6 33.1 15.0 19.7 18.7 0.0 100.0 550 6.6 Aqaba 7.2 26.1 15.2 28.9 22.6 0.0 100.0 724 9.3
Badia Badia 15.1 28.9 15.3 25.4 15.2 0.0 100.0 2,045 7.3 Non Badia 7.0 24.7 15.2 27.7 25.3 0.1 100.0 30,795 9.5
Camps Camp 7.3 31.0 20.3 27.4 13.9 0.0 100.0 1,192 7.8 Non camp 7.6 24.7 15.0 27.6 25.0 0.1 100.0 31,648 9.4
Wealth quintile Lowest 14.3 30.8 20.0 25.5 9.5 0.0 100.0 6,421 6.8 Second 8.8 27.8 16.2 31.0 16.2 0.0 100.0 6,460 8.6 Middle 6.0 26.5 16.7 29.1 21.7 0.0 100.0 6,343 9.1 Fourth 4.8 22.2 13.9 28.0 31.0 0.0 100.0 6,523 10.3 Highest 4.3 18.1 9.7 24.5 42.8 0.6 100.0 7,094 11.2
Total1 7.5 25.0 15.2 27.6 24.6 0.1 100.0 32,840 9.4
Note: Education categories refer to the highest level of education attended, whether or not that level was completed. Elementary education corresponds to the first six years of school, preparatory corresponds to the next three years, and secondary to the last three years, for a total of 12 years of schooling. 1 Total includes one woman missing information on age who is not shown separately.

Household Characteristics • 25
Table 2.10.2 Educational attainment of the male household population
Percent distribution of the de facto male household population age six and over by highest level of schooling attended, according to background characteristics, Jordan 2012
Background characteristic
Education
Total Number Median years
completed No
education Elementary Preparatory Secondary Higher
Age 6-9 1.4 98.6 0.0 0.0 0.0 100.0 3,645 1.1 10-14 0.7 59.3 39.6 0.3 0.0 100.0 4,419 5.5 15-19 0.9 4.1 24.2 56.9 13.9 100.0 4,511 9.9 20-24 0.6 3.5 10.8 40.1 45.0 100.0 3,726 11.3 25-29 0.5 4.1 7.7 44.5 43.3 100.0 2,858 11.3 30-34 1.4 8.7 9.8 49.9 30.2 100.0 2,204 10.8 35-39 1.4 9.7 19.2 43.4 26.3 100.0 2,173 10.5 40-44 1.3 10.4 21.2 37.8 29.2 100.0 2,100 10.7 45-49 1.9 7.9 19.5 35.1 35.7 100.0 1,771 11.2 50-54 1.5 16.0 15.6 28.1 38.8 100.0 1,152 11.1 55-59 3.2 17.0 18.9 18.9 41.9 100.0 908 11.3 60-64 6.0 22.9 17.8 21.6 31.7 100.0 757 9.8 65+ 19.7 30.1 11.7 13.8 24.7 100.0 1,702 6.0
Residence Urban 1.9 26.0 17.7 29.6 24.9 100.0 26,434 9.6 Rural 3.9 28.6 16.4 34.3 16.9 100.0 5,493 9.2
Region Central 1.8 25.8 17.6 29.4 25.4 100.0 20,232 9.6 North 2.5 27.1 17.5 31.7 21.1 100.0 8,694 9.4 South 3.8 28.2 16.6 33.1 18.3 100.0 3,001 9.2
Governorate Amman 1.5 24.4 17.3 27.3 29.4 100.0 12,463 9.9 Balqa 2.9 26.4 17.8 31.7 21.2 100.0 2,292 9.4 Zarqa 1.8 29.1 18.5 33.9 16.7 100.0 4,591 9.0 Madaba 3.3 27.6 15.5 30.2 23.4 100.0 885 9.6 Irbid 1.9 25.9 17.2 30.9 24.1 100.0 5,594 9.7 Mafraq 4.3 30.1 18.7 33.9 13.0 100.0 1,535 8.6 Jarash 3.1 29.9 18.3 31.1 17.6 100.0 881 8.8 Ajloun 3.1 27.3 16.9 33.7 19.0 100.0 685 9.4 Karak 4.0 26.2 16.8 33.3 19.8 100.0 1,265 9.5 Tafiela 2.6 27.6 18.3 34.0 17.6 100.0 444 9.2 Ma'an 5.9 33.1 16.5 31.3 13.1 100.0 583 8.0 Aqaba 2.6 28.0 15.2 33.9 20.4 100.0 709 9.6
Badia Badia 6.2 31.8 18.1 33.2 10.8 100.0 1,969 8.2 Non Badia 2.0 26.1 17.4 30.2 24.4 100.0 29,959 9.6
Camps Camp 3.6 34.1 22.2 28.3 11.9 100.0 1,224 7.7 Non camp 2.2 26.1 17.3 30.5 24.0 100.0 30,703 9.6
Wealth quintile Lowest 5.6 34.3 22.6 30.2 7.2 100.0 6,129 7.5 Second 2.4 29.2 21.0 34.8 12.4 100.0 6,335 8.7 Middle 2.1 27.5 17.1 34.0 19.4 100.0 6,467 9.4 Fourth 0.9 24.0 15.9 30.5 28.6 100.0 6,467 10.1 Highest 0.2 17.6 11.0 22.5 48.7 100.0 6,529 11.6
Total 2.2 26.4 17.5 30.4 23.5 100.0 31,927 9.5
Note: Education categories refer to the highest level of education attended, whether or not that level was completed. Elementary education corresponds to the first six years of school, preparatory corresponds to the next three years, and secondary to the last three years, for a total of 12 years of schooling.

26 • Household Characteristics
Figure 2.4 shows the proportion of the household population age 6-24 attending school, by age and sex. The data reflect the fact that school attendance in Jordan is very high, at almost 98 percent for both sexes among those age 7 through 12. Few differences in attendance are observed between males and females at younger ages (7-13 years).
Beyond the age of 13, attendance rates start to decline, especially for males. Nevertheless, the overall rate exceeds 90 percent for both sexes up to age 15. Age 14 marks the beginning of a gender-based divergence in attendance, where 92 percent of males and 96 percent of females are attending school. This gender gap continues through age 21, with 48 percent of females attending school as compared with 38 percent of males. Between age 22 and 24, men are more likely than women to be in school.
Figure 2.4
Age-specific attendance rates, 2012 (percentage of the population age 6-24 attending school)
0
10
20
30
40
50
60
70
80
90
100
6 7 8 9 10 11 12 13 14 15 16 17 18 19 20 21 22 23 24
Percentage
AgeMale Female
JPFHS 2012

Respondents’ Background Characteristics • 27
RESPONDENTS’ BACKGROUND CHARACTERISTICS 3
his chapter highlights the basic characteristics of ever-married women age 15-49 who were interviewed in the survey. It also presents data on women’s exposure to the mass media, their employment status, and tobacco use.
3.1 GENERAL CHARACTERISTICS
Table 3.1 presents the distribution of respondents by background characteristics, including age, marital status, residence, educational level, and household wealth. The distribution of ever-married women shows that, in 2012, less than one-third of ever-married women (31 percent) are under age 30. This represents a decline from 34 percent in 2002 and 32 percent in 2007 and 2009. In contrast, the proportion of ever-married women age 30-49 has increased from 66 percent in 2002 to 68 percent in 2007 and 2009 and to 69 percent in 2012. Among ever-married women, the percent distribution by marital status indicates that 95 percent are currently married; the rest are either divorced or separated (3 percent) or widowed (2 percent). The proportion of those currently married has remained about the same as in 2007 and 2009.
Table 3.1 shows that in 2012, 83 percent of ever-married women live in urban areas (defined as localities with a population of 5,000 or more, as stated in the 2004 Population and Housing Census). Almost two in three women live in the Central region (Amman, Zarqa, Balqa, and Madaba), about 28 percent in the North region (Irbid, Mafraq, Jarash, and Ajloun), and only 9 percent live in the South region (Karak, Tafiela, Ma’an, and Aqaba).
T
Key Findings
• The median number of years of education for ever-married women age 15-49 is 10.8 years, with large differences in educational attainment by governorates.
• Seventeen percent of women read a newspaper, listen to the radio, and watch television at least once a week; 2 percent were not exposed to any of the three media.
• The majority of ever-married women (68 percent) have never been employed, while 16 percent are currently employed, and 16 percent have been previously employed.
• Among working women, the majority (66 percent) are engaged in professional, technical, and managerial work.
• Overall, 11 percent of women smoke cigarettes and 10 percent smoke nargila (water pipe).

28 • Respondents’ Background Characteristics
Table 3.1 Background characteristics of women
Percent distribution of ever-married women age 15-49 by selected background characteristics, Jordan 2012
Background characteristic
Number of women
Weighted percent
Weighted number
Unweighted number
Age 15-19 2.4 278 239 20-24 10.6 1,207 1,190 25-29 17.7 2,006 2,110 30-34 18.8 2,136 2,169 35-39 18.5 2,098 2,164 40-44 18.1 2,055 1,999 45-49 13.8 1,571 1,481
Marital status Married 95.1 10,801 10,746 Divorced/separated 3.1 350 346 Widowed 1.8 201 260
Residence Urban 83.3 9,458 8,034 Rural 16.7 1,894 3,318
Region Central 63.3 7,181 4,051 North 27.5 3,120 3,980 South 9.3 1,051 3,321
Governorate Amman 39.2 4,454 1,106 Balqa 6.7 765 945 Zarqa 14.6 1,659 1,139 Madaba 2.7 303 861 Irbid 17.5 1,986 1,137 Mafraq 5.0 562 1,000 Jarash 2.8 320 945 Ajloun 2.2 251 898 Karak 3.9 441 873 Tafiela 1.5 167 819 Ma'an 1.6 178 781 Aqaba 2.3 265 848
Badia Badia 6.2 705 1,265 Non Badia 93.8 10,647 10,087
Camps Camp 3.6 413 904 Non camp 96.4 10,939 10,448
Education No education 2.3 267 408 Elementary 7.6 860 981 Preparatory 14.8 1,677 1,610 Secondary 44.7 5,073 4,799 Higher 30.6 3,475 3,554
Wealth quintile Lowest 18.8 2,137 2,695 Second 20.6 2,343 2,896 Middle 21.7 2,461 2,601 Fourth 20.6 2,336 2,050 Highest 18.3 2,076 1,110
Total 15-49 100.0 11,352 11,352
Note: Education categories refer to the highest level of education attended, whether or not that level was completed.

Respondents’ Background Characteristics • 29
The distribution of ever-married women by governorate is comparable to the distribution of the total population in the 2004 census. About two in five (39 percent) women live in Amman, 18 percent in Irbid, and 15 percent in Zarqa. Six percent of ever-married women live in Badia areas and 4 percent live in refugee camp areas.
The overall level of education among women continues to improve. The percentage of ever-married women age 15-49 years who had no schooling has steadily declined from 6 percent in 2002 to 4 percent in 2007, 3 percent in 2009, and 2 percent in 2012. The percentage who have attended school beyond secondary level increased from 25 percent in 2002 to 29 percent in 2007, 32 percent in 2009, and 31 percent in 2012.
Table 3.1 also presents the weighted and unweighted numbers of women in the sample. The unweighted numbers of women in the three largest governorates are smaller than the weighted numbers. The opposite is true for all other governorates because of oversampling. For example, in Ma’an governorate, although the weighted number of women is 178, in reality data were collected from 781 women: Ma’an governorate was oversampled to obtain a sufficient sample of women to yield statistically reliable estimates.
3.2 RESPONDENTS’ LEVEL OF EDUCATION
Table 3.2 presents the distribution of ever-married women by the level of education attended, according to background characteristics. Broad-based access to education for the Jordanian population has continued to increase over the past 65 years. The data indicate that older women are less likely to have had education than younger women; almost 5 percent of women age 45-49 have had no education, compared with less than 1 percent of women between the ages of 15 and 24.
The median number of years of schooling according to age group reflects no major difference. The median number of years of education for all ever-married women is 10.8 years. While women age 15-24 and age 45-49 have a median of 10.5 years of education, those age 25-29 and 30-34 have a median of 11.1 years of education.
Ever-married women in urban areas are more likely to have had some education, as well as higher education, than their rural counterparts; 2 percent of women in urban areas have no education, compared with 6 percent of women in rural areas. There are small differences in terms of the median number of years of schooling according to urban-rural residence. There are pronounced differences in the proportion of women with no education by region and governorate. In the Central region, 2 percent of women have no education, whereas in the South region, the proportion is 6 percent. Only 1 percent of women in Irbid and Zarqa have no education, compared with 13 percent in Ma’an. Regional differences in secondary or higher education are small. Considerable differences exist in terms of higher education by governorate; only one in four women have attained higher education in Zarqa, Mafraq, and Ma’an in contrast to about two in five women in Ajloun and Karak.
In Badia areas, 13 percent of ever-married women age 15-49 have no education, compared with 2 percent in non-Badia areas. There is also a significant and notable difference in the percentage of woman attaining higher education between Badia and non- Badia areas (20 and 31 percent, respectively) and camp and non camp areas (19 percent and 31 percent, respectively). The table also shows an inverse relationship between wealth and educational attainment, with a higher proportion of women in the lowest wealth quintile having no education (8 percent) than in either the fourth or the highest quintiles (less than 1 percent each). The proportion of women who have attained higher education is highest in the wealthiest households (55 percent) and lowest in the poorest households (10 percent).

30 • Respondents’ Background Characteristics
Table 3.2 Educational attainment
Percent distribution of ever-married women age 15-49 by highest level of schooling attended, according to background characteristics, Jordan 2012
Background characteristic
Education
Total
Median years
completed Number of
women No
education Elementary Preparatory Secondary Higher
Age 15-24 0.8 4.6 17.7 52.6 24.2 100.0 10.5 1,485
15-19 0.1 5.3 30.4 62.7 1.5 100.0 9.6 278 20-24 1.0 4.4 14.8 50.3 29.4 100.0 10.7 1,207
25-29 1.4 5.2 8.1 48.9 36.4 100.0 11.1 2,006 30-34 1.7 5.1 14.0 42.7 36.5 100.0 11.1 2,136 35-39 1.9 8.7 15.7 47.4 26.2 100.0 10.7 2,098 40-44 3.8 9.0 16.7 40.4 30.2 100.0 10.7 2,055 45-49 4.6 13.6 17.7 36.4 27.7 100.0 10.5 1,571
Residence Urban 1.7 7.2 15.1 45.3 30.7 100.0 10.8 9,458 Rural 5.5 9.5 13.4 41.6 30.1 100.0 10.6 1,894
Region Central 1.9 7.5 15.7 45.9 29.1 100.0 10.8 7,181 North 2.3 7.1 14.1 44.0 32.5 100.0 10.8 3,120 South 5.8 9.7 10.6 38.3 35.6 100.0 10.8 1,051
Governorate Amman 1.8 7.4 15.8 45.1 30.0 100.0 10.9 4,454 Balqa 3.3 9.2 14.2 40.3 33.0 100.0 10.8 765 Zarqa 1.4 7.1 16.7 51.4 23.5 100.0 10.6 1,659 Madaba 2.0 5.9 12.1 43.4 36.5 100.0 11.2 303 Irbid 1.1 5.9 13.6 46.1 33.4 100.0 10.9 1,986 Mafraq 7.2 13.1 16.2 37.0 26.6 100.0 10.3 562 Jarash 1.8 7.0 16.7 42.6 31.9 100.0 10.7 320 Ajloun 1.6 3.9 9.9 44.6 40.0 100.0 11.0 251 Karak 4.1 7.5 9.6 38.1 40.6 100.0 11.0 441 Tafiela 4.9 9.9 12.2 35.3 37.8 100.0 10.8 167 Ma'an 13.3 19.1 11.9 29.2 26.5 100.0 9.9 178 Aqaba 4.2 6.8 10.4 46.5 32.1 100.0 11.0 265
Badia Badia 12.8 15.0 16.2 35.9 20.2 100.0 9.8 705 Non Badia 1.7 7.1 14.7 45.3 31.3 100.0 10.8 10,647
Camps Camp 1.9 11.7 21.9 45.7 18.8 100.0 10.1 413 Non camp 2.4 7.4 14.5 44.6 31.1 100.0 10.8 10,939
Wealth quintile Lowest 8.3 16.6 25.3 39.4 10.3 100.0 8.9 2,137 Second 2.7 10.1 17.4 50.1 19.8 100.0 10.4 2,343 Middle 0.6 6.7 15.3 48.6 28.7 100.0 10.8 2,461 Fourth 0.3 3.2 11.2 44.9 40.4 100.0 11.4 2,336 Highest 0.2 1.3 4.4 39.2 54.9 100.0 13.1 2,076
Total 2.3 7.6 14.8 44.7 30.6 100.0 10.8 11,352
Note: Education categories refer to the highest level of education attended, whether or not that level was completed. Elementary education corresponds to the first six years of school, preparatory corresponds to the next three years, and secondary to the last three years, for a total of 12 years of schooling.

Respondents’ Background Characteristics • 31
3.3 EXPOSURE TO MASS MEDIA
The exposure of ever-married women to television, radio, and newspapers is shown in Table 3.3. Ninety-seven percent of women watch television, 37 percent listen to the radio, and 35 percent read newspapers at least once a week. While 17 percent of women were exposed to all three forms of media at least once a week, 2 percent were not exposed to any.
Younger women are slightly less likely to be exposed to mass media than older women: whereas 13 percent of women age 15-19 were exposed to all three forms of mass media, the proportion goes up to 18-19 percent among women age 30-49. There is a steady increase with education level in the proportions of women who read a newspaper, watch television, and listen to the radio at least once a week. It should be noted that while about one-fourth of women with a higher than secondary education (27 percent) were exposed to all three media, almost no women with no education report the same.
Women in urban areas are more likely to read a newspaper (37 percent) than women in rural areas (25 percent), while there is no difference in exposure to the television. The extent to which women listen to the radio varies by urban-rural residence (37 percent in urban areas versus 33 percent in rural areas). Women living in the Central region are more likely than women in the other regions to read newspapers, listen to the radio, and watch television (20 percent exposed to all three media in the Central region versus 12 percent in the North and 17 percent in the South).
Women in Amman and Aqaba are more likely to read the newspaper than women in other governorates. While more than one-fourth of women in Aqaba (29 percent) are exposed to all three forms of mass media, this figure is only 9 percent in Ma’an and 7 percent in Mafraq.
The table also indicates the variation in these percentages by residence in Badia and camp areas; 8 percent of women in Badia and camp areas are exposed to all three media compared with 18 percent of women residing in non- Badia and non camp areas.
Table 3.3 also shows a positive relationship between exposure to mass media and household wealth, with exposure to all three media sources increasing from 4 percent of women in the lowest quintile to 37 percent in the highest quintile.

32 • Respondents’ Background Characteristics
Table 3.3 Exposure to mass media
Percentage of ever-married women age 15-49 who are exposed to specific media on a weekly basis, by background characteristics, Jordan 2012
Background characteristic
Reads a newspaper at
least once a week
Watches television at least once
a week
Listens to the radio at least once a week
Accesses all three media at
least once a week
Accesses none of the
three media at least once
a week Number of
women
Age 15-19 28.0 99.1 30.4 13.0 0.5 27820-24 31.1 98.0 33.5 15.2 0.9 1,20725-29 33.7 96.9 37.4 15.3 1.8 2,00630-34 34.7 95.6 35.8 18.1 2.4 2,13635-39 35.4 96.7 36.1 17.9 2.6 2,09840-44 35.3 97.9 39.9 17.9 1.3 2,05545-49 38.7 95.7 36.2 19.0 2.8 1,571
Residence Urban 36.7 96.7 37.2 18.1 2.0 9,458Rural 25.2 97.2 33.4 12.7 2.0 1,894
Region Central 38.1 96.4 40.3 19.5 2.2 7,181North 27.8 97.7 29.7 12.1 1.5 3,120South 32.8 97.1 31.4 16.5 1.9 1,051
Governorate Amman 41.4 96.1 42.6 21.1 2.2 4,454Balqa 32.0 96.8 39.7 16.7 1.6 765Zarqa 33.1 96.9 34.6 16.8 2.4 1,659Madaba 32.2 97.6 39.8 18.4 1.8 303Irbid 31.0 98.3 31.6 13.7 1.0 1,986Mafraq 18.9 96.8 22.8 7.0 2.7 562Jarash 25.7 95.9 30.8 12.1 2.8 320Ajloun 25.1 97.3 28.2 10.9 1.3 251Karak 28.0 97.8 27.6 14.6 1.7 441Tafiela 25.9 95.4 27.9 10.4 3.6 167Ma'an 19.7 96.7 28.5 8.6 2.3 178Aqaba 53.9 97.1 41.9 28.8 0.9 265
Badia Badia 18.0 94.2 27.9 8.4 5.0 705Non Badia 35.9 97.0 37.1 17.8 1.8 10,647
Camps Camp 23.5 95.4 21.3 8.3 3.3 413Non camp 35.2 96.9 37.1 17.5 1.9 10,939
Education No education 0.0 86.5 16.5 0.0 13.1 267Elementary 6.8 93.6 26.8 2.5 4.9 860Preparatory 21.7 95.9 31.1 8.9 1.9 1,677Secondary 35.2 97.7 35.9 16.9 1.6 5,073Higher 50.1 97.5 44.0 26.6 1.0 3,475
Wealth quintile Lowest 14.6 94.2 20.1 3.7 4.1 2,137Second 25.8 96.9 30.9 11.0 2.1 2,343Middle 32.3 97.3 35.1 14.4 1.9 2,461Fourth 40.6 97.7 43.8 21.5 0.8 2,336Highest 62.1 97.9 53.6 36.6 1.1 2,076
Total 34.8 96.8 36.5 17.2 2.0 11,352
3.4 RESPONDENTS’ EMPLOYMENT CHARACTERISTICS
In the 2012 JPFHS, respondents were asked a number of questions about their employment, including whether they were currently working or not. Women who were currently working were then asked a number of questions about the kind of work they do and their employment status. In the 2012 JPFHS, women were defined as currently employed if they worked in the seven days preceding the survey.

Respondents’ Background Characteristics • 33
3.4.1 Working Status
The majority of ever-married women (68 percent) have never been employed, while only 16 percent worked during the seven days preceding the survey (Table 3.4). An additional 16 percent of women had worked in the past, but not during the seven days preceding the survey. The proportion of women who were currently working ranged from 1 percent among those age 15-19 to 20 percent among those age 30-34 and 45-49.
Table 3.4 Employment status Percent distribution of ever-married women age 15-49 by employment status, according to background characteristics, Jordan 2012
Background characteristic
Worked in the 7 days
preceding the survey1
Did not work in the 7 days
preceding the survey but
worked sometime in
the past Never
employed Total Number of
women
Age 15-19 0.8 6.0 93.2 100.0 278 20-24 5.4 8.8 85.8 100.0 1,207 25-29 15.8 17.3 66.9 100.0 2,006 30-34 20.1 16.6 63.3 100.0 2,136 35-39 17.1 14.2 68.6 100.0 2,098 40-44 17.8 15.9 66.3 100.0 2,055 45-49 20.1 21.3 58.6 100.0 1,571
Marital status Married 16.0 15.4 68.6 100.0 10,801 Divorced/separated/widowed 23.3 22.0 54.7 100.0 551
Number of living children 0 19.0 18.9 62.0 100.0 1,107 1-2 20.6 18.8 60.6 100.0 3,031 3-4 16.6 16.0 67.4 100.0 3,795 5+ 11.4 11.6 76.9 100.0 3,419
Residence Urban 16.2 16.5 67.3 100.0 9,458 Rural 17.1 11.9 71.0 100.0 1,894
Region Central 15.4 17.2 67.4 100.0 7,181 North 16.2 14.0 69.8 100.0 3,120 South 23.1 10.5 66.4 100.0 1,051
Governorate Amman 14.9 18.0 67.0 100.0 4,454 Balqa 22.4 15.4 62.1 100.0 765 Zarqa 11.8 16.4 71.8 100.0 1,659 Madaba 24.8 14.1 61.2 100.0 303 Irbid 16.5 16.2 67.3 100.0 1,986 Mafraq 15.7 9.0 75.3 100.0 562 Jarash 15.7 12.3 71.9 100.0 320 Ajloun 15.0 10.6 74.4 100.0 251 Karak 27.9 8.7 63.4 100.0 441 Tafiela 21.2 12.0 66.9 100.0 167 Ma'an 20.9 9.1 70.0 100.0 178 Aqaba 17.8 13.6 68.6 100.0 265
Badia Badia 12.5 8.7 78.9 100.0 705 Non Badia 16.6 16.2 67.2 100.0 10,647
Camps Camp 9.9 16.0 74.1 100.0 413 Non camp 16.6 15.7 67.7 100.0 10,939
Education No education 11.1 7.0 81.9 100.0 267 Elementary 7.3 12.4 80.2 100.0 860 Preparatory 4.7 10.5 84.8 100.0 1,677 Secondary 7.5 11.5 81.0 100.0 5,073 Higher 37.5 25.9 36.6 100.0 3,475
Wealth quintile Lowest 7.7 12.2 80.1 100.0 2,137 Second 11.0 13.7 75.3 100.0 2,343 Middle 14.5 15.1 70.5 100.0 2,461 Fourth 21.3 15.8 62.8 100.0 2,336 Highest 27.8 22.4 49.9 100.0 2,076
Total 16.3 15.7 67.9 100.0 11,352 1 Includes persons who did not work in the past seven days but who are regularly employed and were absent from work for travel, illness, vacation, or any other such reason.

34 • Respondents’ Background Characteristics
There are no major differences in work status according to urban-rural residence. However, a higher proportion of women in the South region report being currently employed (23 percent) compared with other regions. The table also indicates that there are notable variations in work status by governorates. Women in Zarqa are least likely to be currently employed (12 percent) and women in Karak most likely (28 percent). In addition, women are also more likely to be employed if they live in the non Badia and non camp areas. Women with postsecondary education are much more likely to report having been employed in the week preceding the survey (38 percent) than women with any other educational level.
Marital status seems to have a bearing on work status. Only 16 percent of currently married women are currently employed compared with 23 percent of divorced, separated, and widowed women. When the number of living children is considered, the percentage of working women rises from 19 percent among those with no children to 21 percent among those with one or two children, and drops to 11 percent among those with five or more children.
Not surprisingly, there is a direct relationship between household wealth and current employment, with the percentage of women currently employed increasing from 8 percent in the poorest households to 28 percent in the richest households.
The 2012 JPFHS also asked women who had worked in the past but were not currently working for the reasons they stopped working. One in three women (33 percent) had stopped work because they got married, 15 percent stopped because they became pregnant, 11 percent lost their job, 8 percent stopped work because their husbands were opposed, and 6 percent each stopped work due to retirement or illness (data not shown separately).
3.4.2 Occupation
Table 3.5 shows that among ever-married women who report being employed in the seven days preceding the survey, the majority (54 percent) are engaged in professional work, with much smaller proportions employed in services and sales (13 percent), elementary occupations (9 percent), clerical work (8 percent), and craft and related trades (5 percent). The percentages vary considerably by background characteristics of women, particularly by marital status, education, and household wealth.
It is of interest to note that the data do not reflect the expected urban-rural difference in women’s involvement in the professional sector (53 percent and 58 percent, respectively). Employment in the professionalsector is higher among younger than older women, currently married than formerly married women, and women with fewer than five children than among women with five or more children. Employment in this sector is notably higher among women with higher education (76 percent) than among lesser educated women and rises with household wealth. Women in non camp areas are also more likely to be engaged in professional work (55 percent) than women in camp areas (32 percent). Differences by region, governorate, and Badia areas are smaller.
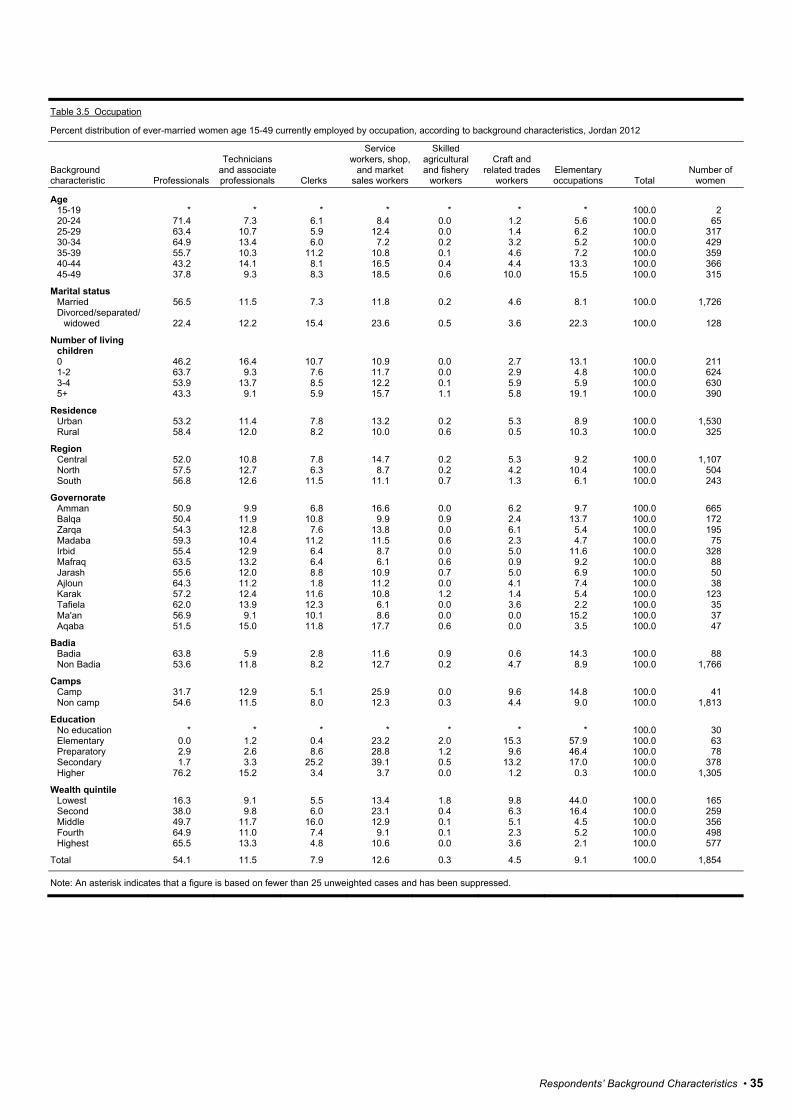
Respondents’ Background Characteristics • 35
Table 3.5 Occupation
Percent distribution of ever-married women age 15-49 currently employed by occupation, according to background characteristics, Jordan 2012
Background characteristic Professionals
Technicians and associate professionals Clerks
Service workers, shop,
and market sales workers
Skilled agricultural and fishery
workers
Craft and related trades
workers Elementary occupations Total
Number of women
Age 15-19 * * * * * * * 100.0 2 20-24 71.4 7.3 6.1 8.4 0.0 1.2 5.6 100.0 65 25-29 63.4 10.7 5.9 12.4 0.0 1.4 6.2 100.0 317 30-34 64.9 13.4 6.0 7.2 0.2 3.2 5.2 100.0 429 35-39 55.7 10.3 11.2 10.8 0.1 4.6 7.2 100.0 359 40-44 43.2 14.1 8.1 16.5 0.4 4.4 13.3 100.0 366 45-49 37.8 9.3 8.3 18.5 0.6 10.0 15.5 100.0 315
Marital status Married 56.5 11.5 7.3 11.8 0.2 4.6 8.1 100.0 1,726 Divorced/separated/
widowed 22.4 12.2 15.4 23.6 0.5 3.6 22.3 100.0 128
Number of living children 0 46.2 16.4 10.7 10.9 0.0 2.7 13.1 100.0 211 1-2 63.7 9.3 7.6 11.7 0.0 2.9 4.8 100.0 624 3-4 53.9 13.7 8.5 12.2 0.1 5.9 5.9 100.0 630 5+ 43.3 9.1 5.9 15.7 1.1 5.8 19.1 100.0 390
Residence Urban 53.2 11.4 7.8 13.2 0.2 5.3 8.9 100.0 1,530 Rural 58.4 12.0 8.2 10.0 0.6 0.5 10.3 100.0 325
Region Central 52.0 10.8 7.8 14.7 0.2 5.3 9.2 100.0 1,107 North 57.5 12.7 6.3 8.7 0.2 4.2 10.4 100.0 504 South 56.8 12.6 11.5 11.1 0.7 1.3 6.1 100.0 243
Governorate Amman 50.9 9.9 6.8 16.6 0.0 6.2 9.7 100.0 665 Balqa 50.4 11.9 10.8 9.9 0.9 2.4 13.7 100.0 172 Zarqa 54.3 12.8 7.6 13.8 0.0 6.1 5.4 100.0 195 Madaba 59.3 10.4 11.2 11.5 0.6 2.3 4.7 100.0 75 Irbid 55.4 12.9 6.4 8.7 0.0 5.0 11.6 100.0 328 Mafraq 63.5 13.2 6.4 6.1 0.6 0.9 9.2 100.0 88 Jarash 55.6 12.0 8.8 10.9 0.7 5.0 6.9 100.0 50 Ajloun 64.3 11.2 1.8 11.2 0.0 4.1 7.4 100.0 38 Karak 57.2 12.4 11.6 10.8 1.2 1.4 5.4 100.0 123 Tafiela 62.0 13.9 12.3 6.1 0.0 3.6 2.2 100.0 35 Ma'an 56.9 9.1 10.1 8.6 0.0 0.0 15.2 100.0 37 Aqaba 51.5 15.0 11.8 17.7 0.6 0.0 3.5 100.0 47
Badia Badia 63.8 5.9 2.8 11.6 0.9 0.6 14.3 100.0 88 Non Badia 53.6 11.8 8.2 12.7 0.2 4.7 8.9 100.0 1,766
Camps Camp 31.7 12.9 5.1 25.9 0.0 9.6 14.8 100.0 41 Non camp 54.6 11.5 8.0 12.3 0.3 4.4 9.0 100.0 1,813
Education No education * * * * * * * 100.0 30 Elementary 0.0 1.2 0.4 23.2 2.0 15.3 57.9 100.0 63 Preparatory 2.9 2.6 8.6 28.8 1.2 9.6 46.4 100.0 78 Secondary 1.7 3.3 25.2 39.1 0.5 13.2 17.0 100.0 378 Higher 76.2 15.2 3.4 3.7 0.0 1.2 0.3 100.0 1,305
Wealth quintile Lowest 16.3 9.1 5.5 13.4 1.8 9.8 44.0 100.0 165 Second 38.0 9.8 6.0 23.1 0.4 6.3 16.4 100.0 259 Middle 49.7 11.7 16.0 12.9 0.1 5.1 4.5 100.0 356 Fourth 64.9 11.0 7.4 9.1 0.1 2.3 5.2 100.0 498 Highest 65.5 13.3 4.8 10.6 0.0 3.6 2.1 100.0 577
Total 54.1 11.5 7.9 12.6 0.3 4.5 9.1 100.0 1,854
Note: An asterisk indicates that a figure is based on fewer than 25 unweighted cases and has been suppressed.

36 • Respondents’ Background Characteristics
It is of interest to note that the data do not reflect the expected urban-rural difference in women’s involvement in the professional, technical, and managerial sector (65 percent and 70 percent, respectively). Employment in professional, technical, and managerial work is higher among younger than older women, currently married than formerly married women, and women with fewer than five children than among women with five or more children. Employment in this sector is notably higher among women with higher education (91 percent) than among lesser educated women and rises with household wealth. Differences by region, governorate, and Badia and camp areas are smaller.
The data also indicate that 88 percent of employed women are paid employees and 9 percent are self-employed (Figure 3.1).
Figure 3.1 Women’s current employment status
JPFHS 2012
3.5 SMOKING TOBACCO
Tobacco use is widely regarded as the most preventable cause of death and disease among adults. In general, chronic exposure to nicotine may cause an acceleration of coronary artery disease, peptic ulcers, reproductive disorders, esophageal reflux, and hypertension. Tobacco and its various components have been associated with an increased risk of various types of cancer. Smoking is the most important contributor to the development of chronic bronchitis and chronic obstructive pulmonary disease, which are characterized by chronic cough, phlegm, and airflow obstruction. Smoking is well established as the cause of the majority of pulmonary emphysema. Smoking among women also creates particular risks for their offspring. Poor pregnancy outcomes, including low birth weight and intrauterine growth retardation, are more frequent among women who smoke than among those who do not smoke.
Table 3.6 shows the percentage of women who smoke cigarettes or a water pipe (nargila). Overall, 11 percent of women smoke cigarettes and 10 percent smoke nargila, a slight increase since 2009, when 9 percent of women reported smoking cigarettes and 6 percent nargila. The data also indicate that older women are more likely to smoke cigarettes but younger women prefer nargila. Smoking (both cigarettes and nargila) is also higher among women who are neither pregnant nor breastfeeding than among pregnant or breastfeeding women. Women living in urban areas are more likely to use tobacco than women living in rural areas. Also, women in the Central region are more likely to use tobacco compared with women from the other regions.

Respondents’ Background Characteristics • 37
Table 3.6 Use of tobacco
Percentage of ever-married women age 15-49 who smoke cigarettes or a water pipe, according to background characteristics and maternity status, Jordan 2012
Background characteristic
Uses tobacco
Does not use tobacco
Number of women Cigarettes
Water pipe (nargila)
Age 15-19 8.2 14.1 84.5 278 20-24 5.8 15.4 81.3 1,207 25-29 9.3 11.1 83.5 2,006 30-34 7.6 10.2 84.7 2,136 35-39 11.2 8.0 82.9 2,098 40-44 14.0 11.0 78.6 2,055 45-49 16.6 6.9 80.0 1,571
Maternity status Pregnant 4.6 7.1 90.4 1,085 Breastfeeding (not
pregnant) 5.8 8.4 87.3 1,869 Neither 12.7 11.1 79.8 8,399
Residence Urban 11.7 11.4 80.4 9,458 Rural 6.4 4.6 90.4 1,894
Region Central 12.4 12.0 79.4 7,181 North 8.5 8.2 85.6 3,120 South 7.0 4.9 89.4 1,051
Governorate Amman 13.9 13.4 77.2 4,454 Balqa 7.9 9.7 84.8 765 Zarqa 11.3 10.2 81.4 1,659 Madaba 7.5 6.7 87.5 303 Irbid 8.9 9.2 84.2 1,986 Mafraq 7.5 6.9 87.5 562 Jarash 9.7 7.6 85.4 320 Ajloun 5.7 3.4 92.1 251 Karak 3.8 4.0 92.9 441 Tafiela 5.7 3.7 92.2 167 Ma'an 11.3 3.8 86.6 178 Aqaba 10.4 8.1 83.5 265
Badia Badia 8.0 4.2 89.2 705 Non Badia 11.0 10.7 81.6 10,647
Camps Camp 7.9 5.0 89.1 413 Non camp 10.9 10.5 81.8 10,939
Education No education 17.1 2.6 82.2 267 Elementary 16.0 6.6 79.7 860 Preparatory 16.4 11.8 76.3 1,677 Secondary 10.1 11.4 82.1 5,073 Higher 7.4 9.4 85.3 3,475
Wealth quintile Lowest 10.7 5.5 86.1 2,137 Second 10.7 7.1 85.1 2,343 Middle 9.1 9.6 84.4 2,461 Fourth 8.8 11.4 82.4 2,336 Highest 15.3 18.5 71.2 2,076
Total 10.8 10.3 82.0 11,352

38 • Respondents’ Background Characteristics
The data indicate that there are significant differences in tobacco use by women according to governorates, with women in Amman most likely to use tobacco and women in Karak least likely. Women living in the Badia and camp areas are less likely to smoke than women living in the non Badia and non camp areas.
Table 3.6 also indicates that there is a direct relationship between smoking and wealth, with the proportion of women smoking increasing with wealth from 14 percent among women in the lowest wealth quintile to 29 percent of women in the highest wealth quintile.
Women with no education are more likely to smoke cigarettes (17 percent) than women who have secondary education (10 percent) or higher (7 percent). However, the pattern differs when nargila use is considered. Only 3 percent of women with no education use tobacco with a pipe compared to 9-12 percent of women with preparatory education or higher.
Among women who smoked cigarettes, nearly one in two (47 percent) smoked 10 or more cigarettes in the past 24 hours, 8 percent smoked 6-9 cigarettes, 16 percent smoked 3-5 cigarettes, and 19 percent smoked 1-2 cigarettes. Eleven percent of women mentioned that they did not smoke any cigarettes in the past 24 hours (data not shown separately).

Marriage and Exposure to the Risk of Pregnancy • 39
MARRIAGE AND EXPOSURE TO THE RISK OF PREGNANCY 4
his chapter addresses the principal factors, other than contraception, that affect a woman’s risk of becoming pregnant: marriage, postpartum amenorrhea, and secondary infertility. In addition, data pertaining to the timing of respondents’ most recent sexual activity were collected.
Information on nuptiality is of particular interest because marriage is a primary determinant of the exposure of women to the risk of pregnancy, particularly in countries like Jordan where premarital fertility is rare. Marriage patterns are important for an understanding of fertility, since early age at first marriage is associated with early childbearing and high fertility. In this survey and for all data collection in Jordan, the term marriage refers to a formal, legal union.
4.1 CURRENT MARITAL STATUS
Table 4.1 presents the distribution of women by current marital status. Of the 19,891 women age 15-49 listed in the household schedule, 43 percent had never married, 54 percent were currently married, and the remaining 3 percent were either divorced, separated, or widowed.
Table 4.1 Current marital status
Percent distribution of women age 15-49 by current marital status, according to age, Jordan 2012
Age
Marital status
Total Number of
respondentsNever
married Married Divorced Separated Widowed
15-19 93.7 6.0 0.3 0.0 0.0 100.0 4,411 20-24 66.4 32.6 1.0 0.0 0.0 100.0 3,588 25-29 30.2 67.3 2.0 0.0 0.4 100.0 2,875 30-34 17.3 79.6 2.7 0.0 0.4 100.0 2,583 35-39 13.7 82.8 2.2 0.1 1.2 100.0 2,430 40-44 10.5 84.7 1.9 0.3 2.6 100.0 2,295 45-49 8.0 83.1 3.5 0.3 5.1 100.0 1,708
Total 15-49 42.9 54.3 1.7 0.1 1.0 100.0 19,891
T
Key Findings
• The percentage of women age 15-49 who had ever been married decreased from 59 percent to 57 percent between 2009 and 2012.
• Marriage is nearly universal in Jordan, with only 8 percent of women not married by the end of their reproductive age in 2012.
• Five percent of currently married women are in a polygynous union, with older women more likely to be in a polygynous union than younger women.
• Kinship marriages are common in Jordan and more prevalent among women living in Badia and camp areas than among other women.
• Data from the 2012 JPFHS show some evidence of a rising age at marriage in Jordan.

40 • Marriage and Exposure to the Risk of Pregnancy
The proportion of women who are currently married increases steadily from 6 percent among women age 15-19 to 83 percent among those age 35-39, then to 85 percent for women in the age group 40-44 and back to 83 percent among women age 45-49. As expected, the proportion of widows increases with age, reaching 5 percent among women age 45-49. Less than 2 percent of women in Jordan are divorced.
Table 4.2 compares data on ever-married women age 15-49 from the 2012 JPFHS with data from five previous surveys: the 1990, 1997, 2002, 2007, and 2009 JPFHS. Over a period of 12 years, between 1990 and 2002, the percentage of ever-married women age 15-49 decreased from 56 to 54 percent. However, between 2002 and 2007, the percentage of ever-married women increased from 54 to 57 percent. This increase was mainly concentrated among young women in the age groups 20-24 and 25-29. Between 2009 and 2012 the percentage of ever-married women decreased from 59 to 57 percent.
Table 4.2 Trends in the proportion of ever-married women by age group
Percentage of women age 15-49 who have ever been married by age, according to various surveys, Jordan 1990-2012
Age JPFHS 1990
JPFHS 1997
JPFHS 2002
JPFHS 2007
JPFHS 2009
JPFHS 2012
15-19 10.6 8.2 6.2 5.8 6.8 6.3 20-24 45.2 38.8 34.1 36.7 37.0 33.6 25-29 73.7 66.2 65.3 69.3 71.5 69.9 30-34 89.1 80.7 79.6 79.4 81.9 82.7 35-39 94.6 89.9 87.3 85.4 84.7 86.3 40-44 97.3 94.4 92.6 91.6 89.8 89.5 45-49 98.0 96.0 95.4 95.9 91.5 92.0
Total 15-49 56.2 54.6 54.4 57.4 58.5 57.1
In Jordan, marriage is almost universal. In 2012, only 8 percent of women had not married by the
end of their reproductive years (see Table 4.2). However, the percentage of women who have never married has generally increased over the years. For example, in 1990, 5 percent of women age 35-39 had never married; the proportion doubled in 1997 (10 percent), rose again to 13 percent in 2002, and reached 15 percent in 2007 and 2009. This percentage dropped to 14 percent in 2012. Echoing this trend, the proportion of women age 15-19 who had never married increased from 89 to 94 percent between 1990 and 2012. This change is the consequence of an increase in the age at first marriage among the youngest cohort of women.
4.2 POLYGYNY
Marital unions in Jordan are predominantly of two types—those that are monogamous and those that are polygynous. The distinction has social significance and possible implications for fertility, although the relationship between type of union and fertility is complex and not easily understood. The proportion of currently married women in Jordan in a polygynous union is shown in Table 4.3.

Marriage and Exposure to the Risk of Pregnancy • 41
Table 4.3 Number of women's co-wives
Percent distribution of currently married women age 15-49 by number of co-wives, according to background characteristics, Jordan 2012
Background characteristic
Number of co-wives
Total Number of
women 0 1 2+
Age 15-19 99.5 0.5 0.0 100.0 264 20-24 99.4 0.5 0.0 100.0 1,171 25-29 96.9 3.0 0.1 100.0 1,935 30-34 97.1 2.7 0.2 100.0 2,055 35-39 94.7 4.7 0.6 100.0 2,012 40-44 92.7 6.5 0.8 100.0 1,944 45-49 88.4 10.5 1.1 100.0 1,419
Residence Urban 95.3 4.3 0.4 100.0 8,983 Rural 93.5 5.9 0.6 100.0 1,818
Region Central 94.9 4.7 0.3 100.0 6,839 North 95.7 3.7 0.6 100.0 2,966 South 93.3 5.9 0.8 100.0 996
Governorate Amman 94.9 4.8 0.3 100.0 4,262 Balqa 94.9 4.6 0.6 100.0 724 Zarqa 95.2 4.5 0.3 100.0 1,564 Madaba 94.6 5.0 0.4 100.0 289 Irbid 96.2 3.2 0.6 100.0 1,892 Mafraq 94.4 4.9 0.7 100.0 528 Jarash 94.1 5.6 0.3 100.0 306 Ajloun 96.2 3.2 0.6 100.0 239 Karak 94.0 5.5 0.5 100.0 420 Tafiela 93.8 5.9 0.3 100.0 161 Ma'an 89.5 8.3 2.2 100.0 163 Aqaba 94.4 5.0 0.6 100.0 253
Badia Badia 89.3 9.2 1.5 100.0 666 Non Badia 95.4 4.3 0.4 100.0 10,135
Camps Camp 93.3 6.3 0.4 100.0 387 Non camp 95.0 4.5 0.5 100.0 10,414
Education No education 78.0 17.5 4.5 100.0 226 Elementary 89.4 8.9 1.7 100.0 788 Preparatory 93.6 5.9 0.6 100.0 1,547 Secondary 96.1 3.7 0.2 100.0 4,863 Higher 96.4 3.3 0.3 100.0 3,376
Wealth quintile Lowest 91.3 7.4 1.2 100.0 1,975 Second 94.2 5.4 0.4 100.0 2,179 Middle 96.4 3.3 0.2 100.0 2,364 Fourth 96.6 3.2 0.2 100.0 2,274 Highest 95.9 3.8 0.3 100.0 2,009
Total 95.0 4.6 0.5 100.0 10,801
Overall, 5 percent of currently married women in 2012 are in a polygynous union. The percentage
of women in a polygynous union has not changed in the past five years. Older women are more likely to be in a polygynous union than younger women (12 percent at age 45-49 compared with less than 1 percent at age 15-24). The prevalence of polygyny is also slightly higher in rural areas (7 percent) than in urban areas (5 percent). There are differences in type of marital union by region, governorate, and particularly residence in Badia areas: in the Badia areas, 11 percent of married women are in a polygynous union compared with 5 percent in the non Badia areas. The results show much smaller differences between camp and non camp areas (7 and 5 percent, respectively). There are also large differences in polygynous unions by household wealth. The proportion of women in the lowest wealth quintile who are in a polygynous union is 9 percent, compared with 4 percent of those in the highest wealth quintile, indicating an inverse relationship between polygyny and household wealth.
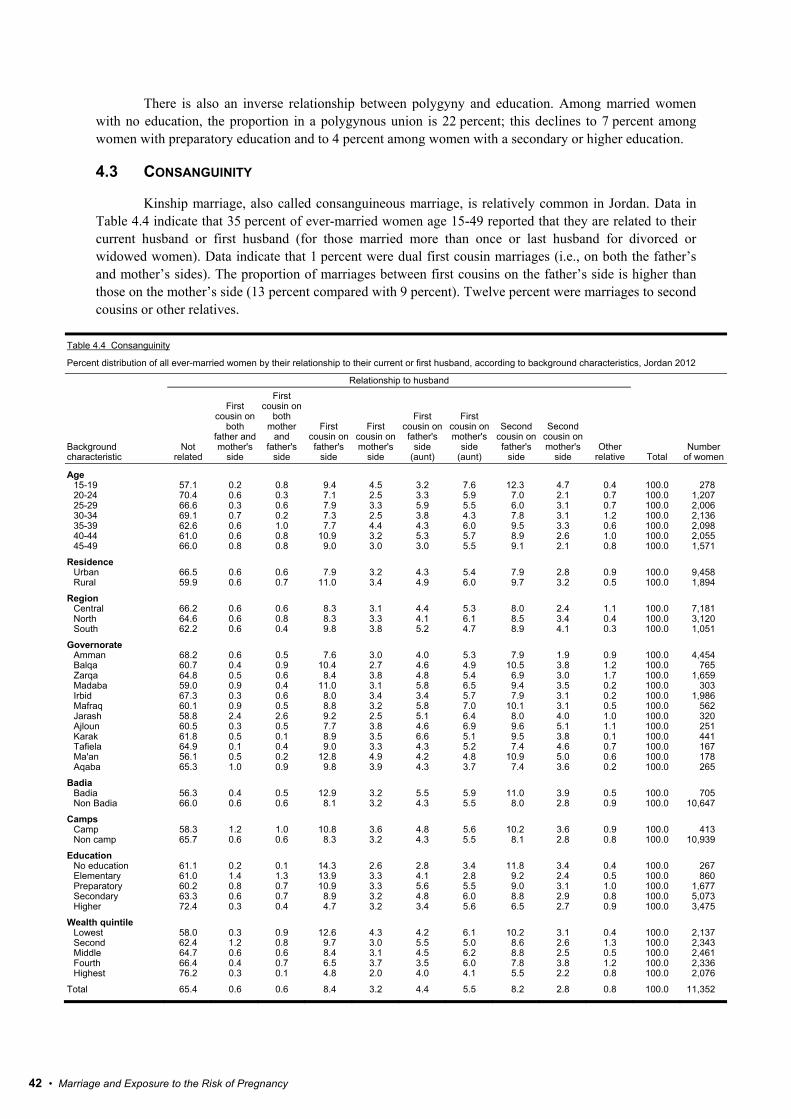
42 • Marriage and Exposure to the Risk of Pregnancy
There is also an inverse relationship between polygyny and education. Among married women with no education, the proportion in a polygynous union is 22 percent; this declines to 7 percent among women with preparatory education and to 4 percent among women with a secondary or higher education.
4.3 CONSANGUINITY
Kinship marriage, also called consanguineous marriage, is relatively common in Jordan. Data in Table 4.4 indicate that 35 percent of ever-married women age 15-49 reported that they are related to their current husband or first husband (for those married more than once or last husband for divorced or widowed women). Data indicate that 1 percent were dual first cousin marriages (i.e., on both the father’s and mother’s sides). The proportion of marriages between first cousins on the father’s side is higher than those on the mother’s side (13 percent compared with 9 percent). Twelve percent were marriages to second cousins or other relatives.
Table 4.4 Consanguinity
Percent distribution of all ever-married women by their relationship to their current or first husband, according to background characteristics, Jordan 2012
Background characteristic
Relationship to husband
Total Number
of womenNot
related
First cousin on
both father and mother's
side
First cousin on
both mother
and father's
side
First cousin on father's
side
First cousin on mother's
side
First cousin on father's
side (aunt)
First cousin on mother's
side (aunt)
Second cousin on father's
side
Second cousin on mother's
side Other
relative
Age 15-19 57.1 0.2 0.8 9.4 4.5 3.2 7.6 12.3 4.7 0.4 100.0 27820-24 70.4 0.6 0.3 7.1 2.5 3.3 5.9 7.0 2.1 0.7 100.0 1,20725-29 66.6 0.3 0.6 7.9 3.3 5.9 5.5 6.0 3.1 0.7 100.0 2,00630-34 69.1 0.7 0.2 7.3 2.5 3.8 4.3 7.8 3.1 1.2 100.0 2,13635-39 62.6 0.6 1.0 7.7 4.4 4.3 6.0 9.5 3.3 0.6 100.0 2,09840-44 61.0 0.6 0.8 10.9 3.2 5.3 5.7 8.9 2.6 1.0 100.0 2,05545-49 66.0 0.8 0.8 9.0 3.0 3.0 5.5 9.1 2.1 0.8 100.0 1,571
Residence Urban 66.5 0.6 0.6 7.9 3.2 4.3 5.4 7.9 2.8 0.9 100.0 9,458Rural 59.9 0.6 0.7 11.0 3.4 4.9 6.0 9.7 3.2 0.5 100.0 1,894
Region Central 66.2 0.6 0.6 8.3 3.1 4.4 5.3 8.0 2.4 1.1 100.0 7,181North 64.6 0.6 0.8 8.3 3.3 4.1 6.1 8.5 3.4 0.4 100.0 3,120South 62.2 0.6 0.4 9.8 3.8 5.2 4.7 8.9 4.1 0.3 100.0 1,051
Governorate Amman 68.2 0.6 0.5 7.6 3.0 4.0 5.3 7.9 1.9 0.9 100.0 4,454Balqa 60.7 0.4 0.9 10.4 2.7 4.6 4.9 10.5 3.8 1.2 100.0 765Zarqa 64.8 0.5 0.6 8.4 3.8 4.8 5.4 6.9 3.0 1.7 100.0 1,659Madaba 59.0 0.9 0.4 11.0 3.1 5.8 6.5 9.4 3.5 0.2 100.0 303Irbid 67.3 0.3 0.6 8.0 3.4 3.4 5.7 7.9 3.1 0.2 100.0 1,986Mafraq 60.1 0.9 0.5 8.8 3.2 5.8 7.0 10.1 3.1 0.5 100.0 562Jarash 58.8 2.4 2.6 9.2 2.5 5.1 6.4 8.0 4.0 1.0 100.0 320Ajloun 60.5 0.3 0.5 7.7 3.8 4.6 6.9 9.6 5.1 1.1 100.0 251Karak 61.8 0.5 0.1 8.9 3.5 6.6 5.1 9.5 3.8 0.1 100.0 441Tafiela 64.9 0.1 0.4 9.0 3.3 4.3 5.2 7.4 4.6 0.7 100.0 167Ma'an 56.1 0.5 0.2 12.8 4.9 4.2 4.8 10.9 5.0 0.6 100.0 178Aqaba 65.3 1.0 0.9 9.8 3.9 4.3 3.7 7.4 3.6 0.2 100.0 265
Badia Badia 56.3 0.4 0.5 12.9 3.2 5.5 5.9 11.0 3.9 0.5 100.0 705Non Badia 66.0 0.6 0.6 8.1 3.2 4.3 5.5 8.0 2.8 0.9 100.0 10,647
Camps Camp 58.3 1.2 1.0 10.8 3.6 4.8 5.6 10.2 3.6 0.9 100.0 413Non camp 65.7 0.6 0.6 8.3 3.2 4.3 5.5 8.1 2.8 0.8 100.0 10,939
Education No education 61.1 0.2 0.1 14.3 2.6 2.8 3.4 11.8 3.4 0.4 100.0 267Elementary 61.0 1.4 1.3 13.9 3.3 4.1 2.8 9.2 2.4 0.5 100.0 860Preparatory 60.2 0.8 0.7 10.9 3.3 5.6 5.5 9.0 3.1 1.0 100.0 1,677Secondary 63.3 0.6 0.7 8.9 3.2 4.8 6.0 8.8 2.9 0.8 100.0 5,073Higher 72.4 0.3 0.4 4.7 3.2 3.4 5.6 6.5 2.7 0.9 100.0 3,475
Wealth quintile Lowest 58.0 0.3 0.9 12.6 4.3 4.2 6.1 10.2 3.1 0.4 100.0 2,137Second 62.4 1.2 0.8 9.7 3.0 5.5 5.0 8.6 2.6 1.3 100.0 2,343Middle 64.7 0.6 0.6 8.4 3.1 4.5 6.2 8.8 2.5 0.5 100.0 2,461Fourth 66.4 0.4 0.7 6.5 3.7 3.5 6.0 7.8 3.8 1.2 100.0 2,336Highest 76.2 0.3 0.1 4.8 2.0 4.0 4.1 5.5 2.2 0.8 100.0 2,076
Total 65.4 0.6 0.6 8.4 3.2 4.4 5.5 8.2 2.8 0.8 100.0 11,352

Marriage and Exposure to the Risk of Pregnancy • 43
As expected, kinship marriages are more common among rural women (40 percent) than among urban women (34 percent). Women in the South region are slightly more likely than those in the Central and North regions to marry a relative (38 percent compared with 34 percent and 35 percent, respectively). The same is true for women in Badia areas compared with non Badia areas (44 percent compared with 34 percent). Table 4.4 also shows that women in camps are more likely to marry a relative than women in non camps (42 percent versus 34 percent). Data also reveal that there are significant differences in kinship marriages by governorates. Women in Madaba, Jarash, and Ma’an are more likely to marry a relative than women in other governorates. Further, less educated women are more likely to marry a relative than highly educated women: 28 percent of women with higher than secondary education married a relative, while 39 percent of women with no education did so.
Few variations in consanguineous marriage exist by current age, with the exception of women age 15-19, where kinship marriages are more common than among women in other age groups. Data also show that there is an inverse relationship between kinship marriage and household wealth: women in the poorest households are more likely to marry relatives than those living in the wealthiest households (42 percent versus 24 percent).
4.4 AGE AT FIRST MARRIAGE
In Jordan, almost all births occur within marriage; thus, age at first marriage is an important indicator of exposure to the risk of pregnancy and childbirth. The legal minimum age at marriage in Jordan for both women and men is 18 years.
Table 4.5 shows the percentage of women who have ever married by specified exact ages and the median age at first marriage according to their age at the time of the survey. Overall, among Jordanian women age 25-49, 15 percent of women were married by age 18 and about one in three was married by age 20. The data indicate some evidence of rising age at marriage. For example, the proportion of women married by age 18 declines from 18 percent among women age 45-49 to 8 percent among women age 20-24. A similar pattern is seen in the percentage of women married by exact age 20, 22, and 25 by women’s current age.
The last column in Table 4.5 provides further indication of later marriage among younger women. The median age at first marriage has increased, from 22.0 years among the cohort of women age 45-49 at the time of the survey to 23.0 years among the cohort of women age 25-29 and 30-34 at the time of the survey.
Another way to assess trends in age at first marriage is to compare data across surveys. The median age at first marriage for women age 25-49 rose slightly between 2002 and 2007 (from 21.8 to 22.2 years), but there was no change in the median age at first marriage between 2009 and 2012 (22.4 years).

44 • Marriage and Exposure to the Risk of Pregnancy
Table 4.5 Age at first marriage
Percentage of women age 15-49 who were first married by specific exact ages and median age at first marriage, according to current age, Jordan 2012
Current age
Percentage first married by exact age: Percentage never
married Number of
respondents
Median age at first
marriage 15 18 20 22 25
15-19 0.5 na na na na 93.7 4,411 a 20-24 0.3 8.4 19.4 na na 66.4 3,588 a 25-29 0.5 11.1 26.3 42.0 63.7 30.2 2,875 23.0 30-34 1.7 13.1 27.5 43.8 63.3 17.3 2,583 23.0 35-39 1.5 17.2 34.3 49.2 66.9 13.7 2,430 22.1 40-44 2.7 18.2 35.6 52.8 71.0 10.5 2,295 21.7 45-49 2.0 18.0 34.1 50.3 67.1 8.0 1,708 22.0
20-49 1.3 13.6 28.4 na na 28.5 15,480 a
25-49 1.6 15.1 31.1 47.1 66.2 17.0 11,892 22.4
Note: The age at first marriage is defined as the age at which the respondent began living with her first husband. na = Not applicable due to censoring a = Omitted because less than 50 percent of the women began living with their husband for the first time before reaching the beginning of the age group.
Table 4.6 shows the median age at marriage by background characteristics. There are only minor differences in the median age at first marriage by urban-rural residence and region. However, there are sizeable variations by governorates: the median age at first marriage ranges from 21.5 years in Zarqa governorate to 23.5 years in Karak. Women in non Badia and non camp areas tend to get married later than women in the Badia and camp areas. Education plays an important role in determining women’s age at marriage. Women with higher education tend to marry more than five years later than women with preparatory education, four years later than women with elementary or secondary education, and three years later than women with no education. The table also shows that women in the highest wealth quintile tend to get married later than those in the other wealth quintiles.

Marriage and Exposure to the Risk of Pregnancy • 45
Table 4.6 Median age at first marriage by background characteristics
Median age at first marriage among women age 25-49, according to background characteristics, Jordan 2012
Background characteristic
Women age 25-49
Residence Urban 22.3 Rural 22.8
Region Central 22.3 North 22.5 South 22.7
Governorate Amman 22.4 Balqa 23.1 Zarqa 21.5 Madaba 23.2 Irbid 22.6 Mafraq 22.2 Jarash 22.0 Ajloun 22.1 Karak 23.5 Tafiela 22.1 Ma'an 21.9 Aqaba 21.9
Badia Badia 21.9 Non Badia 22.4
Camps Camp 21.5 Non camp 22.4
Education No education 21.9 Elementary 20.9 Preparatory 19.5 Secondary 20.8 Higher 25.0
Wealth quintile Lowest 21.7 Second 22.1 Middle 21.9 Fourth 22.7 Highest 23.2
Total 22.4
Note: The age at first marriage is defined as the age at which the respondent began living with her first husband.
4.5 RECENT SEXUAL ACTIVITY
In the absence of effective contraception, the probability of becoming pregnant is related to the frequency of sexual intercourse. Information on sexual activity can, therefore, be used to refine measures of exposure to pregnancy. Currently married women were asked about the timing of their most recent sexual intercourse. This information is presented in Table 4.7. Overall, about nine in ten (89 percent) women stated that their most recent sexual intercourse was within the four weeks prior to the day of interview, 8 percent within the year preceding the survey, and 2 percent within one or more years before the survey.

46 • Marriage and Exposure to the Risk of Pregnancy
Table 4.7 Recent sexual activity
Percent distribution of currently married women age 15-49 by timing of last sexual intercourse, according to background characteristics, Jordan 2012
Background characteristic
Timing of last sexual intercourse
Total Number
of women
Within the past 4 weeks
Within 1 year1
One or more years Missing
Age 15-19 91.8 7.7 0.4 0.1 100.0 264 20-24 92.3 7.0 0.2 0.4 100.0 1,171 25-29 89.2 9.2 0.9 0.7 100.0 1,935 30-34 90.7 7.1 0.6 1.6 100.0 2,055 35-39 90.5 7.8 0.6 1.1 100.0 2,012 40-44 88.6 7.7 2.7 1.0 100.0 1,944 45-49 83.2 10.0 5.9 0.8 100.0 1,419
Marital duration 0-4 years 89.7 9.0 0.6 0.7 100.0 2,122 5-9 years 89.7 8.5 0.8 1.0 100.0 2,160 10-14 years 91.7 6.6 0.8 0.9 100.0 1,809 15-19 years 92.5 5.6 0.6 1.2 100.0 1,648 20-24 years 87.2 8.2 3.5 1.2 100.0 1,605 25+ years 83.8 10.1 5.4 0.7 100.0 1,094 Married more than once 81.9 13.1 3.6 1.3 100.0 363
Residence Urban 88.8 8.5 1.8 1.0 100.0 8,983 Rural 91.4 6.5 1.3 0.8 100.0 1,818
Region Central 87.6 9.4 2.0 0.9 100.0 6,839 North 92.3 5.8 1.1 0.7 100.0 2,966 South 91.1 5.8 1.3 1.8 100.0 996
Governorate Amman 85.1 11.3 2.3 1.3 100.0 4,262 Balqa 91.4 7.0 1.3 0.3 100.0 724 Zarqa 91.7 6.1 1.8 0.4 100.0 1,564 Madaba 92.1 6.1 1.2 0.6 100.0 289 Irbid 92.3 5.8 1.1 0.8 100.0 1,892 Mafraq 91.8 6.1 1.4 0.6 100.0 528 Jarash 92.2 6.3 0.5 0.9 100.0 306 Ajloun 93.7 5.4 0.3 0.6 100.0 239 Karak 92.3 6.1 0.8 0.8 100.0 420 Tafiela 88.4 6.7 2.2 2.7 100.0 161 Ma'an 90.7 6.1 1.8 1.4 100.0 163 Aqaba 91.2 4.4 1.3 3.1 100.0 253
Badia Badia 89.4 7.5 2.2 0.8 100.0 666 Non Badia 89.2 8.2 1.7 1.0 100.0 10,135
Camps Camp 90.1 7.8 1.8 0.3 100.0 387 Non camp 89.2 8.1 1.7 1.0 100.0 10,414
Education No education 86.2 8.2 5.1 0.4 100.0 226 Elementary 87.0 8.6 3.1 1.3 100.0 788 Preparatory 87.5 9.2 3.0 0.3 100.0 1,547 Secondary 91.0 7.3 0.9 0.7 100.0 4,863 Higher 88.2 8.6 1.7 1.6 100.0 3,376
Wealth quintile Lowest 88.4 8.4 2.9 0.4 100.0 1,975 Second 92.9 5.2 1.2 0.7 100.0 2,179 Middle 90.0 8.2 1.6 0.2 100.0 2,364 Fourth 90.6 6.6 1.3 1.5 100.0 2,274 Highest 83.6 12.6 1.7 2.2 100.0 2,009
Total 89.2 8.1 1.7 1.0 100.0 10,801
1 Excludes women who had sexual intercourse within the last 4 weeks.
The relationship between recent sexual activity and age, marital duration, education, and wealth
quintile is mixed. Recent sexual activity is slightly higher in rural than urban areas, is highest in the North region, with little difference between Badia and non Badia and camp and non camp areas. Currently married women in Amman are noticeably less likely to have reported recent sexual activity than women in other governorates. Women with no education are also somewhat less likely to have had sexual activity in the four weeks before the survey than women with education.
Fertility • 47
FERTILITY 5
ertility measures in this chapter are based on the reported birth histories of ever-married women age 15-49 who were interviewed in the 2012 JPFHS. Data were collected in two sections. First, each woman was asked a series of questions on the number of her sons and daughters living with her, the
number living elsewhere, and the number who had died. Second, for each live birth, she was asked to report the sex, date of birth, whether the birth was single or multiple, and whether the child was living in the household or elsewhere. The survival status of each live birth was also asked. For deceased children, the age at death was recorded. As an indicator of future fertility, information was collected on whether currently married women were pregnant at the time of the interview.
Through previous experience in using birth histories to estimate fertility levels and trends, it has been found that the underreporting of children ever born and the displacement of children’s dates of birth are common in many countries. Underreporting of children affects estimates of fertility levels, whereas misreporting of children’s date of birth distorts fertility trends over time. Regarding the latter, one of the characteristics of the 2012 JPFHS is the high quality of age and date reporting. All women were able to report their age and their date of marriage or age at marriage. For children’s age and date of birth reporting, both month and year of birth are documented for all births recorded in the birth history (see Table C.3 in Appendix C). This information lends confidence to the quality of basic data used in the estimation of fertility measures.
Two potential issues require some attention due to the fact that the fertility rates presented in this chapter are based on the birth history section of the JPFHS. First, only surviving women were interviewed in the survey. This would bias the rates if mortality of women of childbearing age were high and if fertility of surviving and non-surviving women differed significantly—neither of which is the case in Jordan. Limiting the survey respondents to ever-married women presents another potential bias. Although information on fertility was obtained only from ever-married women, estimates can be made for all women (regardless of marital status) based on information in the Household Questionnaire; these estimates assume that women who have never been married have had no children.
This chapter also analyzes levels of fertility by background characteristics of women, which include age, residence, educational level, and wealth index. Factors related to fertility, including the median age at first birth, birth intervals, and teenage fertility, are analyzed as well.
This chapter also addresses the principal factors, other than fertility, that affect a woman’s risk of becoming pregnant: postpartum amenorrhea, postpartum abstinence, and insusceptibility.
F
Key Findings
• The total fertility rate for the three years preceding the survey is 3.5 births per woman, a 38 percent decline from the rate recorded in 1990.
• Fertility decline has stalled in the past decade, with a mere 5 percent decline between 2002 and 2012.
• More than two-thirds of all children (68 percent) are born at least two years after their siblings.
• The median age at first birth has changed little between 2007 and 2012 but has declined by almost one year between 1997 and 2012.
• Five percent of adolescent women age 15-19 are already mothers or pregnant with their first child.
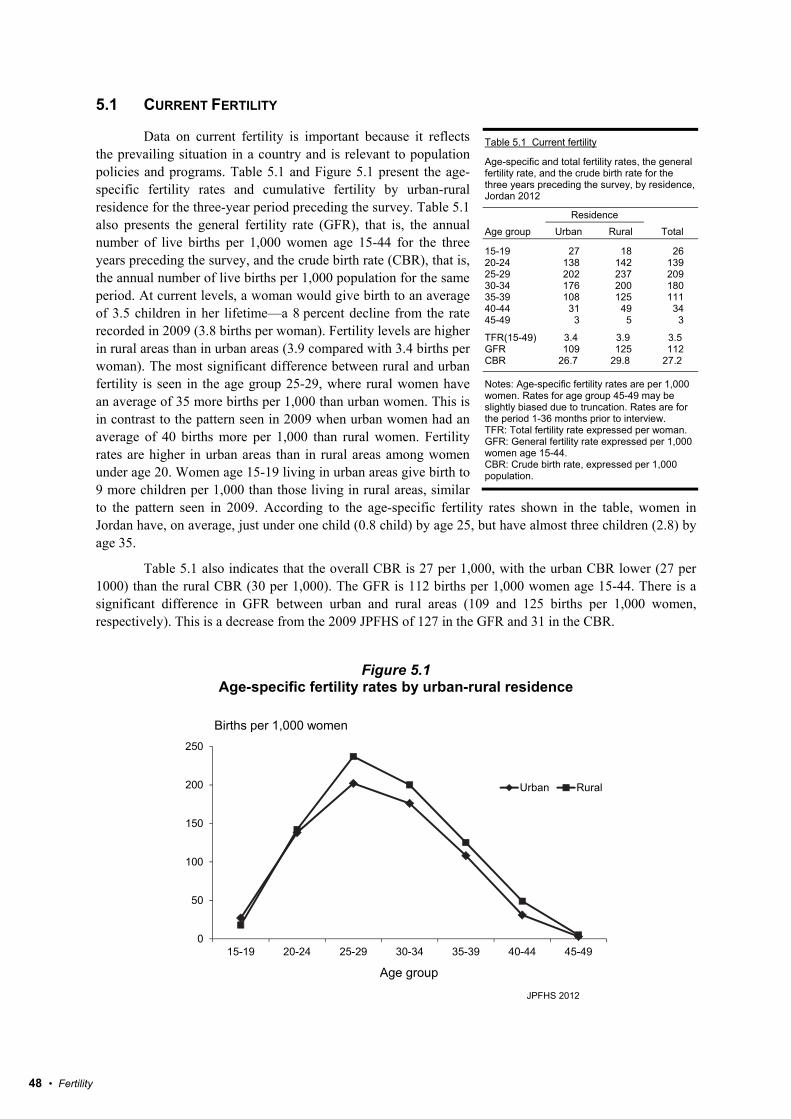
48 • Fertility
5.1 CURRENT FERTILITY
Data on current fertility is important because it reflects the prevailing situation in a country and is relevant to population policies and programs. Table 5.1 and Figure 5.1 present the age-specific fertility rates and cumulative fertility by urban-rural residence for the three-year period preceding the survey. Table 5.1 also presents the general fertility rate (GFR), that is, the annual number of live births per 1,000 women age 15-44 for the three years preceding the survey, and the crude birth rate (CBR), that is, the annual number of live births per 1,000 population for the same period. At current levels, a woman would give birth to an average of 3.5 children in her lifetime—a 8 percent decline from the rate recorded in 2009 (3.8 births per woman). Fertility levels are higher in rural areas than in urban areas (3.9 compared with 3.4 births per woman). The most significant difference between rural and urban fertility is seen in the age group 25-29, where rural women have an average of 35 more births per 1,000 than urban women. This is in contrast to the pattern seen in 2009 when urban women had an average of 40 births more per 1,000 than rural women. Fertility rates are higher in urban areas than in rural areas among women under age 20. Women age 15-19 living in urban areas give birth to 9 more children per 1,000 than those living in rural areas, similar to the pattern seen in 2009. According to the age-specific fertility rates shown in the table, women in Jordan have, on average, just under one child (0.8 child) by age 25, but have almost three children (2.8) by age 35.
Table 5.1 also indicates that the overall CBR is 27 per 1,000, with the urban CBR lower (27 per 1000) than the rural CBR (30 per 1,000). The GFR is 112 births per 1,000 women age 15-44. There is a significant difference in GFR between urban and rural areas (109 and 125 births per 1,000 women, respectively). This is a decrease from the 2009 JPFHS of 127 in the GFR and 31 in the CBR.
Figure 5.1
Age-specific fertility rates by urban-rural residence
JPFHS 2012
0
50
100
150
200
250
15-19 20-24 25-29 30-34 35-39 40-44 45-49
Births per 1,000 women
Age group
Urban Rural
Table 5.1 Current fertility
Age-specific and total fertility rates, the general fertility rate, and the crude birth rate for the three years preceding the survey, by residence, Jordan 2012
Age group
Residence
Total Urban Rural
15-19 27 18 26 20-24 138 142 139 25-29 202 237 209 30-34 176 200 180 35-39 108 125 111 40-44 31 49 34 45-49 3 5 3
TFR(15-49) 3.4 3.9 3.5 GFR 109 125 112 CBR 26.7 29.8 27.2
Notes: Age-specific fertility rates are per 1,000 women. Rates for age group 45-49 may be slightly biased due to truncation. Rates are for the period 1-36 months prior to interview. TFR: Total fertility rate expressed per woman. GFR: General fertility rate expressed per 1,000 women age 15-44. CBR: Crude birth rate, expressed per 1,000 population.

Fertility • 49
5.2 FERTILITY DIFFERENTIALS BY BACKGROUND CHARACTERISTICS
Fertility differentials according to background characteristics of women are shown in Table 5.2 and Figure 5.2. The first column of the table shows the total fertility rates for the three years preceding the survey; column two shows the percentage of women who were pregnant at the time of data collection; and column three shows the mean number of children ever born (CEB) to women age 40-49. CEB is an indicator of cumulative fertility and reflects the fertility of older women who are nearing the end of their reproductive years, representing completed fertility. When fertility remains constant over time, TFR and CEB will be the same or almost the same. In the 2012 JPFHS, however, the fact that the completed fertility rate (4.6 children per woman) is much higher than the total fertility rate (3.5 children per woman) indicates a considerable decline in fertility; this finding is consistent with the decline in fertility in Jordan over the past 30 years.
Urban women have on average half a child less than rural women. Fertility is highest in the North (3.8 children per woman), followed by the South (3.7) and the Central (3.4). Fertility levels vary considerably by governorate; the TFR ranges from a low of 3.2 children per woman in Amman to a high of 4.3 children per woman in Jarash. In addition, women living in Badia areas have on average one child more than women living in the non Badia areas (4.4 and 3.4 children per woman, respectively).
Fertility varies significantly by education. It is of interest to note that the relationship of education to fertility is not linear as in most other countries; rather, in Jordan it has an inverted U-shape. Surprisingly, women who have secondary education have the highest fertility (4.2 births per woman), in contrast with women with no education and those with higher education who have the lowest fertility (3.0 children per woman). However, women who have higher than secondary education have 1.2 fewer births than women with a secondary education. These figures suggest that postsecondary education for women is associated with lower levels of fertility.
The TFR also varies considerably according to wealth index in an inverse pattern that is commonly seen in other countries. Fertility declines as household wealth increases, from 4.4 births per woman among women in the poorest households to 2.6 children among women in the richest households.
Table 5.2 Fertility by background characteristics
Total fertility rate for the three years preceding the survey, percentage of women age 15-49 currently pregnant, and mean number of children ever born to women age 40-49 years, by background characteristics, Jordan 2012
Background characteristic
Total fertility rate
Percentage of women age 15-49 currently pregnant
Mean number of
children ever born to
women age 40-49
Residence Urban 3.4 5.5 4.5Rural 3.9 5.4 5.0
Region Central 3.4 5.1 4.4North 3.8 6.2 4.8South 3.7 5.7 5.1
Governorate Amman 3.2 5.0 4.4Balqa 3.8 5.4 4.3Zarqa 3.6 5.0 4.5Madaba 3.5 5.8 4.9Irbid 3.6 6.3 4.6Mafraq 4.1 6.0 5.1Jarash 4.3 5.5 5.4Ajloun 3.8 7.1 5.5Karak 3.5 5.7 4.6Tafiela 3.9 7.7 5.5Ma'an 4.1 5.0 5.9Aqaba 3.7 5.4 5.0
Badia Badia 4.4 6.8 5.6Non Badia 3.4 5.4 4.5
Camps Camp 3.7 3.9 5.0Non camp 3.5 5.5 4.5
Education No education 3.0 3.4 5.8Elementary 3.9 5.1 5.3Preparatory 3.8 3.2 5.0Secondary 4.2 6.7 4.6Higher 3.0 5.6 3.9
Wealth quintile Lowest 4.4 5.2 5.5Second 3.9 5.6 4.9Middle 3.6 7.4 4.4Fourth 3.1 4.8 4.3Highest 2.6 4.5 3.9
Total 3.5 5.5 4.6
Note: Total fertility rates are for the period 1-36 months prior to interview.

50 • Fertility
Table 5.2 also shows that 6 percent of all women of reproductive age were pregnant at the time of the survey. The percentages of women pregnant by region, Badia, and education follow a pattern roughly similar to that of fertility. The percentage of women pregnant ranges from a high of 8 percent in Tafiela to a low of 5 percent in Amman, Zarqa, and Ma’an. By wealth quintile, women in the middle wealth quintile were most likely to be pregnant at the time of the survey (7 percent), and women in the highest wealth quintile least likely (5 percent).
Figure 5.2
Total fertility rates by background characteristics
5.3 FERTILITY TRENDS
Fertility trends can also be investigated by using retrospective data from a single survey. The birth history information collected in the 2012 JPFHS is used for this purpose. Data in Table 5.3 and Figure 5.3 indicate that fertility has been declining in all age groups. For example, the age-specific fertility rate for women age 25-29 declined from 274 births per 1,000 women in the 15-19 years preceding the survey to 218 births per 1,000 women in the 5-9 year period before the survey, a 20 percent decline. More recently, between the 5-9 and 0-4 year period prior to the survey a slower pace in fertility decline is observed—a 3 percent decline.
3.5
3.4
3.9
3.4
3.8
3.7
4.4
3.9
3.6
3.1
2.6
TOTAL
RESIDENCE
Urban
Rural
REGION
Central
North
South
WEALTH QUINTILE
Lowest
Second
Middle
Fourth
Highest
Total fertility rateJPFHS 2012
Table 5.3 Trends in age-specific fertility rates
Age-specific fertility rates for five-year periods preceding the survey, by mother's age at the time of the birth, Jordan 2012
Mother's age at birth
Number of years preceding survey 0-4 5-9 10-14 15-19
15-19 27 37 42 6120-24 149 176 189 22925-29 211 218 227 27430-34 183 181 190 [220]35-39 115 120 [120] 40-44 38 [51] 45-49 [3]
Note: Age-specific fertility rates are per 1,000 women. Estimates in brackets are truncated. Rates exclude the month of interview.

Fertility • 51
Figure 5.3 Age-specific fertility rates for five-year periods preceding the survey
JPFHS 2012
These trends in fertility decline from retrospective data collected in the 2012 JPFHS are consistent
with the fertility trends observed from comparing with the five previous surveys—the 1990, 1997, 2002, 2007, and 2009 JPFHS. The calculated rates for these surveys refer to the three years preceding each survey (1988-1990, 1995-1997, 2000-2002, 2005-2007, 2007-2009, and 2010-2012, respectively). Comparison of the findings from these surveys shows trends in fertility levels over more than two decades. Data in Table 5.4 indicate that the pace of fertility decline was rapid until 2002, but has since slowed down. Fertility declined by 21 percent between 1990 and 1997 (dropping from 5.6 to 4.4 births per woman) and 16 percent between 1997 and 2002 (dropping from 4.4 to 3.7 births per woman). However, the fertility decline has stagnated in the last decade, with fertility decline a mere 5 percent (from 3.7 to 3.5 births per woman).
Table 5.4 Trends in fertility
Age-specific fertility rates and total fertility rates, various surveys, Jordan 1990-2012
Age group JPFHS 1990
JPFHS 1997
JPFHS 2002
JPFHS 2007
JPFHS 2009
JPFHS 2012
15-19 49 43 28 28 32 26 20-24 219 172 150 148 152 139 25-29 296 246 202 212 238 209 30-34 264 206 184 162 182 180 35-39 188 144 122 121 126 111 40-44 79 48 43 41 37 34 45-49 19 11 5 6 3 3
TFR 15-49 5.6 4.4 3.7 3.6 3.8 3.5
Notes: Age-specific fertility rates are per 1,000 women. Rates for age group 45-49 may be slightly biased due to truncation. Rates are for the period 1-36 months prior to interview. TFR: Total fertility rate expressed per woman
The most significant proportional decline has been observed among women 40-49: a 57 percent
drop from 79 births per 1,000 women in 1990 to 34 births in 2012 for women age 40-44 and an 84 percent decline for women age 45-49 over the same period (Figure 5.4). The bulk of the decline in fertility since 2002 can be attributed to the decrease in the number of births among women between the ages of 20 and 39. Among all the surveys the age-specific fertility rates are highest for the 25-29 age group. These results indicate that the decline of the TFR has temporarily stalled in Jordan. This phenomenon (stability in the TFR after a long decline) has been observed in neighboring countries, such as Egypt (El-Zanaty and Way, 2009), as well.
0100200300400500600700800900
1000
15-19 20-24 25-29 30-34 35-39 40-44 45-49
Births per 1,000 women
0-4 5-9 10-14 15-19

52 • Fertility
Figure 5.4 Trends in age-specific fertility rates, various sources, 1990-2012
5.4 CHILDREN EVER BORN
Table 5.5 presents the distribution of all women and currently married women by the number of children they have had. In the 2012 JPFHS, information on the reproductive history of never-married women was not collected. However, since almost no births in Jordan take place before marriage, it is assumed that never-married women have had no births. The data represent the accumulation of births over time. The difference in fertility between all women and currently married women is due to the proportion of women who were not married at the time of the survey (i.e., single, divorced, or widowed). On average, women have given birth to 1.6 children by their late twenties, 3.7 children by their late thirties, and 4.7 children by the end of their reproductive period.
Table 5.5 Children ever born and living
Percent distribution of all women and currently married women age 15-49 by number of children ever born, mean number of children ever born, and mean number of living children, according to age group, Jordan 2012
Age Number of children ever born
Total
Number of
women
Mean number
of children
ever born
Mean number of living children0 1 2 3 4 5 6 7 8 9 10+
ALL WOMEN
15-19 96.5 2.9 0.6 0.0 0.0 0.0 0.0 0.0 0.0 0.0 0.0 100.0 4,411 0.04 0.0420-24 74.7 12.1 8.9 3.8 0.4 0.1 0.0 0.0 0.0 0.0 0.0 100.0 3,588 0.43 0.4325-29 37.2 13.1 20.4 17.2 8.0 3.5 0.4 0.1 0.2 0.0 0.0 100.0 2,875 1.59 1.5530-34 21.5 7.9 14.6 20.2 18.4 10.5 4.9 1.2 0.6 0.1 0.1 100.0 2,583 2.68 2.6335-39 18.8 3.2 6.4 13.1 20.5 16.9 11.4 4.8 3.3 1.2 0.4 100.0 2,430 3.66 3.5540-44 15.2 2.5 4.2 9.8 15.7 16.9 14.6 8.6 6.6 3.0 3.0 100.0 2,295 4.48 4.3345-49 14.8 2.6 4.6 11.0 14.4 13.9 11.7 10.2 7.1 4.3 5.5 100.0 1,708 4.67 4.46
Total 48.4 6.7 8.2 9.5 9.2 7.1 4.8 2.6 1.9 0.9 0.9 100.0 19,891 2.03 1.97
CURRENTLY MARRIED WOMEN
15-19 42.8 47.8 9.4 0.0 0.0 0.0 0.0 0.0 0.0 0.0 0.0 100.0 264 0.67 0.6520-24 24.1 35.8 27.3 11.4 1.3 0.2 0.0 0.0 0.0 0.0 0.0 100.0 1,171 1.31 1.2825-29 8.5 18.7 29.9 25.3 11.6 5.1 0.6 0.1 0.3 0.0 0.0 100.0 1,935 2.33 2.2730-34 4.0 9.1 16.9 25.3 22.8 13.2 6.2 1.5 0.7 0.1 0.1 100.0 2,055 3.32 3.2435-39 4.8 3.2 6.9 15.5 24.3 19.9 13.7 5.8 3.7 1.5 0.5 100.0 2,012 4.32 4.1940-44 3.8 2.5 4.4 11.0 17.8 19.5 16.8 10.1 7.5 3.2 3.4 100.0 1,944 5.10 4.9345-49 6.7 2.7 5.0 12.2 14.4 15.3 13.4 11.3 7.9 4.7 6.3 100.0 1,419 5.18 4.94
Total 8.4 11.5 14.5 17.0 16.2 12.7 8.6 4.7 3.3 1.5 1.5 100.0 10,801 3.61 3.50
0
50
100
150
200
250
300
15-19 20-24 25-29 30-34 35-39 40-44
Births per 1,000 women
Age group
JPFHS 1990 JPFHS 1997 JPFHS 2002 JPFHS 2007 JPFHS 2009 JPFHS 2012

Fertility • 53
Differences in the mean number of children born and living are notable after women have reached the age of 40. Caution should be exercised in interpreting the data for women in the oldest age groups because of possible recall problems; older women are more likely to omit a child, particularly if the child died at a young age or is living away from the mother. Data in Table 5.5 indicate very little variation between the mean number of children ever born and the mean number of children still living for all women age 15-49 (2.03 and 1.97 children, respectively). The data also indicate that, on average, currently married women have given birth to 2.3 children by their late twenties, 4.3 children by their late thirties, and about 5.2 children by the end of their reproductive period. The mean number of children ever born is 3.6, compared with 3.5 children still living.
5.5 BIRTH INTERVALS
A birth interval is the period of time between two successive live births. Research has shown that children born soon after a previous birth are at greater risk of illness and death. The percent distribution of births in the five years before the survey by number of months since preceding birth is shown in Table 5.6.
Women in Jordan prefer relatively long birth intervals: the median birth interval among children born in the five years preceding the survey is 31.7 months, 0.5 months longer than that recorded in the 2007 JPFHS.
More than two-thirds of all children (68 percent) are born at least two years after their siblings. This figure is only marginally higher than that found in 2007 and 2002, but represents a marked increase when compared with 1997 (56 percent). More than two in five (42 percent) children are born after an interval of three years or longer, compared with 41 percent in 2007, 37 percent in 2002, and 26 percent in 1997. As expected, children born to younger women and low-parity women have shorter birth intervals than those born to older women and high-parity women. The birth interval following a child who has died is shorter than the interval following the birth of a surviving child (21 months compared with 32 months). The length of birth intervals varies little according to urban-rural residence, region, and camps. Birth interval is shortest in Jarash and longest in Irbid. Women in Badia areas have shorter birth intervals than women in the non Badia areas. Birth interval increases with education and wealth quintile. Women with no education have a median birth interval about four months shorter than women with secondary and higher education. Similarly, women in the lowest wealth quintile have a birth interval seven months shorter than women in the highest wealth quintile.

54 • Fertility
Table 5.6 Birth intervals
Percent distribution of non-first births in the five years preceding the survey by number of months since preceding birth, and median number of months since preceding birth, according to background characteristics, Jordan 2012
Background characteristic
Months since preceding birth
Total
Number of non-first
births
Median number of
months since
preceding birth 7-17 18-23 24-35 36-47 48-59 60+
Age 15-19 * * * * * * 100.0 24 * 20-29 22.6 23.7 30.7 13.7 5.5 3.8 100.0 2,578 25.1 30-39 12.0 14.7 25.2 17.9 13.1 17.2 100.0 3,895 35.1 40-49 6.2 7.9 19.3 14.0 16.7 35.7 100.0 982 49.9
Sex of preceding birth Male 14.6 15.4 25.7 16.6 11.1 16.6 100.0 3,800 32.8 Female 15.5 18.5 27.0 15.1 10.8 13.2 100.0 3,679 30.4
Survival of preceding birth Living 14.5 16.9 26.6 16.0 11.0 15.0 100.0 7,310 31.9 Dead 36.7 18.5 16.3 8.9 5.3 14.2 100.0 169 21.1
Birth order 2-3 19.9 20.2 29.4 13.9 8.3 8.3 100.0 3,809 27.4 4-6 10.0 13.4 22.4 18.8 13.8 21.5 100.0 2,997 38.7 7+ 9.9 13.6 26.4 13.7 13.1 23.3 100.0 673 36.0
Residence Urban 14.8 17.3 26.3 15.0 11.1 15.5 100.0 6,062 31.7 Rural 15.9 15.3 26.7 19.3 10.1 12.7 100.0 1,417 31.6
Region Central 15.1 16.7 26.7 15.3 11.0 15.2 100.0 4,585 31.7 North 14.4 17.3 25.6 17.1 11.0 14.7 100.0 2,142 32.1 South 16.5 17.1 26.3 15.7 10.2 14.2 100.0 751 30.7
Governorate Amman 15.0 16.4 26.1 15.4 10.7 16.4 100.0 2,720 32.3 Balqa 16.1 17.2 28.8 13.9 9.6 14.3 100.0 546 29.5 Zarqa 14.6 18.1 26.7 15.2 12.5 12.9 100.0 1,110 30.7 Madaba 17.1 12.6 28.5 17.5 10.4 14.0 100.0 209 32.3 Irbid 12.9 16.9 24.8 17.3 11.7 16.5 100.0 1,260 34.0 Mafraq 16.5 17.8 28.1 17.1 8.9 11.6 100.0 447 29.5 Jarash 18.5 17.5 26.6 16.2 10.0 11.3 100.0 258 29.4 Ajloun 13.2 18.3 24.1 17.5 12.6 14.2 100.0 178 32.3 Karak 16.2 15.8 28.3 16.0 11.7 12.1 100.0 317 31.2 Tafiela 16.1 18.4 25.5 17.2 9.4 13.4 100.0 120 30.0 Ma'an 18.2 18.5 27.3 13.3 8.8 14.0 100.0 142 29.6 Aqaba 16.2 17.6 22.4 16.0 9.2 18.6 100.0 172 31.2
Badia Badia 17.4 18.2 30.5 15.2 8.4 10.2 100.0 606 28.7 Non Badia 14.8 16.8 26.0 15.9 11.1 15.3 100.0 6,873 32.0
Camps Camp 12.5 16.2 30.7 15.0 12.1 13.6 100.0 320 31.2 Non camp 15.2 16.9 26.1 15.9 10.9 15.0 100.0 7,159 31.7
Education No education 15.9 19.8 29.3 14.1 8.9 12.0 100.0 176 28.1 Elementary 15.6 19.8 26.2 12.2 9.4 16.9 100.0 542 28.9 Preparatory 14.9 17.5 26.0 14.2 10.6 16.8 100.0 1,060 31.0 Secondary 15.6 15.6 26.1 16.1 10.8 15.8 100.0 3,591 32.3 Higher 14.0 17.9 26.7 17.4 11.8 12.3 100.0 2,109 32.0
Wealth quintile Lowest 16.3 19.5 28.5 15.1 9.6 11.0 100.0 1,866 28.7 Second 19.9 18.5 25.0 14.8 10.0 11.8 100.0 1,645 28.8 Middle 12.7 16.4 26.9 16.8 11.2 15.9 100.0 1,570 33.2 Fourth 12.0 14.5 25.5 18.8 11.7 17.4 100.0 1,411 34.6 Highest 12.7 13.7 24.7 13.2 13.2 22.4 100.0 988 35.7
Total 15.0 16.9 26.3 15.9 10.9 14.9 100.0 7,479 31.7
Note: First-order births are excluded. The interval for multiple births is the number of months since the preceding pregnancy that ended in a live birth. An asterisk indicates that a figure is based on fewer than 25 unweighted cases and has been suppressed.
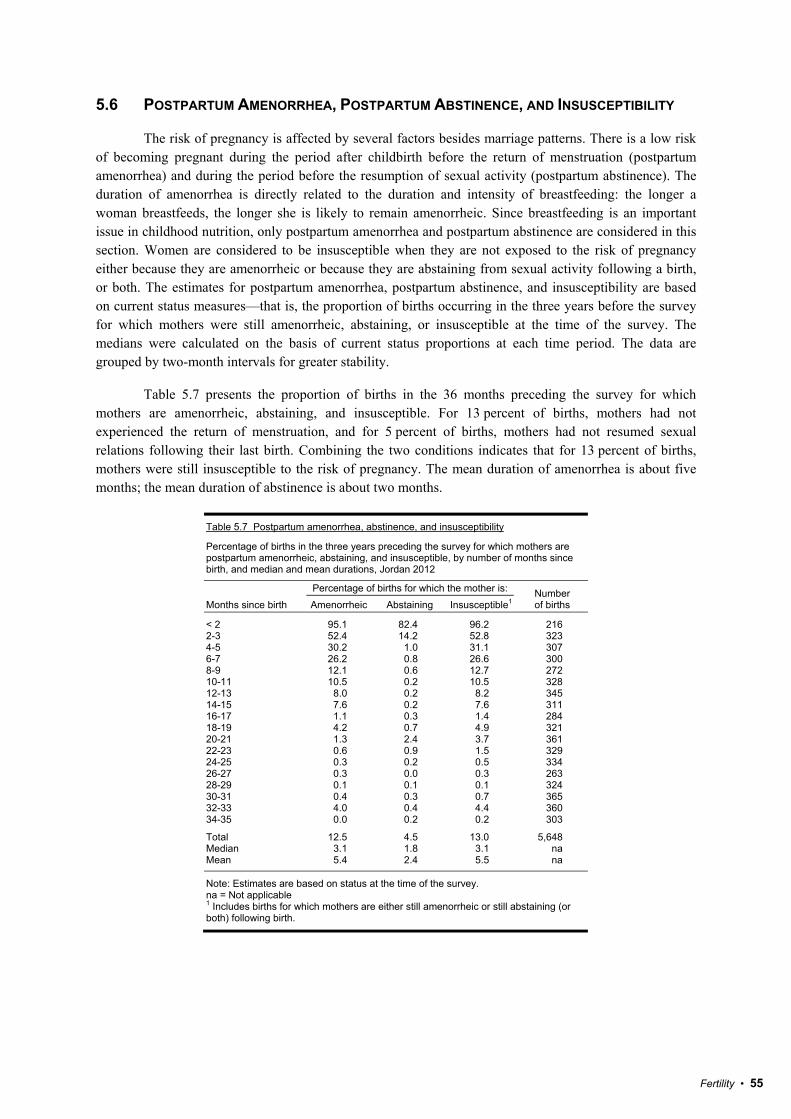
Fertility • 55
5.6 POSTPARTUM AMENORRHEA, POSTPARTUM ABSTINENCE, AND INSUSCEPTIBILITY
The risk of pregnancy is affected by several factors besides marriage patterns. There is a low risk of becoming pregnant during the period after childbirth before the return of menstruation (postpartum amenorrhea) and during the period before the resumption of sexual activity (postpartum abstinence). The duration of amenorrhea is directly related to the duration and intensity of breastfeeding: the longer a woman breastfeeds, the longer she is likely to remain amenorrheic. Since breastfeeding is an important issue in childhood nutrition, only postpartum amenorrhea and postpartum abstinence are considered in this section. Women are considered to be insusceptible when they are not exposed to the risk of pregnancy either because they are amenorrheic or because they are abstaining from sexual activity following a birth, or both. The estimates for postpartum amenorrhea, postpartum abstinence, and insusceptibility are based on current status measures—that is, the proportion of births occurring in the three years before the survey for which mothers were still amenorrheic, abstaining, or insusceptible at the time of the survey. The medians were calculated on the basis of current status proportions at each time period. The data are grouped by two-month intervals for greater stability.
Table 5.7 presents the proportion of births in the 36 months preceding the survey for which mothers are amenorrheic, abstaining, and insusceptible. For 13 percent of births, mothers had not experienced the return of menstruation, and for 5 percent of births, mothers had not resumed sexual relations following their last birth. Combining the two conditions indicates that for 13 percent of births, mothers were still insusceptible to the risk of pregnancy. The mean duration of amenorrhea is about five months; the mean duration of abstinence is about two months.
Table 5.7 Postpartum amenorrhea, abstinence, and insusceptibility
Percentage of births in the three years preceding the survey for which mothers are postpartum amenorrheic, abstaining, and insusceptible, by number of months since birth, and median and mean durations, Jordan 2012
Months since birth
Percentage of births for which the mother is: Number of births Amenorrheic Abstaining Insusceptible1
< 2 95.1 82.4 96.2 216 2-3 52.4 14.2 52.8 323 4-5 30.2 1.0 31.1 307 6-7 26.2 0.8 26.6 300 8-9 12.1 0.6 12.7 272 10-11 10.5 0.2 10.5 328 12-13 8.0 0.2 8.2 345 14-15 7.6 0.2 7.6 311 16-17 1.1 0.3 1.4 284 18-19 4.2 0.7 4.9 321 20-21 1.3 2.4 3.7 361 22-23 0.6 0.9 1.5 329 24-25 0.3 0.2 0.5 334 26-27 0.3 0.0 0.3 263 28-29 0.1 0.1 0.1 324 30-31 0.4 0.3 0.7 365 32-33 4.0 0.4 4.4 360 34-35 0.0 0.2 0.2 303
Total 12.5 4.5 13.0 5,648 Median 3.1 1.8 3.1 na Mean 5.4 2.4 5.5 na
Note: Estimates are based on status at the time of the survey. na = Not applicable 1 Includes births for which mothers are either still amenorrheic or still abstaining (or both) following birth.

56 • Fertility
For 95 percent of births, mothers were still amenorrheic in the first two months following childbirth. The percentage drops to 52 between two and three months after birth, and drops further to 30 percent in the subsequent two months. In Jordan, as in other Islamic societies, women observe sexual abstinence after childbirth. The period of postpartum abstinence traditionally lasts 40 days. The observance of this practice is noticeable in the 2012 JPFHS data. Mothers of 82 percent of the children born during the two months before the survey were still abstaining from sexual relations at the time of the survey. For births two and three months before the survey, 14 percent of mothers were still abstaining, with the percentage declining to 1 percent and below in subsequent months.
Table 5.8 presents the median duration of postpartum amenorrhea (3.1 months), postpartum abstinence (1.8 months), and postpartum insuscepti-bility (3.1 months). There is no clear pattern for the three medians by background characteristics. For example, the duration of postpartum amenorrhea and, consequently, insusceptibility both decline slightly with increasing level of education. Postpartum insusceptibility is one month lower among women who live in the South region than among women in the Central region. Women in the lowest wealth quintile are insusceptible for about two months less than women in the highest wealth quintile.
Table 5.8 Median duration of amenorrhea, postpartum abstinence, and postpartum insusceptibility
Median number of months of postpartum amenorrhea, postpartum abstinence, and postpartum insusceptibility following births in the three years preceding the survey, by background characteristics, Jordan 2012
Background characteristic
Postpartum amenorrhea
Postpartum abstinence
Postpartum insusceptibility1
Mother's age 15-29 2.9 1.7 3.030-49 3.2 1.8 3.2
Residence Urban 3.2 1.8 3.2Rural 2.7 1.7 2.8
Region Central 3.3 1.9 3.4North 2.8 1.6 3.0South 2.3 1.7 2.4
Governorate Amman 3.6 (2.0) 3.6Balqa * * *Zarqa 2.9 * 2.9Madaba 3.3 * 3.4Irbid 2.6 * 2.8Mafraq 3.3 * 3.4Jarash 3.0 (1.4) 3.2Ajloun * * 2.7Karak * * *Tafiela 3.6 * 3.7Ma'an 3.4 * 3.4Aqaba * * *
Badia Badia 3.0 (1.6) 3.0Non Badia 3.1 1.8 3.1
Camps Camp 3.4 * 3.4Non camp 3.0 1.8 3.1
Education No education * * *Elementary * * *Preparatory 3.4 (2.3) 3.5Secondary 3.2 1.7 3.3Higher 2.9 1.7 3.0
Wealth quintile Lowest 2.5 1.5 2.5Second 3.4 1.7 3.5Middle 2.7 1.7 2.9Fourth 3.0 (2.0) 3.0Highest 4.4 * 4.5
Total 3.1 1.8 3.1
Note: Medians are based on the status at the time of the survey (current status). Figures in parentheses are based on 25-49 unweighted cases; an asterisk indicates that a figure is based on fewer than 25 unweighted cases and has been suppressed. 1 Includes births for which mothers are either still amenorrheic or still abstaining (or both) following birth.

Fertility • 57
5.7 MENOPAUSE
This section addresses menopause (i.e., termination of exposure to pregnancy and childbearing) for women age 30-49. Exposure to pregnancy is affected by the terminal amenorrhea of older women. Table 5.9 shows the percentage of ever-married women age 30-49 who are menopausal. For the purpose of this survey, lack of a menstrual period in the six months preceding the survey among women who are neither pregnant nor postpartum amenorrheic is taken as evidence of menopause, and therefore infecundity.
Table 5.9 shows few cases of menopausal women under the age of 40. Beyond this age, the percentage of menopausal women increases with age. The proportion rises from 2 percent among women age 42-43 to 13 percent among those age 46-47, and further to 21 percent for women age 48-49.
5.8 AGE AT FIRST BIRTH
The onset of childbearing is an important indicator of fertility. In Jordan, the postponement of first births (reflecting a later age at first marriage) has contributed to the overall decline in fertility. Table 5.10 shows the distribution of women by age at first birth. Women under age 25 were not included in the calculation of median age at first birth because more than half had not yet given birth. Overall, for women 25-49 years old, median age at first birth has changed little between 2007 and 2012, but has declined by almost one year between 1997 and 2012. Figures in the last column suggest an increasing median age at first birth across age cohorts. Women in younger cohorts are likely to have their first birth at an older age than women in older cohorts. For example, women age 25-29 give birth to their first child one year later than women age 45-49.
Table 5.10 Age at first birth
Percentage of women age 15-49 who gave birth by exact ages, percentage who have never given birth, and median age at first birth, according to current age, Jordan 2012
Current age
Percentage who gave birth by exact age Percentage who have
never given birth
Number of women
Median age at first birth 15 18 20 22 25
15-19 0.0 na na na na 96.5 4,411 a 20-24 0.0 3.6 10.8 na na 74.7 3,588 a 25-29 0.0 3.8 14.3 29.0 51.9 37.2 2,875 24.7 30-34 0.1 6.0 16.9 30.9 52.5 21.5 2,583 24.6 35-39 0.0 7.4 22.3 38.0 56.5 18.8 2,430 24.0 40-44 0.0 7.2 22.4 39.4 63.4 15.2 2,295 23.2 45-49 0.5 7.6 21.4 36.9 58.0 14.8 1,708 23.6
25-49 0.1 6.2 19.1 34.4 56.1 22.6 11,892 24.0
na = Not applicable due to censoring a = Omitted because less than 50 percent of women had a birth before reaching the beginning of the age group.
Table 5.9 Menopause
Percentage of ever-married women age 30-49 who are menopausal, by age, Jordan 2012
Age Percentage
menopausal1 Number of
women
30-34 0.5 2,136 35-39 0.3 2,098 40-41 1.4 888 42-43 2.0 747 44-45 6.3 785 46-47 12.8 638 48-49 21.4 568
Total 3.8 7,860 1 Percentage of ever-married women who are not pregnant and not postpartum amenorrheic whose last menstrual period occurred six or more months preceding the survey.

58 • Fertility
Table 5.11 presents the differentials in age at first birth among women age 25-49 by background characteristics. Rural women begin childbearing half a year later than urban women (24.5 years compared with 23.9 years), and a similar pattern is seen between the non Badia and Badia areas (24.1 years compared with 23.6 years, respectively) and non camp and camp areas (24.1 years and 23.3 years, respectively). There are smaller differences in the median age at first birth by region, while there are noticeable variations according to governorates. The median age at first birth varies from 23.1 years in Zarqa to 24.9 years in Madaba. Contrary to the pattern seen in most other countries, the median age at first birth is two years higher among women with no education (24.5 years) than among women with secondary education (22.4 years). Not surprisingly, women in the poorest households have their first child more than a year earlier than women in the wealthiest households (23.5 versus 24.8).
Table 5.11 Median age at first birth
Median age at first birth among women age 25-49 years, according to background characteristics, Jordan 2012
Background characteristic
Women age
25-49
ResidenceUrban 23.9Rural 24.5
RegionCentral 23.9North 24.2South 24.3
GovernorateAmman 24.0Balqa 24.8Zarqa 23.1Madaba 24.9Irbid 24.4Mafraq 23.9Jarash 23.7Ajloun 24.0Karak aTafiela 23.8Ma'an 23.8Aqaba 23.5
Badia Badia 23.6Non Badia 24.1
Camps Camp 23.3Non camp 24.1
EducationNo education 24.5Elementary 22.9Preparatory 21.3Secondary 22.4Higher a
Wealth quintileLowest 23.5Second 24.1Middle 23.5Fourth 24.1Highest 24.8
Total 24.0
a = Omitted because less than 50 percent of the women had a birth before reaching age 25.

Fertility • 59
5.9 TEENAGE FERTILITY
Table 5.12 shows the extent of fertility among women age 15-19. This issue is a major social and health concern because teenage mothers and their children usually have a higher risk of illness and death. At the same time, women who become mothers in their teens are more likely to curtail their education.
Table 5.12 Teenage pregnancy and motherhood
Percentage of women age 15-19 who have had a live birth or who are pregnant with their first child, and percentage who have begun childbearing, by background characteristics, Jordan 2012
Background characteristic
Percentage of women age 15-19 who: Percentage
who have begun
childbearing Number
of women Have had a
live birth Are pregnant with first child
Age 15 0.0 0.1 0.1 815 16 0.9 0.3 1.2 883 17 2.1 0.8 2.9 974 18 5.5 1.4 6.9 912 19 9.1 2.8 11.9 827
Residence Urban 3.8 1.2 5.0 3,634 Rural 2.0 0.4 2.4 774
Region Central 3.8 0.8 4.5 2,750 North 3.5 1.6 5.1 1,278 South 1.2 1.5 2.6 412
Governorate Amman 4.2 0.6 4.8 1,784 Balqa 2.4 1.1 3.4 304 Zarqa 3.5 0.9 4.4 540 Madaba 2.8 1.2 4.0 117 Irbid 3.9 2.0 5.9 839 Mafraq 2.6 0.7 3.3 219 Jarash 3.4 0.9 4.3 139 Ajloun 1.6 0.7 2.3 86 Karak 1.2 0.0 1.2 140 Tafiela 0.8 0.5 1.4 62 Ma'an 1.8 0.9 2.7 80 Aqaba 1.1 4.6 5.7 108
Badia Badia 2.9 0.8 3.7 300 Non Badia 3.5 1.1 4.6 4,111
Camps Camp 2.0 1.2 3.2 351 Non camp 3.4 1.0 4.4 4,272
Education No education * * * 8 Elementary 6.9 1.7 8.6 86 Preparatory 3.0 0.4 3.4 2,080 Secondary 6.7 2.7 9.4 1,271 Higher 0.1 0.3 0.4 925
Wealth quintile Lowest 3.6 0.6 4.1 964 Second 4.0 0.9 4.9 894 Middle 5.5 2.1 7.6 748 Fourth 2.7 1.6 4.3 1,002 Highest 1.8 0.1 1.8 905
Total 3.5 1.1 4.5 4,411
Note: An asterisk indicates that a figure is based on fewer than 25 unweighted cases and has been suppressed.

60 • Fertility
The level of fertility among teenagers in Jordan is low; only 5 percent have begun childbearing. This percentage is similar to that found in 2007 (4 percent). Teenage pregnancy is twice as high in urban as in rural areas. Teenage pregnancy is much higher in the Central and North regions than in the South. Teenage pregnancy varies from a low of 1 percent in Karak and Tafiela to a high of 6 percent in Aqaba and Irbid. The most significant differentials are found by age and education. At age 15 less than 1 percent of women have begun childbearing, but this increases steadily to 7 percent by age 18 and by age 19, 12 percent have become mothers or are pregnant with their first child. The relationship between early childbearing and education is mixed. Teenage pregnancy is higher among women with elementary or secondary education than among women with preparatory or higher education. Similarly, teenage childbearing and wealth do not have a consistent pattern. Teenage pregnancy is highest among women in the middle wealth quintile and lowest among women in the highest wealth quintile.

Fertility Preferences • 61
FERTILITY PREFERENCES 6
his chapter addresses questions about the need for contraception and the extent of unwanted fertility. Information collected from respondents includes their desire for more children, the gender they would prefer, and the length of time women want to wait before their next child. Respondents
were also asked about the number of children they would like to have if they could start anew. Two other issues are also examined: the extent to which unwanted and mistimed births occur and the effect that preventing such births would have on fertility rates.
Survey questions on fertility preferences have often been the subject of criticism. First, it is suggested that the answers respondents give are misleading because they may reflect uninformed, ephemeral views held with little conviction. Critics also argue that the questions do not take into account the effects of social pressure or the attitudes of other family members—particularly the husband, who may exert considerable influence on the wife’s reproductive decisions. The first objection is probably not relevant in Jordan because family planning is widely used (presumably to realize fertility preferences). The second objection is correct in principle, but evidence from surveys in which both spouses are interviewed suggests that there are no significant differences between husbands and wives regarding their fertility preferences.
Women who were pregnant at the time of the survey were asked whether they would want to have another child later. Taking into account the way in which the preference variable is defined for pregnant women, a current pregnancy is treated as being equivalent to a living child. Women who have been sterilized are classified as wanting no more children.
6.1 DESIRE FOR CHILDREN
Women’s preferences concerning future childbearing serve as indicators of future fertility. However, sterilized women and women who state that they are infecund (declared infecund) have no impact on future fertility, because their potential contribution to fertility has been curtailed.
T
Key Findings
• More than half (53 percent) of currently married women age 15-49 want no more children or are sterilized.
• The desire to stop childbearing among married women has increased only slightly in the past five years, from 51 percent in 2007 to 53 percent in 2012.
• Women report an ideal family size of about four children. The mean ideal number of children among ever-married women has not changed in the last five years.
• Overall, the current fertility rate in Jordan is about one child more per woman than it would be if all unwanted births were avoided. This implies that the total fertility rate of 3.5 children per woman is 46 percent higher than it would be if unwanted births were avoided.

62 • Fertility Preferences
Table 6.1 and Figure 6.1 show that half (53 percent) of currently married women either want no more children at any time in the future or are sterilized. These figures show an increase of about 2 percentage points since the 2007 JPFHS (51 percent). The findings also show that 23 percent of currently married women want to have another child later (after two or more years); this figure is about 3 percentage points less than that recorded in the 2007 JPFHS (26 percent). In general, about 74 percent of currently married women in Jordan have a potential need for family planning services for limiting or spacing their births. This figure is close to the one recorded in the 2007 JPFHS (73 percent).
Table 6.1 Fertility preferences by number of living children
Percent distribution of currently married women age 15-49 by desire for children, according to number of living children, Jordan 2012
Desire for children Number of living children1
Total 15-49 0 1 2 3 4 5 6+
Have another soon2 82.8 43.0 19.0 14.9 8.4 5.6 2.6 18.4 Have another later3 1.7 48.2 47.1 32.8 15.6 8.0 2.5 23.1 Have another, undecided when 0.9 0.4 0.5 0.3 0.1 0.5 0.0 0.3 Undecided 0.5 0.6 2.8 3.1 3.4 2.2 1.1 2.2 Want no more 0.8 5.7 29.3 45.6 69.6 79.1 80.5 50.6 Sterilized4 0.0 0.0 0.7 0.6 1.1 1.5 8.7 2.2 Declared infecund 13.3 2.1 0.6 2.7 1.8 3.1 4.6 3.2
Total 100.0 100.0 100.0 100.0 100.0 100.0 100.0 100.0 Number 678 1,239 1,703 1,949 1,789 1,458 1,986 10,801 1 The number of living children includes the current pregnancy. 2 Wants next birth within 2 years. 3 Wants to delay next birth for 2 or more years. 4 Includes both female and male sterilization.
Figure 6.1
Fertility preferences of currently married women age 15-49
The desire for childbearing is strongly associated with the number of children that a woman has. Eighty-five percent of women who have not started childbearing by the time of the survey want to have a child, and the majority (83 percent) want to have this child soon, that is, within the next two years. Ninety-
Have another soon18%
Have another later23%
Have another, undecided when
0%
Undecided2%
Want no more51%
Sterilized2%
Declared infecund4%
JPFHS 2012
<1%

Fertility Preferences • 63
two percent of women who have one child want to have another child, but the majority (48 percent) want to wait at least two years before having the next child. Among those who have more than one child, the desire to stop childbearing increases rapidly with the number of children they have—from 30 percent among women who have two children to 89 percent among those with six children or more, including 9 percent who are sterilized. Thirteen percent of childless women declared themselves infecund, probably because they are or believe that they are sterile. The proportion of sterilized women has decreased slightly while the proportion of infecund women has increased since the 2007 JPFHS.
Differentials in the desire to stop childbearing are presented in Table 6.2. In general, women living in urban areas are slightly more likely to want to stop childbearing than rural women. Women in the Central and South regions are more likely to want to stop childbearing than women in the North region. This preference also varies according to governorate (ranging from 46 percent in Mafraq to 56 percent in Amman) and according to residence in Badia areas (50 percent of women living in Badia areas compared to 53 percent for other women). The same pattern is seen when the data are analyzed on the basis of the number of living children a woman has.
Table 6.2 Desire to limit childbearing
Percentage of currently married women age 15-49 who want no more children, by number of living children, according to background characteristics, Jordan 2012
Background characteristic
Number of living children1
Total 0 1 2 3 4 5 6+
Residence Urban 0.9 6.0 31.8 47.0 72.3 80.9 89.1 53.2Rural 0.0 4.4 20.3 41.5 61.9 79.3 89.6 50.5
Region Central 1.0 5.5 35.7 49.7 74.6 82.4 89.9 55.0North 0.4 5.0 19.5 37.8 62.0 77.4 87.8 47.4South 0.5 9.1 21.1 43.8 69.0 76.8 89.4 53.2
Governorate Amman 0.0 5.8 41.5 52.0 76.7 82.7 90.7 56.2Balqa (0.0) 4.4 23.1 45.9 67.4 80.6 90.2 52.9Zarqa 3.9 5.0 29.6 46.7 72.7 83.3 87.6 54.2Madaba 0.0 6.5 18.6 41.5 71.6 75.8 89.7 48.9Irbid 0.4 6.4 21.5 39.8 65.8 79.5 87.7 47.6Mafraq 0.0 1.2 13.8 35.9 48.4 75.3 90.3 46.0Jarash (0.0) 1.9 14.2 27.6 65.2 75.5 84.5 47.9Ajloun 1.7 3.5 22.6 35.6 51.8 70.0 87.9 48.5Karak 0.0 11.3 16.1 40.0 71.8 79.8 89.0 52.1Tafiela (0.0) 6.6 25.2 43.9 74.1 76.5 90.7 54.9Ma'an (0.0) 16.8 22.5 39.8 48.6 69.6 92.8 54.7Aqaba (2.3) 4.5 25.8 50.1 73.8 77.0 85.6 52.8
Badia Badia 0.0 3.3 19.0 42.1 44.0 72.1 92.1 49.5Non Badia 0.8 5.8 30.7 46.5 72.1 81.2 88.9 53.0
Camps Camp (2.6) 2.4 20.3 43.1 69.5 72.9 86.8 55.9Non camp 0.7 5.8 30.3 46.3 70.8 81.0 89.3 52.7
Education No education * * (28.8) (37.4) (67.8) (63.9) 90.1 63.1Elementary 0.0 1.7 34.3 45.6 75.9 74.7 90.0 61.4Preparatory 0.0 12.8 26.9 46.0 72.0 74.0 93.3 61.1Secondary 1.1 3.9 29.5 41.2 70.2 83.5 86.5 53.3Higher 1.0 5.7 31.0 53.2 70.1 82.1 88.8 45.5
Wealth quintile Lowest 0.0 3.9 27.6 43.7 63.1 73.3 90.3 56.4Second 1.5 5.3 25.7 39.8 65.9 77.0 88.1 49.7Middle 0.2 2.6 26.2 40.4 67.2 82.3 87.9 48.4Fourth 0.2 8.3 26.3 44.9 73.2 86.2 91.3 52.2Highest (2.2) 8.1 44.5 59.3 82.6 82.3 87.4 58.4
Total 0.8 5.7 30.0 46.2 70.7 80.6 89.2 52.8
Note: Women who have been sterilized are considered to want no more children. Figures in parentheses are based on 25-49 unweighted cases; an asterisk indicates that a figure is based on fewer than 25 unweighted cases and has been suppressed. 1 The number of living children includes the current pregnancy.

64 • Fertility Preferences
Education is negatively associated with the desire to stop childbearing. The proportion of women who want no more children decreases as the level of education increases, from 63 percent among uneducated women to 46 percent among women who have more than secondary education. However, the relationship between education and the desire to limit childbearing is mixed when analyzed by the number of living children. An inverse relationship between education and the desire to limit childbearing is only true of women with four children. The desire to limit childbearing is higher among women with elementary education than women with higher education when the number of living children is two or four. The impact of education diminishes for women with six or more children.
The data presented in Table 6.2 also show that overall there is a U-shaped association between the desire of women to stop childbearing and household wealth. The percentage of women who want no more children decreases from 56 percent among women in the lowest wealth quintile to 48 percent among women in the middle wealth quintile and increases again to 58 percent among women in the highest wealth quintile. However, there is no consistent association between the desire to stop childbearing and household wealth when analyzing data on the basis of the number of living children; however, women in the highest quintile are the most likely to want to stop childbearing at 2, 3, and 4 children.
6.2 IDEAL NUMBER OF CHILDREN
The focus of this chapter is on the future reproductive intentions of women, implicitly taking into account their number of living children. To ascertain her ideal number of children, the respondent was asked to consider—abstractly and independently of her actual family size—the number of children she would choose if she could start childbearing again.
There is usually a correlation between actual and ideal number of children. The reason is twofold. First, to the extent that women implement their preferences, those who want larger families tend to achieve larger families. Second, women may adjust their ideal family size upwards as their actual number of children increases. It is also possible that women with large families have larger ideal family sizes, because of attitudes they acquired 20 to 30 years ago.
Despite the likelihood that some rationalization occurs in the determination of ideal family size, respondents often state ideal family sizes that are lower than their actual number of surviving children. The data in Table 6.3 can be grouped into three categories. The first group is women who have reached their ideal family size—that is, women whose ideal number of children is exactly the same as the number of living children; it is represented by data along the diagonal line from 0 to 6+ children. The second group consists of women whose surviving children have exceeded their ideal family size (shown by data above the diagonal); the last group consists of women who have not reached their ideal family size (shown by data below the diagonal). The second category is of particular interest, because it permits the calculation of surplus or unwanted fertility (discussed in the next section).
The data in Table 6.3 indicate that 63 percent of ever-married women consider the ideal family size to be at least four children, compared with 56 percent in the 2007 JPFHS. Only 18 percent of ever-married women report an ideal family size of two children, the number that is just below replacement level fertility. The mean ideal number of children among ever-married women and currently married women is identical (3.9). Of concern to family planning program managers is the fact that about two-thirds of women with five or more children have already exceeded their ideal family size, in many cases by two or more children.

Fertility Preferences • 65
Table 6.3 Ideal number of children by number of living children
Percent distribution of ever-married women 15-49 by ideal number of children, and mean ideal number of children for ever-married women and for currently married women, according to the number of living children, Jordan 2012
Ideal number of children Number of living children1
Total 0 1 2 3 4 5 6+
0 1.4 0.9 1.0 0.9 0.7 0.7 1.0 0.91 3.3 2.8 3.6 3.4 2.0 1.1 0.5 2.32 31.0 22.8 22.7 15.8 20.1 13.7 9.6 18.13 13.0 20.2 15.3 13.5 6.5 9.6 6.7 11.64 35.6 41.2 44.1 47.0 47.0 40.2 39.5 42.85 3.8 5.4 4.7 7.8 7.2 14.6 7.6 7.56+ 8.1 5.9 6.4 8.6 13.4 17.4 26.6 13.1Non-numeric responses 3.9 0.8 2.2 3.1 3.0 2.6 8.4 3.6
Total 100.0 100.0 100.0 100.0 100.0 100.0 100.0 100.0Number of ever-married women 854 1,315 1,778 1,999 1,862 1,491 2,054 11,352
Mean ideal number children for:2 Ever-married women 3.4 3.5 3.5 3.8 3.9 4.3 4.7 3.9Number of ever-married women 820 1,305 1,738 1,936 1,806 1,452 1,882 10,938Currently married women 3.5 3.5 3.5 3.8 3.9 4.3 4.7 3.9Number of currently married women 646 1,230 1,666 1,889 1,734 1,419 1,816 10,399
1 The number of living children includes the current pregnancy. 2 Means are calculated excluding respondents who gave non-numeric responses.
Compared with the 2007 JPFHS, the percentage of women in the 2012 JPFHS who did not give a numeric response to the hypothetical question on ideal family size decreased substantially from 18 percent to 4 percent. Failure to give a definite answer suggests either an absence of conscious consideration given to the matter or a strong belief that family size is determined by God.
Table 6.4 presents the mean ideal number of children by background characteristics. The mean ideal number of children in Jordan increases with age, from 3.4 children for ever-married women in the youngest age group (15-19) to 4.0 children among women age 35-39 and to 4.5 among the oldest cohort of women (45-49). In general, women living in rural areas, women in the Badia areas, women in camp areas, and women in Ajloun and Ma’an have a slightly higher ideal family size than their counterparts in the other areas.

66 • Fertility Preferences
Table 6.4 Mean ideal number of children by background characteristics
Mean ideal number of children for ever-married women age 15-49 by background characteristics, Jordan 2012
Background characteristic Mean
Number of women1
Age 15-19 3.4 276 20-24 3.6 1,190 25-29 3.7 1,970 30-34 3.7 2,062 35-39 4.0 2,024 40-44 4.2 1,939 45-49 4.5 1,476
Residence Urban 3.9 9,110 Rural 4.1 1,829
Region Central 3.9 6,851 North 4.0 3,082 South 4.1 1,005
Governorate Amman 3.7 4,211 Balqa 4.0 745 Zarqa 4.1 1,607 Madaba 4.1 289 Irbid 3.9 1,971 Mafraq 4.2 553 Jarash 4.1 308 Ajloun 4.3 250 Karak 4.1 427 Tafiela 4.0 156 Ma'an 4.3 169 Aqaba 4.0 253
Badia Badia 4.3 680 Non Badia 3.9 10,258
Camps Camp 4.2 395 Non camp 3.9 10,543
Education No education 4.4 252 Elementary 4.2 796 Preparatory 3.9 1,593 Secondary 3.8 4,916 Higher 4.0 3,381
Wealth quintile Lowest 4.2 2,059 Second 4.1 2,285 Middle 3.9 2,394 Fourth 3.8 2,232 Highest 3.7 1,968
Total 3.9 10,938 1 Number of women who gave a numeric response.
Ideal number of children is also associated with education. Women with no education have a higher mean ideal family size (4.4) than women who have secondary or higher education (3.8 and 4.0, respectively). The ideal number of children has an inverse relationship to household wealth, decreasing as household wealth increases from 4.2 among women in the lowest wealth quintile to 3.7 among women in the highest wealth quintile.

Fertility Preferences • 67
6.3 PLANNING STATUS OF BIRTHS
Respondents in the 2012 JPFHS were asked a series of questions concerning each child born in the five years preceding the survey and for any current pregnancy, to determine whether the particular pregnancy was either planned, unplanned but wanted at a later date, or unwanted. These questions yield data that provide a powerful indicator of the degree to which couples are able to control childbearing. Additionally, the data can be used to measure the effect of preventing unwanted births on the level of fertility for a period of time.
The questions about the planning status of births are demanding. The respondent is required to accurately recall her wishes at one or more points in the preceding five years, and to report them honestly. The possibility of rationalization is present, since an unwanted conception may well turn out to be a cherished child. Despite problems of comprehension, recall, and honesty, the results from previous surveys indicate that the questions are effective in eliciting plausible information about the planning status of births. Although some postpartum rationalization does occur, respondents are willing to report unwanted conceptions. Overall, the estimates of unwanted fertility obtained from the data are probably low.
Table 6.5 shows that about three-quarters (75 percent) of births during the five years preceding the survey were wanted at the time of conception, 15 percent were wanted later, and 10 percent were not wanted at all at the time of conception. The percentage of births wanted when conceived has remained at the same level between 2007 and 2012 (74 and 75 percent, respectively). The percentage of births wanted at conception is negatively associated with birth order; conversely, the percentage of unwanted births increases dramatically with birth order. In other words, higher order (later) births are more likely than first or second births to have been unwanted. Almost all first order births are wanted at the time of conception.
Table 6.5 Fertility planning status
Percent distribution of births tor ever-married women age 15-49 in the five years preceding the survey (including current pregnancies), by planning status of the birth, according to birth order and mother's age at birth, Jordan 2012
Birth order and mother's age at birth
Planning status of birth
Total Number of births
Wanted then
Wanted later
Wanted no more
Birth order 1 96.3 2.8 0.8 100.0 2,595 2 74.4 24.2 1.5 100.0 2,307 3 76.5 19.5 4.0 100.0 1,968 4+ 61.8 15.8 22.4 100.0 4,047
Mother's age at birth <20 89.6 9.5 0.9 100.0 624 20-24 80.9 17.2 1.9 100.0 2,664 25-29 76.0 19.3 4.7 100.0 3,174 30-34 74.0 13.7 12.3 100.0 2,535 35-39 67.2 10.3 22.6 100.0 1,498 40-44 51.4 5.2 43.4 100.0 412 45-49 21.9 0.0 78.1 100.0 11
Total 75.3 15.1 9.5 100.0 10,918

68 • Fertility Preferences
Births to young women tend to be wanted at the time they are conceived, whereas births to older women are more likely to be unwanted (Table 6.5). Although 90 percent of births to women under age 20 were wanted at the time of conception, the percentage declines to 22 percent among women age 45-49.
Another way of measuring the extent of unwanted fertility is to calculate the fertility rate if all unwanted births were avoided. The wanted fertility rate measures the potential demographic impact of avoiding unwanted births. It is calculated in the same manner as the total fertility rate but excludes unwanted births from the numerator. A birth is considered wanted if the number of living children at the time of conception is lower than the ideal number of children reported by the respondent. The gap between wanted and actual fertility shows how successful women are in achieving their reproductive intentions. This measure also may be an underestimate to the extent that women may not report an ideal family size lower than their actual family size.
As shown in Table 6.6, if all unwanted births were prevented in Jordan, the total wanted fertility rate would be 2.4 children per woman, or 1.1 child less than the actual total fertility rate (TFR). That theoretical rate implies that the TFR is inflated by 46 percent because of unwanted births. This is a marked increase when compared to 2007, when the TFR was inflated by 29 percent because of unwanted births.
Table 6.6 also shows that the gap between actual and wanted fertility rates is wider in rural than urban areas, in Badia than in non Badia areas, and in camp than in non camp areas; in addition, it is wider among women with preparatory education than among women with other levels of education and wider among women in the lowest wealth quintile than among women in the other wealth quintiles. The widest gap between actual and wanted fertility rates is in Ma’an, where the difference is 1.5 children per woman.
Table 6.6 Wanted fertility rates
Total wanted fertility rates and total fertility rates for the three years preceding the survey, by background characteristics, Jordan 2012
Background characteristic
Total wanted fertility rate
Total fertility rate
Residence Urban 2.4 3.4 Rural 2.7 3.9
Region Central 2.3 3.4 North 2.7 3.8 South 2.6 3.7
Governorate Amman 2.2 3.2 Balqa 2.8 3.8 Zarqa 2.4 3.6 Madaba 2.6 3.5 Irbid 2.6 3.6 Mafraq 2.9 4.1 Jarash 2.9 4.3 Ajloun 2.8 3.8 Karak 2.6 3.5 Tafiela 2.6 3.9 Ma'an 2.6 4.1 Aqaba 2.6 3.7
Badia Badia 3.0 4.4 Non Badia 2.4 3.4
Camps Camp 2.2 3.7 Non camp 2.4 3.5
Education No education 1.8 3.0 Elementary 2.6 3.9 Preparatory 2.1 3.8 Secondary 3.0 4.2 Higher 2.4 3.0
Wealth quintile Lowest 2.8 4.4 Second 2.7 3.9 Middle 2.5 3.6 Fourth 2.2 3.1 Highest 2.0 2.6
Total 2.4 3.5
Note: Rates are calculated based on births to women age 15-49 in the period 1-36 months preceding the survey. The total fertility rates are the same as those presented in Table 5.2.

Family Planning • 69
FAMILY PLANNING 7
his chapter considers a number of indicators from the 2012 JPFHS related to knowledge of, attitudes toward, and use of family planning and contraceptive sources and brands. This chapter also presents information on unmet need for family planning, intended future use of contraception,
and exposure to mass media messages about family planning.
7.1 KNOWLEDGE OF FAMILY PLANNING METHODS
Determining the level of knowledge of contraceptive methods was a major objective of the 2012 JPFHS, since knowledge of specific methods is a precondition for using them. Information about women’s knowledge of contraceptive methods was collected by describing each method of family planning and asking whether the respondent had heard of it. All methods recognized by the respondent after hearing a description of the method were recorded as knowledge.
Information on knowledge was collected for 10 modern methods: the pill, IUD, injectables, implants, emergency contraception, lactational amenorrhea method (LAM), the male and female condom, and female and male sterilization. Two traditional methods were also included: periodic abstinence or rhythm and withdrawal. In addition, provision was made in the questionnaire to record any other methods that respondents mentioned spontaneously.
It should be noted that knowledge of a family planning method in the JPFHS and all DHS surveys is defined simply as having heard of a method. No questions were asked to elicit depth of knowledge, such as how a specific method is used.
T
Key Findings
• Knowledge of at least one method of family planning is universal among ever-married women in Jordan.
• Three-fifths of currently married women are using a method of contraception, with most women using a modern method (42 percent).
• The three most popular modern methods used by married women are the IUD (21 percent), pill, and male condom (8 percent each).
• Use of contraceptives has increased by 15 percent in the past 15 years; nevertheless, there has been a decline in the use of long-term methods such as female sterilization and IUD and an increase in use of short-term methods like the condom and withdrawal.
• The private sector serves 56 percent of contraceptive users, while the public sector serves the rest. Government health centers are the most important public source, serving one in four (23 percent) users.
• Overall, 48 percent of contraceptive users discontinued an episode within 12 months of starting its use. Twenty-four percent switched to another method following discontinuation.
• Twelve percent of currently married women have an unmet need for family planning services, with 5 percent having an unmet need for spacing and 7 percent having an unmet need for limiting.

70 • Family Planning
The 2012 JPFHS results indicate that all ever-married women in Jordan know at least one method of family planning (Table 7.1). Among modern methods, the IUD and pill are the best known (100 percent), followed by LAM (95 percent), male condom (95 percent), injectables (90 percent), and female sterilization (86 percent). The least recognized methods were emergency contraception and the female condom, with 15 percent and 19 percent, respectively, of ever-married women having heard of these methods. Withdrawal is also known to most ever-married women (96 percent), whereas rhythm is less known (88 percent). On average, an ever-married woman knows about nine methods of family planning.
Table 7.1 Knowledge of contraceptive methods
Percentage of ever-married women and currently married women age 15-49 who have heard of any contraceptive method, by specific method, Jordan 2012
Ever-married
women
Currently married women
Any method 99.9 100.0
Any modern method 99.9 100.0Female sterilization 85.8 85.7Male sterilization 20.9 21.1Pill 99.5 99.6IUD 99.7 99.8Injectables 89.6 89.6Implants 71.9 72.2Male condom 94.9 95.4Female condom 18.7 19.0Lactational amenorrhea (LAM) 95.0 95.1Emergency contraception 15.3 15.3
Any traditional method 97.4 97.6Rhythm 88.3 88.5Withdrawal 95.9 96.3Folk method 0.6 0.6
Mean number of methods known 8.9 8.9Number of women 11,352 10,801
Because knowledge of any family planning method or any modern method is almost universal,
there are small variations in knowledge of any method or any modern method of contraception among subgroups by background characteristics (data not shown separately).
7.2 CURRENT USE OF CONTRACEPTION
The level of current use of contraception is one of the indicators most frequently used to assess the success of family planning activities. It is also widely used as a measure to analyze the determinants of fertility.
Results from the 2012 JPFHS indicate that 61 percent of currently married women are using a contraceptive method (Table 7.2); 42 percent are using modern methods and 19 percent are using traditional methods. The IUD is the most widely adopted modern method (21 percent), followed by the pill and male condom (8 percent each), female sterilization (2 percent), and LAM and injectables (1 percent each). Less than 1 percent of women rely on other modern methods. Withdrawal (14 percent) and rhythm (4 percent) are the most common traditional methods.
Overall, use of any method among currently married women has increased substantially in the last two decades—from 40 percent of women in the 1990 JPFHS survey to 53 percent in the 1997 JPFHS, 56 percent in the 2002 JPFHS, 57 percent in the 2007 JPFHS, and 59 percent in the 2009 JPFHS (Figure 7.1). There was a marked increase in contraceptive use of any method during the seven years between 1990 and 1997 (32 percent). However, since 1997 the increase in use has been steady but not as substantial. In the 15 years between 1997 and 2012, contraceptive use increased by just 15 percent.

Fam
ily P
lann
ing
• 7
1
Tabl
e 7.
2 C
urre
nt u
se o
f con
trace
ptio
n by
age
Perc
ent d
istri
butio
n of
eve
r-m
arrie
d w
omen
and
cur
rent
ly m
arrie
d w
omen
age
15-
49 b
y co
ntra
cept
ive
met
hod
curre
ntly
use
d, a
ccor
ding
to a
ge, J
orda
n 20
12
Age
Any
met
hod
Any
mod
ern
met
hod
Mod
ern
met
hod
Any
trad
i- tio
nal
met
hod
Trad
ition
al m
etho
d N
ot
curre
ntly
us
ing
Tota
l N
umbe
r of
wom
en
Fem
ale
ster
ili-
zatio
n P
ill
IUD
In
ject
- ab
les
Impl
ants
M
ale
cond
om
LAM
O
ther
R
hyth
m
With
- dr
awal
O
ther
EV
ER-M
AR
RIE
D W
OM
EN
15-1
9
26.1
20.7
0.
0 10
.83.
81.
00.
01.
13.
90.
0 5.
40.
04.
21.
273
.910
0.0
278
20-2
4
45.4
29.1
0.
0 7.
410
.31.
50.
56.
33.
20.
0 16
.31.
114
.01.
254
.610
0.0
1,20
7 25
-29
55
.736
.3
0.0
8.3
17.6
1.1
0.5
7.5
1.3
0.0
19.3
2.3
15.8
1.2
44.3
100.
02,
006
30-3
4
62.8
44.3
0.
2 9.
921
.71.
00.
28.
92.
00.
3 18
.52.
814
.51.
237
.210
0.0
2,13
6 35
-39
68
.349
.0
1.5
9.9
25.6
1.1
0.4
9.1
0.9
0.6
19.4
3.4
14.8
1.2
31.7
100.
02,
098
40-4
4
67.0
48.3
4.
9 6.
727
.30.
60.
48.
10.
20.
1 18
.85.
312
.80.
633
.010
0.0
2,05
5 45
-49
46
.230
.3
7.1
2.2
16.1
0.1
0.0
4.7
0.0
0.1
15.9
5.2
10.6
0.1
53.8
100.
01,
571
Tota
l 58
.340
.3
2.2
7.7
20.3
0.9
0.3
7.5
1.3
0.2
17.9
3.4
13.6
0.9
41.7
100.
011
,352
CU
RR
EN
TLY
MA
RR
IED
WO
MEN
15
-19
27
.521
.8
0.0
11.4
4.0
1.1
0.0
1.2
4.1
0.0
5.7
0.0
4.4
1.3
72.5
100.
026
4 20
-24
46
.830
.0
0.0
7.6
10.6
1.5
0.5
6.4
3.3
0.0
16.8
1.2
14.4
1.2
53.2
100.
01,
171
25-2
9
57.7
37.7
0.
0 8.
618
.21.
20.
57.
81.
40.
0 20
.02.
416
.41.
342
.310
0.0
1,93
5 30
-34
65
.246
.0
0.2
10.2
22.6
1.0
0.2
9.3
2.1
0.3
19.2
2.9
15.1
1.2
34.8
100.
02,
055
35-3
9
71.2
51.0
1.
5 10
.426
.61.
10.
49.
51.
00.
6 20
.23.
515
.41.
328
.810
0.0
2,01
2 40
-44
70
.851
.0
5.1
7.0
28.9
0.6
0.4
8.6
0.2
0.1
19.8
5.6
13.6
0.7
29.2
100.
01,
944
45-4
9
50.7
33.1
7.
4 2.
517
.80.
10.
05.
20.
00.
1 17
.65.
811
.70.
149
.310
0.0
1,41
9
Tota
l 61
.242
.3
2.2
8.1
21.3
0.9
0.3
7.9
1.3
0.2
18.9
3.5
14.3
1.0
38.8
100.
010
,801
N
ote:
If m
ore
than
one
met
hod
is u
sed,
onl
y th
e m
ost e
ffect
ive
met
hod
is c
onsi
dere
d in
this
tabu
latio
n.LA
M =
Lac
tatio
nal a
men
orrh
ea m
etho
d
Family Planning • 71

72 • Family Planning
Figure 7.1 Current use of contraception among currently married women, various surveys, 1990-2012
JPFHS 2012
Comparing specific methods, there has been considerable change in the use of specific
contraceptive methods in the period between 1990 and 2012. Most noticeable is the increased use of the IUD among currently married women, which rose from 15 percent in 1990 to 21 percent in 2012. Use of the male condom has also increased during the same period, rising from less than 1 percent to 8 percent. In addition, use of withdrawal has also increased steadily from 4 percent in 1990 to 14 percent in 2012. It is important to point out here that use of long-term methods—including IUD—are declining in favor of condom and withdrawal, resulting in rising discontinuation rates as discussed later in this chapter. In-depth analysis may be useful to discern the reasons for this disturbing trend.
Contraceptive use differs according to age (Table 7.2). Use among currently married women is lowest among women age 15-19 (28 percent), peaks among women age 35-39 (71 percent), then declines sharply among those age 45-49 (51 percent). Most women in the younger age cohorts use contraception for spacing births, relying on the pill, IUD, LAM, and withdrawal, while older women are using more permanent methods. Female sterilization, in particular, rises in popularity among women 35 years of age and older, with the prevalence of sterilization increasing from 2 percent among women age 35-39, to 5 percent among women age 40-44, and 7 percent among currently married women age 45-49. The use of the IUD is also very popular among older women.
Current use of contraceptive methods also differs by background characteristics (Table 7.3). Use of contraception increases with the number of living children, from 2 percent among currently married women with no children to 75 percent among women with five or more children. Although the overall use of contraception is not very different between urban and rural areas, the percentage using modern methods is 3 percentage points higher among urban than among rural women (43 percent and 40 percent, respectively).
There are no regional variations in current use of family planning. Current use of contraceptive methods differs by governorates and ranges from 58 percent of women in Ma’an to 64 percent in Tafiela and Aqaba. A similar difference is seen in use of modern methods, which ranges from 31 percent in Ma’an to 47 percent in Zarqa.
27
3841 42 42 42
13
1515 15 17 19
40
5356 57
5961
0
10
20
30
40
50
60
70
JPFHS 1990 JPFHS 1997 JPFHS 2002 JPFHS 2007 JPFHS 2009 JPFHS 2012
PercentageTraditional
Modern
Family Planning • 73
Current use of contraception increases steadily with women’s education from 46 percent among women with no education to 65 percent among women with secondary education but declines to 59 percent among women with higher education. This pattern also holds for the current use of modern methods. However, it should be noted that use of female sterilization is highest among women with only elementary education. The use of traditional methods increases steadily with all levels of education, from 14 percent among women with no education to 21 percent among women with higher education.
Contraceptive use rises from 58 percent among women in the poorest households to 64 percent among women in the fourth wealth quintile, and then falls slightly to 63 percent among women in the richest households. A similar pattern is seen in the use of modern methods.

74 •
Fam
ily P
lann
ing
Tabl
e 7.
3 C
urre
nt u
se o
f con
trace
ptio
n by
bac
kgro
und
char
acte
ristic
s Pe
rcen
t dis
tribu
tion
of c
urre
ntly
mar
ried
wom
en a
ge 1
5-49
by
cont
race
ptiv
e m
etho
d cu
rrent
ly u
sed,
acc
ordi
ng to
bac
kgro
und
char
acte
ristic
s, J
orda
n 20
12
Back
grou
nd
char
acte
ristic
An
y m
etho
d
Any
mod
ern
met
hod
Mod
ern
met
hod
Any
tradi
- tio
nal
met
hod
Trad
ition
al m
etho
d N
ot
curre
ntly
us
ing
Tota
l N
umbe
r of
wom
en
Fem
ale
ster
ili-
zatio
n P
ill
IUD
In
ject
- ab
les
Impl
ants
M
ale
cond
om
LAM
O
ther
R
hyth
m
With
- dr
awal
O
ther
Nu
mb
er o
f li
vin
g c
hil
dre
n
0
1.
50.
2 0.
0 0.
10.
00.
00.
00.
10.
00.
01.
30.
21.
10.
098
.510
0.0
930
1-2
52
.432
.0
0.4
8.4
10.8
0.8
0.1
9.7
1.7
0.0
20.5
2.8
16.7
1.0
47.6
100.
02,
880
3-4
70
.549
.4
0.9
9.7
27.5
0.8
0.5
8.1
1.5
0.4
21.1
4.4
15.8
0.9
29.5
100.
03,
673
5+
75.2
55.3
5.
9 8.
329
.51.
50.
48.
31.
20.
319
.94.
114
.41.
424
.810
0.0
3,31
7
Re
sid
en
ce
Urb
an
61.1
42.7
2.
2 7.
322
.10.
80.
38.
51.
30.
218
.33.
613
.90.
938
.910
0.0
8,98
3 R
ural
61
.740
.2
2.4
12.1
17.4
1.8
0.3
4.9
1.2
0.1
21.6
3.3
16.6
1.7
38.3
100.
01,
818
Re
gio
n
Cen
tral
61.1
42.7
1.
8 7.
522
.00.
80.
48.
61.
40.
318
.44.
013
.60.
838
.910
0.0
6,83
9 N
orth
61
.342
.3
2.8
9.2
21.1
1.0
0.1
6.7
1.2
0.2
19.0
2.6
15.0
1.5
38.7
100.
02,
966
Sout
h
61.0
39.5
3.
3 9.
417
.11.
70.
56.
41.
10.
121
.53.
117
.60.
839
.010
0.0
996
Go
vern
ora
te
Amm
an
60.5
41.6
1.
7 5.
821
.80.
50.
39.
51.
60.
418
.94.
414
.00.
539
.510
0.0
4,26
2 Ba
lqa
60
.041
.6
2.2
10.2
20.8
1.9
0.1
5.5
0.9
0.0
18.4
4.7
12.3
1.3
40.0
100.
072
4 Za
rqa
63
.146
.5
1.7
10.4
23.5
0.8
1.0
8.0
1.0
0.0
16.7
2.6
12.6
1.4
36.9
100.
01,
564
Mad
aba
62
.142
.2
2.6
9.7
20.4
1.3
0.2
6.4
1.4
0.1
19.9
3.4
15.8
0.8
37.9
100.
028
9 Irb
id
61.7
43.9
3.
1 9.
422
.00.
60.
07.
31.
30.
117
.82.
514
.11.
138
.310
0.0
1,89
2 M
afra
q
59.5
36.7
1.
9 10
.215
.82.
70.
04.
51.
30.
422
.82.
018
.82.
040
.510
0.0
528
Jara
sh
61.8
42.7
3.
2 9.
920
.51.
10.
36.
70.
70.
119
.23.
014
.21.
938
.210
0.0
306
A jlo
un
61.6
41.0
2.
0 4.
126
.40.
60.
26.
61.
00.
020
.63.
414
.92.
338
.410
0.0
239
Kara
k
59.2
40.0
3.
1 10
.515
.12.
90.
66.
80.
90.
019
.33.
415
.60.
340
.810
0.0
420
Tafie
la
64.1
41.5
5.
6 11
.313
.70.
91.
07.
21.
80.
022
.62.
120
.00.
535
.910
0.0
161
Ma'
an
58.4
30.7
4.
6 6.
010
.50.
80.
37.
20.
90.
427
.73.
523
.40.
841
.610
0.0
163
Aqab
a
63.7
43.2
1.
1 8.
727
.00.
60.
34.
70.
90.
020
.53.
115
.41.
936
.310
0.0
253
Ba
dia
Ba
dia
57
.836
.6
2.6
12.4
12.8
2.7
0.3
4.1
1.5
0.2
21.2
1.9
17.4
1.9
42.2
100.
066
6 N
on B
adia
61
.442
.7
2.2
7.8
21.9
0.8
0.3
8.1
1.3
0.2
18.7
3.6
14.1
0.9
38.6
100.
010
,135
Ca
mp
s
Cam
p
60.8
45.4
2.
1 12
.221
.20.
70.
08.
20.
90.
115
.43.
011
.31.
139
.210
0.0
387
Non
cam
p
61.2
42.2
2.
2 8.
021
.30.
90.
37.
91.
30.
219
.03.
614
.41.
038
.810
0.0
10,4
14
Ed
uc
ati
on
N
o ed
ucat
ion
45
.631
.8
3.8
7.9
14.3
2.0
0.0
3.0
0.7
0.1
13.8
0.5
10.2
3.0
54.4
100.
022
6 El
emen
tary
53
.436
.6
7.7
6.6
14.4
1.8
0.1
5.3
0.6
0.1
16.8
0.5
15.3
1.0
46.6
100.
078
8 Pr
e par
ator
y
60.6
43.5
3.
1 8.
624
.91.
00.
84.
11.
00.
117
.11.
914
.40.
839
.410
0.0
1,54
7 Se
cond
ary
64
.746
.0
1.6
8.3
24.1
1.1
0.3
8.7
1.7
0.2
18.7
3.7
13.8
1.1
35.3
100.
04,
863
Hig
her
59.3
38.5
1.
3 8.
017
.80.
40.
19.
41.
10.
420
.84.
915
.10.
740
.710
0.0
3,37
6
We
alt
h q
uin
tile
Lo
wes
t 58
.040
.6
2.7
10.3
16.8
2.3
0.6
6.7
1.0
0.1
17.4
2.2
13.6
1.6
42.0
100.
01,
975
Seco
nd
60.9
41.8
2.
8 7.
919
.61.
20.
57.
72.
00.
219
.12.
515
.21.
439
.110
0.0
2,17
9 M
iddl
e
59.9
41.1
1.
5 7.
522
.50.
80.
37.
11.
30.
018
.93.
215
.00.
740
.110
0.0
2,36
4 Fo
urth
64
.045
.0
3.2
8.6
24.2
0.4
0.1
7.6
0.6
0.3
19.1
3.1
15.2
0.8
36.0
100.
02,
274
Hi g
hest
62
.943
.1
0.7
6.5
22.9
0.0
0.1
10.5
1.8
0.5
19.8
6.8
12.5
0.5
37.1
100.
02,
009
Tota
l 61
.242
.3
2.2
8.1
21.3
0.9
0.3
7.9
1.3
0.2
18.9
3.5
14.3
1.0
38.8
100.
010
,801
N
ote:
If m
ore
than
one
met
hod
is u
sed,
onl
y th
e m
ost e
ffect
ive
met
hod
is c
onsi
dere
d in
this
tabu
latio
n.LA
M =
Lac
tatio
nal a
men
orrh
ea m
etho
d
74 • Family Planning

Family Planning • 75
7.3 TIMING OF STERILIZATION
Use of female sterilization decreased between 2007 and 2012 (from 4 to 2 percent), and it only represents 5 percent of users of modern methods. Nevertheless, the age at which the operation takes place is of particular interest to family planning officials. For 4 percent of women who have been sterilized, the operation took place before they were 30 years old; 21 percent were sterilized at 30-34 years, 52 percent at 35-39 years, and 23 percent at 40-49 (data not shown separately). Overall, women’s age at sterilization has increased slightly in Jordan between 2007 and 2012: the median age for women under age 40 was 35.5 years in 2007; this increased to 36.0 years in 2012.
7.4 SOURCE OF SUPPLY FOR MODERN METHODS
In addition to information about the level of contraceptive use, program officials need to know where users obtain their methods. As in the 2007 and the 2009 JPFHS, the 2012 JPFHS survey included a question for current users of modern methods regarding the source of their method. Private sources serve almost three-fifths (56 percent) of current users, compared with 58 percent in 2007 and 54 percent in 2009. Private hospitals or clinics, pharmacies, the Jordanian Association of Family Planning and Protection (JAFPP), and the United Nations Refugee Welfare Association (UNRWA) clinics are major private sources of supply for modern contraceptive methods (Table 7.4 and Figure 7.2). The share of the public sector decreased to 44 percent in 2012 from 46 percent in 2009.
Table 7.4 Source of modern contraception methods
Percent distribution of users of modern contraceptive methods age 15-49 by most recent source of method, according to method, Jordan 2012
Source Female
sterilization Pill IUD Injectables Male
condom Total
Public sector 79.8 47.7 37.8 82.2 41.5 44.1 Government hospital 53.5 2.0 3.8 1.0 0.6 5.9 Government health center 0.0 30.3 18.9 63.2 27.1 22.7 Government MCH center 0.0 14.4 12.8 17.8 11.5 12.2 University hospital/clinic 2.0 0.1 0.5 0.0 0.8 0.5 Royal Medical Services 24.4 0.8 1.8 0.2 1.4 2.7
Private sector 20.0 52.3 62.1 17.8 57.6 55.6 Private hospital/clinic 20.0 0.7 21.7 0.7 0.2 12.7 Private doctor 0.0 1.1 13.4 2.6 0.3 7.4 Pharmacy 0.0 34.8 0.9 0.2 39.3 15.0 JAFPP 0.0 1.8 18.9 1.0 1.9 10.6 UNRWA clinic 0.0 14.0 6.9 12.6 16.0 9.7 Other NGO 0.0 0.0 0.3 0.8 0.0 0.1
Other source 0.2 0.0 0.2 0.0 1.0 0.3
Total 100.0 100.0 100.0 100.0 100.0 100.0 Number of women 246 877 2,302 101 852 4,413
Note: Total includes other modern methods but excludes lactational amenorrhea method (LAM). Total includes 37 unweighted users of implants who are not shown separately. MCH = Maternal and child health JAFPP = Jordanian Association of Family Planning and Protection UNRWA = United Nations Refugee Welfare Association NGO = Nongovernmental organization

76 • Family Planning
Figure 7.2 Sources of family planning methods among
current users of modern methods, 2012
JPFHS 2012
The sources of contraceptive methods vary by method used. Pharmacies are the primary source for
users of methods that require resupply, including the pill (35 percent) and condoms (39 percent). Private hospitals and clinics are the primary source for IUDs (22 percent), followed by government health centers and JAFPP (19 percent each). Government hospitals are the primary source for most female sterilizations (54 percent), followed by the Royal Medical Services (24 percent) and private hospitals (20 percent). Government health centers are the major source of injectables (63 percent), followed by government maternal and child health (MCH) centers (18 percent).
7.5 USE OF SOCIAL MARKETING BRANDS OF CONTRACEPTIVES
All users of the pill age 15-49 years were asked about the brand they are currently using. The overall results on the three most popular social marketing brands (Table 7.5) indicate that Marvelon is the most popular brand (41 percent), followed by Microgynon and Yasmin (15 percent each). Differentials in using these three most popular brand pills by respondents’ background are evident. Although Marvelon is the most widely used brand of pills among women in all groups, it is most popular among women age 30-34, rural women, women in the North region, women in Jarash, women in Badia and camp areas, women with elementary education only, and women in the lowest wealth quintile. On the other hand, Microgynon is more popular among older women, urban women, women in the Central region, women in Amman, women in camps, and women in the two highest wealth quintiles. The use of Yasmin rises with education and wealth.
In addition to the three most popular brands of pills mentioned above, 8 percent of pill users were using Ezluten (data not shown separately). Other pill brands were less popular and their use varied from less than 1 percent to 4 percent. Ten percent of pill users did not know the brand they were using.
Public sector44%
Private hospital/clinic 13%
Private doctor 7%
Pharmacy 15%
JAFPP 11%
UNRWA clinic 10%

Family Planning • 77
Table 7.5 Use of social marketing brand pills
Among all pill users age 15-49, the percentage of pill users using the three most popular social marketing brands, by background characteristics, Jordan 2012
Background characteristic
Percentage using
Marvelon tab
Percentage using
Microgynon
Percentageusing
Yasmin
Number of women using
the pill
Age 15-19 * * * 30 20-24 40.7 5.2 18.2 89 25-29 43.2 7.3 18.4 167 30-34 46.6 15.1 13.5 211 35-39 46.1 12.9 14.3 208 40-44 31.2 27.6 16.4 137 45-49 (24.8) (29.1) (11.9) 35
Residence Urban 36.7 15.8 16.0 657 Rural 52.4 11.7 12.5 220
Region Central 33.2 19.1 17.9 510 North 52.5 8.1 7.0 272 South 46.3 10.8 23.7 94
Governorate Amman 27.3 22.2 25.1 246 Balqa 43.6 16.6 12.0 74 Zarqa 35.7 15.8 10.1 162 Madaba 44.0 16.6 14.7 28 Irbid 55.7 7.7 5.5 178 Mafraq 41.7 10.0 8.3 54 Jarash 59.5 3.9 12.5 30 Ajloun (31.3) (17.9) (11.3) 10 Karak 52.0 7.1 22.2 44 Tafiela 55.8 18.6 13.9 18 Ma'an 40.3 9.7 19.6 10 Aqaba 29.6 12.5 36.8 22
Badia Badia 47.2 13.2 12.4 83 Non Badia 39.9 15.0 15.4 794
Camps Camp 46.7 19.1 2.9 47 Non camp 40.3 14.5 15.8 830
Education No education * * * 18 Elementary 50.7 10.3 0.2 52 Preparatory 48.4 15.0 5.8 132 Secondary 42.4 13.6 14.5 406 Higher 32.9 14.9 24.6 269
Wealth quintile Lowest 54.2 14.0 4.3 203 Second 43.2 10.9 11.2 173 Middle 48.0 12.6 12.8 177 Fourth 32.5 17.1 17.3 194 Highest 18.1 20.6 37.2 131
Total 40.6 14.8 15.1 877
Note: Figures in parentheses are based on 25-49 unweighted cases. An asterisk indicates that a figure is based on fewer than 25 unweighted cases and has been suppressed.
Because the IUD is the most popular contraceptive method in Jordan, its users were asked to
mention the type of IUD they are currently using. The results indicate that more than half of IUD users (55 percent) are using a non-hormonal type and only 9 percent are using a hormonal type (data not shown separately). However, a significant number (36 percent) of IUD users don’t know the type of IUD they are using.
The IUD is a provider-based method and women in Jordan prefer to receive IUD insertions from a female provider. The 2012 JPFHS asked IUD users about the gender of the person who inserted the IUD for them. Such information is useful for program managers in understanding the reasons for non-use and discontinuation of IUDs and promoting their use. According to data from the 2012 JPFHS, the majority of IUDs used in Jordan were inserted by female doctors (80 percent, with 9 percent inserted by midwives). Only 10 percent of IUDs were inserted by male doctors (data not shown separately).

78 • Family Planning
7.6 INFORMED CHOICE
Women who were currently using a modern method of contraception and had adopted the method within the five years preceding the survey were asked whether they were informed about the side effects of the methods they were using, whether they were told what to do if they experienced any side effects, and whether they were informed about other methods of contraception they could use. Women who had been sterilized were asked if they were informed that they could not have any more children because of the operation. This information assists users in coping with side effects and decreases unnecessary discontinuations. In addition, these data serve as a measure of the quality of family planning services and inform program managers for future improvements.
Table 7.6 shows that 70 percent of women were informed about the side effects of the method they were using at the time of the survey, while 61 percent were informed about what to do if they experienced side effects. Seventy-five percent of women were also informed about alternative methods. The majority of women who use injectables were relatively well informed: 68 percent had been told about side effects, 62 percent knew what to do when they had side effects, and 85 percent were informed about other available methods of contraception. Users of the IUD and pill were similarly well informed about side effects (IUD: 71 percent; pill: 68 percent), and were told in different proportions about other methods they could use (pill: 78 percent; IUD: 74 percent); however, those who use an IUD were more likely to have been told what to do in case of side effects (63 percent) than users of the pill (56 percent). It should be noted that 61 percent of sterilized women were informed about side effects and only 47 percent were informed about what to do if they experienced side effects; 68 percent were informed about other methods. However, 91 percent were told that they would not be able to have any more children (data not shown separately) and consequently only 7 percent regret having the operation.
Table 7.6 Informed choice Among current users of selected modern methods age 15-49 who started the last episode of use within the five years preceding the survey, the percentage who were informed about possible side effects or problems of that method, the percentage who were informed about what to do if they experienced side effects, and the percentage who were informed about other methods they could use, by method and initial source, Jordan 2012
Method/source
Among women who started last episode of modern contraceptive method within five years preceding the survey:
Percentage who were informed about
side effects or problems of method used
Percentage who were informed about
what to do if experienced
side effects
Percentage who were informed by a
health or family planning worker of other methods that
could be used Number
of women
Method Female sterilization 61.3 47.3 68.0 88 Pill 68.3 56.3 77.7 774 IUD 70.6 62.8 74.1 1,666 Injectables 68.1 61.8 85.3 99 Implants (85.9) (73.9) (67.4) 35
Initial source of method1 Public sector 73.0 62.5 78.4 1,187 Government hospital 68.0 58.1 72.3 133 Government health center 74.0 64.2 81.2 638 Government MCH center 74.4 62.0 77.8 362 University hospital/clinic * * * 12 Royal Medical Services 67.1 53.6 56.7 42
Private medical sector 67.2 59.0 72.8 1,474 Private hospital/clinic 64.3 58.8 67.8 404 Private doctor 72.6 67.7 68.2 218 Pharmacy 61.3 44.1 68.8 281 JAFPP 71.9 63.8 79.4 325 UNRWA clinic 67.1 61.8 81.1 240 Other NGO * * * 6
Total 69.8 60.6 75.3 2,661
Note: Table includes users of only the methods listed individually. Table excludes users who obtained their method from friends and relatives. Figures in parentheses are based on 25-49 unweighted cases. An asterisk indicates that a figure is based on fewer than 25 unweighted cases and has been suppressed. MCH = Maternal and child health JAFPP = Jordanian Association of Family Planning and Protection UNRWA = United Nations Refugee Welfare Association NGO = Nongovernment organization 1 Source at start of current episode of use.
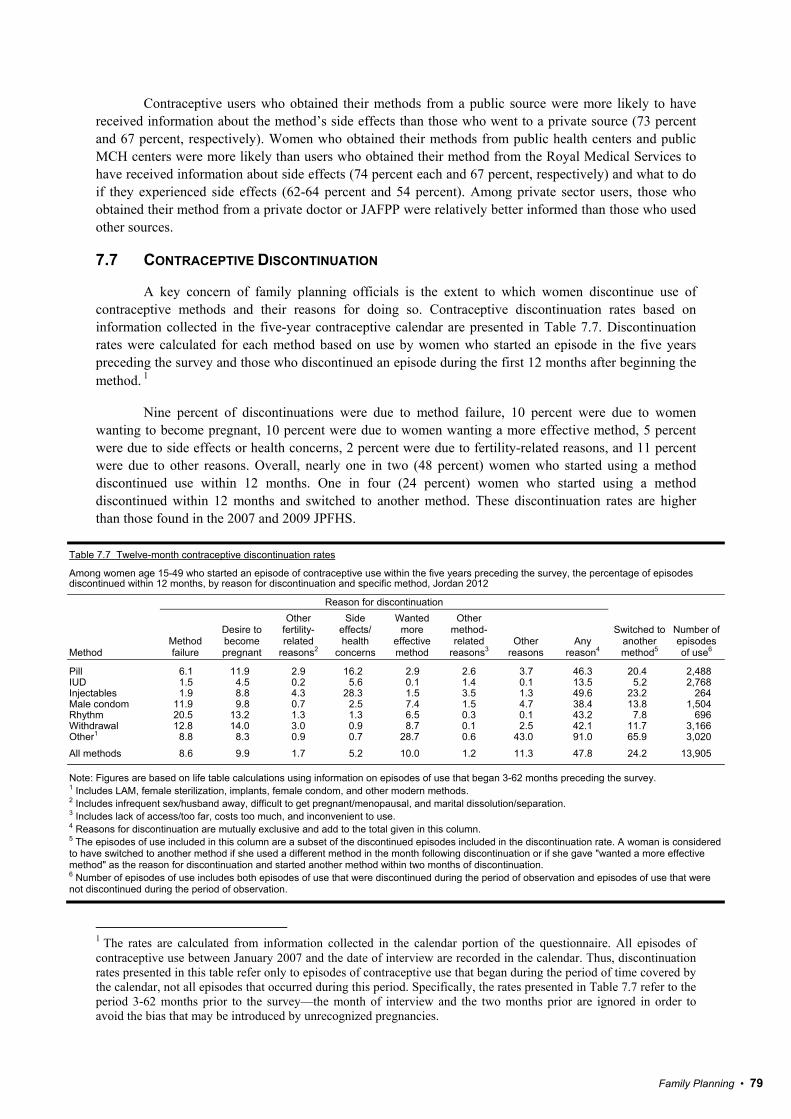
Family Planning • 79
Contraceptive users who obtained their methods from a public source were more likely to have received information about the method’s side effects than those who went to a private source (73 percent and 67 percent, respectively). Women who obtained their methods from public health centers and public MCH centers were more likely than users who obtained their method from the Royal Medical Services to have received information about side effects (74 percent each and 67 percent, respectively) and what to do if they experienced side effects (62-64 percent and 54 percent). Among private sector users, those who obtained their method from a private doctor or JAFPP were relatively better informed than those who used other sources.
7.7 CONTRACEPTIVE DISCONTINUATION
A key concern of family planning officials is the extent to which women discontinue use of contraceptive methods and their reasons for doing so. Contraceptive discontinuation rates based on information collected in the five-year contraceptive calendar are presented in Table 7.7. Discontinuation rates were calculated for each method based on use by women who started an episode in the five years preceding the survey and those who discontinued an episode during the first 12 months after beginning the method. 1
Nine percent of discontinuations were due to method failure, 10 percent were due to women wanting to become pregnant, 10 percent were due to women wanting a more effective method, 5 percent were due to side effects or health concerns, 2 percent were due to fertility-related reasons, and 11 percent were due to other reasons. Overall, nearly one in two (48 percent) women who started using a method discontinued use within 12 months. One in four (24 percent) women who started using a method discontinued within 12 months and switched to another method. These discontinuation rates are higher than those found in the 2007 and 2009 JPFHS.
Table 7.7 Twelve-month contraceptive discontinuation rates
Among women age 15-49 who started an episode of contraceptive use within the five years preceding the survey, the percentage of episodes discontinued within 12 months, by reason for discontinuation and specific method, Jordan 2012
Method
Reason for discontinuation
Switched to another method5
Number of episodes of use6
Method failure
Desire to become pregnant
Other fertility- related
reasons2
Side effects/ health
concerns
Wanted more
effective method
Other method- related
reasons3 Other
reasons Any
reason4
Pill 6.1 11.9 2.9 16.2 2.9 2.6 3.7 46.3 20.4 2,488IUD 1.5 4.5 0.2 5.6 0.1 1.4 0.1 13.5 5.2 2,768Injectables 1.9 8.8 4.3 28.3 1.5 3.5 1.3 49.6 23.2 264Male condom 11.9 9.8 0.7 2.5 7.4 1.5 4.7 38.4 13.8 1,504Rhythm 20.5 13.2 1.3 1.3 6.5 0.3 0.1 43.2 7.8 696Withdrawal 12.8 14.0 3.0 0.9 8.7 0.1 2.5 42.1 11.7 3,166Other1 8.8 8.3 0.9 0.7 28.7 0.6 43.0 91.0 65.9 3,020
All methods 8.6 9.9 1.7 5.2 10.0 1.2 11.3 47.8 24.2 13,905
Note: Figures are based on life table calculations using information on episodes of use that began 3-62 months preceding the survey. 1 Includes LAM, female sterilization, implants, female condom, and other modern methods. 2 Includes infrequent sex/husband away, difficult to get pregnant/menopausal, and marital dissolution/separation. 3 Includes lack of access/too far, costs too much, and inconvenient to use. 4 Reasons for discontinuation are mutually exclusive and add to the total given in this column. 5 The episodes of use included in this column are a subset of the discontinued episodes included in the discontinuation rate. A woman is considered to have switched to another method if she used a different method in the month following discontinuation or if she gave "wanted a more effective method" as the reason for discontinuation and started another method within two months of discontinuation. 6 Number of episodes of use includes both episodes of use that were discontinued during the period of observation and episodes of use that were not discontinued during the period of observation.
1 The rates are calculated from information collected in the calendar portion of the questionnaire. All episodes of contraceptive use between January 2007 and the date of interview are recorded in the calendar. Thus, discontinuation rates presented in this table refer only to episodes of contraceptive use that began during the period of time covered by the calendar, not all episodes that occurred during this period. Specifically, the rates presented in Table 7.7 refer to the period 3-62 months prior to the survey—the month of interview and the two months prior are ignored in order to avoid the bias that may be introduced by unrecognized pregnancies.
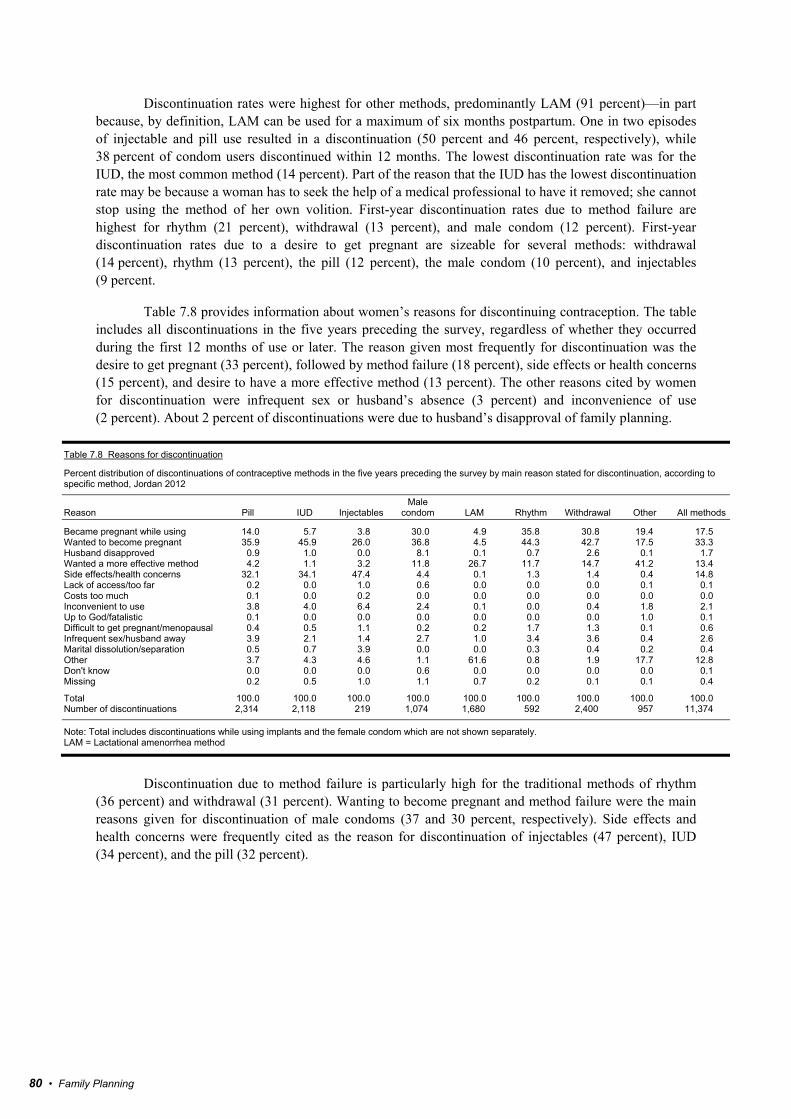
80 • Family Planning
Discontinuation rates were highest for other methods, predominantly LAM (91 percent)—in part because, by definition, LAM can be used for a maximum of six months postpartum. One in two episodes of injectable and pill use resulted in a discontinuation (50 percent and 46 percent, respectively), while 38 percent of condom users discontinued within 12 months. The lowest discontinuation rate was for the IUD, the most common method (14 percent). Part of the reason that the IUD has the lowest discontinuation rate may be because a woman has to seek the help of a medical professional to have it removed; she cannot stop using the method of her own volition. First-year discontinuation rates due to method failure are highest for rhythm (21 percent), withdrawal (13 percent), and male condom (12 percent). First-year discontinuation rates due to a desire to get pregnant are sizeable for several methods: withdrawal (14 percent), rhythm (13 percent), the pill (12 percent), the male condom (10 percent), and injectables (9 percent.
Table 7.8 provides information about women’s reasons for discontinuing contraception. The table includes all discontinuations in the five years preceding the survey, regardless of whether they occurred during the first 12 months of use or later. The reason given most frequently for discontinuation was the desire to get pregnant (33 percent), followed by method failure (18 percent), side effects or health concerns (15 percent), and desire to have a more effective method (13 percent). The other reasons cited by women for discontinuation were infrequent sex or husband’s absence (3 percent) and inconvenience of use (2 percent). About 2 percent of discontinuations were due to husband’s disapproval of family planning.
Table 7.8 Reasons for discontinuation
Percent distribution of discontinuations of contraceptive methods in the five years preceding the survey by main reason stated for discontinuation, according to specific method, Jordan 2012
Reason Pill IUD Injectables Male
condom LAM Rhythm Withdrawal Other All methods
Became pregnant while using 14.0 5.7 3.8 30.0 4.9 35.8 30.8 19.4 17.5 Wanted to become pregnant 35.9 45.9 26.0 36.8 4.5 44.3 42.7 17.5 33.3 Husband disapproved 0.9 1.0 0.0 8.1 0.1 0.7 2.6 0.1 1.7 Wanted a more effective method 4.2 1.1 3.2 11.8 26.7 11.7 14.7 41.2 13.4 Side effects/health concerns 32.1 34.1 47.4 4.4 0.1 1.3 1.4 0.4 14.8 Lack of access/too far 0.2 0.0 1.0 0.6 0.0 0.0 0.0 0.1 0.1 Costs too much 0.1 0.0 0.2 0.0 0.0 0.0 0.0 0.0 0.0 Inconvenient to use 3.8 4.0 6.4 2.4 0.1 0.0 0.4 1.8 2.1 Up to God/fatalistic 0.1 0.0 0.0 0.0 0.0 0.0 0.0 1.0 0.1 Difficult to get pregnant/menopausal 0.4 0.5 1.1 0.2 0.2 1.7 1.3 0.1 0.6 Infrequent sex/husband away 3.9 2.1 1.4 2.7 1.0 3.4 3.6 0.4 2.6 Marital dissolution/separation 0.5 0.7 3.9 0.0 0.0 0.3 0.4 0.2 0.4 Other 3.7 4.3 4.6 1.1 61.6 0.8 1.9 17.7 12.8 Don't know 0.0 0.0 0.0 0.6 0.0 0.0 0.0 0.0 0.1 Missing 0.2 0.5 1.0 1.1 0.7 0.2 0.1 0.1 0.4
Total 100.0 100.0 100.0 100.0 100.0 100.0 100.0 100.0 100.0 Number of discontinuations 2,314 2,118 219 1,074 1,680 592 2,400 957 11,374
Note: Total includes discontinuations while using implants and the female condom which are not shown separately. LAM = Lactational amenorrhea method
Discontinuation due to method failure is particularly high for the traditional methods of rhythm
(36 percent) and withdrawal (31 percent). Wanting to become pregnant and method failure were the main reasons given for discontinuation of male condoms (37 and 30 percent, respectively). Side effects and health concerns were frequently cited as the reason for discontinuation of injectables (47 percent), IUD (34 percent), and the pill (32 percent).

Family Planning • 81
7.8 KNOWLEDGE OF THE FERTILE PERIOD
A basic knowledge of reproductive physiology provides a useful background for the successful practice of coitus-dependent methods (such as withdrawal, condom, or barrier methods), and particularly for the practice of the rhythm method. As noted earlier, traditional methods are currently used by 19 percent of currently married women, and rhythm is currently used by 4 percent of women. Since the failure rate for rhythm is high, it is important to find out if women who are practicing the method know when during the ovulatory cycle they should avoid having sexual intercourse.
Table 7.9 presents the distribution of ever-married women categorized by the time during the ovulatory cycle when they think a woman is most likely to get pregnant (perceived fertile period). The data are presented according to whether or not the woman is currently using the rhythm method. To obtain these data, the respondents were asked at what point during the monthly cycle a woman has the greatest chance of becoming pregnant. The results indicate that the ovulatory cycle is well known to ever-married women, as well as to women who have used the rhythm method. Three-fifths (62 percent) of ever-married women can correctly identify a woman’s fertile period as halfway between two menstrual periods. Among women using rhythm, 78 percent answered correctly, as did 61 percent of nonusers. Overall, women’s knowledge of the fertile period has not changed much since 2007. Eighteen percent of users of the rhythm method incorrectly identified the fertile period as right after the end of the period.
Table 7.9 Knowledge of fertile period
Percent distribution of ever-married women age 15-49 by knowledge of the fertile period during the ovulatory cycle, according to current use of the rhythm method, Jordan 2012
Perceived fertile period
Users of rhythm method
Nonusers of rhythm method
Ever- married women
Just before her menstrual period begins 0.6 1.7 1.7
During her menstrual period 0.0 0.3 0.3 Right after her menstrual
period has ended 17.9 26.8 26.5 Halfway between two
menstrual periods 78.4 61.4 62.0 Other 2.4 0.7 0.7 No specific time 0.6 3.8 3.7 Don't know 0.1 5.2 5.1
Total 100.0 100.0 100.0 Number of women 382 10,970 11,352
Despite the relatively large proportion of women who can correctly identify the fertile period, it
should be noted that almost two-fifths of ever-married women said they did not know the fertile period or gave the wrong answer. Since traditional methods are being used by a substantial number of women, family planning workers need to provide more information on the physiology of reproduction, with emphasis on the ovulatory cycle.
7.9 NEED FOR FAMILY PLANNING SERVICES
Information on fertility preferences is insufficient by itself to estimate the need for family planning services. Many women who do not want to have another child soon are not exposed to the risk of pregnancy, either because they are using contraception or for other reasons. Clearly, a more detailed analysis of unmet need for family planning is needed. In the past, the definition of unmet need used information from the contraceptive calendar and other questions that were not included in every survey, which led to unmet need being calculated inconsistently between surveys. The revised definition uses only information that has been collected in every survey so that unmet need can be measured in the same way over time.
82 • Family Planning
Unmet need for family planning refers to fecund women who are not using contraception but who wish to postpone the next birth (spacing) or stop childbearing altogether (limiting). Specifically, women are considered to have unmet need for spacing if they are:
• At risk of becoming pregnant, not using contraception, and either do not want to become pregnant within the next two years or are unsure if or when they want to become pregnant.
• Pregnant with a mistimed pregnancy.
• Postpartum amenorrheic for up to two years following a mistimed birth and not using contraception.
Women are considered to have unmet need for limiting if they are:
• At risk of becoming pregnant, not using contraception, and want no (more) children.
• Pregnant with an unwanted pregnancy.
• Postpartum amenorrheic for up to two years following an unwanted birth and not using contraception.
Women who are classified as infecund have no unmet need because they are not at risk of becoming pregnant.
Women using contraception are considered to have met need. Women using contraception who say they want no (more) children are considered to have met need for limiting, and women who are using contraception and say they want to delay having a child, or are unsure if or when they want a/another child, are considered to have met need for spacing.
Unmet need, total demand, percentage of demand satisfied, and percentage of demand satisfied by modern methods are defined as follows:
• Unmet need: the sum of unmet need for spacing plus unmet need for limiting
• Total demand for family planning: the sum of unmet need plus total contraceptive use
• Percentage of demand satisfied: total contraceptive use divided by the sum of unmet need plus total contraceptive use
Table 7.10 shows that nearly 12 percent of currently married women in Jordan have an unmet need for family planning. The percentage is split between a need for spacing births (5 percent) and a need for limiting births (7 percent).
Sixty-one percent of women have a met need for contraception; in other words, they are currently using a method. Twenty-one percent of women are using contraception to delay their next birth, while 40 percent want to stop childbearing. The total demand for family planning among currently married women in Jordan is 73 percent. Eighty-four percent of women have had their demand for family planning satisfied.
The level of unmet need for family planning has declined from 14 percent to 12 percent between 2007 and 2012.2 The proportion of total demand that is satisfied has increased by 1 percentage point (from 83 percent to 84 percent) during the same period.
2 Data from 2007 do not match the published figure because it was recalculated with the new definition.

Family Planning • 83
Unmet need for contraception for purposes of spacing births declines in relation to a woman’s age, whereas the need for limiting births increases as a woman ages. The needs for spacing and limiting are complementary, as evidenced by the fact that total unmet need generally varies little by age of the woman, with the exception of women age 35-39.
Unmet need varies little by place of residence and region. Unmet need is lowest in Aqaba (9 percent) and highest in Ma’an (14 percent). Unmet need is linearly associated with education. Women with no education have the highest level of unmet need (17 percent) and women with higher education the lowest (10 percent). Since educated women are more likely to use a contraceptive method than uneducated women, a higher proportion of their total demand for family planning is satisfied. Unmet need is negatively associated with household wealth. Unmet need is higher among women in the lowest wealth quintile (17 percent) than in all other wealth quintiles.

84 •
Fam
ily P
lann
ing Ta
ble
7.10
Nee
d an
d de
man
d fo
r fam
ily p
lann
ing
amon
g cu
rrent
ly m
arrie
d w
omen
P
erce
ntag
e of
cur
rent
ly m
arrie
d w
omen
age
15-
49 w
ith u
nmet
nee
d fo
r fam
ily p
lann
ing,
per
cent
age
with
met
nee
d fo
r fam
ily p
lann
ing,
the
tota
l dem
and
for f
amily
pla
nnin
g, a
nd th
e pe
rcen
tage
of t
he d
eman
d fo
r co
ntra
cept
ion
that
is s
atis
fied,
by
back
grou
nd c
hara
cter
istic
s, J
orda
n 20
12
Bac
kgro
und
ch
arac
teris
tic
Unm
et n
eed
for f
amily
pla
nnin
g M
et n
eed
for f
amily
pla
nnin
g
(cur
rent
ly u
sing
) To
tal d
eman
d fo
r fam
ily p
lann
ing1
Per
cent
age
of d
eman
d sa
tisfie
d2
Per
cent
age
of d
eman
d sa
tisfie
d by
m
oder
n m
etho
ds3
Num
ber o
f w
omen
Fo
r sp
acin
g Fo
r lim
iting
To
tal
For
spac
ing
For
limiti
ng
Tota
l Fo
r sp
acin
g Fo
r lim
iting
To
tal
Ag
e
15
-19
10
.8
1.7
12.5
25.0
2.5
27.5
35.8
4.2
40.0
68.8
54.5
264
20-2
4
10.1
1.
111
.338
.28.
646
.848
.39.
858
.180
.651
.61,
171
25-2
9
11.0
3.
214
.240
.816
.957
.751
.820
.171
.980
.352
.41,
935
30-3
4
5.6
5.1
10.7
30.2
35.0
65.2
35.8
40.1
75.9
85.9
60.6
2,05
535
-39
1.
8 5.
37.
114
.456
.871
.216
.262
.178
.390
.965
.12,
012
40-4
4
0.9
12.1
13.0
3.7
67.1
70.8
4.6
79.2
83.9
84.4
60.8
1,94
445
-49
0.
1 14
.714
.80.
350
.450
.70.
465
.165
.677
.450
.51,
419
Res
iden
ce
Urb
an
4.9
7.0
11.9
20.8
40.3
61.1
25.7
47.3
73.0
83.7
58.6
8,98
3R
ural
5.
2 5.
710
.923
.238
.561
.728
.444
.272
.785
.055
.31,
818
Reg
ion
Cen
tral
4.7
7.5
12.2
19.8
41.3
61.1
24.6
48.8
73.3
83.4
58.3
6,83
9N
orth
5.
6 5.
210
.824
.237
.161
.329
.842
.472
.185
.058
.62,
966
Sou
th
4.3
7.0
11.2
21.7
39.3
61.0
26.0
46.3
72.2
84.5
54.7
996
Go
vern
ora
te
Am
man
4.
8 7.
812
.618
.542
.160
.523
.349
.973
.182
.856
.94,
262
Bal
qa
4.8
5.3
10.1
21.6
38.4
60.0
26.4
43.7
70.1
85.6
59.3
724
Zarq
a
4.4
7.7
12.1
21.9
41.2
63.1
26.3
48.9
75.3
83.9
61.8
1,56
4M
adab
a 5.
6 6.
512
.024
.038
.162
.129
.644
.674
.183
.856
.928
9Irb
id
5.8
4.7
10.5
23.6
38.1
61.7
29.3
42.8
72.2
85.5
60.8
1,89
2M
afra
q 5.
0 6.
311
.326
.333
.259
.531
.239
.670
.884
.051
.852
8Ja
rash
5.
9 6.
011
.925
.136
.761
.831
.042
.673
.783
.957
.930
6A
jloun
5.
1 5.
911
.023
.138
.561
.628
.344
.372
.684
.856
.523
9K
arak
4.
1 7.
912
.020
.738
.559
.224
.846
.571
.383
.156
.142
0Ta
fiela
5.
1 5.
010
.123
.041
.164
.128
.146
.174
.286
.455
.916
1M
a'an
5.
6 7.
913
.521
.237
.258
.426
.845
.171
.981
.242
.716
3A
qaba
3.
2 6.
09.
122
.940
.863
.726
.046
.872
.887
.559
.425
3
Bad
ia
B
adia
6.
1 7.
613
.723
.234
.657
.829
.342
.271
.580
.951
.266
6N
on B
adia
4.
9 6.
711
.621
.140
.361
.425
.947
.173
.084
.158
.510
,135
Cam
ps
C
amp
4.
1 7.
111
.218
.941
.960
.822
.949
.072
.084
.563
.138
7N
on c
amp
5.0
6.8
11.8
21.3
39.9
61.2
26.2
46.7
72.9
83.9
57.8
10,4
14
Ed
uca
tio
n
No
educ
atio
n 4.
5 12
.617
.09.
136
.545
.613
.549
.162
.672
.850
.822
6E
lem
enta
r y
3.7
11.2
14.9
10.4
42.9
53.4
14.1
54.1
68.3
78.2
53.6
788
Pre
para
tory
4.
9 9.
414
.314
.745
.960
.619
.655
.374
.980
.958
.11,
547
Sec
onda
ry
5.1
6.3
11.4
23.4
41.2
64.7
28.6
47.5
76.1
85.0
60.5
4,86
3H
i ghe
r 5.
0 5.
09.
924
.335
.059
.329
.240
.069
.285
.655
.63,
376
Wea
lth
qu
inti
le
Low
est
6.7
9.8
16.5
18.1
39.9
58.0
24.8
49.7
74.5
77.9
54.5
1,97
5S
econ
d 5.
0 6.
211
.222
.738
.260
.927
.744
.472
.184
.458
.02,
179
Mid
dle
5.8
6.0
11.8
23.0
37.0
59.9
28.8
42.9
71.7
83.6
57.3
2,36
4Fo
urth
4.
8 4.
19.
022
.741
.364
.027
.545
.573
.087
.761
.62,
274
Hi g
hest
2.
3 8.
510
.718
.844
.162
.921
.152
.673
.685
.458
.52,
009
Tota
l 4.
9 6.
811
.721
.240
.061
.226
.146
.872
.983
.958
.010
,801
Not
e: N
umbe
rs in
this
tabl
e co
rresp
ond
to th
e re
vise
d de
finiti
on o
f unm
et n
eed
desc
ribed
in B
radl
ey e
t al.,
201
2.
1 Tot
al d
eman
d is
the
sum
of u
nmet
nee
d an
d m
et n
eed.
2 P
erce
ntag
e of
dem
and
satis
fied
is m
et n
eed
divi
ded
by to
tal d
eman
d.
3 Mod
ern
met
hods
incl
ude
fem
ale
ster
ilizat
ion,
mal
e st
eriliz
atio
n, p
ill, IU
D, i
njec
tabl
es, i
mpl
ants
, mal
e co
ndom
, fem
ale
cond
om, a
nd la
ctat
iona
l am
enor
rhea
met
hod
(LA
M).
84 • Family Planning

Family Planning • 85
7.10 FUTURE USE OF FAMILY PLANNING
To obtain information about potential demand for family planning services, all currently married women who were not using contraception at the time of the survey were asked about their intention to use family planning in the future. Those who responded in the affirmative were also asked which method they would prefer to use.
Table 7.11 presents the distribution of currently married women who were not using contraception at the time of the survey, by their intention to use in the future, according to the number of living children. Fifty-four percent of women not currently using a contraceptive method said that they intended to use family planning in the future, while more than two-fifths (42 percent) of nonusers said they do not intend to use in the future. In the 2007 and 2009 JPFHS, the proportion of nonusers who intended to use a family planning method in the future was 58 percent each.
Table 7.11 Future use of contraception
Percent distribution of currently married women age 15-49 who are not using a contraceptive method by intention to use in the future, according to number of living children, Jordan 2012
Intention to use in the future
Number of living children1
Total 0 1 2 3 4+
Intends to use 47.9 61.2 65.6 57.9 47.0 54.4 Unsure 7.3 4.4 3.9 3.8 2.4 4.0 Does not intend to use 44.8 34.4 30.5 38.3 50.6 41.6
Total 100.0 100.0 100.0 100.0 100.0 100.0 Number of women 664 775 657 653 1,445 4,194 1 Includes current pregnancy.
Intention to use increases from 48 percent among childless women to 66 percent among women
with two children, and declines thereafter, to 47 percent among women with four or more children.
7.11 EXPOSURE TO FAMILY PLANNING MESSAGES
Radio and television are major sources of information about family planning, in addition to mass media campaigns, print, and other media. To assess the effectiveness of those media and other sources for disseminating family planning information, all ever-married women were asked if they had heard, seen, or read messages about family planning on the radio, television, or other media and non-media sources, including the Hayatee Ahla campaign, during the few months preceding the survey. Table 7.12 shows that the vast majority of ever-married women have been exposed to at least one source of family planning messages (94 percent). Overall, 80 percent and 29 percent of ever-married women are exposed to family planning messages via the electronic media of television and radio, respectively. Differentials in access to family planning messages by age, place of residence, region, governorates, Badia and camp area, wealth quintile, and education are generally evident, with those sources of information that require literacy showing particularly striking differentials by education. Nevertheless, 67 percent of women had been exposed to family planning information via the print media such as newspapers, magazines, posters, bulletins, or booklets. Nearly two-thirds (64 percent) of women cited other women as a source of family planning messages.

86 • Family Planning
Table 7.12 Exposure to family planning messages
Percentage of ever-married women age 15-49 who heard or saw a family planning message in the past few months on various media and non media sources, and percentage of ever-married women who were exposed to the Hayatee Ahla campaign on family planning in the past few months, according to background characteristics, Jordan 2012
Background characteristic Radio Television
Print media1
None of these three media
sources
Com- munity event2 Women
Other people
Any source
Seen, heard, or read about
Hayatee Ahla
campaign
Seen logo for Hayatee
Ahla campaign
Number of women
Age 15-19 14.5 66.5 51.2 22.2 6.0 54.9 21.8 87.1 31.8 39.6 278 20-24 21.1 72.6 66.4 13.3 13.5 64.3 27.9 93.1 42.7 45.9 1,207 25-29 24.6 78.1 70.3 10.3 12.6 64.6 29.7 94.7 49.8 50.8 2,006 30-34 28.1 80.3 70.0 9.8 14.6 65.3 28.7 94.6 46.7 48.6 2,136 35-39 29.4 84.4 68.7 8.5 16.1 64.6 24.6 95.0 52.6 53.0 2,098 40-44 34.7 84.7 65.5 9.0 21.2 65.3 28.5 94.1 50.8 49.7 2,055 45-49 35.0 80.1 64.0 11.3 17.2 60.0 24.1 93.6 46.4 46.0 1,571
Residence Urban 29.7 79.3 68.7 10.5 16.3 63.5 27.8 94.1 47.4 48.0 9,458 Rural 24.0 85.2 60.5 9.9 13.0 66.2 23.9 94.3 52.5 54.6 1,894
Region Central 35.5 80.5 71.1 9.3 18.4 63.1 29.9 94.8 46.3 47.0 7,181 North 17.5 77.6 61.2 13.6 9.9 66.3 21.6 92.6 52.4 53.7 3,120 South 16.3 86.8 59.8 8.5 14.9 63.1 24.9 94.5 49.0 50.0 1,051
Governorate Amman 40.5 78.9 71.8 8.9 16.8 62.7 28.2 95.3 43.9 44.1 4,454 Balqa 31.0 84.9 70.9 8.7 22.2 68.9 36.9 95.3 52.2 51.6 765 Zarqa 26.3 81.5 70.6 10.9 21.4 61.9 32.3 93.1 49.6 52.0 1,659 Madaba 24.2 86.8 63.5 8.7 15.5 61.2 24.2 94.2 49.8 50.9 303 Irbid 18.1 74.1 61.2 15.5 9.1 65.2 17.9 91.2 53.6 53.7 1,986 Mafraq 13.7 85.1 53.4 11.0 7.0 69.3 22.5 94.5 46.5 49.2 562 Jarash 20.2 82.0 67.3 9.6 16.0 68.8 33.1 95.4 55.3 58.6 320 Ajloun 18.0 83.2 71.2 8.8 15.3 64.4 34.3 95.8 53.1 57.1 251 Karak 10.5 88.5 53.5 8.9 12.0 61.4 19.8 93.7 51.2 51.9 441 Tafiela 17.8 88.5 64.2 8.2 21.9 68.3 31.5 94.7 55.3 55.1 167 Ma'an 23.1 85.7 55.0 9.4 16.7 61.8 27.3 94.5 46.3 48.2 178 Aqaba 20.4 83.6 70.8 7.2 14.3 63.4 27.6 95.8 43.1 44.8 265
Badia Badia 20.3 84.1 53.5 12.6 12.7 64.9 25.8 94.0 42.4 46.3 705 Non Badia 29.4 80.0 68.2 10.2 15.9 63.9 27.3 94.1 48.6 49.3 10,647
Camps Camp 16.9 76.3 65.5 12.9 20.5 66.5 35.1 93.3 43.2 44.9 413 Non camp 29.2 80.4 67.4 10.3 15.6 63.9 26.9 94.2 48.4 49.3 10,939
Education No education 16.6 69.0 20.2 29.0 5.8 55.8 17.5 82.0 23.7 24.8 267 Elementary 18.1 75.9 46.2 18.7 10.7 61.4 23.4 90.3 32.7 33.6 860 Preparatory 26.0 77.8 57.0 13.7 13.7 60.2 22.9 92.7 36.9 39.0 1,677 Secondary 28.2 81.6 69.2 9.6 15.6 65.3 27.7 94.5 51.1 51.8 5,073 Higher 34.6 81.6 78.4 6.5 18.9 65.0 30.1 96.2 55.2 55.7 3,475
Wealth quintile Lowest 20.5 78.1 53.5 14.4 13.1 62.0 22.6 91.7 41.9 44.5 2,137 Second 22.8 80.1 62.0 10.6 14.8 62.4 25.0 93.9 47.1 48.1 2,343 Middle 24.5 82.7 70.3 9.6 15.5 63.6 27.3 95.3 49.2 50.7 2,461 Fourth 32.7 79.4 73.0 9.5 16.8 66.6 28.2 94.7 48.0 50.0 2,336 Highest 44.6 80.8 77.6 8.1 18.6 65.3 33.1 94.9 55.2 52.1 2,076
Total 15-49 28.8 80.3 67.3 10.4 15.7 64.0 27.2 94.1 48.3 49.1 11,352 1 Includes newspaper, magazine, poster, bulletin, or booklet. 2 Includes lecture.
The results also show that only 10 percent of respondents reported that they hadn’t been exposed
to family planning information via any of the three main media sources (radio, television, print). Women with no education and younger women (15-19 years) were most likely to report that they have not been exposed to family planning messages through these three media sources (29 and 22 percent, respectively) than older and more educated women. Differentials in access to family planning messages via any source by other respondent background characteristics are small and range between 90 and 96 percent.

Family Planning • 87
Finally, all ever-married women were asked if they had heard or read about the Hayatee Ahla campaign or had seen its logo. Hayatee Ahla, which means, ‘My Life is More Beautiful’, is a national family planning campaign which encourages Jordanians to effectively plan for a healthy future through contraceptive use. The project which is funded by USAID and the Jordan Health Communication Partnership began in 2004 and is expected to end in 2013. The results indicate that, overall, 48 percent had heard or read about this campaign. An equal proportion (49 percent) of respondents reported seeing the campaign logo. Women age 15-19 years, urban women, women living in the Central region, women in Aqaba and Amman, women in Badia and camp areas, women with no education, and women in the lowest wealth quintile were less likely to have heard or read about the Hayatee Ahla campaign than their counterparts. Differentials with respect to seeing the campaign logo by the respondents’ background characteristics showed a similar pattern.
Because a significant proportion of respondents were recently exposed to a family planning message, all ever-married women who had heard or seen a family planning message on radio, television, or print media in the past few months were asked what the slogan Hayatee Ahla means to them. The results (Table 7.13) indicate that, overall, 37 percent of women equated the meaning of this slogan with family planning. Other meanings of the slogan were also mentioned by the respondents but at very low levels. These meanings included: spacing at least three years between pregnancies (16 percent); happy small family (9 percent); using contraceptives and quality of life, well-being, or prosperity (7 percent each); reproductive health (6 percent); and life planning (4 percent). The remaining five meanings of the slogan were mentioned by 2 percent or fewer women. Around 5 percent of women could not attach a meaning to the slogan. Differentials in the most mentioned meaning of the slogan (family planning) by respondents’ background exist. Least likely to equate the slogan with family planning were younger women (15-19 years); urban women; women living in the Central region, Amman governorate, and Badia and camp areas; women with no education; and women in the lowest wealth.
7.12 CONTACT OF NONUSERS WITH FAMILY PLANNING PROVIDERS
Information on whether ever-married women had visited a health facility (seeking care for themselves or their children) in the 12 months before the survey was collected in the 2012 JPFHS. This contact may provide an opportunity for them to receive family planning information; therefore, women who reported having visited a health facility in the past 12 months were asked whether anyone in the health facility had talked to them about family planning methods. In addition, information on whether ever-married women were visited by a health professional who spoke to them about family planning in the 12 months preceding the survey was also collected.

88 •
Fam
ily P
lann
ing
88 • Family Planning
Tabl
e 7.
13 M
eani
ng o
f Hay
atee
Ahl
a m
essa
ge
Per
cent
age
of e
ver-
mar
ried
wom
en a
ge 1
5-49
by
wha
t the
Hay
atee
Ahl
a fa
mily
pla
nnin
g m
essa
ge m
eans
to th
em, a
ccor
ding
to b
ackg
roun
d ch
arac
teris
tics,
Jor
dan
2012
Bac
kgro
und
char
acte
ristic
Mea
ning
of H
ayat
ee A
hla
Fam
ily
plan
ning
U
sing
co
ntra
cept
ives
Adv
anta
ge
of m
oder
n co
ntra
cept
ion
Hap
py
smal
l fam
ily
Spa
cing
at
leas
t 3 y
ears
be
twee
n pr
egna
ncie
s
Qua
lity
of li
fe,
wel
l-bei
ng,
pros
perit
y
Sup
port
of
gen
der
qual
ity b
y Is
lam
Li
fe
plan
ning
R
epro
duct
ive
heal
th
App
rova
l of
mod
ern
co
ntra
cept
ion
App
rova
l of
spac
ing
betw
een
preg
nanc
ies
by
at le
ast 3
yea
rsO
ther
D
on't
kn
ow
Num
ber
of w
omen
Ag
e
15
-19
29
.34.
0 1.
85.
26.
16.
00.
02.
3 0.
80.
50.
01.
85.
127
8 20
-24
36
.87.
0 2.
06.
513
.95.
21.
32.
7 5.
11.
00.
91.
53.
81,
207
25-2
9
38.8
6.3
2.1
9.4
19.2
6.8
0.2
3.2
4.6
1.1
2.4
1.2
4.5
2,00
6 30
-34
36
.06.
8 1.
710
.013
.76.
70.
34.
9 6.
31.
11.
32.
04.
72,
136
35-3
9
40.3
7.1
1.2
9.0
15.8
9.0
0.9
4.3
6.7
0.9
2.1
1.9
5.7
2,09
8 40
-44
38
.68.
0 1.
710
.816
.49.
50.
44.
4 8.
71.
41.
82.
34.
02,
055
45-4
9
33.4
7.4
3.2
6.7
16.2
5.9
0.2
3.2
6.8
0.9
1.6
3.3
4.9
1,57
1
Res
iden
ce
U
rban
36
.17.
0 2.
08.
815
.07.
10.
53.
6 6.
31.
11.
62.
24.
79,
458
Rur
al
43.3
6.8
1.7
9.6
19.5
9.0
0.3
5.1
6.4
0.7
2.1
1.3
4.6
1,89
4
Reg
ion
Cen
tral
34.7
7.3
2.0
9.7
13.7
7.0
0.5
3.8
6.6
1.4
1.8
2.4
4.7
7,18
1 N
orth
43
.35.
8 1.
47.
019
.88.
30.
43.
9 5.
50.
41.
31.
24.
83,
120
Sou
th
37.7
8.7
3.2
9.1
17.8
7.4
0.7
4.2
7.0
0.9
1.9
2.1
3.8
1,05
1
Go
vern
ora
te
A
mm
an
31.7
8.7
2.3
10.1
12.8
6.7
0.5
3.1
5.9
1.8
1.4
2.9
4.6
4,45
4 B
alqa
41
.64.
6 0.
87.
913
.48.
70.
24.
4 6.
51.
74.
02.
24.
676
5 Za
rqa
38
.63.
3 1.
710
.314
.96.
90.
65.
1 8.
40.
32.
21.
45.
31,
659
Mad
aba
40
.314
.2
1.6
5.5
20.6
7.7
0.9
6.1
5.9
0.9
1.7
1.2
3.5
303
Irbid
43
.66.
3 1.
57.
022
.19.
50.
43.
9 6.
00.
41.
41.
14.
61,
986
Maf
raq
38
.46.
6 1.
56.
014
.94.
00.
53.
4 3.
00.
31.
01.
14.
856
2 Ja
rash
48
.73.
7 0.
87.
618
.67.
50.
23.
7 6.
10.
40.
71.
94.
632
0 A
jloun
44
.53.
5 1.
48.
114
.09.
50.
35.
8 7.
20.
61.
81.
56.
225
1 K
arak
37
.810
.4
4.7
10.6
20.4
7.3
0.7
3.9
7.7
0.9
1.4
1.1
2.6
441
Tafie
la
42.1
9.3
1.2
9.9
19.3
9.1
0.7
3.8
9.4
0.9
2.8
3.0
3.9
167
Ma'
an
35.5
8.5
2.3
6.8
13.4
6.9
1.2
4.4
5.9
1.0
1.4
3.0
5.4
178
Aqa
ba
36.1
5.7
2.5
7.5
15.6
6.6
0.3
4.6
4.9
1.0
2.3
2.7
4.5
265
Bad
ia
B
adia
33
.97.
0 1.
77.
615
.15.
30.
63.
0 4.
70.
81.
41.
25.
570
5 N
on B
adia
37
.57.
0 2.
09.
015
.87.
50.
53.
9 6.
41.
11.
72.
14.
610
,647
Cam
ps
C
amp
35
.04.
5 1.
06.
711
.17.
00.
13.
1 4.
20.
21.
61.
96.
141
3 N
on c
amp
37
.47.
1 2.
09.
015
.97.
40.
53.
9 6.
41.
11.
72.
04.
610
,939
Ed
uca
tio
n
N
o ed
ucat
ion
17
.43.
7 0.
23.
74.
62.
20.
61.
1 1.
20.
01.
00.
53.
626
7 E
lem
enta
r y
23.4
6.0
1.7
4.2
9.6
5.7
0.3
4.2
2.8
1.0
2.3
1.0
5.3
860
Pre
para
tor y
27
.95.
1 1.
48.
310
.55.
80.
23.
6 4.
40.
51.
21.
94.
51,
677
Sec
onda
r y
39.1
7.9
1.7
9.1
17.3
7.5
0.5
3.5
6.2
1.2
1.7
1.5
5.1
5,07
3 H
i ghe
r 44
.37.
2 2.
810
.518
.38.
80.
74.
6 8.
61.
31.
93.
24.
03,
475
Wea
lth
qu
inti
le
Lo
wes
t 32
.95.
7 0.
47.
114
.46.
80.
34.
9 4.
41.
81.
71.
94.
92,
137
Sec
ond
36
.87.
4 2.
29.
015
.58.
50.
33.
9 5.
61.
12.
01.
24.
32,
343
Mid
dle
39
.96.
8 1.
59.
716
.88.
00.
13.
3 6.
60.
92.
01.
43.
72,
461
Four
th
38.0
7.3
2.8
9.5
15.5
7.4
0.6
3.3
6.9
0.4
2.1
1.2
5.6
2,33
6 H
i ghe
st
38.6
7.7
2.6
9.1
16.4
6.1
1.3
4.0
8.1
1.1
0.5
4.8
4.7
2,07
6
Tota
l 15-
49
37.3
7.0
1.9
8.9
15.7
7.4
0.5
3.9
6.3
1.1
1.7
2.0
4.7
11,3
52

Family Planning • 89
Table 7.14 shows that, overall, about three in four women who came into contact with family planning providers did not in fact discuss family planning with them. While more than three-quarters of women (77 percent) had visited a health facility in the 12 months preceding the survey, only 17 percent had discussed family planning methods during their visit. The results also show that older women (age 40-49); rural women; women living in the North region and in Irbid, Mafraq, and Ma’an; women in non Badia areas; women in non camp areas; uneducated women; and women in the fourth and highest wealth quintiles were less likely to have discussed family planning during a visit to a health facility than other women.
Table 7.14 Contact of nonusers with family planning providers
Among ever-married women age 15-49 who are not using contraception, the percentage who during the past 12 months were visited by a fieldworker who discussed family planning, the percentage who visited a health facility and discussed family planning, the percentage who visited a health facility but did not discuss family planning, and the percentage who did not discuss family planning either with a fieldworker or at a health facility, by background characteristics, Jordan 2012
Background characteristic
Percentage of women who were
visited by fieldworker who discussed family
planning
Percentage of women who visited a health facility in the past
12 months and who:
Percentage of women who did
not discuss family planning either
with fieldworker or at a health facility
Number of women
Discussed family planning
Did not discuss family planning
Age 15-19 8.6 15.6 60.7 80.1 205 20-24 12.0 20.9 63.4 72.0 659 25-29 13.4 23.6 61.8 69.2 889 30-34 18.2 22.3 58.0 66.8 796 35-39 16.7 17.9 58.8 69.6 664 40-44 15.8 8.4 58.6 79.5 678 45-49 12.3 6.6 59.9 84.2 845
Residence Urban 15.7 16.9 59.4 72.7 3,968 Rural 7.8 15.2 63.9 80.1 768
Region Central 15.1 18.1 56.1 71.7 2,995 North 14.8 13.7 68.3 76.9 1,298 South 8.3 15.8 63.3 79.4 443
Governorate Amman 11.7 17.6 57.7 74.0 1,870 Balqa 18.2 18.7 55.7 69.5 331 Zarqa 24.6 19.8 49.3 64.6 671 Madaba 7.0 13.4 71.0 81.7 122 Irbid 16.8 12.0 67.6 77.1 817 Mafraq 5.3 12.8 73.5 83.7 247 Jarash 19.1 23.3 59.2 67.6 131 Ajloun 17.0 16.7 72.7 71.2 104 Karak 5.4 14.3 67.5 83.0 193 Tafiela 11.7 25.5 52.1 68.6 63 Ma'an 8.2 12.3 67.9 82.5 83 Aqaba 11.8 15.3 58.9 76.9 104
Badia Badia 8.4 19.5 59.8 76.3 321 Non Badia 14.8 16.4 60.1 73.7 4,415
Camps Camp 30.5 27.7 48.2 54.1 177 Non camp 13.8 16.2 60.6 74.6 4,559
Education No education 14.4 8.9 55.7 80.7 163 Elementary 18.1 11.8 55.8 75.7 435 Preparatory 16.0 17.1 58.0 72.1 738 Secondary 15.1 18.2 59.3 72.2 1,928 Higher 11.7 16.7 64.0 75.6 1,472
Wealth quintile Lowest 16.1 21.4 54.8 68.8 989 Second 15.6 16.2 60.4 73.7 1,013 Middle 15.3 17.7 58.3 71.3 1,042 Fourth 13.0 13.8 62.1 77.7 880 Highest 11.2 13.2 66.3 79.3 812
Total 14.4 16.7 60.1 73.9 4,736
The data also reveal that only 14 percent of women were visited by a fieldworker who discussed
family planning. Least likely to have been visited by a fieldworker who discussed family planning are women age 15-19, rural women, women in Mafraq and Karak, women in Badia areas and non camp areas, women with higher education, and women in the highest wealth quintile.


Infant and Child Mortality • 91
INFANT AND CHILD MORTALITY 8
stimates of levels, trends, and differentials in neonatal, postneonatal, and child mortality are important both for monitoring and evaluating ongoing health programs and for use in formulating future policies. The levels of infant and child mortality are viewed as basic indicators of the
socioeconomic situation, quality of life, and general standard of living in a society. In addition to addressing those issues, this chapter examines the risk factors for births in Jordan.
The five measures of infant and child mortality used in this chapter are as follows:
Neonatal mortality, the probability of dying in the first month of life
Postneonatal mortality, the probability of dying between the first month and first year of life
Infant mortality (1q0), the probability of dying before the first birthday
Child mortality (4q1), the probability of dying between the first and fifth birthday
Under-5 mortality (5q0), the probability of dying before the fifth birthday
All of these rates are calculated per 1,000 live births, except for child mortality, which is calculated per 1,000 children surviving to age one.
Infant and child mortality rates are calculated from information collected in the birth history section of the Woman’s Questionnaire. In the 2012 JPFHS, each ever-married woman was asked about the number of sons and daughters living with her, the number living away, and the number who had died. Those questions were aimed at obtaining the total number of births the respondent had. Next, the respondent was asked to give detailed information on each of the children she had given birth to, including name, sex, date of birth, whether the birth was single or multiple, and survival status. If the child had died, the age at death was recorded. If the child was still living, questions were asked about the age at last birthday and whether the child was living with the mother or elsewhere. It should be noted that birth histories are often subject to inaccuracies in the reporting of events, and can result in biased rates and trends over time. Despite the disadvantages, birth histories provide data for analyses that would be impossible to collect by any other method of gathering data.
E
Key Findings
• Infant and under-5 mortality rates in the past five years are 17 and 21 deaths per 1,000 live births, respectively. At these mortality levels, one in every 59 Jordanian children dies before reaching age 1, and one in every 48 does not survive to the fifth birthday.
• Under-5 mortality declined by 46 percent over the last 23 years from 39 deaths per 1,000 live births in 1990 to 21 deaths per 1,000 live births in 2012.
• Childhood mortality is relatively higher in the South region, in the Tafiela governorate, and in the camp areas of Jordan.
• The neonatal mortality rate is 14 deaths per 1,000 live births, which is three and a half times the postneonatal rate.
• The perinatal mortality rate is 17 per 1,000 pregnancies.
92 • Infant and Child Mortality
The reliability of mortality estimates depends on the sampling variability of the estimates and on nonsampling errors. Sampling variability and sampling errors are discussed in Appendix B. Nonsampling errors depend on the completeness of a women’s recall about children who have died, the absence of significant differences between the displacement of birth dates of living and dead children, and accurate reporting of ages at death. Previous survey results have shown some heaping of age at death at exactly 12 months or one year. On the assumption that age at death is reported in completed months or years, deaths at 12 months are classified as child rather than infant deaths. In reality, some of those deaths may have occurred before the first birthday, so their classification as child deaths tends to negatively bias infant mortality estimates and positively bias child mortality estimates. The distribution of deaths by age at death in months (see Table C.6 in Appendix C) shows that there is heaping at 12 months for deaths reported during the most recent period (0-4 years prior to the survey) and less severe heaping for deaths during the period 5-19 years prior to the survey. Therefore, infant mortality levels in the most recent period (0-4 years prior to the survey) may be slightly underestimated and child mortality slightly overestimated.
An unusual pattern in the distribution of births by calendar years is an indication of omission of children or age displacement. However, Table C.4 in Appendix C shows that the percentage of all births for which a month and year of birth was reported remains stable over time and is close to 100 percent.
Underreporting of deaths is usually assumed to be higher for deaths that occur very early in infancy. An examination of the ratios in Tables C.5 and C.6 shows that the proportion of neonatal deaths occurring in the first week of life (85 percent) and the proportion of infant deaths occurring during the first month of life (82 percent) are somewhat higher than findings from the previous JPFHS surveys. Findings from the 2002, 2007, and 2009 JPFHS surveys show that for deaths in the five years before the survey, the proportion of neonatal deaths occurring in the first week of life ranges from 64-75 and the proportion of infant deaths occurring in the first month of life ranges from 71-73. The higher proportions found in the 2012 JPFHS may not necessarily suggest issues with data quality in the 2012 JPFHS but a shift in the pattern of neonatal and infant mortality rates in the most recent period. This may warrant in-depth analysis of the change in the pattern of childhood mortality in more recent times. However, this kind of analysis is outside the scope of this report.
In addition to levels of mortality, this chapter also includes a table indicating the distribution of children and women according to characteristics of avoidable fertility behavior that place children at a greater risk of mortality. That information is useful for designing and monitoring programs aimed at both discouraging high-risk behavior and coping with the elevated risks.
8.1 LEVELS AND TRENDS
Table 8.1 shows early childhood mortality rates for the 15 years preceding the 2012 JPFHS. The under-5 mortality rate in the 0-4 years before the survey was 21 deaths per 1,000 live births. Most under-5 deaths occur during the first year of life, with infant mortality at 17 per 1,000 live births. The child mortality rate is 4 per 1,000 children. As expected, neonatal mortality is higher than postneonatal mortality (14 per 1,000 and 4 per 1,000, respectively) and accounts for 82 percent of total infant mortality.

Infant and Child Mortality • 93
Table 8.1 Early childhood mortality rates
Neonatal, postneonatal, infant, child, and under-5 mortality rates for five-year periods preceding the survey, Jordan 2012
Years preceding the survey
Neonatal mortality
(NN)
Postneonatal mortality (PNN)1
Infant mortality
(1q0)
Child mortality
(4q1)
Under-5 mortality
(5q0)
0-4 14 4 17 4 21 5-9 11 7 18 2 20 10-14 20 10 30 4 34 1 Computed as the difference between the infant and neonatal mortality rates.
It is apparent from Table 8.1 and Figure 8.1 that there was a marked decline in childhood
mortality in the last 15 years. However, there is no indication of a decline in childhood mortality in the last five years. Under-5 mortality declined by 38 percent, from 34 deaths per 1,000 live births in the 10-14 years preceding the survey to 21 deaths during the five years preceding the survey. A similar decline is seen in infant mortality which declined by 43 percent from 30 deaths per 1,000 live births during the period 10-14 years preceding the survey to 17 deaths during the five years preceding the survey. This decline is due to a substantial decline in both neonatal and postneonatal mortality. However, child mortality has not changed during the last 15 years. In fact, child mortality seems to have increased in the last five years compared with the 5-9 years preceding the survey.
Figure 8.1
Trends in childhood mortality, Jordan 2012
JPFHS 2012
Another approach to looking at trends in mortality levels involves the comparison of estimates from surveys conducted at different points in time. Results from the five JPFHS surveys (conducted in 1990, 1997, 2002, 2007, and 2012) show a 46 percent decline in under-5 mortality over the last 23 years (Figure 8.2). Under-5 mortality declined from 39 deaths per 1,000 in 1990 to 21 per 1,000 in the 2012 survey. It is interesting to note that the confidence intervals associated with the 2007 and 2012 under-5 mortality rates of 21 per 1,000 are almost identical, suggesting that under-5 mortality has not changed in the last five years. A similar trend is observed in infant mortality. Infant mortality declined by 50 percent from 34 per 1,000 in 1990 to 17 per 1,000 in 2012.
20
10
30
4
34
117
18
2
20
14
4
17
4
21
Neonatalmortality
Postneonatalmortality
Infantmortality
Childmortality
Under-5mortality
10-14 5-9 0-4

94 • Infant and Child Mortality
Figure 8.2 Trends in under-5 mortality, 1990-2012
8.2 DIFFERENTIALS IN INFANT AND CHILD MORTALITY
8.2.1 Differentials by Background Characteristics
Differentials in neonatal, postneonatal, infant, child, and under-5 mortality by socioeconomic characteristics are shown in Table 8.2. To have a sufficient number of cases to ensure statistically reliable mortality estimates for population subgroups, mortality rates are presented for the 10-year period preceding the survey. Under-5 mortality does not vary substantially by type of residence.
Childhood mortality varies across regions. Under-5 mortality is higher in the South region (26 per 1,000) than in the North region (19 per 1,000) and Central region (20 deaths per 1,000). Childhood mortality also varies by governorate, with under-5 mortality ranging from a low of 16 deaths per 1,000 live births in Ajloun to a high of 31 deaths per 1,000 live births in Tafiela. Children living in camps are also more likely to die young than children outside of camps, with under-5 mortality at 33 per 1,000 in camps compared with 20 per 1,000 outside of camps.
34
39
29
34
22
27
1921
1721
Infant mortality Under-5 mortality
JPFHS 1990 JPFHS 1997 JPFHS 2002 JPFHS 2007 JPFHS 2012

Infant and Child Mortality • 95
Table 8.2 Early childhood mortality rates by socioeconomic characteristics
Neonatal, postneonatal, infant, child, and under-5 mortality rates for the 10-year period preceding the survey, by background characteristics, Jordan 2012
Background characteristic
Neonatal mortality
(NN)
Postneonatal mortality (PNN)1
Infant mortality
(1q0)
Child mortality
(4q1)
Under-5 mortality
(5q0)
Residence Urban 12 5 18 3 21 Rural 11 5 16 3 19
Region Central 11 6 17 4 20 North 14 3 17 2 19 South 14 7 22 4 26
Governorate Amman 10 7 17 3 20 Balqa 10 5 14 3 18 Zarqa 13 3 16 4 20 Madaba 18 7 25 5 30 Irbid 14 3 17 2 18 Mafraq 16 5 21 2 23 Jarash 13 5 18 2 20 Ajloun 9 5 14 2 16 Karak 13 6 19 4 24 Tafiela 16 10 26 5 31 Ma'an 12 10 22 7 29 Aqaba 17 6 23 2 25
Badia Badia 12 6 18 2 20 Non Badia 12 5 17 3 21
Camps Camp 20 7 27 6 33 Non camp 12 5 17 3 20
Mother's education No education 7 3 10 7 16 Elementary 15 6 20 4 24 Preparatory 13 9 22 3 25 Secondary 14 6 20 2 22 Higher 9 2 11 4 15
Wealth quintile Lowest 17 9 26 3 29 Second 10 5 15 4 19 Middle 11 4 15 5 20 Fourth 15 4 20 1 21 Highest 5 3 8 3 11
1 Computed as the difference between the infant and neonatal mortality rates
The data do not reveal a clear association between under-5 mortality and mother’s education.
Children of mothers with elementary, preparatory, or secondary education are more likely to die in the first five years of life than children of mothers with no education or higher education. Under-5 mortality ranges from a low of 15 deaths per 1,000 live births for children of women with higher education to a high of 25 per 1,000 for children of women with only preparatory education.
Under-5 mortality is almost three times higher among children living in the poorest households than among children living in the wealthiest households (29 deaths per 1,000 live births and 11 deaths per 1,000 live births, respectively).
8.2.2 Differentials by Demographic Characteristics
Besides socioeconomic characteristics, demographic characteristics of the child and the mother have been found to affect mortality risks. Some of these factors include the sex of the child, mother’s age at birth, birth order, length of previous birth interval, and the size of the child at birth. The relationship between these demographic characteristics and mortality is shown in Table 8.3 and Figure 8.2.

96 • Infant and Child Mortality
Table 8.3 Early childhood mortality rates by demographic characteristics
Neonatal, postneonatal, infant, child, and under-5 mortality rates for the 10-year period preceding the survey, by demographic characteristics, Jordan 2012
Demographic characteristic
Neonatal mortality
(NN)
Postneonatal mortality (PNN)1
Infant mortality
(1q0)
Child mortality
(4q1)
Under-5 mortality
(5q0)
Child's sex Male 13 6 19 3 22 Female 11 4 16 3 19
Mother's age at birth <20 10 8 18 3 21 20-29 12 6 18 3 20 30-39 13 4 17 3 20 40-49 12 1 12 (15) (27)
Birth order 1 15 5 19 3 23 2-3 12 3 14 4 18 4-6 11 7 18 3 21 7+ 6 15 21 1 22
Previous birth interval2 <2 years 16 9 25 4 29 2 years 9 3 12 4 16 3 years 9 3 13 2 15 4+ years 11 4 16 2 18
Birth size3 Small/very small 34 4 38 na na Average or larger 9 3 12 na na
Note: Figures in parentheses are based on 250-499 unweighted exposed persons. na = Not applicable 1 Computed as the difference between the infant and neonatal mortality rates. 2 Excludes first-order births. 3 Rates for the five-year period before the survey.
Figure 8.3 Under-5 mortality rates by selected demographic characteristics
JPFHS 2012
21
20
20
27
23
18
21
22
29
16
15
18
Mother's age at birth
<20
20-29
30-39
40-49
Birth order
1
2-3
4-6
7+
Previous birth interval
<2 years
2 years
3 years
4+ years
Deaths per 1,000 births

Infant and Child Mortality • 97
Under-5 mortality levels are slightly higher among male than female children (22 deaths and 19 deaths per 1,000 live births, respectively). Under-5 mortality does not differ much by mother’s age at birth.
First births and higher-order births experience higher mortality, indicating a shallow U-shaped relationship between birth order and mortality. For example, under-5 mortality rates for first births and births of order seven and higher are 23 per 1,000 births and 22 per 1,000 births, respectively, compared with 18-21 per 1,000 births for second- through sixth-order births.
Mortality among children is negatively associated with the length of the previous birth interval. Under-5 mortality decreases sharply from a high of 29 per 1,000 for children born less than two years after a previous birth to 16 per 1,000 live births for children born two years after a previous birth and rises to 18 per 1,000 live births for children born four or more years after a previous birth.
Children’s weight at birth is also closely associated with their chances of survival, particularly during the first month of life. Children reported as “small or very small” at birth were three times more likely to die in the first month of life compared with children whose size at birth was reported as “average or larger.” Of children reported to be small or very small, 38 per 1,000 did not survive to their first birthday, compared with 12 per 1,000 children reported to be average or larger.
8.3 PERINATAL MORTALITY
The 2012 JPFHS survey asked women to report on pregnancy losses and the duration of the pregnancy for each loss for all such pregnancies ending in the five years before the survey. Pregnancy losses occurring after seven completed months of gestation (stillbirths) plus deaths to live births within the first seven days of life (early neonatal deaths) constitute perinatal deaths. The perinatal mortality rate is calculated by dividing the total number of perinatal deaths by the total number of pregnancies reaching seven months’ gestation. An important consideration in the evaluation of perinatal mortality is the quality or completeness of reports on stillbirths, which are susceptible to omission, underreporting, or misclassification (as early neonatal deaths). The distinction between a stillbirth and an early neonatal death may be a fine one, depending often on the observed presence or absence of some faint signs of life after delivery. The causes of stillbirths and early neonatal deaths are overlapping, and examining just one or the other can understate the true level of mortality around delivery. For this reason, it is suggested that both event types be combined and examined together.
Table 8.4 shows perinatal mortality rates, according to background characteristics. At the national level, the perinatal mortality rate is 17 perinatal deaths per 1,000 pregnancies reaching seven months of gestation. Perinatal mortality increases with mother’s age from 4 deaths per 1,000 pregnancies among women age less than 20 years to 22 deaths per 1,000 pregnancies among women age 40-49 years. First pregnancies have the highest perinatal mortality rates, while pregnancies with a short or very long preceding interpregnancy interval are also at higher perinatal risk (19 per 1,000 for an interpregnancy interval of less than 15 months and 18 per 1,000 for pregnancies after an interval of 39 or more months).
Perinatal mortality is very similar in urban areas (18 per 1,000) and rural areas (16 per 1,000). At the regional level, the perinatal mortality rates are slightly higher in the North and South regions (20 deaths per 1,000 pregnancies each) than in the Central region (16 deaths per 1,000 pregnancies). Perinatal mortality is also slightly higher in the non Badia and camp areas of Jordan than in the other areas. Perinatal mortality varies widely by governorate and ranges from a high of 27 deaths per 1,000 pregnancies in Karak to a low of 8 in Tafiela. It is worth noting that perinatal mortality is substantially higher among women with only elementary education than among other women (32 deaths per 1,000 pregnancies).

98 • Infant and Child Mortality
Table 8.4 Perinatal mortality
Number of stillbirths and early neonatal deaths, and the perinatal mortality rate for the five-year period preceding the survey, by background characteristics, Jordan 2012
Background characteristic
Number of stillbirths1
Number of early neonatal
deaths2 Perinatal
mortality rate3
Number of pregnancies of
7+ months’ duration
Mother's age at birth <20 2 0 4 561 20-29 18 69 17 5,258 30-39 26 46 20 3,666 40-49 6 3 22 399
Previous pregnancy interval in months4 First pregnancy 11 39 25 2,025 <15 10 18 19 1,479 15-26 9 24 13 2,532 27-38 3 14 11 1,560 39+ 19 23 18 2,288
Residence Urban 41 100 18 8,051 Rural 10 18 16 1,833
Region Central 23 71 16 6,037 North 18 39 20 2,885 South 10 9 20 963
Governorate Amman 12 47 16 3,634 Balqa 4 7 16 708 Zarqa 4 13 12 1,416 Madaba 3 4 25 279 Irbid 11 26 21 1,739 Mafraq 4 9 21 577 Jarash 1 3 13 334 Ajloun 3 1 17 234 Karak 7 4 27 417 Tafiela 0 1 8 158 Ma'an 1 2 20 171 Aqaba 1 2 16 217
Badia Badia 4 8 15 773 Non Badia 48 111 17 9,112
Camps Camp 1 6 20 389 Non camp 50 112 17 9,496
Mother's education No education 1 2 13 208 Elementary 3 17 32 631 Preparatory 6 9 11 1,314 Secondary 25 75 22 4,625 Higher 16 16 10 3,107
Wealth quintile Lowest 12 43 24 2,304 Second 6 18 11 2,186 Middle 12 26 18 2,127 Fourth 4 18 11 1,897 Highest 17 13 22 1,371
Total 51 119 17 9,885 1 Stillbirths are fetal deaths in pregnancies lasting seven or more months. 2 Early neonatal deaths are deaths at age 0-6 days among live-born children. 3 The sum of the number of stillbirths and early neonatal deaths divided by the number of pregnancies of seven or more months' duration, expressed per 1,000. 4 Categories correspond to birth intervals of <24 months, 24-35 months, 36-47 months, and 48+ months.
There is no clear pattern in perinatal mortality by household wealth. Perinatal mortality is
relatively higher among women in the lowest and highest wealth quintiles (24 and 22 deaths per 1,000 pregnancies).
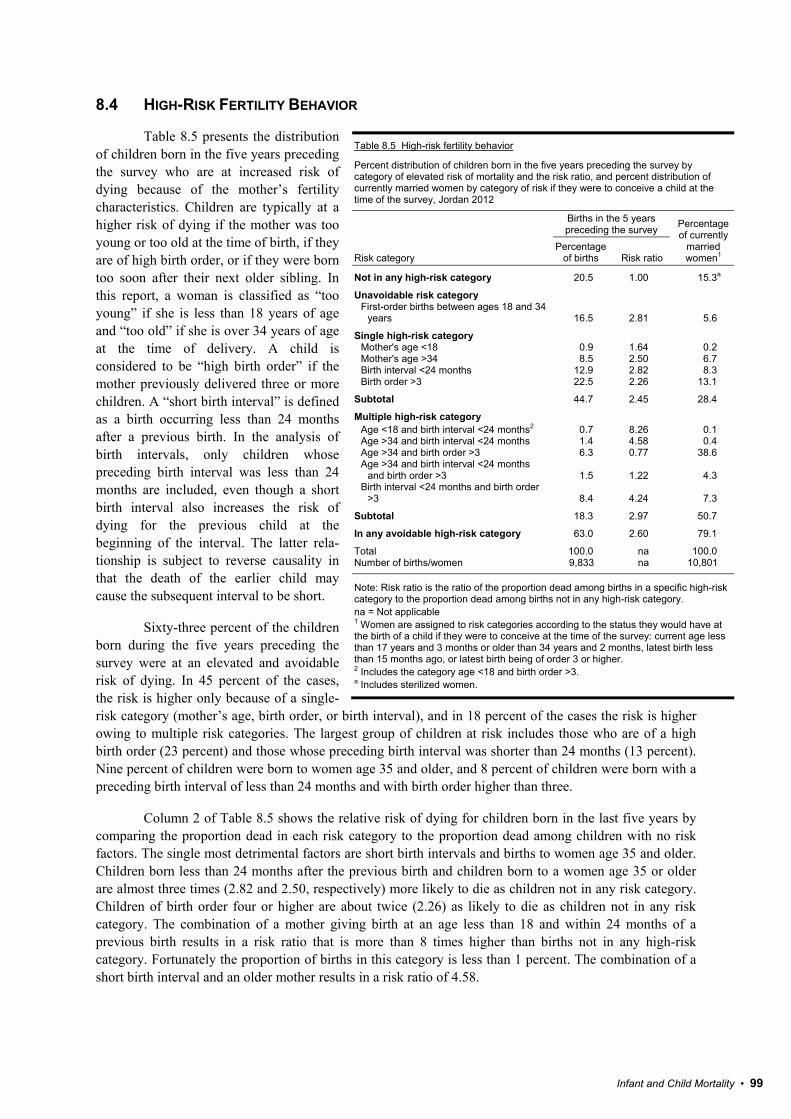
Infant and Child Mortality • 99
8.4 HIGH-RISK FERTILITY BEHAVIOR
Table 8.5 presents the distribution of children born in the five years preceding the survey who are at increased risk of dying because of the mother’s fertility characteristics. Children are typically at a higher risk of dying if the mother was too young or too old at the time of birth, if they are of high birth order, or if they were born too soon after their next older sibling. In this report, a woman is classified as “too young” if she is less than 18 years of age and “too old” if she is over 34 years of age at the time of delivery. A child is considered to be “high birth order” if the mother previously delivered three or more children. A “short birth interval” is defined as a birth occurring less than 24 months after a previous birth. In the analysis of birth intervals, only children whose preceding birth interval was less than 24 months are included, even though a short birth interval also increases the risk of dying for the previous child at the beginning of the interval. The latter rela-tionship is subject to reverse causality in that the death of the earlier child may cause the subsequent interval to be short.
Sixty-three percent of the children born during the five years preceding the survey were at an elevated and avoidable risk of dying. In 45 percent of the cases, the risk is higher only because of a single- risk category (mother’s age, birth order, or birth interval), and in 18 percent of the cases the risk is higher owing to multiple risk categories. The largest group of children at risk includes those who are of a high birth order (23 percent) and those whose preceding birth interval was shorter than 24 months (13 percent). Nine percent of children were born to women age 35 and older, and 8 percent of children were born with a preceding birth interval of less than 24 months and with birth order higher than three.
Column 2 of Table 8.5 shows the relative risk of dying for children born in the last five years by comparing the proportion dead in each risk category to the proportion dead among children with no risk factors. The single most detrimental factors are short birth intervals and births to women age 35 and older. Children born less than 24 months after the previous birth and children born to a women age 35 or older are almost three times (2.82 and 2.50, respectively) more likely to die as children not in any risk category. Children of birth order four or higher are about twice (2.26) as likely to die as children not in any risk category. The combination of a mother giving birth at an age less than 18 and within 24 months of a previous birth results in a risk ratio that is more than 8 times higher than births not in any high-risk category. Fortunately the proportion of births in this category is less than 1 percent. The combination of a short birth interval and an older mother results in a risk ratio of 4.58.
Table 8.5 High-risk fertility behavior
Percent distribution of children born in the five years preceding the survey by category of elevated risk of mortality and the risk ratio, and percent distribution of currently married women by category of risk if they were to conceive a child at the time of the survey, Jordan 2012
Risk category
Births in the 5 years preceding the survey Percentage
of currently married women1
Percentage of births Risk ratio
Not in any high-risk category 20.5 1.00 15.3a
Unavoidable risk category First-order births between ages 18 and 34
years 16.5 2.81 5.6
Single high-risk category Mother's age <18 0.9 1.64 0.2 Mother's age >34 8.5 2.50 6.7 Birth interval <24 months 12.9 2.82 8.3 Birth order >3 22.5 2.26 13.1
Subtotal 44.7 2.45 28.4
Multiple high-risk category Age <18 and birth interval <24 months2 0.7 8.26 0.1 Age >34 and birth interval <24 months 1.4 4.58 0.4 Age >34 and birth order >3 6.3 0.77 38.6 Age >34 and birth interval <24 months
and birth order >3 1.5 1.22 4.3 Birth interval <24 months and birth order
>3 8.4 4.24 7.3
Subtotal 18.3 2.97 50.7
In any avoidable high-risk category 63.0 2.60 79.1
Total 100.0 na 100.0 Number of births/women 9,833 na 10,801
Note: Risk ratio is the ratio of the proportion dead among births in a specific high-risk category to the proportion dead among births not in any high-risk category. na = Not applicable 1 Women are assigned to risk categories according to the status they would have at the birth of a child if they were to conceive at the time of the survey: current age less than 17 years and 3 months or older than 34 years and 2 months, latest birth less than 15 months ago, or latest birth being of order 3 or higher. 2 Includes the category age <18 and birth order >3. a Includes sterilized women.

100 • Infant and Child Mortality
The last column of Table 8.5 presents the distribution of currently married women according to category of increased risk. Women are placed in categories according to the status they would have at the birth of a child conceived at the time of the survey: women who were younger than 17 years and 3 months or older than 34 years and 2 months, women whose most recent birth was less than 15 months before the survey, and women whose most recent birth was of order three or higher. Many women are protected from the risk of pregnancy by contraception, postpartum insusceptibility, and prolonged abstinence but, in this report, for the sake of simplicity, only sterilized women are classified as not being in any risk category.
About eight of ten married women (79 percent) are susceptible to conceiving a child who will be at an increased risk of dying. About 51 percent of married women fall in the multiple high-risk category—mainly those who are older than 34 and with three or more births—while 28 percent of women fall in a single high-risk category, mainly because of a high-order birth (13 percent). The figures in Table 8.5 demonstrate the strong contribution of high parity (the number of children the mother has had) on the risk of dying among children under age 5.

Maternal Health • 101
MATERNAL HEALTH 9
ealth conditions in Jordan are among the best in the Middle East. This is due in large part to the kingdom’s stability and to a range of effective development plans and projects that have included health as a major component. This chapter presents findings on important areas of maternal
health: antenatal, delivery, and postnatal care. In addition, problems in accessing health care and coverage of breast and cervical cancer prevention services are discussed. This information, in combination with data on child health and mortality, is useful in formulating programs and policies to improve maternal and child health services.
9.1 ANTENATAL CARE
A mother’s well-being has a direct impact on her children’s well-being. Conversely, when mothers fare poorly, so do children. For newborns, health and survival is directly proportional to a mother’s health during pregnancy.
The health care that a mother receives during pregnancy and at delivery is important for the survival and well-being of both the mother and the child. Antenatal care (ANC) coverage is described according to the type of provider, number of ANC visits, stages of pregnancy at the time of the first and last visits, and number of visits, as well as services and information provided during ANC. It is recommended that, during ANC, women receive tetanus toxoid vaccine and adequate amounts of iron and folic acid tablets or syrup to prevent and treat anemia. Blood pressure checks and procedures to detect pregnancy complications are also part of ANC coverage. A well-designed and well-implemented ANC program facilitates detection and treatment of problems during pregnancy, such as anemia and infections, and provides an opportunity to disseminate health messages to women.
In the 2012 JPFHS, information on ANC coverage was obtained from women who had a birth in the five years preceding the survey. For women with two or more live births during the five-year period, data refer only to the most recent birth. Table 9.1 shows the percent distribution of mothers in the five years preceding the survey by source of antenatal care received during pregnancy. Almost all women (99 percent) received ANC from medically trained personnel (doctors, nurses, or midwives); the majority of
H
Key Findings
• Almost all women (99 percent) received antenatal care (ANC) from medically trained personnel; the majority of women (96 percent) received care during pregnancy from a doctor.
• Seventy-eight percent of women make seven or more antenatal care visits during their entire pregnancy. The median duration of pregnancy at the first antenatal visit is 2.3 months.
• Thirty-one percent of mothers with a birth in the five years preceding the survey were protected against neonatal tetanus.
• An overwhelming majority of births (99 percent) in the five years preceding the survey were delivered in a medical facility. Three in four births (76 percent) were delivered by a doctor.
• Eighty-two percent of mothers received postnatal care from a doctor, nurse, or midwife within the critical first two days after a delivery.

102 • Maternal Health
women (96 percent) received care during pregnancy from a doctor, and 3 percent received care from a nurse or midwife. Only 1 percent of women did not receive antenatal care for their last birth.
Table 9.1 Antenatal care
Percent distribution of women age 15-49 who had a live birth in the five years preceding the survey by antenatal care (ANC) provider during pregnancy for the most recent birth and the percentage receiving antenatal care from a skilled provider for the most recent birth, according to background characteristics, Jordan 2012
Background characteristic
Antenatal care provider
No ANC Total
Percentage receiving
antenatal care from a skilled
provider1 Number
of women Doctor Nurse/ midwife
Mother's age at birth <20 96.0 2.4 1.7 100.0 98.3 277 20-34 96.8 2.6 0.6 100.0 99.4 4,849 35-49 94.6 3.7 1.7 100.0 98.3 1,451
Birth order 1 98.4 1.2 0.4 100.0 99.6 1,159 2-3 97.2 2.2 0.6 100.0 99.4 2,566 4-5 95.3 3.9 0.8 100.0 99.2 1,793 6+ 93.4 4.4 2.2 100.0 97.8 1,059
Residence Urban 96.3 2.8 0.9 100.0 99.1 5,395 Rural 96.1 3.1 0.8 100.0 99.2 1,182
Region Central 96.0 3.1 0.9 100.0 99.1 4,052 North 97.0 2.2 0.8 100.0 99.2 1,903 South 96.0 3.2 0.9 100.0 99.1 622
Governorate Amman 96.0 2.8 1.2 100.0 98.8 2,469 Balqa 96.1 3.5 0.4 100.0 99.6 452 Zarqa 95.4 4.1 0.5 100.0 99.5 947 Madaba 97.4 1.7 0.8 100.0 99.2 184 Irbid 97.5 1.6 0.9 100.0 99.1 1,174 Mafraq 97.2 2.1 0.7 100.0 99.3 366 Jarash 93.2 6.0 0.8 100.0 99.2 207 Ajloun 97.6 2.0 0.4 100.0 99.6 156 Karak 95.8 3.5 0.7 100.0 99.3 269 Tafiela 94.8 4.5 0.7 100.0 99.3 103 Ma'an 93.6 3.9 2.5 100.0 97.5 104 Aqaba 98.9 1.0 0.1 100.0 99.9 146
Badia Badia 94.8 4.2 1.0 100.0 99.0 469 Non Badia 96.4 2.7 0.9 100.0 99.1 6,108
Camps Camp 92.2 7.4 0.4 100.0 99.6 253 Non camp 96.4 2.7 0.9 100.0 99.1 6,324
Education No education 93.3 4.7 2.0 100.0 98.0 130 Elementary 88.4 7.6 4.0 100.0 96.0 400 Preparatory 94.8 4.1 1.1 100.0 98.9 872 Secondary 96.4 2.8 0.8 100.0 99.2 3,069 Higher 98.4 1.4 0.3 100.0 99.7 2,106
Wealth quintile Lowest 91.3 6.1 2.6 100.0 97.4 1,393 Second 95.9 3.6 0.5 100.0 99.5 1,393 Middle 96.9 2.6 0.4 100.0 99.6 1,470 Fourth 98.4 0.9 0.6 100.0 99.4 1,327 Highest 99.9 0.1 0.0 100.0 100.0 994
Total 96.3 2.8 0.9 100.0 99.1 6,577
Note: If more than one source of ANC was mentioned, only the provider with the highest qualifications is considered in this tabulation. 1 Skilled provider includes doctor, nurse, and midwife.
Antenatal care received from a health professional is very high among all subgroups of women
and as such differentials by background characteristics are minor. However, differentials by background characteristics are more obvious for antenatal care received from a doctor. Mothers are more likely to

Maternal Health • 103
receive care from a doctor for the first birth (98 percent) than for births of order six and higher (93 percent). The differences in the use of antenatal care services between women in urban and rural areas are insignificant. There are some differences in women receiving ANC by governorates, with women in Jarash least likely to receive care from a doctor (93 percent) and women in Aqaba most likely (99 percent). Ninety-two percent of women in the camp areas receive ANC from a doctor compared with 96 percent in other areas. ANC services in the Badia areas have increased in the last five years and ANC coverage is now comparable to that for women in other areas.
Women with elementary education are least likely (88 percent) to receive antenatal care from a doctor when compared to women with other levels of education, including women with no education. On the other hand, women with elementary education are most likely (8 percent) to receive antenatal care from a nurse or midwife, or to receive no antenatal care at all (4 percent). The percentage of women with no education receiving ANC from a doctor has improved in the last five years from 84 percent in 2007 to 93 percent in 2012.
The use of antenatal care services is positively associated with household wealth. Women in the lowest wealth quintile are less likely to receive antenatal care from any trained personnel (97 percent) than those in the highest wealth quintiles (100 percent). Whereas almost all women in the highest wealth quintile received antenatal care from a doctor, this proportion drops to 91 percent for women in the lowest wealth quintile.
9.1.1 Number and Timing of ANC Visits
Antenatal care is more effective for preventing adverse pregnancy outcomes when it is sought early on in the pregnancy, throughout the gestational period, and during delivery. Obstetricians generally recommend that antenatal visits be made on a monthly basis until the 28th week (seventh month), fortnightly until the 36th week, and then weekly until the 40th week (until birth). If the first antenatal visit is made during the third month of pregnancy, this optimum schedule translates to a total of at least 12-13 visits during the pregnancy.
Table 9.2 shows that 78 percent of women make seven or more antenatal care visits during their entire pregnancy. Women whose age at birth is less than 20 years are less likely to make seven or more visits (74 percent) than women age 20-34 (79 percent) and women age 35-49 (76 percent). The proportion of women who make seven or more ANC visits declines as birth order increases. The percentage of women who make seven or more antenatal care visits is higher in urban areas (79 percent) than rural areas (75 percent) and higher in the North region (80 percent) than in the Central and South regions (77 percent and 74 percent, respectively). There is a notable variation in antenatal care services by residence in the Badia and non Badia areas: women in the Badia areas make fewer antenatal care visits (66 percent have seven or more visits) than women residing in the non Badia areas (79 percent). Women in Ma’an governorate are the least likely to have seven or more ANC visits.
Data indicate that there is a strong association between the proportions of women who make seven or more visits for antenatal care during their pregnancy by education and household wealth, with the percentage of women making seven or more visits increasing from 56 percent among women with no education to 85 percent among women with higher education. Similarly, the percentage of women making seven or more visits increases from 66 percent among women in the poorest households to 87 percent among women in the richest households.

104 • Maternal Health
Table 9.2 Number of antenatal care visits
Percent distribution of women age 15-49 who had a live birth in the five years preceding the survey by number of antenatal care (ANC) visits for the most recent live birth, according to background characteristics, Jordan 2012
Background characteristic
Antenatal care visits
Total Number
of womenNone 1 2 3 4 5 6 7+
Mother's age at birth <20 1.5 0.7 1.4 3.4 8.8 5.2 5.2 73.9 100.0 465 20-34 0.8 0.6 1.2 2.7 4.4 5.0 6.7 78.6 100.0 4,863 35-49 1.2 0.6 1.8 2.2 4.8 6.0 7.2 76.1 100.0 1,249
Birth order 1 0.6 0.6 1.0 2.4 3.7 4.3 5.4 81.9 100.0 2,301 2-3 0.5 0.4 0.8 2.5 6.0 4.5 6.8 78.7 100.0 1,899 4-5 1.0 0.8 2.1 2.5 4.8 6.4 8.3 74.1 100.0 1,516 6+ 2.3 0.7 2.0 4.5 5.2 7.1 7.0 71.3 100.0 860
Residence Urban 0.9 0.6 1.2 2.6 4.6 4.9 6.7 78.5 100.0 5,395 Rural 0.8 0.7 1.9 3.2 5.7 6.7 6.4 74.7 100.0 1,182
Region Central 0.9 0.6 1.5 2.6 4.7 4.9 7.4 77.2 100.0 4,052 North 0.8 0.6 0.8 2.5 4.6 4.9 5.6 80.2 100.0 1,903 South 0.9 0.3 1.7 3.6 5.9 8.3 4.9 74.4 100.0 622
Governorate Amman 1.2 0.7 1.8 2.6 5.8 4.8 8.0 75.1 100.0 2,469 Balqa 0.4 0.4 0.7 2.6 2.5 5.1 8.8 79.2 100.0 452 Zarqa 0.5 0.7 1.1 2.8 3.5 5.1 5.9 80.4 100.0 947 Madaba 0.8 0.0 1.1 1.8 2.2 4.6 5.3 84.0 100.0 184 Irbid 0.9 0.6 0.6 1.6 4.0 3.6 4.7 84.2 100.0 1,174 Mafraq 0.7 0.7 1.4 5.6 6.8 8.7 6.0 70.1 100.0 366 Jarash 0.8 0.6 1.3 1.9 3.6 4.2 8.5 79.0 100.0 207 Ajloun 0.4 0.1 0.7 3.4 4.9 6.3 8.2 75.9 100.0 156 Karak 0.7 0.4 1.9 3.0 7.1 7.8 4.7 74.4 100.0 269 Tafiela 0.7 0.6 1.6 2.2 4.8 9.0 4.4 76.6 100.0 103 Ma'an 2.5 0.1 2.6 6.8 7.4 10.0 8.5 62.0 100.0 104 Aqaba 0.1 0.2 0.6 3.2 3.4 7.5 3.2 81.7 100.0 146
Badia Badia 1.0 1.3 2.8 6.2 7.3 8.9 6.4 66.1 100.0 469 Non Badia 0.9 0.5 1.2 2.4 4.6 4.9 6.7 78.7 100.0 6,108
Camps Camp 0.4 0.6 0.4 1.4 3.9 5.2 10.3 78.0 100.0 253 Non camp 0.9 0.6 1.4 2.7 4.8 5.2 6.5 77.8 100.0 6,324
Education No education 2.0 4.8 3.6 4.9 11.6 7.2 9.9 56.0 100.0 130 Elementary 4.0 3.6 2.2 3.1 6.9 6.2 10.0 64.0 100.0 400 Preparatory 1.1 0.6 1.5 5.3 5.8 5.5 8.7 71.5 100.0 872 Secondary 0.8 0.3 1.5 2.4 4.8 5.9 6.5 77.7 100.0 3,069 Higher 0.3 0.2 0.7 1.8 3.5 3.7 5.2 84.5 100.0 2,106
Wealth quintile Lowest 2.6 1.8 2.9 4.4 6.5 6.8 8.5 66.4 100.0 1,393 Second 0.5 0.3 1.4 3.6 5.8 5.7 7.7 74.9 100.0 1,393 Middle 0.4 0.6 1.5 2.4 4.6 4.4 5.7 80.4 100.0 1,470 Fourth 0.6 0.0 0.4 1.4 3.5 4.3 6.8 83.0 100.0 1,327 Highest 0.0 0.0 0.0 1.3 3.0 4.7 3.8 87.2 100.0 994
Total 0.9 0.6 1.3 2.7 4.8 5.2 6.7 77.8 100.0 6,577
Ninety-one percent of women made their first antenatal care visit before the fourth month of
pregnancy (Table 9.3). This is slightly higher than the 89 percent found in 2007. The proportion of women seeking antenatal care before their sixth month of pregnancy increases to 97 percent. The median duration of pregnancy at the first antenatal care visit is 2.3 months. This indicates that, in Jordan, women start antenatal care at a relatively early stage of their pregnancy. The table also indicates that women who are younger (less than 35 years), those having their first birth, women in non camp areas, women with higher education, and women in the higher wealth quintiles are more likely than their counterparts in the other categories to receive antenatal care services before the fourth month of pregnancy.

Maternal Health • 105
Table 9.3 Timing of first antenatal care visit
Percent distribution of women age 15-49 who had a live birth in the five years preceding the survey by timing of the first antenatal care (ANC) visit for the most recent live birth, and median months pregnant at first visit for those with ANC, according to background characteristics, Jordan 2012
Background characteristics
Number of months pregnant at time of first ANC visit
Total Number
of women
Median months
pregnant at first visit
(for those with ANC)
Number of women with ANC
No antenatal
care <4 4-5 6-7 8+
Mother's age at birth <20 1.5 91.9 5.4 0.5 0.7 100.0 465 2.4 458 20-34 0.8 91.8 5.8 1.5 0.2 100.0 4,863 2.2 4,826 35-49 1.2 85.5 9.5 2.9 1.0 100.0 1,249 2.4 1,235
Birth order 1 0.6 94.7 3.4 0.9 0.4 100.0 2,301 2.1 2,287 2-3 0.5 91.3 6.1 2.0 0.1 100.0 1,899 2.3 1,890 4-5 1.0 88.0 9.1 1.3 0.6 100.0 1,516 2.4 1,501 6+ 2.3 82.8 10.6 3.6 0.7 100.0 860 2.5 840
Residence Urban 0.9 90.7 6.3 1.7 0.3 100.0 5,395 2.3 5,346 Rural 0.8 90.2 7.0 1.4 0.5 100.0 1,182 2.3 1,172
Region Central 0.9 90.1 6.6 2.1 0.4 100.0 4,052 2.3 4,014 North 0.8 91.1 6.6 1.2 0.4 100.0 1,903 2.2 1,888 South 0.9 92.8 5.3 0.7 0.2 100.0 622 2.3 616
Governorate Amman 1.2 89.9 6.1 2.4 0.5 100.0 2,469 2.3 2,439 Balqa 0.4 91.5 7.1 0.8 0.3 100.0 452 2.4 450 Zarqa 0.5 88.9 8.2 2.2 0.3 100.0 947 2.4 942 Madaba 0.8 95.1 3.4 0.4 0.2 100.0 184 1.8 183 Irbid 0.9 91.4 6.1 1.2 0.3 100.0 1,174 2.0 1,163 Mafraq 0.7 92.9 5.3 1.0 0.1 100.0 366 2.3 363 Jarash 0.8 86.1 10.2 1.4 1.4 100.0 207 2.5 206 Ajloun 0.4 90.5 8.3 0.8 0.0 100.0 156 2.4 156 Karak 0.7 93.9 4.7 0.4 0.3 100.0 269 2.3 267 Tafiela 0.7 89.4 7.3 2.1 0.2 100.0 103 2.5 102 Ma'an 2.5 89.6 7.0 0.9 0.0 100.0 104 2.4 102 Aqaba 0.1 95.6 3.8 0.1 0.3 100.0 146 1.9 146
Badia Badia 1.0 91.0 5.6 1.8 0.6 100.0 469 2.4 465 Non Badia 0.9 90.6 6.5 1.7 0.4 100.0 6,108 2.3 6,054
Camps Camp 0.4 86.8 10.7 1.5 0.6 100.0 253 2.4 252 Non camp 0.9 90.8 6.3 1.7 0.4 100.0 6,324 2.3 6,266
Education No education 2.0 74.9 14.3 4.7 4.1 100.0 130 2.7 127 Elementary 4.0 78.9 13.3 2.7 1.2 100.0 400 2.5 384 Preparatory 1.1 89.9 6.8 1.8 0.4 100.0 872 2.3 862 Secondary 0.8 90.2 7.0 1.7 0.3 100.0 3,069 2.3 3,045 Higher 0.3 94.7 3.7 1.2 0.2 100.0 2,106 2.1 2,100
Wealth quintile Lowest 2.6 83.7 10.2 2.2 1.3 100.0 1,393 2.5 1,356 Second 0.5 89.1 7.9 2.3 0.2 100.0 1,393 2.4 1,386 Middle 0.4 90.6 7.2 1.7 0.1 100.0 1,470 2.2 1,464 Fourth 0.6 94.9 3.6 0.7 0.2 100.0 1,327 2.1 1,318 Highest 0.0 96.9 1.6 1.4 0.1 100.0 994 2.2 994
Total 0.9 90.6 6.4 1.7 0.4 100.0 6,577 2.3 6,518
Note: Total includes 1 woman for whom information on timing of first antenatal visit was not known.
9.1.2 Components of Antenatal Care
The effectiveness of antenatal checkups in ensuring safe motherhood depends in part on the tests and measurements done and the advice given during the checkups. The 2012 JPFHS collected information on this important aspect of antenatal care by asking mothers who received antenatal checkups whether they received each of several components of ANC during their last pregnancy in the five years preceding the survey. Table 9.4 shows that one-third of mothers who received antenatal care reported that they were informed about pregnancy-related complications during their visits. This is a 32 percent decrease from what was reported in the 2007 JPFHS. Thirty percent of women were told where to go for any

106 • Maternal Health
complications. Twenty-nine percent were informed about signs of pregnancy-related complications after delivery, while about three-fourths of mothers (73 percent) were informed that they should make two visits for medical checkups one week and 30 days after delivery. A blood pressure test was part of antenatal care for 98 percent of mothers. Urine and blood samples were taken from 95 percent of women, while 97 percent of mothers were weighed. In addition, 85 percent of women took iron tablets or syrup during their pregnancy, which reflects an improvement over the last five years (81 percent in the 2007 JPFHS).
Table 9.4 Components of antenatal care
Among women age 15-49 with a live birth in the five years preceding the survey, the percentage who took iron tablets or syrup during the pregnancy of the most recent birth, and among women receiving antenatal care (ANC) for the most recent live birth in the five years preceding the survey, the percentage receiving specific antenatal services, according to background characteristics, Jordan 2012
Background characteristic
Among women with a live birth in the past
five years, the percentage who
during the pregnancy of their last birth:
Among women who received antenatal care for their most recent birth in the past five years, the percentage with selected services
Took iron tablets or
syrup
Number of women
with a live birth in the past five
years
Informed of signs of pregnancy
compli- cations
Told where to go for
any compli- cations
Informed of signs of
compli- cations
during the postnatal
period
Told to have two postnatal visits: one week and 30 days
after delivery Weighed
Blood pressure
measured
Urine sample taken
Blood sample taken
Number of women
with ANC for their
most recent birth
Mother's age at birth <20 86.2 277 23.9 22.3 27.3 68.4 98.5 96.1 94.9 94.6 27220-34 85.3 4,849 33.7 29.7 27.7 73.1 97.1 98.3 95.0 95.8 4,82035-49 81.8 1,451 36.5 31.6 31.5 74.5 97.3 98.5 95.5 94.3 1,426
Birth order 1 90.0 1,159 38.0 33.9 31.2 75.4 99.0 98.3 95.8 97.1 1,1542-3 84.2 2,566 30.8 26.9 25.8 72.5 96.7 98.3 95.7 96.2 2,5504-5 85.3 1,793 34.1 29.2 28.6 73.4 97.4 98.4 94.4 93.9 1,7796+ 78.3 1,059 36.6 33.5 31.8 72.3 96.1 97.4 94.2 94.4 1,036
Residence Urban 85.3 5,395 34.7 30.3 29.0 74.7 97.3 98.2 95.4 95.8 5,346Rural 81.2 1,182 30.0 27.6 26.3 66.6 96.9 98.1 93.8 93.8 1,172
Region Central 86.2 4,052 38.0 32.7 31.5 77.7 97.3 98.1 95.4 95.5 4,014North 81.8 1,903 26.6 24.2 22.7 66.1 97.2 98.6 94.9 95.8 1,888South 82.5 622 29.6 28.2 26.4 65.9 97.0 97.8 93.6 93.8 616
Governorate Amman 85.3 2,469 41.7 35.8 33.7 80.2 97.0 98.4 95.1 95.2 2,439Balqa 88.6 452 38.5 33.9 34.6 82.4 98.6 98.2 96.9 96.4 450Zarqa 87.0 947 29.4 25.3 25.7 70.7 97.5 97.7 95.7 96.0 942Madaba 87.7 184 31.2 27.2 24.9 68.3 96.6 96.6 94.5 95.8 183Irbid 83.3 1,174 27.9 25.5 23.9 63.9 97.0 98.7 95.6 96.8 1,163Mafraq 75.1 366 18.3 16.8 16.7 60.8 97.6 98.7 93.0 93.7 363Jarash 84.6 207 38.9 34.6 30.8 73.9 97.9 98.8 95.6 95.9 206Ajloun 81.9 156 20.3 18.3 17.3 84.4 96.8 96.8 93.5 92.9 156Karak 83.2 269 32.6 31.8 22.8 65.2 96.5 97.0 90.6 91.2 267Tafiela 73.0 103 30.1 27.8 30.7 57.3 92.3 94.9 90.5 91.6 102Ma'an 80.7 104 23.7 21.8 23.7 61.0 98.8 99.4 97.1 95.8 102Aqaba 89.1 146 28.1 26.2 31.8 76.7 100.0 100.0 98.7 98.7 146
Badia Badia 77.1 469 25.2 23.3 27.7 65.1 97.0 97.8 92.8 93.0 465Non Badia 85.1 6,108 34.6 30.3 28.6 73.8 97.2 98.2 95.3 95.6 6,054
Camps Camp 88.2 253 42.1 36.9 36.1 85.8 98.7 99.5 98.5 97.3 252Non camp 84.4 6,324 33.6 29.5 28.2 72.7 97.2 98.2 95.0 95.4 6,266
Education No education 71.4 130 35.4 24.1 24.2 71.9 94.9 96.8 92.6 92.5 127Elementary 78.1 400 29.1 27.1 34.5 68.0 93.3 95.8 89.7 89.4 384Preparatory 81.2 872 30.7 27.3 26.5 71.0 94.8 96.3 92.4 91.9 862Secondary 84.2 3,069 35.3 31.0 28.0 73.5 97.5 98.5 95.5 96.1 3,045Higher 88.4 2,106 34.0 30.0 29.2 74.7 98.6 99.1 96.7 97.3 2,100
Wealth quintile Lowest 77.0 1,393 33.2 29.1 31.3 70.6 94.6 96.0 93.6 93.7 1,356Second 84.8 1,393 35.9 31.3 28.8 71.9 97.2 98.0 95.6 95.4 1,386Middle 84.4 1,470 31.6 28.0 24.8 72.2 98.2 98.3 94.9 95.3 1,464Fourth 87.7 1,327 33.2 29.4 26.5 75.0 98.1 99.3 94.9 96.3 1,318Highest 90.9 994 36.3 31.9 32.3 77.7 98.2 99.9 97.0 96.8 994
Total 84.6 6,577 33.9 29.8 28.5 73.2 97.2 98.2 95.1 95.4 6,518
Maternal Health • 107
Urban-rural differences are noticeable for the various components of antenatal care. Urban women were more likely than rural women to get each component of antenatal care. Data also indicate regional variations in receiving antenatal care. For example, women in the Central region, camp areas, and the non-Badia areas are more likely to receive almost all of the antenatal care components than women in the North and South regions and the Badia and non camp areas. Antenatal care content also varies significantly according to the mother’s educational level. Women with secondary or higher education are more likely to have received almost all routine tests than women with less education. Women who were pregnant with their first child were also more likely to receive almost all components of ANC than women who already had children at the time of the pregnancy. A higher proportion of women in the highest wealth quintiles received antenatal care components than women in lower wealth quintiles.
9.1.3 Coverage of Tetanus Toxoid Vaccinations
Tetanus toxoid injections are given during pregnancy for the prevention of neonatal tetanus, an important cause of death among infants. Neonatal tetanus is most common among children who are delivered in unhygienic environments and when unspecialized instruments are used to cut the umbilical cord. Tetanus usually develops during the first or second week of life and is fatal in 70-90 percent of cases. Neonatal tetanus, however, is a preventable disease. Full protection is considered to be provided to an infant if the mother has received two injections during that pregnancy or two or more injections (the last within three years of the birth), three or more injections (the last within five years of the birth), four or more injections (the last within 10 years of the birth), or five or more injections prior to the birth. When the mother is vaccinated, immunity against tetanus is transferred to the fetus through the placenta.
In the 2012 JPFHS, information was collected from women who had a birth in the five years before the survey on the lifetime number of doses of tetanus toxoid that the mother received. Table 9.5 shows that 3 percent of women received two or more doses of tetanus toxoid vaccine during the last pregnancy, which is lower than that observed in the 2007 JPFHS (6 percent). However, for 31 percent of women the last birth was protected against tetanus because of the injections received during this pregnancy and injections received prior to the pregnancy; this percentage was higher than that reported in 2007 (27 percent).

108 • Maternal Health
Table 9.5 Tetanus toxoid injections
Among mothers age 15-49 with a live birth in the five years preceding the survey, the percentage receiving two or more tetanus toxoid injections during the pregnancy for the last live birth and the percentage whose last live birth was protected against neonatal tetanus, according to background characteristics, Jordan 2012
Background characteristic
Percentage receiving two or more injections
during last pregnancy
Percentage whose last birth was protected
against neonatal tetanus1
Number of mothers
Mother's age at birth <20 3.0 31.9 277 20-34 2.7 30.0 4,849 35-49 2.3 33.7 1,451
Birth order 1 6.0 31.4 1,159 2-3 2.0 28.6 2,566 4-5 1.8 29.6 1,793 6+ 1.6 37.9 1,059
Residence Urban 2.5 32.3 5,395 Rural 2.9 24.4 1,182
Region Central 1.8 29.1 4,052 North 4.0 35.1 1,903 South 3.6 29.2 622
Governorate Amman 0.9 25.8 2,469 Balqa 1.6 35.7 452 Zarqa 2.8 32.0 947 Madaba 9.1 43.7 184 Irbid 4.8 39.2 1,174 Mafraq 1.1 16.1 366 Jarash 2.5 33.2 207 Ajloun 7.2 51.4 156 Karak 4.6 31.7 269 Tafiela 4.7 29.1 103 Ma'an 3.2 30.5 104 Aqaba 1.1 23.8 146
Badia Badia 2.2 21.8 469 Non Badia 2.6 31.6 6,108
Camps Camp 2.4 51.1 253 Non camp 2.6 30.1 6,324
Education No education 4.5 24.0 130 Elementary 2.0 36.4 400 Preparatory 2.6 32.6 872 Secondary 2.6 33.8 3,069 Higher 2.6 25.4 2,106
Wealth quintile Lowest 2.7 36.6 1,393 Second 2.9 39.5 1,393 Middle 3.2 31.6 1,470 Fourth 2.2 26.0 1,327 Highest 1.4 16.3 994
Total 2.6 30.9 6,577 1 Includes mothers with two injections during the pregnancy of their last birth or two or more injections (the last within 3 years of the last live birth), three or more injections (the last within 5 years of the last birth), four or more injections (the last within 10 years of the last live birth), or five or more injections at any time prior to the last birth.
Women residing in urban areas, in the North region, in Ajloun, and in non Badia and camp areas
are more likely to have full protection against tetanus for their last birth than women residing in other areas. The percentage of women with full protection for their last birth is highest among mothers age 35-49. The percentage of women with full protection generally increases with birth order. This is due to the cumulative effect of past vaccinations (whether during prior pregnancies or not). Full protection is higher among women with only elementary education and among women in the second wealth quintile than women in other categories.

Maternal Health • 109
9.2 DELIVERY
9.2.1 Place of Delivery
The objective of providing safe delivery services is to protect the life and health of the mother and her child. An important component of efforts to reduce the health risks to mother and child is to increase the proportion of infants delivered under the supervision of health professionals. Proper medical attention and hygienic conditions during delivery can reduce the risk of complications and infections that may cause death or serious illness for the mother, the child, or both. Data on delivery care were obtained for all births that occurred in the five years preceding the survey.
An overwhelming majority of births (99 percent) in the five years preceding the survey were delivered in a facility (Table 9.6). Sixty-five percent of births took place in public health facilities and 34 percent in private health facilities. Only 1 percent of births took place at home.
There are only very minor differences by background characteristics in the proportion of births that take place in a health facility. The proportion is 95 percent or more for all sub-groups except the small proportion of births for which the mother received fewer than 4 ANC visits, only 90-91 percent of which occurred in a health facility. However, there are some differences in the proportion of births that take place in public or private health facilities. Births to younger women (<20 years) are more likely to take place at a private health facility or at home than births to older women. Around three-fourths of six or higher order births are delivered at a public health facility.
Delivery in a public health facility varies according to the number of ANC visits from 73 percent among births to women with no ANC visit to 64 percent for births to women with four or more visits. Women who are not receiving any kind of ANC services are also more likely to deliver at home (10 percent) compared with those reporting four or more ANC visits (1 percent). Women with four or more ANC visits are also more likely to deliver in a private facility than women in the other categories.
Eighty-one percent of births in the South region took place in a public health facility compared with 59 percent of those in the Central region. Deliveries in a public health facility are also more common in rural areas, in the Badia areas, in camps, and in Tafiela than in other areas.
There is also a strong negative association between delivery by type of facility and mother’s level of education. The proportion of births delivered in a public health facility declines from 77 percent among uneducated mothers to 57 percent of births to mothers with higher education. Conversely, births to mothers with higher education are most likely to be in a private facility.
Table 9.6 also shows that there is a strong, negative relationship between household wealth and delivery in the public sector. While 80 percent of births to mothers in the lowest wealth quintile took place in the public sector, this proportion drops to one-fourth (25 percent) of births to mothers in the highest wealth quintile.

110 • Maternal Health
Table 9.6 Place of delivery
Percent distribution of live births in the five years preceding the survey by place of delivery and percentage delivered in a health facility, according to background characteristics, Jordan 2012
Background characteristic
Health facility
Home Total
Percentage delivered in a health facility
Number of births
Public sector
Private sector
Mother's age at birth <20 58.8 38.6 2.6 100.0 97.4 559 20-34 65.0 33.9 1.1 100.0 98.9 7,535 35-49 68.4 30.4 1.2 100.0 98.8 1,739
Birth order 1 60.4 38.9 0.7 100.0 99.3 2,354 2-3 63.9 34.8 1.3 100.0 98.7 3,809 4-5 67.3 31.7 1.0 100.0 99.0 2,368 6+ 74.2 23.4 2.4 100.0 97.6 1,302
Antenatal care visits1 None 73.1 17.0 10.0 100.0 90.0 58 1-3 70.0 21.0 9.0 100.0 91.0 303 4+ 64.0 35.2 0.8 100.0 99.2 6,214
Residence Urban 61.4 37.2 1.4 100.0 98.6 8,010 Rural 81.9 17.3 0.7 100.0 99.3 1,823
Region Central 59.4 39.3 1.3 100.0 98.7 6,014 North 72.2 26.5 1.3 100.0 98.7 2,867 South 80.9 18.1 0.9 100.0 99.1 952
Governorate Amman 49.5 48.9 1.7 100.0 98.3 3,622 Balqa 73.8 26.1 0.1 100.0 99.9 703 Zarqa 74.0 25.0 1.0 100.0 99.0 1,412 Madaba 78.6 20.9 0.5 100.0 99.5 276 Irbid 69.0 29.4 1.6 100.0 98.4 1,729 Mafraq 72.1 26.5 1.5 100.0 98.5 574 Jarash 81.3 18.3 0.4 100.0 99.6 333 Ajloun 83.5 16.5 0.1 100.0 99.9 232 Karak 86.4 12.8 0.8 100.0 99.2 410 Tafiela 89.1 10.3 0.7 100.0 99.3 157 Ma'an 84.8 13.2 2.0 100.0 98.0 170 Aqaba 61.5 38.0 0.5 100.0 99.5 215
Badia Badia 80.8 17.8 1.4 100.0 98.6 769 Non Badia 63.9 34.8 1.2 100.0 98.8 9,064
Camps Camp 73.4 26.2 0.4 100.0 99.6 388 Non camp 64.9 33.8 1.3 100.0 98.7 9,446
Mother's education No education 77.3 17.8 4.9 100.0 95.1 207 Elementary 71.0 24.8 4.2 100.0 95.8 628 Preparatory 74.2 24.9 0.9 100.0 99.1 1,308 Secondary 66.6 31.9 1.4 100.0 98.6 4,599 Higher 57.4 42.4 0.3 100.0 99.7 3,091
Wealth quintile Lowest 80.3 16.6 3.1 100.0 96.9 2,292 Second 80.6 18.8 0.5 100.0 99.5 2,179 Middle 70.8 28.2 1.0 100.0 99.0 2,115 Fourth 51.9 47.2 0.9 100.0 99.1 1,893 Highest 25.0 75.0 0.0 100.0 100.0 1,354
Total 65.2 33.5 1.2 100.0 98.8 9,833
Note: Total includes one woman for whom data on number of antenatal care visits were not known. 1 Includes only the most recent birth in the five years preceding the survey.
9.2.2 Assistance at Delivery
Obstetric care by a trained provider during delivery is recognized as critical for the reduction of maternal and neonatal mortality. Table 9.7 shows the type of assistance during delivery by background characteristics of mothers. Almost all births in Jordan were delivered with the assistance of a health

Maternal Health • 111
professional, that is, a doctor, nurse, or midwife. Three in four births (76 percent) were delivered by a doctor, and about one in four births (24 percent) was delivered by a nurse or midwife.
Table 9.7 Assistance during delivery
Percent distribution of live births in the five years preceding the survey by person providing assistance during delivery, percentage of births assisted by a skilled provider, percentage delivered by caesarean section, percentage given free sample of infant formula, and percentage for whom mothers discussed family planning (FP) before discharge, according to background characteristics, Jordan 2012
Background characteristic
Person providing assistance during delivery
Percent- age
delivered by a skilled provider1
Percent- age
delivered by C-
section
Given free sample of
infant formula
Discussed FP before discharge
Number of births Doctor
Nurse/ midwife
Relative/ other No one Total
Mother's age at birth <20 81.4 17.6 0.8 0.3 100.0 98.9 19.1 7.3 6.7 559 20-34 75.4 24.3 0.2 0.1 100.0 99.7 26.9 14.3 12.7 7,535 35-49 75.8 23.8 0.2 0.2 100.0 99.6 36.1 16.7 16.8 1,739
Birth order 1 82.7 17.2 0.0 0.1 100.0 99.9 33.5 13.9 9.0 2,354 2-3 75.5 23.9 0.4 0.2 100.0 99.4 25.4 15.7 14.1 3,809 4-5 73.6 26.3 0.1 0.1 100.0 99.8 26.4 14.0 13.6 2,368 6+ 68.3 31.1 0.3 0.2 100.0 99.5 29.0 11.7 16.3 1,302
Antenatal care visits2 None 61.8 29.4 7.5 1.3 100.0 91.2 24.8 4.4 23.1 58 1-3 61.0 36.0 0.6 2.5 100.0 96.9 24.8 8.6 12.3 303 4+ 76.6 23.2 0.1 0.0 100.0 99.8 29.6 22.2 19.8 6,214
Place of delivery Health facility 76.5 23.5 0.0 0.0 100.0 100.0 28.4 14.5 13.2 9,711 Elsewhere 23.2 49.4 18.0 9.4 100.0 72.6 0.0 0.0 0.0 123
Residence Urban 78.3 21.4 0.2 0.1 100.0 99.6 28.4 14.9 13.8 8,010 Rural 65.1 34.6 0.1 0.1 100.0 99.7 26.7 11.6 9.8 1,823
Region Central 80.5 19.1 0.2 0.2 100.0 99.6 28.6 16.4 14.6 6,014 North 69.3 30.4 0.2 0.1 100.0 99.7 26.4 12.2 10.9 2,867 South 65.7 33.8 0.3 0.3 100.0 99.5 29.2 7.7 10.0 952
Governorate Amman 83.5 15.9 0.4 0.2 100.0 99.4 28.3 19.7 14.0 3,622 Balqa 79.9 19.9 0.1 0.1 100.0 99.8 27.3 13.3 15.1 703 Zarqa 75.9 24.1 0.0 0.0 100.0 100.0 29.1 10.2 17.6 1,412 Madaba 67.1 32.4 0.1 0.4 100.0 99.5 33.9 12.0 6.1 276 Irbid 73.0 26.8 0.1 0.1 100.0 99.8 27.8 13.8 12.2 1,729 Mafraq 63.0 36.3 0.7 0.0 100.0 99.3 24.2 7.8 5.9 574 Jarash 65.6 34.2 0.1 0.0 100.0 99.9 26.6 12.8 11.2 333 Ajloun 62.4 37.6 0.0 0.0 100.0 100.0 21.2 10.5 12.2 232 Karak 65.5 33.9 0.1 0.4 100.0 99.5 32.5 8.7 8.1 410 Tafiela 67.8 31.6 0.1 0.6 100.0 99.3 30.0 6.6 13.8 157 Ma'an 49.8 49.1 1.1 0.0 100.0 98.9 19.7 4.3 6.7 170 Aqaba 77.1 22.9 0.0 0.0 100.0 100.0 29.9 9.2 13.5 215
Badia Badia 60.8 38.5 0.7 0.1 100.0 99.3 22.0 7.2 10.2 769 Non Badia 77.1 22.6 0.2 0.1 100.0 99.7 28.6 14.9 13.3 9,064
Camps Camp 76.2 23.5 0.3 0.0 100.0 99.7 28.0 9.7 14.8 388 Non camp 75.8 23.8 0.2 0.1 100.0 99.6 28.0 14.5 13.0 9,446
Mother's education No education 64.0 34.2 1.9 0.0 100.0 98.1 17.6 6.5 15.5 207 Elementary 68.7 30.8 0.2 0.3 100.0 99.6 33.6 6.9 11.7 628 Preparatory 73.4 26.3 0.2 0.1 100.0 99.7 27.7 9.4 14.7 1,308 Secondary 74.5 25.0 0.3 0.2 100.0 99.5 27.1 13.6 13.4 4,599 Higher 81.1 18.8 0.0 0.1 100.0 99.9 29.1 19.4 11.9 3,091
Wealth quintile Lowest 66.6 32.3 0.9 0.2 100.0 98.9 25.2 6.9 13.5 2,292 Second 68.2 31.8 0.0 0.0 100.0 100.0 23.4 8.7 12.4 2,179 Middle 75.8 24.2 0.0 0.0 100.0 100.0 32.2 12.5 13.5 2,115 Fourth 83.4 16.1 0.1 0.4 100.0 99.5 29.9 18.5 13.1 1,893 Highest 93.1 6.9 0.0 0.0 100.0 100.0 31.1 32.8 12.8 1,354
Total 75.8 23.8 0.2 0.1 100.0 99.6 28.0 14.3 13.1 9,833
Note: If the respondent mentioned more than one person attending during delivery, only the most qualified person is considered in this tabulation. Total includes one woman for whom data on number of antenatal care visits were not known. 1 Skilled provider includes doctor, nurse, and midwife. 2 Includes only the most recent birth in the five years preceding the survey.

112 • Maternal Health
There are variations by background characteristics in the proportion of births delivered by a doctor as opposed to a nurse or midwife. Births that are more likely to be assisted by a doctor include those to very young mothers (<20 years), first-order births, births for whom mothers had four or more antenatal visits, births delivered in a health facility, urban births, births in the Central region, births in Amman, births in non Badia areas, births to mothers with higher education, and births in the wealthiest households.
9.2.3 Delivery Characteristics
Caesarean section (C-section) deliveries are one of the few indicators for measuring women’s access to obstetric care. C-sections are generally performed because the mother has medical problems or experiences complications at the time of delivery. Based on research and analysis, the World Health Organization (WHO) has determined that C-sections in a given population should not be less than 5 percent of pregnancies and not more than 15 percent of all pregnancies if the lives of women and infants are to be protected (UNICEF, 1999). A C-section rate below 5 percent indicates that many women and babies may be dying because of inadequate access to the whole spectrum of obstetric services. A level above 15 percent indicates an unnecessarily high reliance on a major surgical procedure with numerous risks. It is essential that C-sections be performed only when necessary, and in facilities that are adequately equipped and staffed to ensure safety (UNICEF, 1999).
The 2012 JPFHS obtained information on a number of key aspects of deliveries, including the frequency of C-sections. Table 9.7 shows that 28 percent of births in the five years preceding the survey were delivered by C-section, a significant increase from the 2007 JPFHS (19 percent). Given the increasing percentage of births delivered by C-section, greater intervention is needed by health professionals in reviewing the necessity for C-section deliveries. C-sections are much more common among births to older women (age 35-49 years), first-order births, births for whom mothers made four or more ANC visits, births in Madaba, and births in non Badia areas. Births to mothers with only elementary education and births in the middle and highest wealth quintiles are also more likely to be delivered by C-section. The high level of C-sections in Jordan may be related to a proclivity of the medical community to routinely deliver a woman by C-section if she has had one before.
Women who delivered in a health facility were asked whether they were given a free sample of infant formula when they were discharged after delivery. Mothers of 14 percent of births were given infant formula by a health facility staff. This practice is particularly common in Amman (20 percent). The distribution of free samples of infant formula increases significantly with level of mother’s education and household wealth.
During the survey, mothers were also asked whether anyone at the health facility talked to them or advised them about family planning before they were discharged. Data in Table 9.7 indicate that for 13 percent of births, mothers discussed family planning before checking out of the health facility after delivery. This percentage varies according to various background characteristics. In particular, it ranges from 6 percent in Mafraq and Madaba to 18 percent in Zarqa.
9.2.4 Payment for Delivery
Table 9.8 shows that, in the five years preceding the survey, 47 percent of births were delivered free of charge. Free deliveries were more common among births to older mothers (age 35-49 years), births of order six and higher, births for whom mothers had at least one antenatal visit, births in health facilities, births in rural areas, births in the South region, births in Tafiela, births in the Badia areas, births in non camp areas, births to mothers with no education, and births to mothers in the poorest households.
Fourteen percent of births were delivered for a cost of 200-499 Jordanian Dinars (JD), 13 percent were delivered for less than 50 JD, 8 percent were delivered for 100-199 JD or for 500 JD or more, and 6 percent of births were delivered for 50-99 JD. For 5 percent of births, the cost was not known.

Maternal Health • 113
Table 9.8 Cost of delivery
Percent distribution of live births in the five years preceding the survey by cost of delivery, according to background characteristics, Jordan 2012
Background characteristic
Cost of delivery (JD)
Number of births Free <50 50-99 100-199 200-499 500+
Don't know/ missing Total
Mother's age at birth <20 34.6 19.6 10.9 7.6 15.0 6.8 5.4 100.0 559 20-34 46.3 14.4 5.8 7.0 14.1 7.8 4.6 100.0 7,535 35-49 55.4 5.7 5.2 9.5 10.7 8.2 5.3 100.0 1,739
Birth order 1 44.1 11.3 5.8 6.8 15.5 12.5 4.0 100.0 2,354 2-3 45.7 14.8 6.2 7.2 13.8 6.8 5.6 100.0 3,809 4-5 47.8 12.9 6.4 8.4 13.9 6.4 4.1 100.0 2,368 6+ 56.6 12.0 5.3 7.8 8.7 4.6 5.0 100.0 1,302
Antenatal care visits1 None 34.7 3.8 18.3 10.0 18.2 4.4 10.5 100.0 58 1-3 46.4 18.8 6.2 12.7 5.6 5.1 5.2 100.0 303 4+ 47.3 12.8 6.2 7.0 13.6 8.6 4.5 100.0 6,214
Place of delivery Health facility 47.7 12.9 5.8 7.5 13.7 7.9 4.4 100.0 9,711 Elsewhere 9.3 29.8 25.8 4.3 0.0 0.0 30.9 100.0 123
Residence Urban 41.8 14.7 6.4 8.1 15.1 8.6 5.4 100.0 8,010 Rural 71.4 6.3 4.3 5.0 6.9 4.3 1.9 100.0 1,823
Region Central 36.4 17.1 6.7 8.1 15.6 9.9 6.3 100.0 6,014 North 59.8 7.8 5.7 8.0 11.8 4.6 2.2 100.0 2,867 South 78.2 3.8 2.8 2.2 5.6 4.5 2.9 100.0 952
Governorate Amman 31.7 14.4 6.3 9.1 19.1 12.3 7.1 100.0 3,622 Balqa 52.3 14.0 7.3 6.2 10.0 6.3 3.9 100.0 703 Zarqa 35.0 27.2 7.4 7.4 10.9 5.9 6.1 100.0 1,412 Madaba 64.7 9.8 5.2 2.4 7.8 6.6 3.5 100.0 276 Irbid 55.8 7.7 6.3 8.5 13.8 5.4 2.4 100.0 1,729 Mafraq 61.0 8.2 5.5 8.1 11.5 4.0 1.7 100.0 574 Jarash 65.0 10.9 4.8 5.8 7.6 3.2 2.7 100.0 333 Ajloun 79.8 2.6 3.2 7.2 4.0 2.0 1.2 100.0 232 Karak 83.9 2.7 1.8 1.5 2.9 4.6 2.6 100.0 410 Tafiela 85.9 3.8 1.3 0.9 2.6 2.7 2.9 100.0 157 Ma'an 77.9 6.8 2.7 1.9 4.1 1.9 4.7 100.0 170 Aqaba 61.9 3.6 5.9 4.7 14.3 7.6 2.0 100.0 215
Badia Badia 67.4 10.2 4.8 5.5 6.2 3.2 2.7 100.0 769 Non Badia 45.6 13.4 6.1 7.7 14.2 8.2 5.0 100.0 9,064
Camps Camp 29.2 32.3 10.5 7.8 10.9 4.2 5.1 100.0 388 Non camp 48.0 12.3 5.8 7.5 13.7 7.9 4.8 100.0 9,446
Mother's education No education 59.8 13.8 6.0 7.8 5.4 2.5 4.7 100.0 207 Elementary 43.9 14.9 10.8 10.5 11.0 3.6 5.3 100.0 628 Preparatory 44.7 18.1 8.4 8.8 10.9 3.7 5.5 100.0 1,308 Secondary 46.6 15.5 5.3 7.2 13.7 6.3 5.4 100.0 4,599 Higher 49.2 7.1 5.1 6.7 15.5 12.9 3.5 100.0 3,091
Wealth quintile Lowest 55.9 18.2 6.4 7.8 5.9 1.7 4.0 100.0 2,292 Second 54.3 13.4 7.0 6.9 10.5 2.4 5.5 100.0 2,179 Middle 50.0 13.4 6.1 8.4 13.1 5.3 3.7 100.0 2,115 Fourth 39.2 12.0 5.7 7.7 20.1 10.5 4.8 100.0 1,893 Highest 28.3 5.3 4.1 6.1 22.7 27.0 6.6 100.0 1,354
Total 47.3 13.1 6.0 7.5 13.5 7.8 4.8 100.0 9,833 1 Includes only the most recent birth in the five years preceding the survey.
9.3 POSTNATAL CARE
A large proportion of maternal and neonatal deaths occur during the first 48 hours after delivery. Safe motherhood programs have recently increased their emphasis on the importance of postnatal care,

114 • Maternal Health
recommending that all women receive a health check within two days of delivery. To assess the extent of postnatal care utilization, respondents were asked whether they had received a health check after the delivery of their last birth in the five years preceding the survey.
9.3.1 Postnatal Care for Mother
Table 9.9 shows that four-fifths (82 percent) of mothers received postnatal care from a health professional (doctor, nurse, or midwife) within the critical first two days after a delivery; 39 percent received postnatal care within 4 hours, 27 percent within 4-23 hours, 16 percent between 1 and 2 days, and 4 percent after 3 days. Fourteen percent of women received no postnatal care at all.
Table 9.9 Timing of first postnatal checkup for the mother Among women age 15-49 giving birth in the two years preceding the survey, the percent distribution of the mother's first postnatal checkup for the last live birth by time after delivery, and the percentage of women with a live birth in the five years preceding the survey who received a postnatal checkup in the first two days after giving birth, according to background characteristics, Jordan 2012
Background characteristic
Time after delivery of mother's first postnatal checkup
No postnatal checkup1 Total
Percentage of women
with a postnatal
checkup in the first two days after birth by a
health professional
Number of women
Less than 4 hours
4-23 hours
1-2 days
3-6 days
7-41 days
Don't know/ missing
Mother's age at birth <20 35.2 19.8 12.0 0.0 3.2 0.0 29.8 100.0 67.0 19520-34 39.2 28.0 15.8 0.9 3.2 0.3 12.7 100.0 83.0 2,62935-49 39.7 23.2 19.5 1.5 1.2 0.5 14.3 100.0 82.5 664
Birth order 1 35.5 30.6 19.3 0.6 1.6 0.1 12.3 100.0 85.4 8142-3 38.2 26.8 15.1 0.3 4.0 0.4 15.2 100.0 80.1 1,3594-5 40.8 27.7 14.9 1.2 2.7 0.4 12.4 100.0 83.3 8376+ 44.5 17.6 17.3 3.0 1.6 0.2 15.7 100.0 79.5 477
Place of delivery Health facility 39.0 27.0 16.6 0.9 2.6 0.3 13.7 100.0 82.5 3,441Elsewhere (42.6) (1.6) (0.0) (1.0) (16.5) (4.6) (33.7) (100.0) (44.2) 47
Residence Urban 38.1 27.3 15.2 1.0 3.3 0.3 14.8 100.0 80.6 2,796Rural 42.8 23.8 21.1 0.6 0.9 0.2 10.6 100.0 87.7 692
Region Central 40.0 21.6 16.3 1.4 4.3 0.3 16.2 100.0 77.9 2,144North 36.1 37.5 13.7 0.3 0.6 0.4 11.4 100.0 87.2 1,013South 42.0 25.8 24.9 0.1 0.2 0.4 6.7 100.0 92.6 331
Governorate Amman 39.1 20.5 14.4 1.7 4.6 0.0 19.6 100.0 74.1 1,318Balqa 42.0 17.2 25.9 1.4 3.7 0.0 9.8 100.0 85.1 257Zarqa 38.6 28.4 15.2 0.6 4.1 0.9 12.2 100.0 82.2 470Madaba 52.0 15.7 21.5 0.9 2.2 1.0 6.7 100.0 89.2 99Irbid 34.1 40.5 12.9 0.4 0.6 0.5 11.0 100.0 87.5 601Mafraq 43.0 29.9 13.1 0.2 0.3 0.3 13.2 100.0 86.0 203Jarash 39.1 33.5 13.8 0.3 0.9 0.0 12.4 100.0 86.4 123Ajloun 29.9 39.9 19.9 0.0 1.1 0.0 9.2 100.0 89.7 86Karak 33.0 26.6 34.7 0.0 0.3 0.7 4.7 100.0 94.3 143Tafiela 37.7 30.8 22.2 0.2 0.0 0.8 8.4 100.0 90.7 54Ma'an 55.4 19.9 12.1 0.3 0.3 0.0 12.0 100.0 87.4 62Aqaba 51.6 25.4 18.2 0.0 0.0 0.0 4.7 100.0 95.3 71
Badia Badia 50.3 21.7 11.9 0.7 1.1 0.3 14.0 100.0 83.9 293Non Badia 38.0 27.1 16.7 1.0 3.0 0.3 13.9 100.0 81.8 3,196
Camps Camp 40.2 28.0 8.6 2.1 6.0 0.8 14.3 100.0 76.8 130Non camp 39.0 26.6 16.6 0.9 2.7 0.3 13.9 100.0 82.2 3,358
Education No education 51.1 12.5 3.3 0.1 0.0 0.0 32.9 100.0 66.9 57Elementary 45.3 16.6 13.7 0.8 1.0 1.1 21.6 100.0 75.6 202Preparatory 39.3 20.9 14.4 0.6 2.6 0.1 22.1 100.0 74.6 464Secondary 37.6 26.0 15.9 1.6 3.8 0.4 14.7 100.0 79.5 1,603Higher 39.2 32.3 18.7 0.3 2.1 0.1 7.3 100.0 90.3 1,162
Wealth quintile Lowest 41.2 24.7 13.4 0.3 1.7 0.4 18.3 100.0 79.3 780Second 33.2 29.8 16.1 1.1 2.8 0.2 17.0 100.0 79.0 773Middle 37.0 24.6 17.7 1.2 3.5 0.1 15.9 100.0 79.3 740Fourth 37.8 28.1 18.9 0.5 2.9 0.8 10.9 100.0 84.8 680Highest 49.2 25.7 15.9 1.9 3.5 0.0 3.9 100.0 90.8 514
Total 39.0 26.6 16.3 0.9 2.8 0.3 13.9 100.0 82.0 3,488
Note: Figures in parentheses are based on 25-49 unweighted cases.1 Includes women who received a checkup after 41 days.

Maternal Health • 115
Postnatal care within the first two days from a health professional is higher among women age 20-49; mothers of first-order births; women in rural areas, in the South region, in Aqaba, and in non camp areas; women with higher education; and women in the highest wealth quintile.
The 2012 JPFHS also collected information on the percentage of women with a birth in the two years preceding the survey who discussed family planning during any postnatal checkup for their last birth. One in four women (23 percent) discussed family planning during their postnatal checkup (data not shown separately).
9.3.2 Postnatal Care for Newborn
Each woman with a birth in the two years preceding the survey was asked questions on the postnatal care her last baby received in the first two days after birth.
Table 9.10 shows that three-fourths (75 percent) of children received postnatal care from a health professional (doctor, nurse, or midwife) within the critical first two days after delivery; 13 percent received postnatal care within 1 hour, 33 percent within 1-3 hours, 17 percent within 4-23 hours, 12 percent within 1-2 days, and 2 percent after 3 days. One in five (21 percent) children received no postnatal checkup at all.
Postnatal care within the first two days from a health professional is higher among children born to mothers age 35-49; births of order six and higher; births in rural areas, in the North region, in Aqaba, in Badia areas, and in non camp areas; births to women with no education; and births in the middle wealth quintile.
Among newborns who ever received postnatal care (including after the first week of life), seven out of ten received a heel prick (to test for anemia) and eight out of ten received a hearing test (Table 9.11). Results show that births to women age 20-49, births in rural areas, births in the South region, births in Tafiela and Aqaba, births in camp areas, and births to mothers with higher education are more likely to receive a heel prick and get a hearing test. While children in the non Badia areas are more likely than children in the Badia areas to receive a heel prick, there is no difference in terms of children receiving a hearing test by these areas of residence. Children in the wealthiest households are more likely to receive a heel prick than children in the other wealth quintiles. On the other hand, children from the middle wealth quintile are more likely to receive a hearing test than children in other wealth quintiles.

116 • Maternal Health
Table 9.10 Timing of first postnatal checkup for the newborn
Percent distribution of last births in the two years preceding the survey by time after birth of first postnatal checkup, and the percentage of births with a postnatal checkup in the first two days after birth, according to background characteristics, Jordan 2012
Background characteristic
Time after birth of newborn's first postnatal checkup
No postnatal checkup1 Total
Percentage of births with a
postnatal checkup in the first two days after birth by
a health professional
Number of births
Less than 1 hour
1-3 hours
4-23 hours
1-2 days
3-6 days
Don't know/
missing
Mother's age at birth <20 9.5 26.2 26.1 9.9 3.2 4.5 20.6 100.0 71.7 195 20-34 12.1 32.5 17.1 12.0 2.1 2.1 22.1 100.0 73.7 2,629 35-49 18.2 34.7 14.7 11.9 1.6 3.3 15.7 100.0 79.5 664
Birth order 1 11.0 34.0 18.8 11.1 2.2 2.4 20.5 100.0 74.8 814 2-3 14.5 29.5 16.8 12.2 2.5 1.8 22.8 100.0 73.0 1,359 4-5 10.5 33.4 17.7 12.8 1.8 2.2 21.7 100.0 74.4 837 6+ 17.2 37.7 14.4 10.7 0.8 4.8 14.3 100.0 80.1 477
Place of delivery Health facility 13.2 32.6 17.4 12.0 2.0 2.5 20.3 100.0 75.2 3,441 Elsewhere (3.0) (32.7) (1.0) (1.0) (3.1) (0.0) (59.3) (100.0) (37.6) 47
Residence Urban 13.0 33.0 16.9 10.8 2.0 2.6 21.7 100.0 73.6 2,796 Rural 13.4 31.2 18.4 16.3 2.1 1.6 17.0 100.0 79.3 692
Region Central 11.5 31.8 13.0 10.0 2.7 2.4 28.5 100.0 66.4 2,144 North 15.4 34.5 27.0 13.0 0.4 3.1 6.5 100.0 90.0 1,013 South 16.2 31.8 13.7 20.3 2.9 0.5 14.5 100.0 82.1 331
Governorate Amman 12.2 31.5 12.3 8.4 2.8 2.8 29.9 100.0 64.4 1,318 Balqa 6.9 26.8 8.3 11.4 2.6 1.9 42.1 100.0 53.4 257 Zarqa 12.9 33.2 17.6 12.9 1.9 2.0 19.6 100.0 76.5 470 Madaba 8.0 42.0 13.3 14.3 3.9 1.0 17.4 100.0 77.7 99 Irbid 13.2 35.3 29.1 13.5 0.4 3.8 4.6 100.0 91.2 601 Mafraq 20.7 35.7 22.1 11.2 0.5 1.2 8.5 100.0 89.8 203 Jarash 23.1 28.8 23.5 10.1 0.3 3.3 11.0 100.0 85.5 123 Ajloun 6.8 34.6 28.9 18.3 0.3 2.5 8.6 100.0 88.6 86 Karak 13.4 21.8 12.4 26.5 2.3 0.3 23.3 100.0 74.1 143 Tafiela 15.4 34.0 18.2 16.5 4.9 1.3 9.8 100.0 84.0 54 Ma'an 10.5 45.9 12.7 16.6 5.3 0.7 8.3 100.0 85.7 62 Aqaba 27.5 38.2 14.0 14.0 0.4 0.0 5.8 100.0 93.8 71
Badia Badia 13.5 39.7 16.7 11.9 1.8 1.0 15.4 100.0 81.8 293 Non Badia 13.1 31.9 17.2 11.9 2.0 2.6 21.3 100.0 74.1 3,196
Camps Camp 11.7 23.7 15.7 7.8 1.8 3.9 35.4 100.0 58.9 130 Non camp 13.1 32.9 17.2 12.0 2.0 2.4 20.2 100.0 75.3 3,358
Mother's education No education 8.1 50.0 10.9 13.6 2.5 1.1 13.9 100.0 82.6 57 Elementary 18.7 27.1 14.6 14.4 2.1 2.5 20.4 100.0 74.9 202 Preparatory 13.9 32.7 17.9 9.5 1.2 4.1 20.7 100.0 74.0 464 Secondary 11.8 31.4 17.2 12.6 2.3 2.6 22.3 100.0 72.8 1,603 Higher 13.9 34.4 17.6 11.3 2.0 1.6 19.3 100.0 77.2 1,162
Wealth quintile Lowest 10.5 34.6 16.6 12.8 1.1 3.9 20.5 100.0 74.6 780 Second 14.8 26.6 20.8 13.0 2.8 1.5 20.5 100.0 75.2 773 Middle 14.7 33.3 17.7 12.1 2.6 2.1 17.5 100.0 77.8 740 Fourth 12.0 33.3 19.1 10.8 0.8 1.4 22.6 100.0 75.2 680 Highest 13.5 36.6 9.3 9.7 3.2 3.5 24.1 100.0 69.1 514
Total 13.1 32.6 17.2 11.9 2.0 2.4 20.8 100.0 74.7 3,488
Note: Figures in parentheses are based on 25-49 unweighted cases. 1 Includes newborns who received a checkup after the first week.

Maternal Health • 117
Table 9.11 Heel prick and hearing test for the newborn
Among last born children in the two years before the survey who ever received postnatal care, the percentage who received a heel prick and the percentage who had a hearing test, according to background characteristics, Jordan 2012
Background characteristic
Among children who ever received postnatal care Number of
births who received
postnatal care
Percentage who received a heel prick
Percentage who had a
hearing test
Mother's age at birth <20 49.1 72.3 177 20-34 71.8 80.9 2,424 35-49 70.3 81.0 646
Birth order 1 71.9 80.0 760 2-3 68.2 81.4 1,257 4-5 72.8 80.6 772 6+ 68.6 78.4 457
Place of delivery Health facility 70.4 80.7 3,212 Elsewhere (53.0) (59.6) 35
Residence Urban 69.8 79.3 2,586 Rural 71.8 84.8 662
Region Central 70.2 76.7 1,927 North 65.7 85.2 997 South 84.2 88.1 323
Governorate Amman 68.2 75.7 1,162 Balqa 75.6 79.8 228 Zarqa 72.0 75.6 444 Madaba 73.8 86.9 93 Irbid 63.3 86.4 594 Mafraq 62.4 84.0 198 Jarash 75.7 87.2 119 Ajloun 76.1 76.9 85 Karak 87.9 86.6 139 Tafiela 90.7 93.0 54 Ma'an 65.0 81.5 60 Aqaba 88.5 93.1 71
Badia Badia 63.6 81.8 275 Non Badia 70.8 80.3 2,973
Camps Camp 76.6 81.7 118 Non camp 70.0 80.4 3,129
Mother's education No education 60.7 81.2 54 Elementary 59.7 75.6 184 Preparatory 67.5 81.5 430 Secondary 68.4 78.5 1,484 Higher 76.1 83.5 1,095
Wealth quintile Lowest 67.6 80.5 720 Second 70.3 78.8 717 Middle 70.3 86.4 702 Fourth 70.1 78.4 629 Highest 74.3 76.9 480
Total 70.2 80.5 3,247
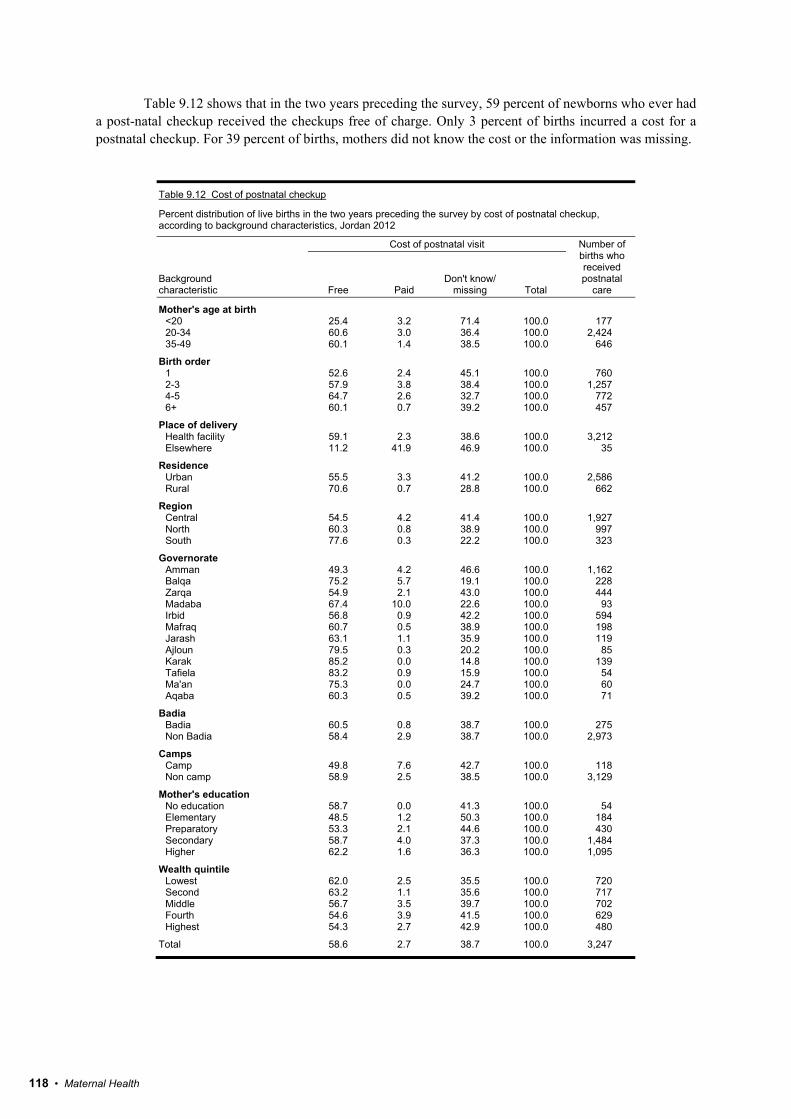
118 • Maternal Health
Table 9.12 shows that in the two years preceding the survey, 59 percent of newborns who ever had a post-natal checkup received the checkups free of charge. Only 3 percent of births incurred a cost for a postnatal checkup. For 39 percent of births, mothers did not know the cost or the information was missing.
Table 9.12 Cost of postnatal checkup
Percent distribution of live births in the two years preceding the survey by cost of postnatal checkup, according to background characteristics, Jordan 2012
Background characteristic
Cost of postnatal visit Number of births who received postnatal
care Free Paid Don't know/
missing Total
Mother's age at birth <20 25.4 3.2 71.4 100.0 177 20-34 60.6 3.0 36.4 100.0 2,424 35-49 60.1 1.4 38.5 100.0 646
Birth order 1 52.6 2.4 45.1 100.0 760 2-3 57.9 3.8 38.4 100.0 1,257 4-5 64.7 2.6 32.7 100.0 772 6+ 60.1 0.7 39.2 100.0 457
Place of delivery Health facility 59.1 2.3 38.6 100.0 3,212 Elsewhere 11.2 41.9 46.9 100.0 35
Residence Urban 55.5 3.3 41.2 100.0 2,586 Rural 70.6 0.7 28.8 100.0 662
Region Central 54.5 4.2 41.4 100.0 1,927 North 60.3 0.8 38.9 100.0 997 South 77.6 0.3 22.2 100.0 323
Governorate Amman 49.3 4.2 46.6 100.0 1,162 Balqa 75.2 5.7 19.1 100.0 228 Zarqa 54.9 2.1 43.0 100.0 444 Madaba 67.4 10.0 22.6 100.0 93 Irbid 56.8 0.9 42.2 100.0 594 Mafraq 60.7 0.5 38.9 100.0 198 Jarash 63.1 1.1 35.9 100.0 119 Ajloun 79.5 0.3 20.2 100.0 85 Karak 85.2 0.0 14.8 100.0 139 Tafiela 83.2 0.9 15.9 100.0 54 Ma'an 75.3 0.0 24.7 100.0 60 Aqaba 60.3 0.5 39.2 100.0 71
Badia Badia 60.5 0.8 38.7 100.0 275 Non Badia 58.4 2.9 38.7 100.0 2,973
Camps Camp 49.8 7.6 42.7 100.0 118 Non camp 58.9 2.5 38.5 100.0 3,129
Mother's education No education 58.7 0.0 41.3 100.0 54 Elementary 48.5 1.2 50.3 100.0 184 Preparatory 53.3 2.1 44.6 100.0 430 Secondary 58.7 4.0 37.3 100.0 1,484 Higher 62.2 1.6 36.3 100.0 1,095
Wealth quintile Lowest 62.0 2.5 35.5 100.0 720 Second 63.2 1.1 35.6 100.0 717 Middle 56.7 3.5 39.7 100.0 702 Fourth 54.6 3.9 41.5 100.0 629 Highest 54.3 2.7 42.9 100.0 480
Total 58.6 2.7 38.7 100.0 3,247

Maternal Health • 119
9.4 PROBLEMS IN ACCESSING HEALTH CARE
Many different factors can prevent women from getting medical advice or treatment for themselves. In the 2012 JPFHS, women were asked about various problems they face in accessing health care. Table 9.13 shows that 62 percent of women reported having at least one problem in accessing health care for themselves.
Table 9.13 Problems in accessing health care
Percentage of ever-married women age 15-49 who reported that they have serious problems in accessing health care for themselves when they are sick, by type of problem, according to background characteristics, Jordan 2012
Background characteristic
Problems in accessing health care
Knowing where to go
Getting permission
to go for treatment
Getting money for treatment
Distance to health facility
Using means
of trans- portation
Not wanting to go alone
No female provider
At least one problem
accessing health care
Number of women
Age 15-19 21.5 10.4 24.9 28.6 42.0 56.4 45.5 79.0 278 20-34 18.2 9.1 21.2 28.3 30.8 33.4 31.5 64.6 5,350 35-49 18.5 5.9 23.7 24.6 25.9 23.2 26.9 58.1 5,724
Number of living children 0 17.3 6.9 17.3 26.6 27.5 34.0 25.5 59.2 1,107 1-2 19.3 8.9 19.1 25.4 31.1 33.2 31.5 63.8 3,031 3-4 17.6 7.0 22.6 26.2 27.1 27.1 27.3 59.5 3,795 5+ 19.0 7.1 27.3 27.5 28.5 25.3 31.6 63.0 3,419
Marital status Married 18.5 7.6 22.1 26.5 28.7 29.1 29.9 61.8 10,801 Divorced/separated/widowed 17.4 5.9 30.8 25.5 27.6 23.1 21.3 58.2 551
Residence Urban 19.0 7.6 22.1 25.0 27.2 28.7 30.1 61.4 9,458 Rural 15.8 7.4 24.6 33.7 35.7 29.6 26.5 63.0 1,894
Region Central 20.3 8.4 23.4 26.1 28.7 29.0 31.3 63.1 7,181 North 17.4 6.0 21.1 26.7 27.9 29.8 27.4 61.0 3,120 South 9.2 5.9 21.2 27.5 30.3 25.0 23.8 53.6 1,051
Governorate Amman 20.3 8.3 23.7 26.3 30.1 30.7 31.3 64.4 4,454 Balqa 15.6 6.8 22.8 24.7 27.3 22.4 28.8 56.2 765 Zarqa 22.8 8.9 23.4 25.8 24.8 26.6 29.8 61.5 1,659 Madaba 17.3 10.9 20.0 28.9 32.6 33.1 44.4 71.6 303 Irbid 19.9 6.6 20.7 25.9 26.2 30.1 28.5 62.6 1,986 Mafraq 10.9 4.2 23.1 25.5 28.6 29.2 22.9 54.0 562 Jarash 11.3 5.3 22.8 24.6 27.0 28.8 23.8 56.1 320 Ajloun 19.4 6.8 17.0 37.9 41.0 30.7 33.7 69.8 251 Karak 7.1 5.8 22.1 28.2 32.7 23.2 23.9 53.2 441 Tafiela 14.2 7.0 20.5 31.6 32.8 27.8 26.5 60.3 167 Ma'an 12.3 5.3 27.6 38.5 40.3 38.0 26.1 68.0 178 Aqaba 7.4 5.8 16.0 16.3 17.8 17.4 20.5 40.3 265
Badia Badia 15.0 10.0 30.0 36.7 39.3 37.7 29.6 64.5 705 Non Badia 18.7 7.4 22.1 25.7 27.9 28.2 29.5 61.5 10,647
Camps Camp 21.8 10.9 34.4 25.2 30.1 28.5 35.1 68.1 413 Non camp 18.3 7.4 22.1 26.5 28.6 28.8 29.3 61.4 10,939
Education No education 17.2 15.5 37.3 31.6 33.9 32.4 25.4 61.4 267 Elementary 22.2 7.9 40.6 34.4 34.5 32.8 31.7 68.8 860 Preparatory 22.2 12.6 34.0 30.7 33.1 31.6 33.7 69.8 1,677 Secondary 18.0 7.8 21.4 26.0 29.7 30.4 30.2 63.3 5,073 Higher 16.5 4.0 13.1 22.6 23.0 24.0 26.3 53.6 3,475
Wealth quintile Lowest 21.3 11.2 40.1 34.3 37.3 33.8 34.2 71.5 2,137 Second 16.7 7.4 26.8 29.7 33.3 31.0 30.2 64.4 2,343 Middle 17.4 8.0 19.6 25.9 26.8 29.7 31.1 62.9 2,461 Fourth 18.9 7.4 16.4 24.5 26.9 28.2 28.9 59.0 2,336 Highest 18.1 3.5 10.2 17.3 18.5 21.0 22.7 49.9 2,076
Total 18.4 7.5 22.5 26.4 28.6 28.8 29.5 61.7 11,352

120 • Maternal Health
Three in ten women were concerned that there might not be a female provider at the health facility, did not want to go alone, or were concerned about having to take transport to access care. One in four women was concerned about the distance to the health facility or not being able to get money for treatment, one in five women was concerned about not knowing where to go, and fewer than one in ten women were concerned about not getting permission to go to a health facility. Younger women (age 15-19), women living in the Central region, women in Madaba, women living in camp areas, women with elementary and preparatory education, and those in the lowest wealth quintile reported more frequently than others that they have at least one problem in accessing health care. As expected, rural women were more likely than urban women to have problems related to distance to the health facility and need for transportation.
9.5 PREMARITAL MEDICAL EXAMINATIONS
Premarital examinations, which normally include genetic testing (given the high proportion of consanguineous unions in Jordan), are considered an important aspect of the process of forming a marital union in Jordan; since 2004, these examinations have been required by law for all marriages. The lack of facilities providing this type of service and the desire to avoid premarital medical examinations are likely to result in increases in poor health outcomes for children if their parents are too closely related to one another by blood.
Table 9.14 indicates that only two in five ever-married women (40 percent) mentioned that they or their husbands underwent premarital medical examinations. The table also indicates that the percentage of women who said that they or their husbands underwent a premarital examination increases with women’s age at first marriage from 31 percent among women who were married before age 20 to 78 percent among women married at age 35 and older. Premarital examinations are slightly more common among women in the Central region, in Madaba, and in non camp areas. There is a direct relationship between having a premarital examination and education, with the percentage rising from 21 percent among women with no education to 53 percent among women with higher education. Premarital examinations are least common among women in the lowest wealth quintile.
Table 9.14 Premarital medical exams by background characteristics
Percentage of ever-married women age 15-49 whose husbands had a premarital medical exam and who had a premarital medical exam themselves, according to background characteristics, Jordan 2012
Background characteristic
Husband Women Number of women Yes Yes
Age at first marriage < 20 31.3 31.0 4,67020-24 43.9 42.8 4,68425-29 47.6 47.2 1,42830-34 63.7 64.3 38235+ 77.9 78.1 188
Residence Urban 40.8 40.2 9,458Rural 38.3 37.9 1,894
Region Central 41.4 40.5 7,181North 39.5 39.4 3,120South 36.1 36.0 1,051
Governorate Amman 42.0 40.5 4,454Balqa 40.9 40.6 765Zarqa 39.9 39.9 1,659Madaba 42.6 43.2 303Irbid 40.5 40.6 1,986Mafraq 36.8 36.8 562Jarash 39.7 39.2 320Ajloun 37.0 36.7 251Karak 36.3 36.3 441Tafiela 41.0 41.0 167Ma'an 32.3 32.3 178Aqaba 35.1 34.9 265
Badia Badia 38.3 37.6 705Non Badia 40.5 39.9 10,647
Camps Camp 33.3 33.0 413Non camp 40.7 40.1 10,939
Education No education 20.9 20.9 267Elementary 26.2 25.6 860Preparatory 28.6 28.7 1,677Secondary 38.4 37.6 5,073Higher 54.0 53.4 3,475
Wealth quintile Lowest 35.2 34.7 2,137Second 42.0 40.8 2,343Middle 41.2 40.3 2,461Fourth 40.6 40.7 2,336Highest 42.8 42.2 2,076
Total 40.4 39.8 11,352

Maternal Health • 121
9.6 CANCER SCREENING
Breast self-examination (BSE) is a very important part of every adult woman’s personal health regimen. BSE should be performed monthly beginning at age 20 and should continue each month throughout a woman’s lifetime. In addition to BSE, adult women should receive regular physician-performed clinical breast exams. Table 9.15 shows the percentage of women who have had a breast cancer self-exam or an exam by a health specialist.
About two-fifths of women (39 percent) had a breast cancer examination in the 12 months preceding the survey, either by a self-exam (31 percent) or a clinical exam (19 percent). This has not changed from data collected in the 2007 JPFHS. Older women (age 35-49 years); those who have three children or more; women who live in urban areas, in the North region, in Jarash, and in the non Badia and camp areas; women with higher education; and those in the highest wealth quintile are more likely to have had a breast cancer self-exam or an examination by a health professional than other women.
The Pap smear or Pap test checks for changes in the cells of the cervix (lower part of the uterus/womb that opens into the birth canal) that show cervical cancer or conditions that may develop into cervical cancer. The pre-cancerous changes are usually caused by sexually transmitted human papillomaviruses (HPV). The test aims to detect and prevent the progression of HPV-induced cervical cancer and other abnormalities in the female genital tract. If detected early, cervical cancer can be cured. All women age 21 or older or sexually active should have an annual Pap smear. During the survey, women were asked whether they have ever heard about the Pap smear for detecting cervical cancer. They were also asked if they ever had a Pap smear.
Table 9.15 shows that although 74 percent of women have heard about the Pap smear for detecting cervical cancer, only 19 percent of women have ever undergone this test.
As with breast cancer exams, older women; women who have three children or more; women residing in urban areas, in the Central and North regions, and in the non Badia and non camp areas; women with higher education; and those in the highest wealth quintile are more likely to have had a Pap smear than other women.

122 • Maternal Health
Table 9.15 Breast cancer exam and Pap smear
Percentage of ever-married women age 15-49 who had a breast cancer self-exam or an exam by a health specialist to detect breast cancer in the 12 months preceding the survey, percentage who have heard of Pap smear, and percentage who ever had a Pap smear, according to background characteristics, Jordan 2012
Background characteristic
Had a breast cancer self-exam in past 12 months
Had a breast cancer exam
by a specialist in past
12 months
Had a breast cancer self-
exam or exam by a specialist
in past 12 months
Has heard of Pap smear
Ever had a Pap smear
Number of women
Age 15-19 9.3 6.9 14.5 34.6 2.7 278 20-34 26.8 16.2 34.1 68.5 11.0 5,350 35-49 35.8 22.3 44.3 81.6 26.8 5,724
Number of living children 0 23.8 16.2 29.8 61.2 10.9 1,107 1-2 27.7 15.8 36.0 68.3 10.9 3,031 3-4 32.8 21.1 41.4 78.2 22.3 3,795 5+ 33.8 20.4 41.3 79.4 24.4 3,419
Marital status Married 31.3 19.0 39.1 74.7 18.9 10,801 Divorced/separated/widowed 23.7 18.2 33.1 65.2 15.5 551
Residence Urban 31.6 19.8 39.9 75.4 19.7 9,458 Rural 27.2 15.0 33.2 68.6 14.4 1,894
Region Central 30.3 19.6 38.6 74.8 20.3 7,181 North 33.6 19.6 41.5 76.7 18.7 3,120 South 27.2 13.3 31.8 63.4 8.6 1,051
Governorate Amman 29.5 21.4 38.7 75.0 22.6 4,454 Balqa 27.8 15.8 34.1 68.9 13.6 765 Zarqa 34.0 16.6 41.2 76.8 17.3 1,659 Madaba 27.8 18.2 35.2 76.0 19.6 303 Irbid 34.5 21.2 43.2 77.9 20.0 1,986 Mafraq 28.7 14.5 34.3 68.8 12.9 562 Jarash 37.8 22.5 47.3 76.7 22.2 320 Ajloun 31.7 14.6 36.7 85.2 17.2 251 Karak 24.6 12.8 28.7 61.2 6.4 441 Tafiela 22.4 9.7 25.8 63.0 6.7 167 Ma'an 26.4 10.0 29.8 57.9 7.2 178 Aqaba 35.0 18.6 41.8 70.8 14.5 265
Badia Badia 21.6 11.0 27.0 59.5 10.6 705 Non Badia 31.5 19.5 39.6 75.3 19.3 10,647
Camps Camp 35.4 23.4 44.4 71.4 14.1 413 Non camp 30.7 18.8 38.6 74.4 19.0 10,939
Education No education 20.3 13.9 24.9 42.2 13.1 267 Elementary 20.5 13.4 25.2 59.5 13.2 860 Preparatory 26.2 17.4 34.4 68.6 17.5 1,677 Secondary 31.3 19.3 39.0 75.7 18.7 5,073 Higher 36.0 21.2 45.0 81.0 21.3 3,475
Wealth quintile Lowest 23.5 12.7 28.5 59.1 10.6 2,137 Second 26.1 16.9 34.7 70.3 13.1 2,343 Middle 33.6 20.9 40.9 76.1 15.3 2,461 Fourth 34.2 19.2 41.9 78.1 21.4 2,336 Highest 36.9 25.4 47.9 88.0 34.8 2,076
Total 30.9 19.0 38.8 74.3 18.8 11,352
Child Health • 123
CHILD HEALTH 10
his chapter presents findings on several areas of importance to child health: characteristics of the neonate (birth weight), vaccination status of children, and the prevalence and treatment of childhood illnesses, namely acute respiratory infection (ARI), fever, and diarrhea.
10.1 BIRTH WEIGHT
Birth weight is an important indicator of a child’s vulnerability to the risk of childhood illness and chances of survival. Children whose birth weight is less than 2.5 kilograms are considered to have a higher than average risk of early childhood death. In the 2012 JPFHS, for all births during the five years preceding the survey, mothers were asked to report the weight in kilograms if the baby had been weighed after delivery. Table 10.1 shows that nearly all babies were weighed at birth. Among those births for which the baby’s weight was reported, 14 percent weighed less than 2.5 kilograms at birth. In addition to the birth weight, mothers were also asked about the size of the baby at birth. This information is a useful proxy for birth weight, particularly in countries where a sizeable proportion of infants are not weighed at birth. Six percent of births were reported by mothers as being very small, 14 percent smaller than average, and 80 percent as average or larger.
Births to mothers younger than 20 years (21 percent), first-order births (16 percent), and births to women who smoke (20 percent) are more likely to weigh less than 2.5 kg at birth than births in the other categories. By governorate, the proportion of low birth weight babies varies from 12 percent in Ajloun to 17 percent in Tafiela. Low birth weight is also associated with mother’s education, ranging from 19 percent of births when the mother has no education to 11 percent for mothers with higher education. A similar pattern is seen with wealth quintile, where low birth weight varies from 16 percent of births in the poorest households to 12 percent of births in the middle quintile.
T
Key Findings
• Ninety-three percent of Jordanian children age 12-23 months are fully immunized. This is a 7 percent increase over the last five years.
• Seven percent of children under age five showed symptoms of acute respiratory infection in the two weeks before the survey, and more than three-quarters of them were taken to a health facility or provider for advice or treatment.
• Eighteen percent of children under five had fever in the two weeks before the survey, and two-thirds of them were taken to a health facility or provider for advice or treatment.
• Sixteen percent of children under age five had diarrhea in the two weeks before the survey, and 56 percent were taken to a health facility or provider for advice or treatment.

124 • Child Health
Table 10.1 Child's size and weight at birth
Percent distribution of live births in the five years preceding the survey by mother's estimate of baby's size at birth, percentage of live births in the five years preceding the survey that have a reported birth weight, and among live births in the five years preceding the survey with a reported birth weight, percentage less than 2.5 kg, according to background characteristics, Jordan 2012
Background characteristic
Percent distribution of all live births by size of child at birth Percentage
of all births that have a
reported birth weight1
Number of births
Births with a reported birth weight1
Very small
Smaller than average
Average or larger
Don't know/
missing Total
Percentage less than
2.5 kg Number of births
Mother's age at birth <20 10.0 14.6 75.5 0.0 100.0 99.5 559 21.1 556 20-34 5.4 14.0 80.6 0.1 100.0 98.9 7,535 13.2 7,453 35-49 6.0 13.3 80.6 0.1 100.0 99.2 1,739 14.1 1,725
Birth order 1 5.7 14.9 79.3 0.1 100.0 99.1 2,354 16.1 2,332 2-3 5.7 14.5 79.8 0.0 100.0 98.9 3,809 13.5 3,767 4-5 4.8 12.0 83.1 0.1 100.0 99.4 2,368 12.4 2,355 6+ 7.9 13.7 78.3 0.1 100.0 98.4 1,302 13.5 1,280
Mother's smoking status Smokes cigarettes/
tobacco 9.3 18.0 72.5 0.1 100.0 98.5 721 19.7 711 Does not smoke 5.5 13.6 80.9 0.1 100.0 99.0 9,112 13.4 9,023
Residence Urban 5.9 14.0 80.0 0.0 100.0 98.9 8,010 13.9 7,926 Rural 5.1 13.4 81.3 0.1 100.0 99.2 1,823 13.5 1,808
Region Central 5.8 13.7 80.5 0.0 100.0 98.9 6,014 14.2 5,950 North 5.6 14.6 79.7 0.1 100.0 99.2 2,867 12.7 2,844 South 6.1 13.1 80.5 0.3 100.0 98.8 952 14.8 941
Governorate Amman 7.2 13.4 79.4 0.0 100.0 98.8 3,622 15.2 3,578 Balqa 4.6 13.2 82.2 0.0 100.0 99.6 703 12.7 701 Zarqa 3.3 14.6 82.1 0.0 100.0 98.9 1,412 12.6 1,397 Madaba 3.5 14.2 82.2 0.1 100.0 99.3 276 14.5 274 Irbid 5.4 15.3 79.3 0.0 100.0 99.5 1,729 12.7 1,720 Mafraq 5.9 13.3 80.5 0.3 100.0 98.3 574 12.8 564 Jarash 6.5 13.3 80.1 0.1 100.0 98.6 333 12.6 328 Ajloun 4.7 15.2 80.0 0.1 100.0 99.7 232 12.4 231 Karak 5.7 11.1 83.0 0.2 100.0 99.0 410 13.1 406 Tafiela 7.7 13.8 78.3 0.2 100.0 99.0 157 17.2 156 Ma'an 4.1 17.4 78.3 0.1 100.0 97.7 170 15.6 166 Aqaba 7.4 12.8 79.3 0.5 100.0 99.0 215 15.6 213
Badia Badia 5.7 14.6 79.4 0.3 100.0 97.9 769 15.0 753 Non Badia 5.8 13.8 80.4 0.0 100.0 99.1 9,064 13.8 8,981
Camps Camp 7.2 12.9 79.8 0.1 100.0 99.6 388 15.1 386 Non camp 5.7 13.9 80.3 0.1 100.0 99.0 9,446 13.8 9,348
Mother's education No education 6.6 18.4 74.5 0.6 100.0 92.0 207 18.5 191 Elementary 10.8 14.7 74.4 0.2 100.0 98.2 628 17.8 617 Preparatory 5.6 14.1 80.2 0.0 100.0 99.3 1,308 15.2 1,298 Secondary 5.8 14.6 79.5 0.1 100.0 98.8 4,599 14.8 4,543 Higher 4.7 12.3 83.0 0.0 100.0 99.8 3,091 10.8 3,085
Wealth quintile Lowest 6.3 15.5 78.0 0.2 100.0 97.3 2,292 15.8 2,231 Second 6.1 14.1 79.8 0.0 100.0 99.4 2,179 14.1 2,166 Middle 3.8 13.6 82.6 0.0 100.0 99.4 2,115 12.2 2,103 Fourth 6.5 10.6 82.9 0.0 100.0 99.3 1,893 12.9 1,880 Highest 6.4 16.0 77.6 0.0 100.0 100.0 1,354 14.1 1,354
Total 5.8 13.9 80.3 0.1 100.0 99.0 9,833 13.8 9,734 1 Based on either a written record or the mother's recall.

Child Health • 125
10.2 VACCINATION COVERAGE
Universal immunization of children against six vaccine-preventable diseases (tuberculosis, diphtheria, whooping cough, tetanus, polio, and measles) is a crucial component in any strategy to reduce infant and child mortality. Differences in vaccination coverage among subgroups of the population are of great assistance for program planning and targeting resources to areas most in need. Additionally, information on immunization coverage is important for the monitoring and evaluation of the Expanded Program on Immunization (EPI).
Jordan joined UNICEF’s “Child Survival Revolution” in 1980. Since then, the Ministry of Health has made the vaccination card a requirement for entry into the school system. The card is issued through various service providers at the time of a child’s first vaccination. Upon registering at the Maternal and Child Health Center, each child receives a health card that shows vaccinations and the child’s height and weight. The 2012 JPFHS collected information on vaccination coverage for all living children born in the five years preceding the survey. According to the guidelines developed by the World Health Organization (WHO), children are considered fully vaccinated when they have received a vaccination against tuberculosis (BCG), three doses of DPT vaccine (against diphtheria, pertussis, and tetanus), three doses of polio vaccine, and one dose of measles vaccination by age 12 months. BCG should be given at birth or at first clinical contact; DPT and polio require three vaccinations at approximately age four, eight, and 12 weeks; and measles should be given at age nine months.
Information on vaccination coverage was collected in two ways: from vaccination cards shown to the interviewer and from mothers’ verbal reports. If the child’s vaccination card was available, the interviewer copied the vaccination dates from the card directly onto the questionnaire. When there was no vaccination card for the child, the respondent was asked to recall the vaccines given to her child. Table 10.2 and Figure 10.1 show the percentage of children age 12-23 months who have received various vaccinations by source of information, that is, whether from a vaccination card or mother’s report. Children age 12-23 months are the youngest cohort of children who have reached the age by which they should be fully vaccinated.
Table 10.2 Vaccinations by source of information
Percentage of children age 12-23 months who received specific vaccines at any time before the survey, by source of information (vaccination card or mother's report), and percentage vaccinated by age 12 months, Jordan 2012
Source of information BCG DPT 1 DPT 2 DPT 3 Polio 1 Polio 2 Polio 3 Measles
All basic vaccina-
tions1
No vaccina-
tions Number of
children
Vaccinated at any time before survey Vaccination card 79.0 80.3 80.1 79.4 80.3 80.1 79.4 77.1 75.7 0.0 1,560 Mother's report 19.3 19.2 19.0 19.0 19.2 19.0 19.0 17.4 17.3 0.3 381 Either source 98.3 99.5 99.1 98.4 99.5 99.1 98.4 94.4 93.0 0.3 1,941 Vaccinated by age 12
months2 97.9 99.3 98.7 97.9 99.3 98.7 97.9 85.7 85.1 0.5 1,941 1 BCG, measles, and three doses each of DPT and polio vaccine (excluding polio vaccine given at birth). 2 For children whose information is based on the mother's report, the proportion of vaccinations given during the first year of life is assumed to be the same as for children with a written record of vaccination.

126 • Child Health
Figure 10.1 Percentage of children age 12-23 months with specific vaccinations
JPFHS 2012
Ninety-three percent of children were fully immunized at the time of the survey. Ninety-four percent of children are vaccinated against measles; this figure includes children who have received either the measles vaccine or the MMR vaccine, a combination vaccine against measles, mumps, and rubella.
Coverage for the first and second doses of DPT is slightly higher (about 99 percent for both) than that for the third dose of DPT (98 percent). DPT and polio vaccines are often administered at the same time so they have similar coverage. The dropout between the first and third doses of the polio vaccine is similar to that between the first and third doses of DPT.
Table 10.3 shows the vaccination coverage by background characteristics among children age 12-23 months. Vaccination coverage is high regardless of background characteristic, an indication of the success of the immunization program in reaching out to all population subgroups. However, the proportion of vaccination cards seen by the interviewer (80 percent) is lower compared to data from the 2007 JPFHS (90 percent).
Vaccination coverage is lower among children of birth order six and higher than children of other birth orders. Vaccination coverage is also lower among children in the South region, the Badia areas, and non camp areas than for other children. Vaccination coverage varies from a low of 79 percent of children in Ma’an to a high of 96 percent in Jarash and Zarqa.
Table 10.3 also shows variations according to the level of education of the mother. Children of mothers with no education show relatively lower vaccination coverage (70 percent) than children of mothers with preparatory or higher education (94-95 percent). There are also differences in vaccination coverage by household wealth quintile. Children in the poorest households are least likely to be fully vaccinated (89 percent), while children living in households in the middle wealth quintile are most likely to be fully vaccinated (97 percent).
98
100 9998
100 9998
94
93
BCG 1 2 3 1 2 3 Measles All
Percentage
DPT Polio

Child Health • 127
Table 10.3 Basic vaccinations of children age 12-23 months by background characteristics
Percentage of children age 12-23 months who received specific vaccines at any time before the survey (according to a vaccination card or the mother's report), and percentage with a vaccination card, by background characteristics, Jordan 2012
Background characteristic BCG DPT 1 DPT 2 DPT 3 Polio 1 Polio 2 Polio 3 Measles
All basic vaccina-
tions1
No vaccina-
tions
Percen- tage with
a vaccina-tion card
seen Number
of children
Sex Male 97.6 99.3 99.1 98.5 99.3 99.1 98.5 94.9 92.7 0.4 80.0 1,030 Female 99.1 99.7 99.2 98.3 99.7 99.2 98.3 93.9 93.3 0.2 80.8 910
Birth order 1 97.8 99.8 99.7 99.4 99.8 99.7 99.4 98.0 95.9 0.1 84.6 493 2-3 98.2 99.8 99.2 98.9 99.8 99.2 98.9 92.9 91.4 0.2 79.2 733 4-5 99.4 99.3 98.8 97.3 99.3 98.8 97.3 95.9 95.6 0.3 80.6 449 6+ 97.4 98.6 98.1 96.8 98.6 98.1 97.0 89.5 87.5 1.3 75.4 266
Residence Urban 98.5 99.5 99.3 98.6 99.5 99.3 98.7 94.3 93.0 0.3 80.0 1,538 Rural 97.4 99.6 98.4 97.4 99.6 98.4 97.4 95.1 92.8 0.2 81.8 403
Region Central 98.4 99.8 99.4 99.2 99.8 99.4 99.2 94.6 93.0 0.1 79.8 1,190 North 99.2 99.9 99.5 98.1 99.9 99.5 98.2 95.2 94.5 0.1 83.4 562 South 94.6 96.6 95.9 94.0 96.6 95.9 94.0 91.0 88.6 2.6 75.3 189
Governorate Amman 97.8 100.0 99.6 99.6 100.0 99.6 99.6 93.8 91.5 0.0 79.5 730 Balqa 98.5 99.6 99.0 97.9 99.6 99.0 97.9 96.6 94.8 0.4 85.0 145 Zarqa 100.0 99.4 99.4 99.2 99.4 99.4 99.2 96.3 96.3 0.0 76.0 258 Madaba 99.4 99.4 97.5 96.6 99.4 97.5 96.6 93.2 91.6 0.6 87.2 57 Irbid 100.0 100.0 100.0 99.2 100.0 100.0 99.2 95.6 95.6 0.0 86.7 332 Mafraq 96.9 99.6 97.8 94.3 99.6 97.8 94.8 93.2 90.0 0.4 80.2 116 Jarash 98.5 100.0 100.0 99.4 100.0 100.0 99.4 96.6 96.3 0.0 69.9 69 Ajloun 100.0 100.0 100.0 98.0 100.0 100.0 98.0 94.6 94.6 0.0 87.0 45 Karak 97.4 99.5 99.0 97.8 99.5 99.0 97.8 93.2 90.4 0.0 80.8 80 Tafiela 90.7 93.8 93.8 93.8 93.8 93.8 93.8 92.2 88.0 4.2 71.1 29 Ma'an 88.8 90.4 88.9 83.5 90.4 88.9 83.5 80.0 78.8 9.0 76.2 36 Aqaba 97.1 97.9 97.4 95.8 97.9 97.4 95.8 95.3 93.7 1.1 67.4 44
Badia Badia 94.8 97.0 94.8 91.3 97.0 94.8 91.3 88.1 85.7 2.6 80.4 169 Non Badia 98.6 99.8 99.5 99.1 99.8 99.5 99.1 95.0 93.7 0.1 80.4 1,772
Camps Camp 99.2 99.2 99.2 99.2 99.2 99.2 99.2 97.6 97.6 0.8 85.7 68 Non camp 98.2 99.5 99.1 98.3 99.5 99.1 98.4 94.3 92.8 0.3 80.2 1,873
Mother's education No education 91.4 90.4 87.9 77.1 90.4 87.9 77.1 74.8 69.5 5.6 76.3 37 Elementary 95.6 97.9 96.6 94.3 97.9 96.6 94.8 85.4 82.8 2.1 64.0 114 Preparatory 99.7 99.8 99.0 97.9 99.8 99.0 97.9 95.1 94.7 0.2 80.3 288 Secondary 99.5 99.9 99.6 99.2 99.9 99.6 99.2 94.8 94.4 0.0 81.5 855 Higher 96.9 99.7 99.6 99.4 99.7 99.6 99.4 96.4 93.5 0.1 82.1 647
Wealth quintile Lowest 98.1 98.4 97.6 96.0 98.4 97.6 96.1 90.7 89.3 1.1 73.0 479 Second 99.0 99.9 99.6 99.1 99.9 99.6 99.1 94.3 93.7 0.1 79.7 415 Middle 99.6 100.0 99.5 99.2 100.0 99.5 99.2 97.2 97.1 0.0 84.3 377 Fourth 99.3 99.8 99.5 99.3 99.8 99.5 99.3 94.9 94.3 0.1 88.0 369 Highest 94.6 100.0 100.0 99.1 100.0 100.0 99.1 96.5 91.1 0.0 78.9 301
Total 98.3 99.5 99.1 98.4 99.5 99.1 98.4 94.4 93.0 0.3 80.4 1,941 1 BCG, measles, and three doses each of DPT and polio vaccine (excluding polio vaccine given at birth).
10.2.1 Additional Doses of Polio and DPT
Table 10.4 shows the percentage of children age 24-59 months who received additional doses of polio and DPT vaccines at any time before the survey.
In addition to the three polio doses given at one-month intervals, children in Jordan receive a fourth dose of polio at age nine months and a booster dose at age 18 months. There are no significant differences observed in polio vaccination coverage for three doses of polio (more than 99 percent of children age 24-59 months). However, there is a slight decrease between the proportion of children vaccinated with the fourth dose of polio (98 percent) and those vaccinated with the booster (96 percent).

128 • Child Health
Table 10.4 Basic and booster vaccinations of children 24-59 months by background characteristics
Percentage of children age 24-59 months who received specific vaccines at any time before the survey (according to a vaccination card or the mother's report), and percentage with a vaccination card, by background characteristics, Jordan 2012
Background characteristic Polio 1 Polio 2 Polio 3 Polio 4
Polio booster DPT 1 DPT 2 DPT 3
DPT booster
Number of children
Sex Male 99.4 99.1 98.7 98.1 95.7 99.3 99.0 98.6 96.0 3,022Female 99.5 99.3 99.2 98.5 96.6 99.5 99.3 99.2 96.9 2,910
Birth order 1 99.7 99.5 99.4 98.8 97.5 99.5 99.3 99.3 97.4 1,3832-3 99.5 99.4 99.2 98.8 96.7 99.5 99.3 99.2 97.1 2,3064-5 99.7 99.3 98.9 97.9 94.8 99.7 99.3 98.8 95.4 1,4566+ 98.4 98.0 97.6 96.8 94.5 98.3 98.0 97.4 94.9 787
Residence Urban 99.4 99.2 99.1 98.4 96.3 99.4 99.2 99.0 96.6 4,890Rural 99.6 99.0 98.4 97.8 95.5 99.5 98.8 98.3 95.6 1,041
Region Central 99.6 99.6 99.4 98.8 96.7 99.6 99.6 99.4 97.0 3,637North 99.2 98.9 98.6 98.2 96.6 99.1 98.6 98.4 96.9 1,718South 98.8 98.0 97.1 95.3 91.4 98.8 97.9 96.7 91.9 577
Governorate Amman 99.7 99.6 99.4 98.9 96.7 99.7 99.6 99.4 97.1 2,166Balqa 100.0 100.0 100.0 98.7 96.4 100.0 100.0 100.0 97.0 413Zarqa 99.2 99.2 99.2 99.0 97.2 99.2 99.2 99.2 97.0 895Madaba 99.8 99.4 99.2 97.9 95.1 99.8 99.4 99.2 96.2 163Irbid 99.0 98.8 98.8 98.8 97.3 98.8 98.6 98.6 97.6 1,041Mafraq 99.4 98.4 97.2 96.2 94.5 99.2 98.1 97.0 94.6 342Jarash 99.5 99.2 99.2 98.7 96.4 99.5 99.2 99.2 96.7 195Ajloun 99.8 99.7 99.5 98.2 96.2 99.6 99.4 99.3 96.7 139Karak 99.0 98.7 97.5 96.3 92.2 99.0 98.7 97.5 92.9 248Tafiela 99.8 99.4 98.8 97.0 95.3 99.8 99.4 98.3 95.4 98Ma'an 96.4 93.1 92.4 88.8 81.3 96.4 92.9 90.5 81.8 96Aqaba 99.2 99.1 98.5 96.8 94.3 99.2 99.1 98.5 94.7 135
Badia Badia 98.7 97.0 95.8 93.9 89.9 98.5 96.7 95.2 89.7 439Non Badia 99.5 99.4 99.2 98.7 96.6 99.4 99.3 99.2 97.0 5,493
Camps Camp 99.1 99.1 99.0 98.6 96.5 99.1 99.1 98.8 97.0 239Non camp 99.4 99.2 99.0 98.3 96.1 99.4 99.1 98.9 96.4 5,693
Mother's education No education 96.4 91.4 89.0 86.8 83.6 96.4 91.1 88.2 84.3 143Elementary 98.0 97.6 96.0 94.5 91.8 97.8 97.5 95.5 91.9 405Preparatory 99.6 99.6 99.5 98.5 96.3 99.3 99.2 99.2 96.3 797Secondary 99.7 99.5 99.4 98.9 96.4 99.7 99.5 99.4 97.0 2,790Higher 99.6 99.5 99.5 99.1 97.6 99.6 99.5 99.5 97.6 1,797
Wealth quintile Lowest 98.9 98.3 97.4 96.8 94.3 98.7 98.0 97.1 94.3 1,380Second 99.8 99.7 99.5 98.9 97.0 99.8 99.7 99.5 97.6 1,295Middle 99.4 99.3 99.3 99.0 96.7 99.4 99.3 99.2 97.6 1,299Fourth 99.6 99.4 99.3 98.7 95.9 99.6 99.4 99.3 96.2 1,164Highest 99.6 99.6 99.6 98.4 97.3 99.6 99.6 99.6 96.8 794
Total 99.4 99.2 99.0 98.3 96.1 99.4 99.1 98.9 96.5 5,932
Coverage of the three doses of DPT in children age 24-59 months is high as well (more than 99
percent). As is the case for polio, coverage for the DPT booster (97 percent), usually given at 18 months, is slightly lower than DPT 3 (99 percent).
10.2.2 Additional Vaccinations
Hepatitis B
Hepatitis B is a viral disease that primarily attacks the liver. Primary vaccination consists of three intramuscular injections: the first dose is administered at the end of the second month of life, and the second and third doses are given between the third and fourth month. The percentage of children vaccinated against hepatitis B is shown in Table 10.5. Ninety-nine percent of children received three doses of hepatitis vaccination. There is very little variation in vaccination coverage according to background characteristics.

Child Health • 129
Table 10.5 Additional vaccinations of children 24-59 months by background characteristics
Percentage of children age 24-59 months who received specific vaccines at any time before the survey (according to a vaccination card or the mother's report), and percentage with a vaccination card, by background characteristics, Jordan 2012
Background characteristic
Hepatitis B 1
Hepatitis B 2
Hepatitis B 3 Hib 1 Hib 2 Hib 3 Measles MMR
Percen- tage with
a vaccina- tion card
seen Number of
children
Sex Male 99.3 98.8 98.2 99.3 99.0 98.5 98.3 96.0 65.4 3,022 Female 99.5 99.3 98.8 99.5 99.3 99.0 98.1 97.2 67.2 2,910
Birth order 1 99.7 99.5 99.1 99.6 99.5 99.1 98.9 98.2 65.6 1,383 2-3 99.5 99.0 98.8 99.5 99.3 98.9 98.2 97.3 66.8 2,306 4-5 99.7 99.3 98.0 99.6 99.2 98.7 98.4 95.5 68.0 1,456 6+ 98.3 97.9 97.4 98.3 97.9 97.4 96.9 93.7 62.9 787
Residence Urban 99.4 99.1 98.5 99.4 99.2 98.8 98.4 96.8 65.5 4,890 Rural 99.5 98.8 98.3 99.5 98.8 98.3 97.5 95.6 70.2 1,041
Region Central 99.6 99.3 98.8 99.6 99.5 99.1 98.9 97.2 66.0 3,637 North 99.2 98.8 98.5 99.2 98.7 98.5 97.9 97.0 68.5 1,718 South 98.8 97.9 96.6 98.8 97.9 96.8 94.9 91.5 61.7 577
Governorate Amman 99.7 99.3 98.5 99.7 99.6 98.9 98.6 97.0 64.8 2,166 Balqa 100.0 100.0 99.9 100.0 100.0 100.0 100.0 97.8 65.1 413 Zarqa 99.2 99.2 98.9 99.0 99.0 99.0 99.2 97.6 68.5 895 Madaba 99.8 99.4 99.2 99.8 99.4 99.2 98.3 96.4 70.7 163 Irbid 99.0 98.8 98.8 99.0 98.8 98.8 98.3 97.7 69.5 1,041 Mafraq 99.1 97.9 96.9 99.1 97.9 96.9 96.4 95.3 69.3 342 Jarash 99.5 99.2 99.2 99.5 99.2 99.2 98.6 96.4 61.6 195 Ajloun 99.8 99.7 99.3 99.6 99.4 99.3 97.4 96.5 67.8 139 Karak 99.0 98.7 97.5 99.0 98.7 97.5 95.6 92.9 60.8 248 Tafiela 99.8 99.3 98.3 99.8 99.3 98.3 97.5 95.4 60.0 98 Ma'an 96.4 92.7 90.0 96.4 92.7 91.5 89.3 81.0 67.3 96 Aqaba 99.2 99.1 98.5 99.2 99.1 98.5 95.9 93.8 60.3 135
Badia Badia 98.4 96.5 95.1 98.4 96.5 95.4 94.0 89.9 70.1 439 Non Badia 99.5 99.2 98.8 99.5 99.3 99.0 98.6 97.1 66.0 5,493
Camps Camp 99.1 99.1 98.6 99.1 99.1 98.8 98.8 96.7 68.7 239 Non camp 99.4 99.0 98.5 99.4 99.1 98.7 98.2 96.6 66.2 5,693
Mother's education No education 96.1 90.6 88.2 96.1 90.6 88.2 87.9 84.8 65.4 143 Elementary 97.8 97.5 95.5 97.8 97.5 95.8 94.6 92.1 60.7 405 Preparatory 99.6 99.6 98.8 99.6 99.5 98.8 98.7 96.7 64.0 797 Secondary 99.7 99.2 99.1 99.6 99.4 99.4 98.5 96.9 69.4 2,790 Higher 99.6 99.5 99.0 99.6 99.5 99.1 99.2 97.9 63.9 1,797
Wealth quintile Lowest 98.8 98.1 97.2 98.8 98.1 97.2 96.7 94.6 63.8 1,380 Second 99.8 99.1 99.0 99.7 99.5 99.4 98.5 96.8 70.0 1,295 Middle 99.4 99.3 99.0 99.4 99.3 99.3 98.2 97.6 67.6 1,299 Fourth 99.6 99.4 98.9 99.6 99.4 98.9 99.0 96.3 67.3 1,164 Highest 99.6 99.6 98.5 99.6 99.6 98.8 99.4 98.2 60.9 794
Total 99.4 99.0 98.5 99.4 99.1 98.7 98.2 96.6 66.3 5,932
Haemophilus influenzae type b (Hib)
Haemophilus influenzae type b (Hib) is a bacterial disease that can cause meningitis in infants and severe infection of the epiglottis in older children. Children should receive the first two doses of Hib vaccine at age two and three months, respectively, and a third dose may be given at age four months. Results in Table 10.5 show that 99 percent of children age 24-59 months received the Hib vaccine. Variations in vaccination coverage for Hib are negligible.

130 • Child Health
Measles/MMR
Since 1995, a routine two-dose schedule has been recommended for measles vaccination. The purpose of the second dose is to produce immunity to measles in a person who fails to respond to the first dose. Children generally receive the second dose of measles vaccine as a combined MMR vaccine. The first dose is administered at age nine months and the second dose, as part of the MMR vaccine, is recommended at 18 months. Ninety-eight percent of children age 24-59 months received the first dose of the measles vaccine (Table 10.5) and a combined MMR was given to 97 percent of children.
There are some variations in MMR coverage by birth order and mother’s level of education. For example, 98 percent of children of mothers with higher education have MMR coverage compared to 85 percent of children of mothers with no education. MMR coverage is particularly low among children in Ma’an (81 percent).
10.2.3 Trends in Vaccination Coverage
One way of measuring trends in vaccination coverage is to compare coverage among children of different ages. Table 10.6 shows the percentage of children age 12-59 months who have received vaccinations during the first year of life according to their current age. This type of data can provide evidence of any trends in the vaccination coverage over the past five years.
Table 10.6 Vaccinations in first year of life
Percentage of children age 12-59 months at the time of the survey who received specific vaccines by age 12 months, and percentage with a vaccination card, by current age of child, Jordan 2012
Age in months BCG DPT 1 DPT 2 DPT 3 Polio 1 Polio 2 Polio 3 Measles
All basic vaccina-
tions1
No vaccina-
tions
Percen- tage with a vaccina- tion card
seen Number
of children
12-23 97.9 99.3 98.7 97.9 99.3 98.7 97.9 85.7 85.1 0.5 80.4 1,941 24-35 98.1 98.2 97.9 97.2 98.4 98.1 97.4 86.5 85.9 1.2 76.1 1,950 36-47 98.3 98.7 98.1 97.3 98.7 98.1 97.3 83.5 82.5 0.9 70.5 1,965 48-59 96.4 99.0 98.7 96.8 99.0 98.7 97.0 87.3 86.5 0.8 52.7 2,018
Total 97.8 98.8 98.4 97.4 98.9 98.4 97.5 85.8 85.1 0.9 69.8 7,873
Note: Information was obtained from the vaccination card or, if there was no written record, from the mother. For children whose information is based on the mother's report, the proportion of vaccinations given during the first year of life is assumed to be the same as for children with a written record of vaccinations. 1 BCG, measles, and three doses each of DPT and polio vaccine.
Coverage has remained consistently high among all age groups of children. Vaccination cards
were seen by the interviewer for 80 percent of children age 12-23 months compared to 53 percent of children age 48-59 months. The lower percentage of cards shown for older children could be because vaccination cards for children in kindergarten are generally kept at the school and may not have been available at the time of the survey.
Another way of measuring trends in vaccination coverage is to compare coverage across surveys. Vaccination coverage increased by 7 percent in the last five years from 87 percent of children fully immunized (including BCG) in 2007 to 93 percent in 2012. This increase was primarily due to the increase in BCG coverage from 91 percent to 98 percent. Surveys prior to the 2007 JPFHS show very low coverage for BCG (and therefore very low coverage of all basic vaccinations) because the health program in Jordan did not emphasize BCG coverage for children below age six.

Child Health • 131
10.3 ACUTE RESPIRATORY INFECTION
Acute respiratory infection (ARI) is a leading cause of childhood morbidity and mortality throughout the world. Early diagnosis and treatment with antibiotics can prevent a large proportion of deaths caused by ARI. In the 2012 JPFHS, the prevalence of ARI was estimated by asking mothers whether their children under age five had been ill in the two weeks preceding the survey with a cough accompanied by short, rapid breathing that is chest-related. It should be noted that the morbidity data collected are subjective, as they are based on the mother’s perception of illness with no validation from medical personnel.
Table 10.7 shows the percentage of children under age five with symptoms of ARI during the two weeks preceding the survey. In total, 7 percent of children showed symptoms of ARI at some time in the two weeks preceding the survey. Prevalence of ARI varies by age of child: children age 6-11 months are more likely to have ARI symptoms (10 percent) than children in any other age group. Boys (8 percent) are more likely to have symptoms of ARI than girls (5 percent). Children of mothers who smoke are also more likely to have symptoms of ARI (10 percent) than children of mothers who don’t smoke (7 percent). Prevalence of ARI is also relatively higher in Jarash, among children of mothers with no education, and among children living in the middle wealth quintile. Table 10.7 also shows that medical advice or treatment was sought for more than three-quarters of children who had ARI symptoms, and 87 percent of these children received antibiotics to treat the infection. There are significant variations in treatment by background characteristics; however, they do not follow any clear pattern. The results indicate that male children are more likely to be taken to a health facility or provider and receive antibiotics to treat ARI than female children. Children residing in the rural areas are slightly more likely to be taken to a health facility and receive antibiotics compared to children residing in the urban areas.
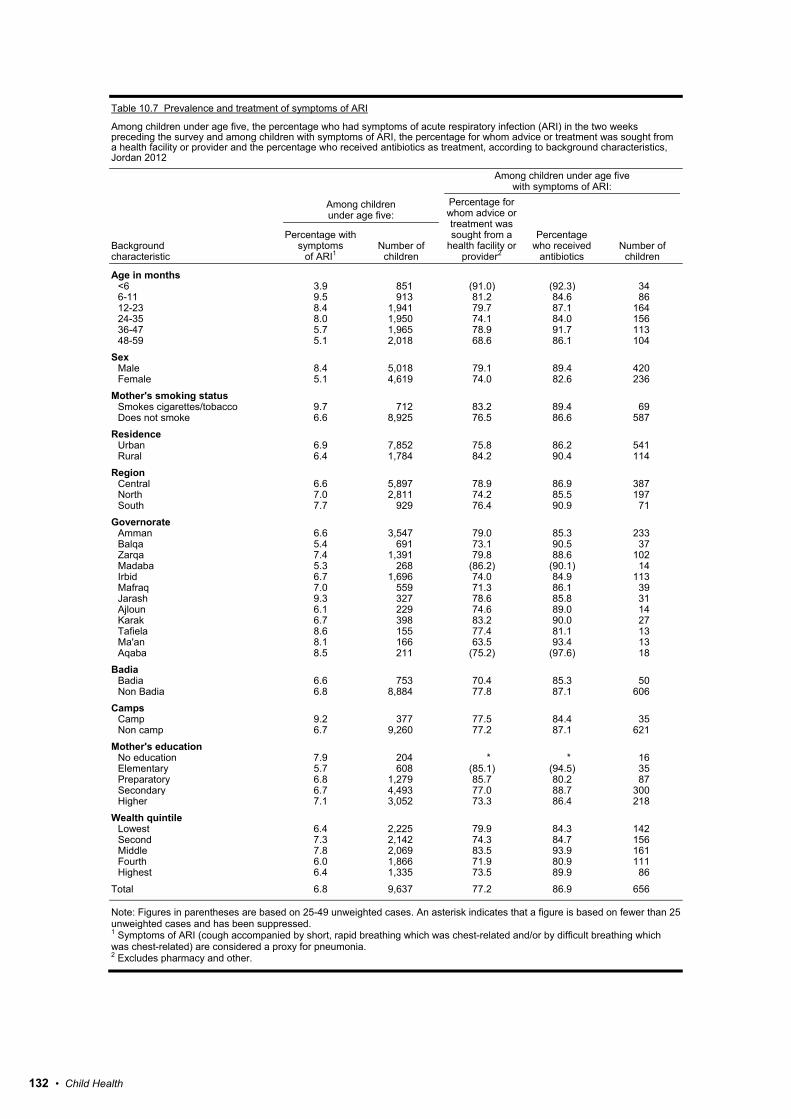
132 • Child Health
Table 10.7 Prevalence and treatment of symptoms of ARI
Among children under age five, the percentage who had symptoms of acute respiratory infection (ARI) in the two weeks preceding the survey and among children with symptoms of ARI, the percentage for whom advice or treatment was sought from a health facility or provider and the percentage who received antibiotics as treatment, according to background characteristics, Jordan 2012
Background characteristic
Among children under age five:
Among children under age five with symptoms of ARI:
Percentage for whom advice or treatment was sought from a
health facility or provider2
Percentage who received
antibiotics Number of
children
Percentage with symptoms
of ARI1 Number of
children
Age in months <6 3.9 851 (91.0) (92.3) 34 6-11 9.5 913 81.2 84.6 86 12-23 8.4 1,941 79.7 87.1 164 24-35 8.0 1,950 74.1 84.0 156 36-47 5.7 1,965 78.9 91.7 113 48-59 5.1 2,018 68.6 86.1 104
Sex Male 8.4 5,018 79.1 89.4 420 Female 5.1 4,619 74.0 82.6 236
Mother's smoking status Smokes cigarettes/tobacco 9.7 712 83.2 89.4 69 Does not smoke 6.6 8,925 76.5 86.6 587
Residence Urban 6.9 7,852 75.8 86.2 541 Rural 6.4 1,784 84.2 90.4 114
Region Central 6.6 5,897 78.9 86.9 387 North 7.0 2,811 74.2 85.5 197 South 7.7 929 76.4 90.9 71
Governorate Amman 6.6 3,547 79.0 85.3 233 Balqa 5.4 691 73.1 90.5 37 Zarqa 7.4 1,391 79.8 88.6 102 Madaba 5.3 268 (86.2) (90.1) 14 Irbid 6.7 1,696 74.0 84.9 113 Mafraq 7.0 559 71.3 86.1 39 Jarash 9.3 327 78.6 85.8 31 Ajloun 6.1 229 74.6 89.0 14 Karak 6.7 398 83.2 90.0 27 Tafiela 8.6 155 77.4 81.1 13 Ma'an 8.1 166 63.5 93.4 13 Aqaba 8.5 211 (75.2) (97.6) 18
Badia Badia 6.6 753 70.4 85.3 50 Non Badia 6.8 8,884 77.8 87.1 606
Camps Camp 9.2 377 77.5 84.4 35 Non camp 6.7 9,260 77.2 87.1 621
Mother's education No education 7.9 204 * * 16 Elementary 5.7 608 (85.1) (94.5) 35 Preparatory 6.8 1,279 85.7 80.2 87 Secondary 6.7 4,493 77.0 88.7 300 Higher 7.1 3,052 73.3 86.4 218
Wealth quintile Lowest 6.4 2,225 79.9 84.3 142 Second 7.3 2,142 74.3 84.7 156 Middle 7.8 2,069 83.5 93.9 161 Fourth 6.0 1,866 71.9 80.9 111 Highest 6.4 1,335 73.5 89.9 86
Total 6.8 9,637 77.2 86.9 656
Note: Figures in parentheses are based on 25-49 unweighted cases. An asterisk indicates that a figure is based on fewer than 25 unweighted cases and has been suppressed. 1 Symptoms of ARI (cough accompanied by short, rapid breathing which was chest-related and/or by difficult breathing which was chest-related) are considered a proxy for pneumonia. 2 Excludes pharmacy and other.

Child Health • 133
10.4 PREVALENCE OF FEVER
Fever is a major manifestation of acute infections in children. Table 10.8 shows the percentage of children under age five who had fever in the two weeks preceding the survey and the percentage receiving treatment, by background characteristics. Overall, 18 percent of children had fever in the two weeks before the interview.
The prevalence of fever is high among children age 6-11 months and 12-23 months (26 and 27 percent, respectively). There are no significant variations in the prevalence of fever by the sex of the child. However, there are noticeable variations by region (from 12 percent in the South to 22 percent in the North and by governorate, ranging from 9 percent in Karak to 26 percent in Irbid. There is no clear pattern between mother’s education and the prevalence of fever; the prevalence ranges from 8 percent among children of mothers with no education to 22 percent among children of mothers with elementary and preparatory education.
Table 10.8 Prevalence and treatment of fever Among children under age 5, the percentage who had a fever in the two weeks preceding the survey, and among children with fever, the percentage for whom advice or treatment was sought from a health facility or provider and the percentage who received antibiotics as treatment, by background characteristics, Jordan 2012
Background characteristic
Among children under age 5:
Among children under age 5 with fever: Percentage for whom advice or treatment was sought from a health facility or provider1
Percentage who took antibiotic
drugs Number of
children Percentage with fever
Number of children
Age in months <6 11.6 851 64.1 62.6 98 6-11 26.4 913 79.0 75.3 241 12-23 26.5 1,941 64.2 77.6 515 24-35 16.4 1,950 70.7 89.0 321 36-47 15.5 1,965 65.0 77.1 304 48-59 13.9 2,018 72.1 83.6 281
Sex Male 18.1 5,018 69.0 78.1 908 Female 18.4 4,619 68.6 80.8 852
Residence Urban 18.9 7,852 66.4 77.5 1,486 Rural 15.3 1,784 81.7 89.8 274
Region Central 17.3 5,897 68.3 78.2 1,022 North 22.3 2,811 68.8 79.9 626 South 12.0 929 73.5 87.8 112
Governorate Amman 19.2 3,547 67.2 75.2 680 Balqa 9.8 691 75.4 85.0 68 Zarqa 17.4 1,391 68.3 83.9 242 Madaba 12.1 268 75.6 85.8 32 Irbid 25.9 1,696 66.8 77.0 440 Mafraq 12.2 559 74.1 91.1 68 Jarash 22.8 327 74.2 81.1 75 Ajloun 19.1 229 72.1 89.1 44 Karak 8.5 398 73.9 84.8 34 Tafiela 18.6 155 79.9 83.2 29 Ma'an 16.8 166 67.6 93.9 28 Aqaba 10.1 211 72.1 90.5 21
Badia Badia 15.0 753 76.4 89.4 113 Non Badia 18.5 8,884 68.3 78.7 1,646
Camps Camp 23.0 377 70.1 77.3 87 Non camp 18.1 9,260 68.7 79.5 1,673
Mother's education No education 7.7 204 * * 16 Elementary 22.2 608 67.7 58.2 135 Preparatory 21.9 1,279 61.2 76.9 281 Secondary 18.0 4,493 70.4 81.1 807 Higher 17.1 3,052 70.3 83.2 521
Wealth quintile Lowest 15.7 2,225 65.9 82.7 349 Second 21.9 2,142 74.3 74.8 469 Middle 18.8 2,069 69.6 81.3 389 Fourth 19.6 1,866 65.7 81.6 366 Highest 14.1 1,335 64.8 76.9 188
Total 18.3 9,637 68.8 79.4 1,760
Note: An asterisk indicates that a figure is based on fewer than 25 unweighted cases and has been suppressed. 1 Excludes pharmacy and other.

134 • Child Health
Table 10.8 shows that medical advice or treatment was sought for 69 percent of children with fever and 79 percent received antibiotics to treat the fever. These percentages vary slightly by background characteristics. Treatment or advice for fever is sought more commonly in rural areas than in urban areas and in the South region compared to other regions. Use of antibiotics to treat fever is also more common in rural areas than urban areas, in the South region, and in Badia areas.
Table 10.9 shows that 18 percent of children with fever sought treatment the same day, while 39 percent sought treatment the next day. Two in five children received treatment after two days (42 percent).
Children under age six months (32 percent), children in Zarqa (38 percent), children of mothers with higher education (26 percent), and children in the fourth wealth quintile (27 percent) are much more likely to receive treatment for the fever the same day than children in other categories.
Table 10.9 Children taken for treatment of fever by number of days Among children under age 5 who had fever in the two weeks preceding the survey and who were taken to a health facility or provider, percent distribution by number of days after fever began when treatment was first sought, by background characteristics, Jordan 2012
Background characteristic
Number of days after fever began before treatment was sought
Total
Number of children with
fever taken to a health facility1 Same day Next day 2-6 days 7+ days
Age in months <6 31.7 45.4 22.9 0.0 100.0 63 6-11 20.1 43.5 36.1 0.3 100.0 190 12-23 14.8 34.7 49.3 1.2 100.0 331 24-35 20.5 43.2 33.8 2.6 100.0 227 36-47 14.3 44.1 41.4 0.2 100.0 198 48-59 19.6 32.3 46.9 1.2 100.0 203
Sex Male 18.0 39.5 41.7 0.8 100.0 627 Female 18.5 39.3 40.8 1.4 100.0 584
Residence Urban 18.9 37.4 42.7 1.0 100.0 987 Rural 15.7 48.1 34.7 1.5 100.0 223
Region Central 17.2 36.0 45.9 0.9 100.0 698 North 20.3 44.2 33.9 1.6 100.0 431 South 16.8 42.7 40.4 0.2 100.0 82
Governorate Amman 10.3 33.4 55.2 1.1 100.0 457 Balqa 11.4 48.6 38.8 1.3 100.0 51 Zarqa 37.6 37.6 24.8 0.0 100.0 165 Madaba 20.9 48.8 28.4 1.8 100.0 25 Irbid 21.1 43.5 33.7 1.7 100.0 294 Mafraq 16.6 49.6 33.8 0.0 100.0 50 Jarash 23.8 46.5 28.9 0.7 100.0 55 Ajloun 12.4 38.1 45.1 4.4 100.0 32 Karak 12.3 35.6 52.1 0.0 100.0 25 Tafiela 14.6 55.0 30.4 0.0 100.0 23 Ma'an 20.6 35.8 42.9 0.8 100.0 19 Aqaba 22.9 44.0 33.1 0.0 100.0 15
Badia Badia 18.6 40.6 40.8 0.0 100.0 86 Non Badia 18.3 39.3 41.3 1.2 100.0 1,124
Camps Camp 21.4 39.0 39.7 0.0 100.0 61 Non camp 18.1 39.4 41.3 1.1 100.0 1,150
Mother's education No education * * * * 100.0 13 Elementary 4.7 28.7 66.6 0.0 100.0 91 Preparatory 10.7 46.4 42.4 0.5 100.0 172 Secondary 17.6 35.5 45.0 1.9 100.0 569 Higher 26.4 44.9 28.3 0.4 100.0 366
Wealth quintile Lowest 11.4 39.9 48.6 0.1 100.0 230 Second 19.2 41.7 37.5 1.6 100.0 348 Middle 15.6 39.3 43.5 1.6 100.0 271 Fourth 26.5 37.3 35.7 0.5 100.0 240 Highest 18.2 36.2 44.1 1.4 100.0 122
Total 18.3 39.4 41.3 1.1 100.0 1,211
Note: An asterisk indicates that a figure is based on fewer than 25 unweighted cases and has been suppressed. 1 Excludes pharmacy and other.

Child Health • 135
10.5 PREVALENCE OF DIARRHEA
Table 10.10 shows the percentage of children under five with diarrhea in the two weeks preceding the survey, by background characteristics. Sixteen percent of all children under age five experienced diarrhea at some time in the two weeks preceding the survey. The occurrence of diarrhea varies by age of the child; children age 6-23 months are more prone to diarrhea than children in the other age groups. The prevalence of diarrhea varies from a low of 8 percent in Aqaba to a high of 19 percent in Jarash. The prevalence of diarrhea in children also varies according to the source of drinking water. Children who consume water from an improved source are slightly less likely to have diarrhea (14 percent) than children who consume water from sources that are not considered safe for drinking (17 percent).
Table 10.10 Prevalence of diarrhea
Percentage of children under age five who had diarrhea in the two weeks preceding the survey, by background characteristics, Jordan 2012
Background characteristic
Diarrhea in the two weeks preceding the survey
Number of children
All diarrhea
Diarrhea with blood
Age in months <6 16.2 0.1 8516-11 32.0 2.1 91312-23 27.8 1.2 1,94124-35 12.2 0.4 1,95036-47 9.6 0.7 1,96548-59 5.3 0.4 2,018
SexMale 16.4 0.8 5,018Female 14.7 0.7 4,619
Source of drinking water1
Improved 14.3 0.8 5,306Not improved 17.1 0.8 4,331
Residence Urban 16.1 0.7 7,852Rural 13.5 0.9 1,784
Region Central 15.5 0.9 5,897North 17.0 0.5 2,811South 11.4 0.7 929
Governorate Amman 16.0 1.1 3,547Balqa 12.9 1.0 691Zarqa 15.6 0.4 1,391Madaba 16.4 0.8 268Irbid 18.1 0.4 1,696Mafraq 12.8 0.5 559Jarash 18.8 0.7 327Ajloun 16.5 1.0 229Karak 10.9 0.7 398Tafiela 15.1 0.8 155Ma'an 12.9 0.8 166Aqaba 8.4 0.5 211
Badia Badia 14.0 0.7 753Non Badia 15.7 0.8 8,884
Camps Camp 18.2 0.6 377Non camp 15.5 0.8 9,260
Mother's education No education 7.3 0.6 204Elementary 21.5 0.3 608Preparatory 20.6 1.9 1,279Secondary 15.3 0.8 4,493Higher 13.3 0.3 3,052
Wealth quintile Lowest 17.9 0.4 2,225Second 18.7 1.8 2,142Middle 14.4 0.4 2,069Fourth 12.4 0.4 1,866Highest 12.9 0.8 1,335
Total 15.6 0.8 9,637
Note: Total includes 4 children living in households using non-improved toilet facilities who are not shown separately. 1 See Table 2.1 for definition of categories.

136 • Child Health
Table 10.10 also shows that less than 1 percent of children had bloody diarrhea in the two weeks before the survey.
10.5.1 Diarrhea Treatment
Table 10.11 shows the percentage of children with diarrhea who received specific treatments by background characteristics. Advice or treatment was sought from a health facility or a provider for more than half (56 percent) of children with diarrhea in the two weeks preceding the survey. Treatment was most commonly sought for children age 6-11 months. Children residing in Karak and Ma’an are most likely to have received advice or treatment. Children of mothers with higher education and children living in households in the middle wealth quintile are also more likely than their counterparts to have received advice or treatment for diarrhea.
One in five children with diarrhea was treated with oral rehydration salts (ORS), and 10 percent were given recommended home fluids (RHF). In addition, 34 percent of children with diarrhea were given increased fluids. Overall, 52 percent of children received ORT or increased fluids. Moreover, 51 percent of children were given antibiotic drugs and 29 percent were given home remedies. However, 24 percent of children with diarrhea did not receive any type of treatment at all.
Diarrhea treatment varies slightly with age. Children age 12-23 months, children with bloody diarrhea, female children, children of mothers with higher education, and children from the richest households are more likely than their counterparts to be given ORT or increased fluids. In addition, children in the South region, children in Aqaba, children in the Badia areas, and children in non camp areas are more likely to receive ORT or increased fluids than other children.

Child Health • 137
Table 10.11 Diarrhea treatment
Among children under age five who had diarrhea in the two weeks preceding the survey, the percentage for whom advice or treatment was sought from a health facility or provider, the percentage given oral rehydration therapy (ORT), the percentage given increased fluids, the percentage given ORT or increased fluids, and the percentage who were given other treatments, by background characteristics, Jordan 2012
Background characteristic
Percent-age of
children with
diarrhea for whom advice or treatment
was sought from a health
facility or provider1
Oral rehydration therapy (ORT)
Increased fluids
ORT or increased
fluids
Other treatments
No treatment
Number of children
with diarrhea
Fluid from ORS
packets or pre-
packaged liquid
Recom- mended
home fluids (RHF)
Either ORS or RHF
Antibiotic drugs
Intra-venous solution
Home remedy/
other
Age in months <6 47.4 11.1 13.4 24.2 21.1 37.8 32.7 0.7 27.7 42.3 1386-11 66.9 22.3 5.6 27.0 32.1 52.3 55.4 1.2 32.8 21.3 29212-23 56.8 27.3 11.1 32.8 39.0 57.4 52.4 0.4 29.2 18.4 53924-35 52.7 13.3 7.0 19.0 39.0 51.6 52.7 0.0 27.1 26.9 23736-47 44.0 12.8 15.3 27.8 30.3 47.8 47.3 0.0 25.3 28.8 18848-59 57.8 21.6 8.8 30.0 30.1 51.7 51.2 0.4 28.3 24.8 107
Sex Male 55.0 17.7 9.1 24.9 32.7 49.6 48.2 0.5 27.1 26.0 823Female 56.6 23.7 11.0 31.4 36.2 55.1 53.4 0.5 31.1 22.1 678
Type of diarrhea Non-bloody 54.9 19.6 10.3 27.2 33.5 51.3 50.3 0.4 28.9 25.2 1,427Bloody 71.8 36.7 4.0 39.6 50.3 67.1 54.5 1.5 28.6 5.7 74
Residence Urban 55.5 20.0 10.5 27.7 34.2 51.8 50.2 0.5 27.4 24.4 1,261Rural 57.0 22.7 7.4 28.9 34.5 53.5 52.3 0.6 36.6 23.2 241
Region Central 55.7 20.9 10.1 27.7 33.9 51.0 48.4 0.3 22.1 26.3 917North 53.1 19.0 8.7 26.7 33.8 52.2 51.3 0.8 39.7 22.6 478South 67.5 22.6 14.2 33.9 40.1 61.6 65.1 0.6 38.8 13.4 106
Governorate Amman 53.6 15.8 10.7 24.0 31.0 46.0 46.2 0.0 18.5 27.9 567Balqa 57.9 35.0 14.4 38.6 37.0 57.7 50.1 2.8 38.0 26.0 89Zarqa 61.4 29.9 7.6 34.7 41.2 62.8 56.0 0.0 25.6 20.2 217Madaba 49.8 13.3 6.6 19.1 28.2 42.4 35.2 0.7 19.6 37.2 44Irbid 50.7 18.0 9.4 26.2 29.6 49.3 46.4 0.6 39.4 25.1 308Mafraq 59.2 21.9 8.4 29.6 42.3 60.9 62.5 0.7 43.6 16.6 71Jarash 57.2 24.3 6.0 29.4 39.7 56.9 60.8 2.4 43.0 18.0 62Ajloun 54.9 13.7 8.4 20.7 42.4 51.2 55.2 0.7 29.1 21.4 38Karak 70.4 27.9 14.3 37.8 42.9 66.2 66.7 1.1 35.0 9.0 44Tafiela 63.6 10.2 9.6 18.5 40.2 48.5 57.7 0.0 29.4 20.4 23Ma'an 69.5 23.4 10.9 31.5 30.8 51.9 64.5 0.0 44.5 19.8 21Aqaba 63.4 25.2 24.1 47.7 44.4 79.3 71.9 1.1 53.3 7.1 18
Badia Badia 62.5 25.4 6.1 31.4 33.1 55.4 60.5 0.4 43.0 18.8 105Non Badia 55.2 20.0 10.3 27.6 34.4 51.8 49.8 0.5 27.8 24.7 1,396
Camps Camp 52.1 17.0 7.5 21.0 31.7 43.9 45.5 0.7 26.9 30.8 68Non camp 55.9 20.6 10.1 28.2 34.4 52.5 50.8 0.5 29.0 23.9 1,433
Mother's education No education (50.3) (31.4) (5.9) (37.3) (23.7) (41.0) (53.2) (0.0) (38.5) (31.2) 15Elementary 58.3 16.1 6.2 18.2 20.7 32.9 60.0 0.2 26.7 24.3 131Preparatory 42.4 23.7 11.0 32.4 35.9 52.0 47.0 0.4 20.4 28.3 264Secondary 57.0 23.0 9.5 29.6 30.4 51.1 48.4 0.5 28.0 26.9 686Higher 61.5 14.9 11.6 24.7 44.6 60.4 53.2 0.6 36.3 16.9 405
Wealth quintile Lowest 54.7 22.1 13.0 31.6 31.5 51.5 48.8 1.0 27.5 26.2 399Second 58.3 20.6 6.0 25.2 35.1 50.3 58.0 0.0 28.2 20.0 401Middle 61.3 21.2 6.0 25.7 35.9 53.0 53.9 0.9 31.3 21.7 298Fourth 44.7 15.6 7.4 22.2 39.1 51.8 38.0 0.3 28.9 32.2 232Highest 57.4 21.3 22.5 36.7 29.6 56.6 48.1 0.0 29.6 23.1 172
Total 55.7 20.4 10.0 27.8 34.3 52.1 50.5 0.5 28.9 24.2 1,501
Note: Figures in parentheses are based on 25-49 unweighted cases. ORT includes fluid prepared from oral rehydration salt (ORS) packets, pre-packaged ORS fluid, and recommended home fluids (RHF). 1 Excludes pharmacy and other.

138 • Child Health
10.5.2 Nutritional Practices during Diarrhea
Mothers are encouraged to treat children suffering from diarrhea by increasing their fluid intake and continuing to feed them normally. These practices help to reduce dehydration and minimize the adverse consequences of diarrhea on the child’s nutritional status. To assess compliance with proper treatment practices, mothers with a child who had diarrhea in the two weeks preceding the survey were asked about the relative amounts of fluids and foods given to the child during the diarrheal episode. Table 10.12 shows that 34 percent of children with diarrhea were given more fluids during the illness, while 39 percent were given the same amount of fluids as usual; 20 percent were given somewhat less fluids and 6 percent much less. With respect to food intake during diarrheal episodes, 4 percent of children were given more food and 33 percent maintained their usual food intake, 34 percent received somewhat less food, and 20 percent were given much less than usual.
Only a fifth of children with diarrhea (20 percent) were fed according to recommendations (more liquids and same amount of food). However, 34 percent of children with diarrhea continued feeding as usual and were given ORT and/or increased fluids for management of diarrhea. This practice is more common for children with bloody diarrhea.
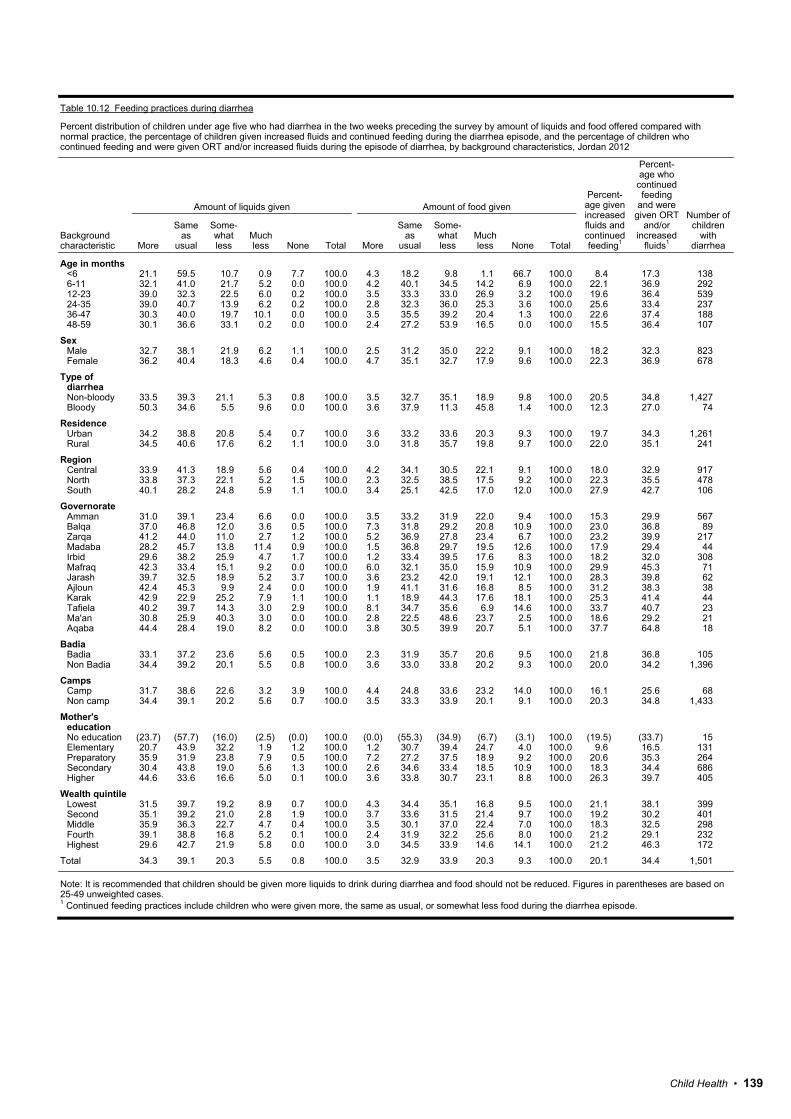
Child Health • 139
Table 10.12 Feeding practices during diarrhea
Percent distribution of children under age five who had diarrhea in the two weeks preceding the survey by amount of liquids and food offered compared with normal practice, the percentage of children given increased fluids and continued feeding during the diarrhea episode, and the percentage of children who continued feeding and were given ORT and/or increased fluids during the episode of diarrhea, by background characteristics, Jordan 2012
Background characteristic
Amount of liquids given Amount of food given Percent- age given increased fluids and continued feeding1
Percent- age who
continued feeding
and were given ORT
and/or increased
fluids1
Number of children
with diarrhea More
Same as
usual
Some- what less
Much less None Total More
Same as
usual
Some-what less
Much less None Total
Age in months <6 21.1 59.5 10.7 0.9 7.7 100.0 4.3 18.2 9.8 1.1 66.7 100.0 8.4 17.3 1386-11 32.1 41.0 21.7 5.2 0.0 100.0 4.2 40.1 34.5 14.2 6.9 100.0 22.1 36.9 29212-23 39.0 32.3 22.5 6.0 0.2 100.0 3.5 33.3 33.0 26.9 3.2 100.0 19.6 36.4 53924-35 39.0 40.7 13.9 6.2 0.2 100.0 2.8 32.3 36.0 25.3 3.6 100.0 25.6 33.4 23736-47 30.3 40.0 19.7 10.1 0.0 100.0 3.5 35.5 39.2 20.4 1.3 100.0 22.6 37.4 18848-59 30.1 36.6 33.1 0.2 0.0 100.0 2.4 27.2 53.9 16.5 0.0 100.0 15.5 36.4 107
Sex Male 32.7 38.1 21.9 6.2 1.1 100.0 2.5 31.2 35.0 22.2 9.1 100.0 18.2 32.3 823Female 36.2 40.4 18.3 4.6 0.4 100.0 4.7 35.1 32.7 17.9 9.6 100.0 22.3 36.9 678
Type of diarrhea Non-bloody 33.5 39.3 21.1 5.3 0.8 100.0 3.5 32.7 35.1 18.9 9.8 100.0 20.5 34.8 1,427Bloody 50.3 34.6 5.5 9.6 0.0 100.0 3.6 37.9 11.3 45.8 1.4 100.0 12.3 27.0 74
Residence Urban 34.2 38.8 20.8 5.4 0.7 100.0 3.6 33.2 33.6 20.3 9.3 100.0 19.7 34.3 1,261Rural 34.5 40.6 17.6 6.2 1.1 100.0 3.0 31.8 35.7 19.8 9.7 100.0 22.0 35.1 241
Region Central 33.9 41.3 18.9 5.6 0.4 100.0 4.2 34.1 30.5 22.1 9.1 100.0 18.0 32.9 917North 33.8 37.3 22.1 5.2 1.5 100.0 2.3 32.5 38.5 17.5 9.2 100.0 22.3 35.5 478South 40.1 28.2 24.8 5.9 1.1 100.0 3.4 25.1 42.5 17.0 12.0 100.0 27.9 42.7 106
Governorate Amman 31.0 39.1 23.4 6.6 0.0 100.0 3.5 33.2 31.9 22.0 9.4 100.0 15.3 29.9 567Balqa 37.0 46.8 12.0 3.6 0.5 100.0 7.3 31.8 29.2 20.8 10.9 100.0 23.0 36.8 89Zarqa 41.2 44.0 11.0 2.7 1.2 100.0 5.2 36.9 27.8 23.4 6.7 100.0 23.2 39.9 217Madaba 28.2 45.7 13.8 11.4 0.9 100.0 1.5 36.8 29.7 19.5 12.6 100.0 17.9 29.4 44Irbid 29.6 38.2 25.9 4.7 1.7 100.0 1.2 33.4 39.5 17.6 8.3 100.0 18.2 32.0 308Mafraq 42.3 33.4 15.1 9.2 0.0 100.0 6.0 32.1 35.0 15.9 10.9 100.0 29.9 45.3 71Jarash 39.7 32.5 18.9 5.2 3.7 100.0 3.6 23.2 42.0 19.1 12.1 100.0 28.3 39.8 62Ajloun 42.4 45.3 9.9 2.4 0.0 100.0 1.9 41.1 31.6 16.8 8.5 100.0 31.2 38.3 38Karak 42.9 22.9 25.2 7.9 1.1 100.0 1.1 18.9 44.3 17.6 18.1 100.0 25.3 41.4 44Tafiela 40.2 39.7 14.3 3.0 2.9 100.0 8.1 34.7 35.6 6.9 14.6 100.0 33.7 40.7 23Ma'an 30.8 25.9 40.3 3.0 0.0 100.0 2.8 22.5 48.6 23.7 2.5 100.0 18.6 29.2 21Aqaba 44.4 28.4 19.0 8.2 0.0 100.0 3.8 30.5 39.9 20.7 5.1 100.0 37.7 64.8 18
Badia Badia 33.1 37.2 23.6 5.6 0.5 100.0 2.3 31.9 35.7 20.6 9.5 100.0 21.8 36.8 105Non Badia 34.4 39.2 20.1 5.5 0.8 100.0 3.6 33.0 33.8 20.2 9.3 100.0 20.0 34.2 1,396
Camps Camp 31.7 38.6 22.6 3.2 3.9 100.0 4.4 24.8 33.6 23.2 14.0 100.0 16.1 25.6 68Non camp 34.4 39.1 20.2 5.6 0.7 100.0 3.5 33.3 33.9 20.1 9.1 100.0 20.3 34.8 1,433
Mother's education No education (23.7) (57.7) (16.0) (2.5) (0.0) 100.0 (0.0) (55.3) (34.9) (6.7) (3.1) 100.0 (19.5) (33.7) 15Elementary 20.7 43.9 32.2 1.9 1.2 100.0 1.2 30.7 39.4 24.7 4.0 100.0 9.6 16.5 131Preparatory 35.9 31.9 23.8 7.9 0.5 100.0 7.2 27.2 37.5 18.9 9.2 100.0 20.6 35.3 264Secondary 30.4 43.8 19.0 5.6 1.3 100.0 2.6 34.6 33.4 18.5 10.9 100.0 18.3 34.4 686Higher 44.6 33.6 16.6 5.0 0.1 100.0 3.6 33.8 30.7 23.1 8.8 100.0 26.3 39.7 405
Wealth quintile Lowest 31.5 39.7 19.2 8.9 0.7 100.0 4.3 34.4 35.1 16.8 9.5 100.0 21.1 38.1 399Second 35.1 39.2 21.0 2.8 1.9 100.0 3.7 33.6 31.5 21.4 9.7 100.0 19.2 30.2 401Middle 35.9 36.3 22.7 4.7 0.4 100.0 3.5 30.1 37.0 22.4 7.0 100.0 18.3 32.5 298Fourth 39.1 38.8 16.8 5.2 0.1 100.0 2.4 31.9 32.2 25.6 8.0 100.0 21.2 29.1 232Highest 29.6 42.7 21.9 5.8 0.0 100.0 3.0 34.5 33.9 14.6 14.1 100.0 21.2 46.3 172
Total 34.3 39.1 20.3 5.5 0.8 100.0 3.5 32.9 33.9 20.3 9.3 100.0 20.1 34.4 1,501
Note: It is recommended that children should be given more liquids to drink during diarrhea and food should not be reduced. Figures in parentheses are based on 25-49 unweighted cases. 1 Continued feeding practices include children who were given more, the same as usual, or somewhat less food during the diarrhea episode.

140 • Child Health
Table 10.13 shows that for 15 percent of children with diarrhea, treatment was sought the same day, while for 35 percent, care was sought the next day, and for 51 percent after the second day. The percentage of children for whom treatment was sought the same day is higher among children with non-bloody diarrhea, children living in Karak and Zarqa, children of mothers with secondary education, and children living in the middle wealth quintile.
Table 10.13 Children taken for treatment of diarrhea by number of days
Among children under age five who had diarrhea in the two weeks preceding the survey and who were taken to a health facility or provider, percent distribution by number of days after diarrhea began before treatment was first sought, by background characteristics, Jordan 2012
Background characteristic
Number of days after diarrhea began before treatment was sought
Total
Number of children with
diarrhea taken to a health
facility1 Same day Next day 2-6 days 7+ days
Age in months <6 8.7 35.3 38.1 17.9 100.0 65 6-11 17.0 37.1 45.1 0.8 100.0 195 12-23 13.2 32.0 51.4 3.4 100.0 306 24-35 16.9 37.7 44.1 1.2 100.0 125 36-47 17.2 33.5 49.2 0.0 100.0 83 48-59 13.8 34.8 51.4 0.0 100.0 62
Sex Male 15.6 34.6 45.9 3.8 100.0 453 Female 13.7 34.7 49.5 2.1 100.0 384
Type of diarrhea Non-bloody 15.1 33.4 48.2 3.2 100.0 783 Bloody 9.2 52.6 38.2 0.0 100.0 53
Residence Urban 15.2 33.3 48.3 3.2 100.0 699 Rural 12.3 41.8 43.9 2.0 100.0 137
Region Central 13.7 32.4 49.5 4.4 100.0 511 North 16.2 37.5 45.6 0.7 100.0 254 South 16.6 41.3 41.0 1.2 100.0 72
Governorate Amman 10.4 27.3 56.3 6.0 100.0 304 Balqa 5.9 39.7 46.6 7.8 100.0 52 Zarqa 24.5 38.6 36.9 0.0 100.0 133 Madaba 13.7 46.2 38.4 1.6 100.0 22 Irbid 16.4 35.2 48.4 0.0 100.0 156 Mafraq 14.7 50.0 34.0 1.3 100.0 42 Jarash 17.6 31.0 48.1 3.3 100.0 35 Ajloun 15.9 39.8 44.3 0.0 100.0 21 Karak 24.6 40.9 34.5 0.0 100.0 31 Tafiela 3.5 41.9 50.0 4.6 100.0 15 Ma'an 8.8 36.5 53.7 1.0 100.0 15 Aqaba 22.4 47.8 29.8 0.0 100.0 11
Badia Badia 16.6 37.6 44.7 1.1 100.0 66 Non Badia 14.6 34.4 47.8 3.2 100.0 771
Camps Camp 13.7 32.7 50.9 2.7 100.0 36 Non camp 14.8 34.8 47.4 3.0 100.0 801
Mother's education No education * * * * 100.0 7 Elementary 9.6 31.0 59.1 0.4 100.0 76 Preparatory 10.4 49.1 38.8 1.7 100.0 112 Secondary 20.0 30.3 44.1 5.6 100.0 391 Higher 10.5 36.2 52.9 0.4 100.0 249
Wealth quintile Lowest 10.1 43.0 42.7 4.3 100.0 218 Second 12.6 37.0 44.6 5.7 100.0 234 Middle 21.9 33.0 44.1 1.0 100.0 182 Fourth 14.7 28.2 56.4 0.7 100.0 104 Highest 16.8 20.8 62.4 0.0 100.0 99
Total 14.7 34.7 47.6 3.0 100.0 836
Note: An asterisk indicates that a figure is based on fewer than 25 unweighted cases and has been suppressed. Total includes one child missing information on type of diarrhea who is not shown separately. 1 Excludes pharmacy and other.

Child Health • 141
10.5.3 Knowledge of Diarrhea Treatment Solutions
A simple and effective response to dehydration caused by diarrhea is a prompt increase in the child’s fluid intake through some form of ORT, which may include the use of solutions prepared from packets of oral rehydration salts (ORS packets), known in Jordan as “Aquasal.” Women were asked whether they know about ORS or Aquasal packets. Table 10.14 shows that the majority of women (92 percent) know about ORS packets for the treatment of diarrhea. Knowledge is high among all subgroups of women, with the exception of young mothers age 15-19 (63 percent).
Table 10.14 Knowledge of ORS packets or pre-packaged liquids
Percentage of women age 15-49 with a live birth in the five years preceding the survey who know about ORS packets or ORS pre-packaged liquids for treatment of diarrhea, by background characteristics, Jordan 2012
Background characteristic
Percentage of women who know
about ORS packets or ORS pre-packaged
liquids Number
of women
Age 15-19 62.6 154 20-24 79.0 901 25-34 93.0 3,412 35-49 97.9 2,110
Residence Urban 91.9 5,395 Rural 92.1 1,182
Region Central 92.7 4,052 North 90.9 1,903 South 90.6 622
Governorate Amman 92.7 2,469 Balqa 93.6 452 Zarqa 92.7 947 Madaba 90.7 184 Irbid 90.6 1,174 Mafraq 88.5 366 Jarash 93.1 207 Ajloun 96.1 156 Karak 94.0 269 Tafiela 88.5 103 Ma'an 90.1 104 Aqaba 86.1 146
Badia Badia 90.1 469 Non Badia 92.1 6,108
Camps Camp 94.0 253 Non camp 91.9 6,324
Education No education 80.0 130 Elementary 86.9 400 Preparatory 90.7 872 Secondary 92.4 3,069 Higher 93.6 2,106
Wealth quintile Lowest 88.8 1,393 Second 90.2 1,393 Middle 93.5 1,470 Fourth 94.7 1,327 Highest 92.8 994
Total 92.0 6,577
ORS = Oral rehydration salts


Nutritional Status and Prevalence of Anemia • 143
NUTRITIONAL STATUS AND PREVALENCE OF ANEMIA 11
ood nutrition is a prerequisite for the well-being of individuals and for national development. Although problems related to poor nutrition affect the entire population, women and children are particularly vulnerable because of their unique physiology and socioeconomic characteristics.
This chapter reviews the nutritional status of children and women in Jordan. Specific issues discussed include the nutritional status of children based on anthropometric measurements; infant and young child feeding practices based on information on initiation of breastfeeding, exclusive and continued breastfeeding status, and feeding with solid or semisolid foods; diversity of foods fed and frequency of feeding; micronutrient intake; and prevalence of anemia. The discussion also covers the nutritional status of women age 15-49.
11.1 NUTRITIONAL STATUS OF CHILDREN
Adequate nutrition is critical to children’s growth and development. The period from birth to age two is especially important for optimal physical, mental, and cognitive growth, health, and development. Unfortunately, this period is often marked by protein-energy and micronutrient deficiencies that interfere with optimal growth. Childhood illnesses such as diarrhea and acute respiratory infections (ARIs) are also common. The nutritional status of young children reflects the level of household, community, and national development. Malnutrition (inadequate nutrition) is a direct result of insufficient food intake or repeated infection, or a combination of both. It can result in increased risk of illness and death.
G
Key Findings
• Eight percent of children under five years of age are stunted, 2 percent are wasted, 3 percent are underweight and 4 percent are overweight.
• Breastfeeding is common in Jordan with 93 percent of children ever breastfed, and half of children breastfed for about 12 months or longer.
• About one in five children under age 6 months is exclusively breastfed, and the median duration of exclusive breastfeeding is less than one month.
• Complementary foods are not introduced in a timely fashion for all children. Sixty-six percent of children age 6-9 months are breastfeeding and given complementary foods.
• Overall, only one-third of children age 6-23 months are fed appropriately based on recommended infant and young child feeding (IYCF) practices.
• Thirty-two percent of children age 6-59 months are anemic, 20 percent are mildly anemic, 12 percent are moderately anemic, and less than 1 percent are severely anemic.
• Five percent of women are too thin, that is, they fall below the body mass index (BMI) cutoff of 18.5. On the other hand, an alarming 55 percent of women are overweight or obese.
• Thirty-four percent of women age 15-49 are anemic, 26 percent are mildly anemic, 7 percent are moderately anemic, and less than 1 percent are severely anemic.

144 • Nutritional Status and Prevalence of Anemia
11.1.1 Measurement of Nutritional Status among Young Children
In the 2012 JPFHS, anthropometric data on height and weight for children less than age five were collected in two-thirds of the sampled households to evaluate their nutritional status. Their standing height (for children age 24 months and older) or recumbent length (for children under age 24 months) was measured using the Shorr height board. Electronic Seca scales were used to measure the weight of children. Based on these measurements, three internationally accepted indices were constructed and are used to reflect the nutritional status of children. These are:
• Height-for-age (stunting) • Weight-for-height (wasting) • Weight-for-age (underweight)
In presenting anthropometric results, the nutritional status of children is compared with the World Health Organization (WHO) Child Growth Standards (WHO, 2006). The WHO Child Growth Standards are based on data from 8,440 children in six countries around the world showing that well-nourished children in all population groups follow very similar growth patterns before puberty. In any large population, there are natural variations in height and weight. The variations approximate a normal distribution. Children who fall below minus two standard deviations (-2 SD) from the reference median are considered malnourished, and children who fall below minus three standard deviations (-3 SD) from the reference median are considered severely malnourished. Because children’s height and weight change with age, it is useful that height and weight be assessed in relation to age and that weight be assessed in relation to height, taking the sex of the child into consideration. Each of the three indices provides information about different aspects of children’s nutritional status.
The height-for-age index reflects long-term, cumulative effects of inadequate nutrition, poor health, or both. Children who are below -2 SD from the median of the reference population are considered short for their age, or stunted. Children who are below -3 SD are severely stunted. Stunting of a child’s growth may result from failure to receive adequate nutrition over a long period, sustained improper feeding practices, or the effects of repeated episodes of illness. Height-for-age therefore represents a measure of the outcome of malnutrition in a population over a long period and usually does not vary appreciably with the season of data collection.
The weight-for-height index measures body mass in relation to body length. It describes a recent and severe process that has produced substantial weight loss, usually as a consequence of acute shortage of food, severe disease, or both. Children whose weight-for-height is below -2 SD from the median of the reference population are too thin for their height, or wasted, while those who measure below -3 SD from the reference population median are severely wasted. Wasting represents the failure to receive adequate nutrition during the period immediately before the survey and usually shows marked seasonal patterns associated with changes in food availability or disease prevalence. It may be the result of recent episodes of illness, particularly diarrhea, improper feeding practices, or acute food shortage.
Weight-for-age is a composite index of height-for-age and weight-for-height. It represents body mass relative to age and takes into account both acute and chronic malnutrition. Children whose weight-for-age measures below -2 SD from the median of the reference population are underweight for their age, and those whose measurements are below -3 SD from the reference population median are severely underweight. Being underweight for one’s age therefore could mean that a child is stunted or wasted or both stunted and wasted.
Nutritional Status and Prevalence of Anemia • 145
Overweight and obesity are becoming problems for some children in developing countries. The percentage of children more than two standard deviations above the median for weight-for-height indicates the level of this potential problem.
11.1.2 Results of Data Collection
All children born in the five years prior to the survey who were listed in the Household Questionnaires in the selected households were eligible for measuring and weighing. Table 11.1 shows the percentage of children under five years classified as malnourished according to background characteristics. The table also shows the nutritional status of children of mothers who were not interviewed, according to whether or not the mother lives in the household.
Among the 6,810 children eligible for anthropometric measurement, 92 percent had complete and valid anthropometric and age data. Seven percent of children could not be measured either because they were not at home at the time of the survey, they refused to be measured, or the mother refused to allow the child to be measured. In some cases, measurements were not taken if the child was too sick. However, the data are unlikely to be biased, since the proportion with missing information on anthropometry is relatively uniform across age groups and other background characteristics. In addition, 1 percent of children had measures considered to be out of range for their ages. Therefore, the anthropometric data in the tables are based on 6,368 children (5,851 weighted children).
11.1.3 Levels of Child Malnutrition
Chronic malnutrition among Jordanian children is relatively low. Eight percent of children are stunted or chronically malnourished (height-for-age below -2 SD), of whom one in four (2 percent) are severely stunted (Table 11.1). As Figure 11.1 shows, stunting levels increase rapidly with age, from only 9 percent among children less than six months of age to 13 percent among children age 18-23 months. After 23 months of age, the level of stunting declines linearly to 5 percent among children age 48-59 months. Male children are more likely to be stunted (9 percent) than female children (6 percent). Children born less than 48 months apart (9-10 percent) are more likely to be stunted than first births (6 percent) and children born after an interval of 48 months or longer (5 percent). Children who were considered by the mother to be very small (19 percent) or small (13 percent) at birth were two to three times more likely to be stunted as children who were average or larger (6 percent).
Table 11.1 shows that stunting is not strongly associated with urban-rural residence. Children from the South (12 percent) are more likely to be chronically malnourished than children from the North (7 percent) and Central (8 percent) regions. More children who live in Badia areas (12 percent) are stunted than children who live in other areas (7 percent). There are small differences in stunting by residence in camp areas. The prevalence of stunting ranges from 5 percent in the Madaba, Irbid, and Ajloun governorates to 19 percent in Ma’an. Mother’s education has a positive relationship with children’s nutritional status, with 5 percent of children of highly educated mothers stunted compared with 12 percent of children of mothers with elementary or no education. The relationship between stunting and household wealth is mixed. However, the data show that children who live in the poorest households (14 percent) are seven times as likely to be stunted as children who live in the richest households (2 percent). There is no clear pattern between stunting and either mother’s interview status or mother’s nutritional status.

146 • Nutritional Status and Prevalence of Anemia
Table 11.1 Nutritional status of children
Percentage of children under five years classified as malnourished according to three anthropometric indices of nutritional status: height-for-age, weight-for-height, and weight-for-age, by background characteristics, Jordan 2012
Background characteristic
Height-for-age1 Weight-for-height Weight-for-age
Number of
children
Percent-age
below -3 SD
Percent-age
below -2 SD2
Mean Z-score
(SD)
Percent-age
below -3 SD
Percent-age
below -2 SD2
Percent-age
above +2 SD
Mean Z-score
(SD)
Percent-age
below -3 SD
Percent-age
below -2 SD2
Percent-age
above +2 SD
Mean Z-score
(SD)
Age in months <6 1.6 8.6 -0.1 2.3 5.0 13.1 0.3 1.6 4.8 1.2 0.0 482 6-8 0.4 5.6 0.1 1.0 3.0 6.0 0.2 0.7 1.0 2.0 0.1 221 9-11 0.3 9.3 -0.1 0.1 0.7 2.6 0.2 0.2 0.3 5.2 0.1 274 12-17 0.6 7.8 -0.1 0.9 2.4 6.2 0.3 1.4 3.3 5.6 0.2 608 18-23 3.9 13.1 -0.6 0.1 1.0 4.2 0.3 0.2 5.0 2.1 -0.1 599 24-35 2.2 8.8 -0.5 0.6 1.5 3.1 0.2 0.3 3.0 0.7 -0.1 1,159 36-47 0.7 6.3 -0.5 0.1 2.8 2.4 0.1 0.1 3.0 0.8 -0.2 1,260 48-59 1.2 5.0 -0.5 0.4 2.8 3.6 -0.0 0.3 2.2 1.1 -0.3 1,248
Sex Male 1.6 9.2 -0.4 0.4 2.4 5.1 0.2 0.4 3.3 2.3 -0.1 3,006 Female 1.3 6.1 -0.4 0.8 2.5 3.6 0.1 0.6 2.7 1.2 -0.1 2,846
Birth interval in months3 First birth4 1.4 6.0 -0.3 0.3 2.2 4.6 0.2 0.2 2.6 1.5 -0.0 1,303 <24 1.7 9.0 -0.5 0.5 3.0 4.5 0.1 0.9 4.2 1.5 -0.2 1,448 24-47 1.8 9.5 -0.4 0.8 2.3 4.5 0.2 0.4 2.8 2.1 -0.1 1,877 48+ 0.7 4.8 -0.3 0.3 2.0 4.0 0.2 0.2 2.1 1.8 -0.0 1,126
Size at birth3 Very small 4.1 18.7 -0.9 1.8 7.0 1.4 -0.2 2.5 9.8 0.9 -0.6 322 Small 1.1 13.1 -0.7 0.3 3.4 3.1 -0.0 0.4 4.8 0.5 -0.5 768 Average or larger 1.3 6.0 -0.3 0.5 1.9 4.9 0.2 0.3 2.2 2.0 -0.0 4,661
Mother's interview status Interviewed 1.5 7.7 -0.4 0.5 2.4 4.4 0.2 0.4 3.0 1.7 -0.1 5,754 Not interviewed but
in household (0.5) (6.2) -0.6 (5.9) (6.5) (3.1) -0.1 (4.2) (6.5) (3.1) -0.4 50 Not interviewed and
not in the house-hold5 1.4 6.6 -0.6 0.6 0.9 2.4 0.3 0.0 3.3 0.0 -0.1 47
Mother's nutritional status6 Thin (BMI < 18.5) 3.3 8.6 -0.7 0.2 7.9 4.7 (0.4) 0.2 3.8 0.3 -0.6 126 Normal (BMI 18.5-
24.9) 1.3 9.1 -0.4 1.0 3.3 2.9 0.0 0.7 3.6 1.3 -0.2 1,901 Overweight/ obese
(BMI ≥ 25) 1.5 6.9 -0.4 0.3 1.7 5.2 0.3 0.3 2.6 2.1 -0.0 3,735
Residence Urban 1.3 7.4 -0.4 0.6 2.5 4.1 0.1 0.5 3.2 1.7 -0.1 4,737 Rural 2.3 8.9 -0.5 0.5 2.0 5.7 0.3 0.6 2.1 1.7 -0.1 1,114
Region Central 1.3 7.5 -0.4 0.7 2.7 4.2 0.1 0.5 3.2 1.6 -0.1 3,472 North 1.3 6.7 -0.4 0.4 2.0 3.7 0.2 0.4 2.5 1.6 -0.1 1,813 South 2.9 12.1 -0.6 0.6 2.0 7.7 0.4 0.5 3.4 3.1 -0.1 567
Continued…

Nutritional Status and Prevalence of Anemia • 147
Table 11.1—Continued
Percentage of children under five years classified as malnourished according to three anthropometric indices of nutritional status: height-for-age, weight-for-height, and weight-for-age, by background characteristics, Jordan 2012
Background characteristic
Height-for-age1 Weight-for-height Weight-for-age
Number of
children
Percent-age
below -3 SD
Percent-age
below -2 SD2
Mean Z-score
(SD)
Percent-age
below -3 SD
Percent-age
below -2 SD2
Percent-age
above +2 SD
Mean Z-score
(SD)
Percent-age
below -3 SD
Percent-age
below -2 SD2
Percent-age
above +2 SD
Mean Z-score
(SD)
Governorate Amman 1.2 7.1 -0.3 0.7 2.9 4.4 0.2 0.6 3.3 1.4 -0.1 2,038 Balqa 0.9 5.6 -0.4 1.5 3.3 4.5 0.2 0.6 3.0 1.7 -0.1 395 Zarqa 2.1 9.8 -0.5 0.3 2.1 3.5 0.1 0.3 3.5 1.7 -0.3 879 Madaba 0.4 4.5 -0.2 0.4 2.0 6.2 0.3 0.0 1.6 2.7 0.1 160 Irbid 0.8 5.1 -0.2 0.5 2.2 2.9 0.1 0.3 2.3 1.6 -0.1 1,080 Mafraq 2.2 10.4 -0.7 0.0 0.9 4.3 0.3 0.5 2.3 0.9 -0.2 369 Jarash 2.5 9.2 -0.5 0.4 3.0 4.6 0.2 0.5 3.8 2.2 -0.1 217 Ajloun 0.8 4.6 -0.4 0.7 1.2 6.0 0.3 0.4 1.9 2.5 -0.0 146 Karak 3.2 11.1 -0.5 0.2 1.5 8.9 0.4 0.4 2.7 2.9 -0.0 257 Tafiela 0.5 9.9 -0.4 1.6 2.7 6.0 0.2 1.0 3.1 3.7 -0.1 98 Ma'an 3.8 18.5 -0.9 0.7 3.2 4.5 0.2 0.4 6.2 1.4 -0.4 105 Aqaba 3.3 10.4 -0.5 0.3 1.0 9.8 0.4 0.4 2.6 5.0 0.0 107
Badia Badia 3.2 11.8 -0.8 0.2 2.6 4.7 0.1 0.4 2.9 0.7 -0.3 468 Non Badia 1.3 7.3 -0.4 0.6 2.4 4.4 0.2 0.5 3.0 1.8 -0.1 5,383
Camps Camp 2.0 9.6 -0.6 0.7 3.2 2.5 0.0 0.7 4.2 0.9 -0.3 245 Non camp 1.4 7.6 -0.4 0.6 2.4 4.5 0.2 0.5 2.9 1.8 -0.1 5,606
Mother's education7 No education 2.2 11.7 -1.0 1.4 4.5 3.2 0.1 0.6 6.7 0.7 -0.5 103 Elementary 2.8 12.0 -0.7 0.3 0.6 4.8 0.3 0.4 2.7 0.7 -0.2 386 Preparatory 2.4 10.9 -0.6 0.3 1.8 3.1 0.1 0.2 4.0 1.1 -0.3 765 Secondary 1.2 8.0 -0.4 0.6 3.4 3.7 0.1 0.7 3.8 1.7 (0.1) 2,774 Higher 1.1 4.7 -0.2 0.6 1.5 6.1 0.2 0.3 1.2 2.4 0.1 1,777
Wealth quintile Lowest 3.4 13.8 -0.8 0.6 3.0 4.7 0.1 1.2 5.2 1.7 -0.3 1,373 Second 1.2 7.0 -0.4 0.7 2.6 3.3 0.2 0.3 2.8 1.4 -0.1 1,321 Middle 0.7 6.2 -0.4 0.2 1.7 3.3 0.1 0.2 2.3 1.4 -0.1 1,311 Fourth 1.2 6.8 -0.2 0.8 2.1 4.8 0.2 0.6 3.2 2.8 0.0 1,060 Highest 0.2 1.8 0.0 0.7 2.5 6.9 0.2 0.0 0.4 1.6 0.2 787
Total 1.5 7.7 -0.4 0.6 2.4 4.4 0.2 0.5 3.0 1.7 -0.1 5,851
Note: Table is based on children who stayed in the household on the night before the interview. Each of the indices is expressed in standard devia-tion units (SD) from the median of the WHO Child Growth Standards adopted in 2006. The indices in this table are NOT comparable to those based on the previously used 1977 NCHS/CDC/WHO reference. Table is based on children with valid dates of birth (month and year) and valid measurement of both height and weight. Figures in parentheses are based on 25-49 unweighted cases. 1 Recumbent length is measured for children under age 2, or in the few cases when the age of the child is unknown and the child is less than 85 cm; standing height is measured for all other children. 2 Includes children who are below -3 standard deviations (SD) from the WHO Child Growth Standards population median. 3 Excludes children whose mothers were not interviewed. 4 First-born twins (triplets, etc.) are counted as first births because they do not have a previous birth interval. 5 Includes children whose mothers are deceased. 6 Excludes children whose mothers were not weighed and measured, and children whose mothers are pregnant or gave birth within the preceding 2 months. Mother's nutritional status in terms of BMI (body mass index) is presented in Table 11.9. 7 For women who are not interviewed, information is taken from the Household Questionnaire. Excludes children whose mothers are not listed in the Household Questionnaire.

148 • Nutritional Status and Prevalence of Anemia
Two percent of children under age five are wasted (weight-for-height below -2 SD) and less than 1 percent are severely wasted. The proportion wasted is highest among children under age six months (5 percent) (Figure 11.1). There is little difference in the level of wasting by sex or birth interval. Wasting is higher among children perceived to be very small (7 percent) at birth than children who are small (3 percent) or average or larger (2 percent). Children born to mothers who are thin (BMI < 18.5) are more likely to be wasted than those born to mothers who are overweight/obese (BMI ≥ 25). Wasting among children does not vary markedly by any place of residence. The relationship between wasting and mother’s education and wealth quintile is mixed.
Four percent of children are overweight (weight-for-height above +2 SD), with children under age six months much more likely to be overweight (13 percent) than children in the other age groups (2-6 percent). Children who are perceived to have been average or larger at birth are more likely to be overweight (5 percent) than children who were small (3 percent) or very small (1 percent) at birth. There is no clear pattern between mother’s nutritional status and overweight children. Children from the South (8 percent) are more likely to be overweight than children from the North and Central regions (4 percent each). The percentage of children overweight ranges from 10 percent in Aqaba to 3 percent in Irbid.
Three percent of children are underweight (weight-for-age below -2 SD), and less than 1 percent are severely underweight. Differentials by background characteristics are very similar to those discussed for stunting.
Figure 11.1
Nutritional status of children by age
0
2
4
6
8
10
12
14
16
18
0 2 4 6 8 10 12 14 16 18 20 22 24 26 28 30 32 34 36 38 40 42 44 46 48 50 52 54 56 58
Percentage
Age (months)
Stunted Wasted Underweight
Note: Stunting reflects chronic malnutrition; wasting reflects acute malnutrition; underweight reflects chronic or acute malnutrition or a combination of both. Plotted values are smoothed by a five-month moving average. JPFHS 2012

Nutritional Status and Prevalence of Anemia • 149
11.1.4 Trends in Children’s Nutritional Status
The nutritional status among children can be compared over the last decade from data collected in the 2002, 2009, and 2012 JPFHS surveys. For comparison purposes in this section, data from the 2002 JPFHS were recalculated according to the new reference population. Figure 11.2 presents the prevalence of stunting, wasting, and underweight in 2002, 2009, and 2012 according to the WHO Child Growth Standards. Stunting has declined in the last decade from 12 percent of children under five years to 8 percent. This decline was more obvious between the 2002 and 2009 surveys, with the changes in the last three years minimal. There has been very little change in the percentage of children wasted in the last decade. A similar pattern is seen in the percentage of children underweight.
Figure 11.2
Trends in nutritional status of children under age five, 2002, 2009, and 2012
11.2 BREASTFEEDING AND COMPLEMENTARY FEEDING
Breastfeeding and complementary feeding behaviors are important predictors of infant and child nutrition, health, and survival. Poor nutritional status has been shown to increase the risk of illness and death among children. Breastfeeding practices also have an effect on the mother’s fertility. A well-documented effect of exclusive breastfeeding of sufficient intensity and duration is delayed return to ovulation, resulting in longer birth intervals and lower fertility, which is strongly related to infant and child survival.
11.2.1 Initiation of Breastfeeding
Breast milk is the most desirable source of nutrients for infants. Breastfeeding provides a complete source of nutrition for the first six months of life, half of all requirements in the second six months of life, and one-third of requirements in the second year of life. The attributes of breast milk go beyond its nutrient content, as it offers the infant unsurpassed protection against infection. Colostrum, a pre-milk substance containing antibodies and white cells from the mother’s blood, is produced during the first two to three days of lactation. Colostrum contains maternal immune factors and helps protect the newborn infant from infections. There is evidence that links having been breastfed as a child with stronger intellectual
12
2
4
8
22
8
23
Stunting (height-for-age)
Wasting(weight-for-height)
Underweight(weight-for-age)
Percentage
2002 2009 2012
Note: The data for all three surveys are based on the WHO Child Growth Standards adopted in 2006. JPFHS 2012

150 • Nutritional Status and Prevalence of Anemia
development and a reduced risk of cancer, obesity, and several chronic diseases. The early initiation of breastfeeding is also beneficial for the mother since it stimulates breast milk production and causes the uterus to retract, which reduces postpartum blood loss. Furthermore, women who breastfeed have a reduced risk of ovarian cancer and premenopausal breast cancer (Administrative Committee on Coordination/Subcommittee on Nutrition [ACC/SCN], 2000).
Table 11.2 shows that breastfeeding is common in Jordan. Among children born in the two years preceding the survey, 93 percent were breastfed. There are small differences in the percentage of infants ever breastfed by sex, residence, and household wealth. Children of mothers with elementary education are less likely to be breastfed (83 percent) compared to children of mothers with no education (96 percent).
Nineteen percent of children began breastfeeding within an hour after delivery, and two-thirds (67 percent) of infants were breastfed within the first day. Children in the South are relatively more likely to be breastfed within one hour of birth (26 percent) than children in the Central and North regions (18 percent each). The proportions of children breastfed within one hour and one day of birth decline as mother’s education and wealth quintile increase.
The percentages breastfed within one hour of birth and one day of birth are much lower in 2012 than in 2007. This could be attributed to the fact that recall in the 2012 survey was presumably better since it was restricted to the two years preceding the survey in contrast to five years in 2007. In addition, in the 2012 survey the timing of breastfeeding was based on all last-born children in contrast to 2007, when this percentage was restricted to last-born children ever breastfed.
Prelacteal feeding is the practice of giving other liquids to a child during the period after birth before the mother’s milk is flowing freely. Table 11.2 shows that a total of 67 percent of children who were ever breastfed received a prelacteal feed. The proportion of infants receiving a prelacteal feed is higher in rural areas (72 percent) than in urban areas (66 percent), the South region (74 percent) compared with the Central and North regions (66-67 percent), and in non camp areas (67 percent) than in camps (59 percent). Prelacteal feeding varies from a low of 58 percent in Ajloun to a high of 79 percent in Karak. Also, the proportion receiving a prelacteal feed is highest among infants born to mothers with higher education (75 percent) and mothers living in the wealthiest quintile of households (80 percent).

Nutritional Status and Prevalence of Anemia • 151
Table 11.2 Initial breastfeeding
Among last-born children who were born in the two years preceding the survey, the percentage who were ever breastfed and the percentages who started breastfeeding within one hour and within one day of birth, and among last-born children born in the two years preceding the survey who were ever breastfed, the percentage who received a prelacteal feed, by background characteristics, Jordan 2012
Background characteristic
Among last-born children born in the past two years:
Among last-born children born in the past two years who were ever breastfed:
Percentage ever breastfed
Percentage who started
breastfeeding within 1 hour
of birth
Percentage who started
breastfeeding within 1 day
of birth1
Number of last-born chil-
dren
Percentage who received a prelacteal
feed2
Number of last-born chil-
dren ever breastfed
Sex Male 93.3 18.9 66.7 1,901 65.1 1,775Female 92.8 18.1 68.2 1,587 69.3 1,472
Residence Urban 92.9 17.9 67.0 2,796 65.8 2,597Rural 93.9 21.1 68.8 692 71.8 650
Region Central 92.3 17.5 63.8 2,144 66.2 1,978North 95.0 18.4 74.7 1,013 66.5 962South 92.5 26.0 67.9 331 73.7 306
Governorate Amman 91.3 16.6 64.0 1,318 65.7 1,204Balqa 93.7 20.3 64.3 257 62.1 241Zarqa 93.9 20.0 63.6 470 67.8 442Madaba 93.0 9.8 61.4 99 76.5 92Irbid 94.4 19.5 75.2 601 65.2 567Mafraq 96.7 15.8 72.3 203 70.7 197Jarash 94.2 18.8 74.7 123 71.8 116Ajloun 95.9 16.1 77.5 86 58.4 82Karak 89.8 28.2 64.0 143 78.7 129Tafiela 94.2 25.4 71.9 54 75.7 51Ma'an 94.3 23.9 77.1 62 64.2 59Aqaba 95.2 23.7 64.7 71 70.7 68
Badia Badia 96.3 24.6 70.1 293 66.0 282Non Badia 92.8 18.0 67.1 3,196 67.1 2,965
Camps Camp 94.7 20.6 75.6 130 58.6 124Non camp 93.0 18.5 67.1 3,358 67.4 3,123
Mother's education No education 95.6 24.9 81.4 57 65.0 55Elementary 82.8 25.0 59.3 202 62.5 167Preparatory 93.2 18.6 69.5 464 60.7 432Secondary 93.8 19.6 70.8 1,603 63.8 1,503Higher 93.7 15.6 62.6 1,162 74.7 1,089
Wealth quintile Lowest 92.9 21.2 70.5 780 60.9 725Second 95.1 24.5 75.8 773 61.2 736Middle 92.7 16.6 63.7 740 67.2 686Fourth 92.4 14.4 67.9 680 71.0 629Highest 91.7 13.8 54.6 514 80.0 471
Total 93.1 18.6 67.4 3,488 67.0 3,247
Note: Table is based on last-born children born in the two years preceding the survey regardless of whether the children are living or dead at the time of interview. 1 Includes children who started breastfeeding within one hour of birth. 2 Children given something other than breast milk during the first three days of life.
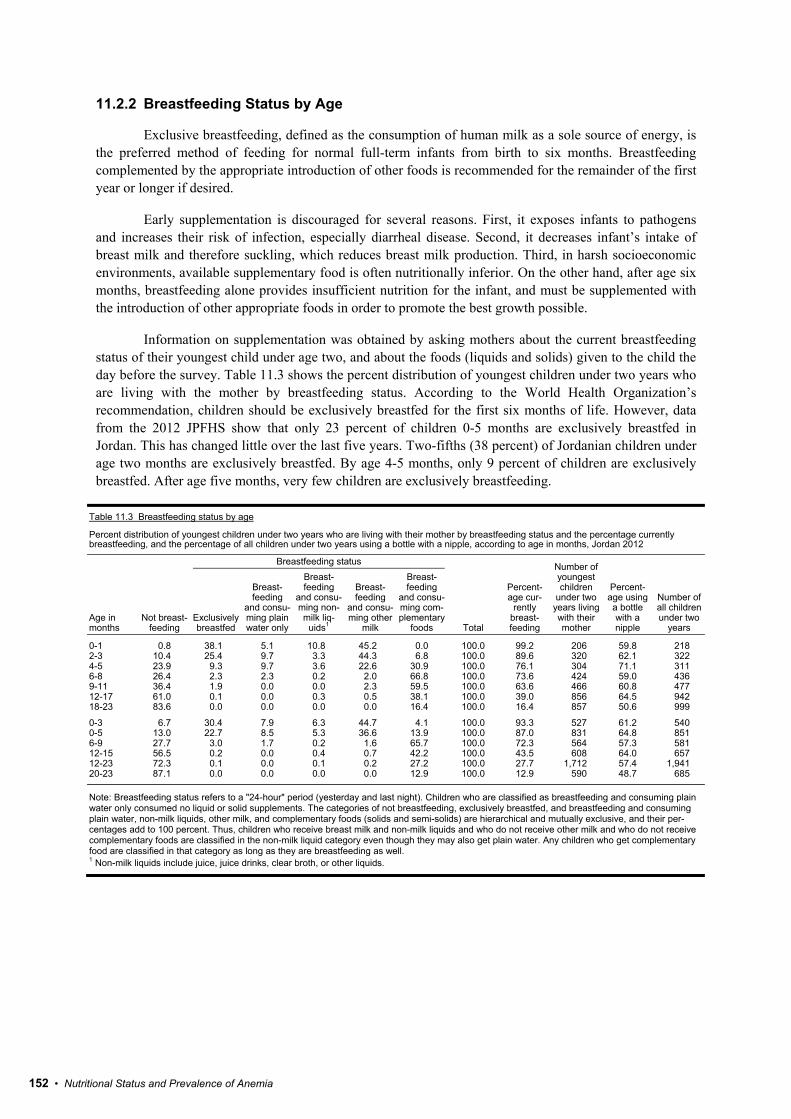
152 • Nutritional Status and Prevalence of Anemia
11.2.2 Breastfeeding Status by Age
Exclusive breastfeeding, defined as the consumption of human milk as a sole source of energy, is the preferred method of feeding for normal full-term infants from birth to six months. Breastfeeding complemented by the appropriate introduction of other foods is recommended for the remainder of the first year or longer if desired.
Early supplementation is discouraged for several reasons. First, it exposes infants to pathogens and increases their risk of infection, especially diarrheal disease. Second, it decreases infant’s intake of breast milk and therefore suckling, which reduces breast milk production. Third, in harsh socioeconomic environments, available supplementary food is often nutritionally inferior. On the other hand, after age six months, breastfeeding alone provides insufficient nutrition for the infant, and must be supplemented with the introduction of other appropriate foods in order to promote the best growth possible.
Information on supplementation was obtained by asking mothers about the current breastfeeding status of their youngest child under age two, and about the foods (liquids and solids) given to the child the day before the survey. Table 11.3 shows the percent distribution of youngest children under two years who are living with the mother by breastfeeding status. According to the World Health Organization’s recommendation, children should be exclusively breastfed for the first six months of life. However, data from the 2012 JPFHS show that only 23 percent of children 0-5 months are exclusively breastfed in Jordan. This has changed little over the last five years. Two-fifths (38 percent) of Jordanian children under age two months are exclusively breastfed. By age 4-5 months, only 9 percent of children are exclusively breastfed. After age five months, very few children are exclusively breastfeeding.
Table 11.3 Breastfeeding status by age
Percent distribution of youngest children under two years who are living with their mother by breastfeeding status and the percentage currently breastfeeding, and the percentage of all children under two years using a bottle with a nipple, according to age in months, Jordan 2012
Age in months
Not breast- feeding
Breastfeeding status
Total
Percent- age cur-
rently breast- feeding
Number of youngest children
under two years living with their mother
Percent- age using a bottle with a nipple
Number of all children under two
years Exclusively breastfed
Breast- feeding
and consu- ming plain water only
Breast- feeding
and consu- ming non- milk liq-
uids1
Breast- feeding
and consu- ming other
milk
Breast- feeding
and consu- ming com-plementary
foods
0-1 0.8 38.1 5.1 10.8 45.2 0.0 100.0 99.2 206 59.8 2182-3 10.4 25.4 9.7 3.3 44.3 6.8 100.0 89.6 320 62.1 3224-5 23.9 9.3 9.7 3.6 22.6 30.9 100.0 76.1 304 71.1 3116-8 26.4 2.3 2.3 0.2 2.0 66.8 100.0 73.6 424 59.0 4369-11 36.4 1.9 0.0 0.0 2.3 59.5 100.0 63.6 466 60.8 47712-17 61.0 0.1 0.0 0.3 0.5 38.1 100.0 39.0 856 64.5 94218-23 83.6 0.0 0.0 0.0 0.0 16.4 100.0 16.4 857 50.6 999
0-3 6.7 30.4 7.9 6.3 44.7 4.1 100.0 93.3 527 61.2 5400-5 13.0 22.7 8.5 5.3 36.6 13.9 100.0 87.0 831 64.8 8516-9 27.7 3.0 1.7 0.2 1.6 65.7 100.0 72.3 564 57.3 58112-15 56.5 0.2 0.0 0.4 0.7 42.2 100.0 43.5 608 64.0 65712-23 72.3 0.1 0.0 0.1 0.2 27.2 100.0 27.7 1,712 57.4 1,94120-23 87.1 0.0 0.0 0.0 0.0 12.9 100.0 12.9 590 48.7 685
Note: Breastfeeding status refers to a "24-hour" period (yesterday and last night). Children who are classified as breastfeeding and consuming plain water only consumed no liquid or solid supplements. The categories of not breastfeeding, exclusively breastfed, and breastfeeding and consuming plain water, non-milk liquids, other milk, and complementary foods (solids and semi-solids) are hierarchical and mutually exclusive, and their per-centages add to 100 percent. Thus, children who receive breast milk and non-milk liquids and who do not receive other milk and who do not receive complementary foods are classified in the non-milk liquid category even though they may also get plain water. Any children who get complementary food are classified in that category as long as they are breastfeeding as well. 1 Non-milk liquids include juice, juice drinks, clear broth, or other liquids.

Nutritional Status and Prevalence of Anemia • 153
The table shows that more than one-third (37 percent) of children under age six months breastfeed and also consume other milk (e.g., fresh milk or powdered milk), 9 percent of children consume plain water and breast milk, and 14 percent are given complementary food in addition to breast milk. Two-thirds (67 percent) of children are breastfeeding and consuming complementary food at 6-8 months. By 18-23 months, only 16 percent of children are still breastfeeding.
Bottle-feeding is discouraged for very young children. It is usually associated with increased risk of illness, especially diarrheal disease, because of difficulty in sterilizing the nipples properly. Bottle-feeding also shortens the period of postpartum amenorrhea and increases the risk of pregnancy. As seen in Table 11.3, the practice of bottle-feeding with a nipple is prevalent in 60 percent of children under age two months. Bottle-feeding peaks at 71 percent among children age 4-5 months.
Since 2002, infant feeding practices have worsened (Figure 11.3). The proportion of children 0-5 months of age not breastfed has slightly increased (from 10 percent in 2002 to 13 percent in 2012); exclusive breastfeeding (as recommended) has decreased (from 27 to 23 percent); and use of a bottle with a nipple has increased (from 40 to 65 percent). Similarly, the proportion of children 6-9 months of age not breastfed has slightly increased (from 24 to 28 percent), and the percentage of breastfed children receiving complementary food (as recommended) has decreased (from 70 to 66 percent).
Figure 11.3
Breastfeeding Status, 2002, 2007, 2012
13
23
65
28
66
11
22
48
26
66
10
27
40
24
70
Not breastfed
Exclusively breastfed
Using bottle with nipple
Not breastfed
Breastfed and receiving complementary foods
2002 2007 2012JPFHS 2012
(6-9 months)
(6-9 months)
(0-5 months)
(0-5 months)
(0-5 months)

154 • Nutritional Status and Prevalence of Anemia
11.2.3 Duration of Breastfeeding
Table 11.4 provides information on the median duration of any breastfeeding, exclusive breastfeeding, and predominant breastfeeding among children born in the three years preceding the survey. Estimates of the mean and median duration of breastfeeding are based on current status data, that is, the proportion of children under three years who were being breastfed at the time of the survey.
Table 11.4 Median duration of breastfeeding
Median duration of any breastfeeding, exclusive breastfeeding, and predominant breastfeeding among children born in the three years preceding the survey, by background characteristics, Jordan 2012
Background characteristic
Median duration (months) of breastfeeding among children born in the past three years1
Any breastfeeding
Exclusive breastfeeding
Predominant breastfeeding2
SexMale 11.6 0.6 0.7Female 11.9 0.6 1.5
Residence Urban 11.7 0.6 0.7Rural 11.8 0.7 1.5
Region Central 12.1 0.6 1.0North 11.7 0.6 0.7South 9.4 0.5 0.6
Governorate Amman 11.6 0.6 1.0Balqa 12.7 0.6 0.7Zarqa 12.9 0.7 1.4Madaba 10.6 0.6 0.6Irbid 11.3 0.5 0.7Mafraq 12.8 0.8 1.4Jarash 12.5 0.5 0.6Ajloun 10.1 1.6 2.1Karak 7.1 0.5 0.5Tafiela 12.0 0.5 0.7Ma'an 8.9 0.6 0.8Aqaba 10.9 0.9 1.0
Badia Badia 12.7 0.9 1.6Non Badia 11.7 0.6 0.7
Camps Camp 13.4 0.6 0.7Non camp 11.7 0.6 0.8
Mother's education No education 13.4 1.8 4.8Elementary 11.2 0.5 0.5Preparatory 12.6 0.9 2.3Secondary 12.9 0.6 0.7Higher 10.5 0.5 0.7
Wealth quintile Lowest 12.7 0.5 0.6Second 12.2 0.7 1.9Middle 10.1 0.6 0.7Fourth 12.3 0.6 1.4Highest 9.2 0.6 0.6
Total 11.7 0.6 0.8
Mean for all children 12.5 2.1 2.9
Note: Median and mean durations are based on the distributions at the time of the survey of the proportion of births by months since birth. Includes children living and deceased at the time of the survey. 1 It is assumed that non-last-born children and last-born children not currently living with the mother are not currently breastfeeding. 2 Either exclusively breastfed or received breast milk and plain water and/or non-milk liquids only

Nutritional Status and Prevalence of Anemia • 155
The median duration of any breastfeeding in Jordan is 11.7 months, which is lower than the median in 2007 (12.5 months). The mean duration of breastfeeding in 2012 for all children is 12.5 months. There are no differences in the duration of breastfeeding by sex of the child and urban-rural residence. The median duration of breastfeeding varies by governorates from a low of 7.1 months in Karak to a high of 12.9 months in Zarqa. The relationship between the median duration of breastfeeding and mother’s education and household wealth is mixed. The median duration of exclusive breastfeeding is 0.6 months.
Predominant breastfeeding is defined as exclusive breastfeeding or breastfeeding in combination with plain water, water-based liquids, or juices. The median duration of predominant breastfeeding is 0.8 months, lower than in 2007 (1.7 months).
11.2.4 Types of Complementary Foods
Information on the types of food given to children under age two in the 24 hours preceding the survey, according to breastfeeding status, is shown in Table 11.5. In Jordan, the introduction of other liquids such as water, juice, and formula takes place earlier than the recommended age of about six months. Even among the youngest breastfed children (under age two months), almost one in two (45 percent) children receive milk other than breast milk and one in five (19 percent) consumes other liquids.
WHO recommends the introduction of solid food to infants around age six months because by that age breast milk by itself is no longer sufficient to maintain a child’s optimal growth. However, in Jordan, breastfed children consume breads, cereals, grains, and semi-solid or solid types of foods early in life. Among infants age 4-5 months, 41 percent consume solid or semi-solid food. The percentage of children who are fed solid or semi-solid food increases rapidly to 91 percent at 6-8 months. Among children who are not breastfed, nearly two-thirds (65 percent) receive solid or semi-solid food by the age of 4-5 months.
Overall, 45 percent of breastfed children under two years of age consume foods made with grain; 20 percent receive meat, fish, and poultry; and 21 percent receive eggs. In comparison, the percentage of children consuming roots, tubers, legumes and nuts, and fruits and vegetables rich in vitamin A is much lower.
11.3 APPROPRIATE INFANT AND YOUNG CHILD FEEDING (IYCF) PRACTICES
Breastfed children age 6-23 months should receive animal-source foods and vitamin A-rich fruits and vegetables daily (PAHO/WHO, 2003). Since first foods almost universally include a grain- or tuber-based staple, it is unlikely that young children who eat two or fewer food groups will receive both an animal-source food and a vitamin A-rich fruit or vegetable. Therefore, four food groups are considered as the minimum acceptable number of food groups for breastfed infants (Arimond and Ruel, 2003). Breastfed infants age 6-8 months should be fed meals of complementary foods two to three times per day, with one to two snacks as desired; breastfed children 9-23 months should be fed meals three to four times per day, with one to two snacks (WHO, 2008).
Nonbreastfed children age 6-23 months should receive milk products at least twice a day to ensure their calcium needs are met. In addition, they also need animal-source foods and vitamin A-rich fruits and vegetables. Therefore, four food groups are considered as a minimum acceptable number of food groups for nonbreastfed young children. Nonbreastfed children should be fed meals four to five times per day, with one to two snacks as desired (WHO, 2005). Meal frequency is considered a proxy for energy intake from foods other than breast milk; therefore, the feeding frequency indicator for nonbreastfed children includes both milk feeds and solid/semi-solid feeds (WHO, 2008). Table 11.6 shows the percentage of breastfed children who were fed from at least four food groups and who were fed at least the minimum number of times for their age (i.e., at least twice for infants 6-8 months and at least three times for children 9-23 months). Among breastfed children age 6-23 months, 43 percent were given foods from four or more food groups in the 24 hours preceding the survey. The percentage of children given foods from four or more food groups increases with age from 17 percent among those age 6-8 months to 70 percent among

156 • Nutritional Status and Prevalence of Anemia
those age 18-23 months. Two in five (39-40 percent) children residing in the North and South regions were given foods from four or more food groups, compared with 46 percent of children living in the Central region. Children living in Amman and Aqaba, children in non Badia areas, children of mothers with higher education, and children from the wealthiest households were more likely than their counterparts to receive foods from four or more food groups.
Table 11.5 Foods and liquids consumed by children in the day or night preceding the interview
Percentage of youngest children under two years of age who are living with the mother by type of foods consumed in the day or night preceding the inter-view, according to breastfeeding status and age, Jordan 2012
Age in months
Liquids Solid or semi-solid foods
Any solid or semi-
solid food
Number of chil-dren
Infant formula
Other milk1
Other liquids2
Fortified baby foods
Food made from
grains3
Fruits and
vegeta-bles rich in vita-min A4
Other fruits and
vege- tables
Food made from roots and
tubers
Food made from
legumes and nuts
Meat, fish,
poultry Eggs
Cheese, yogurt, other milk
product BREASTFEEDING CHILDREN
0-1 0.1 45.4 19.3 0.0 0.0 0.0 0.0 0.0 0.0 0.0 0.0 0.0 0.0 2052-3 4.6 52.7 7.4 3.4 0.0 0.2 0.1 0.0 0.0 0.0 0.0 4.1 7.5 2874-5 10.2 48.5 21.5 17.4 7.1 1.0 2.8 2.2 0.3 0.3 3.4 21.4 40.6 2316-8 15.0 41.8 56.2 29.3 55.9 13.7 30.9 19.8 5.8 11.2 22.7 61.8 90.7 3129-11 10.0 45.8 53.8 19.4 75.0 23.1 51.7 26.6 13.9 32.0 35.0 71.1 93.5 29612-17 14.3 38.2 73.0 10.7 84.2 32.2 60.9 29.8 18.7 45.6 38.3 79.3 97.7 33418-23 3.7 52.9 82.8 1.1 85.4 40.6 72.1 41.6 34.0 49.1 46.6 80.2 100.0 140
6-23 11.9 43.2 64.2 17.2 73.7 25.5 51.2 27.6 15.6 32.4 34.0 72.1 94.8 1,083
Total 9.2 45.6 44.6 13.1 45.1 15.4 31.1 16.8 9.4 19.5 20.8 46.6 63.3 1,806
NONBREASTFEEDING CHILDREN
0-1 * * * * * * * * * * * * * 22-3 (1.8) (100.0) (30.3) (0.0) (1.2) (6.8) (0.0) (6.8) (0.0) (0.0) (0.0) (0.0) (9.8) 334-5 20.0 98.2 26.9 23.0 21.1 5.1 10.5 2.7 7.4 1.4 8.1 26.8 64.8 736-8 12.8 95.8 58.4 38.2 49.6 10.5 42.8 22.2 4.7 11.6 16.0 63.6 94.5 1129-11 16.0 95.3 65.8 19.0 79.5 22.8 45.1 29.5 12.1 24.0 30.9 74.8 98.3 17012-17 4.4 94.2 74.2 5.8 87.0 28.5 72.2 31.6 25.7 45.9 41.5 81.2 99.4 52218-23 4.5 79.9 80.6 3.7 89.2 36.7 72.2 31.5 28.4 60.0 47.8 80.6 98.9 716
6-23 6.4 87.7 75.1 8.7 84.5 30.4 67.0 30.7 23.9 47.6 41.4 78.9 98.7 1,520
Total 6.9 88.4 72.0 9.1 79.8 28.7 63.0 28.9 22.7 44.5 39.0 74.9 95.2 1,628
Note: Breastfeeding status and food consumed refer to a “24-hour" period (yesterday and last night). Figures in parentheses are based on 25-49 un-weighted cases. An asterisk indicates that a figure is based on fewer than 25 unweighted cases and has been suppressed. 1 Other milk includes fresh, tinned, and powdered animal milk. 2 Does not include plain water. Includes juice, juice drinks, clear broth, or other non-milk liquids. 3 Includes fortified baby food. 4 Includes pumpkin, carrots, red sweet potatoes, spinach, mouloukia, and other locally grown fruits and vegetables that are rich in vitamin A.

Nut
ritio
nal S
tatu
s an
d P
reva
lenc
e of
Ane
mia
• 1
57
Tabl
e 11
.6 I
nfan
t and
you
ng c
hild
feed
ing
(IYC
F) p
ract
ices
Per
cent
age
of y
oung
est c
hild
ren
age
6-23
mon
ths
livin
g w
ith th
eir m
othe
r who
are
fed
acco
rdin
g to
thre
e IY
CF
feed
ing
prac
tices
bas
ed o
n br
east
feed
ing
stat
us, n
umbe
r of f
ood
grou
ps, a
nd ti
mes
they
are
fed
durin
g th
e da
y or
nig
ht
prec
edin
g th
e su
rvey
, by
back
grou
nd c
hara
cter
istic
s, J
orda
n 20
12
Bac
kgro
und
ch
arac
teris
tic
Am
ong
brea
stfe
d ch
ildre
n 6-
23 m
onth
s, p
erce
ntag
e fe
d:
Am
ong
nonb
reas
tfed
child
ren
6-23
mon
ths,
per
cent
age
fed:
A
mon
g al
l chi
ldre
n 6-
23 m
onth
s, p
erce
ntag
e fe
d:
4+ fo
od
grou
ps1
Min
imum
m
eal f
re-
quen
cy2
Bot
h 4+
food
gr
oups
and
m
inim
um
mea
l fre
-qu
ency
Num
ber o
f br
east
fed
child
ren
6-23
m
onth
s M
ilk o
r milk
pr
oduc
ts3
4+ fo
od
grou
ps1
Min
imum
m
eal f
re-
quen
cy4
With
3 IY
CF
prac
tices
5
Num
ber o
f no
nbre
astfe
d ch
ildre
n 6-
23
mon
ths
Bre
ast m
ilk,
milk
, or m
ilk
prod
ucts
6 4+
food
gr
oups
1
Min
imum
m
eal f
re-
quen
cy7
With
3 IY
CF
prac
tices
Num
ber o
f all
child
ren
6-23
m
onth
s
Ag
e in
mo
nth
s
6-
8
17.4
74.3
16
.931
297
.021
.298
.83.
0 11
299
.218
.480
.813
.242
4 9-
11
41.6
55.4
32
.029
695
.239
.395
.116
.1
170
98.2
40.8
69.9
26.2
466
12-1
7
57.7
62.3
44
.633
493
.065
.594
.134
.2
522
95.7
62.4
81.7
38.3
856
18-2
3
69.6
75.7
56
.814
080
.274
.488
.239
.3
716
83.4
73.6
86.1
42.2
857
Sex
Mal
e
42.1
65.8
34
.660
787
.962
.691
.332
.3
821
93.1
53.9
80.5
33.3
1,42
8 Fe
mal
e
44.6
65.5
34
.947
687
.064
.592
.332
.4
699
92.2
56.4
81.4
33.4
1,17
4
Res
iden
ce
U
rban
43
.765
.0
34.9
875
88.0
65.7
91.6
33.7
1,
211
93.0
56.5
80.4
34.2
2,08
6 R
ural
41
.168
.5
33.9
208
85.6
54.9
92.5
27.0
30
891
.449
.382
.829
.851
7
Reg
ion
Cen
tral
45.9
63.7
36
.565
089
.064
.792
.035
.6
929
93.5
57.0
80.4
36.0
1,57
9 N
orth
39
.069
.6
32.7
346
84.5
63.9
91.0
26.4
43
191
.452
.881
.529
.277
8 S
outh
40
.063
.8
29.3
8686
.855
.392
.429
.4
160
91.4
49.9
82.4
29.3
246
Go
vern
ora
te
A
mm
an
47.1
64.6
36
.636
790
.665
.890
.938
.5
574
94.2
58.5
80.6
37.7
941
Bal
qa
42.2
67.2
33
.879
85.0
57.2
90.6
29.7
11
191
.350
.980
.931
.419
0 Za
rqa
45
.359
.2
37.4
175
85.7
67.9
95.4
31.6
19
792
.457
.378
.434
.337
2 M
adab
a
43.9
70.3
38
.229
93.5
56.4
95.4
30.9
47
95.9
51.7
85.9
33.7
76
Irbid
39
.471
.0
32.8
204
81.8
65.6
88.1
25.3
25
489
.953
.980
.528
.745
8 M
afra
q
32.4
63.3
25
.072
91.2
58.1
94.8
24.2
87
95.2
46.5
80.6
24.5
159
Jara
sh
43.6
71.4
40
.840
82.1
62.4
94.5
30.2
53
89.8
54.3
84.6
34.7
93
Ajlo
un
45.8
72.7
39
.730
90.4
68.3
96.3
33.6
37
94.7
58.2
85.7
36.4
68
Kar
ak
31.6
60.8
23
.729
84.8
52.7
90.2
27.6
78
88.9
47.0
82.3
26.6
106
Tafie
la
39.1
64.9
32
.618
85.8
61.4
90.0
32.5
22
92.2
51.4
78.8
32.5
39
Ma'
an
45.4
66.1
29
.019
92.0
52.9
96.8
25.8
27
95.3
49.8
84.1
27.1
47
Aqa
ba
47.4
64.8
34
.421
87.7
59.1
95.6
34.3
33
92.4
54.6
83.8
34.4
54
Bad
ia
B
adia
32
.759
.0
21.8
9592
.451
.195
.822
.1
130
95.6
43.3
80.3
21.9
225
Non
Bad
ia
44.2
66.3
36
.098
887
.064
.791
.433
.3
1,39
092
.456
.281
.034
.42,
378
Cam
ps
C
amp
40
.164
.4
35.6
4276
.955
.589
.525
.2
5586
.948
.878
.629
.797
N
on c
amp
43
.365
.7
34.7
1,04
187
.963
.891
.932
.6
1,46
592
.955
.381
.033
.52,
505
Con
tinue
d…
Nutritional Status and Prevalence of Anemia • 157

158
• N
utrit
iona
l Sta
tus
and
Pre
vale
nce
of A
nem
ia
Tabl
e 11
.6—
Con
tinue
d
Per
cent
age
of y
oung
est c
hild
ren
age
6-23
mon
ths
livin
g w
ith th
eir m
othe
r who
are
fed
acco
rdin
g to
thre
e IY
CF
feed
ing
prac
tices
bas
ed o
n br
east
feed
ing
stat
us, n
umbe
r of f
ood
grou
ps, a
nd ti
mes
they
are
fed
durin
g th
e da
y or
nig
ht
prec
edin
g th
e su
rvey
, by
back
grou
nd c
hara
cter
istic
s, J
orda
n 20
12
Bac
kgro
und
ch
arac
teris
tic
Am
ong
brea
stfe
d ch
ildre
n 6-
23 m
onth
s, p
erce
ntag
e fe
d:
Am
ong
nonb
reas
tfed
child
ren
6-23
mon
ths,
per
cent
age
fed:
A
mon
g al
l chi
ldre
n 6-
23 m
onth
s, p
erce
ntag
e fe
d:
4+ fo
od
grou
ps1
Min
imum
m
eal f
re-
quen
cy2
Bot
h 4+
food
gr
oups
and
m
inim
um
mea
l fre
-qu
ency
Num
ber o
f br
east
fed
child
ren
6-23
m
onth
s M
ilk o
r milk
pr
oduc
ts3
4+ fo
od
grou
ps1
Min
imum
m
eal f
re-
quen
cy4
With
3 IY
CF
prac
tices
5
Num
ber o
f no
nbre
astfe
d ch
ildre
n 6-
23
mon
ths
Bre
ast m
ilk,
milk
, or m
ilk
prod
ucts
6 4+
food
gr
oups
1
Min
imum
m
eal f
re-
quen
cy7
With
3 IY
CF
prac
tices
Num
ber o
f all
child
ren
6-23
m
onth
s
Mo
ther
's e
du
cati
on
N
o ed
ucat
ion
(1
4.5)
(56.
5)
(12.
6)22
(77.
1)(4
8.8)
(91.
1)(2
0.4)
26
87.5
33.3
75.5
16.9
48
Ele
men
tary
43
.756
.8
27.9
6169
.756
.168
.124
.2
9181
.951
.163
.525
.715
2 P
repa
rato
ry
35.3
56.3
30
.214
481
.852
.792
.725
.0
222
89.0
45.9
78.4
27.0
366
Sec
onda
ry
42.2
64.6
32
.855
088
.665
.992
.932
.3
641
93.9
55.0
79.8
32.5
1,19
1 H
ighe
r 50
.774
.2
43.4
306
92.0
67.0
94.1
37.3
54
094
.961
.186
.939
.584
6
Wea
lth
qu
inti
le
Lo
wes
t 33
.464
.3
26.0
265
80.3
52.7
89.7
17.4
33
289
.044
.178
.521
.259
7 S
econ
d
41.8
61.3
34
.128
983
.959
.487
.727
.1
295
91.9
50.7
74.7
30.5
584
Mid
dle
37
.768
.0
31.2
203
89.0
63.7
93.9
33.0
35
093
.154
.284
.432
.455
2 Fo
urth
55
.067
.2
46.0
206
89.2
70.8
93.0
38.5
30
493
.664
.482
.641
.651
0 H
ighe
st
57.2
72.0
42
.212
097
.373
.995
.050
.6
239
98.2
68.3
87.3
47.8
359
Tota
l 43
.265
.6
34.7
1,08
387
.563
.591
.832
.3
1,52
092
.755
.180
.933
.32,
603
Not
e: F
igur
es in
par
enth
eses
are
bas
ed o
n 25
-49
unw
eigh
ted
case
s.
1 Foo
d gr
oups
: a. i
nfan
t for
mul
a, m
ilk o
ther
than
bre
ast m
ilk, c
hees
e or
yog
urt o
r oth
er m
ilk p
rodu
cts;
b. f
oods
mad
e fro
m g
rain
s, ro
ots,
and
tube
rs, i
nclu
ding
por
ridge
and
forti
fied
baby
food
from
gra
ins;
c. v
itam
in A
-ric
h fru
its a
nd
vege
tabl
es (a
nd re
d pa
lm o
il); d
. oth
er fr
uits
and
veg
etab
les;
e. e
ggs;
f. m
eat,
poul
try, f
ish,
and
she
llfis
h (a
nd o
rgan
mea
ts);
g. le
gum
es a
nd n
uts.
2 F
or b
reas
tfed
child
ren,
min
imum
mea
l fre
quen
cy is
rece
ivin
g so
lid o
r sem
i-sol
id fo
od a
t lea
st tw
ice
a da
y fo
r inf
ants
6-8
mon
ths
and
at le
ast t
hree
tim
es a
day
for c
hild
ren
9-23
mon
ths.
3 In
clud
es tw
o or
mor
e fe
edin
gs o
f com
mer
cial
infa
nt fo
rmul
a; fr
esh,
tinn
ed, a
nd p
owde
red
anim
al m
ilk; a
nd y
ogur
t 4 F
or n
onbr
east
fed
child
ren
age
6-23
mon
ths,
min
imum
mea
l fre
quen
cy is
rece
ivin
g so
lid o
r sem
i-sol
id fo
od o
r milk
feed
s at
leas
t fou
r tim
es a
day
. 5 N
onbr
east
fed
child
ren
age
6-23
mon
ths
are
cons
ider
ed to
be
fed
with
a m
inim
um s
tand
ard
of th
ree
infa
nt a
nd y
oung
chi
ld fe
edin
g pr
actic
es if
they
rece
ive
othe
r milk
or m
ilk p
rodu
cts
at le
ast t
wic
e a
day,
rece
ive
the
min
imum
mea
l fre
quen
cy, a
nd re
ceiv
e so
lid o
r sem
i-sol
id fo
ods
from
at l
east
four
food
gro
ups
not i
nclu
ding
the
milk
or m
ilk p
rodu
cts
food
gro
up.
6 Bre
astfe
edin
g, o
r not
bre
astfe
edin
g an
d re
ceiv
ing
two
or m
ore
feed
ings
of c
omm
erci
al in
fant
form
ula;
fres
h, ti
nned
, and
pow
dere
d an
imal
milk
; and
yog
urt
7 Chi
ldre
n ar
e fe
d th
e m
inim
um re
com
men
ded
num
ber o
f tim
es p
er d
ay a
ccor
ding
to th
eir a
ge a
nd b
reas
tfeed
ing
stat
us a
s de
scrib
ed in
foot
note
s 2
and
4.
158 • Nutritional Status and Prevalence of Anemia

Nutritional Status and Prevalence of Anemia • 159
Sixty-six percent of breastfed children were fed the minimum number of times in the previous 24 hours. The combined percentage of children who fall in both categories (given foods from four or more groups and fed the minimum number of times per day) is 35 percent. The proportion of breastfeeding children age 6-23 months who are given a variety of foods at least three times daily is highest in the Central region, in Jarash, in non Badia areas, and in the fourth wealth quintile. This figure also increases with the mother’s level of education.
The percentages of children who received food from four or more food groups and were fed the minimum number of times are much higher among nonbreastfed children (64 percent and 92 percent, respectively) than among breastfed children. One in three (32 percent) nonbreastfed children was fed in accordance with all three IYCF practices. Nonbreastfed children in urban areas, in the Central region, in Amman, in non Badia areas, and in non camp areas; nonbreastfed children of women with higher education; and those in the highest wealth quintile are more likely to be fed with all three IYCF practices than their counterparts in the other categories.
Ninety-three percent of children age 6-23 months (both breastfed and nonbreastfed) are given either breast milk or other milk products. Fifty-five percent of children are given foods from the appropriate number of food groups, and 81 percent are fed an appropriate number of times per day. Overall, one-third of Jordanian children are fed in accordance with the three recommended IYCF practices. The likelihood of children being fed appropriately increases with mother’s education and wealth quintile.
There have been changes in the definition of the standard IYCF indicators (such as the removal of “foods made with fats” as a food group, the requirement that breastfed children receive four instead of three food groups, the requirement that nonbreastfed children receive two or more servings of milk or milk products, and the removal of cheese from the milk or milk products group) from the 2007 JPFHS, and thus direct comparisons of these indicators are problematic. However, for purposes of comparison, the data were recalculated based on the former IYCF definition, and results indicate that the percentage of children fed in accordance with the recommended three IYCF practices has decreased between 2007 (38 percent) and 2012 (32 percent). However, these results should be interpreted with caution, as they could be influenced by methodological differences in data collection (data not shown).
11.4 PREVALENCE OF ANEMIA IN CHILDREN
Anemia is characterized by a low level of hemoglobin in the blood. Hemoglobin is necessary for transporting oxygen from the lungs to other tissues and organs in the body. Anemia can result from a deficiency of iron, folate, vitamin B12, or some other nutrients. These types of anemia are commonly referred to as iron deficiency anemia and is the most widespread form of malnutrition in the world. Young children and pregnant and postpartum women are the most severely affected because of the high iron demands of infant growth and pregnancy. Anemia can also be the result of hemorrhage and chronic disease, malaria, parasitic infection, or genetic disorders.
Hemoglobin testing is the primary method of anemia diagnosis. The 2012 JPFHS included direct measurement of hemoglobin levels years in two-thirds of the households for children age 6-59 months and all women age 15-49. Hemoglobin measurements were taken in the field using the HemoCue instrument. This methodology utilizes a drop of capillary blood taken from the finger drawn in one continuous process directly into a reagent-coated microcuvette that serves as a blood collection device. Excess blood on the outside of the microcuvette is wiped off and the filled microcuvette is inserted into a cuvette holder of a portable, battery-operated photometer. In less than a minute, hemoglobin concentration is indicated on a digital readout in grams per deciliter. Given that hemoglobin requirements differ substantially depending on altitude, an adjustment to sea-level equivalents was made before classifying children by level of anemia. Table 11.7 reflects anemia levels that have been adjusted for altitude. Levels of anemia were classified as severe, moderate, or mild according to criteria developed by the World Health Organization. Children with a hemoglobin level below 7.0 g/dl are classified as having severe anemia, those with a level

160 • Nutritional Status and Prevalence of Anemia
of 7.0-9.9 g/dl are classified as having moderate anemia, and those with a level of 10.0-10.9 g/dl are classified as having mild anemia.
Table 11.7 Prevalence of anemia in children
Percentage of children age 6-59 months classified as having anemia, by background characteristics, Jordan 2012
Background characteristic
Anemia status by hemoglobin level Any
anemia (<11.0 g/dl)
Mild anemia (10.0-
10.9 g/dl)
Moderate ane-mia
(7.0-9.9 g/dl)
Severe anemia
(< 7.0 g/dl) Number
of children
Age in months 6-8 61.3 34.8 26.1 0.5 2079-11 41.2 24.6 16.7 0.0 26312-17 54.0 29.7 23.9 0.4 57918-23 42.8 24.2 18.3 0.3 55524-35 31.9 20.4 11.4 0.2 1,11936-47 25.8 16.2 9.4 0.3 1,19948-59 17.1 12.2 4.8 0.2 1,196
Sex Male 33.7 19.6 13.8 0.3 2,635Female 31.0 19.9 11.0 0.1 2,484
Mother's interview status Interviewed 32.2 19.8 12.1 0.2 5,019Not interviewed but in household (34.9) (4.6) (30.3) (0.0) 55Not interviewed and not in the
household1 45.9 26.2 19.7 0.0 46
Residence Urban 32.2 19.5 12.5 0.2 4,142Rural 33.0 20.7 12.1 0.2 977
Region Central 32.4 20.0 12.2 0.2 3,014North 32.5 19.7 12.6 0.2 1,603South 31.8 18.4 13.0 0.4 503
Governorate Amman 34.2 22.2 12.0 0.0 1,738Balqa 37.5 20.4 16.0 1.1 341Zarqa 27.4 15.4 11.7 0.3 797Madaba 24.6 16.9 7.5 0.2 138Irbid 34.2 21.0 13.0 0.2 960Mafraq 26.3 16.2 10.0 0.1 325Jarash 31.3 17.7 13.2 0.4 187Ajloun 37.2 21.4 15.6 0.2 131Karak 34.7 19.0 15.1 0.6 224Tafiela 21.9 15.9 5.7 0.3 87Ma'an 38.1 19.8 18.0 0.3 88Aqaba 28.6 17.8 10.5 0.2 104
Badia Badia 39.3 23.5 15.8 0.0 420Non Badia 31.7 19.4 12.1 0.2 4,700
Camps Camp 36.5 21.1 15.3 0.0 222Non camp 32.2 19.7 12.3 0.2 4,897
Mother's education2 No education 35.2 19.8 13.2 2.3 95Elementary 36.2 19.2 16.5 0.5 352Preparatory 37.0 23.0 14.0 0.1 685Secondary 31.3 18.6 12.5 0.2 2,460Higher 30.5 20.1 10.2 0.2 1,481
Wealth quintile Lowest 40.5 24.5 15.5 0.5 1,230Second 30.8 19.9 10.8 0.1 1,174Middle 30.5 18.5 11.8 0.2 1,135Fourth 29.8 18.0 11.6 0.2 970Highest 26.3 14.6 11.7 0.0 610
Total 32.4 19.7 12.4 0.2 5,119
Note: Table is based on children who stayed in the household on the night before the interview and who were tested for anemia. Prevalence of anemia, based on hemoglobin levels, is adjusted for altitude using formulas in CDC, 1998. Hemoglobin is in grams per deciliter (g/dl). Figures in parentheses are based on 25-49 unweighted cases. 1 Includes children whose mothers are deceased. 2 For women who are not interviewed, information is taken from the Household Questionnaire. Excludes children whose mothers are not listed in the Household Questionnaire.

Nutritional Status and Prevalence of Anemia • 161
Eighty-eight percent of eligible children were tested for hemoglobin levels. The remaining eligible children could not be measured for various reasons such as not being available in the household at the time of the interview. Before hemoglobin testing, a separate informed consent statement was read to the child’s mother or caretaker explaining that participation in the hemoglobin testing was completely voluntary. This too could have led to refusals of testing by the mother for her child. In some cases measurements were not taken if the child was too sick. However, because missing information is almost uniform by background characteristics for both children, we can assume that the response rate has not caused any bias in the data. A total of 5,620 children were tested for anemia (5,119 weighted children).
Table 11.7 shows anemia levels for children age 6-59 months. Anemia is common among children in Jordan; one-third (32 percent) of children are anemic. Twenty percent of children are classified as having mild anemia and 12 percent of children have moderate anemia. Less than 1 percent of children are classified as having severe anemia. Among infants, the prevalence of any anemia is highest at age 6-8 months (61 percent), decreases at age 9-11 months (41 percent), and increases at age 12-17 months (54 percent), after which it declines linearly to a low of 17 percent for the age group 48-59 months.
Differences in anemia levels are small between boys and girls, in rural and urban areas, and by region. Prevalence of any anemia varies by governorate from 22 percent in Tafiela to 38 percent in Ma’an. Anemia is more prevalent in Badia and camp areas than in the other areas. The percentage of children with anemia varies with mother’s education from 35-37 percent among mothers with only preparatory education or less to 31 percent among mothers with some secondary or higher education. Similarly, the prevalence of anemia varies inversely with household wealth, decreasing from 41 percent among children in the poorest households to 26 percent among children in the richest households.
Figure 11.4 shows that the overall prevalence of anemia has not changed much in the last decade, decreasing very slightly from 34 percent in 2002 to 32 percent in 2012. However, there are marked improvements by region, particularly in the South region, where the prevalence of any anemia declined by 22 percent in the last three years from 41 percent in 2009 to 32 percent in 2012. A smaller improvement is seen in the prevalence of anemia in the North region, from 36 percent in 2009 to 33 in 2012.
Figure 11.4
Trends in anemia status among children 6-59 months
JPFHS 2012
34
21
13
0.2
34
19
15
0
32
20
12
0.2
Anyanemia
Mildanemia
Moderateanemia
Severe
Percentage
2002 2009 2012
<1 0 <1

162 • Nutritional Status and Prevalence of Anemia
11.5 MICRONUTRIENT INTAKE AMONG CHILDREN
A serious contributor to childhood morbidity and mortality is micronutrient deficiency. Children can receive micronutrients from foods, food fortification, and direct supplementation. Table 11.8 looks at measures relating to the intake of several key micronutrients among children.
Table 11.8 Micronutrient intake among children Among youngest children age 6-23 months who are living with their mother, the percentages who consumed vitamin A-rich and iron-rich foods in the day or night preceding the survey, and among all children 6-59 months, the percentages who were given vitamin A supplements in the six months preceding the survey and who were given iron supplements in the past seven days, by background characteristics, Jordan 2012
Background characteristic
Among youngest children age 6-23 months living with the mother:
Among all children age 6-59 months:
Percentage who consumed foods rich in vitamin A in last 24 hours1
Percentage who consumed foods
rich in iron in last 24 hours2
Number of children
Percentage given vitamin A supplements in last 6 months
Percentage given iron sup-
plements in last 7 days
Number of children
Age in months 6-8 36.9 28.2 424 11.6 1.3 4369-11 58.2 50.3 466 14.0 2.7 47712-17 73.9 65.6 856 16.3 5.4 94218-23 82.3 76.9 857 21.7 7.5 99924-35 na na na 10.0 4.0 1,95036-47 na na na 8.1 3.7 1,96548-59 na na na 6.1 3.1 2,018
Sex Male 67.0 59.8 1,428 10.4 4.2 4,550Female 68.8 61.4 1,174 11.6 4.0 4,235
Breastfeeding status Breastfeeding 59.0 51.6 1,083 14.2 4.8 1,174Not breastfeeding 74.0 66.8 1,520 10.5 4.0 7,611
Mother's age at birth 15-19 65.6 63.3 85 20.3 2.9 12020-29 68.6 61.5 1,279 12.7 4.7 3,73130-39 66.8 58.0 1,042 9.6 3.3 3,97140-49 68.7 66.2 196 8.9 5.3 963
Residence Urban 68.6 61.4 2,086 11.5 4.4 7,171Rural 64.6 56.7 517 8.8 2.5 1,615
Region Central 69.3 60.9 1,579 11.5 4.9 5,362North 64.7 59.9 778 10.2 2.7 2,577South 67.9 59.9 246 10.0 3.0 846
Governorate Amman 71.3 62.3 941 10.9 5.3 3,196Balqa 66.4 58.6 190 19.5 4.7 626Zarqa 65.2 57.4 372 10.1 4.2 1,294Madaba 72.6 65.7 76 6.1 3.5 246Irbid 65.6 62.0 458 10.9 3.0 1,553Mafraq 59.2 53.0 159 10.0 1.8 516Jarash 65.3 59.7 93 11.0 3.5 297Ajloun 69.9 62.6 68 4.8 1.8 211Karak 68.3 62.2 106 12.6 2.9 361Tafiela 64.7 57.4 39 7.5 4.0 141Ma'an 62.5 51.6 47 8.5 1.9 151Aqaba 74.0 64.5 54 8.0 3.4 194
Badia Badia 61.0 51.7 225 8.2 2.3 686Non Badia 68.4 61.3 2,378 11.2 4.2 8,100
Camps Camp 63.9 55.6 97 22.3 7.6 343Non camp 67.9 60.7 2,505 10.5 3.9 8,443
Mother's education No education 58.4 47.9 48 4.1 2.3 196Elementary 59.3 51.3 152 9.4 6.0 563Preparatory 62.2 58.2 366 9.6 4.5 1,188Secondary 68.3 60.9 1,191 12.7 4.0 4,104Higher 71.5 63.2 846 9.8 3.7 2,735
Wealth quintile Lowest 61.9 53.3 597 10.4 3.8 2,050Second 64.8 60.3 584 10.5 4.6 1,952Middle 63.6 58.0 552 8.9 3.8 1,895Fourth 77.7 67.3 510 12.7 4.4 1,700Highest 74.8 67.0 359 13.8 3.5 1,189
Total 67.8 60.5 2,603 11.0 4.1 8,786
Note: Information on vitamin A is based on both mother's recall and the immunization card (where available). Information on iron supplements is based on the mother's recall. na = Not applicable 1 Includes meat (and organ meat), fish, poultry, eggs, pumpkin, carrots, red sweet potatoes, dark green leafy vegetables, apricot, palm nuts, yellow melon, and other locally grown fruits and vegetables that are rich in vitamin A 2 Includes meat (and organ meat), fish, poultry, and eggs

Nutritional Status and Prevalence of Anemia • 163
Vitamin A is an essential micronutrient for the immune system and plays an important role in maintaining the epithelial tissue in the body. Severe vitamin A deficiency (VAD) can cause eye damage. VAD can also increase severity of infections such as measles and diarrheal diseases in children and slows recovery from illness. Vitamin A is found in breast milk, other milks, liver, eggs, fish, butter, red palm oil, mangoes, papayas, carrots, pumpkins, and dark green leafy vegetables. The liver can store an adequate amount of the vitamin for four to six months. Periodic dosing (usually every six months) of vitamin A supplements is one method of ensuring that children at risk do not develop VAD. Similarly, iron-rich foods and iron supplementation are valuable means of preventing anemia.
The 2012 JPFHS collected information on the consumption of foods rich in vitamin A and iron and on the coverage of supplements. Sixty-eight percent of last-born children age 6-23 months living with the mother consumed vitamin A-rich foods in the 24 hours before the survey. Consumption of vitamin A-rich foods increases from 37 percent among children age 6-8 months to 82 percent among children age 18-23 months. Not surprisingly, breastfeeding children are much less likely to consume vitamin A-rich foods than nonbreastfeeding children. Consumption of foods rich in vitamin A increases with education of the mother.
Sixty-one percent of young children consume foods rich in iron. Differences in the consumption of iron-rich foods are similar to those seen for the consumption of vitamin A-rich foods.
Only 11 percent of children age 6-59 months received a vitamin A supplement in the six months before the survey, and 4 percent received iron supplements in the seven days preceding the survey. Interestingly, children in camps are more likely to receive both types of supplements than children not in camps.
11.6 NUTRITIONAL STATUS OF WOMEN
In the 2012 JPFHS, data were collected on the height and weight of all women age 15-49 in two-thirds of the households sampled. Women’s nutritional status is important both as an indicator of overall health and as a predictor of pregnancy outcome for both mother and child. Two indices of women’s nutritional status are presented in Table 11.9: the percentage of women with very short stature (less than 145 cm) and body mass index (BMI).
Adult height is a measure of past nutritional status and reflects in part the cumulative effect of social and economic outcomes on access to nutritional foods during childhood and adolescence. It can be used to predict the risks associated with difficult deliveries because small stature is often associated with small pelvic size and a greater likelihood of obstructed labor. Short stature also correlates with low birth weight in infants, high risk of stillbirths, and high rates of miscarriage. A woman is considered at nutritional risk if her height is below 145 centimeters.
BMI is used to measure thinness and obesity. BMI utilizes both height and weight and provides a better measure of thinness than weight alone; it is defined as weight in kilograms divided by the square of height in meters (kg/m2).
Table 11.9 shows the percentage of women with height below 145 cm, the mean BMI, and the proportion of women falling into high-risk categories, according to background characteristics. Respondents for whom there was no information on height or weight and for whom a BMI could not be estimated are excluded from this analysis. To avoid bias in the measurement of women’s nutritional status, pregnant women and women who had given birth in the two months preceding the survey were excluded from the calculation of weight and body mass measures. The data analysis on BMI is based on 10,747 women (10,312 weighted women) age 15-49, while the height analysis is based on 11,624 women (11,123 weighted women).

164 • Nutritional Status and Prevalence of Anemia
Table 11.9 Nutritional status of women
Among women age 15-49, the percentage with height under 145 cm, mean body mass index (BMI), and the percentage with specific BMI levels, by background characteristics, Jordan 2012
Background characteristic
Height Body mass index1
Percent- age below
145 cm Number
of women Mean BMI
18.5-24.9 (total nor-
mal) <18.5 (total
thin)
17.0-18.4 (mildly thin)
<17 (moder-
ately and severely
thin)
≥25.0 (total over-
weight or obese)
25.0-29.9 (over-
weight) ≥30.0
(obese) Number
of women
Age 15-19 1.6 830 23.1 62.2 11.3 8.7 2.6 26.5 19.5 7.0 78620-29 1.0 3,087 25.1 49.2 7.3 6.4 0.9 43.5 26.2 17.3 2,66030-39 1.1 3,582 27.2 36.6 3.2 2.3 0.9 60.2 31.8 28.5 3,27140-49 0.8 3,623 28.4 32.0 3.7 2.9 0.8 64.3 25.9 38.5 3,594
Residence Urban 0.9 9,123 26.8 40.5 5.1 4.2 1.0 54.4 27.0 27.4 8,463Rural 1.6 1,999 26.8 38.9 4.6 3.5 1.1 56.4 28.7 27.7 1,849
Region Central 1.0 6,755 26.7 41.1 5.3 4.4 0.9 53.6 26.8 26.9 6,277North 1.1 3,281 26.8 39.2 4.7 3.6 1.1 56.1 28.2 27.9 3,027South 1.2 1,087 27.1 37.7 4.4 3.2 1.2 57.8 28.2 29.7 1,008
Governorate Amman 0.7 4,151 26.7 41.4 5.4 4.6 0.8 53.2 26.7 26.5 3,863Balqa 1.1 755 26.9 37.9 5.5 4.3 1.2 56.5 29.2 27.4 693Zarqa 1.6 1,533 26.8 41.9 4.8 3.8 1.0 53.3 25.8 27.5 1,433Madaba 1.3 315 26.6 39.5 6.1 4.6 1.5 54.3 27.0 27.3 288Irbid 0.7 2,088 26.7 39.1 5.1 4.0 1.1 55.8 29.0 26.8 1,928Mafraq 1.8 583 27.3 37.1 4.2 2.9 1.3 58.7 26.3 32.3 538Jarash 1.8 341 26.6 44.2 3.6 2.6 1.0 52.2 25.1 27.1 312Ajloun 1.4 269 26.9 37.9 4.4 3.3 1.0 57.7 29.7 28.0 248Karak 1.5 472 26.8 38.9 3.9 3.0 1.0 57.1 29.7 27.4 440Tafiela 0.5 171 27.3 38.2 3.9 2.4 1.5 57.8 25.9 31.9 155Ma'an 1.8 195 26.6 40.2 5.2 4.0 1.3 54.6 28.7 25.9 184Aqaba 0.4 249 27.9 33.1 5.1 3.5 1.6 61.8 26.3 35.5 230
Badia Badia 1.9 731 26.2 42.7 5.0 3.7 1.3 52.3 28.0 24.3 666Non Badia 0.9 10,391 26.8 40.0 5.1 4.1 1.0 54.9 27.3 27.7 9,646
Camps Camp 1.8 413 27.2 34.6 6.0 5.0 0.9 59.5 31.2 28.3 385Non camp 1.0 10,710 26.8 40.4 5.0 4.0 1.0 54.6 27.2 27.4 9,928
Education2 No education 11.6 243 28.2 27.8 9.3 5.2 4.1 62.9 24.3 38.6 234Elementary 1.7 689 29.9 28.0 1.7 1.3 0.4 70.4 24.0 46.4 639Preparatory 1.0 1,689 27.4 37.9 4.6 3.6 1.0 57.4 28.0 29.4 1,589Secondary 0.9 4,905 26.8 41.6 4.4 3.7 0.7 54.0 25.7 28.4 4,526Higher 0.4 3,589 25.8 42.4 6.5 5.3 1.2 51.0 30.2 20.8 3,316
Wealth quintile Lowest 2.1 2,271 27.0 41.6 4.3 3.7 0.6 54.1 26.2 27.9 2,124Second 1.2 2,331 27.5 36.8 4.8 4.0 0.8 58.4 26.8 31.6 2,147Middle 0.5 2,262 26.7 37.6 5.2 3.8 1.4 57.2 30.4 26.8 2,034Fourth 0.4 2,174 26.7 41.6 4.6 3.5 1.1 53.8 25.9 27.9 2,039Highest 0.8 2,085 25.9 43.5 6.4 5.3 1.1 50.0 27.4 22.6 1,968
Total 1.0 11,123 26.8 40.2 5.1 4.1 1.0 54.8 27.3 27.4 10,312
Note: The body mass index (BMI) is expressed as the ratio of weight in kilograms to the square of height in meters (kg/m2). Total includes 8 women missing information on education. 1 Excludes pregnant women and women with a birth in the preceding 2 months. 2 For women who are not interviewed, information is taken from the Household Questionnaire.

Nutritional Status and Prevalence of Anemia • 165
The data show that 1 percent of women are below 145 cm in height. Short stature decreases dramatically with increasing level of education, from 12 percent among women with no education to less than 1 percent among women with higher education. There are no other major variations in height by background characteristics.
The mean BMI of women in Jordan is 27, higher than the normal BMI range of 18.5-24.9. Forty percent of women fall in the normal BMI category. Five percent of women fall below the cutoff of 18.5, indicating that the level of chronic energy deficiency is relatively low in Jordan. In general, very young women (15-19) are more likely than other women to suffer from chronic energy deficiency. An alarming proportion of women—more than half (55 percent)—have a BMI of 25 and over, and thus can be considered overweight or obese. Women from Aqaba (62 percent) are more likely to be overweight or obese than women from other governorates. Older women and women with no education or elementary education are also more likely to be overweight or obese.
11.7 PREVALENCE OF ANEMIA IN WOMEN
Table 11.10 shows the prevalence of anemia in women age 15-49. Women with a hemoglobin level below 7.0 g/dl are classified as having severe anemia, those with a level of 7.0-9.9 g/dl are classified as having moderate anemia, and non-pregnant women with a level of 10.0-11.9 g/dl and pregnant women with a level of 10.0-10.9 g/dl are classified as having mild anemia. Eighty-four percent of women age 15-49 were measured, and the remaining eligible women were not measured primarily because they refused to be measured (12 percent) or were not in the household at the time of the interview (4 percent). Besides altitude, hemoglobin requirements also differ substantially depending on women’s smoking status. Table 11.10 reflects anemia levels among women that have been adjusted for the influence of altitude and smoking.
Results show that anemia is common among women in Jordan; about one in three women are anemic (34 percent). About one in four (26 percent) women has mild anemia, and 7 percent of women have moderate anemia. Less than 1 percent of women have severe anemia.
Age is associated with anemia levels, with the highest prevalence among women age 30-39 (39 percent). There is no uniform pattern in the prevalence of anemia by women’s education and wealth. Differences by urban-rural residence, region, and Badia and camp areas are small. The prevalence of anemia among women varies from 24 percent in Madaba to 40 percent in Balqa.
The prevalence of anemia rises with the number of living children from 30 percent among ever-married women with no children to 43 percent among women with six or more children. It is more common among ever-married women who are using the IUD than among those who are not.

166 • Nutritional Status and Prevalence of Anemia
Table 11.10 Prevalence of anemia in women Percentage of women age 15-49 with anemia, by background characteristics, Jordan 2012
Background characteristic
Anemia status by hemoglobin level
Number of women
Any Mild Moderate Severe
Not pregnant <12.0 g/dl 10.0-11.9 g/dl 7.0-9.9 g/dl < 7.0 g/dl Pregnant <11.0 g/dl 10.0-10.9 g/dl 7.0-9.9 g/dl < 7.0 g/dl
ALL WOMEN Age
15-19 25.3 21.1 4.0 0.1 2,32320-29 32.1 26.1 5.9 0.1 3,26130-39 38.5 29.6 8.8 0.1 2,86140-49 37.4 26.9 9.4 1.1 2,289
Residence Urban 33.3 26.3 6.6 0.3 8,798Rural 34.4 25.2 8.9 0.3 1,936
Region Central 32.4 25.7 6.4 0.3 6,513North 35.3 26.6 8.5 0.2 3,173South 34.4 27.4 6.8 0.2 1,048
Governorate Amman 29.5 24.3 5.0 0.3 3,988Balqa 39.7 30.3 8.6 0.7 731Zarqa 38.4 28.8 9.1 0.4 1,494Madaba 23.7 18.4 5.3 0.0 301Irbid 36.2 27.1 8.8 0.2 2,019Mafraq 30.4 22.8 7.5 0.1 557Jarash 35.1 27.5 7.6 0.0 333Ajloun 38.9 29.0 9.2 0.7 264Karak 35.6 29.4 6.0 0.2 459Tafiela 32.9 24.6 8.2 0.2 166Ma'an 30.3 22.7 7.4 0.1 189Aqaba 36.5 29.3 6.9 0.3 235
Badia Badia 30.5 22.1 8.1 0.3 707Non Badia 33.7 26.4 7.0 0.3 10,027
Camps Camp 33.8 26.3 7.1 0.5 403Non camp 33.4 26.1 7.0 0.3 10,331
Education1 No education 27.0 20.8 6.0 0.2 236Elementary 37.8 29.1 8.4 0.3 671Preparatory 35.5 27.0 8.2 0.3 1,635Secondary 35.1 27.6 7.3 0.2 4,779Higher 29.6 23.3 5.9 0.4 3,406
Wealth quintile Lowest 34.8 26.3 8.2 0.3 2,226Second 37.0 28.5 8.1 0.4 2,272Middle 37.7 29.1 8.1 0.4 2,187Fourth 27.9 22.0 5.5 0.4 2,102Highest 29.0 24.2 4.8 0.0 1,946
Total 33.5 26.1 7.0 0.3 10,734
EVER-MARRIED WOMEN2
Number of children ever born 0 30.4 21.3 8.9 0.2 6391 34.4 26.1 8.0 0.3 7332-3 35.4 29.4 5.7 0.3 2,1374-5 38.3 30.1 7.9 0.3 1,9576+ 43.4 29.9 12.9 0.6 1,357
Maternity status Pregnant 39.7 26.2 13.4 0.1 642Breastfeeding 33.8 29.2 4.4 0.2 1,111Neither 37.7 28.8 8.5 0.4 5,070
Using IUD Yes 42.6 32.9 9.3 0.4 1,386No 35.9 27.5 8.1 0.3 5,437
Smoking status Smokes cigarettes/tobacco 36.2 28.1 7.9 0.2 1,268Does not smoke 37.5 28.7 8.4 0.4 5,555
Total 37.3 28.6 8.3 0.4 6,823
Note: Prevalence for all women and ever-married women is adjusted for altitude using formulas in CDC, 1998. 1 For women who are not interviewed, information is taken from the Household Questionnaire. 2 Prevalence for ever-married women is adjusted for smoking status using formulas in CDC, 1998.
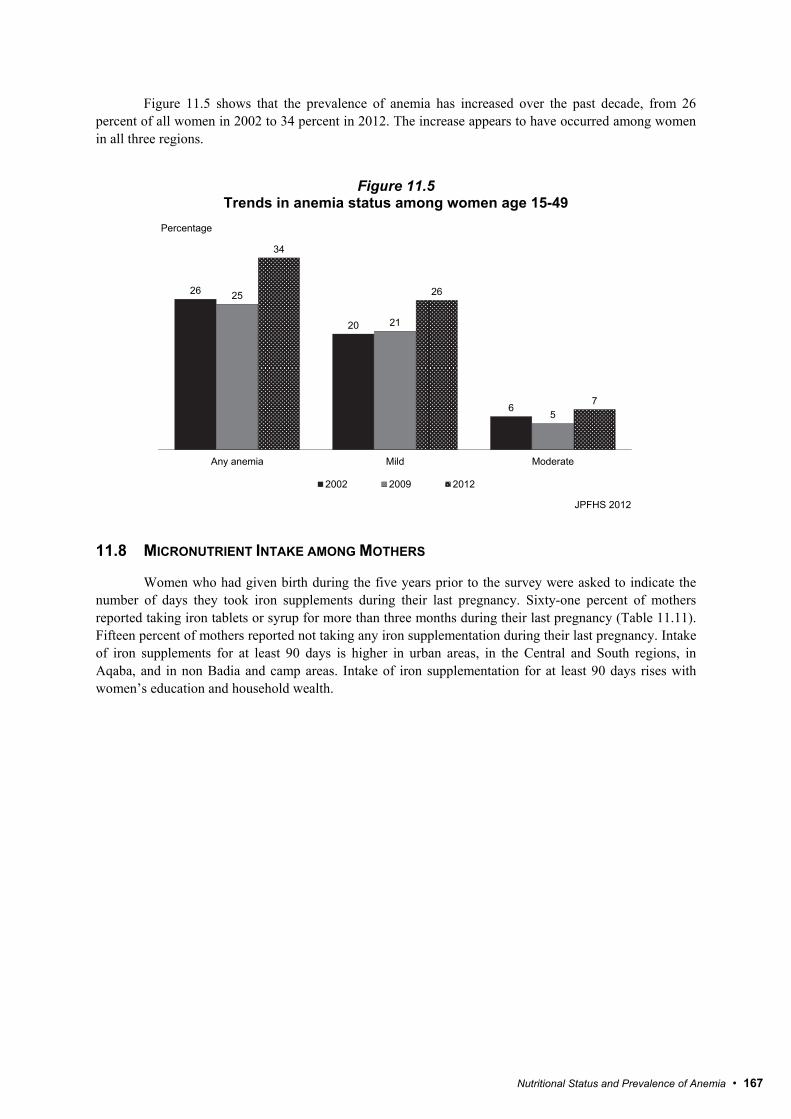
Nutritional Status and Prevalence of Anemia • 167
Figure 11.5 shows that the prevalence of anemia has increased over the past decade, from 26 percent of all women in 2002 to 34 percent in 2012. The increase appears to have occurred among women in all three regions.
Figure 11.5
Trends in anemia status among women age 15-49
JPFHS 2012
11.8 MICRONUTRIENT INTAKE AMONG MOTHERS
Women who had given birth during the five years prior to the survey were asked to indicate the number of days they took iron supplements during their last pregnancy. Sixty-one percent of mothers reported taking iron tablets or syrup for more than three months during their last pregnancy (Table 11.11). Fifteen percent of mothers reported not taking any iron supplementation during their last pregnancy. Intake of iron supplements for at least 90 days is higher in urban areas, in the Central and South regions, in Aqaba, and in non Badia and camp areas. Intake of iron supplementation for at least 90 days rises with women’s education and household wealth.
26
20
6
25
21
5
34
26
7
Any anemia Mild Moderate
Percentage
2002 2009 2012

168 • Nutritional Status and Prevalence of Anemia
Table 11.11 Micronutrient intake among mothers
Among ever-married women age 15-49 with a child born in the past five years, the percent distribution by number of days they took iron tablets or syrup during the pregnancy of the last child, by background characteristics, Jordan 2012
Background characteristic
Number of days women took iron tablets or syrup during pregnancy of last birth
Number of women None <60 60-89 90+
Don't know/
missing Total
Age 15-19 17.3 18.9 10.0 53.7 0.1 100.0 154 20-29 13.8 16.2 8.8 60.5 0.8 100.0 2,606 30-39 14.3 13.0 8.6 63.6 0.5 100.0 2,979 40-49 22.3 9.5 9.2 58.4 0.7 100.0 838
Residence Urban 14.4 13.7 8.3 62.8 0.7 100.0 5,395 Rural 18.7 14.8 11.1 55.2 0.3 100.0 1,182
Region Central 13.6 13.2 7.6 65.0 0.5 100.0 4,052 North 17.8 16.9 11.5 52.9 0.9 100.0 1,903 South 17.4 9.4 8.4 64.3 0.5 100.0 622
Governorate Amman 14.7 12.3 7.4 65.2 0.4 100.0 2,469 Balqa 11.0 11.9 7.0 69.6 0.5 100.0 452 Zarqa 12.4 15.5 7.7 63.5 1.0 100.0 947 Madaba 12.3 17.5 10.4 59.3 0.6 100.0 184 Irbid 16.1 17.3 11.8 53.6 1.3 100.0 1,174 Mafraq 24.6 16.8 11.7 46.6 0.3 100.0 366 Jarash 15.4 14.0 8.6 61.5 0.4 100.0 207 Ajloun 18.0 18.2 12.5 50.6 0.7 100.0 156 Karak 16.8 9.0 7.8 66.1 0.2 100.0 269 Tafiela 26.5 14.0 9.3 49.0 1.1 100.0 103 Ma'an 19.1 11.2 11.3 57.6 0.8 100.0 104 Aqaba 10.9 5.6 6.8 76.4 0.3 100.0 146
Badia Badia 22.5 16.7 14.2 46.2 0.4 100.0 469 Non Badia 14.6 13.7 8.4 62.6 0.7 100.0 6,108
Camps Camp 11.6 13.9 6.6 67.4 0.5 100.0 253 Non camp 15.3 13.9 8.9 61.2 0.7 100.0 6,324
Education No education 28.1 14.6 14.4 42.1 0.8 100.0 130 Elementary 21.4 16.1 5.4 56.7 0.5 100.0 400 Preparatory 18.2 13.5 7.8 58.8 1.7 100.0 872 Secondary 15.5 16.1 9.2 58.7 0.4 100.0 3,069 Higher 11.5 10.5 8.9 68.6 0.6 100.0 2,106
Wealth quintile Lowest 23.0 14.9 9.1 52.8 0.2 100.0 1,393 Second 14.6 15.2 9.7 59.4 1.1 100.0 1,393 Middle 15.6 13.2 8.8 62.1 0.4 100.0 1,470 Fourth 11.9 16.5 7.5 62.8 1.3 100.0 1,327 Highest 9.0 8.5 8.6 73.7 0.1 100.0 994
Total 15.2 13.9 8.8 61.4 0.7 100.0 6,577

HIV/AIDS-Related Knowledge, Attitudes, and Behavior • 169
HIV/AIDS-RELATED KNOWLEDGE, ATTITUDES, AND BEHAVIOR 12
cquired immune deficiency syndrome (AIDS) is caused by a human immunodeficiency virus (HIV) that weakens the immune system, making the body susceptible to and unable to recover from other diseases.
HIV/AIDS is a pandemic with cases reported from every country. The Joint United Nations Programme on HIV/AIDS (UNAIDS) estimates that approximately 34 million people worldwide were living with HIV in 2011. Nevertheless, the joint global effort in the fight against AIDS resulted in a 24 percent decline in the number of AIDS-related deaths in 2011 compared to 2005, and a 20 percent decline in newly infected cases in the decade between 2001 and 2011 (UNAIDS, 2012).
The first case of AIDS reported in Jordan was in 1986. By December 2011, there were 847 reported HIV infections in Jordan: a total of 247 cases (29 percent) among Jordanian nationals and the remaining 600 cases (71 percent) among members of the expatriate community (UNGASS, 2012). As of December 2011, there were 99 AIDS-related deaths. As surveillance systems are not fully developed, and there continues to exist pervasive fear of and stigma against HIV/AIDS in Jordan, it is believed that the number of HIV-infected individuals residing in Jordan exceeds the number of officially registered cases. According to available data, transmission occurs primarily among those age 25-34. The modes of transmission are estimated to be 65 percent via sexual contact, 25 percent via blood or blood products, 2 percent via injecting drug use, 3 percent via mother-to-child transmission, and 5 percent through unknown routes (MOH/NAP and UNAIDS, 2011).
In 1986, Jordan launched the National AIDS Program within the Ministry of Health, followed in 2005 by the National AIDS Strategy 2005-2009 to promote peer education, develop life skill strategies among the youth population, provide voluntary counseling and testing (VCT), and provide free antiretroviral drugs to people living with HIV. The Ministry of Health is working with international bodies such as UNAIDS and the World Health Organization to combat the threat of AIDS in Jordan. The new National Strategic Plan on HIV and AIDS (2012-2016) aims to continue and further guide Jordan’s national AIDS response (UNGASS, 2012).
A
Key Findings
• Ninety-nine percent of ever-married women age 15-49 have heard of AIDS.
• More than one in two women know that both using condoms and limiting sexual intercourse to one uninfected partner prevents HIV transmission.
• Comprehensive knowledge of AIDS is not widespread among ever-married women age 15-49 (13 percent); it is even lower among women age 15-24 (9 percent).
• Overall, only 3 percent of women express accepting attitudes toward people living with AIDS.
• Two in five women have heard of sexually transmitted infections (STIs) other than HIV.
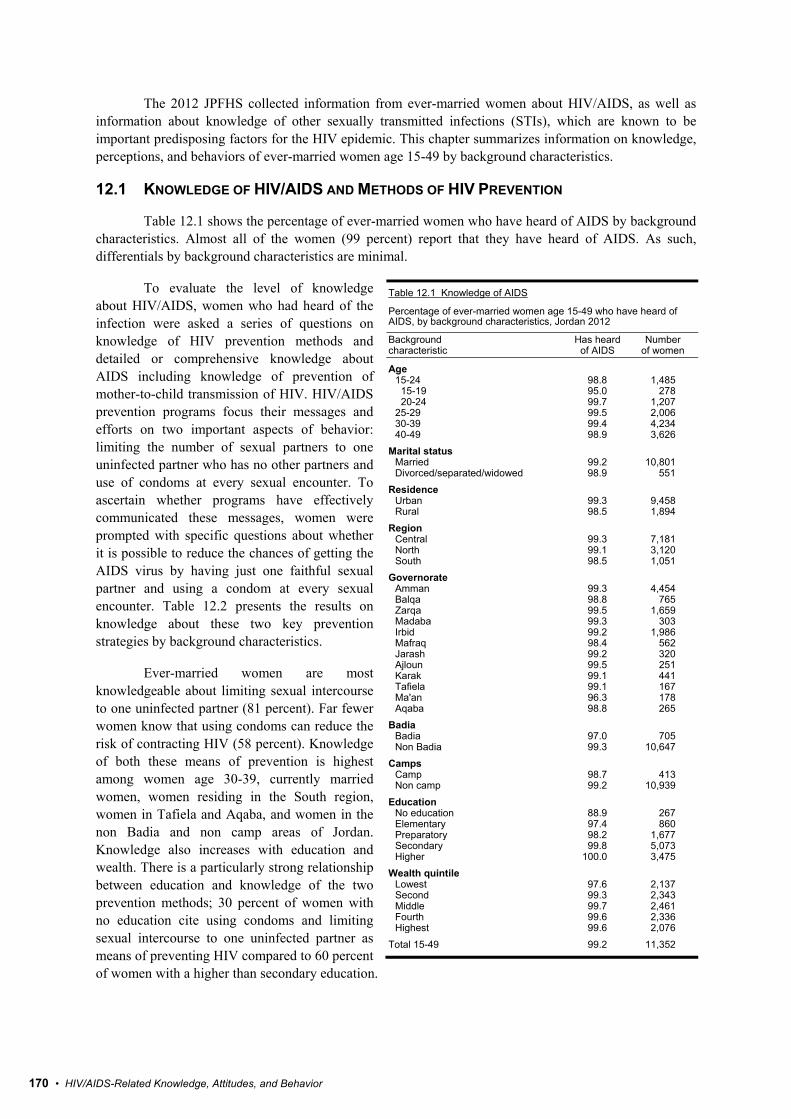
170 • HIV/AIDS-Related Knowledge, Attitudes, and Behavior
The 2012 JPFHS collected information from ever-married women about HIV/AIDS, as well as information about knowledge of other sexually transmitted infections (STIs), which are known to be important predisposing factors for the HIV epidemic. This chapter summarizes information on knowledge, perceptions, and behaviors of ever-married women age 15-49 by background characteristics.
12.1 KNOWLEDGE OF HIV/AIDS AND METHODS OF HIV PREVENTION
Table 12.1 shows the percentage of ever-married women who have heard of AIDS by background characteristics. Almost all of the women (99 percent) report that they have heard of AIDS. As such, differentials by background characteristics are minimal.
To evaluate the level of knowledge about HIV/AIDS, women who had heard of the infection were asked a series of questions on knowledge of HIV prevention methods and detailed or comprehensive knowledge about AIDS including knowledge of prevention of mother-to-child transmission of HIV. HIV/AIDS prevention programs focus their messages and efforts on two important aspects of behavior: limiting the number of sexual partners to one uninfected partner who has no other partners and use of condoms at every sexual encounter. To ascertain whether programs have effectively communicated these messages, women were prompted with specific questions about whether it is possible to reduce the chances of getting the AIDS virus by having just one faithful sexual partner and using a condom at every sexual encounter. Table 12.2 presents the results on knowledge about these two key prevention strategies by background characteristics.
Ever-married women are most knowledgeable about limiting sexual intercourse to one uninfected partner (81 percent). Far fewer women know that using condoms can reduce the risk of contracting HIV (58 percent). Knowledge of both these means of prevention is highest among women age 30-39, currently married women, women residing in the South region, women in Tafiela and Aqaba, and women in the non Badia and non camp areas of Jordan. Knowledge also increases with education and wealth. There is a particularly strong relationship between education and knowledge of the two prevention methods; 30 percent of women with no education cite using condoms and limiting sexual intercourse to one uninfected partner as means of preventing HIV compared to 60 percent of women with a higher than secondary education.
Table 12.1 Knowledge of AIDS
Percentage of ever-married women age 15-49 who have heard of AIDS, by background characteristics, Jordan 2012
Background characteristic
Has heard of AIDS
Number of women
Age 15-24 98.8 1,485
15-19 95.0 27820-24 99.7 1,207
25-29 99.5 2,00630-39 99.4 4,23440-49 98.9 3,626
Marital status Married 99.2 10,801Divorced/separated/widowed 98.9 551
Residence Urban 99.3 9,458Rural 98.5 1,894
Region Central 99.3 7,181North 99.1 3,120South 98.5 1,051
Governorate Amman 99.3 4,454Balqa 98.8 765Zarqa 99.5 1,659Madaba 99.3 303Irbid 99.2 1,986Mafraq 98.4 562Jarash 99.2 320Ajloun 99.5 251Karak 99.1 441Tafiela 99.1 167Ma'an 96.3 178Aqaba 98.8 265
Badia Badia 97.0 705Non Badia 99.3 10,647
Camps Camp 98.7 413Non camp 99.2 10,939
Education No education 88.9 267Elementary 97.4 860Preparatory 98.2 1,677Secondary 99.8 5,073Higher 100.0 3,475
Wealth quintile Lowest 97.6 2,137Second 99.3 2,343Middle 99.7 2,461Fourth 99.6 2,336Highest 99.6 2,076
Total 15-49 99.2 11,352

HIV/AIDS-Related Knowledge, Attitudes, and Behavior • 171
Table 12.2 Knowledge of HIV prevention methods
Percentage of ever-married women age 15-49 who, in response to prompted questions, say that people can reduce the risk of getting the AIDS virus by using condoms every time they have sexual intercourse and by having one sex partner who is not infected and has no other partners, by background characteristics, Jordan 2012
Background characteristic
Percentage who say HIV can be prevented by
Number of women
Using condoms1
Limiting sexual intercourse to one uninfected
partner2
Using condoms and limiting
sexual intercourse to one uninfected
partner1,2
Age 15-24 56.5 79.9 48.3 1,485
15-19 51.5 70.2 40.5 278 20-24 57.6 82.1 50.1 1,207
25-29 59.4 81.0 51.6 2,006 30-39 59.6 82.8 54.3 4,234 40-49 56.7 78.8 49.3 3,626
Marital status Married 58.6 81.1 51.9 10,801 Divorced/separated/
widowed 51.6 75.2 43.7 551
Residence Urban 58.5 80.8 51.3 9,458 Rural 57.1 81.2 52.5 1,894
Region Central 57.8 78.9 50.0 7,181 North 58.2 86.2 53.6 3,120 South 61.0 78.4 55.4 1,051
Governorate Amman 55.6 77.2 47.0 4,454 Balqa 61.8 83.8 56.9 765 Zarqa 61.2 80.8 54.0 1,659 Madaba 61.8 80.5 54.1 303 Irbid 57.6 85.4 52.3 1,986 Mafraq 57.8 85.4 54.2 562 Jarash 61.5 88.2 58.2 320 Ajloun 59.6 91.0 56.2 251 Karak 60.4 75.6 54.4 441 Tafiela 65.0 78.6 59.1 167 Ma'an 55.4 73.0 48.8 178 Aqaba 63.0 86.6 59.2 265
Badia Badia 49.2 74.3 44.6 705 Non Badia 58.8 81.3 51.9 10,647
Camps Camp 55.3 80.2 49.7 413 Non camp 58.3 80.9 51.5 10,939
Education No education 33.6 52.9 30.2 267 Elementary 45.5 65.0 37.8 860 Preparatory 52.6 75.8 44.7 1,677 Secondary 58.6 82.2 51.3 5,073 Higher 65.5 87.4 60.0 3,475
Wealth quintile Lowest 50.0 75.0 43.5 2,137 Second 56.7 78.3 49.1 2,343 Middle 58.1 82.4 51.3 2,461 Fourth 62.6 84.4 56.5 2,336 Highest 63.5 83.7 56.7 2,076
Total 15-49 58.2 80.8 51.5 11,352 1 Using condoms every time they have sexual intercourse. 2 Partner who has no other partners.
The 2012 JPFHS also included questions to assess the prevalence of common misconceptions
about AIDS and HIV transmission. Women who had heard of HIV/AIDS were asked whether they think it is possible for a healthy-looking person to have the AIDS virus. They were also asked whether a person can get AIDS from mosquito bites, by sharing food with a person who has AIDS, by shaking hands or hugging someone who has AIDS, or by sharing razors or blades when shaving their beard or having their

172 • HIV/AIDS-Related Knowledge, Attitudes, and Behavior
hair cut. Table 12.3 indicates that many women lack accurate knowledge about the ways in which HIV can and cannot be transmitted. Only 65 percent of ever-married women know that a healthy-looking person can have (and thus transmit) the virus that causes AIDS. Although this represents a significant increase from 2002, when only 46 percent of women reported knowing this, there has been no change in the last five years.
Table 12.3 Comprehensive knowledge about AIDS
Percentage of ever-married women age 15-49 who say that a healthy-looking person can have the AIDS virus and who, in response to prompted questions, correctly reject local misconceptions about transmission or prevention of the AIDS virus, and the percentage with comprehensive knowledge about AIDS, by background characteristics, Jordan 2012
Background characteristic
Percentage of women who say that: Percentage who say that a
healthy- looking person can have the
AIDS virus and who reject the
two most common local
miscon- ceptions1
Percentage with compre-
hensive knowledge
about AIDS2 Number
of women
A healthy- looking person can have the AIDS virus
The AIDS virus cannot
be transmitted by mosquito
bites
A person cannot become
infected by sharing food with a person who has AIDS
The AIDS virus cannot
be transmitted by shaking hands or hugging a
person with AIDS
The AIDS virus can be
transmitted by sharing razors or blades while
shaving or having a haircut
Age 15-24 60.0 32.2 63.6 81.0 91.6 14.8 8.6 1,485
15-19 46.5 31.1 52.6 69.0 87.4 11.9 5.6 27820-24 63.1 32.5 66.2 83.8 92.6 15.5 9.3 1,207
25-29 66.1 37.3 66.7 79.1 90.5 20.0 11.1 2,00630-39 67.3 39.1 66.5 75.3 88.2 22.4 14.9 4,23440-49 65.0 37.7 68.3 74.2 86.0 22.2 13.4 3,626
Marital status Married 65.5 37.8 67.0 76.6 88.5 21.1 13.2 10,801Divorced/separated/
widowed 63.5 29.0 61.3 71.2 86.4 16.4 8.2 551
Residence Urban 66.0 37.8 67.3 77.3 88.4 21.2 13.1 9,458Rural 62.6 35.5 63.7 71.8 87.9 19.1 12.1 1,894
Region Central 66.6 39.0 67.6 77.1 88.2 21.6 12.9 7,181North 61.5 33.2 65.1 77.0 89.0 18.1 11.9 3,120South 68.5 39.4 65.3 69.2 87.6 24.1 15.8 1,051
Governorate Amman 70.1 38.3 69.3 78.9 87.5 22.5 12.7 4,454Balqa 59.0 36.5 62.9 73.8 88.1 17.3 11.8 765Zarqa 62.3 40.7 64.5 73.2 90.2 20.5 13.7 1,659Madaba 59.0 45.6 73.0 81.1 87.9 25.5 15.4 303Irbid 61.6 33.7 64.9 78.2 88.3 18.3 12.0 1,986Mafraq 61.2 29.8 62.3 72.2 93.0 16.4 10.9 562Jarash 59.7 36.0 69.0 78.0 86.3 20.4 13.8 320Ajloun 63.7 33.0 67.3 76.8 88.2 17.5 11.3 251Karak 72.8 45.5 66.4 69.3 86.9 28.2 17.7 441Tafiela 65.7 32.3 66.8 71.5 88.8 19.0 13.4 167Ma'an 54.4 28.5 55.1 56.5 82.0 13.5 8.9 178Aqaba 72.5 41.0 69.3 76.1 91.6 27.7 18.7 265
Badia Badia 57.4 28.0 58.3 63.8 86.5 13.9 6.9 705Non Badia 65.9 38.0 67.3 77.2 88.5 21.4 13.3 10,647
Camps Camp 60.1 37.4 62.0 73.1 86.3 18.4 11.0 413Non camp 65.6 37.4 66.9 76.5 88.4 21.0 13.0 10,939
Education No education 37.3 20.1 42.2 41.0 64.6 11.3 3.9 267Elementary 51.2 26.2 48.5 57.8 77.8 12.5 5.7 860Preparatory 55.2 31.3 58.4 69.5 84.4 14.1 7.2 1,677Secondary 64.1 39.8 67.0 78.3 89.0 20.0 12.6 5,073Higher 77.9 41.0 76.7 84.1 93.7 28.3 18.6 3,475
Wealth quintile Lowest 54.8 33.3 57.7 66.2 81.4 15.2 8.2 2,137Second 61.1 33.5 62.9 70.8 86.5 17.0 9.6 2,343Middle 65.9 37.2 67.6 76.1 90.2 20.6 12.4 2,461Fourth 68.4 40.7 70.2 82.3 90.0 22.4 15.7 2,336Highest 77.3 42.6 75.2 86.7 93.5 29.7 19.0 2,076
Total 15-49 65.4 37.4 66.7 76.4 88.4 20.9 12.9 11,352 1 Two most common local misconceptions: the AIDS virus can be transmitted through mosquito bites and by sharing food. 2 Comprehensive knowledge means knowing that consistent use of condoms during sexual intercourse and having just one uninfected faithful partner can reduce the chance of getting the AIDS virus, knowing that a healthy-looking person can have the AIDS virus, and rejecting the two most common local misconceptions about AIDS transmission or prevention.

HIV/AIDS-Related Knowledge, Attitudes, and Behavior • 173
Many women also erroneously believe that AIDS can be transmitted by mosquito bites; only 37 percent of women reject this common misconception. Larger proportions of women are aware that the AIDS virus cannot be transmitted by sharing food with a person who has AIDS (67 percent) or by shaking hands or hugging an infected person (76 percent). In addition, the majority of women (88 percent) know that the AIDS virus can be transmitted by sharing razors or blades while shaving or having their hair cut. However, only one fifth of women (21 percent) reject the two most common misconceptions about AIDS—that AIDS can be transmitted by mosquito bites and that a person can become infected with the AIDS virus by sharing food with someone who is infected—and know that a healthy-looking person can have the AIDS virus. Table 12.3 also provides an assessment of the level of comprehensive knowledge of HIV/AIDS prevention and transmission. Comprehensive knowledge is defined as: 1) knowing that both condom use and limiting sex partners to one uninfected person are HIV/AIDS prevention methods, 2) being aware that a healthy-looking person can have HIV, and 3) rejecting the two most common local misconceptions—that HIV/AIDS can be transmitted through mosquito bites and by sharing food. Overall, only 13 percent of ever-married women have comprehensive knowledge of HIV/AIDS prevention and transmission. Comprehensive knowledge is positively associated with education; 19 percent of the most highly educated women have comprehensive knowledge about AIDS, compared to only 4 percent of women with no education.
Comprehensive knowledge of AIDS has decreased slightly since 2007 from 14 percent to 13 percent. The percentage of ever-married women who know that AIDS cannot be transmitted through mosquito bites, sharing foods with an infected person, or shaking hands or hugging a person with AIDS, decreased from 40, 73 and 79 percent, respectively, in 2007 to 37, 67 and 76 percent, respectively in 2012.
The 2012 JPFHS asked women whether they thought the AIDS virus could be transmitted from mother to child during pregnancy, during delivery, and through breastfeeding (Table 12.4). The results indicate that, while 84 percent know that HIV can be transmitted from mother to child during pregnancy and three-fourths (72 percent) know that the virus can be transmitted during delivery, only half (48 percent) know that it can be transmitted through breastfeeding. Although knowledge of HIV transmission during pregnancy and through delivery is positively correlated with a woman’s education, there is no relationship between education levels and knowledge of transmission of HIV through breastfeeding.

174 • HIV/AIDS-Related Knowledge, Attitudes, and Behavior
Table 12.4 Knowledge of prevention of mother-to-child transmission of HIV
Percentage of ever-married women age 15-49 who know that HIV can be transmitted from mother to child during pregnancy, during delivery, and through breastfeeding, by background characteristics, Jordan 2012
Background characteristic
Percentage who know that:
Number of women
HIV can be transmitted
during pregnancy
HIV can be transmitted
during delivery
HIV can be transmitted by breastfeeding
Age 15-24 87.5 71.4 53.2 1,485
15-19 83.5 65.3 53.1 278 20-24 88.4 72.8 53.3 1,207
25-29 86.0 72.1 49.8 2,006 30-39 84.3 73.4 48.3 4,234 40-49 80.9 71.9 43.7 3,626
Marital status Married 84.0 72.5 47.7 10,801 Divorced/separated/
widowed 82.1 71.0 49.2 551
Currently pregnant Pregnant 88.6 70.1 52.9 1,085 Not pregnant or not sure 83.4 72.7 47.2 10,267
Residence Urban 84.1 72.6 46.8 9,458 Rural 83.3 71.6 52.4 1,894
Region Central 84.0 73.7 46.4 7,181 North 84.6 69.8 50.4 3,120 South 81.9 71.6 49.0 1,051
Governorate Amman 83.5 73.2 42.6 4,454 Balqa 84.5 76.4 57.0 765 Zarqa 85.0 73.8 49.8 1,659 Madaba 83.7 74.2 56.8 303 Irbid 84.0 68.9 49.0 1,986 Mafraq 85.6 72.0 58.3 562 Jarash 84.8 72.4 48.7 320 Ajloun 86.8 68.6 44.9 251 Karak 83.0 72.2 47.3 441 Tafiela 83.1 71.2 52.5 167 Ma'an 72.7 62.8 44.0 178 Aqaba 85.3 76.7 53.2 265
Badia Badia 78.6 66.3 51.8 705 Non Badia 84.3 72.8 47.5 10,647
Camps Camp 82.4 72.6 50.7 413 Non camp 84.0 72.4 47.6 10,939
Education No education 58.6 47.7 41.8 267 Elementary 72.0 56.8 50.9 860 Preparatory 80.2 66.1 50.6 1,677 Secondary 84.9 73.0 48.9 5,073 Higher 89.3 80.4 44.3 3,475
Wealth quintile Lowest 77.5 66.7 50.1 2,137 Second 83.7 68.8 53.4 2,343 Middle 85.1 73.9 49.8 2,461 Fourth 83.6 72.9 44.9 2,336 Highest 89.8 80.1 39.6 2,076
Total 15-49 83.9 72.4 47.7 11,352

HIV/AIDS-Related Knowledge, Attitudes, and Behavior • 175
The survey also collected information on whether women know where to go to get an HIV test. Table 12.5 shows that only one in five women (21 percent) know where to go to be tested. Knowledge is particularly low among very young women (age 15-19), women living in the Badia and camp areas, women with no education, and women from the poorest households.
Table 12.5 Knowledge of where to get an HIV test
Percentage of ever-married women age 15-49 who know where to get an HIV test, according to background characteristics, Jordan 2012
Background characteristic
Percentage who know
where to get an HIV test
Number of women
Age 15-24 15.5 1,485
15-19 13.5 278 20-24 15.9 1,207
25-29 18.3 2,006 30-39 21.2 4,234 40-49 23.1 3,626
Marital status Married 20.6 10,801 Divorced/separated/widowed 19.2 551
Residence Urban 20.9 9,458 Rural 18.9 1,894
Region Central 22.1 7,181 North 18.0 3,120 South 17.9 1,051
Governorate Amman 23.5 4,454 Balqa 23.0 765 Zarqa 18.4 1,659 Madaba 18.9 303 Irbid 16.7 1,986 Mafraq 17.5 562 Jarash 26.3 320 Ajloun 18.3 251 Karak 16.6 441 Tafiela 20.2 167 Ma'an 18.3 178 Aqaba 18.6 265
Badia Badia 15.7 705 Non Badia 20.9 10,647
Camps Camp 16.8 413 Non camp 20.7 10,939
Education No education 10.1 267 Elementary 16.0 860 Preparatory 15.7 1,677 Secondary 18.9 5,073 Higher 27.2 3,475
Wealth quintile Lowest 16.1 2,137 Second 17.5 2,343 Middle 18.8 2,461 Fourth 22.3 2,336 Highest 28.6 2,076
Total 15-49 20.6 11,352
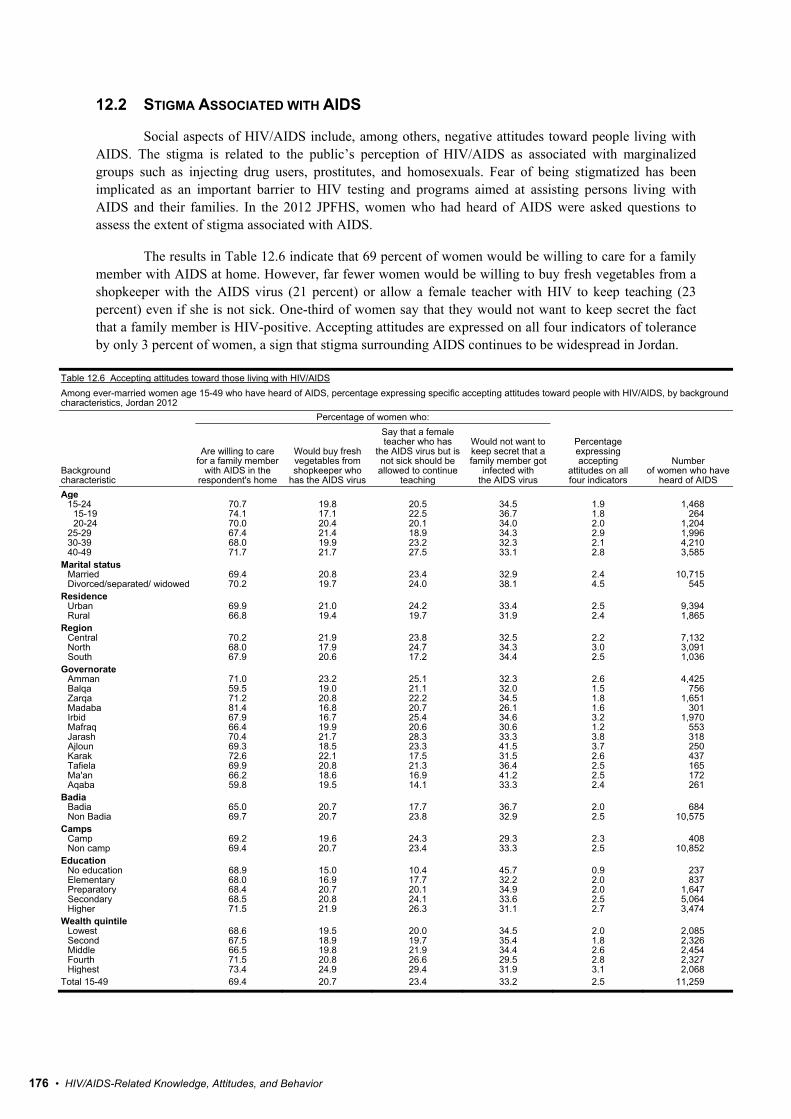
176 • HIV/AIDS-Related Knowledge, Attitudes, and Behavior
12.2 STIGMA ASSOCIATED WITH AIDS
Social aspects of HIV/AIDS include, among others, negative attitudes toward people living with AIDS. The stigma is related to the public’s perception of HIV/AIDS as associated with marginalized groups such as injecting drug users, prostitutes, and homosexuals. Fear of being stigmatized has been implicated as an important barrier to HIV testing and programs aimed at assisting persons living with AIDS and their families. In the 2012 JPFHS, women who had heard of AIDS were asked questions to assess the extent of stigma associated with AIDS.
The results in Table 12.6 indicate that 69 percent of women would be willing to care for a family member with AIDS at home. However, far fewer women would be willing to buy fresh vegetables from a shopkeeper with the AIDS virus (21 percent) or allow a female teacher with HIV to keep teaching (23 percent) even if she is not sick. One-third of women say that they would not want to keep secret the fact that a family member is HIV-positive. Accepting attitudes are expressed on all four indicators of tolerance by only 3 percent of women, a sign that stigma surrounding AIDS continues to be widespread in Jordan.
Table 12.6 Accepting attitudes toward those living with HIV/AIDS Among ever-married women age 15-49 who have heard of AIDS, percentage expressing specific accepting attitudes toward people with HIV/AIDS, by background characteristics, Jordan 2012
Background characteristic
Percentage of women who:
Percentage expressing accepting
attitudes on all four indicators
Number of women who have
heard of AIDS
Are willing to care for a family member
with AIDS in the respondent's home
Would buy fresh vegetables from shopkeeper who
has the AIDS virus
Say that a female teacher who has
the AIDS virus but is not sick should be allowed to continue
teaching
Would not want to keep secret that a family member got
infected with the AIDS virus
Age 15-24 70.7 19.8 20.5 34.5 1.9 1,468
15-19 74.1 17.1 22.5 36.7 1.8 26420-24 70.0 20.4 20.1 34.0 2.0 1,204
25-29 67.4 21.4 18.9 34.3 2.9 1,99630-39 68.0 19.9 23.2 32.3 2.1 4,21040-49 71.7 21.7 27.5 33.1 2.8 3,585
Marital status Married 69.4 20.8 23.4 32.9 2.4 10,715Divorced/separated/ widowed 70.2 19.7 24.0 38.1 4.5 545
Residence Urban 69.9 21.0 24.2 33.4 2.5 9,394Rural 66.8 19.4 19.7 31.9 2.4 1,865
Region Central 70.2 21.9 23.8 32.5 2.2 7,132North 68.0 17.9 24.7 34.3 3.0 3,091South 67.9 20.6 17.2 34.4 2.5 1,036
Governorate Amman 71.0 23.2 25.1 32.3 2.6 4,425Balqa 59.5 19.0 21.1 32.0 1.5 756Zarqa 71.2 20.8 22.2 34.5 1.8 1,651Madaba 81.4 16.8 20.7 26.1 1.6 301Irbid 67.9 16.7 25.4 34.6 3.2 1,970Mafraq 66.4 19.9 20.6 30.6 1.2 553Jarash 70.4 21.7 28.3 33.3 3.8 318Ajloun 69.3 18.5 23.3 41.5 3.7 250Karak 72.6 22.1 17.5 31.5 2.6 437Tafiela 69.9 20.8 21.3 36.4 2.5 165Ma'an 66.2 18.6 16.9 41.2 2.5 172Aqaba 59.8 19.5 14.1 33.3 2.4 261
Badia Badia 65.0 20.7 17.7 36.7 2.0 684Non Badia 69.7 20.7 23.8 32.9 2.5 10,575
Camps Camp 69.2 19.6 24.3 29.3 2.3 408Non camp 69.4 20.7 23.4 33.3 2.5 10,852
Education No education 68.9 15.0 10.4 45.7 0.9 237Elementary 68.0 16.9 17.7 32.2 2.0 837Preparatory 68.4 20.7 20.1 34.9 2.0 1,647Secondary 68.5 20.8 24.1 33.6 2.5 5,064Higher 71.5 21.9 26.3 31.1 2.7 3,474
Wealth quintile Lowest 68.6 19.5 20.0 34.5 2.0 2,085Second 67.5 18.9 19.7 35.4 1.8 2,326Middle 66.5 19.8 21.9 34.4 2.6 2,454Fourth 71.5 20.8 26.6 29.5 2.8 2,327Highest 73.4 24.9 29.4 31.9 3.1 2,068
Total 15-49 69.4 20.7 23.4 33.2 2.5 11,259

HIV/AIDS-Related Knowledge, Attitudes, and Behavior • 177
12.3 ATTITUDES TOWARDS NEGOTIATING SAFER SEXUAL RELATIONS
Knowledge about HIV transmission and ways to prevent it is of little use if women feel powerless to negotiate safer sexual practices with their partner. In an effort to assess the ability of women to negotiate safer sex, women were asked if they thought a wife is justified in refusing to have sex with her husband if she knows he has sex with other women or if she knows he has a disease that can be transmitted through sexual contact. They were also asked if they thought a woman is justified in asking her husband to use a condom if she knows he has a sexually transmitted infection (STI).
Table 12.7 shows that the vast majority of ever-married women age 15-49 believe that, if she knows her husband has an STI, a woman is justified in either refusing to have sex with him or asking him to wear a condom (96 percent and 89 percent, respectively). In addition, 94 percent also mentioned that a woman is justified in refusing to have sexual intercourse with her husband if she knows he has sex with other women.
Table 12.7 Attitudes toward negotiating safer sexual relations with husband Percentage of ever-married women age 15-49 who believe that a woman is justified in refusing to have sexual intercourse with her husband if she knows that he has sexual intercourse with other women, percentage who believe that a woman is justified in refusing to have sexual intercourse with her husband if she knows he has a sexually transmitted infection (STI), and percentage who believe that a woman is justified in asking that they use a condom if she knows that her husband has an STI, by background characteristics, Jordan 2012
Background characteristic
Woman is justified in
Number of women
Refusing to have sexual intercourse with her husband if she knows he
has sex with other women
Refusing to have sexual intercourse with her husband
if she knows he has an STI
Asking that they use a condom if she
knows that her husband has an STI
Age 15-24 93.4 95.6 85.0 1,485
15-19 89.2 90.8 76.2 278 20-24 94.4 96.7 87.0 1,207
25-29 94.9 96.5 90.3 2,006 30-39 95.6 97.0 90.8 4,234 40-49 92.0 95.9 86.8 3,626
Marital status Married 94.3 96.5 89.2 10,801 Divorced/separated/widowed 89.1 94.5 78.6 551
Residence Urban 93.8 96.2 88.3 9,458 Rural 95.5 97.3 90.4 1,894
Region Central 93.6 95.9 88.5 7,181 North 95.1 97.1 89.6 3,120 South 94.0 97.6 87.0 1,051
Governorate Amman 92.8 95.8 88.1 4,454 Balqa 95.2 95.9 90.6 765 Zarqa 94.8 96.0 87.6 1,659 Madaba 94.8 96.8 94.4 303 Irbid 95.1 96.9 89.1 1,986 Mafraq 94.7 97.2 91.0 562 Jarash 96.1 97.4 88.2 320 Ajloun 95.1 97.9 91.8 251 Karak 93.5 97.9 83.4 441 Tafiela 94.5 98.4 92.3 167 Ma'an 92.2 94.1 90.6 178 Aqaba 95.7 98.8 87.4 265
Badia Badia 93.3 95.2 89.0 705 Non Badia 94.1 96.5 88.6 10,647
Camps Camp 94.0 93.7 86.2 413 Non camp 94.1 96.5 88.8 10,939
Education No education 90.4 90.4 77.1 267 Elementary 89.2 91.9 83.3 860 Preparatory 92.7 93.3 86.2 1,677 Secondary 94.3 97.3 88.4 5,073 Higher 95.8 98.1 92.4 3,475
Wealth quintile Lowest 91.4 95.0 86.1 2,137 Second 94.6 95.4 88.3 2,343 Middle 94.7 96.4 88.8 2,461 Fourth 94.7 97.4 89.5 2,336 Highest 94.7 97.8 90.7 2,076
Total 15-49 94.1 96.4 88.7 11,352
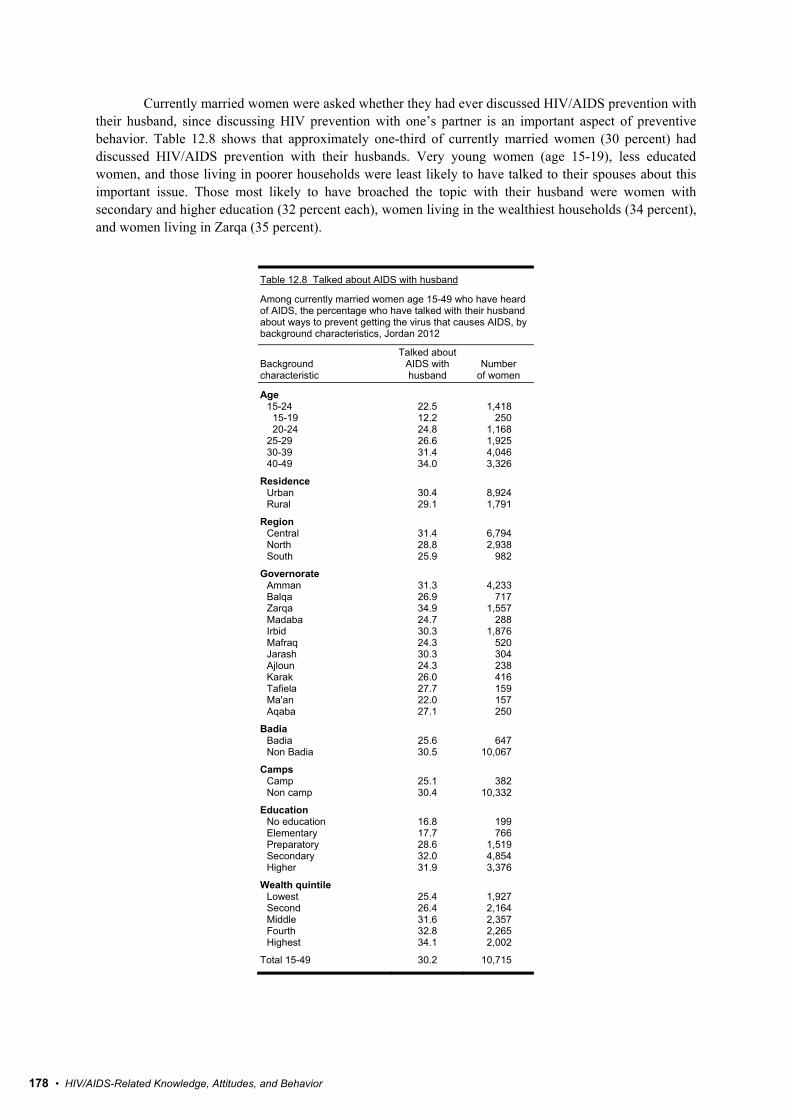
178 • HIV/AIDS-Related Knowledge, Attitudes, and Behavior
Currently married women were asked whether they had ever discussed HIV/AIDS prevention with their husband, since discussing HIV prevention with one’s partner is an important aspect of preventive behavior. Table 12.8 shows that approximately one-third of currently married women (30 percent) had discussed HIV/AIDS prevention with their husbands. Very young women (age 15-19), less educated women, and those living in poorer households were least likely to have talked to their spouses about this important issue. Those most likely to have broached the topic with their husband were women with secondary and higher education (32 percent each), women living in the wealthiest households (34 percent), and women living in Zarqa (35 percent).
Table 12.8 Talked about AIDS with husband
Among currently married women age 15-49 who have heard of AIDS, the percentage who have talked with their husband about ways to prevent getting the virus that causes AIDS, by background characteristics, Jordan 2012
Background characteristic
Talked about AIDS with husband
Number of women
Age 15-24 22.5 1,418
15-19 12.2 250 20-24 24.8 1,168
25-29 26.6 1,925 30-39 31.4 4,046 40-49 34.0 3,326
Residence Urban 30.4 8,924 Rural 29.1 1,791
Region Central 31.4 6,794 North 28.8 2,938 South 25.9 982
Governorate Amman 31.3 4,233 Balqa 26.9 717 Zarqa 34.9 1,557 Madaba 24.7 288 Irbid 30.3 1,876 Mafraq 24.3 520 Jarash 30.3 304 Ajloun 24.3 238 Karak 26.0 416 Tafiela 27.7 159 Ma'an 22.0 157 Aqaba 27.1 250
Badia Badia 25.6 647 Non Badia 30.5 10,067
Camps Camp 25.1 382 Non camp 30.4 10,332
Education No education 16.8 199 Elementary 17.7 766 Preparatory 28.6 1,519 Secondary 32.0 4,854 Higher 31.9 3,376
Wealth quintile Lowest 25.4 1,927 Second 26.4 2,164 Middle 31.6 2,357 Fourth 32.8 2,265 Highest 34.1 2,002
Total 15-49 30.2 10,715

HIV/AIDS-Related Knowledge, Attitudes, and Behavior • 179
12.4 KNOWLEDGE OF SEXUALLY TRANSMITTED INFECTIONS
Sexually transmitted infections (STIs) are important predisposing factors of HIV/AIDS transmission. As such, the presence of STIs in a population increases the likelihood of the occurrence of HIV. AIDS prevention programs must therefore also address the prevention and treatment of STIs. Additional questions were included in the JPFHS to assess the level of awareness of STIs among women.
Table 12.9 shows that only two in five ever-married women (40 percent) have heard of STIs apart from AIDS. As expected, younger women, rural residents, women with less education, and women living in poorer households are less likely than others to have heard about other STIs.
Table 12.9 Knowledge of sexually transmitted infections (STIs)
Percentage of ever-married women age 15-49 who have heard of sexually transmitted infections (STI) other than AIDS, by background characteristics, Jordan 2012
Background characteristic
Heard of STIs
Number of ever-married
women
Age 15-24 31.2 1,485
15-19 20.9 278 20-24 33.6 1,207
25-29 38.4 2,006 30-39 39.0 4,234 40-49 44.5 3,626
Marital status Married 39.8 10,801 Divorced/separated/widowed 37.0 551
Residence Urban 41.1 9,458 Rural 32.3 1,894
Region Central 43.0 7,181 North 32.5 3,120 South 37.7 1,051
Governorate Amman 44.6 4,454 Balqa 40.8 765 Zarqa 40.6 1,659 Madaba 37.7 303 Irbid 33.3 1,986 Mafraq 29.0 562 Jarash 33.9 320 Ajloun 32.5 251 Karak 37.8 441 Tafiela 41.4 167 Ma'an 32.6 178 Aqaba 38.5 265
Badia Badia 29.4 705 Non Badia 40.3 10,647
Camps Camp 35.7 413 Non camp 39.8 10,939
Education No education 14.7 267 Elementary 21.3 860 Preparatory 24.7 1,677 Secondary 35.4 5,073 Higher 59.4 3,475
Wealth quintile Lowest 25.3 2,137 Second 30.8 2,343 Middle 37.7 2,461 Fourth 47.3 2,336 Highest 58.0 2,076
Total 15-49 39.6 11,352

180 • HIV/AIDS-Related Knowledge, Attitudes, and Behavior
Those who have heard of STIs were asked to specify what type of STI they have heard about. The most commonly known STIs are syphilis, mentioned by 58 percent of women; gonorrhea, mentioned by 46 percent of women; and hepatitis, mentioned by 15 percent of women (data not shown separately).
12.5 EXPOSURE TO MEDIA MESSAGES ABOUT AIDS
Media messages play an important role in transmitting information about HIV/AIDS and its spread and are an important and effective tool for educating the general population. The JPFHS asked ever-married women who have heard of AIDS if they had heard, seen, or received information about HIV/AIDS in the previous six months.
Table 12.10 shows that three-fifths of women (60 percent) have had no exposure to media messages about AIDS in the past six months. Non-exposure to media messages about AIDS ranges from a low of 42 percent among women in Karak to a high of 66 percent among women in Irbid. Not surprisingly, women with no education are most likely to have had no exposure (79 percent).
Table 12.10 Exposure to media messages about AIDS Among ever-married women age 15-49 who have heard of AIDS, percentage who have heard, seen, or received information about HIV/AIDS from specific sources in the 6 months before the survey, by background characteristics, Jordan 2012
Background characteristic
Media
Television Radio Print
media Social
meetings Health worker Husband
Other relatives, friends,
neighbors Other No
media
Number of ever- married women
Age 15-24 31.6 2.5 4.0 0.4 0.5 0.5 1.9 0.4 64.5 1,468
15-19 30.0 3.6 2.5 1.0 0.4 1.0 2.9 1.6 64.2 26420-24 31.9 2.2 4.3 0.3 0.5 0.4 1.7 0.2 64.5 1,204
25-29 34.2 1.5 5.8 1.0 0.9 0.6 3.9 0.0 60.4 1,99630-39 33.4 2.3 5.3 1.1 1.4 1.1 3.2 0.3 61.3 4,21040-49 38.2 2.4 7.1 1.4 1.4 1.6 3.5 0.3 56.0 3,585
Marital status Married 34.8 2.1 5.8 1.1 1.2 1.2 3.0 0.3 60.2 10,715Divorced/separated/
widowed 36.3 3.3 5.2 1.4 0.3 0.0 6.7 0.0 53.2 545
Residence Urban 33.7 2.3 5.5 1.0 1.2 1.0 3.3 0.3 60.7 9,394Rural 40.7 1.4 7.1 1.8 1.3 1.5 3.0 0.2 55.4 1,865
Region Central 34.7 2.7 5.7 1.1 1.2 1.1 3.6 0.3 59.8 7,132North 32.0 1.3 4.8 0.9 0.9 0.6 2.2 0.2 62.9 3,091South 44.0 1.3 9.1 1.8 1.8 2.3 3.5 0.3 50.9 1,036
Governorate Amman 33.6 3.2 5.3 0.5 0.9 1.3 3.5 0.3 60.9 4,425Balqa 34.5 1.4 5.4 3.5 2.4 0.9 5.0 0.4 60.2 756Zarqa 36.0 2.0 6.8 1.5 1.4 0.7 3.4 0.3 58.1 1,651Madaba 44.0 2.8 6.6 1.6 1.9 0.9 2.8 0.5 52.4 301Irbid 28.6 1.3 4.4 0.8 0.9 0.7 2.1 0.2 65.5 1,970Mafraq 35.4 0.8 3.3 1.2 0.5 0.4 2.1 0.1 61.7 553Jarash 41.7 1.4 8.5 0.8 1.1 0.4 2.0 0.1 53.8 318Ajloun 38.6 2.1 6.4 0.5 1.0 0.9 3.5 0.2 57.0 250Karak 51.5 1.7 11.7 2.0 2.3 4.1 4.3 0.1 42.4 437Tafiela 41.2 1.1 8.2 2.0 2.5 1.7 5.0 0.1 54.9 165Ma'an 33.7 1.1 6.8 0.5 1.7 0.7 3.6 0.3 61.1 172Aqaba 39.9 1.1 6.9 2.0 0.6 0.9 1.0 0.9 55.8 261
Badia Badia 36.5 1.0 3.7 0.9 1.2 0.3 3.2 0.1 61.0 684Non Badia 34.7 2.3 5.9 1.1 1.2 1.1 3.2 0.3 59.8 10,575
Camps Camp 33.9 1.1 5.5 1.3 1.6 0.6 3.7 0.1 61.5 408Non camp 34.9 2.2 5.8 1.1 1.2 1.1 3.2 0.3 59.8 10,852
Education No education 17.5 0.7 0.1 0.5 0.0 0.2 4.6 0.0 79.3 237Elementary 26.8 0.4 2.6 0.8 0.8 0.0 3.7 0.0 71.2 837Preparatory 34.4 1.9 4.7 0.8 1.0 1.2 3.7 0.4 61.1 1,647Secondary 35.0 2.5 5.0 0.8 0.8 1.3 3.0 0.2 60.5 5,064Higher 37.9 2.4 8.6 1.7 2.1 1.0 3.1 0.4 54.3 3,474
Wealth quintile Lowest 30.5 1.3 4.8 0.6 0.8 0.6 3.6 0.3 66.1 2,085Second 39.1 1.9 4.6 1.2 1.2 1.1 3.2 0.0 56.8 2,326Middle 37.9 2.1 7.2 1.6 1.8 1.1 3.2 0.2 56.1 2,454Fourth 34.4 2.7 7.6 1.0 1.0 1.7 3.6 0.2 60.5 2,327Highest 31.3 2.8 4.4 1.0 1.0 0.8 2.4 0.7 60.8 2,068
Total 15-49 34.8 2.2 5.8 1.1 1.2 1.1 3.2 0.3 59.9 11,259

HIV/AIDS-Related Knowledge, Attitudes, and Behavior • 181
The most important source of exposure to AIDS messages is the television, mentioned by one-third of women (35 percent). The print media is mentioned by 6 percent; friends, relatives, and neighbors by 3 percent; and radio by 2 percent. Women’s exposure to information about AIDS on the television is highest among those residing in Karak (52 percent) and lowest in Irbid (29 percent).
12.6 AIDS-RELATED KNOWLEDGE AMONG YOUTH
Knowledge of AIDS among youth age 15-24 is of particular interest because the period between sexual initiation and marriage is, for many young people, a time of sexual experimentation that may involve high-risk behaviors. This section considers two issues that relate to knowledge of both transmission and prevention of AIDS among youth: the extent to which youth have comprehensive knowledge about AIDS transmission and prevention modes and knowledge of a source where they can obtain condoms.
Knowledge of how AIDS is transmitted is crucial for people to avoid contracting HIV. Young people are often at greater risk because they have short relationships with more partners or engage in other risky behaviors. In a country like Jordan, where sexual intercourse occurs predominantly within the context of marriage, this may be of lesser importance. However, AIDS-related knowledge is important when age at marriage is relatively low as in Jordan. Table 12.11 shows the level of comprehensive knowledge of AIDS among youth, and the percentage of youth who know of a source where they can obtain condoms. As noted earlier, comprehensive knowledge of AIDS is defined as knowing that consistent use of condoms during sexual intercourse and having just one uninfected faithful partner can reduce the chances of contracting HIV, knowing that a healthy-looking person can have HIV, and rejecting the two most common misconceptions about HIV transmission in Jordan (that HIV can be transmitted by mosquito bites and that it can be transmitted by sharing food with someone who has AIDS).
Less than one in ten (9 percent) ever-married young women have comprehensive knowledge of AIDS in Jordan. Comprehensive knowledge is lower among women age 15-17, young women living in urban areas and in the Central region, women residing in Badia and camp areas, and women with low levels of education.
Table 12.11 Comprehensive knowledge about AIDS and of a source of condoms among young women
Percentage of ever-married women age 15-24 with comprehensive knowledge about AIDS and percentage with knowledge of a source of condoms, by background characteristics, Jordan 2012
Background characteristic
Percentage with comprehensive
knowledge of AIDS1
Percentage who know a
condom source2 Number
of women
Age 15-19 5.6 55.3 278
15-17 2.1 47.0 64 18-19 6.6 57.8 214
20-24 9.3 80.0 1,207 20-22 9.2 79.2 586 23-24 9.4 80.7 621
Residence Urban 8.2 75.1 1,271 Rural 11.1 77.0 214
Region Central 7.4 74.9 913 North 10.1 75.2 454 South 11.9 79.6 118
Badia Badia 5.2 71.0 99 Non Badia 8.8 75.7 1,387
Camps Camp 7.1 72.1 56 Non camp 8.7 75.5 1,429
Education No education * * 13 Elementary 3.6 54.7 68 Preparatory 7.1 65.0 264 Secondary 8.0 78.1 782 Higher 12.3 81.1 359
Total 15-24 8.6 75.4 1,485
Note: An asterisk indicates that a figure is based on fewer than 25 unweighted cases and has been suppressed. 1 Comprehensive knowledge means knowing that consistent use of condoms during sexual intercourse and having just one uninfected faithful partner can reduce the chance of getting the AIDS virus, knowing that a healthy-looking person can have the AIDS virus, and rejecting the two most common local misconceptions about AIDS transmission or prevention of the AIDS virus. The components of comprehensive knowledge are presented in Tables 12.2, and 12.3. 2 For this table, the following responses are not considered a source for condoms: friends, family members, and home.

182 • HIV/AIDS-Related Knowledge, Attitudes, and Behavior
Table 12.11 shows that three-fourths of young women (75 percent) know where to get condoms. Knowledge of a source for condoms follows expected patterns by background characteristics, with the exception being that young women in rural areas are slightly more likely than those in urban areas to know a condom source.
12.7 KNOWLEDGE OF TUBERCULOSIS
Tuberculosis (TB) is an infectious disease caused by mycobacteria. TB usually attacks the lungs (as pulmonary TB) but it can also affect other systems of the body. TB is spread through the air when an infectious person coughs, sneezes, or spits. In the 2012 JPFHS, women were asked if they had ever heard of TB, whether they knew how TB spreads from one person to another, whether TB can be cured, and if they would be willing to be tested for TB.
Table 12.12 shows that 96 percent of ever-married women have heard of TB. There are no significant variations in knowledge of TB by most background characteristics except that women age 15-19 are far less likely than older women to have heard of TB. Knowledge of TB increases with level of education and wealth.
Data in Table 12.13 indicate that, among women who have heard of TB, only 41 percent know how TB is transmitted from one person to another. Knowledge of the means of transmission of TB is the highest among women age 40-49, women residing in the South region and in Karak, and women in the non Badia and non camp areas. However, even among these women, only 50 percent or less know that TB is spread through the air by an infected person coughing or sneezing.
Wider variations are found by educational level and household wealth quintile. Knowledge of the means of transmission of TB increases as educational level and wealth quintile increase. However, only 53 percent of women with higher education and 53 percent of women in the highest wealth quintile know how TB is spread from person to person.
Table 12.13 also shows that 60 percent of women who have ever heard of TB reported that it can be cured. Variations according to background characteristics follow approximately the same pattern as knowledge of the route of transmission of TB; however, differences are negligible. Data also
Table 12.12 Knowledge of tuberculosis
Percentage of ever-married women age 15-49 who have heard of tuberculosis, by background characteristics, Jordan 2012
Background characteristic
Heard of tuberculosis
Number of women
Age 15-24 88.9 1,485
15-19 81.0 27820-24 90.7 1,207
25-29 94.8 2,00630-39 97.1 4,23440-49 98.1 3,626
Marital status Married 96.0 10,801Divorced/separated/
widowed 94.7 551
Knows condom source1 Yes 97.3 9,219No 90.0 2,133
Residence Urban 95.8 9,458Rural 96.7 1,894
Region Central 96.0 7,181North 95.6 3,120South 96.6 1,051
Governorate Amman 95.6 4,454Balqa 95.8 765Zarqa 96.5 1,659Madaba 98.8 303Irbid 94.6 1,986Mafraq 98.2 562Jarash 95.2 320Ajloun 98.4 251Karak 96.5 441Tafiela 96.8 167Ma'an 96.5 178Aqaba 96.9 265
Badia Badia 97.0 705Non Badia 95.9 10,647
Camps Camp 93.2 413Non camp 96.1 10,939
Education No education 91.7 267Elementary 89.7 860Preparatory 93.3 1,677Secondary 96.2 5,073Higher 98.7 3,475
Wealth quintile Lowest 93.3 2,137Second 95.3 2,343Middle 95.8 2,461Fourth 96.6 2,336Highest 98.8 2,076
Total 15-49 96.0 11,352
1 For this table, the following responses are not considered a source for condoms: friends, family members, and home.

HIV/AIDS-Related Knowledge, Attitudes, and Behavior • 183
indicate that 40 percent of women would be willing to take a TB test, much less than what was reported in the 2007 JPFHS. This varies from a minimum of 32 percent in Mafraq to a maximum of 45 percent in Ajloun. Variations by other background characteristics are mixed and do not follow any clear pattern.
Table 12.13 Comprehensive knowledge of tuberculosis and willingness to be tested
Among ever-married women age 15-49 who have heard of tuberculosis, the percentage who know that tuberculosis is spread from one person to another through the air when coughing or sneezing, the percentage who know that tuberculosis can be cured, and the percentage who are willing to be tested for tuberculosis, by background characteristics, Jordan 2012
Background characteristic
Know that tuberculosis is
spread from one person to
another through the air when coughing or
sneezing
Know that tuberculosis can be cured
Willing to be tested for
tuberculosis Number
of women
Age 15-24 27.6 51.2 45.0 1,320
15-19 21.4 50.1 39.5 225 20-24 28.8 51.4 46.1 1,095
25-29 33.4 55.3 40.1 1,902 30-39 41.8 59.5 40.0 4,113 40-49 48.5 67.3 37.6 3,558
Marital status Married 40.6 60.2 40.0 10,371 Divorced/separated/widowed 44.5 63.2 37.5 522
Knows condom source1 Yes 42.4 61.5 41.1 8,972 No 33.0 55.0 34.0 1,920
Residence Urban 41.1 61.0 40.4 9,061 Rural 39.2 57.0 37.1 1,831
Region Central 42.2 61.4 42.0 6,893 North 36.5 59.6 36.3 2,984 South 43.8 55.0 35.8 1,016
Governorate Amman 43.5 62.0 42.7 4,260 Balqa 36.6 60.6 41.1 733 Zarqa 40.2 60.8 41.8 1,600 Madaba 47.1 58.2 34.9 299 Irbid 36.3 57.5 36.0 1,879 Mafraq 41.7 66.6 32.2 552 Jarash 33.7 57.5 38.8 305 Ajloun 30.6 62.3 45.0 247 Karak 50.1 53.9 34.6 426 Tafiela 42.0 57.7 39.2 161 Ma'an 34.9 51.9 39.6 172 Aqaba 40.5 57.2 33.4 257
Badia Badia 36.0 58.6 36.5 684 Non Badia 41.1 60.4 40.1 10,208
Camps Camp 36.1 55.0 46.7 385 Non camp 41.0 60.5 39.6 10,508
Education No education 23.7 52.9 36.0 245 Elementary 24.5 48.0 33.3 771 Preparatory 29.3 55.4 41.6 1,564 Secondary 39.4 59.4 40.2 4,880 Higher 52.9 67.2 40.3 3,432
Wealth quintile Lowest 30.7 54.4 44.1 1,994 Second 35.4 56.9 39.1 2,233 Middle 39.9 58.1 40.3 2,359 Fourth 44.7 64.5 38.2 2,256 Highest 53.1 67.8 37.7 2,051
Total 15-49 40.8 60.3 39.8 10,892


Women’s Empowerment • 185
WOMEN’S EMPOWERMENT 13
his chapter looks at indicators of women’s status and empowerment, such as working status, use of earnings, and participation in decision making. It also presents data on women’s attitudes towards wife beating and a woman’s ability to refuse sexual intercourse with her husband.
13.1 WOMEN’S WORK STATUS
In the 2012 JPFHS, ever-married women age 15-49 were asked a number of questions about their work, including whether they were currently working or not. Women who were currently working were then asked additional questions about the kind of work they do, their employment status, who makes the decision about how their earnings are used, and what proportion of household expenditures are paid for by the income gained from their own employment.
A relatively small proportion of Jordanian women (16 percent) were employed in the seven days prior to the interview (Table 13.1). The proportion of currently married women who are currently employed ranges from less than 1 percent among those age 15-19 to 20 percent among those age 45-49.
Table 13.1 Employment of currently married women
Percentage of currently married women age 15-49 who were employed at any time in the past 7 days and, among those employed in the past 7 days, percent distribution by employment status, according to age, Jordan 2012
Age Percentage employed
Number of women
Employment status
Total Number
of women Employee Employer Self-
employed Unpaid worker
15-19 0.1 264 100.0 na na na 100.0 020-24 5.5 1,171 97.3 0.0 2.1 0.6 100.0 6425-29 15.5 1,935 91.8 0.3 7.6 0.2 100.0 30030-34 19.2 2,055 92.1 1.2 6.5 0.2 100.0 39535-39 16.8 2,012 89.0 2.3 8.6 0.2 100.0 33840-44 17.8 1,944 87.2 1.1 8.6 3.1 100.0 34645-49 20.0 1,419 77.4 3.9 17.2 1.5 100.0 283
Total 16.0 10,801 88.3 1.6 9.1 1.0 100.0 1,726
na = Not applicable
T
Key Findings
• Only 16 percent of ever-married Jordanian women were employed at the time of the survey.
• Two-fifths (39 percent) of currently employed women earning cash made independent decisions on how to spend their earnings.
• Ninety-three percent of ever-married women age 15-49 do not own a house or land and only 3 percent own a house or land by themselves.
• Two-thirds (65 percent) of currently married women participate either alone or jointly with their husband in making all three specified decisions pertaining to their own health care, major household purchases, and visits to their family or relatives.
• Seventy percent of ever-married women accept at least one reason as a justification for wife beating. Women are most likely to agree that if a woman has relations with other men, it justifies wife beating (65 percent).

186 • Women’s Empowerment
Among those who are currently working, the majority are employees, that is, they work for someone else (88 percent); 2 percent are employers, 9 percent are self-employed, and 1 percent are unpaid workers. Women age 45-49 are more likely to be self-employed (17 percent) than younger women.
13.2 WOMEN’S CONTROL OVER THEIR OWN EARNINGS AND RELATIVE MAGNITUDE OF
WOMEN’S EARNINGS
Currently married women earning cash for their work were asked who mainly decides how their earnings will be used and whether they earn more or less than their husband. Table 13.2 shows that 58 percent of women reported that they decide jointly with their husband how their earnings are spent, and 39 percent of women stated that it is mainly their own decision. Young women age 20-24, women who reside in the South region, and women who reside in the Badia areas are less likely than other women to make independent decisions on spending their earnings. Independent decision making is higher in urban areas than in rural areas; 41 percent of urban women mainly decide on their own how to spend their earnings, compared to 30 percent of rural women. The percentage of women who decide how their earnings are spent is lower among women with two children or less than among women with three children or more. There is wide variation in decision making about spending women’s earnings according to level of education. Women with elementary education are least likely to be the sole decision maker (32 percent). Thirty-eight percent of women in the lowest wealth quintile reported being the main decision maker on spending their earnings, compared with 47 percent of women in the highest quintile.
Table 13.2 also shows that 58 percent of women reported earning less than their husband, 16 percent of women reported earning more than their husband, and 15 percent reported earning about the same amount. Young women age 20-24; women with one to two children; women in urban areas, in the Central region, in Zarqa and Aqaba, and in the non Badia and non camp areas; women with elementary education; and women in the highest wealth quintile are more likely to earn less than their husbands than their counterparts in the other categories.

Women’s Empowerment • 187
Table 13.2 Control over women's cash earnings and relative magnitude of women's cash earnings
Percent distribution of currently married women age 15-49 who received cash earnings for employment in the 7 days preceding the survey by person who decides how wife's cash earnings are used and by whether she earned more or less than her husband, according to background characteristics, Jordan 2012
Background characteristic
Person who decides how the wife's cash earnings are used:
Total
Wife's cash earnings compared with husband's earnings:
Total Number
of womenMainly
wife
Wife and husband
jointly Mainly
husband More Less About the
same
Husband has no
earnings
Don't know/
missing
Age 20-24 21.4 73.6 5.1 100.0 5.2 85.6 6.1 3.1 0.0 100.0 6425-29 34.7 63.0 2.3 100.0 15.5 60.8 22.3 1.2 0.1 100.0 29930-34 39.5 56.6 3.9 100.0 19.1 64.8 11.2 4.8 0.0 100.0 39535-39 33.4 65.6 1.1 100.0 19.2 53.1 17.0 9.0 1.7 100.0 33740-44 43.6 53.0 3.5 100.0 14.1 48.4 15.5 20.2 1.8 100.0 33545-49 47.4 45.4 7.2 100.0 13.0 55.1 8.9 22.3 0.7 100.0 279
Number of living children 0 35.7 62.0 2.2 100.0 14.5 52.1 20.7 8.8 3.8 100.0 1591-2 35.8 61.0 3.2 100.0 15.0 64.0 14.7 5.3 1.0 100.0 5783-4 41.0 56.1 2.9 100.0 17.3 58.7 14.4 9.4 0.0 100.0 5975+ 41.5 52.8 5.7 100.0 16.0 49.0 12.0 22.4 0.5 100.0 375
Residence Urban 40.8 55.3 3.9 100.0 15.1 59.5 14.3 10.1 1.0 100.0 1,400Rural 30.0 67.8 2.2 100.0 20.2 50.1 15.7 14.0 0.0 100.0 309
Region Central 45.6 50.5 3.9 100.0 14.3 58.9 14.9 10.8 1.1 100.0 1,025North 30.3 66.1 3.6 100.0 20.7 56.4 11.5 10.9 0.4 100.0 455South 25.8 72.1 2.1 100.0 14.1 55.4 19.2 11.0 0.2 100.0 230
Governorate Amman 53.6 42.5 3.8 100.0 11.0 59.6 14.5 13.0 1.9 100.0 625Balqa 35.5 58.1 6.4 100.0 19.4 49.9 22.6 8.1 0.0 100.0 154Zarqa 33.0 65.4 1.6 100.0 19.3 66.5 9.4 4.8 0.0 100.0 174Madaba 27.9 67.9 4.1 100.0 20.4 53.0 14.5 12.2 0.0 100.0 71Irbid 32.2 64.1 3.6 100.0 17.8 61.9 9.4 10.3 0.7 100.0 294Mafraq 27.5 69.8 2.7 100.0 32.7 40.3 14.8 12.1 0.0 100.0 81Jarash 27.5 67.9 4.5 100.0 16.1 52.5 19.8 11.6 0.0 100.0 47Ajloun 23.3 72.5 4.2 100.0 23.8 53.2 10.5 12.5 0.0 100.0 33Karak 22.7 77.1 0.3 100.0 12.5 54.2 23.7 9.6 0.0 100.0 117Tafiela 27.6 71.1 1.4 100.0 30.0 45.2 11.5 12.3 1.0 100.0 35Ma'an 26.0 70.4 3.6 100.0 14.2 54.8 14.3 16.1 0.5 100.0 33Aqaba 32.4 61.0 6.6 100.0 6.0 67.2 16.9 9.8 0.0 100.0 44
Badia Badia 32.3 64.0 3.7 100.0 30.0 38.8 16.4 14.3 0.5 100.0 84Non Badia 39.2 57.3 3.6 100.0 15.3 58.7 14.5 10.7 0.8 100.0 1,625
Camps Camp 37.9 57.9 4.2 100.0 24.4 46.1 17.0 11.5 1.1 100.0 35Non camp 38.9 57.6 3.6 100.0 15.8 58.0 14.5 10.8 0.8 100.0 1,674
Education No education * * * * * * * * * * 21Elementary 32.4 57.8 9.8 100.0 3.0 66.2 17.0 13.5 0.3 100.0 55Preparatory 53.4 43.5 3.1 100.0 22.6 33.7 16.8 26.9 0.0 100.0 68Secondary 44.2 52.6 3.2 100.0 10.3 61.7 9.7 17.7 0.6 100.0 315Higher 37.0 59.7 3.3 100.0 17.8 57.8 15.7 7.7 1.0 100.0 1,250
Wealth quintile Lowest 38.4 52.8 8.8 100.0 10.4 48.6 12.7 28.1 0.1 100.0 136Second 38.0 58.8 3.2 100.0 21.4 54.0 11.4 13.1 0.1 100.0 221Middle 33.5 62.6 3.9 100.0 13.5 59.5 14.1 10.3 2.5 100.0 335Fourth 33.3 63.9 2.9 100.0 21.6 50.9 17.4 10.0 0.0 100.0 471Highest 47.4 49.8 2.8 100.0 11.9 66.3 14.1 6.7 1.0 100.0 547
Total 38.8 57.6 3.6 100.0 16.0 57.8 14.6 10.8 0.8 100.0 1,709
Note: Total includes 1 woman age 15-19 who is not shown separately. An asterisk indicates that a figure is based on fewer than 25 unweighted cases and has been suppressed.
13.3 CONTROL OVER HUSBANDS’ EARNINGS
Currently married women age 15-49 whose husbands have earnings were asked who decides how their husbands’ earnings are used. Table 13.3 shows women’s responses on who makes the decision about their husband’s earnings. Sixty-two percent of currently married women whose husbands receive earnings say that they decide jointly with their husband about the use of his cash earnings, 5 percent say that they decide by themselves, 33 percent say that their husband alone decides, and less than 1 percent say that others decide.

188 • Women’s Empowerment
Table 13.3 Control over husband's earnings
Percent distribution of currently married women age 15-49 whose husbands have earnings, by person who decides how husband's earnings are used, according to background characteristics, Jordan 2012
Background characteristic
Person who decides how husband's earnings are used:
Total Number of
women Mainly
wife
Husband and wife
jointly Mainly
husband Other
Age 15-19 0.1 47.3 50.8 1.8 100.0 256 20-24 2.5 64.6 32.0 1.0 100.0 1,113 25-29 4.0 63.2 32.6 0.2 100.0 1,840 30-34 3.8 63.8 32.2 0.2 100.0 1,905 35-39 4.7 62.1 33.0 0.3 100.0 1,776 40-44 7.1 63.4 29.0 0.5 100.0 1,635 45-49 6.8 58.0 35.1 0.1 100.0 1,062
Number of living children 0 2.7 67.6 28.9 0.9 100.0 815 1-2 3.1 64.6 31.7 0.7 100.0 2,709 3-4 5.5 60.3 34.0 0.1 100.0 3,317 5+ 5.7 60.9 33.1 0.3 100.0 2,746
Residence Urban 5.0 61.4 33.3 0.4 100.0 8,081 Rural 3.0 67.3 29.3 0.4 100.0 1,506
Region Central 5.7 59.1 34.8 0.5 100.0 6,180 North 3.0 67.2 29.6 0.3 100.0 2,568 South 2.1 71.4 26.4 0.1 100.0 839
Governorate Amman 6.2 57.6 35.5 0.7 100.0 3,869 Balqa 5.0 55.0 40.0 0.1 100.0 634 Zarqa 5.0 63.3 31.5 0.2 100.0 1,426 Madaba 3.8 67.5 28.8 0.0 100.0 250 Irbid 3.0 66.4 30.3 0.3 100.0 1,686 Mafraq 2.7 66.9 30.3 0.2 100.0 421 Jarash 3.9 68.6 27.4 0.1 100.0 265 Ajloun 2.4 72.8 24.6 0.1 100.0 197 Karak 1.4 77.4 21.1 0.1 100.0 350 Tafiela 3.6 64.7 31.4 0.3 100.0 137 Ma'an 1.7 64.9 33.2 0.2 100.0 126 Aqaba 2.3 69.8 27.9 0.0 100.0 226
Badia Badia 4.1 55.5 39.4 0.9 100.0 521 Non Badia 4.7 62.7 32.3 0.4 100.0 9,065
Camps Camp 6.0 57.5 35.6 0.9 100.0 348 Non camp 4.6 62.5 32.5 0.4 100.0 9,239
Education No education 5.4 44.0 50.6 0.0 100.0 148 Elementary 5.5 45.5 47.5 1.5 100.0 569 Preparatory 4.3 53.7 41.1 0.9 100.0 1,310 Secondary 5.9 60.3 33.5 0.3 100.0 4,414 Higher 2.9 72.6 24.4 0.0 100.0 3,146
Wealth quintile Lowest 4.9 55.6 38.7 0.8 100.0 1,560 Second 4.3 62.3 33.1 0.3 100.0 1,910 Middle 5.1 63.3 31.4 0.2 100.0 2,139 Fourth 4.6 63.4 31.5 0.5 100.0 2,068 Highest 4.3 65.5 29.9 0.2 100.0 1,910
Total 4.6 62.3 32.7 0.4 100.0 9,587
Joint decision making is more commonly reported by childless women, women living in rural areas, those in the South region, and those residing in the non Badia and non camp areas. In addition, 73 percent of currently married women with higher education and 66 percent of women in the highest wealth quintile say that they make decisions about the use of their husband’s earnings jointly with their husband. Decision making by mainly the husband is higher among women with no education and women in the youngest (15-19) age group (51 percent each).

Women’s Empowerment • 189
The level of women’s earnings relative to their husbands’ earnings is expected to be associated with women’s control over their own and their husbands’ earnings. To examine this association, Table 13.4 shows the percent distribution of currently married women age 15-49 with earnings in the last seven days by the person who decides how the wife’s earnings are used and the distribution of currently married women age 15-49 whose husbands have earnings by the person who decides how the husband’s earnings are used, according to women’s earnings relative to their husband’s earnings.
Table 13.4 Women's control over their own earnings and over those of their husbands
Percent distribution of currently married women age 15-49 with earnings in the last 7 days by person who decides how the wife's earnings are used and percent distribution of currently married women age 15-49 whose husbands have earnings by person who decides how the husband's earnings are used, according to the relation between wife's and husband's earnings, Jordan 2012
Women's earnings relative to husband's earnings
Person who decides how the wife's earnings are used:
Total Number
Person who decides how husband's earnings are used:
Total Number
of womenMainly wife
Wife and husband
jointly Mainly
husband Mainly
wife
Wife and husband
jointly Mainly
husband Other
More than husband 31.3 65.7 3.0 100.0 273 10.3 75.4 14.4 0.0 100.0 273Less than husband 42.2 54.7 3.1 100.0 987 5.2 68.4 26.4 0.0 100.0 987Same as husband 26.5 69.7 3.8 100.0 249 2.2 78.3 19.5 0.0 100.0 249Husband has no earnings
or did not work 45.0 47.9 7.1 100.0 185 na na na na na na Woman worked but has no
earnings na na na na na * * * * * 17Woman did not work na na na na na 4.5 60.7 34.4 0.5 100.0 8,047
Total1 38.8 57.6 3.6 100.0 1,709 4.6 62.3 32.7 0.4 100.0 9,587
Note: An asterisk indicates that a figure is based on fewer than 25 unweighted cases and has been suppressed.na = Not applicable 1 Includes cases where a woman does not know whether she earned more or less than her husband.
The table shows that women who earn about the same as their husbands are most likely to jointly
decide about the use of both their own earnings (70 percent) and their husband’s earnings (78 percent). Women who earn more than their husband are more likely than other women to be the main decision maker about the use of their husband’s earnings (10 percent), but women whose husbands have no earnings or did not work are more likely than other women to be the main decision makers about their own earnings (45 percent).
13.4 WOMEN’S OWNERSHIP OF ASSETS
Ownership of assets, particularly high value assets, has many beneficial effects for households, including protection against financial ruin. Women’s individual ownership of assets enables their economic empowerment and provides protection in the case of marital dissolution or abandonment. The 2012 JPFHS collected information on women’s ownership (alone, jointly, and alone and jointly) of two high value assets, namely, land and a house.
Table 13.5 shows that 93 percent of currently married women age 15-49 do not own a house and the same percentage do not own land. Three percent of currently married women own a house or land by themselves. Currently married women’s ownership of a house and land increases with age and wealth. Urban currently married women, those from the Central region, women in Amman, and those from the non Badia and non camp areas are more likely to own a house alone than rural currently married women and women in other regions and areas. In contrast, currently married women living in non camp areas, those in the North and South regions, and those living in Ma’an are more likely to own land alone than currently married women in other regions and areas. Women with higher education are most likely to own land or a house.

190 • Women’s Empowerment
Table 13.5 Ownership of assets
Percent distribution of currently married women age 15-49 by ownership of housing and land, according to background characteristics, Jordan 2012
Background characteristic
Percentage who own a house:
Total
Percentage who own land:
Total Number of
women Alone Jointly Alone
and jointly
Percent-age who
do not own a house Alone Jointly
Alone and jointly
Percent-age who do not
own land
Age 15-19 0.4 1.6 0.0 98.0 100.0 0.0 1.4 0.1 98.6 100.0 264 20-24 0.1 1.1 0.0 98.8 100.0 0.3 2.0 0.0 97.7 100.0 1,171 25-29 1.2 1.8 0.0 97.0 100.0 1.9 2.2 0.0 95.9 100.0 1,935 30-34 1.9 4.7 0.0 93.3 100.0 3.0 3.1 0.2 93.8 100.0 2,055 35-39 3.9 3.6 0.0 92.5 100.0 3.0 4.0 0.1 92.9 100.0 2,012 40-44 5.4 4.0 0.0 90.7 100.0 4.5 4.9 0.3 90.3 100.0 1,944 45-49 7.1 5.8 0.0 87.2 100.0 7.8 4.7 0.0 87.5 100.0 1,419
Residence Urban 3.5 3.7 0.0 92.8 100.0 3.3 3.1 0.1 93.6 100.0 8,983 Rural 2.0 2.6 0.0 95.4 100.0 3.7 5.4 0.1 90.7 100.0 1,818
Region Central 3.8 3.6 0.0 92.6 100.0 3.1 2.6 0.1 94.2 100.0 6,839 North 2.2 3.8 0.0 94.0 100.0 3.8 5.4 0.2 90.6 100.0 2,966 South 2.3 2.1 0.1 95.5 100.0 3.8 3.4 0.3 92.6 100.0 996
Governorate Amman 5.0 4.2 0.0 90.8 100.0 3.3 2.5 0.0 94.2 100.0 4,262 Balqa 2.2 2.6 0.1 95.1 100.0 2.6 3.6 0.4 93.5 100.0 724 Zarqa 1.5 2.8 0.0 95.7 100.0 2.7 2.2 0.1 95.1 100.0 1,564 Madaba 2.8 1.8 0.0 95.4 100.0 3.1 4.5 0.1 92.4 100.0 289 Irbid 2.2 4.7 0.0 93.1 100.0 3.8 5.8 0.2 90.3 100.0 1,892 Mafraq 2.3 2.0 0.0 95.7 100.0 4.1 3.3 0.1 92.5 100.0 528 Jarash 1.8 2.1 0.0 96.1 100.0 3.8 4.8 0.2 91.2 100.0 306 Ajloun 1.6 3.1 0.1 95.3 100.0 2.9 8.1 0.3 88.7 100.0 239 Karak 1.8 1.2 0.0 97.0 100.0 3.4 2.8 0.0 93.8 100.0 420 Tafiela 1.1 3.1 0.4 95.5 100.0 4.9 6.1 1.0 88.0 100.0 161 Ma'an 2.1 0.7 0.0 97.2 100.0 5.7 5.1 0.7 88.6 100.0 163 Aqaba 4.1 4.0 0.1 91.8 100.0 2.3 1.5 0.1 96.1 100.0 253
Badia Badia 1.8 1.9 0.0 96.3 100.0 4.2 3.6 0.1 92.1 100.0 666 Non Badia 3.3 3.6 0.0 93.0 100.0 3.3 3.4 0.1 93.2 100.0 10,135
Camps Camp 2.4 1.8 0.0 95.8 100.0 1.4 0.9 0.0 97.6 100.0 387 Non camp 3.3 3.6 0.0 93.1 100.0 3.4 3.5 0.1 92.9 100.0 10,414
Education No education 0.9 0.5 0.1 98.5 100.0 1.0 0.2 0.1 98.7 100.0 226 Elementary 2.7 2.1 0.0 95.3 100.0 2.8 2.6 0.1 94.6 100.0 788 Preparatory 1.8 1.5 0.0 96.7 100.0 1.9 1.8 0.1 96.2 100.0 1,547 Secondary 2.8 2.9 0.0 94.3 100.0 2.9 3.8 0.0 93.2 100.0 4,863 Higher 4.7 5.9 0.1 89.3 100.0 4.9 4.1 0.3 90.7 100.0 3,376
Wealth quintile Lowest 1.7 1.1 0.0 97.3 100.0 1.6 1.4 0.2 96.9 100.0 1,975 Second 1.8 2.2 0.0 96.0 100.0 2.6 3.0 0.0 94.4 100.0 2,179 Middle 1.8 2.5 0.0 95.7 100.0 2.3 3.5 0.2 94.0 100.0 2,364 Fourth 3.8 4.1 0.0 92.1 100.0 3.1 3.4 0.1 93.4 100.0 2,274 Highest 7.4 7.9 0.1 84.7 100.0 7.3 6.0 0.1 86.5 100.0 2,009
Total 3.2 3.5 0.0 93.2 100.0 3.3 3.5 0.1 93.1 100.0 10,801
13.5 WOMEN’S PARTICIPATION IN DECISION MAKING
The ability of women to make decisions that affect their personal circumstances is an essential element of their empowerment and serves as an important aspect of their overall development. To assess currently married women’s decision-making autonomy, the 2012 JPFHS collected information on three issues: the respondent’s own health care, major household purchases, and visits to her family or relatives.
Table 13.6 shows that 40 percent of currently married women reported that they decide for themselves about seeking their own health care, and 49 percent said that this decision is made jointly with the husband. Eleven percent of women reported that their husbands have the final say over their wives’ health care.

Women’s Empowerment • 191
Table 13.6 Participation in decision making
Percent distribution of currently married women age 15-49 by person who usually makes decisions about various issues, Jordan 2012
Decision Mainly
wife
Wife and husband
jointly Mainly
husband Someone
else Other Total Number
of women
Own health care 40.0 48.7 11.0 0.3 0.0 100.0 10,801 Major household purchases 19.0 58.1 22.2 0.5 0.1 100.0 10,801 Visits to her family or relatives 25.7 60.2 13.7 0.2 0.2 100.0 10,801
More than half of currently married women (58 percent) report that decisions about major
household purchases are made jointly with their husbands. The data show that only 26 percent of currently married women decide on their own regarding visits to their family or relatives.
Table 13.7 shows currently married women’s participation (alone or jointly) in decision making by background characteristics. Sixty-five percent of women participated alone or jointly with their husband on all three decisions, whereas only 3 percent of women did not have a say in making decisions on any of these issues (Figure 13.1). Women are most likely to have the final or joint say with regard to their own health care (89 percent) and visits to their family or relatives (86 percent), while they are less likely to participate in decision making about major household purchases (77 percent).
Currently married women in the South region, those with higher education, those living in the wealthiest households, and those who work are more likely than women in other categories to participate in household decision making on all of the three issues. Sixty-four percent of women who are not currently working participate in all three decisions, in contrast to 74 percent of those who are working. Half of women with no education participate in all decisions, compared with three-fourths of women with higher than secondary education. Participation in all three decisions varies from a high of 81 percent of women in Karak to a low of 59 percent in Jarash.
Figure 13.1
Number of decisions in which currently married women participate
3
8
24
65
0 1 2 3
Number of decisions
Percent of women
JPFHS 2012

192 • Women’s Empowerment
Table 13.7 Women's participation in decision making by background characteristics
Percentage of currently married women age 15-49 who usually make specific decisions either by themselves or jointly with their husband, by background characteristics, Jordan 2012
Background characteristic
Specific decisions
All three decisions
None of the three decisions
Number of women
Woman's own health care
Making major household purchases
Visits to her family or relatives
Age 15-19 77.2 63.7 71.0 43.4 9.6 26420-24 86.5 69.9 82.2 56.6 3.3 1,17125-29 87.0 76.7 86.6 64.0 2.5 1,93530-34 92.0 75.8 86.5 66.6 1.7 2,05535-39 89.4 79.2 84.5 65.7 2.2 2,01240-44 89.5 83.7 89.3 72.6 1.9 1,94445-49 88.2 76.4 87.6 64.5 2.4 1,419
Employment (last 7 days) Employed 90.9 85.3 92.4 73.7 0.7 1,726Not employed 88.3 75.6 84.7 63.5 2.8 9,075
Number of living children 0 81.5 77.2 84.0 59.4 3.4 9301-2 87.6 75.4 86.3 63.5 3.0 2,8803-4 90.8 77.2 85.9 66.6 1.8 3,6735+ 89.4 78.6 86.2 66.5 2.4 3,317
Residence Urban 89.0 77.2 86.0 65.2 2.3 8,983Rural 87.3 77.0 85.8 65.0 3.3 1,818
Region Central 89.1 77.3 86.0 64.9 2.2 6,839North 86.9 75.1 84.6 62.0 2.8 2,966South 91.7 82.1 89.3 75.9 3.6 996
Governorate Amman 88.4 78.1 86.9 65.0 2.1 4,262Balqa 87.0 74.5 85.7 62.9 2.4 724Zarqa 92.6 75.4 83.8 65.9 2.3 1,564Madaba 83.8 83.0 86.2 64.2 1.5 289Irbid 87.5 75.4 84.3 62.0 2.5 1,892Mafraq 87.3 73.0 83.9 62.2 3.5 528Jarash 84.9 72.1 84.7 59.4 3.7 306Ajloun 84.2 81.8 88.3 64.8 1.6 239Karak 95.0 85.2 90.7 81.4 3.3 420Tafiela 87.4 78.9 88.7 68.5 2.9 161Ma'an 87.2 75.6 85.6 65.6 4.6 163Aqaba 91.7 83.3 89.8 78.0 3.7 253
Badia Badia 83.7 69.9 80.2 56.8 4.9 666Non Badia 89.0 77.6 86.3 65.7 2.3 10,135
Camps Camp 87.8 76.1 80.9 62.0 3.4 387Non camp 88.7 77.2 86.1 65.3 2.4 10,414
Education No education 81.4 59.4 70.2 49.6 9.9 226Elementary 81.0 68.8 81.1 53.9 5.3 788Preparatory 87.9 70.1 79.4 55.6 3.5 1,547Secondary 89.8 78.0 85.0 65.9 2.3 4,863Higher 89.8 82.3 92.4 72.1 1.1 3,376
Wealth quintile Lowest 85.4 70.8 78.8 58.0 5.5 1,975Second 89.1 73.8 83.8 61.0 2.4 2,179Middle 88.2 77.7 86.0 65.3 2.3 2,364Fourth 89.2 79.6 88.7 67.0 1.4 2,274Highest 91.7 83.7 92.0 74.3 0.9 2,009
Total 88.7 77.2 85.9 65.1 2.5 10,801
Women’s Empowerment • 193
13.6 WOMEN’S ATTITUDES TOWARD WIFE BEATING
For many years, there has been increasing concern about violence against women in general and domestic violence in particular, in both developed and developing countries. Both tolerance of and experience of domestic violence are significant barriers to the empowerment of women, with consequences for women’s health, their health-seeking behavior, and the health of their children. Learning more about attitudes toward domestic violence is important in a country such as Jordan, where, in some cases, domestic violence and even the murder of one’s wife or daughter, called “honor killing” (Faqir, 2001), have been justified by ideas about family honor and what is required to keep it intact.
In order to assess women’s attitudes toward wife beating, women were asked in the 2012 JPFHS whether they thought that a husband is justified in beating his wife for each of the following reasons: if she burns the food, argues with her husband, insults her husband, goes out without telling her husband, neglects the children, does not feed her husband, or has relations with other men. These reasons, which range from reasons that involve suspicions about a wife’s moral character to those that may be considered more trivial, such as not cooking properly, were chosen to provide variation in the perceived seriousness of violations of behavioral norms. Table 13.8 gives the percentages of ever-married women age 15-49 who agree with various reasons for wife beating by background characteristics.
Seventy percent of women accept at least one reason as a justification for wife beating. Women are most likely to agree that if a woman has relations with other men, it justifies wife beating (65 percent), while relatively few believe that a man is justified in beating his wife if she burns the food (2 percent) or argues with him (6 percent). Thirty-eight percent of women agree that a husband is justified in beating his wife if she insults him, and 25 percent believe that wife beating is justified if a wife does not feed her husband.
Table 13.8 also indicates that young women, women who are not employed, currently married women, women living in the North region, and those who reside in camp areas are the most likely to agree with at least one reason for justifying wife beating. Justification of wife beating for at least one reason decreases with educational level and wealth. In addition, women living in Madaba are more likely to agree that wife beating is justified for at least one specified reason than women in other governorates.

194 • Women’s Empowerment
Table 13.8 Attitude toward wife beating
Percentage of ever-married women age 15-49 who agree that a husband is justified in hitting or beating his wife for specific reasons, by background characteristics, Jordan 2012
Background characteristic
Husband is justified in hitting or beating his wife if she: Percentage who agree
with at least one specified reason
Number of women
Burns the food
Argues with him
Goes out without
telling him
Neglects the
children Insults
him Does not feed him
Has relations with other
men
Age 15-19 3.0 12.0 24.2 25.1 53.4 44.3 77.3 84.1 27820-24 1.2 5.2 12.0 16.9 38.1 26.8 70.2 74.2 1,20725-29 2.0 6.1 13.3 18.5 38.0 26.3 67.4 71.7 2,00630-34 2.0 6.7 10.8 15.6 37.0 23.2 65.6 68.8 2,13635-39 1.5 6.6 11.9 17.2 39.8 26.2 65.8 71.1 2,09840-44 1.4 5.5 12.2 16.5 37.4 22.6 62.4 66.7 2,05545-49 2.6 6.2 11.9 15.9 35.5 22.5 60.1 65.9 1,571
Employment (last 7 days) Employed 0.6 3.1 7.5 11.5 26.9 18.3 53.9 56.7 1,854Not employed 2.0 6.9 13.3 18.1 40.3 26.3 67.6 72.5 9,498
Number of living children 0 0.9 5.6 15.1 17.2 34.7 27.5 62.3 67.2 1,1071-2 1.6 5.4 11.8 15.9 34.7 23.6 65.9 69.8 3,0313-4 1.5 6.1 10.7 15.7 36.0 22.1 64.8 68.5 3,7955+ 2.6 7.4 13.8 19.4 44.5 28.6 66.6 72.5 3,419
Marital status Married 1.8 6.2 12.1 16.6 38.2 24.8 65.8 70.4 10,801Divorced/separated/
widowed 2.1 7.3 17.5 24.4 36.3 28.4 56.6 61.6 551
Residence Urban 1.6 5.8 11.6 16.5 37.2 23.9 65.2 69.6 9,458Rural 2.7 8.5 15.7 19.6 42.7 30.5 66.1 71.4 1,894
Region Central 1.7 5.9 11.2 16.4 35.6 23.2 65.4 69.7 7,181North 2.0 6.7 14.9 18.8 44.6 28.7 68.1 73.4 3,120South 1.8 7.6 12.4 15.6 35.5 26.6 57.5 61.3 1,051
Governorate Amman 1.7 4.5 9.4 13.4 32.2 19.9 64.3 68.6 4,454Balqa 2.6 10.8 17.2 26.4 48.3 37.5 70.1 73.8 765Zarqa 1.5 7.5 12.9 19.7 38.4 24.6 64.2 68.7 1,659Madaba 1.0 4.1 12.4 17.5 38.2 27.2 76.0 80.1 303Irbid 1.6 4.7 15.6 19.5 46.9 29.4 68.4 73.7 1,986Mafraq 3.4 12.7 15.2 17.8 41.2 29.4 64.0 69.2 562Jarash 2.7 11.1 15.4 20.8 45.5 28.1 67.9 75.1 320Ajloun 1.3 3.9 8.7 13.2 33.6 22.6 74.4 78.7 251Karak 1.6 8.1 11.8 16.2 37.8 31.6 69.0 71.8 441Tafiela 1.6 7.5 11.7 16.1 37.7 21.7 56.9 62.3 167Ma'an 4.4 10.1 18.8 22.4 42.3 33.7 61.8 64.9 178Aqaba 0.4 5.2 9.5 9.8 25.5 16.3 35.8 40.8 265
Badia Badia 3.9 10.6 19.8 23.0 44.8 32.5 63.9 68.9 705Non Badia 1.7 6.0 11.8 16.6 37.6 24.5 65.5 70.0 10,647
Camps Camp 2.4 8.6 16.7 25.1 49.3 32.7 72.2 79.0 413Non camp 1.8 6.2 12.1 16.7 37.7 24.7 65.1 69.6 10,939
Education No education 9.7 20.7 33.3 36.2 58.5 44.0 75.0 81.0 267Elementary 4.8 15.6 24.8 29.2 55.1 41.6 69.8 76.1 860Preparatory 2.7 8.2 16.8 21.0 44.4 29.6 69.8 75.8 1,677Secondary 1.6 5.9 11.9 17.3 39.1 25.4 67.8 71.9 5,073Higher 0.3 2.4 6.1 10.1 27.7 16.6 57.8 61.9 3,475
Wealth quintile Lowest 3.9 12.0 21.2 27.2 48.6 34.8 68.7 74.3 2,137Second 2.2 7.1 15.3 20.8 45.8 32.4 68.8 74.2 2,343Middle 1.5 6.4 11.4 16.4 39.5 24.4 67.1 72.4 2,461Fourth 1.1 4.3 9.3 13.9 34.4 21.7 65.6 68.4 2,336Highest 0.3 1.4 4.2 6.5 20.9 10.9 55.8 59.4 2,076
Total 1.8 6.3 12.3 17.0 38.1 25.0 65.4 69.9 11,352

Women’s Empowerment • 195
13.7 WOMEN’S EMPOWERMENT INDICATORS
Table 13.9 provides a brief overview on how the two basic empowerment indicators—number of decisions in which women participate and number of reasons for which wife beating is justified—relate to each other.
Table 13.9 Indicators of women's empowerment
Percentage of currently married women age 15-49 who participate in all decision making and the percentage who disagree with all of the reasons justifying wife beating, by value on each of the indicators of women's empowerment, Jordan 2012
Empowerment indicator
Percentage who participate in all decision making
Percentage who disagree with all
reasons justifying wife
beating Number
of women
Number of decisions in which women participate1 0 na 20.5 265 1-2 na 24.0 3,501 3 na 32.8 7,035
Number of reasons for which wifebeating is justified2 0 72.0 na 3,202 1-2 64.2 na 4,704 3-4 60.0 na 2,013 5-7 56.5 na 882
na = Not applicable 1 See Table 13.6 for the list of decisions. 2 See Table 13.8 for the list of reasons.
The results show strong correlation between the two indicators. The top panel shows that the
proportion of currently married women who disagree with all the specified reasons for wife beating increases with the number of decisions in which women participate, from 21 percent among women who do not participate in any decisions to 33 percent among those who participate in all three of the decisions. The lower panel shows that the greater the number of reasons for which women feel wife beating is justified, the smaller the percentage who participate in all three decisions. For example, almost three out of four currently married women who do not believe wife beating is justified for any reason participate in making all three decisions, compared with only 57 percent of women who believe that wife beating is justified for 5-7 reasons.
13.8 CURRENT USE OF CONTRACEPTION BY WOMEN’S EMPOWERMENT
A woman’s desire and ability to control her fertility and her choice of a contraceptive method are in part affected by her own sense of empowerment. A woman who feels that she is unable to control her life may be less likely to feel that she can make and carry out decisions about her fertility. She may also feel the need to choose methods that are less obvious or which do not depend on her husband’s cooperation. Table 13.10 shows the distribution of currently married women by contraceptive method used, according to the two empowerment indicators.
The data indicate that there is a positive relationship between use of contraception and participation in household decision making. For example, current use of modern contraceptive methods rises from 32 percent among women who participate in none of the household decisions to 43 percent among women who participate in all of the three household decisions.
There is not much variation in use of any contraceptive method by number of reasons for which a women believes wife beating is justified. For each number of reasons, the percentage using any method of contraception ranges from 57 percent to 63 percent. This pattern also applies for women using modern or traditional contraceptive methods.

196 • Women’s Empowerment
Table 13.10 Current use of contraception by women's empowerment
Percent distribution of currently married women age 15-49 by current contraceptive method, according to selected indicators of women's status, Jordan 2012
Empowerment indicator Any
method
Any modern method
Modern methods
Any traditional method
Not currently
using Total Number
of women
Female sterili- zation
Tempo- rary
modern female
methods1 Male
condom
Number of decisions in which women participate2 0 46.2 32.0 2.4 24.1 5.5 14.1 53.8 100.0 2651-2 59.1 41.4 1.9 32.7 6.9 17.6 40.9 100.0 3,5013 62.8 43.1 2.4 32.3 8.5 19.6 37.2 100.0 7,035
Number of reasons for which wife beating is justified3 0 62.4 41.8 2.2 31.4 8.2 20.6 37.6 100.0 3,2021-2 60.5 42.7 1.7 32.8 8.2 17.8 39.5 100.0 4,7043-4 62.5 42.7 3.5 31.5 7.7 19.8 37.5 100.0 2,0135-7 57.3 41.1 1.9 33.6 5.6 16.1 42.7 100.0 882
Total 61.2 42.3 2.2 32.2 7.9 18.9 38.8 100.0 10,801
Note: If more than one method is used, only the most effective method is considered in this tabulation. 1 Pill, IUD, injectables, implants, and lactational amenorrhea method. 2 See Table 13.6 for the list of decisions. 3 See Table 13.8 for the list of reasons.
13.9 IDEAL FAMILY SIZE AND UNMET NEED BY WOMEN’S EMPOWERMENT
The ability of women to make decisions effectively has important implications for their fertility preferences and the practice of family planning. An increase in women’s empowerment is recognized as important for efforts to reduce fertility through at least two main pathways: its negative association with ideal family size and its positive association with women’s ability to meet their own family-size goals through the effective use of contraception.
Table 13.11 shows how women’s ideal family size and their unmet need for family planning vary by women’s empowerment indicators. There is a linear association between the number of reasons a woman believes wife beating is justified and the mean ideal number of children. Women who believe there are no reasons which justify a husband beating his wife consider the ideal number of children to be 3.9, compared to 4.2 among women who believe that wife beating is justified for 5-7 reasons. There is no clear relationship between the mean ideal number of children and women’s participation in decision making.
The data also indicate that there is a direct association between the number of decisions in which a woman participates and unmet need for family planning. Women who participate in one or more decisions have a lower level of unmet need (12 percent) than women who participate in no decisions (16 percent). The relationship between unmet need for family planning and reasons to justify wife beating is mixed, with small differences overall.

Women’s Empowerment • 197
Table 13.11 Ideal number of children and unmet need for family planning by women’s empowerment
Mean ideal number of children for ever-married women 15-49 and the percentage of currently married women age 15-49 with an unmet need for family planning, by indicators of women's empowerment, Jordan 2012
Empowerment indicator
Mean ideal number of children1
Number of women
Percentage of currently married women with an unmet need for family planning
Number of women
For spacing
For limiting Total
Number of decisions in which women participate2 0 4.1 262 4.2 11.9 16.1 265 1-2 3.9 3,399 5.8 5.9 11.6 3,501 3 4.0 6,738 4.5 7.1 11.6 7,035
Number of reasons for which wife beating is justified3 0 3.9 3,275 4.8 5.8 10.6 3,202 1-2 3.9 4,723 4.9 7.7 12.6 4,704 3-4 4.0 2,015 5.4 6.0 11.4 2,013 5-7 4.2 925 4.3 7.6 11.9 882
Total 3.9 10,938 4.9 6.8 11.7 10,801 1 Mean excludes respondents who gave non-numeric responses. 2 Restricted to currently married women. See Table 13.6 for the list of decisions. 3 See Table 13.8 for the list of reasons.


Domestic Violence • 199
DOMESTIC VIOLENCE 14
iolence against women has been acknowledged worldwide as a violation of basic human rights, and an increasing amount of research highlights the health burdens, intergenerational effects, and demographic consequences of such violence (UNGASS, 1991; Heise et al., 1994, 1998;
Jejeebhoy, 1998).
The 2012 JPFHS included a special module designed to obtain information on the extent to which women experience domestic violence. The domestic violence module was administered to women in a subsample of two-thirds of the JPFHS clusters selected for the survey. To ensure confidentiality, only one woman in each designated household in the subsample was randomly selected to be asked questions about domestic violence.
The module included a series of questions to collect information on various forms of spousal violence, including physical and emotional violence. Although the module focused on the extent of spousal violence, information was also obtained on any physical violence involving perpetrators other than the current (last) husband that the woman experienced since her fifteenth birthday. Women who reported recent spousal violence were asked about assistance they may have sought at the time the most recent episode of violence occurred.
14.1 PHYSICAL VIOLENCE
One-third (34 percent) of ever-married women age 15-49 reported that they had been hit, slapped, kicked, or subjected to some other form of physical violence at some point after their fifteenth birthday (Table 14.1). Thirteen percent of women reported that they had been subjected to some form of physical violence at least once within the 12-month period before the interview, including 4 percent who reported that they had often experienced some form of physical violence during the period.
V
Key Findings
• Thirty-four percent of ever-married women age 15-49 have experienced physical violence at least once since age 15, and 13 percent experienced physical violence within the 12 months prior to the survey.
• Nine percent of ever-married women age 15-49 report having experienced sexual violence at least once in their lifetime.
• Overall, 32 percent of ever-married women age 15-49 report ever having experienced emotional, physical, and/or sexual violence from their spouse, and 22 percent report having experienced one or more of these forms of violence in the past 12 months.
• Among ever-married women who had experienced spousal violence (physical or sexual) in the past 12 months, 30 percent reported experiencing physical injuries.
• It is not common for women in Jordan to seek assistance from any source for violence they have experienced. Nearly one in two (47 percent) women have never sought help and never told anyone about the violence they have experienced.
200 • Domestic Violence
The experience of physical violence varies substantially by background characteristics. Women age 25-39 are more likely than other women to have experienced physical violence since age 15 (37 percent). Women age 25-29 are more likely than other women to have experienced physical violence during the 12 months prior to the survey (15 percent). A woman’s marital status is strongly related to the likelihood that she had ever experienced physical violence; the prevalence of violence is higher among formerly married (divorced, separated, or widowed) women (57 percent) than currently married women (33 percent). Thirteen percent of married women report having been subjected to violence often or sometimes in the 12 months preceding the survey.
Urban women, women living in the Central region, and women in the non Badia areas are more likely to have experienced physical violence since age 15 than women in other areas and regions. Women living in Zarqa were more likely to have ever experienced physical violence than women living in other governorates. Experience of physical violence in the past 12 months tends to follow a similar trend for residency, region, and Badia areas. There is a notable variation in the experience of physical violence by camps. Forty-five percent of women living in camps reported experiencing violence since age 15, and 21 percent of women reported experiencing physical violence in the 12 months preceding the survey.
In terms of employment, women who are not employed are more likely than employed women to have experienced physical violence since age 15 as well as during the 12 months preceding the survey (35 percent and 13 percent, respectively).
Women with higher education (26 percent) are less likely than women with lower educational attainment (35-46 percent) to have experienced physical violence since age 15. Similarly, only 8 percent of women with higher education reported experiencing physical violence in the 12 months preceding the survey, compared to 13-15 percent of women with lower levels of education.
Women living in the poorest households are more likely than other women to report physical violence since age 15 as well as during the 12 months preceding the survey (46 percent and 19 percent, respectively).

Domestic Violence • 201
Table 14.1 Experience of physical violence
Percentage of ever-married women age 15-49 who have ever experienced physical violence since age 15 and percentage who have experienced violence during the 12 months preceding the survey, by background characteristics, Jordan 2012
Background characteristic
Percentage who have ever
experienced physical violence
since age 151
Percentage who have experienced physical violence in the past 12 months
Number of women Often Sometimes
Often or sometimes2
Age 15-19 31.1 3.5 10.6 14.1 166 20-24 31.0 3.1 10.7 13.7 744 25-29 37.1 5.4 9.7 15.1 1,215 30-39 36.9 4.2 10.0 14.3 2,684 40-49 31.0 3.3 5.5 8.8 2,219
Residence Urban 35.3 4.3 9.0 13.3 5,814 Rural 29.5 2.6 6.7 9.3 1,213
Region Central 36.4 4.1 9.7 13.9 4,356 North 32.4 4.0 7.2 11.2 1,989 South 26.3 2.9 5.7 8.7 681
Governorate Amman 37.0 4.2 10.5 14.7 2,604 Balqa 31.2 3.3 6.8 10.1 480 Zarqa 38.0 4.8 9.2 14.1 1,083 Madaba 32.7 1.8 10.7 12.6 190 Irbid 34.5 4.6 7.6 12.2 1,245 Mafraq 27.9 2.2 5.1 7.3 364 Jarash 36.5 6.4 8.8 15.2 216 Ajloun 21.2 0.0 6.4 6.4 164 Karak 23.3 1.9 4.3 6.2 288 Tafiela 32.6 5.6 7.7 13.4 109 Ma'an 25.2 1.7 5.5 7.3 114 Aqaba 28.1 3.7 6.7 10.7 171
Badia Badia 31.6 3.5 8.4 11.9 462 Non Badia 34.5 4.0 8.6 12.7 6,565
Camps Camp 44.7 6.9 13.9 20.8 274 Non camp 33.9 3.9 8.4 12.3 6,753
Marital status Married 33.2 4.1 8.8 12.9 6,714 Divorced/separated/widowed 57.1 1.3 5.6 6.9 313
Number of living children 0 32.9 2.2 5.5 7.7 663 1-2 33.0 3.8 9.8 13.6 1,844 3-4 34.9 4.2 10.0 14.2 2,379 5+ 35.2 4.4 7.0 11.6 2,141
Employment (last 7 days) Employed 31.0 3.1 6.9 10.0 1,141 Not employed 34.9 4.1 9.0 13.1 5,886
Education No education 36.9 3.5 9.0 12.5 152 Elementary 45.7 7.7 6.4 14.1 537 Preparatory 42.0 5.1 10.0 15.1 1,055 Secondary 35.0 4.5 10.1 14.7 3,167 Higher 26.3 1.7 6.2 7.9 2,116
Wealth quintile Lowest 45.6 7.3 11.2 18.5 1,335 Second 36.0 4.5 8.2 12.7 1,504 Middle 33.3 3.7 9.2 13.0 1,554 Fourth 28.1 2.5 5.8 8.4 1,389 Highest 28.2 1.8 8.8 10.6 1,245
Total 34.3 4.0 8.6 12.6 7,027 1 Includes violence in the past 12 months. For women who were married before age 15 and who reported physical violence, the violence could have occurred before age 15. 2 Includes women who report physical violence in the past 12 months but for whom frequency is not known.

202 • Domestic Violence
Table 14.2 shows the percentage of ever-married women who have ever experienced violence according to the persons identified as perpetrators of the violence. The most commonly reported perpetrator of physical violence is the current husband (57 percent. More than one in four (27 percent) women report physical violence by a brother, one in five (21 percent) women report physical violence by their father, and one in ten (10 percent) women report physical violence by a former husband.
Table 14.2 Persons committing physical violence
Among ever-married women age 15-49 who have experienced physical violence since age 15, percentage who report specific persons who committed the violence, according to the respondent's current marital status, Jordan 2012
Person
Percentage of ever-married
women
Current husband 56.9 Former husband 9.7 Father 21.2 Mother 14.3 Brother 27.0 Sister 2.8 Stepfather/stepmother 0.7 Other relative 1.0 Teacher 4.0 Other male 0.3 Other 0.6
Number of women who have experienced physical violence since age 15 2,410
14.2 SEXUAL VIOLENCE
Table 14.3 shows the percentage of ever-married women age 15-49 who have ever experienced spousal sexual violence, by background characteristics. The results show that 9 percent of women have ever experienced sexual violence from a current or former husband. There is a notable variation in experience of sexual violence by age. Women age 20-24 are less likely to report sexual violence than women in the other age groups. Differences in the experience of sexual violence are also seen by region and camps. Women in the North region and those living in the camp areas are more likely to report spousal sexual violence (11 percent and 12 percent, respectively) than women living in non camp areas (9 percent), in the Central region (9 percent), and in the South region (7 percent).
Women who are divorced, separated, or widowed are much more likely to have ever experienced spousal sexual violence (23 percent) than currently married women (9 percent). Women who are not employed, women with higher education, and women in the highest wealth quintile are less likely to report sexual violence than their counterparts in the other categories.
Six percent of women report having experienced sexual violence in the 12 months preceding the survey. The variation by background characteristics among women who have experienced sexual violence in the past 12 months is similar to the variation among women who have ever experienced sexual violence except by marital status.

Domestic Violence • 203
Table 14.3 Experience of sexual violence
Percentage of ever-married women age 15-49 who have ever experienced sexual violence from their current or former husband and percentage who have experienced this sexual violence in the 12 months preceding the survey, by background characteristics, Jordan 2012
Background characteristic
Percentage who have experienced sexual violence:
Number of women Ever1
In the past 12 months
Age 15-19 12.9 12.9 166 20-24 4.5 4.3 744 25-29 10.3 7.2 1,215 30-39 9.5 5.9 2,684 40-49 9.6 5.5 2,219
Residence Urban 9.2 6.0 5,814 Rural 9.2 5.6 1,213
Region Central 9.0 5.8 4,356 North 10.6 6.6 1,989 South 6.6 5.2 681
Governorate Amman 8.8 6.0 2,604 Balqa 7.4 4.8 480 Zarqa 10.3 5.8 1,083 Madaba 7.6 6.0 190 Irbid 11.4 7.1 1,245 Mafraq 7.9 4.4 364 Jarash 11.0 8.3 216 Ajloun 10.1 5.1 164 Karak 5.1 4.4 288 Tafiela 7.4 6.0 109 Ma'an 7.5 4.7 114 Aqaba 8.0 6.4 171
Badia Badia 9.4 4.6 462 Non Badia 9.2 6.1 6,565
Camps Camp 12.2 9.4 274 Non camp 9.1 5.8 6,753
Marital status Married 8.5 6.1 6,714 Divorced/separated/widowed 23.4 2.8 313
Employment (last 7 days) Employed 11.9 6.2 1,141 Not employed 8.7 5.9 5,886
Number of living children 0 11.6 5.5 663 1-2 7.8 5.8 1,844 3-4 9.4 5.8 2,379 5+ 9.5 6.4 2,141
Education No education 10.9 5.5 152 Elementary 14.0 10.0 537 Preparatory 12.4 6.9 1,055 Secondary 9.0 6.2 3,167 Higher 6.6 4.2 2,116
Wealth quintile Lowest 15.3 10.9 1,335 Second 10.3 6.1 1,504 Middle 9.2 6.3 1,554 Fourth 5.8 3.9 1,389 Highest 5.1 2.4 1,245
Total 9.2 6.0 7,027 1 Includes violence in the past 12 months.

204 • Domestic Violence
14.3 PHYSICAL AND SEXUAL VIOLENCE
Table 14.4 shows the percentage of ever-married women age 15-49 who have ever experienced physical and/or sexual violence. Overall, more than one-third of women (36 percent) reported that they have experienced either physical or sexual violence. Twenty-seven percent have experienced physical violence only, 2 percent have experienced sexual violence only, and 7 percent have experienced both physical and sexual violence. Women age 25-39 are more likely to have experienced either physical or sexual violence (39 percent) than women in the other age groups. Sexual violence is highest among women age 18-19 (8 percent).
Table 14.4 Experience of different forms of violence
Percentage of ever-married women age 15-49 who have ever experienced different forms of violence by current age, Jordan 2012
Age
Physical violence
only
Sexual violence
only
Physical and sexual
violence
Physical or sexual violence
Number of women
15-19 24.6 6.4 6.4 37.5 166 15-17 (30.2) (0.0) (12.2) (42.5) 37 18-19 23.0 8.3 4.8 36.1 129
20-24 28.1 1.7 2.8 32.6 744 25-29 29.0 2.1 8.1 39.3 1,215 30-39 29.1 1.7 7.8 38.6 2,684 40-49 23.5 2.1 7.5 33.1 2,219
Total 27.1 2.0 7.2 36.3 7,027
Note: Figures in parentheses are based on 25-49 unweighted cases.
14.4 VIOLENCE DURING PREGNANCY
Violence during pregnancy may threaten not only a woman’s well-being but that of her unborn child. Table 14.5 presents information on the proportion of women who have experienced some form of physical violence during pregnancy by background characteristics. Among women who had ever been pregnant, 7 percent were hit, slapped, kicked, or subjected to some other form of physical violence at least once during a pregnancy.
Although there is no clear pattern between current age and physical violence during pregnancy, it can be noted that older women (age 40-49) are less likely than women in other age groups to report ever having experienced physical violence during pregnancy. Women who are divorced, separated, or widowed were far more likely to report ever experiencing violence during pregnancy (19 percent) than currently married women (7 percent). The experience of physical violence during pregnancy increases with the number of children, from 3 percent among women who have no living children to 8 percent among women who have five or more living children. Women in Aqaba (12 percent) are most likely to report experiencing physical violence during pregnancy and women in Ma’an (3 percent) least likely. The proportion of women who reported physical violence during pregnancy is noticeably higher in camps (10 percent) than in non camps (7 percent). Women with elementary or preparatory education are more likely to report violence during pregnancy than women with no education or secondary and higher education. Women in the lowest wealth quintile are more than twice as likely as women in the other wealth quintiles to report physical violence during pregnancy.

Domestic Violence • 205
Table 14.5 Experience of violence during pregnancy
Among ever-married women age 15-49 who have ever been pregnant, percentage who have ever experienced physical violence during pregnancy, by background characteristics, Jordan 2012
Background characteristic
Percentage who
experienced violence during
pregnancy
Number of women who have ever
been pregnant
Age 15-19 7.9 130 20-24 6.3 653 25-29 9.7 1,142 30-39 7.2 2,580 40-49 5.4 2,150
Marital status Married 6.6 6,434 Divorced/separated/widowed 19.1 220
Number of living children 0 2.5 290 1-2 6.2 1,844 3-4 7.3 2,379 5+ 8.0 2,141
Residence Urban 7.3 5,513 Rural 5.8 1,141
Region Central 7.3 4,123 North 6.4 1,884 South 7.3 647
Governorate Amman 7.6 2,473 Balqa 6.7 454 Zarqa 6.9 1,014 Madaba 5.5 182 Irbid 6.5 1,178 Mafraq 6.3 347 Jarash 6.8 205 Ajloun 4.5 154 Karak 5.8 271 Tafiela 8.4 104 Ma'an 3.2 109 Aqaba 11.8 163
Badia Badia 7.3 433 Non Badia 7.0 6,221
Camps Camp 10.4 257 Non camp 6.9 6,397
Education No education 4.9 145 Elementary 12.0 493 Preparatory 11.2 1,010 Secondary 7.3 3,021 Higher 3.3 1,985
Wealth quintile Lowest 13.9 1,261 Second 5.9 1,380 Middle 6.0 1,480 Fourth 4.0 1,326 Highest 5.7 1,207
Total 7.0 6,654

206 • Domestic Violence
14.5 MARITAL CONTROL BY HUSBAND
Close control and monitoring of their wife’s behavior by husbands is seen as an important warning sign and correlate of violence in a relationship. A series of questions were asked in the 2012 JPFHS to determine the degree of marital control exercised by a husband over his wife. Table 14.6 shows the percentage of ever-married women whose husband displays various types of controlling behavior, by selected background characteristics.
The main controlling behavior women experience from their husbands is jealousy or anger if she talks to other men (70 percent). Thirty-one percent of women say their husbands insist on knowing where they are at all times, 15 percent say their husbands do not permit them to meet their female friends, 10 percent say he tries to limit her contact with her family, and 4 percent say he frequently accuses her of being unfaithful. Thirteen percent of ever-married women say that their husband displays three or more controlling behaviors, whereas 24 percent say their husband displays none of the behaviors.
Divorced, separated, or widowed women are twice as likely as currently married women to report that their husband displays at least three of the controlling behaviors. Women who are not employed, urban women, women living in camps, and women in the lowest wealth quintile are more likely than their counterparts to report that their husband engages in three or more controlling behaviors. Women in Amman are most likely to report controlling behavior by their husband and women in Ma’an least likely. Highly educated women are least likely to experience controlling behavior by their husband. Women who are afraid of their husband most of the time are far more likely to report that their husband displays at least three of the controlling behaviors than women who are only sometimes afraid of their husband or women who are never afraid of their husband.

Domestic Violence • 207
Table 14.6 Marital control exercised by husbands
Percentage of ever-married women age 15-49 whose husbands have ever demonstrated specific types of controlling behaviors, by background characteristics, Jordan 2012
Background characteristic
Percentage of women whose husband:
Is jealous or angry if she
talks to other men
Frequently accuses her
of being unfaithful
Does not permit her to
meet her female friends
Tries to limit her contact
with her family
Insists on knowing
where she is at all times
Displays 3 or more of the
specific behaviors
Displays none of the specific
behaviors
Number of ever-married
women
Age 15-19 86.9 4.8 21.8 5.9 38.2 12.7 6.6 166 20-24 83.4 2.3 18.1 9.4 39.2 15.8 13.1 744 25-29 78.2 4.0 16.1 11.0 34.8 14.7 17.1 1,215 30-39 70.8 4.3 15.4 10.2 31.0 12.5 23.0 2,684 40-49 59.7 4.1 12.7 10.4 25.8 11.8 32.9 2,219
Marital status Married 70.5 3.7 14.2 9.7 30.9 12.5 23.9 6,714 Divorced/separated/
widowed 66.0 10.0 33.3 21.0 33.6 24.0 19.5 313
Number of living children 0 73.8 3.4 20.3 8.7 34.0 15.5 16.6 663 1-2 72.1 3.0 14.8 8.8 31.8 11.9 23.5 1,844 3-4 69.3 4.3 14.7 11.9 31.6 13.6 24.6 2,379 5+ 68.8 4.8 14.2 10.1 28.9 12.6 24.9 2,141
Residence Urban 70.5 4.3 16.1 10.6 31.1 13.7 23.3 5,814 Rural 69.4 2.7 10.4 8.1 30.7 9.5 25.2 1,213
Region Central 68.9 4.4 16.3 11.0 29.7 14.1 25.1 4,356 North 73.8 3.5 12.1 9.3 34.4 11.4 20.3 1,989 South 68.9 2.9 15.9 7.5 30.1 10.5 24.0 681
Governorate Amman 65.7 5.1 15.1 11.8 31.6 15.1 27.7 2,604 Balqa 71.7 3.1 14.1 10.6 26.0 11.5 24.3 480 Zarqa 75.6 3.5 20.8 10.2 26.0 13.7 19.3 1,083 Madaba 67.5 2.9 13.5 7.2 32.7 10.5 24.6 190 Irbid 72.5 3.3 13.3 10.1 33.4 12.4 21.4 1,245 Mafraq 74.9 5.2 9.5 6.8 34.9 9.2 19.2 364 Jarash 75.2 3.4 12.4 11.1 31.4 12.4 21.4 216 Ajloun 79.2 1.3 8.7 6.0 44.6 7.4 13.4 164 Karak 61.0 1.3 15.7 7.5 33.0 9.7 29.2 288 Tafiela 81.5 3.8 14.7 10.6 28.9 12.8 16.2 109 Ma'an 75.7 1.6 14.3 6.2 27.6 6.1 18.9 114 Aqaba 69.4 6.0 18.2 6.5 27.8 13.3 23.4 171
Badia Badia 75.5 4.5 12.5 8.9 38.2 11.8 19.4 462 Non Badia 69.9 4.0 15.3 10.3 30.5 13.1 24.0 6,565
Camps Camp 73.4 3.4 16.6 15.1 37.4 16.5 19.9 274 Non camp 70.2 4.0 15.0 10.0 30.8 12.9 23.8 6,753
Employment (last 7 days) Employed 57.0 4.2 12.7 8.6 25.6 9.6 34.6 1,141 Not employed 72.9 4.0 15.6 10.5 32.1 13.7 21.5 5,886
Education No education 62.0 9.2 14.2 11.2 30.1 12.4 31.3 152 Elementary 70.4 5.9 16.4 12.4 32.6 15.7 23.7 537 Preparatory 73.9 7.0 18.5 13.0 34.1 17.3 21.2 1,055 Secondary 73.7 3.9 16.5 10.2 32.9 13.6 19.1 3,167 Higher 64.1 1.7 11.0 8.2 26.5 9.3 31.2 2,116
Wealth quintile Lowest 75.0 8.3 18.8 14.8 36.7 18.6 18.5 1,335 Second 76.2 3.2 16.1 9.7 30.9 12.0 18.2 1,504 Middle 72.6 3.0 17.2 9.6 33.7 13.9 21.6 1,554 Fourth 67.6 3.3 13.9 9.0 26.9 11.9 25.0 1,389 Highest 58.3 2.4 8.6 8.1 26.4 8.4 36.9 1,245
Woman afraid of husband Most of the time 86.1 19.2 38.6 37.2 55.9 43.2 7.2 705 Sometimes 77.5 3.7 15.6 10.8 38.7 14.0 16.0 2,288 Never afraid 63.4 1.5 10.7 5.1 22.3 7.2 30.9 4,035
Total 70.3 4.0 15.1 10.2 31.0 13.0 23.7 7,027
Note: Husband refers to the current husband for currently married women and the most recent husband for divorced, separated, or widowed women.

208 • Domestic Violence
14.6 SPOUSAL VIOLENCE
The domestic violence module obtained more detailed information on the forms of violence ever-married women had experienced in the relationship with their current husband or, in the case of widowed or divorced women, their most recent husband. Table 14.7 shows the proportions of ever-married women age 15-49 who have experienced various forms of violence by their husband or former husband either ever or in the 12 months preceding the survey.
Table 14.7 Forms of spousal violence
Percentage of ever-married women age 15-49 who have experienced various forms of violence ever or in the 12 months preceding the survey, committed by their husband or former husband, Jordan 2012
Type of violence Ever
In the past 12 months
Often Sometimes Often or
sometimes SPOUSAL VIOLENCE COMMITTED BY CURRENT OR MOST RECENT HUSBAND
Physical violence Any physical violence 21.1 3.6 7.6 11.2
Pushed her, shook her, or threw something at her 15.9 2.8 6.5 9.3 Slapped her 15.2 2.3 4.6 6.9 Twisted her arm or pulled her hair 8.8 1.5 3.4 5.0 Punched her with his fist or with something that could
hurt her 8.9 1.6 3.6 5.2 Kicked her, dragged her, or beat her up 5.2 1.2 1.9 3.1 Tried to choke her or burn her on purpose 2.3 0.3 0.8 1.1 Threatened her or attacked her with a knife, gun, or
other weapon 1.3 0.1 0.6 0.7
Sexual violence Any sexual violence 8.6 1.6 4.4 6.0
Physically forced her to have sexual intercourse with him when she did not want to 8.6 1.6 4.4 6.0
Emotional violence Any emotional violence 24.6 6.7 10.8 17.4
Said or did something to humiliate her in front of others 17.2 4.5 7.3 11.8 Threatened to hurt or harm her or someone she cared
about 6.0 1.6 2.2 3.8 Insulted her or made her feel bad about herself 19.1 5.4 8.6 14.0
Any form of physical and/or sexual violence 23.6 4.4 9.7 14.1 Any form of emotional and/or physical and/or sexual
violence 31.7 8.2 13.8 22.0
SPOUSAL VIOLENCE COMMITTED BY ANY HUSBAND
Physical violence 21.8 na na 11.2 Sexual violence 9.2 na na 6.0 Physical and/or sexual violence 24.3 na na 14.1
Number of women 7,027 7,027 7,027 7,027
na = Not applicable
The results show that 21 percent of ever-married women report ever experiencing physical
violence from their current or most recent husband, 9 percent report sexual violence, and 25 percent report emotional violence. Approximately a quarter of ever-married women (24 percent) have experienced physical and/or sexual violence from their current or most recent husband, while nearly one-third (32 percent) have experienced physical, sexual, and/or emotional violence.
Table 14.7 also shows that 22 percent of ever-married women reported experiencing physical violence from any husband, 9 percent of ever-married women reported experiencing sexual violence from any husband, and one in four ever-married women reported experiencing physical and/or sexual violence from any husband.
Ever-married women most commonly state that their husband insults them or makes them feel bad about themselves (19 percent). Seventeen percent of ever-married women report that their husband said or did something to humiliate them in front of others, 16 percent have been pushed or shaken or had objects thrown at them, and 15 percent report being slapped.

Domestic Violence • 209
Twenty-two percent of ever-married women reported experiencing spousal emotional, physical and/or sexual violence in the past 12 months, with 14 percent having experienced violence sometimes and 8 percent having experienced it often. Table 14.8 shows the percentage of ever-married women age 15-49 who have experienced spousal violence by background characteristics.
Table 14.8 Spousal violence by background characteristics
Percentage of ever-married women age 15-49 who have ever experienced emotional, physical, or sexual violence committed by their husband, by background characteristics, Jordan 2012
Background characteristic
Emotional violence
Physical violence
Sexual violence
Physical and sexual
Physical and sexual and emotional
Physical or sexual
Physical or sexual or emotional
Number of ever-married
women
Age 15-19 14.5 10.0 12.9 3.2 2.9 19.6 25.7 16620-24 19.0 17.0 4.5 2.0 2.0 19.5 25.3 74425-29 26.0 20.1 9.5 6.5 5.6 23.1 32.7 1,21530-39 25.7 24.3 8.9 6.7 6.1 26.4 33.5 2,68440-49 25.1 20.1 8.7 6.5 5.9 22.2 31.6 2,219
Marital status Married 23.5 20.1 8.0 5.5 4.9 22.6 30.6 6,714Divorced/separated/
widowed 47.8 42.5 21.6 19.2 18.5 44.9 54.4 313
Number of living children 0 17.4 14.7 10.0 6.3 5.8 18.5 23.0 6631-2 23.0 18.5 7.2 4.6 4.2 21.2 29.5 1,8443-4 27.9 22.8 8.9 6.9 6.5 24.8 34.5 2,3795+ 24.4 23.4 9.0 6.3 5.3 26.0 33.2 2,141
Residence Urban 25.8 21.8 8.6 6.1 5.7 24.3 32.7 5,814Rural 18.7 17.6 8.4 5.8 4.3 20.2 27.0 1,213
Region Central 26.4 22.4 8.2 6.5 6.0 24.1 32.4 4,356North 22.0 20.2 10.1 5.8 5.0 24.5 32.1 1,989South 20.7 15.4 6.3 3.9 3.5 17.8 25.9 681
Governorate Amman 26.8 22.1 8.4 7.2 6.9 23.2 31.4 2,604Balqa 21.8 21.3 6.5 5.3 4.0 22.6 29.8 480Zarqa 28.5 25.2 8.7 6.0 5.1 28.0 36.7 1,083Madaba 20.6 13.9 7.3 2.9 2.6 18.3 27.7 190Irbid 23.0 21.1 10.9 6.2 5.5 25.8 33.5 1,245Mafraq 19.5 17.7 7.5 4.3 3.4 20.9 28.8 364Jarash 25.0 25.7 10.9 7.8 6.0 28.8 36.2 216Ajloun 15.8 11.8 9.7 3.9 3.5 17.6 24.1 164Karak 16.5 11.2 4.7 2.2 1.7 13.6 21.4 288Tafiela 24.5 19.6 7.4 5.0 4.9 22.0 30.2 109Ma'an 21.9 15.7 7.5 3.3 2.7 20.0 29.2 114Aqaba 24.7 19.6 7.7 6.5 6.3 20.8 28.5 171
Badia Badia 22.9 21.4 9.2 6.7 5.7 23.8 31.5 462Non Badia 24.7 21.1 8.5 6.0 5.4 23.6 31.7 6,565
Camps Camp 30.5 30.3 11.5 7.8 6.6 34.0 41.7 274Non camp 24.3 20.7 8.5 6.0 5.4 23.2 31.3 6,753
Employment (last 7 days) Employed 23.0 19.5 11.3 8.9 8.6 21.9 29.4 1,141Not employed 24.9 21.4 8.1 5.5 4.9 24.0 32.2 5,886
Education No education 25.7 28.3 10.6 9.5 9.0 29.5 33.2 152Elementary 30.6 33.3 12.8 10.5 9.2 35.6 40.5 537Preparatory 28.3 28.5 11.6 8.3 7.6 31.8 37.9 1,055Secondary 25.8 20.7 8.4 5.7 5.1 23.4 33.1 3,167Higher 19.3 14.5 6.2 4.2 3.7 16.4 24.3 2,116
Wealth quintile Lowest 30.6 31.9 14.6 11.8 11.0 34.8 40.9 1,335Second 24.8 23.1 9.9 6.9 6.1 26.1 33.5 1,504Middle 24.4 20.0 8.6 5.2 4.5 23.3 31.9 1,554Fourth 20.8 15.1 5.4 3.5 3.0 16.9 26.6 1,389Highest 22.3 15.3 4.0 2.8 2.8 16.5 25.2 1,245
Total 24.6 21.1 8.6 6.1 5.5 23.6 31.7 7,027
Note: Husband refers to the current husband for currently married women and the most recent husband for divorced, separated, or widowed women.

210 • Domestic Violence
More than one in two (54 percent) divorced, separated, or widowed women have ever experienced emotional, physical, or sexual violence from a spouse. Spousal violence rises from 23 percent among women with no children to 33-35 percent among women with three or more children. Spousal violence is higher among women who are not employed than among employed women. Spousal violence is also higher in urban than rural areas, in the Central and North regions compared to the South region, and ranges from a low of 21 percent in Karak to a high of 37 percent in Zarqa. Women living in camps are much more likely to have ever experienced spousal violence (42 percent) than women in non camp areas (31 percent). It is notable that women with higher education and women in the highest wealth quintile are consistently less likely than women in other education groups and wealth quintiles to experience any form of spousal violence.
14.7 SPOUSAL VIOLENCE AND WOMEN’S EMPOWERMENT
Table 14.9 presents a cross tabulation of spousal violence by husband’s characteristics and empowerment indicators for ever-married women age 15-49. Women whose husbands are highly educated (higher education) are least likely to experience spousal physical, sexual, or emotional violence (26 percent). In addition, spousal violence is lowest among women whose education is equal to that of their husband (28 percent). Spousal violence is highest among women who are older than their husband (42 percent).
Not surprisingly, there is a direct relationship between spousal behavior and controlling behaviors displayed by a husband. Spousal violence increases linearly with the number of controlling behaviors displayed by a husband, from 19 percent among women whose husband displayed no controlling behavior to 94 percent among women whose husband displayed five controlling behaviors.
Spousal violence decreases linearly with the number of decisions in which women participate—the more empowered a woman, the less likely she is to have experienced violence. Forty-six percent of women who do not participate in any household decision have experienced one or more forms of violence at the hands of their husband, compared to 28 percent of women who participate in all household decisions. In addition, 29 percent of women who believe that there are up to two reasons that justify a husband beating his wife have ever experienced one or more forms of violence, compared with 36-41 percent of women who believe that there is at least three reason to justify wife beating.
A family history of domestic violence is associated with a respondent’s own experience of domestic violence. As Table 14.9 shows, twice (51 percent) as many women whose father beat their mother experienced spousal violence as women whose father did not beat their mother (27 percent). In addition, there is a strong relationship between spousal violence and women being afraid of their husband. Seventy-one percent of women who were afraid of their husband most of the time reported spousal abuse, compared to 39 percent of women who reported that they were afraid of their husband only sometimes, and 21 percent of those who were never afraid.

Domestic Violence • 211
Table 14.9 Spousal violence by husband's characteristics and empowerment indicators
Percentage of ever-married women age 15-49 who have ever experienced emotional, physical, or sexual violence committed by their husband, by husband's characteristics and empowerment indicators, Jordan 2012
Background characteristic
Emotional violence
Physical violence
Sexual violence
Physical and sexual
Physical and sexual and emotional
Physical or sexual
Physical or sexual or emotional
Number of ever-married
women
Husband's education No education 34.8 30.0 8.2 7.6 7.4 30.5 39.2 120Elementary 26.8 29.4 13.9 9.7 8.7 33.6 37.8 759Preparatory 30.7 29.4 14.0 10.7 9.5 32.7 39.5 1,212Secondary 22.9 19.2 7.4 4.9 4.3 21.7 30.6 2,968Higher 21.7 15.0 4.8 3.3 3.1 16.5 25.7 1,963
Spousal education difference Husband better educated 25.4 22.6 7.3 5.8 5.3 24.1 32.4 2,477Wife better educated 25.1 21.7 10.5 7.0 6.2 25.2 32.9 2,860Both equally educated 22.3 17.5 7.1 4.7 4.1 19.9 28.4 1,626Neither educated 31.3 31.4 8.5 8.5 8.5 31.4 35.3 48
Spousal age difference1 Wife older 33.6 27.9 14.6 11.8 10.6 30.7 41.5 374Wife same age 28.1 22.7 6.2 3.9 3.8 25.0 35.3 374Wife 1-4 years younger 22.4 19.0 7.0 5.0 4.6 20.9 28.4 2,171Wife 5-9 years younger 22.9 19.5 7.4 4.5 4.2 22.4 31.1 2,617Wife 10+ years younger 22.1 20.3 9.5 6.8 5.3 23.0 28.9 1,177
Number of marital control behaviors displayed by husband2 0 14.3 12.3 3.6 2.5 2.0 13.5 19.3 1,6631-2 21.1 18.2 6.8 4.0 3.5 21.0 29.0 4,4503-4 57.0 47.7 23.2 19.5 18.2 51.4 64.3 8255 90.6 86.1 53.2 50.1 50.1 89.2 93.6 90
Number of decisions in which women participate3 0 39.4 34.2 10.9 8.4 7.2 36.7 45.7 1681-2 26.0 24.3 9.6 7.2 6.4 26.6 34.3 2,1643 21.6 17.5 7.1 4.5 4.0 20.1 28.3 4,382
Number of reasons for which wife beating is justified4 0 23.4 19.2 8.7 6.5 6.1 21.4 28.5 2,1391-2 22.9 18.1 6.9 4.6 4.0 20.4 29.3 3,0563-4 30.7 28.7 11.2 7.6 6.6 32.4 41.1 1,2715-7 24.3 27.9 11.3 9.2 8.4 30.0 36.2 561
Woman's father beat her mother Yes 41.7 39.2 15.3 13.1 12.3 41.4 51.3 1,396No 20.1 16.4 6.8 4.2 3.7 19.0 26.6 5,420Don’t know/missing 26.1 22.9 10.8 8.1 7.0 25.6 31.9 211
Woman afraid of husband Most of the time 63.4 59.8 26.5 25.1 24.0 61.2 70.9 705Sometimes 30.9 25.5 9.0 6.3 5.7 28.2 38.9 2,288Never afraid 14.2 11.9 5.2 2.6 2.1 14.5 20.8 4,035
Total 24.6 21.1 8.6 6.1 5.5 23.6 31.7 7,027
Note: Husband refers to the current husband for currently married women and the most recent husband for divorced, separated, or widowed women. Total includes 5 women missing information on husband’s education and 16 women missing information on education difference. 1 Includes women who have been married only once. 2 According to the wife's report. See Table 14.6 for list of behaviors. 3 According to the wife's report. See Table 13.6 for list of decisions. 4 According to the wife's report. See Table 13.8 for list of reasons.
14.8 SPOUSAL VIOLENCE IN THE PAST 12 MONTHS
Table 14.10 shows that 14 percent of ever-married women experienced spousal physical or sexual abuse in the past 12 months. Currently married women, women who are not currently employed, urban women, and women in camp areas are more likely than their counterparts to have experienced physical or sexual violence in the past 12 months. Experience of spousal violence in the past 12 months varies from a high of 17 percent among women in Jarash to a low of 9 percent in Ajloun, Mafraq, and Karak. Experience of spousal abuse in the past 12 months is lowest among women with higher education and women living in households in the fourth and fifth wealth quintiles and highest among women with preparatory education and women in the lowest wealth quintile. Spousal abuse in the past 12 months is twice as high among women who stated that they are afraid of their husband most of the time as women who reported being afraid of their husband only sometimes.

212 • Domestic Violence
Table 14.10 Frequency of physical or sexual violence
Percentage of ever-married women who have experienced physical or sexual violence by any husband in the past 12 months, by background characteristics, Jordan 2012
Background characteristic
Percentage of women who have
experienced physical or sexual
violence in the past 12 months
from any husbandNumber of ever-married women
Age 15-19 18.2 16620-24 15.1 74425-29 16.6 1,21530-39 15.4 2,68440-49 10.6 2,219
Marital status Married 14.6 6,714Divorced/separated/
widowed 4.7 313
Number of living children0 9.3 6631-2 14.5 1,8443-4 15.4 2,3795+ 13.9 2,141
Residence Urban 14.8 5,814Rural 11.0 1,213
Region Central 14.8 4,356North 13.5 1,989South 11.8 681
Governorate Amman 15.6 2,604Balqa 11.1 480Zarqa 14.6 1,083Madaba 13.7 190Irbid 14.7 1,245Mafraq 9.1 364Jarash 17.4 216Ajloun 8.7 164Karak 9.4 288Tafiela 14.6 109Ma'an 11.0 114Aqaba 14.6 171
Badia Badia 13.0 462Non Badia 14.2 6,565
Camps Camp 22.5 274Non camp 13.8 6,753
Employment (last 7 days)Employed 11.5 1,141Not employed 14.6 5,886
Education No education 14.5 152Elementary 17.1 537Preparatory 17.7 1,055Secondary 15.5 3,167Higher 9.4 2,116
Wealth quintile Lowest 20.8 1,335Second 15.6 1,504Middle 14.2 1,554Fourth 9.7 1,389Highest 10.1 1,245
Woman afraid of husbandMost of the time 38.3 705Sometimes 17.9 2,288Never afraid 7.7 4,035
Total 14.1 7,027
Note: Any husband includes all current, most recent, and former husbands.
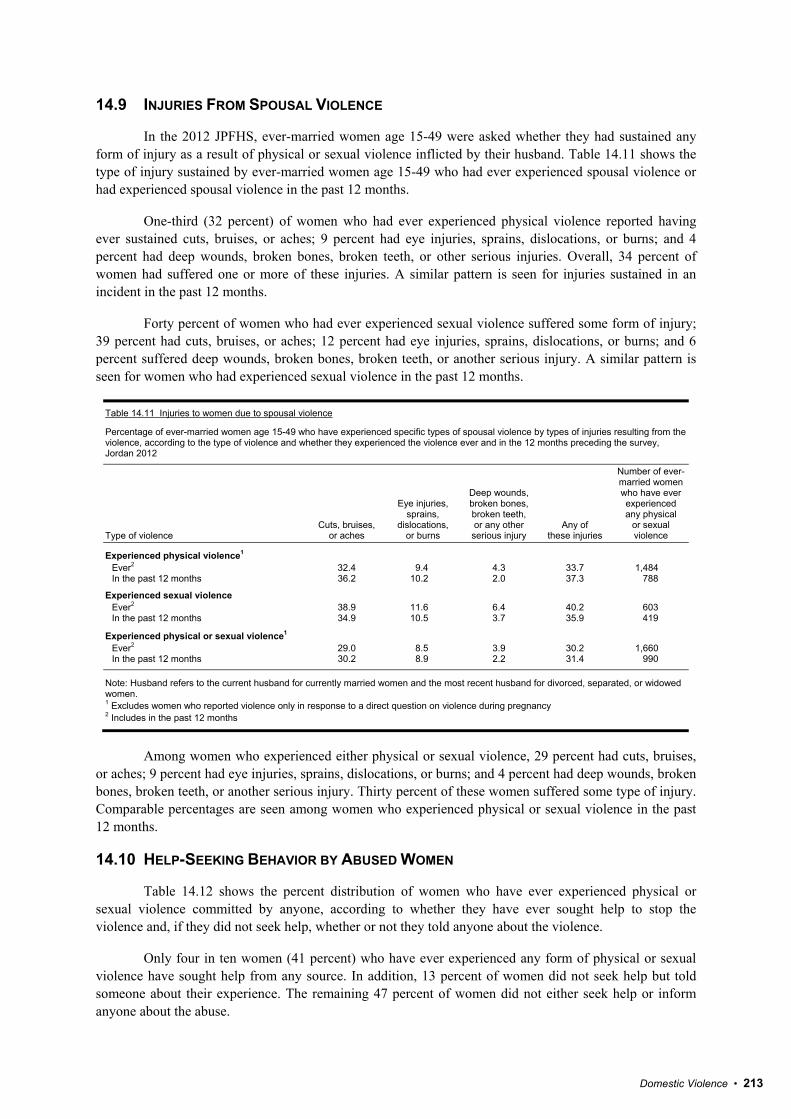
Domestic Violence • 213
14.9 INJURIES FROM SPOUSAL VIOLENCE
In the 2012 JPFHS, ever-married women age 15-49 were asked whether they had sustained any form of injury as a result of physical or sexual violence inflicted by their husband. Table 14.11 shows the type of injury sustained by ever-married women age 15-49 who had ever experienced spousal violence or had experienced spousal violence in the past 12 months.
One-third (32 percent) of women who had ever experienced physical violence reported having ever sustained cuts, bruises, or aches; 9 percent had eye injuries, sprains, dislocations, or burns; and 4 percent had deep wounds, broken bones, broken teeth, or other serious injuries. Overall, 34 percent of women had suffered one or more of these injuries. A similar pattern is seen for injuries sustained in an incident in the past 12 months.
Forty percent of women who had ever experienced sexual violence suffered some form of injury; 39 percent had cuts, bruises, or aches; 12 percent had eye injuries, sprains, dislocations, or burns; and 6 percent suffered deep wounds, broken bones, broken teeth, or another serious injury. A similar pattern is seen for women who had experienced sexual violence in the past 12 months.
Table 14.11 Injuries to women due to spousal violence
Percentage of ever-married women age 15-49 who have experienced specific types of spousal violence by types of injuries resulting from the violence, according to the type of violence and whether they experienced the violence ever and in the 12 months preceding the survey, Jordan 2012
Type of violence Cuts, bruises,
or aches
Eye injuries, sprains,
dislocations, or burns
Deep wounds, broken bones, broken teeth, or any other serious injury
Any of these injuries
Number of ever-married women who have ever experienced any physical
or sexual violence
Experienced physical violence1 Ever2 32.4 9.4 4.3 33.7 1,484 In the past 12 months 36.2 10.2 2.0 37.3 788
Experienced sexual violence Ever2 38.9 11.6 6.4 40.2 603 In the past 12 months 34.9 10.5 3.7 35.9 419
Experienced physical or sexual violence1 Ever2 29.0 8.5 3.9 30.2 1,660 In the past 12 months 30.2 8.9 2.2 31.4 990
Note: Husband refers to the current husband for currently married women and the most recent husband for divorced, separated, or widowed women. 1 Excludes women who reported violence only in response to a direct question on violence during pregnancy 2 Includes in the past 12 months
Among women who experienced either physical or sexual violence, 29 percent had cuts, bruises,
or aches; 9 percent had eye injuries, sprains, dislocations, or burns; and 4 percent had deep wounds, broken bones, broken teeth, or another serious injury. Thirty percent of these women suffered some type of injury. Comparable percentages are seen among women who experienced physical or sexual violence in the past 12 months.
14.10 HELP-SEEKING BEHAVIOR BY ABUSED WOMEN
Table 14.12 shows the percent distribution of women who have ever experienced physical or sexual violence committed by anyone, according to whether they have ever sought help to stop the violence and, if they did not seek help, whether or not they told anyone about the violence.
Only four in ten women (41 percent) who have ever experienced any form of physical or sexual violence have sought help from any source. In addition, 13 percent of women did not seek help but told someone about their experience. The remaining 47 percent of women did not either seek help or inform anyone about the abuse.

214 • Domestic Violence
Women who have experienced only sexual violence are much less likely (5 percent) than women who have experienced physical violence (38 percent) to seek help; help seeking is most common among women who have experienced both physical and sexual violence (61 percent). Women age 30-39 are most likely to seek help (48 percent). Divorced, separated, or widowed women are more likely to seek help than married women. Help-seeking behavior decreases with the number of children. Women in the South region, women in Aqaba, women in the non Badia and camp areas, women with elementary education, and women in the lowest wealth quintile are more likely to seek help than their counterparts in the other categories.
Table 14.12 Help seeking to stop violence Percent distribution of ever-married women age 15-49 who have ever experienced physical or sexual violence by their help-seeking behavior, by type of violence and background characteristics, Jordan 2012
Background characteristic
Sought help to stop violence
Never sought help but told
someone
Never sought help, never told anyone Total
Number of women who have ever
experienced any physical or sexual violence
Type of violence experienced Physical only 38.1 13.9 48.0 100.0 1,904 Sexual only 4.8 1.7 93.5 100.0 141 Physical and sexual 60.5 10.2 29.3 100.0 506
Age 15-19 (33.1) (15.5) (51.5) (100.0) 62 20-24 40.4 15.0 44.6 100.0 243 25-29 40.9 17.5 41.6 100.0 477 30-39 47.7 10.4 41.8 100.0 1,035 40-49 31.3 11.2 57.5 100.0 734
Marital status Married 38.8 13.2 48.1 100.0 2,369 Divorced/separated/widowed 65.9 4.1 30.1 100.0 182
Number of living children 0 45.9 13.7 40.4 100.0 236 1-2 40.4 15.9 43.7 100.0 648 3-4 41.4 12.0 46.6 100.0 864 5+ 38.6 10.0 51.4 100.0 803
Residence Urban 40.6 13.3 46.1 100.0 2,169 Rural 41.0 8.4 50.7 100.0 382
Region Central 39.7 14.1 46.2 100.0 1,643 North 40.3 10.4 49.4 100.0 716 South 50.5 7.0 42.4 100.0 192
Governorate Amman 39.3 16.5 44.2 100.0 987 Balqa 37.9 11.9 50.1 100.0 154 Zarqa 40.5 10.4 49.1 100.0 433 Madaba 44.9 7.7 47.4 100.0 69 Irbid 40.4 10.9 48.7 100.0 478 Mafraq 37.3 10.7 52.0 100.0 111 Jarash 49.5 5.9 44.6 100.0 84 Ajloun 29.0 12.2 58.8 100.0 43 Karak 52.3 6.6 41.1 100.0 72 Tafiela 47.5 10.8 41.6 100.0 37 Ma'an 45.2 4.0 50.8 100.0 33 Aqaba 53.7 6.8 39.5 100.0 50
Badia Badia 34.1 11.7 54.2 100.0 155 Non Badia 41.1 12.6 46.3 100.0 2,396
Camps Camp 43.2 12.1 44.7 100.0 129 Non camp 40.6 12.5 46.9 100.0 2,422
Employment (last 7 days) Employed 42.5 12.4 45.1 100.0 372 Not employed 40.4 12.5 47.1 100.0 2,179
Education No education 30.8 9.8 59.4 100.0 58 Elementary 43.2 11.8 44.9 100.0 259 Preparatory 41.9 16.3 41.8 100.0 469 Secondary 39.5 11.8 48.7 100.0 1,177 Higher 41.9 11.6 46.5 100.0 589
Wealth quintile Lowest 45.9 11.0 43.1 100.0 634 Second 38.9 11.0 50.1 100.0 582 Middle 38.6 15.3 46.1 100.0 561 Fourth 36.6 12.0 51.4 100.0 410 Highest 42.3 13.9 43.8 100.0 365
Total 40.7 12.5 46.8 100.0 2,551
Note: Figures in parentheses are based on 25-49 unweighted cases.

Domestic Violence • 215
Table 14.13 shows the percentage of women age 15-49 who have ever experienced physical or sexual violence and who sought help, by sources from which help was sought. The most common source of help is a woman’s own family (84 percent). One in five (19 percent) women sought help from her husband’s family. Five percent each sought help from friends or others, while 4 percent each sought help from neighbors or a social service organization. Less than 2 percent sought help from the police.
Table 14.13 Sources for help to stop violence
Percentage of ever-married women age 15-49 who have experienced physical or sexual violence and sought help by sources from which they sought help, according to the type of violence that women reported, Jordan 2012
Source
Type of violence experienced
Total Physical
only Physical
and sexual
Own family 86.3 78.6 83.9 Husband's family 15.5 25.8 18.5 Friend 2.2 9.3 4.5 Neighbor 1.8 7.6 3.5 Religious leader 0.0 0.5 0.1 Doctor/medical personnel 0.0 0.0 0.0 Police 0.7 3.3 1.5 Lawyer 0.0 0.7 0.2 Social service organization 2.8 7.4 4.1 Other 4.2 6.1 4.8 Number of women who have experienced
violence and sought help 725 306 1,038
Note: Total includes 7 women who reported seeking help for sexual violence only.


Early Childhood Development and Child Discipline • 217
EARLY CHILDHOOD DEVELOPMENT AND CHILD DISCIPLINE 15
arly childhood, roughly described as ages 0 to 8, is a time of tremendous physical, social, emotional, and intellectual growth for children. One of the stated goals of the United Nations’ World Fit for Children is that children should be “physically healthy, mentally alert, emotionally
secure, socially competent and able to learn” (United Nations, 2002). Therefore, any comprehensive model of early childhood development must cover major areas of well-being including intellectual development, social development, emotional development, and child health.
Social development refers to the ability of young children to interact and sustain relationships with others, including parents, siblings, peers, teachers, and other adults. Emotional development, on the other hand, refers not to relationships but to children’s feelings about themselves and others. It includes such characteristics as self-control, self-efficacy (i.e., the sense of being able to affect events), and the ability to properly interpret the emotions of others. The behaviors which constitute healthy social and emotional development vary greatly according to the age of the child. For example, at age two, markers of good social development focus heavily on relationships with parents and caregivers, whereas by ages five and six, they would include working cooperatively and playing well with fellow students and being able to make friends. In addition, it should be understood that young children mature at different rates and that the range of behaviors that fall in the normal range (though not always optimal) can be quite wide. Good social skills and positive emotional characteristics are important outcomes in and of themselves. Also, they can have strong influences on intellectual development and early school performance (Child Trends and Center for Child Health Research, 2004). When recognized early, problems in any of these areas can often be addressed effectively, and their long-term negative consequences can often be minimized and sometimes eliminated altogether.
This chapter also addresses methods of disciplining children. The World Fit for Children and the Millennium Declaration calls for the protection of children against abuse, exploitation and violence (United Nations, 2002). Respondents to the 2012 JPFHS household questionnaire were asked a series of questions on the ways adults in the household teach children the right behavior or address a
E
Key Findings
• Twenty-two percent of 3-4 year-old children in Jordan are attending an organized early childhood education program.
• For more than four-fifths (82 percent) of children age 3-4 years, an adult household member engaged in four or more activities that promote learning and school readiness in the three days preceding the survey.
• Only 23 percent of children under five live in households where at least three children’s books are present; 70 percent of children had two or more types of playthings within the home.
• Eight percent of children under five were left in the care of other children during the week preceding the interview, while 2 percent were left alone for at least one hour.
• Sixty-nine percent of children age 36-59 months are developmentally on track as measured by the early childhood development index (ECDI).
• Sixty-six percent of children age 2-14 were subjected to at least one form of physical punishment during the month preceding the survey.

218 • Early Childhood Development and Child Discipline
behavior problem. Only one child was selected at random per household from all children age 2-14 living in the household, and questions were asked about the methods used on that particular child, by any adult in the household. Figures were then appropriately weighted to reflect all children age 2-14 in all of the households interviewed.
15.1 EARLY CHILDHOOD EDUCATION AND LEARNING
In order to obtain an overview of certain early childhood education (ECE) indicators in Jordan, ever-married women age 15-49 in two-thirds of the households selected for the 2012 JPFHS who had a child age 3-4 living with them were asked about early education regarding their youngest child age 3-4. These children were identified through the birth histories of ever-married women age 15-49. The results are presented in this chapter for all (100 percent) of the 3,829 children (3,670 weighted children) who met the selection criteria.
Early childhood education (ECE) programs and preschool attendance socialize children for primary school and improve school readiness. ECE programs include organized learning components and do not include baby-sitting or day care, which typically do not include organized education and learning.
According to data from the 2012 JPFHS, 22 percent of children age 36-59 months are attending an organized ECE program in Jordan (Table 15.1). Children age 48-59 months are three and a half times more likely to attend an organized ECE program as children age 36-47 months (35 percent versus 10 percent). Female children are slightly more likely to be engaged in ECE programs than male children. Urban children are slightly more likely to be in ECE programs than rural children. Children living in the North region are most likely to attend ECE programs. The percentage of children attending ECE programs ranges from a low of 17 percent in Mafraq and Zarqa to a high of 29 percent in Irbid. ECE program attendance is also higher in the non Badia and non camp areas of Jordan. Attendance at ECE programs varies positively with mother’s education and household wealth.
It is well recognized that a period of rapid brain development occurs in the first 3-4 years of life, and the quality of home care is the major determinant of the child’s development during this period. In this context, engagement of adults in activities with children, presence of books in the home for the child, and the conditions of care are important indicators of quality of home care.
Table 15.1 Early childhood education
Percentage of children age 36-59 months who are attending an organized early childhood education program, Jordan 2012
Background characteristic
Percentage of children age 36-59 months currently attending early
childhood education
Number of children 36-59
months
Age in months 36-47 9.6 1,91548-59 35.0 1,755
Child's sex Male 20.9 1,866Female 22.6 1,804
Residence Urban 22.2 3,045Rural 19.3 625
Region Central 19.5 2,285North 25.8 1,038South 24.1 348
Governorate Amman 20.5 1,361Balqa 19.1 259Zarqa 17.3 561Madaba 19.0 104Irbid 29.0 628Mafraq 17.3 209Jarash 26.5 118Ajloun 22.6 83Karak 26.1 160Tafiela 22.4 56Ma'an 26.0 58Aqaba 19.6 74
Badia Badia 13.2 270Non Badia 22.4 3,400
Camps Camp 16.0 145Non camp 22.0 3,526
Mother's education No education 7.6 96Elementary 8.7 261Preparatory 11.3 541Secondary 19.6 1,682Higher 34.6 1,091
Wealth quintile Lowest 10.5 851Second 14.3 778Middle 25.8 815Fourth 26.4 724Highest 38.9 503
Total 21.7 3,670

Early Childhood Development and Child Discipline • 219
Information on a number of activities that support early learning was collected in the Jordan survey for children age 36-59 months. Questions included the involvement of adults with children in the following six activities: reading books or looking at picture books; telling stories; singing songs; taking children outside the home, compound, or yard; playing with children; and spending time with children naming, counting, or drawing things.
For more than four-fifths (82 percent) of children age 36-59 months, an adult household member engaged in four or more activities that promote learning and school readiness during the three days preceding the survey (Table 15.2). The mean number of activities that adults engaged in with children was 4.8. The table also indicates that a father’s involvement in such activities was somewhat limited. Although father’s involvement with one or more activities was 72 percent, the average number of activities that fathers engaged in with children was only 2.0. The two most common activities fathers engaged in were taking the child outside the house and playing with the child (data not shown separately). Six percent of children were living in a household without their biological fathers.
There are small gender differentials in terms of engagement of adults in activities, with female children slightly more likely than male children to engage with adults; however, fathers engaged in activities for a slightly larger proportion of male children (73 percent) than female children (71 percent). Larger proportions of adults engaged in learning and school readiness activities with urban children (82 percent) than rural children (78 percent). Strong differentials by region and socioeconomic status are also observed: adult engagement in activities with children was greatest in the South region (86 percent) and lowest in the North region (80 percent), and it ranged from a low of 72 percent in Balqa to a high of 89 percent in Aqaba. The proportion of children age 3-4 years who engaged in at least four learning activities with an adult is higher in non Badia and non camp areas than in other areas. Support for learning activities increases with household wealth from 75 percent of children living in the poorest households to 87 percent of children living in the richest households. Adult involvement rose from 58 percent among children of mothers with no education to 87 percent among children of mothers with higher education. Similarly, adult involvement increased from 47 percent among children of fathers with no education to 87 percent among children of fathers with higher education. A similar pattern was seen with father’s involvement by background characteristics.
Exposure to books in early years not only provides a child with greater understanding of the nature of print, but may also give the child opportunities to see others reading, such as older siblings doing school work. Presence of books is important for later school performance. In two-thirds of the households selected for the 2012 JPFHS, mothers with a child under age five were asked about the number of children’s books or picture books they have for the child, household objects or outside objects, and homemade toys or toys that came from a shop that are available at home. If a woman had more than one child under five living with her, the questions referred to the youngest child.

220 • Early Childhood Development and Child Discipline
Table 15.2 Support for learning
Percentage of children age 36-59 months with whom an adult household member engaged in activities that promote learning and school readiness during the last three days, Jordan 2012
Background characteristic
Percentage of children age 36-59 months
Mean number of activities
Percentage of children not
living with their natural father
Number of children 36-59
months
With whom adult
household members
engaged in four or more
activities
With whom the father
engaged in one or more
activities
Any adult household member engaged
with the child
The father engaged with
the child
Age in months 36-47 80.3 73.7 4.8 2.0 6.6 1,915 48-59 83.2 69.9 4.8 1.9 4.2 1,755
Child's sex Male 80.5 73.1 4.8 2.0 5.9 1,866 Female 82.8 70.6 4.8 2.0 5.0 1,804
Residence Urban 82.4 71.6 4.8 2.0 5.7 3,045 Rural 78.0 73.1 4.6 1.9 4.5 625
Region Central 81.5 69.0 4.8 1.9 5.5 2,285 North 80.3 75.9 4.8 2.0 6.2 1,038 South 86.2 78.8 5.1 2.3 3.1 348
Governorate Amman 83.6 72.0 4.8 2.1 7.1 1,361 Balqa 72.1 62.6 4.4 1.4 1.9 259 Zarqa 80.1 63.0 4.7 1.7 3.3 561 Madaba 85.9 77.8 5.0 2.4 4.9 104 Irbid 80.0 76.0 4.7 2.0 6.5 628 Mafraq 78.7 74.9 4.8 2.0 5.4 209 Jarash 81.5 78.6 4.8 2.0 5.5 118 Ajloun 85.5 73.1 4.9 1.9 6.8 83 Karak 86.3 74.1 5.1 2.1 3.1 160 Tafiela 85.3 83.8 5.0 2.5 3.6 56 Ma'an 84.0 77.0 4.8 2.3 3.6 58 Aqaba 88.5 86.4 5.1 2.7 2.6 74
Badia Badia 72.8 69.7 4.4 1.8 5.4 270 Non Badia 82.3 72.0 4.8 2.0 5.5 3,400
Camps Camp 74.8 64.6 4.5 1.5 3.9 145 Non camp 81.9 72.2 4.8 2.0 5.5 3,526
Mother's education No education 57.5 47.8 3.7 1.3 8.2 96 Elementary 68.1 65.9 4.4 1.6 4.8 261 Preparatory 75.1 74.2 4.5 1.7 6.1 541 Secondary 84.1 70.6 4.9 1.9 5.9 1,682 Higher 86.5 76.2 5.0 2.3 4.3 1,091
Father's education No education 47.2 61.1 3.2 1.2 0.0 35 Elementary 73.3 60.1 4.5 1.5 0.0 402 Preparatory 81.2 70.9 4.6 1.6 0.0 605 Secondary 82.4 78.4 4.8 2.2 0.0 1,561 Higher 87.2 77.1 5.1 2.4 0.0 865 Missing, don't know, no father in
the household, father not alive 76.0 na 4.6 na 99.0 202
Wealth quintile Lowest 74.6 65.0 4.5 1.6 6.6 851 Second 80.8 68.9 4.7 1.7 6.2 778 Middle 82.7 74.7 4.8 2.0 5.2 815 Fourth 86.3 78.5 5.0 2.3 3.2 724 Highest 86.5 74.0 5.1 2.4 6.0 503
Total 81.6 71.9 4.8 2.0 5.5 3,670
na = Not applicable

Early Childhood Development and Child Discipline • 221
In Jordan, only 23 percent of children age 0-59 months live in households where at least three children’s books are present for the child (Table 15.3). The proportion of children with 10 or more books declines to 3 percent. The presence of children’s books is positively correlated with the child’s age; three or more children’s books are present in the homes of 40 percent of children age 24-59 months, compared with 8 percent of children age 0-23 months. Urban children appear to have greater access to children’s books than those living in rural households. The proportion of children under age five who have three or more children’s books is 25 percent in urban areas, compared to 15 percent in rural areas. Children living in households in the Central region and the non Badia and non camp areas of Jordan are more likely to have three or more children’s books than children living in other areas. Children living in Amman (28 percent) are most likely to live in households with three or more books and children in Ma’an are least likely (13 percent). Education of both mothers and fathers has a positive influence on the percentage of children exposed to three or more books in the household, as does household wealth. A similar pattern is seen in the percentage of children exposed to 10 or more children’s books in the household for all of the background characteristics with the exception of governorates, where exposure is highest in Balqa and Amman and lowest in Karak.
Table 15.3 also shows that 70 percent of children age 0-59 months play with two or more types of playthings in their homes. The types of playthings include homemade toys (such as dolls and cars, or other toys made at home), toys that came from a store, and household objects (such as pots and bowls) or objects and materials found outside the home (such as sticks, rocks, animal shells, or leaves). It is interesting to note that the vast majority of children (89 percent) play with toys that come from a store; the percentage of children playing with homemade toys is only 9 percent. Sixty-nine percent of children play with other types of household objects or objects found outside the home. Older children (24-59 months) are much more likely to play with two or more types of playthings than younger children (0-23 months). There are smaller differences in the proportion of children who play with two or more types of playthings by gender of the child, urban-rural residence, residence in Badia, camp areas of Jordan and mother’s education. Larger differences are observed in terms of region, governorate, father’s education, and wealth quintile.
Leaving children alone or in the presence of other young children is known to increase the risk of accidents. In the 2012 JPFHS, two questions were asked to find out whether children age 0-59 months were left alone in the house during the week preceding the interview and whether children were left in the care of other children under age 10.

222 • Early Childhood Development and Child Discipline
Table 15.3 Learning materials
Percentage of youngest children under age five by numbers of children's books present in the household, and by playthings that child plays with, Jordan 2012
Background characteristic
Household has for the child: Child plays with:
Two or more types of
playthings
Number of youngest children
under age 5
3 or more children's
books
10 or more children's
books Home-
made toys
Toys from a shop/manu- factured toys
Household objects/
objects found outside
Age in months 0-23 8.4 1.3 8.5 81.0 55.8 57.0 3,433 24-59 39.6 5.1 10.3 97.1 84.1 85.3 3,069
Child's sex Male 21.2 2.8 9.6 88.6 67.8 69.4 3,510 Female 25.4 3.3 9.1 88.6 70.8 71.6 2,993
Residence Urban 24.9 3.6 9.8 89.4 69.2 71.1 5,331 Rural 14.8 0.8 7.1 85.0 69.0 67.3 1,172
Region Central 25.8 3.5 12.2 88.8 66.9 69.6 4,003 North 19.3 2.6 5.2 89.4 75.8 74.7 1,885 South 17.2 1.5 3.3 84.9 64.0 62.2 614
Governorate Amman 27.7 3.8 16.7 87.5 67.8 72.0 2,431 Balqa 18.6 4.0 5.9 89.5 59.5 60.3 450 Zarqa 25.7 2.8 4.6 91.4 66.6 66.8 939 Madaba 19.8 2.8 7.8 90.1 73.3 74.9 183 Irbid 21.8 3.3 5.0 90.4 76.9 76.5 1,160 Mafraq 14.1 1.4 3.0 86.2 75.4 71.4 362 Jarash 14.4 1.8 7.5 87.7 76.1 75.8 206 Ajluon 19.4 1.2 8.4 91.6 68.0 67.3 156 Karak 16.7 0.8 2.0 83.9 51.9 50.5 266 Tafiela 20.8 2.4 7.7 86.4 71.5 69.5 102 Ma'an 13.4 1.5 4.9 83.4 73.6 71.5 103 Aqaba 18.4 2.0 1.4 86.9 74.3 72.1 143
Badia Badia 9.4 0.7 7.1 82.0 71.6 68.6 466 Non Badia 24.2 3.2 9.5 89.1 69.0 70.5 6,036
Camps Camp 16.9 1.6 12.3 87.4 63.9 66.9 251 Non camp 23.4 3.1 9.2 88.6 69.4 70.5 6,252
Mother's education No education 10.6 0.1 9.4 77.2 77.6 70.0 128 Elementary 8.7 0.1 11.8 83.1 74.1 70.6 389 Preparatory 14.9 0.9 9.4 88.1 72.7 72.5 860 Secondary 20.7 1.0 8.9 88.8 68.9 70.8 3,028 Higher 33.4 7.6 9.5 90.2 66.7 68.8 2,097
Father's education No education 8.1 0.0 2.6 68.1 68.8 56.2 49 Elementary 16.2 1.0 10.9 84.7 68.8 69.2 676 Preparatory 17.4 0.8 8.5 85.7 65.3 65.2 1,012 Secondary 22.4 1.5 7.9 89.4 69.1 70.0 2,703 Higher 31.2 7.6 11.2 90.7 70.7 73.6 1,646 Missing, don't know, no father in
the household, father not alive 22.5 4.3 12.1 90.9 73.6 76.3 417
Wealth quintile Lowest 11.2 0.5 10.7 83.1 70.7 68.2 1,375 Second 17.1 0.9 7.7 88.0 65.2 67.6 1,383 Middle 22.1 1.6 8.9 92.1 71.1 72.1 1,441 Fourth 30.7 3.7 8.8 90.9 68.8 71.3 1,320 Highest 39.5 10.9 11.2 88.8 70.3 73.6 983
Total 23.1 3.1 9.3 88.6 69.2 70.4 6,502
Table 15.4 shows that 8 percent of children age 0-59 months were left in the care of other children
for more than one hour during the week preceding the interview, while 2 percent were left alone for at least one hour. Combining the two care indicators, it is calculated that 9 percent of children were left with inadequate care for at least one hour during the week preceding the survey, either by being left alone or in the care of another child. No differences were observed by the sex of the child. Urban children are more likely than rural children to be left with inadequate care (10 percent versus 7 percent). Inadequate care was also more prevalent among children living in the Central region (10 percent) compared with children in the North and South regions (8 percent and 7 percent, respectively). Inadequate care is most prevalent in

Early Childhood Development and Child Discipline • 223
Jarash (12 percent) and least prevalent in Aqaba (3 percent). Inadequate care is also higher in the non Badia and camp areas of Jordan than in the other areas. The pattern of inadequate care by mother’s and father’s education is mixed, with children of mothers with preparatory education and fathers with elementary education most likely to be left with inadequate care. Inadequate care varies inversely with household wealth.
Table 15.4 Inadequate care Percentage of youngest children under age five left alone or left in the care of another child younger than age 10 for more than one hour at least once during the past week, Jordan 2012
Background characteristic
Percentage of children under age 5
Number of children under
age 5 Left alone in the
past week
Left in the care of another child
younger than age 10 in the past
week
Left with inadequate care in the past week1
Age in months 0-23 2.1 5.7 7.1 3,433 24-59 2.3 10.8 11.9 3,069
Child's sex Male 2.5 8.1 9.4 3,510 Female 1.9 8.1 9.4 2,993
Residence Urban 2.2 8.7 10.0 5,331 Rural 2.2 5.3 6.7 1,172
Region Central 2.3 9.1 10.3 4,003 North 2.2 6.9 8.3 1,885 South 2.2 5.2 6.9 614
Governorate Amman 2.3 9.4 10.6 2,431 Balqa 2.2 5.1 6.5 450 Zarqa 2.4 10.3 11.2 939 Madaba 1.7 9.0 10.2 183 Irbid 2.5 7.4 9.0 1,160 Mafraq 1.1 4.2 4.7 362 Jarash 2.9 9.8 11.8 206 Ajloun 1.6 5.2 6.8 156 Karak 3.6 6.1 9.1 266 Tafiela 1.5 7.8 8.4 102 Ma'an 1.1 3.9 4.7 103 Aqaba 0.8 2.3 3.1 143
Badia Badia 1.8 4.6 5.7 466 Non Badia 2.3 8.4 9.7 6,036
Camps Camp 2.0 15.1 16.0 251 Non camp 2.2 7.8 9.1 6,252
Mother's education No education 0.6 4.9 5.5 128 Elementary 1.5 10.8 12.0 389 Preparatory 2.0 12.2 13.2 860 Secondary 2.8 8.3 9.9 3,028 Higher 1.8 5.8 6.8 2,097
Father's education No education 0.4 2.2 2.6 49 Elementary 0.9 11.4 11.9 676 Preparatory 2.4 9.3 10.3 1,012 Secondary 2.4 7.4 8.7 2,703 Higher 1.0 7.4 7.9 1,646 Missing, don't know, no father in the
household, father not alive 8.0 7.8 14.1 417
Wealth quintile Lowest 2.6 9.2 10.7 1,375 Second 3.0 9.1 10.7 1,383 Middle 1.8 8.1 9.4 1,441 Fourth 1.5 6.8 7.9 1,320 Highest 2.3 6.9 7.7 983
Total 2.2 8.1 9.4 6,502
1 Inadequate care is defined as children left alone or in the care of another child under 10 years for more than one hour at least once in the week before the survey.

224 • Early Childhood Development and Child Discipline
15.2 EARLY CHILDHOOD DEVELOPMENT
Early child development is defined as an orderly, predictable process along a continuous path, in which a child learns to handle more complicated levels of moving, thinking, speaking, feeling, and relating to others. Physical growth, literacy and numeracy skills, socioemotional development, and readiness to learn are vital domains of a child’s overall development, which is a basis for overall human development.
A 10-item module that was developed for UNICEF’s Multiple Indicator Cluster Survey (MICS) program was included in the 2012 JPFHS, and the data from this module were used to calculate the early childhood development index (ECDI). The indicator is based on some benchmarks that 3-4 year-old children would be expected to have if they are developing as the majority of children in their age group. The primary purpose of the ECDI is to inform public policy regarding the developmental status of children in Jordan.
Each of the 10 items is used in one of the four domains to determine if children are developmentally on track in that domain. The domains in question are:
• Literacy-numeracy: Children are identified as being developmentally on track based on whether they can identify/name at least 10 letters of the alphabet; whether they can read at least four simple, popular words; and whether they know the name and recognize the symbols of all numbers from 1 to 10. If at least two of these are true, then the child is considered developmentally on track.
• Physical: If the child can pick up a small object with two fingers, such as a stick or a rock from the ground, and/or the mother does not indicate that the child is sometimes too sick to play, then the child is regarded as being developmentally on track in the physical domain.
• Social-emotional: Children are considered to be developmentally on track if two of the following are true: the child gets along well with other children or adults; the child does not kick, bite, or hit other children or adults; and the child does not get distracted easily.
• Learning: If the child follows simple directions on how to do something correctly and/or, when given something to do, is able to do it independently, then the child is considered to be developmentally on track in this domain.
The ECDI is then calculated as the percentage of children who are developmentally on track in at least three of these four domains.
The results are presented in Table 15.5. In Jordan, 69 percent of children age 36-59 months are developmentally on track. As expected, the ECDI is higher in the older age group (72 percent among children 48-59 months) than in the younger age group (67 percent among children 36-47 months), since children acquire more skills with increasing age. The ECDI is higher among girls (73 percent) than boys (65 percent). The ECDI is also higher for children living in the North region and in Irbid than for their counterparts in the other areas. Not surprisingly, the ECDI is higher among children attending an early childhood education program (76 percent) than children not attending (67 percent). It is also highest among children whose mothers have higher than secondary education. The ECDI is lower for children living in the poorest households (61 percent) compared to children living in the richest households (74 percent of children developmentally on track).
The analysis of the four domains of child development shows that nearly all children (99 percent and 91 percent) are on track in the physical and learning domains, respectively, and 71 percent in the social-emotional domain. However, only 17 percent of children are on track in the literacy-numeracy domain. In each individual domain, higher percentages are associated with children attending an early childhood education program.

Early Childhood Development and Child Discipline • 225
Table 15.5 Early child development index
Percentage of children age 36-59 months who are developmentally on track in the literacy-numeracy, physical, social-emotional, and learning domains, and the early child development index score, Jordan 2012
Background characteristic
Percentage of children age 36-59 months who are developmentally on track for indicated domains Early child
development index score1
Number of children 36-59
months Literacy-
numeracy Physical Social-emotional Learning
Age in months 36-47 10.7 98.9 70.4 90.6 66.5 1,915 48-59 23.8 98.7 71.6 90.9 71.6 1,755
Child's sex Male 15.8 98.8 68.3 88.7 65.3 1,866 Female 18.2 98.7 73.7 92.9 72.6 1,804
Residence Urban 18.1 98.8 70.7 90.8 69.1 3,045 Rural 11.7 98.4 72.2 90.5 68.3 625
Region Central 18.8 98.8 70.0 89.3 67.6 2,285 North 14.3 98.7 72.6 94.2 71.6 1,038 South 13.0 98.8 72.5 89.9 70.0 348
Governorate Amman 20.8 98.6 66.5 89.9 65.0 1,361 Balqa 11.4 99.1 73.4 89.5 69.5 259 Zarqa 17.3 99.1 75.1 87.8 72.1 561 Madaba 19.5 98.4 79.2 88.9 72.1 104 Irbid 16.8 99.0 72.8 96.5 75.0 628 Mafraq 8.9 98.9 71.6 87.6 63.6 209 Jarash 11.3 98.6 70.5 93.7 67.5 118 Ajloun 12.7 96.6 76.4 94.2 71.1 83 Karak 16.3 98.9 71.4 89.1 70.0 160 Tafiela 12.0 99.3 66.2 86.3 64.2 56 Ma'an 9.2 98.2 75.4 93.9 73.0 58 Aqaba 9.4 98.6 77.4 91.4 71.9 74
Badia Badia 9.4 98.1 74.4 86.6 65.8 270 Non Badia 17.6 98.8 70.7 91.1 69.2 3,400
Camps Camp 11.6 97.5 69.1 93.2 67.9 145 Non camp 17.2 98.8 71.0 90.6 69.0 3,526
Attendance at early childhood education Attending 37.3 99.6 72.1 93.3 76.3 798 Not attending 11.3 98.6 70.6 90.0 66.9 2,873
Mother's education No education 4.7 96.8 79.4 87.3 70.9 96 Elementary 14.4 99.0 62.3 89.2 61.4 261 Preparatory 10.7 98.4 63.6 87.9 60.9 541 Secondary 17.1 98.9 69.1 89.6 66.7 1,682 Higher 21.5 99.0 78.7 94.5 78.0 1,091
Wealth quintile Lowest 10.8 98.8 62.8 89.1 61.2 851 Second 12.7 98.7 68.1 90.5 65.2 778 Middle 15.9 99.5 77.1 91.6 74.2 815 Fourth 19.4 97.8 74.5 91.2 72.2 724 Highest 32.3 99.0 74.0 91.8 74.4 503
Total 17.0 98.8 71.0 90.7 68.9 3,670 1 Percentage of children who are developmentally on track in at least three of the four domains.

226 • Early Childhood Development and Child Discipline
15.3 CHILD DISCIPLINE
As stated in A World Fit for Children, “children must be protected against any acts of violence,” and the Millennium Declaration calls for the protection of children against abuse, exploitation, and violence (United Nations, 2002). In the 2012 JPFHS, for the child discipline module, one child age 2-14 per household was selected randomly during fieldwork. Mothers or fathers of these children were asked a series of questions on the ways adults in the household tended to discipline the child during the past month preceding the survey. Out of these questions, the two indicators used to describe aspects of child discipline are 1) the number of children 2-14 years who experience psychological aggression as punishment or physical punishment and 2) the number of respondents who believe that in order to raise children properly, they need be physically punished.
In Jordan, 66 percent of children age 2-14 were subjected to at least one form of physical punishment by their parents or other adult household members during the month preceding the survey (Table 15.6). More importantly, 89 percent of children were subjected to a violent form of discipline, with 20 percent subject to severe physical punishment, i.e., either being hit or slapped on the face, head, or ears, or being beaten hard with an implement over and over. On the other hand, only 23 percent of young children’s parents believe that children need to be physically punished, which implies an interesting contrast with the actual prevalence of physical discipline. Eighty-seven percent of children were subjected to psychological disciplining methods, such as being shouted at, yelled at, or screamed at, or being called dumb, lazy or something similar.

Early Childhood Development and Child Discipline • 227
Table 15.6 Child discipline
Percentage of children age 2-14 who experienced various methods of disciplining during the month before the survey, according to background characteristics, Jordan 2012
Background characteristic
Percentage of children age 2-14 who experienced: Respondent believes that
the child needs to be physically punished
Respondents to the child discipline module
Only non-violent
discipline Psychological aggression
Any physical punishment
Severe physical
punishment
Any violent discipline method
Age 2-4 7.0 86.6 76.4 20.2 89.5 23.6 1,4865-9 5.8 91.1 73.5 23.9 92.5 23.8 2,34010-14 10.6 83.4 52.2 17.0 86.5 21.4 2,490
Child's sex Male 7.6 88.0 68.9 22.4 90.4 23.0 3,215Female 8.3 86.0 62.6 18.0 88.4 22.6 3,105
Residence Urban 7.9 87.2 66.7 20.9 89.6 23.6 5,176Rural 8.4 85.9 61.7 17.3 88.6 19.0 1,144
Region Central 8.8 85.6 65.5 20.7 88.4 23.9 3,912North 5.8 90.0 69.4 20.1 91.7 21.2 1,770South 8.7 87.4 57.5 18.1 89.6 20.5 638
Governorate Amman 10.4 83.4 63.7 20.2 86.7 24.3 2,289Balqa 5.9 89.6 66.6 19.2 91.3 24.4 456Zarqa 6.9 87.9 69.0 22.8 90.3 24.2 996Madaba 6.7 90.3 67.8 19.3 91.4 15.9 171Irbid 6.4 89.6 67.9 19.7 90.9 23.6 1,059Mafraq 5.0 90.2 70.0 19.1 92.3 14.5 350Jarash 5.0 90.8 73.2 26.9 93.2 22.4 208Ajloun 4.9 91.6 73.0 15.4 93.8 18.3 153Karak 11.0 84.6 50.0 16.3 86.9 20.9 268Tafiela 7.6 88.6 67.2 21.1 91.3 20.6 102Ma'an 5.6 90.1 69.3 25.3 93.3 20.8 118Aqaba 7.7 89.4 55.1 13.5 90.5 19.7 150
Badia Badia 7.3 86.2 68.3 20.3 89.4 17.1 459Non Badia 8.0 87.1 65.6 20.3 89.4 23.2 5,861
Camps Camp 2.9 93.7 79.1 27.5 96.0 25.8 275Non camp 8.2 86.7 65.2 19.9 89.1 22.7 6,045
Education of the household head No education 5.2 90.5 64.1 36.8 93.5 na naElementary 11.3 82.6 62.3 21.8 85.3 na naPreparatory 4.8 91.4 71.3 24.0 92.8 na naSecondary 6.1 89.8 71.3 21.1 92.0 na naHigher 11.7 81.3 55.5 13.7 84.7 na na
Respondent's education No education na na na na na 21.0 196Elementary na na na na na 23.9 554Preparatory na na na na na 18.7 973Secondary na na na na na 24.3 2,879Higher na na na na na 22.5 1,718
Wealth quintile Lowest 6.9 86.8 70.5 25.1 90.2 19.5 1,357Second 5.9 90.1 68.9 21.6 91.9 22.6 1,322Middle 6.7 88.1 68.4 20.0 90.9 24.8 1,347Fourth 6.0 89.4 66.9 18.8 91.4 25.8 1,217Highest 15.6 79.4 51.6 14.5 81.4 21.2 1,077
Total 8.0 87.0 65.8 20.3 89.4 22.8 6,320
na = Not applicable
Male children were slightly more likely to be subjected to physical discipline (90 percent) than
female children (88 percent). Differentials with respect to many of the background variables are relatively small because of the very high overall prevalence of physical discipline.


References • 229
REFERENCES
Administrative Committee on Coordination/Subcommittee on Nutrition (ACC/SCN). 2000. Fourth report on the world nutrition situation. Geneva: ACC/SCN (in collaboration with the International Food Policy Research Institute).
Arimond, M., and M.T. Ruel. 2003. Generating indicators of appropriate feeding of children 6 through 23 months from the KPC 2000+ report. Washington, DC. Food and Nutrition Technical Assistance Project (FANTA). http://pdf.usaid.gov/pdf_docs/PNACW465.pdf.
Bradley, Sarah E. K., Trevor N. Croft, Joy D. Fishel, and Charles F. Westoff. 2012 Revising Unmet Need for Family Planning. DHS Analytical Studies No. 25. Calverton, Maryland, USA: ICF International.
Centers for Disease Control and Prevention (CDC). 1998. Recommendations to prevent and control iron deficiency in the United States. Morbidity and Mortality Weekly Report 47 (RR-3): 1-29.
Child Trends and Center for Child Health Research. 2004. Early child development in social context. New York: Center for Child Health Research.
Department of Statistics [Jordan]. 1989. Jordan Fertility and Family Health Survey 1983. Amman, Jordan.
Department of Statistics [Jordan]. 1997. Housing and Population Census 1994. Amman, Jordan: Department of Statistics.
Department of Statistics [Jordan]. 2006. Housing and Population Census 2004. Amman, Jordan: Department of Statistics.
Department of Statistics [Jordan]. 2013a. Department of Statistics home page. http://www.dos.gov.jo/dos_home_a/main/index.htm
Department of Statistics [Jordan]. 2013b. Statistical year book 2012. Amman, Jordan: Department of Statistics.
Department of Statistics [Jordan] and ICF Macro. 2010. Jordan Population and Family Health Survey 2009. Calverton, Maryland, USA: Department of Statistics and ICF Macro.
Department of Statistics [Jordan] and Macro International Inc. 1998. Jordan Population and Family Health Survey 1997. Calverton, Maryland, USA: Department of Statistics and Macro International.
Department of Statistics [Jordan] and Macro International Inc. 2008. Jordan Population and Family Health Survey 2007. Calverton, Maryland, USA: Department of Statistics and Macro International.
Department of Statistics [Jordan] and ORC Macro. 2003. Jordan Population and Family Health Survey 2002. Calverton, Maryland, USA: Department of Statistics and ORC Macro.
El-Zanaty, Fatma and Ann Way. 2009. Egypt Demographic and Health Survey 2008. Cairo, Egypt: Ministry of Health. El-Zanaty and Associates, and Macro International.
Faqir, F. 2001. Intrafamily femicide in defence of honour: The case of Jordan. Third World Quarterly 22(1): 65-82.
230 • References
Gwatkin, D., S. Rutstein, K. Johnson, R. Pande, and A. Wagstaff. (2000). Socioeconomic differences in health, nutrition, and population in Bangladesh. Washington, DC: World Bank.
Heise, L., M. Ellsberg, and M. Goettemoeller. 1998. Ending violence among women. Population Reports, Series L, No. 11. Baltimore: Population Information Program, Johns Hopkins University School of Public Health.
Heise, L., J. Pitanguy, and A. Germain. 1994. Violence against women: The hidden health burden. Washington, DC: World Bank.
Higher Population Council [Jordan]. 2013. The updated national population strategy: concepts, foundation, and goals, 2000-2020. http://www.policyproject.com/pubs/countryreports/Jordan NPS.pdf
Jejeebhoy, S.J. 1998. Associations between wife-beating and fetal and infant death: impressions from a survey in rural India. Studies in Family Planning 29(3): 300-308.
Ministry of Health [Jordan]. 2013. Ministry of Health news. http://www.moh.gov.jo/ar/pages/ default.aspx
Ministry of Health (MoH) [Jordan]/National AIDS Program and UNAIDS. 2011. National strategic plan on HIV/AIDS in Jordan (2012-2016). Amman, Jordan: Ministry of Health.
Pan American Health Organization (PAHO)/World Health Organization (WHO). 2003. Guiding principles for complementary feeding of the breastfed child. Washington, DC/Geneva, Switzerland: PAHO/WHO.
Rutstein, S. 1999. Wealth versus expenditure: comparison between the DHS wealth index and household expenditures in four departments of Guatemala. Calverton, Maryland, USA: ORC Macro.
UNAIDS. 2012. UNAIDS report on the global AIDS epidemic 2012. Geneva, Switzerland: UNAIDS.
UNGASS. 1991. Advancement of women: Convention on the Elimination of All Forms of Discrimination Against Women. Report of the Secretary General. New York: United Nations.
UNGASS. 2002. Building a World Fit for Children: The United Nations General Assembly Special Session on Children, 8-10 May, 2002. New York: United Nations.
UNGASS. 2012. Global AIDS response progress reporting: country progress report, Hashemite Kingdom of Jordan January-December 2011. http://www.unaids.org/en/dataanalysis/ knowyourresponse/countryprogressreports/2012countries/ce_JO_Narrative_Report[1].pdf
UNICEF. 1999. Lack of obstetric care: mothers and babies at risk. In The progress of nations 1999, p. 15. New York: UNICEF.
UNICEF. 2006. The State of the World’s Children 2006. New York: UNICEF.
United Nations. 2002. Resolutions and decisions adopted by the General Assembly during its twenty-seventh special session 8-10 May, 2002. General Assembly Official Records, Twenty-Seventh Special Session, Supplement No. 1 (A/S-27/24). New York: United Nations.
U.S. Department of Health and Human Services, Public Health Service, Office of the Surgeon General. 2006. The health consequences of involuntary exposure to tobacco smoke: a report of the surgeon general. Rockville, Maryland, USA: U.S. Department of Health and Human Services.
Windham, G. C., A. Eaton, and B. Hopkins. 1999. Evidence for an association between environmental tobacco smoke exposure and birth weight: a meta-analysis and new data. Paediatric and Perinatal Epidemiology 13: 35-37.

References • 231
World Health Organization. 2005. Guiding Principles for Feeding Nonbreastfeeding Children 6 to 24 Months of Age. Geneva, Switzerland: WHO. http://www.helid.desastres.net/pdf/s13445e/s13445e.pdf.
World Health Organization. 2008. Indicator for assessing infant and young child feeding practices. Part 1: definitions. http://whqlibdoc.who.int/publications/2008/9789241596664_eng.pdf.
World Health Organization Multicentre Growth Reference Group. 2006. WHO Child Growth Standards: length/height-for-age, weight-for-age, weight-for-length, weight-for-height and body mass index-for-age: methods and development. Geneva: World Health Organization.
Zou’bi, A.A.A., S. Poedjastoeti, and M. Ayad. 1992. Jordan Population and Family Health Survey 1990. Columbia, Maryland, USA: Department of Statistics and IRD/Macro International Inc.


Appendix A • 233
SAMPLE IMPLEMENTATION APPENDIX A A.1 OBJECTIVES OF THE SURVEY
he 2012 Jordan Population and Family Health Survey (JPFHS 2012) is the sixth survey of its kind, following those implemented in 1990, 1997, 2002, 2007 and 2009. As with the prior surveys, the main objectives of the JPFHS 2012 survey are to provide up-to-date information on fertility and
childhood mortality levels; fertility preferences; awareness, approval, and use of family planning methods; maternal and child health; knowledge and attitudes toward HIV/AIDS and other sexually transmitted infections (STI). All ever-married women 15-49 who were usual members of the selected households or who spent the night in the selected households the day before the survey were eligible for the survey. The survey uses a nationally representative sample consisting of 16,120 residential households, resulting in about 11,000 interviews of ever-married women age 15-49. The survey produces representative results for the country as a whole, for the urban and rural areas separately, for each of the 12 governorates of the country, and for two special domains: the Badia areas and people living in refugee camps.
A sub-sample of two-thirds of the selected households was selected for anthropometry measurements. All women 15-49 years and all children under 5 years in the selected sub-sample were eligible for an anemia test and for height and weight measurement.
A.2 SAMPLING FRAME
Administratively, Jordan is divided into 12 governorates. Each governorate is subdivided into districts; each district into sub-districts; each sub-district into localities, and each locality into areas and then sub-areas. In addition to these administrative units, during the 2004 Jordan Population and Housing Census (JPHC 2004), each sub-area was subdivided into convenient area units called census blocks. An electronic file of a complete list of all the census blocks was created. This list contains census information on households, population, geographical locations and socioeconomic and other characteristics of each block. Based on this list, the census blocks were then regrouped to form a general statistical unit of moderate size (30 households or more), called a cluster which is widely used in various surveys as the primary sampling unit (PSU). The sample for the 2012 JPFHS was selected from the frame of cluster units provided by the Department of Statistics (DoS). The frame excludes the population living in remote areas (most of whom are nomads), as well as those living in collective housing units, such as hotels, hospitals, work camps, prisons, and the like. Table A.1 shows the distribution of the clusters by governorate and by urban-rural residence. The sample for the Badia areas was provided by the Hashemite Fund for the Badia Development, and the refugee camp areas are identified by DOS based on the United Nation’s Relief and Works Agency (UNRWA) records. The camps are defined at the block level. For the JPFHS 2012, a cluster is defined as camps if refugees represent 80 percent of the total population or more of the cluster. With this cutoff, only 33 clusters with refugee population were not counted in this domain. A few clusters in the Amman governorate which are both Badia and refugee camps are defined as refugee camps in order to simplify the stratification. The refugee camps exist only in urban areas.
In total, there are 13,025 clusters in Jordan. The average size of the cluster is 74 households in the urban areas and 62 in the rural areas. The overall average size is 72 households which is adequate for a sample take of 20 households per cluster for the JPFHS 2012.
T

234 • Appendix A
Table A.1 Enumeration areas
Distribution of enumeration areas in the sampling frame by governorate and type of residence, Jordan 2012
Governorate
Urban Rural Grand total Badia Camps Other Total Badia Other Total
Amman 7 110 4,540 4,657 182 147 329 4,986 Balqa 112 437 549 247 247 796 Zarqa 53 93 1,729 1,875 42 86 128 2,003 Madaba 9 225 234 112 112 346 Irbid 57 1,874 1,931 422 422 2,353 Mafraq 69 155 224 243 110 353 577 Jarash 50 167 217 142 142 359 Ajloun 222 222 80 80 302 Karak 176 176 20 353 373 549 Tafiela 21 131 152 4 57 61 213 Ma'an 19 114 133 56 65 121 254 Aqaba 19 230 249 37 1 38 287 Jordan 188 431 10,000 10,619 584 1,822 2,406 13,025
Table A.2 shows the distribution of households by governorate and by urban-rural residence. In
Jordan, 84 percent of the households live in urban areas according to the sampling frame. The urban-rural definition had been modified after the 2004 Census since it was based on the 1994 Census definition and it no longer reflects the true situation of the country.
Table A.2 Households
Distribution of residential households in the sampling frame by governorate and type of residence, Jordan 2012
Governorate
Urban Rural Grand total Badia Camps Other Total Badia Other Total
Amman 465 8,651 348,861 357,977 10,813 9,167 19,980 377,957 Balqa 10,457 34,348 44,805 16,827 16,827 61,632 Zarqa 3,498 8,050 123,838 135,386 2,275 4,303 6,578 141,964 Madaba 636 15,708 16,344 6,245 6,245 22,589 Irbid 4,783 132,767 137,550 27,668 27,668 165,218 Mafraq 5,164 11,070 16,234 15,538 6,612 22,150 38,384 Jarash 4,118 12,234 16,352 9,351 9,351 25,703 Ajloun 15,733 15,733 4,698 4,698 20,431 Karak 11,541 11,541 1,053 22,940 23,993 35,534 Tafiela 1,292 8,274 9,566 175 3,262 3,437 13,003 Ma'an 1,367 7,162 8,529 3,063 3,546 6,609 15,138 Aqaba 1,191 14,319 15,510 2,096 77 2,173 17,683 Jordan 12,977 36,695 735,855 785,527 35,013 114,696 149,709 935,236
A.3 SAMPLE ALLOCATION AND SAMPLE SELECTION
The sample for the JPFHS 2012 is a stratified sample selected in two stages from the 2004 JPHC frame. Stratification is achieved by separating each governorate into urban and rural areas, and each urban and rural area is further stratified by Badia areas, refugee camps and other. In total, 43 sampling strata have been constructed. Samples were selected independently in each sampling stratum, in two stages according to the sample allocation shown in Table A.3 and Table A.4. Prior to the sample selection, the sampling frame was sorted by social-geographical characteristics which defines cities with a population of over 100,000, and by social-economic characteristics within each sampling stratum. In the three governorates of Amman, Zarqa and Irbid, there are cities having a population of 100,000 or more. By using a probability proportional to size selection at the first stage of sampling, an implicit stratification and proportional allocation was achieved at each of the lower administrative levels and for each of the social-geographical strata.

Appendix A • 235
In the first stage, 806 clusters were selected with probability proportional to the cluster size, with the cluster size being the number of residential households as counted in the 2004 JPHC. The sample allocation takes the precision consideration at the governorate level and at each of the two special domain levels. The ideal sample would allocate the 11,000 completed women interviews proportionally to each sampling stratum according to the stratum size. But the proportional allocation will allocate a too small a sample size for certain governorates such as Tafiela, Ma'an and Aqaba, and for the two special domains. Meanwhile, a proportional allocation will allocate an unnecessarily large sample size to the large governorates. DHS surveys in other countries show that in order to get a reasonable precision for most indicators at the regional level, at least 800 completed interviews of women 15-49 are needed. This means that a proportional allocation cannot meet the precision request for the small governorates. To assure that the survey precision is comparable across the governorates, it was decided to use a power allocation with small adjustments, which is between the proportional allocation and the equal size allocation. The given allocation undersampled the large governorates such as Amman, Zarqa and Irbid, and oversampled the small governorates such as Tafiela, Ma'an and Aqaba; the two domains Badia area and the refugee camps were also oversampled. Neither the oversample nor the undersample created any problems in data analysis because a sampling weight was developed according to the sample allocation; all analysis using the JPFHS data apply the sampling weight in order to guarantee that the actual sample is representative.
Following the selection of the PSU in the first stage, a household listing operation was carried out in all the selected clusters, and the resulting lists of households served as the sampling frame for the selection of households in the second stage. In the second stage of selection, a fixed number of 20 households per cluster was selected with an equal probability systematic selection from the newly created household listing. The survey interviewers interviewed only the pre-selected households. No replacements and no changes of the pre-selected households were allowed in the implementing stages in order to prevent bias.
Table A.3 shows the sample allocation of clusters by governorate and by type of residence; Table A.4 shows the sample allocation of households by governorate and by type of residence. Table A.5 shows the sample allocation of expected numbers of interviews of ever-married women 15-49. The parameters used in the sample calculations are obtained from the survey results of the JPFHS 2009: the household response rate is assumed to be 97 percent; the individual woman response rate is assumed to be 97 percent; and, it is assumed that there are 0.77 ever-married women age 15-49 per household.
Table A.3 Sample allocation of enumeration areas
Sample allocation of enumeration areas by governorate and type of residence, Jordan 2012
Governorate
Urban Rural Grand total Badia Camps Other Total Badia Other Total
Amman 2 14 64 80 8 2 10 90 Balqa 17 34 51 19 19 70 Zarqa 5 13 55 73 3 3 6 79 Madaba 2 43 45 17 17 62 Irbid 8 58 66 13 13 79 Mafraq 8 19 27 26 11 37 64 Jarash 7 33 40 23 23 63 Ajloun 47 47 14 14 61 Karak 21 21 2 42 44 65 Tafiela 2 39 41 2 14 16 57 Ma'an 2 30 32 11 15 26 58 Aqaba 2 49 51 7 7 58 Jordan 21 61 492 574 59 173 232 806

236 • Appendix A
Table A.4 Sample allocation of households
Sample allocation of households by governorate and type of residence, Jordan 2012
Governorate
Urban Rural Grand total Badia Camps Other Total Badia Other Total
Amman 40 280 1,280 1,600 160 40 200 1,800 Balqa 340 680 1,020 380 380 1,400 Zarqa 100 260 1,100 1,460 60 60 120 1,580 Madaba 40 860 900 340 340 1,240 Irbid 160 1,160 1,320 260 260 1,580 Mafraq 160 380 540 520 220 740 1,280 Jarash 140 660 800 460 460 1,260 Ajloun 940 940 280 280 1,220 Karak 420 420 40 840 880 1,300 Tafiela 40 780 820 40 280 320 1,140 Ma'an 40 600 640 220 300 520 1,160 Aqaba 40 980 1,020 140 140 1,160 Jordan 420 1,220 9,840 11,480 1,180 3,460 4,640 16,120
Table A.5 Sample allocation of expected interviews with women
Sample allocation of expected number of completed interviews with ever-married women by governorate, according to type of residence, Jordan 2012
Governorate
Urban Rural Grand total Badia Camps Other Total Badia Other Total
Amman 27 190 870 1,087 109 27 136 1,223 Balqa 231 462 693 258 258 951 Zarqa 68 177 748 992 41 41 82 1,075 Madaba 27 585 612 231 231 843 Irbid 109 788 897 177 177 1,074 Mafraq 109 258 367 353 150 503 870 Jarash 95 449 544 313 313 857 Ajloun 639 639 190 190 829 Karak 285 285 27 571 598 883 Tafiela 27 530 557 27 190 217 774 Ma'an 27 408 435 150 204 353 789 Aqaba 27 666 693 95 95 788 Jordan 285 829 6,688 7,801 802 2,352 3,153 10,956
A.4 SELECTION PROBABILITY AND SAMPLING WEIGHT
Due to the non-proportional allocation of sample to different governorates and to their urban and rural areas and the possible differences in response rates, sampling weights are required for any analysis using the 2012 JPFHS data to ensure the actual representativeness of the survey results at the national level and as well as at the domain level. Since the 2012 JPFHS sample is a two-stage stratified cluster sample, sampling weights are calculated based on sampling probabilities separately for each sampling stage and for each cluster. The following notations are used:
P1hi: first-stage sampling probability of the ith cluster in stratum h
P2hi: second -stage sampling probability within the ith cluster (household selection) Let ah be the number of clusters selected in stratum h, Mhi the number of households according to
the sampling frame in the ith cluster, and M hi the total number of households in the stratum. The
probability of selecting the ith cluster in the JPFHS 2012 sample is calculated as follows:
M M a
hi
hih

Appendix A • 237
Let hiL be the number of households listed in the household listing operation in cluster i in
stratum h, and let hig be the number of households selected in the cluster. The second stage selection
probability for each household in the cluster is calculated as follows:
hi
hihi L
gP =2
The overall selection probability of each household in cluster i of stratum h is therefore the product of the two stages selection probabilities:
hihihi PPP 21 ×= The sampling weight for each household in cluster i of stratum h is the inverse of its overall
selection probability:
hihi PW /1=
A spreadsheet containing all sampling parameters and selection probabilities was prepared to facilitate the calculation of sampling weights. Sampling weights were adjusted for household non-response and as well as for individual non-response. Therefore, two sets of weights were calculated: one set for the households and one set for individual women. The difference of the household weight and the individual weight was introduced by the women’s non-response. The final weights were normalized in order for the total number of unweighted cases to equal the total number of weighted cases at the national level, for both household weights and individual weights.
A.5 SAMPLE IMPLEMENTATION
Table A.6 presents the sample implementation results by the number of households selected and interviewed and the number of ever-married women found and interviewed.

238
• A
ppen
dix
A
Tabl
e A.
6 S
ampl
e im
plem
enta
tion
Per
cent
dis
tribu
tion
of h
ouse
hold
s an
d el
igib
le w
omen
by
resu
lts o
f the
hou
seho
ld a
nd in
divi
dual
inte
rvie
ws,
and
hou
seho
ld, e
ligib
le w
omen
and
ove
rall
wom
en re
spon
se ra
tes,
acc
ordi
ng to
urb
an-r
ural
resi
denc
e an
d re
gion
(u
nwei
ghte
d), J
orda
n 20
12
Res
ult
Res
iden
ce
Reg
ion
Gov
erno
rate
of r
esid
ence
B
adia
C
amps
Tota
l U
rban
R
ural
C
entra
l N
orth
S
outh
A
mm
anB
alqa
Za
rqa
Mad
aba
Irbid
M
afra
q Ja
rash
Ajlo
un
Kar
ak
Tafie
laM
a'an
A
qaba
Bad
ia
Non
B
adia
C
amp
Non
ca
mp
Sel
ecte
d h
ou
seh
old
s
Com
plet
ed (C
) 93
.4
96.2
91
.6
96.6
94.8
86.3
93.4
93.4
95.0
96.9
95.8
97
.896
.195
.693
.694
.795
.395
.494
.195
.394
.1
94.2
H
ouse
hold
pre
sent
but
no
com
pete
nt re
spon
dent
at
hom
e (H
P)
2.1
1.1
3.1
0.2
1.9
5.7
2.6
2.3
1.0
0.0
0.3
0.2
0.5
1.5
2.4
1.6
2.2
1.7
1.8
1.5
1.8
1.8
Pos
tpon
ed (P
) 0.
0 0.
0 0.
0 0.
00.
00.
00.
10.
00.
00.
00.
0 0.
00.
00.
00.
10.
00.
00.
00.
00.
10.
0 0.
0 R
efus
ed (R
) 1.
6 1.
1 1.
8 0.
91.
42.
71.
91.
11.
41.
31.
5 0.
30.
50.
90.
82.
41.
71.
41.
40.
71.
5 1.
4 D
wel
ling
not f
ound
(DN
F)
0.1
0.0
0.1
0.1
0.0
0.0
0.1
0.0
0.2
0.1
0.0
0.0
0.1
0.0
0.0
0.1
0.1
0.1
0.1
0.2
0.0
0.1
Hou
seho
ld a
bsen
t (H
A)
1.0
0.3
1.4
0.4
0.4
2.9
0.5
1.1
0.8
0.2
0.4
0.6
0.6
0.0
0.8
0.8
0.3
0.2
0.9
0.1
0.9
0.8
Dw
ellin
g va
cant
/add
ress
not
a
dwel
ling
(DV
) 1.
7 1.
4 1.
8 1.
7 1.
2 2.
3 1.
4 1.
9 1.
6 1.
5 2.
0 1.
0 2.
3 1.
9 2.
3 0.
3 0.
3 1.
1 1.
7 2.
1 1.
6 1.
6 D
wel
ling
dest
roye
d (D
D)
0.0
0.0
0.0
0.0
0.0
0.1
0.0
0.1
0.0
0.0
0.1
0.0
0.0
0.1
0.0
0.1
0.0
0.1
0.0
0.1
0.0
0.0
Oth
er (O
) 0.
0 0.
0 0.
0 0.
00.
00.
00.
00.
10.
00.
00.
0 0.
10.
00.
00.
10.
00.
00.
00.
00.
00.
0 0.
0
Tota
l 10
0.0
100.
0 10
0.0
100.
010
0.0
100.
010
0.0
100.
010
0.0
100.
010
0.0
100.
010
0.0
100.
010
0.0
100.
010
0.0
100.
010
0.0
100.
010
0.0
100.
0 N
umbe
r of s
ampl
ed
hous
ehol
ds
11,4
80
4,64
0 6,
020
5,34
0 4,
760
1,80
0 1,
400
1,58
0 1,
240
1,58
0 1,
280
1,26
0 1,
220
1,30
0 1,
140
1,16
0 1,
160
1,62
0 14
,500
1,
220
14,9
00
16,1
20
Hou
seho
ld re
spon
se ra
te
(HR
R)1
96.1
97
.9
94.8
98
.8
96.5
91
.1
95.2
96
.5
97.4
98
.6
98.2
99
.4
98.9
97
.6
96.6
95
.8
95.9
96
.7
96.6
97
.6
96.5
96
.6
Eli
gib
le w
om
en
C
ompl
eted
(EW
C)
96.8
98
.3
96.0
98
.397
.692
.696
.298
.197
.597
.498
.6
98.5
98.7
98.0
98.1
97.6
96.8
98.8
97.1
98.3
97.2
97
.3
Not
at h
ome
(EW
NH
) 1.
0 0.
6 1.
3 0.
70.
52.
31.
11.
10.
60.
70.
9 0.
40.
80.
21.
20.
50.
10.
70.
90.
90.
9 0.
9 P
ostp
oned
(EW
P)
0.0
0.0
0.0
0.0
0.0
0.0
0.0
0.0
0.0
0.0
0.0
0.0
0.0
0.0
0.0
0.0
0.1
0.0
0.0
0.0
0.0
0.0
Ref
used
(EW
R)
0.5
0.4
0.8
0.3
0.3
1.3
1.0
0.3
0.5
0.5
0.2
0.3
0.1
0.3
0.4
0.4
0.2
0.2
0.5
0.4
0.5
0.5
Par
tly c
ompl
eted
(EW
PC
) 0.
1 0.
1 0.
1 0.
00.
10.
30.
00.
20.
00.
00.
0 0.
00.
00.
00.
10.
10.
10.
20.
10.
10.
1 0.
1 In
capa
cita
ted
(EW
I) 0.
9 0.
4 1.
0 0.
21.
02.
40.
80.
10.
60.
30.
0 0.
40.
30.
60.
11.
31.
90.
20.
80.
20.
8 0.
7 O
ther
(EW
O)
0.7
0.4
0.8
0.5
0.5
1.2
0.8
0.3
0.9
1.1
0.3
0.3
0.1
0.9
0.1
0.1
0.7
0.0
0.7
0.1
0.6
0.6
Tota
l 10
0.0
100.
0 10
0.0
100.
010
0.0
100.
010
0.0
100.
010
0.0
100.
010
0.0
100.
010
0.0
100.
010
0.0
100.
010
0.0
100.
010
0.0
100.
010
0.0
100.
0 N
umbe
r of w
omen
8,
296
3,37
7 4,
221
4,05
03,
402
1,19
598
21,
161
883
1,16
71,
014
959
910
891
835
800
876
1,28
110
,392
920
10,7
53
11,6
73
Elig
ible
wom
en re
spon
se ra
te
(EW
RR
)2 96
.8
98.3
96
.0
98.3
97
.6
92.6
96
.2
98.1
97
.5
97.4
98
.6
98.5
98
.7
98.0
98
.1
97.6
96
.8
98.8
97
.1
98.3
97
.2
97.3
Ove
rall
wom
en re
spon
se ra
te
(OR
R)3
93.1
96
.1
91.0
97
.0
94.2
84
.3
91.6
94
.6
94.9
96
.0
96.8
98
.0
97.6
95
.6
94.8
93
.5
92.9
95
.5
93.8
95
.9
93.8
94
.0
1 Usi
ng th
e nu
mbe
r of h
ouse
hold
s fa
lling
into
spe
cific
resp
onse
cat
egor
ies,
the
hous
ehol
d re
spon
se ra
te (H
RR
) is
calc
ulat
ed a
s:
10
0 *
C
____
____
____
____
____
____
____
___
C +
HP
+ P
+ R
+ D
NF
2 The
elig
ible
wom
en re
spon
se ra
te (E
WR
R) i
s eq
uiva
lent
to th
e pe
rcen
tage
of i
nter
view
s co
mpl
eted
(EW
C).
3 The
ove
rall
wom
en re
spon
se ra
te (O
WR
R) i
s ca
lcul
ated
as:
O
WR
R =
HR
R *
EW
RR
/100
238 • Appendix A

Appendix B • 239
ESTIMATES OF SAMPLING ERRORS APPENDIX B
he estimates from a sample survey are affected by two types of errors: (1) nonsampling errors and (2) sampling errors. Nonsampling errors are the results of mistakes made in implementing data collection and data processing, such as failure to locate and interview the correct household,
misunderstanding of the questions on the part of either the interviewer or the respondent, and data entry errors. Although numerous efforts were made during the implementation of the 2012 Jordan Population and Family Health Survey (JPFHS) to minimize this type of error, nonsampling errors are impossible to avoid and difficult to evaluate statistically.
Sampling errors, on the other hand, can be evaluated statistically. The sample of respondents selected in the 2012 JPFHS is only one of many samples that could have been selected from the same population, using the same design and identical size. Each of these samples would yield results that differ somewhat from the results of the actual sample selected. Sampling error is a measure of the variability between all possible samples. Although the degree of variability is not known exactly, it can be estimated from the survey results.
A sampling error is usually measured in terms of the standard error for a particular statistic (mean, percentage, etc.), which is the square root of the variance. The standard error can be used to calculate confidence intervals within which the true value for the population can reasonably be assumed to fall. For example, for any given statistic calculated from a sample survey, the value of that statistic will fall within a range of plus or minus two times the standard error of that statistic in 95 percent of all possible samples of identical size and design.
If the sample of respondents had been selected as a simple random sample, it would have been possible to use straightforward formulas for calculating sampling errors. However, the 2012 JPFHS sample is the result of a multistage stratified design, and, consequently, it was necessary to use more complex formulae. The computer software used to calculate sampling errors for the 2012 JPFHS is an SAS program. This program used the Taylor linearization method for variance estimation for survey estimates that are means or proportions. The Jackknife repeated replication method is used for variance estimation of more complex statistics such as fertility and mortality rates.
The Taylor linearization method treats any percentage or average as a ratio estimate, r = y/x, where y represents the total sample value for variable y, and x represents the total number of cases in the group or subgroup under consideration. The variance of r is computed using the formula given below, with the standard error being the square root of the variance:
( ) = =
−
−−==
H
h h
hm
ihi
h
hh m
zzm
mfx
rvarrSEh
1
2
1
22
2
11
1)()(
in which
hihihi rxyz −= , and hhh rxyz −=
T

240 • Appendix B
where h represents the stratum which varies from 1 to H, mh is the total number of clusters selected in the hth stratum, yhi is the sum of the weighted values of variable y in the ith cluster in the hth stratum, xhi is the sum of the weighted number of cases in the ith cluster in the hth stratum, and fh is the sampling fraction of PSU in the hth stratum, which is small and ignored.
The Jackknife repeated replication method derives estimates of complex rates from each of several
replications of the parent sample and calculates standard errors for these estimates using simple formulae. Each replication considers all but one cluster in the calculation of the estimates. Pseudo-independent replications are thus created. In the 2012 JPFHS, there were 806 non-empty clusters. Hence, 806 replications were created. The variance of a rate r is calculated as follows:
SE r var rk k
r ri
k
i2
1
21
1( ) ( )
( )( )= =
−−
=
in which
)()1( ii rkkrr −−=
where r is the estimate computed from the full sample of 806 clusters,
r(i) is the estimate computed from the reduced sample of 805 clusters (ith cluster excluded), and
k is the total number of clusters.
In addition to the standard error, the program computes the design effect (DEFT) for each estimate, which is defined as the ratio between the standard error using the given sample design and the standard error that would result if a simple random sample had been used. A DEFT value of 1.0 indicates that the sample design is as efficient as a simple random sample, while a value greater than 1.0 indicates the increase in the sampling error due to the use of a more complex and less statistically efficient design, such as multistage and cluster selection. The program also computes the relative standard error and the confidence limits for the estimates.
Sampling errors for the 2012 JPFHS are calculated for selected variables considered to be of primary interest. The results are presented in this appendix for the country as a whole, for urban and rural areas separately, for each of the three geographical regions, for each of the 12 governorates, for the Badia and non Badia populations, and for the refugee camp population and the non camp population. For each variable, the type of statistic (mean, proportion, or rate) and the base population are given in Table B.1. Tables B.2 to B.23 present the value of the statistic (R), its standard error (SE), the number of unweighted (N) and weighted (WN) cases, the design effect (DEFT), the relative standard error (SE/R), and the 95 percent confidence limits (R±2SE) for each variable. The DEFT is considered undefined when the standard error considering simple random sample is zero (when the estimate is close to 0 or 1). In the case of the total fertility rate, the number of unweighted cases is not relevant, as there is no known unweighted value for woman-years of exposure to childbearing.
The confidence interval (e.g., as calculated for children ever born to women over age 40) can be interpreted as follows: the overall average from the national sample is 4.561, and its standard error is 0.071. Therefore, to obtain the 95 percent confidence limits, one adds and subtracts twice the standard error to the sample estimate, that is, 4.561±2×0.071. There is a high probability (95 percent) that the true average number of children ever born to all women over age 40 is between 4.420 and 4.703.
For the total sample, the value of the design effect (DEFT), averaged over all variables for the women’s survey, is 1.705, which means that, due to multistage clustering of the sample, the average standard error is increased by a factor of 1.705 over that in an equivalent simple random sample.

Appendix B • 241
Table B.1 List of indicators for sampling errors, Jordan 2012
Variable Estimate Base population
Urban residence Proportion Ever-married women 15-49 No education Proportion Ever-married women 15-49 Secondary education Proportion Ever-married women 15-49 Higher education Proportion Ever-married women 15-49 Currently married/in union Proportion All women 15-49 Married before age 20 Proportion All women 25-49 Currently pregnant Proportion Ever-married women 15-49 Children ever born Mean All women 15-49 Children surviving Mean All women 15-49 Children ever born to women age 40-49 Mean All women 40-49 Knows any contraceptive method Proportion Ever-married women 15-49 Knows any modern contraceptive method Proportion Ever-married women 15-49 Currently using any contraceptive method Proportion Currently married women 15-49 Currently using a modern method Proportion Currently married women 15-49 Currently using a traditional method Proportion Currently married women 15-49 Currently using pill Proportion Currently married women 15-49 Currently using IUD Proportion Currently married women 15-49 Currently using condoms Proportion Currently married women 15-49 Currently using injectables Proportion Currently married women 15-49 Currently using female sterilization Proportion Currently married women 15-49 Currently using rhythm Proportion Currently married women 15-49 Currently using withdrawal Proportion Currently married women 15-49 Obtained method from public sector source Proportion Currently married women 15-49 Want no more children Proportion Ever-married women 15-49 Want to delay birth at least 2 years Proportion Ever-married women 15-49 Ideal number of children Mean Ever-married women 15-49 Mothers received antenatal care for last birth Proportion Women with at least 1 live birth in past 5 years Mothers protected against tetanus for last birth Proportion Births in last 5 years Births with skilled attendant at delivery Proportion Births in last 5 years Had diarrhea in the 2 weeks before survey Proportion Children under age 5 Treated with oral rehydration salts (ORS) Proportion Children under age 5 with diarrhea in past 2 weeks Sought medical treatment for diarrhea Proportion Children with diarrhea in past 2 weeks Vaccination card seen Proportion Children age 12-23 months Received BCG vaccination Proportion Children age 12-23 months Received DPT (3 doses) vaccination Proportion Children age 12-23 months Received polio (3 doses) vaccination Proportion Children age 12-23 months Received measles vaccination Proportion Children age 12-23 months Received all vaccinations Proportion Children age 12-23 months Height-for-age (below -2SD) Proportion Children under age 5 who were measured Weight-for-height (below -2SD) Proportion Children under age 5 who were measured Weight-for-age (below -2SD) Proportion Children under age 5 who were measured Prevalence of anemia (children 6-59 months) Proportion Children age 6-59 months who were tested Experienced physical violence since age 15 by anyone Proportion Ever-married women 15-49 Ever experienced any sexual violence Proportion Ever-married women 15-49 Experienced physical or sexual violence by husband Proportion Ever-married women 15-49 Experienced physical or sexual violence in the last 12
months by husband Proportion Ever-married women 15-49 Prevalence of anemia (women 15-49 years) Proportion All women 15-49 who were tested Body mass index (BMI) < 18.5 Proportion Ever-married women 15-49 who were measured Total fertility rate (last 0-2 years) Rate Woman-years of exposure to childbearing for all women 15-49 Neonatal mortality rate1 Rate Children exposed to the risk of mortality Post-neonatal mortality rate1 Rate Children exposed to the risk of mortality Infant mortality rate1 Rate Children exposed to the risk of mortality Child mortality rate1 Rate Children exposed to the risk of mortality Under-5 mortality rate1 Rate Children exposed to the risk of mortality 1 Mortality rates are calculated for the last 0-4 years for the total sample and for the last 0-9 years for the domain sample.

242 • Appendix B
Table B.2 Sampling errors: Total sample, Jordan 2012
Variable R SE N WN DEFT SE/R R-2SE R+2SE
Urban residence 0.833 0.005 11,352 11,352 1.385 0.006 0.823 0.843 No education 0.023 0.003 11,352 11,352 2.050 0.124 0.018 0.029 Secondary education 0.447 0.009 11,352 11,352 1.869 0.020 0.429 0.464 Higher education 0.306 0.010 11,352 11,352 2.376 0.034 0.286 0.327 Currently married (in union) 0.543 0.015 20,065 19,891 1.304 0.027 0.514 0.572 Married before age 20 0.311 0.007 12,000 11,892 1.682 0.022 0.297 0.324 Currently pregnant 0.055 0.003 20,065 19,891 1.470 0.050 0.049 0.060 Children ever born 2.030 0.063 20,065 19,891 1.363 0.031 1.905 2.155 Children surviving 1.967 0.060 20,065 19,891 1.356 0.031 1.846 2.087 Children ever born to women age 40-49 4.561 0.071 3,844 4,003 1.799 0.015 4.420 4.703 Knows any contraceptive method 1.000 0.000 10,746 10,801 1.061 0.000 1.000 1.000 Knows any modern contraceptive method 1.000 0.000 10,746 10,801 1.061 0.000 1.000 1.000 Currently using any method 0.612 0.007 10,746 10,801 1.563 0.012 0.597 0.626 Currently using a modern method 0.423 0.007 10,746 10,801 1.542 0.017 0.408 0.438 Currently using a traditional method 0.189 0.005 10,746 10,801 1.399 0.028 0.178 0.199 Currently using pill 0.081 0.005 10,746 10,801 1.826 0.059 0.072 0.091 Currently using IUD 0.213 0.008 10,746 10,801 1.940 0.036 0.198 0.228 Currently using condoms 0.079 0.005 10,746 10,801 1.808 0.060 0.069 0.088 Currently using injectables 0.009 0.001 10,746 10,801 1.370 0.136 0.007 0.012 Currently using female sterilization 0.022 0.003 10,746 10,801 1.844 0.118 0.017 0.027 Currently using rhythm 0.035 0.003 10,746 10,801 1.949 0.098 0.028 0.042 Currently using withdrawal 0.143 0.005 10,746 10,801 1.512 0.036 0.133 0.154 Used public sector source 0.441 0.014 4,308 4,404 1.878 0.032 0.412 0.469 Want no more children 0.528 0.008 10,746 10,801 1.726 0.016 0.511 0.544 Want to delay birth at least 2 years 0.231 0.007 10,746 10,801 1.716 0.030 0.217 0.245 Ideal number of children 3.931 0.031 10,983 10,938 1.695 0.008 3.870 3.993 Mothers received antenatal care for last birth 0.991 0.002 6,811 6,577 1.684 0.002 0.987 0.995 Mothers protected against tetanus for last birth 0.309 0.012 6,811 6,577 2.037 0.038 0.286 0.332 Births with skilled attendant at delivery 0.996 0.001 10,360 9,833 1.849 0.001 0.994 0.999 Had diarrhea in the last 2 weeks 0.156 0.008 10,128 9,637 1.984 0.050 0.140 0.171 Treated with ORS 0.204 0.019 1,540 1,501 1.715 0.094 0.166 0.243 Sought medical treatment for diarrhea 0.557 0.026 1,540 1,501 1.922 0.047 0.505 0.610 Vaccination card seen 0.804 0.016 2,030 1,941 1.761 0.020 0.772 0.836 Received BCG vaccination 0.983 0.009 2,030 1,941 2.919 0.009 0.966 1.000 Received DPT (3 doses) vaccination 0.984 0.003 2,030 1,941 1.204 0.004 0.977 0.991 Received polio (3 doses) vaccination 0.984 0.003 2,030 1,941 1.211 0.003 0.977 0.991 Received measles vaccination 0.944 0.009 2,030 1,941 1.800 0.010 0.926 0.963 Received all vaccinations 0.930 0.012 2,030 1,941 2.133 0.013 0.905 0.955 Height-for-age (below -2SD) 0.077 0.006 6,368 5,851 1.532 0.078 0.065 0.089 Weight-for-height (below -2SD) 0.024 0.003 6,368 5,851 1.497 0.124 0.018 0.030 Weight-for-age (below -2SD) 0.030 0.004 6,368 5,851 1.723 0.137 0.022 0.038 Prevalence of anemia (children 6-59 months) 0.324 0.012 5,620 5,119 1.761 0.036 0.300 0.347 Experienced physical violence since age 15 by anyone 0.343 0.010 7,027 7,027 1.771 0.029 0.323 0.363 Ever experienced any sexual violence 0.092 0.007 7,027 7,027 1.989 0.075 0.078 0.106 Experienced physical or sexual violence by husband 0.236 0.010 7,027 7,027 1.924 0.041 0.217 0.256 Experienced physical or sexual violence by husband in
the last 12 months 0.141 0.007 7,027 7,027 1.777 0.052 0.126 0.156 Prevalence of anemia (women 15-49 years) 0.335 0.009 11,249 10,734 1.960 0.026 0.317 0.352 Body mass index (BMI) < 18.5 0.051 0.004 10,747 10,312 1.810 0.076 0.043 0.058 Total fertility rate (last 3 years) 3.506 0.067 55,059 55,927 1.706 0.019 3.373 3.640 Neonatal mortality rate (last 0-4 years) 13.709 2.149 10,437 9,871 1.584 0.157 9.411 18.006 Post-neonatal mortality rate (last 0-4 years) 3.505 0.801 10,483 9,925 1.356 0.229 1.903 5.108 Infant mortality rate (last 0-4 years) 17.214 2.462 10,440 9,872 1.652 0.143 12.290 22.138 Child mortality rate (last 0-4 years) 3.815 1.112 10,633 9,951 1.649 0.292 1.591 6.039 Under-5 mortality rate (last 0-4 years) 20.963 2.590 10,453 9,882 1.614 0.124 15.783 26.143

Appendix B • 243
Table B.3 Sampling errors: Urban sample, Jordan 2012
Variable R SE N WN DEFT SE/R R-2SE R+2SE
Urban residence 1.000 0.000 8,034 9,458 na 0.000 1.000 1.000 No education 0.017 0.003 8,034 9,458 2.107 0.177 0.011 0.023 Secondary education 0.453 0.010 8,034 9,458 1.810 0.022 0.433 0.473 Higher education 0.307 0.012 8,034 9,458 2.341 0.039 0.283 0.331 Currently married (in union) 0.546 0.017 14,308 16,450 1.224 0.031 0.512 0.580 Married before age 20 0.315 0.008 8,412 9,830 1.626 0.025 0.299 0.331 Currently pregnant 0.055 0.003 14,308 16,450 1.401 0.058 0.048 0.061 Children ever born 2.022 0.072 14,308 16,450 1.284 0.036 1.878 2.165 Children surviving 1.958 0.069 14,308 16,450 1.278 0.035 1.819 2.096 Children ever born to women age 40-49 4.490 0.081 2,735 3,364 1.768 0.018 4.328 4.652 Knows any contraceptive method 1.000 0.000 7,575 8,983 0.977 0.000 1.000 1.000 Knows any modern contraceptive method 1.000 0.000 7,575 8,983 0.977 0.000 1.000 1.000 Currently using any method 0.611 0.009 7,575 8,983 1.520 0.014 0.594 0.628 Currently using a modern method 0.427 0.009 7,575 8,983 1.505 0.020 0.410 0.445 Currently using a traditional method 0.183 0.006 7,575 8,983 1.357 0.033 0.171 0.195 Currently using pill 0.073 0.006 7,575 8,983 1.845 0.075 0.062 0.084 Currently using IUD 0.221 0.009 7,575 8,983 1.896 0.041 0.203 0.239 Currently using condoms 0.085 0.006 7,575 8,983 1.740 0.066 0.074 0.096 Currently using injectables 0.008 0.001 7,575 8,983 1.343 0.177 0.005 0.010 Currently using female sterilization 0.022 0.003 7,575 8,983 1.844 0.142 0.016 0.028 Currently using rhythm 0.036 0.004 7,575 8,983 1.910 0.114 0.028 0.044 Currently using withdrawal 0.139 0.006 7,575 8,983 1.504 0.043 0.127 0.151 Used public sector source 0.415 0.016 3,100 3,698 1.857 0.040 0.382 0.448 Want no more children 0.532 0.010 7,575 8,983 1.695 0.018 0.513 0.552 Want to delay birth at least 2 years 0.226 0.008 7,575 8,983 1.723 0.037 0.209 0.242 Ideal number of children 3.906 0.036 7,801 9,110 1.650 0.009 3.834 3.978 Mothers received antenatal care for last birth 0.991 0.002 4,738 5,395 1.647 0.002 0.986 0.996 Mothers protected against tetanus for last birth 0.323 0.014 4,738 5,395 2.009 0.043 0.295 0.351 Births with skilled attendant at delivery 0.996 0.002 7,156 8,010 1.810 0.002 0.993 0.999 Had diarrhea in the last 2 weeks 0.161 0.009 6,995 7,852 1.943 0.058 0.142 0.179 Treated with ORS 0.200 0.022 1,103 1,261 1.693 0.112 0.155 0.245 Sought medical treatment for diarrhea 0.555 0.031 1,103 1,261 1.895 0.055 0.493 0.616 Vaccination card seen 0.800 0.019 1,346 1,538 1.751 0.024 0.761 0.839 Received BCG vaccination 0.985 0.011 1,346 1,538 3.181 0.011 0.964 1.006 Received DPT (3 doses) vaccination 0.986 0.004 1,346 1,538 1.191 0.004 0.979 0.994 Received polio (3 doses) vaccination 0.987 0.004 1,346 1,538 1.202 0.004 0.979 0.994 Received measles vaccination 0.943 0.011 1,346 1,538 1.775 0.012 0.920 0.965 Received all vaccinations 0.930 0.015 1,346 1,538 2.147 0.016 0.900 0.960 Height-for-age (below -2SD) 0.074 0.007 4,404 4,737 1.526 0.098 0.059 0.088 Weight-for-height (below -2SD) 0.025 0.004 4,404 4,737 1.456 0.143 0.018 0.032 Weight-for-age (below -2SD) 0.032 0.005 4,404 4,737 1.661 0.155 0.022 0.042 Prevalence of anemia (children 6-59 months) 0.322 0.014 3,902 4,142 1.706 0.043 0.294 0.349 Experienced physical violence since age 15 by anyone 0.353 0.012 4,958 5,814 1.713 0.033 0.330 0.376 Ever experienced any sexual violence 0.092 0.008 4,958 5,814 1.952 0.087 0.076 0.108 Experienced physical or sexual violence by husband 0.243 0.011 4,958 5,814 1.880 0.047 0.221 0.266 Experienced physical or sexual violence by husband in
the last 12 months 0.148 0.009 4,958 5,814 1.718 0.059 0.130 0.165 Prevalence of anemia (women 15-49 years) 0.333 0.010 7,849 8,798 1.848 0.030 0.313 0.352 Body mass index (BMI) < 18.5 0.051 0.004 7,500 8,463 1.726 0.086 0.043 0.060 Total fertility rate (last 3 years) 3.423 0.076 39,134 46,355 1.650 0.022 3.271 3.575 Neonatal mortality rate (last 0-9 years) 12.356 1.789 14,089 15,660 1.547 0.145 8.778 15.934 Post-neonatal mortality rate (last 0-9 years) 5.297 1.095 14,085 15,635 1.731 0.207 3.108 7.486 Infant mortality rate (last 0-9 years) 17.653 2.364 14,090 15,660 1.769 0.134 12.926 22.380 Child mortality rate (last 0-9 years) 3.239 0.834 13,976 15,520 1.568 0.258 1.571 4.908 Under-5 mortality rate (last 0-9 years) 20.835 2.407 14,099 15,665 1.699 0.116 16.021 25.650
na = Not applicable
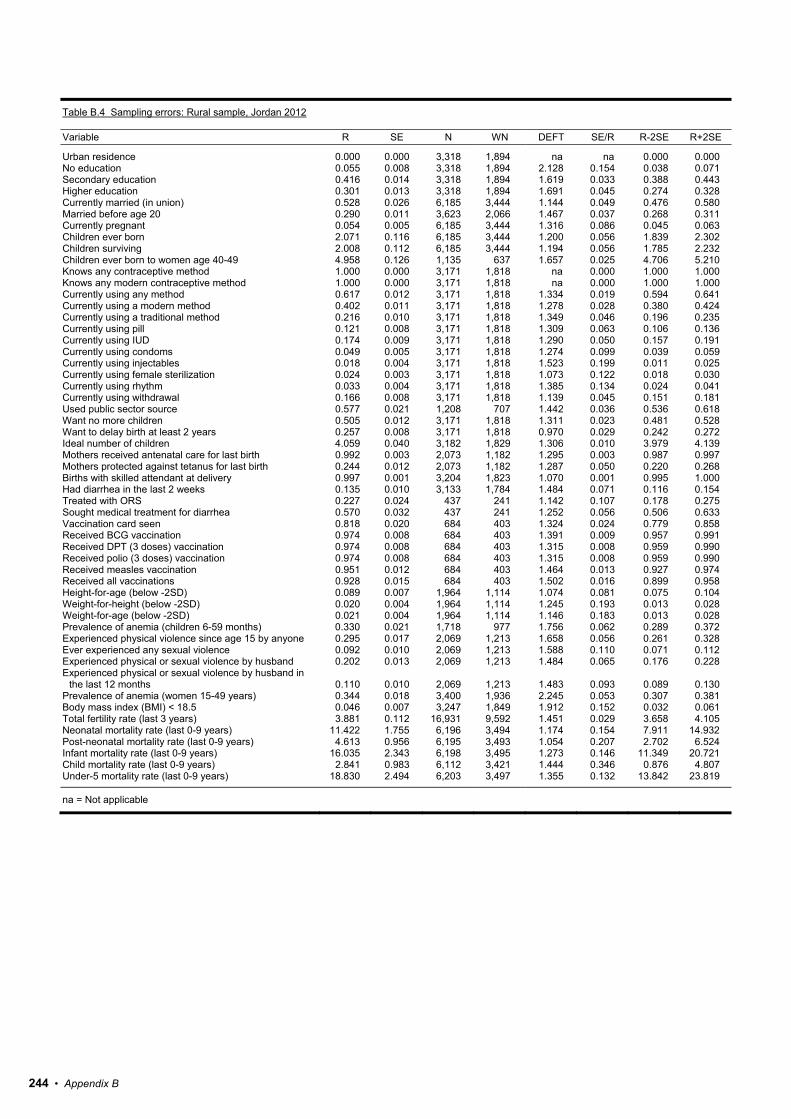
244 • Appendix B
Table B.4 Sampling errors: Rural sample, Jordan 2012
Variable R SE N WN DEFT SE/R R-2SE R+2SE
Urban residence 0.000 0.000 3,318 1,894 na na 0.000 0.000 No education 0.055 0.008 3,318 1,894 2.128 0.154 0.038 0.071 Secondary education 0.416 0.014 3,318 1,894 1.619 0.033 0.388 0.443 Higher education 0.301 0.013 3,318 1,894 1.691 0.045 0.274 0.328 Currently married (in union) 0.528 0.026 6,185 3,444 1.144 0.049 0.476 0.580 Married before age 20 0.290 0.011 3,623 2,066 1.467 0.037 0.268 0.311 Currently pregnant 0.054 0.005 6,185 3,444 1.316 0.086 0.045 0.063 Children ever born 2.071 0.116 6,185 3,444 1.200 0.056 1.839 2.302 Children surviving 2.008 0.112 6,185 3,444 1.194 0.056 1.785 2.232 Children ever born to women age 40-49 4.958 0.126 1,135 637 1.657 0.025 4.706 5.210 Knows any contraceptive method 1.000 0.000 3,171 1,818 na 0.000 1.000 1.000 Knows any modern contraceptive method 1.000 0.000 3,171 1,818 na 0.000 1.000 1.000 Currently using any method 0.617 0.012 3,171 1,818 1.334 0.019 0.594 0.641 Currently using a modern method 0.402 0.011 3,171 1,818 1.278 0.028 0.380 0.424 Currently using a traditional method 0.216 0.010 3,171 1,818 1.349 0.046 0.196 0.235 Currently using pill 0.121 0.008 3,171 1,818 1.309 0.063 0.106 0.136 Currently using IUD 0.174 0.009 3,171 1,818 1.290 0.050 0.157 0.191 Currently using condoms 0.049 0.005 3,171 1,818 1.274 0.099 0.039 0.059 Currently using injectables 0.018 0.004 3,171 1,818 1.523 0.199 0.011 0.025 Currently using female sterilization 0.024 0.003 3,171 1,818 1.073 0.122 0.018 0.030 Currently using rhythm 0.033 0.004 3,171 1,818 1.385 0.134 0.024 0.041 Currently using withdrawal 0.166 0.008 3,171 1,818 1.139 0.045 0.151 0.181 Used public sector source 0.577 0.021 1,208 707 1.442 0.036 0.536 0.618 Want no more children 0.505 0.012 3,171 1,818 1.311 0.023 0.481 0.528 Want to delay birth at least 2 years 0.257 0.008 3,171 1,818 0.970 0.029 0.242 0.272 Ideal number of children 4.059 0.040 3,182 1,829 1.306 0.010 3.979 4.139 Mothers received antenatal care for last birth 0.992 0.003 2,073 1,182 1.295 0.003 0.987 0.997 Mothers protected against tetanus for last birth 0.244 0.012 2,073 1,182 1.287 0.050 0.220 0.268 Births with skilled attendant at delivery 0.997 0.001 3,204 1,823 1.070 0.001 0.995 1.000 Had diarrhea in the last 2 weeks 0.135 0.010 3,133 1,784 1.484 0.071 0.116 0.154 Treated with ORS 0.227 0.024 437 241 1.142 0.107 0.178 0.275 Sought medical treatment for diarrhea 0.570 0.032 437 241 1.252 0.056 0.506 0.633 Vaccination card seen 0.818 0.020 684 403 1.324 0.024 0.779 0.858 Received BCG vaccination 0.974 0.008 684 403 1.391 0.009 0.957 0.991 Received DPT (3 doses) vaccination 0.974 0.008 684 403 1.315 0.008 0.959 0.990 Received polio (3 doses) vaccination 0.974 0.008 684 403 1.315 0.008 0.959 0.990 Received measles vaccination 0.951 0.012 684 403 1.464 0.013 0.927 0.974 Received all vaccinations 0.928 0.015 684 403 1.502 0.016 0.899 0.958 Height-for-age (below -2SD) 0.089 0.007 1,964 1,114 1.074 0.081 0.075 0.104 Weight-for-height (below -2SD) 0.020 0.004 1,964 1,114 1.245 0.193 0.013 0.028 Weight-for-age (below -2SD) 0.021 0.004 1,964 1,114 1.146 0.183 0.013 0.028 Prevalence of anemia (children 6-59 months) 0.330 0.021 1,718 977 1.756 0.062 0.289 0.372 Experienced physical violence since age 15 by anyone 0.295 0.017 2,069 1,213 1.658 0.056 0.261 0.328 Ever experienced any sexual violence 0.092 0.010 2,069 1,213 1.588 0.110 0.071 0.112 Experienced physical or sexual violence by husband 0.202 0.013 2,069 1,213 1.484 0.065 0.176 0.228 Experienced physical or sexual violence by husband in
the last 12 months 0.110 0.010 2,069 1,213 1.483 0.093 0.089 0.130 Prevalence of anemia (women 15-49 years) 0.344 0.018 3,400 1,936 2.245 0.053 0.307 0.381 Body mass index (BMI) < 18.5 0.046 0.007 3,247 1,849 1.912 0.152 0.032 0.061 Total fertility rate (last 3 years) 3.881 0.112 16,931 9,592 1.451 0.029 3.658 4.105 Neonatal mortality rate (last 0-9 years) 11.422 1.755 6,196 3,494 1.174 0.154 7.911 14.932 Post-neonatal mortality rate (last 0-9 years) 4.613 0.956 6,195 3,493 1.054 0.207 2.702 6.524 Infant mortality rate (last 0-9 years) 16.035 2.343 6,198 3,495 1.273 0.146 11.349 20.721 Child mortality rate (last 0-9 years) 2.841 0.983 6,112 3,421 1.444 0.346 0.876 4.807 Under-5 mortality rate (last 0-9 years) 18.830 2.494 6,203 3,497 1.355 0.132 13.842 23.819
na = Not applicable
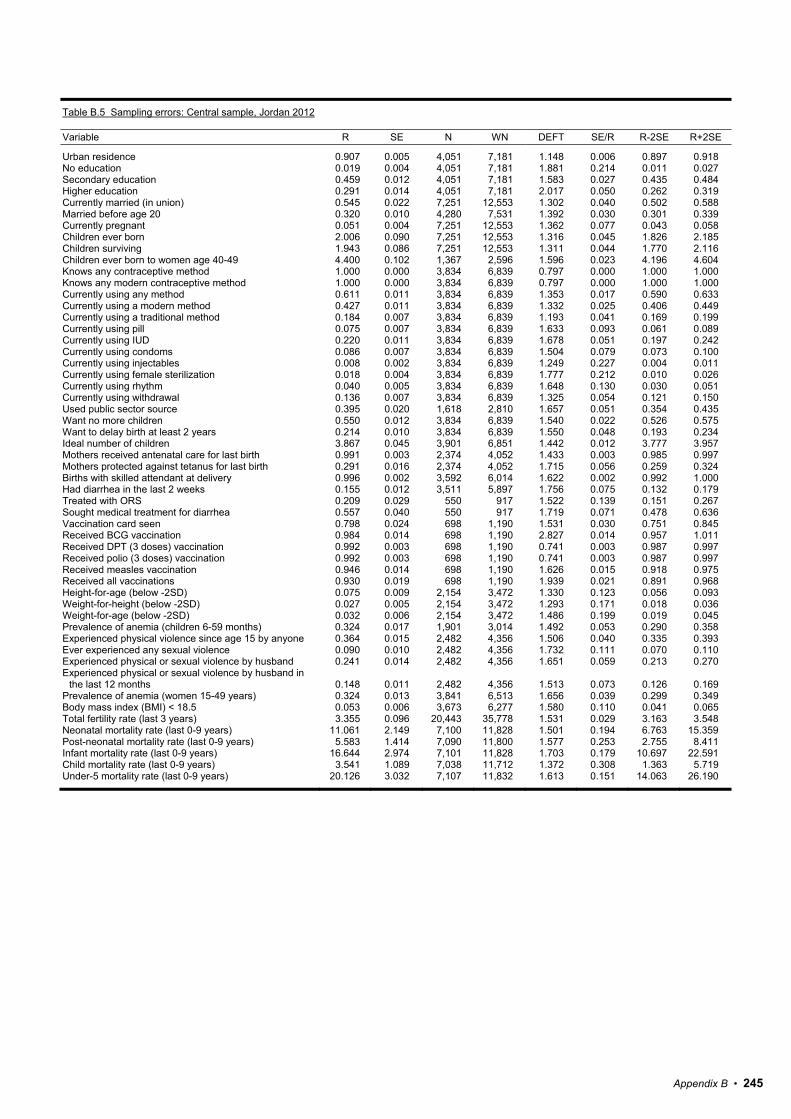
Appendix B • 245
Table B.5 Sampling errors: Central sample, Jordan 2012
Variable R SE N WN DEFT SE/R R-2SE R+2SE
Urban residence 0.907 0.005 4,051 7,181 1.148 0.006 0.897 0.918 No education 0.019 0.004 4,051 7,181 1.881 0.214 0.011 0.027 Secondary education 0.459 0.012 4,051 7,181 1.583 0.027 0.435 0.484 Higher education 0.291 0.014 4,051 7,181 2.017 0.050 0.262 0.319 Currently married (in union) 0.545 0.022 7,251 12,553 1.302 0.040 0.502 0.588 Married before age 20 0.320 0.010 4,280 7,531 1.392 0.030 0.301 0.339 Currently pregnant 0.051 0.004 7,251 12,553 1.362 0.077 0.043 0.058 Children ever born 2.006 0.090 7,251 12,553 1.316 0.045 1.826 2.185 Children surviving 1.943 0.086 7,251 12,553 1.311 0.044 1.770 2.116 Children ever born to women age 40-49 4.400 0.102 1,367 2,596 1.596 0.023 4.196 4.604 Knows any contraceptive method 1.000 0.000 3,834 6,839 0.797 0.000 1.000 1.000 Knows any modern contraceptive method 1.000 0.000 3,834 6,839 0.797 0.000 1.000 1.000 Currently using any method 0.611 0.011 3,834 6,839 1.353 0.017 0.590 0.633 Currently using a modern method 0.427 0.011 3,834 6,839 1.332 0.025 0.406 0.449 Currently using a traditional method 0.184 0.007 3,834 6,839 1.193 0.041 0.169 0.199 Currently using pill 0.075 0.007 3,834 6,839 1.633 0.093 0.061 0.089 Currently using IUD 0.220 0.011 3,834 6,839 1.678 0.051 0.197 0.242 Currently using condoms 0.086 0.007 3,834 6,839 1.504 0.079 0.073 0.100 Currently using injectables 0.008 0.002 3,834 6,839 1.249 0.227 0.004 0.011 Currently using female sterilization 0.018 0.004 3,834 6,839 1.777 0.212 0.010 0.026 Currently using rhythm 0.040 0.005 3,834 6,839 1.648 0.130 0.030 0.051 Currently using withdrawal 0.136 0.007 3,834 6,839 1.325 0.054 0.121 0.150 Used public sector source 0.395 0.020 1,618 2,810 1.657 0.051 0.354 0.435 Want no more children 0.550 0.012 3,834 6,839 1.540 0.022 0.526 0.575 Want to delay birth at least 2 years 0.214 0.010 3,834 6,839 1.550 0.048 0.193 0.234 Ideal number of children 3.867 0.045 3,901 6,851 1.442 0.012 3.777 3.957 Mothers received antenatal care for last birth 0.991 0.003 2,374 4,052 1.433 0.003 0.985 0.997 Mothers protected against tetanus for last birth 0.291 0.016 2,374 4,052 1.715 0.056 0.259 0.324 Births with skilled attendant at delivery 0.996 0.002 3,592 6,014 1.622 0.002 0.992 1.000 Had diarrhea in the last 2 weeks 0.155 0.012 3,511 5,897 1.756 0.075 0.132 0.179 Treated with ORS 0.209 0.029 550 917 1.522 0.139 0.151 0.267 Sought medical treatment for diarrhea 0.557 0.040 550 917 1.719 0.071 0.478 0.636 Vaccination card seen 0.798 0.024 698 1,190 1.531 0.030 0.751 0.845 Received BCG vaccination 0.984 0.014 698 1,190 2.827 0.014 0.957 1.011 Received DPT (3 doses) vaccination 0.992 0.003 698 1,190 0.741 0.003 0.987 0.997 Received polio (3 doses) vaccination 0.992 0.003 698 1,190 0.741 0.003 0.987 0.997 Received measles vaccination 0.946 0.014 698 1,190 1.626 0.015 0.918 0.975 Received all vaccinations 0.930 0.019 698 1,190 1.939 0.021 0.891 0.968 Height-for-age (below -2SD) 0.075 0.009 2,154 3,472 1.330 0.123 0.056 0.093 Weight-for-height (below -2SD) 0.027 0.005 2,154 3,472 1.293 0.171 0.018 0.036 Weight-for-age (below -2SD) 0.032 0.006 2,154 3,472 1.486 0.199 0.019 0.045 Prevalence of anemia (children 6-59 months) 0.324 0.017 1,901 3,014 1.492 0.053 0.290 0.358 Experienced physical violence since age 15 by anyone 0.364 0.015 2,482 4,356 1.506 0.040 0.335 0.393 Ever experienced any sexual violence 0.090 0.010 2,482 4,356 1.732 0.111 0.070 0.110 Experienced physical or sexual violence by husband 0.241 0.014 2,482 4,356 1.651 0.059 0.213 0.270 Experienced physical or sexual violence by husband in
the last 12 months 0.148 0.011 2,482 4,356 1.513 0.073 0.126 0.169 Prevalence of anemia (women 15-49 years) 0.324 0.013 3,841 6,513 1.656 0.039 0.299 0.349 Body mass index (BMI) < 18.5 0.053 0.006 3,673 6,277 1.580 0.110 0.041 0.065 Total fertility rate (last 3 years) 3.355 0.096 20,443 35,778 1.531 0.029 3.163 3.548 Neonatal mortality rate (last 0-9 years) 11.061 2.149 7,100 11,828 1.501 0.194 6.763 15.359 Post-neonatal mortality rate (last 0-9 years) 5.583 1.414 7,090 11,800 1.577 0.253 2.755 8.411 Infant mortality rate (last 0-9 years) 16.644 2.974 7,101 11,828 1.703 0.179 10.697 22.591 Child mortality rate (last 0-9 years) 3.541 1.089 7,038 11,712 1.372 0.308 1.363 5.719 Under-5 mortality rate (last 0-9 years) 20.126 3.032 7,107 11,832 1.613 0.151 14.063 26.190

246 • Appendix B
Table B.6 Sampling errors: North sample, Jordan 2012
Variable R SE N WN DEFT SE/R R-2SE R+2SE
Urban residence 0.737 0.008 3,980 3,120 1.081 0.010 0.722 0.752 No education 0.023 0.004 3,980 3,120 1.578 0.164 0.015 0.030 Secondary education 0.440 0.012 3,980 3,120 1.544 0.028 0.415 0.464 Higher education 0.325 0.015 3,980 3,120 2.005 0.046 0.295 0.355 Currently married (in union) 0.538 0.020 6,988 5,511 1.230 0.038 0.497 0.579 Married before age 20 0.298 0.010 4,164 3,237 1.528 0.035 0.277 0.319 Currently pregnant 0.062 0.004 6,988 5,511 1.284 0.067 0.054 0.071 Children ever born 2.033 0.087 6,988 5,511 1.245 0.043 1.858 2.208 Children surviving 1.971 0.084 6,988 5,511 1.243 0.043 1.802 2.140 Children ever born to women age 40-49 4.809 0.090 1,270 1,019 1.271 0.019 4.628 4.990 Knows any contraceptive method 1.000 0.000 3,771 2,966 na 0.000 1.000 1.000 Knows any modern contraceptive method 1.000 0.000 3,771 2,966 na 0.000 1.000 1.000 Currently using any method 0.613 0.010 3,771 2,966 1.214 0.016 0.594 0.632 Currently using a modern method 0.423 0.010 3,771 2,966 1.233 0.023 0.403 0.442 Currently using a traditional method 0.190 0.008 3,771 2,966 1.266 0.043 0.174 0.207 Currently using pill 0.092 0.007 3,771 2,966 1.390 0.071 0.079 0.105 Currently using IUD 0.211 0.010 3,771 2,966 1.441 0.045 0.192 0.230 Currently using condoms 0.067 0.006 3,771 2,966 1.582 0.096 0.054 0.079 Currently using injectables 0.010 0.002 3,771 2,966 1.152 0.184 0.007 0.014 Currently using female sterilization 0.028 0.004 3,771 2,966 1.323 0.127 0.021 0.035 Currently using rhythm 0.026 0.004 3,771 2,966 1.439 0.144 0.018 0.033 Currently using withdrawal 0.150 0.007 3,771 2,966 1.286 0.050 0.135 0.165 Used public sector source 0.493 0.021 1,506 1,212 1.624 0.043 0.451 0.534 Want no more children 0.474 0.010 3,771 2,966 1.199 0.021 0.454 0.493 Want to delay birth at least 2 years 0.270 0.009 3,771 2,966 1.309 0.035 0.251 0.289 Ideal number of children 4.024 0.042 3,916 3,082 1.469 0.010 3.939 4.108 Mothers received antenatal care for last birth 0.992 0.003 2,484 1,903 1.450 0.003 0.987 0.997 Mothers protected against tetanus for last birth 0.351 0.019 2,484 1,903 1.970 0.054 0.313 0.389 Births with skilled attendant at delivery 0.997 0.001 3,798 2,867 1.029 0.001 0.996 0.999 Had diarrhea in the last 2 weeks 0.170 0.010 3,721 2,811 1.469 0.058 0.150 0.190 Treated with ORS 0.190 0.023 624 478 1.309 0.121 0.144 0.236 Sought medical treatment for diarrhea 0.531 0.032 624 478 1.437 0.059 0.468 0.595 Vaccination card seen 0.834 0.020 762 562 1.401 0.024 0.794 0.873 Received BCG vaccination 0.992 0.005 762 562 1.472 0.005 0.982 1.002 Received DPT (3 doses) vaccination 0.981 0.007 762 562 1.299 0.007 0.968 0.994 Received polio (3 doses) vaccination 0.982 0.006 762 562 1.322 0.007 0.969 0.995 Received measles vaccination 0.952 0.010 762 562 1.205 0.010 0.932 0.971 Received all vaccinations 0.945 0.011 762 562 1.261 0.011 0.923 0.966 Height-for-age (below -2SD) 0.067 0.007 2,415 1,813 1.257 0.105 0.053 0.081 Weight-for-height (below -2SD) 0.020 0.004 2,415 1,813 1.174 0.178 0.013 0.027 Weight-for-age (below -2SD) 0.025 0.004 2,415 1,813 1.341 0.182 0.016 0.034 Prevalence of anemia (children 6-59 months) 0.325 0.019 2,129 1,603 1.735 0.058 0.288 0.362 Experienced physical violence since age 15 by anyone 0.324 0.014 2,450 1,989 1.498 0.044 0.296 0.352 Ever experienced any sexual violence 0.106 0.010 2,450 1,989 1.675 0.098 0.085 0.127 Experienced physical or sexual violence by husband 0.245 0.014 2,450 1,989 1.628 0.058 0.217 0.274 Experienced physical or sexual violence by husband in
the last 12 months 0.135 0.010 2,450 1,989 1.498 0.077 0.114 0.155 Prevalence of anemia (women 15-49 years) 0.353 0.014 4,066 3,173 1.843 0.039 0.325 0.380 Body mass index (BMI) < 18.5 0.047 0.004 3,869 3,027 1.309 0.094 0.038 0.056 Total fertility rate (last 3 years) 3.764 0.095 19,276 15,409 1.223 0.025 3.574 3.953 Neonatal mortality rate (last 0-9 years) 13.843 2.409 7,223 5,409 1.310 0.174 9.025 18.661 Post-neonatal mortality rate (last 0-9 years) 3.471 0.790 7,224 5,415 1.085 0.228 1.890 5.052 Infant mortality rate (last 0-9 years) 17.314 2.583 7,224 5,409 1.297 0.149 12.149 22.479 Child mortality rate (last 0-9 years) 1.929 0.641 7,127 5,328 1.221 0.332 0.646 3.211 Under-5 mortality rate (last 0-9 years) 19.209 2.592 7,228 5,411 1.269 0.135 14.026 24.393
na = Not applicable

Appendix B • 247
Table B.7 Sampling errors: South sample, Jordan 2012
Variable R SE N WN DEFT SE/R R-2SE R+2SE
Urban residence 0.613 0.023 3,321 1,051 2.691 0.037 0.567 0.658 No education 0.058 0.011 3,321 1,051 2.629 0.184 0.037 0.080 Secondary education 0.383 0.014 3,321 1,051 1.717 0.038 0.354 0.412 Higher education 0.356 0.018 3,321 1,051 2.213 0.052 0.320 0.393 Currently married (in union) 0.536 0.030 6,064 1,856 1.209 0.055 0.477 0.596 Married before age 20 0.286 0.011 3,548 1,118 1.486 0.038 0.264 0.308 Currently pregnant 0.057 0.004 6,064 1,856 1.093 0.071 0.049 0.066 Children ever born 2.158 0.143 6,064 1,856 1.370 0.066 1.872 2.445 Children surviving 2.083 0.138 6,064 1,856 1.362 0.066 1.808 2.359 Children ever born to women age 40-49 5.056 0.093 1,224 384 1.283 0.018 4.870 5.241 Knows any contraceptive method 1.000 0.000 3,141 996 na 0.000 1.000 1.000 Knows any modern contraceptive method 1.000 0.000 3,141 996 na 0.000 1.000 1.000 Currently using any method 0.610 0.013 3,141 996 1.501 0.021 0.584 0.636 Currently using a modern method 0.395 0.012 3,141 996 1.424 0.031 0.370 0.420 Currently using a traditional method 0.215 0.009 3,141 996 1.199 0.041 0.197 0.233 Currently using pill 0.094 0.006 3,141 996 1.150 0.064 0.082 0.106 Currently using IUD 0.171 0.013 3,141 996 2.002 0.079 0.144 0.198 Currently using condoms 0.064 0.006 3,141 996 1.483 0.101 0.051 0.077 Currently using injectables 0.017 0.003 3,141 996 1.260 0.173 0.011 0.022 Currently using female sterilization 0.033 0.004 3,141 996 1.303 0.127 0.024 0.041 Currently using rhythm 0.031 0.004 3,141 996 1.370 0.136 0.023 0.040 Currently using withdrawal 0.176 0.008 3,141 996 1.190 0.046 0.159 0.192 Used public sector source 0.615 0.021 1,184 383 1.475 0.034 0.573 0.656 Want no more children 0.532 0.010 3,141 996 1.091 0.018 0.512 0.551 Want to delay birth at least 2 years 0.233 0.010 3,141 996 1.274 0.041 0.214 0.253 Ideal number of children 4.089 0.044 3,166 1,005 1.335 0.011 4.002 4.177 Mothers received antenatal care for last birth 0.991 0.003 1,953 622 1.436 0.003 0.985 0.997 Mothers protected against tetanus for last birth 0.292 0.020 1,953 622 1.977 0.069 0.252 0.333 Births with skilled attendant at delivery 0.995 0.002 2,970 952 1.520 0.002 0.990 0.999 Had diarrhea in the last 2 weeks 0.114 0.010 2,896 929 1.656 0.092 0.093 0.135 Treated with ORS 0.226 0.021 366 106 0.881 0.092 0.185 0.268 Sought medical treatment for diarrhea 0.675 0.031 366 106 1.121 0.046 0.614 0.737 Vaccination card seen 0.753 0.028 570 189 1.560 0.037 0.698 0.809 Received BCG vaccination 0.946 0.017 570 189 1.834 0.018 0.913 0.980 Received DPT (3 doses) vaccination 0.940 0.023 570 189 2.339 0.024 0.895 0.985 Received polio (3 doses) vaccination 0.940 0.023 570 189 2.339 0.024 0.895 0.985 Received measles vaccination 0.910 0.021 570 189 1.787 0.023 0.869 0.952 Received all vaccinations 0.886 0.023 570 189 1.774 0.026 0.840 0.932 Height-for-age (below -2SD) 0.121 0.013 1,799 567 1.542 0.103 0.096 0.146 Weight-for-height (below -2SD) 0.020 0.004 1,799 567 1.179 0.194 0.012 0.027 Weight-for-age (below -2SD) 0.034 0.006 1,799 567 1.324 0.174 0.022 0.046 Prevalence of anemia (children 6-59 months) 0.318 0.021 1,590 503 1.682 0.066 0.277 0.360 Experienced physical violence since age 15 by anyone 0.263 0.017 2,095 681 1.795 0.066 0.228 0.297 Ever experienced any sexual violence 0.066 0.007 2,095 681 1.333 0.110 0.051 0.080 Experienced physical or sexual violence by husband 0.178 0.015 2,095 681 1.735 0.081 0.149 0.207 Experienced physical or sexual violence by husband in
the last 12 months 0.118 0.012 2,095 681 1.681 0.101 0.094 0.142 Prevalence of anemia (women 15-49 years) 0.344 0.012 3,342 1,048 1.474 0.035 0.320 0.368 Body mass index (BMI) < 18.5 0.044 0.005 3,205 1,008 1.270 0.104 0.035 0.053 Total fertility rate (last 3 years) 3.723 0.109 16,837 5,192 1.181 0.029 3.506 3.941 Neonatal mortality rate (last 0-9 years) 14.438 2.048 5,962 1,917 1.126 0.142 10.343 18.533 Post-neonatal mortality rate (last 0-9 years) 7.453 1.402 5,966 1,914 1.193 0.188 4.650 10.256 Infant mortality rate (last 0-9 years) 21.891 2.684 5,963 1,917 1.253 0.123 16.522 27.259 Child mortality rate (last 0-9 years) 4.325 1.089 5,923 1,901 1.189 0.252 2.148 6.503 Under-5 mortality rate (last 0-9 years) 26.121 3.023 5,967 1,918 1.324 0.116 20.076 32.166
na = Not applicable

248 • Appendix B
Table B.8 Sampling errors: Amman sample, Jordan 2012
Variable R SE N WN DEFT SE/R R-2SE R+2SE
Urban residence 0.940 0.006 1,106 4,454 0.853 0.007 0.927 0.952 No education 0.018 0.006 1,106 4,454 1.468 0.327 0.006 0.030 Secondary education 0.451 0.019 1,106 4,454 1.265 0.042 0.413 0.488 Higher education 0.300 0.022 1,106 4,454 1.597 0.074 0.255 0.344 Currently married (in union) 0.527 0.034 2,181 8,085 1.030 0.064 0.460 0.595 Married before age 20 0.312 0.014 1,171 4,728 1.042 0.043 0.285 0.339 Currently pregnant 0.050 0.006 2,181 8,085 1.057 0.115 0.038 0.061 Children ever born 1.912 0.136 2,181 8,085 1.037 0.071 1.640 2.184 Children surviving 1.851 0.131 2,181 8,085 1.036 0.071 1.588 2.113 Children ever born to women age 40-49 4.357 0.146 410 1,727 1.231 0.034 4.064 4.649 Knows any contraceptive method 1.000 0.000 1,049 4,262 na 0.000 1.000 1.000 Knows any modern contraceptive method 1.000 0.000 1,049 4,262 na 0.000 1.000 1.000 Currently using any method 0.605 0.016 1,049 4,262 1.041 0.026 0.574 0.637 Currently using a modern method 0.416 0.016 1,049 4,262 1.026 0.038 0.385 0.447 Currently using a traditional method 0.189 0.010 1,049 4,262 0.863 0.055 0.169 0.210 Currently using pill 0.058 0.010 1,049 4,262 1.380 0.172 0.038 0.078 Currently using IUD 0.218 0.017 1,049 4,262 1.336 0.078 0.184 0.252 Currently using condoms 0.095 0.010 1,049 4,262 1.125 0.107 0.075 0.116 Currently using injectables 0.005 0.002 1,049 4,262 1.036 0.437 0.001 0.010 Currently using female sterilization 0.017 0.006 1,049 4,262 1.468 0.345 0.005 0.029 Currently using rhythm 0.044 0.008 1,049 4,262 1.256 0.180 0.028 0.060 Currently using withdrawal 0.140 0.011 1,049 4,262 1.005 0.077 0.118 0.161 Used public sector source 0.342 0.030 435 1,687 1.322 0.088 0.282 0.402 Want no more children 0.562 0.019 1,049 4,262 1.217 0.033 0.524 0.599 Want to delay birth at least 2 years 0.209 0.016 1,049 4,262 1.246 0.075 0.178 0.240 Ideal number of children 3.747 0.066 1,050 4,211 1.204 0.018 3.615 3.879 Mothers received antenatal care for last birth 0.988 0.005 635 2,469 1.030 0.005 0.979 0.997 Mothers protected against tetanus for last birth 0.258 0.025 635 2,469 1.438 0.099 0.207 0.309 Births with skilled attendant at delivery 0.994 0.003 951 3,622 1.122 0.003 0.988 1.001 Had diarrhea in the last 2 weeks 0.160 0.018 928 3,547 1.385 0.115 0.123 0.196 Treated with ORS 0.158 0.042 142 567 1.271 0.269 0.073 0.242 Sought medical treatment for diarrhea 0.536 0.062 142 567 1.396 0.116 0.412 0.661 Vaccination card seen 0.795 0.035 186 730 1.188 0.044 0.725 0.866 Received BCG vaccination 0.978 0.022 186 730 2.012 0.023 0.934 1.022 Received DPT (3 doses) vaccination 0.996 0.002 186 730 0.533 0.002 0.992 1.001 Received polio (3 doses) vaccination 0.996 0.002 186 730 0.533 0.002 0.992 1.001 Received measles vaccination 0.938 0.022 186 730 1.231 0.024 0.893 0.982 Received all vaccinations 0.915 0.030 186 730 1.471 0.033 0.854 0.976 Height-for-age (below -2SD) 0.071 0.014 575 2,038 1.021 0.205 0.042 0.100 Weight-for-height (below -2SD) 0.029 0.007 575 2,038 1.020 0.249 0.015 0.044 Weight-for-age (below -2SD) 0.033 0.010 575 2,038 1.158 0.316 0.012 0.054 Prevalence of anemia (children 6-59 months) 0.342 0.026 506 1,738 1.199 0.077 0.290 0.395 Experienced physical violence since age 15 by anyone 0.370 0.022 668 2,604 1.190 0.060 0.325 0.414 Ever experienced any sexual violence 0.088 0.015 668 2,604 1.391 0.173 0.058 0.119 Experienced physical or sexual violence by husband 0.232 0.022 668 2,604 1.344 0.095 0.188 0.276 Experienced physical or sexual violence by husband in
the last 12 months 0.156 0.016 668 2,604 1.157 0.104 0.124 0.189 Prevalence of anemia (women 15-49 years) 0.295 0.019 1,016 3,988 1.302 0.063 0.258 0.332 Body mass index (BMI) < 18.5 0.054 0.009 976 3,863 1.245 0.167 0.036 0.072 Total fertility rate (last 3 years) 3.206 0.143 6,099 23,230 1.204 0.044 2.920 3.491 Neonatal mortality rate (last 0-9 years) 10.038 3.355 1,842 6,998 1.294 0.334 3.327 16.748 Post-neonatal mortality rate (last 0-9 years) 6.624 2.300 1,835 6,973 1.211 0.347 2.024 11.224 Infant mortality rate (last 0-9 years) 16.661 4.815 1,843 6,998 1.400 0.289 7.031 26.292 Child mortality rate (last 0-9 years) 3.483 1.685 1,809 6,909 1.034 0.484 0.113 6.854 Under-5 mortality rate (last 0-9 years) 20.087 4.882 1,843 6,998 1.313 0.243 10.323 29.850
na = Not applicable

Appendix B • 249
Table B.9 Sampling errors: Balqa sample, Jordan 2012
Variable R SE N WN DEFT SE/R R-2SE R+2SE
Urban residence 0.732 0.017 945 765 1.163 0.023 0.698 0.765 No education 0.033 0.011 945 765 1.921 0.342 0.010 0.055 Secondary education 0.403 0.020 945 765 1.223 0.048 0.364 0.442 Higher education 0.330 0.027 945 765 1.750 0.081 0.277 0.384 Currently married (in union) 0.535 0.044 1,681 1,353 1.223 0.083 0.446 0.624 Married before age 20 0.278 0.016 1,037 841 1.210 0.058 0.246 0.310 Currently pregnant 0.054 0.007 1,681 1,353 1.135 0.131 0.040 0.069 Children ever born 2.071 0.186 1,681 1,353 1.201 0.090 1.700 2.443 Children surviving 2.017 0.180 1,681 1,353 1.196 0.089 1.657 2.377 Children ever born to women age 40-49 4.323 0.155 338 272 1.242 0.036 4.013 4.633 Knows any contraceptive method 0.998 0.002 896 724 1.172 0.002 0.995 1.002 Knows any modern contraceptive method 0.998 0.002 896 724 1.172 0.002 0.995 1.002 Currently using any method 0.600 0.019 896 724 1.143 0.031 0.562 0.637 Currently using a modern method 0.416 0.019 896 724 1.133 0.045 0.379 0.453 Currently using a traditional method 0.184 0.015 896 724 1.174 0.083 0.154 0.214 Currently using pill 0.102 0.012 896 724 1.192 0.118 0.078 0.126 Currently using IUD 0.208 0.016 896 724 1.185 0.077 0.176 0.240 Currently using condoms 0.055 0.008 896 724 1.032 0.143 0.039 0.071 Currently using injectables 0.019 0.007 896 724 1.577 0.378 0.005 0.034 Currently using female sterilization 0.022 0.006 896 724 1.130 0.253 0.011 0.033 Currently using rhythm 0.047 0.008 896 724 1.098 0.165 0.032 0.063 Currently using withdrawal 0.123 0.012 896 724 1.059 0.094 0.100 0.146 Used public sector source 0.535 0.033 373 295 1.291 0.062 0.468 0.602 Want no more children 0.529 0.019 896 724 1.154 0.036 0.491 0.568 Want to delay birth at least 2 years 0.231 0.013 896 724 0.945 0.058 0.204 0.258 Ideal number of children 4.035 0.079 919 745 1.293 0.020 3.877 4.193 Mothers received antenatal care for last birth 0.996 0.003 563 452 1.006 0.003 0.991 1.001 Mothers protected against tetanus for last birth 0.357 0.023 563 452 1.128 0.064 0.311 0.403 Births with skilled attendant at delivery 0.998 0.001 871 703 0.926 0.001 0.995 1.001 Had diarrhea in the last 2 weeks 0.129 0.015 855 691 1.190 0.113 0.100 0.158 Treated with ORS 0.350 0.053 114 89 1.091 0.150 0.245 0.455 Sought medical treatment for diarrhea 0.579 0.056 114 89 1.092 0.097 0.467 0.691 Vaccination card seen 0.850 0.027 174 145 0.994 0.032 0.795 0.905 Received BCG vaccination 0.985 0.009 174 145 0.940 0.009 0.968 1.002 Received DPT (3 doses) vaccination 0.979 0.010 174 145 0.959 0.011 0.958 0.999 Received polio (3 doses) vaccination 0.979 0.010 174 145 0.959 0.011 0.958 0.999 Received measles vaccination 0.966 0.015 174 145 1.126 0.016 0.935 0.996 Received all vaccinations 0.948 0.019 174 145 1.146 0.020 0.910 0.986 Height-for-age (below -2SD) 0.056 0.011 506 395 1.011 0.194 0.034 0.077 Weight-for-height (below -2SD) 0.033 0.008 506 395 1.035 0.251 0.016 0.049 Weight-for-age (below -2SD) 0.030 0.007 506 395 0.927 0.235 0.016 0.044 Prevalence of anemia (children 6-59 months) 0.375 0.031 436 341 1.271 0.082 0.314 0.437 Experienced physical violence since age 15 by anyone 0.312 0.025 575 480 1.283 0.080 0.262 0.361 Ever experienced any sexual violence 0.074 0.013 575 480 1.169 0.172 0.049 0.100 Experienced physical or sexual violence by husband 0.226 0.024 575 480 1.373 0.106 0.178 0.274 Experienced physical or sexual violence by husband in
the last 12 months 0.111 0.014 575 480 1.053 0.124 0.083 0.139 Prevalence of anemia (women 15-49 years) 0.397 0.022 916 731 1.343 0.055 0.353 0.440 Body mass index (BMI) < 18.5 0.055 0.009 873 693 1.145 0.160 0.038 0.073 Total fertility rate (last 3 years) 3.840 0.174 4,799 3,873 1.376 0.045 3.491 4.189 Neonatal mortality rate (last 0-9 years) 9.622 3.118 1,708 1,354 1.178 0.324 3.385 15.859 Post-neonatal mortality rate (last 0-9 years) 4.818 1.809 1,703 1,347 1.075 0.376 1.199 8.436 Infant mortality rate (last 0-9 years) 14.440 3.582 1,708 1,354 1.152 0.248 7.276 21.603 Child mortality rate (last 0-9 years) 3.437 1.486 1,692 1,334 1.071 0.432 0.465 6.409 Under-5 mortality rate (last 0-9 years) 17.827 3.643 1,710 1,355 1.102 0.204 10.540 25.114

250 • Appendix B
Table B.10 Sampling errors: Zarqa sample, Jordan 2012
Variable R SE N WN DEFT SE/R R-2SE R+2SE
Urban residence 0.942 0.006 1,139 1,659 0.934 0.007 0.929 0.955 No education 0.014 0.005 1,139 1,659 1.425 0.354 0.004 0.024 Secondary education 0.514 0.015 1,139 1,659 1.033 0.030 0.483 0.544 Higher education 0.235 0.017 1,139 1,659 1.335 0.071 0.201 0.268 Currently married (in union) 0.605 0.033 1,942 2,583 0.658 0.055 0.539 0.672 Married before age 20 0.379 0.017 1,123 1,636 1.238 0.045 0.344 0.413 Currently pregnant 0.050 0.006 1,942 2,583 0.913 0.118 0.038 0.061 Children ever born 2.256 0.137 1,942 2,583 0.695 0.061 1.982 2.529 Children surviving 2.188 0.131 1,942 2,583 0.687 0.060 1.926 2.450 Children ever born to women age 40-49 4.462 0.124 354 502 1.061 0.028 4.213 4.710 Knows any contraceptive method 1.000 0.000 1,071 1,564 na 0.000 1.000 1.000 Knows any modern contraceptive method 1.000 0.000 1,071 1,564 na 0.000 1.000 1.000 Currently using any method 0.631 0.016 1,071 1,564 1.058 0.025 0.600 0.663 Currently using a modern method 0.465 0.016 1,071 1,564 1.017 0.033 0.434 0.496 Currently using a traditional method 0.167 0.014 1,071 1,564 1.219 0.083 0.139 0.194 Currently using pill 0.104 0.011 1,071 1,564 1.175 0.106 0.082 0.126 Currently using IUD 0.235 0.014 1,071 1,564 1.054 0.058 0.207 0.262 Currently using condoms 0.080 0.010 1,071 1,564 1.251 0.130 0.059 0.101 Currently using injectables 0.008 0.003 1,071 1,564 1.025 0.339 0.003 0.014 Currently using female sterilization 0.017 0.004 1,071 1,564 1.008 0.232 0.009 0.025 Currently using rhythm 0.026 0.006 1,071 1,564 1.209 0.226 0.014 0.038 Currently using withdrawal 0.126 0.011 1,071 1,564 1.105 0.089 0.104 0.149 Used public sector source 0.444 0.033 475 711 1.459 0.075 0.377 0.511 Want no more children 0.542 0.016 1,071 1,564 1.051 0.030 0.510 0.574 Want to delay birth at least 2 years 0.207 0.013 1,071 1,564 1.037 0.062 0.181 0.233 Ideal number of children 4.058 0.081 1,105 1,607 1.135 0.020 3.896 4.219 Mothers received antenatal care for last birth 0.995 0.003 662 947 0.986 0.003 0.990 1.001 Mothers protected against tetanus for last birth 0.320 0.021 662 947 1.135 0.065 0.279 0.362 Births with skilled attendant at delivery 1.000 0.000 990 1,412 na 0.000 1.000 1.000 Had diarrhea in the last 2 weeks 0.156 0.014 975 1,391 1.187 0.092 0.127 0.185 Treated with ORS 0.299 0.047 170 217 1.193 0.156 0.206 0.393 Sought medical treatment for diarrhea 0.614 0.040 170 217 0.976 0.066 0.533 0.694 Vaccination card seen 0.760 0.040 181 258 1.228 0.052 0.680 0.839 Received BCG vaccination 1.000 0.000 181 258 na 0.000 1.000 1.000 Received DPT (3 doses) vaccination 0.992 0.006 181 258 0.945 0.006 0.979 1.005 Received polio (3 doses) vaccination 0.992 0.006 181 258 0.945 0.006 0.979 1.005 Received measles vaccination 0.963 0.016 181 258 1.159 0.017 0.930 0.996 Received all vaccinations 0.963 0.016 181 258 1.159 0.017 0.930 0.996 Height-for-age (below -2SD) 0.098 0.012 622 879 1.001 0.127 0.073 0.122 Weight-for-height (below -2SD) 0.021 0.006 622 879 1.014 0.286 0.009 0.034 Weight-for-age (below -2SD) 0.035 0.007 622 879 0.954 0.203 0.021 0.049 Prevalence of anemia (children 6-59 months) 0.274 0.023 568 797 1.128 0.085 0.228 0.321 Experienced physical violence since age 15 by anyone 0.380 0.020 701 1,083 1.115 0.054 0.339 0.421 Ever experienced any sexual violence 0.103 0.015 701 1,083 1.275 0.142 0.074 0.132 Experienced physical or sexual violence by husband 0.280 0.018 701 1,083 1.082 0.066 0.243 0.316 Experienced physical or sexual violence by husband in
the last 12 months 0.146 0.018 701 1,083 1.313 0.120 0.111 0.181 Prevalence of anemia (women 15-49 years) 0.384 0.019 1,040 1,494 1.241 0.049 0.346 0.421 Body mass index (BMI) < 18.5 0.048 0.006 991 1,433 0.954 0.135 0.035 0.061 Total fertility rate (last 3 years) 3.566 0.136 4,949 7,167 1.068 0.038 3.293 3.839 Neonatal mortality rate (last 0-9 years) 12.920 3.182 2,051 2,945 1.083 0.246 6.556 19.283 Post-neonatal mortality rate (last 0-9 years) 3.193 1.231 2,060 2,952 0.984 0.386 0.731 5.656 Infant mortality rate (last 0-9 years) 16.113 3.330 2,051 2,945 1.050 0.207 9.454 22.772 Child mortality rate (last 0-9 years) 3.516 1.651 2,050 2,942 1.167 0.470 0.213 6.819 Under-5 mortality rate (last 0-9 years) 19.573 3.559 2,054 2,948 1.034 0.182 12.454 26.691
na = Not applicable

Appendix B • 251
Table B.11 Sampling errors: Madaba sample, Jordan 2012
Variable R SE N WN DEFT SE/R R-2SE R+2SE
Urban residence 0.688 0.037 861 303 2.306 0.053 0.615 0.761 No education 0.020 0.006 861 303 1.264 0.301 0.008 0.032 Secondary education 0.434 0.019 861 303 1.139 0.044 0.396 0.473 Higher education 0.365 0.023 861 303 1.383 0.062 0.320 0.411 Currently married (in union) 0.541 0.055 1,616 535 0.886 0.101 0.432 0.651 Married before age 20 0.252 0.014 925 329 1.024 0.056 0.223 0.280 Currently pregnant 0.058 0.008 1,616 535 0.974 0.145 0.041 0.074 Children ever born 2.033 0.210 1,616 535 0.870 0.103 1.613 2.453 Children surviving 1.950 0.203 1,616 535 0.878 0.104 1.544 2.356 Children ever born to women age 40-49 4.906 0.156 285 98 1.078 0.032 4.595 5.217 Knows any contraceptive method 1.000 0.000 818 289 na 0.000 1.000 1.000 Knows any modern contraceptive method 1.000 0.000 818 289 na 0.000 1.000 1.000 Currently using any method 0.621 0.018 818 289 1.080 0.030 0.584 0.658 Currently using a modern method 0.422 0.021 818 289 1.197 0.049 0.381 0.463 Currently using a traditional method 0.199 0.016 818 289 1.110 0.078 0.168 0.230 Currently using pill 0.097 0.011 818 289 1.085 0.116 0.075 0.120 Currently using IUD 0.204 0.015 818 289 1.072 0.074 0.174 0.234 Currently using condoms 0.064 0.009 818 289 1.029 0.137 0.047 0.082 Currently using injectables 0.013 0.004 818 289 0.912 0.274 0.006 0.021 Currently using female sterilization 0.026 0.006 818 289 1.045 0.224 0.014 0.038 Currently using rhythm 0.034 0.006 818 289 0.989 0.185 0.021 0.046 Currently using withdrawal 0.158 0.014 818 289 1.094 0.088 0.130 0.186 Used public sector source 0.502 0.025 335 118 0.919 0.050 0.451 0.552 Want no more children 0.489 0.021 818 289 1.183 0.042 0.447 0.530 Want to delay birth at least 2 years 0.277 0.017 818 289 1.090 0.062 0.243 0.311 Ideal number of children 4.121 0.072 827 289 1.012 0.017 3.978 4.265 Mothers received antenatal care for last birth 0.992 0.004 514 184 0.947 0.004 0.984 0.999 Mothers protected against tetanus for last birth 0.437 0.022 514 184 1.024 0.051 0.393 0.482 Births with skilled attendant at delivery 0.995 0.004 780 276 1.488 0.004 0.988 1.003 Had diarrhea in the last 2 weeks 0.164 0.015 753 268 1.062 0.092 0.134 0.195 Treated with ORS 0.133 0.028 124 44 0.868 0.208 0.078 0.188 Sought medical treatment for diarrhea 0.498 0.061 124 44 1.256 0.123 0.376 0.620 Vaccination card seen 0.872 0.031 157 57 1.179 0.036 0.810 0.934 Received BCG vaccination 0.994 0.006 157 57 0.947 0.006 0.983 1.006 Received DPT (3 doses) vaccination 0.966 0.018 157 57 1.231 0.018 0.931 1.001 Received polio (3 doses) vaccination 0.966 0.018 157 57 1.231 0.018 0.931 1.001 Received measles vaccination 0.932 0.021 157 57 1.073 0.023 0.889 0.974 Received all vaccinations 0.916 0.025 157 57 1.121 0.027 0.867 0.965 Height-for-age (below -2SD) 0.045 0.011 451 160 1.026 0.250 0.022 0.067 Weight-for-height (below -2SD) 0.020 0.006 451 160 0.975 0.320 0.007 0.032 Weight-for-age (below -2SD) 0.016 0.006 451 160 1.028 0.379 0.004 0.027 Prevalence of anemia (children 6-59 months) 0.246 0.025 391 138 1.140 0.101 0.197 0.296 Experienced physical violence since age 15 by anyone 0.327 0.025 538 190 1.252 0.077 0.277 0.378 Ever experienced any sexual violence 0.076 0.011 538 190 0.997 0.150 0.053 0.099 Experienced physical or sexual violence by husband 0.183 0.018 538 190 1.051 0.096 0.148 0.218 Experienced physical or sexual violence by husband in
the last 12 months 0.137 0.014 538 190 0.955 0.103 0.109 0.166 Prevalence of anemia (women 15-49 years) 0.237 0.019 869 301 1.349 0.082 0.198 0.276 Body mass index (BMI) < 18.5 0.061 0.012 833 288 1.384 0.188 0.038 0.085 Total fertility rate (last 3 years) 3.481 0.158 4,549 1,527 0.953 0.045 3.165 3.796 Neonatal mortality rate (last 0-9 years) 17.888 4.192 1,499 531 0.985 0.234 9.503 26.272 Post-neonatal mortality rate (last 0-9 years) 7.286 2.010 1,492 527 0.928 0.276 3.267 11.306 Infant mortality rate (last 0-9 years) 25.174 4.977 1,499 531 1.029 0.198 15.220 35.128 Child mortality rate (last 0-9 years) 4.815 1.798 1,487 526 0.971 0.373 1.219 8.410 Under-5 mortality rate (last 0-9 years) 29.868 5.857 1,500 531 1.120 0.196 18.154 41.581
na = Not applicable

252 • Appendix B
Table B.12 Sampling errors: Irbid sample, Jordan 2012
Variable R SE N WN DEFT SE/R R-2SE R+2SE
Urban residence 0.838 0.010 1,137 1,986 0.918 0.012 0.818 0.858 No education 0.011 0.004 1,137 1,986 1.307 0.376 0.003 0.018 Secondary education 0.461 0.018 1,137 1,986 1.213 0.039 0.425 0.497 Higher education 0.334 0.022 1,137 1,986 1.600 0.067 0.289 0.378 Currently married (in union) 0.532 0.037 2,024 3,559 0.995 0.070 0.457 0.606 Married before age 20 0.282 0.015 1,180 2,059 1.203 0.054 0.251 0.312 Currently pregnant 0.063 0.007 2,024 3,559 1.041 0.108 0.049 0.077 Children ever born 1.929 0.147 2,024 3,559 0.997 0.076 1.635 2.222 Children surviving 1.873 0.142 2,024 3,559 0.995 0.076 1.589 2.157 Children ever born to women age 40-49 4.584 0.124 384 681 0.969 0.027 4.336 4.833 Knows any contraceptive method 1.000 0.000 1,080 1,892 na 0.000 1.000 1.000 Knows any modern contraceptive method 1.000 0.000 1,080 1,892 na 0.000 1.000 1.000 Currently using any method 0.617 0.014 1,080 1,892 0.951 0.023 0.589 0.645 Currently using a modern method 0.439 0.015 1,080 1,892 0.963 0.033 0.410 0.468 Currently using a traditional method 0.178 0.012 1,080 1,892 1.014 0.066 0.154 0.201 Currently using pill 0.094 0.010 1,080 1,892 1.083 0.102 0.075 0.113 Currently using IUD 0.220 0.014 1,080 1,892 1.133 0.065 0.192 0.249 Currently using condoms 0.073 0.010 1,080 1,892 1.230 0.134 0.053 0.092 Currently using injectables 0.006 0.002 1,080 1,892 0.984 0.379 0.002 0.011 Currently using female sterilization 0.031 0.005 1,080 1,892 1.007 0.171 0.021 0.042 Currently using rhythm 0.025 0.005 1,080 1,892 1.137 0.214 0.015 0.036 Currently using withdrawal 0.141 0.011 1,080 1,892 1.031 0.077 0.119 0.163 Used public sector source 0.519 0.030 461 803 1.302 0.059 0.458 0.580 Want no more children 0.476 0.014 1,080 1,892 0.946 0.030 0.447 0.505 Want to delay birth at least 2 years 0.260 0.014 1,080 1,892 1.051 0.054 0.232 0.288 Ideal number of children 3.939 0.062 1,127 1,971 1.145 0.016 3.814 4.063 Mothers received antenatal care for last birth 0.991 0.004 672 1,174 1.097 0.004 0.983 0.999 Mothers protected against tetanus for last birth 0.392 0.030 672 1,174 1.589 0.076 0.333 0.452 Births with skilled attendant at delivery 0.998 0.001 990 1,729 0.921 0.001 0.996 1.001 Had diarrhea in the last 2 weeks 0.181 0.015 968 1,696 1.144 0.085 0.151 0.212 Treated with ORS 0.180 0.034 180 308 1.026 0.189 0.112 0.247 Sought medical treatment for diarrhea 0.507 0.048 180 308 1.135 0.094 0.412 0.602 Vaccination card seen 0.867 0.031 195 332 1.252 0.036 0.806 0.929 Received BCG vaccination 1.000 0.000 195 332 na 0.000 1.000 1.000 Received DPT (3 doses) vaccination 0.992 0.008 195 332 1.219 0.008 0.977 1.008 Received polio (3 doses) vaccination 0.992 0.008 195 332 1.219 0.008 0.977 1.008 Received measles vaccination 0.956 0.015 195 332 0.992 0.015 0.927 0.986 Received all vaccinations 0.956 0.015 195 332 0.992 0.015 0.927 0.986 Height-for-age (below -2SD) 0.051 0.010 625 1,080 1.143 0.195 0.031 0.072 Weight-for-height (below -2SD) 0.022 0.005 625 1,080 0.928 0.246 0.011 0.033 Weight-for-age (below -2SD) 0.023 0.007 625 1,080 1.156 0.297 0.010 0.037 Prevalence of anemia (children 6-59 months) 0.342 0.030 557 960 1.417 0.088 0.282 0.402 Experienced physical violence since age 15 by anyone 0.345 0.021 684 1,245 1.180 0.062 0.302 0.388 Ever experienced any sexual violence 0.114 0.016 684 1,245 1.314 0.140 0.082 0.146 Experienced physical or sexual violence by husband 0.258 0.021 684 1,245 1.269 0.082 0.216 0.301 Experienced physical or sexual violence by husband in
the last 12 months 0.147 0.015 684 1,245 1.141 0.105 0.116 0.178 Prevalence of anemia (women 15-49 years) 0.362 0.021 1,155 2,019 1.477 0.058 0.320 0.404 Body mass index (BMI) < 18.5 0.051 0.007 1,103 1,928 0.995 0.129 0.038 0.064 Total fertility rate (last 3 years) 3.576 0.140 5,701 9,976 0.954 0.039 3.296 3.857 Neonatal mortality rate (last 0-9 years) 14.036 3.793 1,889 3,260 0.984 0.270 6.450 21.622 Post-neonatal mortality rate (last 0-9 years) 2.617 1.115 1,892 3,269 0.899 0.426 0.387 4.847 Infant mortality rate (last 0-9 years) 16.653 4.019 1,889 3,260 0.998 0.241 8.615 24.692 Child mortality rate (last 0-9 years) 1.796 0.972 1,872 3,217 1.019 0.541 0.000 3.739 Under-5 mortality rate (last 0-9 years) 18.420 4.027 1,890 3,261 0.980 0.219 10.365 26.475
na = Not applicable

Appendix B • 253
Table B.13 Sampling errors: Mafraq sample, Jordan 2012
Variable R SE N WN DEFT SE/R R-2SE R+2SE
Urban residence 0.429 0.022 1,000 562 1.373 0.050 0.386 0.472 No education 0.072 0.015 1,000 562 1.825 0.207 0.042 0.102 Secondary education 0.370 0.019 1,000 562 1.236 0.051 0.332 0.407 Higher education 0.266 0.020 1,000 562 1.411 0.074 0.226 0.305 Currently married (in union) 0.551 0.032 1,718 959 1.143 0.058 0.487 0.615 Married before age 20 0.317 0.017 1,025 578 1.239 0.055 0.283 0.352 Currently pregnant 0.060 0.006 1,718 959 0.991 0.104 0.047 0.072 Children ever born 2.180 0.142 1,718 959 1.100 0.065 1.895 2.465 Children surviving 2.098 0.137 1,718 959 1.099 0.065 1.825 2.372 Children ever born to women age 40-49 5.057 0.162 284 158 1.054 0.032 4.732 5.382 Knows any contraceptive method 1.000 0.000 935 528 na 0.000 1.000 1.000 Knows any modern contraceptive method 1.000 0.000 935 528 na 0.000 1.000 1.000 Currently using any method 0.595 0.014 935 528 0.880 0.024 0.567 0.623 Currently using a modern method 0.367 0.015 935 528 0.933 0.040 0.338 0.397 Currently using a traditional method 0.228 0.012 935 528 0.898 0.054 0.203 0.253 Currently using pill 0.102 0.011 935 528 1.070 0.104 0.081 0.123 Currently using IUD 0.158 0.012 935 528 1.036 0.078 0.133 0.183 Currently using condoms 0.045 0.007 935 528 1.065 0.160 0.031 0.060 Currently using injectables 0.027 0.006 935 528 1.139 0.226 0.015 0.038 Currently using female sterilization 0.019 0.004 935 528 0.967 0.230 0.010 0.027 Currently using rhythm 0.020 0.005 935 528 0.996 0.226 0.011 0.030 Currently using withdrawal 0.188 0.011 935 528 0.889 0.061 0.165 0.210 Used public sector source 0.455 0.032 323 185 1.144 0.070 0.391 0.518 Want no more children 0.460 0.014 935 528 0.837 0.030 0.432 0.487 Want to delay birth at least 2 years 0.300 0.014 935 528 0.922 0.046 0.272 0.328 Ideal number of children 4.167 0.059 983 553 1.058 0.014 4.050 4.284 Mothers received antenatal care for last birth 0.993 0.004 647 366 1.220 0.004 0.986 1.001 Mothers protected against tetanus for last birth 0.161 0.016 647 366 1.122 0.101 0.129 0.194 Births with skilled attendant at delivery 0.993 0.003 1,016 574 0.908 0.003 0.988 0.998 Had diarrhea in the last 2 weeks 0.128 0.014 989 559 1.261 0.111 0.099 0.156 Treated with ORS 0.219 0.037 128 71 0.982 0.169 0.145 0.292 Sought medical treatment for diarrhea 0.592 0.042 128 71 0.908 0.071 0.508 0.676 Vaccination card seen 0.802 0.030 205 116 1.056 0.037 0.742 0.862 Received BCG vaccination 0.969 0.023 205 116 1.905 0.024 0.923 1.015 Received DPT (3 doses) vaccination 0.943 0.021 205 116 1.324 0.023 0.901 0.986 Received polio (3 doses) vaccination 0.948 0.021 205 116 1.354 0.022 0.906 0.990 Received measles vaccination 0.932 0.017 205 116 0.955 0.018 0.899 0.966 Received all vaccinations 0.900 0.028 205 116 1.341 0.031 0.844 0.956 Height-for-age (below -2SD) 0.104 0.014 645 369 1.015 0.129 0.077 0.131 Weight-for-height (below -2SD) 0.009 0.003 645 369 0.858 0.348 0.003 0.016 Weight-for-age (below -2SD) 0.023 0.006 645 369 1.051 0.271 0.010 0.035 Prevalence of anemia (children 6-59 months) 0.263 0.020 566 325 1.076 0.076 0.223 0.303 Experienced physical violence since age 15 by anyone 0.279 0.018 608 364 0.998 0.065 0.242 0.315 Ever experienced any sexual violence 0.079 0.011 608 364 1.009 0.139 0.057 0.102 Experienced physical or sexual violence by husband 0.209 0.020 608 364 1.230 0.097 0.168 0.249 Experienced physical or sexual violence by husband in
the last 12 months 0.091 0.013 608 364 1.120 0.144 0.065 0.117 Prevalence of anemia (women 15-49 years) 0.304 0.016 979 557 1.081 0.052 0.273 0.336 Body mass index (BMI) < 18.5 0.042 0.007 948 538 1.015 0.158 0.028 0.055 Total fertility rate (last 3 years) 4.106 0.149 4,763 2,661 1.160 0.036 3.808 4.404 Neonatal mortality rate (last 0-9 years) 15.825 3.260 1,905 1,074 1.043 0.206 9.304 22.346 Post-neonatal mortality rate (last 0-9 years) 4.839 1.618 1,905 1,073 0.967 0.334 1.603 8.075 Infant mortality rate (last 0-9 years) 20.664 3.881 1,906 1,075 1.033 0.188 12.902 28.426 Child mortality rate (last 0-9 years) 2.093 1.055 1,870 1,052 0.966 0.504 0.000 4.204 Under-5 mortality rate (last 0-9 years) 22.714 3.916 1,907 1,075 1.031 0.172 14.881 30.547
na = Not applicable

254 • Appendix B
Table B.14 Sampling errors: Jarash sample, Jordan 2012
Variable R SE N WN DEFT SE/R R-2SE R+2SE
Urban residence 0.609 0.017 945 320 1.098 0.029 0.574 0.644 No education 0.018 0.004 945 320 0.929 0.223 0.010 0.026 Secondary education 0.426 0.016 945 320 0.985 0.037 0.394 0.457 Higher education 0.319 0.019 945 320 1.228 0.058 0.282 0.356 Currently married (in union) 0.539 0.040 1,631 568 1.231 0.074 0.460 0.619 Married before age 20 0.366 0.019 984 333 1.281 0.051 0.329 0.403 Currently pregnant 0.055 0.006 1,631 568 0.975 0.108 0.043 0.067 Children ever born 2.238 0.173 1,631 568 1.144 0.077 1.893 2.584 Children surviving 2.172 0.170 1,631 568 1.162 0.078 1.832 2.511 Children ever born to women age 40-49 5.425 0.170 288 98 1.157 0.031 5.085 5.766 Knows any contraceptive method 1.000 0.000 902 306 na 0.000 1.000 1.000 Knows any modern contraceptive method 1.000 0.000 902 306 na 0.000 1.000 1.000 Currently using any method 0.618 0.020 902 306 1.237 0.032 0.578 0.658 Currently using a modern method 0.427 0.018 902 306 1.121 0.043 0.390 0.463 Currently using a traditional method 0.192 0.016 902 306 1.215 0.083 0.160 0.223 Currently using pill 0.099 0.010 902 306 1.000 0.100 0.079 0.119 Currently using IUD 0.205 0.014 902 306 1.010 0.066 0.178 0.232 Currently using condoms 0.067 0.009 902 306 1.118 0.139 0.049 0.086 Currently using injectables 0.011 0.003 902 306 0.963 0.302 0.004 0.018 Currently using female sterilization 0.032 0.006 902 306 1.085 0.198 0.020 0.045 Currently using rhythm 0.030 0.007 902 306 1.297 0.246 0.015 0.045 Currently using withdrawal 0.142 0.015 902 306 1.275 0.104 0.113 0.172 Used public sector source 0.456 0.027 380 128 1.050 0.059 0.403 0.510 Want no more children 0.479 0.017 902 306 1.014 0.035 0.446 0.513 Want to delay birth at least 2 years 0.295 0.015 902 306 0.981 0.051 0.265 0.324 Ideal number of children 4.065 0.081 913 308 1.429 0.020 3.903 4.227 Mothers received antenatal care for last birth 0.992 0.004 612 207 0.979 0.004 0.985 0.999 Mothers protected against tetanus for last birth 0.332 0.020 612 207 1.074 0.062 0.291 0.373 Births with skilled attendant at delivery 0.999 0.001 977 333 1.211 0.001 0.996 1.001 Had diarrhea in the last 2 weeks 0.188 0.012 960 327 0.903 0.064 0.164 0.212 Treated with ORS 0.243 0.039 181 62 1.075 0.159 0.166 0.320 Sought medical treatment for diarrhea 0.572 0.036 181 62 0.939 0.064 0.499 0.645 Vaccination card seen 0.699 0.041 204 69 1.202 0.058 0.618 0.781 Received BCG vaccination 0.985 0.009 204 69 1.021 0.009 0.967 1.002 Received DPT (3 doses) vaccination 0.994 0.006 204 69 1.095 0.006 0.982 1.006 Received polio (3 doses) vaccination 0.994 0.006 204 69 1.095 0.006 0.982 1.006 Received measles vaccination 0.966 0.013 204 69 1.033 0.014 0.940 0.992 Received all vaccinations 0.963 0.014 204 69 1.025 0.014 0.935 0.990 Height-for-age (below -2SD) 0.092 0.014 631 217 1.091 0.154 0.063 0.120 Weight-for-height (below -2SD) 0.030 0.008 631 217 1.106 0.278 0.013 0.046 Weight-for-age (below -2SD) 0.038 0.009 631 217 0.964 0.223 0.021 0.055 Prevalence of anemia (children 6-59 months) 0.313 0.018 543 187 0.969 0.059 0.276 0.350 Experienced physical violence since age 15 by anyone 0.365 0.024 599 216 1.194 0.064 0.318 0.412 Ever experienced any sexual violence 0.110 0.016 599 216 1.281 0.149 0.077 0.143 Experienced physical or sexual violence by husband 0.288 0.024 599 216 1.274 0.082 0.240 0.335 Experienced physical or sexual violence by husband in
the last 12 months 0.174 0.022 599 216 1.413 0.126 0.130 0.218 Prevalence of anemia (women 15-49 years) 0.351 0.019 983 333 1.218 0.053 0.314 0.388 Body mass index (BMI) < 18.5 0.036 0.007 921 312 1.136 0.194 0.022 0.050 Total fertility rate (last 3 years) 4.257 0.150 4,554 1,575 1.258 0.035 3.957 4.556 Neonatal mortality rate (last 0-9 years) 12.855 3.476 1,792 615 1.058 0.270 5.903 19.807 Post-neonatal mortality rate (last 0-9 years) 4.794 1.989 1,781 611 1.255 0.415 0.816 8.772 Infant mortality rate (last 0-9 years) 17.649 4.105 1,792 615 1.093 0.233 9.438 25.859 Child mortality rate (last 0-9 years) 1.984 1.024 1,742 598 0.986 0.516 0.000 4.031 Under-5 mortality rate (last 0-9 years) 19.598 4.229 1,793 615 1.069 0.216 11.140 28.056
na = Not applicable

Appendix B • 255
Table B.15 Sampling errors: Ajloun sample, Jordan 2012
Variable R SE N WN DEFT SE/R R-2SE R+2SE
Urban residence 0.785 0.017 898 251 1.218 0.021 0.752 0.819 No education 0.016 0.004 898 251 0.900 0.233 0.009 0.024 Secondary education 0.446 0.017 898 251 1.051 0.039 0.411 0.481 Higher education 0.400 0.020 898 251 1.240 0.051 0.359 0.440 Currently married (in union) 0.557 0.035 1,534 429 0.971 0.062 0.488 0.626 Married before age 20 0.301 0.017 953 266 1.202 0.057 0.266 0.335 Currently pregnant 0.071 0.007 1,534 429 0.947 0.098 0.057 0.085 Children ever born 2.278 0.151 1,534 429 0.923 0.066 1.976 2.580 Children surviving 2.220 0.147 1,534 429 0.926 0.066 1.925 2.515 Children ever born to women age 40-49 5.516 0.146 299 81 0.969 0.026 5.225 5.808 Knows any contraceptive method 1.000 0.000 854 239 na 0.000 1.000 1.000 Knows any modern contraceptive method 1.000 0.000 854 239 na 0.000 1.000 1.000 Currently using any method 0.616 0.014 854 239 0.829 0.022 0.588 0.644 Currently using a modern method 0.410 0.016 854 239 0.934 0.038 0.378 0.441 Currently using a traditional method 0.206 0.017 854 239 1.239 0.083 0.172 0.240 Currently using pill 0.041 0.007 854 239 0.971 0.160 0.028 0.054 Currently using IUD 0.264 0.017 854 239 1.096 0.063 0.231 0.298 Currently using condoms 0.066 0.009 854 239 1.044 0.135 0.048 0.083 Currently using injectables 0.006 0.003 854 239 1.214 0.533 0.000 0.013 Currently using female sterilization 0.020 0.005 854 239 0.953 0.227 0.011 0.029 Currently using rhythm 0.034 0.008 854 239 1.271 0.232 0.018 0.050 Currently using withdrawal 0.149 0.014 854 239 1.141 0.093 0.121 0.177 Used public sector source 0.393 0.026 342 96 0.995 0.067 0.340 0.446 Want no more children 0.485 0.017 854 239 1.020 0.036 0.450 0.520 Want to delay birth at least 2 years 0.255 0.014 854 239 0.929 0.054 0.228 0.283 Ideal number of children 4.324 0.061 893 250 1.049 0.014 4.201 4.447 Mothers received antenatal care for last birth 0.996 0.003 553 156 1.045 0.003 0.990 1.002 Mothers protected against tetanus for last birth 0.514 0.019 553 156 0.887 0.037 0.476 0.551 Births with skilled attendant at delivery 1.000 0.000 815 232 na 0.000 1.000 1.000 Had diarrhea in the last 2 weeks 0.165 0.015 804 229 1.092 0.091 0.135 0.195 Treated with ORS 0.137 0.029 135 38 0.944 0.213 0.079 0.196 Sought medical treatment for diarrhea 0.549 0.051 135 38 1.118 0.093 0.447 0.652 Vaccination card seen 0.870 0.027 158 45 1.025 0.031 0.815 0.925 Received BCG vaccination 1.000 0.000 158 45 na 0.000 1.000 1.000 Received DPT (3 doses) vaccination 0.980 0.011 158 45 0.978 0.011 0.959 1.002 Received polio (3 doses) vaccination 0.980 0.011 158 45 0.978 0.011 0.959 1.002 Received measles vaccination 0.946 0.020 158 45 1.097 0.021 0.907 0.986 Received all vaccinations 0.946 0.020 158 45 1.097 0.021 0.907 0.986 Height-for-age (below -2SD) 0.046 0.012 514 146 1.263 0.267 0.022 0.071 Weight-for-height (below -2SD) 0.012 0.005 514 146 0.943 0.420 0.002 0.022 Weight-for-age (below -2SD) 0.019 0.006 514 146 0.979 0.308 0.007 0.030 Prevalence of anemia (children 6-59 months) 0.372 0.026 463 131 1.149 0.071 0.319 0.425 Experienced physical violence since age 15 by anyone 0.212 0.021 559 164 1.219 0.099 0.170 0.255 Ever experienced any sexual violence 0.101 0.016 559 164 1.235 0.156 0.069 0.132 Experienced physical or sexual violence by husband 0.176 0.021 559 164 1.274 0.117 0.135 0.218 Experienced physical or sexual violence by husband in
the last 12 months 0.087 0.013 559 164 1.060 0.145 0.062 0.113 Prevalence of anemia (women 15-49 years) 0.389 0.019 949 264 1.208 0.049 0.351 0.427 Body mass index (BMI) < 18.5 0.044 0.006 897 248 0.906 0.141 0.031 0.056 Total fertility rate (last 3 years) 3.817 0.144 4,447 1,246 1.126 0.038 3.530 4.104 Neonatal mortality rate (last 0-9 years) 9.173 2.056 1,637 460 0.872 0.224 5.060 13.285 Post-neonatal mortality rate (last 0-9 years) 4.567 1.546 1,646 462 0.940 0.338 1.476 7.659 Infant mortality rate (last 0-9 years) 13.740 2.473 1,637 460 0.874 0.180 8.794 18.687 Child mortality rate (last 0-9 years) 2.463 1.197 1,643 461 0.954 0.486 0.068 4.858 Under-5 mortality rate (last 0-9 years) 16.169 2.469 1,638 460 0.821 0.153 11.231 21.107
na = Not applicable

256 • Appendix B
Table B.16 Sampling errors: Karak sample, Jordan 2012
Variable R SE N WN DEFT SE/R R-2SE R+2SE
Urban residence 0.392 0.033 873 441 2.001 0.085 0.325 0.458 No education 0.041 0.010 873 441 1.517 0.248 0.021 0.061 Secondary education 0.381 0.019 873 441 1.178 0.051 0.343 0.420 Higher education 0.406 0.031 873 441 1.861 0.076 0.344 0.468 Currently married (in union) 0.539 0.047 1,592 779 1.036 0.088 0.445 0.634 Married before age 20 0.225 0.015 971 493 1.140 0.066 0.195 0.254 Currently pregnant 0.057 0.007 1,592 779 1.023 0.128 0.043 0.072 Children ever born 2.081 0.192 1,592 779 1.021 0.092 1.697 2.466 Children surviving 2.013 0.186 1,592 779 1.021 0.092 1.641 2.384 Children ever born to women age 40-49 4.594 0.168 343 171 1.315 0.036 4.259 4.929 Knows any contraceptive method 1.000 0.000 831 420 na 0.000 1.000 1.000 Knows any modern contraceptive method 1.000 0.000 831 420 na 0.000 1.000 1.000 Currently using any method 0.592 0.023 831 420 1.323 0.038 0.547 0.638 Currently using a modern method 0.400 0.019 831 420 1.124 0.048 0.361 0.438 Currently using a traditional method 0.193 0.016 831 420 1.190 0.085 0.160 0.225 Currently using pill 0.105 0.011 831 420 1.067 0.108 0.083 0.128 Currently using IUD 0.151 0.014 831 420 1.151 0.095 0.122 0.180 Currently using condoms 0.068 0.010 831 420 1.134 0.146 0.048 0.088 Currently using injectables 0.029 0.006 831 420 0.969 0.194 0.018 0.041 Currently using female sterilization 0.031 0.007 831 420 1.086 0.209 0.018 0.045 Currently using rhythm 0.034 0.008 831 420 1.294 0.240 0.018 0.050 Currently using withdrawal 0.156 0.014 831 420 1.139 0.092 0.128 0.185 Used public sector source 0.685 0.028 326 164 1.077 0.041 0.629 0.740 Want no more children 0.521 0.018 831 420 1.052 0.035 0.485 0.558 Want to delay birth at least 2 years 0.215 0.015 831 420 1.059 0.070 0.184 0.245 Ideal number of children 4.057 0.056 845 427 0.949 0.014 3.946 4.168 Mothers received antenatal care for last birth 0.993 0.006 521 269 1.594 0.006 0.981 1.005 Mothers protected against tetanus for last birth 0.317 0.042 521 269 2.060 0.132 0.233 0.400 Births with skilled attendant at delivery 0.995 0.004 791 410 1.196 0.004 0.987 1.003 Had diarrhea in the last 2 weeks 0.109 0.017 765 398 1.470 0.155 0.076 0.143 Treated with ORS 0.279 0.043 91 44 0.870 0.154 0.193 0.365 Sought medical treatment for diarrhea 0.704 0.059 91 44 1.097 0.083 0.586 0.822 Vaccination card seen 0.808 0.030 157 80 0.973 0.038 0.748 0.869 Received BCG vaccination 0.974 0.012 157 80 0.932 0.012 0.950 0.997 Received DPT (3 doses) vaccination 0.978 0.012 157 80 1.056 0.013 0.953 1.003 Received polio (3 doses) vaccination 0.978 0.012 157 80 1.056 0.013 0.953 1.003 Received measles vaccination 0.932 0.019 157 80 0.948 0.020 0.894 0.970 Received all vaccinations 0.904 0.027 157 80 1.147 0.030 0.851 0.958 Height-for-age (below -2SD) 0.111 0.017 492 257 1.164 0.150 0.078 0.144 Weight-for-height (below -2SD) 0.015 0.006 492 257 1.068 0.377 0.004 0.027 Weight-for-age (below -2SD) 0.027 0.007 492 257 0.954 0.265 0.013 0.042 Prevalence of anemia (children 6-59 months) 0.347 0.030 433 224 1.222 0.087 0.287 0.408 Experienced physical violence since age 15 by anyone 0.233 0.031 545 288 1.695 0.132 0.171 0.294 Ever experienced any sexual violence 0.051 0.010 545 288 1.056 0.195 0.031 0.071 Experienced physical or sexual violence by husband 0.136 0.028 545 288 1.915 0.207 0.080 0.193 Experienced physical or sexual violence by husband in
the last 12 months 0.094 0.016 545 288 1.315 0.175 0.061 0.127 Prevalence of anemia (women 15-49 years) 0.356 0.021 922 459 1.352 0.060 0.313 0.399 Body mass index (BMI) < 18.5 0.039 0.008 885 440 1.263 0.210 0.023 0.056 Total fertility rate (last 3 years) 3.501 0.149 4,551 2,218 1.088 0.043 3.204 3.799 Neonatal mortality rate (last 0-9 years) 13.499 3.063 1,549 808 0.891 0.227 7.373 19.624 Post-neonatal mortality rate (last 0-9 years) 5.928 2.176 1,549 805 1.020 0.367 1.576 10.279 Infant mortality rate (last 0-9 years) 19.426 4.235 1,549 808 1.008 0.218 10.957 27.895 Child mortality rate (last 0-9 years) 4.361 2.157 1,530 793 1.096 0.494 0.048 8.675 Under-5 mortality rate (last 0-9 years) 23.703 5.092 1,549 808 1.075 0.215 13.519 33.886
na = Not applicable

Appendix B • 257
Table B.17 Sampling errors: Tafiela sample, Jordan 2012
Variable R SE N WN DEFT SE/R R-2SE R+2SE
Urban residence 0.711 0.036 819 167 2.285 0.051 0.639 0.784 No education 0.049 0.006 819 167 0.813 0.126 0.037 0.061 Secondary education 0.353 0.028 819 167 1.667 0.079 0.297 0.408 Higher education 0.378 0.026 819 167 1.538 0.069 0.325 0.430 Currently married (in union) 0.563 0.046 1,483 285 0.883 0.082 0.471 0.656 Married before age 20 0.308 0.018 844 172 1.139 0.058 0.273 0.344 Currently pregnant 0.077 0.011 1,483 285 1.175 0.148 0.054 0.100 Children ever born 2.246 0.195 1,483 285 0.872 0.087 1.856 2.635 Children surviving 2.158 0.192 1,483 285 0.897 0.089 1.774 2.543 Children ever born to women age 40-49 5.469 0.130 249 54 0.792 0.024 5.209 5.729 Knows any contraceptive method 1.000 0.000 788 161 na 0.000 1.000 1.000 Knows any modern contraceptive method 1.000 0.000 788 161 na 0.000 1.000 1.000 Currently using any method 0.641 0.030 788 161 1.769 0.047 0.581 0.702 Currently using a modern method 0.415 0.027 788 161 1.508 0.064 0.362 0.468 Currently using a traditional method 0.226 0.017 788 161 1.122 0.074 0.193 0.260 Currently using pill 0.113 0.013 788 161 1.134 0.113 0.088 0.139 Currently using IUD 0.137 0.022 788 161 1.795 0.161 0.093 0.181 Currently using condoms 0.072 0.010 788 161 1.065 0.136 0.052 0.092 Currently using injectables 0.009 0.004 788 161 1.239 0.461 0.001 0.017 Currently using female sterilization 0.056 0.008 788 161 0.996 0.146 0.040 0.072 Currently using rhythm 0.021 0.005 788 161 1.044 0.254 0.010 0.032 Currently using withdrawal 0.200 0.018 788 161 1.274 0.091 0.163 0.236 Used public sector source 0.749 0.043 316 64 1.764 0.058 0.662 0.835 Want no more children 0.549 0.019 788 161 1.083 0.035 0.511 0.587 Want to delay birth at least 2 years 0.275 0.012 788 161 0.779 0.045 0.250 0.299 Ideal number of children 3.992 0.085 772 156 1.182 0.021 3.823 4.162 Mothers received antenatal care for last birth 0.993 0.004 521 103 0.963 0.004 0.985 1.000 Mothers protected against tetanus for last birth 0.291 0.025 521 103 1.217 0.085 0.242 0.341 Births with skilled attendant at delivery 0.993 0.004 811 157 1.248 0.004 0.986 1.001 Had diarrhea in the last 2 weeks 0.151 0.016 798 155 1.167 0.108 0.119 0.184 Treated with ORS 0.102 0.025 120 23 0.880 0.248 0.051 0.152 Sought medical treatment for diarrhea 0.636 0.057 120 23 1.185 0.089 0.522 0.749 Vaccination card seen 0.711 0.050 146 29 1.286 0.071 0.611 0.812 Received BCG vaccination 0.907 0.047 146 29 1.906 0.052 0.813 1.001 Received DPT (3 doses) vaccination 0.938 0.036 146 29 1.781 0.039 0.866 1.011 Received polio (3 doses) vaccination 0.938 0.036 146 29 1.781 0.039 0.866 1.011 Received measles vaccination 0.922 0.034 146 29 1.516 0.037 0.853 0.991 Received all vaccinations 0.880 0.046 146 29 1.664 0.052 0.789 0.972 Height-for-age (below -2SD) 0.099 0.012 503 98 0.820 0.121 0.075 0.123 Weight-for-height (below -2SD) 0.027 0.006 503 98 0.819 0.220 0.015 0.039 Weight-for-age (below -2SD) 0.031 0.007 503 98 0.842 0.213 0.018 0.044 Prevalence of anemia (children 6-59 months) 0.219 0.023 437 87 1.158 0.105 0.173 0.265 Experienced physical violence since age 15 by anyone 0.326 0.024 527 109 1.157 0.073 0.279 0.373 Ever experienced any sexual violence 0.074 0.017 527 109 1.474 0.228 0.040 0.107 Experienced physical or sexual violence by husband 0.220 0.019 527 109 1.033 0.085 0.182 0.257 Experienced physical or sexual violence by husband in
the last 12 months 0.146 0.018 527 109 1.150 0.121 0.111 0.182 Prevalence of anemia (women 15-49 years) 0.329 0.027 822 166 1.674 0.083 0.274 0.384 Body mass index (BMI) < 18.5 0.039 0.007 767 155 0.974 0.174 0.026 0.053 Total fertility rate (last 3 years) 3.918 0.191 4,232 823 1.029 0.049 3.535 4.301 Neonatal mortality rate (last 0-9 years) 15.975 4.137 1,526 303 1.087 0.259 7.701 24.249 Post-neonatal mortality rate (last 0-9 years) 10.085 3.815 1,525 303 1.346 0.378 2.455 17.714 Infant mortality rate (last 0-9 years) 26.059 6.124 1,526 303 1.374 0.235 13.811 38.308 Child mortality rate (last 0-9 years) 5.097 1.805 1,498 300 0.933 0.354 1.486 8.707 Under-5 mortality rate (last 0-9 years) 31.023 6.305 1,528 304 1.335 0.203 18.413 43.633
na = Not applicable

258 • Appendix B
Table B.18 Sampling errors: Ma'an sample, Jordan 2012
Variable R SE N WN DEFT SE/R R-2SE R+2SE
Urban residence 0.634 0.049 781 178 2.806 0.077 0.537 0.732 No education 0.133 0.046 781 178 3.751 0.345 0.041 0.226 Secondary education 0.292 0.036 781 178 2.230 0.125 0.219 0.365 Higher education 0.265 0.038 781 178 2.405 0.144 0.189 0.342 Currently married (in union) 0.499 0.057 1514 326 1.180 0.114 0.385 0.613 Married before age 20 0.357 0.034 861 193 2.157 0.096 0.288 0.426 Currently pregnant 0.050 0.008 1,514 326 1.139 0.164 0.034 0.066 Children ever born 2.394 0.321 1,514 326 1.299 0.134 1.752 3.037 Children surviving 2.298 0.307 1,514 326 1.295 0.134 1.684 2.911 Children ever born to women age 40-49 5.903 0.177 291 69 0.994 0.030 5.549 6.257 Knows any contraceptive method 1.000 0.000 726 163 na 0.000 1.000 1.000 Knows any modern contraceptive method 1.000 0.000 726 163 na 0.000 1.000 1.000 Currently using any method 0.584 0.028 726 163 1.507 0.047 0.529 0.640 Currently using a modern method 0.307 0.026 726 163 1.533 0.086 0.254 0.360 Currently using a traditional method 0.277 0.014 726 163 0.860 0.052 0.249 0.306 Currently using pill 0.060 0.010 726 163 1.130 0.166 0.040 0.080 Currently using IUD 0.105 0.013 726 163 1.182 0.128 0.078 0.132 Currently using condoms 0.072 0.009 726 163 0.977 0.130 0.053 0.091 Currently using injectables 0.008 0.004 726 163 1.327 0.556 0.000 0.016 Currently using female sterilization 0.046 0.013 726 163 1.658 0.280 0.020 0.072 Currently using rhythm 0.035 0.008 726 163 1.095 0.212 0.020 0.050 Currently using withdrawal 0.234 0.015 726 163 0.952 0.064 0.204 0.264 Used public sector source 0.584 0.043 227 48 1.297 0.073 0.499 0.670 Want no more children 0.547 0.018 726 163 0.967 0.033 0.512 0.583 Want to delay birth at least 2 years 0.221 0.016 726 163 1.008 0.070 0.190 0.252 Ideal number of children 4.348 0.145 736 169 1.892 0.033 4.058 4.639 Mothers received antenatal care for last birth 0.975 0.007 454 104 1.016 0.008 0.960 0.990 Mothers protected against tetanus for last birth 0.305 0.017 454 104 0.795 0.056 0.270 0.339 Births with skilled attendant at delivery 0.989 0.007 708 170 1.831 0.007 0.975 1.003 Had diarrhea in the last 2 weeks 0.129 0.018 687 166 1.254 0.136 0.094 0.164 Treated with ORS 0.234 0.031 84 21 0.682 0.132 0.172 0.297 Sought medical treatment for diarrhea 0.695 0.047 84 21 0.893 0.067 0.602 0.789 Vaccination card seen 0.762 0.028 143 36 0.819 0.037 0.705 0.819 Received BCG vaccination 0.888 0.060 143 36 2.361 0.067 0.768 1.007 Received DPT (3 doses) vaccination 0.835 0.089 143 36 2.980 0.107 0.656 1.013 Received polio (3 doses) vaccination 0.835 0.089 143 36 2.980 0.107 0.656 1.013 Received measles vaccination 0.800 0.072 143 36 2.232 0.090 0.656 0.943 Received all vaccinations 0.788 0.070 143 36 2.139 0.089 0.648 0.929 Height-for-age (below -2SD) 0.185 0.036 443 105 1.839 0.193 0.114 0.257 Weight-for-height (below -2SD) 0.032 0.011 443 105 1.343 0.329 0.011 0.054 Weight-for-age (below -2SD) 0.062 0.020 443 105 1.789 0.323 0.022 0.102 Prevalence of anemia (children 6-59 months) 0.381 0.041 379 88 1.580 0.107 0.300 0.463 Experienced physical violence since age 15 by anyone 0.252 0.040 485 114 2.036 0.160 0.171 0.332 Ever experienced any sexual violence 0.075 0.013 485 114 1.062 0.169 0.050 0.101 Experienced physical or sexual violence by husband 0.200 0.021 485 114 1.150 0.105 0.158 0.242 Experienced physical or sexual violence by husband in
the last 12 months 0.110 0.017 485 114 1.220 0.158 0.075 0.144 Prevalence of anemia (women 15-49 years) 0.303 0.020 830 189 1.244 0.066 0.263 0.342 Body mass index (BMI) < 18.5 0.052 0.008 799 184 0.984 0.148 0.037 0.068 Total fertility rate (last 3 years) 4.086 0.387 4,227 919 1.315 0.095 3.312 4.860 Neonatal mortality rate (last 0-9 years) 11.704 3.764 1,475 350 1.028 0.322 4.176 19.232 Post-neonatal mortality rate (last 0-9 years) 10.491 3.890 1,477 350 1.492 0.371 2.711 18.270 Infant mortality rate (last 0-9 years) 22.194 5.937 1,476 351 1.449 0.267 10.321 34.068 Child mortality rate (last 0-9 years) 6.686 2.663 1,460 344 1.297 0.398 1.360 12.012 Under-5 mortality rate (last 0-9 years) 28.732 7.266 1,477 351 1.705 0.253 14.199 43.264
na = Not applicable

Appendix B • 259
Table B.19 Sampling errors: Aqaba sample, Jordan 2012
Variable R SE N WN DEFT SE/R R-2SE R+2SE
Urban residence 0.904 0.019 848 265 1.875 0.021 0.866 0.942 No education 0.042 0.010 848 265 1.432 0.234 0.023 0.062 Secondary education 0.465 0.033 848 265 1.895 0.070 0.400 0.530 Higher education 0.321 0.043 848 265 2.691 0.135 0.234 0.407 Currently married (in union) 0.571 0.052 1,385 442 1.316 0.091 0.467 0.675 Married before age 20 0.337 0.022 842 260 1.360 0.064 0.293 0.380 Currently pregnant 0.054 0.008 1,385 442 1.208 0.141 0.039 0.069 Children ever born 2.180 0.259 1,385 442 1.552 0.119 1.662 2.697 Children surviving 2.113 0.248 1,385 442 1.540 0.118 1.617 2.610 Children ever born to women age 40-49 5.048 0.121 319 89 0.937 0.024 4.805 5.291 Knows any contraceptive method 1.000 0.000 796 253 na 0.000 1.000 1.000 Knows any modern contraceptive method 1.000 0.000 796 253 na 0.000 1.000 1.000 Currently using any method 0.637 0.018 796 253 1.065 0.029 0.601 0.673 Currently using a modern method 0.432 0.019 796 253 1.109 0.045 0.393 0.471 Currently using a traditional method 0.205 0.014 796 253 0.994 0.070 0.176 0.233 Currently using pill 0.087 0.009 796 253 0.861 0.099 0.070 0.104 Currently using IUD 0.270 0.027 796 253 1.740 0.102 0.215 0.325 Currently using condoms 0.047 0.017 796 253 2.211 0.354 0.014 0.080 Currently using injectables 0.006 0.002 796 253 0.898 0.406 0.001 0.011 Currently using female sterilization 0.011 0.004 796 253 1.117 0.375 0.003 0.019 Currently using rhythm 0.031 0.008 796 253 1.298 0.255 0.015 0.048 Currently using withdrawal 0.154 0.012 796 253 0.942 0.078 0.130 0.179 Used public sector source 0.440 0.037 315 107 1.306 0.083 0.367 0.513 Want no more children 0.528 0.016 796 253 0.880 0.029 0.497 0.559 Want to delay birth at least 2 years 0.246 0.024 796 253 1.568 0.098 0.198 0.294 Ideal number of children 4.031 0.070 813 253 1.117 0.017 3.891 4.170 Mothers received antenatal care for last birth 0.999 0.001 457 146 0.812 0.001 0.996 1.001 Mothers protected against tetanus for last birth 0.238 0.036 457 146 1.851 0.153 0.166 0.311 Births with skilled attendant at delivery 1.000 0.000 660 215 na 0.000 1.000 1.000 Had diarrhea in the last 2 weeks 0.084 0.021 646 211 1.754 0.252 0.042 0.126 Treated with ORS 0.252 0.048 71 18 0.773 0.192 0.156 0.349 Sought medical treatment for diarrhea 0.634 0.065 71 18 0.961 0.103 0.504 0.764 Vaccination card seen 0.674 0.077 124 44 1.944 0.115 0.519 0.829 Received BCG vaccination 0.971 0.017 124 44 1.182 0.017 0.937 1.004 Received DPT (3 doses) vaccination 0.958 0.025 124 44 1.457 0.026 0.909 1.007 Received polio (3 doses) vaccination 0.958 0.025 124 44 1.457 0.026 0.909 1.007 Received measles vaccination 0.953 0.020 124 44 1.100 0.020 0.914 0.992 Received all vaccinations 0.937 0.029 124 44 1.430 0.031 0.879 0.996 Height-for-age (below -2SD) 0.104 0.027 361 107 1.594 0.257 0.050 0.158 Weight-for-height (below -2SD) 0.010 0.005 361 107 0.971 0.501 0.000 0.020 Weight-for-age (below -2SD) 0.026 0.009 361 107 0.912 0.351 0.008 0.044 Prevalence of anemia (children 6-59 months) 0.286 0.057 341 104 2.205 0.200 0.171 0.400 Experienced physical violence since age 15 by anyone 0.281 0.035 538 171 1.779 0.123 0.212 0.351 Ever experienced any sexual violence 0.080 0.018 538 171 1.516 0.222 0.044 0.115 Experienced physical or sexual violence by husband 0.208 0.029 538 171 1.671 0.141 0.150 0.267 Experienced physical or sexual violence by husband in
the last 12 months 0.146 0.032 538 171 2.112 0.221 0.081 0.210 Prevalence of anemia (women 15-49 years) 0.365 0.024 768 235 1.361 0.065 0.318 0.413 Body mass index (BMI) < 18.5 0.051 0.011 754 230 1.315 0.208 0.030 0.072 Total fertility rate (last 3 years) 3.690 0.234 3,844 1,233 0.795 0.063 3.223 4.157 Neonatal mortality rate (last 0-9 years) 17.177 5.917 1,412 456 1.377 0.344 5.343 29.010 Post-neonatal mortality rate (last 0-9 years) 6.104 2.501 1,415 456 1.160 0.410 1.102 11.105 Infant mortality rate (last 0-9 years) 23.280 6.868 1,412 456 1.377 0.295 9.545 37.016 Child mortality rate (last 0-9 years) 1.928 1.076 1,435 463 0.938 0.558 0.000 4.080 Under-5 mortality rate (last 0-9 years) 25.164 7.037 1,413 456 1.378 0.280 11.090 39.237
na = Not applicable

260 • Appendix B
Table B.20 Sampling errors: Non Badia sample, Jordan 2012
Variable R SE N WN DEFT SE/R R-2SE R+2SE
Urban residence 0.869 0.004 10,087 10,647 1.331 0.005 0.860 0.878 No education 0.017 0.003 10,087 10,647 2.095 0.161 0.011 0.022 Secondary education 0.453 0.009 10,087 10,647 1.824 0.020 0.435 0.471 Higher education 0.313 0.011 10,087 10,647 2.374 0.035 0.291 0.335 Currently married (in union) 0.544 0.017 17,783 18,640 1.279 0.031 0.511 0.577 Married before age 20 0.308 0.007 10,672 11,165 1.674 0.023 0.294 0.322 Currently pregnant 0.054 0.003 17,783 18,640 1.452 0.055 0.048 0.059 Children ever born 2.018 0.069 17,783 18,640 1.331 0.034 1.879 2.156 Children surviving 1.955 0.067 17,783 18,640 1.324 0.034 1.822 2.088 Children ever born to women age 40-49 4.508 0.074 3,446 3,786 1.796 0.016 4.360 4.655 Knows any contraceptive method 1.000 0.000 9,554 10,135 1.033 0.000 1.000 1.000 Knows any modern contraceptive method 1.000 0.000 9,554 10,135 1.033 0.000 1.000 1.000 Currently using any method 0.614 0.008 9,554 10,135 1.554 0.013 0.598 0.629 Currently using a modern method 0.427 0.008 9,554 10,135 1.528 0.018 0.411 0.442 Currently using a traditional method 0.187 0.006 9,554 10,135 1.391 0.030 0.176 0.198 Currently using pill 0.078 0.005 9,554 10,135 1.841 0.065 0.068 0.088 Currently using IUD 0.219 0.008 9,554 10,135 1.916 0.037 0.202 0.235 Currently using condoms 0.081 0.005 9,554 10,135 1.788 0.061 0.071 0.091 Currently using injectables 0.008 0.001 9,554 10,135 1.398 0.157 0.006 0.011 Currently using female sterilization 0.022 0.003 9,554 10,135 1.856 0.127 0.016 0.027 Currently using rhythm 0.036 0.004 9,554 10,135 1.927 0.101 0.029 0.044 Currently using withdrawal 0.141 0.005 9,554 10,135 1.513 0.038 0.131 0.152 Used public sector source 0.435 0.015 3,892 4,172 1.871 0.034 0.405 0.465 Want no more children 0.530 0.009 9,554 10,135 1.721 0.017 0.512 0.547 Want to delay birth at least 2 years 0.227 0.007 9,554 10,135 1.730 0.033 0.212 0.242 Ideal number of children 3.907 0.033 9,783 10,258 1.698 0.008 3.842 3.972 Mothers received antenatal care for last birth 0.991 0.002 5,972 6,108 1.696 0.002 0.987 0.995 Mothers protected against tetanus for last birth 0.316 0.012 5,972 6,108 2.028 0.039 0.291 0.341 Births with skilled attendant at delivery 0.997 0.001 9,012 9,064 1.914 0.001 0.994 0.999 Had diarrhea in the last 2 weeks 0.157 0.008 8,811 8,884 1.984 0.053 0.140 0.174 Treated with ORS 0.200 0.021 1,353 1,396 1.726 0.102 0.159 0.241 Sought medical treatment for diarrhea 0.552 0.028 1,353 1,396 1.936 0.051 0.496 0.609 Vaccination card seen 0.804 0.017 1,741 1,772 1.773 0.021 0.769 0.838 Received BCG vaccination 0.986 0.009 1,741 1,772 3.208 0.009 0.968 1.004 Received DPT (3 doses) vaccination 0.991 0.002 1,741 1,772 0.959 0.002 0.986 0.995 Received polio (3 doses) vaccination 0.991 0.002 1,741 1,772 0.968 0.002 0.986 0.995 Received measles vaccination 0.950 0.010 1,741 1,772 1.834 0.010 0.931 0.970 Received all vaccinations 0.937 0.013 1,741 1,772 2.200 0.014 0.911 0.963 Height-for-age (below -2SD) 0.073 0.006 5,552 5,383 1.545 0.087 0.060 0.086 Weight-for-height (below -2SD) 0.024 0.003 5,552 5,383 1.502 0.134 0.018 0.030 Weight-for-age (below -2SD) 0.030 0.004 5,552 5,383 1.720 0.147 0.021 0.039 Prevalence of anemia (children 6-59 months) 0.317 0.013 4,890 4,700 1.793 0.040 0.292 0.343 Experienced physical violence since age 15 by anyone 0.345 0.010 6,241 6,565 1.742 0.030 0.324 0.366 Ever experienced any sexual violence 0.092 0.007 6,241 6,565 1.975 0.079 0.078 0.106 Experienced physical or sexual violence by husband 0.236 0.010 6,241 6,565 1.916 0.044 0.216 0.257 Experienced physical or sexual violence by husband in
the last 12 months 0.142 0.008 6,241 6,565 1.760 0.055 0.126 0.157 Prevalence of anemia (women 15-49 years) 0.337 0.009 9,984 10,027 1.960 0.028 0.318 0.355 Body mass index (BMI) < 18.5 0.051 0.004 9,554 9,646 1.797 0.080 0.042 0.059 Total fertility rate (last 3 years) 3.443 0.069 48,950 52,507 1.688 0.020 3.304 3.582 Neonatal mortality rate (last 0-9 years) 12.233 1.599 17,755 17,740 1.579 0.131 9.034 15.432 Post-neonatal mortality rate (last 0-9 years) 5.090 0.975 17,748 17,715 1.764 0.192 3.140 7.040 Infant mortality rate (last 0-9 years) 17.323 2.112 17,757 17,741 1.799 0.122 13.099 21.547 Child mortality rate (last 0-9 years) 3.244 0.756 17,607 17,573 1.601 0.233 1.732 4.756 Under-5 mortality rate (last 0-9 years) 20.511 2.155 17,770 17,747 1.730 0.105 16.200 24.822

Appendix B • 261
Table B.21 Sampling errors: Badia sample, Jordan 2012
Variable R SE N WN DEFT SE/R R-2SE R+2SE
Urban residence 0.296 0.031 1,265 705 2.374 0.103 0.235 0.357 No education 0.128 0.022 1,265 705 2.338 0.172 0.084 0.172 Secondary education 0.359 0.029 1,265 705 2.146 0.081 0.301 0.417 Higher education 0.202 0.017 1,265 705 1.495 0.084 0.168 0.236 Currently married (in union) 0.533 0.034 2,232 1,250 1.174 0.064 0.465 0.601 Married before age 20 0.357 0.018 1,312 724 1.395 0.050 0.321 0.392 Currently pregnant 0.068 0.007 2,232 1,250 1.142 0.101 0.055 0.082 Children ever born 2.223 0.167 2,232 1,250 1.225 0.075 1.888 2.557 Children surviving 2.145 0.160 2,232 1,250 1.217 0.075 1.825 2.465 Children ever born to women age 40-49 5.577 0.197 391 214 1.359 0.035 5.183 5.971 Knows any contraceptive method 1.000 0.000 1,192 666 na 0.000 1.000 1.000 Knows any modern contraceptive method 1.000 0.000 1,192 666 na 0.000 1.000 1.000 Currently using any method 0.578 0.017 1,192 666 1.200 0.030 0.544 0.612 Currently using a modern method 0.366 0.018 1,192 666 1.313 0.050 0.329 0.402 Currently using a traditional method 0.212 0.014 1,192 666 1.207 0.067 0.184 0.241 Currently using pill 0.124 0.011 1,192 666 1.178 0.091 0.102 0.147 Currently using IUD 0.128 0.014 1,192 666 1.454 0.110 0.100 0.156 Currently using condoms 0.041 0.005 1,192 666 0.902 0.127 0.030 0.051 Currently using injectables 0.027 0.006 1,192 666 1.343 0.236 0.014 0.039 Currently using female sterilization 0.026 0.004 1,192 666 0.912 0.160 0.018 0.035 Currently using rhythm 0.019 0.004 1,192 666 1.082 0.223 0.011 0.028 Currently using withdrawal 0.174 0.012 1,192 666 1.114 0.070 0.149 0.198 Used public sector source 0.543 0.034 416 232 1.399 0.063 0.475 0.612 Want no more children 0.495 0.017 1,192 666 1.168 0.034 0.461 0.529 Want to delay birth at least 2 years 0.290 0.012 1,192 666 0.934 0.042 0.265 0.315 Ideal number of children 4.304 0.062 1,200 680 1.092 0.015 4.179 4.429 Mothers received antenatal care for last birth 0.990 0.003 839 469 0.970 0.003 0.984 0.997 Mothers protected against tetanus for last birth 0.218 0.020 839 469 1.384 0.090 0.178 0.257 Births with skilled attendant at delivery 0.993 0.003 1,348 769 1.043 0.003 0.988 0.998 Had diarrhea in the last 2 weeks 0.140 0.015 1,317 753 1.427 0.104 0.111 0.169 Treated with ORS 0.254 0.034 187 105 1.008 0.133 0.186 0.321 Sought medical treatment for diarrhea 0.625 0.038 187 105 1.000 0.061 0.549 0.701 Vaccination card seen 0.804 0.030 289 169 1.285 0.037 0.745 0.864 Received BCG vaccination 0.948 0.023 289 169 1.785 0.024 0.902 0.994 Received DPT (3 doses) vaccination 0.913 0.030 289 169 1.838 0.033 0.854 0.973 Received polio (3 doses) vaccination 0.913 0.030 289 169 1.838 0.033 0.854 0.973 Received measles vaccination 0.881 0.032 289 169 1.704 0.036 0.818 0.945 Received all vaccinations 0.857 0.035 289 169 1.722 0.041 0.787 0.926 Height-for-age (below -2SD) 0.118 0.016 816 468 1.289 0.132 0.087 0.149 Weight-for-height (below -2SD) 0.026 0.007 816 468 1.233 0.257 0.013 0.039 Weight-for-age (below -2SD) 0.029 0.008 816 468 1.311 0.261 0.014 0.044 Prevalence of anemia (children 6-59 months) 0.393 0.022 730 420 1.178 0.057 0.348 0.438 Experienced physical violence since age 15 by anyone 0.316 0.033 786 462 1.986 0.105 0.250 0.382 Ever experienced any sexual violence 0.094 0.019 786 462 1.782 0.198 0.056 0.131 Experienced physical or sexual violence by husband 0.238 0.024 786 462 1.551 0.099 0.191 0.286 Experienced physical or sexual violence by husband in
the last 12 months 0.130 0.020 786 462 1.667 0.154 0.090 0.171 Prevalence of anemia (women 15-49 years) 0.305 0.015 1,265 707 1.192 0.051 0.274 0.336 Body mass index (BMI) < 18.5 0.050 0.010 1,193 666 1.617 0.204 0.030 0.071 Total fertility rate (last 3 years) 4.442 0.181 6,055 3,430 1.364 0.041 4.079 4.804 Neonatal mortality rate (last 0-9 years) 11.657 2.915 2,508 1,405 1.276 0.250 5.828 17.487 Post-neonatal mortality rate (last 0-9 years) 6.258 1.793 2,510 1,405 1.163 0.286 2.673 9.844 Infant mortality rate (last 0-9 years) 17.916 4.148 2,509 1,406 1.458 0.232 9.620 26.211 Child mortality rate (last 0-9 years) 2.177 0.927 2,461 1,360 0.955 0.426 0.324 4.030 Under-5 mortality rate (last 0-9 years) 20.054 4.241 2,510 1,406 1.462 0.211 11.572 28.536
na = Not applicable
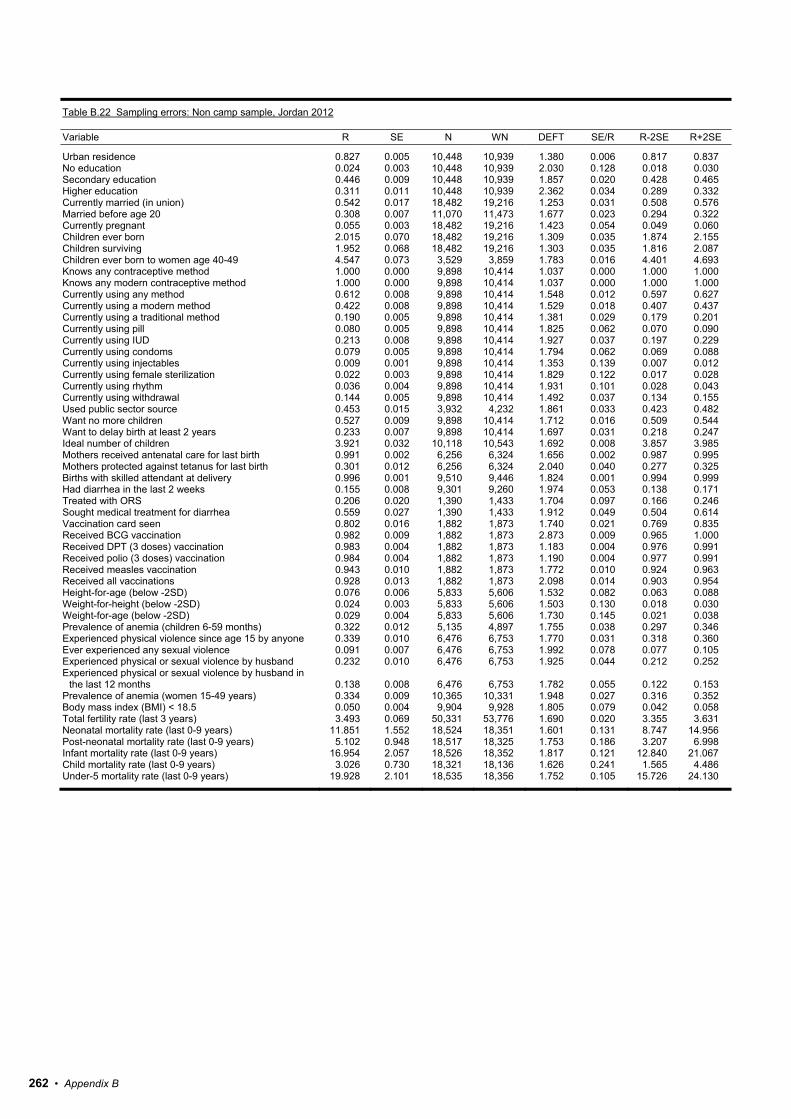
262 • Appendix B
Table B.22 Sampling errors: Non camp sample, Jordan 2012
Variable R SE N WN DEFT SE/R R-2SE R+2SE
Urban residence 0.827 0.005 10,448 10,939 1.380 0.006 0.817 0.837 No education 0.024 0.003 10,448 10,939 2.030 0.128 0.018 0.030 Secondary education 0.446 0.009 10,448 10,939 1.857 0.020 0.428 0.465 Higher education 0.311 0.011 10,448 10,939 2.362 0.034 0.289 0.332 Currently married (in union) 0.542 0.017 18,482 19,216 1.253 0.031 0.508 0.576 Married before age 20 0.308 0.007 11,070 11,473 1.677 0.023 0.294 0.322 Currently pregnant 0.055 0.003 18,482 19,216 1.423 0.054 0.049 0.060 Children ever born 2.015 0.070 18,482 19,216 1.309 0.035 1.874 2.155 Children surviving 1.952 0.068 18,482 19,216 1.303 0.035 1.816 2.087 Children ever born to women age 40-49 4.547 0.073 3,529 3,859 1.783 0.016 4.401 4.693 Knows any contraceptive method 1.000 0.000 9,898 10,414 1.037 0.000 1.000 1.000 Knows any modern contraceptive method 1.000 0.000 9,898 10,414 1.037 0.000 1.000 1.000 Currently using any method 0.612 0.008 9,898 10,414 1.548 0.012 0.597 0.627 Currently using a modern method 0.422 0.008 9,898 10,414 1.529 0.018 0.407 0.437 Currently using a traditional method 0.190 0.005 9,898 10,414 1.381 0.029 0.179 0.201 Currently using pill 0.080 0.005 9,898 10,414 1.825 0.062 0.070 0.090 Currently using IUD 0.213 0.008 9,898 10,414 1.927 0.037 0.197 0.229 Currently using condoms 0.079 0.005 9,898 10,414 1.794 0.062 0.069 0.088 Currently using injectables 0.009 0.001 9,898 10,414 1.353 0.139 0.007 0.012 Currently using female sterilization 0.022 0.003 9,898 10,414 1.829 0.122 0.017 0.028 Currently using rhythm 0.036 0.004 9,898 10,414 1.931 0.101 0.028 0.043 Currently using withdrawal 0.144 0.005 9,898 10,414 1.492 0.037 0.134 0.155 Used public sector source 0.453 0.015 3,932 4,232 1.861 0.033 0.423 0.482 Want no more children 0.527 0.009 9,898 10,414 1.712 0.016 0.509 0.544 Want to delay birth at least 2 years 0.233 0.007 9,898 10,414 1.697 0.031 0.218 0.247 Ideal number of children 3.921 0.032 10,118 10,543 1.692 0.008 3.857 3.985 Mothers received antenatal care for last birth 0.991 0.002 6,256 6,324 1.656 0.002 0.987 0.995 Mothers protected against tetanus for last birth 0.301 0.012 6,256 6,324 2.040 0.040 0.277 0.325 Births with skilled attendant at delivery 0.996 0.001 9,510 9,446 1.824 0.001 0.994 0.999 Had diarrhea in the last 2 weeks 0.155 0.008 9,301 9,260 1.974 0.053 0.138 0.171 Treated with ORS 0.206 0.020 1,390 1,433 1.704 0.097 0.166 0.246 Sought medical treatment for diarrhea 0.559 0.027 1,390 1,433 1.912 0.049 0.504 0.614 Vaccination card seen 0.802 0.016 1,882 1,873 1.740 0.021 0.769 0.835 Received BCG vaccination 0.982 0.009 1,882 1,873 2.873 0.009 0.965 1.000 Received DPT (3 doses) vaccination 0.983 0.004 1,882 1,873 1.183 0.004 0.976 0.991 Received polio (3 doses) vaccination 0.984 0.004 1,882 1,873 1.190 0.004 0.977 0.991 Received measles vaccination 0.943 0.010 1,882 1,873 1.772 0.010 0.924 0.963 Received all vaccinations 0.928 0.013 1,882 1,873 2.098 0.014 0.903 0.954 Height-for-age (below -2SD) 0.076 0.006 5,833 5,606 1.532 0.082 0.063 0.088 Weight-for-height (below -2SD) 0.024 0.003 5,833 5,606 1.503 0.130 0.018 0.030 Weight-for-age (below -2SD) 0.029 0.004 5,833 5,606 1.730 0.145 0.021 0.038 Prevalence of anemia (children 6-59 months) 0.322 0.012 5,135 4,897 1.755 0.038 0.297 0.346 Experienced physical violence since age 15 by anyone 0.339 0.010 6,476 6,753 1.770 0.031 0.318 0.360 Ever experienced any sexual violence 0.091 0.007 6,476 6,753 1.992 0.078 0.077 0.105 Experienced physical or sexual violence by husband 0.232 0.010 6,476 6,753 1.925 0.044 0.212 0.252 Experienced physical or sexual violence by husband in
the last 12 months 0.138 0.008 6,476 6,753 1.782 0.055 0.122 0.153 Prevalence of anemia (women 15-49 years) 0.334 0.009 10,365 10,331 1.948 0.027 0.316 0.352 Body mass index (BMI) < 18.5 0.050 0.004 9,904 9,928 1.805 0.079 0.042 0.058 Total fertility rate (last 3 years) 3.493 0.069 50,331 53,776 1.690 0.020 3.355 3.631 Neonatal mortality rate (last 0-9 years) 11.851 1.552 18,524 18,351 1.601 0.131 8.747 14.956 Post-neonatal mortality rate (last 0-9 years) 5.102 0.948 18,517 18,325 1.753 0.186 3.207 6.998 Infant mortality rate (last 0-9 years) 16.954 2.057 18,526 18,352 1.817 0.121 12.840 21.067 Child mortality rate (last 0-9 years) 3.026 0.730 18,321 18,136 1.626 0.241 1.565 4.486 Under-5 mortality rate (last 0-9 years) 19.928 2.101 18,535 18,356 1.752 0.105 15.726 24.130

Appendix B • 263
Table B.23 Sampling errors: Camp sample, Jordan 2012
Variable R SE N WN DEFT SE/R R-2SE R+2SE
Urban residence 1.000 0.000 904 413 na 0.000 1.000 1.000 No education 0.019 0.005 904 413 1.039 0.249 0.009 0.028 Secondary education 0.457 0.017 904 413 1.032 0.037 0.423 0.491 Higher education 0.188 0.014 904 413 1.107 0.077 0.159 0.217 Currently married (in union) 0.428 0.045 1,983 904 0.969 0.105 0.339 0.518 Married before age 20 0.380 0.015 940 430 1.014 0.039 0.350 0.410 Currently pregnant 0.039 0.005 1,983 904 0.851 0.123 0.029 0.048 Children ever born 1.849 0.196 1,983 904 0.929 0.106 1.457 2.240 Children surviving 1.786 0.190 1,983 904 0.932 0.106 1.407 2.166 Children ever born to women age 40-49 4.973 0.145 314 143 1.060 0.029 4.683 5.263 Knows any contraceptive method 1.000 0.000 848 387 na 0.000 1.000 1.000 Knows any modern contraceptive method 1.000 0.000 848 387 na 0.000 1.000 1.000 Currently using any method 0.608 0.020 848 387 1.186 0.033 0.568 0.648 Currently using a modern method 0.454 0.019 848 387 1.108 0.042 0.416 0.492 Currently using a traditional method 0.154 0.015 848 387 1.250 0.101 0.123 0.185 Currently using pill 0.122 0.010 848 387 0.908 0.084 0.101 0.142 Currently using IUD 0.212 0.014 848 387 1.029 0.068 0.184 0.241 Currently using condoms 0.082 0.011 848 387 1.209 0.139 0.059 0.105 Currently using injectables 0.007 0.003 848 387 0.977 0.404 0.001 0.012 Currently using female sterilization 0.021 0.005 848 387 1.067 0.249 0.011 0.032 Currently using rhythm 0.030 0.006 848 387 1.093 0.214 0.017 0.043 Currently using withdrawal 0.113 0.014 848 387 1.252 0.120 0.086 0.141 Used public sector source 0.142 0.020 376 172 1.109 0.140 0.102 0.183 Want no more children 0.559 0.019 848 387 1.105 0.034 0.522 0.597 Want to delay birth at least 2 years 0.190 0.016 848 387 1.163 0.083 0.159 0.221 Ideal number of children 4.214 0.071 865 395 0.993 0.017 4.072 4.356 Mothers received antenatal care for last birth 0.996 0.002 555 253 0.988 0.002 0.992 1.001 Mothers protected against tetanus for last birth 0.511 0.021 555 253 1.008 0.042 0.468 0.554 Births with skilled attendant at delivery 0.997 0.002 850 388 1.055 0.002 0.994 1.001 Had diarrhea in the last 2 weeks 0.182 0.012 827 377 0.918 0.068 0.157 0.206 Treated with ORS 0.170 0.037 150 68 1.123 0.218 0.096 0.245 Sought medical treatment for diarrhea 0.521 0.046 150 68 1.095 0.089 0.429 0.614 Vaccination card seen 0.857 0.028 148 68 0.967 0.033 0.800 0.913 Received BCG vaccination 0.992 0.007 148 68 1.051 0.008 0.977 1.007 Received DPT (3 doses) vaccination 0.992 0.007 148 68 1.051 0.008 0.977 1.007 Received polio (3 doses) vaccination 0.992 0.007 148 68 1.051 0.008 0.977 1.007 Received measles vaccination 0.976 0.012 148 68 0.982 0.013 0.951 1.001 Received all vaccinations 0.976 0.012 148 68 0.982 0.013 0.951 1.001 Height-for-age (below -2SD) 0.096 0.017 535 245 1.131 0.175 0.063 0.130 Weight-for-height (below -2SD) 0.032 0.009 535 245 1.131 0.292 0.013 0.051 Weight-for-age (below -2SD) 0.042 0.008 535 245 0.921 0.200 0.025 0.059 Prevalence of anemia (children 6-59 months) 0.365 0.027 485 222 1.240 0.075 0.310 0.419 Experienced physical violence since age 15 by anyone 0.447 0.020 551 274 0.921 0.044 0.408 0.486 Ever experienced any sexual violence 0.122 0.014 551 274 1.009 0.116 0.094 0.150 Experienced physical or sexual violence by husband 0.340 0.022 551 274 1.069 0.064 0.297 0.383 Experienced physical or sexual violence by husband in
the last 12 months 0.225 0.021 551 274 1.164 0.092 0.184 0.266 Prevalence of anemia (women 15-49 years) 0.338 0.020 884 403 1.244 0.059 0.299 0.378 Body mass index (BMI) < 18.5 0.060 0.009 843 385 1.085 0.149 0.042 0.077 Total fertility rate (last 3 years) 3.729 0.147 4,945 2,265 1.081 0.040 3.434 4.023 Neonatal mortality rate (last 0-9 years) 19.816 3.866 1,761 802 1.006 0.195 12.083 27.549 Post-neonatal mortality rate (last 0-9 years) 6.758 2.125 1,763 804 1.033 0.314 2.509 11.007 Infant mortality rate (last 0-9 years) 26.574 4.443 1,762 803 1.008 0.167 17.688 35.460 Child mortality rate (last 0-9 years) 6.289 2.225 1,767 805 1.174 0.354 1.840 10.738 Under-5 mortality rate (last 0-9 years) 32.696 4.316 1,767 805 0.928 0.132 24.065 41.327
na = Not applicable


Appendix C • 265
DATA QUALITY TABLES Appendix C
Table C.1 Household age distribution
Single-year age distribution of the de facto household population by sex (weighted), Jordan 2012
Age Women Men
Number Percent Number Percent
0 774 2.0 960 2.5 1 908 2.4 1,036 2.7 2 956 2.5 1,006 2.6 3 973 2.5 999 2.6 4 1,005 2.6 1,033 2.7 5 884 2.3 1,003 2.6 6 917 2.4 905 2.4 7 855 2.2 908 2.4 8 946 2.5 928 2.4 9 880 2.3 904 2.4 10 817 2.1 922 2.4 11 793 2.1 924 2.4 12 875 2.3 897 2.4 13 788 2.1 778 2.1 14 755 2.0 897 2.4 15 812 2.1 874 2.3 16 863 2.2 944 2.5 17 946 2.5 933 2.5 18 894 2.3 930 2.5 19 817 2.1 829 2.2 20 790 2.1 790 2.1 21 714 1.9 835 2.2 22 806 2.1 721 1.9 23 672 1.8 751 2.0 24 646 1.7 629 1.7 25 606 1.6 686 1.8 26 610 1.6 594 1.6 27 558 1.5 535 1.4 28 612 1.6 537 1.4 29 569 1.5 505 1.3 30 611 1.6 501 1.3 31 531 1.4 434 1.1 32 531 1.4 452 1.2 33 540 1.4 369 1.0 34 480 1.3 448 1.2 35 560 1.5 382 1.0 36 522 1.4 467 1.2 37 497 1.3 400 1.1 38 485 1.3 469 1.2 39 456 1.2 454 1.2 40 503 1.3 422 1.1 41 483 1.3 425 1.1 42 408 1.1 433 1.1 43 453 1.2 428 1.1 44 448 1.2 392 1.0 45 402 1.0 376 1.0 46 320 0.8 431 1.1 47 350 0.9 337 0.9 48 316 0.8 340 0.9 49 319 0.8 289 0.8 50 350 0.9 298 0.8 51 258 0.7 222 0.6 52 318 0.8 227 0.6 53 246 0.6 212 0.6 54 263 0.7 193 0.5 55 244 0.6 172 0.5 56 278 0.7 189 0.5 57 247 0.6 205 0.5 58 206 0.5 170 0.4 59 163 0.4 172 0.5 60 189 0.5 185 0.5 61 162 0.4 135 0.4 62 166 0.4 151 0.4 63 131 0.3 145 0.4 64 208 0.5 141 0.4 65 143 0.4 132 0.3 66 125 0.3 163 0.4 67 130 0.3 120 0.3 68 105 0.3 148 0.4 69 89 0.2 74 0.2 70+ 1,056 2.8 1,065 2.8 Don't know/missing 8 0.0 0 0.0
Total 38,339 100.0 37,963 100.0
Note: The de facto population includes all residents and nonresidents who stayed in the household the night before the interview.

266 • Appendix C
Table C.2 Age distribution of eligible and interviewed women
De facto household population of women age 10-54 and interviewed women age 15-49, and percent distribution and percentage of eligible women who were interviewed (weighted), by five-year age groups, Jordan 2012
Age group
Household population of women age
10-54
Ever-married women age
10-54
Interviewed women age 15-49 Percentage of
eligible women interviewed Number Percentage
10-14 4,027 0 na na na 15-19 4,332 273 268 2.4 98.1 20-24 3,629 1,222 1,167 10.6 95.5 25-29 2,955 2,062 1,942 17.7 94.2 30-34 2,693 2,225 2,068 18.9 92.9 35-39 2,520 2,175 2,032 18.5 93.4 40-44 2,294 2,055 1,978 18.0 96.3 45-49 1,707 1,571 1,507 13.7 95.9 50-54 1,435 1,322 na na na
15-49 20,129 11,584 10,963 100.0 94.6
Note: The de facto population includes all residents and nonresidents who stayed in the household the night before the interview. Weights for both household population of women and interviewed women are household weights. Age is based on the Household Questionnaire. na = Not applicable
Table C.3 Completeness of reporting
Percentage of observations missing information for selected demographic and health questions (weighted), Jordan 2012
Subject
Percentage with
information missing
Number of cases
Birth date Month only (births in the 15 years preceding the survey) 0.08 27,128 Month and year (births in the 15 years preceding the survey) 0.00 27,128
Age at death (deceased children born in the 15 years preceding the survey) 0.04 676
Age/date at first union1 (ever-married women age 15-49) 0.00 11,352
Respondent's education (ever-married women age 15-49) 0.00 11,352
Diarrhea in the past 2 weeks (living children age 0-59 months) 0.29 9,637
Anthropometry Height (living children age 0-59 months from the Household Questionnaire) 7.27 6,379 Weight (living children age 0-59 months from the Household Questionnaire) 6.94 6,379 Height or weight (living children age 0-59 months from the Household Questionnaire) 7.28 6,379
Anemia Anemia (living children age 6-59 months from the Household Questionnaire) 12.25 5,834 Anemia (all women from the Household Questionnaire) 18.40 13,028
1 Both year and age missing.

Appendix C • 267
Table C.4 Births by calendar years
Number of births, percentage with complete birth date, sex ratio at birth, and calendar year ratio by calendar year, according to living (L), dead (D), and total (T) children (weighted), Jordan 2012
Calendar year
Number of births Percentage with
complete birth date1 Sex ratio at birth2 Calendar year ratio3
L D T L D T L D T L D T
2012 1,445 23 1,468 100.0 100.0 100.0 123.2 139.2 123.4 na na na 2011 1,890 36 1,926 100.0 100.0 100.0 118.3 49.5 116.5 na na na 2010 1,959 37 1,996 100.0 100.0 100.0 106.3 135.6 106.8 101.2 109.4 101.4 2009 1,980 33 2,013 100.0 100.0 100.0 100.5 98.1 100.5 101.0 68.0 100.2 2008 1,961 59 2,019 100.0 100.0 100.0 106.9 179.9 108.5 98.3 176.1 99.6 2007 2,009 34 2,043 100.0 100.0 100.0 107.2 90.1 106.9 107.4 78.4 106.7 2006 1,780 28 1,808 99.4 100.0 99.4 98.0 213.6 99.1 95.1 84.9 94.9 2005 1,735 32 1,767 100.0 100.0 100.0 112.0 84.5 111.4 93.8 87.8 93.6 2004 1,921 45 1,966 100.0 100.0 100.0 89.7 217.2 91.4 112.4 102.3 112.1 2003 1,683 55 1,739 100.0 96.9 99.9 108.0 126.9 108.5 94.2 126.8 95.0 2008-2012 9,234 188 9,422 100.0 100.0 100.0 110.0 115.9 110.1 na na na 2003-2007 9,128 194 9,322 99.9 99.1 99.9 102.4 134.8 103.0 na na na 1998-2002 7,825 285 8,110 100.0 98.1 99.9 110.9 146.8 112.0 na na na 1993-1997 6,911 252 7,163 100.0 99.5 100.0 107.2 134.7 108.0 na na na <1993 6,022 348 6,369 100.0 99.9 100.0 106.9 111.8 107.2 na na na
All 39,120 1,266 40,386 100.0 99.3 99.9 107.4 127.5 108.0 na na na
na = Not applicable 1 Both year and month of birth given. 2 (Bm/Bf)x100, where Bm and Bf are the numbers of male and female births, respectively. 3 [2Bx/(Bx-1+Bx+1)]x100, where Bx is the number of births in calendar year x.
Table C.5 Reporting of age at death in days
Distribution of reported deaths under age one month by age at death in days and the percentage of neonatal deaths reported to occur at age 0-6 days, for five-year periods of birth preceding the survey (weighted), Jordan 2012
Age at death (days)
Number of years preceding the survey Total 0-19 0-4 5-9 10-14 15-19
<1 43 46 49 50 189 1 22 9 24 14 69 2 23 4 2 16 44 3 15 6 8 15 45 4 3 2 13 5 23 5 9 0 1 1 12 6 4 1 10 3 17 7 5 12 25 3 45 8 4 0 2 0 6 9 0 0 0 1 2 10 1 2 3 3 8 11 1 0 1 1 3 12 1 0 0 1 1 13 0 0 0 0 0 14 4 1 6 0 11 15 2 1 1 0 3 16 0 1 0 0 1 17 1 8 0 0 8 18 1 0 0 0 1 19 0 0 0 1 1 20 0 1 3 1 6 21 0 0 1 0 1 22 1 1 1 0 2 23 0 2 0 0 2 24 0 0 0 0 0 25 0 0 5 0 5 26 0 0 0 0 1 27 1 0 0 0 1 28 0 0 8 0 8 30 0 5 2 3 9
Total 0-30 140 101 166 118 525 Percentage early neonatal1 84.6 67.3 64.9 88.0 75.8 1 ≤0-6 days / ≤0-30 days.

268 • Appendix C
Table C.6 Reporting of age at death in months
Distribution of reported deaths under age two by age at death in months and the percentage of infant deaths reported to occur at under age one month, for five-year periods of birth preceding the survey, Jordan 2012
Age at death (months)
Number of years preceding the survey Total 0-19 0-4 5-9 10-14 15-19
<1a 140 101 166 118 525 1 14 7 14 6 41 2 4 3 15 8 30 3 2 9 5 8 23 4 4 7 8 15 33 5 2 13 3 8 26 6 1 9 2 5 17 7 2 7 6 10 25 8 1 1 8 7 16 9 1 2 7 4 14 10 0 0 2 2 5 11 0 0 0 1 2 12 7 1 2 4 14 13 0 0 0 0 0 14 3 0 0 5 8 15 0 0 0 0 1 16 0 1 1 0 2 17 0 0 10 0 10 18 0 2 1 7 11 19 5 0 0 0 5 20 2 0 0 0 2 22 0 0 0 0 0 23 0 4 2 0 6
Total 0-11 172 159 235 192 757 Percentage neonatal1 81.6 63.5 70.5 61.6 69.3 a Includes deaths under one month reported in days. 1 Under one month/under one year.

Appendix C • 269
Table C.7 Nutritional status of children based on the NCHS/CDC/WHO International Reference Population
Percentage of children under age five classified as malnourished according to three anthropometric indices of nutritional status: height-for-age, weight-for-height, and weight-for-age, by background characteristics, based on the NCHS/CDC/WHO International Reference Population, Jordan 2012
Background characteristic
Height-for-age1 Weight-for-height Weight-for-age
Number of
children
Percent- age below
-3 SD
Percent- age below
-2 SD2
Mean Z-score (SD)
Percent- age below
-3 SD
Percent- age below
-2 SD2
Percent- age
above +2 SD
Mean Z-score (SD)
Percent- age below
-3 SD
Percent- age below
-2 SD2
Percent- age
above +2 SD
Mean Z-score (SD)
Age in months <6 0.2 2.2 -0.0 0.2 0.8 8.5 0.5 0.0 1.6 8.0 0.5 473 6-8 0.2 2.9 -0.0 0.0 2.8 3.5 0.1 0.0 0.9 1.8 0.1 223 9-11 0.3 3.8 -0.2 0.1 1.0 2.4 -0.1 0.2 2.4 4.8 -0.3 274 12-17 0.3 7.0 -0.2 0.2 4.4 5.2 -0.1 0.7 4.4 4.7 -0.2 604 18-23 3.1 11.8 -0.6 0.1 3.3 3.0 -0.1 0.1 6.4 2.2 -0.4 599 24-35 1.5 5.4 -0.2 0.1 1.7 1.6 -0.1 0.4 4.7 0.8 -0.3 1,160 36-47 0.6 4.9 -0.3 0.1 1.7 1.3 -0.1 0.1 3.9 1.1 -0.3 1,261 48-59 1.1 3.8 -0.3 0.3 1.5 3.3 -0.1 0.3 3.4 2.1 -0.3 1,247
Sex Male 1.0 6.0 -0.3 0.2 2.3 2.9 -0.1 0.3 4.4 2.7 -0.2 3,006 Female 1.2 4.6 0.2 0.1 1.8 3.2 -0.0 0.3 3.4 2.3 -0.2 2,836
Birth interval in months3 First birth4 1.0 4.5 -0.1 0.1 1.8 3.7 0.0 0.2 3.3 2.3 -0.1 1,302 <24 1.2 6.8 -0.4 0.1 1.8 2.3 -0.1 0.4 4.6 2.3 -0.3 1,445 24-47 1.4 5.9 -0.3 0.1 1.9 3.1 -0.1 0.2 4.0 2.8 -0.3 1,872 48+ 0.4 3.6 -0.1 0.0 2.4 3.2 -0.0 0.1 3.0 2.6 -0.2 1,124
Size at birth3 Very small 2.8 14.8 -0.7 0.0 3.6 1.0 -0.3 0.8 12.8 1.2 -0.8 321 Small 0.6 8.7 -0.6 0.1 2.4 2.1 -0.2 0.2 5.4 0.6 -0.6 768 Average or larger 1.0 4.2 -0.2 0.1 1.7 3.4 0.0 0.2 2.9 2.9 -0.1 4,652 Missing 0.0 13.0 -1.2 0.0 20.2 0.0 -0.5 0.0 20.2 0.0 -1.1 3
Mother's interview status Interviewed 1.1 5.4 -0.3 0.1 1.9 3.1 -0.0 0.2 3.8 2.5 -0.2 5,744 Not interviewed but in
household 0.5 1.3 -0.6 5.9 15.9 3.1 -0.3 4.2 15.9 3.1 -0.6 50 Not interviewed and not in
the household5 0.0 6.5 -0.4 0.0 0.3 3.2 0.2 0.0 3.3 1.9 -0.2 47
Mother's nutritional status6 Thin (BMI <18.5) 3.3 7.0 -0.6 0.2 3.4 4.7 -0.6 0.2 7.2 0.3 -0.9 126 Normal (BMI 18.5-24.9) 1.2 6.2 -0.3 0.1 2.2 2.0 -0.2 0.1 4.5 1.6 -0.4 1,897 Overweight/ obese (BMI
≥25) 1.0 4.8 -0.2 0.1 1.7 3.6 0.1 0.3 3.2 3.1 -0.2 3,729
Residence Urban 1.0 5.0 -0.2 0.1 2.1 2.7 -0.1 0.2 4.0 2.5 -0.2 4,730 Rural 1.5 6.9 -0.4 0.1 1.6 4.5 0.0 0.4 3.2 2.7 -0.3 1,111
Region Central 1.0 5.3 -0.2 0.2 2.1 3.0 -0.1 0.3 4.0 2.3 -0.2 3,469 North 0.8 4.5 -0.2 0.0 2.0 2.6 -0.1 0.2 3.5 2.5 -0.3 1,808 South 2.0 8.2 -0.4 0.2 1.7 5.1 0.1 0.4 4.4 4.2 -0.2 565
Governorate Amman 1.2 5.1 -0.2 0.0 1.7 3.0 -0.0 0.2 4.0 2.1 -0.2 2,034 Balqa 0.7 3.4 -0.3 1.0 3.2 3.3 0.0 0.4 3.7 2.5 -0.2 394 Zarqa 1.0 7.3 -0.4 0.3 2.6 2.6 -0.2 0.5 4.7 2.4 -0.4 880 Madaba 0.2 2.2 -0.1 0.0 1.8 4.4 0.1 0.0 1.3 3.6 -0.0 160 Irbid 0.6 3.6 -0.1 0.0 2.6 2.1 -0.1 0.0 3.2 2.6 -0.2 1,080 Mafraq 1.2 7.1 -0.6 0.0 0.4 2.9 0.1 0.6 3.7 1.7 -0.4 368 Jarash 1.8 5.4 -0.4 0.1 2.2 3.6 -0.0 0.5 5.1 2.6 -0.3 215 Ajloun 0.4 2.7 -0.2 0.2 1.3 4.1 0.1 0.4 3.1 2.9 -0.2 146 Karak 2.0 7.7 -0.4 0.0 1.6 5.9 0.2 0.4 3.2 4.0 -0.1 256 Tafiela 0.3 6.1 -0.3 0.7 1.9 4.5 0.0 0.8 3.6 4.7 -0.2 97 Ma'an 2.5 10.9 -0.7 0.2 2.9 1.7 -0.1 0.4 7.6 2.1 -0.5 104 Aqaba 2.9 8.5 -0.4 0.0 0.5 6.9 0.2 0.0 4.6 6.0 -0.1 107
Badia Badia 2.2 8.2 -0.6 0.0 1.5 3.4 -0.1 0.3 6.0 1.7 -0.5 467 Non Badia 1.0 5.1 -0.2 0.1 2.1 3.0 (0.0) 0.3 3.7 2.6 -0.2 5,375
Camps Camp 1.9 6.6 -0.4 0.4 1.4 2.5 -0.2 0.6 4.7 1.3 -0.5 245 Non camp 1.0 5.3 -0.2 0.1 2.1 3.1 -0.0 0.2 3.8 2.6 -0.2 5,597
Mother's education7 No education 2.0 5.9 -0.8 0.9 2.5 1.7 -0.2 0.2 10.6 0.9 -0.6 102 Elementary 1.6 7.6 -0.5 0.2 2.2 3.2 0.0 0.4 4.2 2.0 -0.4 385 Preparatory 2.0 7.4 -0.5 0.0 2.2 2.2 -0.1 0.0 5.3 0.8 -0.4 762 Secondary 1.0 5.5 -0.3 0.1 2.3 2.8 -0.1 0.4 4.6 2.3 -0.3 2,772 Higher 0.6 3.6 -0.0 0.2 1.5 3.9 0.0 0.2 1.7 3.8 -0.1 1,774
Continued

270 • Appendix C
Table C.7—Continued
Percentage of children under age five classified as malnourished according to three anthropometric indices of nutritional status: height-for-age, weight-for-height, and weight-for-age, by background characteristics, based on the NCHS/CDC/WHO International Reference Population, Jordan 2012
Background characteristic
Height-for-age1 Weight-for-height Weight-for-age
Number of
children
Percent- age below
-3 SD
Percent- age below
-2 SD2
Mean Z-score (SD)
Percent- age below
-3 SD
Percent- age below
-2 SD2
Percent- age
above +2 SD
Mean Z-score (SD)
Percent- age below
-3 SD
Percent- age below
-2 SD2
Percent- age
above +2 SD
Mean Z-score (SD)
Wealth quintile Lowest 2.6 9.8 -0.6 0.1 2.4 3.5 -0.1 0.5 6.8 1.9 -0.5 1,368 Second 0.8 4.7 -0.3 0.2 2.0 2.7 -0.0 0.3 3.3 2.8 -0.2 1,323 Middle 0.5 4.5 -0.2 0.1 1.5 2.2 -0.1 0.2 3.2 1.8 -0.3 1,308 Fourth 0.7 4.3 -0.1 0.4 2.6 3.2 -0.0 0.3 4.2 4.0 -0.2 1,059 Highest 0.3 1.5 0.1 0.0 1.4 4.3 0.0 0.0 0.5 2.3 0.0 784
Total 1.1 5.3 -0.3 0.1 2.0 3.1 -0.0 0.3 3.9 2.5 -0.2 5,842
Note: Table is based on children who slept in the household the night before the interview. Each of the indices is expressed in standard deviation units (SD) from the median of the NCHS/CDC/WHO International Reference Population. Table is based on children with valid dates of birth (month and year) and valid measurement of both height and weight. 1 Recumbent length is measured for children under age 2, or in the few cases when the age of the child is unknown and the child is less than 85 cm; standing height is measured for all other children. 2 Includes children who are below -3 standard deviations (SD) from the International Reference Population median 3 Excludes children whose mothers were not interviewed. 4 First-born twins (triplets, etc.) are counted as first births because they do not have a previous birth interval. 5 Includes children whose mothers are deceased. 6 Excludes children whose mothers were not weighed and measured, and children whose mothers are pregnant or gave birth within the preceding 2 months. Mother's nutritional status in terms of BMI (body mass index) is presented in Table 11.9. 7 For women who are not interviewed, information is taken from the Household Questionnaire. Excludes children whose mothers are not listed in the Household Questionnaire.

Appendix D • 271
QUESTIONNAIRES APPENDIX D


March 8, 2012The Hashemite Kingdom of Jordan
Department of Statistics JORDAN POPULATION AND Household Survey Directorate FAMILY HEALTH SURVEY 2012
HOUSEHOLD QUESTIONNAIRE
Survey Contents Confidential by Statistical Law
IDENTIFICATION
QUESTIONNAIRE No.: . . . . . . . . . . . . . .
GOVERNORATE: BLOCK No.: . . . . . . . . . . . . . . . . . . . . .
DISTRICT:BUILDING No.:
SUB-DISTRICT:HOUSING UNIT No.:
LOCALITY:CLUSTER No.: . . . . . . . . . . . . . . . . . . .
AREA:HOUSEHOLD No.: . . . . . . . . . . . . . . . .
SUB-AREA:
STRATUM: TELEPHONE/MOBILE No.
URBAN/RURAL (Urban=1; Rural=2) (if available)
INTERVIEWER VISITS
FINAL VISIT
DATE DAY
MONTH
YEAR
INTERVIEWER'S NAME INT. NUMBER
RESULT* RESULT
NEXT VISIT: DATETOTAL NUMBER
TIME OF VISITS
*RESULT CODES:1 COMPLETED TOTAL PERSONS2 NO HOUSEHOLD MEMBER AT HOME OR NO COMPETENT RESPONDENT IN HOUSEHOLD
AT HOME AT TIME OF VISIT3 ENTIRE HOUSEHOLD ABSENT FOR EXTENDED PERIOD OF TIME4 POSTPONED TOTAL ELIGIBLE5 REFUSED WOMEN6 HOUSING UNIT VACANT OR ADDRESS NO MORE A DWELLING7 HOUSING UNIT DESTROYED LINE NO. OF8 HOUSING UNIT NOT FOUND RESPONDENT 9 OTHER HOUSEHOLD
(SPECIFY) QUESTIONNAIRE
SUPERVISOR FIELD EDITOR
NAME NAME
DATE DATE
1
HOUSEHOLD SELECTED FOR ANTHROPOMETRY, ANEMIA TESTING, CHILD DISCIPLINE AND DOMESTIC VIOLENCE MODULE ? (YES = 1; NO = 2)
EDITOROFFICE KEYED BY
1 2 3
2 0
HH-1• 273Appendix D

GIVE CARD WITH CONTACT INFORMATION
SIGNATURE OF INTERVIEWER: DATE:
. . . 1 RESPONDENT DOES NOT AGREE TO BE INTERVIEWED . . . 2 END
Hello. My name is _______________________________________. I am working with the Department of Statistics. We are conducting a survey about health all over Jordan. The information we collect will help the government to plan health services. Your household was selected for the survey. I would like to ask you some questions about your household. The questions usually take about 15 to 20 minutes. All of the answers you give will be confidential and will not be shared with anyone other than members of our survey team. You don't have to be in the survey, but we hope you will agree to answer the questions since your views are important. If I ask you any question you don't want to answer, just let me know and I will go on to the next question or you can stop the interview at any time.
In case you need more information about the survey, you may contact the person listed on this card.
Do you have any questions?May I begin the interview now?
RESPONDENT AGREES TO BE INTERVIEWED
INTRODUCTION AND CONSENT
HH-2274 • Appendix D

IF AGE 15
OR OLDER
LINE USUAL RESIDENTS AND DATE OF BIRTH AGE NATIONALITY ELIGIBILITYNO. VISITORS INDIVIDUAL
INTERVIEW
Please give me the names What is the Is Does Did In what month and year was How old is What is What is CIRCLEof the persons who usually relationship of (NAME) (NAME) (NAME) (NAME) born? (NAME)? (NAME'S) (NAME'S) LINElive in your household and (NAME) to the male or usually stay nationality? current marital NUMBER ANTHROPOMETRY ANDguests of the household head of the female? live here IF DON'T KNOW MONTH, RECORD IF AGE =95+, status? OF ANEMIA MEASUREMENTSwho stayed here last night, household? here? last 98' FOR MONTH. RECORD 95. WOMEN CIRCLE CIRCLEstarting with the head of night? 1 = JORDANIAN 1 = NEVER- ELIGIBLE LINE LINEthe household. SEE CODES IF DON'T KNOW YEAR, RECORD COMPARE AND 2 = EGYPTIAN MARRIED FOR NUMBER NUMBER
BELOW. 9998' FOR YEAR. CORRECT 6A 3 = SYRIAN 2 = MARRIED INDIVIDUAL OF ALL OF ALLAFTER LISTING THE AND/OR 7 IF 4= IRAQI 3 = DIVORCED SURVEY WOMEN CHILDRENNAMES AND RECORDING INCONSISTENT. 5 = OTHER ARAB 4 = WIDOWED (EVER- AGE BORN INTHE RELATIONSHIP 6 = NOT ARAB 5 = SEPARATED MARRIED 15-49. 2007 OR AND SEX FOR EACH 8= DON'T KNOW WOMEN LATER, ORPERSON, ASK AGE 15-49). CHILDRENQUESTIONS 2A-2C AGE 0-5
TO BE SURE THAT THE YEARS
LISTING IS COMPLETE. (IF DATE
OF BIRTH
THEN ASK APPROPRIATE NOT
QUESTIONS IN COLUMNS KNOWN).
5-20 FOR EACH PERSON.
(1) (2) (6) (9) (10) (11)
M F Y N Y N MONTH YEAR IN YEARS
01 1 2 1 2 1 2 01 01 01
02 1 2 1 2 1 2 02 02 02
03 1 2 1 2 1 2 03 03 03
04 1 2 1 2 1 2 04 04 04
05 1 2 1 2 1 2 05 05 05
06 1 2 1 2 1 2 06 06 06
07 1 2 1 2 1 2 07 07 07
CODES FOR Q. 3: RELATIONSHIP TO HEAD OF HOUSEHOLD
01 = HEAD 06 = PARENT 11 = ADOPTED/02 = WIFE OR HUSBAND 07 = PARENT-IN-LAW FOSTERED CHILD03 = SON OR DAUGHTER 08 = BROTHER OR SISTER 12 = NOT RELATED04 = STEPSON OR 09 = GRAND FATHER/MOTHER 98 = DON'T KNOW
STEPDAUGHTER 10 = OTHER RELATIVE05 = GRANDCHILD
(7)
HOUSEHOLD SCHEDULE
RELATIONSHIPTO HEAD OFHOUSEHOLD
SEX RESIDENCE MARITALSTATUS
CHECK COVER PAGE IF THIS HOUSEHOLD IS SELECTED
FOR ANTHROPOMETRY AND ANEMIA
(3) (4) (5) (5A) (6A) (8)
HH-3
• 275Appendix D

IF AGE 0-17 YEARS IF AGE 5 YEARS
OR OLDER
LINE SURVIVORSHIP AND RESIDENCE OF BIOLOGICAL EVER ATTENDED NO. PARENTS SCHOOL
Is Does Is Does Has Can (NAME) What is the What is the Did (NAME)'s (NAME)'s (NAME)'s (NAME)'s (NAME) read and highest level highest grade (NAME)natural natural natural natural ever write? of school (NAME) attendmother alive? mother father alive? father attended (NAME) has completed school usually usually school? attended? at that level? at any IF NO, PROBE:
live in this live in this timehousehold household SEE CODES. SEE CODES. duringor was she or was he thea guest a guest current last night? last night? (2012-13)
schoolIF YES: IF YES: year? 1 = HAS What is What is CERTIFICATEher name? his name? 2 = REGISTEREDRECORD RECORD 3 = NEITHERMOTHER'S FATHER'S 8 = DON'T LINE LINE KNOWNUMBER. NUMBER.
IF NO, IF NO, RECORD RECORD '00'. '00'.
(1) (13) (16) (16A) (17) (17A)
Y N DK Y N DK Y N Y N LEVEL GRADE Y N CODES FOR EDUCATION LEVEL (Q.17)
01 1 2 8 1 2 8 1 2 1 2 1 2 OLD SYSTEM
01 = OLD ELEMENTARYGO TO 14 GO TO 16 GO TO 17 NEXT LINE 02 = OLD PREPARATORY
02 1 2 8 1 2 8 1 2 1 2 1 2 NEW SYSTEM
04 = NEW BASICGO TO 14 GO TO 16 GO TO 17 NEXT LINE 05 = NEW SECONDARY
03 1 2 8 1 2 8 1 2 1 2 1 2 07 = BACHELOR
08 = HIGHER EDUCATIONGO TO 14 GO TO 16 GO TO 17 NEXT LINE
04 1 2 8 1 2 8 1 2 1 2 1 2CODES FOR GRADE (Q.17A)
GO TO 14 GO TO 16 GO TO 17 NEXT LINE 00 = LESS THAN ONE YEAR COMPLETED
05 1 2 8 1 2 8 1 2 1 2 1 2
GO TO 14 GO TO 16 GO TO 17 NEXT LINE
06 1 2 8 1 2 8 1 2 1 2 1 2
GO TO 14 GO TO 16 GO TO 17 NEXT LINE
07 1 2 8 1 2 8 1 2 1 2 1 2
GO TO 14 GO TO 16 GO TO 17 NEXT LINE
03 = OLD SECONDARY
98 = DON'T KNOW
06 = INTERMEDIATE DIPLOMA
98 = DON'T KNOW
(14) (15)(12)
BIRTH
(20)
Does (NAME) have a birth certificate?
Has (NAME)'s birth ever been registered with the civil authority?
IF AGE 5-24
YEARS
(18)
IF AGE
0-4 YEARS
TRATIONREGIS-
HH-4
276 • Appendix D

IF AGE 15
OR OLDER
LINE USUAL RESIDENTS AND DATE OF BIRTH AGE NATIONALITY ELIGIBILITYNO. VISITORS INDIVIDUAL
INTERVIEW
Please give me the names What is the Is Does Did In what month and year was How old is What is What is CIRCLEof the persons who usually relationship of (NAME) (NAME) (NAME) (NAME) born? (NAME)? (NAME'S) (NAME'S) LINElive in your household and (NAME) to the male or usually stay nationality? current marital NUMBER ANTHROPOMETRY ANDguests of the household head of the female? live here IF DON'T KNOW MONTH, RECORD IF AGE =95+, status? OF ANEMIA MEASUREMENTSwho stayed here last night, household? here? last 98' FOR MONTH. RECORD 95. WOMEN CIRCLE CIRCLEstarting with the head of night? 1 = JORDANIAN 1 = NEVER- ELIGIBLE LINE LINEthe household. SEE CODES IF DON'T KNOW YEAR, RECORD COMPARE AND 2 = EGYPTIAN MARRIED FOR NUMBER NUMBER
BELOW. 9998' FOR YEAR. CORRECT 6A 3 = SYRIAN 2 = MARRIED INDIVIDUAL OF ALL OF ALLAFTER LISTING THE AND/OR 7 IF 4= IRAQI 3 = DIVORCED SURVEY WOMEN CHILDRENNAMES AND RECORDING INCONSISTENT. 5 = OTHER ARAB 4 = WIDOWED (EVER- AGE BORN INTHE RELATIONSHIP 6 = NOT ARAB 5 = SEPARATED MARRIED 15-49. 2007 OR AND SEX FOR EACH 8= DON'T KNOW WOMEN LATER, ORPERSON, ASK AGE 15-49). CHILDRENQUESTIONS 2A-2C AGE 0-5
TO BE SURE THAT THE YEARS
LISTING IS COMPLETE. (IF DATE
OF BIRTH
THEN ASK APPROPRIATE NOT
QUESTIONS IN COLUMNS KNOWN).
5-20 FOR EACH PERSON.
RELATIONSHIPTO HEAD OFHOUSEHOLD
SEX RESIDENCE MARITALSTATUS
CHECK COVER PAGE IF THIS HOUSEHOLD IS SELECTED
FOR ANTHROPOMETRY AND ANEMIA
(1) (2) (6) (9) (10) (11)
M F Y N Y N MONTH YEAR
08 1 2 1 2 1 2 08 08 08
09 1 2 1 2 1 2 09 09 9
10 1 2 1 2 1 2 10 10 10
11 1 2 1 2 1 2 11 11 11
12 1 2 1 2 1 2 12 12 12
13 1 2 1 2 1 2 13 13 13
14 1 2 1 2 1 2 14 14 14
TICK HERE IF CONTINUATION SHEET USED CODES FOR Q. 3: RELATIONSHIP TO HEAD OF HOUSEHOLD
2A) Just to make sure that I have a complete listing. Are there any other 01 = HEAD 06 = PARENT 11 = ADOPTED/persons such as small children or infants that we have not listed? YES NO 02 = WIFE OR HUSBAND 07 = PARENT-IN-LAW FOSTERED CHILD2B) Are there any other people who may not be members of your family, 03 = SON OR DAUGHTER 08 = BROTHER OR SISTER 12 = NOT RELATEDsuch as domestic servants, lodgers, or friends who usually live here? YES NO 04 = STEPSON OR 09 = GRAND FATHER/MOTHER 98 = DON'T KNOW2C) Are there any guests or temporary visitors staying here, or anyone STEPDAUGHTER 10 = OTHER RELATIVEelse who stayed here last night, who have not been listed? YES NO 05 = GRANDCHILD
ADD TO TABLE
(6A)(3) (4) (5) (5A)
ADD TO TABLE
ADD TO TABLE
IN YEARS
(7) (8)
HH-5
• 277Appendix D

IF AGE 0-17 YEARS IF AGE 5 YEARS
OR OLDER
LINE SURVIVORSHIP AND RESIDENCE OF BIOLOGICAL EVER ATTENDED NO. PARENTS SCHOOL
Is Does Is Does Has Can (NAME) What is the What is the Did (NAME)'s (NAME)'s (NAME)'s (NAME)'s (NAME) read and highest level highest grade (NAME)natural natural natural natural ever write? of school (NAME) attendmother alive? mother father alive? father attended (NAME) has completed school usually usually school? attended? at that level? at any IF NO, PROBE:
live in this live in this timehousehold household SEE CODES. SEE CODES. duringor was she or was he thea guest a guest current last night? last night? (2012-13)
schoolIF YES: IF YES: year? 1 = HAS What is What is CERTIFICATEher name? his name? 2 = REGISTEREDRECORD RECORD 3 = NEITHERMOTHER'S FATHER'S 8 = DON'T LINE LINE KNOWNUMBER. NUMBER.
IF NO, IF NO, RECORD RECORD '00'. '00'.
BIRTH
Does (NAME) have a birth certificate?
Has (NAME)'s birth ever been registered with the civil authority?
IF AGE 5-24
YEARS
IF AGE
0-4 YEARS
TRATIONREGIS-
(1) (13) (16) (16A) (17) (17A)
Y N DK Y N DK Y N Y N LEVEL GRADE Y N CODES FOR EDUCATION LEVEL (Qs.17)
08 1 2 8 1 2 8 1 2 1 2 1 2 OLD SYSTEM
01 = OLD ELEMENTARYGO TO 14 GO TO 16 GO TO 17 NEXT LINE 02 = OLD PREPARATORY
09 1 2 8 1 2 8 1 2 1 2 1 2 NEW SYSTEM
04 = NEW BASICGO TO 14 GO TO 16 GO TO 17 NEXT LINE 05 = NEW SECONDARY
10 1 2 8 1 2 8 1 2 1 2 1 2 07 = BACHELOR
08 = HIGHER EDUCATIONGO TO 14 GO TO 16 GO TO 17 NEXT LINE
11 1 2 8 1 2 8 1 2 1 2 1 2 CODES FOR GRADE (Qs.17A)
00 = LESS THAN ONE YEAR COMPLETEDGO TO 14 GO TO 16 GO TO 17 NEXT LINE
12 1 2 8 1 2 8 1 2 1 2 1 2
GO TO 14 GO TO 16 GO TO 17 NEXT LINE
13 1 2 8 1 2 8 1 2 1 2 1 2
GO TO 14 GO TO 16 GO TO 17 NEXT LINE
14 1 2 8 1 2 8 1 2 1 2 1 2
GO TO 14 GO TO 16 GO TO 17 NEXT LINE
(20)
98 = DON'T KNOW
03 = OLD SECONDARY
06 = INTERMEDIATE DIPLOMA
98 = DON'T KNOW
(18)(15)(12) (14)
HH-6
278 • Appendix D

NO. QUESTIONS AND FILTERS SKIP
100 TYPE OF HOUSING UNIT. APARTMENT . . . . . . . . . . . . . . . . . . . . . . 1DAR . . . . . . . . . . . . . . . . . . . . . . . . . . . . 2
RECORD OBSERVATION. VILLA . . . . . . . . . . . . . . . . . . . . . . . . . . . . 3HUT/BARRACK . . . . . . . . . . . . . . . . . . . . 4
OTHER ___________________________ 6(SPECIFY)
101 DAILY . . . . . . . . . . . . . . . . . . . . . . . . . . . . . . 1WEEKLY . . . . . . . . . . . . . . . . . . . . . . . . . . . . 2MONTHLY . . . . . . . . . . . . . . . . . . . . . . . . . . 3LESS THAN MONTHLY . . . . . . . . . . . . . . . . 4NEVER . . . . . . . . . . . . . . . . . . . . . . . . . . . . 5
102 What is the main source of drinking water for members PIPED WATERof your household? PIPED INTO HOUSING UNIT . . . . . . . 11
PIPED TO YARD . . . . . . . . . . . . . . . . . . 12
SPRING . . . . . . . . . . . . . . . . . . . . . . . . . . 21RAINWATER . . . . . . . . . . . . . . . . . . . . . . 31TANKER TRUCK . . . . . . . . . . . . . . . . . . 41BOTTLED WATER . . . . . . . . . . . . . . . . . . 51
OTHER 96(SPECIFY)
105 Do you do anything to the water to make it safer to drink? YES . . . . . . . . . . . . . . . . . . . . . . . . . . . . . . 1NO . . . . . . . . . . . . . . . . . . . . . . . . . . . . . . 2DON'T KNOW . . . . . . . . . . . . . . . . . . . . 8 107
106 What do you usually do to make the water safer to drink? BOIL . . . . . . . . . . . . . . . . . . . . . . . . . . . . AADD BLEACH/CHLORINE . . . . . . . . . B
Anything else? USE WATER FILTER . . . . . . . . . . . . C
RECORD ALL MENTIONED. OTHER X(SPECIFY)
DON'T KNOW . . . . . . . . . . . . . . . . . . . . Z
107 What kind of toilet facility do members of your FLUSH OR POUR FLUSH TOILET household usually use? FLUSH TO PIPED SEWER
SYSTEM . . . . . . . . . . . . . . . . . . . . 11IF FLUSH TOILET: FLUSH TO PIT LATRINE . . . . . . . . . 12Is your toilet connected to a public sewer system, a FLUSH TO SOMEWHERE ELSE . . . 13septic tank, a pit latrine or somewhere else? PIT LATRINE
VENTILATED IMPROVEDPIT LATRINE . . . . . . . . . . . . . . . . . . 21
PIT LATRINE WITH SLAB . . . . . . . . . 22PIT LATRINE WITHOUT SLAB/
OPEN PIT . . . . . . . . . . . . . . . . . . . . 23NO FACILITY/BUSH/FIELD . . . . . . . . . 61 109A
OTHER 96(SPECIFY)
108 YES . . . . . . . . . . . . . . . . . . . . . . . . . . . . . . . . 1NO . . . . . . . . . . . . . . . . . . . . . . . . . . . . . . . . 2 109A
109 NO. OF HOUSEHOLDSIF LESS THAN 10 . . . . . . . . .
10 OR MORE HOUSEHOLDS . . . . . . . 95DON'T KNOW . . . . . . . . . . . . . . . . . . . . 98
HOUSING UNIT AND HOUSEHOLD CHARACTERISTICS
Do you share this toilet facility with other households?
How many households use this toilet facility? 0
CODING CATEGORIES
How often does anyone smoke cigarette/nargila
Would you say daily, weekly, monthly, less than monthly, or never?
inside your house?
HH-7• 279Appendix D

NO. QUESTIONS AND FILTERS SKIPCODING CATEGORIES
109A Is your house connected with electricity? YES . . . . . . . . . . . . . . . . . . . . . . . . . . . . . . 1NO . . . . . . . . . . . . . . . . . . . . . . . . . . . . . . 2
109B Does your household have a bed or sofa bed?
IF YES: How many beds or sofa beds does your household have? NUMBER OF BEDS . . . . . . . . . . . . . .
IF NONE, RECORD '0'. IF 7 OR MORE, RECORD 7.
110 Does your household have: YES NO
A radio/tape recorder? RADIO/TAPE RECORDER . 1 2A television? TELEVISION . . . . . . . . . . . . . . 1 2Satellite? SATELLITE . . . . . . . . . . . . . . . . 1 2A land telephone? LAND TELEPHONE . . . . . . . 1 2A refrigerator? REFRIGERATOR . . . . . . . . . 1 2A freezer? FREEZER . . . . . . . . . . . . . . . . 1 2A washing machine? WASHING MACHINE . . . . . 1 2A dish washer? DISH WASHER . . . . . . . . . 1 2Solar heater? SOLAR HEATER . . . . . . . . . 1 2Air conditioner? AIR CONDITIONER . . . . . . . 1 2Fan? FAN . . . . . . . . . . . . . . . . . . . . 1 2Water cooler? WATER COOLER . . . . . . . 1 2Microwave? MICROWAVE . . . . . . . . . . . . 1 2Digital camera? DIGITAL CAMERA . . . . . . . 1 2
110A Does your household have a computer?
IF YES: How many?IF NONE, RECORD '0'. IF 7 OR MORE, RECORD 7. NUMBER OF COMPUTERS . . . . . . . . .
110B Does your household have a mobile?
IF YES: How many?IF NONE, RECORD '0'. IF 7 OR MORE, RECORD 7. NUMBER OF MOBILES . . . . . . . . . . . .
110C CHECK 110A and 110B:
110A OR 110B = 1 OR MORE 110A AND 110B = 0111
110D Do you have internet access at home? YES . . . . . . . . . . . . . . . . . . . . . . . . . . . . . . 1NO . . . . . . . . . . . . . . . . . . . . . . . . . . . . . . 2
111 What type of fuel does your household mainly use ELECTRICITY . . . . . . . . . . . . . . . . . . . . . . 1for cooking? NATURAL GAS . . . . . . . . . . . . . . . . . . . . 2
KEROSENE . . . . . . . . . . . . . . . . . . . . . . 3COAL/WOOD . . . . . . . . . . . . . . . . . . . . 4
OTHER 6(SPECIFY)
113 Do you have a separate room which is used as a kitchen? YES . . . . . . . . . . . . . . . . . . . . . . . . . . . . . . 1NO . . . . . . . . . . . . . . . . . . . . . . . . . . . . . . 2
113A Do you have an independent bathroom? YES . . . . . . . . . . . . . . . . . . . . . . . . . . . . . . 1NO . . . . . . . . . . . . . . . . . . . . . . . . . . . . . . 2
114 MAIN MATERIAL OF THE FLOOR. NATURAL FLOOREARTH . . . . . . . . . . . . . . . . . . . . . . . . 11
FINISHED FLOORPARQUET OR POLISHED
WOOD . . . . . . . . . . . . . . . . . . . . . . 31TILE . . . . . . . . . . . . . . . . . . . . . . . . . . 32MARBLE/CERAMIC TILES . . . . . . . 33CEMENT . . . . . . . . . . . . . . . . . . . . . . 34
OTHER 96(SPECIFY)
HH-8280 • Appendix D

NO. QUESTIONS AND FILTERS SKIPCODING CATEGORIES
115 MAIN MATERIAL OF THE ROOF RUDIMENTARYMUD BRICKS . . . . . . . . . . . . . . . . . . . . 21
RECORD OBSERVATION. MUD BRICKS WITH STONES . . . . . 22ASBESTOS/WOOD/ZINC . . . . . . . . . 23
FINISHEDCONCRETE . . . . . . . . . . . . . . . . . . . . 31
HAIR/WOOL/CLOTH . . . . . . . . . . . . . . . . 41
OTHER 96(SPECIFY)
116 MAIN MATERIAL OF THE EXTERIOR WALLS. RUDIMENTARYMUD BRICKS . . . . . . . . . . . . . . . . . . . . 21
RECORD OBSERVATION. MUD BRICKS WITH STONES . . . . . 22ASBESTOS/WOOD/ZINC . . . . . . . . . 23
FINISHEDCEMENT BRICKS . . . . . . . . . . . . . . . . 31CUT STONES . . . . . . . . . . . . . . . . . . 32CUT STONES AND CONCRETE . . . . . 33CONCRETE . . . . . . . . . . . . . . . . . . 34
HAIR/WOOL/CLOTH . . . . . . . . . . . . . . . . 41OTHER 96
(SPECIFY)
116A How many rooms do you have in your house?NUMBER OF ROOMS . . . . . . .
117 How many rooms in this household are used forsleeping? ROOMS FOR SLEEPING . . .
118 Does your household own a private car or pickup?
IF YES: How many?IF NONE, RECORD '0'. IF 7 OR MORE, RECORD 7. NUMBER OF CARS/PICKUPS . . . . . . .
123A Does any member of this household have a credit card? YES . . . . . . . . . . . . . . . . . . . . . . . . . . . . . . 1NO . . . . . . . . . . . . . . . . . . . . . . . . . . . . . . 2
HH-9• 281Appendix D

141 CHECK THE COVER PAGE:
CONTINUE END OF HOUSEHOLD QUESTIONNAIRE
142 CHECK HOUSEHOLD SCHEDULE, COLUMN 6A:
NO CHILDREN AGE 2-14 163
____________
____________
____________
____________
____________
____________
____________
____________
148 CHECK COLUMN 146:
ONLY ONE CHILDAGE 2-14 149
03
02
01
143
RANK NUMBER
145
NAME OF THE CHILD FROM COLUMN 2 IN THE HOUSEHOLD SCHEDULE
146
CHILD'S AGE FROM
COLUMN 6A
CHILD DISCIPLINE
147
WRITE PARENT'S OR CARETAKER'S LINE
NUMBER/NAME FROM COLUMN 13, 15 OR 1 IN THE
HOUSEHOLD SCHEDULE
MORE THAN ONE CHILD AGE 2-14:
THE HOUSEHOLD IS SELECTED FOR ANTHROPOMETRY, ANEMIA, DOMESTIC
VIOLENCE AND CHILD DISCIPLINE
THE HOUSEHOLD IS NOT SELECTED FOR ANTHROPOMETRY, ANEMIA, DOMESTIC
VIOLENCE AND CHILD DISCIPLINE
AT LEAST ONE CHILD AGE 2-14
08
07
06
LIST EACH OF THE CHILDREN AGED 2-14 YEARS BELOW IN THE ORDER THEY APPEAR IN THE HOUSEHOLD SCHEDULE.DO NOT INCLUDE OTHER HOUSEHOLD MEMBERS OUTSIDE OF THE AGE RANGE 2-14 YEARS.
05
144
LINE NUMBER
FROM COLUMN 1 IN HOUSEHOLD SCHEDULE
04
HH-10282 • Appendix D

LAST DIGIT OF THE QUESTIONNAIRE
NUMBER
- LOOK AT THE LAST DIGIT OF THE QUESTIONNAIRE NUMBER ON THE COVER PAGE. THIS IS THE ROW NUMBER YOU SHOULD CIRCLE. - LOOK AT COLUMN 146 AND RECORD THE TOTAL NUMBER OF ELIGIBLE CHILDREN AGE 2-14_________. THIS IS THE COLUMN NUMBER YOU SHOULD CIRCLE. - IF THERE ARE MORE THAN 8 ELIGIBLE CHILDREN IN THE HOUSEHOLD, CIRCLE ‘8’ IN THE ROW AT THE TOP OF THE TABLE. - FIND THE BOX WHERE THE CIRCLED ROW AND THE CIRCLED COLUMN MEET AND CIRCLE THE NUMBER THAT APPEARS IN THE BOX. THIS IS THE RANK NUMBER OF THE ELIGIBLE CHILD WHOSE PARENT OR CARETAKER WILL BE ASKED THE QUESTIONS ON CHILD DISCIPLINE. - THEN, GO TO COLUMN 144 AND PUT A * NEXT TO THE HOUSEHOLD LINE NUMBER OF THE SELECTED CHILD AND RECORD CHILD'S HOUSEHOLD LINE NUMBER AND NAME IN Q.149 AND RECORD CHILD'S PARENT OR OTHER MOST KNOWLEDGEABLE ADULT'S NAME AND LINE NUMBER IN Q.150.
TOTAL NUMBER OF CHILDREN AGE 2-14 IN THE HOUSEHOLD
1 2 3 4 5 6 7 8+
RANDOM NUMBER TABLE FOR SELECTION OF CHILDREN FOR THE CHILD DISCIPLINE QUESTIONS
FOR EXAMPLE , IF THE HOUSEHOLD QUESTIONNAIRE NUMBER IS ‘0716’, GO TO ROW 6 AND CIRCLE THE ROW NUMBER ('6').- IF THERE ARE THREE ELIGIBLE CHILDREN IN THE HOUSEHOLD, GO TO COLUMN 3 AND CIRCLE THE COLUMN NUMBER ('3'). - DRAW LINES FROM ROW 6 AND COLUMN 3 AND FIND THE BOX WHERE THE TWO MEET, AND CIRCLE THE NUMBER IN IT (‘2'). THIS MEANS YOU HAVE TO SELECT THE SECOND ELIGIBLE CHILD. - SUPPOSE THE HOUSEHOLD LINE NUMBERS OF THE THREE ELIGIBLE CHILDREN ARE ‘02', ‘03', AND ‘07’; THEN THE ELIGIBLE CHILD FOR THE QUESTIONS ON CHILD DISCIPLINE IS THE SECOND ELIGIBLE CHILD, I.E., THE CHILD WITH HOUSEHOLD LINE NUMBER ‘03'. - PUT A * NEXT TO THIS CHILD'S LINE NUMBER IN COLUMN 144 AND ALSO ENTER THE TWO DIGIT LINE NUMBER AND CHILD'S NAME IN Q.149. - THEN, RECORD THE LINE NUMBER AND A NAME OF CHILD'S PARENT OR OTHER MOST KNOWLEDGEABLE ADULT IN Q.150.
0 1 2 2 4 3 6 5 4
1 1 1 3 1 4 1 6 5
2 1 2 1 2 5 2 7 6
3 1 1 2 3 1 3 1 7
4 1 2 3 4 2 4 2 8
5 1 1 1 1 3 5 3 1
6 1 2 2 2 4 6 4 2
7 1 1 3 3 5 1 5 3
2 1 4 1
2 1
2 6 4
7 52
8 1
39 1 1
HH-11• 283Appendix D

NO. QUESTIONS AND FILTERS
149 LINENUMBER . . . . . . . . . . . . . . . . . . .
NAME
150 MOTHER/CARETAKER NOTAVAILABLE . . . . . . . . . . . 00 163
LINENUMBER . . . . . . . . . . . . . . . . . . .
NAME
THE FOLLOWING QUESTIONS 150-161 ON CHILD DISCIPLINE ARE TO BE ADMINISTERED ONLY TO THE MOST KNOWLEDGEABLE ADULT (MOTHER, FATHER, OTHER PRIMARY CARETAKER OR A GUARDIAN OF A CHILD).
All adults use certain ways to teach or to address a behavior problem. I will read various methods that are used. I want you to tell me if you or anyone else in the household has used this method with (NAME) in the past month.
151 Took away privileges, forbade something (NAME) liked or YES . . . . . . . . . . . . . . . . . . . . . . . . . . . . . . 1did not allow him/her to leave the house (in the past month)? NO . . . . . . . . . . . . . . . . . . . . . . . . . . . . . . 2
152 YES . . . . . . . . . . . . . . . . . . . . . . . . . . . . . . 1NO . . . . . . . . . . . . . . . . . . . . . . . . . . . . . . 2
153 Shook him/her (in the past month)? YES . . . . . . . . . . . . . . . . . . . . . . . . . . . . . . 1NO . . . . . . . . . . . . . . . . . . . . . . . . . . . . . . 2
154 Shouted, yelled or screamed at (NAME) in the past month? YES . . . . . . . . . . . . . . . . . . . . . . . . . . . . . . 1NO . . . . . . . . . . . . . . . . . . . . . . . . . . . . . . 2
155 Gave him/her something else to do (in the past month)? YES . . . . . . . . . . . . . . . . . . . . . . . . . . . . . . 1NO . . . . . . . . . . . . . . . . . . . . . . . . . . . . . . 2
156 Spanked, hit or slapped him/her on the bottom with bare YES . . . . . . . . . . . . . . . . . . . . . . . . . . . . . . 1hand (in the past month)? NO . . . . . . . . . . . . . . . . . . . . . . . . . . . . . . 2
157 Hit him/her on the bottom or elsewhere on the body with YES . . . . . . . . . . . . . . . . . . . . . . . . . . . . . . 1something like a belt, hairbrush, stick or other NO . . . . . . . . . . . . . . . . . . . . . . . . . . . . . . 2(in the past month) ?
158 Called him/her dumb, lazy, or a similar name YES . . . . . . . . . . . . . . . . . . . . . . . . . . . . . . 1(in the past month)? NO . . . . . . . . . . . . . . . . . . . . . . . . . . . . . . 2
159 YES . . . . . . . . . . . . . . . . . . . . . . . . . . . . . . 1NO . . . . . . . . . . . . . . . . . . . . . . . . . . . . . . 2
160 YES . . . . . . . . . . . . . . . . . . . . . . . . . . . . . . 1NO . . . . . . . . . . . . . . . . . . . . . . . . . . . . . . 2
161 YES . . . . . . . . . . . . . . . . . . . . . . . . . . . . . . 1NO . . . . . . . . . . . . . . . . . . . . . . . . . . . . . . 2
162 YES . . . . . . . . . . . . . . . . . . . . . . . . . . . . . . 1NO . . . . . . . . . . . . . . . . . . . . . . . . . . . . . . 2DON'T KNOW . . . . . . . . . . . . . . . . . . . . . . 8
Do you believe that in order to bring up (raise, educate) (NAME) properly, you need to physically punish him/her?
LINE NUMBER AND NAME OF CHILD'S MOTHER, FATHER OR OTHER PRIMARY CARETAKER FROM COLUMN 147
CODING CATEGORIES
Explained why some behavior was wrong (in the past month)?
Hit or slapped him/her on the face, head or ears (in the past month)?
Hit or slapped him/her on the hand, arm or leg (in the past month)?
Beat her/him up with an implement (hit over and over as hard as one could) (in the past month)?
LINE NUMBER AND NAME OF THE SELECTED CHILD AGE 2-14 YEARS FROM COLUMNS 144 AND 145
HH-12284 • Appendix D

163 CHECK HOUSEHOLD SCHEDULE, COLUMN 6A:
164
NO EVER-MARRIED WOMEN AGE 15-49 201
164 NAME OF SELECTED WOMAN
HH LINE NUMBER OF SELECTED WOMAN . . . . . . .
- LOOK AT THE LAST DIGIT OF THE QUESTIONNAIRE NUMBER ON THE COVER PAGE. THIS IS THE ROW NUMBER YOU SHOULD CIRCLE. - LOOK AT COLUMN 9 AND RECORD THE TOTAL NUMBER OF ELIGIBLE WOMEN_________. THIS IS THE COLUMN NUMBER YOU SHOULD CIRCLE. - IF THERE ARE MORE THAN 8 ELIGIBLE CHILDREN IN THE HOUSEHOLD, CIRCLE ‘8’ IN THE ROW AT THE TOP OF THE TABLE. - FIND THE BOX WHERE THE CIRCLED ROW AND THE CIRCLED COLUMN MEET AND CIRCLE THE NUMBER THAT APPEARS IN THE BOX. THIS IS THE RANK NUMBER OF THE ELIGIBLE WOMAN WHO WILL BE ASKED THE DOMESTIC VIOLENCE MODULE. - N COLUMN 9 OF THE HOUSEHOLD SCHEDULE, PUT A * NEXT TO THE HOUSEHOLD LINE NUMBER OF THE SELECTED WOMAN IN THAT POSITION.
EXAMPLE: THE HOUSEHOLD QUESTIONNAIRE NUMBER IS ‘716’ AND THE HOUSEHOLD SCHEDULE COLUMN 9 SHOWS THAT THERE ARE THREE ELIGIBLE WOMEN AGE 15-49 IN THE HOUSEHOLD (LINE NUMBERS 02, 04, AND 05). SINCE THE LAST DIGIT OF THE HOUSEHOLD SERIAL NUMBER IS '6' GO TO ROW '6' AND SINCE THERE ARE THREE ELIGIBLE WOMEN IN THE HOUSEHOLD, GO TO COLUMN '3’. FOLLOW THE ROW AND COLUMN AND FIND THE NUMBER IN THE CELL WHERE THEY MEET (‘2') AND CIRCLE THE NUMBER. NOW GO TO THE HOUSEHOLD SCHEDULE AND FIND THE SECOND WOMAN WHO IS ELIGIBLE FOR THE DOMESTIC VIOLENCE MODULE (LINE NUMBER '04' IN THIS EXAMPLE). WRITE HER NAME AND LINE NUMBER IN THE SPACE BELOW THE TABLE (Q.164).
LAST DIGIT OF THE HOUSEHOLD
QUESTIONNAIRE SERIAL NUMBER
TOTAL NUMBER OF ELIGIBLE EVER-MARRIED WOMEN AGE 15-49 IN HOUSEHOLD SCHEDULE COLUMN 9
1 2 3 4 5 6 7 8
0 1 2 2 4 3 6 5 4
1 1 1 3 1 4 1 6 5
2 1 2 1 2 5 2 7 6
3 1 1 2 3 1 3 1 7
4 1 2 3 4 2 4 2 8
5 1 1 1 1 3 5 3 1
6 1 2 2 2 4 6 4 2
7 1 1 3 3 5 1 5 3
8 1 2 1 4 1
1 1 2 1 2 3 7 5
TABLE FOR SELECTION OF WOMEN FOR THE DOMESTIC VIOLENCE QUESTIONS
LIST OF EVER-MARRIED WOMEN AGE 15-49
MORE THAN ONE EVER-MARRIED WOMEN AGE 15-49
ONLY ONE EVER-MARRIED WOMEN AGE 15-49
2 6 4
9
HH-13• 285Appendix D
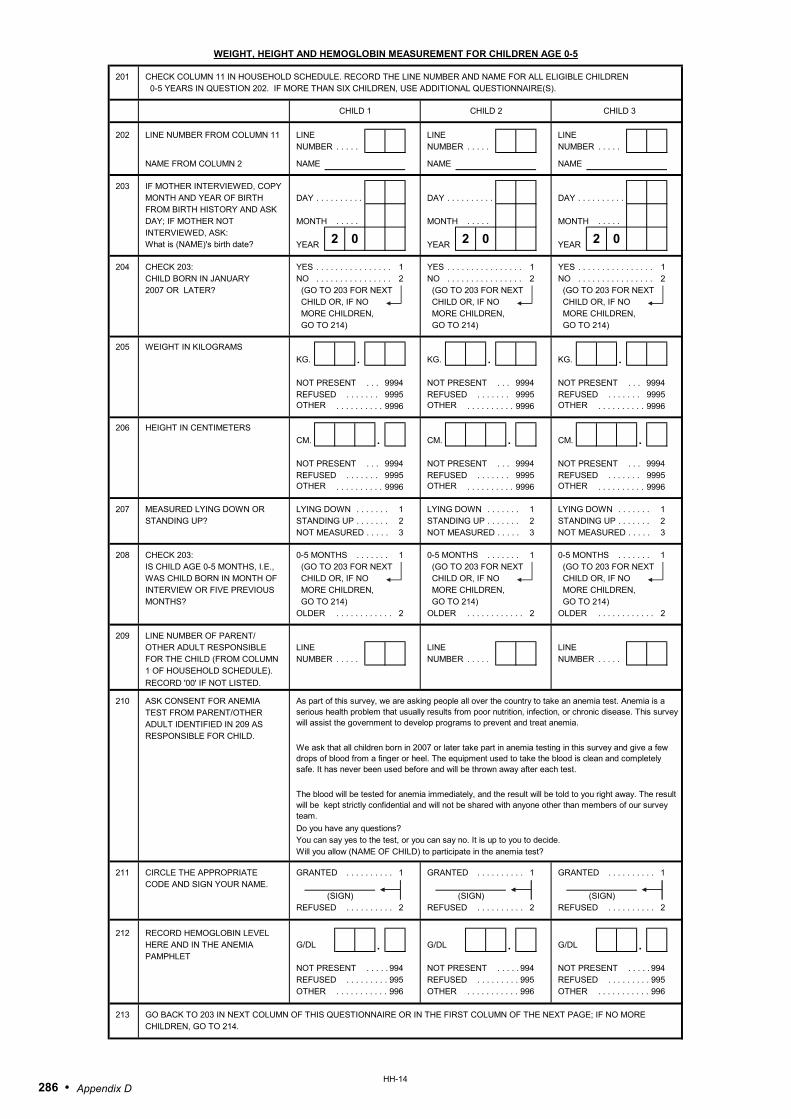
WEIGHT, HEIGHT AND HEMOGLOBIN MEASUREMENT FOR CHILDREN AGE 0-5
201 CHECK COLUMN 11 IN HOUSEHOLD SCHEDULE. RECORD THE LINE NUMBER AND NAME FOR ALL ELIGIBLE CHILDREN 0-5 YEARS IN QUESTION 202. IF MORE THAN SIX CHILDREN, USE ADDITIONAL QUESTIONNAIRE(S).
CHILD 1 CHILD 2 CHILD 3
202 LINE NUMBER FROM COLUMN 11 LINE LINE LINENUMBER . . . . . NUMBER . . . . . NUMBER . . . . .
NAME FROM COLUMN 2 NAME NAME NAME
203 IF MOTHER INTERVIEWED, COPYMONTH AND YEAR OF BIRTH DAY . . . . . . . . . . DAY . . . . . . . . . . DAY . . . . . . . . . . FROM BIRTH HISTORY AND ASK DAY; IF MOTHER NOT MONTH . . . . . MONTH . . . . . MONTH . . . . . INTERVIEWED, ASK:
YEAR YEAR YEAR
204 CHECK 203: YES . . . . . . . . . . . . . . . . 1 YES . . . . . . . . . . . . . . . . 1 YES . . . . . . . . . . . . . . . . 1CHILD BORN IN JANUARY NO . . . . . . . . . . . . . . . . 2 NO . . . . . . . . . . . . . . . . 2 NO . . . . . . . . . . . . . . . . 22007 OR LATER? (GO TO 203 FOR NEXT (GO TO 203 FOR NEXT (GO TO 203 FOR NEXT
CHILD OR, IF NO CHILD OR, IF NO CHILD OR, IF NO MORE CHILDREN, MORE CHILDREN, MORE CHILDREN, GO TO 214) GO TO 214) GO TO 214)
205 WEIGHT IN KILOGRAMSKG. . KG. . KG. .
NOT PRESENT . . . 9994 NOT PRESENT . . . 9994 NOT PRESENT . . . 9994REFUSED . . . . . . . 9995 REFUSED . . . . . . . 9995 REFUSED . . . . . . . 9995OTHER . . . . . . . . . . 9996 OTHER . . . . . . . . . . 9996 OTHER . . . . . . . . . . 9996
206 HEIGHT IN CENTIMETERSCM. . CM. . CM. .
NOT PRESENT . . . 9994 NOT PRESENT . . . 9994 NOT PRESENT . . . 9994REFUSED . . . . . . . 9995 REFUSED . . . . . . . 9995 REFUSED . . . . . . . 9995OTHER . . . . . . . . . . 9996 OTHER . . . . . . . . . . 9996 OTHER . . . . . . . . . . 9996
207 MEASURED LYING DOWN OR LYING DOWN . . . . . . . 1 LYING DOWN . . . . . . . 1 LYING DOWN . . . . . . . 1STANDING UP? STANDING UP . . . . . . . 2 STANDING UP . . . . . . . 2 STANDING UP . . . . . . . 2
NOT MEASURED . . . . . 3 NOT MEASURED . . . . . 3 NOT MEASURED . . . . . 3
208 CHECK 203: 0-5 MONTHS . . . . . . . 1 0-5 MONTHS . . . . . . . 1 0-5 MONTHS . . . . . . . 1IS CHILD AGE 0-5 MONTHS, I.E., (GO TO 203 FOR NEXT (GO TO 203 FOR NEXT (GO TO 203 FOR NEXTWAS CHILD BORN IN MONTH OF CHILD OR, IF NO CHILD OR, IF NO CHILD OR, IF NO INTERVIEW OR FIVE PREVIOUS MORE CHILDREN, MORE CHILDREN, MORE CHILDREN, MONTHS? GO TO 214) GO TO 214) GO TO 214)
OLDER . . . . . . . . . . . . 2 OLDER . . . . . . . . . . . . 2 OLDER . . . . . . . . . . . . 2
209 LINE NUMBER OF PARENT/OTHER ADULT RESPONSIBLE LINE LINE LINEFOR THE CHILD (FROM COLUMN NUMBER . . . . . NUMBER . . . . . NUMBER . . . . . 1 OF HOUSEHOLD SCHEDULE).RECORD '00' IF NOT LISTED.
210 ASK CONSENT FOR ANEMIA TEST FROM PARENT/OTHER ADULT IDENTIFIED IN 209 AS RESPONSIBLE FOR CHILD.
211 CIRCLE THE APPROPRIATE GRANTED . . . . . . . . . . 1 GRANTED . . . . . . . . . . 1 GRANTED . . . . . . . . . . 1CODE AND SIGN YOUR NAME.
(SIGN) (SIGN) (SIGN)REFUSED . . . . . . . . . . 2 REFUSED . . . . . . . . . . 2 REFUSED . . . . . . . . . . 2
212 RECORD HEMOGLOBIN LEVEL HERE AND IN THE ANEMIA G/DL . G/DL . G/DL .PAMPHLET
NOT PRESENT . . . . . 994 NOT PRESENT . . . . . 994 NOT PRESENT . . . . . 994REFUSED . . . . . . . . . . 995 REFUSED . . . . . . . . . . 995 REFUSED . . . . . . . . . . 995OTHER . . . . . . . . . . . . 996 OTHER . . . . . . . . . . . . 996 OTHER . . . . . . . . . . . . 996
213 GO BACK TO 203 IN NEXT COLUMN OF THIS QUESTIONNAIRE OR IN THE FIRST COLUMN OF THE NEXT PAGE; IF NO MORECHILDREN, GO TO 214.
Will you allow (NAME OF CHILD) to participate in the anemia test?
2 0 2 0 2 0What is (NAME)'s birth date?
We ask that all children born in 2007 or later take part in anemia testing in this survey and give a few drops of blood from a finger or heel. The equipment used to take the blood is clean and completely safe. It has never been used before and will be thrown away after each test.
The blood will be tested for anemia immediately, and the result will be told to you right away. The result will be kept strictly confidential and will not be shared with anyone other than members of our survey team.Do you have any questions?You can say yes to the test, or you can say no. It is up to you to decide.
As part of this survey, we are asking people all over the country to take an anemia test. Anemia is a serious health problem that usually results from poor nutrition, infection, or chronic disease. This survey will assist the government to develop programs to prevent and treat anemia.
HH-14286 • Appendix D

CHILD 4 CHILD 5 CHILD 6
202 LINE NUMBER FROM COLUMN 11 LINE LINE LINENUMBER . . . . . NUMBER . . . . . NUMBER . . . . .
NAME FROM COLUMN 2 NAME NAME NAME
203 IF MOTHER INTERVIEWED, COPYMONTH AND YEAR OF BIRTH DAY . . . . . . . . . . DAY . . . . . . . . . . DAY . . . . . . . . . . FROM BIRTH HISTORY AND ASK DAY; IF MOTHER NOT MONTH . . . . . MONTH . . . . . MONTH . . . . . INTERVIEWED, ASK:
YEAR YEAR YEAR
204 CHECK 203: YES . . . . . . . . . . . . . . . . 1 YES . . . . . . . . . . . . . . . . 1 YES . . . . . . . . . . . . . . . . 1CHILD BORN IN JANUARY NO . . . . . . . . . . . . . . . . 2 NO . . . . . . . . . . . . . . . . 2 NO . . . . . . . . . . . . . . . . 22007 OR LATER? (GO TO 203 FOR NEXT (GO TO 203 FOR NEXT (GO TO 203 IN FIRST
CHILD OR, IF NO CHILD OR, IF NO COLUMN OF NEW MORE CHILDREN, MORE CHILDREN, QUESTIONNAIRE; OR, GO TO 214) GO TO 214) IF NO MORE CHILDREN,
GO TO 214)
205 WEIGHT IN KILOGRAMSKG. . KG. . KG. .
NOT PRESENT. . . . . 9994 NOT PRESENT. . . . . 9994 NOT PRESENT. . . . . 9994REFUSED . . . . . . . 9995 REFUSED . . . . . . . 9995 REFUSED . . . . . . . 9995OTHER . . . . . . . . . . 9996 OTHER . . . . . . . . . . 9996 OTHER . . . . . . . . . . 9996
206 HEIGHT IN CENTIMETERSCM. . CM. . CM. .
NOT PRESENT . . . 9994 NOT PRESENT . . . 9994 NOT PRESENT . . . 9994REFUSED . . . . . . . 9995 REFUSED . . . . . . . 9995 REFUSED . . . . . . . 9995OTHER . . . . . . . . . . 9996 OTHER . . . . . . . . . . 9996 OTHER . . . . . . . . . . 9996
207 MEASURED LYING DOWN OR LYING DOWN . . . . . . . 1 LYING DOWN . . . . . . . 1 LYING DOWN . . . . . . . 1STANDING UP? STANDING UP . . . . . . . 2 STANDING UP . . . . . . . 2 STANDING UP . . . . . . . 2
NOT MEASURED . . . . . 3 NOT MEASURED . . . . . 3 NOT MEASURED . . . . . 3
208 CHECK 203: 0-5 MONTHS . . . . . . . 1 0-5 MONTHS . . . . . . . 1 0-5 MONTHS . . . . . . . 1IS CHILD AGE 0-5 MONTHS, I.E., (GO TO 203 FOR NEXT (GO TO 203 FOR NEXT (GO TO 203 IN FIRSTWAS CHILD BORN IN MONTH OF CHILD OR, IF NO CHILD OR, IF NO COLUMN OF NEW INTERVIEW OR FIVE PREVIOUS MORE CHILDREN, MORE CHILDREN, QUESTIONNAIRE; OR,MONTHS? GO TO 214) GO TO 214) IF NO MORE CHILDREN,
GO TO 214)OLDER . . . . . . . . . . . . 2 OLDER . . . . . . . . . . . . 2 OLDER . . . . . . . . . . . . 2
209 LINE NUMBER OF PARENT/OTHER ADULT RESPONSIBLE LINE LINE LINEFOR THE CHILD (FROM COLUMN NUMBER . . . . . NUMBER . . . . . NUMBER . . . . . 1 OF HOUSEHOLD SCHEDULE).RECORD '00' IF NOT LISTED.
210 ASK CONSENT FOR ANEMIA TEST FROM PARENT/OTHER ADULT IDENTIFIED IN 209 AS RESPONSIBLE FOR CHILD.
211 CIRCLE THE APPROPRIATE GRANTED . . . . . . . . . . 1 GRANTED . . . . . . . . . . 1 GRANTED . . . . . . . . . . 1CODE AND SIGN YOUR NAME.
(SIGN) (SIGN) (SIGN)REFUSED . . . . . . . . . . 2 REFUSED . . . . . . . . . . 2 REFUSED . . . . . . . . . . 2
212 RECORD HEMOGLOBIN LEVEL HERE AND IN THE ANEMIA G/DL . G/DL . G/DL .PAMPHLET.
NOT PRESENT. . . . . . . 994 NOT PRESENT. . . . . . . 994 NOT PRESENT. . . . . . . 994REFUSED . . . . . . . . . . 995 REFUSED . . . . . . . . . . 995 REFUSED . . . . . . . . . . 995OTHER . . . . . . . . . . . . 996 OTHER . . . . . . . . . . . . 996 OTHER . . . . . . . . . . . . 996
213 GO BACK TO 203 IN NEXT COLUMN OF THIS QUESTIONNAIRE OR IN THE FIRST COLUMN OF THE NEXT PAGE; IF NO MORECHILDREN, GO TO 214.
Will you allow (NAME OF CHILD) to participate in the anemia test?
2 0 2 0 2 0What is (NAME)'s birth date?
We ask that all children born in 2007 or later take part in anemia testing in this survey and give a few drops of blood from a finger or heel. The equipment used to take the blood is clean and completely safe. It has never been used before and will be thrown away after each test.
The blood will be tested for anemia immediately, and the result told to you right away. The result will be kept strictly confidential and will not be shared with anyone other than members of our survey team.
Do you have any questions?You can say yes to the test, or you can say no. It is up to you to decide.
As part of this survey, we are asking people all over the country to take an anemia test. Anemia is a serious health problem that usually results from poor nutrition, infection, or chronic disease. This survey will assist the government to develop programs to prevent and treat anemia.
HH-15
• 287Appendix D

WEIGHT, HEIGHT AND HEMOGLOBIN MEASUREMENT TESTING FOR WOMEN AGE 15-49
214 CHECK COLUMN 10. RECORD THE LINE NUMBER AND NAME FOR ALL ELIGIBLE WOMEN IN 215.IF THERE ARE MORE THAN THREE WOMEN, USE ADDITIONAL QUESTIONNAIRE(S).
WOMAN 1 WOMAN 2 WOMAN 3
215 LINE NUMBER LINE LINE LINE(COLUMN 10) NUMBER . . . . . . . . . . NUMBER . . . . . . . . . . . . NUMBER . . . . . . . . . . . .
NAME(COLUMN 2) NAME NAME NAME
216 WEIGHT IN KILOGRAMS KG. . KG. . KG. .
NOT PRESENT . . . . . . . . . . 99994 NOT PRESENT . . . . . . . . . . 99994 NOT PRESENT . . . . . . . . . . 99994REFUSED . . . . . . . . . . . . . . 99995 REFUSED . . . . . . . . . . . . . . 99995 REFUSED . . . . . . . . . . . . . . 99995OTHER . . . . . . . . . . . . . . . . . 99996 OTHER . . . . . . . . . . . . . . . . . 99996 OTHER . . . . . . . . . . . . . . . . . 99996
217 HEIGHT IN CENTIMETERS CM. . CM. . CM. .
NOT PRESENT . . . . . . . . . . . . 9994 NOT PRESENT . . . . . . . . . . . . 9994 NOT PRESENT . . . . . . . . . . . . 9994REFUSED . . . . . . . . . . . . . . . . . 9995 REFUSED . . . . . . . . . . . . . . . . . 9995 REFUSED . . . . . . . . . . . . . . . . . 9995OTHER . . . . . . . . . . . . . . . . . . . 9996 OTHER . . . . . . . . . . . . . . . . . . . 9996 OTHER . . . . . . . . . . . . . . . . . . . 9996
218 AGE: CHECK 15-17 YEARS . . . . . . . . . . . . . . . . . 1 15-17 YEARS . . . . . . . . . . . . . . . . . 1 15-17 YEARS . . . . . . . . . . . . . . . . . 1COLUMN 6A. 18-49 YEARS . . . . . . . . . . . . . . . . . 2 18-49 YEARS . . . . . . . . . . . . . . . . . 2 18-49 YEARS . . . . . . . . . . . . . . . . . 2
(GO TO 223) (GO TO 223) (GO TO 223)
219 MARITAL STATUS: CODE 4 (NEVER IN UNION) . . . . . . 1 CODE 4 (NEVER IN UNION) . . . . . . 1 CODE 4 (NEVER IN UNION) . . . . . . 1 CHECK COLUMN 8. OTHER . . . . . . . . . . . . . . . . . . . . . 2 OTHER . . . . . . . . . . . . . . . . . . . . . 2 OTHER . . . . . . . . . . . . . . . . . . . . . 2
(GO TO 223) (GO TO 223) (GO TO 223)
220 RECORD LINENUMBER OF PARENT/OTHERADULT RESPON-SIBLE FOR LINE NUMBER OF LINE NUMBER OF LINE NUMBER OFADOLESCENT. PARENT OR OTHER PARENT OR OTHER PARENT OR OTHERRECORD '00' RESPONSIBLE ADULT RESPONSIBLE ADULT RESPONSIBLE ADULTIF NOT LISTED.
221 ASK CONSENTFORANEMIA TESTFROM PARENT/OTHER ADULTIDENTIFIED IN 220AS RESPONSIBLEFOR NEVER IN UNIONWOMEN AGE 15-17.
222 CIRCLE THE GRANTED . . . . . . . . . . . . . . . . . . . 1 GRANTED . . . . . . . . . . . . . . . . . . . 1 GRANTED . . . . . . . . . . . . . . . . . . . 1APPROPRIATE PARENT/OTHER RESPONSIBLE PARENT/OTHER RESPONSIBLE PARENT/OTHER RESPONSIBLECODE AND ADULT REFUSED . . . . . . . . . . . . 2 ADULT REFUSED . . . . . . . . . . . . 2 ADULT REFUSED . . . . . . . . . . . . 2SIGNYOUR NAME.
(SIGN) (SIGN) (SIGN)
(IF REFUSED, GO TO 240) (IF REFUSED, GO TO 242) (IF REFUSED, GO TO 242)
As part of this survey, we are asking people all over the country to take an anemia test. Anemia is a serious health problem that usually results from poor nutrition, infection, or chronic disease. This survey will assist the government to develop programs to prevent and treat anemia.For the anemia testing, we will need a few drops of blood from a finger. The equipment used to take the blood is clean and completely safe. It has never been used before and will be thrown away after each test.
The blood will be tested for anemia immediately, and the result will be told to you and (NAME OF ADOLESCENT) right away. The result will be kept strictly confidential and will not be shared with anyone other than members of our survey team.
Do you have any questions?
You can say yes to the test for (NAME OF ADOLESCENT), or you can say no. It is up to you to decide. Will you allow (NAME OF ADOLESCENT) to take the anemia test?
HH-16288 • Appendix D

WOMAN 1 WOMAN 2 WOMAN 3
NAME FROMCOLUMN 2 NAME NAME NAME
223 ASK CONSENTFORANEMIA TESTFROMRESPONDENT.
224 CIRCLE THE GRANTED . . . . . . . . . . . . . . . . . . . 1 GRANTED . . . . . . . . . . . . . . . . . . . 1 GRANTED . . . . . . . . . . . . . . . . . . . 1APPROPRIATE RESPONDENT REFUSED . . . . . . 2 RESPONDENT REFUSED . . . . . . 2 RESPONDENT REFUSED . . . . . . 2CODE ANDSIGNYOUR NAME. (SIGN) (SIGN) (SIGN)
(IF REFUSED, GO TO 240) (IF REFUSED, GO TO 240) (IF REFUSED, GO TO 240)
225 PREGNANCY STATUS: FIRST
CHECK COLUMN 8: YES . . . . . . . . . . . . . . . . . . . . . . . . . . . 1 YES . . . . . . . . . . . . . . . . . . . . . . . . . . . 1 YES . . . . . . . . . . . . . . . . . . . . . . . . . . . 1
IF EVER MARRIED NO/DK . . . . . . . . . . . . . . . . . . . . . . . . . 2 NO/DK . . . . . . . . . . . . . . . . . . . . . . . . . 2 NO/DK . . . . . . . . . . . . . . . . . . . . . . . . . 2(CODES 2-5), ASK:Are you pregnant? NEVER MARRIED . . . . . . . . . . . . . . 3 NEVER MARRIED . . . . . . . . . . . . . . 3 NEVER MARRIED . . . . . . . . . . . . . . 3
IF NEVER MARRIED(CODE 1), CIRCLE '3'
239 CHECK 224 AND PREPARE EQUIPMENT AND SUPPLIES FOR THE TEST FOR WHICH CONSENT HAS BEEN OBTAINED AND PROCEED WITH THE TEST.
240 RECORD HEMO-GLOBIN LEVEL G/DL . . . . . . . . . . . G/DL . . . . . . . . . . . G/DL . . . . . . . . . . .HERE AND IN ANEMIA PAMPHLET NOT PRESENT . . . . . . . . . . . . 994 NOT PRESENT . . . . . . . . . . . . 994 NOT PRESENT . . . . . . . . . . . . 994
REFUSED . . . . . . . . . . . . . . . . . 995 REFUSED . . . . . . . . . . . . . . . . . 995 REFUSED . . . . . . . . . . . . . . . . . 995OTHER . . . . . . . . . . . . . . . . . . . 996 OTHER . . . . . . . . . . . . . . . . . . . 996 OTHER . . . . . . . . . . . . . . . . . . . 996
242 GO BACK TO 216 IN NEXT COLUMN OF THIS QUESTIONNAIRE OR IN THE FIRST COLUMN OF AN ADDITIONAL QUESTIONNAIRE; IF NO MOREWOMEN, END INTERVIEW.
As part of this survey, we are asking people all over the country to take an anemia test. Anemia is a serious health problem that usually results from poor nutrition, infection, or chronic disease. This survey will assist the government to develop programs to prevent and treat anemia.
For the anemia testing, we will need a few drops of blood from a finger. The equipment used to take the blood is clean and completely safe. It has never been used before and will be thrown away after each test. The blood will be tested for anemia immediately, and the result will be told to you right away. The result will be kept strictly confidential and will not be shared with anyone other than members of our survey team.
Do you have any questions?You can say yes to the test, or you can say no. It is up to you to decide. Will you take the anemia test?
HH-17• 289Appendix D


March 5, 2012
Department of StatisticsHousehold Survey Directorate
Survey Contents Confidential by Statistical Law
IDENTIFICATION
QUESTIONNAIRE No.: . . . . . . . . . . . . . .
GOVERNORATE: BLOCK No.: . . . . . . . . . . . . . . . . . . . .
DISTRICT:BUILDING No.:
SUB-DISTRICT:HOUSING UNIT No.:
LOCALITY:CLUSTER No.: . . . . . . . . . . . . . . . . . .
AREA:HOUSEHOLD No.: . . . . . . . . . . . . . . . .
SUB-AREA:
STRATUM: TELEPHONE/MOBILE No.
URBAN/RURAL (Urban=1; Rural=2) (if available)
NAME AND LINE NUMBER OF WOMAN:
WOMAN SELECTED FOR DOMESTIC VIOLENCE SECTION (YES = 1; NO = 2) . . . . . . . . . . . . . . . . . . . . . .
INTERVIEWER VISITS
FINAL VISIT
DATE DAY
MONTH
YEAR
INTERVIEWER'S NAME INT. NUMBER
RESULT* RESULT
NEXT VISIT: DATETOTAL NUMBER
TIME OF VISITS
*RESULT CODES:1 COMPLETED 4 REFUSED 7 OTHER2 NOT AT HOME 5 PARTLY COMPLETED3 POSTPONED 6 INCAPACITATED
SUPERVISOR FIELD EDITOR
NAME NAME
DATE DATE
(SPECIFY)
1 2
EDITOROFFICE KEYED BY
0 1
FAMILY HEALTH SURVEY 2012JORDAN POPULATION AND
The Hashemite Kingdom of Jordan
3
2
WOMAN'S QUESTIONNAIRE
W-1• 291Appendix D

SECTION 1. RESPONDENT'S BACKGROUND
INTRODUCTION AND CONSENT
INFORMED CONSENT
Hello. My name is _______________________________________ and I am working with the Department of Statistics. We areconducting a national survey that asks women about the health of women and their children. We would very much appreciate your participation in this survey. This information will help the government to plan health services. The interview usually takes about40 minutes to complete. Whatever information you provide will be kept strictly confidential and willnot be shown to other persons.
Participation in this survey is voluntary, and if we should come to any question you don't want to answer, just let me know and I will go on to the next question; or you can stop the interview at any time. However, we hope that you will participate in this survey since your views are important.At this time, do you want to ask me anything about the survey?
May I begin the interview now?
Signature of interviewer: Date:
RESPONDENT AGREES TO BE INTERVIEWED . . . . . 1 RESPONDENT DOES NOT AGREE TO BE INTERVIEWED . . . 2 END
NO. QUESTIONS AND FILTERS CODING CATEGORIES SKIP
101 RECORD THE TIME.HOUR . . . . . . . . . . . . . . . . . . . .
MINUTE . . . . . . . . . . . . . . . . .
101A What is your marital status now: are you married, widowed, divorced, or separated? MARRIED . . . . . . . . . . . . . . . . . . . . . . 1
DIVORCED . . . . . . . . . . . . . . . . . . . . . . 2IF THE WOMAN IS NOT MARRIED, WIDOWED, DIVORCED OR WIDOWED . . . . . . . . . . . . . . . . . . . . . . 3SEPARATED, END THE INTERVIEW, AND CORRECT MARITAL SEPARATED . . . . . . . . . . . . . . . . . . . . 4STATUS AND ELIGIBILITY IN THE HOUSEHOLD QNNAIRE. NEVER MARRIED . . . . . . . . . . . . . . . . 5 END
102 In what month and year were you born?MONTH . . . . . . . . . . . . . . . . . .
DON'T KNOW MONTH . . . . . . . . . . . . 98
YEAR . . . . . . . . . . . .
DON'T KNOW YEAR . . . . . . . . . . . . 9998
103 How old were you at your last birthday?AGE IN COMPLETED YEARS
COMPARE AND CORRECT 102 AND/OR 103 IF INCONSISTENT.
104 Have you ever attended school? YES . . . . . . . . . . . . . . . . . . . . . . . . . . . . 1NO . . . . . . . . . . . . . . . . . . . . . . . . . . . . 2 110
105 What is the highest level of school you attended: OLD SYSTEMOld elementary, old preparatory, old secondary, new basic, ELEMENTARY . . . . . . . . . . . . . . . . . . 1new secondary, intermediate diploma, bachelor, or higher? PREPARATORY . . . . . . . . . . . . . . . . 2
SECONDARY . . . . . . . . . . . . . . . . . . 3NEW SYSTEM
BASIC . . . . . . . . . . . . . . . . . . . . . . . . 4SECONDARY . . . . . . . . . . . . . . . . . . 5
INTERMEDIATE DIPLOMA . . . . . . . . . 6BACHELOR . . . . . . . . . . . . . . . . . . . . 7HIGHER . . . . . . . . . . . . . . . . . . . . . . . . 8
In case you need more information about the survey, you may contact the person listed on the card that has already been given to your household.
W-2292 • Appendix D

NO. QUESTIONS AND FILTERS CODING CATEGORIES SKIP
106 What is the highest grade you completed at that
level? GRADE . . . . . . . . . . . . . . . . . .
110 Do you read a newspaper or magazine almost every day, ALMOST EVERY DAY . . . . . . . . . . . . . . 13-5 times a week, once or twice a week, once a month, few 3-5 TIMES A WEEK . . . . . . . . . . . . . . . . 2times a year, or never? ONCE OR TWICE A WEEK . . . . . . . . . 3
ONCE A MONTH . . . . . . . . . . . . . . . . 4FEW TIMES A YEAR . . . . . . . . . . . . . . 5NEVER . . . . . . . . . . . . . . . . . . . . . . . . 6CANNOT READ/ILLITERATE . . . . . . . 7
111 Do you listen to the radio almost every day, at least once a ALMOST EVERY DAY . . . . . . . . . . . . . . 1week, at least once a month, few times a year, or never? AT LEAST ONCE A WEEK . . . . . . . . . 2
AT LEAST ONCE A MONTH . . . . . . . 3FEW TIMES A YEAR . . . . . . . . . . . . . . 4NEVER. . . . . . . . . . . . . . . . . . . . . . . . . . 5
112 Do you watch television almost every day, at least once a ALMOST EVERY DAY . . . . . . . . . . . . . . 1week, at least once a month, few times a year, or never? AT LEAST ONCE A WEEK . . . . . . . . . 2
AT LEAST ONCE A MONTH . . . . . . . 3FEW TIMES A YEAR . . . . . . . . . . . . . . 4NEVER. . . . . . . . . . . . . . . . . . . . . . . . . . 5
W-3• 293Appendix D

SECTION 2. REPRODUCTION
NO. QUESTIONS AND FILTERS CODING CATEGORIES SKIP
201 Now I would like to ask about all the births you have had during YES . . . . . . . . . . . . . . . . . . . . . . . . . . . . 1your life. Have you ever given birth? NO . . . . . . . . . . . . . . . . . . . . . . . . . . . . 2 206
202 Do you have any sons or daughters to whom you have given YES . . . . . . . . . . . . . . . . . . . . . . . . . . . . 1birth who are now living with you? NO . . . . . . . . . . . . . . . . . . . . . . . . . . . . 2 204
203 How many sons live with you? SONS AT HOME . . . . . . . . . . . .
And how many daughters live with you? DAUGHTERS AT HOME . . . . .
IF NONE, RECORD '00'.
204 Do you have any sons or daughters to whom you have given YES . . . . . . . . . . . . . . . . . . . . . . . . . . . . 1birth who are alive but do not live with you? NO . . . . . . . . . . . . . . . . . . . . . . . . . . . . 2 206
205 How many sons are alive but do not live with you? SONS ELSEWHERE . . . . . . .
And how many daughters are alive but do not live with you? DAUGHTERS ELSEWHERE .
IF NONE, RECORD '00'.
206 Have you ever given birth to a boy or girl who was born alivebut later died?
YES . . . . . . . . . . . . . . . . . . . . . . . . . . . . 1IF NO, PROBE: Any baby who cried or showed signs of life but NO . . . . . . . . . . . . . . . . . . . . . . . . . . . . 2 208
did not survive?
207 How many boys have died? BOYS DEAD . . . . . . . . . . . . . .
And how many girls have died? GIRLS DEAD . . . . . . . . . . . . . .
IF NONE, RECORD '00'.
208 SUM ANSWERS TO 203, 205, AND 207, AND ENTER TOTAL.IF NONE, RECORD '00'. TOTAL BIRTHS . . . . . . . . . . . .
209 CHECK 208:
Just to make sure that I have this right: you have had in TOTAL_____ births during your life. Is that correct?
PROBE ANDYES NO CORRECT
201-208 ASNECESSARY.
210 CHECK 208:
ONE OR MORE NO BIRTHSBIRTHS 226
W-4294 • Appendix D

211 Now I would like to record the names of all your births, whether still alive or not, starting with the first one you had.RECORD NAMES OF ALL THE BIRTHS IN 212. RECORD TWINS AND TRIPLETS ON SEPARATE LINES.(IF THERE ARE MORE THAN 12 BIRTHS, USE AN ADDITIONAL QUESTIONNAIRE, STARTING WITH THE SECOND ROW).
IF ALIVE: IF ALIVE: IF ALIVE: IF DEAD:
What name Were Is In what month Is How old was Is (NAME) RECORD How old was (NAME) Were there
was given to any of (NAME) and year was (NAME) (NAME) at living with HOUSE- when he/she died? any other
your these a boy or (NAME) born? still his/her last you? HOLD LINE live births
(first/next) births a girl? alive? birthday? NUMBER OF IF '1 YR', PROBE: between
baby? twins? PROBE: CHILD How many months old (NAME OF
When is his/her RECORD (RECORD '00' was (NAME)? PREVIOUS
RECORD birthday? AGE IN COM- IF CHILD NOT RECORD DAYS IF BIRTH) and
NAME PLETED LISTED IN LESS THAN 1 (NAME),
YEARS. HOUSE- MONTH; MONTHS IF including
BIRTH IF LESS THAN HOLD). LESS THAN TWO any children
HISTORY 1 YEAR, YEARS; OR YEARS. who died
RECORD '00' after birth?
01 MONTH LINE NUMBER DAYS . . . 1
SING 1 BOY 1 YES . . 1 YES . . . 1
YEAR MONTHS 2
MULT 2 GIRL 2 NO . . . 2 NO . . . . 2
(NEXT BIRTH) YEARS . . 3
220
02 MONTH LINE NUMBER DAYS . . . 1 YES . . . . 1
SING 1 BOY 1 YES . . 1 YES . . . 1 ADD
YEAR MONTHS 2 BIRTH
MULT 2 GIRL 2 NO . . . 2 NO . . . . 2 NO . . . . . 2
(GO TO 221) YEARS . . 3 NEXT
220 BIRTH
03 MONTH LINE NUMBER DAYS . . . 1 YES . . . . 1
SING 1 BOY 1 YES . . 1 YES . . . 1 ADD
YEAR MONTHS 2 BIRTH
MULT 2 GIRL 2 NO . . . 2 NO . . . . 2 NO . . . . . 2
(GO TO 221) YEARS . . 3 NEXT
220 BIRTH
04 MONTH LINE NUMBER DAYS . . . 1 YES . . . . 1
SING 1 BOY 1 YES . . 1 YES . . . 1 ADD
YEAR MONTHS 2 BIRTH
MULT 2 GIRL 2 NO . . . 2 NO . . . . 2 NO . . . . . 2
(GO TO 221) YEARS . . 3 NEXT
220 BIRTH
05 MONTH LINE NUMBER DAYS . . . 1 YES . . . . 1
SING 1 BOY 1 YES . . 1 YES . . . 1 ADD
YEAR MONTHS 2 BIRTH
MULT 2 GIRL 2 NO . . . 2 NO . . . . 2 NO . . . . . 2
(GO TO 221) YEARS . . 3 NEXT
220 BIRTH
06 MONTH LINE NUMBER DAYS . . . 1 YES . . . . 1
SING 1 BOY 1 YES . . 1 YES . . . 1 ADD
YEAR MONTHS 2 BIRTH
MULT 2 GIRL 2 NO . . . 2 NO . . . . 2 NO . . . . . 2
(GO TO 221) YEARS . . 3 NEXT
220 BIRTH
07 MONTH LINE NUMBER DAYS . . . 1 YES . . . . 1
SING 1 BOY 1 YES . . 1 YES . . . 1 ADD
YEAR MONTHS 2 BIRTH
MULT 2 GIRL 2 NO . . . 2 NO . . . . 2 NO . . . . . 2
(GO TO 221) YEARS . . 3 NEXT
220 BIRTH
AGE IN
YEARS
212 213
NUMBER
AGE IN
YEARS
YEARS
AGE IN
YEARS
AGE IN
YEARS
AGE IN
YEARS
AGE IN
YEARS
220 221218 219214 215 216 217
AGE IN
W-5• 295Appendix D

IF ALIVE: IF ALIVE: IF ALIVE: IF DEAD:
What name Were Is In what month Is How old was Is (NAME) RECORD How old was (NAME) Were there
was given to any of (NAME) and year was (NAME) (NAME) at living with HOUSE- when he/she died? any other
your next these a boy or (NAME) born? still his/her last you? HOLD LINE live births
baby? births a girl? alive? birthday? NUMBER OF IF '1 YR', PROBE: between
twins? PROBE: CHILD How many months old (NAME OF
RECORD What is his/her RECORD (RECORD '00' was (NAME)? PREVIOUS
NAME birthday? AGE IN COM- IF CHILD NOT RECORD DAYS IF BIRTH) and
PLETED LISTED IN LESS THAN 1 (NAME),
BIRTH YEARS. HOUSE- MONTH; MONTHS IF including
HISTORY IF LESS THAN HOLD). LESS THAN TWO any children
1 YEAR, YEARS; OR YEARS. who died
RECORD '00' after birth?
08 MONTH LINE NUMBER DAYS . . . 1 YES . . . . 1
SING 1 BOY 1 YES . . 1 YES . . . 1 ADD
YEAR MONTHS 2 BIRTH
MULT 2 GIRL 2 NO . . . 2 NO . . . . 2 NO . . . . . 2
(GO TO 221) YEARS . . 3 NEXT
220 BIRTH
09 MONTH LINE NUMBER DAYS . . . 1 YES . . . . 1
SING 1 BOY 1 YES . . 1 YES . . . 1 ADD
YEAR MONTHS 2 BIRTH
MULT 2 GIRL 2 NO . . . 2 NO . . . . 2 NO . . . . . 2
(GO TO 221) YEARS . . 3 NEXT
220 BIRTH
10 MONTH LINE NUMBER DAYS . . . 1 YES . . . . 1
SING 1 BOY 1 YES . . 1 YES . . . 1 ADD
YEAR MONTHS 2 BIRTH
MULT 2 GIRL 2 NO . . . 2 NO . . . . 2 NO . . . . . 2
(GO TO 221) YEARS . . 3 NEXT
220 BIRTH
11 MONTH LINE NUMBER DAYS . . . 1 YES . . . . 1
SING 1 BOY 1 YES . . 1 YES . . . 1 ADD
YEAR MONTHS 2 BIRTH
MULT 2 GIRL 2 NO . . . 2 NO . . . . 2 NO . . . . . 2
(GO TO 221) YEARS . . 3 NEXT
220 BIRTH
12 MONTH LINE NUMBER DAYS . . . 1 YES . . . . 1
SING 1 BOY 1 YES . . 1 YES . . . 1 ADD
YEAR MONTHS 2 BIRTH
MULT 2 GIRL 2 NO . . . 2 NO . . . . 2 NO . . . . . 2
(GO TO 221) YEARS . . 3 NEXT
220 BIRTH
222 Have you had any live births since the birth of (NAME OF LAST YES . . . . . . . . . . . . . . . . . . . . . . . . . . . . . . . . . . . . . . . . . BIRTH)? IF YES, RECORD BIRTH(S) IN TABLE. NO . . . . . . . . . . . . . . . . . . . . . . . . . . . . . . . . . . . . . . . . . . .
223 COMPARE 208 WITH NUMBER OF BIRTHS IN HISTORY ABOVE AND MARK:
NUMBERS NUMBERS AREARE SAME DIFFERENT (PROBE AND RECONCILE)
224 CHECK 215:NUMBER OF BIRTHS . . . . . . . . . . . . . . . .
ENTER THE NUMBER OF BIRTHS IN 2007 OR LATER.
NONE . . . . . . . . . . . . . . . . . . . . . . . . . . . . . 0 226
12
YEARS
AGE IN
AGE IN
AGE IN
YEARS
YEARS
AGE IN
YEARS
AGE IN
YEARS
219
NUMBER
215214213212 221220217216 218
W-6296 • Appendix D

NO. QUESTIONS AND FILTERS CODING CATEGORIES SKIP
225 FOR EACH BIRTH SINCE JANUARY 2007, ENTER 'B' IN THE MONTH OF BIRTH IN THECALENDAR. WRITE THE NAME OF THE CHILD TO THE LEFT OF THE 'B' CODE. FOR EACH BIRTH,ASK THE NUMBER OF MONTHS THE PREGNANCY LASTED AND RECORD 'P' IN EACH OF THEPRECEDING MONTHS ACCORDING TO THE DURATION OF PREGNANCY. (NOTE: THE NUMBER OF 'P's MUST BE ONE LESS THAN THE NUMBER OF MONTHS THAT THE PREGNANCY LASTED.)
226 Are you pregnant now? YES . . . . . . . . . . . . . . . . . . . . . . . . . . . . 1NO . . . . . . . . . . . . . . . . . . . . . . . . . . . . 2UNSURE . . . . . . . . . . . . . . . . . . . . . . . . 8 230
227 How many months pregnant are you?MONTHS . . . . . . . . . . . . . . . . . . . . . .
RECORD NUMBER OF COMPLETED MONTHS.
ENTER 'P's IN THE CALENDAR, BEGINNING WITH THE MONTH OF INTERVIEW AND FOR THE TOTALNUMBER OF COMPLETED MONTHS.
228 YES . . . . . . . . . . . . . . . . . . . . . . . . . . . . 1 230NO . . . . . . . . . . . . . . . . . . . . . . . . . . . . 2
229 LATER . . . . . . . . . . . . . . . . . . . . . . . . . . 1NO MORE . . . . . . . . . . . . . . . . . . . . . . 2
230 Have you ever had a pregnancy that miscarried, was aborted, or YES . . . . . . . . . . . . . . . . . . . . . . . . . . . . 1ended in a stillbirth? NO . . . . . . . . . . . . . . . . . . . . . . . . . . . . 2 238
230A The last time you had a such pregnancy, did the pregnancy end MISCARRIAGE . . . . . . . . . . . . . . . . . . 1in a miscarriage, an induced abortion or a stillbirth? INDUCED ABORTION . . . . . . . . . . . . . . 2
STILLBIRTH . . . . . . . . . . . . . . . . . . . . . . 3
231 When did the last such pregnancy end?MONTH . . . . . . . . . . . . . . . . . .
YEAR . . . . . . . . . . . .
232 CHECK 231:
LAST PREGNANCY LAST PREGNANCYENDED IN ENDED BEFORE 238
JAN. 2007 OR LATER JAN. 2007
232A Did this (MISCARRIAGE/ABORTION/STILLBIRTH - FROM Q.230A) HEALTH FACILITY . . . . . . . . . . . . . . . . 1 232Dlast such pregnancy take place in a health facility, YOUR HOME/OTHER HOME . . . . . . . 2at home, or in another place?
OTHER PLACE 6
(SPECIFY)
232B Did you seek care for this (MISCARRIAGE/ABORTION/ YES . . . . . . . . . . . . . . . . . . . . . . . . . . . . 1STILLBIRTH - FROM Q.230A)? NO . . . . . . . . . . . . . . . . . . . . . . . . . . . . 2 233
232C Where did you go for this (MISCARRIAGE/ABORTION/ PUBLIC MEDICAL SECTORSTILLBIRTH - FROM Q.230A)? GOVT. HOSPITAL . . . . . . . . . . . . 11
GOVT. HEALTH CENTER . . . . . . . 12232D What type of health facility was this? UNIVERSITY HOSPITAL . . . . . . . . . 13
ROYAL MEDICAL HOSPITAL . . . . . 14PROBE TO IDENTIFY THE TYPE OF SOURCE AND CIRCLE THE APPROPRIATE CODE. OTHER PUBLIC 16
IF UNABLE TO DETERMINE IF HOSPITAL, HEALTH CENTER PRIVATE MEDICAL SECTOROR CLINIC IS PUBLIC OR PRIVATE MEDICAL, WRITE PRIVATE HOSPITAL/CLINIC . . . . . 21THE NAME OF THE PLACE. OTHER PRIVATE
MEDICAL 26(NAME OF PLACE)
C
CWhen you got pregnant, did you want to get pregnant at that time?
Did you want to have a baby later on or did you not want any (more) children?
__________________
________________(SPECIFY)
________________(SPECIFY)
W-7• 297Appendix D

NO. QUESTIONS AND FILTERS CODING CATEGORIES SKIP
232E Before you were discharged, did anyone in the health facility YES . . . . . . . . . . . . . . . . . . . . . . . . . . . . 1talk to you or advise you about family planning? NO . . . . . . . . . . . . . . . . . . . . . . . . . . . . 2
233MONTHS . . . . . . . . . . . . . . . . . .
RECORD NUMBER OF COMPLETED MONTHS. ENTER 'T' IN THE CALENDAR IN THE MONTH THAT THEPREGNANCY TERMINATED AND 'P' FOR THEREMAINING NUMBER OF COMPLETED MONTHS.
234 YES . . . . . . . . . . . . . . . . . . . . . . . . . . . . 1NO . . . . . . . . . . . . . . . . . . . . . . . . . . . . 2 236
234A Since January 2007, how many other pregnancies that did notresult in a live birth have you had? NUMBER OF PREGNANCIES .
235 ASK THE DATE AND THE DURATION OF PREGNANCY FOR EACH EARLIER NON-LIVE BIRTH PREGNANCYBACK TO JANUARY 2007.
ENTER 'T' IN THE CALENDAR IN THE MONTH THAT EACH PREGNANCY TERMINATED AND 'P'FOR THE REMAINING NUMBER OF COMPLETED MONTHS.
236 YES . . . . . . . . . . . . . . . . . . . . . . . . . . . . 1NO . . . . . . . . . . . . . . . . . . . . . . . . . . . . 2 238
237MONTH . . . . . . . . . . . . . . . . . .
YEAR . . . . . . . . . . . .
238DAYS AGO . . . . . . . . . . . . 1
WEEKS AGO . . . . . . . . . 2
MONTHS AGO . . . . . . . . . 3
(DATE, IF GIVEN) YEARS AGO . . . . . . . . . 4
IN MENOPAUSE/HAS HAD HYSTERECTOMY . . . 994
BEFORE LAST BIRTH . . . . . . . . . . . . 995
NEVER MENSTRUATED . . . . . . . . . 996
239 YES . . . . . . . . . . . . . . . . . . . . . . . . . . . . 1NO . . . . . . . . . . . . . . . . . . . . . . . . . . . . 2
DON'T KNOW . . . . . . . . . . . . . . . . . . . . 8 301
240 JUST BEFORE HER PERIODBEGINS . . . . . . . . . . . . . . . . . . . . . . 1
DURING HER PERIOD . . . . . . . . . . . . 2RIGHT AFTER HER
PERIOD HAS ENDED . . . . . . . . . . . . 3HALFWAY BETWEEN
TWO PERIODS . . . . . . . . . . . . . . . . 4
OTHER 6(SPECIFY)
DON'T KNOW . . . . . . . . . . . . . . . . . . . . 8
How many months pregnant were you when the last such pregnancy ended?
From one menstrual period to the next, are there certain days when a woman is more likely to become pregnant?
Is this time just before her period begins, during her period, right after her period has ended, or halfway between two periods?
_________________________
CSince January 2007, have you had any other pregnancies that did not result in a live birth?
CDid you have any miscarriages, abortions or stillbirths that ended before 2007?
When did the last such pregnancy that terminated before 2007 end?
When did your last menstrual period start?
W-8298 • Appendix D

SECTION 3. CONTRACEPTION
301
01 YES . . . . . . . . . . . . . . . . . . . . . . . . . . . . 1NO . . . . . . . . . . . . . . . . . . . . . . . . . . . . 2
02 YES . . . . . . . . . . . . . . . . . . . . . . . . . . . . 1NO . . . . . . . . . . . . . . . . . . . . . . . . . . . . 2
03 YES . . . . . . . . . . . . . . . . . . . . . . . . . . . . 1NO . . . . . . . . . . . . . . . . . . . . . . . . . . . . 2
04 YES . . . . . . . . . . . . . . . . . . . . . . . . . . . . 1NO . . . . . . . . . . . . . . . . . . . . . . . . . . . . 2
05 YES . . . . . . . . . . . . . . . . . . . . . . . . . . . . 1NO . . . . . . . . . . . . . . . . . . . . . . . . . . . . 2
06 YES . . . . . . . . . . . . . . . . . . . . . . . . . . . . 1NO . . . . . . . . . . . . . . . . . . . . . . . . . . . . 2
07 YES . . . . . . . . . . . . . . . . . . . . . . . . . . . . 1NO . . . . . . . . . . . . . . . . . . . . . . . . . . . . 2
08 YES . . . . . . . . . . . . . . . . . . . . . . . . . . . . 1NO . . . . . . . . . . . . . . . . . . . . . . . . . . . . 2
09 YES . . . . . . . . . . . . . . . . . . . . . . . . . . . . 1NO . . . . . . . . . . . . . . . . . . . . . . . . . . . . 2
10 YES . . . . . . . . . . . . . . . . . . . . . . . . . . . . 1NO . . . . . . . . . . . . . . . . . . . . . . . . . . . . 2
11 YES . . . . . . . . . . . . . . . . . . . . . . . . . . . . 1NO . . . . . . . . . . . . . . . . . . . . . . . . . . . . 2
12 YES . . . . . . . . . . . . . . . . . . . . . . . . . . . . 1NO . . . . . . . . . . . . . . . . . . . . . . . . . . . . 2
13 YES . . . . . . . . . . . . . . . . . . . . . . . . . . . . 1
________________________________(SPECIFY)
________________________________(SPECIFY)
NO . . . . . . . . . . . . . . . . . . . . . . . . . . . . 2
302 CHECK 226:
NOT PREGNANT PREGNANTOR UNSURE 311
303 YES . . . . . . . . . . . . . . . . . . . . . . . . . . . . 1NO . . . . . . . . . . . . . . . . . . . . . . . . . . . . 2 311
Now I would like to talk about family planning - the various ways or methods that a couple can use to delay or avoid a pregnancy.
Have you ever heard of (METHOD)?
Female Sterilization. PROBE: Women can have an operation to avoid having any more children.
Male Sterilization. PROBE: Men can have an operation to avoid having any more children.
IUD. PROBE: Women can have a loop or coil placed inside them by a doctor or a midwife.
Injectables. PROBE: Women can have an injection by a health provider that stops them from becoming pregnant usually for 3 months.
Implants. PROBE: Women can have one or more small rods placed in their upper arm by a doctor which can prevent pregnancy usually for 3 years.
Pill. PROBE: Women can take a pill every day to avoid becoming pregnant.
Condom. PROBE: Men can put a rubber sheath on their penis before sexual intercourse.
Female Condom. PROBE: Women can place a sheath in their vagina before sexual intercourse.
Lactational Amenorrhea Method (LAM)
Rhythm Method. PROBE: To avoid pregnancy, women do not have sexual intercourse on the days of the month they think they can get pregnant.
Withdrawal. PROBE: Men can be careful and pull out before climax.
Emergency Contraception. PROBE: As an emergency measure, within three days after they have unprotected sexual intercourse, women can take special pills to prevent pregnancy. (3)
Have you heard of any other ways or methods that women or men can use to avoid pregnancy?
Are you currently doing something or using any method to delay or avoid getting pregnant?
W-9• 299Appendix D
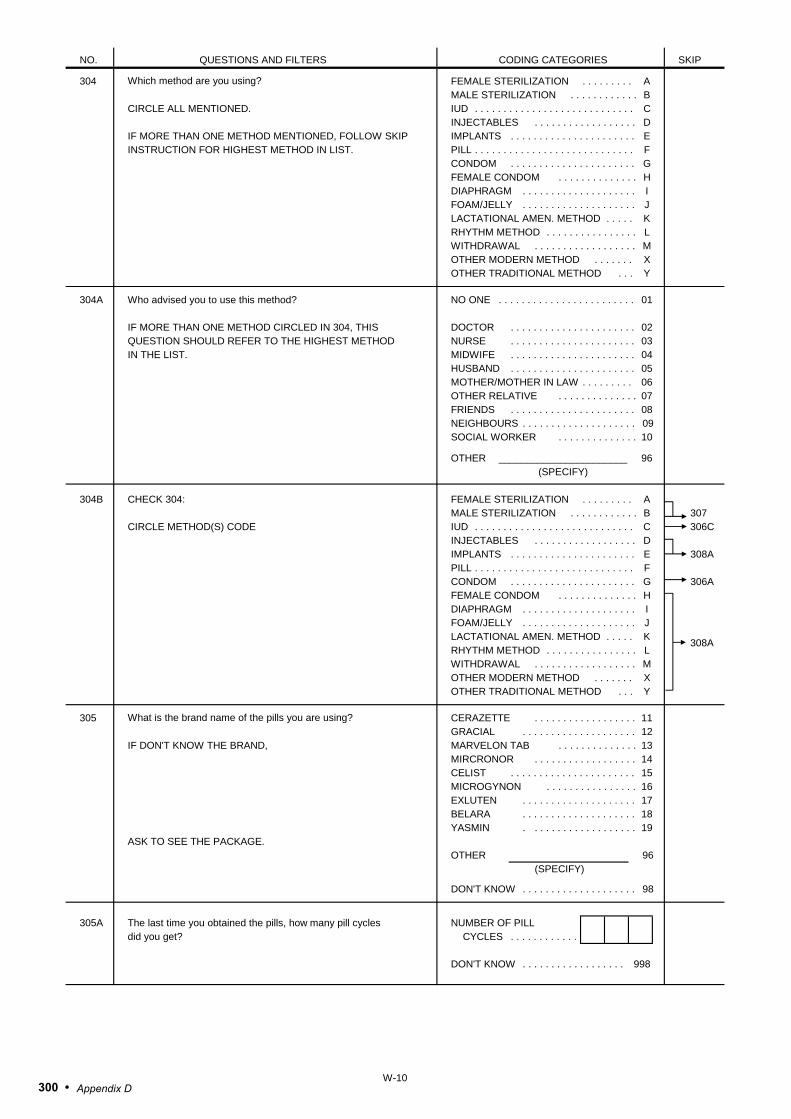
NO. QUESTIONS AND FILTERS CODING CATEGORIES SKIP
304 FEMALE STERILIZATION . . . . . . . . . AMALE STERILIZATION . . . . . . . . . . . . B
CIRCLE ALL MENTIONED. IUD . . . . . . . . . . . . . . . . . . . . . . . . . . . . CINJECTABLES . . . . . . . . . . . . . . . . . . D
IF MORE THAN ONE METHOD MENTIONED, FOLLOW SKIP IMPLANTS . . . . . . . . . . . . . . . . . . . . . . EINSTRUCTION FOR HIGHEST METHOD IN LIST. PILL . . . . . . . . . . . . . . . . . . . . . . . . . . . . F
CONDOM . . . . . . . . . . . . . . . . . . . . . . GFEMALE CONDOM . . . . . . . . . . . . . . HDIAPHRAGM . . . . . . . . . . . . . . . . . . . . IFOAM/JELLY . . . . . . . . . . . . . . . . . . . . JLACTATIONAL AMEN. METHOD . . . . . KRHYTHM METHOD . . . . . . . . . . . . . . . . LWITHDRAWAL . . . . . . . . . . . . . . . . . . MOTHER MODERN METHOD . . . . . . . XOTHER TRADITIONAL METHOD . . . Y
304A Who advised you to use this method? NO ONE . . . . . . . . . . . . . . . . . . . . . . . . 01
IF MORE THAN ONE METHOD CIRCLED IN 304, THIS DOCTOR . . . . . . . . . . . . . . . . . . . . . . 02QUESTION SHOULD REFER TO THE HIGHEST METHOD NURSE . . . . . . . . . . . . . . . . . . . . . . 03IN THE LIST. MIDWIFE . . . . . . . . . . . . . . . . . . . . . . 04
HUSBAND . . . . . . . . . . . . . . . . . . . . . . 05MOTHER/MOTHER IN LAW . . . . . . . . . 06OTHER RELATIVE . . . . . . . . . . . . . . 07FRIENDS . . . . . . . . . . . . . . . . . . . . . . 08NEIGHBOURS . . . . . . . . . . . . . . . . . . . . 09SOCIAL WORKER . . . . . . . . . . . . . . 10
OTHER _______________________ 96(SPECIFY)
304B CHECK 304: FEMALE STERILIZATION . . . . . . . . . AMALE STERILIZATION . . . . . . . . . . . . B 307
CIRCLE METHOD(S) CODE IUD . . . . . . . . . . . . . . . . . . . . . . . . . . . . C 306CINJECTABLES . . . . . . . . . . . . . . . . . . DIMPLANTS . . . . . . . . . . . . . . . . . . . . . . E 308APILL . . . . . . . . . . . . . . . . . . . . . . . . . . . . FCONDOM . . . . . . . . . . . . . . . . . . . . . . G 306AFEMALE CONDOM . . . . . . . . . . . . . . HDIAPHRAGM . . . . . . . . . . . . . . . . . . . . IFOAM/JELLY . . . . . . . . . . . . . . . . . . . . JLACTATIONAL AMEN. METHOD . . . . . KRHYTHM METHOD . . . . . . . . . . . . . . . . LWITHDRAWAL . . . . . . . . . . . . . . . . . . MOTHER MODERN METHOD . . . . . . . XOTHER TRADITIONAL METHOD . . . Y
305 CERAZETTE . . . . . . . . . . . . . . . . . . 11GRACIAL . . . . . . . . . . . . . . . . . . . . 12
IF DON'T KNOW THE BRAND, MARVELON TAB . . . . . . . . . . . . . . 13MIRCRONOR . . . . . . . . . . . . . . . . . . 14CELIST . . . . . . . . . . . . . . . . . . . . . . 15MICROGYNON . . . . . . . . . . . . . . . . 16EXLUTEN . . . . . . . . . . . . . . . . . . . . 17BELARA . . . . . . . . . . . . . . . . . . . . 18YASMIN . . . . . . . . . . . . . . . . . . . 19
ASK TO SEE THE PACKAGE.OTHER
(SPECIFY)
DON'T KNOW . . . . . . . . . . . . . . . . . . . . 98
305A The last time you obtained the pills, how many pill cycles NUMBER OF PILLdid you get? CYCLES . . . . . . . . . . . .
DON'T KNOW . . . . . . . . . . . . . . . . . . 998
Which method are you using?
308A
What is the brand name of the pills you are using?
96
W-10300 • Appendix D

NO. QUESTIONS AND FILTERS CODING CATEGORIES SKIP
305B How much did you pay for the pills? COST IN JD . . . . . . . . . . . .
308AFREE . . . . . . . . . . . . . . . . . . . . . . . . 95DON'T KNOW . . . . . . . . . . . . . . . . . . 98
306A The last time you obtained the condoms, how many condom did you get? NUMBER OF CONDOM
DON'T KNOW . . . . . . . . . . . . . . . . . . 998
306B How much did you pay for the condoms? COST IN JD . . . . . . . . . . . .
308AFREE . . . . . . . . . . . . . . . . . . . . . . . . 95DON'T KNOW . . . . . . . . . . . . . . . . . . 98
306C Who inserted your IUD? MALE DOCTOR . . . . . . . . . . . . . . . . . . 1FEMALE DOCTOR . . . . . . . . . . . . . . . . 2MIDWIFE . . . . . . . . . . . . . . . . . . . . . . . . 3
OTHER _______________________ 6(SPECIFY)
306D How much did you pay in total for the IUD, including the cost of the IUD and the consultation? COST IN JD . . . . . . . . . . . .
FREE . . . . . . . . . . . . . . . . . . . . . . . . 995DON'T KNOW . . . . . . . . . . . . . . . . . . 998
306E Is the IUD you are using hormonal or non-hormonal? HORMONAL . . . . . . . . . . . . . . . . . . 1NON-HORMONAL . . . . . . . . . . . . . . . . 2 308A
CIRCLE ONE RESPONSE ONLY DON'T KNOW . . . . . . . . . . . . . . . . . . 8
307 PUBLIC MEDICAL SECTORGOVT. HOSPITAL . . . . . . . . . . . . 11
PROBE TO IDENTIFY THE TYPE OF SOURCE. UNIVERSITY HOSPITAL . . . . . . . 12ROYAL MEDICAL SERVICES 13OTHER PUBLIC 16
IF UNABLE TO DETERMINE IF PUBLIC OR PRIVATE (SPECIFY)SECTOR, WRITE THE NAME OF THE PLACE.
PRIVATE MEDICAL SECTORPRIVATE HOSPITAL/CLINIC . . . 21
(NAME OF PLACE) OTHER PRIVATEMEDICAL 26
(SPECIFY)DON'T KNOW . . . . . . . . . . . . . . . . . . 98
307A YES . . . . . . . . . . . . . . . . . . . . . . . . . . . . 1NO . . . . . . . . . . . . . . . . . . . . . . . . . . . . 2
307B How much was paid in total for thesterilization, including any consultation you (he) may have had? COST IN JD . . . . . . . . . . . .
IF MORE THAN 990 JD, RECORD 990 FREE . . . . . . . . . . . . . . . . . . . . . . . . 995DON'T KNOW . . . . . . . . . . . . . . . . . . 998
307C Do you regret that you had the operation not to have any (more) YES . . . . . . . . . . . . . . . . . . . . . . . . . . . . 1children? NO . . . . . . . . . . . . . . . . . . . . . . . . . . . . 2
In what facility did the sterilization take place?
When you got sterilized, were you told that you would not be able to have any (more) children because of the operation?
W-11• 301Appendix D

NO. QUESTIONS AND FILTERS CODING CATEGORIES SKIP
308
308A MONTH . . . . . . . . . . . . . . . . . .
YEAR . . . . . . . . . . . .
309 CHECK 308/308A, 215 AND 231:
ANY BIRTH OR PREGNANCY TERMINATION AFTER MONTH AND YES NOYEAR OF START OF USE OF CONTRACEPTION IN 308/308A
GO BACK TO 308/308A, PROBE AND RECORD MONTH AND YEAR AT START OF CONTINUOUSUSE OF CURRENT METHOD (MUST BE AFTER LAST BIRTH OR PREGNANCY TERMINATION).
310 CHECK 308/308A:
YEAR IS 2007 OR LATER YEAR IS 2006 OR EARLIER
ENTER CODE FOR METHOD USED IN MONTH ENTER CODE FOR METHOD USED IN MONTH OFOF INTERVIEW IN THE CALENDAR INTERVIEW IN THE CALENDAR ANDAND IN EACH MONTH BACK TO THE DATE EACH MONTH BACK TO JANUARY 2007.STARTED USING.
THEN SKIP TO
311
USE CALENDAR TO PROBE FOR EARLIER PERIODS OF USE AND NONUSE, STARTING WITH MOST RECENT USE, BACK TO JANUARY 2007.USE NAMES OF CHILDREN, DATES OF BIRTH, AND PERIODS OF PREGNANCY AS REFERENCE POINTS.
IN COLUMN 1, ENTER METHOD USE CODE OR '0' FOR NONUSE IN EACH BLANK MONTH.
ILLUSTRATIVE QUESTIONS:***
IN COLUMN 2, ENTER CODES FOR DISCONTINUATION NEXT TO THE LAST MONTH OF USE.
NUMBER OF CODES IN COLUMN 2 MUST BE SAME AS NUMBER OF INTERRUPTIONS OF METHOD USE IN COLUMN 1.
ASK WHY SHE STOPPED USING THE METHOD. IF A PREGNANCY FOLLOWED, ASK WHETHER SHE BECAME PREGNANT UNINTENTIONALLY WHILE USING THE METHOD ORDELIBERATELY STOPPED TO GET PREGNANT.
ILLUSTRATIVE QUESTIONS:*
*
In what month and year was the sterilization performed?
Since what month and year have you been using (CURRENT METHOD) without stopping?
PROBE: For how long have you been using (CURRENT METHOD) now without stopping?
C C322
I would like to ask you some questions about the times you or your partner may have used a method to avoid getting pregnant during the last few years.
CWhen was the last time you used a method? Which method was that? When did you start using that method? How long after the birth of (NAME)?How long did you use the method then?
Why did you stop using the (METHOD)? Did you become pregnant while using (METHOD), or did you stop to get pregnant, or did you stop for some other reason?
IF DELIBERATELY STOPPED TO BECOME PREGNANT, ASK: How many months did it take you to get pregnant after you stopped using (METHOD)? AND ENTER ‘0’ IN EACH SUCH MONTH IN COLUMN 1.
W-12302 • Appendix D
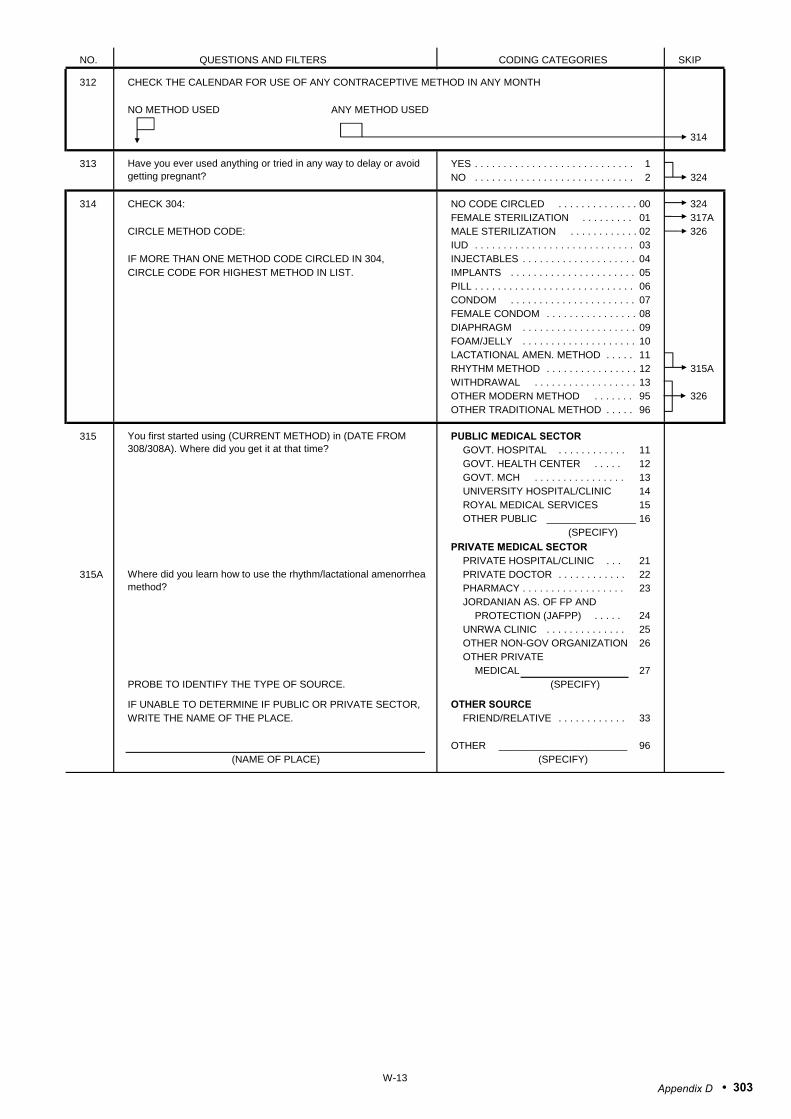
NO. QUESTIONS AND FILTERS CODING CATEGORIES SKIP
312 CHECK THE CALENDAR FOR USE OF ANY CONTRACEPTIVE METHOD IN ANY MONTH
NO METHOD USED ANY METHOD USED
314
313 YES . . . . . . . . . . . . . . . . . . . . . . . . . . . . 1NO . . . . . . . . . . . . . . . . . . . . . . . . . . . . 2 324
314 CHECK 304: NO CODE CIRCLED . . . . . . . . . . . . . . 00 324FEMALE STERILIZATION . . . . . . . . . 01 317A
CIRCLE METHOD CODE: MALE STERILIZATION . . . . . . . . . . . . 02 326IUD . . . . . . . . . . . . . . . . . . . . . . . . . . . . 03
IF MORE THAN ONE METHOD CODE CIRCLED IN 304, INJECTABLES . . . . . . . . . . . . . . . . . . . . 04CIRCLE CODE FOR HIGHEST METHOD IN LIST. IMPLANTS . . . . . . . . . . . . . . . . . . . . . . 05
PILL . . . . . . . . . . . . . . . . . . . . . . . . . . . . 06CONDOM . . . . . . . . . . . . . . . . . . . . . . 07FEMALE CONDOM . . . . . . . . . . . . . . . . 08DIAPHRAGM . . . . . . . . . . . . . . . . . . . . 09FOAM/JELLY . . . . . . . . . . . . . . . . . . . . 10LACTATIONAL AMEN. METHOD . . . . . 11RHYTHM METHOD . . . . . . . . . . . . . . . . 12 315AWITHDRAWAL . . . . . . . . . . . . . . . . . . 13OTHER MODERN METHOD . . . . . . . 95 326OTHER TRADITIONAL METHOD . . . . . 96
315 PUBLIC MEDICAL SECTORGOVT. HOSPITAL . . . . . . . . . . . . 11GOVT. HEALTH CENTER . . . . . 12GOVT. MCH . . . . . . . . . . . . . . . . 13UNIVERSITY HOSPITAL/CLINIC 14ROYAL MEDICAL SERVICES 15OTHER PUBLIC ________________ 16
(SPECIFY)
PRIVATE MEDICAL SECTORPRIVATE HOSPITAL/CLINIC . . . 21
315A PRIVATE DOCTOR . . . . . . . . . . . . 22PHARMACY . . . . . . . . . . . . . . . . . . 23JORDANIAN AS. OF FP AND
PROTECTION (JAFPP) . . . . . 24UNRWA CLINIC . . . . . . . . . . . . . . 25OTHER NON-GOV ORGANIZATION 26OTHER PRIVATE
MEDICAL 27PROBE TO IDENTIFY THE TYPE OF SOURCE. (SPECIFY)
IF UNABLE TO DETERMINE IF PUBLIC OR PRIVATE SECTOR, OTHER SOURCEWRITE THE NAME OF THE PLACE. FRIEND/RELATIVE . . . . . . . . . . . . 33
OTHER _______________________ 96(NAME OF PLACE) (SPECIFY)
Have you ever used anything or tried in any way to delay or avoid getting pregnant?
You first started using (CURRENT METHOD) in (DATE FROM 308/308A). Where did you get it at that time?
Where did you learn how to use the rhythm/lactational amenorrhea method?
W-13• 303Appendix D

NO. QUESTIONS AND FILTERS CODING CATEGORIES SKIP
316 CHECK 304: IUD . . . . . . . . . . . . . . . . . . . . . . . . . . . . 03INJECTABLES . . . . . . . . . . . . . . . . . . . . 04
CIRCLE METHOD CODE: IMPLANTS . . . . . . . . . . . . . . . . . . . . . . 05PILL . . . . . . . . . . . . . . . . . . . . . . . . . . . . 06
IF MORE THAN ONE METHOD CODE CIRCLED IN 304, CONDOM . . . . . . . . . . . . . . . . . . . . . . 07 323CIRCLE CODE FOR HIGHEST METHOD IN LIST. FEMALE CONDOM . . . . . . . . . . . . . . . . 08
DIAPHRAGM . . . . . . . . . . . . . . . . . . . . 09 320FOAM/JELLY . . . . . . . . . . . . . . . . . . . . 10LACTATIONAL AMEN. METHOD . . . . . 11RHYTHM METHOD . . . . . . . . . . . . . . . . 12 326
317 YES . . . . . . . . . . . . . . . . . . . . . . . . . . . . 1 319NO . . . . . . . . . . . . . . . . . . . . . . . . . . . . 2
317A
318 YES . . . . . . . . . . . . . . . . . . . . . . . . . . . . 1NO . . . . . . . . . . . . . . . . . . . . . . . . . . . . 2 320
319 YES . . . . . . . . . . . . . . . . . . . . . . . . . . . . 1NO . . . . . . . . . . . . . . . . . . . . . . . . . . . . 2
320 CHECK 317:
CODE '1' CODE '1'CIRCLED NOT
CIRCLED
YES . . . . . . . . . . . . . . . . . . . . . . . . . . . . 1 322NO . . . . . . . . . . . . . . . . . . . . . . . . . . . . 2
321 YES . . . . . . . . . . . . . . . . . . . . . . . . . . . . 1NO . . . . . . . . . . . . . . . . . . . . . . . . . . . . 2
322 CHECK 304: FEMALE STERILIZATION . . . . . . . . . 01MALE STERILIZATION . . . . . . . . . . . . 02 326
CIRCLE METHOD CODE: IUD . . . . . . . . . . . . . . . . . . . . . . . . . . . . 03INJECTABLES . . . . . . . . . . . . . . . . . . . . 04
IF MORE THAN ONE METHOD CODE CIRCLED IN 304, IMPLANTS . . . . . . . . . . . . . . . . . . . . . . 05CIRCLE CODE FOR HIGHEST METHOD IN LIST. PILL . . . . . . . . . . . . . . . . . . . . . . . . . . . . 06
CONDOM . . . . . . . . . . . . . . . . . . . . . . 07FEMALE CONDOM . . . . . . . . . . . . . . . . 08DIAPHRAGM . . . . . . . . . . . . . . . . . . . . 09FOAM/JELLY . . . . . . . . . . . . . . . . . . . . 10LACTATIONAL AMEN. METHOD . . . . . 11RHYTHM METHOD . . . . . . . . . . . . . . . . 12WITHDRAWAL . . . . . . . . . . . . . . . . . . 13 326OTHER MODERN METHOD . . . . . . . 95OTHER TRADITIONAL METHOD . . . 96
At that time, were you told about side effects or problems you might have with the method?
Were you told what to do if you experienced side effects or problems?
At that time, were you told about other methods of family planning that you could use?
When you obtained (CURRENT METHOD FROM 314) from (SOURCE OF METHOD FROM 307 OR 315), were you told about other methods of family planning that you could use?
Were you ever told by a health or family planning worker about other methods of family planning that you could use?
When you got sterilized, were you told about side effects or problems you might have with the method?
Were you ever told by a health or family planning worker about side effects or problems you might have with the method?
W-14304 • Appendix D

NO. QUESTIONS AND FILTERS CODING CATEGORIES SKIP
323 PUBLIC MEDICAL SECTORGOVT. HOSPITAL . . . . . . . . . . . . 11
PROBE TO IDENTIFY THE TYPE OF SOURCE. GOVT. HEALTH CENTER . . . . . 12GOVT. MCH . . . . . . . . . . . . . . . . 13
IF UNABLE TO DETERMINE IF PUBLIC OR PRIVATE UNIVERSITY HOSPITAL/CLINIC 14SECTOR, WRITE THE NAME OF THE PLACE. ROYAL MEDICAL SERVICES 15
OTHER PUBLIC ________________ 16(SPECIFY)
PRIVATE MEDICAL SECTORPRIVATE HOSPITAL/CLINIC . . . 21
(NAME OF PLACE) PRIVATE DOCTOR . . . . . . . . . . . . 22PHARMACY . . . . . . . . . . . . . . . . . . 23JORDANIAN AS. OF FP AND 326
PROTECTION (JAFPP) . . . . . 24UNRWA CLINIC . . . . . . . . . . . . . . 25OTHER NON-GOV ORGANIZATION 26OTHER PRIVATE
MEDICAL 27(SPECIFY)
OTHER SOURCEFRIEND/RELATIVE . . . . . . . . . . . . 33
OTHER _______________________ 96(SPECIFY)
324 YES . . . . . . . . . . . . . . . . . . . . . . . . . . . . 1NO . . . . . . . . . . . . . . . . . . . . . . . . . . . . 2 326
325 PUBLIC MEDICAL SECTORGOVT. HOSPITAL . . . . . . . . . . . . . . AGOVT. HEALTH CENTER . . . . . . . BGOVT. MCH . . . . . . . . . . . . . . . . . . C
PROBE TO IDENTIFY EACH TYPE OF SOURCE. UNIVERSITY HOSPITAL/CLINIC . . . DROYAL MEDICAL SERVICES . . . . . E
IF UNABLE TO DETERMINE IF PUBLIC OR PRIVATE OTHER PUBLIC ________________ FSECTOR, WRITE THE NAME OF THE PLACE. (SPECIFY)
PRIVATE MEDICAL SECTOR PRIVATE HOSPITAL/CLINIC . . . . . GPRIVATE DOCTOR . . . . . . . . . . . . . . H
(NAME OF PLACE(S)) PHARMACY . . . . . . . . . . . . . . . . . . . . IJORDANIAN AS. OF FP AND
PROTECTION (JAFPP) . . . . . JUNRWA CLINIC . . . . . . . . . . . . . . KOTHER NON-GOV ORGANIZATION LOTHER PRIVATE
MEDICAL M(SPECIFY)
OTHER SOURCEFRIEND/RELATIVE . . . . . . . . . . . . . . N
OTHER _________________________ X
(SPECIFY)
Do you know of a place where you can obtain a method of family planning?
Where did you obtain (CURRENT METHOD) the last time?
Where is that?
Any other place?
W-15• 305Appendix D

NO. QUESTIONS AND FILTERS CODING CATEGORIES SKIP
326 YES . . . . . . . . . . . . . . . . . . . . . . . . . . . . 1NO . . . . . . . . . . . . . . . . . . . . . . . . . . . . 2
327 YES . . . . . . . . . . . . . . . . . . . . . . . . . . . . 1NO . . . . . . . . . . . . . . . . . . . . . . . . . . . . 2 401
328 YES . . . . . . . . . . . . . . . . . . . . . . . . . . . . 1NO . . . . . . . . . . . . . . . . . . . . . . . . . . . . 2
In the last 12 months, have you visited a health facility for care for yourself (or your children)?
Did any staff member at the health facility speak to you about family planning methods?
In the last 12 months, were you visited by a fieldworker who talked to you about family planning?
W-16306 • Appendix D

SECTION 4. PREGNANCY AND POSTNATAL CARE
401 CHECK 224:ONE OR MORE NO
BIRTHS BIRTHSIN 2007 OR LATER IN 2007 OR LATER
402 CHECK 215: ENTER IN THE TABLE THE LINE NUMBER, NAME, AND SURVIVAL STATUS OF EACH BIRTH IN 2007 ORLATER. ASK THE QUESTIONS ABOUT ALL OF THESE BIRTHS. BEGIN WITH THE LAST BIRTH.(IF THERE ARE MORE THAN 3 BIRTHS, USE LAST 2 COLUMNS OF ADDITIONAL QUESTIONNAIRES).
Now I would like to ask you some questions about the health of all your children born in the last five years. (We will talk about each separately.)
403 BIRTH HISTORY NUMBER LAST BIRTH NEXT-TO-LAST BIRTH SECOND-FROM-LAST BIRTHFROM 212 IN BIRTH HISTORY BIRTH BIRTH BIRTH
HISTORY HISTORY HISTORY NUMBER NUMBER NUMBER
404 NAME ________________ NAME ________________ NAME _________________FROM 212 AND 216
LIVING DEAD LIVING DEAD LIVING DEAD
405 YES . . . . . . . . . . . . . . 1 YES . . . . . . . . . . . . . . 1 YES . . . . . . . . . . . . . . 1(SKIP TO 408) (SKIP TO 430) (SKIP TO 430)
NO . . . . . . . . . . . . . . 2 NO . . . . . . . . . . . . . . 2 NO . . . . . . . . . . . . . . 2
406 LATER . . . . . . . . . . . . 2 LATER . . . . . . . . . . . . 2 LATER . . . . . . . . . . . . 2NOT AT ALL . . . . . . 3 NOT AT ALL . . . . . . 3 NOT AT ALL . . . . . . 3
(SKIP TO 408) (SKIP TO 430) (SKIP TO 430)
407 How much longer would you have liked to wait? MONTHS MONTHS MONTHS
YEARS YEARS YEARS
DON'T KNOW . . . 998 DON'T KNOW . . . 998 DON'T KNOW . . . 998
408 YES . . . . . . . . . . . . . . 1NO . . . . . . . . . . . . . . 2
(SKIP TO 415)
409 HEALTH PERSONNELDOCTOR . . . . . . . . ANURSE/MIDWIFE B
PROBE TO IDENTIFY EACH TYPE OTHER PERSONOF PERSON AND RECORD ALL XMENTIONED. (SPECIFY)
410 Where did you receive antenatal HOMEcare for this pregnancy? YOUR HOME . . . A
OTHER HOME . . . B
Anywhere else? PUBLIC MED. SECTORGOVT. HOSPITAL C
PROBE TO IDENTIFY TYPE(S) GOVT. HEALTHOF SOURCE(S) AND CIRCLE CENTER . . . . . . DTHE APPROPRIATE CODE(S). UNIVERSITY
HOSPITAL . . . EIF UNABLE TO DETERMINE ROYAL MEDICAL
SERVICES . . . FIF A HOSPITAL, HEALTH OTHER PUBLICCENTER, OR CLINIC IS GPUBLIC OR PRIVATE (SPECIFY)
MEDICAL, WRITE THE PRIVATE MED. SECTORTHE NAME OF THE PLACE. PVT. HOSPITAL/
CLINIC . . . . . . . . HUNRWA HEALTH
CENTER . . . . . . IOTHER PRIVATE
(NAME OF PLACE(S)) MED. J(SPECIFY)
OTHER X(SPECIFY)
When you got pregnant with (NAME), did you want to get pregnant at that time?
Did you want to have a baby later on, or did you not want any (more) children?
Did you see anyone for antenatal care for this pregnancy?
Whom did you see?
Anyone else?
. .1
. .2
. .1
. .2
. .1
. .2
556
W-17• 307Appendix D

LAST BIRTH NEXT-TO-LAST BIRTH SECOND-FROM-LAST BIRTH
NO. QUESTIONS AND FILTERS NAME ________________ NAME ________________ NAME _________________
411 How many months pregnant were NUMBER OFyou when you first received MONTHS . . . antenatal care for this pregnancy?
DON'T KNOW . . . . . . 98
412 How many times did you receive NUMBERantenatal care during this OF TIMES . pregnancy?
DON'T KNOW . . . . . . 98
413 As part of your antenatal careduring this pregnancy, were any ofthe following done at least once? YES NO
Was your blood pressuremeasured? BP . . . . . . . . 1 2
Were you weighed? WEIGHT . . . 1 2Did you give a urine sample? URINE . . . . . . 1 2Did you give a blood sample? BLOOD . . . 1 2
(SKIP TO 414)
413A CHECK Q413. IF 'YES' CIRCLED NUMBERFOR 'BP' ONLY ASK: OF TIMES .
How many times was your DON'T KNOW . . . . . . 98blood pressure measured?
414 YES . . . . . . . . . . . . . . 1NO . . . . . . . . . . . . . . 2
(SKIP TO 414B)DON'T KNOW . . . . . . 8
414A Were you told where to go if you YES . . . . . . . . . . . . . . 1had any of these complications? NO . . . . . . . . . . . . . . 2
DON'T KNOW . . . . . . 8
414B During (any of) your antenatal YES . . . . . . . . . . . . . . 1care visit(s), were you told about NO . . . . . . . . . . . . . . 2the signs of complications during DON'T KNOW . . . . . . 8the postnatal period?
414C During (any of) your antenatal YES . . . . . . . . . . . . . . 1care visit(s), were you told about NO . . . . . . . . . . . . . . 2having postnatal care visits one DON'T KNOW . . . . . . 8week and 30 days after delivery?
415 During this pregnancy, were you YES . . . . . . . . . . . . . . 1given an injection in the armto prevent the baby from getting NO . . . . . . . . . . . . . . 2tetanus, that is, convulsions (SKIP TO 418)after birth? DON'T KNOW . . . . . . 8
416 During this pregnancy, how manytimes did you get this tetanus TIMES . . . . . . . . . . injection?
DON'T KNOW . . . . 8
417 CHECK 416: 2 OR MORE OTHERTIMES
(SKIP TO 421)
418 At any time before this pregnancy, YES . . . . . . . . . . . . . . 1did you receive any tetanus NO . . . . . . . . . . . . . . 2injections, either to protect (SKIP TO 421)yourself or another baby? DON'T KNOW . . . . . . 8
419 Before this pregnancy, how many other times did you receive a TIMES . . . . . . . . . . tetanus injection?
IF 7 OR MORE TIMES, DON'T KNOW . . . . 8RECORD '7'.
During (any of) your antenatal care visit(s), were you told about things to look out for that might suggest problems with the pregnancy?
W-18308 • Appendix D

LAST BIRTH NEXT-TO-LAST BIRTH SECOND-FROM-LAST BIRTH
NO. QUESTIONS AND FILTERS NAME ________________ NAME ________________ NAME _________________
420 How many years ago did you YEARSreceive that tetanus injection? AGO . . . . . .
421 During this pregnancy, were you YES . . . . . . . . . . . . . . 1given or did you buy any irontablets or iron syrup? NO . . . . . . . . . . . . . . 2
(SKIP TO 430)DON'T KNOW . . . . . . 8
422 During the whole pregnancy, for how many days did you take the DAYS .tablets or syrup?
DON'T KNOW . . . 998IF ANSWER IS NOT NUMERIC,PROBE FOR APPROXIMATENUMBER OF DAYS.
430 When (NAME) was born, was VERY LARGE . . . . . . 1 VERY LARGE . . . . . . 1 VERY LARGE . . . . . . 1he/she very large, larger than LARGER THAN LARGER THAN LARGER THANaverage, average, smaller than AVERAGE . . . . . . 2 AVERAGE . . . . . . 2 AVERAGE . . . . . . 2average, or very small? AVERAGE . . . . . . . . 3 AVERAGE . . . . . . . . 3 AVERAGE . . . . . . . . 3
SMALLER THAN SMALLER THAN SMALLER THANAVERAGE . . . . . . 4 AVERAGE . . . . . . 4 AVERAGE . . . . . . 4
VERY SMALL . . . . . . 5 VERY SMALL . . . . . . 5 VERY SMALL . . . . . . 5DON'T KNOW . . . . . . 8 DON'T KNOW . . . . . . 8 DON'T KNOW . . . . . . 8
431 Was (NAME) weighed at birth? YES . . . . . . . . . . . . . . 1 YES . . . . . . . . . . . . . . 1 YES . . . . . . . . . . . . . . 1NO . . . . . . . . . . . . . . 2 NO . . . . . . . . . . . . . . 2 NO . . . . . . . . . . . . . . 2
(SKIP TO 433) (SKIP TO 433) (SKIP TO 433)DON'T KNOW . . . . . . 8 DON'T KNOW . . . . . . 8 DON'T KNOW . . . . . . 8
432 How much did (NAME) weigh? KG FROM CARD KG FROM CARD KG FROM CARD
RECORD WEIGHT IN . . .KILOGRAMS FROM HEALTHCARD, IF AVAILABLE. KG FROM RECALL KG FROM RECALL KG FROM RECALL
. . .
DON'T KNOW . 99998 DON'T KNOW . 99998 DON'T KNOW . 99998
433 Who assisted with the delivery HEALTH PERSONNEL HEALTH PERSONNEL HEALTH PERSONNELof (NAME)? DOCTOR . . . . . . A DOCTOR . . . . . . A DOCTOR . . . . . . A
NURSE/MIDWIFE . B NURSE/MIDWIFE . B NURSE/MIDWIFE . BAnyone else?
PROBE FOR THE TYPE(S) OF OTHER PERSON X OTHER PERSON X OTHER PERSON XPERSON(S) AND RECORD ALL MENTIONED. (SPECIFY) (SPECIFY) (SPECIFY)
(SKIP TO 434) (SKIP TO 434) (SKIP TO 434)IF RESPONDENT SAYS NO ONE NO ONE . . . . . . . . . . Y NO ONE . . . . . . . . . . Y NO ONE . . . . . . . . . . YASSISTED, PROBE TO DETERMINE WHETHER ANY ADULTS WERE PRESENT ATTHE DELIVERY.
2
11
2
1
2
W-19• 309Appendix D
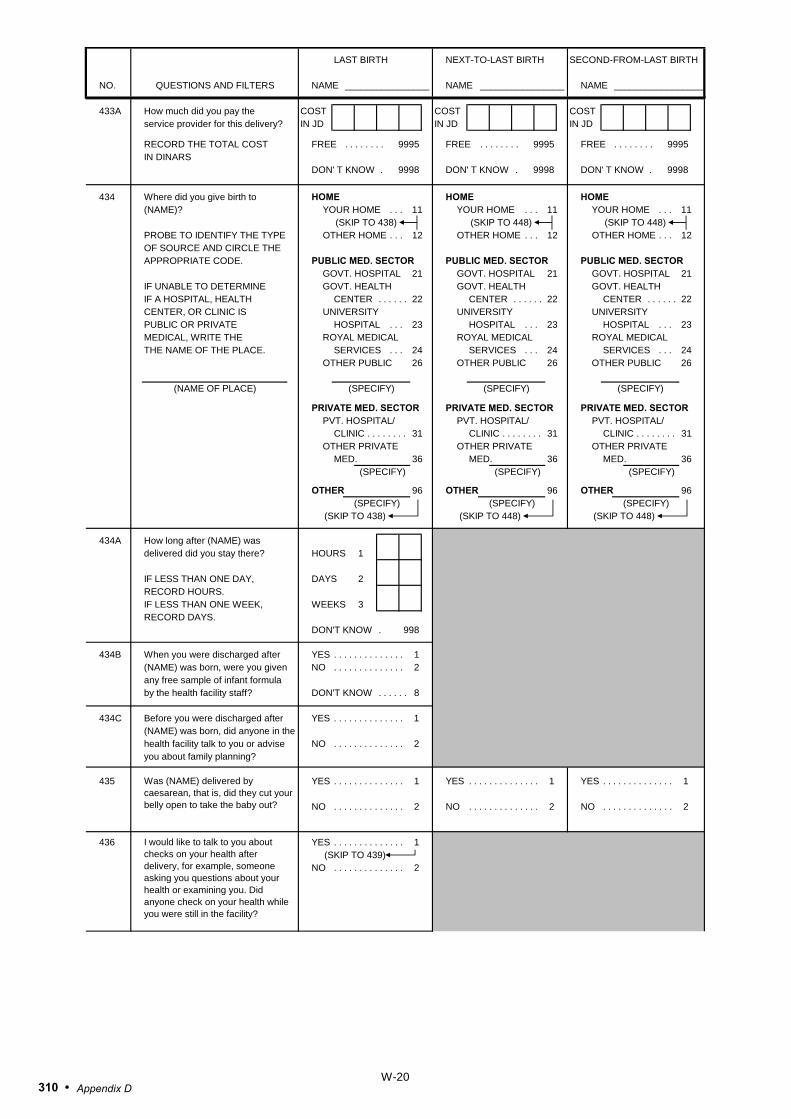
LAST BIRTH NEXT-TO-LAST BIRTH SECOND-FROM-LAST BIRTH
NO. QUESTIONS AND FILTERS NAME ________________ NAME ________________ NAME _________________
433A How much did you pay the COST COST COSTservice provider for this delivery? IN JD IN JD IN JD
RECORD THE TOTAL COST FREE . . . . . . . . 9995 FREE . . . . . . . . 9995 FREE . . . . . . . . 9995IN DINARS
DON' T KNOW . 9998 DON' T KNOW . 9998 DON' T KNOW . 9998
434 Where did you give birth to HOME HOME HOME(NAME)? YOUR HOME . . . 11 YOUR HOME . . . 11 YOUR HOME . . . 11
(SKIP TO 438) (SKIP TO 448) (SKIP TO 448)PROBE TO IDENTIFY THE TYPE OTHER HOME . . . 12 OTHER HOME . . . 12 OTHER HOME . . . 12OF SOURCE AND CIRCLE THEAPPROPRIATE CODE. PUBLIC MED. SECTOR PUBLIC MED. SECTOR PUBLIC MED. SECTOR
GOVT. HOSPITAL 21 GOVT. HOSPITAL 21 GOVT. HOSPITAL 21IF UNABLE TO DETERMINE GOVT. HEALTH GOVT. HEALTH GOVT. HEALTHIF A HOSPITAL, HEALTH CENTER . . . . . . 22 CENTER . . . . . . 22 CENTER . . . . . . 22CENTER, OR CLINIC IS UNIVERSITY UNIVERSITY UNIVERSITY PUBLIC OR PRIVATE HOSPITAL . . . 23 HOSPITAL . . . 23 HOSPITAL . . . 23MEDICAL, WRITE THE ROYAL MEDICAL ROYAL MEDICAL ROYAL MEDICALTHE NAME OF THE PLACE. SERVICES . . . 24 SERVICES . . . 24 SERVICES . . . 24
OTHER PUBLIC 26 OTHER PUBLIC 26 OTHER PUBLIC 26
(NAME OF PLACE) (SPECIFY) (SPECIFY) (SPECIFY)
PRIVATE MED. SECTOR PRIVATE MED. SECTOR PRIVATE MED. SECTORPVT. HOSPITAL/ PVT. HOSPITAL/ PVT. HOSPITAL/
CLINIC . . . . . . . . 31 CLINIC . . . . . . . . 31 CLINIC . . . . . . . . 31OTHER PRIVATE OTHER PRIVATE OTHER PRIVATE
MED. 36 MED. 36 MED. 36(SPECIFY) (SPECIFY) (SPECIFY)
OTHER 96 OTHER 96 OTHER 96(SPECIFY) (SPECIFY) (SPECIFY)
(SKIP TO 438) (SKIP TO 448) (SKIP TO 448)
434A How long after (NAME) wasdelivered did you stay there? HOURS 1
IF LESS THAN ONE DAY, DAYS 2RECORD HOURS.IF LESS THAN ONE WEEK, WEEKS 3RECORD DAYS.
DON'T KNOW . 998
434B When you were discharged after YES . . . . . . . . . . . . . . 1(NAME) was born, were you given NO . . . . . . . . . . . . . . 2any free sample of infant formula by the health facility staff? DON'T KNOW . . . . . . 8
434C Before you were discharged after YES . . . . . . . . . . . . . . 1(NAME) was born, did anyone in thehealth facility talk to you or advise NO . . . . . . . . . . . . . . 2you about family planning?
435 YES . . . . . . . . . . . . . . 1 YES . . . . . . . . . . . . . . 1 YES . . . . . . . . . . . . . . 1
NO . . . . . . . . . . . . . . 2 NO . . . . . . . . . . . . . . 2 NO . . . . . . . . . . . . . . 2
436 YES . . . . . . . . . . . . . . 1(SKIP TO 439)
NO . . . . . . . . . . . . . . 2
Was (NAME) delivered by caesarean, that is, did they cut your belly open to take the baby out?
I would like to talk to you about checks on your health after delivery, for example, someone asking you questions about your health or examining you. Did anyone check on your health while you were still in the facility?
W-20310 • Appendix D

LAST BIRTH NEXT-TO-LAST BIRTH SECOND-FROM-LAST BIRTH
NO. QUESTIONS AND FILTERS NAME ________________ NAME ________________ NAME _________________
437 YES . . . . . . . . . . . . . . 1(SKIP TO 439)
NO . . . . . . . . . . . . . . 2
437A What is the main reason you did NO NEED/NO SICK . 01not seek a health professional NOT AWARE AVAI-check on your health after (NAME) LABILITY OF POST-was born? NATAL SERVICE . 02
NOT SUPPOSED TO GO OUT DURING THIS PERIOD . . . 03NO ONE TO TAKE CARE OF MY BABY DURING VISIT . . . 04TOO FAR . . . . . . . 05TOO EXPENSIVE . 06NO QUALIFIED PERSONNEL . . . 07HUSBAND OPPOSED . . . . . . 08
OTHER 96(SPECIFY)
(SKIP TO 442)
438 YES . . . . . . . . . . . . . . 1(SKIP TO 439)
NO . . . . . . . . . . . . . . 2
438A What is the main reason you did NO NEED/NO SICK . 01not seek a health professional NOT AWARE AVAI-check on your health after (NAME) LABILITY OF POST-was born? NATAL SERVICE . 02
NOT SUPPOSED TO GO OUT DURING THIS PERIOD . . . 03NO ONE TO TAKE CARE OF MY BABY DURING VISIT . . . 04TOO FAR . . . . . . . 05TOO EXPENSIVE . 06NO QUALIFIED PERSONNEL . . . 07HUSBAND OPPOSED . . . . . . 08
OTHER 96(SPECIFY)
(SKIP TO 442)
439 HEALTH PERSONNELDOCTOR . . . . . . . . 1NURSE/MIDWIFE 2
PROBE FOR MOST QUALIFIED OTHER PERSON 6PERSON.
(SPECIFY)
Did anyone check on your health after you left the facility?
I would like to talk to you about checks on your health after delivery, for example, someone asking you questions about your health or examining you. Did anyone check on your health after you gave birth to (NAME)?
Who checked on your health at that time?
W-21• 311Appendix D
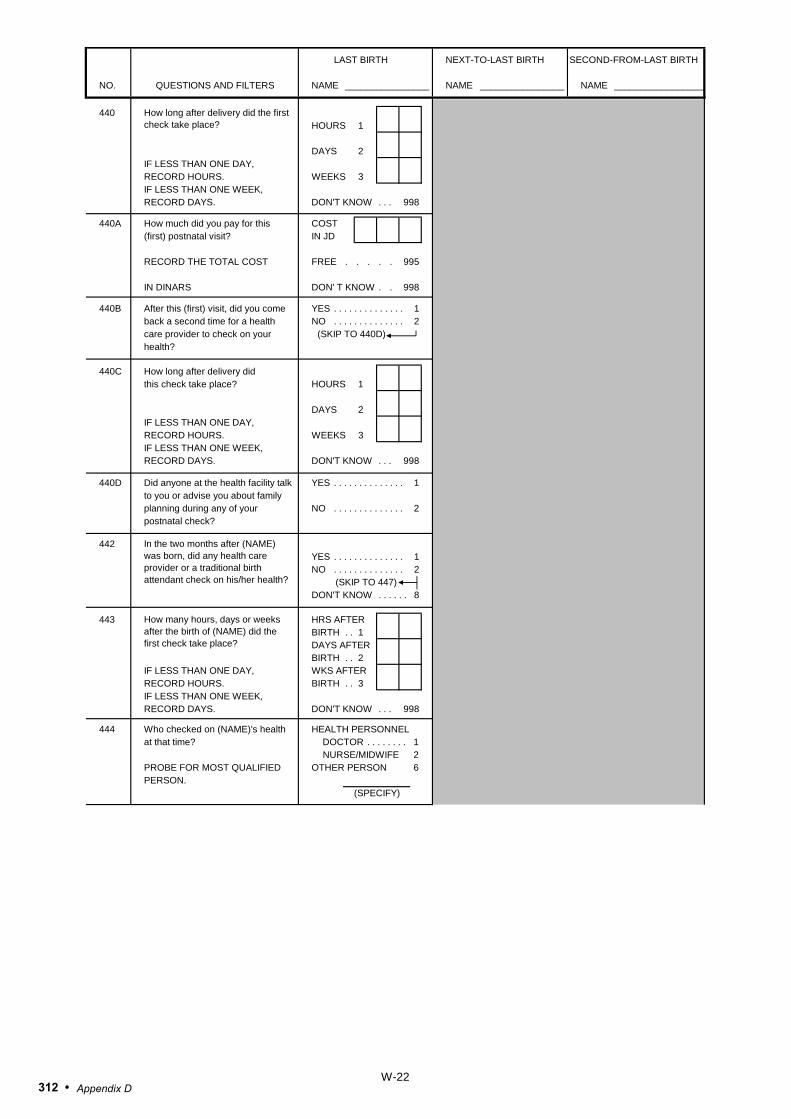
LAST BIRTH NEXT-TO-LAST BIRTH SECOND-FROM-LAST BIRTH
NO. QUESTIONS AND FILTERS NAME ________________ NAME ________________ NAME _________________
440HOURS 1
DAYS 2IF LESS THAN ONE DAY,RECORD HOURS. WEEKS 3IF LESS THAN ONE WEEK,RECORD DAYS. DON'T KNOW . . . 998
440A How much did you pay for this COST(first) postnatal visit? IN JD
RECORD THE TOTAL COST FREE . . . . . 995
IN DINARS DON' T KNOW . . 998
440B After this (first) visit, did you come YES . . . . . . . . . . . . . . 1back a second time for a health NO . . . . . . . . . . . . . . 2care provider to check on your (SKIP TO 440D)health?
440C How long after delivery didthis check take place? HOURS 1
DAYS 2IF LESS THAN ONE DAY,RECORD HOURS. WEEKS 3IF LESS THAN ONE WEEK,RECORD DAYS. DON'T KNOW . . . 998
440D Did anyone at the health facility talk YES . . . . . . . . . . . . . . 1to you or advise you about family planning during any of your NO . . . . . . . . . . . . . . 2postnatal check?
442YES . . . . . . . . . . . . . . 1NO . . . . . . . . . . . . . . 2
(SKIP TO 447)DON'T KNOW . . . . . . 8
443 HRS AFTERBIRTH . . 1DAYS AFTER BIRTH . . 2
IF LESS THAN ONE DAY, WKS AFTERRECORD HOURS. BIRTH . . 3IF LESS THAN ONE WEEK,RECORD DAYS. DON'T KNOW . . . 998
444 Who checked on (NAME)'s health HEALTH PERSONNELat that time? DOCTOR . . . . . . . . 1
NURSE/MIDWIFE 2PROBE FOR MOST QUALIFIED OTHER PERSON 6PERSON.
(SPECIFY)
How many hours, days or weeks after the birth of (NAME) did the first check take place?
How long after delivery did the first check take place?
In the two months after (NAME) was born, did any health care provider or a traditional birth attendant check on his/her health?
W-22312 • Appendix D
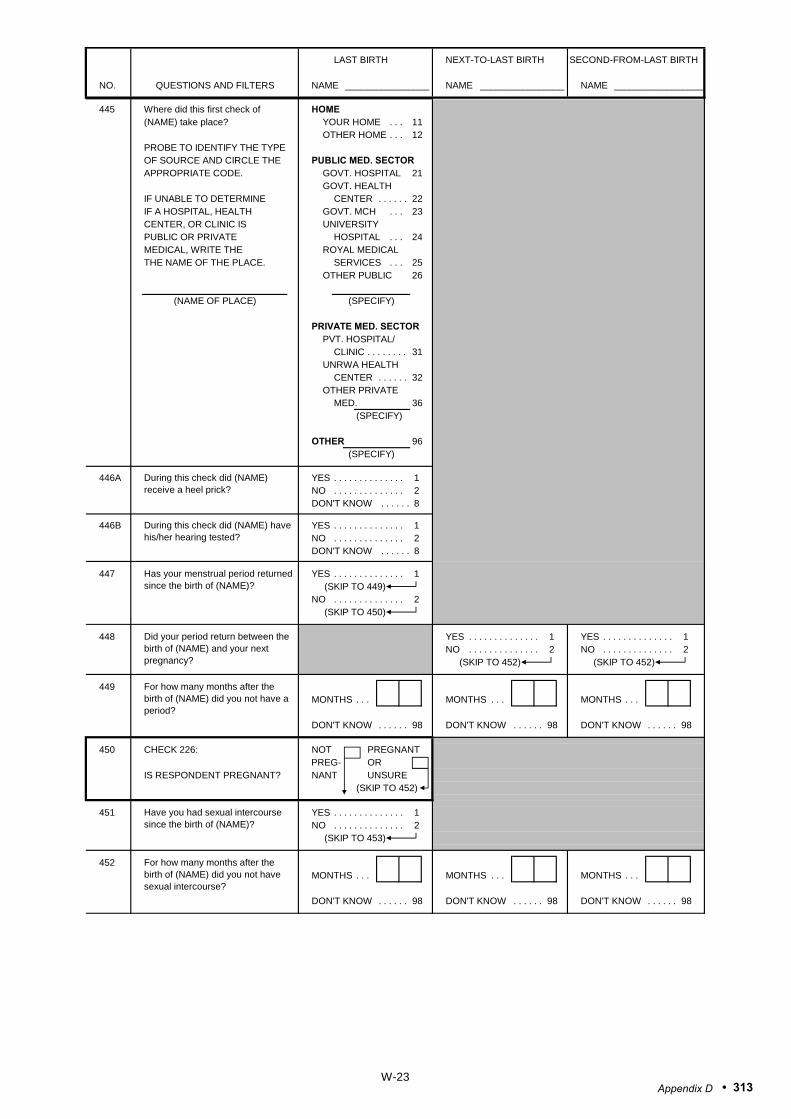
LAST BIRTH NEXT-TO-LAST BIRTH SECOND-FROM-LAST BIRTH
NO. QUESTIONS AND FILTERS NAME ________________ NAME ________________ NAME _________________
445 Where did this first check of HOME(NAME) take place? YOUR HOME . . . 11
OTHER HOME . . . 12PROBE TO IDENTIFY THE TYPEOF SOURCE AND CIRCLE THE PUBLIC MED. SECTORAPPROPRIATE CODE. GOVT. HOSPITAL 21
GOVT. HEALTHIF UNABLE TO DETERMINE CENTER . . . . . . 22IF A HOSPITAL, HEALTH GOVT. MCH . . . 23CENTER, OR CLINIC IS UNIVERSITYPUBLIC OR PRIVATE HOSPITAL . . . 24MEDICAL, WRITE THE ROYAL MEDICALTHE NAME OF THE PLACE. SERVICES . . . 25
OTHER PUBLIC 26
(NAME OF PLACE) (SPECIFY)
PRIVATE MED. SECTORPVT. HOSPITAL/
CLINIC . . . . . . . . 31UNRWA HEALTH
CENTER . . . . . . 32OTHER PRIVATE
MED. 36(SPECIFY)
OTHER 96(SPECIFY)
446A YES . . . . . . . . . . . . . . 1NO . . . . . . . . . . . . . . 2DON'T KNOW . . . . . . 8
446B YES . . . . . . . . . . . . . . 1NO . . . . . . . . . . . . . . 2DON'T KNOW . . . . . . 8
447 YES . . . . . . . . . . . . . . 1(SKIP TO 449)
NO . . . . . . . . . . . . . . 2(SKIP TO 450)
448 YES . . . . . . . . . . . . . . 1 YES . . . . . . . . . . . . . . 1NO . . . . . . . . . . . . . . 2 NO . . . . . . . . . . . . . . 2
(SKIP TO 452) (SKIP TO 452)
449MONTHS . . . MONTHS . . . MONTHS . . .
DON'T KNOW . . . . . . 98 DON'T KNOW . . . . . . 98 DON'T KNOW . . . . . . 98
450 CHECK 226: NOT PREGNANTPREG- OR
IS RESPONDENT PREGNANT? NANT UNSURE(SKIP TO 452)
451 YES . . . . . . . . . . . . . . 1NO . . . . . . . . . . . . . . 2
(SKIP TO 453)
452MONTHS . . . MONTHS . . . MONTHS . . .
DON'T KNOW . . . . . . 98 DON'T KNOW . . . . . . 98 DON'T KNOW . . . . . . 98
During this check did (NAME) receive a heel prick?
Has your menstrual period returned since the birth of (NAME)?
Did your period return between the birth of (NAME) and your next pregnancy?
For how many months after the birth of (NAME) did you not have a period?
Have you had sexual intercourse since the birth of (NAME)?
For how many months after the birth of (NAME) did you not have sexual intercourse?
During this check did (NAME) have his/her hearing tested?
W-23• 313Appendix D

LAST BIRTH NEXT-TO-LAST BIRTH SECOND-FROM-LAST BIRTH
NO. QUESTIONS AND FILTERS NAME ________________ NAME ________________ NAME _________________
453 YES . . . . . . . . . . . . . . 1 YES . . . . . . . . . . . . . . 1 YES . . . . . . . . . . . . . . 1(SKIP TO 455) (SKIP TO 458) (SKIP TO 458)
NO . . . . . . . . . . . . . . 2 NO . . . . . . . . . . . . . . 2 NO . . . . . . . . . . . . . . 2
454 CHECK 404: LIVING DEAD
IS CHILD LIVING?(SKIP TO
460) (GO BACKTO 405 IN
NEXT COLUMN;OR IF NO
MORE BIRTHS,GO TO 501)
455
IMMEDIATELY . . . 000IF LESS THAN 1 HOUR, RECORD ‘00' HOURS.IF LESS THAN 24 HOURS, HOURS 1 RECORD HOURS.OTHERWISE, RECORD DAYS. DAYS 2
456 YES . . . . . . . . . . . . . . 1NO . . . . . . . . . . . . . . 2
(SKIP TO 458)
457 MILK (OTHER THANBREAST MILK ) . A
PLAIN WATER . . . BSUGAR OR GLU-
RECORD ALL LIQUIDS COSE WATER . . . CMENTIONED. GRIPE WATER . . . D
SUGAR-SALT-WATERSOLUTION . . . . . . E
FRUIT JUICE . . . . . . FINFANT FORMULA . GTEA/INFUSIONS . . . HHONEY . . . . . . . . . . I
OTHER X(SPECIFY)
458 CHECK 404: LIVING DEAD LIVING DEAD LIVING DEAD
IS CHILD LIVING?(GO BACK TO (GO BACK TO (GO BACK TO
405 IN NEXT 405 IN NEXT 405 IN NEXT-TO-LAST COLUMN; OR, COLUMN; OR, COLUMN OF NEW
IF NO MORE IF NO MORE QUESTIONNAIRE; BIRTHS, GO BIRTHS, GO OR, IF NO MORE
TO 501) TO 501) BIRTHS, GO TO 501)
459 YES . . . . . . . . . . . . . . 1NO . . . . . . . . . . . . . . 2
460 YES . . . . . . . . . . . . . . 1 YES . . . . . . . . . . . . . . 1 YES . . . . . . . . . . . . . . 1NO . . . . . . . . . . . . . . 2 NO . . . . . . . . . . . . . . 2 NO . . . . . . . . . . . . . . 2DON'T KNOW . . . . . . 8 DON'T KNOW . . . . . . 8 DON'T KNOW . . . . . . 8
461 GO BACK TO 405 IN GO BACK TO 405 IN GO BACK TO 405 IN NEXT COLUMN; OR, IF NEXT COLUMN; OR, IF NEXT-TO-LAST NO MORE BIRTHS, GO NO MORE BIRTHS, GO COLUMN OF NEWTO 501. TO 501. QUESTIONNAIRE; OR,
IF NO MORE BIRTHS,GO TO 501.
Are you still breastfeeding (NAME)?
Did (NAME) drink anything from a bottle with a nipple yesterday or last night?
Did you ever breastfeed (NAME)?
How long after birth did you first put (NAME) to the breast?
In the first three days after delivery, was (NAME) given anything to drink other than breast milk?
What was (NAME) given to drink?
Anything else?
W-24314 • Appendix D

SECTION 5. CHILD IMMUNIZATION AND HEALTH AND CHILD'S NUTRITION
501 ENTER IN THE TABLE THE LINE NUMBER, NAME, AND SURVIVAL STATUS OF EACH BIRTH IN 2007 OR LATER.
ASK THE QUESTIONS ABOUT ALL OF THESE BIRTHS. BEGIN WITH THE LAST BIRTH.(IF THERE ARE MORE THAN 3 BIRTHS, USE LAST 2 COLUMNS OF ADDITIONAL QUESTIONNAIRES).
502 BIRTH HISTORY LAST BIRTH NEXT-TO-LAST BIRTH SECOND-FROM-LAST BIRTHLINE NUMBER BIRTH HISTORY BIRTH HISTORY BIRTH HISTORYFROM 212 NUMBER . . . . . . . . NUMBER . . . . . . . . NUMBER . . . . . .
503 NAME NAME NAMEFROM 212AND 216 LIVING DEAD LIVING DEAD LIVING DEAD
(GO TO 503 (GO TO 503 (GO TO 503 IN NEXT- IN NEXT COLUMN IN NEXT COLUMN TO-LAST COLUMN OF
OR, IF NO MORE OR, IF NO MORE NEW QUESTIONNAIRE, BIRTHS, GO TO 555) BIRTHS, GO TO 555) OR IF NO MORE
BIRTHS, GO TO 555)
504 Do you have a card where (NAME'S) YES, SEEN . . . . . . . . . . . . 1 YES, SEEN . . . . . . . . . . . . 1 YES, SEEN . . . . . . . . . . . 1vaccinations are (SKIP TO 506) (SKIP TO 506) (SKIP TO 506)written down? YES, NOT SEEN . . . . . . . . 2 YES, NOT SEEN . . . . . . . . 2 YES, NOT SEEN . . . . . . 2IF YES: (SKIP TO 508) (SKIP TO 508) (SKIP TO 508)May I see it please? NO CARD . . . . . . . . . . . . . 3 NO CARD . . . . . . . . . . . . . 3 NO CARD . . . . . . . . . . . . 3
505 Did you ever have YES . . . . . . . . . . . . . . . . . . 1 YES . . . . . . . . . . . . . . . . . . 1 YES . . . . . . . . . . . . . . . . . 1a vaccination (SKIP TO 508) (SKIP TO 508) (SKIP TO 508)card for (NAME)? NO . . . . . . . . . . . . . . . . . . 2 NO . . . . . . . . . . . . . . . . . . 2 NO . . . . . . . . . . . . . . . . . 2
506 (1) COPY VACCINATION DATE FOR EACH VACCINE FROM THE CARD.(2) WRITE ‘44' IN ‘DAY' COLUMN IF CARD SHOWS THAT A VACCINATION WAS GIVEN, BUT NO DATE IS RECORDED.
LAST BIRTH NEXT-TO-LAST BIRTH SECOND-FROM-LAST BIRTHDAY MONTH YEAR DAY MONTH YEAR DAY MONTH YEAR
MMR
MEA
MMR
MEAMEASLES
Hib (TETRA/PENTA) 1 Hib1 Hib1
Hib2
Hib3
MMR (Measles/ /Mumps/ Rubella)
Hib (TETRA/PENTA) 2
Hib (TETRA/PENTA) 3
HEPATITIS (TETRA/ PENTA) 1
HEPATITIS (TETRA/ PENTA) 2
Hib2
Hib3
P3
HEPATITIS (TETRA/ PENTA) 3
P4
P b
DTP1
DTP2
DTP Booster
POLIO (OPV) 3
POLIO (OPV) 4
HEP2 HEP2
HEP3
DTP1
DTP2
DTP3 DTP3
DTPbDTPb
HEP1
HEP3
POLIO (IPV/OPV) 1
POLIO (IPV/OPV) 2
BCG
P1
POLIO Booster
DPT (TETRA/PENTA) 3
P3
HEP1
DPT (TETRA/PENTA) 1
P2
DPT (TETRA/PENTA) 2
BCG
P1
P2
P4
P b
BCG
W-25• 315Appendix D

LAST BIRTH NEXT-TO-LAST BIRTH SECOND-FROM-LAST BIRTH
NO. QUESTIONS AND FILTERS NAME ________________ NAME ________________ NAME _________________
507 Has (NAME) received any YES . . . . . . . . . . . . . . 1 YES . . . . . . . . . . . . . . 1 YES . . . . . . . . . . . . . . 1vaccinations that are not recorded (PROBE FOR (PROBE FOR (PROBE FORon this card, including vaccinations VACCINATIONS AND VACCINATIONS AND VACCINATIONS AND received in a immunization WRITE ‘66' IN THE WRITE ‘66' IN THE WRITE ‘66' IN THEcampaign? CORRESPONDING CORRESPONDING CORRESPONDING
DAY COLUMN IN 506) DAY COLUMN IN 506) DAY COLUMN IN 506) RECORD ‘YES’ ONLY IF RESPONDENT MENTIONS (SKIP TO 510) (SKIP TO 511) (SKIP TO 511)BCG, POLIO 1-4, POL. BoosterDPT 1-3, DPT Booster, NO . . . . . . . . . . . . . . 2 NO . . . . . . . . . . . . . . 2 NO . . . . . . . . . . . . . . 2HEPATITIS 1-3, Hib 1-3, (SKIP TO 510) (SKIP TO 511) (SKIP TO 511)MEASLES AND/OR MMR. DON'T KNOW . . . . . . 8 DON'T KNOW . . . . . . 8 DON'T KNOW . . . . . . 8
508 Did (NAME) ever receive anyvaccinations to prevent him/her YES . . . . . . . . . . . . . . 1 YES . . . . . . . . . . . . . . 1 YES . . . . . . . . . . . . . . 1from getting diseases, including NO . . . . . . . . . . . . . . 2 NO . . . . . . . . . . . . . . 2 NO . . . . . . . . . . . . . . 2vaccinations received in an (SKIP TO 510) (SKIP TO 511) (SKIP TO 511)immunization campaign? DON'T KNOW . . . . . . 8 DON'T KNOW . . . . . . 8 DON'T KNOW . . . . . . 8
509 Please tell me if (NAME) received any of the following vaccinations:
509A A BCG vaccination against YES . . . . . . . . . . . . . . 1 YES . . . . . . . . . . . . . . 1 YES . . . . . . . . . . . . . . 1tuberculosis, that is, an injection NO . . . . . . . . . . . . . . 2 NO . . . . . . . . . . . . . . 2 NO . . . . . . . . . . . . . . 2in the arm or shoulder that DON'T KNOW . . . . . . 8 DON'T KNOW . . . . . . 8 DON'T KNOW . . . . . . 8usually causes a scar?
509B Polio vaccine, that is, usually YES . . . . . . . . . . . . . . 1 YES . . . . . . . . . . . . . . 1 YES . . . . . . . . . . . . . . 1drops in the mouth or sometimes NO . . . . . . . . . . . . . . 2 NO . . . . . . . . . . . . . . 2 NO . . . . . . . . . . . . . . 2an injection in the thigh? (SKIP TO 509D) (SKIP TO 509D) (SKIP TO 509D)
DON'T KNOW . . . . . . 8 DON'T KNOW . . . . . . 8 DON'T KNOW . . . . . . 8
509C How many times was the polio NUMBER NUMBER NUMBERvaccine received? OF TIMES . . . . . . OF TIMES . . . . . . OF TIMES . . . . . .
509D A DPT vaccination, that is, an YES . . . . . . . . . . . . . . 1 YES . . . . . . . . . . . . . . 1 YES . . . . . . . . . . . . . . 1injection given in the thigh, some- NO . . . . . . . . . . . . . . 2 NO . . . . . . . . . . . . . . 2 NO . . . . . . . . . . . . . . 2times at the same times as polio (SKIP TO 509F) (SKIP TO 509F) (SKIP TO 509F) to prevent diphtheria, pertussis, DON'T KNOW . . . . . . 8 DON'T KNOW . . . . . . 8 DON'T KNOW . . . . . . 8and tetanus.Sometimes, DPT is part of theTETRA or PENTA vaccine.
509E How many times was a DPT NUMBER NUMBER NUMBERvaccination received? OF TIMES . . . . . . OF TIMES . . . . . . OF TIMES . . . . . .
509F An injection to prevent Hepatitis, YES . . . . . . . . . . . . . . 1 YES . . . . . . . . . . . . . . 1 YES . . . . . . . . . . . . . . 1that is an injection given some- NO . . . . . . . . . . . . . . 2 NO . . . . . . . . . . . . . . 2 NO . . . . . . . . . . . . . . 2times at the same times as polio (SKIP TO 509H) (SKIP TO 509H) (SKIP TO 509H)and DPT injection. DON'T KNOW . . . . . . 8 DON'T KNOW . . . . . . 8 DON'T KNOW . . . . . . 8Sometimes, DPT is part of theTETRA or PENTA vaccine.
509G How many times was a Hepatitis NUMBER NUMBER NUMBERvaccination received? OF TIMES . . . . . . OF TIMES . . . . . . OF TIMES . . . . . .
509H A Hib vaccination, that is an YES . . . . . . . . . . . . . . 1 YES . . . . . . . . . . . . . . 1 YES . . . . . . . . . . . . . . 1injection given sometimes at the NO . . . . . . . . . . . . . . 2 NO . . . . . . . . . . . . . . 2 NO . . . . . . . . . . . . . . 2same times as polio, DPT and (SKIP TO 509J) (SKIP TO 509J) (SKIP TO 509J)Hepatitis to prevent meningitis. DON'T KNOW . . . . . . 8 DON'T KNOW . . . . . . 8 DON'T KNOW . . . . . . 8Sometimes, DPT is part of theTETRA or PENTA vaccine.
509I How many times was a Hib NUMBER NUMBER NUMBERvaccination received? OF TIMES . . . . . . OF TIMES . . . . . . OF TIMES . . . . . .
W-26316 • Appendix D

LAST BIRTH NEXT-TO-LAST BIRTH SECOND-FROM-LAST BIRTH
NO. QUESTIONS AND FILTERS NAME ________________ NAME ________________ NAME _________________
509J A measles injection, that is a YES . . . . . . . . . . . . . . 1 YES . . . . . . . . . . . . . . 1 YES . . . . . . . . . . . . . . 1shot in the arm at the age of 9 NO . . . . . . . . . . . . . . 2 NO . . . . . . . . . . . . . . 2 NO . . . . . . . . . . . . . . 2months or older to prevent DON'T KNOW . . . . . . 8 DON'T KNOW . . . . . . 8 DON'T KNOW . . . . . . 8measles?
509K A MMR vaccination, that is an YES . . . . . . . . . . . . . . 1 YES . . . . . . . . . . . . . . 1 YES . . . . . . . . . . . . . . 1injection to prevent Measles, NO . . . . . . . . . . . . . . 2 NO . . . . . . . . . . . . . . 2 NO . . . . . . . . . . . . . . 2Mumps and Rubella, usually DON'T KNOW . . . . . . 8 DON'T KNOW . . . . . . 8 DON'T KNOW . . . . . . 8given at the age of 18 months.
510 Did (NAME) receive an YES . . . . . . . . . . . . . . 1anemia test? NO . . . . . . . . . . . . . . 2
DON'T KNOW . . . . . . 8
511 HAS (NAME) ever received YES . . . . . . . . . . . . . . 1 YES . . . . . . . . . . . . . . 1 YES . . . . . . . . . . . . . . 1a vitamin A dose (like this/ NO . . . . . . . . . . . . . . 2 NO . . . . . . . . . . . . . . 2 NO . . . . . . . . . . . . . . 2any of these)? (SKIP TO 512) (SKIP TO 512) (SKIP TO 512)SHOW COMMON TYPES OF DON'T KNOW . . . . . . 8 DON'T KNOW . . . . . . 8 DON'T KNOW . . . . . . 8CAPSULES.
511A Did (NAME) receive a vitamin A YES . . . . . . . . . . . . . . 1 YES . . . . . . . . . . . . . . 1 YES . . . . . . . . . . . . . . 1dose within the last six months? NO . . . . . . . . . . . . . . 2 NO . . . . . . . . . . . . . . 2 NO . . . . . . . . . . . . . . 2
DON'T KNOW . . . . . . 8 DON'T KNOW . . . . . . 8 DON'T KNOW . . . . . . 8
512 YES . . . . . . . . . . . . . . 1 YES . . . . . . . . . . . . . . 1 YES . . . . . . . . . . . . . . 1NO . . . . . . . . . . . . . . 2 NO . . . . . . . . . . . . . . 2 NO . . . . . . . . . . . . . . 2DON'T KNOW . . . . . . 8 DON'T KNOW . . . . . . 8 DON'T KNOW . . . . . . 8
SHOW COMMON TYPES OFPILLS/SPRINKLES/SYRUPS.
514 YES . . . . . . . . . . . . . . 1 YES . . . . . . . . . . . . . . 1 YES . . . . . . . . . . . . . . 1NO . . . . . . . . . . . . . . 2 NO . . . . . . . . . . . . . . 2 NO . . . . . . . . . . . . . . 2
(SKIP TO 525) (SKIP TO 525) (SKIP TO 525)DON'T KNOW . . . . . . 8 DON'T KNOW . . . . . . 8 DON'T KNOW . . . . . . 8
515 YES . . . . . . . . . . . . . . 1 YES . . . . . . . . . . . . . . 1 YES . . . . . . . . . . . . . . 1NO . . . . . . . . . . . . . . 2 NO . . . . . . . . . . . . . . 2 NO . . . . . . . . . . . . . . 2DON'T KNOW . . . . . . 8 DON'T KNOW . . . . . . 8 DON'T KNOW . . . . . . 8
516MUCH LESS . . . . . . 1 MUCH LESS . . . . . . 1 MUCH LESS . . . . . . 1SOMEWHAT LESS 2 SOMEWHAT LESS 2 SOMEWHAT LESS 2ABOUT THE SAME 3 ABOUT THE SAME 3 ABOUT THE SAME 3MORE . . . . . . . . . . . . 4 MORE . . . . . . . . . . . . 4 MORE . . . . . . . . . . . . 4NOTHING TO DRINK 5 NOTHING TO DRINK 5 NOTHING TO DRINK 5DON'T KNOW . . . . . . 8 DON'T KNOW . . . . . . 8 DON'T KNOW . . . . . . 8
517MUCH LESS . . . . . . 1 MUCH LESS . . . . . . 1 MUCH LESS . . . . . . 1SOMEWHAT LESS 2 SOMEWHAT LESS 2 SOMEWHAT LESS 2ABOUT THE SAME 3 ABOUT THE SAME 3 ABOUT THE SAME 3MORE . . . . . . . . . . . . 4 MORE . . . . . . . . . . . . 4 MORE . . . . . . . . . . . . 4STOPPED FOOD 5 STOPPED FOOD 5 STOPPED FOOD 5NEVER GAVE FOOD 6 NEVER GAVE FOOD 6 NEVER GAVE FOOD 6DON'T KNOW . . . . . . 8 DON'T KNOW . . . . . . 8 DON'T KNOW . . . . . . 8
IF LESS, PROBE: Was he/she given much less than usual to eat or somewhat less?
In the last seven days, was (NAME) given iron pills, sprinkles with iron, or iron syrup like (this/any of these)?
Was he/she given less than usual to drink, about the same amount, or more than usual to drink?
IF LESS, PROBE: Was he/she given much less than usual to drink or somewhat less?
When (NAME) had diarrhea, was he/she given less than usual to eat, about the same amount, more than usual, or nothing to eat?
Has (NAME) had diarrhea in the last 2 weeks?
Was there any blood in the stools?
Now I would like to know how much (NAME) was given to drink during the diarrhea (including breastmilk).
W-27• 317Appendix D

LAST BIRTH NEXT-TO-LAST BIRTH SECOND-FROM-LAST BIRTH
NO. QUESTIONS AND FILTERS NAME ________________ NAME ________________ NAME _________________
518 YES . . . . . . . . . . . . . . 1 YES . . . . . . . . . . . . . . 1 YES . . . . . . . . . . . . . . 1NO . . . . . . . . . . . . . . 2 NO . . . . . . . . . . . . . . 2 NO . . . . . . . . . . . . . . 2
(SKIP TO 521B) (SKIP TO 521B) (SKIP TO 521B)
519 PUBLIC MED. SECTOR PUBLIC MED. SECTOR PUBLIC MED. SECTORGOVT. HOSP. . A GOVT. HOSP. . A GOVT. HOSP. . AGOVT. HEALTH GOVT. HEALTH GOVT. HEALTH
CENTER . . . . . . B CENTER . . . . . . B CENTER . . . . . . BGOVT. MCH . . . C GOVT. MCH . . . C GOVT. MCH . . . C
PROBE TO IDENTIFY EACH UNIVERSITY UNIVERSITY UNIVERSITYTYPE OF SOURCE. HOSPITAL . . . D HOSPITAL . . . D HOSPITAL . . . D
ROYAL MEDICAL ROYAL MEDICAL ROYAL MEDICALIF UNABLE TO DETERMINE SERVICES . . . E SERVICES . . . E SERVICES . . . EIF PUBLIC OR PRIVATE OTHER PUBLIC F OTHER PUBLIC F OTHER PUBLIC FSECTOR, WRITE THE NAMEOF THE PLACE. (SPECIFY) (SPECIFY) (SPECIFY)
PRIVATE MED. SECTOR PRIVATE MED. SECTOR PRIVATE MED. SECTORPVT. HOSPITAL/ PVT. HOSPITAL/ PVT. HOSPITAL/
(NAME OF PLACE(S)) CLINIC . . . . . . G CLINIC . . . . . . G CLINIC . . . . . . GPHARMACY . . . H PHARMACY . . . H PHARMACY . . . HPVT DOCTOR . . . I PVT DOCTOR . . . I PVT DOCTOR . . . IUNRWA HEALTH UNRWA HEALTH UNRWA HEALTH
CENTER . . . . . . J CENTER . . . . . . J CENTER . . . . . . J
OTHER PRIVATE OTHER PRIVATE OTHER PRIVATEMED. K MED. K MED. K
(SPECIFY) (SPECIFY) (SPECIFY)
OTHER X OTHER X OTHER X(SPECIFY) (SPECIFY) (SPECIFY)
520 CHECK 519: TWO OR ONLY TWO OR ONLY TWO OR ONLYMORE ONE MORE ONE MORE ONECODES CODE CODES CODE CODES CODE
CIRCLED CIRCLED CIRCLED CIRCLED CIRCLED CIRCLED
(SKIP TO 521A) (SKIP TO 521A) (SKIP TO 521A)
521
FIRST PLACE . . . FIRST PLACE . . . FIRST PLACE . . . USE LETTER CODE FROM 519.
521A How many days after the diarrheabegan did you first seek adviceor treatment for (NAME)? DAYS . . . . . . DAYS . . . . . . DAYS . . . . . . IF THE SAME DAY, RECORD '00'.
521B Does (NAME) still have diarrhea? YES . . . . . . . . . . . . . . 1 YES . . . . . . . . . . . . . . 1 YES . . . . . . . . . . . . . . 1NO . . . . . . . . . . . . . . 2 NO . . . . . . . . . . . . . . 2 NO . . . . . . . . . . . . . . 2DON'T KNOW . . . . . . 8 DON'T KNOW . . . . . . 8 DON'T KNOW . . . . . . 8
Did you seek advice or treatment for the diarrhea from any source?
Where did you seek advice or treatment?
Anywhere else?
Where did you first seek advice or treatment?
W-28318 • Appendix D

LAST BIRTH NEXT-TO-LAST BIRTH SECOND-FROM-LAST BIRTH
NO. QUESTIONS AND FILTERS NAME ________________ NAME ________________ NAME _________________
522 Was he/she given any of the following to drink at any time sincehe/she started having the diarrhea: YES NO DK YES NO DK YES NO DK
A fluid made from a special AQUA- AQUA- AQUA-packet called Aquacell or CELL/ CELL/ CELL/Paralait? PARALAIT 1 2 8 PARALAIT 1 2 8 PARALAIT 1 2 8
Thin watery gruel made from GRUEL . . 1 2 8 GRUEL . . 1 2 8 GRUEL . . 1 2 8rice, carrots, wheat, etc?
Soup? SOUP . . . 1 2 8 SOUP . . . 1 2 8 SOUP . . . 1 2 8
Home made sugar-salt-watersolution? SU-SALT . 1 2 8 SU-SALT . 1 2 8 SU-SALT . 1 2 8
Milk or infant formula? MILK/FOR. 1 2 8 MILK/FOR. 1 2 8 MILK/FOR. 1 2 8
Yoghurt-based drink? YOGHURT 1 2 8 YOGHURT 1 2 8 YOGHURT 1 2 8
Water WATER . 1 2 8 WATER . 1 2 8 WATER . 1 2 8
Any other liquid? OTH. LIQ. 1 2 8 OTH. LIQ. 1 2 8 OTH. LIQ. 1 2 8
523 YES . . . . . . . . . . . . . . 1 YES . . . . . . . . . . . . . . 1 YES . . . . . . . . . . . . . . 1NO . . . . . . . . . . . . . . 2 NO . . . . . . . . . . . . . . 2 NO . . . . . . . . . . . . . . 2
(SKIP TO 525) (SKIP TO 525) (SKIP TO 525)DON'T KNOW . . . . . . 8 DON'T KNOW . . . . . . 8 DON'T KNOW . . . . . . 8
524 PILL OR SYRUP PILL OR SYRUP PILL OR SYRUPANTIBIOTIC . . . . . . A ANTIBIOTIC . . . . . . A ANTIBIOTIC . . . . . . ANON-ANTIBIO. . . B NON-ANTIBIO. . . B NON-ANTIBIO. . . BUNKNOWN PILL UNKNOWN PILL UNKNOWN PILL
OR SYRUP . . . C OR SYRUP . . . C OR SYRUP . . . CRECORD ALL TREATMENTSGIVEN. INJECTION INJECTION INJECTION
ANTIBIOTIC . . . . . . D ANTIBIOTIC . . . . . . D ANTIBIOTIC . . . . . . DNON-ANTIBIO. . . E NON-ANTIBIO. . . E NON-ANTIBIO. . . EUNKNOWN UNKNOWN UNKNOWN
INJECTION . . . F INJECTION . . . F INJECTION . . . F
(IV) INTRAVENOUS . G (IV(IV(IV) INTRAVENOUG (IV) INTRAVENOUS . G
HOME REMEDY/ HOME REMEDY/ HOME REMEDY/HERBAL MED- HERBAL MED- HERBAL MED-ICINE . . . . . . . . . . H ICINE . . . . . . . . . . H ICINE . . . . . . . . . . H
OTHER X OTHER X OTHER X(SPECIFY) (SPECIFY) (SPECIFY)
DON'T KNOW . . . . . . Z DON'T KNOW . . . . . . Z DON'T KNOW . . . . . . Z
525 YES . . . . . . . . . . . . . . 1 YES . . . . . . . . . . . . . . 1 YES . . . . . . . . . . . . . . 1NO . . . . . . . . . . . . . . 2 NO . . . . . . . . . . . . . . 2 NO . . . . . . . . . . . . . . 2DON'T KNOW . . . . . . 8 DON'T KNOW . . . . . . 8 DON'T KNOW . . . . . . 8
527 YES . . . . . . . . . . . . . . 1 YES . . . . . . . . . . . . . . 1 YES . . . . . . . . . . . . . . 1NO . . . . . . . . . . . . . . 2 NO . . . . . . . . . . . . . . 2 NO . . . . . . . . . . . . . . 2
(SKIP TO 530) (SKIP TO 530) (SKIP TO 530)DON'T KNOW . . . . . . 8 DON'T KNOW . . . . . . 8 DON'T KNOW . . . . . . 8
528 YES . . . . . . . . . . . . . . 1 YES . . . . . . . . . . . . . . 1 YES . . . . . . . . . . . . . . 1NO . . . . . . . . . . . . . . 2 NO . . . . . . . . . . . . . . 2 NO . . . . . . . . . . . . . . 2
(SKIP TO 531) (SKIP TO 531) (SKIP TO 531)DON'T KNOW . . . . . . 8 DON'T KNOW . . . . . . 8 DON'T KNOW . . . . . . 8
a)
b)
d)
c)
Was anything (else) given to treat the diarrhea?
What (else) was given to treat the diarrhea?
Anything else?
Has (NAME) been ill with a fever at any time in the last 2 weeks?
e)
f)
g)
h)
Has (NAME) had an illness with a cough at any time in the last 2 weeks?
When (NAME) had an illness with a cough, did he/she breathe faster than usual with short, rapid breaths or have difficulty breathing?
W-29• 319Appendix D

LAST BIRTH NEXT-TO-LAST BIRTH SECOND-FROM-LAST BIRTH
NO. QUESTIONS AND FILTERS NAME ________________ NAME ________________ NAME _________________
529 CHEST ONLY . . . 1 CHEST ONLY . . . 1 CHEST ONLY . . . 1NOSE ONLY . . . . . . 2 NOSE ONLY . . . . . . 2 NOSE ONLY . . . . . . 2BOTH . . . . . . . . . . . . 3 BOTH . . . . . . . . . . . . 3 BOTH . . . . . . . . . . . . 3OTHER 6 OTHER 6 OTHER 6
(SPECIFY) (SPECIFY) (SPECIFY)DON'T KNOW . . . . . . 8 DON'T KNOW . . . . . . 8 DON'T KNOW . . . . . . 8
(SKIP TO 531) (SKIP TO 531) (SKIP TO 531)
530 CHECK 525: YES NO OR DK YES NO OR DK YES NO OR DK
HAD FEVER?(GO BACK TO (GO BACK TO (GO TO 503
503 IN NEXT 503 IN NEXT IN NEXT-TO-LASTCOLUMN; OR, COLUMN; OR, COLUMN OF NEW
IF NO MORE IF NO MORE QUESTIONNAIRE; OR,BIRTHS, GO BIRTHS, GO IF NO MORE BIRTHS,
TO 555) TO 555) GO TO 555)
531MUCH LESS . . . . . . 1 MUCH LESS . . . . . . 1 MUCH LESS . . . . . . 1SOMEWHAT LESS 2 SOMEWHAT LESS 2 SOMEWHAT LESS 2ABOUT THE SAME 3 ABOUT THE SAME 3 ABOUT THE SAME 3MORE . . . . . . . . . . . . 4 MORE . . . . . . . . . . . . 4 MORE . . . . . . . . . . . . 4NOTHING TO DRINK 5 NOTHING TO DRINK 5 NOTHING TO DRINK 5DON'T KNOW . . . . . . 8 DON'T KNOW . . . . . . 8 DON'T KNOW . . . . . . 8
532MUCH LESS . . . . . . 1 MUCH LESS . . . . . . 1 MUCH LESS . . . . . . 1SOMEWHAT LESS 2 SOMEWHAT LESS 2 SOMEWHAT LESS 2ABOUT THE SAME 3 ABOUT THE SAME 3 ABOUT THE SAME 3MORE . . . . . . . . . . . . 4 MORE . . . . . . . . . . . . 4 MORE . . . . . . . . . . . . 4STOPPED FOOD 5 STOPPED FOOD 5 STOPPED FOOD 5NEVER GAVE FOOD 6 NEVER GAVE FOOD 6 NEVER GAVE FOOD 6DON'T KNOW . . . . . . 8 DON'T KNOW . . . . . . 8 DON'T KNOW . . . . . . 8
533 YES . . . . . . . . . . . . . . 1 YES . . . . . . . . . . . . . . 1 YES . . . . . . . . . . . . . . 1NO . . . . . . . . . . . . . . 2 NO . . . . . . . . . . . . . . 2 NO . . . . . . . . . . . . . . 2
(SKIP TO 536B) (SKIP TO 536B) (SKIP TO 536B)
Was the fast or difficult breathing due to a problem in the chest or to a blocked or runny nose?
Now I would like to know how much (NAME) was given to drink (including breastmilk) during the illness with a (fever/cough).
Was he/she given less than usual to drink, about the same amount, or more than usual to drink?
IF LESS, PROBE: Was he/she given much less than usual to drink or somewhat less?
When (NAME) had a (fever/cough), was he/she given less than usual to eat, about the same amount, more than usual, or nothing to eat?
IF LESS, PROBE: Was he/she given much less than usual to eat or somewhat less?
Did you seek advice or treatment for the illness from any source?
W-30320 • Appendix D

LAST BIRTH NEXT-TO-LAST BIRTH SECOND-FROM-LAST BIRTH
NO. QUESTIONS AND FILTERS NAME ________________ NAME ________________ NAME _________________
534 PUBLIC MED. SECTOR PUBLIC MED. SECTOR PUBLIC MED. SECTORGOVT. HOSP. . A GOVT. HOSP. . A GOVT. HOSP. . AGOVT. HEALTH GOVT. HEALTH GOVT. HEALTH
CENTER . . . . . . B CENTER . . . . . . B CENTER . . . . . . BGOVT. MCH . . . C GOVT. MCH . . . C GOVT. MCH . . . C
PROBE TO IDENTIFY EACH UNIVERSITY UNIVERSITY UNIVERSITYTYPE OF SOURCE. HOSPITAL . . . D HOSPITAL . . . D HOSPITAL . . . D
ROYAL MEDICAL ROYAL MEDICAL ROYAL MEDICALIF UNABLE TO DETERMINE SERVICES . . . E SERVICES . . . E SERVICES . . . EIF PUBLIC OR PRIVATE OTHER PUBLIC F OTHER PUBLIC F OTHER PUBLIC FSECTOR, WRITE THE NAME OF THE PLACE. (SPECIFY) (SPECIFY) (SPECIFY)
PRIVATE MED. SECTOR PRIVATE MED. SECTOR PRIVATE MED. SECTORPVT. HOSPITAL/ PVT. HOSPITAL/ PVT. HOSPITAL/
(NAME OF PLACE(S)) CLINIC . . . . . . G CLINIC . . . . . . G CLINIC . . . . . . GPHARMACY . . . H PHARMACY . . . H PHARMACY . . . HPVT DOCTOR . . . I PVT DOCTOR . . . I PVT DOCTOR . . . IUNRWA HEALTH UNRWA HEALTH UNRWA HEALTH
CENTER . . . . . . J CENTER . . . . . . J CENTER . . . . . . J
OTHER PRIVATE OTHER PRIVATE OTHER PRIVATEMED. K MED. K MED. K
(SPECIFY) (SPECIFY) (SPECIFY)
OTHER X OTHER X OTHER X(SPECIFY) (SPECIFY) (SPECIFY)
535 CHECK 534: TWO OR ONLY TWO OR ONLY TWO OR ONLYMORE ONE MORE ONE MORE ONECODES CODE CODES CODE CODES CODE
CIRCLED CIRCLED CIRCLED CIRCLED CIRCLED CIRCLED
(SKIP TO 536A) (SKIP TO 536A) (SKIP TO 536A)
536
FIRST PLACE . . . FIRST PLACE . . . FIRST PLACE . . . USE LETTER CODE FROM 534.
536A How many days after the illnessbegan did you first seek adviceor treatment for (NAME)? DAYS . . . . . . DAYS . . . . . . DAYS . . . . . . IF THE SAME DAY, RECORD '00'.
536B Is (NAME) still sick with a (fever/ FEVER ONLY . . . . . . 1 FEVER ONLY . . . . . . 1 FEVER ONLY . . . . . . 1cough)? COUGH ONLY . . . 2 COUGH ONLY . . . 2 COUGH ONLY . . . 2
BOTH FEVER AND BOTH FEVER AND BOTH FEVER ANDCOUGH . . . . . . . . 3 COUGH . . . . . . . . 3 COUGH . . . . . . . . 3
NO, NEITHER . . . . . . 4 NO, NEITHER . . . . . . 4 NO, NEITHER . . . . . . 4DON'T KNOW . . . 8 DON'T KNOW . . . 8 DON'T KNOW . . . 8
537 YES . . . . . . . . . . . . . . 1 YES . . . . . . . . . . . . . . 1 YES . . . . . . . . . . . . . . 1NO . . . . . . . . . . . . . . 2 NO . . . . . . . . . . . . . . 2 NO . . . . . . . . . . . . . . 2
(GO BACK TO 503 (GO BACK TO 503 (GO TO 503 ININ NEXT COLUMN; IN NEXT COLUMN; NEXT-TO-LAST
OR, IF NO MORE OR, IF NO MORE COLUMN OF NEWBIRTHS, GO TO 555) BIRTHS, GO TO 555) QUESTIONNAIRE;DON'T KNOW . . . . . . 8 DON'T KNOW . . . . . . 8 OR, IF NO MORE
BIRTHS, GO TO 555)DON'T KNOW . . . . . . 8
At any time during the illness, did (NAME) take any drugs for the illness?
Where did you seek advice or treatment?
Anywhere else?
Where did you first seek advice or treatment?
W-31• 321Appendix D
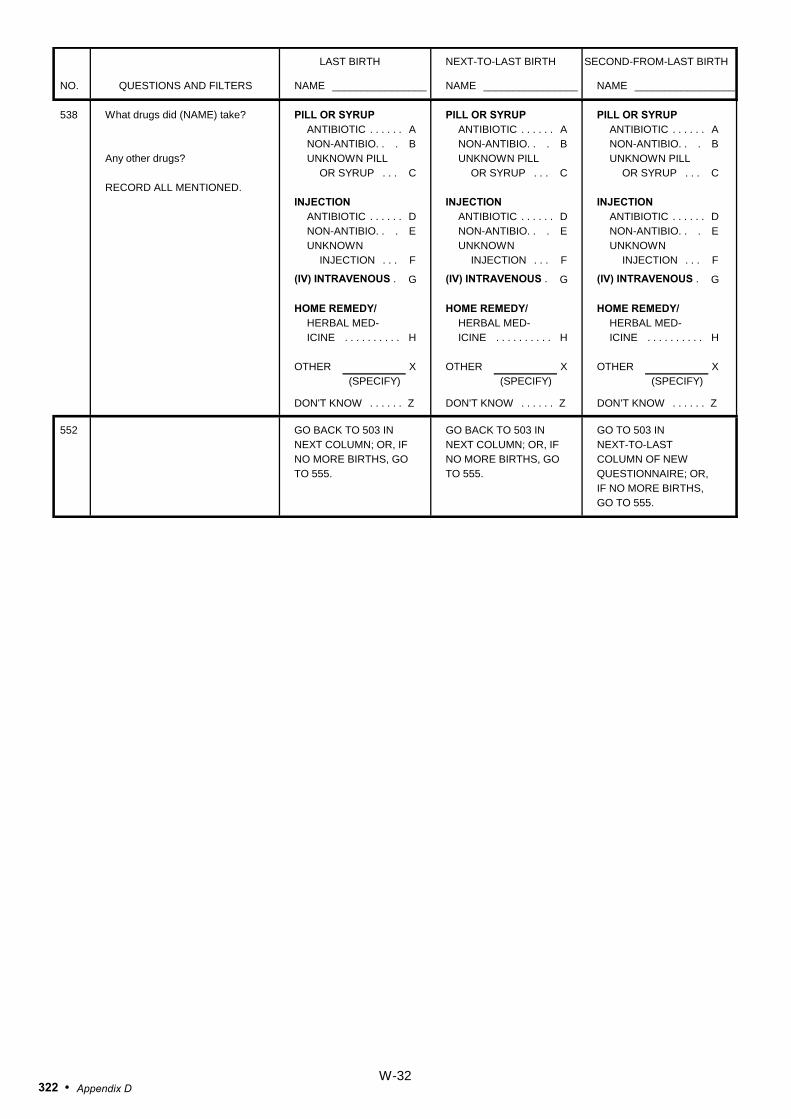
LAST BIRTH NEXT-TO-LAST BIRTH SECOND-FROM-LAST BIRTH
NO. QUESTIONS AND FILTERS NAME ________________ NAME ________________ NAME _________________
538 PILL OR SYRUP PILL OR SYRUP PILL OR SYRUPANTIBIOTIC . . . . . . A ANTIBIOTIC . . . . . . A ANTIBIOTIC . . . . . . ANON-ANTIBIO. . . B NON-ANTIBIO. . . B NON-ANTIBIO. . . BUNKNOWN PILL UNKNOWN PILL UNKNOWN PILL
OR SYRUP . . . C OR SYRUP . . . C OR SYRUP . . . CRECORD ALL MENTIONED.
INJECTION INJECTION INJECTIONANTIBIOTIC . . . . . . D ANTIBIOTIC . . . . . . D ANTIBIOTIC . . . . . . DNON-ANTIBIO. . . E NON-ANTIBIO. . . E NON-ANTIBIO. . . EUNKNOWN UNKNOWN UNKNOWN
INJECTION . . . F INJECTION . . . F INJECTION . . . F
(IV) INTRAVENOUS . G (IV) INTRAVENOUS . G (IV) INTRAVENOUS . G
HOME REMEDY/ HOME REMEDY/ HOME REMEDY/HERBAL MED- HERBAL MED- HERBAL MED-ICINE . . . . . . . . . . H ICINE . . . . . . . . . . H ICINE . . . . . . . . . . H
OTHER X OTHER X OTHER X(SPECIFY) (SPECIFY) (SPECIFY)
DON'T KNOW . . . . . . Z DON'T KNOW . . . . . . Z DON'T KNOW . . . . . . Z
552 GO BACK TO 503 IN GO BACK TO 503 IN GO TO 503 IN NEXT COLUMN; OR, IF NEXT COLUMN; OR, IF NEXT-TO-LAST NO MORE BIRTHS, GO NO MORE BIRTHS, GO COLUMN OF NEWTO 555. TO 555. QUESTIONNAIRE; OR,
IF NO MORE BIRTHS,GO TO 555.
What drugs did (NAME) take?
Any other drugs?
W-32322 • Appendix D

NO. QUESTIONS AND FILTERS CODING CATEGORIES SKIP
555 CHECK 522(a), ALL COLUMNS:
NO CHILD ANY CHILDRECEIVED AQUACELL RECEIVED 557
OR PARALAIT AQUACELL OR PARALAIT
556 YES . . . . . . . . . . . . . . . . . . . . . . . . . . . . 1NO . . . . . . . . . . . . . . . . . . . . . . . . . . . . 2
557 CHECK 215 AND 218, ALL ROWS:
NUMBER OF CHILDREN BORN IN 2010 OR LATER LIVING WITH THE RESPONDENT
ONE OR MORE NONE 601
RECORD NAME OF YOUNGEST CHILD LIVINGWITH HER AND CONTINUE WITH 558
(NAME)
Have you ever heard of a special product called Aquacell or Paralait you can get for the treatment of diarrhea?
W-33• 323Appendix D
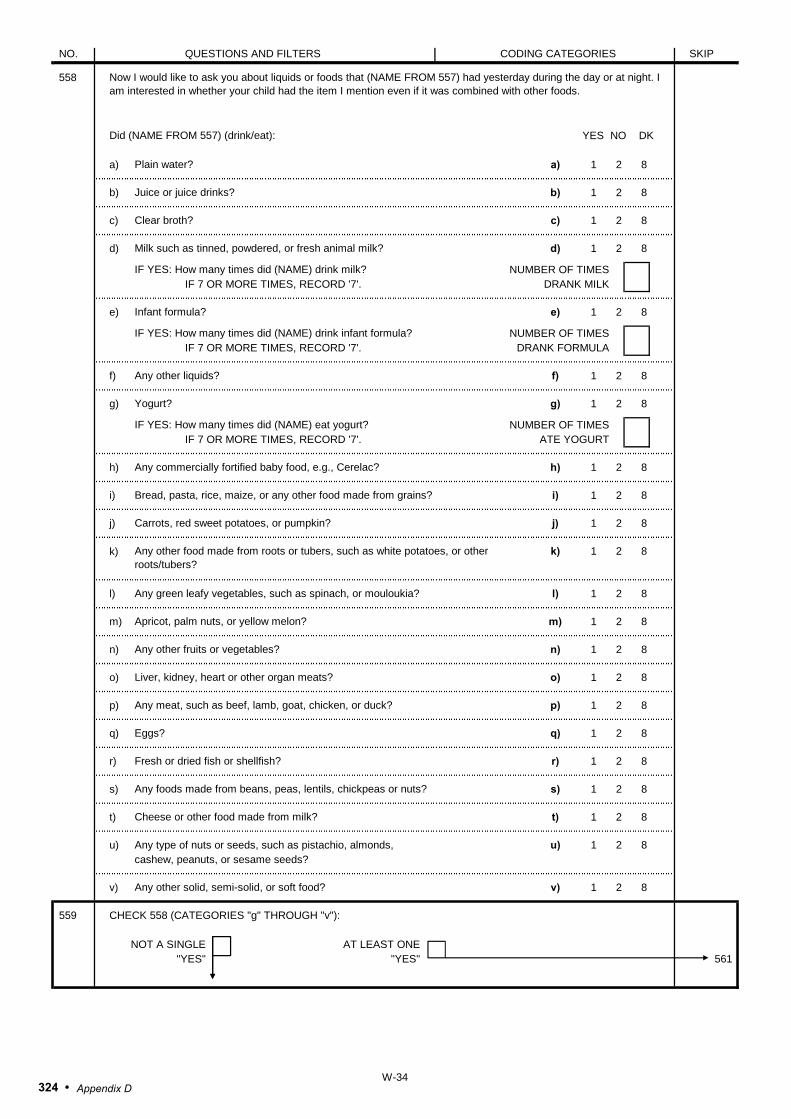
NO. QUESTIONS AND FILTERS CODING CATEGORIES SKIP
558
YES NO DK
a) a) 1 2 8
b) b) 1 2 8
c) c) 1 2 8
d) d) 1 2 8
NUMBER OF TIMESIF 7 OR MORE TIMES, RECORD '7'. DRANK MILK
e) e) 1 2 8
NUMBER OF TIMESIF 7 OR MORE TIMES, RECORD '7'. DRANK FORMULA
f) f) 1 2 8
g) g) 1 2 8
NUMBER OF TIMESIF 7 OR MORE TIMES, RECORD '7'. ATE YOGURT
h) h) 1 2 8
i) i) 1 2 8
j) j) 1 2 8
k) k) 1 2 8
l) l) 1 2 8
m) m) 1 2 8
n) n) 1 2 8
o) o) 1 2 8
p) p) 1 2 8
q) q) 1 2 8
r) r) 1 2 8
s) s) 1 2 8
t) t) 1 2 8
u) Any type of nuts or seeds, such as pistachio, almonds, u) 1 2 8cashew, peanuts, or sesame seeds?
v) v) 1 2 8
559 CHECK 558 (CATEGORIES "g" THROUGH "v"):
NOT A SINGLE AT LEAST ONE"YES" "YES" 561
Now I would like to ask you about liquids or foods that (NAME FROM 557) had yesterday during the day or at night. I am interested in whether your child had the item I mention even if it was combined with other foods.
Did (NAME FROM 557) (drink/eat):
Plain water?
Juice or juice drinks?
Clear broth?
Any green leafy vegetables, such as spinach, or mouloukia?
Milk such as tinned, powdered, or fresh animal milk?
IF YES: How many times did (NAME) drink milk?
Infant formula?
IF YES: How many times did (NAME) drink infant formula?
Any other liquids?
Yogurt?
Any other food made from roots or tubers, such as white potatoes, or other roots/tubers?
Fresh or dried fish or shellfish?
Any foods made from beans, peas, lentils, chickpeas or nuts?
Cheese or other food made from milk?
Any other solid, semi-solid, or soft food?
IF YES: How many times did (NAME) eat yogurt?
Any commercially fortified baby food, e.g., Cerelac?
Bread, pasta, rice, maize, or any other food made from grains?
Carrots, red sweet potatoes, or pumpkin?
Apricot, palm nuts, or yellow melon?
Any other fruits or vegetables?
Liver, kidney, heart or other organ meats?
Any meat, such as beef, lamb, goat, chicken, or duck?
Eggs?
W-34324 • Appendix D

NO. QUESTIONS AND FILTERS CODING CATEGORIES SKIP
560 YES . . . . . . . . . . . . . . . . . . . . . . . . . . . . 1(GO BACK TO 558 TO RECORDFOOD EATEN YESTERDAY)
NO . . . . . . . . . . . . . . . . . . . . . . . . . . . . 2 601
561 NUMBER OFTIMES . . . . . . . . . . . . . . . . . . . . . . . .
IF 7 OR MORE TIMES, RECORD ‘7'. DON'T KNOW . . . . . . . . . . . . . . . . . . . . 8
How many times did (NAME FROM 557) eat solid, semi-solid, or soft foods yesterday during the day or at night?
Did (NAME) eat any solid, semi-solid, or soft foods yesterday during the day or at night?
IF ‘YES’ PROBE: What kind of solid, semi-solid or soft foods did (NAME) eat?
W-35• 325Appendix D

SECTION 6. MARRIAGE AND SEXUAL ACTIVITY
NO. QUESTIONS AND FILTERS CODING CATEGORIES SKIP
601 CHECK 101A:WIDOWED/
CURRENTLY SEPARATED/ 606MARRIED/ DIVORCED
602 Is your husband living with you now or is he staying LIVING WITH HER . . . . . . . . . . . . . . . . 1elsewhere? STAYING ELSEWHERE . . . . . . . . . . . . 2
603 RECORD THE HUSBAND'S NAME AND LINE NAME _____________________________NUMBER FROM THE HOUSEHOLD QUESTIONNAIRE.IF HE IS NOT LISTED IN THE HOUSEHOLD, RECORD '00'.
LINE NO. . . . . . . . . . . . . . . . . . .
604 Does your husband have another wife (other wives) YES . . . . . . . . . . . . . . . . . . . . . . . . . . . . 1besides you? NO . . . . . . . . . . . . . . . . . . . . . . . . . . . . 2 606
605 Including yourself, in total, how many wives doesyour husband have? TOTAL NUMBER OF WIVES . .
DON'T KNOW . . . . . . . . . . . . . . . . . . 8
606 Have you been married only once or more than once? ONLY ONCE . . . . . . . . . . . . . . . . . . . . 1MORE THAN ONCE . . . . . . . . . . . . . . 2
607 CHECK 606:
MARRIED MARRIED MONTH . . . . . . . . . . . . . . . . ONLY ONCE MORE THAN ONCE
DON'T KNOW MONTH . . . . . . . . . 98In what month and year Now I would like to ask aboutdid you start living with your first husband.your husband In what month and year YEAR . . . . . . . . . . . . 609(consummate marriage)? did you start living with him
(consummate marriage)? DON'T KNOW YEAR . . . . . . . . . . . . 9998
608 How old were you when you first started living with him?AGE . . . . . . . . . . . . . . . . . . . .
609 Before you got married, was your (first) husband related YES . . . . . . . . . . . . . . . . . . . . . . . . . . . . 1to you in any way? NO . . . . . . . . . . . . . . . . . . . . . . . . . . . . 2 611
610 What type of relation was it? FIRST COUSIN ON BOTH FATHERAND MOTHER’S SIDE . . . . . . . . . . . . 01
FIRST COUSIN ON BOTH MOTHERAND FATHER’S SIDE . . . . . . . . . . . . 02
FIRST COUSIN ON FATHER'S SIDE (IBN AL AMM) . . . . . . . . . . . . 03
FIRST COUSIN ON MOTHER'S SIDE (IBN AL KHAL) . . . . . . . . . . . . 04
FIRST COUSIN ON FATHER'S SIDE (IBN AL AMMAH) . . . . . . . . . . . . . . 05
FIRST COUSIN ON MOTHER'S SIDE (IBN AL KHALAH) . . . . . . . . . . . . . . 06
SECOND COUSIN (FATHER’S SIDE) . 07SECOND COUSIN (MOTHER’S SIDE) . 08OTHER RELATIVE . . . . . . . . . . . . . . . . 09DON’T KNOW . . . . . . . . . . . . . . . . 98
W-36326 • Appendix D

NO. QUESTIONS AND FILTERS CODING CATEGORIES SKIP
611 CHECK 606:
MARRIED MARRIED YES . . . . . . . . . . . . . . . . . . . . . . . . . . . . 1ONLY ONCE MORE THAN ONCE
NO . . . . . . . . . . . . . . . . . . . . . . . . . . . . 2Did your husband have Now I would like to ask abouta premarital medical your last marriage. DON’T KNOW . . . . . . . . . . . . . . . . . . . . 8exam? Did your husband have a
premarital medical exam?
611A Did you have a premarital medical exam? YES . . . . . . . . . . . . . . . . . . . . . . . . . . . . 1NO . . . . . . . . . . . . . . . . . . . . . . . . . . . . 2 612
611B Where did you go for the premarital medical exam? PUBLIC MEDICAL SECTORGOVT. HOSPITAL . . . . . . . . . . . . . . 11GOVT. HEALTH CENTER . . . . . . . 12GOVT. MCH . . . . . . . . . . . . . . . . . . 13UNIVERSITY HOSPITAL . . . . . . . . . 14ROYAL MEDICAL SERVICES 15
OTHER PUBLIC 16(SPECIFY)
PRIVATE MEDICAL SECTORPRIVATE HOSPITAL/CLINIC . . . . . 21PRIVATE DOCTOR . . . . . . . . . . . . 22JORDANIAN AS. OF FP AND
PROTECTION (JAFPP) . . . . . 23UNRWA HEALTH CENTER . . . . . 24OTHER NON GOV. ORGANIZATION. 25OTHER PRIVATE
MEDICAL 26(SPECIFY)
OTHER 96(SPECIFY)
612 When was the last time you had sexual intercourse?
DAYS AGO . . . . . . . . . . . . 1IF LESS THAN 12 MONTHS, ANSWER MUST BE RECORDEDIN DAYS, WEEKS OR MONTHS. WEEKS AGO . . . . . . . . . 2IF 12 MONTHS (ONE YEAR) OR MORE, ANSWER MUST BERECORDED IN YEARS. MONTHS AGO . . . . . . . 3
YEARS AGO . . . . . . . . . 4 614
613 The last time you had sexual intercourse, was a condom YES . . . . . . . . . . . . . . . . . . . . . . . . . . . . 1used? NO . . . . . . . . . . . . . . . . . . . . . . . . . . . . 2
614 Do you know of a place where a person can get condoms? YES . . . . . . . . . . . . . . . . . . . . . . . . . . . . 1NO . . . . . . . . . . . . . . . . . . . . . . . . . . . . 2 615A
W-37• 327Appendix D

NO. QUESTIONS AND FILTERS CODING CATEGORIES SKIP
615 Where is that? PUBLIC MEDICAL SECTORGOVT. HOSPITAL . . . . . . . . . . . . . . A
Any other place? GOVT. HEALTH CENTER . . . . . . . BGOVT. MCH . . . . . . . . . . . . . . . . . . C
PROBE TO IDENTIFY EACH TYPE OF SOURCE AND UNIVERSITY HOSPITAL/CLINIC DCIRCLE THE APPROPRIATE CODE(S). ROYAL MEDICAL SERVICES . . . E
OTHER PUBLIC ________________ F(SPECIFY)
IF UNABLE TO DETERMINE IF HOSPITAL, HEALTH CENTER PRIVATE MEDICAL SECTOR OR CLINIC IS PUBLIC OR PRIVATE MEDICAL, WRITE PRIVATE HOSPITAL/CLINIC . . . . . GTHE NAME OF THE PLACE. PRIVATE DOCTOR . . . . . . . . . . . . . . H
PHARMACY . . . . . . . . . . . . . . . . . . IJORDANIAN AS. OF FP AND
(NAME OF PLACE(S)) PROTECTION (JAFPP) . . . . . JUNRWA CLINIC . . . . . . . . . . . . . . KOTHER NON-GOV ORGANIZATION LOTHER PRIVATE
MEDICAL M(SPECIFY)
OTHER SOURCEFRIEND/RELATIVE . . . . . . . . . . . . . . N
OTHER _________________________ X(SPECIFY)
615A Have you performed a breast cancer self exam to detect breast YES . . . . . . . . . . . . . . . . . . . . . . . . . . . . 1cancer in yourself within the last 12 months? NO . . . . . . . . . . . . . . . . . . . . . . . . . . . . 2
DK BREAST CANCER/DK SELF EXAM . . . . . . . . . . . . . . 8
615B Have you had a breast cancer clinical exam to detect breast YES . . . . . . . . . . . . . . . . . . . . . . . . . . . . 1cancer in the last 12 months? NO . . . . . . . . . . . . . . . . . . . . . . . . . . . . 2
NOT SURE . . . . . . . . . . . . . . . . . . . . . . 8
615C Have you ever heard of a pap smear, that is, an exam that YES . . . . . . . . . . . . . . . . . . . . . . . . . . . . 1consists of removing cells from the cervix to detect changes that NO . . . . . . . . . . . . . . . . . . . . . . . . . . . . 2 700can suggest the presence of cancer in a woman's womb?
615D Have you ever had such an exam in your life time? YES . . . . . . . . . . . . . . . . . . . . . . . . . . . . 1NO . . . . . . . . . . . . . . . . . . . . . . . . . . . . 2
W-38328 • Appendix D

SECTION 7. FERTILITY PREFERENCES
NO. QUESTIONS AND FILTERS CODING CATEGORIES SKIP
700 CHECK 101A:
CURRENTLY CURRENTLYMARRIED WIDOWED, 712
DIVORCED, OR SEPARATED
701 CHECK 304:
NEITHER HE OR SHESTERILIZED STERILIZED 712
702 CHECK 226:
NOT PREGNANTPREGNANT OR UNSURE 704
703 HAVE ANOTHER CHILD . . . . . . . . . . . . 1 705NO MORE . . . . . . . . . . . . . . . . . . . . . . 2UNDECIDED/DON'T KNOW . . . . . . . . . 8 711
704 HAVE (A/ANOTHER) CHILD . . . . . . . 1NO MORE/NONE . . . . . . . . . . . . . . . . . . 2 707SAYS SHE CAN'T GET PREGNANT . 3 712UNDECIDED/DON'T KNOW . . . . . . . . . 8 710
705 CHECK 226:MONTHS . . . . . . . . . . . . . . 1
NOT PREGNANT PREGNANTOR UNSURE YEARS . . . . . . . . . . . . . . 2
SOON/NOW . . . . . . . . . . . . . . . . . . 993 710SAYS SHE CAN'T GET PREGNANT . 994 712
OTHER _______________________ 996(SPECIFY) 710
DON'T KNOW . . . . . . . . . . . . . . . . . . 998
706 CHECK 226:
NOT PREGNANT PREGNANTOR UNSURE 711
707 CHECK 303: USING A CONTRACEPTIVE METHOD?
NOT CURRENTLYCURRENTLY USING 712
USING
708 CHECK 705:
NOT 24 OR MORE MONTHS 00-23 MONTHSASKED OR 02 OR MORE YEARS OR 00-01 YEAR 711
Now I have some questions about the future. After the child you are expecting now, would you like to have another child, or would you prefer not to have any more children?
Now I have some questions about the future. Would you like to have (a/another) child, or would you prefer not to have any (more) children?
How long would you like to wait from now before the birth of (a/another) child?
After the birth of the child you are expecting now, how long would you like to wait before the birth of another child?
W-39• 329Appendix D

NO. QUESTIONS AND FILTERS CODING CATEGORIES SKIP
709 CHECK 704: FERTILITY-RELATED REASONSNOT HAVING SEX . . . . . . . . . . . . . . A
WANTS TO HAVE WANTS NO MORE/ INFREQUENT SEX . . . . . . . . . . . . . . BA/ANOTHER CHILD NONE MENOPAUSAL/HYSTERECTOMY . C
SUBFECUND/INFECUND . . . . . . . DPOSTPARTUM AMENORRHEIC . . . EBREASTFEEDING . . . . . . . . . . . . . . FDIFFICULT TO GET PREGNANT . . . G
OPPOSITION TO USERESPONDENT OPPOSED . . . . . . . HHUSBAND OPPOSED . . . . . . . . . . . . IOTHERS OPPOSED . . . . . . . . . . . . JRELIGIOUS PROHIBITION . . . . . . . KRUMORS . . . . . . . . . . . . . . . . . . . . . . L
LACK OF KNOWLEDGEKNOWS NO METHOD . . . . . . . . . . . . M
RECORD ALL REASONS MENTIONED. KNOWS NO SOURCE . . . . . . . . . . . . N
METHOD-RELATED REASONSHEALTH CONCERNS . . . . . . . . . . . . OFEAR OF SIDE EFFECTS . . . . . . . PLACK OF ACCESS/TOO FAR . . . . . QCOSTS TOO MUCH . . . . . . . . . . . . RINCONVENIENT TO USE . . . . . . . SINTERFERES WITH BODY'S
NORMAL PROCESSES . . . . . . . T
OTHER _______________________ X(SPECIFY)
DON'T KNOW . . . . . . . . . . . . . . . . . . . . Z
710 CHECK 303: USING A CONTRACEPTIVE METHOD?
NOT NO, YES,ASKED NOT CURRENTLY USING CURRENTLY USING 712
711 YES . . . . . . . . . . . . . . . . . . . . . . . . . . . . 1NO . . . . . . . . . . . . . . . . . . . . . . . . . . . . 2 711BDON'T KNOW . . . . . . . . . . . . . . . . . . . . 8 712
711A Which contraceptive method would you prefer to use? FEMALE STERILIZATION . . . . . . . . . 01MALE STERILIZATION . . . . . . . . . . . . 02PILL . . . . . . . . . . . . . . . . . . . . . . . . . . . . 03IUD . . . . . . . . . . . . . . . . . . . . . . . . . . . . 04INJECTABLES . . . . . . . . . . . . . . . . . . . . 05IMPLANTS . . . . . . . . . . . . . . . . . . . . . . 06CONDOM . . . . . . . . . . . . . . . . . . . . . . 07FEMALE CONDOM . . . . . . . . . . . . . . . . 08 712DIAPHRAGM . . . . . . . . . . . . . . . . . . . . 09FOAM/JELLY . . . . . . . . . . . . . . . . . . . . 10LACTATIONAL AMEN. METHOD . . . . . 11RHYTHM METHOD/PERIOD. ABSTIN. . 12WITHDRAWAL . . . . . . . . . . . . . . . . . . 13
OTHER _______________________ 96(SPECIFY)
DK/UNSURE . . . . . . . . . . . . . . . . . . . . 98
You have said that you do not want (a/another) child soon.
You have said that you do not want any (more) children.
Can you tell me why you are not using a method to prevent pregnancy?
Can you tell me why you are not using a method to prevent pregnancy?
Any other reason? Any other reason?
Do you think you will use a contraceptive method to delay or avoid pregnancy at any time in the future?
W-40330 • Appendix D

NO. QUESTIONS AND FILTERS CODING CATEGORIES SKIP
711B What is the main reason that you think you will not use a FERTILITY-RELATED REASONScontraceptive method at any time in the future? INFREQUENT SEX/NO SEX . . . 11
MENOPAUSAL/HYSTERECTOMY 12SUBFECUND/INFECUND . . . . . 13WANTS AS MANY CHILDREN AS
POSSIBLE . . . . . . . . . . . . . . . . 14
OPPOSITION TO USERESPONDENT OPPOSED . . . . . 21 711DHUSBAND OPPOSED . . . . . . . . . . . . 22OTHERS OPPOSED . . . . . . . . . 23RELIGIOUS PROHIBITION . . . . . 24RUMORS 25
LACK OF KNOWLEDGEKNOWS NO METHOD . . . . . . . . . 31KNOWS NO SOURCE . . . . . . . . . 32
METHOD-RELATED REASONSHEALTH CONCERNS . . . . . . . . . 41FEAR OF SIDE EFFECTS . . . . . 42LACK OF ACCESS/TOO FAR . . . 43COSTS TOO MUCH . . . . . . . . . 44INCONVENIENT TO USE . . . . . . . 45INTERFERES WITH BODY'S
NORMAL PROCESSES . . . . . 46
OTHER _______________________ 96(SPECIFY)
DON'T KNOW . . . . . . . . . . . . . . . . . . 98
711C Why does your husband disapprove of using contraception? AGAINST RELIGION . . . . . . . . . . . . . . ACAUSE HEALTH PROBLEMS . . . . . . . BFEAR OF SIDE EFFECTS . . . . . . . . . CCOST TOO MUCH . . . . . . . . . . . . . . . . DINTERFERES WITH BODY'S
RECORD ALL REASONS MENTIONED. NORMAL PROCESSES . . . . . . . . . EFATALISTIC . . . . . . . . . . . . . . . . . . . . F
OTHER _______________________ X(SPECIFY)
DON'T KNOW . . . . . . . . . . . . . . . . . . Z
711D Why do you disapprove of using contraception? AGAINST RELIGION . . . . . . . . . . . . . . ACAUSE HEALTH PROBLEMS . . . . . . . BFEAR OF SIDE EFFECTS . . . . . . . . . CCOST TOO MUCH . . . . . . . . . . . . . . . . DINTERFERES WITH BODY'S
RECORD ALL REASONS MENTIONED. NORMAL PROCESSES . . . . . . . . . EFATALISTIC . . . . . . . . . . . . . . . . . . . . F
OTHER _______________________ X(SPECIFY)
DON'T KNOW . . . . . . . . . . . . . . . . . . Z
712
712
712
W-41• 331Appendix D

NO. QUESTIONS AND FILTERS CODING CATEGORIES SKIP
712 CHECK 216:
HAS LIVING CHILDREN NO LIVING CHILDRENNONE . . . . . . . . . . . . . . . . . . . . . . . . . . 00 714
NUMBER . . . . . . . . . . . . . . . . . .
OTHER _______________________ 96 714(SPECIFY)
PROBE FOR A NUMERIC RESPONSE.
713 BOYS GIRLS EITHER
NUMBER
OTHER _______________________ 96(SPECIFY)
713ANUMBER . . . . . . . . . . . . . . . . . .
OTHER ______________________ 96
PROBE FOR A NUMERIC RESPONSE. (SPECIFY)
714 YES NO
Heard about family planning on the radio? RADIO . . . . . . . . . . . . . . . . . . . . 1 2Seen about family planning on the television? TELEVISION . . . . . . . . . . . . . . 1 2Read about family planning in a newspaper or magazine? NEWSPAPER OR MAGAZINE . 1 2Seen or read about family planning on posters? POSTER . . . . . . . . . . . . . . . . . . 1 2Read about family planning in bulletins/booklets? BULLETIN/BOOKLET . . . . . . . 1 2Heard about family planning in lectures? LECTURE. . . . . . . . . . . . . . . . . . 1 2Heard about family planning from women you associate with? WOMEN . . . . . . . . . . . . . . . . . . 1 2Heard about family planning from any other people
you associate with? OTHER PEOPLE . . . . . . . . . . . . 1 2Heard about family planning at a community event? COMMUNITY EVENT . . . . . . . 1 2
714A YES . . . . . . . . . . . . . . . . . . . . . . . . . . . . 1NO . . . . . . . . . . . . . . . . . . . . . . . . . . . . 2DON'T KNOW . . . . . . . . . . . . . . . . . . . . 8
714B YES . . . . . . . . . . . . . . . . . . . . . . . . . . . . 1NO . . . . . . . . . . . . . . . . . . . . . . . . . . . . 2
SHOW THE HOT BALLOON CARD DON'T KNOW . . . . . . . . . . . . . . . . . . . . 8 715
714C What does Hayatee Ahla mean to you? FAMILY PLANNING AUSING CONTRACEPTIVES B
PROBE: Anything else? ADVANTAGE OF MODERN CONTRA. CHAPPY SMALL FAMILY D
CIRCLE ALL RESPONSES. SPACING AT LEAST 3 YEARSBETWEEN PREGNANCIES . . . . . . . E
QUALITY OF LIFE/WELL BEING/ PROSPERITY F
SUPPORT OF GENDER EQUALITYBY ISLAM . . . . . . . . . . . . . . . . . . . . G
LIFE PLANNING HREPRODUCTIVE HEALTH IAPPROVAL OF USING MODERN
CONTRACEPTIVES BY ISLAM . . . JAPPROVAL OF ON SPACING PREG.
BY AT LEAST 3 YEARS . . . . . . . . . K
OTHER _______________________ X(SPECIFY)
DON'T KNOW . . . . . . . . . . . . . . . . . . . . Y
. . . . . . . . . . . . . . .. . . . . . . .
. . . . . . . . . .
. . . . . . . . . . . . . . . . .. . . . . . . .
. . . . . . . . . . . . . . . . . .
In the last few months have you ever seen this logo for the Hayatee Ahla campaign?
If you could go back to the time you did not have any children and could choose exactly the number of children to have in your whole life, how many would that be?
If you could choose exactly the number of children to have in your whole life, how many would that be?
If you could choose exactly the number of months to wait between the birth of one child and the birth of another, how many months would that be?
In the last few months have you seen, heard or read about Hayatee Ahla?
How many of these children would you like to be boys, how many would you like to be girls and for how many would it not matter if it’s a boy or a girl?
In the last few months have you:
W-42332 • Appendix D

NO. QUESTIONS AND FILTERS CODING CATEGORIES SKIP
715 Where and from whom would you prefer to get information INTERPERSONALabout family planning? GOVERN. HEALTH WORKER . . . . . 11
PRIVATE DOCTOR/NURSE . . . . . . . 12JAFPP STAFF . . . . . . . . . . . . . . . . . . 13
CIRCLE ONLY ONE ANSWER. HUSBAND . . . . . . . . . . . . . . . . . . . . 14OTHER RELATIVES . . . . . . . . . . . . . . 15FRIENDS . . . . . . . . . . . . . . . . . . . . . . 16
MEDIARADIO . . . . . . . . . . . . . . . . . . . . . . . . 21TV . . . . . . . . . . . . . . . . . . . . . . . . . . 22PRINT MATERIALS . . . . . . . . . . . . . . 23SCHOOL, LIBRARY/ACADEMIC . . . 24COMMUNITY/PUBLIC MEETING . . . 25LECTURES . . . . . . . . . . . . . . . . . . . . 26
OTHER _______________________ 96(SPECIFY)
DON'T KNOW . . . . . . . . . . . . . . . . . . . . 98
716 CHECK 601:CURRENTLY
YES, WIDOWED,CURRENTLY DIVORCED, OR 801
MARRIED SEPARATED
716A CHECK 304: CODE B, G, OR MCIRCLED
OTHER 718CODES NO CODECIRCLED CIRCLED 718A
716B Does your husband know that you are using YES . . . . . . . . . . . . . . . . . . . . . . . . . . . . 1a method of family planning? NO . . . . . . . . . . . . . . . . . . . . . . . . . . . . 2
DON'T KNOW . . . . . . . . . . . . . . . . . . . . 8
717 CHECK 303: USING A CONTRACEPTIVE METHOD?NOT
CURRENTLY CURRENTLYUSING USING 718A
OR NOT ASKED
718 MAINLY RESPONDENT . . . . . . . . . 1MAINLY HUSBAND/PARTNER . . . . . 2JOINT DECISION . . . . . . . . . . . . . . . . 3OTHER 6
(SPECIFY)
718A Now I want to ask you about your husband’s views on APPROVES . . . . . . . . . . . . . . . . . . . . 1family planning. DISAPPROVES . . . . . . . . . . . . . . . . . . 2Do you think that your husband approves or disapproves of DON’T KNOW . . . . . . . . . . . . . . . . . . . . 8couples using a contraceptive method to avoid pregnancy?
719 CHECK 304:
NEITHER HE OR SHESTERILIZED STERILIZED 801
720 SAME NUMBER . . . . . . . . . . . . . . . . . . 1MORE CHILDREN . . . . . . . . . . . . . . . . 2FEWER CHILDREN . . . . . . . . . . . . . . . . 3DON'T KNOW . . . . . . . . . . . . . . . . . . . . 8
Would you say that using contraception is mainly your decision, mainly your husband's decision, or did you both decide together?
Does your (husband/partner) want the same number of children that you want, or does he want more or fewer than you want?
W-43• 333Appendix D

SECTION 8. HUSBAND'S BACKGROUND AND WOMAN'S WORK
NO. QUESTIONS AND FILTERS CODING CATEGORIES SKIP
801 CHECK 101A:CURRENTLY
CURRENTLY WIDOWED, 803MARRIED DIVORCED, OR
SEPARATED
802 How old was your husband on his last birthday?AGE IN COMPLETED YEARS
803 Did your (last) husband ever attend school? YES . . . . . . . . . . . . . . . . . . . . . . . . . . . . 1NO . . . . . . . . . . . . . . . . . . . . . . . . . . . . 2 806
804 What is the highest level of school he attended: OLD SYSTEMOld elementary, old preparatory, old secondary, new basic, ELEMENTARY . . . . . . . . . . . . . . . . . . 01new secondary, intermediate diploma, bachelor, or higher? PREPARATORY . . . . . . . . . . . . . . . . 02
SECONDARY . . . . . . . . . . . . . . . . . . 03NEW SYSTEM
BASIC . . . . . . . . . . . . . . . . . . . . . . . . 04SECONDARY . . . . . . . . . . . . . . . . . . 05
INTERMEDIATE DIPLOMA . . . . . . . . . 06BACHELOR . . . . . . . . . . . . . . . . . . . . 07HIGHER . 08DON'T KNOW . . . . . . . . . . . . . . . . . . 98 806
805 What was the highest grade he completed atthat level? GRADE . . . . . . . . . . . . . . . .
DON'T KNOW . . . . . . . . . . . . . . . . . . 98
806 CHECK 101A:CURRENTLY
CURRENTLY WIDOWED, 811MARRIED DIVORCED, OR
SEPARATED
807 Has your husband done any work in the last seven days, even YES . . . . . . . . . . . . . . . . . . . . . . . . . . . . 1 809for one hour? By “work”, I mean any paid work, any work in a business completely or partially owned by your husband, any NO . . . . . . . . . . . . . . . . . . . . . . . . . . . . 2work in a business owned by the household without payment, or work in other business?
808 Does your husband have any job, but he did not practice it YES . . . . . . . . . . . . . . . . . . . . . . . . . . . . 1during the last seven days for a reason such as vacation, travel,or illness? NO . . . . . . . . . . . . . . . . . . . . . . . . . . . . 2 811
809 What is your husband’s current occupation, that is, what kindof work does he mainly do?
810 What is your husband’s employment status: is he an employee, EMPLOYEE . . . . . . . . . . . . . . . . . . . . . . 1an employer, is he self-employed, is he working for his family EMPLOYER . . . . . . . . . . . . . . . . . . . . . . 2without payment, or is he working for someone else without SELF-EMPLOYED . . . . . . . . . . . . . . . . 3payment? UNPAID FAMILY WORKER . . . . . . . . . 4
UNPAID WORKER . . . . . . . . . . . . . . . . 5
811 Have you done any work in the last seven days, even for one YES . . . . . . . . . . . . . . . . . . . . . . . . . . . . 1 813hour? By “work”, I mean any paid work, any work in a business completely or partially owned by yourself, any work in a business NO . . . . . . . . . . . . . . . . . . . . . . . . . . . . 2owned by the household without payment, or work in other business?
W-44334 • Appendix D

NO. QUESTIONS AND FILTERS CODING CATEGORIES SKIP
812 Do you have any job, but you did not practice it during the last YES . . . . . . . . . . . . . . . . . . . . . . . . . . . . 1 813seven days for a reason such as vacation, travel, or illness? NO . . . . . . . . . . . . . . . . . . . . . . . . . . . . 2
812A Have you ever done any work before? YES . . . . . . . . . . . . . . . . . . . . . . . . . . . . 1NO . . . . . . . . . . . . . . . . . . . . . . . . . . . . 2 818
812B Why did you stop working? GOT MARRIED ABECAME PREGNANT BBECAME ILL CHUSBAND OPPOSED DOTHER OPPOSED . . . . . . . . . . . . . . . . EDIDN'T NEED TO WORK F 818DIDN'T NEED MONEY GCAN'T FIND A JOB HI LOST MY JOB II GOT FIRED JOTHER X
(SPECIFY)DON'T KNOW Y
813 What is your current occupation, that is, what kind of work do you mainly do?
814 What is your employment status: are you an employee, an EMPLOYEE . . . . . . . . . . . . . . . . . . . . . . 1employer, are you self-employed, are you working for your EMPLOYER . . . . . . . . . . . . . . . . . . . . . . 2family without payment, or are you working for someone else SELF-EMPLOYED . . . . . . . . . . . . . . . . 3without payment? UNPAID FAMILY WORKER . . . . . . . . . 4
UNPAID WORKER . . . . . . . . . . . . . . . . 5
818 CHECK 101A:CURRENTLY
CURRENTLY WIDOWED,MARRIED DIVORCED, OR
SEPARATED 827
819 CHECK 814:CODE 4, OR 5
CODE 1, 2, OR 3 CIRCLED ORCIRCLED 814 NOT ASKED 822
820 Who usually decides how the money you earn will be used: RESPONDENT . . . . . . . . . . . . . . . . . . 1mainly you, mainly your husband, or you and your husband HUSBAND . . . . . . . . . . . . . . . . . . . . . . 2jointly? RESPONDENT AND
HUSBAND JOINTLY . . . . . . . . . . . . 3OTHER 6
(SPECIFY)
821 Would you say that the money that you earn is more than what MORE THAN HIM . . . . . . . . . . . . . . . . . . 1your husband earns, less than what he earns, or about the same? LESS THAN HIM . . . . . . . . . . . . . . . . . . 2
ABOUT THE SAME . . . . . . . . . . . . . . . . 3HUSBAND DOESN'T BRING IN
ANY MONEY . . . . . . . . . . . . . . . . . . 4 822ADON'T KNOW . . . . . . . . . . . . . . . . . . . . 8
822 Who usually decides how your husband's earnings RESPONDENT . . . . . . . . . . . . . . . . . . 1will be used: you, your husband, or you and your husband HUSBAND . . . . . . . . . . . . . . . . . . . . . . 2jointly? RESPONDENT AND
HUSBAND JOINTLY . . . . . . . . . . . . 3HUSBAND HAS NO EARNINGS . . . . . 4OTHER 6
(SPECIFY)
. . . . . . . . . . . . . . .. . . . . . . . . . . . . . . . .
. . . . . . . . . . . . . . . . . . .
. . . . . . . . . . . . . . . . . . . .
. . . . . . . . . . . . . . . . .. . . . . . . . . . . .
. . . . . . . . . . . . . . . . . . . . . . . . . . . . . . . .
. . . . . . . . . . . . . . . . . . . . . .
W-45• 335Appendix D

NO. QUESTIONS AND FILTERS CODING CATEGORIES SKIP
822A CHECK 814:CODES CODE 4, OR 5
1, 2, 0R 3 CIRCLED OR YES . . . . . . . . . . . . . . . . . . . . . . . . . . . . 1CIRCLED 814 NOT ASKED
In addition to your employment Do you have income from NO . . . . . . . . . . . . . . . . . . . . . . . . . . . . 2 823income, do you have income any source such as realfrom any other source, such estate, retirement, as real estate, retirement, allowances, etc.?allowances, etc.?
822B Who usually decides how the (additional) money you earn will RESPONDENT . . . . . . . . . . . . . . . . . . 1be used: mainly you, mainly your husband, or you and your HUSBAND . . . . . . . . . . . . . . . . . . . . . . 2husband jointly? RESPONDENT AND
HUSBAND JOINTLY . . . . . . . . . . . . 3OTHER 6
(SPECIFY)
823 Who usually makes decisions about health care for yourself: RESPONDENT . . . . . . . . . . . . . . . . . . 1you, your husband, you and your husband jointly, or HUSBAND . . . . . . . . . . . . . . . . . . . . . . 2someone else? RESPONDENT AND
HUSBAND JOINTLY . . . . . . . . . . . . 3SOMEONE ELSE . . . . . . . . . . . . . . . . . . 4OTHER 6
(SPECIFY)
824 Who usually makes decisions about making major RESPONDENT . . . . . . . . . . . . . . . . . . 1household purchases? HUSBAND . . . . . . . . . . . . . . . . . . . . . . 2
RESPONDENT AND HUSBAND JOINTLY . . . . . . . . . . . . 3
SOMEONE ELSE . . . . . . . . . . . . . . . . . . 4OTHER 6
(SPECIFY)
826 Who usually makes decisions about visits to your family RESPONDENT . . . . . . . . . . . . . . . . . . 1or relatives? HUSBAND . . . . . . . . . . . . . . . . . . . . . . 2
RESPONDENT AND HUSBAND JOINTLY . . . . . . . . . . . . 3
SOMEONE ELSE . . . . . . . . . . . . . . . . . . 4OTHER 6
(SPECIFY)
826A ALONE ONLY . . . . . . . . . . . . . . . . . . . . 1JOINTLY ONLY . . . . . . . . . . . . . . . . . . 2BOTH ALONE AND JOINTLY . . . . . . . 3DOES NOT OWN . . . . . . . . . . . . . . . . 4
826B ALONE ONLY . . . . . . . . . . . . . . . . . . . . 1JOINTLY ONLY . . . . . . . . . . . . . . . . . . 2BOTH ALONE AND JOINTLY . . . . . . . 3DOES NOT OWN . . . . . . . . . . . . . . . . 4
Do you own this or any other house either alone or jointly with someone else?
Do you own any land either alone or jointly with someone else?
W-46336 • Appendix D
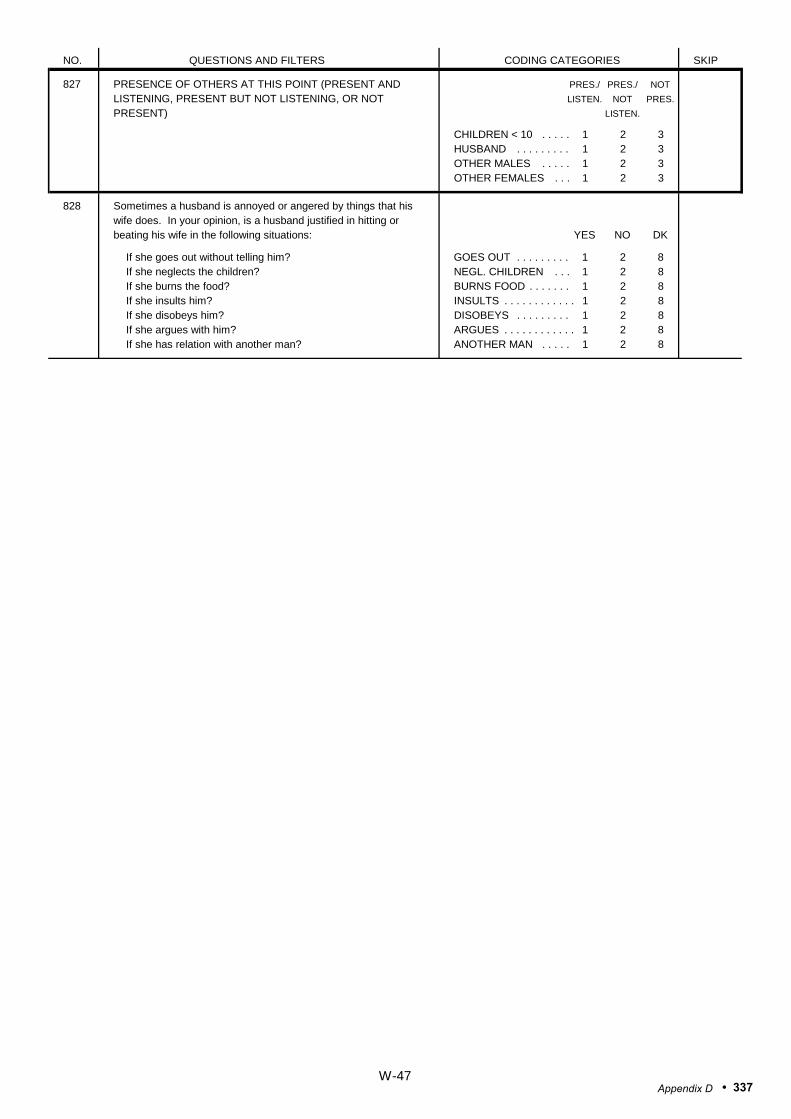
NO. QUESTIONS AND FILTERS CODING CATEGORIES SKIP
827 PRESENCE OF OTHERS AT THIS POINT (PRESENT AND PRES./ PRES./ NOT
LISTENING, PRESENT BUT NOT LISTENING, OR NOT LISTEN. NOT PRES.
PRESENT) LISTEN.
CHILDREN < 10 . . . . . 1 2 3HUSBAND . . . . . . . . . 1 2 3OTHER MALES . . . . . 1 2 3OTHER FEMALES . . . 1 2 3
828 Sometimes a husband is annoyed or angered by things that hiswife does. In your opinion, is a husband justified in hitting orbeating his wife in the following situations: YES NO DK
If she goes out without telling him? GOES OUT . . . . . . . . . 1 2 8If she neglects the children? NEGL. CHILDREN . . . 1 2 8If she burns the food? BURNS FOOD . . . . . . . 1 2 8If she insults him? INSULTS . . . . . . . . . . . . 1 2 8If she disobeys him? DISOBEYS . . . . . . . . . 1 2 8If she argues with him? ARGUES . . . . . . . . . . . . 1 2 8If she has relation with another man? ANOTHER MAN . . . . . 1 2 8
W-47• 337Appendix D

SECTION 9. HIV/AIDS AND STI
NO. QUESTIONS AND FILTERS CODING CATEGORIES SKIP
901 Now I would like to talk about something else. YES . . . . . . . . . . . . . . . . . . . . . . . . . . . . 1Have you ever heard of an illness called AIDS? NO . . . . . . . . . . . . . . . . . . . . . . . . . . . . 2 916
902 Can people reduce their chance of getting the AIDS virus YES . . . . . . . . . . . . . . . . . . . . . . . . . . . . 1by having just one uninfected sex partner who has no other NO . . . . . . . . . . . . . . . . . . . . . . . . . . . . 2sex partners? DON'T KNOW . . . . . . . . . . . . . . . . . . . . 8
903 Can people get the AIDS virus from mosquito bites? YES . . . . . . . . . . . . . . . . . . . . . . . . . . . . 1NO . . . . . . . . . . . . . . . . . . . . . . . . . . . . 2DON'T KNOW . . . . . . . . . . . . . . . . . . . . 8
904 Can people reduce their chance of getting the AIDS virus by YES . . . . . . . . . . . . . . . . . . . . . . . . . . . . 1using a condom every time they have sex? NO . . . . . . . . . . . . . . . . . . . . . . . . . . . . 2
DON'T KNOW . . . . . . . . . . . . . . . . . . . . 8
905 Can people get the AIDS virus by sharing food with a person who YES . . . . . . . . . . . . . . . . . . . . . . . . . . . . 1has AIDS? NO . . . . . . . . . . . . . . . . . . . . . . . . . . . . 2
DON'T KNOW . . . . . . . . . . . . . . . . . . . . 8
906 Can people reduce their chance of getting the AIDS virus by YES . . . . . . . . . . . . . . . . . . . . . . . . . . . . 1not having sexual intercourse at all? NO . . . . . . . . . . . . . . . . . . . . . . . . . . . . 2
DON'T KNOW . . . . . . . . . . . . . . . . . . . . 8
907 Can people get the AIDS virus by shaking hands with or hugging YES . . . . . . . . . . . . . . . . . . . . . . . . . . . . 1a person who has AIDS? NO . . . . . . . . . . . . . . . . . . . . . . . . . . . . 2
DON'T KNOW . . . . . . . . . . . . . . . . . . . . 8
907A Can people get the AIDS virus by sharing razors or blades when YES . . . . . . . . . . . . . . . . . . . . . . . . . . . . 1shaving their beard or having their hair cut? NO . . . . . . . . . . . . . . . . . . . . . . . . . . . . 2
DON'T KNOW . . . . . . . . . . . . . . . . . . . . 8
908 Is it possible for a healthy-looking person to have the AIDS virus? YES . . . . . . . . . . . . . . . . . . . . . . . . . . . . 1NO . . . . . . . . . . . . . . . . . . . . . . . . . . . . 2DON'T KNOW . . . . . . . . . . . . . . . . . . . . 8
909 Can the virus that causes AIDS be transmitted from a mother toher baby: YES NO DK
During pregnancy? DURING PREG. . . . . . 1 2 8During delivery? DURING DELIVERY . . . 1 2 8By breastfeeding? BREASTFEEDING . . . 1 2 8
910 Do you know of a place where people can go to get tested for YES . . . . . . . . . . . . . . . . . . . . . . . . . . . . 1the AIDS virus? NO . . . . . . . . . . . . . . . . . . . . . . . . . . . . 2 912
W-48338 • Appendix D
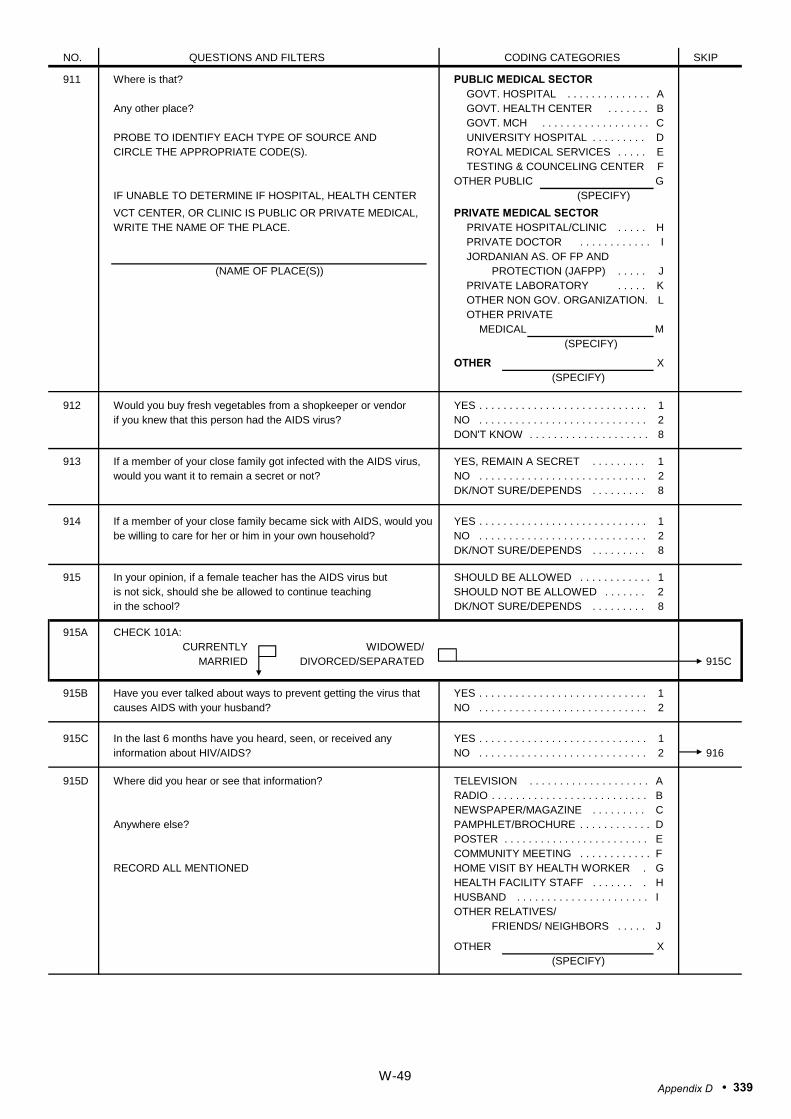
NO. QUESTIONS AND FILTERS CODING CATEGORIES SKIP
911 Where is that? PUBLIC MEDICAL SECTORGOVT. HOSPITAL . . . . . . . . . . . . . . A
Any other place? GOVT. HEALTH CENTER . . . . . . . BGOVT. MCH . . . . . . . . . . . . . . . . . . C
PROBE TO IDENTIFY EACH TYPE OF SOURCE AND UNIVERSITY HOSPITAL . . . . . . . . . DCIRCLE THE APPROPRIATE CODE(S). ROYAL MEDICAL SERVICES . . . . . E
TESTING & COUNCELING CENTER FOTHER PUBLIC G
IF UNABLE TO DETERMINE IF HOSPITAL, HEALTH CENTER (SPECIFY)
VCT CENTER, OR CLINIC IS PUBLIC OR PRIVATE MEDICAL, PRIVATE MEDICAL SECTORWRITE THE NAME OF THE PLACE. PRIVATE HOSPITAL/CLINIC . . . . . H
PRIVATE DOCTOR . . . . . . . . . . . . IJORDANIAN AS. OF FP AND
PROTECTION (JAFPP) . . . . . JPRIVATE LABORATORY . . . . . KOTHER NON GOV. ORGANIZATION. LOTHER PRIVATE
MEDICAL M(SPECIFY)
OTHER X(SPECIFY)
912 Would you buy fresh vegetables from a shopkeeper or vendor YES . . . . . . . . . . . . . . . . . . . . . . . . . . . . 1if you knew that this person had the AIDS virus? NO . . . . . . . . . . . . . . . . . . . . . . . . . . . . 2
DON'T KNOW . . . . . . . . . . . . . . . . . . . . 8
913 If a member of your close family got infected with the AIDS virus, YES, REMAIN A SECRET 1would you want it to remain a secret or not? NO . . . . . . . . . . . . . . . . . . . . . . . . . . . . 2
DK/NOT SURE/DEPENDS 8
914 If a member of your close family became sick with AIDS, would you YES . . . . . . . . . . . . . . . . . . . . . . . . . . . . 1be willing to care for her or him in your own household? NO . . . . . . . . . . . . . . . . . . . . . . . . . . . . 2
DK/NOT SURE/DEPENDS . . . . . . . . . 8
915 In your opinion, if a female teacher has the AIDS virus but SHOULD BE ALLOWED . . . . . . . . . . . . 1is not sick, should she be allowed to continue teaching SHOULD NOT BE ALLOWED . . . . . . . 2in the school? DK/NOT SURE/DEPENDS . . . . . . . . . 8
915A CHECK 101A:CURRENTLY WIDOWED/
MARRIED DIVORCED/SEPARATED 915C
915B Have you ever talked about ways to prevent getting the virus that YES . . . . . . . . . . . . . . . . . . . . . . . . . . . . 1causes AIDS with your husband? NO . . . . . . . . . . . . . . . . . . . . . . . . . . . . 2
915C In the last 6 months have you heard, seen, or received any YES . . . . . . . . . . . . . . . . . . . . . . . . . . . . 1information about HIV/AIDS? NO . . . . . . . . . . . . . . . . . . . . . . . . . . . . 2 916
915D Where did you hear or see that information? TELEVISION . . . . . . . . . . . . . . . . . . . . ARADIO . . . . . . . . . . . . . . . . . . . . . . . . . . BNEWSPAPER/MAGAZINE . . . . . . . . . C
Anywhere else? PAMPHLET/BROCHURE . . . . . . . . . . . . DPOSTER . . . . . . . . . . . . . . . . . . . . . . . . ECOMMUNITY MEETING . . . . . . . . . . . . F
RECORD ALL MENTIONED HOME VISIT BY HEALTH WORKER . GHEALTH FACILITY STAFF . . . . . . . . HHUSBAND . . . . . . . . . . . . . . . . . . . . . . IOTHER RELATIVES/
FRIENDS/ NEIGHBORS . . . . . J
OTHER X(SPECIFY)
. . . . . . . . .
. . . . . . . . .
(NAME OF PLACE(S))
W-49• 339Appendix D

NO. QUESTIONS AND FILTERS CODING CATEGORIES SKIP
916 CHECK 901:
HEARD ABOUT NOT HEARDAIDS ABOUT AIDS
Apart from AIDS, have Have you heard about infections you heard about other that can be transmitted throughinfections that can be sexual contact? YES . . . . . . . . . . . . . . . . . . . . . . . . . . . . 1transmitted through NO . . . . . . . . . . . . . . . . . . . . . . . . . . . . 2 917sexual contact?
916A What (other) sexually transmitted infections have you GENITAL HERPES . . . . . . . . . . . . . . . . Aheard about? GENITAL WARTS/HPV . . . . . . . . . . . . B
HEPATITIS . . . . . . . . . . . . . . . . . . . . . . CAnything else? CHLAMYDIA . . . . . . . . . . . . . . . . . . . . D
SYPHILIS . . . . . . . . . . . . . . . . . . . . . . EHIV/AIDS INFECTION . . . . . . . . . . . . . . F
RECORD ALL MENTIONED TRICHOMONIASIS . . . . . . . . . . . . . . . . GCHANCROID . . . . . . . . . . . . . . . . HYEAST INFECTION . . . . . . . . . . . . . . . . IOTHER X
(SPECIFY)
DON'T KNOW . . . . . . . . . . . . . . . . . . . . Z
917 Husbands and wives do not always agree on everything. YES . . . . . . . . . . . . . . . . . . . . . . . . . . . . 1If a wife knows her husband has a disease that she can get NO . . . . . . . . . . . . . . . . . . . . . . . . . . . . 2during sexual intercourse, is she justified in refusing to have DON'T KNOW . . . . . . . . . . . . . . . . . . . . 8sex with him?
918 If a wife knows her husband has a disease that she can get YES . . . . . . . . . . . . . . . . . . . . . . . . . . . . 1during sexual intercourse, is she justified in asking that they use NO . . . . . . . . . . . . . . . . . . . . . . . . . . . . 2a condom when they have sex? DON'T KNOW . . . . . . . . . . . . . . . . . . . . 8
919 Is a wife justified in refusing to have sex with her husband when YES . . . . . . . . . . . . . . . . . . . . . . . . . . . . 1she is tired or not in the mood? NO . . . . . . . . . . . . . . . . . . . . . . . . . . . . 2
DON'T KNOW . . . . . . . . . . . . . . . . . . . . 8
920 Is a wife justified in refusing to have sex with her husband YES . . . . . . . . . . . . . . . . . . . . . . . . . . . . 1when she knows her husband has sex with women other than NO . . . . . . . . . . . . . . . . . . . . . . . . . . . . 2his wives? DON'T KNOW . . . . . . . . . . . . . . . . . . . . 8
W-50340 • Appendix D
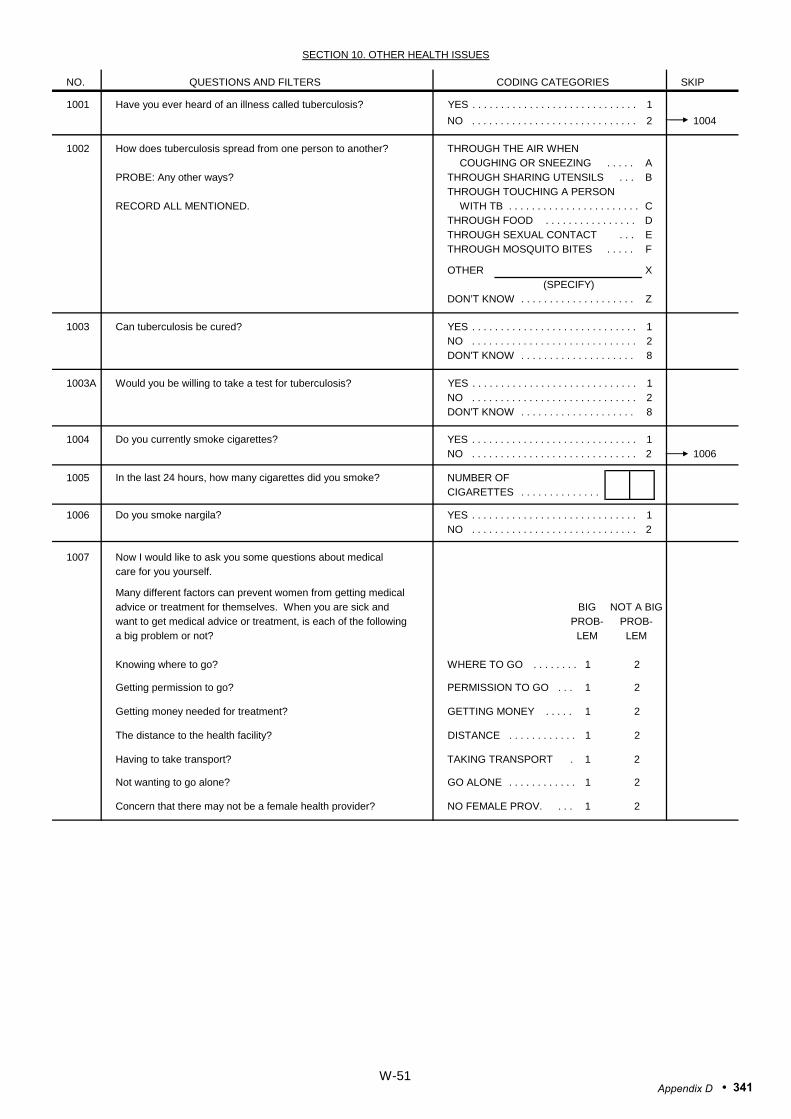
SECTION 10. OTHER HEALTH ISSUES
NO. QUESTIONS AND FILTERS CODING CATEGORIES SKIP
1001 Have you ever heard of an illness called tuberculosis? YES . . . . . . . . . . . . . . . . . . . . . . . . . . . . . 1
NO . . . . . . . . . . . . . . . . . . . . . . . . . . . . . 2 1004
1002 How does tuberculosis spread from one person to another? THROUGH THE AIR WHENCOUGHING OR SNEEZING . . . . . A
PROBE: Any other ways? THROUGH SHARING UTENSILS . . . BTHROUGH TOUCHING A PERSON
RECORD ALL MENTIONED. WITH TB . . . . . . . . . . . . . . . . . . . . . . . CTHROUGH FOOD . . . . . . . . . . . . . . . . DTHROUGH SEXUAL CONTACT . . . ETHROUGH MOSQUITO BITES . . . . . F
OTHER X(SPECIFY)
DON’T KNOW . . . . . . . . . . . . . . . . . . . . Z
1003 Can tuberculosis be cured? YES . . . . . . . . . . . . . . . . . . . . . . . . . . . . . 1NO . . . . . . . . . . . . . . . . . . . . . . . . . . . . . 2DON'T KNOW . . . . . . . . . . . . . . . . . . . . 8
1003A Would you be willing to take a test for tuberculosis? YES . . . . . . . . . . . . . . . . . . . . . . . . . . . . . 1NO . . . . . . . . . . . . . . . . . . . . . . . . . . . . . 2DON'T KNOW . . . . . . . . . . . . . . . . . . . . 8
1004 YES . . . . . . . . . . . . . . . . . . . . . . . . . . . . . 1NO . . . . . . . . . . . . . . . . . . . . . . . . . . . . . 2 1006
1005 NUMBER OF CIGARETTES . . . . . . . . . . . . . .
1006 YES . . . . . . . . . . . . . . . . . . . . . . . . . . . . . 1NO . . . . . . . . . . . . . . . . . . . . . . . . . . . . . 2
1007 Now I would like to ask you some questions about medical care for you yourself.
Many different factors can prevent women from getting medical advice or treatment for themselves. When you are sick and BIG NOT A BIGwant to get medical advice or treatment, is each of the following PROB- PROB-a big problem or not? LEM LEM
Knowing where to go? WHERE TO GO . . . . . . . . 1 2
Getting permission to go? PERMISSION TO GO . . . 1 2
Getting money needed for treatment? GETTING MONEY . . . . . 1 2
The distance to the health facility? DISTANCE . . . . . . . . . . . . 1 2
Having to take transport? TAKING TRANSPORT . 1 2
Not wanting to go alone? GO ALONE . . . . . . . . . . . . 1 2
Concern that there may not be a female health provider? NO FEMALE PROV. . . . 1 2
Do you currently smoke cigarettes?
In the last 24 hours, how many cigarettes did you smoke?
Do you smoke nargila?
W-51• 341Appendix D
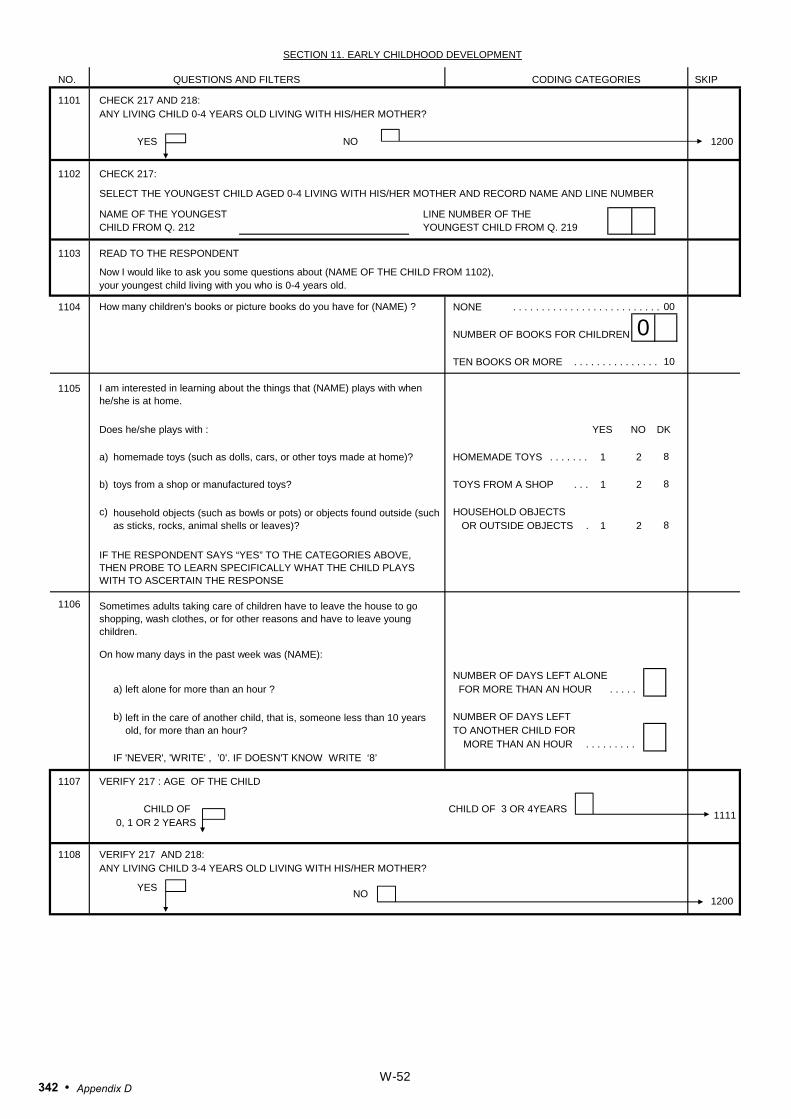
SECTION 11. EARLY CHILDHOOD DEVELOPMENT
NO. QUESTIONS AND FILTERS CODING CATEGORIES SKIP
1101 CHECK 217 AND 218:ANY LIVING CHILD 0-4 YEARS OLD LIVING WITH HIS/HER MOTHER?
YES NO 1200
1102 CHECK 217:
SELECT THE YOUNGEST CHILD AGED 0-4 LIVING WITH HIS/HER MOTHER AND RECORD NAME AND LINE NUMBER
NAME OF THE YOUNGEST LINE NUMBER OF THE CHILD FROM Q. 212 YOUNGEST CHILD FROM Q. 219
1103 READ TO THE RESPONDENT
Now I would like to ask you some questions about (NAME OF THE CHILD FROM 1102), your youngest child living with you who is 0-4 years old.
1104 NONE . . . . . . . . . . . . . . . . . . . . . . . . . . 00
NUMBER OF BOOKS FOR CHILDREN
TEN BOOKS OR MORE . . . . . . . . . . . . . . . 10
1105
Does he/she plays with : YES NO DK
a) homemade toys (such as dolls, cars, or other toys made at home)? HOMEMADE TOYS . . . . . . . 1 2
b) toys from a shop or manufactured toys? TOYS FROM A SHOP . . . 1 2
c) HOUSEHOLD OBJECTS OR OUTSIDE OBJECTS . 1 2
1106
On how many days in the past week was (NAME):
NUMBER OF DAYS LEFT ALONE a) left alone for more than an hour ? FOR MORE THAN AN HOUR . . . . .
b) NUMBER OF DAYS LEFT TO ANOTHER CHILD FOR
. . . . . . . . . IF 'NEVER', 'WRITE' , ’0’. IF DOESN'T KNOW WRITE ‘8’
1107 VERIFY 217 : AGE OF THE CHILD
CHILD OF CHILD OF 3 OR 4YEARS 0, 1 OR 2 YEARS
1108 VERIFY 217 AND 218:ANY LIVING CHILD 3-4 YEARS OLD LIVING WITH HIS/HER MOTHER?
YES1200
MORE THAN AN HOUR
How many children's books or picture books do you have for (NAME) ?
0
8
8
8
1111
I am interested in learning about the things that (NAME) plays with when he/she is at home.
household objects (such as bowls or pots) or objects found outside (such as sticks, rocks, animal shells or leaves)?
IF THE RESPONDENT SAYS “YES” TO THE CATEGORIES ABOVE, THEN PROBE TO LEARN SPECIFICALLY WHAT THE CHILD PLAYS WITH TO ASCERTAIN THE RESPONSE
NO
Sometimes adults taking care of children have to leave the house to go shopping, wash clothes, or for other reasons and have to leave young children.
left in the care of another child, that is, someone less than 10 years old, for more than an hour?
W-52342 • Appendix D
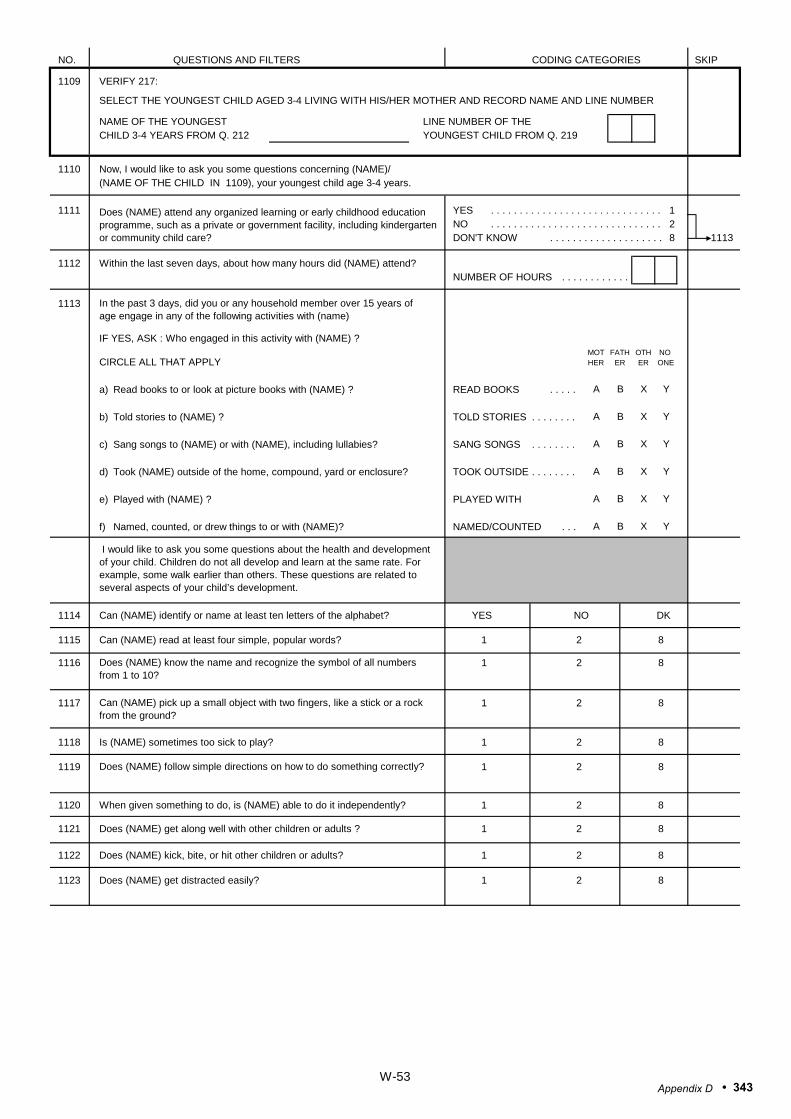
NO. QUESTIONS AND FILTERS CODING CATEGORIES SKIP
1109 VERIFY 217:
SELECT THE YOUNGEST CHILD AGED 3-4 LIVING WITH HIS/HER MOTHER AND RECORD NAME AND LINE NUMBER
NAME OF THE YOUNGEST LINE NUMBER OF THE CHILD 3-4 YEARS FROM Q. 212 YOUNGEST CHILD FROM Q. 219
1110 Now, I would like to ask you some questions concerning (NAME)/(NAME OF THE CHILD IN 1109), your youngest child age 3-4 years.
1111 YES . . . . . . . . . . . . . . . . . . . . . . . . . . . . . . 1NO . . . . . . . . . . . . . . . . . . . . . . . . . . . . . . 2DON'T KNOW . . . . . . . . . . . . . . . . . . . . 8
1112 Within the last seven days, about how many hours did (NAME) attend?NUMBER OF HOURS . . . . . . . . . . . .
1113
IF YES, ASK : Who engaged in this activity with (NAME) ?
CIRCLE ALL THAT APPLY
a) Read books to or look at picture books with (NAME) ? READ BOOKS . . . . .
b) Told stories to (NAME) ? TOLD STORIES . . . . . . . .
c) Sang songs to (NAME) or with (NAME), including lullabies? SANG SONGS . . . . . . . .
d) Took (NAME) outside of the home, compound, yard or enclosure? TOOK OUTSIDE . . . . . . . .
e) Played with (NAME) ? PLAYED WITH
f) Named, counted, or drew things to or with (NAME)? NAMED/COUNTED . . .
1114 Can (NAME) identify or name at least ten letters of the alphabet? YES NO DK
1115 Can (NAME) read at least four simple, popular words? 1 2 8
1116 1 2 8
1117 1 2 8
1118 Is (NAME) sometimes too sick to play? 1 2 8
1119 1 2 8
1120 When given something to do, is (NAME) able to do it independently? 1 2 8
1121 Does (NAME) get along well with other children or adults ? 1 2 8
1122 Does (NAME) kick, bite, or hit other children or adults? 1 2 8
1123 Does (NAME) get distracted easily? 1 2 8
X Y
B X Y
1113
NO ONE
MOTHER
FATHER
OTHER
A B
Y
A B X Y
A B X Y
A
A B X Y
A B X
Does (NAME) follow simple directions on how to do something correctly?
Can (NAME) pick up a small object with two fingers, like a stick or a rock from the ground?
Does (NAME) attend any organized learning or early childhood education programme, such as a private or government facility, including kindergarten or community child care?
In the past 3 days, did you or any household member over 15 years of age engage in any of the following activities with (name)
I would like to ask you some questions about the health and development of your child. Children do not all develop and learn at the same rate. For example, some walk earlier than others. These questions are related to several aspects of your child’s development.
Does (NAME) know the name and recognize the symbol of all numbers from 1 to 10?
W-53• 343Appendix D

SECTION 12. DOMESTIC VIOLENCE MODULE
NO. QUESTIONS AND FILTERS CODING CATEGORIES SKIP
1200 CHECK HOUSEHOLD QUESTIONNAIRE.
WOMAN SELECTED WOMANFOR THIS SECTION NOT SELECTED 1233
1201 CHECK FOR PRESENCE OF OTHERS:
DO NOT CONTINUE UNTIL PRIVACY IS ENSURED.
PRIVACY PRIVACYOBTAINED . . . . . . . 1 NOT POSSIBLE . . . . . . . 2 1232
READ TO THE RESPONDENT
1202 CHECK 601 AND 602: WIDOWED/SEPARATED
CURRENTLY DIVORCEDMARRIED/
(READ IN PAST TENSE AND USE 'LAST' WITH HUSBAND)
1203
YES NO DKJEALOUS . . . . . . . . . . . . 1 2 8ACCUSES . . . . . . . . . . . . 1 2 8NOT MEET FRIENDS . . . 1 2 8NO FAMILY . . . . . . . . . . . . 1 2 8WHERE YOU ARE . . . . . 1 2 8
1204
A B
SOME- NOT IN LASTEVER OFTEN TIMES 12 MONTHS
a) YES 1 1 2 3NO 2
b) YES 1 1 2 3NO 2
c) YES 1 1 2 3
NO 2
Now I would like to ask you questions about some other important aspects of a woman's life. You may find some of these questions very personal. However, your answers are crucial for helping to understand the condition of women in Jordan Let me assure you that your answers are completely confidential and will not be told to anyone and no one else in your household will know that you were asked these questions.
First, I am going to ask you about some situations which happen to some women. Please tell me if these apply to your relationship with your (last) husband?
a) He (is/was) jealous or angry if you (talk/talked) to other men?b) He frequently (accuses/accused) you of being unfaithful?c) He (does/did) not permit you to meet your female friends?d) He (tries/tried) to limit your contact with your family?e) He (insists/insisted) on knowing where you (are/were) at all times?
Now I need to ask some more questions about your relationship with your (last) husband.
Did your (last) husband ever: How often did this happen during the last 12 months: often, only sometimes, or not at all?
say or do something to humiliate you in front of others?
threaten to hurt or harm you or someone you care about?
insult you or make you feel bad about yourself?
W-54344 • Appendix D

NO. QUESTIONS AND FILTERS CODING CATEGORIES SKIP
1205 A B
SOME- NOT IN LASTEVER OFTEN TIMES 12 MONTHS
a) YES 1 1 2 3NO 2
b) YES 1 1 2 3NO 2
c) YES 1 1 2 3NO 2
d) YES 1 1 2 3NO 2
e) YES 1 1 2 3NO 2
f) YES 1 1 2 3NO 2
g) YES 1 1 2 3NO 2
h) YES 1 1 2 3NO 2
1206 CHECK '1205A (a-h): AT LEAST ONE NOT A SINGLE
'YES' 'YES' 1213
1208
a) YES . . . . . . . . . . . . . . . . . . . . . . . . . . . . . . 1NO . . . . . . . . . . . . . . . . . . . . . . . . . . . . . . 2
b) YES . . . . . . . . . . . . . . . . . . . . . . . . . . . . . . 1NO . . . . . . . . . . . . . . . . . . . . . . . . . . . . . . 2
c) YES . . . . . . . . . . . . . . . . . . . . . . . . . . . . . . 1NO . . . . . . . . . . . . . . . . . . . . . . . . . . . . . . 2
1213 MOST OF THE TIME AFRAID . . . . . . . . . 1 SOMETIMES AFRAID . . . . . . . . . . . . . . . . 2 NEVER AFRAID . . . . . . . . . . . . . . . . . . . . 3
1214 CHECK 606: MARRIED MORE MARRIED ONLY
THAN ONCE ONCE 1216
Did your (last) husband ever do any of the following things to you:
How often did this happen during the last 12 months: often, only sometimes, or not at all?
push you, shake you, or throw something at you?
slap you?
twist your arm or pull your hair?
punch you with his fist or with something that could hurt you?
kick you, drag you, or beat you up?
try to choke you or burn you on purpose?
threaten or attack you with a knife, gun, or other weapon?
physically force you to have sexual intercourse with him when you did not want to?
Did the following ever happen as a result of what your (last) husband did to you:
You had cuts, bruises, or aches?
You had eye injuries, sprains, dislocations, or burns?
You had deep wounds, broken bones, broken teeth, or any other serious injury?
Are (were) you afraid of your (last) husband: most of the time, sometimes, or never?
W-55• 345Appendix D
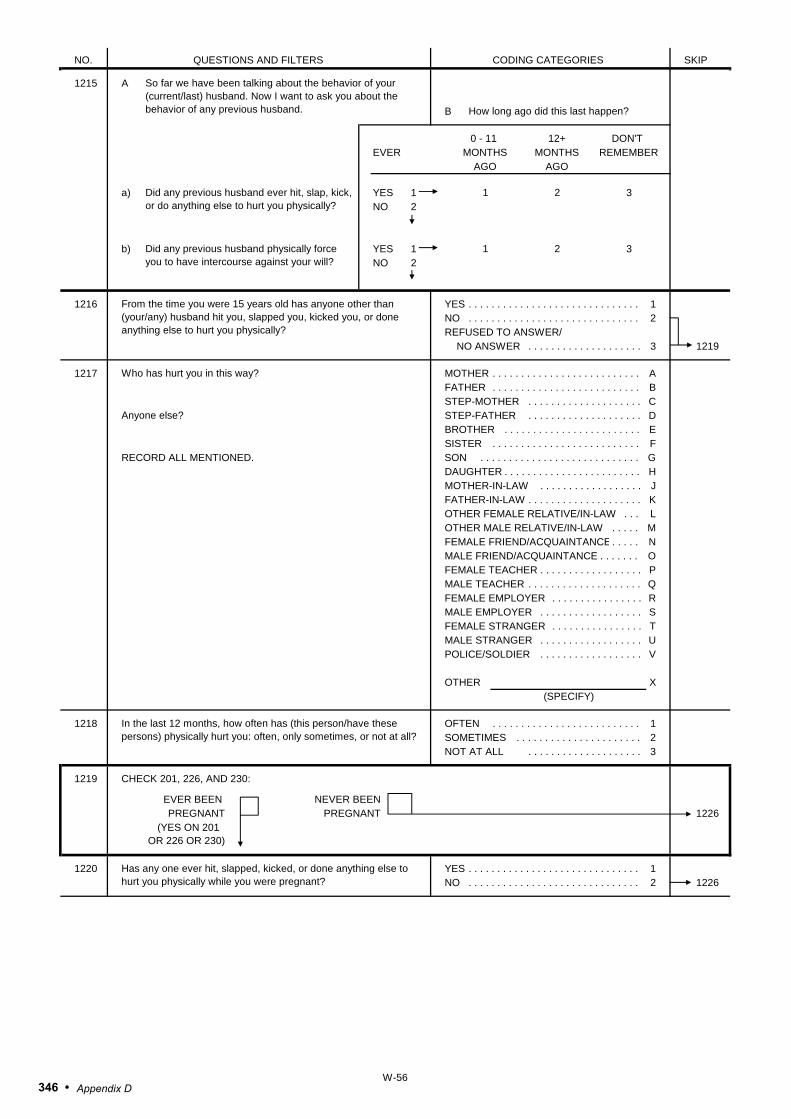
NO. QUESTIONS AND FILTERS CODING CATEGORIES SKIP
1215 A
B
0 - 11 12+ DON'T EVER MONTHS MONTHS REMEMBER
AGO AGO
a) YES 1 1 2 3NO 2
b) YES 1 1 2 3NO 2
1216 YES . . . . . . . . . . . . . . . . . . . . . . . . . . . . . . 1NO . . . . . . . . . . . . . . . . . . . . . . . . . . . . . . 2 REFUSED TO ANSWER/
NO ANSWER . . . . . . . . . . . . . . . . . . . . 3 1219
1217 MOTHER . . . . . . . . . . . . . . . . . . . . . . . . . . AFATHER . . . . . . . . . . . . . . . . . . . . . . . . . . B
STEP-MOTHER . . . . . . . . . . . . . . . . . . . . CSTEP-FATHER . . . . . . . . . . . . . . . . . . . . DBROTHER . . . . . . . . . . . . . . . . . . . . . . . . ESISTER . . . . . . . . . . . . . . . . . . . . . . . . . . F
RECORD ALL MENTIONED. SON . . . . . . . . . . . . . . . . . . . . . . . . . . . . GDAUGHTER . . . . . . . . . . . . . . . . . . . . . . . . HMOTHER-IN-LAW . . . . . . . . . . . . . . . . . . JFATHER-IN-LAW . . . . . . . . . . . . . . . . . . . . KOTHER FEMALE RELATIVE/IN-LAW . . . LOTHER MALE RELATIVE/IN-LAW . . . . . MFEMALE FRIEND/ACQUAINTANCE . . . . . NMALE FRIEND/ACQUAINTANCE . . . . . . . OFEMALE TEACHER . . . . . . . . . . . . . . . . . . PMALE TEACHER . . . . . . . . . . . . . . . . . . . . QFEMALE EMPLOYER . . . . . . . . . . . . . . . . RMALE EMPLOYER . . . . . . . . . . . . . . . . . . SFEMALE STRANGER . . . . . . . . . . . . . . . . TMALE STRANGER . . . . . . . . . . . . . . . . . . UPOLICE/SOLDIER . . . . . . . . . . . . . . . . . . V
OTHER X
1218 OFTEN . . . . . . . . . . . . . . . . . . . . . . . . . . 1SOMETIMES . . . . . . . . . . . . . . . . . . . . . . 2
NOT AT ALL . . . . . . . . . . . . . . . . . . . . 3
1219 CHECK 201, 226, AND 230:
EVER BEEN NEVER BEENPREGNANT PREGNANT 1226
(YES ON 201 OR 226 OR 230)
1220 YES . . . . . . . . . . . . . . . . . . . . . . . . . . . . . . 1 NO . . . . . . . . . . . . . . . . . . . . . . . . . . . . . . 2 1226
So far we have been talking about the behavior of your (current/last) husband. Now I want to ask you about the behavior of any previous husband. How long ago did this last happen?
Did any previous husband ever hit, slap, kick, or do anything else to hurt you physically?
From the time you were 15 years old has anyone other than (your/any) husband hit you, slapped you, kicked you, or done anything else to hurt you physically?
Who has hurt you in this way?
Anyone else?
(SPECIFY)
Did any previous husband physically force you to have intercourse against your will?
In the last 12 months, how often has (this person/have these persons) physically hurt you: often, only sometimes, or not at all?
Has any one ever hit, slapped, kicked, or done anything else to hurt you physically while you were pregnant?
W-56346 • Appendix D
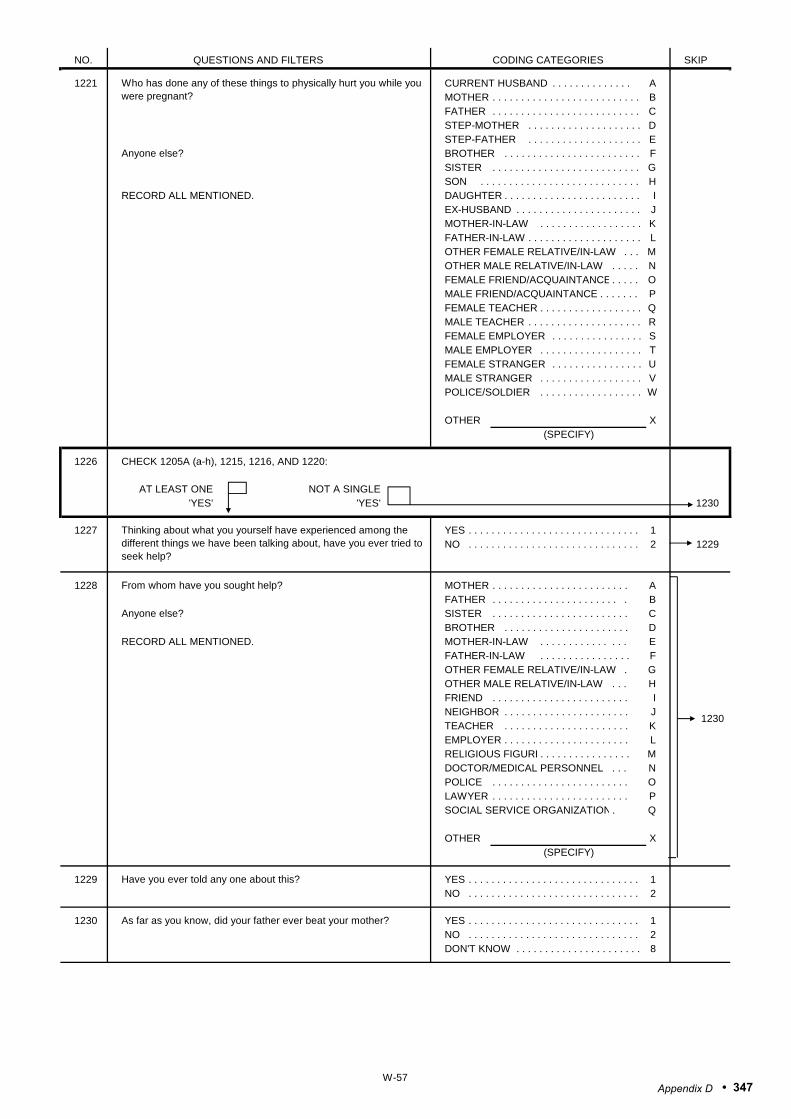
NO. QUESTIONS AND FILTERS CODING CATEGORIES SKIP
1221 CURRENT HUSBAND . . . . . . . . . . . . . . A MOTHER . . . . . . . . . . . . . . . . . . . . . . . . . . B
FATHER . . . . . . . . . . . . . . . . . . . . . . . . . . CSTEP-MOTHER . . . . . . . . . . . . . . . . . . . . DSTEP-FATHER . . . . . . . . . . . . . . . . . . . . EBROTHER . . . . . . . . . . . . . . . . . . . . . . . . FSISTER . . . . . . . . . . . . . . . . . . . . . . . . . . GSON . . . . . . . . . . . . . . . . . . . . . . . . . . . . H
RECORD ALL MENTIONED. DAUGHTER . . . . . . . . . . . . . . . . . . . . . . . . IEX-HUSBAND . . . . . . . . . . . . . . . . . . . . . . JMOTHER-IN-LAW . . . . . . . . . . . . . . . . . . KFATHER-IN-LAW . . . . . . . . . . . . . . . . . . . . LOTHER FEMALE RELATIVE/IN-LAW . . . MOTHER MALE RELATIVE/IN-LAW . . . . . NFEMALE FRIEND/ACQUAINTANCE . . . . . OMALE FRIEND/ACQUAINTANCE . . . . . . . PFEMALE TEACHER . . . . . . . . . . . . . . . . . . QMALE TEACHER . . . . . . . . . . . . . . . . . . . . RFEMALE EMPLOYER . . . . . . . . . . . . . . . . SMALE EMPLOYER . . . . . . . . . . . . . . . . . . TFEMALE STRANGER . . . . . . . . . . . . . . . . UMALE STRANGER . . . . . . . . . . . . . . . . . . VPOLICE/SOLDIER . . . . . . . . . . . . . . . . . . W
OTHER X
1226 CHECK 1205A (a-h), 1215, 1216, AND 1220:
AT LEAST ONE NOT A SINGLE'YES' 'YES' 1230
1227 YES . . . . . . . . . . . . . . . . . . . . . . . . . . . . . . 1 NO . . . . . . . . . . . . . . . . . . . . . . . . . . . . . . 2 1229
1228 MOTHER . . . . . . . . . . . . . . . . . . . . . . . . AFATHER . . . . . . . . . . . . . . . . . . . . . . . B
SISTER . . . . . . . . . . . . . . . . . . . . . . . . CBROTHER . . . . . . . . . . . . . . . . . . . . . . D
RECORD ALL MENTIONED. MOTHER-IN-LAW . . . . . . . . . . . . . . . EFATHER-IN-LAW . . . . . . . . . . . . . . . . FOTHER FEMALE RELATIVE/IN-LAW . GOTHER MALE RELATIVE/IN-LAW . . . HFRIEND . . . . . . . . . . . . . . . . . . . . . . . . INEIGHBOR . . . . . . . . . . . . . . . . . . . . . . JTEACHER . . . . . . . . . . . . . . . . . . . . . . KEMPLOYER . . . . . . . . . . . . . . . . . . . . . . LRELIGIOUS FIGURE. . . . . . . . . . . . . . . . MDOCTOR/MEDICAL PERSONNEL . . . NPOLICE . . . . . . . . . . . . . . . . . . . . . . . . OLAWYER . . . . . . . . . . . . . . . . . . . . . . . . PSOCIAL SERVICE ORGANIZATION. Q
OTHER X
1229 YES . . . . . . . . . . . . . . . . . . . . . . . . . . . . . . 1 NO . . . . . . . . . . . . . . . . . . . . . . . . . . . . . . 2
1230 YES . . . . . . . . . . . . . . . . . . . . . . . . . . . . . . 1 NO . . . . . . . . . . . . . . . . . . . . . . . . . . . . . . 2
DON'T KNOW . . . . . . . . . . . . . . . . . . . . . . 8
1230
Who has done any of these things to physically hurt you while you were pregnant?
Anyone else?
(SPECIFY)
Thinking about what you yourself have experienced among the different things we have been talking about, have you ever tried to seek help?
From whom have you sought help?
Anyone else?
(SPECIFY)
Have you ever told any one about this?
As far as you know, did your father ever beat your mother?
W-57• 347Appendix D
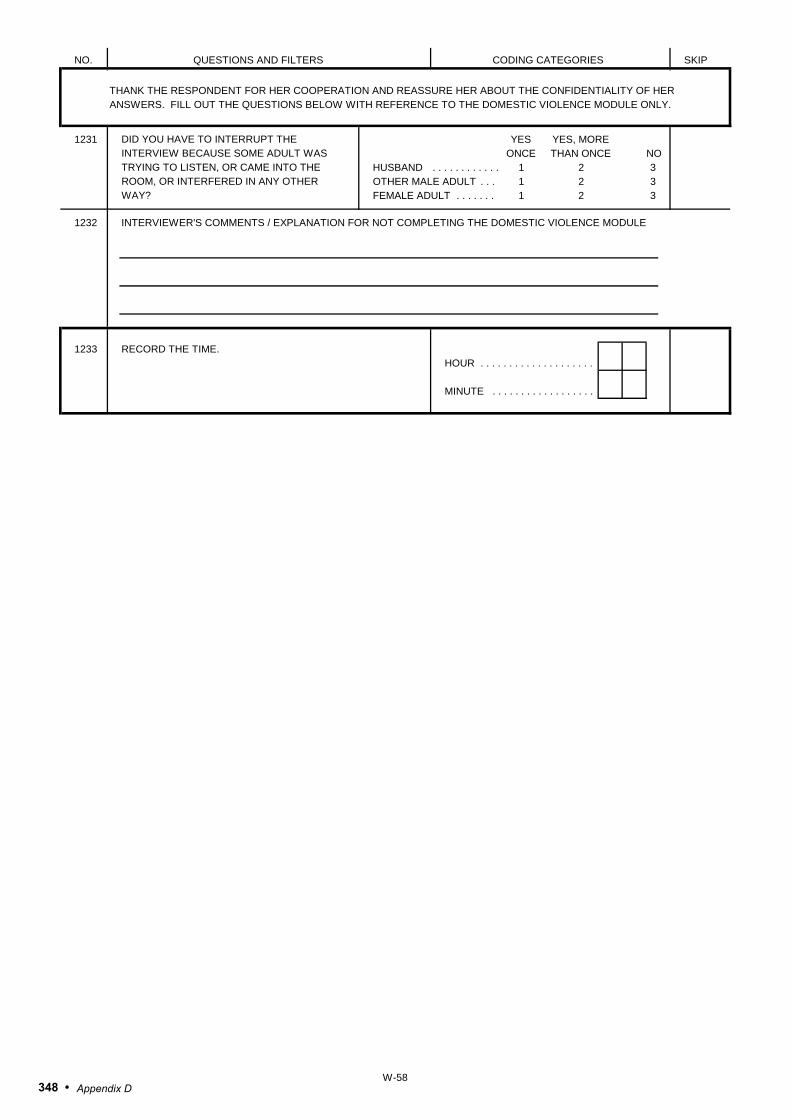
NO. QUESTIONS AND FILTERS CODING CATEGORIES SKIP
THANK THE RESPONDENT FOR HER COOPERATION AND REASSURE HER ABOUT THE CONFIDENTIALITY OF HERANSWERS. FILL OUT THE QUESTIONS BELOW WITH REFERENCE TO THE DOMESTIC VIOLENCE MODULE ONLY.
1231 DID YOU HAVE TO INTERRUPT THE YES YES, MORE INTERVIEW BECAUSE SOME ADULT WAS ONCE THAN ONCE NO
TRYING TO LISTEN, OR CAME INTO THE HUSBAND . . . . . . . . . . . . 1 2 3ROOM, OR INTERFERED IN ANY OTHER OTHER MALE ADULT . . . 1 2 3WAY? FEMALE ADULT . . . . . . . 1 2 3
1232 INTERVIEWER'S COMMENTS / EXPLANATION FOR NOT COMPLETING THE DOMESTIC VIOLENCE MODULE
RECORD THE TIME.HOUR . . . . . . . . . . . . . . . . . . . .
MINUTE . . . . . . . . . . . . . . . . . .
1233
W-58348 • Appendix D

INTERVIEWER'S OBSERVATIONS
TO BE FILLED IN AFTER COMPLETING INTERVIEW
COMMENTS ABOUT RESPONDENT:
COMMENTS ON SPECIFIC QUESTIONS:
ANY OTHER COMMENTS:
SUPERVISOR'S OBSERVATIONS
NAME OF SUPERVISOR: DATE:
EDITOR'S OBSERVATIONS
NAME OF EDITOR: DATE:
W-59• 349Appendix D

INSTRUCTIONS: 2 1 2 2ONLY ONE CODE SHOULD APPEAR IN ANY BOX. 0 03 MAR 01 0COLUMN 1 REQUIRES A CODE IN EVERY MONTH. 1 02 FEB 02 1
3 01 JAN 03 3INFORMATION TO BE CODED FOR EACH COLUMN
12 DEC 04COLUMN 1: BIRTHS, PREGNANCIES, CONTRACEPTIVE USE 11 NOV 05
B BIRTHS 10 OCT 06P PREGNANCIES 09 SEP 07T TERMINATIONS 2 08 AUG 08 2
0 07 JUL 09 00 NO METHOD 1 06 JUN 10 11 FEMALE STERILIZATION 2 05 MAY 11 22 MALE STERILIZATION 04 APR 123 IUD 03 MAR 134 INJECTABLES 02 FEB 145 IMPLANTS 01 JAN 156 PILL7 CONDOM 12 DEC 168 FEMALE CONDOM 11 NOV 179 DIAPHRAGM 10 OCT 18J FOAM OR JELLY 09 SEP 19K LACTATIONAL AMENORRHEA METHOD 2 08 AUG 20 2L RHYTHM METHOD 0 07 JUL 21 0M WITHDRAWAL 1 06 JUN 22 1X OTHER MODERN METHOD 1 05 MAY 23 1Y OTHER TRADITIONAL METHOD 04 APR 24
03 MAR 25COLUMN 2: DISCONTINUATION OF CONTRACEPTIVE USE 02 FEB 26
0 INFREQUENT SEX/HUSBAND AWAY 01 JAN 271 BECAME PREGNANT WHILE USING2 WANTED TO BECOME PREGNANT 12 DEC 283 HUSBAND DISAPPROVED 11 NOV 294 WANTED MORE EFFECTIVE METHOD 10 OCT 305 SIDE EFFECTS/HEALTH CONCERNS 09 SEP 316 LACK OF ACCESS/TOO FAR 2 08 AUG 32 27 COSTS TOO MUCH 0 07 JUL 33 08 INCONVENIENT TO USE 1 06 JUN 34 1F FATALISTIC 0 05 MAY 35 0A DIFFICULT TO GET PREGNANT/MENOPAUSAL 04 APR 36D WIDOW/DIVORCE/SEPARATION 03 MAR 37R RAMADAN 02 FEB 38X OTHER 01 JAN 39
(SPECIFY)Z DON'T KNOW 12 DEC 40
11 NOV 4110 OCT 4209 SEP 43
2 08 AUG 44 20 07 JUL 45 00 06 JUN 46 09 05 MAY 47 9
04 APR 4803 MAR 4902 FEB 5001 JAN 51
12 DEC 5211 NOV 5310 OCT 5409 SEP 55
2 08 AUG 56 20 07 JUL 57 00 06 JUN 58 08 05 MAY 59 8
04 APR 6003 MAR 6102 FEB 6201 JAN 63
12 DEC 6411 NOV 6510 OCT 6609 SEP 67
2 08 AUG 68 20 07 JUL 69 00 06 JUN 70 07 05 MAY 71 7
04 APR 7203 MAR 7302 FEB 7401 JAN 75
W-60350 • Appendix D

Jordan 2012Population and Fam
ily Health Survey