Indonesia Development Prospects- and Policy Options
163
Report No. 3307-IND PILE COPY Indonesia Development Prospects- and Policy Options April 6, 1981 East Asia and Pacific Regional Office FOR OFFICIAL USE ONLY o Dm o z ~~m This document has a restricted distribution and may be used by recipients only in the performance of their official duties. its contents may not otherwise be disclosed without World Bank authorization. Public Disclosure Authorized Public Disclosure Authorized Public Disclosure Authorized Public Disclosure Authorized Public Disclosure Authorized Public Disclosure Authorized Public Disclosure Authorized Public Disclosure Authorized
-
Upload
khangminh22 -
Category
Documents
-
view
0 -
download
0
Transcript of Indonesia Development Prospects- and Policy Options
Report No. 3307-IND PILE COPYIndonesiaDevelopment Prospects- and Policy Options
April 6, 1981
East Asia and Pacific Regional Office
FOR OFFICIAL USE ONLY
oDm o
z ~~m
This document has a restricted distribution and may be used by recipientsonly in the performance of their official duties. its contents may not otherwisebe disclosed without World Bank authorization.
Pub
lic D
iscl
osur
e A
utho
rized
Pub
lic D
iscl
osur
e A
utho
rized
Pub
lic D
iscl
osur
e A
utho
rized
Pub
lic D
iscl
osur
e A
utho
rized
Pub
lic D
iscl
osur
e A
utho
rized
Pub
lic D
iscl
osur
e A
utho
rized
Pub
lic D
iscl
osur
e A
utho
rized
Pub
lic D
iscl
osur
e A
utho
rized
CURRENCY EQUIVALENTS
Before November 15, 1978
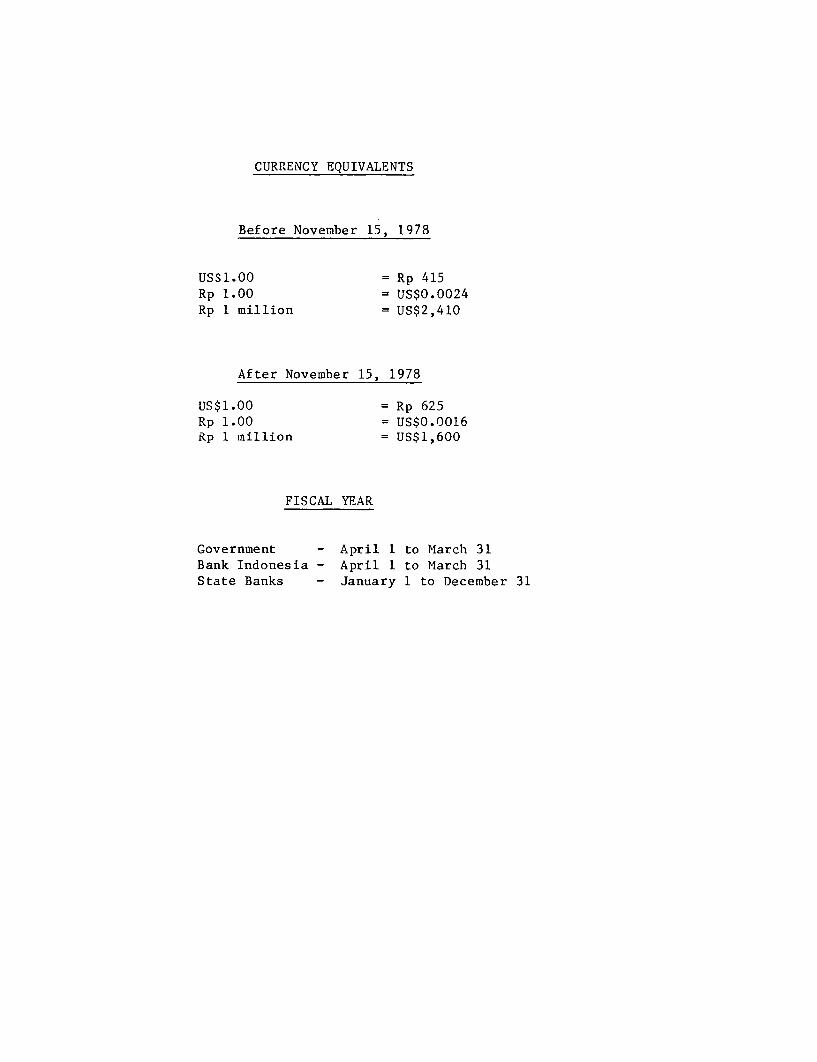
US$1.00 = Rp 415Rp 1.00 = US$0.0024Rp 1 million = US$2,410
After November 15, 1978
US$1.00 = Rp 625Rp 1.00 = US$0.0016Rp 1 million = US$1,600
FISCAL YEAR
Government - April 1 to March 31Bank Indonesia - April 1 to March 31State Banks - January 1 to December 31
FOR OFFICIAL USE ONLY
PREFACE
This report is based on findings of a mission comprising Nissim Ezekiel (IFC),Chandra Sharma (DPS), Lyn Squire, Andrew Steer, Michael Walton and SarathRajapatirana (Mission Leader), of the East Asia and Pacific Country ProgramsDepartment. The Mission visited Indonesia in October/November 1980. A draftof the report was discussed with the Government in March 1981.
This document has a restricted distribution and may be used by recipients only in the performance of |their official duties. Its contents may not otherwise be disclosed without World Bank authorization.

INDONESIA
DEVELOPMENT PROSPECTS AND POLICY OPTIONS
Table of Contents
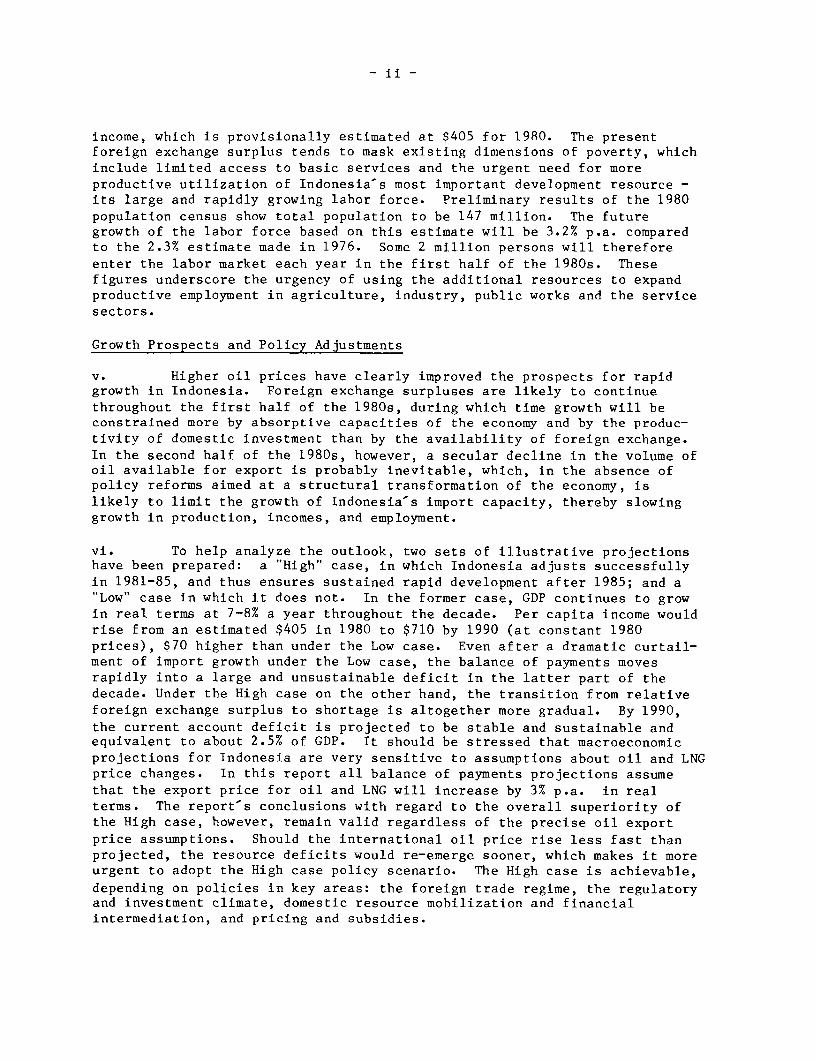
Page No.SUMMARY AND CONCLUSIONS
1. INTRODUCTION .... . . . . . . . . . . . . . . . . . . . . . 1
2. RECENT TRENDS IN THE ECONOMY ... . . . . . . . . . . . . . . 4
Domestic Production and Expenditures . . . . . . . . . . . . 4The Balance of Payments. 8The Government Budget . . . . . . . . . . . . . . . . . . . 10Prices and Competitiveness .13Monetary Developments .15
3. OPTIONS FOR MACROECONOMIC POLICY . . . . . . . . . . . . . . . 17
Elements of the Policy Package Aimed at StructuralTransformation of the Economy . . . . . . . . . . . . . . 18
Foreign Trade Policies .18Investment, Efficiency and the Regulatory Enviroment . . . . 20Domestic Resource Mobilization and Financial
Intermediation 22Price Policy and the Role of Subsidies . . . . . . . 25Summary of the Two Policy Scenarios . . . . . . . . . . . . 29Implications for Incomes, Employment and Equity . . . . . . 31
4. ISSUES IN PUBLIC EXPENDITURES ... . . . .... . . . . . . 34
Review of Sectoral Programs ... . . . . . . . ..... . 34Constraints to Implementation of Development Programs . . . 47
5. THE EMERGING RESOURCE POSITION ... . . . . . ....... . 50
Prospects for the Oil Sector . . . . . . . . . . . . . . . . 50Non-Oil Exports .54Import Policies and Projections . . . . . . . . . . . . . . 57The Budget .61
6. POLICY TOWARDS EXTERNAL CAPITAL INFLOWS AND DEBT MANAGEMENT . 64
Financing Requirements and Creditworthiness . . . . . . . . 64Capital Inflows from Official Sources . . . . . . . . . . . 65Policy Towards Private Capital Inflows . . . . . . . . . . . 68Foreign Exchange Reserves and Debt Management . . . . . . . 70
ANALYSIS AND PROJECTIONS APPENDIX .72STATISTICAL ANNEX .80M4AP .............................. .. . 146

Page No.
TABLES IN TEXT
2.1 Growth of Gross Domestic Product at 1973 Market Prices 52.2 Growth of Gross Domestic Expenditure at 1973 Market Prices 62.3 Balance of Payments - 1978/79-1980/81 92.4 Central Government Budget Summary 1977/78-1980/81 112.5 Selected Monetary Indicators 15
3.1 Effective Rates of Protection accorded to SelectedIndustries in 1975 19
3.2 Selected Public Enterprises Investment Programs 233.3 Alternative Scenarios for Domestic Oil Prices and
Subsidies 283.4 Summary of Two Growth Scenarios 303.5 Sector Employment Elasticities 32
4.1 Education and Health Statistics for Selected Countries -1975/78 44
4.2 Public Expenditures on Health Education 444.3 Annual Additional Needs for Technical/Scientific/Managerial
Manpower 1980-90 and Output 1979 46
5.1 Indicators of Oil Exploration Activity 505.2 Key Oil Sector Projections - 1980/81-1990/91 515.3 Domestic Consumption of Oil Products 525.4 Net Oil Balance 535.5 Projected Exports under Alternative Cases 555.6 Projected Imports under Alternative Cases 585.7 Real Growth Rates of Exports and Imports under
Alternative Cases 595.8 Projected Resource Balances and Terms of Trade Development 605.9 Projected Government Revenue and Expenditure 1980/81-1985/86 62
6.1 Balance of Payments Projections Under High and Low Cases 656.2 New Commitments of External Public Debt by Source 1975-80 666.3 Projected New Commitments of Grants and Medium-
and Long-Term Loans: High Case 686.4 Disbursed Medium- and Long-Term Public Debt Outstanding 71
SIUMMARY AND CONCLUSIONS
i. The main theme of this report is that Indonesia will have aresource surplus during the first half of the 1980s, and that this comfort-able resource position provides Indonesia with a unique opportunity toundertake a series of policy reforms and an expanded program of investment inexport production, import replacement, and alternative energy supplies, thatin turn will ensure sustained development during the second half of thedecade and beyond. Implementing the policy changes and investment programsin support of these structural changes will pose many challenges for economicmanagement. They are nevertheless essential to address the vast and varieddevelopment needs of the country. Indeed, without such a program ofstructural adjustment, it will be difficult for the Government to continuemaking reasonable progress towards one of its major development goals - thealleviation of poverty - in the latter part of the decade when foreignexchange availabilities will again be limited.
Current Economic Trends
ii. The Indonesian economy was more buoyant in 1980 than 1979./1 Ahigher GDP growth rate, increasing income from a higher level of domesticeconomic activity and favorable terms of trade effects, a balance ofpayments surplus, and relative monetary stability characterized the 1980performance. Highlights of this performance include a record rice harvestof nearly 20 million metric tons, a current account surplus in the balance ofpayments of almost $3.0 billion, and a real GDP growth rate of over 7%. Thelatter compares with an increase of 4.9% in 1979 and an average annual realGDP growth rate of 6.6% in the 1973-79 period.
iii. The strong balance of payments was principally the result of oilsector related net export earnings which increased by $3.0 billion in1980/81. Although the volume of oil exports declined, an increase in theaverage price of oil by 46% to $33.00 per barrel, and an expansion in thevolume of LNG exports, produced the increase in oil sector earnings.Despite the rapid increase in liquidity stemming from the large inflow ofoil income, the rate of increase in consumer prices declined from 28% in1979 to 17% in 1980. While domestic prices continued to rise more rapidlythan international prices, half the gains in competitiveness secured throughthe November 1978 devaluation for manufactured exports and importsubstitutes were still retained by the end of 1980.
iv. The inescapable fact is that average per capita income in Indone-sia is still very low, the current resource surpluses notwithstanding. Each$1 billion earned in foreign exchange adds less than $7 to per capita
/1 The 1979 performance was analyzed in last year-s Bank report,"Indonesia: Long Run Development and Short Run Adjustment", Report rlo.
2788-IND, February 1980.
- ii -
income, which is provisionally estimated at $405 for 1980. The presentforeign exchange surplus tends to mask existing dimensions of poverty, whichinclude limited access to basic services and the urgent need for moreproductive utilization of Indonesia-s most important development resource -its large and rapidly growing labor force. Preliminary results of the 1980population census show total population to be 147 million. The futuregrowth of the labor force based on this estimate will be 3.2% p.a. comparedto the 2.3% estimate made in 1976. Some 2 million persons will thereforeenter the labor market each year in the first half of the 1980s. Thesefigures underscore the urgency of using the additional resources to expandproductive employment in agriculture, industry, public works and the servicesectors.
Growth Prospects and Policy Adjustments
v. Higher oil prices have clearly improved the prospects for rapidgrowth in Indonesia. Foreign exchange surpluses are likely to continuethroughout the first half of the 1980s, during which time growth will beconstrained more by absorptive capacities of the economy and by the produc-tivity of domestic investment than by the availability of foreign exchange.In the second half of the 1980s, however, a secular decline in the volume ofoil available for export is probably inevitable, which, in the absence ofpolicy reforms aimed at a structural transformation of the economy, islikely to limit the growth of Indonesia's import capacity, thereby slowinggrowth in production, incomes, and employment.
vi. To help analyze the outlook, two sets of illustrative projectionshave been prepared: a "High" case, in which Indonesia adjusts successfullyin 1981-85, and thus ensures sustained rapid development after 1985; and a"Low" case in which it does not. In the former case, GDP continues to growin real terms at 7-8% a year throughout the decade. Per capita income wouldrise from an estimated $405 in 1980 to $710 by 1990 (at constant 1980prices), $70 higher than under the Low case. Even after a dramatic curtail-ment of import growth under the Low case, the balance of payments movesrapidly into a large and unsustainable deficit in the latter part of thedecade. Under the High case on the other hand, the transition from relativeforeign exchange surplus to shortage is altogether more gradual. By 1990,the current account deficit is projected to be stable and sustainable andequivalent to about 2.5% of GDP. It should be stressed that macroeconomicprojections for Indonesia are very sensitive to assumptions about oil and LNGprice changes. In this report all balance of payments projections assumethat the export price for oil and LNG will increase by 3% p.a. in realterms. The report's conclusions with regard to the overall superiority ofthe High case, however, remain valid regardless of the precise oil exportprice assumptions. Should the international oil price rise less fast thanprojected, the resource deficits would re-emerge sooner, which makes it moreurgent to adopt the High case policy scenario. The High case is achievable,depending on policies in key areas: the foreign trade regime, the regulatoryand investment climate, domestic resource mobilization and financialintermediation, and pricing and subsidies.
- iii -
vii. Foreign Trade Policy. To avoid the re-emergence of a seriousforeign exchange constraint in the latter part of the decade, substantiallyincreased investments will be required in export and import replacingindustries in which Indonsia has a comparative advantage. This will requireadjustments in the current trade regime which includes tariffs, subsidies,quantitative restrictions and excise duties. These adjustments must lead toa trade regime which approaches a degree of neutrality in the relativeprofitability of export and import competing activities. Towards this end,a number of elements will be required. These include a simplification ofthe system of protection so that import tariffs and excise taxes are thesole sources of protection for domestic industries; unification of thetariff structure and gradual reduction of the level and variance ofeffective rates of protection (to be achieved by reducing import tariffs andexport duties on final goods and raising tariffs in appropriate cases onintermediate goods). These changes would not only have the effect ofsetting Indonesia's non-oil export industries on a more competitive footing,but also of significantly reducing the current inflationary pressures withinthe country. The Government has already announced its intention to furtherreduce import tariffs, but further changes on the lines indicated above willbe needed.
viii. The Investment and Regulatory Environment. Indonesia's investmentrate with respect to GDP has risen from 17% in the early 1970s to about 23% in1980. By 1985 the investment rate would have to rise to about 27% of GDPand then level off close to 30% by the latter part of the 1980s. Both thevolume and the efficiency of new investment would be enhanced by asimplified regulatory environment. In combination with the reform of thetrade regime, such a simplification of the regulatory system will improvethe efficiency of investment by the ensuing changes in resource allocation.With few exceptions, the objectives of the regulatory system in Indonesiaare similar to those found in most countries. They include preservation ofnational control of particular activities, increasing domestic value addedand promotion of regional development. It is mostly in practice, applicationand in its complexity that Indonesia's system differs from other countries.Certain changes have already been undertaken, to reduce the complexity onthe system. But further reforms are an essential complement to changes intrade and financial policy. Simplification of the system is a long termgoal. Initial steps that could be taken in the short-run include:evaluation of applications on the basis of sound cost-benefit analysis (anattempt in this direction is already underway at BKPM); revision ofapplication forms to eliminate superfluous requirements; furthersimplification of the list of investment priorities; use of broadercategories of projects qualifying for special facilities.
ix. Domestic Resource Mtobilization and Financial Intermediation.Financial policies and institutions have a crucial role to play during andbeyond the restructuring process. Despite the present increase in national
- iv -
savings arising from oil revenues, medium and long term efforts will beneeded to raise domestic resource mobilization. This follows from theprospects of declining oil related revenues beyond the medium term and fromthe fact that an enhanced investment program has to be financed outside theGovernment's budget in the medium term. For example, investment programsplanned for industry, electricity and tree crop sectors will leave a gap inexcess of $6.0 billion even after accounting for retained earnings andtransfers from the Government budget. To fill this gap, it is important thatin the medium term policies are directed more towards mobilizing domesticresources, and in providing private and public enterprises with greateraccess to domestic and international capital markets. Efforts should alsobe made to raise non-oil revenues in the budget, through improved taxadministration, and to encourage deposit mobilization efforts through thebanks. In this latter respect, the Government is already exploring ways inwhich the expansion of credit by commercial banks could be also linked tosavings mobilization performance. In addition, consideration could be givento raising the costs of commercial banks access to Bank Indonesia'srediscount facilities thereby providing greater incentives for these banksto increase the level of their deposit liabilities. The present problem ofmaintaining price stability while raising public expenditures has to betackled through monetary surpluses in the implementation of the budget. Tothe extent that these surpluses are generated, bank credit can be extendedto the private sector and public enterprises.
x. Improvements in the efficiency of financial intermediationprocesses will be a key element for transferring funds for increasedinvestments from surplus to deficit sectors. At present, the financialintermediation process must cope with the fact that the majority of foreignexchange resources accrues to the Government. Currently budget transfersand equity participation provide the primary mechanism for transferringthese funds to the nongovernment sector. With further major increases ininvestment in the private and public enterprise sectors, the financialsystem must become better equipped to deal with these transfers.
xi. Price Policy and Subsidies. Budgetary subsidies have risenrapidly in recent years to a level of Rp 2.1 trillion ($3.4 billion) in the1981/82 budget - equal to 15% of the total budget, or 4.0% of GDP. Thelargest subsidy is that on oil products which increased by 82% in the1981/82 budget to Rp 1.5 trillion ($2.4 billion). The economic subsidy (thedifference between international and domestic prices) on oil is muchlarger, and in 1980 amounted to more than $3 billion, equivalent to about 3.5%of GDP. Arguments in favor of maintaining low domestic oil prices are basedon poverty alleviation, inflation control, and environmental protectionconsiderations. The report describes why the subsidization of oil productsis an ineffective method of achieving those objectives, and recommends thatthe subsidy be gradually reduced, and eliminated by the latter part of the1980s. Such a policy would achieve annual foreign exchange savings of about$7 billion (at current prices) and annual budgetary savings of about
Rp 9 trillion (also in current prices), by the end of the decade, sufficientto virtually double the Government's investment program. In addition,realistic energy input pricing would improve resource allocation and thusprovide a more efficient foundation for sustained economic growth in thesecond part of the decade.
xii. The budgetary subsidy on oil products amounts annually to about $5for each person in the lowest 40% income group and about $13 for each personin the upper 60% income group. Despite the small absolute amount benefitingmembers of the poorest group, the abolition of the oil subsidy would howeverimpose a comparatively high burden upon them, and careful thought should begiven to the phasing of the price increases and to ways in which the budgetarysavings from reduced subsidies could be used to supplement the incomes ofthe poor. For example, the savings would over time be sufficient to financea large portion of the rural electrification program on Java, and could beused also to target subsidies toward the lower income groups for consumptionof other, more efficient, energy sources such as bottled LPG. In circum-stances of poverty, inflation and structural adjustment, movement of domesticprices to international and efficient levels has to be accomplished gradually,with due regard for its impact on income distribution. In some countriesthis can be accomplished through taxation policies and in others, where suchpolicies are not effective in redistributing income, targeted subsidies canbe used. The Government is aware of the long-term costs of continuingsubsidies as well as the short-run adjustment costs in raising domestic oilprices to international levels. The Government raised domestic oil pricesin May 1980 by 50% on average and in announcing the price increases reiter-ated its commitment to reduce the subsidy over time and stated inter aliathat such reductions will enable it to finance a larger development program.
xiii. Policy reform in the areas suggested above, would need to becomplemented by expanded public expenditure programs for supportingagricultural services and industrial production designed to raise income andemployment. In addition, expenditures on the social sectors are needed todirectly support poverty alleviation programs as well as raise labor produc-tivity through education, health and nutrition.
Sector Development Programs
xiv. Agriculture. A continued good performance in this sector will becritical for improved food security, income generation, employment and thebalance of payments in the 1980s. Although agricultural institutions arepredominantly within the private sector, the Government plays a vital rolein provision of infrastructure and services. Large public investments willbe needed to maintain a 3.5% growth rate in the sector in the 1980s. Whileemphasis on rice production must continue, special attention to crops suchas sugar and soya, for which large gaps between production and consumptionhave emerged, will be needed. Key elements for expenditure expansion in thesector include continued intensification, specially further development ofirrigation systems in Java, extension of the cultivated area in the OuterIslands and the improvement of support services and better marketing andprocessing services. The future growth of the irrigation subsector will beincreasingly dependent on new irrigation development rather than rehabili-
- vi -
tation both in Java and the Outer Islands. With the additional resources,the Government is now in a position to develop large integrated dams whereeconomically justified. There is also an urgent need to expand tertiarycanal systems and to improve routine maintenance to reap greater productionbenefits from the existing systems, and to develop technical and managerialcapability to undertake new schemes.
xv. The tree crops subsector, which will be an important foreignexchange earner and in which there are millions of smallholders, will makean important contribution to the structural transformation. The Governmenthas a ten year development program for rubber, coconuts, oil palm, coffee,
and cocoa that aims at rehabilitation, replanting and expansion. Thesuccess of the program will depend on the alleviation of manpower,organizational and financial constraints. The latter constraint appliesespecially in regard to smallholders.
xvi. The transmigration program is seen by Government as an importantvehicle for easing population pressures in Java, and of providing low incomefamilies with greater access to opportunities to earn higher incomes.Performance of the program has improved considerably in relation to pastyears, but manpower shortages, weak interagency coordination, and shortagesof land appropriate for food production continue to hamper progress. Bettersite selection, improved reliability of agricultural inputs, cooperativedevelopment, and the provision of livestock are needed to improve incomes infood crop settlements.
xvii. Industry. A two-pronged approach to industrial development willbe needed in the 1980s. One element will be the development of a number ofcapital intensive projects designed to replace imports of intermediategoods or expand exports of raw materials where economical. The Governmenthas plans in hand for investments in petrochemicals (methanol, olefins,aromatics), fertilizers, cement, pulp and paper, basic metals and mining.A subsidiary objective of this part of the strategy is to deepen theindustrial structure. The other element of the strategy will be thepromotion of production from medium and small-scale industries using morelabor-intensive methods. The policy reforms suggested in the trade regimeand the investment licensing system will serve this element of theindustrial strategy. Increased profitability in manufactured exportindustries is essential for the successful development of the industrialstructure.
xviii. Energy. Domestic oil consumption is growing rapidly, and as aresult the volume of oil exports is expected to decline beyond the mid-1980s, even though production prospects have improved compared to earlierassessments. Development of alternative energy sources - especially coal,hydropower and geothermal - which currently account for less than 10% oftotal energy consumption has therefore become a priority. Successful
- vii -
development of nonoil energy sources will require heavy investment inexploration and development and a revision of the present pricing policy.For example, PLN plans to increase its installed generating capacity at anaverage of 16% a year from 2,700 MW at present to 11,700 MW in 1990. It isunlikely that a program of this size - with a total cost of $14 billion -can be financed without substantial local borrowing for the domestic currencycomponent, estimated at $4-5 billion. This underscores the need for thefurther development of the domestic capital market.
xix. Transport. Because of rapidly growing demand for transportfacilities arising both from income growth and from regional dispersion ofthis growth, an expanded expenditure program is warranted for the sector.Priorities for the 1980s will include increased budgetary allocations andimproved organization for road and bridge maintenance, rationalizing theexisting regulation framework to reduce costs, especially in inter-islandshipping, targeting of subsidies to specific routes and continuing emphasison expanding infrastructure to support development of new roads andsecondary ports in the Outer Islands.
xx. Human Resource Development. Although much progress has been madein the provision of education, health and nutrition in the last decade, keysocial indicators for Indonesia suggest that the level of services avail-able remain relatively modest in comparison to many other countries.Increased emphasis on human resource development will thus be a majorchallenge for the 1980s. It will serve as a vehicle for raising laborproductivity as well as poverty alleviation. Although Indonesia has madegreat strides in expanding primary education, progress in secondary andtertiary levels has been much slower and participation rates at these levelsare lower than the averages for all low income countries. Given thatskilled manpower has emerged as the primary constraint to the use ofadditional resources, expanded expenditures on education and training shouldhave a high priority. Large, and in some areas growing gaps between supplyand demand for technical and professional manpower justify substantialinvestments in education beyond the secondary level. In the short andmedium-term the purchase of skills abroad, short-term training programs andon-the-job training facilities will help to bridge some of these gaps. Thesuccess of development programs in the 1980s will depend heavily on progressmade in alleviating the skilled manpower constraint.
xxi. In the field of health, physical achievements have been rapid inJava, but even here it is unclear whether the newly established infra-structure is effectively utilized. The secondary level referral facilitiesand support services are still inadequate. Many district hospitals are inpoor condition and not functioning well, while district health administrationshave received inadequate support from the central level. In the OuterIslands, both infrastructure and service facilities are needed. Extension ofdisease control and prevention programs such as malaria control andimmunization programs to the Outer Islands is a priority. The expenditure
- viii -
expansions must be accompanied by greater in-service training to raise thequality of health service, improved drug supply, and expansion of the networkof health centers and subcenters at district levels.
Balance of Payments and External Capital Inflows
xxii. The projected balance of payments surplus in the first half of the1980s clearly has significance for the Government-s external borrowingstrategy. Increased creditworthiness, as evidenced by attractive interestrates, maturities and grace periods on commercial debt incurred in 1980,ensures Indonesia's continued access to credit markets. But the questionshould be raised whether Indonesia should continue to borrow from externalsources while the current account surpluses persist. In examining thisquestion it is useful to distinguish between capital from official and fromcommercial sources.
xxiii. Since foreign exchange resources are not at present a bindingconstraint on development, continued capital aid to Indonesia has to bejustified more by technical assistance embodied in financial flows than byfinancial flows themselves. Foreign donors, and especially members of theIGGI, have been a major source of financial and technical assistance forIndonesia. Programs and projects developed with the capital and technicalassistance of donors are making an important contribution to the monumentaldevelopment tasks of overcoming poverty, disease, malnutrition, and the lackof basic services. Donors have developed a stock of knowledge in designingprojects and programs in specific sectors; they have a close associationwith the implementing agencies, and have a commitment to developmentassistance that goes well beyond financial transfers. There is therefore aclear case for continued capital assistance for programs and projects thatinclude technical assistance, training, and technology transfers. In thismanner donors can play an important role in assisting the Government in theprogram of structural adjustment.
xxiv. New commitments of loans from official bilateral and multilateralsources are projected to remain relatively stable at about $2.5 billionthroughout the 1980s. However, it is expected that the average terms forthis borrowing will harden. A declining share of loans at highly conces-sional rates is projected to be offset by increased use of official exportcredits.
xxv. With the prospect of continued resource surpluses for severalyears, Indonesia now has the option of using more of its own funds. For thisreason, the report suggests a reduced level of borrowing from private sourcesand especially from the Euro-dollar market in the first half of the 1980s.The level of public borrowing from private sources would, however, have torise again by the mid-1980s in anticipation of the projected balance of pay-ment deficits. New public and private borrowings from private markets are
- ix -
projected to reach about $6 billion annually by the end of the 1980s in theHigh case, a level that would be well within the limits of prudent borrowingfor Indonesia at that time.
xxvi. Direct private investment can also play an important role in thetransfer of managerial skills and technology and in employment creation inthe 1980s. If the policy reforms suggested under the High case were adopted,the decline in net real inflows of direct foreign investment that haspersisted since 1974, could be reversed. Under the High case net inflowsare therefore projected to rise by 5% a year in real terms from less than$200 million at present to $500 million a year by 1990. This rate isslightly above the rate at which direct investment in developing countriesgenerally is likely to grow in the future.
xxvii. Official reserves which at end of March 1981 stand at $7.1 billion(equivalent to 6.9 months of non-oil imports) are expected to rise under theHigh case to about $25 billion by the end of the decade (equivalent to 3.9months of imports). Under the Low case, balance of payments deficitstowards the end of the decade cause a rapid depletion of official reserves,which by 1990 are projected to amount to about $13 billion (equivalent toabout 2.9 months of imports).
xxviii. Disbursed and outstanding external public debt is estimated to be$15.2 billion at the end of March 1981 and is projected under the High caseto grow by about 9% annually to about $34 billion by 1990. The ratio ofinterest and amortization payments (on public and private debt) to exportreceipts which declined sharply in 1980/81 is expected to remain stable atabout 12% during the first half of the 1980s. Under the High case it wouldrise only slightly to 13% by 1990. Under these circumstances Indonesiashould have no difficulty in maintaining a manageable external financialposition.

1. INTRODUCTION
1.01 There were two central themes in last year-s economic report onIndonesia,/1 namely: (a) how to contain in the near future the inflationarypressures associated with the windfall revenues from oil; and (b) how touse the windfall revenues to lay the foundations for sustained economicgrowth and greater equity in the longer-term. These are retained in thepresent report. But there is more emphasis this time on policy changes andinvestment programs needed for long-term structural reform and less onshort-term monetary and fiscal management issues. The special features ofoil-associated resource surpluses - and especially their external origin -will pose many challenges for the economic management of Indonesia in the1980s. The main theme of this report is that a program of structural reformis needed in the first half of the 1980s to ensure rapid growth and improveddistribution during the second half of the decade and beyond.
1.02 Indonesia's medium-term economic prospects appear brighter than ayear ago. Higher oil and LNG prices and improved production prospects, atleast for the next few years, are likely to increase Indonesia-s foreignexchange resource surpluses in the medium-term. This gives the opportunityto maintain GDP growth at 7-8% p.a. in real terms during the 1981-84 period,exceeding the 6.5% p.a. visualized at the time of preparation of Repelita III.Nevertheless, the longer-term prospects for growth, employment, and equitywill depend crucially on policy changes made between now and the mid-1980s.Mainly as a result of rapid domestic consumption growth, oil exports areexpected to decline from the mid-1980s.
1.03 Foreign exchange surpluses have, for the time being, overcome thefinancial constraint which plagued Indonesia for the most of the past twodecades. However, other constraints to development remain and have now cometo the fore. These include skilled manpower, administrative capacity and thecapacity of the construction sector. Because the resource surpluses werenot anticipated when Repelita III was drawn up, strategies to break thenonfinancial constraints have to be articulated, expenditure programsidentified, and the implementation machinery improved. The Government isnow gearing up to these new tasks as there is growing awareness
/1 "Indonesia: Long run Development and Short Run Adjustment," World Bankreport No. 2788-IND, February 1980.
- 2 -
of the unique opportunity afforded by the oil revenues to address the manyand varied development needs of the country.
1.04 By all standards Indonesia remains a poor country despite thecurrent resource surpluses. Each $1 billion earned in foreign revenues addsless than $7 to per capita income, which is provisionally estimated at $405for 1980. Although this level is much higher than that of most low incomecountries, it masks existing dimensions of poverty, limited access to basicservices and the need for more productive utilization of Indonesia-s mostimportant development resource: its large and rapidly growing labor force.From the data on distribution of households by levels of per capitaconsumption, it is estimated that in 1976, the latest year for which data isavailable, some 40% of the total population were subsisting on less than $90per year.
1.05 In the areas of health, education, water supply and other basicservices, there is both the need and the scope for a substantial effort inthe 1980s. Provisional 1980 population census results suggest that lifeexpectancy in Indonesia has increased from less than 50 years in early 1970 toaround 55 years in 1980. But this is still less than that in the majority ofmiddle income countries. The challenges in education are formidable in viewof the shortages of skilled manpower. While primary school enrollment ishigher than for most other low income countries, secondary and high schoolenrollment at 21% and 2% are below the averages of 24% and 4% respectively forlow income countries, and only about one-half and one-fifth respectively ofthe middle income country averages.
1.06 Preliminary results of the 1980 population census put the totalpopulation at 147 million, about 2 million more than had been generallyexpected on the basis of earlier projections. This has important implicationsfor the provision of basic services and for policies aimed at increasing therate of labor absorbtion in the economy. Recent estimates for the futuregrowth of the labor force at 3.2% p.a. compare with the 2.3% p.a. estimatemade in 1976. The revised growth rate for the labor force raises the numberof new entrants to the labor market from 1.5 million p.a. to 2.0 million p.a.during the 1981-84 period. This underscores the urgency of using resourcesnow available to expand productive employment in agriculture, industry, publicworks and service sectors.
1.07 The duration of foreign exchange surpluses cannot be predicted withaccuracy. Even though oil production prospects have improved, the analysisof this report suggests that, if present domestic oil consumption ratescontinue, net exports of oil will begin to decline in the mid-1980s. In theabsence of policy changes and investment programs to stimulate alternativesources of export and income growth, significant resource deficits areprojected to re-emerge during the second-half of the 1980s. But even if oilproduction prospects were to improve beyond current expectations, the case
-3 -
for structural transformation would remain valid. Production in the oilsector is highly capital and skill-intensive and therefore input requirementsdiffer from domestic factor supplies. Hence, domestic consumption and pro-duction linkages are very limited and it will be very difficult to achieveemployment and equity goals within the present structure of the economy.
1.08 The plan of the report is as follows: Chapter Two reviews recenteconomic trends. Chapter Three considers broad macroeconomic options formanaging the resource surplus in the medium-term and policy changes requiredfor longer-term growth. Chapter Four focuses on sectoral development issuesand investment programs and identifies a number of constraints that cut acrossmany sectors. Chapter Five presents balance of payments and budget pro-jections for the 1980s under the alternative scenarios. Finally, Chapter Sixreviews policies towards external assistance and borrowing, in the light ofthe prevailing foreign exchange surplus.
- 4 -
2. RECENT TRENDS IN THE ECONOMlY
2.01 Key economic indicators confirm that the Indonesian economyrecovered fully in 1980 from the 1979 slump. A higher GDP growth rate,improved terms of trade, a balance of payments surplus, and relative monetarystability characterized the 1980 performance. Private consumptionexpenditures also rose sharply, as reflected for example in a 50% increase inmotor vehicle purchases and larger-than-ever numbers of Indonesian pilgrimsto Mecca.
2.02 Underlying these recent developments were three dominant factors:continuing adjustments to the November 1978 devaluation resulting, inter-alia,in the recovery of domestic production; a bumper rice harvest and strongagricultural growth generally; and increases in foreign exchange earningsbrought about by increases in the international price of oil. This chaptertraces the impact of these factors on domestic production and expenditures,the balance of payments, the Government's budget and the domestic price leveland monetary policy.
Domestic Production and Expenditures
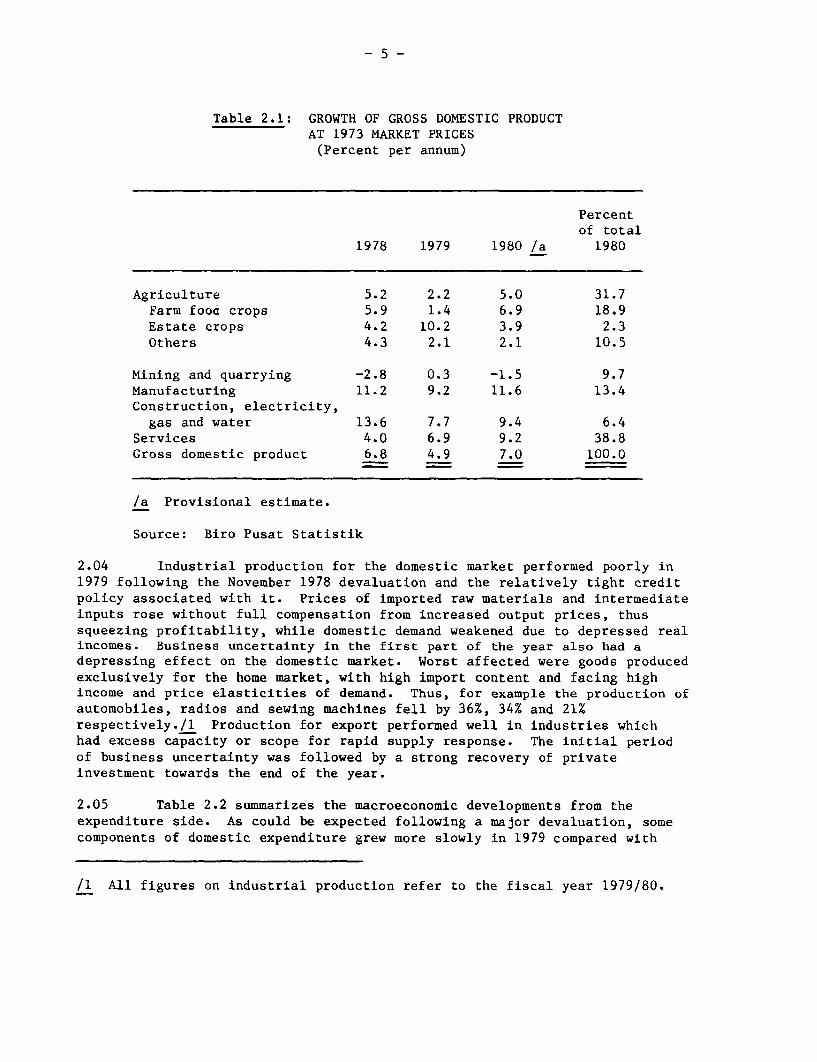
2.03 Economic growth in 1979 was well below that of the previous fewyears. In constant 1973 prices GDP grew by 4.9%, compared with an annualgrowth rate of 6.9% in the period 1973-78 (Table 2.1). The rice harvest,which jumped by a remarkable 10.4% to 17.5 million tons in 1978, increasedonly 2.2% to 17.9 million tons in 1979; while the production of corn, sweetpotatoes and ground nuts was lower than in 1978. The production of logsalso fell despite favorable world market prices. Estate crop production onceagain showed the strongest growth in the agriculture sector due to earliergovernment investments in the public estates, particularly in oil palm andtea, production of which grew by 20% and 39% respectively.
- 5 -
Table 2.1: GROWTH OF GROSS DOMESTIC PRODUCTAT 1973 MARKET PRICES(Percent per annum)
Percentof total
1978 1979 1980 /a 1980
Agriculture 5.2 2.2 5.0 31.7Farm food crops 5.9 1.4 6.9 18.9Estate crops 4.2 10.2 3.9 2.3Others 4.3 2.1 2.1 10.5
Mining and quarrying -2.8 0.3 -1.5 9.7Manufacturing 11.2 9.2 11.6 13.4Construction, electricity,
gas and water 13.6 7.7 9.4 6.4Services 4.0 6.9 9.2 38.8Gross domestic product 6.8 4.9 7.0 100.0
/a Provisional estimate.
Source: Biro Pusat Statistik
2.04 Industrial production for the domestic market performed poorly in1979 following the November 1978 devaluation and the relatively tight creditpolicy associated with it. Prices of imported raw materials and intermediateinputs rose without full compensation from increased output prices, thussqueezing profitability, while domestic demand weakened due to depressed realincomes. Business uncertainty in the first part of the year also had adepressing effect on the domestic market. Worst affected were goods producedexclusively for the home market, with high import content and facing highincome and price elasticities of demand. Thus, for example the production ofautomobiles, radios and sewing machines fell by 36%, 34% and 21%respectively./l Production for export performed well in industries whichhad excess capacity or scope for rapid supply response. The initial periodof business uncertainty was followed by a strong recovery of privateinvestment towards the end of the year.
2.05 Table 2.2 summarizes the macroeconomic developments from theexpenditure side. As could be expected following a major devaluation, somecomponents of domestic expenditure grew more slowly in 1979 compared with
/1 All figures on industrial production refer to the fiscal year 1979/80.
- 6 -
trend rates, while foreign demand for Indonesia's exports was buoyant.Unfortunately, increased exports were not sufficient to compensate fordepressed domestic demand. Fixed capital formation by domestic companieswas disappointing (see Annex Tables 10.2 and 10.3), with domestic investmentapprovals 10% below the previous year. Foreign investment approvals, however,appeared impressive at $1.7 billion compared with $470 million in 1978, butthis performance was strongly influenced by the $800 million Asahan aluminumsmelter. The implementation of foreign investment as reported by BKPM in1979 was 21% below that of 1978 (in current prices), suggesting some post-ponement of investment expenditures./I
Table 2.2: GROWTH OF GROSS DOMESTIC EXPENDITUREAT 1973 MARKET PRICES(Percent per annum)
Averageannualgrowth
1978 1979 1980/a 1973-1978
Private Consumption 8.3 8.2 12.9 7.7
Government consumption 10.7 16.3 14.9 10.1
Gross domestic fixedcapital formation 15.1 4.4 11.4 15.1
Imports of goods & NFS 15.6 13.9 10.0 15.9
/a Provisional estimate.
Source: Biro Pusat Statistik
2.06 International terms of trade moved strongly in Indonesia-s favor in1979, ensuring a rapid growth in national income despite the modest growthin the national product. Export unit values rose on average by 76% whileimport prices rose by less than 11%. Gross domestic income thus rose by12.9% as against the 4.9% GDP growth. By way of comparison, in 1974, afterthe first major oil price rise, Gross Domestic Income and GDP grew by 20.6%and 7.6% respectively.
2.07 In contrast to 1979, 1980 was characterized by high domestic demandas real incomes were restored and previously deferred expenditures were under-
/1 Because of paucity of data total private investment and foreign investmentoutlays cannot be disaggregated from overall Gross Domestic Investmentfigures.
- 7 -
taken. Consumer and investor confidence returned as the cost-inducedinflationary pressures of the post-devaluation period were gradually broughtunder control. Real GDP growth is estimated by the Government at 7.1% in1980 - higher than the average Repelita III target of 6.5%. With furtherimprovements in Indonesia's terms of trade, national income growth exceeded10% in 1980.
2.08 Domestic investment approvals amounted to Rp 1.5 trillion in 1980compared with Rp 689 billion in 1979, indicating the beginning of a newprivate investment boom. In real terms /1 approvals of domestic investmentin 1980 were higher than for any previous year. Applications for investmentlicenses in 1980 were particularly high in the chemical, wood processing andforestry industries, the latter two reflecting the recent government emphasison domestic processing of timber (see para. 2.16).
2.09 Foreign investment approvals amounted to $776 million in 1980,down from $1,765 million in 1979 (which was dominated by the $800 millionAsahan aluminum smelter), but about equal in real terms to the annualaverage of the past five years. However, many of the new approvals relatedto expansion of existing facilities and to revisions in cost estimatesrather than to new investments. The general decline in new foreigninvestment in the nonoil sectors that has prevailed since the mid-1970sappears to be continuing.
2.10 The agricultural sector provided a strong impetus to the economyin 1980, growing by about 5%. The excellent rice crop of almost 20 milliontons, up 11% from last year, was due to relative absence of pests, expandeduse of fertilizer and favorable weather. It has resulted in strongconsumer demand in rural areas (particularly East Java) and stable grainprices. Aggregate output of secondary food crops was relatively stable in1980, with increases in some crops such as cassava, peanuts and soybeans beingoffset by lower corn production. The area under corn, which fell by 15% in1979, declined again in 1980. The main reasons were the increased intensityof rice cultivation, which precludes intercropping with corn, and substitutionof cassava for corn due to high export demand for staples. Reflecting stronggrowth in demand and the slow rate of increase in production, imports of sugarand soyabean grew rapidly in 1980, as did imports of wheat.
2.11 The construction sector showed particularly impressive growth in1980, but was still unable to meet the demand for construction services.The excess capacity which characterized the building industry in 1979 hasbeen superceded by shortages of construction materials and skilled labor.In the first ten months of 1980, construction costs rose at a rate doublethat of the overall wholesale price index./2 Cement consumption, which in
/1 Wholesale price index used as deflator.
/2 Between December 1979 and October 1980, the wholesale price index forconstruction materials rose by 20.3% while the overall non-export WPIrose by 10.2%.
- 8 -
1979 rose by only 1.4% increased by over 20% in 1980, resulting in severe
shortages. Cement imports were at their highest levels since 1976 andexceeded exports.
Balance of Payments
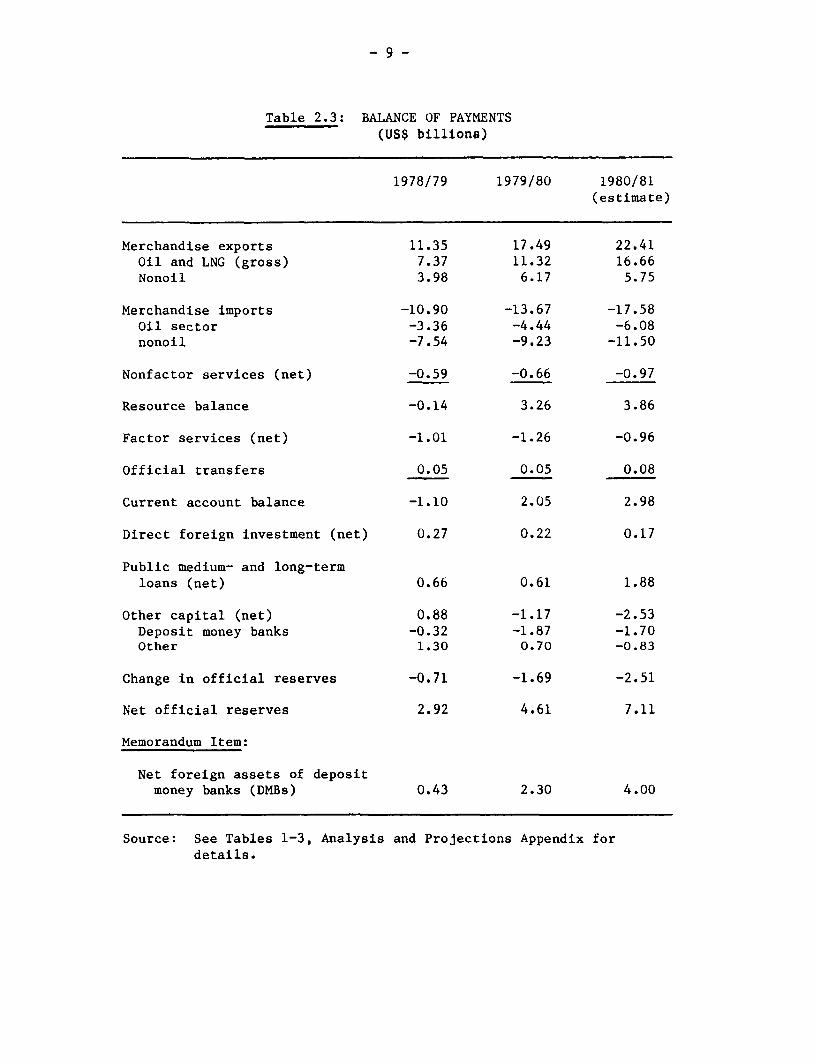
2.12 In 1979/80 Indonesia enjoyed a current account surplus in more thantwo decades. The $2.0 billion surplus was a $3.1 billion improvement over theprevious year and matched the increase in net earnings from oil and LNGexports. Although the volume of oil exports declined by 7% in 1979/80, theincrease in the average export price from $13.50 per barrel in 1978/79 to$22.50 in 1979/80, and the 78% increase in the volume of LNG exports from alow base, accounted for the increase in net oil and LNG export earnings.
2.13 Nonoil merchandise exports, which account for 35% of total earnings,increased by 55% in 1979/80, largely due to higher prices. Volume increaseswere confined to palm oil, coffee, tin, copper and miscellaneous manufactures.The most dramatic volume increase for any one category was in manufacturedexports including garments, textiles, and electronic parts. These items grewby 140% to $1.0 billion under the impetus of the devaluation and the exportcertificate scheme. The increased volume of exports of manufactures primarilystemmed from a reallocation of existing production capacity from the weakdomestic market to the more profitable overseas market rather than fromcreation of new production capacity just for the export market.
2.14 In 1979/80 total nonoil imports grew by 23% to $9.2 billion (orabout 8.7% in real terms). Although similar in the aggregate to the averagegrowth of 8.4% a year in real terms between 1973 and 1978, the composition ofthe import growth in 1979/80 was markedly different from the past. Riceimports rose to $744 million, an increase in volume of 140%. Imports ofintermediate goods increased by 16% reversing a downward trend. The largestgains here were in chemical inputs and textiles, reflecting the strongdemand from manufacturing plants for export-oriented production. Thereduction of tariffs on these imports was also a factor which contributed totheir rapid growth. Capital goods imports, however, remained at a relativelymodest level in 1979/80, reflecting the previously-mentioned weak investmentclimate. Imports of nonrice consumption goods fell by 7.5% in real terms,due to the devaluation-induced relative price shifts and the low level ofconsumer spending.
2.15 In the capital account, disbursements of public medium- and long-term loans declined in nominal terms; net transfers (disbursements lessamortization plus interest payments) were already negative. This was largelydue to the prepayment of over $400 million of debt. The net foreign assets(NFA) of Indonesian commercial banks rose by $1.9 billion, and officialreserves by $1.7 billion. Official reserves rose to $4.6 billion, the equiva-lent of 5.6 months of nonoil imports and net nonfactor services. In additionthe state-owned commercial banks were holding NFA amounting to $2.3 billion.
- 9 -
Table 2.3: BALANCE OF PAYMENTS(US$ billions)
1978/79 1979/80 1980/81(estimate)
Merchandise exports 11.35 17.49 22.41Oil and LNG (gross) 7.37 11.32 16.66Nonoil 3.98 6.17 5.75
Merchandise imports -10.90 -13.67 -17.58Oil sector -3.36 -4.44 -6.08nonoil -7.54 -9.23 -11.50
Nonfactor services (net) -0.59 -0.66 -0.97
Resource balance -0.14 3.26 3.86
Factor services (net) -1.01 -1.26 -0.96
Official transfers 0.05 0.05 0.08
Current account balance -1.10 2.05 2.98
Direct foreign investment (net) 0.27 0.22 0.17
Public medium- and long-termloans (net) 0.66 0.61 1.88
Other capital (net) 0.88 -1.17 -2.53Deposit money banks -0.32 -1.87 -1.70Other 1.30 0.70 -0.83
Change in official reserves -0.71 -1.69 -2.51
Net official reserves 2.92 4.61 7.11
Memorandum Item:
Net foreign assets of depositmoney banks (DMBs) 0.43 2.30 4.00
Source: See Tables 1-3, Analysis and Projections Appendix fordetails.
- 10 -
2.16 For 1980/81 total gross receipts from oil and gas exports areexpected to be about $16.9 billion, an increase of 50% over the previous year.Nonoil exports on the other hand are expected to decline slightly in 1980/81.This is mainly due to an expected decline in timber exports, a modest increasein the value of perennial crop exports (palm oil exports are expected tofall), lower coffee and rubber prices, and a much weaker performance inmanufactured exports. Timber exports, which account for one-third of totalnonoil exports, are expected to fall in volume by about 30% in 1980/81, due tothe introduction of the "Three Minister-s Decree" in May 1980 which requiresthat a certain proportion (currently 66%) of domestic logs be processed withinIndonesia. The poor performance of manufactured exports is mainly due to therecovery of domestic demand, including in particular fertilizer and cement.
2.17 Nonoil imports are expected to increase by about 10% in real termsin 1980/81. Increased capital imports, reflecting an improved investmentclimate as well as the sharp rise in public sector development spending, andlarge imports of cement and fertilizer to meet domestic shortages, account forthe higher rate of import growth. Rice imports on the other hand areprojected to decline given the 1980 bumper harvest which enabled BULOG toprocure a record 1.6 million tons of rice domestically. With the increasedrate of economic activity, other consumer goods imports are expected to growby about 10% in real terms for the year.
2.18 The current account is expected to record a surplus of almost $3billion in 1980/81, to which must be added net inflows of medium- andlong-term loans of about $1.9 billion and direct private investment inflowsof about $170 million. An outflow of $2.5 billion on the "other capital"account is expected, mainly as a result of a large increase (about $1.7billion) in the foreign assets held by the commercial banks and to tradefinancing (about $700 million) provided by Indonesia in connection with itsoil exports. Official reserves are expected to rise by about $2.5 billion to$7.1 billion, equivalent to nearly seven months of nonoil imports.
The Government Budget
2.19 Revenues. Government revenue continues to grow rapidly. The1979/80 domestic revenue of Rp 6.7 trillion was equivalent to an 18% increasein real terms over 1978/79, and the expected receipts of about Rp 10 trillionfor 1980/81 is equivalent to a further 25% real increase./l These gains arealmost entirely due to higher oil revenues which in 1980/81 account for 70% oftotal domestic revenue. The 1981/82 budget revenues (including foreign aid)
/1 The estimated receipts for 1980/81 include a revised estimate of oilrevenue and an upward revaluation of nonoil tax revenue to take accountof high first semester returns and a higher inflation estimate.
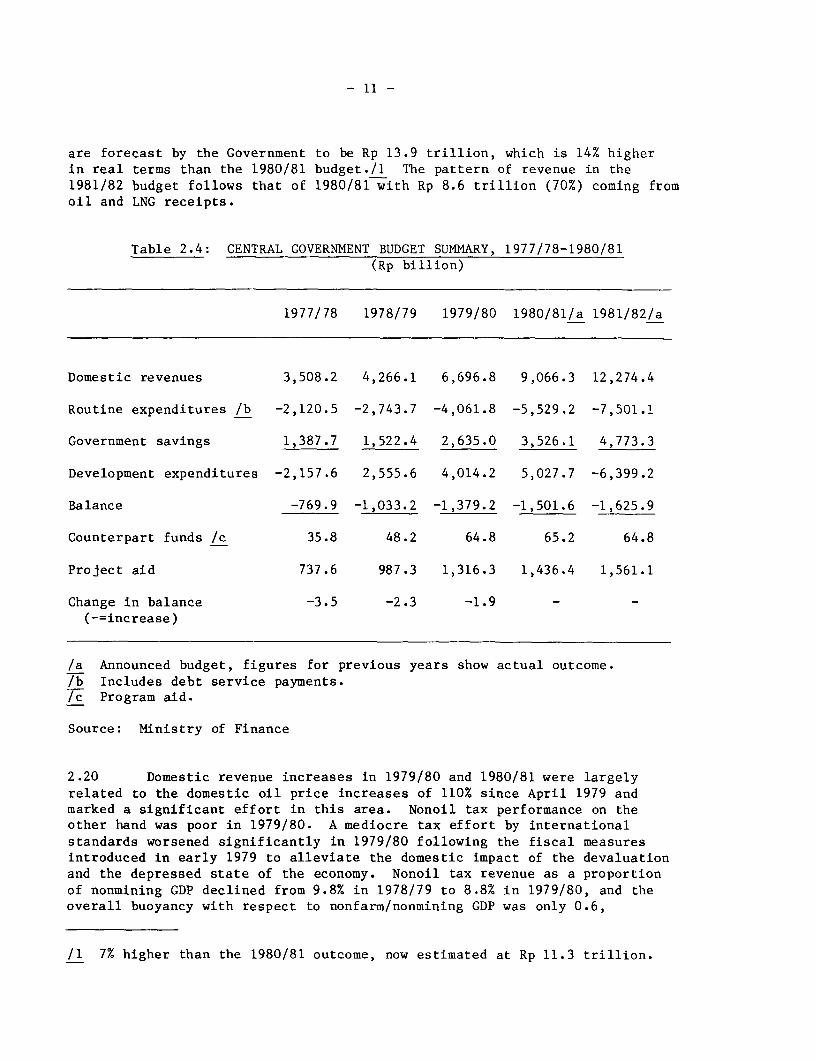
- 11 -
are forecast by the Government to be Rp 13.9 trillion, which is 14% higherin real terms than the 1980/81 budget./1 The pattern of revenue in the1981/82 budget follows that of 1980/81 with Rp 8.6 trillion (70%) coming fromoil and LNG receipts.
Table 2.4: CENTRAL GOVERNMENT BUDGET SUMMARY, 1977/78-1980/81(Rp billion)
1977/78 1978/79 1979/80 1980/81/a 1981/82/a
Domestic revenues 3,508.2 4,266.1 6,696.8 9,066.3 12,274.4
Routine expenditures /b -2,120.5 -2,743.7 -4,061.8 -5,529.2 -7,501.1
Government savings 1,387.7 1,522.4 2,635.0 3,526.1 4,773.3
Development expenditures -2,157.6 2,555.6 4,014.2 5,027.7 -6,399.2
Balance -769.9 -1,033.2 -1,379.2 -1,501.6 -1,625.9
Counterpart funds /c 35.8 48.2 64.8 65.2 64.8
Project aid 737.6 987.3 1,316.3 1,436.4 1,561.1
Change in balance -3.5 -2.3 -1.9 - -(-=increase)
/a Announced budget, figures for previous years show actual outcome./b Includes debt service payments./c Program aid.
Source: Ministry of Finance
2.20 Domestic revenue increases in 1979/80 and 1980/81 were largelyrelated to the domestic oil price increases of 110% since April 1979 andmarked a significant effort in this area. Nonoil tax performance on theother hand was poor in 1979/80. A mediocre tax effort by internationalstandards worsened significantly in 1979/80 following the fiscal measuresintroduced in early 1979 to alleviate the domestic impact of the devaluationand the depressed state of the economy. Nonoil tax revenue as a proportionof nonmining GDP declined from 9.8% in 1978/79 to 8.8% in 1979/80, and theoverall buoyancy with respect to nonfarm/nonmining GDP was only 0.6,
/1 7% higher than the 1980/81 outcome, now estimated at Rp 11.3 trillion.
- 12 -
compared with a historical experience of slightly over 1.0./I In the 1981/82budget, nonoil revenues are estimated at Rp 3.7 trillion, indicating aslightly improved tax effort, despite selected rate reductions. Personalincome taxes, domestic sales taxes, customs duties and sales taxes on inputsall declined significantly in real terms, and only export taxes increased.Some improvement in the buoyancy is likely in 1980/81. Good first semesterreceipts suggest a buoyancy of about 0.9, which implies a further slightdecline in tax effort. No major new measures to raise revenues from nonoilrevenues were introduced during 1979/80 or 1980/81 mainly because oil revenueshave been adequate for Government needs. This continues to be true for the1981/82 budget.
2.21 External assistance passing through the budget has been steadilydeclining in relative importance. In 1979/80 this source of funds stagnatedin real terms, and the budgeted value of Rp 1.5 trillion in 1980/81 impliesa decline of at least 5% in real terms. In 1980/81 external assistance fundsaccount for less than 15% of domestic revenues, compared with 20% in 1978/79.This trend is likely to continue. The 1981/82 budget estimates foreign aidreceipts at Rp 1.6 trillion, implying a further 6% real decline over the1980/81 budget. These external assistance funds were used to financedevelopment expenditures and in 1978/79 they accounted for 41% of totaloutlays. Since then, these funds have financed a steadily declining share ofdevelopment expenditures and in the 1981/82 budget they are projected to meetonly 25% of these outlays.
2.22 Expenditures. The routine budget accounted for 50% of totalexpenditures in 1979/80. Its share in total expenditures is expected torise to 52% in 1980/81, owing to further large increases (about 47% innominal terms) in subsidies, personnel expenditure and transfers to theregions. For the last two items a 50% increase in salaries to publicservants and military personnel is the main cause of the increase inroutine expenditures. In the 1981/82 budget, there is a further shifttowards routine expenditures which account for 54% of the total outlays.This shift is largely due to the increased subsidies.
2.23 Producer and consumer subsidies have risen from Rp 97 billion in1977/78, or 2% of routine and development expenditures, to an estimatedRp 1,450 billion in 1980/81, nearly 13% of expenditure. The 1981/82 budgetallocated Rp 2.1 trillion or 15% of total budgeted expenditures to subsidies.Of this amount, Rp 1.5 trillion is on account of the oil subsidy. Since
/1 The buoyancy is the proportionate change in tax divided by the propor-tionate change in the tax base. A buoyancy greater than unity indicatesa rising tax effort. Nonmining GDP is used in calculating the taxeffort to abstract from the impact of the oil sector, but retain afigure comparable with other countries. Nonfarm nonmining GDP is usedfor the buoyancy as the best aggregate proxy for the various tax bases.
- 13 -
1977/78, about a quarter of the Government's incremental revenue has been usedto increase subsidies. The most dramatic increase has been in the oilsubsidy (Table 3.3). The food subsidy has risen to an estimated Rp 170billion and the fertilizer subsidy to Rp 213 billion in 1980/81. The foodsubsidy, covering rice, wheat and sugar has been rising owing a higher foodimports, increased prices, and the decision to hold domestic prices down forequity and social stability reasons. Fertilizer prices have been decliningin real terms to improve producer incentives. This rapid increase insubsidies has been a major vehicle for distributing the windfall incomefrom higher oil prices among the population. One consequence, however, hasbeen a steady decline in the share of development outlays in totalexpenditures. In 1977/78 these accounted for 50% of the total; by 1981/82they are expected to be about 46% of total expenditures. An emerging issuefor policy is whether subsidies can and should be maintained at their currenthigh levels. The report takes up this question in Chapter Three.
2.24 For the last two years, the composition of incremental expenditurein the development budget has been markedly different from the historicalpattern. In 1979/80, 17% was allocated to Government capital participationand 14% to general public services (comprising law, defence and security,and government apparatus). The social sectors - health, education and housingand water supply also experienced significant increases in expenditurewhereas allocations to the main productive sectors other than industry andmining grew little or declined. Overall, basic development expenditure,excluding the fertilizer subsidy, Government capital participation and generalpublic services, grew at a steady 6-8% p.a. in real terms for the three yearsto 1979/80. The 1980/81 development budget showed a real growth rate ofnearly 20%, with the main beneficiaries of incremental resources beingtransportation, education, agriculture and regional development (mainlyINPRES). In the 1981/82 budget the largest beneficiaries of incrementaldevelopment expenditures are education, industry and mining, and manpower andtransmigration.
Prices and Competitiveness
2.25 Indonesia's inflationary experience over the last two years has beendominated by the influence of the November 1978 devaluation, the rising priceof oil exports, and the monetary and fiscal policy consequent upon thoseevents. In the period October 1978-November 1980 the consumer priceindex for Indonesia rose by 55%, while world consumer prices rose on averageby 30%. Internal prices inevitably rise following a major devaluation dueto increased prices for tradable goods, but the extent to which domesticinflation may exceed the internatonal rate without eroding competitivenessis open to question and depends on the foreign exchange or "traded" componentof domestic expenditure. An "appropriate" consumer price rise may be definedas that which would maintain the gain in competitiveness secured from the
- 14 -
devaluation. Calculations based on import requirements derived from input-output tables for Indonesia suggest that domestic prices could "appropriately"adjust by about 15% above world prices. Thereafter, any excess of Indonesianinflation over world rates would result in a gradual reduction in competi-
tiveness. The extent to which gains in competitiveness are being eroded bydomestic cost inflation differs according to sector and no single measure cancapture trends in competitiveness in all export and import substitutionindustries. Separate indices have been constructed for traditional exports,manufactured exports and import substitutes./l The competitiveness oftraditional nonoil exports, which rose by 65% between October 1978 and October1979, has remained virturally unchanged since than, as international commodityprices have continued to rise at about the same rate as domestic prices. Formanufactured exports and import substitutes almost half the gains in competi-
tiveness have been retained two years after the devaluation despite domesticprice inflation. In mid-1980, the indices for manufactured goods and importsubstitutes, which had both risen by 50% in November 1978 were respectively19% and 25% above their predevaluation levels.
2.26 On a year-over-year basis the rate of increase of the consumer priceindex (CPI) rose from 7.3% in September 1978 to 31% in October 1979 and thenfell steadily /2 for the next eleven months to reach a low of 15% in
/1 Traditional Exports: since producers are "price-takers" in internationalmarkets, domestic profitability is a better measure of competitivenesthan international price differences. The ratio of the nonoil exportcomponent of Indonesia's wholesale price index (WPI) to the price indexfor Essential Commodities in rural Java and Madura is employed here tomeasure supply incentives.
Manufactured Exports: since Indonesian exports compete primarily againstmanufactured exports from other Asian countries, the ratio of exchangerate-adjusted average price indices of eight Asian countries (Malaysia,Thailand, Singapore, Philippines, Taiwan, Korea, Sri Lanka and India) tothe manufactured goods component in Indonesia-s WPI, is used here tomeasure changes in competitiveness.
Import Substitutes: ratio of trade-weighted export unit values (adjustedfor exchange rate changes) of seven industrial countries to Indonesia'sConsumer Price Index (Trade weights are Japan 45%, USA 21%, Germany 11%,
Singapore 9%, Netherlands 5% and Australia 4%).
/2 With the exception of May 1980, when domestic prices for oil and oilproducts were increased an average of 50%.
- 15 -
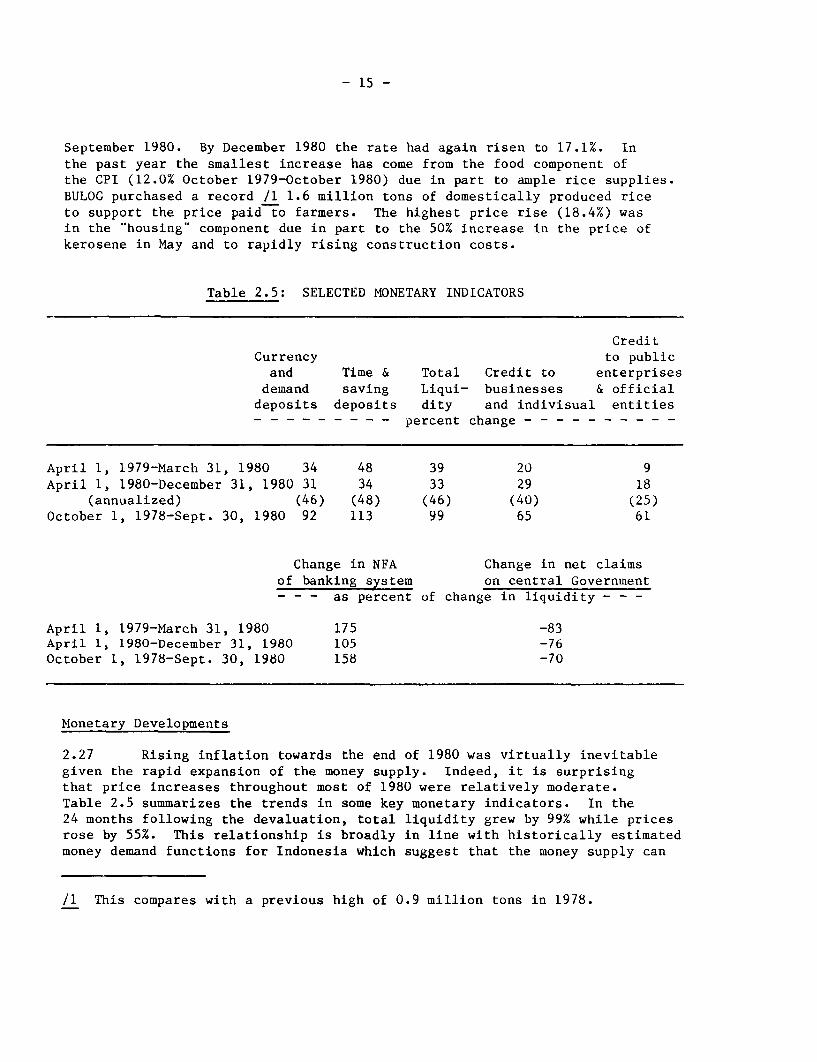
September 1980. By December 1980 the rate had again risen to 17.1%. Inthe past year the smallest increase has come from the food component ofthe CPI (12.0% October 1979-October 1980) due in part to ample rice supplies.BULOG purchased a record /1 1.6 million tons of domestically produced riceto support the price paid to farmers. The highest price rise (18.4%) wasin the "housing" component due in part to the 50% increase in the price ofkerosene in May and to rapidly rising construction costs.
Table 2.5: SELECTED MONETARY INDICATORS
CreditCurrency to publicand Time & Total Credit to enterprises
demand saving Liqui- businesses & officialdeposits deposits dity and indivisual entities- - - - - - - - - percent change - - - - - - - - - -
April 1, 1979-March 31, 1980 34 48 39 20 9April 1, 1980-December 31, 1980 31 34 33 29 18
(annualized) (46) (48) (46) (40) (25)October 1, 1978-Sept. 30, 1980 92 113 99 65 61
Change in NFA Change in net claimsof banking system on central Government- - - as percent of change in liquidity - - -
April 1, 1979-March 31, 1980 175 -83April 1, 1980-December 31, 1980 105 -76October 1, 1978-Sept. 30, 1980 158 -70
Monetary Developments
2.27 Rising inflation towards the end of 1980 was virtually inevitablegiven the rapid expansion of the money supply. Indeed, it is surprisingthat price increases throughout most of 1980 were relatively moderate.Table 2.5 summarizes the trends in some key monetary indicators. In the24 months following the devaluation, total liquidity grew by 99% while pricesrose by 55%. This relationship is broadly in line with historically estimatedmoney demand functions for Indonesia which suggest that the money supply can
/1 This compares with a previous high of 0.9 million tons in 1978.
- 16 -
expand at about 12% a year before creating inflationary pressures./l Realmoney balances were run down during 1979 due to a high and uncertain inflationrate, but appear to have been fully rebuilt during 1980. It is, therefore,very unlikely that the money supply could continue to expand at its currentpace (about 46% for the 1980/81 fiscal year) without causing a substantialincrease in inflation. From Table 2.4 and Annex Table 6.1 it is evident thatthe primary reason for such rapid monetary expansion is the high proportion ofthe foreign exchange accruing to the Government being changed into rupiah andspent domestically through the budget./2 On the other hand, credit to theprivate sector has increased in real terms over the last two years by only6.5%.
/1 This is derived from an estimated income elasticity of money demand of1.5.
/2 The Government presents a balanced budget and balanced accounts everyyear and, as a result, budgetary outlays rise with revenues. However,some expenditures are not disbursed during the same year. The monetarysurplus (change in net claims of the banking system on the CentralGovernment) thus generated - Rp 1.2 trillion in 1979/80 - was not suffi-cient to sterilize the balance of payments surplus (change in net foreignassets of the banking system).
- 1 7 -
3. OPTIONS FOR MACROECONOMIC POLICY
3.01 Indonesia-s short- and medium-term resource outlook is dominatedby developments in the energy sector. The two key features of the currentsituation are:
(a) Indonesia's current account surplus in the balance of paymentsis likely to continue until the mid-1980½s; but
(b) In the absence of policy changes aimed at a structural transfor-mation of the economy, large resource deficits are likely tore-emerge in the second half of the decade.
3.02 Higher oil prices have clearly improved the prospects for rapidgrowth in Indonesia, at least in the first half of the 1980s. In this reportit has been assumed that the real export price for oil and LNG will rise at3% p.a. throughout the decade of the 1980s. In this period, growth will beconstrained more by absorptive capacity than by the availability of foreignexchange. A secular decline in the volume of oil available for export beyond1983/84 is probably inevitable, and this will lead to the re-emergence of aforeign exchange constraint. Since earnings from oil exports would stillaccount for some 55% of total export receipts in the mid-1980s, the overallgrowth of exports may decline sharply, thereby limiting the growth inIndonesia's import capacity and slowing the growth in incomes, production andemployment.
3.03 Thus, Indonesia faces a major challenge over the next few years -to adjust to the declining volumes of oil exports and the consequentpotentially severe constraints imposed on import capacities. The adjustmentprocess has two stages. In the first half of the 1980s, when the balance ofpayments position is likely to be strong, it will be possible to undertake aseries of major policy reforms and an expanded program of investment in exportpromotion, import replacement and alternative energy sources. Such a programof structural adjustment would lay the foundations for sustained economicdevelopment in the latter part of the decade. In this latter period, currentaccount deficits would emerge again, but with adjustment along the linesproposed, these would be moderate both in relation to Indonesia's GDP and itscapacity for foreign borrowing. Sustained growth at 7-8% a year in real termswould be possible while maintaining a manageable internal and externalfinancial position.
3.04 Without a program of structural adjustment along the lines proposedin this chapter, Indonesia would face the prospect of foreign exchangeconstraints that would lead to a sharp slowdown in the growth of incomes andemployment. In these circumstances, it would be difficult indeed for theGovernment to make much progress towards one of its major developmentobjectives - the alleviation of poverty.
- 18 -
3.05 To help analyze the outlook with and without significant policy
changes, two sets of illustrative projections have been prepared. They are
designated "High" and "Low" cases, and they are based on alternative policy
responses to the current situation. The Low case shows an unsuccessful
adjustment in 1980-85; the foundations for a manageable balance of payments
position and sustained growth in the latter part of the decade are notestablished. The High case represents a much more successful adjustment,
with growth being maintained throughout the 1980s at 7-8% a year. The High
case is achievable, depending on policy actions in key areas: policiestowards external trade and export promotion; regulation and productivity of
investment; domestic resource mobilization and financial intermediation;
and changing the pattern of energy production and consumption. A successful
outcome will require carefully designed programs in each of these areas.
Elements of a Policy Package Aimed at Structural Transformation of the
Economy
3.06 The proposed package comprises measures in four policy areas: theforeign trade regime, the efficiency and regulation of investment, financial
policies, and subsidies. The proposed measures are inter-related and should
be conceived as a package because, in combination with each other, they are
likely to be more effective than if taken in isolation. For example, a
simplification of the investment licensing system and certain financial
reforms are important complements to the liberalization of the trade regime,
since without them, entrepreneurs would find it more difficult to respond to
the changed market signals brought about by the new trade regime. Similarly,
a reduction of the oil subsidy is an essential complement to the continuedhigh investment program advocated in this chapter. Without it, the
investment program would have to be severely reduced in the second half of
the 1980s owing to re-emerging foreign exchange and budgetary constraints.
3.07 Foreign Trade Policies./l Indonesia depends heavily on exports of
oil and gas (75% of total earnings) and on agricultural products and
minerals (21% of earnings) for its foreign exchange. Manufactures other
than processed agricultural products account for less than 5% of total
earnings. The projected rapid increase in earnings from LNG exports will be
largely offset by the decline in the volume of oil exports from the middle
of the decade. Export receipts may not keep pace with the growth in demand
for foreign exchange which will be associated with economic growth of 7-8% a
year./2
/1 A more detailed analysis of the foreign trade regime and the regulatory
environment and the policies needed to develop a more dynamic foreign
trade sector and investment environment is found in "Indonesia: Selected
Issues of Industrial Development and Trade Strategy" (World Bank draft
report 1980).
/2 Details of export projections are set out in Chapter 5.
- 19 -
3.08 If, over the longer-term, Indonesia is to avoid the constraint ongrowth that would be imposed by a lack of foreign exchange, a substantiallybetter performance in the growth of exports and further progress in importsubstitution based on a liberalized import regime, will be needed in the1980s. Increased investments will have to be made in the export sector andin import-replacing industries. This, in turn, will require improved profit-ability, especially in a number of export industries, and a continuation ofrecent efforts to reform the trade regime in Indonesia. The devaluation ofthe Rupiah in November 1978, together with associated policy measures,represented the first significant attempt in recent years to reduce theinward-looking bias of the trade regime by encouraging exports andliberalizing imports. The Government has already announced its intention tofurther reduce import tariffs. There is therefore already movement in theright direction, but further changes will be needed.
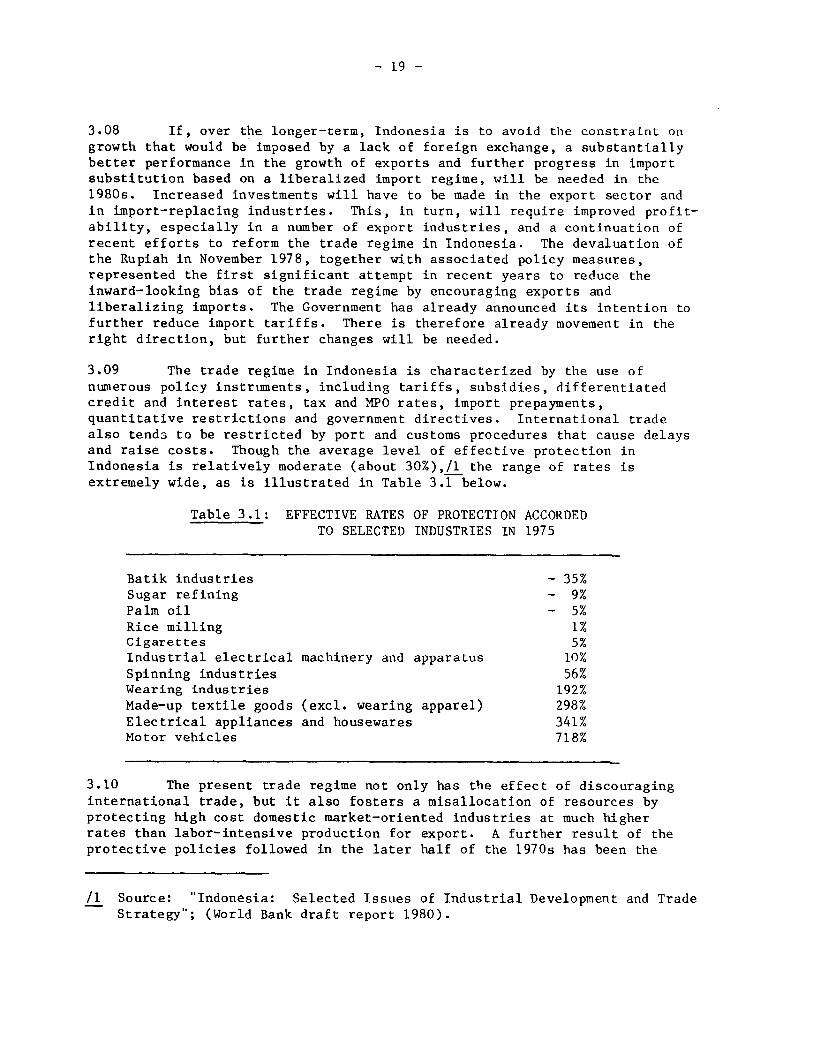
3.09 The trade regime in Indonesia is characterized by the use ofnumerous policy instruments, including tariffs, subsidies, differentiatedcredit and interest rates, tax and MPO rates, import prepayments,quantitative restrictions and government directives. International tradealso tends to be restricted by port and customs procedures that cause delaysand raise costs. Though the average level of effective protection inIndonesia is relatively moderate (about 30%),/l the range of rates isextremely wide, as is illustrated in Table 3.1 below.
Table 3.1: EFFECTIVE RATES OF PROTECTION ACCORDEDTO SELECTED INDUSTRIES IN 1975
Batik industries - 35%Sugar refining - 9%Palm oil - 5%Rice milling 1%Cigarettes 5%Industrial electrical machinery and apparatus 10%Spinning industries 56%Wearing industries 192%Made-up textile goods (excl. wearing apparel) 298%Electrical appliances and housewares 341%Motor vehicles 718%
3.10 The present trade regime not only has the effect of discouraginginternational trade, but it also fosters a misallocation of resources byprotecting high cost domestic market-oriented industries at much higherrates than labor-intensive production for export. A further result of theprotective policies followed in the later half of the 1970s has been the
/1 Source: "Indonesia: Selected Issues of Industrial Development and TradeStrategy"; (World Bank draft report 1980).
- 20 -
creation of excess capacity in many industries such as cable, furniture, carassembly, pharmaceuticals, corrugated boxes and canvas fabrics.
3.11 The main objective of the reform of the trade regime is torestructure the economy along more competitive lines to promote exports. Atthe same time expansion of some major new import substitution activities canbe justified on comparative cost grounds. Some of these activities includeindustries that are capital intensive and would not contribute toemployment, although they would have a significant impact on the balance ofpayments and value added. The basic elements of a reform of the traderegime would include: (a) simplification of the system of protection.Import tariffs combined with appropriate excise taxes should, as a rule, bethe sole source of protection for domestic industries; (b) unification ofthe tariff structure and reduction in average tariff levels over time. TheGovernment appears to be committed to move towards lower tariffs generally,but the desirability of movement towards unification at the same time maynot be fully recognized; and (c) simplification and standardization of theexport certificate scheme. A broader range of manufactured goods could beincluded in the scheme, whether or not they are currently exported, andcertificate levels could be set according to more broadly defined commoditygroups than at present.
3.12 Some of these policy changes will not be easy to bring about andwill have to be undertaken gradually. For example, a program to rationalizeand lower the tariff structure may have to be phased over a period ofseveral years and even then special facilities to assist potentiallyefficient industries in adjusting to the new rates may be needed. Theadoption of these general principles for tariff reform does not precludecontinued protection of certain industrial activities when justified oninfant industry or strategic considerations.
3.13 The recommended trade policy reform would also have the effect ofreducing inflationary pressures in the economy which is an extra advantageunder the current economic circumstances in Indonesia. Any expenditure onimported, rather than on domestically produced goods results in a lowergrowth of the domestic money supply and consequently tends to hold down therate of inflation. Therefore, for any given monetary target, a liberaliza-tion of imports will allow a significantly higher domestic investmentprogram.
3.14 Investment, Efficiency and the Regulatory Environment. Indonesiahas raised its investment rate from about 17% of GDP in the early part ofthe 1970s to a current level of about 23%. As the earlier discussionindicated, additional investment will be needed to expand export and importreplacement industries, and to develop alternative sources of energy for thedomestic market. The capital intensive nature of the investments in importreplacement and in energy development will tend to raise the share ofinvestment in GDP even further.
- 21 -
3.15 The prospective rise in the investment rate should not over-shadow the importance of efficiency in the use of investment and of policiesfor promoting this. Of particular concern here is the efficiency of publicenterprises. Efficient industrialization, for example, can be helped bypolicies that discourage undue capital intensity and do not protect domesticindustry excessively. Another major aspect of efficiency in resource useand one of particular importance for Indonesia is the regulatoryenvironment. It is to this issue that we now turn.
3.16 Like other countries, Indonesia regulates many economic activitiesthrough a number of administrative controls and licenses. The system aimsto achieve a host of objectives that range from broad ones - such as thepreservation of national control over particular activities, the increase indomestic value added, the promotion of regional development and the supportof economically weak groups - to narrow ones such as the protection ofparticular industries or even firms. There are, of course, many otherspecific objectives related to environmental protection, wages, workingconditions, and the number of foreign personnel working in Indonesia. Withfew exceptions, the objectives of the regulatory system in Indonesia aresimilar to those found in most countries. It is mostly in its applicationand complexity that Indonesia's regulatory system differs from othercountries. Yet, in one respect at least - foreign exchange transactions -the Indonesian economy is relatively unrestricted. Indonesia, unlike mostdeveloping countries, has virtually no restrictions on capital movements.
3.17 Reform of the regulatory system to achieve the objectives of thesystem at a lower economic cost is an essential complement to suggestedreforms of the trade regime and financial policy. The main objective of areform of the regulatory system is to allow resource allocation to takeplace in line with the incentive structure which will emerge from tradereforms. The investment licensing system could be the starting point toreform the regulatory system. Certain changes have already been initiatedin the licensing system such as the decision (1978) to make the BKPM(Investment Coordinating Board) a one stop agency, from which a number oflicenses can be obtained at the same time. Another recent improvement inthe system has been the removal of restrictions on the import of second handmachinery.
3.18 However, many other regulations remain and tend to counteractefforts to improve resource allocation in line with trade policy and otherreforms. First, the new incentives that trade reforms can establish forboth export promotion and import substitution may not be fully effective, ifthe granting of industrial licenses continues to be strongly influenced byGovernment-s assessment of the balance between existing capacity anddomestic demand in the relevant industry. Protection of present capacitymay unintentionally help high cost industries to operate, with deleteriouseffects on efficiency. Second, it may prevent new entrepreneurs,
- 22 -
including the economically weak, from entering certain industries, fostermonopolies and, paradoxically, contribute to the creation of excesscapacity. Third, another high cost of the present system is the uncertaintycreated by its complexity and the possibility of conflicting interpretationsof licensing requirements and tax laws. It also entails the maintenance ofa large bureaucracy to administer the system while shortages of skilledadministrative personnel and managers are pervasive.
3.19 Obviously, wholesale simplification of the regulatory system cannotbe undertaken overnight. Besides, certain entrepreneurial groups who atpresent derive unintended benefits from the monopoly power sustained by the
present system may well resist attempts to simplify and liberalize thesystem. Thus, simplification of the system is a long term goal. However,
some initial steps can be taken during the coming years. These couldinclude: (a) evaluation of investment applications on the basis of soundcost-benefit analysis. An attempt in this direction is already underway;
(b) revision of criteria to evaluate applications for investment licenses soas to eliminate superfluous requirements; (c) further simplification of theDSP list of investment priorities administered by BKPM, using broadercategories of investment projects qualifying for tax and other benefits; (d)the recent introduction by the Ministry of Industry of a detailedclassification of subsectors that do not qualify for investment incentives,should be used for statistical purposes only, as it may otherwiseunintentionally become a constraint on private investment in the relevant
sectors. To coordinate and supervise efforts to streamline and simplify theregulatory system, the Government may wish to establish a high levelDeregulation Commission with special authority to intervene in the relevantagencies and processes.
3.20 Domestic Resource Mobilization and Financial Intermediation. Asuccessful program of structural adjustment (the High case) would mean thatthe share of investment in GDP would rise to a level of about 27% by themid-1980s and then level off at close to 30% of GDP by the end of thedecade./l With its resource surpluses in the first half of the 19 80sIndonesia would have little difficulty in mobilizing the necessarygovernment savings for development expenditures. There are, however, reallimits to how far consumption in a low income country like Indonesia can berestrained. In the latter part of the decade therefore, a large part of thefurther increase in investment from 27% to 30% of GDP is assumed to comefrom foreign savings.
3.21 Financial policies and banking institutions have a crucial role toplay during and beyond the restructuring process. Not only must they becapable of transferring savings to the investing sectors in an efficientintermediation role, they must also be capable of mobilizing additional
/1 In the Low case, investment levels off at 25% of GDP by the mid 1980s;there is a much smaller increase in domestic savings so that relativedependence on foreign borrowing is higher.
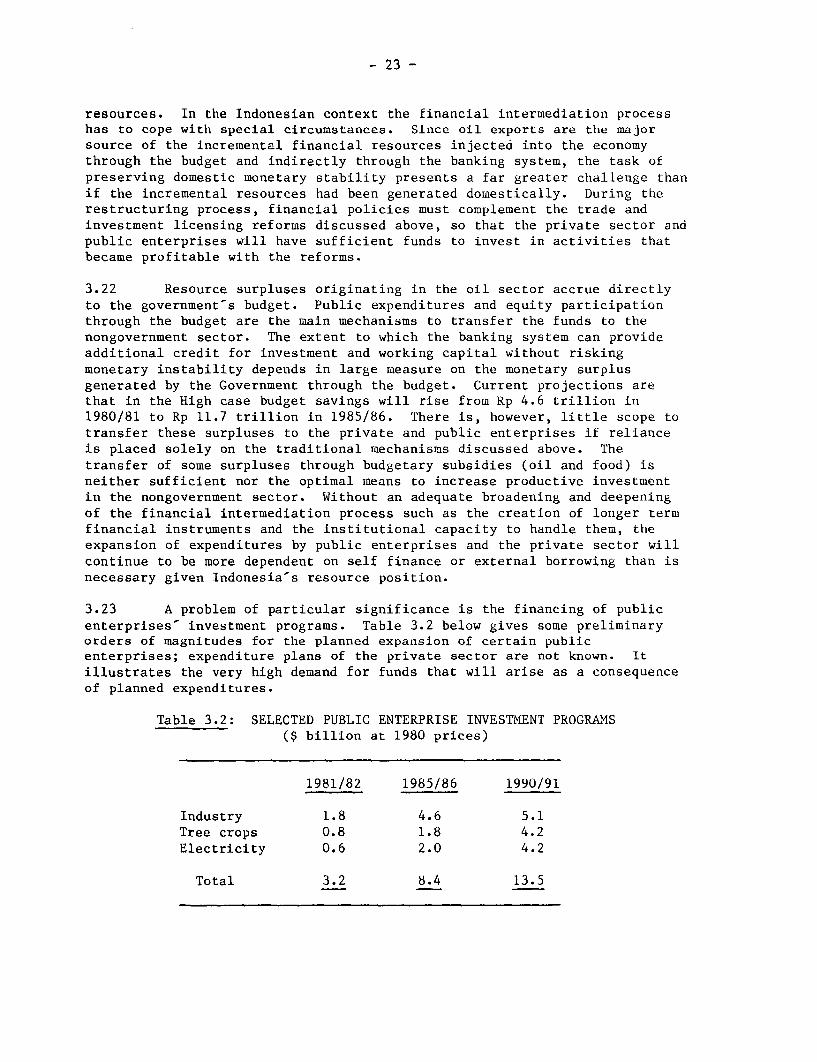
- 23 -
resources. In the Indonesian context the financial intermediation processhas to cope with special circumstances. Since oil exports are the majorsource of the incremental financial resources injected into the economythrough the budget and indirectly through the banking system, the task ofpreserving domestic monetary stability presents a far greater challenge thanif the incremental resources had been generated domestically. During therestructuring process, financial policies must complement the trade andinvestment licensing reforms discussed above, so that the private sector andpublic enterprises will have sufficient funds to invest in activities thatbecame profitable with the reforms.
3.22 Resource surpluses originating in the oil sector accrue directlyto the government's budget. Public expenditures and equity participationthrough the budget are the main mechanisms to transfer the funds to thenongovernment sector. The extent to which the banking system can provideadditional credit for investment and working capital without riskingmonetary instability depends in large measure on the monetary surplusgenerated by the Government through the budget. Current projections arethat in the High case budget savings will rise from Rp 4.6 trillion in1980/81 to Rp 11.7 trillion in 1985/86. There is, however, little scope totransfer these surpluses to the private and public enterprises if relianceis placed solely on the traditional mechanisms discussed above. Thetransfer of some surpluses through budgetary subsidies (oil and food) isneither sufficient nor the optimal means to increase productive investmentin the nongovernment sector. Without an adequate broadening and deepeningof the financial intermediation process such as the creation of longer termfinancial instruments and the institutional capacity to handle them, theexpansion of expenditures by public enterprises and the private sector willcontinue to be more dependent on self finance or external borrowing than isnecessary given Indonesia's resource position.
3.23 A problem of particular significance is the financing of publicenterprises investment programs. Table 3.2 below gives some preliminaryorders of magnitudes for the planned expansion of certain publicenterprises; expenditure plans of the private sector are not known. itillustrates the very high demand for funds that will arise as a consequenceof planned expenditures.
Table 3.2: SELECTED PUBLIC ENTERPRISE INVESTMENT PROGRAMS($ billion at 1980 prices)
1981/82 1985/86 1990/91
Industry 1.8 4.6 5.1Tree crops 0.8 1.8 4.2Electricity 0.6 2.0 4.2
Total 3.2 8.4 13.5
- 24 -
3.24 Even for limited areas of public enterprise investment in industry,tree crops and electricity, there will be tremendous demand for funds. Thisdemand will more than double within the next five years and quadruple by1990. Clearly, even if we assume that as much as 15% of these expenditurescan be financed from cash flow and another 10% through public expenditureparticipations (historically such participation has not exceeded 5% ofgovernment savings), this still leaves a gap of $6.2 billion in 1985/86 and$10 billion in 1990/91 to be financed through domestic and foreign borrow-ings. In other words, public enterprises will have a large resource gap tofill which lends further support to the High growth case because budgetsavings would be substantially higher than in the Low case. Those increasedbudget savings could, if domestic financial intermediation is efficient,effectively reduce the need for foreign borrowing by public sector enter-prises. Although savings through the budget are necessary, they are notsufficient to lead to investments outside the government sector. Improvedand increased financial intermediation will be needed. Furthermore, totalsavings, including nongovernment savings, must be stepped up to meet thegrowing demand for funds for an accelerated investment program. The presentpublic enterprise expenditure plans will thus entail some foreign borrowinggiven the dearth of domestic private capital funds. Two principal methodsfor foreign borrowing by these enterprises are through government guaranteesand through direct contracting for debt without guarantees. In theiroverall impact both approaches represent a charge against future exchangeearnings. No simple criteria exist for making a choice. A number ofelements can be considered, however, in developing a borrowing strategy forpublic enterprises. First, because of the Government's comfortable resourceposition, there is now the possibility to increase Government-s equityparticipation in public enterprises which would also enhance their borrowingcapacity. Second, government guarantees for loans can be given depending onthe financial and economic viability of the projects. Although legally adistinction is made between guaranteed and nonguaranteed borrowing, in termsof economic analysis both options lead to similar results and should betreated as a part of the country-s external liabilities. Finally, financingfrom whatever sources has to be considered in relation to their impact onthe overall structure, and terms of total debt obligations of the country.
3.25 Financial policy reforms to perform the critical resource mobili-zation and intermediation functions will thus be an important element of therecommended policy package. One short term concern for financial policy,however, is the need to sterilize part of the foreign exchange earnings,to avoid an acceleration of inflationary pressures. The primary instrumentfor this, given the nature of the surplus, is budgetary policy. Theresulting control of inflation may incidentally also allow real interestrates to become positive. Over the long run positive real interest rateswill be a critical factor for domestic resource mobilization throughincreased private sector savings. The other domestic resource mobilizationobjective is to raise nonoil revenues in the budget. As noted earlier thebuoyancy of nonoil revenues with respect to nonoil GDP has been very modestin recent years which is suggestive of an insufficient tax effort. Signi-ficant improvements can still be made in the areas of tax administration
- 25 -
and collection. Remaining uncertainties that enterprises face indetermining their tax liabilities also require urgent attention.
3.26 To improve financial intermediation, deposit mobilization effortsshould and can be encouraged even within the present system of monetarycontrols. For example, monetary authorities have for sometime been consi-dering the possibility of linking ceilings on the expansion of commercialbank lending to savings mobilization performance. Furthemore, it would beadvisable to make access to Bank Indonesia's rediscount window more costlyin relation to deposit mobilization efforts. This could be achieved byshifting from a system of indirect subsidies through the rediscount window,to a system of direct budgetary subsidies for priority credits. Finally, itis most important that efforts should continue to be made to achieveinstitutional improvements for state banks through better training andtechnical assistance to reduce costs of operations.
3.27 Price Policy and the Role of Subsidies. Budgetary subsidies havebeen rising rapidly and amount to Rp. 2.1 trillion ($3.4 billion) in the1981/82 budget, equal to 15% of the total budget or 4.2% of GDP. The largestsubsidy is that on domestic consumption of oil products, budgeted atRp 1.5 trillion ($2.4 billion) for 1981/82, an increase of 82% over 1980/81.The other main subsidies channeled through the budget are on food andfertilizer. The budgetary subsidy on oil is much smaller than the trueeconomic cost of the subsidy./l In 1980/81 the average domestic price perbarrel of refined products was $17, compared with an international price ofabout $40 per barrel of similar products. Total domestic consumptionamounted to 140 million barrels implying a total economic subsidy of about $3billion, equivalent to about 3.5% of GDP. The oil subsidies are dominated bytwo products, kerosene and automative diesel fuel, accounting for about 50%and 35% respectively of the economic subsidy.
3.28 Three arguments are frequently advanced in favor of low, sub-sidized fuel prices:
(a) Subsidized fuel prices help alleviate poverty and improve incomedistribution. The current oil subsidies certainly raise the realincome of the lower income groups but by only a small amount andthey also worsen income disparities. According to 1976 expendituresurvey data, about 20% of kerosene is consumed by the poorest 40%of the population, implying that for every Rp. 100 of kerosenesubsidy benefiting a member of the poorest 40%, Rp. 266 willbenefit members of the upper 60%. An increase in the keroseneprice to the world level (about three times the current domestic
/1 The former is based on the difference between Pertamina's actual cashoutlays for crude oil (which includes a large amount of pro rata crudepriced at a small fraction of international values) plus costs ofmarketing and distribution, and revenues from domestic sales, whereas thelater concept measures the difference between the opportunity cost ofcrude used by Pertamina and sales.
- 26 -
price) would impose a burden on the poor, and careful thoughtshould be given to the phasing of the price increases and to waysin whiclh the budgetary savings from reduced subsidies could be usedto supplement reduced incomes of the poor - such as subsidizingmore efficient alterantive forms of energy, possibly includingrural electrification and bottled lPG. The case for acceleratingrural electrification will be further discussed in Chapter 4.
(b) Raising energy prices will cause an increase in the rate ofinflation because of cost-push factors and also because fuelprices have an important psychological impact on general wageand price movements. There are two reasons why the effect onthe overall price level of a reduction in the oil subsidy wouldbe small and possibly even negative. First, the energy contentof economic activity in Indonesia is still very low./l Even verysubstantial domestic oil prices would effect consumer prices onlymarginally./2 Second, the increased budgetary revenue (reducedsubsidy) would have an initial deflationary impact (on the demandside), and reduce the need for converting oil revenues into rupiahsto finance Government development programs by the same amount. Theannual budget subsidy on oil products is currently equivalent toover 25% of the stock of money in circulation and demand deposits.Given these relative magnitudes, domestic oil pricing in Indonesiacould be used as a powerful tool of fiscal policy. If theGovernment should decide not to use all of the incremental revenuesresulting from a decrease in the oil subsidy, the overall effectmay be to reduce inflation.
(c) Higher domestic oil prices would result in further deforestationand the erosion of watersheds. The cross-price elasticity betweenkerosene and firewood is not known with any confidence, but it hasbeen estimated /3 that the subsidy serves to protect at most onlyabout 20,000 ha. of land vulnerable to erosion. If this estimateis reasonably accurate the budgetary cost of protection per hectareis approaching $100,000, roughly two hundred times the cost ofreplanting a hectare!
/1 Energy consumption per capita in Indonesia in 1978 was slightly over200 kilograms of coal equivalent (KCE) compared with an average of900 KCE in middle income countries and 7,000 KCE in industrialcountries c.f. W4orld Bank: World Development Report 1980.
/2 Total domestic consumption of fuel oil products accounts (at currentprices) for about 4% of GDP, and a rough calculation based on the 1975input-output table suggest that the direct and indirect price effects ofa doubling of domestic oil prices would raise the consumer price indexby about 4%. This ignores psychological effects which could lead tofurther price increases.
/3 David 0. Dapice, "Some Notes on Oil Product Consumption in Indonesia,"forthcoming in Malcolm Gillis & Peter Timmer, Public Policy inIndonesia: Issues and Methodology. (Oegelslanger, Main and Gunn, 1981).
- 27 -
3.29 There are three major reasons why oil subsidies should begradually reduced: first, foreign exchange savings through reduceddomestic consumption growth, could amount to almost $7 billion dollars (incurrent prices) annually by the end of the decade if domestic prices wereraised to world levels (see table 5.4). Second, annual budget savingscould amount to Rp. 9 trillion (in current prices) by the end of Repelita IV.Over a five year period, this saving would be sufficient to finance ruralelectrification in a large part of Java and other socially oriented programsfor the Outer Islands and would lead to significant additional reductionsin kerosene consumption. Finally, realistic input pricing would improveresource allocation and thus provide a more efficient foundation forsustained economic growth in the second part of the decade. Realisticdomestic oil pricing would also eliminate relative price incentives forillegal resale at higher prices in foreign markets.
3.30 Under the High case it is assumed that the economic subsidy ondomestic oil products is gradually reduced, and eliminated by the end ofRepelita IV. A 12% real increase in the domestic price each year until1988/89 is required to achieve domestic consumption of 281 million barrelsby that year./l In the Low case, it is assumed that there are no nominalincreases in domestic oil prices for the next two years and thereaftermodest real increases. This results in a domestic consumption figure of 334million barrels by 1988/89. Table 3.3 illustrates the effects of thealternative price assumptions on domestic consumption, budgetary andeconomic subsidies, and government savings. By the end of Repelita IV theannual difference in domestic consumption would be about 53 million barrels,equivalent to almost $5 billion (current prices) in foreign exchangeearnings and Rp. 11.5 trillion in budgetary revenues, sufficient to allow avirtual doubling of government financed development expenditures. Thedifference in consumption would, of course, be greater were it not for thefact that income is projected to grow more rapidly under the High case./2Reducing the rate of increase in domestic oil consumption is therefore a keyissue for the balance of payments and the rate of investment. The Govern-ment is aware of the long-term costs of continuing the oil subsidy as wellas the short-run adjustment costs in raising domestic oil prices tointernational levels. The Government raised domestic oil prices in May 1980by 50% on the average and in announcing the price increases reiterated itscommitment to reduce subsidies over time and stated inter alia that suchreductions will enable it to undertake an expanded development program.
/1 This includes a 12% real price increase in the current fiscal year,1981/82, despite the Government-s announced intention not to raisedomestic oil prices this year. To compensate for delayed price adjust-ment, the High case has to assume that domestic oil prices will beraised by 25.4% in real terms in 1982/83 or alternatively 13% p.a.in real terms through 1988/89.
/2 If in both cases income grew at the same rate as the Low case, (i.e.5-6% p.a.), the annual difference in consumption by 1988/89 would be 88million barrels, equivalent to $6.3 billion in foreign exchange earningsand Rp. 19.0 trillion in budgetary revenues (in current prices).
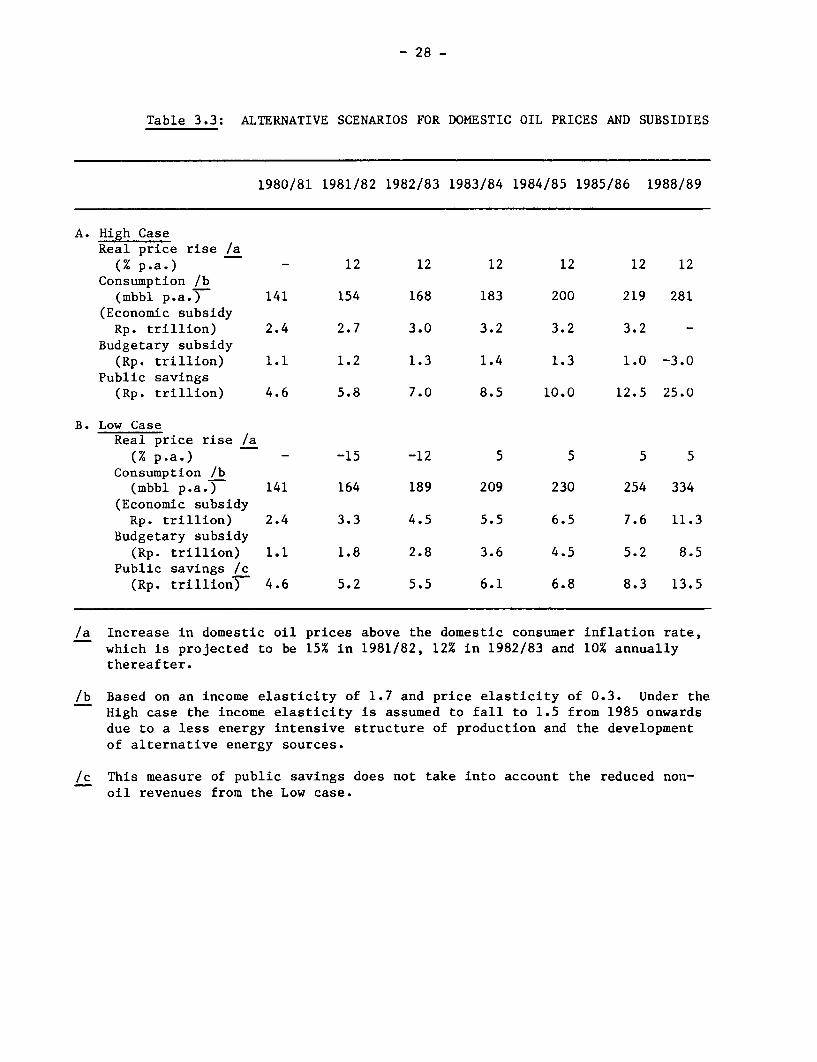
- 28 -
Table 3.3: ALTERNATIVE SCENARIOS FOR DOMESTIC OIL PRICES AND SUBSIDIES
1980/81 1981/82 1982/83 1983/84 1984/85 1985/86 1988/89
A. High CaseReal price rise /a
(% p.a.) - 12 12 12 12 12 12Consumption /b
(mbbl p.a.) 141 154 168 183 200 219 281(Economic subsidyRp. trillion) 2.4 2.7 3.0 3.2 3.2 3.2 -
Budgetary subsidy(Rp. trillion) 1.1 1.2 1.3 1.4 1.3 1.0 -3.0
Public savings(Rp. trillion) 4.6 5.8 7.0 8.5 10.0 12.5 25.0
B. Low CaseReal price rise /a
(% p.a.) - -15 -12 5 5 5 5Consumption /b
(mbbl p.a.) 141 164 189 209 230 254 334(Economic subsidy
Rp. trillion) 2.4 3.3 4.5 5.5 6.5 7.6 11.3Budgetary subsidy
(Rp. trillion) 1.1 1.8 2.8 3.6 4.5 5.2 8.5Public savings /c
(Rp. trillion) 4.6 5.2 5.5 6.1 6.8 8.3 13.5
/a Increase in domestic oil prices above the domestic consumer inflation rate,which is projected to be 15% in 1981/82, 12% in 1982/83 and 10% annuallythereafter.
/b Based on an income elasticity of 1.7 and price elasticity of 0.3. Under theHigh case the income elasticity is assumed to fall to 1.5 from 1985 onwardsdue to a less energy intensive structure of production and the developmentof alternative energy sources.
/c This measure of public savings does not take into account the reduced non-oil revenues from the Low case.
- 29 -
3.31 The extent of subsidies on other commodities has also beengrowing, and serious price distortions are emerging which have adverseeffects on productivity. The 1981/82 budget includes Rp. 0.6 trillion fornon-oil subsidies, divided about equally between fertilizer and food.However, this figure greatly underestimates the true economic subsidiesinvolved. For example, while the import price of sugar in 1980 rose toover $800 per ton, BULOG continued to procure sugar from domestic millsat about $450 per ton which implies a tax on producers and a subsidyto consumers of $350 per ton on sugar thus procured./1 In the medium andlong-term it is important that domestic producers should receive incen-tives from rising world prices. If low consumer prices are deemednecessary it would be preferable to explicitly target subsidies toconsumers through the budget while allowing producers to receive theeconomic price. Another important example of this principle is the case ofpalm oil. Domestic crude palm oil producers are required to sell tofractionation plants at a substantial discount below the export price.Although the domestic consumer price is officially determined, it remainseffectively uncontrolled. This means that high profit margins are earned byfractionation plants and/or traders. The unintended effect is that as agrowing proportion of crude palm oil production is thus diverted to thedomestic market at the expense of the palm oil estates, incentives forfurther investment in oil palm decline.
3.32 With regard to the large and rapidly growing fertilizer subsidyit should be mentioned that this important subsidy has enabled the Govern-ment to maintain slightly improved producer incentives to rice growerswithout commensurate increases in the guaranteed floor price for gabah(unmilled rice). Given the great economic and psychological importanceof the price of rice in the Indonesian economy, the fertilizer subsidypolicy can be said to have been a major element in the Government'soverall anti-inflation strategy. The point has now been reached, however,that both the price of natural gas (input for urea - Indonesia's dominantfertilizer) and the price of fertilizer need review. The prevailingartifically low price of natural gas is slowing down exploration and mayretard the start up of projects that would be dependent on gas.
Summary of the Two Policy Scenarios
3.33 Adoption of the package of policy reforms as described abovewould not only result in higher growth during the first half of the 1980½sbut, more importantly, would lay the foundations for sustained rapiddevelopment including progress towards employment and equity objectives inthe second half of the decade. A summary of the main features of these twoscenarios is set out in Table 3.4.
/1 From April 1, 1981, the domestic producer price paid by BULOG was raisedto $560 per ton, which is close to current import c.i.f. prices.
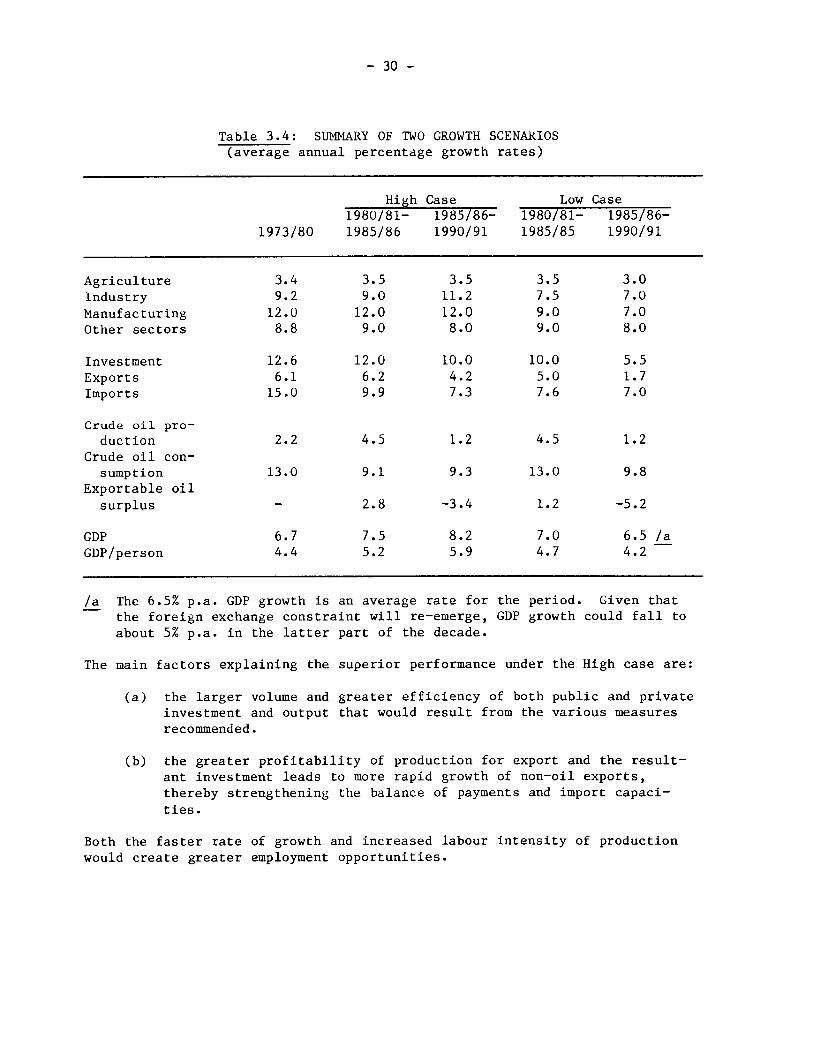
- 30 -
Table 3.4: SUMMARY OF TWO GROWTH SCENARIOS(average annual percentage growth rates)
High Case Low Case1980/81- 1985/86- 1980/81- 1985/86-
1973/80 1985/86 1990/91 1985/85 1990/91
Agriculture 3.4 3.5 3.5 3.5 3.0Industry 9.2 9.0 11.2 7.5 7.0
Manufacturing 12.0 12.0 12.0 9.0 7.0Other sectors 8.8 9.0 8.0 9.0 8.0
Investment 12.6 12.0 10.0 10.0 5.5Exports 6.1 6.2 4.2 5.0 1.7Imports 15.0 9.9 7.3 7.6 7.0
Crude oil pro-duction 2.2 4.5 1.2 4.5 1.2
Crude oil con-sumption 13.0 9.1 9.3 13.0 9.8
Exportable oilsurplus - 2.8 -3.4 1.2 -5.2
GDP 6.7 7.5 8.2 7.0 6.5 /aGDP/person 4.4 5.2 5.9 4.7 4.2
/a The 6.5% p.a. GDP growth is an average rate for the period. Given thatthe foreign exchange constraint will re-emerge, GDP growth could fall toabout 5% p.a. in the latter part of the decade.
The main factors explaining the superior performance under the High case are:
(a) the larger volume and greater efficiency of both public and privateinvestment and output that would result from the various measuresrecommended.
(b) the greater profitability of production for export and the result-ant investment leads to more rapid growth of non-oil exports,thereby strengthening the balance of payments and import capaci-
ties.
Both the faster rate of growth and increased labour intensity of productionwould create greater employment opportunities.
- 31 -
3.34 The differences in outcome between the High and Low cases are mostmarked in the latter part of the decade, since it is only then that, underthe Low case, investment is constrained by a shortage of foreign exchange.It is probable that, even in the period of 1981-85, investment growth wouldbe more rapid in the High case (12%) than in the Low case (10%) due to amore attractive investment climate in the former. The greatest differencein sectoral growth rates occurs in manufacturing, where responsiveness toimprovements in the regulatory and trade environment and to availability offoreign exchange financing is projected to be greatest. By 1990, themanufacturing sector would account for 17.5% of nonmining GDP (in constant1979 prices) under the High case, but only 13% under the Low case./lAgricultural growth would be about half a percentage point higher in theHigh case, principally due to increased output of perennial crops broughtabout by the reduction of export restrictions. Perhaps the comparison ofgrowth rates underplays the qualitative differences in the two outcomes.Should the foreign exchange constraint become more binding in the Low case,a reduction in the growth rate becomes necessary to sustain externalequilibrium. The implication of such a reduced growth rate will be seriousfor employment and equity objectives.
Implications for Incomes, Employment and Equity
3.35 Under the High case, GNP per person would increase from $405 in1980 to $710 by 1990 (at 1980 constant prices), whereas in the Low caseper capita income would be smaller by some $70 in 1990 (also at 1980 con-stant prices). This difference in income would more than compensate forthe gradual removal of subsidies (the economic value of which were about$20 per person in 1980). Even among lower income families, averageincomes would be higher and access to public services improved as aresult of diverting these subsidies. Moreover, subsidy policies cannot besustained over the long run, unlike improvements in equity, that are basedon the creation of more productive employment opportunities.
3.36 One major objective of the policy reforms under the High case isthe creation of productive employment opportunities for the estimated 2 mil-lion new entrants into the labor market per year and for those who arecurrently forced into marginal activities because of under-employment.Since it is possible to achieve the high growth rate without commensurategains on the employment front, the emphasis is not on high growth for its ownsake. The Low case on the other hand can hardly provide for the absorptionof the growing labor force let alone a reduction in current under-employment.The nature of the issues is brought out by the sectoral employmentelasticities as reflected in Table 3.5.
/1 In 1979 the manufacturing sector accounted for 11% of non-mining GNP.

- 32 -
Table 3.5: SECTOR EMPLOYMENT ELASTICITIES, 1961-71 & 1971-78
GDP growth rate Employment growth rate Employment(% p.a.) (% p.a.) elasticities
1961-71 1971-78 1961-71 1971-78 1961-71 1971-78
Agriculture 2.75 3.53 1.48 2.13 0.54 0.60Industry 6.42 12.89 4.94 3.20 0.77 0.25Services 4.24 9.63 5.18 6.31 1.22 0.66
All sectors 3.97 8.04 2.57 3.32 0.65 0.41
Source: World Bank Staff estimates
3.37 Table 3.5 is based on observed relationships between output growthand employment growth in Indonesia. It suggests that of the two policyscenarios only the High case offers the prospect that employment growth willapproximate the growth of the labor force. Moreover, with improvements inresource allocation, sector employment elasticities should increase overtheir historical values.
3.38 Given the present structure of the economy, it is clear that in theaggregate, agriculture must continue to be a major source of incrementalemployment. These remarks reinforce the importance of alleviating constraintson public expenditure both in agriculture proper and in supporting infra-structure such as roads, as will be discussed in Chapter 4. Given itsrelatively small size at present it is unlikely that manufacturing will be amajor source of additional employment in the medium-term at least./1 In theaggregate, incremental employment from manufacturing is, for the time being,bound to remain modest compared to incremental agricultural employment. Thisis an important observation since countries that have enjoyed rapid increasesin economy-wide real wages have done so largely as a result of an expandingdemand for industrial labor. When real wages started to increase rapidly inthe Republic of Korea during 1968-73, period, for example, the manufacturingsector accounted for 36% of incremental employment compared with only 6% inIndonesia for the period 1971-78.
3.39 Although the manufacturing sector in Indonesia cannot be the majorsource of incremental employment in the near future, establishing theappropriate environment for a rapid expansion of output from privatemanufacturing is an immediate concern. In the medium-term the demands placedon the construction sector will have the added virtue of strengthening the
/1 This does not of course mean that that additional employment per dollarinvested is necessarily greater in agriculture than it is in industry.In fact, for small- and medium-scale industry, the employment effectsper dollar of additional investment may well be greater than most branchesof agriculture.
- 33 -
overall demand for unskilled labor. Facilitating the expansion ofconstruction activities is thus important, not only to speed theimplementation of public programs, but also as a powerful instrument of jobcreation. During the next decade the construction sector could become, ifit is not already, the major source of incremental productive employmentoutside agriculture.
3.40 The suggested reforms - especially those related to trade and theincentive system - will thus accelerate the growth in the demand for laborand may therefore be expected to contribute to the Government s equity objec-tives which are given first priority in Repelita III and other importantstatements of Government policy. Increased employment opportunities providethe primary basis for improved income distribution. In addition, thetargeting of subsidies will also improve the welfare of those who are most inneed of help. The present subsidies benefit the high income groups more thanthe low income groups. Although the contribution from the manufacturingsector towards employment creation will be small in the medium-term, in thelong run it becomes the main sector for employment creation. Increasedinvestments in agriculture and tree crops that are expected to result fromtrade reforms will absorb millions of small farmers in these activities.Finally, the expansion of public expenditures on social sectors - health,nutrition and education - as recommended in Chapter 4 will also contribute toequity objectives. The same applies to enlarged programs for transmigration,rural roads and improved maintenance of irrigation systems and forinfrastructure creation.
3.41 In conclusion, it should be stressed that the projection ofIndonesia's resource position is highly sensitive to international oil andLNG price assumptions. If the export price should rise less fast thanassumed (3% p.a. in real terms), a resource deficit would appear sooner thancurrently projected. The report's conclusion with regard to the overallsuperiority of the High case policy scenario however remain unaffected bythis. If anything, the possibility of more slowly rising internationalprices, underlines the urgency of adopting the policy changes associated withthe High case as early as possible.
- 34 -
4. ISSUES IN PUBLIC EXPENDITURFS
4.01 Policy reforms needed to lay the foundations for an acceleratedprogram of development were set out in Chapter 3. These policies would haveto be complemented with an expanded public development expenditure program.This chapter reviews public expenditure programs in the major sectors andsuggests areas in which outlays can be expanded. It concludes with a briefreview of some of the key constraints to expansion.
4.02 An expanded program of public development expenditures will beneeded to support the policy proposals in Chapter 3 for several reasons.First, agricultural and industrial production programs designed to raiseincomes and employment must be assisted directly, for example throughimproved agricultural support, power, transport and communication services.In many regions of the country these basic services are still far fromadequate. Second, despite its oil wealth there is still widespread povertyin Indonesia. Growth in income through expanded production programs is vitalto reducing the incidence of absolute poverty. However, the worst aspects ofpoverty include not only low incomes, but also malnutrition, high rates ofchild mortality, disease and lack of education. To further reduce theincidence of poverty, expanded programs will be needed in each of these areas.
Review of Sectoral Programs
4.03 Agriculture. Agriculture is the largest sector in the economy,contributing 30% to GDP in 1979 and accounting for 61% of total employment;its performance is critical to both expanding export earnings and reducingimports and it provides a majority of total employment. Continued increasesin agricultural production coupled with increased labor productivity will bean essential element in Indonesia's development in the 1980½s. Agriculturalenterprises are predominantly within the private sector, but the Governmentplays a vital role in provision of infrastructure and services. Publicexpenditures for a variety of supporting services for agriculture must beaccelerated to maintain the 3.5% growth in agricultural output discussed inthe High case in Chapter 3.
4.04 The rapid growth in agriculture in the 1970's stemmed in largepart from extensive public investment in rehabilitation of existing facilitiesand services, most of which were relatively quick to yield benefits.Increased production in the 1980-s will continue to come from more intensiveuse of existing areas and from bringing new land into cultivation. Buthigher production from areas already under cultivation will increasinglyrequire heavy investments in longer-gestation projects that will be slow toyield benefits (e.g. new irrigation systems rather than rehabilitation ofexisting ones, watershed protection and development). At the extensivemargin it will be lower quality or increasingly inaccessible land that will bebrought into production. All of these factors will lead in the direction of
- 35 -
relatively higher public outlays to ensure that agricultural output continuesto expand at a rate of 3.5% a year. Slower growth in agriculture willjeopardize food security, poverty and employment objectives, and will putunreasonably heavy burdens on the nonagricultural sectors in meeting theseobjectives.
4.05 A broad strategy to accelerate public expenditures in the sectorshould include: (a) continued intensification and the fine tuning of theirrigation system in Java while extending the cultivated area in the OuterIslands, including transmigration and other multipurpose projects;
(b) improvement of input distribution services (seeds, research, extension);and (c) better marketing and processing facilities.
4.06 A high proportion of past expenditure has been in support ofexpanding rice production, though allocations to nonrice food crops and arange of tree crops have also increased. Ninety-five percent of Indonesia'srice production is grown under irrigated or wetland conditions. Althoughaverage yields in these areas are already close to four tons of paddy perhectare, yields can continue to increase through application of improvedagronomic technology and better water management. The record 1980 rice cropof nearly 20 million tons is, in large part, due to the Government's supportof improved input services, irrigation development and the reduction in therelative price of fertilizers./l Research accounts for a small fraction ofexpenditure but will continue to be a critical complementary input for allcrops.
4.07 Expansion of irrigation, along with growing use of HYV technologies,has played an especially important role in increasing rice production. Inthe past most of the attention has been given to rehabilitation of oldsystems on Java. The future growth of the irrigation subsector will beincreasingly dependent on new irrigation development in both Java and OuterIslands. With the increased availability of finance the Government is now in
a position to develop large integrated dams on Java, where these are economi-
cally justified. A $250 million project at Kedungombo and another project atJatigede are likely to go ahead in the near future and other sites should heappraised without delay. It has been estimated that almost $700 million (1980prices) should be invested in irrigation annually (excluding dams) if thecountry is to satisfy the growing demand for rice./2
4.08 However, the rate at which new schemes can be developed iscritically dependent on the technical and management skills available to theDirectorate General of Water Resources Development (DGWRD). This agency has
/1 The decrease of the urea-gabah floor price ratio by 75% between 1976and 1980 has significantly strengthened producer incentives without majorshifts in the price of rice relative to other crops.
/2 See the Indonesia Irrigation Program Review, World Bank ReportNo. 2027a-IND.
- 36 -
shown remarkable development in staff quality and availability, but in rela-tion to its rapidly growing tasks, it is short of critical manpower. Also, atpresent the capacity of local contractors in surveying, mapping andconstruction is inadequate and, within Government, the scarcity of skilledmanpower - in particular, experienced managers and planners - is a seriousconstraint on irrigation development. One area of potentially high payoff isimproved routine maintenance of existing systems. The present allocation ofabout Rp 5,000 per hectare seems inadequate and goes mainly on salaries andsupport expenditures. Increasing expenditures for maintenance should have avery high rate of return and is one of the most profitable areas for use ofGovernment funds in the subsector at this time. To be effective, however,increased allocations will have to be complemented with intensive training ofDGWRD field staff and greater support for water user associations. The rapidexpansion of tertiary canal systems is another high priority area foradditional investment. The ecological precariousness of many areas in Java,owing to the continued deforestation of hill sides and extremely intensivecultivation, remains a matter of concern. The existing regreening program hashad disappointing results and the Government is now developing a moreintensive project-oriented approach to watershed management.
4.09 Preliminary conclusions of a new World Bank study on secondary foodcrops in Indonesia suggest tllat within a very wide range of relative prices,domestic demand for staples other than rice (sweet potatoes, cassava and corn)is unlikely to be very buoyant in the years to come. Unless there aredomestic processing or export possibilities, it would not be prudent to aim ata production expansion rate significantly higher than historical rates. Withregard to sugar and soya, there is a large and rapidly growing gap betweendomestic production and consumption of those crops. There may be greatpotential for increased sugar production in the Outer Islands. Although theGovernment has identified about 20 sites, their viability has yet to beestablished through the necessary feasibility studies, including cane trialsand hydrological surveys, all of which are urgently needed.
4.10 A continued moderate growth in demand for secondary food crops,however, should not in any way distract from the need for more and betterresearch and other support services to raise productivity and thius, improvefarm incomes. The Government provides services for these crops in the form ofcredit, extension advice and support for input distribution, in particularthrough the BIiAAS, INMAS and the newer INSUS programs. These programs havemet with varying success and are currently the subject of intensive study bythe Government and others. Depending on the results of the studies there maybe opportunities for increased allocations of expenditures for theseprograms. However, the immediate priority should be to maintain a goodenvironment for farmers in terms of availability of inputs, marketing outletsand adequate price incentives.
4.11 The estate crops sector, once one of the most productive in theworld, suffered from relative neglect until the 1970-s; major replanting andrehabilitation has been underway for much of the past decade however. Thesector currently provides almost two-thirds of nonoil and nontimber export
- 37 -
earnings and could again become a major source of export growth in the future.The Government has a ten year program (1979/80-1988/89) for rubber, coconut,oil palm, coffee, cocoa and sugar that aims at rehabilitation, replanting andexpansion which would cover more than five million hectares by the end ofRepelita IV. It would require a capital outlay of about $10 billion (at 1980prices) for field establishment alone./I Because of gestation lags and theyield cycle of tree crops, production benefits from this program would not befully realized until the 1990s. Nonetheless, the Government estimates thatexport earnings would rise from $1.4 billion in 1978 to $3 billion in 1983 and$6.5 billion in 1988, reflecting plantings from the mid-1970's. The newinvestment program would generate employment at a low investment cost per jobfor some 130,000 staff and 2.2 million new smallholders, as well as raiseincomes of the 4 million rural families now in the sector.
4.12 A major program of expansion and rehabilitation of the tree cropsector is justified both from an employment and balance of payments viewpoint. However, the program's targets are substantially above currentimplementation capacity, even if finance is available. The major constraintis the lack of technical and managerial staff and the acute shortage ofextension workers. Investment in training is therefore of criticalimportance. In addition, the organizational structure and the system offinancing this development should be reviewed. Improvement of the supply oflong-term finance through institutional and other means will be of particularbenefit to the sector. Review of international experience suggests that analternative for providing finance for smallholder tree-crop programs which hasworked well in other countries is through taxes levied on production (cessfunds) with funds provided for planting and rehabilitation on a grant basis.It may nonetheless be preferable to concentrate for the time being on tryingto make the existing system which is based on subsidized small holder creditprograms work, before re-introduction of the cess system which in the past hasbeen less successful in Indonesia than in other countries. Furthermore, thefeasibility of establishing vertically-integrated, crop-specific boards withoverall responsibility for policy formulation and program implementationmerits consideration.
4.13 Transmigration. The transmigration program is seen by Government asan important vehicle for easing population pressures in parts of Java, forregional development, for broadening the country's agriculture base and forproviding low income families with greater access to opportunities foreconomic advancement. Following the reorganization of the transmigrationprogram in 1978, the Government's first objective was to resettle largenumbers of farmers to meet the immediate goals of decreasing populationpressure on critical lands and improving food security both for the nation andthose who moved. It was assumed that incomes would be low, but higher thanthat of the target population in the areas of origin. Improved incomes wereto be obtained in a second generation of projects intended both to increase
/1 Assuming average costs of $2,000 per hectare.
- 38 -
production (by opening additional land, adding tree crops or irrigation) andto improve rarketing (by upgrading infrastructure and promoting cooperativedevelopment). Proposed Government expenditures for transmigration in
Repelita III amount to US$2.0 billion or 8.7% of the projected development
budget.
4.14 In the first two years of Repelita III, the Government resettlednearly 90,000 families (400,000 people), of the 125,000 families targeted for
movement through the transmigration program. This was a much improvedperformance and required Government½s strong committment, new organizational
arrangements, and increased availability of funds. For 11 of the 18 provincesreceiving transmigrants, investments in this program constitute the largest
single component in their budgets. In five of the least populated provinces,
transmigration provides from 40% to over 50% of proposed developmentexpenditures, making it potentially the principal vehicle for regionaldevelopment in these areas.
4.15 Although substantial progress has been made in the past two years,the program still suffers from a variety of shortcomings. Manpower shortages,
weak interagency coordination, and shortages of land appropriate for foodproduction continue to hamper progress. The Government is considering a widerange of options to improve settler welfare further, as incomes are still low
while costs to individual settlers are relatively high. Better siteselection, improved reliability of agricultural inputs, cooperativedevelopment and the provision of livestock are intended to improve incomes in
food crop settlements. Another promising avenue has been the development bythe Directorate General of Estates of a settlement program in which migrantsthemselves establish 2 hectares of tree crops after their arrival on site.
This program called Perkebunan Inti Rakyat (PIR) is projected to settle 75,000families in Repelita III.
4.16 Another problem facing the program is the availability of landsuitable for food crop production. It has become apparent that the
traditional receiving areas of Sumatera, Sulawesi and South Kalimantan will
have very little land remaining which is suitable for large-scale food cropdevelopment at the end of Repelita III. Other areas of potential settlement
in Kalimantan and Irian Jaya are not yet well-known and may contain valuable
commercial forests which increase settlement costs and pose conflicts interms of resource management. It is, therefore, likely that Repelita IV
developments will emphasize better infrastructure utilization through
"filling-in operations such as tree crop settlements, small sites,
spontaneous migration and regional development schemes.
4.17 Industry. Under the High case discussed in Chapter 3, thecombination of policy changes and increased investment could result in anindustrial output growth exceeding 11% a year during the 19 8 0 s. As noted in
that chapter the policy measures included reform of the trade regime, and
- 39 -
investment licensing procedures, and measures to improve resource mobilizationand financial intermediation. The object of these reforms would be theestablishment of an industrial structure consistent with the country-scomparative advantage and capable of contributing significantly to employment,balance of payments and equity objectives.
4.18 Indonesia must adopt a two-pronged approach to its industrialstrategy in the 1980-s. One element will be the development of a numberof capital-intensive projects designed to replace imports of intermediategoods or expand exports of raw materials. A subsidiary objective of thispart of the strategy is to deepen the industrial structure. The otherelement of the strategy will be the promotion of production from medium-and smaller-scale industries for both domestic and export markets usingmore labor-intensive technologies. Given the present stage of Indonesia'sindustrial development and its particular resource endowment, such a strategyseems appropriate. However, care will be needed to ensure that the capital-intensive projects are indeed economically justified and, in the case of theimport replacement industries, that they can operate free of subsidies witha cost structure that will permit production of intermediate inputs atinternationally competitive prices. Unless these industries can provideindustrial inputs at competitive prices Indonesia may experience difficultyin developing a suitable scale of manufactured exports that can compete inforeign markets.
4.19 The Government is planning a program of large-scale investments inpetrochemicals, (methanol, olefins, aromatics), fertilizers, cement, pulp andpaper, basic metals (steel and aluminum) and mining (coal, nickel, bauxiteand iron sands). The export-oriented methanol project at Bunyu ($200 million)was delayed by negotiations over joint venture arrangements and will now alsobe implemented in the public sector. The fertilizer and cement industriesare well established. Planned expansions totalling $0.4 billion infertilizer and $0.2 billion in cement to meet the sharply increased domesticdemand are being given high priority. Major projects in the basic metalssector, including the expansion of Krakatau Steel ($0.7 billion) and AsahanAluminum ($0.8 billion) are underway. The Asahan complex will begin exportsin 1982 and reach maximum capacity by 1984. Krakatau Steel½s Phase IIexpansion for hotstrip mills and a slab steel plant has started, but arelated cold rolling mill is being delayed because of the Government-sintention to implement it as a separate project.
4.20 The large and complex olefins project at Arun ($1.6 billion),designed to meet domestic requirements for plastic raw materials and relatedprojects is still being evaluated by the Government and potential foreignpartners. Its economic viability remains to be established and dependsin particular on gas prices that reflect opportunity costs. The aromaticsproject, also at Arun, appears to be less attractive now because of thedepressed state of the world market for synthetic fibers. For pulp and
- 40 -
paper, the main problem is the remote location of most projects (apart fromthe expansion of the Leces plant and a new scheme in Central Java). Thesubstantial infrastructural outlays required are unlikely to be justifiedby the paper projects alone. A second issue is that pulp and paperproduction is relatively energy intensive. In evaluating new projects itwill be important to take account of the heavily subsidized domestic fuelprices. Subsidies on fuel used as an industrial input may lead to amisallocation of resources and it will be difficult to eliminate subsidiesafter these industries get entrenched in the economy. In the mining sector,
the long-delayed Gag Island nickel project ($1.0 billion) is not expected toreach the production stage before 1987/88 because of international marketconstraints. Expansion of bauxite mining capacity is being examined in orderto supply part of the Asahan complex-s alumina requirements, but this mayprove too costly, because of the low grade of the bauxite. Similarly,
studies are underway for the supply of iron ore to Krakatau steel fromcoastal Java iron sands, but the high titanium content may make miningeconomically unattractive.
4.21 Despite the size of the program, the impact of the above mentionedlarge industrial and mining projects on exports and employment will berelatively modest. Of the projects considered firm at this stage,
substantial exports are likely only from methanol ($50 million p.a.), theAsean fertilizer project (about $60 million p.a.), and the Asahan Aluminumoperation ($400 million)./l Of the projects not considered firm at this stageonly the aromatics project could generate a substantial amount of exports.The total direct job creation from all these capital-intensive projects wouldnot exceed 20,000. This implies a direct investment/employment ratio ofapproximately $0.8-1.0 million per job. While indirect employment creationwould be larger, the implication is that most employment creation in industrywill have to come from the private sector and public enterprises which engagein labor intensive activities, in particular from small and medium sizedmanufacturing enterprises.
4.22 Energy Development. Indonesia has unusually large and diverseconventional energy resources, including oil, natural gas, coal, hydropower,geothermal and fuel wood. Fuel wood currently acounts for 50% of totalenergy consumption, with most of the remainder coming from oil products. Asnoted in Chapter 3, domestic consumption of oil products is growing rapidly(about 12.5% a year since the mid-seventies) and supply is limited. Beyondthe mid-1980 s the volume of oil exports is expected to decline even thoughproduction prospects for oil have improved compared to past assessments.Development of alternate sources of energy - especially coal, hydropower andgeothermal, which currently account for less than 10% of total consumption -has, therefore, become a matter of priority for the Government.
/1 All these export figures are in gross terms and at 1980 prices.
- 41 -
4.23 The prospects for the oil and gas sector are examined in somedetail in Chapter 5. It should be noted here however, that because abouta third of the oil consumed domestically is currently being imported (dueto a mismatch between refinery product mix and demand for refined products),increasing domestic refining capacity is an important element of energysector strategy. Towards this end, refining expansions in Balikpapan andCilacap are underway, while the financing delays earlier encountered inimplementing the Dumai hydro-cracker have now been resolved. The Governmenthas decided to finance the project from its own funds. A fourth refineryproject to be located either in the Eastern part of the country or nearJakarta is under consideration. Total Government investments planned in theoil sector (excluding the fourth refinery) amounting to some $2.2 billion,are proceeding.
4.24 Successful development of nonoil energy sources will require arevision of the present pricing policy and as well as increased explorationfor nonoil sources of energy, and as discussed in Chapter 3, the extent ofoil subsidies should gradually be reduced. In the case of kerosene, thisshould be combined with a program to develop alternative sources of energyfor cooking and lighting such as solid fuels, LPG and electricity, to reducethe impact on household incomes. In exploration, there is an urgent need toaccelerate the identification of geothermal and hydropower resources, and tocarry out an integrated study of the coal sector. Development of theseenergy sources is essential to reducing the power sector's current extremelyhigh dependence on oil.
4.25 Power use is now supply-constrained. The National Electric PowerCorporation (PLN) plans to increase its installed generating capacity at anaverage of 16% a year from 2,700 MW at present to 11,700 MW in 1990/91. Theestimated cost of the program is $14 billion in current prices, of whichthe domestic currency component will amount to about $4-5 billion. It isunlikely that a program of this magnitude can be financed without substantiallocal borrowing which underscores the need for the accelerated development ofthe domestic capital market as discussed in the previous chapter. The PLN-sexpansion program as presently conceived will have little impact on thegrowth of oil consumption by the power sector during this decade unlessextra efforts are to be made to accelerate the development of geothermal andcoal resources and to implement hydropower on schedule.
4.26 Rural electrification has greater potential, particularly in Java.However, present programs are fragmented and unless there is propercoordination between the various agencies involved, the Repelita III targetof electrifying 6-7% of the country's villages is unlikely to be achieved.PLN is an effective organization, but to realize a sharply expanded programit will have to be further strengthened. Its professional and managerialmanpower resources are already fully stretched. Combined with efforts toincrease professional and managerial manpower it may be appropriate toconsider establishing a separate department within the PLN with responsi-bility for rural electrification.
- 42 -
4.27 Fuelwood is increasingly in short supply on Java and Bali but isabundant in parts of the Outer Islands. Investment in this sector could hevery significant, but the options are less well defined. The greening andreforestation programs require additional support, and studies are needed todetermine possible uses of residues from commercial logging for woodgasification and charcoal.
4.28 Transport. Under the impetus of high income growth the demand fortransport services is rising rapidly. In the 1970½s the road vehiclepopulation increased by about 15% p.a. for commercial vehicles and 23% p.a.for cars, while domestic marine dry cargo traffic increased by about 15% p.a.Assuming the GDP growth rate is maintained at 7-8% p.a. and regional develop-ment priorities are pursued, transport demand will grow by at least at 14% ayear during the 1980½s. Priorities for public expenditures in the sectorinclude upgrading the existing network primarily in Java and establishing newinfrastructure to support development programs in the Outer Islands.
4.29 A recent transport sector study by the World Bank staff hassuggested a number of priorities for transport sector policy. First, theexisting transport infrastructure facilities cannot be exploited to theirfull potential because they are either in poor condition or they areinadequately managed. Because of inadequate maintenance, a substantialproportion of the national highway system can be utilized only to a limitedextent; stevedoring and customs practices cause considerable delays in cargoprocessing thus raising costs in the ports. Although technical capacities inthe main ports are adequate at present, a number of improvements in secondaryports will be required. Second, the regulatory framework has had detrimentaleffects on the supply and use of existing facilities. Rigid licensingpractices and across-the-board subsidies in inter-island shipping havehampered efficient route allocations and also resulted in substantialoperating losses. Finally, existing practices for transport planning andregulation could be improved to ensure cost effective solutions to meetingspecific demands.
4.30 Priorities for transport sector policy formulation include:(a) larger budgetary allocations and improved organization of responsibilityfor road and bridge maintenance, (b) rationalizing the existing regulatoryframework with a view to minimizing transport costs especially in inter-islandtransport, (c) targeting of subsidies to specific routes such as the pioneerservices while reducing general transport subsidies, and (d) continuingemphasis on expanding infrastructure to support development projects andprograms in the Outer Islands, including secondary port expansion and(e) improving coordination of investment planning among the different modes.
4.31 Social Sectors. Although much progress has been made in theprovision of education, health, nutrition, and other basic services duringthe last decade, key social indicators for Indonesia suggest a relatively
- 43 -
modest level of services available in comparison with many other countries.Increased emphasis on human resource development is thus a major challenge forthe 1980's. As the productivity of human capital strongly depenids on healthland education, a clear link exists between the level of economic progress anddevelopment of thie social sectors./l The 1980 population census measured alarger than previously projected population which probably implies that acorrespondingly larger expansion of services is needed. The Government has,in fact, reiterated its commitment to improving social services to meetequity objectives. The current resource surpluses provide an opportunity toaccelerate progress in these sectors.
4.32 During the 1970's Indonesia made very impress;, progress t'n
expanding primary education. Participation rates were raised from about 70%in the early 1970's to well above 90% by 1980. However, progress at thesecondary and tertiary level was much slower. As Table 4.1 indicates,participation rates at these levels were lower than the averages for all lowincome countries, and substantially below those for middle income countries.Table 4.2 provides a further illustration of the relatively low level ofspending on education in Indonesia in comparison with the middle incomecountries of East Asia.
/1 World Development Report: World Bank, August 1980.
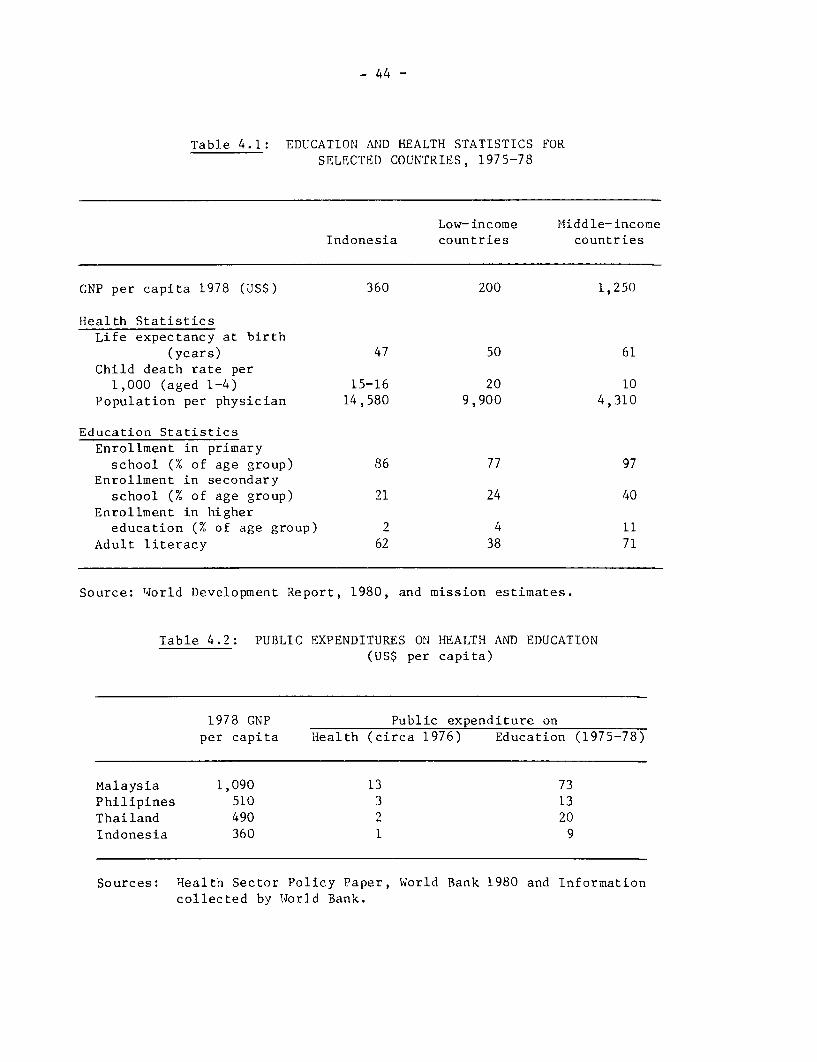
- 44 -
Table 4.1: EDUCATION AND HEALTH STATISTICS FORSELECTED COUNTRIES, 1975-78
Low-income Middle-incomeIndonesia countries countries
GNP per capita 1978 (US$) 360 200 1,250
HIealth StatisticsLife expectancy at birth
(years) 47 50 61Child death rate per
1,000 (aged 1-4) 15-16 20 10Population per physician 14,580 9,900 4,310
Education StatisticsEnrollment in primary
school (% of age group) 86 77 97Enrollment in secondary
school (% of age group) 21 24 40Enrollment in higher
education (% of age group) 2 4 11Adult literacy 62 38 71
Source: World Development Report, 1980, and mission estimates.
Table 4.2: PUBLIC EXPENDITURES ON HEALTH AND EDUCATION(US$ per capita)
1978 GNP Public expenditure onper capita 'Health (circa 1976) Education (1975-78)
Malaysia 1,090 13 73Philipines 510 3 13Thailand 490 2 20Indonesia 360 1 9
Sources: 'Iealth Sector Policy Paper, World Bank 1980 and Informationcollected by World Bank.
- 45 -
4.33 The shortage of trained manpower will be a major constraint to
development in the 1980's and both formal and nonformal education must be
expanded to alleviate this constraint. Large gaps between supply and demand
for technical and professional manpower are likely to justify further
educational investment. However, the planning of secondary education
expansion requires care, in view of the high level of unemployment among
qc--ndary school leavers. In the short-term, there will be a need for special
training schemes while general education investment catches up. In addition,
there is evidence that the quality of education has suffered during the past
decade of rapid expansion, and that inequalities in educational opportunity
between urban and rural areas, public and private institutions, and between
Java and the other islands are substantial. Regional differences in academic
achievements are striking. For example in a recent national achievement test,
children in Jakarta obtained scores in the grade nine examinations that were
78% higher than those of the Eastern Islands and Sulawesi. To tackle these
problems, the Government is now taking measures to revise curricula, upgrade
teachers, publish and distribute more textbooks and experiment with
alternative means of providing education through the "small school" and "open
secondary school" programs. Investment in teacher training is of particular
importance.
4.34 In the long run, an expansion of the educational system is critical.
Table 4.3 reveals the magnitude of the likely gaps between demand for and
supply of selected skills. Clearly, an uncritical focus on quantities is
inappropriate, especially in the light of the existing levels of unemployment
among the educated. Although the Government has prepared a comprehensive plan
to address current deficiencies in secondary and in higher and technical
education, and although the proportion of development expenditures allocated
to education increased from 5.3% in 1974/75 to 11.4% in 1980/81, all available
evidence suggest that the social return to investment in education probably
exceeds that of most other investments. The Government has increased
allocations to the education sector in the 1981!82 budget by 37% in nominal
terms. Further such increases will probably be needed in subsequent years.
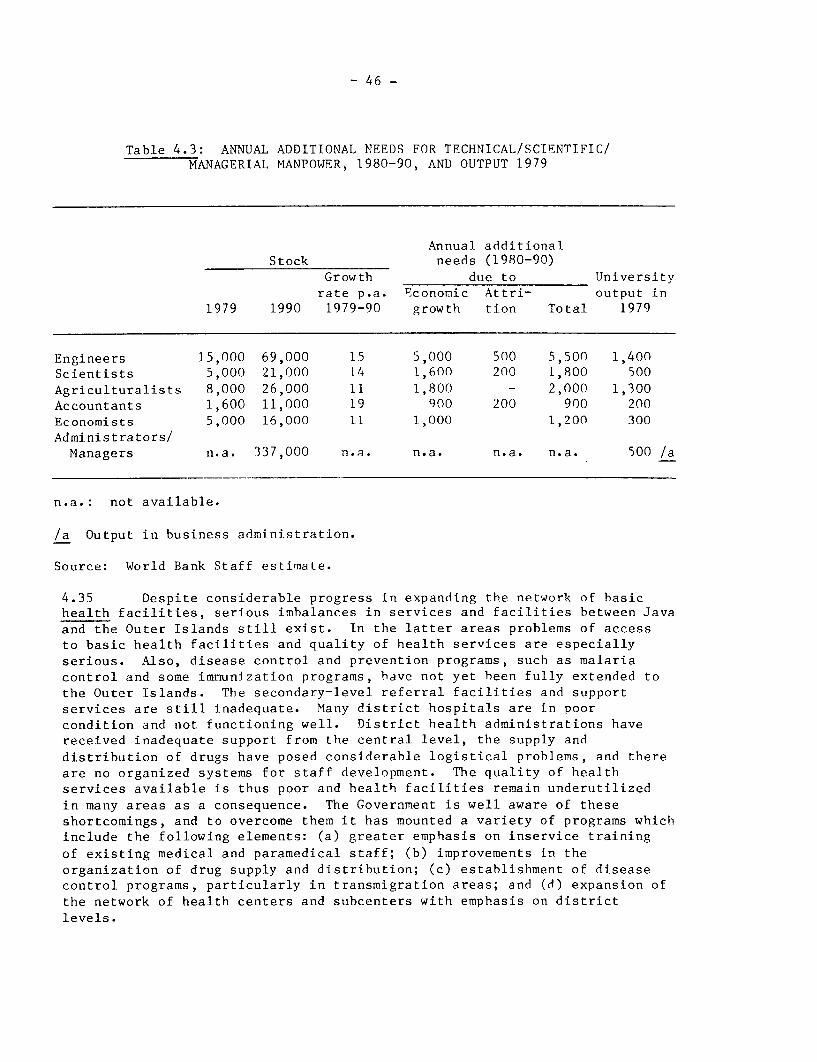
- 46 -
Table 4.3: ANNUAL ADDITIONAL NEEDS FOR TECHNICAL/SCIENTIFIC/MANAGERIAL MANPOWER, 1980-90, AND OUTPUT 1979
Annual additionalStock needs (1980-90)
Growth due to Universityrate p.a. Economic Attri- output in
1979 1990 1979-90 growth tion Total 1979
Engineers 15,000 69,000 15 5,000 500 5,500 1,400Scientists 5,000 21,000 14 1,600 200 1,800 500Agriculturalists 8,000 26,000 11 1,800 - 2,000 1,300Accountants 1,600 11,000 19 900 200 900 200Economists 5,000 16,000 11 1,000 1,200 300Administrators/Managers n.a. 337,000 n.a. n.a. n.a. n.a. 500 /a
n.a.: not available.
/a Output in business administration.
Source: World Bank Staff estimate.
4.35 Despite considerable progress in expanding the network of basichealth facilities, serious imbalances in services and facilities between Javaand the Outer Islands still exist. In the latter areas problems of accessto basic health facilities and quality of health services are especiallyserious. Also, disease control and prevention programs, such as malariacontrol and some immunization programs, have not yet heen fully extended tothe Outer Islands. The secondary-level referral facilities and supportservices are still inadequate. Many district hospitals are in poorcondition and not functioning well. District health administrations havereceived inadequate support from the central level, the supply and
distribution of drugs have posed considerable logistical problems, and thereare no organized systems for staff development. The quality of healthservices available is thus poor and health facilities remain underutilizedin many areas as a consequence. The Government is well aware of theseshortcomings, and to overcome them it has mounted a variety of programs whichinclude the following elements: (a) greater emphasis on inservice trainingof existing medical and paramedical staff; (b) improvements in theorganization of drug supply and distribution; (c) establishment of diseasecontrol programs, particularly in transmigration areas; and (d) expansion ofthe network of health centers and subcenters with emphasis on districtlevels.
- 47 -
Constraints to Implementation of Development Programs
4.36 In its efforts to carry out a larger development program theGovernment is faced with a number of constraints which tend to slow imple-mentation or raise the cost of these programs. Perhaps the most serious isthe pervasive shortage of skilled manpower. Other constraints include avariety of administrative procedures, and the capacity of the constructionindustry to implement a larger program of public works. Progress in resolvingthese bottlenecks will have a significant bearing on the Government's successin carrying out its programs.
4.37 Manpower. The acute shortage of skilled manpower is the singlemost important constraint to the effective utilization of the large andsudden increase in foreign exchange revenues. The magnitude of this manpowerproblem is illustrated by the fact that in 1976, 0.7 percent and 9.3 percentof the Indonesian labor force had received higher education and secondaryeducation respectively, whereas the corresponding figures for Malaysia in1974 were 1.8 percent and 25.8 percent and for Korea 10.4 percent and 60.6percent. Expenditure programs in agriculture, for example, will almostcertainly be constrained by the availability of technical manpower duringthe next few years. Historical evidence reveals that the level of SIAPs(unexpended budgetary balances available for expenditures in subsequent years)rose from 18% of potential domestic development expenditure in agriculture andirrigation in 1977/78 to 32% in 1979/80. It appears that the availability oftechnical and managerial manpower, which grew at a slower pace than budgetaryresources, had already become the major determinant of the rate at which fundscould effectively be channeled into agriculture. A draft World Bank report onmanpower training requirements for the agricultural sector suggests that forthe period 1980-84, the supply of personnel available for food and tree cropdevelopment will increase at a rate of 11% a year. However, to satisfy themanpower needs of the Ministry of Agriculture for projects planned forRepelita III, a manpower supply growth rate of about 25% p.a. would berequired. If many areas food crops and estate crops use the same type ofpersonnel and there will be a trade-off between expansion of the twosubsectors. Similar trade-offs will have to be faced in other sectors.
4.38 Whilst the overall shortage of trained and experienced manpower is anational problem, this should not distract from the fact that there isconsiderable unemployment of young educated people, particularly in urbanareas. For example, the overall unemployment rate in Indonesia is estimatedat less than 3 percent and yet approximately 30 percent of urban males aged 20to 24 who have completed senior high school were unemployed in 1979. This mayindicate that the skills imparted through the school system do not match therequirements of urban employers or that school leavers choose to remainunemployed in the hope of securing a preferred position. Either way, theevidence suggests that urban labor markets contain a reserve of unemployed,educated resources that could be mobilized for development. In the short-termspecial training measures could be adopted, including incentives for privatefirms to train workers, lowering of certification requirements for specificjobs, and short courses for para-professional health and agricultural fieldworkers.
- 48 -
Similarly, at the other end of the age distribution, labor force participationof males over 50 is considerably lower in urban than in rural areas. In thepublic sector there may be a case for relaxing retirement rules, and allowingolder managers and technicians to continue to work if they wish./l Elimina-tion of unemployment among the educated young and encouraging older,experienced workers to remain in the labor force would ensure a more effectiveuse of the existing stock of trained manpower.
4.39 In a situation where foreign exchange is not a binding constraintbut where skilled human resources are extremely scarce, one solution is thepurchase of additional skills from abroad. Indonesia could also takeadvantage of opportunities to send more students abroad for further educationand training in as wide a range of skills and subjects as possible. This isan area where members of the IGGI could take the lead in establishing a vastlyexpanded fellowship program and assisting with the placement of Indonesianstudents. At the same time, Indonesia is now in a position to buy substantialquantities of technical assistance in the international market. It shouldtake advantage of foreign loans or equity participation whenever these involveinflows of technical assistance and policy advice that is not otherwiseavailable. Use of foreign trainers could be particularly beneficial. Membersof the IGGI may be able to assist Indonesia both in the direct provision oftechnical expertise and policy advice embodied in its loans and in therecruitment, selection and supervision of international consultants.Provision of assistance in the social sectors will be of special value, sincethe private market for technical assistance in these areas is very limited.In the private sector, greater flexibility in the granting of work permits forspecialized foreign personnel could help to exploit more effectively theexpanded potential for private domestic investment that has been created bythe country s favorable resource position.
4.40 Administrative Procedures. Successful implementation of an expandedpublic expenditure program will, in part, be determined by budgetaryprocedures and other aspects of the administrative framework. Improvements inthese areas are needed to complement efforts to expand the supply of trainedmanpower. Some of the measures - the simplification of the DIP system and theadoption of post-auditing of development expenditures - introduced in the1980/81 budget have served this objective especially well. Although it is tooearly to judge the full impact of these changes, it is noteworthy that morethan 50% of an enlarged budget was disbursed to the executing agencies duringthe first six months of this fiscal year (1980/81) compared with less than 35%in the corresponding period of 1979/80. It does not automatically follow thatthe rate of physical implementation has correspondingly increased, but this isan encouraging sign.
/1 This would be a major help for example to the public sector estates wheremore than two-thirds of senior management are due to retire duringRepelita III.
- 49 -
4.41 Other changes associated with Keppres 14A and Keppres 10, however,may influence the implementation of public investments. For example, Govern-ment contracts below $32,000 are now reserved for small contractors, biddingis to be restricted to firms located in the area in which the work is to bedone which may cause initial delays. These requirements imply trade-offsbetween efficiency and equity which must inevitably occur whenever more thanone objective is pursued. To ensure a rapid dispersion of the oil windfallto as large a population as possible, as intended, further procedural improve-ments are needed. Such reforms include the recent efforts to reduce delaysin the despatch of operational instructions by some departments, thedevelopment of standard contract documents and more liberal approval ofmultiyear contracts by the Ministry of Finance. Additional efforts to buildup project preparation capacities within public departments, agencies andenterprises and monitoring systems, have now became crucial. Other effortsto improve budgetary systems as well as policies to ease land purchases forpublic projects deserve continued close attention.
4.42 Construction Capacity. A rapid expansion in public developmentexpenditures will strain the capacity of the construction sector. Duringthe period 1975-79, the national accounts reveal that construction'scontribution to GDP increased at a real rate of 12.5% a year. Sinceconstruction accounts for about 55% of public development expenditures(including project aid), increased expenditures on irrigation, housing, roadsland settlement and maintenance can be expected to result in unprecedentedincreases in the demand for construction services. Demand pressure hasalready been revealed in price increases; in 1979 the increase in the pricedeflator for construction was 40%, compared with only 33% for the GDP pricedeflator. Similar problems have surfaced in other oil-exporting countriesand they underscore the importance of promoting an efficient and responsiveconstruction industry in Indonesia.
4.43 In such buoyant circumstances, it is unlikely that qualifiedcontractors among the weaker economic groups will encounter serious diffi-culties in securing adequate work loads. Efforts to increase their capacityto meet expected future demands, however, remain critical. For example,small contractors could be encouraged to pool resources - financial,personnel and equipment - in order to undertake larger and more complexprojects. Additional financing could be provided either through the bankingsystem for smaller contractors or through equity participation in the caseof the large public and private eompanies. Increased funds for prefinancingloans are especially important as a means of minimizing start-up delays. Thecurrent policy of indirectly subsidizing the movement of Indonesian construc-tion workers to the Middle East also merits reconsideration in presentcircumstances. Relaxation of restrictions on the use of foreign technical andmanagerial specialists, and the promotion of equipment-leasing companies areother measures that would improve supply response in the construction sector.
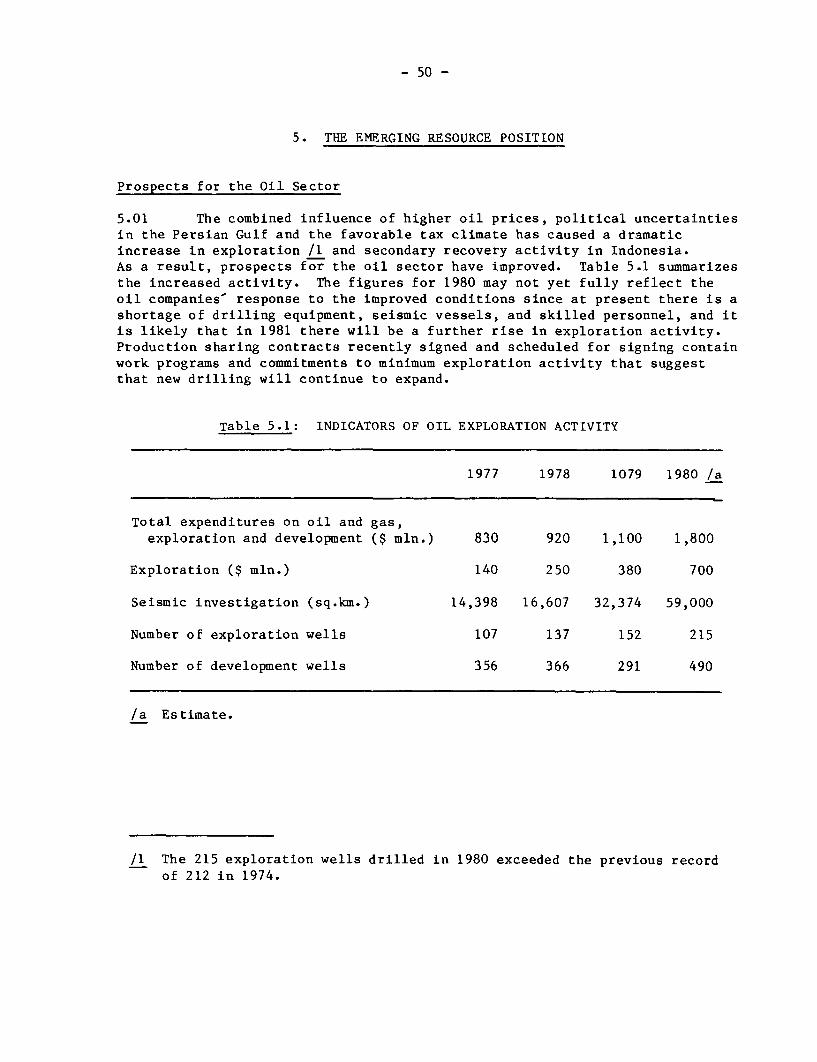
- 50 -
5. THE EMERGING RESOURCE POSITION
Prospects for the Oil Sector
5.01 The combined influence of higher oil prices, political uncertaintiesin the Persian Gulf and the favorable tax climate has caused a dramaticincrease in exploration /1 and secondary recovery activity in Indonesia.As a result, prospects for the oil sector have improved. Table 5.1 summarizesthe increased activity. The figures for 1980 may not yet fully reflect theoil companies response to the improved conditions since at present there is ashortage of drilling equipment, seismic vessels, and skilled personnel, and itis likely that in 1981 there will be a further rise in exploration activity.Production sharing contracts recently signed and scheduled for signing containwork programs and commitments to minimum exploration activity that suggestthat new drilling will continue to expand.
Table 5.1: INDICATORS OF OIL EXPLORATION ACTIVITY
1977 1978 1079 1980 /a
Total expenditures on oil and gas,exploration and development ($ mln.) 830 920 1,100 1,800
Exploration ($ mln.) 140 250 380 700
Seismic investigation (sq.km.) 14,398 16,607 32,374 59,000
Number of exploration wells 107 137 152 215
Number of development wells 356 366 291 490
/a Estimate.
/1 The 215 exploration wells drilled in 1980 exceeded the previous recordof 212 in 1974.
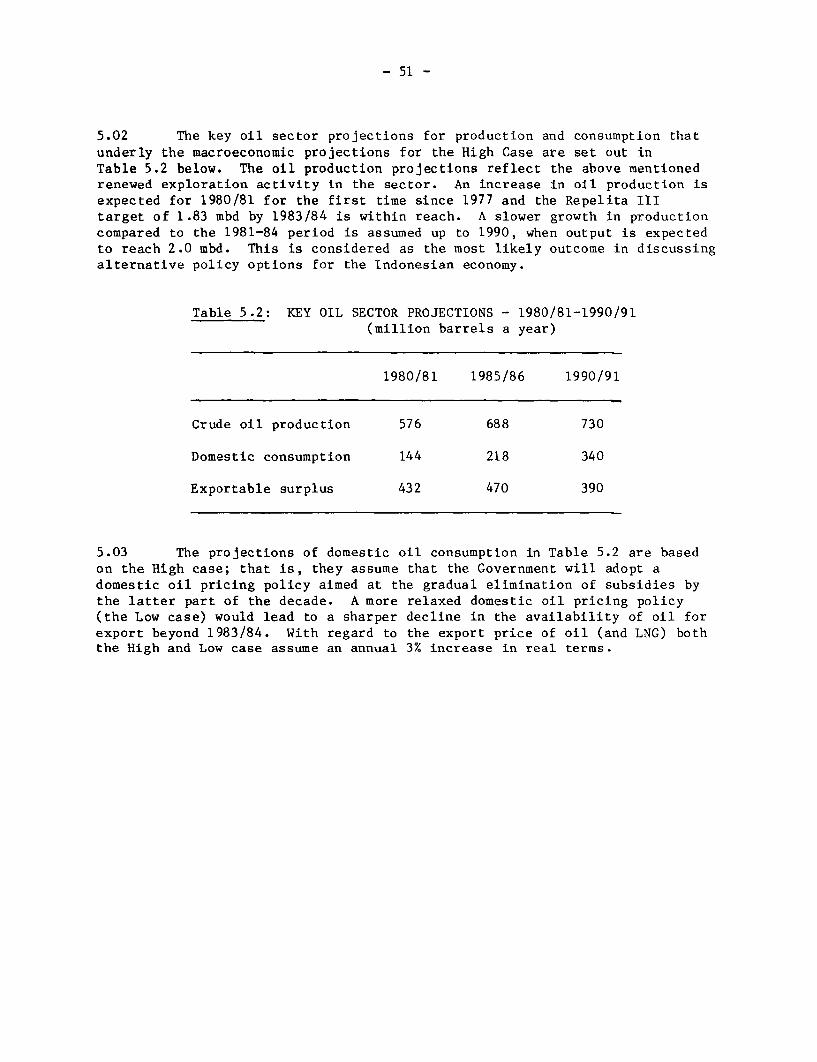
- 51 -
5.02 The key oil sector projections for production and consumption thatunderly the macroeconomic projections for the High Case are set out inTable 5.2 below. The oil production projections reflect the above mentionedrenewed exploration activity in the sector. An increase in oil production isexpected for 1980/81 for the first time since 1977 and the Repelita IIItarget of 1.83 mbd by 1983/84 is within reach. A slower growth in productioncompared to the 1981-84 period is assumed up to 1990, when output is expectedto reach 2.0 mbd. This is considered as the most likely outcome in discussingalternative policy options for the Indonesian economy.
Table 5.2: KEY OIL SECTOR PROJECTIONS - 1980/81-1990/91(million barrels a year)
1980/81 1985/86 1990/91
Crude oil production 576 688 730
Domestic consumption 144 218 340
Exportable surplus 432 470 390
5.03 The projections of domestic oil consumption in Table 5.2 are basedon the High case; that is, they assume that the Government will adopt adomestic oil pricing policy aimed at the gradual elimination of subsidies bythe latter part of the decade. A more relaxed domestic oil pricing policy(the Low case) would lead to a sharper decline in the availability of oil forexport beyond 1983/84. With regard to the export price of oil (and LNG) boththe High and Low case assume an annual 3% increase in real terms.
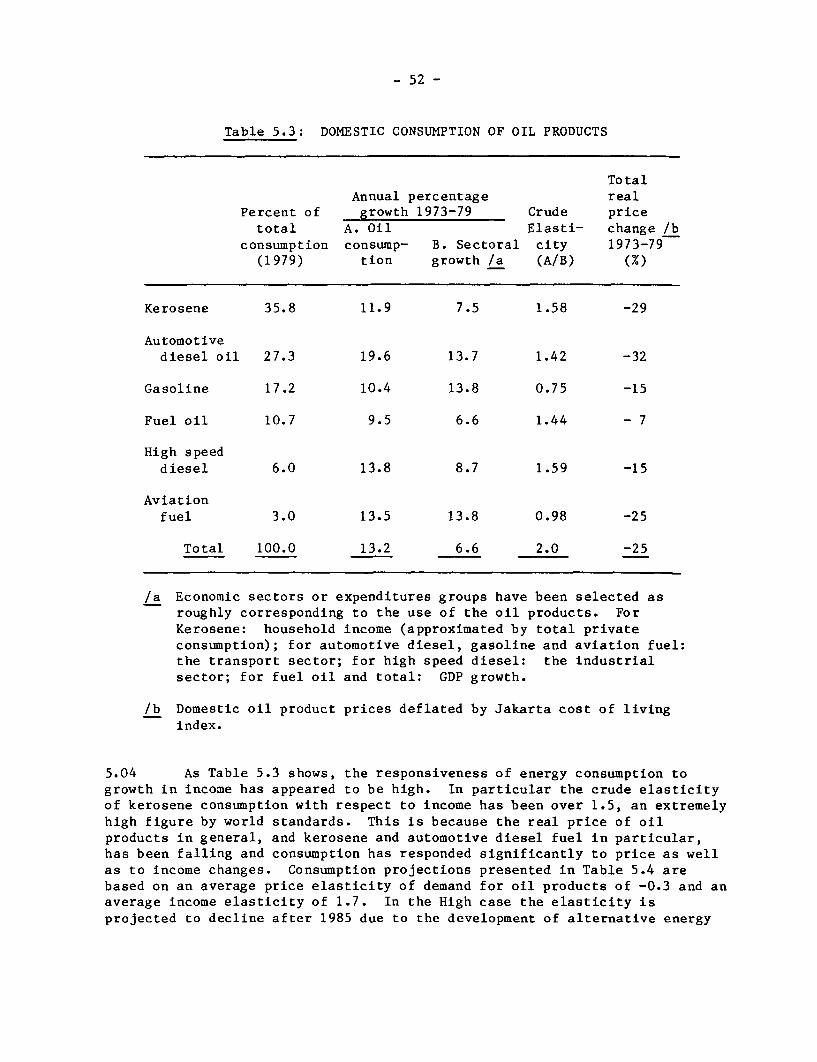
- 52 -
Table 5.3: DOMESTIC CONSUMPTION OF OIL PRODUCTS
TotalAnnual percentage real
Percent of growth 1973-79 Crude pricetotal A. Oil Elasti- change /b
consumption consump- B. Sectoral city 1973-79(1979) tion growth /a (A/B) (%)
Kerosene 35.8 11.9 7.5 1.58 -29
Automotivediesel oil 27.3 19.6 13.7 1.42 -32
Gasoline 17.2 10.4 13.8 0.75 -15
Fuel oil 10.7 9.5 6.6 1.44 - 7
High speeddiesel 6.0 13.8 8.7 1.59 -15
Aviationfuel 3.0 13.5 13.8 0.98 -25
Total 100.0 13.2 6.6 2.0 -25
/a Economic sectors or expenditures groups have been selected asroughly corresponding to the use of the oil products. ForKerosene: household income (approximated by total privateconsumption); for automotive diesel, gasoline and aviation fuel:the transport sector; for high speed diesel: the industrialsector; for fuel oil and total: GDP growth.
/b Domestic oil product prices deflated by Jakarta cost of livingindex.
5.04 As Table 5.3 shows, the responsiveness of energy consumption togrowth in income has appeared to be high. In particular the crude elasticityof kerosene consumption with respect to income has been over 1.5, an extremelyhigh figure by world standards. This is because the real price of oilproducts in general, and kerosene and automotive diesel fuel in particular,has been falling and consumption has responded significantly to price as wellas to income changes. Consumption projections presented in Table 5.4 arebased on an average price elasticity of demand for oil products of -0.3 and anaverage income elasticity of 1.7. In the High case the elasticity isprojected to decline after 1985 due to the development of alternative energy
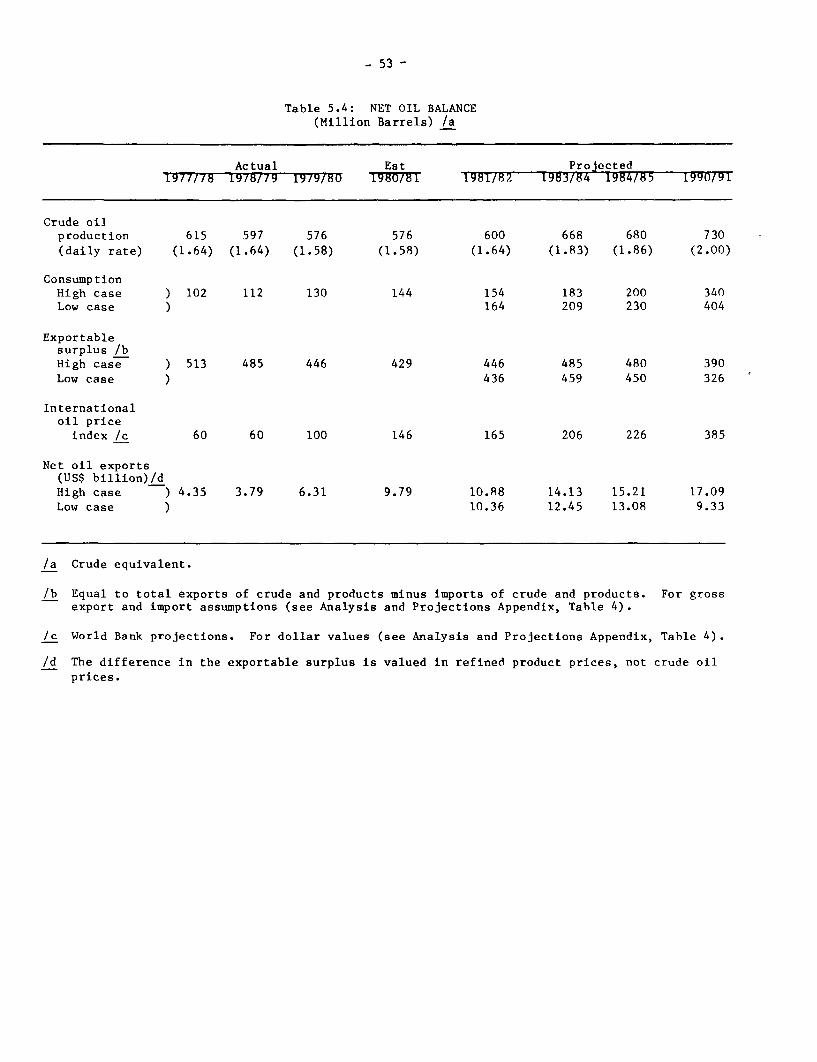
- 53 -
Table 5.4: NET OIL BALANCE(Million Barrels) /a
Actual Eat Projected1977/78 1978/79 1979/80 TlTg/hT 1981/82 1983/84 1984/85 1990/91
Crude oilproduction 615 597 576 576 600 668 680 730(daily rate) (1.64) (1.64) (1.58) (1.58) (1.64) (1.83) (1.86) (2.00)
ConsumptionHigh case ) 102 112 130 144 154 183 200 340Low case ) 164 209 230 404
Exportablesurplus /bHigh case ) 513 485 446 429 446 485 480 390Low case ) 436 459 450 326
Internationaloil priceindex /c 60 60 100 146 165 206 226 385
Net oil exports(US$ billion)/dHigh case ) 4.35 3.79 6.31 9.79 10.88 14.13 15.21 17.09Low case ) 10.36 12.45 13.08 9.33
/a Crude equivalent.
/b Equal to total exports of crude and products minus imports of crude and products. For grossexport and import assumptions (see Analysis and Projections Appendix, Table 4).
/c World Bank projections. For dollar values (see Analysis and Projections Appendix, Table 4).
/d The difference in the exportable surplus is valued in refined product prices, not crude oilprices.
- 54 -
sources and a reduced labor intensity of production). Net oil exports in1990 are shown to be almost twice as high under the High Case as under theLow Case. The need for investment in new refineries for the domestic marketwill also be influenced by the subsidy policy. Table 5 of the Analysis andProjections Appendix shows new refinery requirements under each scenario.
5.05 The prospects for Indonesia's LNG industry are bright, with thepossibility of LNG export earnings becoming equal to net oil export earningsby the end of this decade. Currently, there are five LNG trains inoperation. The Government plans to increase capacity to eleven trains by1984/85, with possibly as many as 18 by 1990/91. Although the supply of gasremains plentiful, difficulties in marketing may delay implementation of theprogram. It now appears that the U.S. West Coast market will remain closedto LNG imports for environmental reasons, leaving Japan as the only marketfor some years to come. Table 6 of the Analysis and Projections Appendixsummarizes the probable growth in LNG exports under the assumption thatthirteen trains will be operational by the end of the decade. Even underthese conservative assumptions, however, net earnings can be expected torise to $10 billion in current prices ($4.5 billion when deflated by aninternational inflation index to 1979 prices).
Nonoil Exports
5.06 Table 5.5 summarizes the projections of export earnings throughoutthe 1980s under the High and Low cases. More detailed projections for theHigh Case are given in Table 1 of the Analysis and Projections Appendix.
5.07 Timber, which accounted for 32% of total nonoil exports last yearis expected to fall in volume by about 30% in 1980/81, and to remain at thatlevel for the next two years. The decline stems from the introduction ofthe "Three Ministers" Decree in May 1980 which requires that a certainproportion (currently 66%) of domestic logs be processed within Indonesia.!lExports of sawnwood and plywoods/veneers, on the other hand are expected togrow throughout the 1980s at an annual rate of about 6% and 15% respectivelydue to increased investments in sawmill and plywood factories./2 As aresult, the proportion of total wood exports accounted for by logs willdecline from 83% in 1979/80 to about 75% in 1983/84 and to about 60% in 1990.
/1 This decree is difficult to implement and it is possible that the recordeddecline in volume exaggerates its effectiveness, as more logs may beexported unofficially.
/2 Between January and September 1980 the Investment Coordinating Board(BKPM) granted 41 licenses for this purpose, although the number ofapplications was more than double that. BKPM was hesitant to issuefurther licences on the grounds that additional investment would makesome small existing sawmills processing plants unprofitable. Clearlysome conflict of objectives is involved here since the principal purposeof the export quotas is to encourage domestic processing (as was thecase with rattan and untreated leather in 1979).
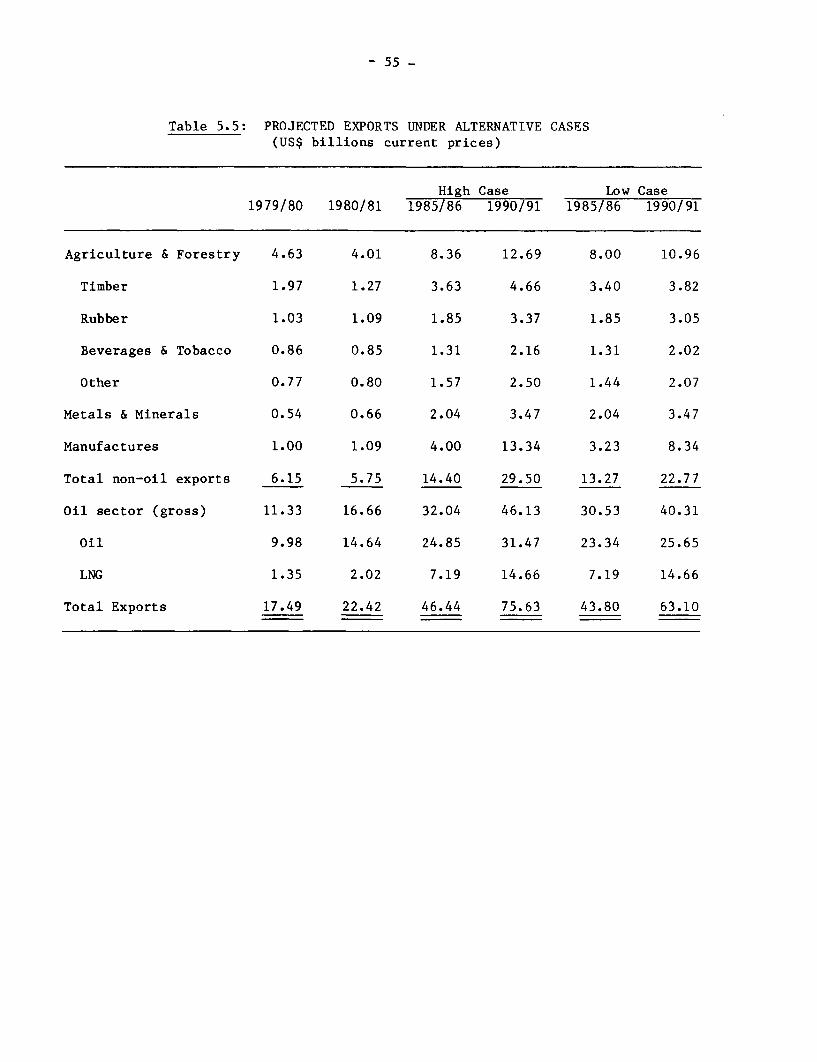
- 55 -
Table 5.5: PROJECTED EXPORTS UNDER ALTERNATIVE CASES(US$ billions current prices)
High Case Low Case1979/80 1980/81 1985/86 1990/91 1985/86 1990/91
Agriculture & Forestry 4.63 4.01 8.36 12.69 8.00 10.96
Timber 1.97 1.27 3.63 4.66 3.40 3.82
Rubber 1.03 1.09 1.85 3.37 1.85 3.05
Beverages & Tobacco 0.86 0.85 1.31 2.16 1.31 2.02
Other 0.77 0.80 1.57 2.50 1.44 2.07
Metals & Minerals 0.54 0.66 2.04 3.47 2.04 3.47
Manufactures 1.00 1.09 4.00 13.34 3.23 8.34
Total non-oil exports 6.15 5.75 14.40 29.50 13.27 22.77
Oil sector (gross) 11.33 16.66 32.04 46.13 30.53 40.31
Oil 9.98 14.64 24.85 31.47 23.34 25.65
LNG 1.35 2.02 7.19 14.66 7.19 14.66
Total Exports 17.49 22.42 46.44 75.63 43.80 63.10
- 56 -
5.08 Exports of perennial crops are expected to increase substantiallyin the medium term due principally to ambitious government rehabilitation andplanting programs. The annual increase in rubber production and exports,which is currently 1.5% for smallholders and 3% for estates, will rise inRepelita IV as new planting and rehabilitation undertaken in Repelita IIIbecomes productive. Under the High case, it is projected to grow at about3%-3.5% for smallholders and 8%-9% for estates. Palm oil production isalready growing rapidly (8% p.a.) and is expected to continue at about thesame pace. Palm oil exports in the next three years, however, will not growas rapidly due to the government's policy of substituting palm oil forcoconut oil in domestic consumption. Exports of coffee and tea areprojected to grow at rates considerably lower than new Government targets;programs and institutional support for coffee and tea smallholders remaininadequate, and production from private domestic tea estates has stagnated.
5.09 The outlook for exports of metals in the 1980s is good. Nickel andaluminum could show impressive growth. Over 28,000 tons of tin are nowexported annually, making Indonesia the world½s fourth largest producer.There is considerable scope for further expansion, with large sites withgood potential in offshore Sumatera, which are beginning to be explored andexploited.
5 10 The international environment for manufactured exports from develop-ing countries is likely to be less favorable than in the 19 70s due to slowerincome growth and increased protectionism in industrialized countries, hutis still unlikely to be a serious constraint on the rapid expansion of manu-factured exports from countries, such as Indonesia, beginning from a rela-tively low base ($1.0 billion in 1980/81). World trade in manufactures willgrow at about 8-9% a year, with manufactures from low income countriesgrowing at perhaps 10% a year despite the less than favorable export climatein the 1980s than in the 19 7 0s. Indonesia must act to benefit from thegrowth in manufactures. There will be scope for replacing exports of otherEast Asian countries that are graduating into more sophisticated types ofmanufactured exports. Some products have attracted protectionist attentionfrom OECD countries and Indonesia now faces textile import quotas from anumber of countries, notably from members of the EEC./1 At this time ofrelative foreign exchange abundance in Indonesia, when concessional financialtransfers are less crucial to Indonesia's development, continued access tothe markets of industrialized countries is one of the most important meanswhereby they can contribute to the raising of real income levels among the
/1 The Government has recently negotiated some increase in the UK quotabut quotas for garments in EEC countries generally remain well belowactual levels of imports from Indonesia in 1979.
- 57 -
poor in Indonesia. If appropriate policies with regard to investment,export promotion and the incentive framework are undertaken, Indonesia'smanufactured exports can continue to grow in real terms at an annual rate ofabout 20%. This is lower than the 36% compound annual growth achievedbetween 1973/74 and 1979/80, but is high by world standards, although by nomeans unprecedented. The growth in utanufactured exports from Indonesia willcome from continued high growth of small and medium private companies andfrom large-scale public and joint-venture enterprises in such sectors asfertilizers, petrochemicals and electronics./1 However, continued fastgrowth of manufactures is by no means assured at this stage. It willrequire vigorous action by the Government to improve the trade policyenvironment along the lines discussed earlier, and especially to improve theprofitability of investment in export production relative to importsubstitution.
Import Polices and Projections
5.11 Import growth will be particularly sensitive to investment andincome growth and to changes in the structure of production withinIndonesia. Table 5.6 summarizes projections for capital, intermediateand consumer goods imports under the alternative cases.
5.12 During the 1970s, capital goods imports grew at a rate about 1.3times as fast as the rate of growth of investment, implying an increasingimport-intensity of investment./2 This trend is expected to continue forthe remainder of Repelita III, with capital imports growing in real termsbetween 15% (Low case) and 18% (High case). Thereafter the elasticity ofcapital imports to investment is expected to fall as foreign exchangeavailability once again becomes a constraint, and as the capacity ofIndonesia's domestic capital goods industry increases. In the second halfof the decade therefore, imports of capital goods are projected to growbetween 9% (Low case) and 12% (High case).
5.13 Imports of intermediate goods (accounting for 28% of nonoilimports), which have declined slightly in real terms since the mid-1970s dueto past investments in input-producing industries (notably fertilizer andcement), are expected to rise by between 6% (Low case) and 10% (High case)annually up to 1985/86 due to increased industrial activity. A number ofmajor investments expected to begin production from 1983 will substitute for
/1 Two of the large public sector projects, currently being planned willbegin producing for the export market in 1984/85. The Bunyu Methanoland the Asean Fertilizer plants will earn about $75 million and $126million (current prices) respectively from exports in that year.
/2 The ratio of capital goods imports to GDI rose from 27% in 1973 to 37%in 1979.
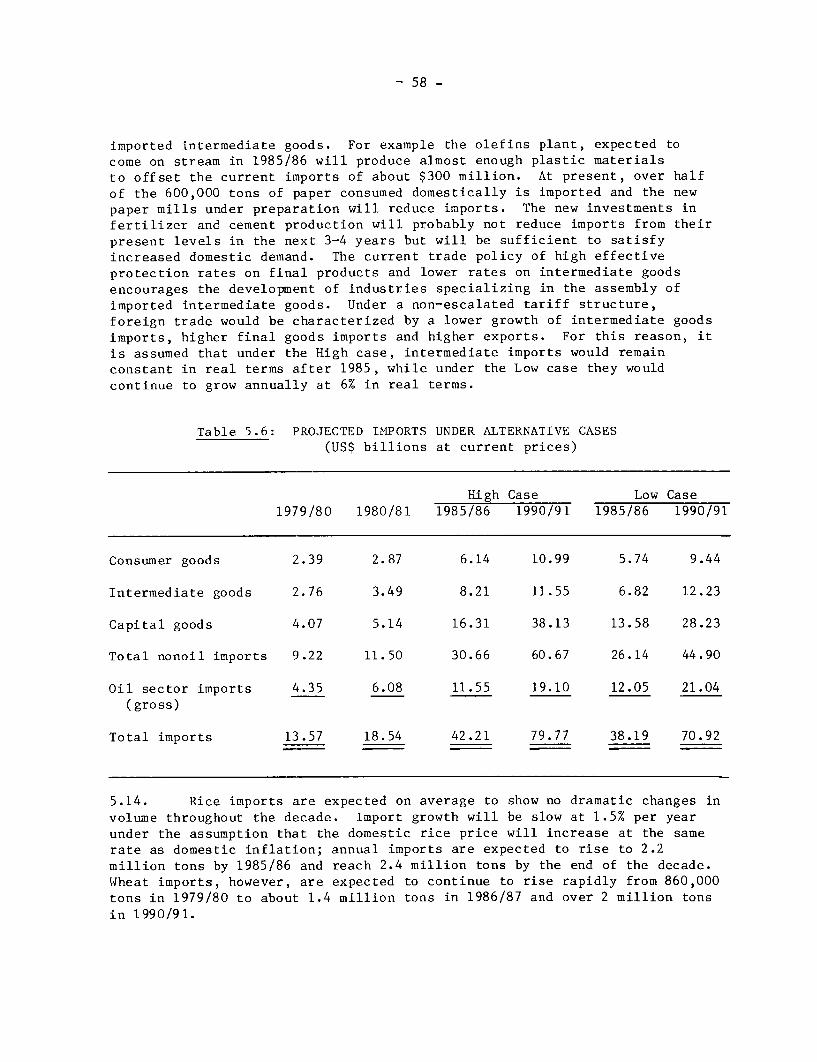
- 58 -
imported intermediate goods. For example the olefins plant, expected tocome on stream in 1985/86 will produce almost enough plastic materialsto offset the current imports of about $300 million. At present, over half
of the 600,000 tons of paper consumed domestically is imported and the newpaper mills under preparation will reduce imports. The new investments infertilizer and cement production will probably not reduce imports from theirpresent levels in the next 3-4 years but will be sufficient to satisfyincreased domestic demand. The current trade policy of high effectiveprotection rates on final products and lower rates on intermediate goodsencourages the development of industries specializing in the assembly ofimported intermediate goods. Under a non-escalated tariff structure,foreign trade would be characterized by a lower growth of intermediate goodsimports, higher final goods imports and higher exports. For this reason, itis assumed that under the High case, intermediate imports would remainconstant in real terms after 1985, while under the Low case they wouldcontinue to grow annually at 6% in real terms.
Table 5.6: PROJECTED IMPORTS UNDER ALTERNATIVE CASES(US$ billions at current prices)
High Case Low Case1979/80 1980/81 1985/86 1990/91 1985/86 1990/91
Consumer goods 2.39 2.87 6.14 10.99 5.74 9.44
Intermediate goods 2.76 3.49 8.21 11.55 6.82 12.23
Capital goods 4.07 5.14 16.31 38.13 13.58 28.23
Total nonoil imports 9.22 11.50 30.66 60.67 26.14 44.90
Oil sector imports 4.35 6.08 11.55 19.10 12.05 21.04(gross)
Total imports 13.57 18.54 42.21 79.77 38.19 70.92
5.14. Rice imports are expected on average to show no dramatic changes involume throughout the decade. Import growth will be slow at 1.5% per yearunder the assumption that the domestic rice price will increase at the samerate as domestic inflation; annual imports are expected to rise to 2.2million tons by 1985/86 and reach 2.4 million tons by the end of the decade.Wheat imports, however, are expected to continue to rise rapidly from 860,000tons in 1979/80 to about 1.4 million tons in 1986/87 and over 2 million tonsin 1990/91.
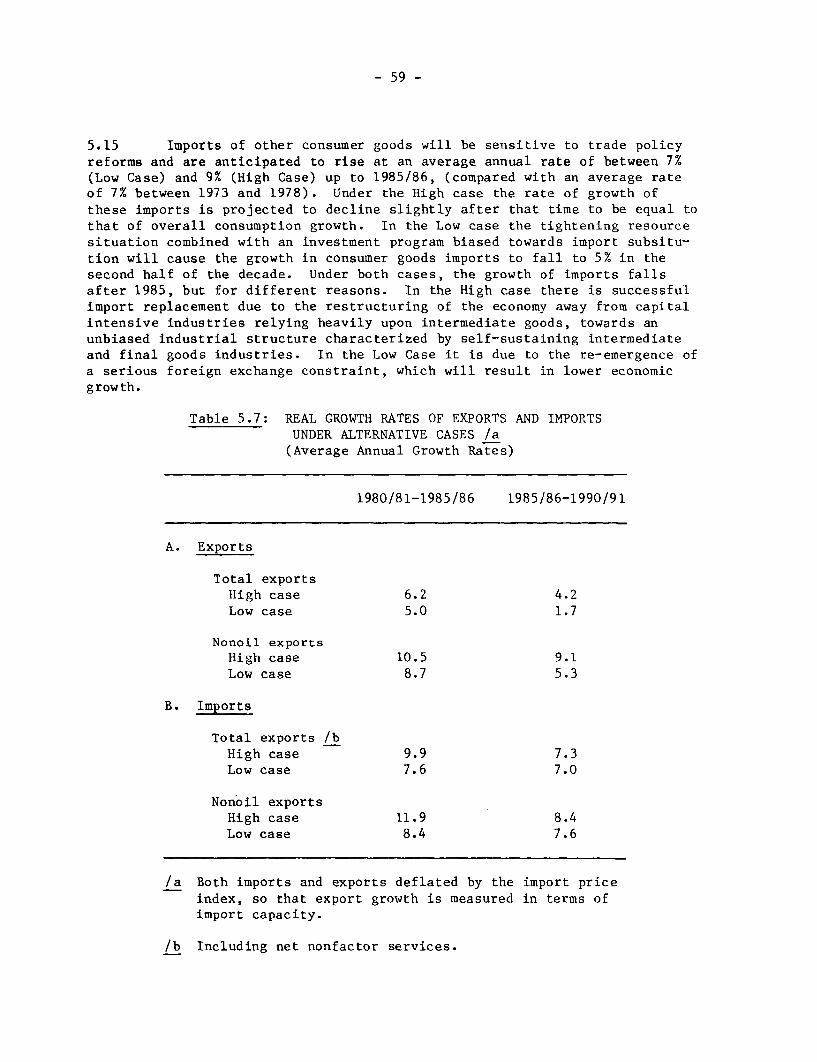
- 59 -
5.15 Imports of other consumer goods will be sensitive to trade policyreforms and are anticipated to rise at an average annual rate of between 7%(Low Case) and 9% (High Case) up to 1985/86, (compared with an average rateof 7% between 1973 and 1978). Under the High case the rate of growth ofthese imports is projected to decline slightly after that time to be equal tothat of overall consumption growth. In the Low case the tightening resourcesituation combined with an investment program biased towards import subsitu-tion will cause the growth in consumer goods imports to fall to 5% in thesecond half of the decade. Under both cases, the growth of imports fallsafter 1985, but for different reasons. In the High case there is successfulimport replacement due to the restructuring of the economy away from capitalintensive industries relying heavily upon intermediate goods, towards anunbiased industrial structure characterized by self-sustaining intermediateand final goods industries. In the Low Case it is due to the re-emergence ofa serious foreign exchange constraint, which will result in lower economicgrowth.
Table 5.7: REAL GROWTH RATES OF EXPORTS AND IMPORTSUNDER ALTERNATIVE CASES /a
(Average Annual Growth Rates)
1980/81-1985/86 1985/86-1990/91
A. Exports
Total exportsHigh case 6.2 4.2Low case 5.0 1.7
Nonoil exportsHigh case 10.5 9.1Low case 8.7 5.3
B. Imports
Total exports /bHigh case 9.9 7.3Low case 7.6 7.0
Nonoil exportsHigh case 11.9 8.4Low case 8.4 7.6
/a Both imports and exports deflated by the import priceindex, so that export growth is measured in terms ofimport capacity.
/b Including net nonfactor services.
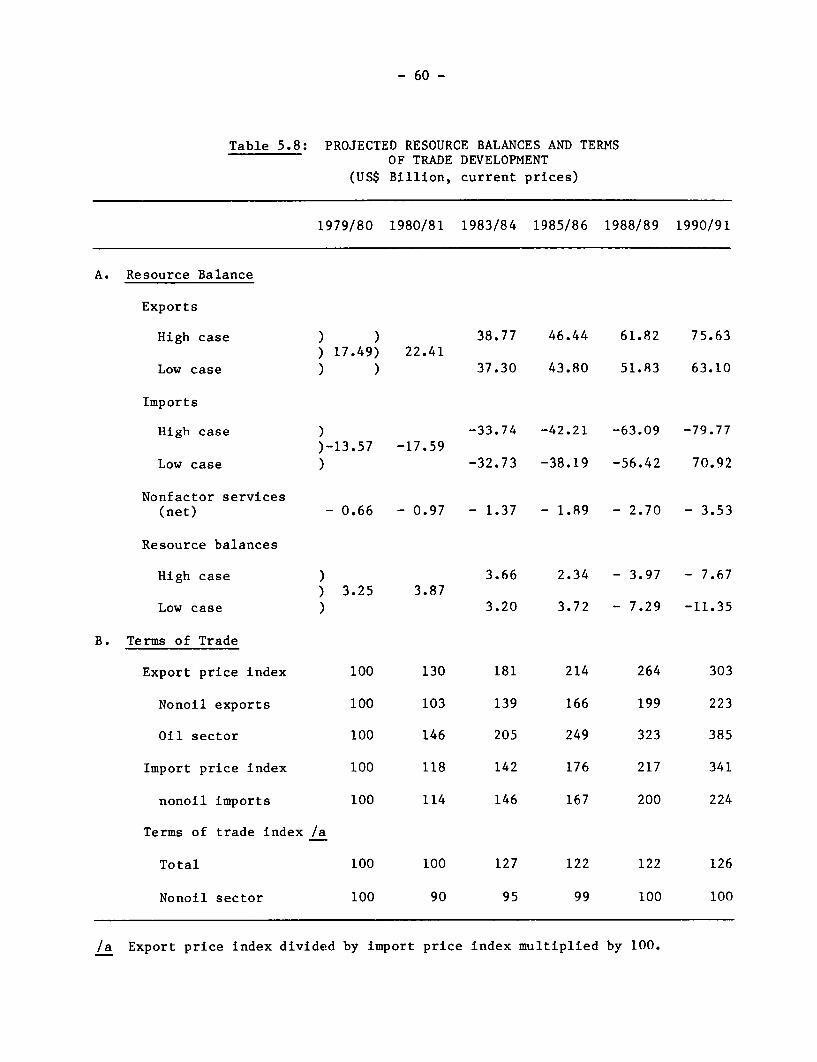
- 60 -
Table 5.8: PROJECTED RESOURCE BALANCES AND TERMSOF TRADE DEVELOPMENT
(US$ Billion, current prices)
1979/80 1980/81 1983/84 1985/86 1988/89 1990/91
A. Resource Balance
Exports
High case ) ) 38.77 46.44 61.82 75.63) 17.49) 22.41
Low case ) ) 37.30 43.80 51.83 63.10
Imports
High case ) -33.74 -42.21 -63.09 -79.77)-13.57 -17.59
Low case ) -32.73 -38.19 -56.42 70.92
Nonfactor services(net) - 0.66 - 0.97 - 1.37 - 1.89 - 2.70 - 3.53
Resource balances
High case ) 3.66 2.34 - 3.97 - 7.67) 3.25 3.87
Low case ) 3.20 3.72 - 7.29 -11.35
B. Terms of Trade
Export price index 100 130 181 214 264 303
Nonoil exports 100 103 139 166 199 223
Oil sector 100 146 205 249 323 385
Import price index 100 118 142 176 217 341
nonoil imports 100 114 146 167 200 224
Terms of trade index /a
Total 100 100 127 122 122 126
Nonoil sector 100 90 95 99 100 100
/a Export price index divided by import price index multiplied by 100.
- 61 -
5.16 As can be seen in Table 5.8 under both cases the resource balanceis likely to remain highly favorable throughout the first half of the decadealthough more so under the Low than the High Case. In the second half ofthe decade the resource picture is reversed with the balance moving rapidlyand heavily into deficit under the Low Case, while under the High Case thetransition to relative foreign exchange scarcity is altogether more gradualand sustainable. Experience in other developing countries suggest thata resource gap of 2-3% of GDP is sustainable in the long run. By the end ofthe decade the resource gap under the Low Case is estimated to be over$11.3 billion, equivalent to about 4.5% of projected GDP. Under the HighCase the gap is estimated at $7.7 billion, equivalent to about 2.5% ofprojected GDP.
5.17 In conclusion, it should be mentioned that international oil pricedevelopments will play a crucial role in Indonesia's resource position in the1980s. The precise outcome of the resource projections is highly sensitive tochanges in the oil and LNG price assumption (3% increase p.a. in real terms isassumed in this report), but conclusions with regard to policy implicationsare not. A lower real increase in international oil prices would increase theurgency for the adoption of the High case policy scenario.
The Budget
5.18 The future outlook on Government resources available for developmentexpenditures will depend on revenue from oil and LNG production, domesticresource mobilization through the budget, the growth of routine/currentexpenditures and the maintenance of reasonable macroeconomic stability. Table5.9 summarizes estimates for the first three factors up to 1985/86 under thealternative cases.
5.19 Revenue projections for oil and LNG are derived from productionprojections in the Analysis and Projections Appendix Tables 4 and 6. Exportprices of the oil sector are expected to rise in real terms by 3% annually,with the cost of oil production rising at 5% p.a. in real terms to takeaccount of the shift towards higher cost fields and secondary recovery. Thecost of LNG production rises at the international rate of inflation.Government revenue is slightly under 80% of operating income for oil, onaverage, and 60% of operating income for LNG. As a result of the relativelymoderate export price increases assumed, growth of revenue is slower than inthe past two years. From 1980/81 to 1983/84 the real growth is only about 20%compared with 80% from 1978/79 to 1980/81. The growing importance of LNG isapparent: in 1985/86 it will be 14% of total oil and LNG earnings.
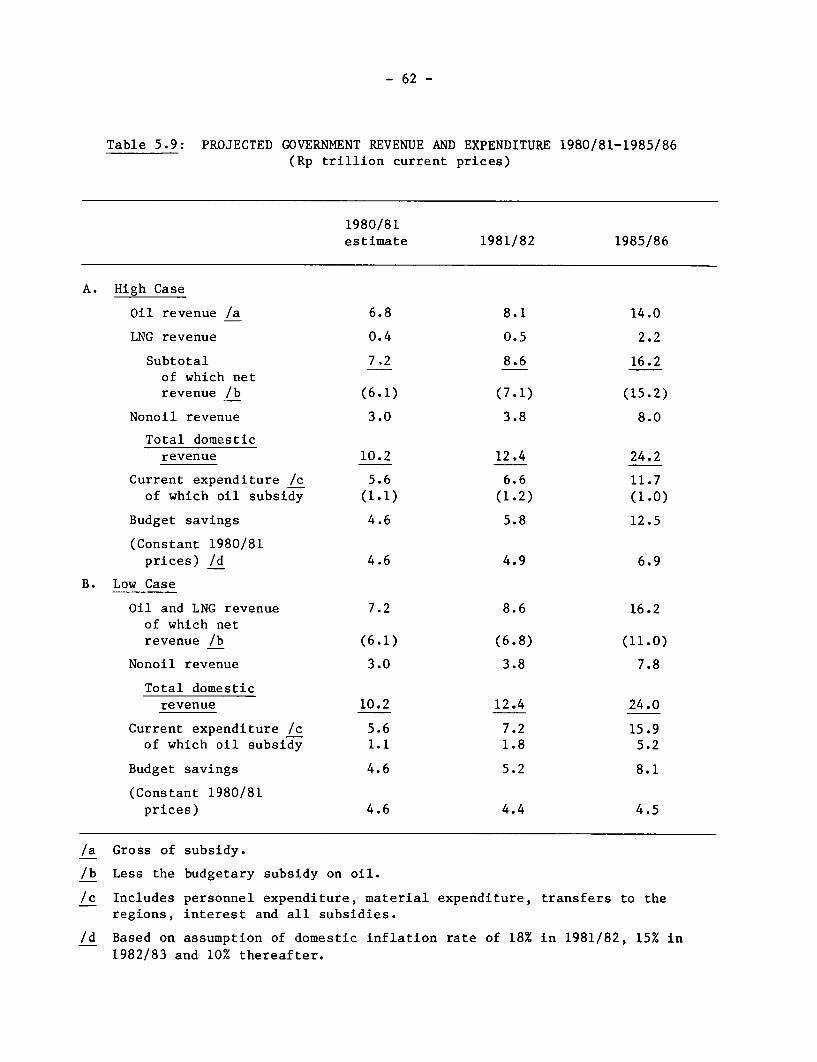
- 62 -
Table 5.9: PROJECTED GOVERNMENT REVENUE AND EXPENDITURE 1980/81-1985/86(Rp trillion current prices)
1980/81estimate 1981/82 1985/86
A. High Case
Oil revenue /a 6.8 8.1 14.0
LNG revenue 0.4 0.5 2.2
Subtotal 7.2 8.6 16.2of which netrevenue /b (6.1) (7.1) (15.2)
Nonoil revenue 3.0 3.8 8.0
Total domesticrevenue 10.2 12.4 24.2
Current expenditure /c 5.6 6.6 11.7of which oil subsidy (1.1) (1.2) (1.0)
Budget savings 4.6 5.8 12.5
(Constant 1980/81prices) /d 4.6 4.9 6.9
B. Low Case
Oil and LNG revenue 7.2 8.6 16.2of which netrevenue /b (6.1) (6.8) (11.0)
Nonoil revenue 3.0 3.8 7.8
Total domesticrevenue 10.2 12.4 24.0
Current expenditure /c 5.6 7.2 15.9of which oil subsidy 1.1 1.8 5.2
Budget savings 4.6 5.2 8.1
(Constant 1980/81prices) 4.6 4.4 4.5
/a Gross of subsidy.
/b Less the budgetary subsidy on oil.
/c Includes personnel expenditure, material expenditure, transfers to theregions, interest and all subsidies.
/d Based on assumption of domestic inflation rate of 18% in 1981/82, 15% in1982/83 and 10% thereafter.
- 63 -
5.20 The projection of nonoil tax revenue is based on the historicalexperience with optimistic assumptions. Direct taxes and the sales taxare assumed to follow the past underlying relationship with the tax bases,after accounting for Government discretionary action./l For excises andexport taxes the historical buoyancies /2 are used. For import dutiesand sales tax on imports, a buoyancy of 0.5 with respect to the level ofimports is used for 1981/82, in anticipation of further reductions in tariffson imports of capital and intermediate goods. After 1981/82 the historicalbuoyancy is used. (Nontax receipts have been declining in recent years, butare assumed to remain constant in real terms in the future). The result isequivalent to an overall buoyancy of about 1.25 with respect to GDP, andresults in tax receipts in 1985/86 almost 50% higher than in 1980/81 underthe High case. The ratio to nonmining GDP would rise from 8.8% in 1980/81to 9.5% in 1985/86. Although this would mark a significant improvement overthe past, nonoil revenue would still only account for a third of domesticrevenues in 1985/86. The resultant growth rate in total real revenue,although much less than in the past, is still healthy, at about 7% p.a.,slightly less than anticipated GDP growth.
5.21 Current expenditure /3 on goods and services are assumed to grow atthe same rate as GDP while the projection of interest payments is based onpast and projected borrowing. Government policy towards subsidies, and inparticular the oil subsidy, is by far the single most important policy -determined factor affecting domestic resource mobilization, Governmentsavings, and the key factor that distinguishes the High from the Low case withrespect to the budget.
/1 That is, the historical elasticity, which has been greater than thebuoyancy, is used.
/2 See footnote on page 12 for the definition of buoyancy.
/3 The definition of current expenditure differs from the routine budgetonly in the exclusion of amortization of Government debt and theinclusion of the fertilizer subsidy.
- 64 -
6. POLICY TOWARDS EXTERNAL CAPITAL INFLOWS AND DEBT MANAGEMENT
Financing Requirements and Creditworthiness
6.01 The macroeconomic projections and prospects analyzed in Chapters3 and 5, and the review of sectoral issues and public expenditure programs inChapter 4, provide a framework to consider Indonesia's external assistanceneeds. While macroeconomic projections are fraught with difficulties, areasonable set of assumptions regarding the behavior of GDP, investment,savings, and import and export growth, coupled with a review of absorptivecapacity in the different sectors, support the conclusion that foreignexchange availability will not be a major constraint on growth in Indonesia,during the first half of the decade. As the balance of payments projectionsin Table 6.1 indicate, the current account will remain in surplus until themid 1980s under both the High and Low growth cases. In this period officialreserves are projected to rise steadily from their current level of $7 billionto about $24 billion by 1985/86 - the equivalent of about 9 months of imports.
6.02 In the second half of the decade the balance of payments positiondeteriorates in both cases. In the High case the current account remainsmanageable, with the deficits equal to about 2.5%, of GDP by 1990/91 beingfinanced with inflows of medium and long-term loans, short-term capitalinflows (from a draw-down of assets held abroad by commercial banks), andlimited use of official reserves. In the Low case however, the currentaccount deficit would become very large. The reason, of course, is that withonly limited progress towards the objectives of structural adjustment in thefirst half of the 1980s, the export growth rate is very low. Large deficitswould rapidly emerge as Indonesia tries to maintain imports sufficient tosustain a GDP growth rate of even 6% a year. In this Low case the currentaccount deficit would be about 4.5% of GDP by 1990/91 - a level that would beinconsistent with the maintenance of internal and external financialstability. In these circumstances Indonesia would have little choice but tocut growth in production, incomes and employment even further.
6.03 At the present time however, Indonesia's external borrowingcapacity is strong indeed. Commercial loans contracted in 1980, with only0.5% interest over LIBOR, attractive maturity and grace periods, equallyattractive terms for other costs of loans, and the continued success withbond sales, all point to the high creditworthiness rating attributed byforeign private lenders to Indonesia. The question then is whetherIndonesia should continue to borrow from external sources while the currentaccount surpluses persist. In examining this question it is useful todistinguish between capital from official and from commercial sources.
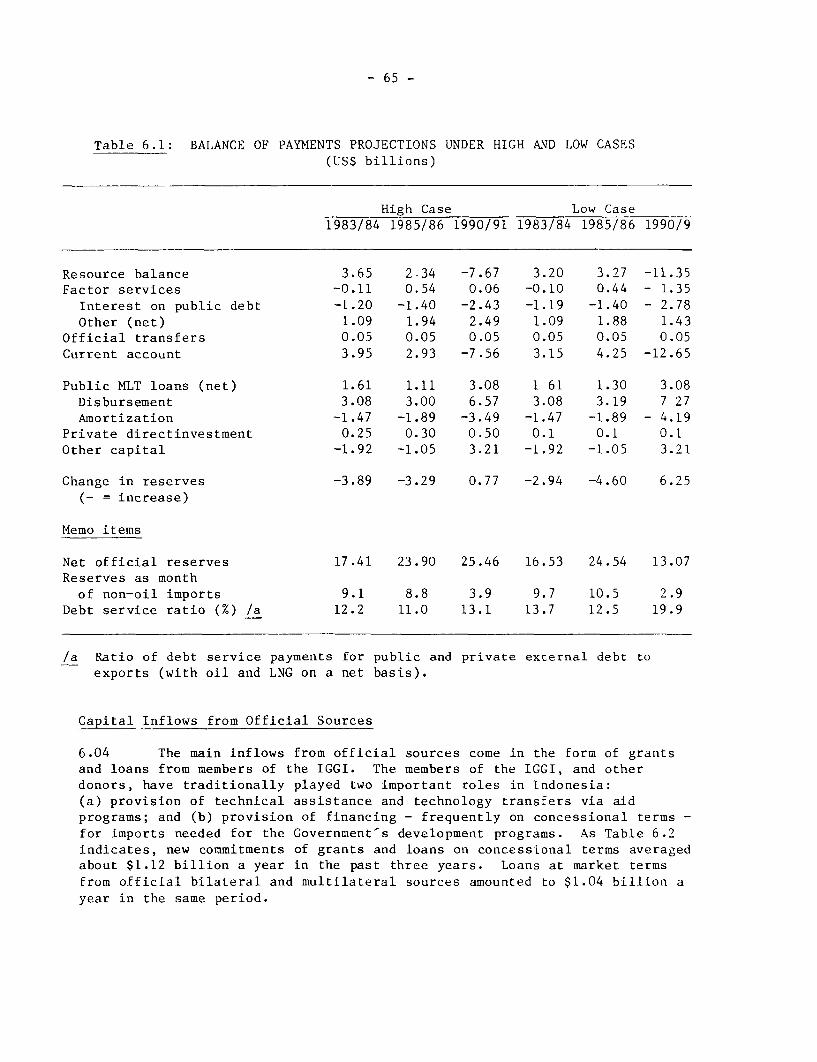
- 65 -
Table 6.1: BALANCE OF PAYMENTS PROJECTIONS UNDER HIGH AND LOW CASES(US$ billions)
High Case Low Case1983/84 1985/86 1990/91 1983/84 1985/86 1990/9
Resource balance 3.65 2.34 -7.67 3.20 3.27 -11.35Factor services -0.11 0.54 0.06 -0.10 0.44 - 1.35
Interest on public debt -1.20 -1.40 -2.43 -1.19 -1.40 - 2.78Other (net) 1.09 1.94 2.49 1.09 1.88 1.43
Official transfers 0.05 0.05 0.05 0.05 0.05 0.05Current account 3.95 2.93 -7.56 3.15 4.25 -12.65
Public MLT loans (net) 1.61 1.11 3.08 1 61 1.30 3.08Disbursement 3.08 3.00 6.57 3.08 3.19 7 27Amortization -1.47 -1.89 -3.49 -1.47 -1.89 - 4.19
Private directinvestment 0.25 0.30 0.50 0.1 0.1 0.1Other capital -1.92 -1.05 3.21 -1.92 -1.05 3.21
Change in reserves -3.89 -3.29 0.77 -2.94 -4.60 6.25(- = increase)
Memo items
Net official reserves 17.41 23.90 25.46 16.53 24.54 13.07Reserves as month
of non-oil imports 9.1 8.8 3.9 9.7 10.5 2.9Debt service ratio (%) /a 12.2 11.0 13.1 13.7 12.5 19.9
/a Ratio of debt service payments for public and private external debt toexports (with oil and LNG on a net basis).
Capital Inflows from Official Sources
6.04 The main inflows from official sources come in the form of grantsand loans from members of the IGGI. The members of the IGGI, and otherdonors, have traditionally played two important roles in Indonesia:(a) provision of technical assistance and technology transfers via aidprograms; and (b) provision of financing - frequently on concessional terms -for imports needed for the Government's development programs. As Table 6.2indicates, new commitments of grants and loans on concessional terms averagedabout $1.12 billion a year in the past three years. Loans at market termsfrom official bilateral and multilateral sources amounted to $1.04 billion ayear in the same period.
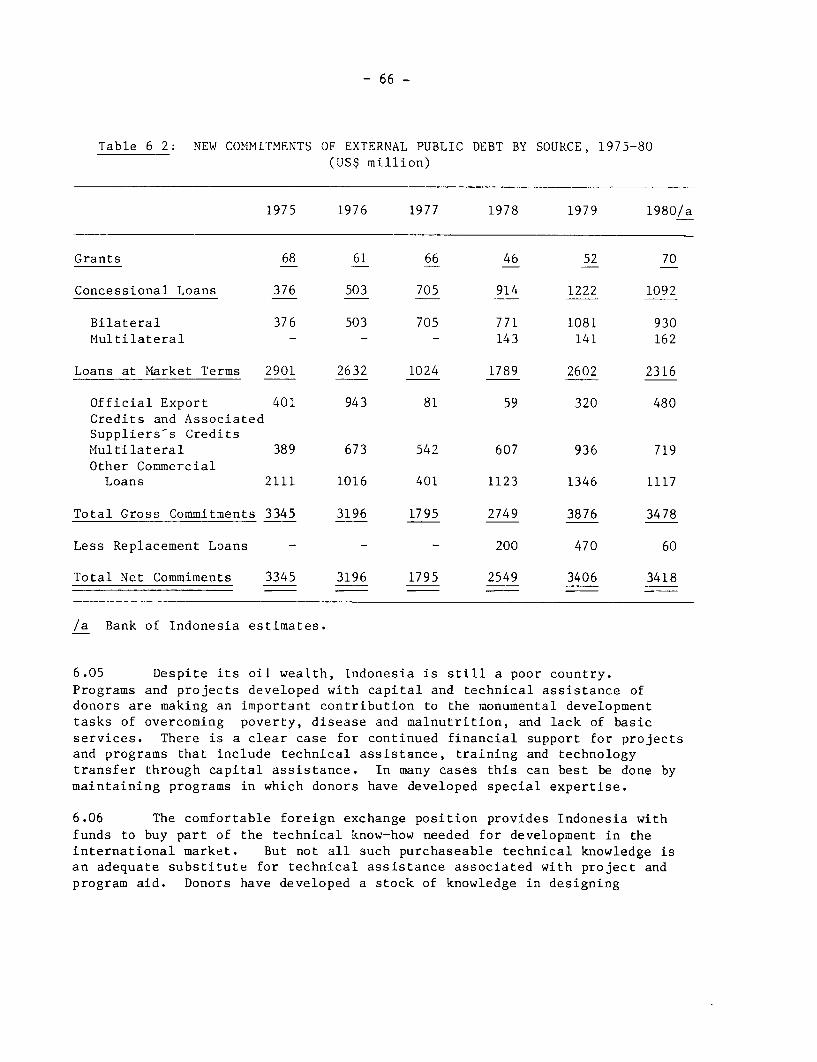
- 66 -
Table 6 2: NEW COMMITMENTS OF EXTERNAL PUBLIC DEBT BY SOURCE, 1975-80(US$ million)
1975 1976 1977 1978 1979 1980/a
Grants 68 61 66 46 52 70
Concessional Loans 376 503 705 914 1222 1092
Bilateral 376 503 705 771 1081 930Multilateral - - - 143 141 162
Loans at Market Terms 2901 2632 1024 1789 2602 2316
Official Export 401 943 81 59 320 480Credits and AssociatedSuppliers's CreditsMultilateral 389 673 542 607 936 719Other CommercialLoans 2111 1016 401 1123 1346 1117
Total Gross Commitments 3345 3196 1795 2749 3876 3478
Less Replacement Loans - - - 200 470 60
Total Net Commiments 3345 3196 1795 2549 3406 3418
/a Bank of Indonesia estimates.
6.05 Despite its oil wealth, Indonesia is still a poor country.Programs and projects developed with capital and technical assistance ofdonors are making an important contribution to the monumental developmenttasks of overcoming poverty, disease and malnutrition, and lack of basicservices. There is a clear case for continued financial support for projectsand programs that include technical assistance, training and technologytransfer through capital assistance. In many cases this can best be done bymaintaining programs in which donors have developed special expertise.
6.06 The comfortable foreign exchange position provides Indonesia withfunds to buy part of the technical know-how needed for development in theinternational market. But not all such purchaseable technical knowledge isan adequate substitute for technical assistance associated with project andprogram aid. Donors have developed a stock of knowledge in designing
- 67 -
projects and programs in specific sectors in Indonesia; they have beenclosely associated with the implementing agencies and have a commitment tosupport development efforts that goes well beyond commercial technicaltransfers. For this reason, a dollar of technical assistance associated withproject aid frequently provides more benefits to Indonesia than marketpurchased technical know-how of equal cost.
6.07 Capital aid and technical assistance cannot be disentangled inmany cases. Thus under the present circumstances in Indonesia capital aidbecomes an adjunct in external development assistance. Because financialand technical transfer components vary by project and program, it is notpossible to define the overall level of assistance needed in financial termsas in the more conventional case of aid needed to fill a resource gap.
6.08 Nonetheless, the supply of funds from donors is limited. With manyof the oil-importing developing countries facing an extremely difficult periodof adjustment to the realities of higher energy prices and slower growth inexport markets, donors and the Government alike must be satisfied that thesescarce funds are used to best advantage. The essence of the argumentpresented in Chapters 3 and 4 is that Indonesia also faces a period ofstructural adjustment, if it is to successfully lay the foundations forsustained development throughout the 1980s. Unless it does so, the currentdevelopment momentum may falter, and serious balance of payments constraintsmay re-emerge in the second half of the decade. Donors have an importantrole to play in assisting the Government in such a program of structuraladjustment. In this context, several areas suggest themselves as prioritiesfor foreign assistance. Support for upgrading and expanding technical andprofessional manpower is urgently needed. As a first priority for the 1980stechnical and managerial manpower availability has to be raised to utilizeIndonesia's incremental resources effectively. Second, continued support forprograms and delivery systems in food production, health, education, andwater supply, and programs to address basic social needs remain veryimportant. Finally, donors should continue to support projects and programsaimed at employment generation and long-term structural transformation anddiversification of the economy as a whole, the broad outlines of which wereset out in Chapters 3 and 4. It may be especially important for donors tosupport programs and projects in the more remote regions where institutionalcapacities are less well developed, especially in those regions which haveyet to participate fully in the development of the country.
6.09 Traditionally, much of the development aid provided by members ofthe IGGI and other donors, was financed at concessional rates. Indonesia-scomfortable external financial position and increased borrowing capacity have,of course, weakened the case for providing assistance on highly concessionalterms. Given the changing needs of other developing countries and the globalresponsibilities of many donors, it would be prudent for Indonesia to expectsomewhat harder terms for loans related to donor-supported programs and
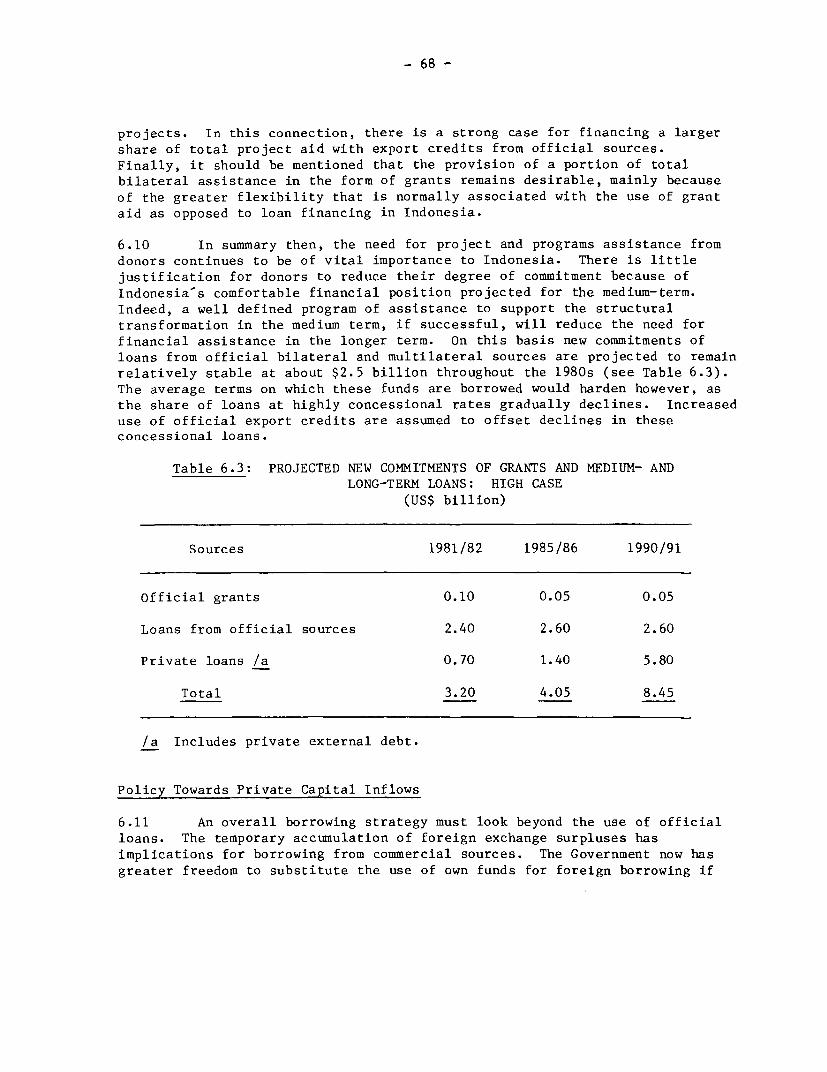
- 68 -
projects. In this connection, there is a strong case for financing a largershare of total project aid with export credits from official sources.Finally, it should be mentioned that the provision of a portion of totalbilateral assistance in the form of grants remains desirable, mainly becauseof the greater flexibility that is normally associated with the use of grantaid as opposed to loan financing in Indonesia.
6.10 In summary then, the need for project and programs assistance fromdonors continues to be of vital importance to Indonesia. There is littlejustification for donors to reduce their degree of commitment because ofIndonesia-s comfortable financial position projected for the medium-term.Indeed, a well defined program of assistance to support the structuraltransformation in the medium term, if successful, will reduce the need forfinancial assistance in the longer term. On this basis new commitments ofloans from official bilateral and multilateral sources are projected to remainrelatively stable at about $2.5 billion throughout the 1980s (see Table 6.3).The average terms on which these funds are borrowed would harden however, asthe share of loans at highly concessional rates gradually declines. Increaseduse of official export credits are assumed to offset declines in theseconcessional loans.
Table 6.3: PROJECTED NEW COMMITMENTS OF GRANTS AND MEDIUM- ANDLONG-TERM LOANS: HIGH CASE
(US$ billion)
Sources 1981/82 1985/86 1990/91
Official grants 0.10 0.05 0.05
Loans from official sources 2.40 2.60 2.60
Private loans /a 0.70 1.40 5.80
Total 3.20 4.05 8.45
/a Includes private external debt.
Policy Towards Private Capital Inflows
6.11 An overall borrowing strategy must look beyond the use of officialloans. The temporary accumulation of foreign exchange surpluses hasimplications for borrowing from commercial sources. The Government now hasgreater freedom to substitute the use of own funds for foreign borrowing if
- 69 -
and when circumstances make that desirable, and to be highly selective in theuse of commercial funds generally. The prepayment of some high interest orfloating rate loans may also become attractive, depending on returns toreserves and other factors. In recent years, several old commercial loanshave in fact been replaced by newer loans on more favorable terms for thatreason.
6.12 As Table 6.2 indicates, Indonesia has borrowed substantial amountsfrom private sources during the past three years. Some of these funds havecome in the form of suppliers- credits, and there have been several Governmentbond issues in private markets; but the bulk of the borrowings - more than$1 billion a year since 1978 - have come from the Euro-dollar and similarmarkets. With its present strong external financial position Indonesia nowhas the option of using more of its own funds as an alternative to borrowingcommercially. While there may be a case for small selective commercialborrowing for certain specific purposes, continued large scale borrowing inthe Euro-dollar market would appear to have little justification at this time.If, for example, liquidation of foreign assets is costly at a given point intime, compared to short-term borrowing rates, selective borrowing forshort-term roll-overs may be economically more attractive. There may also bea case for selective borrowings at fixed interest rates for specificprojects where returns depend on technology transfer and risk spreading.
6.13 In these circumstances, a sharply reduced level of borrowing fromprivate sources is projected for the first half of the 1980s (see Table6.3) and then to rise again to meet the emerging balance of paymentsdeficits. By the latter part of the decade public and private borrowingfrom commercial sources is projected to approach $6 billion a year.
6.14 A second element in private capital flows is private directinvestment. For the transfer of managerial skills and technology as wellas for employment absorption, private investment is an important vehicle.The manufacturing, mining, and tree crops sectors are likely to be the mostattractive for private foreign investment.
6.15 Although private foreign investment has declined in real termssince 1974, a majority of potential investors believe that Indonesia is anattractive country in which to invest. The basic thrust of encouragingprivate foreign investment lies in reducing uncertainties that affect newforeign investors by defining licensing, tax and ownership regulations moreclearly and by adopting more flexible ceilings and procedures for thegranting of work permits to foreign personnel. If the investment climatewas clarified along these lines, the decline in net inflows in real termsof direct private investment that has persisted since 1974 could bereversed. A nominal annual growth rate of 12% throughout the decade wouldbe reasonable in these conditions, bringing the net annual inflow to $500million by 1990. This is equivalent to a 5% annual growth in real terms,
- 70 -
slightly above the rate at which private direct investment in developingcountries generally is likely to grow in the future. These inflows couldplay an important role in the restructuring process that now needs to beinitiated. From a purely financial point of view, private foreigninvestment will enable risk sharing between Indonesians and foreigninvestors and will thus help to raise total investment.
Foreign Exchange Reserves and Debt Management
6.16 Indonesia now (end March 1981) holds official foreign exchangereserves of about $7.1 billion, equivalent to 4.6 months of gross imports(6.9 months of nonoil imports). In addition, state-owned commercial bankshold $4.0 billion in net foreign assets. Although the current level ofreserves is higher, both absolutely and relatively, than the average levelof reserves held by Indonesia in any previous year, it should not beconsidered excessive in relation to the reserve cover needed to undertakethe various reforms discussed in Chapter 3 and the investment programsdiscussed in Chapter 4 and the associated import requirements. Nor shouldthere be the presumption that a policy to reduce reserves is desirable forits own sake. The report s projections demonstrate that the accumulation ofreserves is essentially a medium-term phenomenon. From a monetary stabilitypoint of view, an increase in external reserves in the current circumstancesis an essential corollary to controlling inflation through monetarysurpluses in the budget. This is a reflection of the Government's decisionto spend some of the incremental revenues later than now for reasons ofstability. Optimal use of reserves inevitably entails a comparison at themargin of real returns to reserve holding with real returns to theirexpenditure domestically or abroad.
6.17 In the High case, official reserves rise steadily to about $24billion - the equivalent of 9 months of nonoil imports - by the mid-1980s.With the emergence of current account deficits in the second half of the1980s, the level of official reserves stabilizes at around $25 billion by1990/91. However, by 1990/91 this level of reserves is the equivalent ofabout 4 months of imports which may be regarded as reasonable. Thissituation is in contrast to the Low case where there is a sharp reduction inofficial reserves in the latter part of the decade to a level equivalent toonly about 3 months of imports. In this case, further declines would beunavoidable in the absence of more restrictive growth policies which wouldbe needed to ensure a manageable external position.
6.18 Private external debt is a part of the total debt obligations ofthe country. The servicing of this debt lays a claim on the same resourcesas the servicing of public foreign debt. Information on the terms andmaturity structure of nonguaranteed private external debt is not availablefrom official sources. Bank staff estimates based on lender sources put theamount of outstanding and disbursed medium- and long-term private foreign
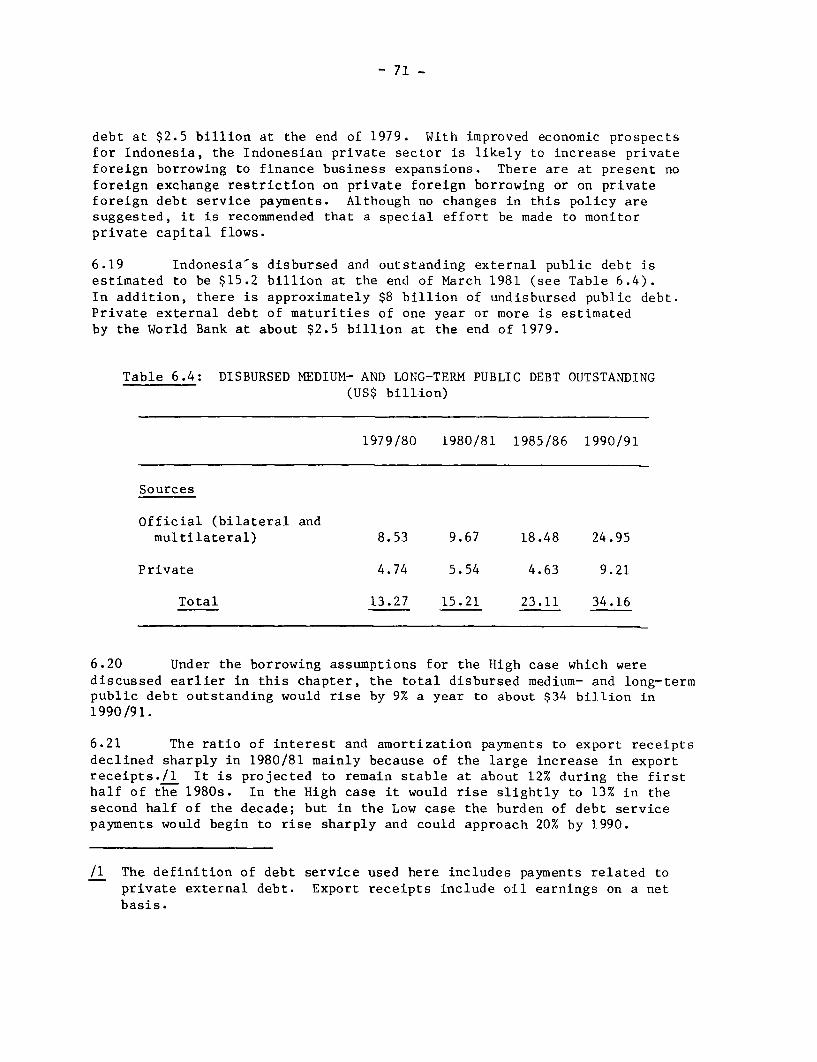
- 71 -
debt at $2.5 billion at the end of 1979. With improved economic prospectsfor Indonesia, the Indonesian private sector is likely to increase privateforeign borrowing to finance business expansions. There are at present noforeign exchange restriction on private foreign borrowing or on privateforeign debt service payments. Although no changes in this policy aresuggested, it is recommended that a special effort be made to monitorprivate capital flows.
6.19 Indonesia's disbursed and outstanding external public debt isestimated to be $15.2 billion at the end of March 1981 (see Table 6.4).In addition, there is approximately $8 billion of undisbursed public debt.Private external debt of maturities of one year or more is estimatedby the World Bank at about $2.5 billion at the end of 1979.
Table 6.4: DISBURSED MEDIUM- AND LONG-TERM PUBLIC DEBT OUTSTANDING(US$ billion)
1979/80 1980/81 1985/86 1990/91
Sources
Official (bilateral andmultilateral) 8.53 9.67 18.48 24.95
Private 4.74 5.54 4.63 9.21
Total 13.27 15.21 23.11 34.16
6.20 Under the borrowing assumptions for the High case which werediscussed earlier in this chapter, the total disbursed medium- and long-termpublic debt outstanding would rise by 9% a year to about $34 billion in1990/91.
6.21 The ratio of interest and amortization payments to export receiptsdeclined sharply in 1980/81 mainly because of the large increase in exportreceipts./1 It is projected to remain stable at about 12% during the firsthalf of the 1980s. In the High case it would rise slightly to 13% in thesecond half of the decade; but in the Low case the burden of debt servicepayments would begin to rise sharply and could approach 20% by 1990.
/1 The definition of debt service used here includes payments related toprivate external debt. Export receipts include oil earnings on a netbasis.
- 72 -
Analysis and Projections Appendix
1. Exports: High Case
2. Imports: High Case
3. Balance of Payments: High Case
4. Oil Sector Projections
5. Petroleum Fuel Products Projected Supply and Demand
6. LNG Projection
7. Terms of Trade Index 1973-1990
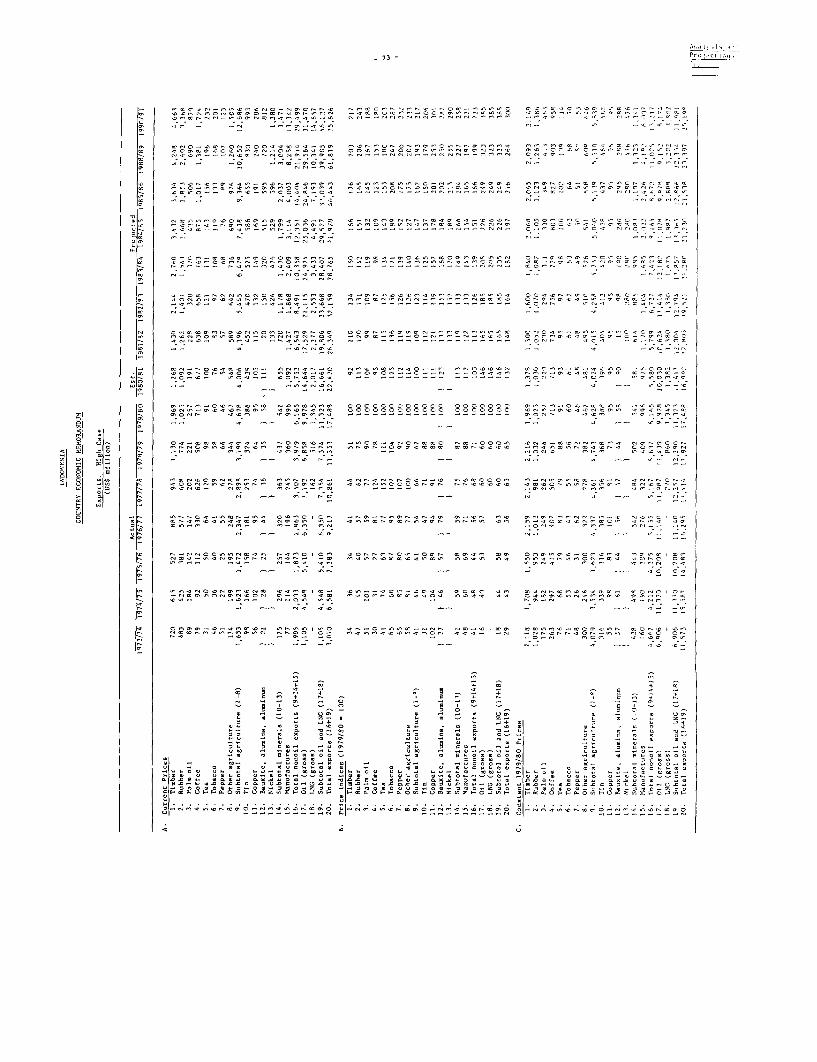
_ 73 - Pro1
00 --.0- .- ~ ~ - - - -00-0-- - --
-oo-e o l rOOGO r = o0-.-r _ o 0r 00 0 - 0 e t OON0OC r0 _0, 01 -, . - rl _ r0r
_o _ - _ C . o 0 - .-- O O- - r - - o - -
rr oo'cr oo rrrOoo OO o 0 OOcOS0-n X.raeorOOo.0-r'.0-tOO ¢ 00°'r-'.00 ° .0-o or-Cr>Or-cOrCoc
.0000-- o--o-- - - - -- - -- -- --- --- -~ ' - t C ~ 0 0 0or e ~ r _r 2ooo-,.t or - .- - C- -r _ _ _ _i r oo Cor--.r o _r d0.A - roOdd drr- OO dadrr0_ _ _-- 0v dOOoC r° r° eo d OC00 r ° r 00V r ° e
-- _-r -do-S CNr_0dd__C -t_O.- - - - - - - - - - -
I . . .._. . . . . . . . .-. . .o.o. .-. .0I. ..CN . .O . . . . . . . -C.
-O _0 0- ' _r d'N 00 00 . 00 C .-00 -- -o0 -- 0 0 0-Cr- r or0 0 0 -0
r-0 rl _ _.nr ro_ ~ 4d - - u
= o .rd;rI r ; rod r, nCIC r CorO d .3 ; t< S- rd2r 2Cr r r
~~~0 ~ r _- or _0 4~ 0:0 - Q -~
a or + o+aer da a + 0
*: 0 0 + O- -A 0 0 + 0-; C 0J C- +A O -r
X ~ ~ ~~ o- 0 0-e iE ii 0 0- oo .- -XX @ ==ai r ;os ?= r
r~~~~~~~~~~~~ or 0 0 .r0

INDONESIA
COUNTRY ECONOMIC MEMORANDUM
Imports: High Case(US$ million)
Actual Est. Projected1q73/ 1974/ 1975/ 1976/ 1977/ 1978/ 1979/ 19R0/ 1981/ 1982/ 1983/ 1984/ jq85/ 1986/ 1987/ 1988/ 1989/ 1990/
74 75 76 77 78 79 so 81 82 83 84 85 86 87 88 89 90 91
A. Current Prices1. Rice 389 493 275 333 650 341 744 781 918 1,077 1,191 1,321 1,460 1,579 1,712 1,851 2,006 2 ,1722. Other consumption goods 610 457 631 1,024 1,326 1,572 1,651 2,089 2,478 2 ,922 3,449 4,046 4 684 5,327 6,058 6, 65 7, 794 8,8183. Intermediate goods 1,163 2,162 1,771 1,603 1,721 2,085 2,760 3,493 4,144 5,111 6,254 7,141 8,210 9,142 9,717 10,291 10,918 11,5464. Capital goods 776 1,229 2,413 3,207 3,544 3,545 4,070 5,140 6,603 8,424 10,763 13,322 16,309 19,892 23,680 28,090 33,377 38,1305. Total nonoil imports 2,938 4,341 5,090 6,167 7,241 7,543 9,225 11,503 14,143 17,534 21,657 25,830 30,663 35,940 41,167 47,097 54,095 60,6666. Oil sector /a 460 1,910 2,272 2,640 2,909 2,264 4,349 6,084 7,512 9,495 12,085 11,426 11,554 13,139 14,775 15,992 17,476 19,0977. Nonfactor services (net) 194 263 345 490 536 586 659 975 1,002 1,174 1,370 1,613 1,889 2,058 2,355 2,701 3,086 3,5348. Imports + NFS 3,592 6,514 7,707 9,297 10,686 11,493 14,238 18,544 22,657 28,203 35,112 38,859 44,104 51,137 58,289 65,790 74,657 83,297
B. Price Index (1979 - 100)1. Rice 107 165 110 77 82 111 100 133 154 178 194 212 231 246 263 280 299 3192. Other goods 48 60 69 71 76 88 100 113 123 133 144 155 165 175 186 197 209 2213. Total nonoil imports 52 65 70 71 77 89 100 114 125 135 146 157 167 178 189 200 212 2244. Oil sector /a 40 55 65 67 72 81 100 129 143 159 174 190 207 223 241 260 281 3035. NFS 48 60 69 71 76 88 100 110 119 128 137 148 159 168 178 189 200 2126. Imports + NFS 50 61 68 70 75 86 100 118 129 143 155 167 179 193 199 211 225 237
C. Constant 1979 Prices1. Rice 364 299 250 432 793 307 744 587 596 605 614 623 632 642 651 661 671 6812. Other consumption goods 1,271 762 914 1,442 1,745 1,786 1,651 1,849 2,015 2,197 2,395 2,610 2,845 3,044 3,257 3,485 3,729 3,9903. Intermediate goods 2,423 3,603 2,567 2,258 2,264 2,369 2,760 3,091 3,462 1,842 4,227 4,607 4,976 5,224 5,224 5,224 5,224 5,2244. Capital goods 1,617 2,048 3,497 4,517 4,661 4,028 4,070 4,549 5,368 6,334 7,474 8,595 9,884 11,367 12,731 14,259 15,970 17,2535. Total nonoil imports 5,675 6,712 7,228 8,649 9,465 8,490 9,230 10,076 11,440 12,878 14,710 16,435 18,337 20,777 21,863 23,629 25,594 27,1486. Oil sector /a 1,150 3,456 3,492 3,940 4,040 4,153 4,349 4,716 5,253 5,972 6,945 6,014 5,582 5,892 6,131 6,151 6,219 6,3037. Nonfactor services (net) 404 438 500 690 705 666 659 886 842 917 1,000 1,090 1,188 1,225 1,323 1,429 1,543 1,667A. Imports + NFS 7,229 10,606 11,270) 13,259 14,21() 13,309 14,238 15,678 17,535 19,761 22,655 23,315 24,682 26,526 29,317 31,209 33,242 35,118
/a Including services (see Table 4 of this Appendix for disaggregation).
- .al56 m l
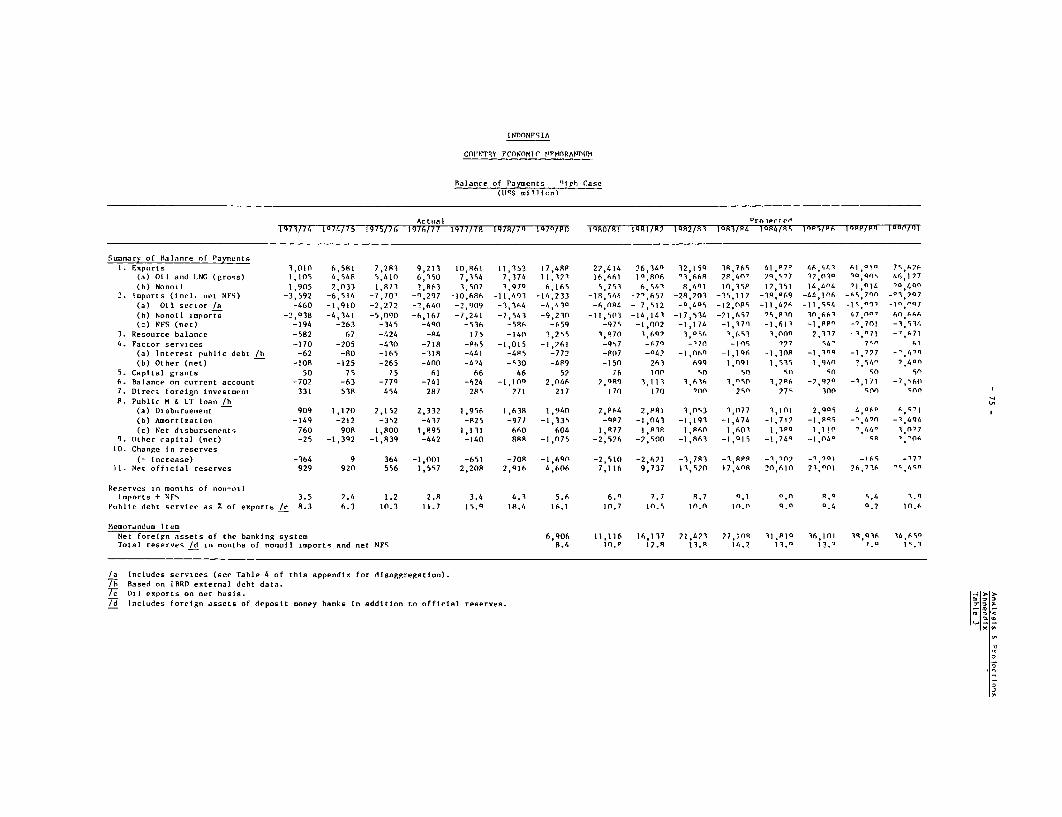
I NrnnNFP IA
COUNTRY FCONOMIC MFMnRAMA1'rM
Ralance of Payments .is?h Case(I15S n11 Inn)
Ac tual Pro - tced1971/74 l174/I5 19/5/76 1976/7 7 19R71/7 9I7/79 1970/812 10n0/g1 1991/R2 I982/R1 IQlR8/4 1QR4/Rs l55fp6 IQRP/Aq I uNT(FT
Summary of Balance of Payments1. Exports 1,010 6,581 7,2S3 9,213 10,R61 11,153 17,48P 27,414 ?6,340 12,159 3R,76S 41,P70 4.,'&,43 6l,a1' 7S,67F
(a) Oil and l.NC (gross) 1,105 4,54F 5,41(0 6,150 7,354 7,374 11,17t 16,661 1,8nh6 '3,66h 2P,4n0 71,S77 7.030 10,9qn0 46,177(b) Nonoil 1,905 2,033 1,R71 7,963 3,507 1,97Q 6,165 9,753 6,543 R,41l In,35P 17,151 14,4n4 '1,nl4 'o 49"
2. Imports (I ncl. net NFS) -3,592 -6,514 -7,707 -9,297 -10,6R6 -11,493 -14 ,233 -18,544 -27,657 -2A,7(0l -15,117 -IR,a69 -44,10n6 _sS,70n .3,Q707
(a) Oil sector /a -460 -1,910 -2,272 -7,640 -2,909 -3,364 -4,'.1 -6,nR4 - 7,S12 -0,405 -12,0S8 -11,472 -11,55 c -1",len7(h) Nonoil imports -2,938 -4,341 -5,050 -6,167 -7,241 -7,543 -9,210 -11,503 -14,141 -17,514 -71,6S7 5,P83n 30,66f 47,nn, 6,AA66(c) NFS (net) -194 -263 -345 -4Q0 -536 -586 -65q -87S -I,0O2 -1,174 -1,17n -1 ,61 -I,'p -1,701 -1,5134
3. Resource balance -582 67 -424 -84 175 -14n 1,2S5 3,870 1,693 3,054 1,653 A,no 2,11737 .3,071 -7,r714. Factor services -170 -205 -410 -718 -P65 -1,015 -1,761 -9S7 -67n -'7n -10-, 177 54' 710 61
(a) Interest public debt /b -62 -80 -165 -318 -441 -85 -772 -807 no4 -1,069 -1,1n6 -1,308 _151q -1,777 -,tin(b) Other (net) -108 -125 -265 -40O -4b4 -S30 -4b9 -150 263 69q 1InQ9 1,S3S 1,q4n 7,5s4^ ,40n
5. Capital grants 50 75 75 61 66 46 57 76 100 sn 0n sn sn sn0 56. Balance on current account -702 -63 -77Q -741 -624 -1,100 2,n46 7,0QR 3,111 3,636 305" 1,726 -.7,970 -1,171 -7,S607. Direct foreign investment 331 518 454 287 285 771 217 170 170 '00 7Sn 777 3n0 5son 0nn
P. Public M & LT loan /b(a) Disbnrsenent 909 1,170 7,152 2,332 1,956 1,638 1,940 2,P64 2,PRI 1,053 1,077 3,101 2.q90 4,Q06 r 7'l
(b) Amortization -149 -212 -352 -437 -P25 -977 -1,335 -Q97 -1 ,041 -1,193 -1,474 -1,717 -1,Pq8 -',41bn -3,494(c) Net disbursements 760 908 1,800 1,R95 1,131 660 604 IR77 1,81R IR,60 1,601 1,lPo 1,l 10 7,440 3,n77
9. OIther capital (net) -25 -1,392 -1,839 -442 -140 8RA -1,075 -2,S76 -7,S00 -1,863 -1,l,S -1,74Q -1,04° ca ' '0,10. Change In reserves
(- Increase) -364 9 364 -1,001 -651 -708 -1,60 -2,510 -2,671 -3,7R8 -3,8P8 -3,107 .1,701 -165 -77111. Net official reserves 929 920 556 1,557 2,208 2,q16 4,606 7,116 9,737 13,S70 17,4n8 20,610 21,0n1 76,736 ' 45n
Reserves in months of non-oilimports 6 NFS 3.5 2.4 1.2 2.R 3.4 4.1 5.6 6.n 7.7 8.7 9.1 o.n 8.Q s.4 3.n
Public debt service as 1: of exports /c 8.3 6.3 10.3 11.7 15.0 18.4 16.1 10.7 10.5 In.n In.n q.n °.4 °.? In0.
Memorandum ItemNet forelFn assets of the banksing system 6,906 11,116 16,117 21,4721 27,I0nR 31.10 36,101 3,Q3 134,650Total reserves /d in months of nonoil imports and net NFIS 8.4 in.p 17.8 13.R 14.2 13.0 13.3 1.0 1c
/a Includes services (see Table 4 of this appendix for disaggrepatlon)./b Based on IRR8 external debt data.7 Oil exports on net hasis.7'd Includes foreign assets of deposit money banks in addition to official reserves.
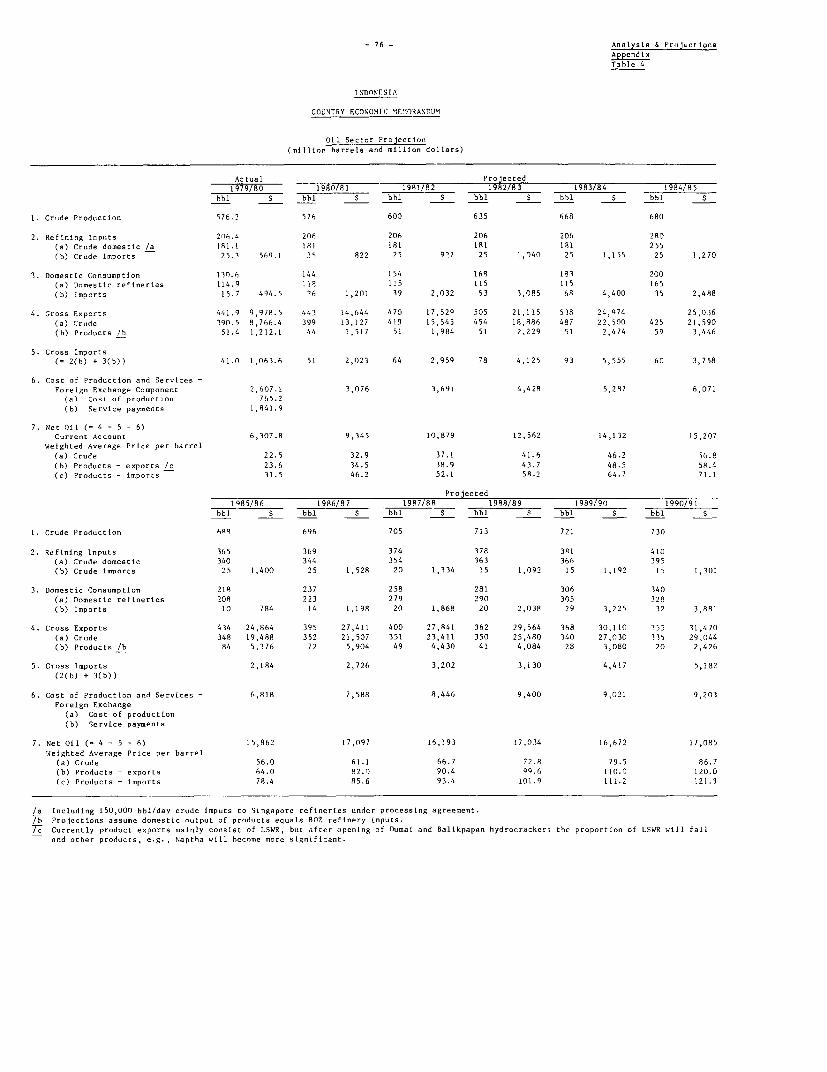
- 76 - Analysis . ProjectionsAppendixTable 4
I NDONES SIA
COUNTRY ECONOMIlC '1F.(RANDllM
Oil Sector Projection(million barrels and million dollars)
Actual Projected1979/80 1980/81 1981/82 1982/83 1983/84 1984/85
hbl S bbl S 661 S bbl $ hbl $ bbl $
1. Crude Produiction 976.2 576 600 635 668 680
2. Refining Inpu,ts 206.4 206 206 206 206 280(a) Crude domestic /a 181.1 IRI 181 181 181 255(b) Crude imports 25.1 569.1 29 822 25 9'.7 25 1,040 25 1,IS5 25 1,270
3. Domestic Consumption 130.6 144 154 169 181 200(a) Domestic refineries 114.9 118 115 115 115 165(b) Imports 15.7 4Q4.5 26 1,201 19 2,032 53 3,085 68 4,400 15 2,488
4. Gross Exports 441.9 9,978.5 443 14,644 470 17,52Q 505 21,115 538 24,074 25,036(a) Crude 390.5 8,766.4 399 13,127 419 I5,545 454 18,886 487 22,500 425 21,590(b) Products /b 51.4 1,212.1 44 1,517 51 1,984 51 2,229 51 2,474 59 3,446
5. Gross Imports(= 2(b) + 3(b)) 41.0 1,063.6 51 2,023 64 2,959 78 4,125 93 5,555 60 3,758
6. Cost of Production and Services -Foreign Exchange Component 2,607.1 3,076 3,691 1,428 5,287 6,071
(a) Cost of production 765.2(b) Service payments 1,841.9
7. Net Oil (- 4 - 5 - 6)Current Account 6,307.8 9,345 10,879 12,562 14,132 15,207
Weighted Average Price per barrel(a) Crude 22.5 32.9 37.1 41.6 46.2 ;10.8(b) Products - exports /c 23.6 34.5 38.9 43.7 48.5 58.4(c) Products - imports 31.5 46.2 52.1 58.2 64.7 71.1
Projected1585/86 1986/87 1987/88 1988/89 1989/90 1990/91
bbl S bbl S bbl $ hbl $ bbl S 6bb S
1. Crude Production 6R8 696 705 713 721 730
2. Refining Inputs 365 369 374 178 381 410(a) Crude domestic 340 344 354 363 366 395(b) Crude imports 25 1,400 25 1,528 20 1,334 15 1,092 15 1,192 15 1,301
3. Domestic Consumption 218 237 258 281 306 340(a) Domestic refineries 208 223 279 290 305 328(b) Imports 10 784 14 1,198 20 1,868 20 2,038 29 3,225 32 3,881
4. Gross Exports 434 24,864 395 27,411 400 27,841 362 29,564 368 30,110 355 31,470(a) Crude 348 19,488 352 21,507 351 23,411 350 25,480 340 27,030 335 29,044(b) Products /b 84 5,376 72 5,904 49 4,430 41 4,084 28 3,080 20 2,426
5. Gross Imports 2,184 2,726 3,202 3,130 4,417 5,182(2(b) + 3(b))
6. Cost of Production and Services - 6,818 7,588 8,446 9,400 9,021 9,203Foreign Exchange
(a) Cost of production(b) Service payments
7. Net Oil (= 4 - 5 - 6) 15,862 17,097 16,193 17,034 16,672 17,085Wleighted Average Price per barrel
(a) Crude 56.0 61.1 66.7 72.8 79.5 86.7(b) Products - exports 64.0 82.0 90.4 99.6 110.0 120.0(c) Products - imports 78.4 85.6 93.4 101.9 111.2 121.3
/a Including 150,000 bbl/day crude Imputs to Singapore refineries under processing agreement.7i Projections assume domestic output of products equals 80% refinery inputs.7J Currently product exports mainly consist of LSWR, but after opening of Dumai and Balikpapan hydrocrackers the proportion of LSWR will fall
and other products, e.g., Naptha will become more significant.
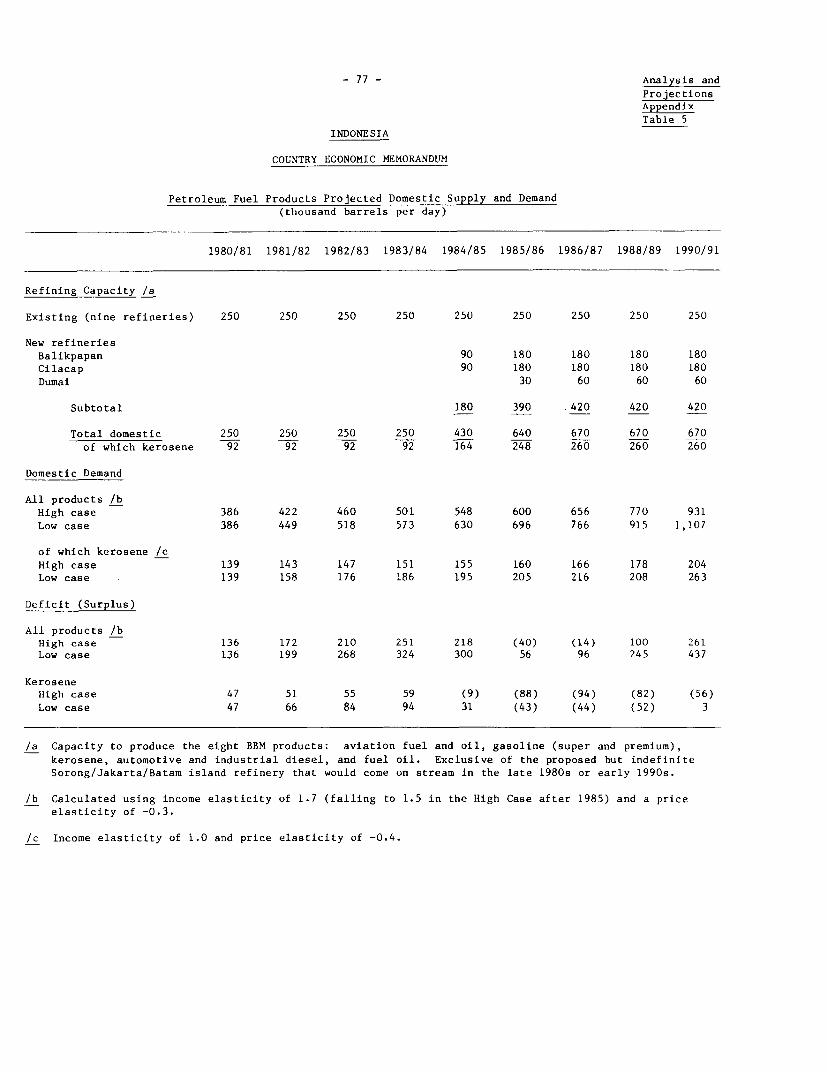
- 77 - Analysis and
ProjectionsAppendixTable 5
INDONESIA
COUNTRY ECONOMIC MEMORANDUM
Petroleum Fuel Products Projected Domestic Supply and Demand(thousand barrels per day)
1980/81 1981/82 1982/83 1983/84 1984/85 1985/86 1986/87 1988/89 1990/91
Refining Capacity /a
Existing (nine refineries) 250 250 250 250 250 250 250 250 250
New refineriesBalikpapan 90 180 180 180 180Cilacap 90 180 180 180 180Dumai 30 60 60 60
Subtotal 180 390 420 420 420
Total domestic 250 250 250 250 430 640 670 670 670of which kerosene 92 92 92 92 164 248 260 260 260
Domestic Demand
All products /bHigh case 386 422 460 501 548 600 656 770 931Low case 386 449 518 573 630 696 766 915 1,107
of which kerosene /cHigh case 139 143 147 151 155 160 166 178 204Low case 139 158 176 186 195 205 216 208 263
Deficit (Surplus)
All products /bHigh case 136 172 210 251 218 (40) (14) 100 261Low case 136 199 268 324 300 56 96 245 437
KeroseneHigh case 47 51 55 59 (9) (88) (94) (82) (56)Low case 47 66 84 94 31 (43) (44) (52) 3
/a Capacity to produce the eight BBM products: aviation fuel and oil, gasoline (super and premium),kerosene, automotive and industrial diesel, and fuel oil. Exclusive of the proposed but indefiniteSorong/Jakarta/Batam island refinery that would come on stream in the late 1980s or early 1990s.
/b Calculated using income elasticity of 1.7 (falling to 1.5 in the High Case after 1985) and a priceelasticity of -0.3.
/c Income elasticity of 1.0 and price elasticity of -0.4.
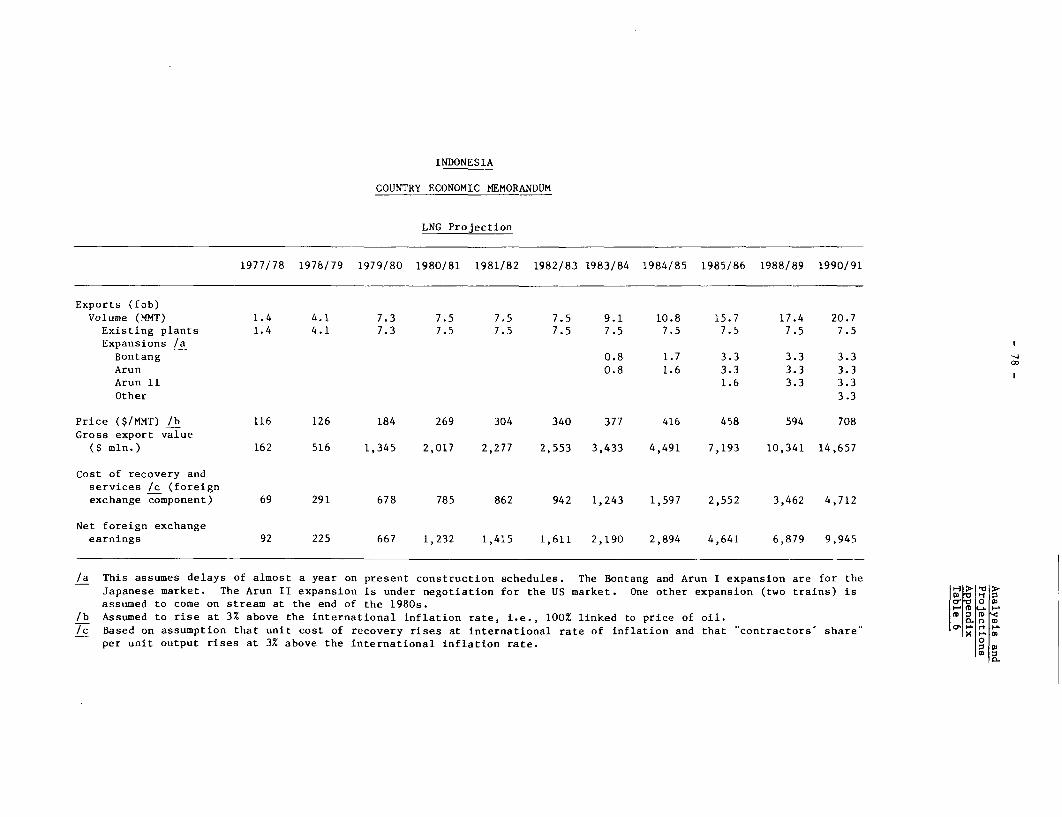
INDONESIA
COUNTRY ECONOMIC MEMORANDUM
LNG Projection
1977/78 1978/79 1979/80 1980/81 1981/82 1982/83 1983/84 1984/85 1985/86 1988/89 1990/91
Exports (fob)Volume (MMT) 1.4 4.1 7.3 7.5 7.5 7.5 9.1 10.8 15.7 17.4 20.7
Existing plants 1.4 4.1 7.3 7.5 7.5 7.5 7.5 7.5 7.5 7.5 7.5Expansions /a
Bontang 0.8 1.7 3.3 3.3 3.3 X
Arun 0.8 1.6 3.3 3.3 3.3Arun II 1.6 3.3 3.3Other 3.3
Price ($/MMT) /b 116 126 184 269 304 340 377 416 458 594 708Gross export value
($ mln.) 162 516 1,345 2,017 2,277 2,553 3,433 4,491 7,193 10,341 14,657
Cost of recovery andservices /c (foreignexchange component) 69 291 678 785 862 942 1,243 1,597 2,552 3,462 4,712
Net foreign exchangeearnings 92 225 667 1,232 1,415 1,611 2,190 2,894 4,641 6,879 9,945
/a This assumes delays of almost a year on present construction schedules. The Bontang and Arun I expansion are for theJapanese market. The Arun II expansion is under negotiation for the US market. One other expansion (two trains) is v D e 5
assumed to come on stream at the end of the 19 80s. a X 0/b Assumed to rise at 3% above the international inflation rate, i.e., 100% linked to price of oil. X f m w/c Based on assumption that unit cost of recovery rises at international rate of inflation and that "contractors' share" ° 1^ X
per unit output rises at 3% above the international inflation rate. 00.0
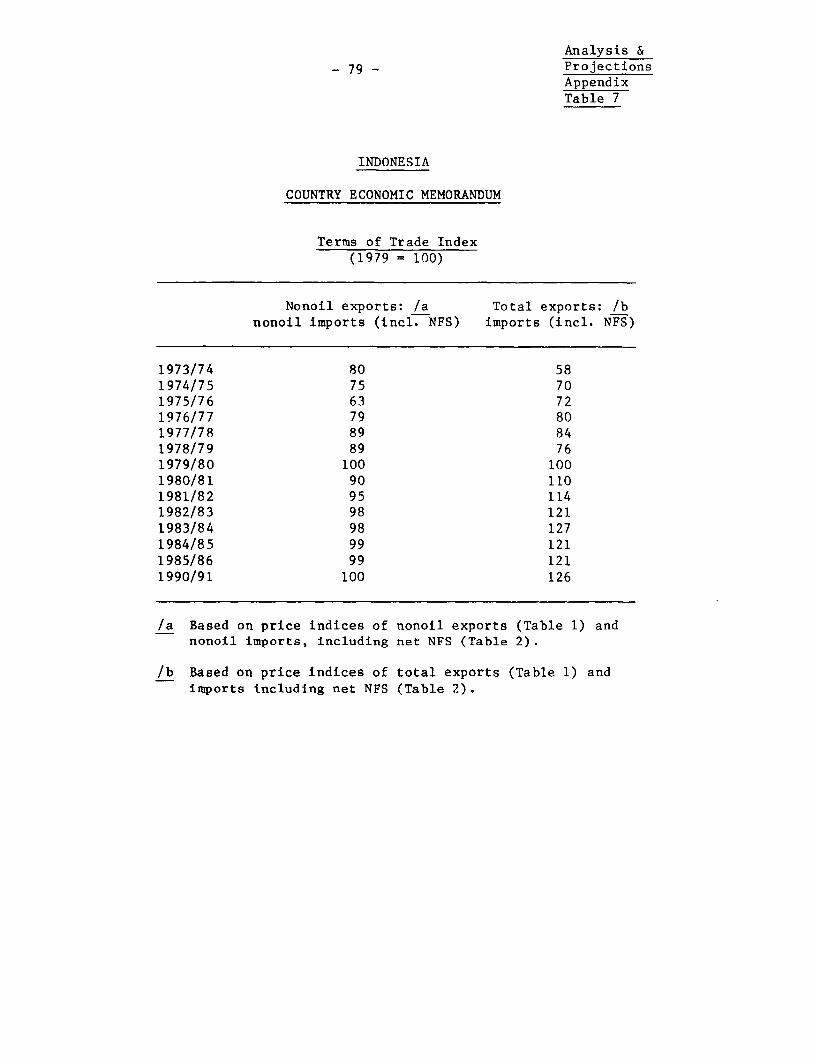
Analysis &- 79 - Projections
AppendixTable 7
INDONESIA
COUNTRY ECONOMIC MEMORANDUM
Terms of Trade Index(1979 = 100)
Nonoil exports: /a Total exports: /bnonoil imports (incl. NFS) imports (incl. NFS)
1973/74 80 581974/75 75 701975/76 63 721976/77 79 801977/78 89 841978/79 89 761979/80 100 1001980/81 90 1101981/82 95 1141982/83 98 1211983/84 98 1271984/85 99 1211985/86 99 1211990/91 100 126
/a Based on price indices of nonoil exports (Table 1) andnonoil imports, including net NFS (Table 2).
/b Based on price indices of total exports (Table 1) andimports including net NFS (Table 2).
- 80 -
STATISTICAL ANNEX - LIST OF TABLES
Population and Employment
1.1 Population 1930, 1961, 1971, 1980: Average Annual Growth Rates,1930-80 and Population Density, by Region and Province.
1.2 Distribution of Population by Age Group and Sex.
National Income Accounts
2.1 Gross Domestic Product by Industrial Origin at Current Market Prices,1967-79.
2.2 Percentage Distribution of GDP at Current Market Prices, 1971-79.
2.3 Gross Domestic Product by Industrial Origin at Constant 1973Market Prices, 1971-79
2.4 Percentage Distribution of GDP at Constant 1973 Market Prices, 1971-79.
2.5 Expenditures on GDP at Current Market Prices, 1971-79.
2.6 Expenditures on GDP at Constant 1973 Market Prices, 1971-79.
2.7 Estimate of the Terms of Trade Effects, 1971-79.
2.8 Average Growth Rates and Selected Economic Indicators 1974-79.
International Trade and Balance of Payments
3.1 Balance of Payments, 1973/74-1979/80.
3.2 Nonoil Exports, 1971/72-1979/80.
3.3 Export Values by Country of Destination, 1971-79.
3.4 Import Values by Country of Origin, 1971-79.
3.5 Oil Balance of Payments, 1976/77-1979/80.
3.6 LNG Balance of Payments , 1977/78-1979/80.
External Debt
4.1 External Public Debt Outstanding Including Undisbursed as ofDecember 31, 1979.
- 81 -
4.2 Service Payments, Commitments, Disbursements and Outstanding Amountsof External Public Debt.
4.3 External Public Debt by Country and Type of Creditor as ofDecember 31, 1979.
4.4 External Public Debt as of December 31, 1979, by Major Currenciesand Countries.
4.5 Loan Commitments by Country (1974-1979).
4.6 IGGI and Non-IGGI Disbursements and Net Resources Transfers, 1974-79.
4.7 Summary External Debt Data, 1974-79.
4.8 Selected Debt Indicators, 1973-79.
4.9 Net Resource Transfers, 1975-79.
Public Finance
5.1 Central Government Budget Summary, 1972/73-1981/82.
5.2 Central Government Receipts, 1972/73-1981/82.
5.3 Central Government Expenditures, 1972/73-1981/82.
5.4 Development Expenditures, 1972/73-1980/81.
5.5 Development Expenditures by Sector, 1974/75-1981/82.
5.6 Project Aid by Sector, 1974/75-1980/81.
Monetary Statistics
6.1 Money Supply, 1971-80.
6.2 Changes in Factors Affecting Money Supply, 1972-80.
6.3 Consolidated Balance Sheet of Monetary System, 1973-80.
6.4 Consolidated Balance Sheet of Monetary Authorities, 1974-80.
6.5 Banking System Credits by Economic Sector, 1973-80.
6.6 Banking System Credits by Type of Bank3, 1974-80.
6.7 Small-Scale Investment Credits and Permanent Working CapitalCredits, 1974-80.
- 82 -
6.8 Medium-Term Investment Credits by Economic Sector, 1973-80.
6.9 Time Deposits with State Banks, 1971-80.
Agricultural Statistics
7.1 Principal Agriculture Products by Subsectors, 1968-79.
7.2 Agricultural Production of Major Crops by Type of Products, 1969-79.
7.3 Rice-Area Harvested, Production and Yield, 1968/79.
7.4 Rice Production, Imports, Procurement and Consumption, 1960-79.
7.5 Area Covered Under Rice Intensification Programs, 1969-79.
Other Sectors
8.1 Production of Selected Industrial Goods, 1969/70-1979/80.
8.2 Production, Imports and Estimated Consumption of Cement, 1967-79.
8.3 Production of Minerals, 1973-79.
8.4 Crude Oil Production, 1973-79.
8.5 Petroleum Products - Supply and Demand, 1969-79.
8.6 Domestic Sales of Petroleum Products, 1971-80.
Prices
9.1 Cost of Living Index in Jakarta, 1970-79.
9.2 Consumer Price Index - Jakarta and Indonesia, 1979-81.
9.3 Wholesale Price Indices in Indonesia, 1971-80.
9.4 Domestic Price of Petroleum Products, 1972-80.
Investment
10.1 Approved Foreign Investment by Sector, 1967-80.
10.2 Implementation of Foreign Investment by Sector, 1967-79.
10.3 Approved Domestic Investment by Sector, 1967-79.
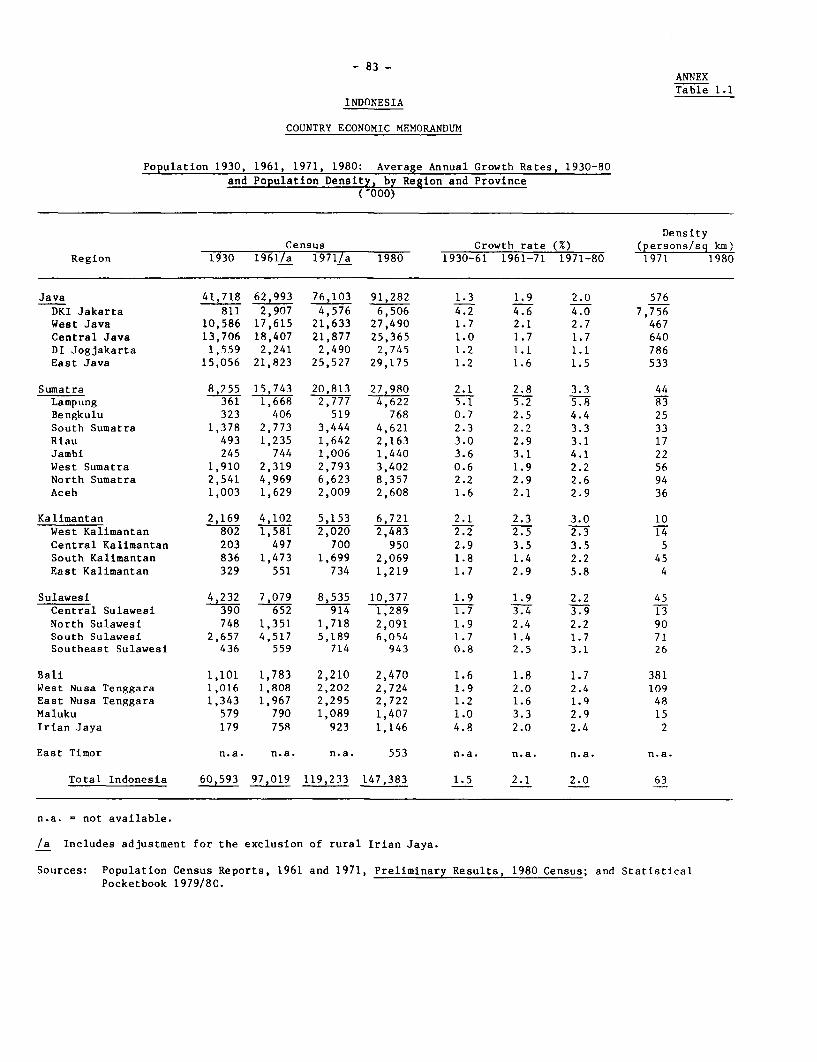
- 83 -ANNEXTable 1.1
INDONESIA
COUNTRY ECONOMIC MEMORANDUM
Population 1930, 1961, 1971, 1980: Average Annual Growth Rates, 1930-80and Population Density, by Region and Province
(U°°°)
DensityCensus Growth rate (%) (persons/sq km)
Region 1930 1961/a 1971/a 1980 1930-61 1961-71 1971-80 1971 1980
Java 41,718 62,993 76,103 91,282 1.3 1.9 2.0 576DKI Jakarta 811 2,907 4,576 6,506 4.2 4.6 4.0 7,756West Java 10,586 17,615 21,633 27,490 1.7 2.1 2.7 467Central Java 13,706 18,407 21,877 25,365 1.0 1.7 1.7 640DI Jogjakarta 1,559 2,241 2,490 2,745 1.2 1.1 1.1 786East Java 15,056 21,823 25,527 29,175 1.2 1.6 1.5 533
Sumatra 8,255 15,743 20,813 27,980 2.1 2.8 3.3 44Lampung 361 1,668 2,777 4,622 5.1 5.2 5.8 83Bengkulu 323 406 519 768 0.7 2.5 4.4 25South Sumatra 1,378 2,773 3,444 4,621 2.3 2.2 3.3 33Riau 493 1,235 1,642 2,163 3.0 2.9 3.1 17Jambi 245 744 1,006 1,440 3.6 3.1 4.1 22West Sumatra 1,910 2,319 2,793 3,402 0.6 1.9 2.2 56North Sumatra 2,541 4,969 6,623 8,357 2.2 2.9 2.6 94Aceh 1,003 1,629 2,009 2,608 1.6 2.1 2.9 36
Kalimantan 2,169 4,102 5,153 6,721 2.1 2.3 3.0 10West Kalimantan 802 1,581 2,020 2,483 2.2 2.5 2.3 14Central Kalimantan 203 497 700 950 2.9 3.5 3.5 5South Kalimantan 836 1,473 1,699 2,069 1.8 1.4 2.2 45East Kalimantan 329 551 734 1,219 1.7 2.9 5.8 4
Sulawesi 4 7,079 8,535 10,377 1.9 1.9 2.2 45Central Sulawesi 390 652 914 1,289 1.7 3.4 3.9 13North Sulawesi 748 1,351 1,718 2,091 1.9 2.4 2.2 90South Sulawesi 2,657 4,517 5,189 6,054 1.7 1.4 1.7 71Southeast Sulawesi 436 559 714 943 0.8 2.5 3.1 26
Bali 1,101 1,783 2,210 2,470 1.6 1.8 1.7 381West Nusa Tenggara 1,016 1,808 2,202 2,724 1.9 2.0 2.4 109East Nusa Tenggara 1,343 1,967 2,295 2,722 1.2 1.6 1.9 48Maluku 579 790 1,089 1,407 1.0 3.3 2.9 15Irian Jaya 179 758 923 1,146 4.8 2.0 2.4 2
East Timor n.a. n.a. n.a. 553 n.a. n.a. n.a. n.a.
Total Indonesia 60,593 97,019 119,233 147,383 1.5 2.1 2.0 63
n.a. = not available.
/a Includes adjustment for the exclusion of rural Irian Jaya.
Sources: Population Census Reports, 1961 and 1971, Preliminary Results, 1980 Census; and StatisticalPocketbook 1979/80.
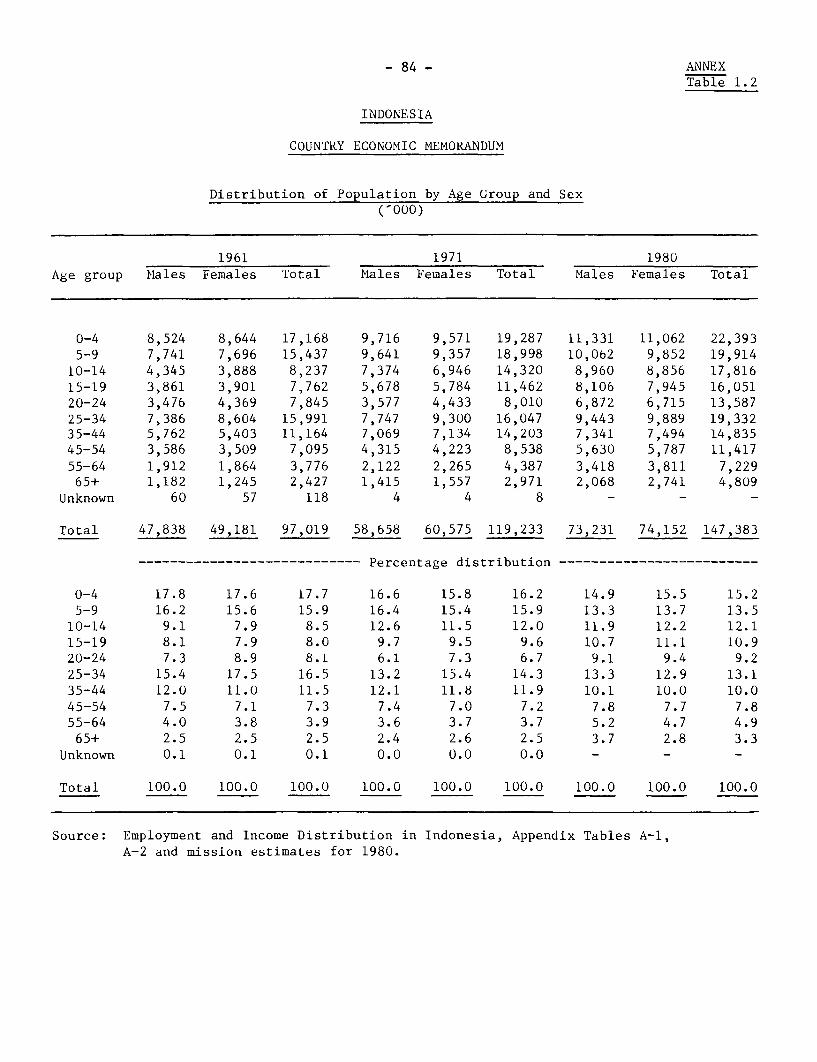
- 84 - ANNEXTable 1.2
INDONESIA
COUNTRY ECONOMIC MEMORANDUM
Distribution of Population by Age Group and Sex(-000)
1961 1971 1980Age group Males Females Total Males Females Total Males Females Total
0-4 8,524 8,644 17,168 9,716 9,571 19,287 11,331 11,062 22,3935-9 7,741 7,696 15,437 9,641 9,357 18,998 10,062 9,852 19,91410-14 4,345 3,888 8,237 7,374 6,946 14,320 8,960 8,856 17,81615-19 3,861 3,901 7,762 5,678 5,784 11,462 8,106 7,945 16,05120-24 3,476 4,369 7,845 3,577 4,433 8,010 6,872 6,715 13,58725-34 7,386 8,604 15,991 7,747 9,300 16,047 9,443 9,889 19,33235-44 5,762 5,403 11,164 7,069 7,134 14,203 7,341 7,494 14,83545-54 3,586 3,509 7,095 4,315 4,223 8,538 5,630 5,787 11,41755-64 1,912 1,864 3,776 2,122 2,265 4,387 3,418 3,811 7,22965+ 1,182 1,245 2,427 1,415 1,557 2,971 2,068 2,741 4,809
Unknown 60 57 118 4 4 8 - - -
Total 47,838 49,181 97,019 58,658 60,575 119,233 73,231 74,152 147,383
---------------------------- Percentage distribution -------------------------
0-4 17.8 17.6 17.7 16.6 15.8 16.2 14.9 15.5 15.25-9 16.2 15.6 15.9 16.4 15.4 15.9 13.3 13.7 13.5
10-14 9.1 7.9 8.5 12.6 11.5 12.0 11.9 12.2 12.115-19 8.1 7.9 8.0 9.7 9.5 9.6 10.7 11.1 10.920-24 7.3 8.9 8.1 6.1 7.3 6.7 9.1 9.4 9.225-34 15.4 17.5 16.5 13.2 15.4 14.3 13.3 12.9 13.135-44 12.0 11.0 11.5 12.1 11.8 11.9 10.1 10.0 10.045-54 7.5 7.1 7.3 7.4 7.0 7.2 7.8 7.7 7.855-64 4.0 3.8 3.9 3.6 3.7 3.7 5.2 4.7 4.965+ 2.5 2.5 2.5 2.4 2.6 2.5 3.7 2.8 3.3
Unknown 0.1 0.1 0.1 0.0 0.0 0.0 - - -
Total 100.0 100.0 100.0 100.0 100.0 100.0 100.0 100.0 100.0
Source: Employment and Income Distribution in Indonesia, Appendix Tables A-1,A-2 and mission estimates for 1980.
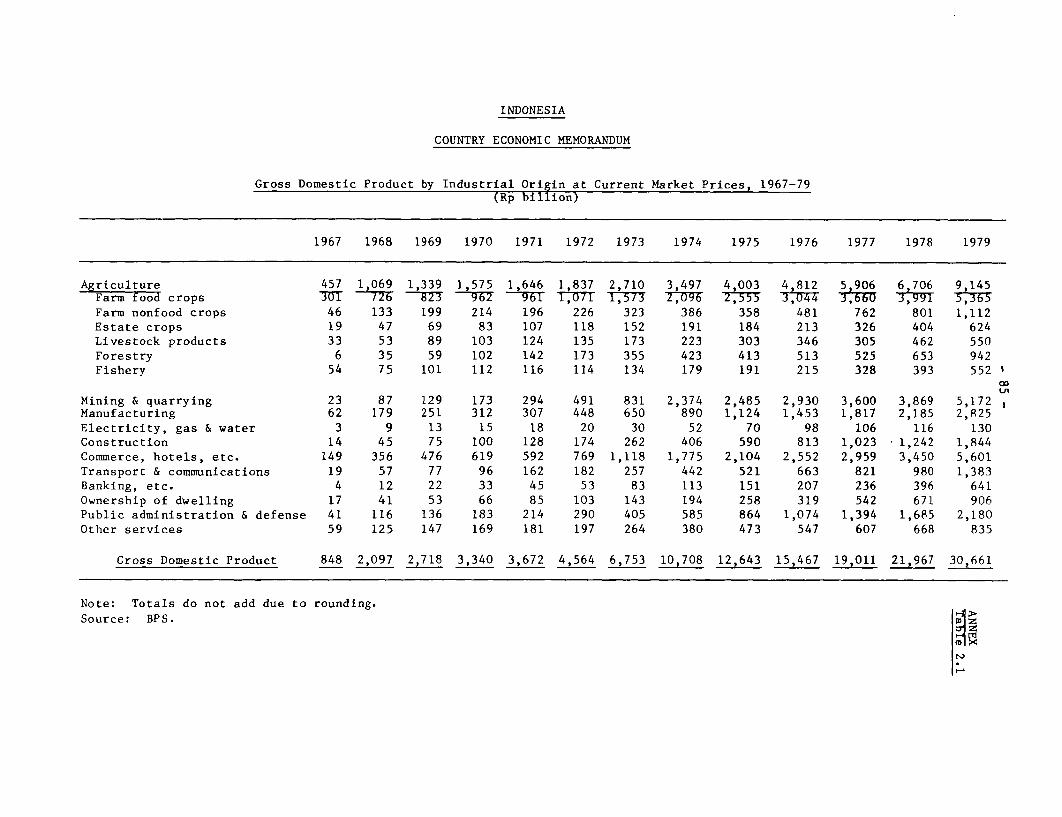
INDONESIA
COUNTRY ECONOMIC MEMORANDUM
Gross Domestic Product by Industrial Origin at Current Market Prices, 1967-79(Rp billion)
1967 1968 1969 1970 1971 1972 1973 1974 1975 1976 1977 1978 1979
Agriculture 457 1,069 1,339 1,575 1,646 1,837 2,710 3 497 4,003 4,812 5,906 6 706 9,145Farm tood crops =UT -- 8-23 -7 6T -7T 1571 0 21753 37,4T 37,660 T99 3 Farm nonfood crops 46 133 199 214 196 226 323 386 358 481 762 801 1,112Estate crops 19 47 69 83 107 118 152 191 184 213 326 404 624Livestock products 33 53 89 103 124 135 173 223 303 346 305 462 550Forestry 6 35 59 102 142 173 355 423 413 513 525 653 942Fishery 54 75 101 112 116 114 134 179 191 215 328 393 552 1
00Lfl
Mining & quarrying 23 87 129 173 294 491 831 2,374 2,485 2,930 3,600 3,869 5,172Manufacturing 62 179 251 312 307 448 650 890 1,124 1,453 1,817 2,185 2,R25Electricity, gas & water 3 9 13 15 18 20 30 52 70 98 106 116 130Construction 14 45 75 100 128 174 262 406 590 813 1,023 1,242 1,844Commerce, hotels, etc. 149 356 476 619 592 769 1,118 1,775 2,104 2,552 2,959 3,450 5,601Transport & communications 19 57 77 96 162 182 257 442 521 663 821 980 1,383Banking, etc. 4 12 22 33 45 53 83 113 151 207 236 396 641Ownership of dwelling 17 41 53 66 85 103 143 194 258 319 542 671 906Public administration & defense 41 116 136 183 214 290 405 585 864 1,074 1,394 1,685 2,180Other services 59 125 147 169 181 197 264 380 473 547 607 668 835
Gross Domestic Product 848 2,097 2,718 3,340 3,672 4,564 6,753 10,708 12,643 15,467 19,011 21,967 30,661
Note: Totals do not add due to rounding.Source: BPS.
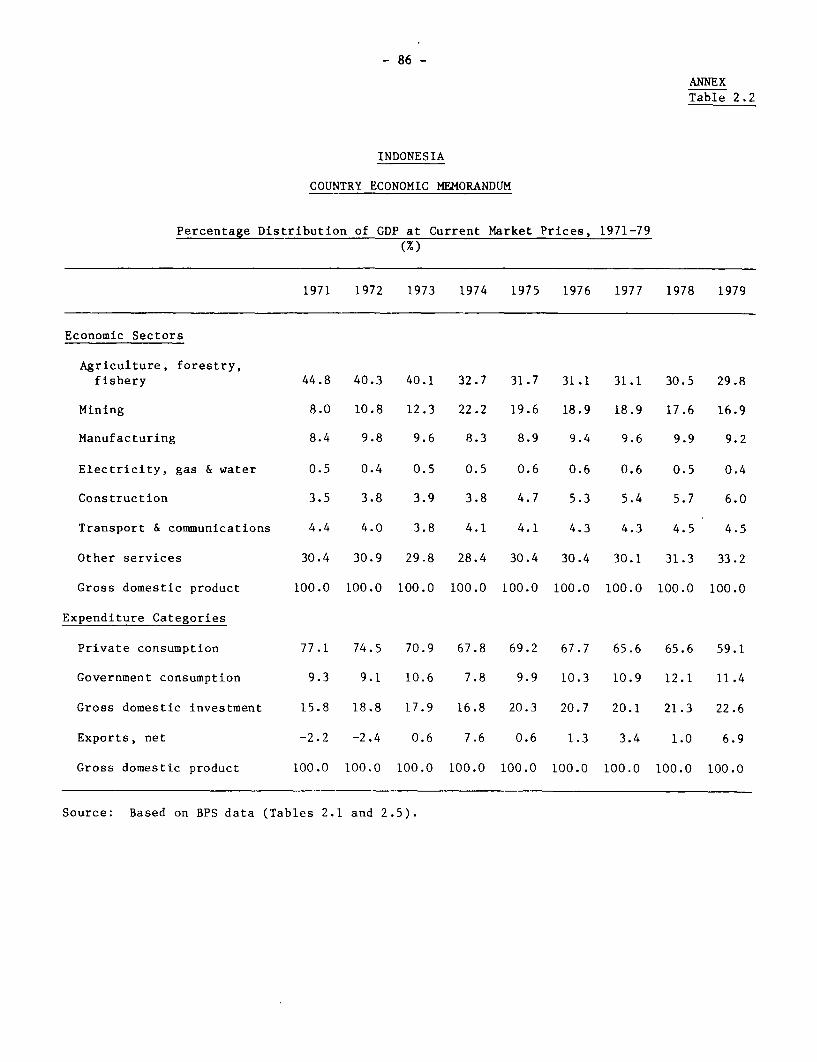
- 86 -
ANNEX
Table 2.2
INDONESIA
COUNTRY ECONOMIC MEMORANDUM
Percentage Distribution of GDP at Current Market Prices, 1971-79
(%)
1971 1972 1973 1974 1975 1976 1977 1978 1979
Economic Sectors
Agriculture, forestry,fishery 44.8 40.3 40.1 32.7 31.7 31.1 31.1 30.5 29.8
Mining 8.0 10.8 12.3 22.2 19.6 18.9 18.9 17.6 16.9
Manufacturing 8.4 9.8 9.6 8.3 8.9 9.4 9.6 9.9 9.2
Electricity, gas & water 0.5 0.4 0.5 0.5 0.6 0.6 0.6 0.5 0.4
Construction 3.5 3.8 3.9 3.8 4.7 5.3 5.4 5.7 6.0
Transport & communications 4.4 4.0 3.8 4.1 4.1 4.3 4.3 4.5 4.5
Other services 30.4 30.9 29.8 28.4 30.4 30.4 30.1 31.3 33.2
Gross domestic product 100.0 100.0 100.0 100.0 100.0 100.0 100.0 100.0 100.0
Expenditure Categories
Private consumption 77.1 74.5 70.9 67.8 69.2 67.7 65.6 65.6 59.1
Government consumption 9.3 9.1 10.6 7.8 9.9 10.3 10.9 12.1 11.4
Gross domestic investment 15.8 18.8 17.9 16.8 20.3 20.7 20.1 21.3 22.6
Exports, net -2.2 -2.4 0.6 7.6 0.6 1.3 3.4 1.0 6.9
Gross domestic product 100.0 100.0 100.0 100.0 100.0 100.0 100.0 100.0 100.0
Source: Based on BPS data (Tables 2.1 and 2.5).
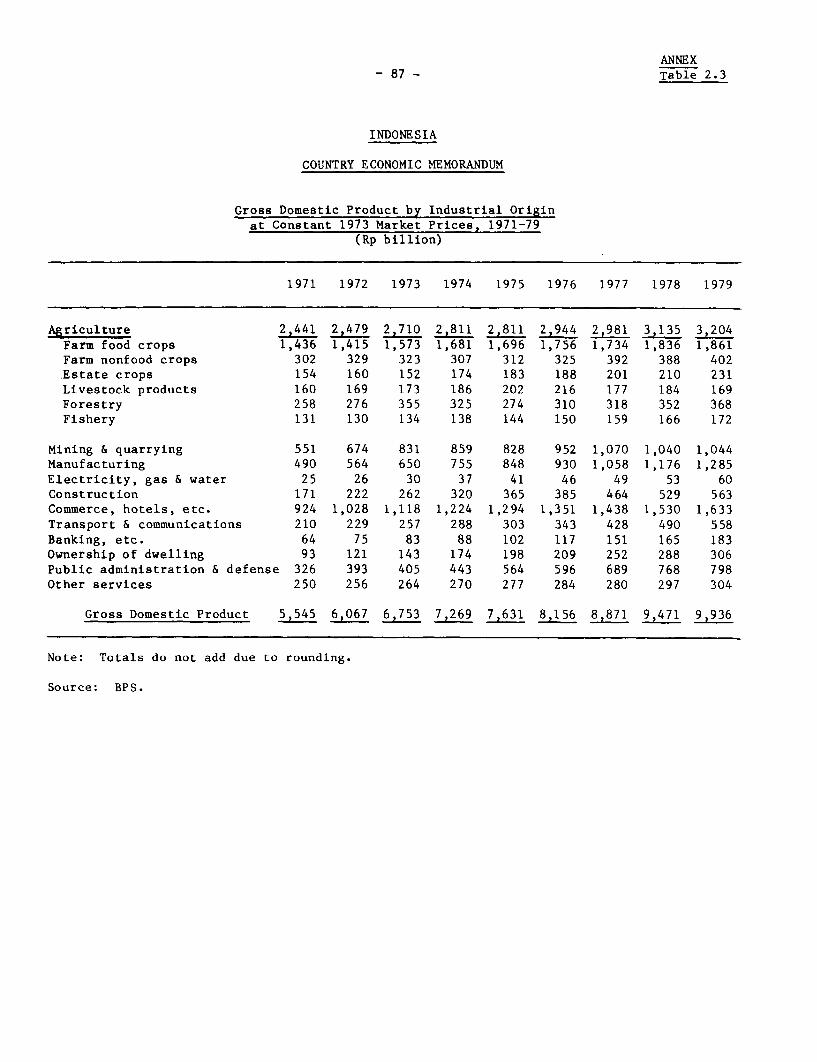
ANNEX- 87 - Table 2.3
INDONESIA
COUNTRY ECONOMIC MEMORANDUM
Gross Domestic Product by Industrial Originat Constant 1973 Market Prices, 1971-79
(Rp billion)
1971 1972 1973 1974 1975 1976 1977 1978 1979
Agriculture 2,479 2710 2,811 2,81 1 2,944 2,981 3,135 3,204Farm food crops 1,436 1,415 1,573 1,681 1,696 1,756 1,734 1,836 1,861Farm nonfood crops 302 329 323 307 312 325 392 388 402Estate crops 154 160 152 174 183 188 201 210 231Livestock products 160 169 173 186 202 216 177 184 169Forestry 258 276 355 325 274 310 318 352 368Fishery 131 130 134 138 144 150 159 166 172
Mining & quarrying 551 674 831 859 828 952 1,070 1,040 1,044Manufacturing 490 564 650 755 848 930 1,058 1,176 1,285Electricity, gas & water 25 26 30 37 41 46 49 53 60Construction 171 222 262 320 365 385 464 529 563Commerce, hotels, etc. 924 1,028 1,118 1,224 1,294 1,351 1,438 1,530 1,633Transport & communications 210 229 257 288 303 343 428 490 558Banking, etc. 64 75 83 88 102 117 151 165 183Ownership of dwelling 93 121 143 174 198 209 252 288 306Public administration & defense 326 393 405 443 564 596 689 768 798Other services 250 256 264 270 277 284 280 297 304
Gross Domestic Product 5,545 6,067 6,753 7,269 7,631 8,156 8,871 9,471 9,936
Note: Totals do not add due to rounding.
Source: BPS.
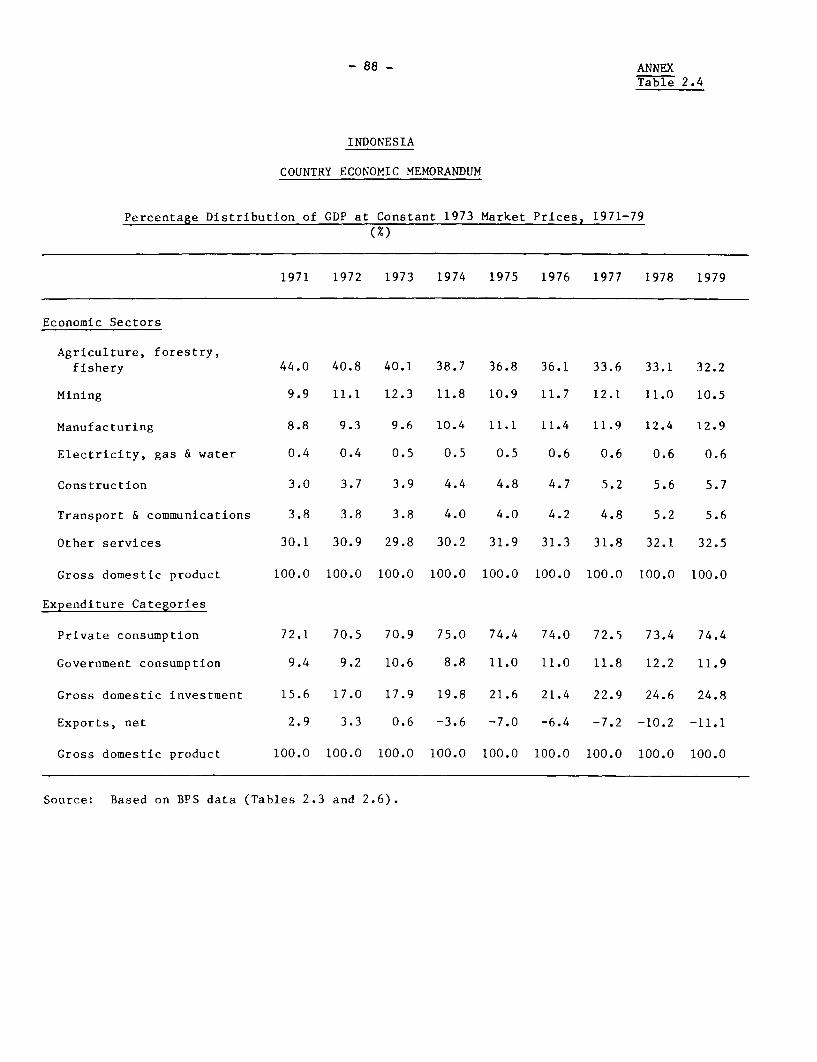
- 88 - ANNEXTable 2.4
INDONESIA
COUNTRY ECONOMIC MEMORANDUM
Percentage Distribution of GDP at Constant 1973 Market Prices, 1971-79
1971 1972 1973 1974 1975 1976 1977 1978 1979
Economic Sectors
Agriculture, forestry,fishery 44.0 40.8 40.1 38.7 36.8 36.1 33.6 33.1 32.2
Mining 9.9 11.1 12.3 11.8 10.9 11.7 12.1 11.0 10.5
Manufacturing 8.8 9.3 9.6 10.4 11.1 11.4 11.9 12.4 12.9
Electricity, gas & water 0.4 0.4 0.5 0.5 0.5 0.6 0.6 0.6 0.6
Construction 3.0 3.7 3.9 4.4 4.8 4.7 5.2 5.6 5.7
Transport & communications 3.8 3.8 3.8 4.0 4.0 4.2 4.8 5.2 5.6
Other services 30.1 30.9 29.8 30.2 31.9 31.3 31.8 32.1 32.5
Gross domestic product 100.0 100.0 100.0 100.0 100.0 100.0 100.0 100.0 100.0
Expenditure Categories
Private consumption 72.1 70.5 70.9 75.0 74.4 74.0 72.5 73.4 74.4
Government consumption 9.4 9.2 10.6 8.8 11.0 11.0 11.8 12.2 11.9
Gross domestic investment 15.6 17.0 17.9 19.8 21.6 21.4 22.9 24.6 24.8
Exports, net 2.9 3.3 0.6 -3.6 -7.0 -6.4 -7.2 -10.2 -11.1
Gross domestic product 100.0 100.0 100.0 100.0 100.0 100.0 100.0 100.0 100.0
Source: Based on BPS data (Tables 2.3 and 2.6).
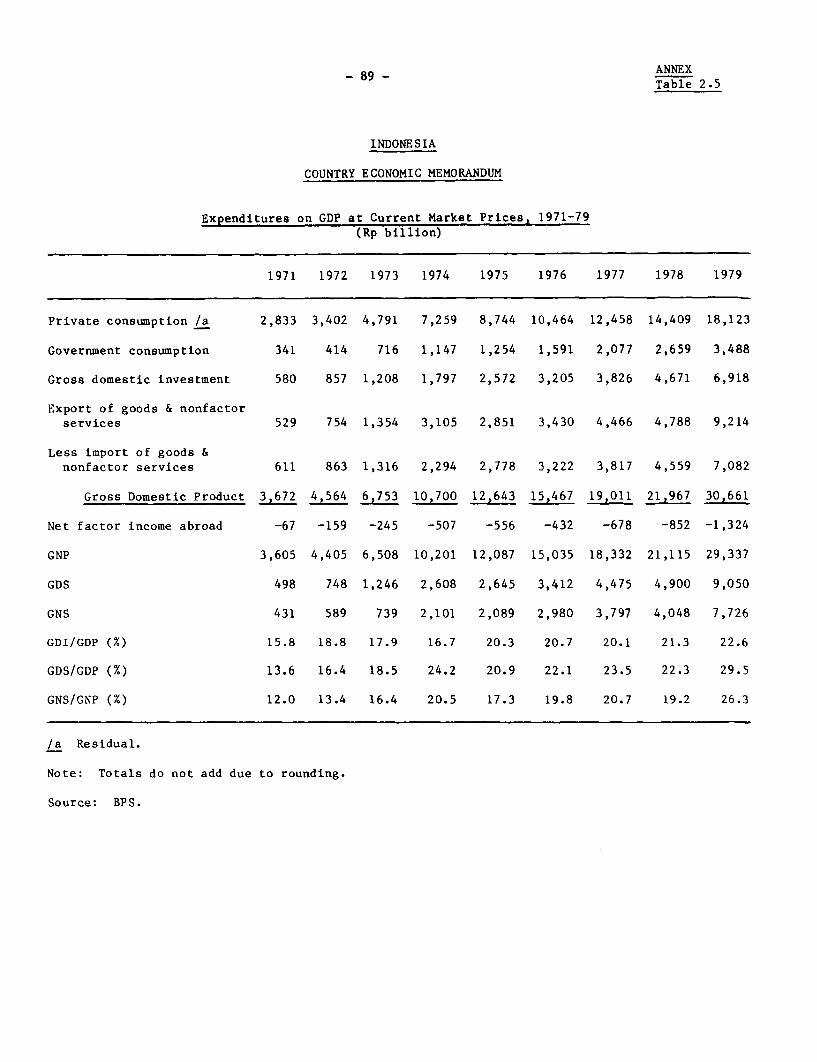
SQ 89 -ANNEX- 89 - Table 2.5
INDONESIA
COUNTRY ECONOMIC MEMORANDUM
Expenditures on GDP at Current Market Prices, 1971-79(Rp billion)
1971 1972 1973 1974 1975 1976 1977 1978 1979
Private consumption /a 2,833 3,402 4,791 7,259 8,744 10,464 12,458 14,409 18,123
Government consumption 341 414 716 1,147 1,254 1,591 2,077 2,659 3,488
Gross domestic investment 580 857 1,208 1,797 2,572 3,205 3,826 4,671 6,918
Export of goods & nonfactorservices 529 754 1,354 3,105 2,851 3,430 4,466 4,788 9,214
Less import of goods &nonfactor services 611 863 1,316 2,294 2,778 3,222 3,817 4,559 7,082
Gross Domestic Product 3,672 4,564 6,753 10,700 12,643 15,467 19,011 21,967 30,661
Net factor income abroad -67 -159 -245 -507 -556 -432 -678 -852 -1,324
GNP 3,605 4,405 6,508 10,201 12,087 15,035 18,332 21,115 29,337
GDS 498 748 1,246 2,608 2,645 3,412 4,475 4,900 9,050
GNS 431 589 739 2,101 2,089 2,980 3,797 4,048 7,726
GDI/GDP (%) 15.8 18.8 17.9 16.7 20.3 20.7 20.1 21.3 22.6
GDS/GDP (%) 13.6 16.4 18.5 24.2 20.9 22.1 23.5 22.3 29.5
GNS/GNP (%) 12.0 13.4 16.4 20.5 17.3 19.8 20.7 19.2 26.3
/a Residual.
Note: Totals do not add due to rounding.
Source: BPS.
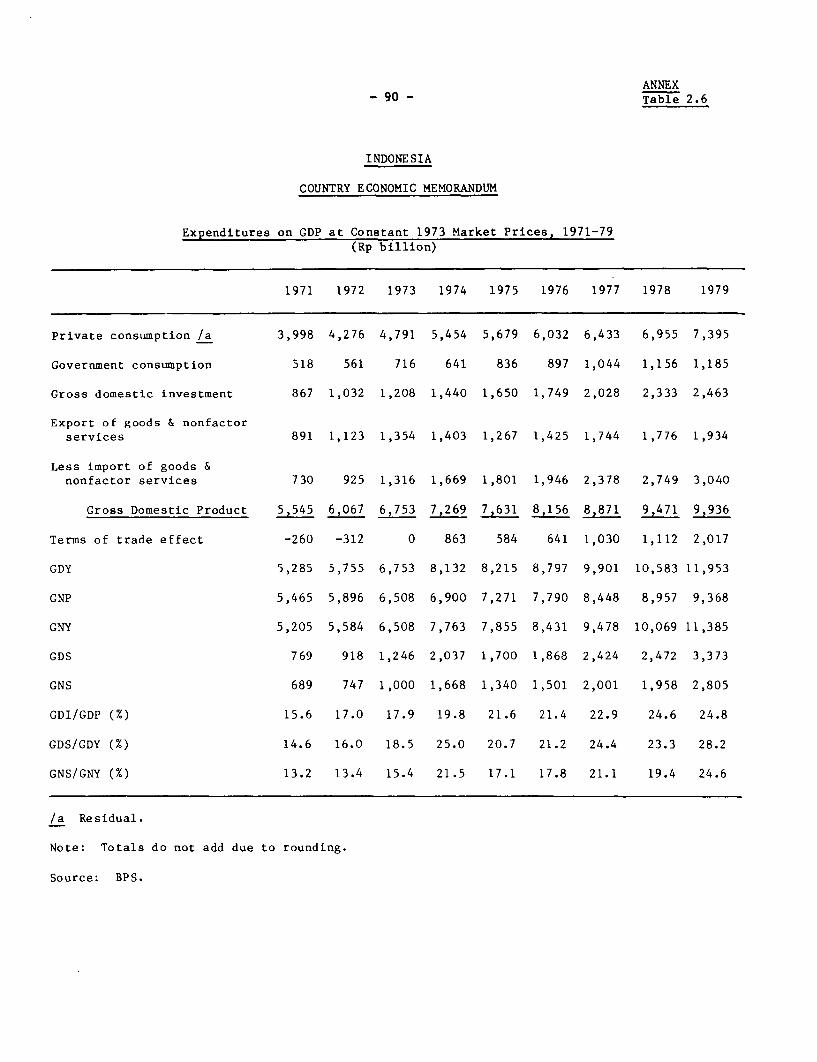
ANNEX-90 - Table 2.6
INDONESIA
COUNTRY ECONOMIC MEMORANDUM
Expenditures on GDP at Constant 1973 Market Prices, 1971-79(Rp billion)
1971 1972 1973 1974 1975 1976 1977 1978 1979
Private consumption /a 3,998 4,276 4,791 5,454 5,679 6,032 6,433 6,955 7,395
Government consumption 518 561 716 641 836 897 1,044 1,156 1,185
Gross domestic investment 867 1,032 1,208 1,440 1,650 1,749 2,028 2,333 2,463
Export of goods & nonfactorservices 891 1,123 1,354 1,403 1,267 1,425 1,744 1,776 1,934
Less import of goods &nonfactor services 730 925 1,316 1,669 1,801 1,946 2,378 2,749 3,040
Gross Domestic Product 5,545 6,067 6,753 7,269 7,631 8,156 8,871 9,471 9,936
Terms of trade effect -260 -312 0 863 584 641 1,030 1,112 2,017
GDY 5,285 5,755 6,753 8,132 8,215 8,797 9,901 10,583 11,953
GNP 5,465 5,896 6,508 6,900 7,271 7,790 8,448 8,957 9,368
GNY 5,205 5,584 6,508 7,763 7,855 8,431 9,478 10,069 11,385
GDS 769 918 1,246 2,037 1,700 1,868 2,424 2,472 3,373
GNS 689 747 1,000 1,668 1,340 1,501 2,001 1,958 2,805
GDI/GDP (%) 15.6 17.0 17.9 19.8 21.6 21.4 22.9 24.6 24.8
GDS/GDY (%) 14.6 16.0 18.5 25.0 20.7 21.2 24.4 23.3 28.2
GNS/GNY (%) 13.2 13.4 15.4 21.5 17.1 17.8 21.1 19.4 24.6
/a Residual.
Note: Totals do not add due to rounding.
Source: BPS.
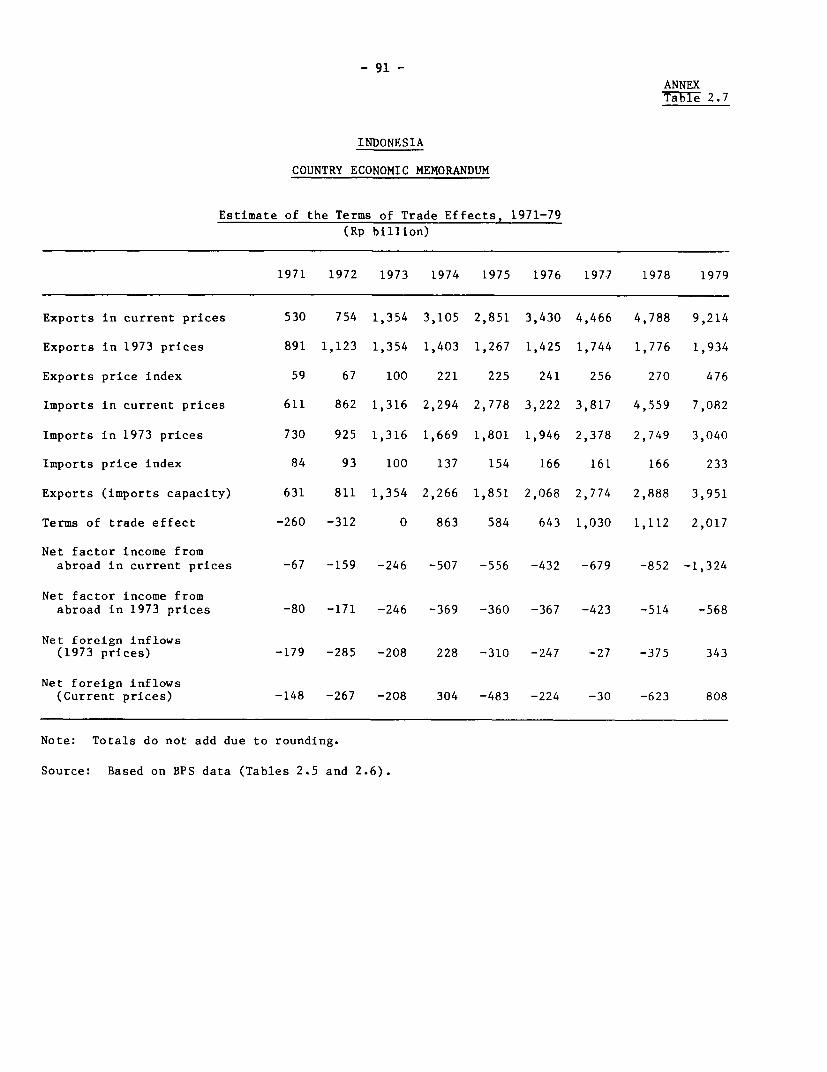
- 91 -
ANNEX5EaF7e 2.7
INDONESIA
COUNTRY ECONOMIC MEMORANDUM
Estimate of the Terms of Trade Effects, 1971-79
(Rp billion)
1971 1972 1973 1974 1975 1976 1977 1978 1979
Exports in current prices 530 754 1,354 3,105 2,851 3,430 4,466 4,788 9,214
Exports in 1973 prices 891 1,123 1,354 1,403 1,267 1,425 1,744 1,776 1,934
Exports price index 59 67 100 221 225 241 256 270 476
Imports in current prices 611 862 1,316 2,294 2,778 3,222 3,817 4,559 7,082
Imports in 1973 prices 730 925 1,316 1,669 1,801 1,946 2,378 2,749 3,040
Imports price index 84 93 100 137 154 166 161 166 233
Exports (imports capacity) 631 811 1,354 2,266 1,851 2,068 2,774 2,888 3,951
Terms of trade effect -260 -312 0 863 584 643 1,030 1,112 2,017
Net factor income fromabroad in current prices -67 -159 -246 -507 -556 -432 -679 -852 -1,324
Net factor income fromabroad in 1973 prices -80 -171 -246 -369 -360 -367 -423 -514 -568
Net foreign inflows(1973 prices) -179 -285 -208 228 -310 -247 -27 -375 343
Net foreign inflows(Current prices) -148 -267 -208 304 -483 -224 -30 -623 808
Note: Totals do not add due to rounding.
Source: Based on BPS data (Tables 2.5 and 2.6).
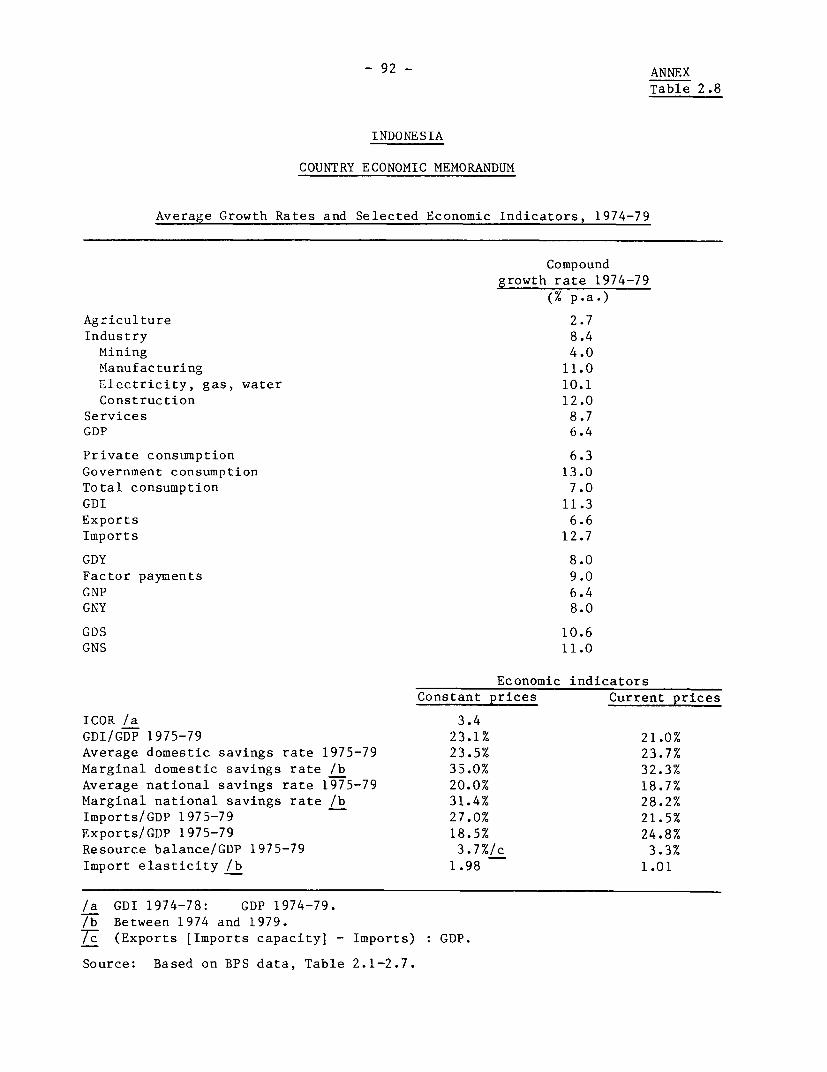
- 92 - ANNEX
Table 2.8
INDONESIA
COUNTRY ECONOMIC MEMORANDUM
Average Growth Rates and Selected Economic Indicators, 1974-79
Compoundgrowth rate 1974-79
(% p.a.)
Agriculture 2.7
Industry 8.4
Mining 4.0
Manufacturing 11.0
Electricity, gas, water 10.1Construction 12.0
Services 8.7GDP 6.4
Private consumption 6.3Government consumption 13.0
Total consumption 7.0
GDI 11.3Exports 6.6
Imports 12.7
GDY 8.0Factor payments 9.0
GNP 6.4GNY 8.0
GDS 10.6
GNS 11.0
Economic indicatorsConstant prices Current prices
ICOR /a 3.4GDI/GDP 1975-79 23.1% 21.0%
Average domestic savings rate 1975-79 23.5% 23.7%
Marginal domestic savings rate /b 35.0% 32.3%
Average national savings rate 1975-79 20.0% 18.7%Marginal national savings rate /b 31.4% 28.2%
Imports/GDP 1975-79 27.0% 21.5%
Exports/GDP 1975-79 18.5% 24.8%Resource balance/GDP 1975-79 3.7%/c 3.3%
Import elasticity /b 1.98 1.01
/a GDI 1974-78: GDP 1974-79.lb Between 1974 and 1979.7c (Exports [Imports capacity] - Imports) GDP.
Source: Based on BPS data, Table 2.1-2.7.
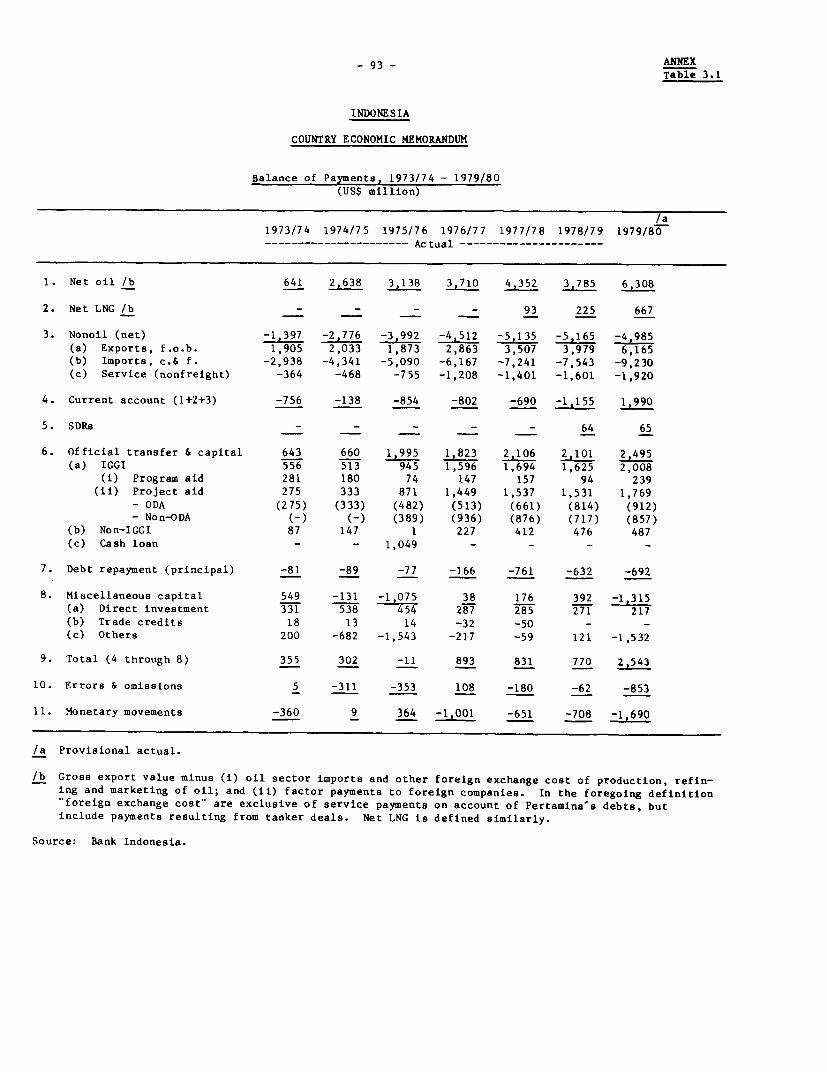
- 93 - ANNEXTable 3.1
INDONESIA
COUNTRY ECONOMIC MEMORANDUM
Balance of Payments, 1973/74 - 1979/80(US$ million)
/a1973/74 1974/75 1975/76 1976/77 1977/78 1978/79 1979/80---------------------- Actual ----------------------
1. Net oil /b 641 2,638 3,138 3,710 4,352 3,785 6,308
2. Net LNG /b - - - 93 225 667
3. Nonoil (net) -1,397 -2,776 -3,992 -4,512 -5,135 -5,165 -4,985
(a) Exports, f.o.b. 1,905 2,033 1,873 2,863 3,507 3,979 6,165
(b) Imports, c.& f. -2,938 -4,341 -5,090 -6,167 -7,241 -7,543 -9,230
(c) Service (nonfreight) -364 -468 -755 -1,208 -1,401 -1,601 -1,920
4. Current account (1+2+3) -756 -138 -854 -802 -690 -1,155 1,990
5. SDRs - - - - 64 65
6. Official transfer & capital 643 660 1,995 1,823 2,106 2,101 2,49
(a) IGGI 556 513 945 1,596 1,694 1,625 2,008
(i) Program aid 281 180 74 147 157 94 239
(ii) Project aid 275 333 871 1,449 1,537 1,531 1,769
- ODA (275) (333) (482) (513) (661) (814) (912)- Non-ODA (-) (-) (389) (936) (876) (717) (857)
(b) Non-IGGI 87 147 1 227 412 476 487(c) Cash loan - - 1,049 - - - -
7. Debt repayment (principal) -81 -89 -77 -166 -761 -632 -692
8. Miscellaneous capital 549 -131 -1,075 38 176 392 -1,315(a) Direct investment 331 538 454 287 285 271 217
(b) Trade credits 18 13 14 -32 -50 - -
(c) Others 200 -682 -1,543 -217 -59 121 -1,532
9. Total (4 through 8) 355 302 11 893 831 770 2,543
10. Errors & omissions 5 -311 -353 108 -180 -62 -853
11. Monetary movements -360 9 364 -1,001 -651 -708 -1,690
/a Provisional actual.
/b Gross export value minus (i) oil sector imports and other foreign exchange cost of production, refin-ing and marketing of oil; and (ii) factor payments to foreign companies. In the foregoing definition"foreign exchange cost" are exclusive of service payments on account of Pertamina's debts, but
include payments resulting from tanker deals. Net LNG is defined similarly.
Source: Bank Indonesia.
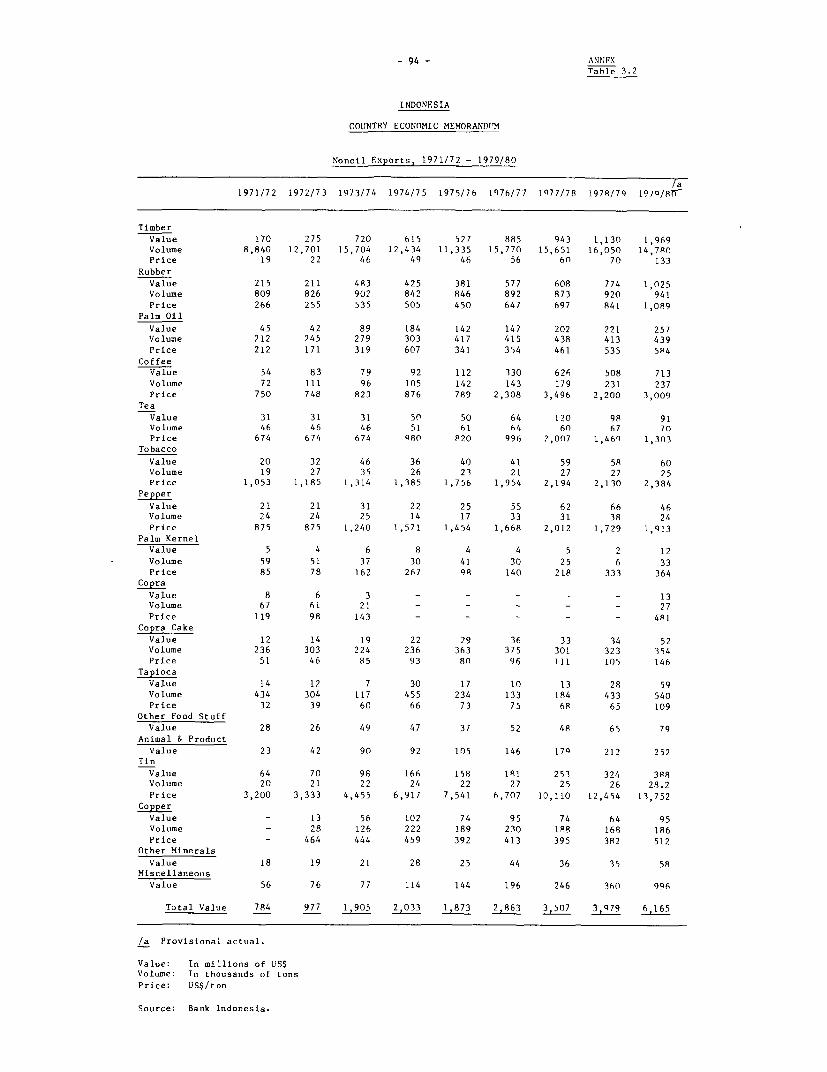
- 94 - AN?FXTahle 3.2
INDONESIA
COUNTRY ECONOMIC MEMORANDUM
Nonoil Exports, 1971/72 - 1979/80
_ la
1971/72 1972/73 1973/74 1974/75 1975/76 1976/77 1077/78 1978/79 1970/8T-
Timber
Value 170 275 720 615 527 885 943 1,130 1,969
Volume 8,840 12,701 15,704 12,434 11,335 15,770 15,651 16,050 14,78O
Price 19 22 46 49 46 56 60 70 133
Rubber
Value 215 211 483 425 381 577 608 774 1,025
Volume 809 826 902 842 846 892 873 920 941
Price 266 255 535 505 450 647 697 841 1,089
Palm Oil
Value 45 42 89 184 142 147 202 221 257
Volume 212 245 279 303 417 415 438 413 439
Price 212 171 319 607 341 354 461 535 594
CoffeeValue 54 83 79 92 112 330 626 508 713
Volume 72 111 96 105 142 143 179 231 237
Price 750 748 823 876 789 2,308 3,496 2,200 3,009
Tea
Value 31 31 31 50 50 64 120 98 91
Volume 46 46 46 51 61 64 60 67 70
Price 674 674 674 980 820 996 2,007 l,46q 1,303
Tobacco
Value 20 32 46 36 40 41 59 58 60
Volume 19 27 35 26 21 21 27 27 25
Price 1,053 1,185 1,314 1,385 1,756 1,954 2,194 2,130 2,384
Pepper
Value 21 21 31 22 25 55 62 66 46
Volume 24 24 25 14 17 33 31 38 24
Price 875 875 1,240 1,571 1,454 1,668 2,012 1,729 1,913
Palm Kernel
Value 5 4 6 8 4 4 5 2 12
Volume 59 51 37 30 41 30 25 6 33
Price 85 78 162 267 98 140 218 333 364
Copra
Value 8 6 3 - - - - - 13
Volume 67 61 21 - - - - - 27Price 119 98 143 - - - - - 48I
Copra Cake
Value 12 14 19 22 29 36 33 34 52
Volume 236 303 224 236 363 375 301 323 354
Price 51 46 85 93 80 96 111 105 146
Tapioca
Value 14 12 7 30 17 10 13 28 59
Volume 434 304 117 455 234 133 184 433 540
Price 32 39 60 66 73 75 68 65 109
Other Food Stuff
Value 28 26 49 47 37 52 48 65 79
Animal & Product
Value 23 42 90 92 105 146 17Q 212 252
Tin
Value 64 70 98 166 158 181 253 324 3R8
Volume 20 21 22 24 22 27 25 26 28.2
Price 3,200 3,333 4,455 6,917 7,541 6,707 10,110 12,454 11,752
Copper
Value - 13 56 102 74 95 74 64 95
Volume - 28 126 222 189 230 188 168 186
Price - 464 444 459 392 413 395 3R2 512
Other Minerals
Value 18 19 21 28 25 44 36 35 58
Miscellaneous
Value 56 76 77 114 144 196 246 360 996
Total Value 784 977 1,905 20 1,873 2,863 3,507 3,979 6
/a Provisional actual.
Value: In millions of US$Volume: In thousands of tons
Price: US$/ton
Source: Bank Indonesia.
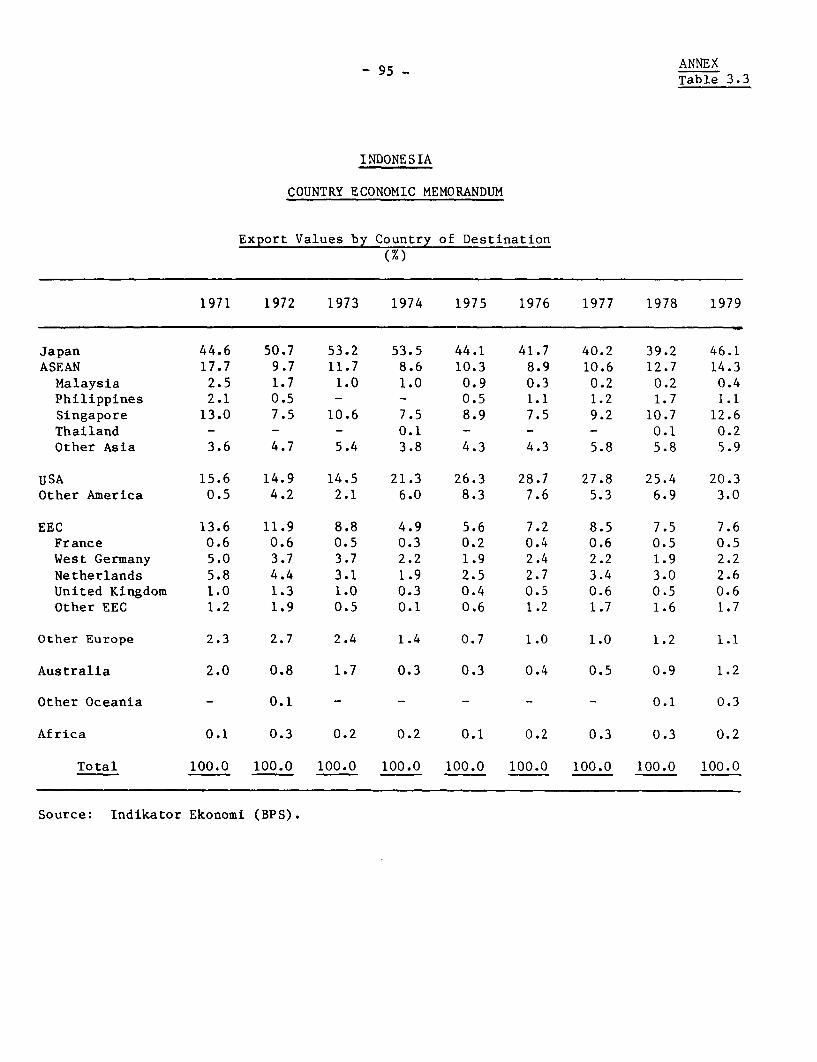
_ 95 ANNEXTable 3.3
INDONESIA
COUNTRY ECONOMIC MEMORANDUM
Export Values by Country of Destination
(%)
1971 1972 1973 1974 1975 1976 1977 1978 1979
Japan 44.6 50.7 53.2 53.5 44.1 41.7 40.2 39.2 46.1ASEAN 17.7 9.7 11.7 8.6 10.3 8.9 10.6 12.7 14.3Malaysia 2.5 1.7 1.0 1.0 0.9 0.3 0.2 0.2 0.4Philippines 2.1 0.5 - - 0.5 1.1 1.2 1.7 1.1
Singapore 13.0 7.5 10.6 7.5 8.9 7.5 9.2 10.7 12.6Thailand - - - 0.1 - - - 0.1 0.2
Other Asia 3.6 4.7 5.4 3.8 4.3 4.3 5.8 5.8 5.9
USA 15.6 14.9 14.5 21.3 26.3 28.7 27.8 25.4 20.3Other America 0.5 4.2 2.1 6.0 8.3 7.6 5.3 6.9 3.0
EEC 13.6 11.9 8.8 4.9 5.6 7.2 8.5 7.5 7.6France 0.6 0.6 0.5 0.3 0.2 0.4 0.6 0.5 0.5West Germany 5.0 3.7 3.7 2.2 1.9 2.4 2.2 1.9 2.2Netherlands 5.8 4.4 3.1 1.9 2.5 2.7 3.4 3.0 2.6United Kingdom 1.0 1.3 1.0 0.3 0.4 0.5 0.6 0.5 0.6Other EEC 1.2 1.9 0.5 0.1 0.6 1.2 1.7 1.6 1.7
Other Europe 2.3 2.7 2.4 1.4 0.7 1.0 1.0 1.2 1.1
Australia 2.0 0.8 1.7 0.3 0.3 0.4 0.5 0.9 1.2
Other Oceania - 0.1 - - - - - 0.1 0.3
Africa 0.1 0.3 0.2 0.2 0.1 0.2 0.3 0.3 0.2
Total 100.0 100.0 100.0 100.0 100.0 100.0 100.0 100.0 100.0
Source: Indikator Ekonomi (BPS).
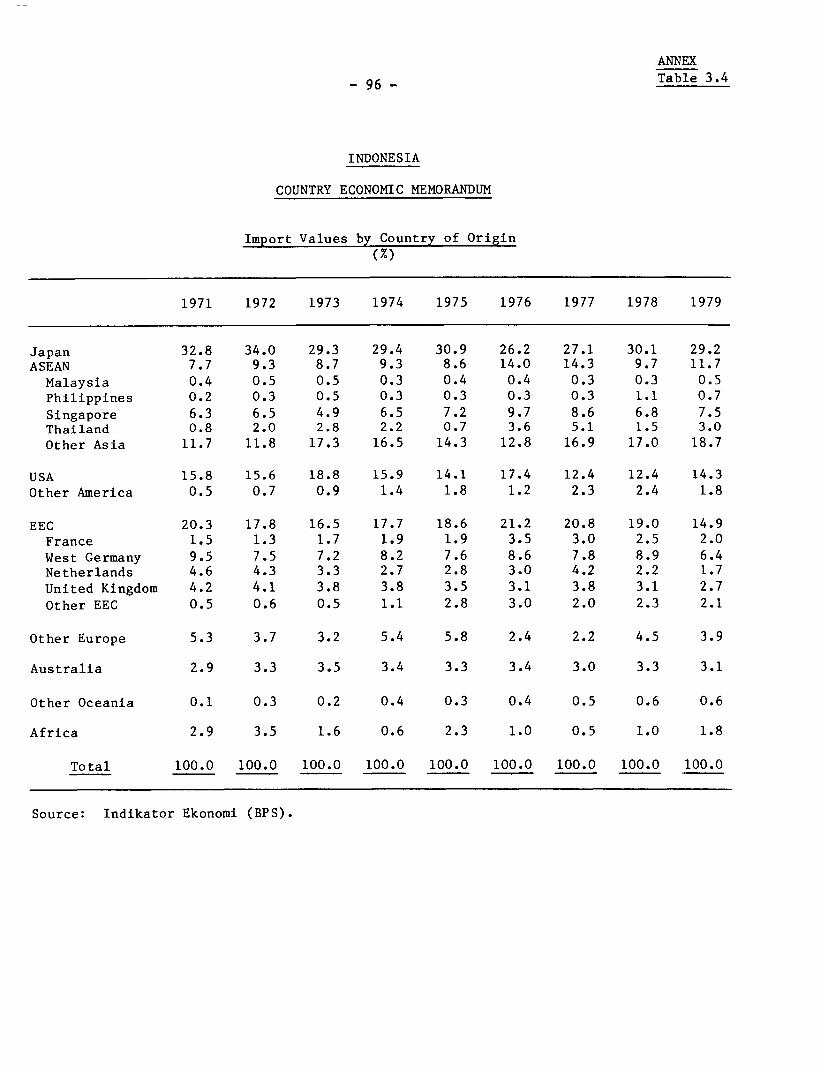
ANNEX
- 96 - Table 3.4
INDONESIA
COUNTRY ECONOMIC MEMORANDUM
Import Values by Country of Origin
1971 1972 1973 1974 1975 1976 1977 1978 1979
Japan 32.8 34.0 29.3 29.4 30.9 26.2 27.1 30.1 29.2ASEAN 7.7 9.3 8.7 9.3 8.6 14.0 14.3 9.7 11.7Malaysia 0.4 0.5 0.5 0.3 0.4 0.4 0.3 0.3 0.5Philippines 0.2 0.3 0.5 0.3 0.3 0.3 0.3 1.1 0.7Singapore 6.3 6.5 4.9 6.5 7.2 9.7 8.6 6.8 7.5Thailand 0.8 2.0 2.8 2.2 0.7 3.6 5.1 1.5 3.0Other Asia 11.7 11.8 17.3 16.5 14.3 12.8 16.9 17.0 18.7
USA 15.8 15.6 18.8 15.9 14.1 17.4 12.4 12.4 14.3Other America 0.5 0.7 0.9 1.4 1.8 1.2 2.3 2.4 1.8
EEC 20.3 17.8 16.5 17.7 18.6 21.2 20.8 19.0 14.9France 1.5 1.3 1.7 1.9 1.9 3.5 3.0 2.5 2.0West Germany 9.5 7.5 7.2 8.2 7.6 8.6 7.8 8.9 6.4Netherlands 4.6 4.3 3.3 2.7 2.8 3.0 4.2 2.2 1.7United Kingdom 4.2 4.1 3.8 3.8 3.5 3.1 3.8 3.1 2.7Other EEC 0.5 0.6 0.5 1.1 2.8 3.0 2.0 2.3 2.1
Other Europe 5.3 3.7 3.2 5.4 5.8 2.4 2.2 4.5 3.9
Australia 2.9 3.3 3.5 3.4 3.3 3.4 3.0 3.3 3.1
Other Oceania 0.1 0.3 0.2 0.4 0.3 0.4 0.5 0.6 0.6
Africa 2.9 3.5 1.6 0.6 2.3 1.0 0.5 1.0 1.8
Total 100.0 100.0 100.0 100.0 100.0 100.0 100.0 100.0 100.0
Source: Indikator Ekonomi (BPS).
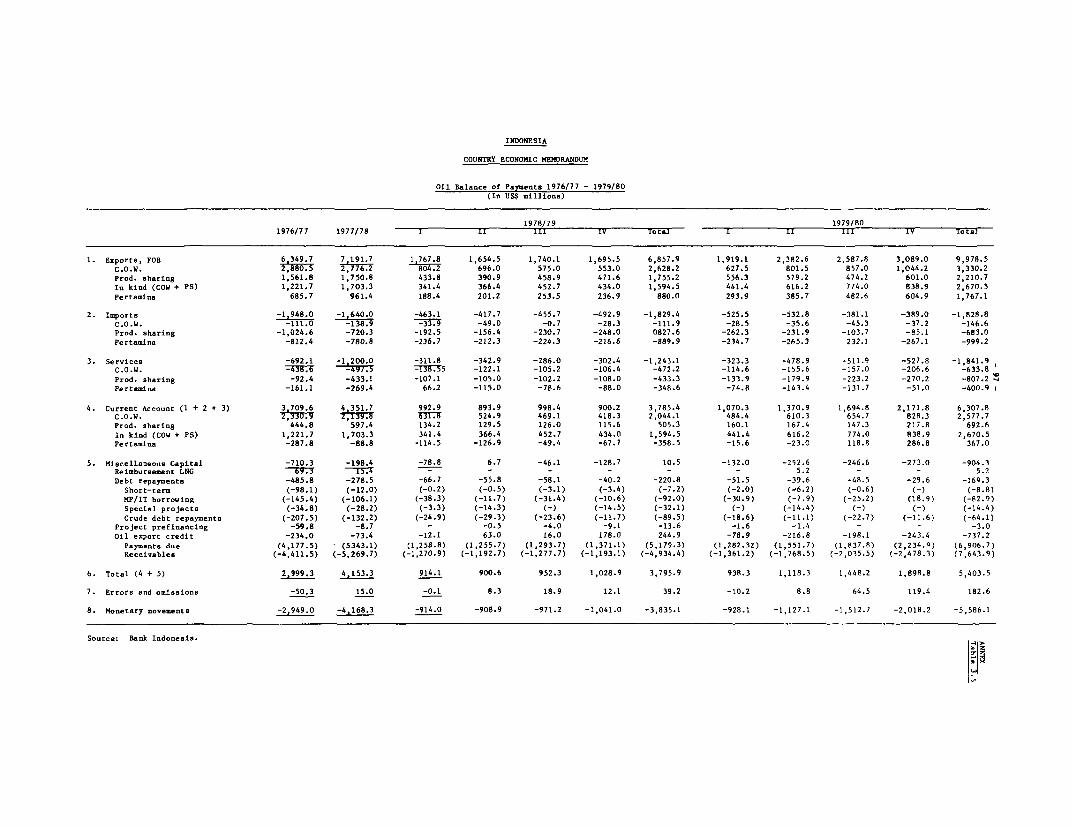
INDONESIA
COUNTRY ECONOMIC MEMORANDUM
Oil Balance of Payments 1976/77 - 1979/80(ln 11$ miEllions)
1918/79 1979/801976/77 1977/78 I II ILL IV Total II Iil0 IV Total
1. Exports, FOB 6,349.7 7,191.7 1,767.8 1,654.5 1,740.1 1,695.5 6,857.9 1,919.1 2,382.6 2,587.8 3,089.0 9,978.5C.O.W. 2,880.5 2,776.2 804.2 696.0 575.0 553.0 2,628.2 627.5 801.5 857.0 1,044.2 3,330.2Prod. sharing 1,561.8 1,750.8 433.8 390.9 458.9 471.6 1,755.2 556.3 579.2 474.2 601.0 2,210.7In kind (COW + PS) 1,221.7 1,703.3 341.4 366.4 452.7 434.0 1,594.5 441.4 616.2 774.0 838.9 2,670.5Pertamina 685.7 961.4 188.4 201.2 253.5 236.9 880.0 293.9 385.7 482.6 604.9 1,767.1
2. Imports -1,948.0 -1 640.0 -463.1 -417.7 -455.7 -492.9 -1,829.4 -525.5 -532.8 -381.1 -389.0 -1,828.8C.O.W. -111.0 -138.9 -3.9 -49.0 -0.7 -28.3 -111.9 -28.5 -35.6 -45.3 -37.2 -146.6Prod. sharing -1,024.6 -720.3 -192.5 -156.4 -230.7 -248.0 0827.6 -262.3 -231.9 -103.7 -85.1 -683.0Pertamina -812.4 -780.8 -236.7 -212.3 -224.3 -216.6 -889.9 -234.7 -265.3 232.1 -267.1 -999.2
3. Services -692.1 -1 200.0 -311.8 -342.9 -286.0 -302.4 -1,243.1 -323.3 -478.9 -511.9 -527.8 -1,841 9C.O.W. I3E -75 TB3 5 -122.1 -105.2 -106.4 -472.2 -114.6 -155.6 -157.0 -206.6 -633.8Prod. sharing -92.4 -433.1 -107.1 -105.0 -102.2 -108.0 -433.3 -133.9 -179.9 -223.2 -270.2 -807.2Pertamina -161.1 -269.4 66.2 -115.0 -78.6 -88.0 -348.6 -74.8 -143.4 -131.7 -51.0 -400.9
4. Current Account (1 + 2 + 3) 3,709.6 4,351.7 992.9 893.9 998.4 900.2 3,785.4 1,070.3 1,370.9 1,694.8 2.171.8 6,307.8C.O.W. ,13U3 zjT39. d 7;9 524.9 469.1 418.3 2,044.1 484.4 610.3 654.7 828.3 2,577.7Prod. sharing 444.8 597.4 134.2 129.5 126.0 115.6 505.3 160.1 167.4 147.3 217.8 692.6In kind (COW + PS) 1,221.7 1,703.3 341.4 366.4 452.7 434.0 1,594.5 441.4 616.2 774.0 838.9 2,670.5Pertamina -287.8 -88.8 -114.5 -126.9 -49.4 -67.7 -358.5 -15.6 -23.0 118.8 286.8 367.0
5. Miscellaneous Capital -710.3 -198.4 -78.8 6.7 -46.1 -128.7 10.5 -132.0 -252.6 -246.6 -273.0 -904.3Reimbursement LNG EiY" T57T - - - - - - 5.2 - - 5.2Debt repayments -485.8 -278.5 -66.7 -55.8 -58.1 -40.2 -220.8 -51.5 -39.6 -48.5 -29.6 -169.3
Short-term (-98.1) (-12.0) (-0.2) (-0.5) (-3.1) (-3.4) (-7.2) (-2.0) (-6.2) (-0.6) () (-8.8)MP/IT borrowing (-145.4) (-106.1) (-38.3) (-11.7) (-31.4) (-10.6) (-92.0) (-30.9) (-7.9) (-25.2) (18.9) (-82.9)Special projects (-34.8) (-28.2) (-3.3) (-14.3) (-) (-14.5) (-32.1) (-) (-14.4) (-) (i) (-14.4)Crude debt repayments (-207.5) (-132.2) (-24.9) (-29.3) (-23.6) (-11.7) (-89.5) (-18.6) (-11.1) (-22.7) (-11.6) (-64.1)
Project prefinancing -59.8 -8.7 - -0.5 -4.0 -9.1 -13.6 -1.6 -1.4 - - -3.0Oil export credit -234.0 -73.4 -12.1 63.0 16.0 178.0 244.9 -78.9 -216.8 -198.1 -243.4 -737.2
Payments due (4,177.5) (5343.1) (1,258.8) (1,255.7) (1,293.7) (1,371.1) (5,179.3) (1,282.3Z) (1,551.7) (1,F37.8) (2,234.Q) (6,906.7)Receivables (-4,411.5) (-5,269.7) (-1,270.9) (-1,192.7) (-1,277.7) (-1,193.1) (-4,934.4) (-1,361.2) (-1,768.5) (-2,035.5) (-2,478.3) (7,643.9)
6. Total (4 + 5) 2,999.3 4,153.3 914.1 900.6 952.3 1,028.9 3,795.9 938.3 1,118.3 1,448.2 1,898.8 5,403.5
7. Errors and omissions -50.3 15.0 -0.1 8.3 18.9 12.1 39.2 -10.2 8.8 64.5 119.4 182.6
8. Monetary movements -2,949.0 -4,168.3 -914.0 -908.9 -971.2 -1,041.0 -3,835.1 -928.1 -1,127.1 -1,512.7 -2,018.2 -5,586.1
Source: Bank Indonesia.
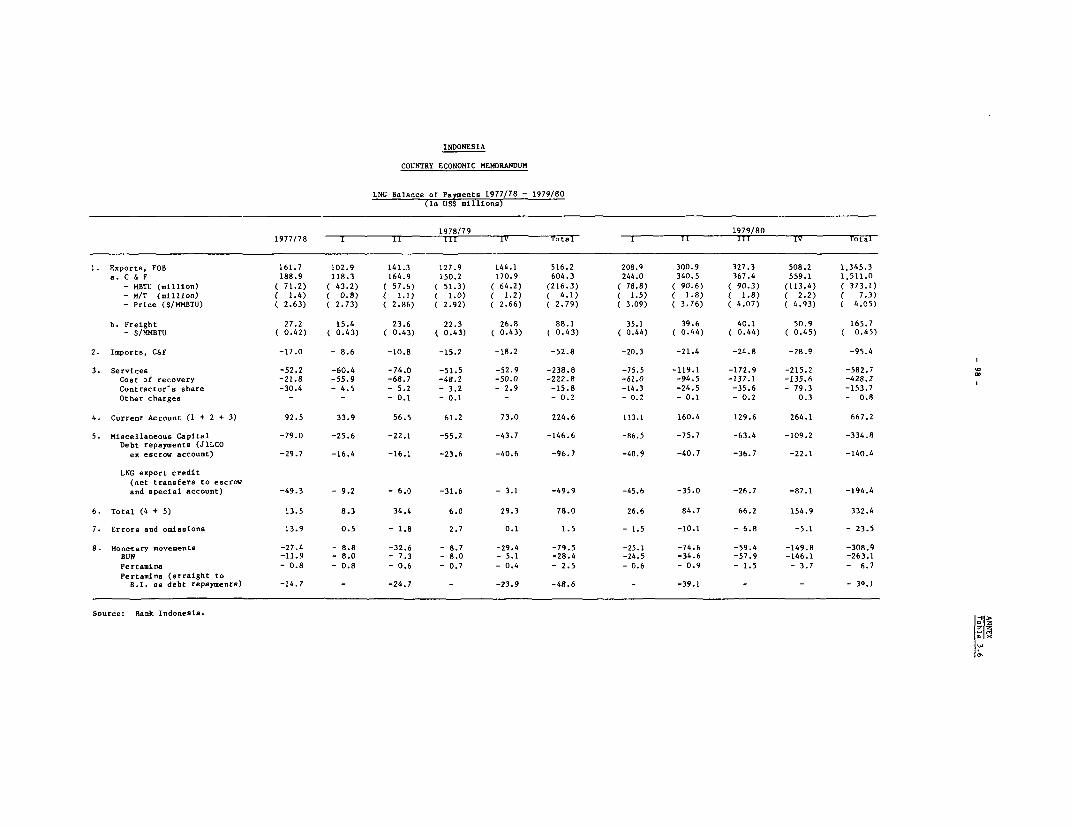
INDONESIA
COUNTRY ECONOMIC MEMORANDUM
LNG Balance of Payments 1977/78 - 1979/80(In US$ millions)
1978/79 1979/801977/78 1 II TIT IV Total I li III IV Total
1. Exports, FOB 161.7 102.9 141.3 127.9 144.1 516.2 208.9 300.9 327.3 508.2 1,345.3a. C 6 F 188.9 118.3 164.9 150.2 170.9 604.3 244.0 340.5 367.4 559.1 1,511.0- MBTU (million) ( 71.2) ( 43.2) ( 57.6) ( 51.3) ( 64.2) (216.3) ( 78.8) ( 90.6) ( 90.3) (113.4) ( 373.1)- M/T (million) ( 1.4) ( 0.8) ( 1.1) ( 1.0) ( 1.2) ( 4.1) ( 1.5) ( 1.8) ( 1.8) ( 2.2) ( 7.3)- Price ($/MMBTU) ( 2.63) ( 2.73) ( 2.86) ( 2.92) ( 2.66) ( 2.79) ( 3.09) ( 3.76) ( 4.07) ( 4.93) ( 4.05)
b. Freight 27.2 15.4 23.6 22.3 26.8 88.1 35.1 39.6 40.1 50.9 165.7- $/MMBTU ( 0.42) ( 0.43) ( 0.43) ( 0.43) ( 0.43) ( 0.43) ( 0.44) ( 0.44) ( 0.44) ( 0.45) ( 0.45)
2. Imports, C&F -17.0 - 8.6 -10.8 -15.2 -18.2 -52.8 -20.3 -21.4 -24.8 -28.9 -95.4
3. Services -52.2 -60.4 -74.0 -51.5 -52.9 -238.8 -75.5 -119.1 -172.9 -215.2 -582.7Cost of recovery -21.8 -55.9 -68.7 -48.2 -50.0 -222.8 -61.0 -94.5 -137.1 -135.6 -428.2Contractor's share -30.4 - 4.5 - 5.2 - 3.2 - 2.9 -15.8 -14.3 -24.5 -35.6 - 79.3 -153.7Other charges - - - 0.1 - 0.1 - - 0.2 - 0.2 - 0.1 - 0.2 0.3 - 0.8
4. Current Account (1 + 2 + 3) 92.5 33.9 56.5 61.2 73.0 224.6 113.1 160.4 129.6 264.1 667.2
5. Miscellaneous Capital -79.0 -25.6 -22.1 -55.2 -43.7 -146.6 -86.5 -75.7 -63.4 -109.2 -334.8Debt repayments (JILCO
ex escrow account) -29.7 -16.4 -16.1 -23.6 -40.6 -96.7 -40.9 -40.7 -36.7 -22.1 -140.4
LNG export credit(net transfers to escrowand special account) -49.3 - 9.2 - 6.0 -31.6 - 3.1 -49.9 -45.6 -35.0 -26.7 -87.1 -194.4
6. Total (4 + 5) 13.5 8.3 34.4 6.0 29.3 78.0 26.6 84.7 66.2 154.9 332.4
7. Errors and omissions 13.9 0.5 - 1.8 2.7 0.1 1.5 - 1.5 -10.1 - 6.8 -5.1 - 23.5
8. Monetary movements -27.4 - 8.8 -32.6 - 8.7 -29.4 -79.5 -25.1 -74.6 -59.4 -149.8 -308.9BUN -11.9 - 8.0 - 7.3 - 8.0 - 5.1 -28.4 -24.5 -34.6 -57.9 -146.1 -263.1Pertamina - 0.8 - 0.8 - 0.6 - 0.7 - 0.4 - 2.5 - 0.6 - 0.9 - 1.5 - 3.7 - 6.7Pertamina (straight to
B.I. as debt repayments) -14.7 - -24.7 - -23.9 -48.6 - -39.1 - - - 30.1
Source: Bank Indonesia.
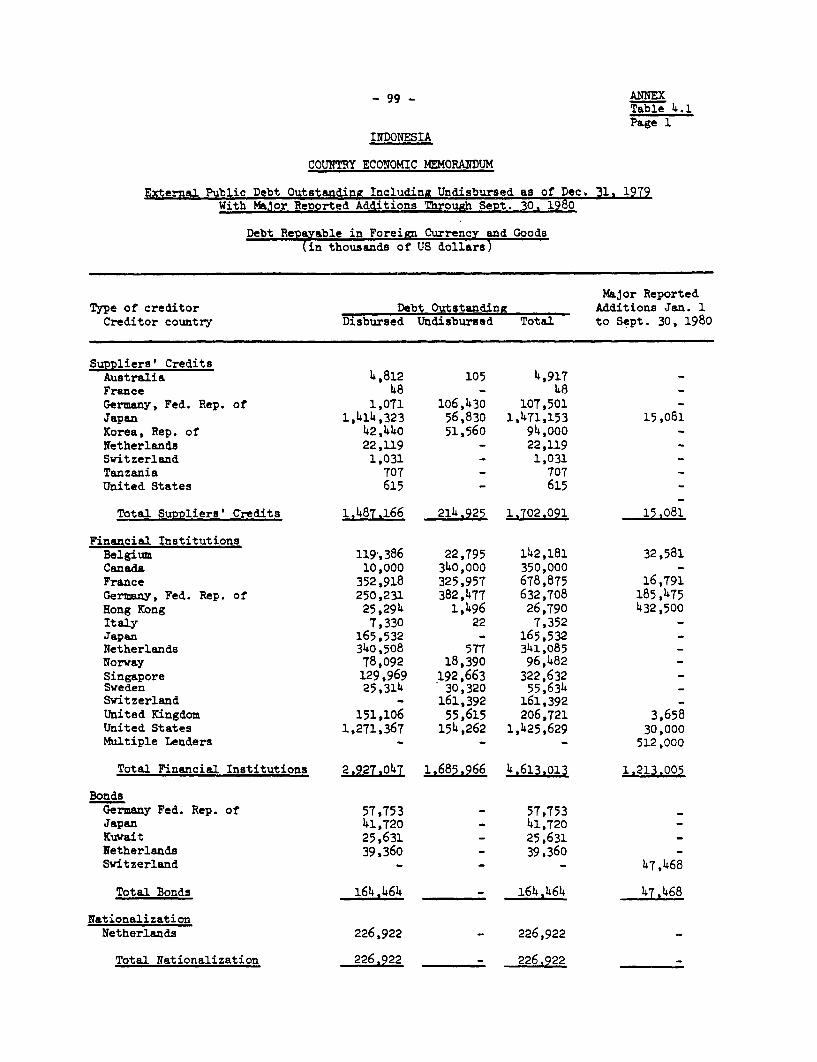
_ 99 - ANNETable 4.1Page 1
INDONESIA
COUNTRY ECONOMIC MEMORANDUM
External Public Debt Outstandinz Including Undisbursed as of Dec. 31. 1979With Malor Reported Additions Through SePt. 30. 1980
Debt Repayable in Foreign Currency and Goods(in thousands of US dollars)
Major ReportedType of creditor Debt OutstandinE Additions Jan. 1
Creditor country Disbursed Undisbursed Total to Sept. 30, 1980
Suppliers' CreditsAustralia 4,812 105 4,917France 48 - 48Germany, Fed. Rep. of 1,071 106,430 107,501 -Japan 1,414,323 56,830 1,471,153 15,081Korea, Rep. of 42,440 51,560 94,ooo 0Ietherlands 22,119 - 22,119 -Switzerland 1,031 - 1,031 -Tanzania 707 - 707 -United States 615 - 615
Total Suppliers' Credits 1,487.166 214.925 1,702.091 15,081
Financial InstitutionsBelgium 119,386 22,795 142,181 32,581Canada 10,000 340,000 350,000 -France 352,918 325,957 678,875 16,791Germany, Fed. Rep. of 250,231 382,477 632,708 185,475Hong Kong 25,294 1,496 26,790 432,500Italy 7,330 22 7,352 _Japan 165,532 - 165,532Netherlands 340,508 577 341,085Norway 78,092 18,390 96,482 -Singapore 129,969 192,663 322,632 -Sweden 25,314 30,320 55,634 _Svitzerland - 161,392 161,392 _United Kingdom 151,106 55,615 206,721 3,658United States 1,271,367 154,262 1,425,629 30,000Multiple Lenders - - - 512,000
Total Financial Institutions 2.927,047 1.685.966 4.613,013 1.213.005
BondsGermany Fed. Rep. of 57,753 - 57,753 -Japan 41,720 - 41,720 -Kuwait 25,631 - 25,631 -Netherlands 39,360 - 39,360 _Svitzerland - - - 47,468
Total Bonds 16446 - 164,464 47,468
NationalizationNetherlands 226,922 - 226,922
Total Nationalization 226.922 - 226,922 -
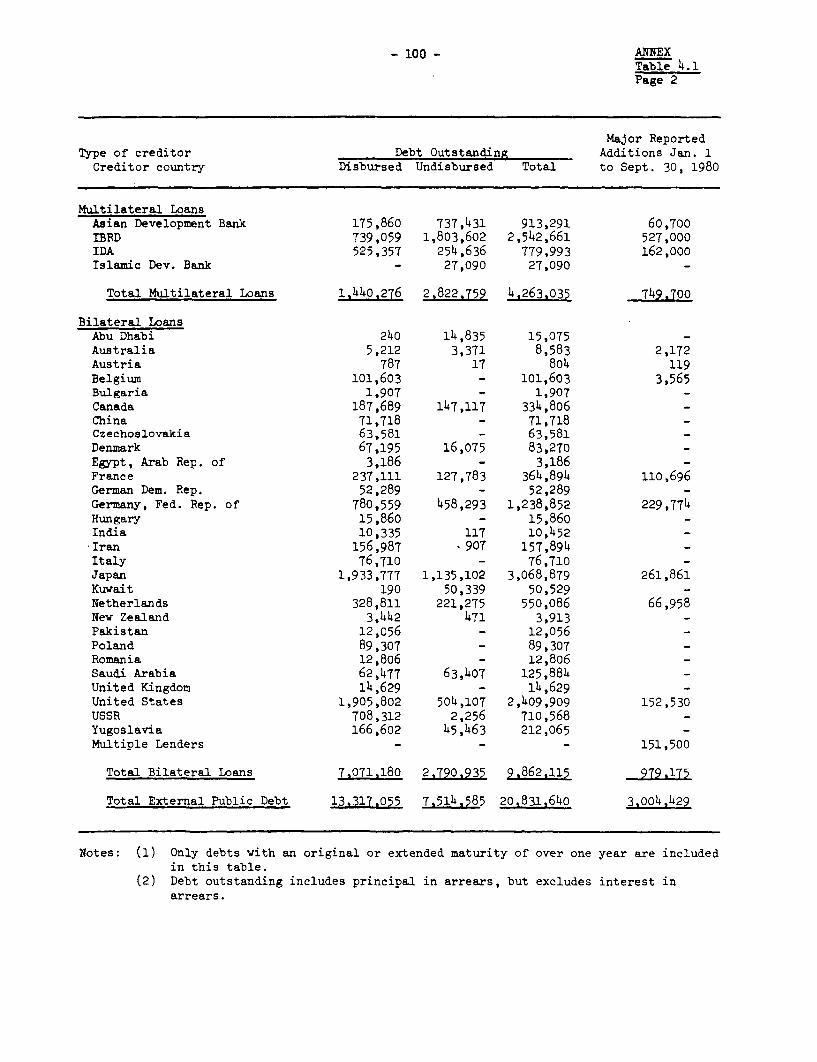
- 100 - ANNEXTable 4.1Page 2
Major ReportedType of creditor Debt Outstanding Additions Jan. 1
Creditor country Disbursed Undisbursed Total to Sept. 30, 1980
Multilateral LoansAsian Development Bank 175,860 737,431 913,291 60,700IBRD 739,059 1,803,602 2,542,661 527,000IDA 525,357 254,636 779,993 162,000Islamic Dev. Bank - 27,090 27,090 -
Total Multilateral Loans i,44o,276 2,822,759 4,263.035 749.700
Bilateral LoansAbu Dhabi 240 14,835 15,075 -Australia 5,212 3,371 8,583 2,172Austria 787 17 804 119Belgium 101,603 - 101,603 3,565Bulgaria 1,907 - 1,907Canada 187,689 147,117 334,806 -China 71,718 - 71,718 -Czechoslovakia 63,581 - 63,581 -Denmark 67,195 16,075 83,270 -Egypt, Arab Rep. of 3,186 - 3,186 -France 237,111 127,783 364,894 110,696German Dem. Rep. 52,289 - 52,289 -Germany, Fed. Rep. of 780,559 458,293 1,238,852 229,774Hungary 15,860 - 15,860 -India 10,335 117 10,452 -*Iran 156,987 -907 157,894 _Italy 76,710 - 76,710 -Japan 1,933,777 1,135,102 3,068,879 261,861Kuwait 190 50,339 50,529 _
Netherlands 328,811 221,275 550,086 66,958New Zealand 3,442 471 3,913 _
Pakistan 12,056 - 12,056 -Poland 89,307 89,307 -Romania 12,806 - 12,806 -Saudi Arabia 62,477 63,407 125,884 -United Kingdom 14,629 - 14,629 -United States 1,905,802 504,107 2,409,909 152,530USSR 708,312 2,256 710,568 -Yugoslavia 166,602 45,463 212,065 -Multiple Lenders - - - 151,500
Total Bilateral Loans 7,071,180 2,790.935 9,862,115 979,175
Total External Public Debt 13.317,055 7,514,585 20,831,640 3,004,429
Notes: (1) Only debts with an original or extended maturity of over one year are includedin this table.
(2) Debt outstanding includes principal in arrears, but excludes interest inarrears.
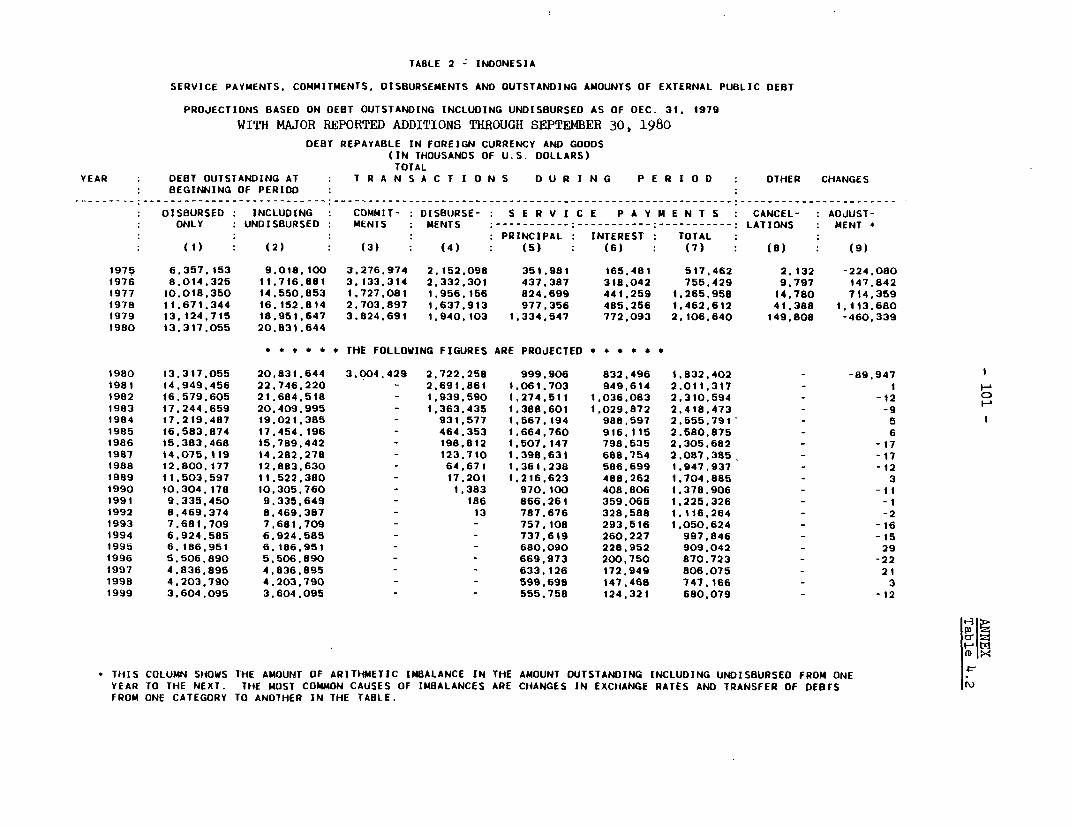
TABLE 2 INDONESIA
SERVICE PAYMENTS. COMMITMENTS. DISBURSEMENTS AND OUTSTANDING AMOUNTS OF EXTERNAL PUBLIC DEBT
PROJECTIONS BASED ON DEBT OUTSTANDING INCLUDING UNDISBURSED AS OF DEC. 31. 1979
WITH MAJOR REPORTED ADDITIONS THROUGH SEPTEMBER 30, 1980
DEBT REPAYABLE IN FOREIGN CURRENCY AND GOODS(IN THOUSANDS OF U.S. DOLLARS)
TOTAL
YEAR DEBT OUTSTANDING AT T R A N S A C T I 0 N S 0 U R I N G P E R I 0 0 OTHER CHANGES
BEGINNING OF PERIOD
DISBURSED INCLUDING COMMIT- DISBURSE- S E R V I C E P A Y M E N T S CANCEL- ADJUST-
ONLY UNDISBURSED MENTS MENTS- -----------:---------------- LATIONS MENT *
PRINCIPAL INTEREST TOTAL
: (1) : (2) (3) (4) (5) (6) (7) (8) (9)
1975 6.357.153 9.018,100 3.276.974 2.152.098 351,981 165,481 517.462 2.132 -224.080
1976 8.014.325 11.716.881 3.133.314 2,332.301 437.387 318.042 755.429 9.797 147.842
1977 10.018.350 14.550.853 1.727.081 1.956.156 824.699 441.259 1.265,958 14,780 714.359
1978 11.671.344 16.152.814 2.703.897 1.637.913 977,356 485.256 1.462.612 41.388 1.113.680
1979 13.124.715 18.951.647 3.824.691 1.940,103 1.334.547 772,093 2.106.640 149.808 -460,339
1980 13,317.055 20.831.644
* * * * * * THE FOLLOWING FIGURES ARE PROJECTED * * * * * *
1980 13.317.055 20.831.644 3.004.429 2.722.258 999.906 832,496 1.832,402 - -89.947
1981 14.949.456 22.746.220 - 2.691.861 1.061.703 949.614 2,011,317 - i
1982 16.579.605 21.684.518 - 1.939,590 1.274.511 1.036.083 2.310,594 - -12 0
1983 17.244.659 20.409.995 - 1.363,435 1.388.601 1.029.872 2.418.473 - -9
1984 17,219.487 19.021.385 - 931.577 1,567.194 988.597 2.555.791 - 5
1985 16.583,874 17.454,196 - 464.353 1,664.760 916.115 2.580.875 - 6
1986 15.383,468 15,789,442 - 198.812 1.507.147 798.535 2.305.682 - -17
1987 14.075,119 14.282.278 - 123.710 1.398.631 688.754 2.087.385, - -17
1988 12.800.177 12.883.630 - 64,671 i.361.238 586.699 1.947,937 - -12
1989 11,503,597 11,522.380 - 17.201 1.216.623 488.262 1.704.885 - 3
1990 10.304.178 10.305.760 - 1.383 970.100 408.806 1.378.906 - -1t
1991 9.335.450 9.335,649 - 186 866.261 359.065 1.225,326 - -1
1992 8.469,374 8.469.387 - 13 787.676 328.588 1.116.264 - -2
1993 7.681.709 7.681.709 - - 757.108 293.516 1.050.624 - -16
1994 6,924.585 6.924.585 - - 737.619 260.227 997,846 - -IS
1995 6.186.951 6.186.951 - - 680.090 228.952 909.042 - 29
1996 5,506,890 5.506.890 - - 669.973 200,750 870.723 - -22
1997 4.836.895 4,836.895 - - 633.126 172.949 806.075 - 21
1998 4.203.790 4.203.790 - - 599,698 147.468 747.166 - 3
1999 3,604.095 3,604.095 - - 555.758 124.321 680.079 - -12
'431-
. THIS COLUMN SHOWS THE AMOUNT OF ARITHMETIC IMBALANCE IN THE AMOUNT OUTSTANDING INCLUDING UNDISBURSED FROM ONE
YEAR TO THE NEXT. THE MOST COMMON CAUSES OF IMBALANCES ARE CHANGES IN EXCHANGE RATES AND TRANSFER OF DEBTS
FROM ONE CATEGORY TO ANOTHER IN THE TABLE.
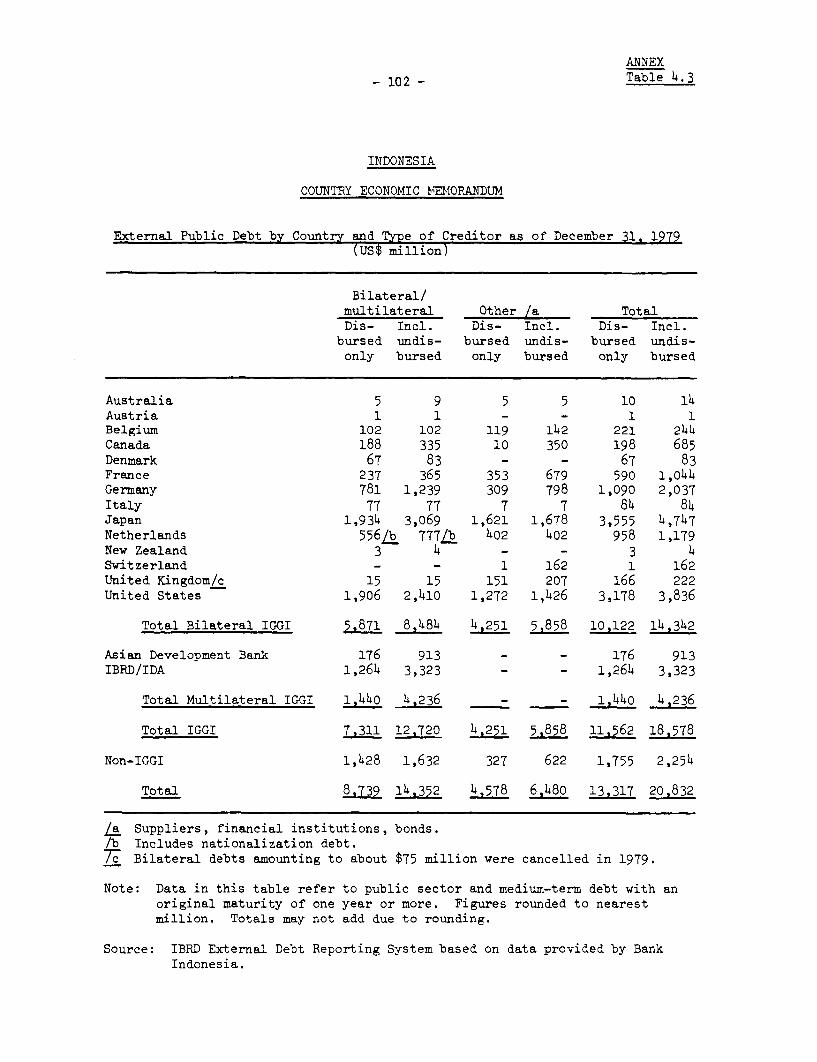
ANNEX
- 102 - Table 4.3
INDONESIA
COUNTRY ECONOMIC MEMOFANDUM
External Public Debt by Country and Type of Creditor as of December 31, 1979(US$ million)
Bilateral/multilateral Other /a TotalDis- Incl. Dis- Incl. Dis- Incl.
bursed undis- bursed undis- bursed undis-only bursed only bursed only bursed
Australia 5 9 5 5 10 14Austria 1 1 - - 1 1Belgium 102 102 119 142 221 244Canada 188 335 10 350 198 685Denmark 67 83 - - 67 83France 237 365 353 679 590 1,044Germany 781 1,239 309 798 1,ogo 2,037Italy 77 77 7 7 84 84Japan 1,934 3,069 1,621 1,678 3,555 4,747Netherlands 556/b 777/b 402 402 958 1,179New Zealand 3 4 - - 3 4Switzerland - - 1 162 1 162United Kingdom/c 15 15 151 207 166 222United States 1,906 2,410 1,272 1,426 3,178 3,836
Total Bilateral IGGI 5,871 8,484 4,251 5,858 10,122 14,342
Asian Development Bank 176 913 - - 176 913IBRD/IDA 1,264 3,323 _ - 1,264 3,323
Total Multilateral IGGI 1440 4,236 - 1,44 4,236
Total IGGI 7.311 12,720 4,251 5,858 11,562 18,578
Non-IGGI 1,428 1,632 327 622 1,755 2,254
Total 8,739 14,352 4,578 6,480 13,317 20,832
L Suppliers, financial institutions, bonds./ Includes nationalization debt./c Bilateral debts amounting to about $75 million were cancelled in 1979.
Note: Data in this table refer to public sector and medium-term debt with anoriginal maturity of one year or more. Figures rounded to nearestmillion. Totals may not add due to rounding.
Source: IBERD External Debt Reporting System based on data provided by BankIndonesia.
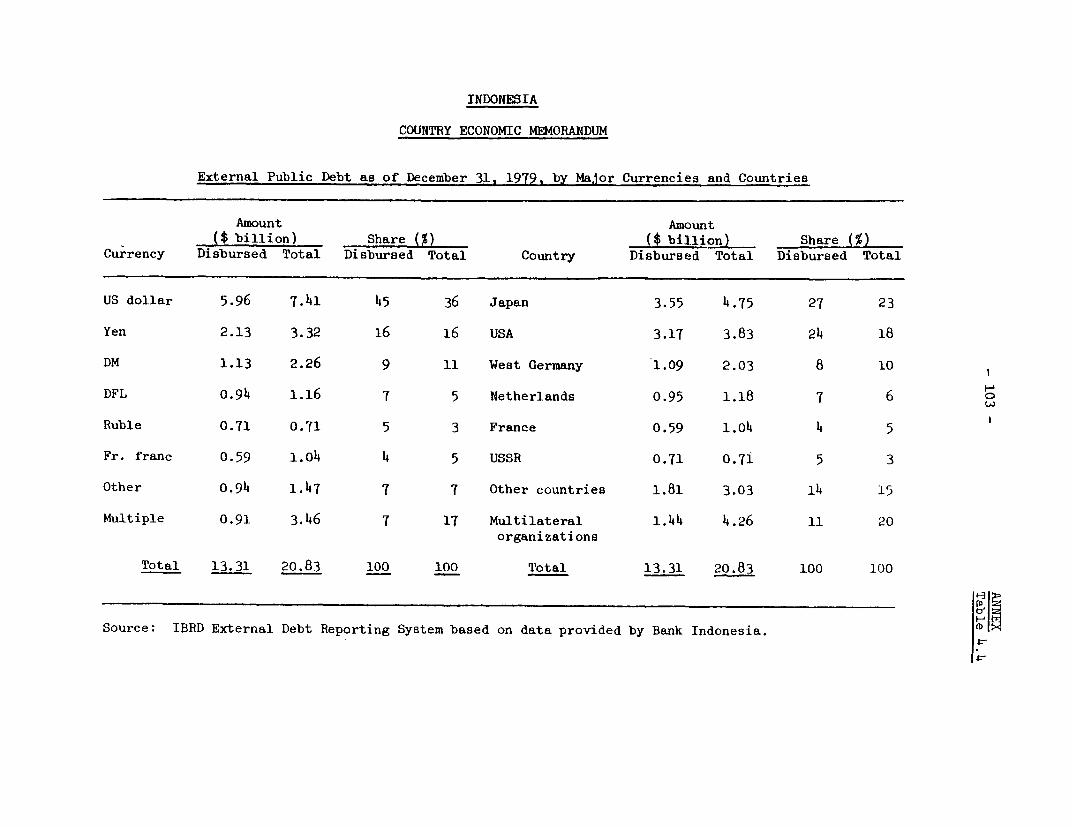
INDONESIA
COUNTRY ECONOMIC MEMORANDUM
External Public Debt as of December 31, 1979, by Major Currencies and Countries
Amount Amount($ billion) Share (%) ($ billion) Share (%)
Currency Disbursed Total Disbursed Total Country Disbursed Total Disbursed Total
US dollar 5.96 7.41 45 36 Japan 3.55 4.75 27 23
Yen 2.13 3.32 16 16 USA 3.17 3.83 24 18
DM 1.13 2.26 9 11 West Germany 1.09 2.03 8 10
DFL 0.94 1.16 7 5 Netherlands 0.95 1.18 7 6 w
Ruble 0.71 0.71 5 3 France 0.59 1.04 4 5
Fr. franc 0.59 1.04 4 5 USSR 0.71 0.71 5 3
Other 0.94 1.47 7 7 Other countries 1.81 3.03 14 15
Multiple 0.91 3.46 7 17 Multilateral 1.44 4.26 11 20organizations
Total 13.31 20.83 100 100 Total 13.31 20.83 100 100
Source: IBRD External Debt Reporting System based on data provided by Bank Indonesia.
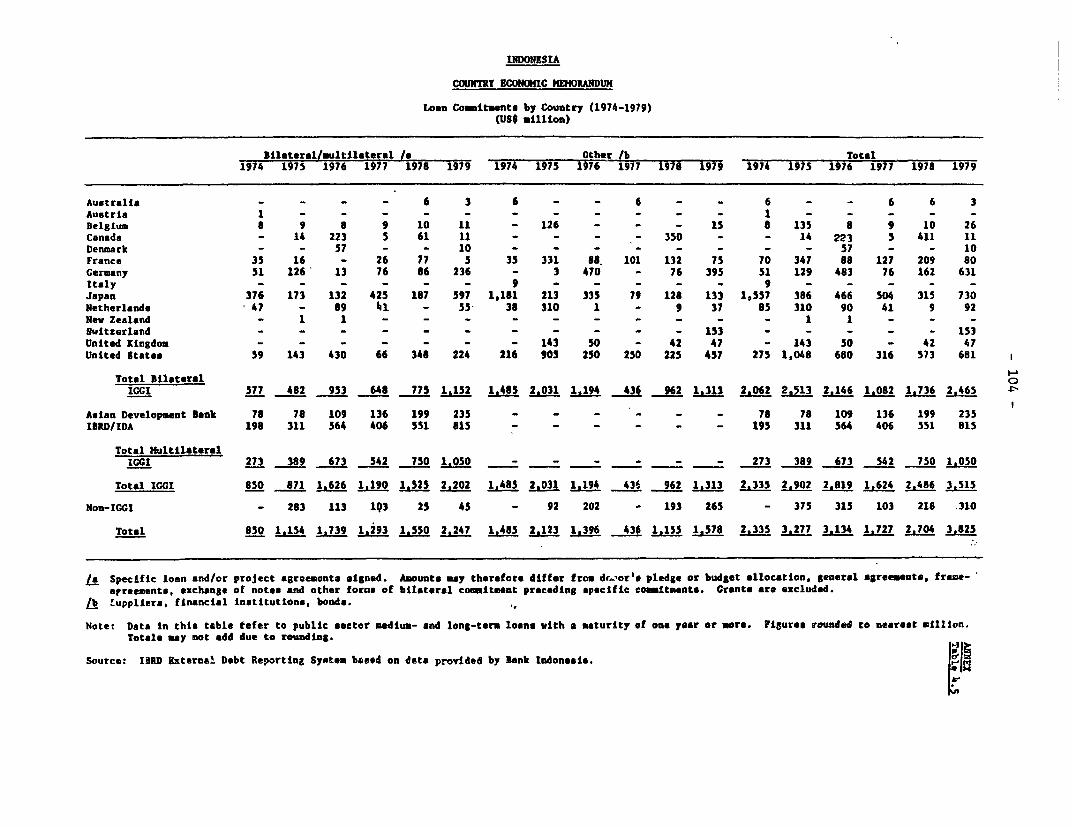
INDONESIA
COUNTRY ECONCFIC MV1ORANDUH
Loan Coinitents by Country (1974-1979)(US$ million)
Bilataral/multilateral /e Other /b Total1974 1975 1976 1977 1978 1979 1974 1975 1976 1977 1917 1979 1974 1975 1976 1977 1978 1979
Australia - - - - 6 3 6 - - 6 - - 6 - - 6 6 3Austria I - - - - - - - - - - - 1 - - - - -Belgium 8 9 8 9 10 11 - 126 - - - 15 8 135 8 9 10 26Canada - 14 223 5 61 11 - - - - 350 - - 14 223 ' 411 11Denmark - - 57 - - 10 - - - - - - - - 57 - - 10France 35 16 - 26 77 5 35 331 88. 101 132 75 70 347 88 127 209 80Germany 51 126 13 76 86 236 - 3 470 - 76 395 51 129 483 76 162 631Italy - - - - - - 9 - - - - - 9 - - - - -Japan 376 173 132 425 187 597 1,181 213 335 79 128 133 1,557 386 466 504 315 730Netherlands 47 - 89 hi - 55 38 310 1 - 9 37 a5 310 90 41 9 92New Zealand - 1 1 - - - - - - - - - - 1 1 - - -Switzerland - - - - - - - - - - - 153 - - - - - 153United Kingdom - - - - - - - 143 50 - 42 47 - 143 50 - 42 47United Statee 59 143 430 66 348 224 216 903 250 250 225 457 275 1,048 680 316 573 681 1
Total Bilateral 0
IGCI 577 482 953 648 775 1.152 1.485 2.031 1.194 436 962 1.313 2.062 2.513 2.146 1.082 1.736 2.465 $*
Asian Developaent Dank 78 78 109 136 199 235 - - - - - - 78 78 109 136 199 235IBRD/IDA 198 311 564 406 551 815 - - - - - - 195 311 564 406 551 815
Total MultilateralIGGI 273 389 673 542 750 1.050 _ I _ - I _ 273 389 673 542 750 1,050
Total IWCI 850 871 1.626 1,190 1.525 2.202 1.485 2.031 1.194 436 962 1.313 2.335 2.902 2.819 1.624 2.486 3.S15
Non-ICCI - 283 113 193 25 45 - 92 202 - 193 265 - 375 315 103 218 310
Total 850 1 154 1.739 1.293 1,550 2.247 1.485 2.123 1.396 436 1.155 1.578 2.335 3.277 3,134 1.727 2.704 3,825
La Specific loan and/or project agreements signed. Amounts may therefore differ from din,or's pledge or budget allocation, general treements, frame-streemente, exchange of notes and other forus of bilateral commitment preceding specific comitesnta. Crante are excluded.
/b ruppliers, financial lnstitution., bonds.
Note: Data in this table tefer to public sector mdium- and long-term loans with a maturity of one year or more. Figures rounded to nearest million.Totals may not add due to rounding.
Source: IBRD External Debt Reporting System based on data provided by Bank Indonesia.
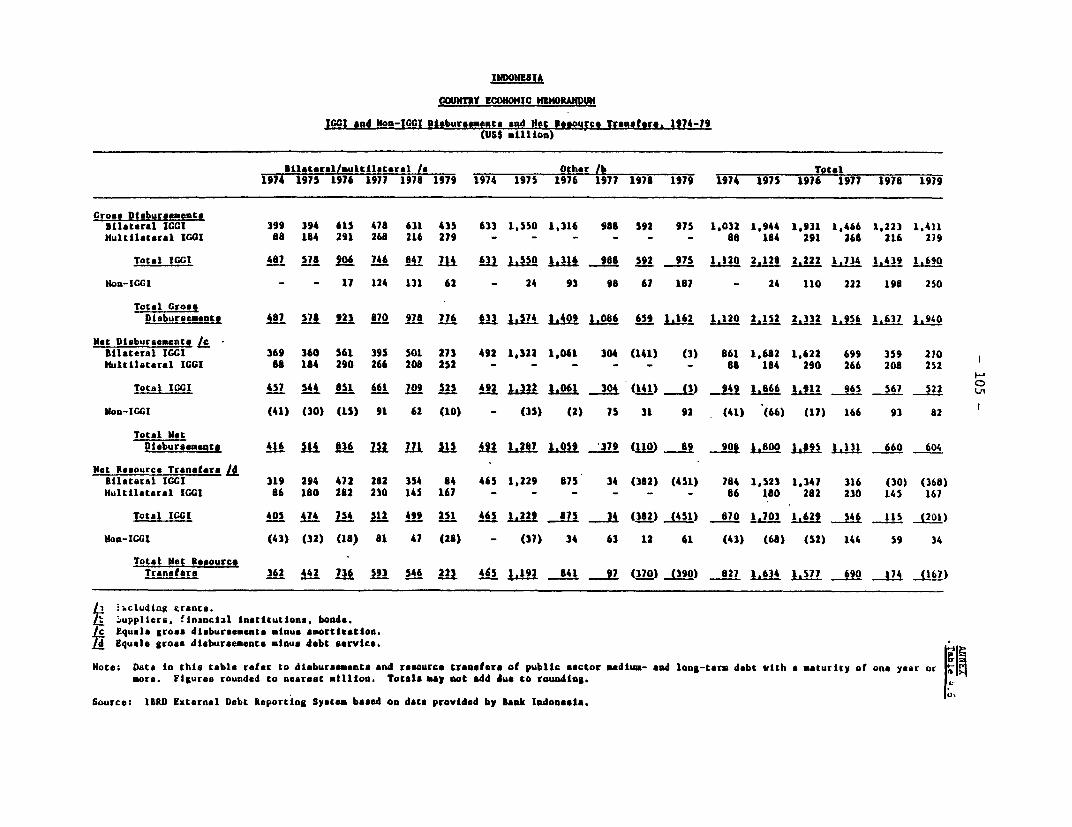
INDONESIA
COUNTRY ICOWNIC HEUORANWIt
IGGI and Hon-IGGI Dieburpente and Hot Resource ]Monsetr. 1974-79(USS million)
9Uct-erel/multtl terel /e Other lb Total1974 1975 1976 1977 1978 1979 1974 1975 1976 1977 1978 1979 1974 1975 1976 1977 1970 1979
Croce Disbursementobilateral IGGI 399 394 61S 478 631 435 633 1,550 1,316 g98 592 975 1,032 1,944 1,931 1,466 1,223 1,411
Hultilateral ICCI 88 184 291 268 216 279 - - - - - - a8 164 291 268 216 279
Total ICCI 467 578 9G6 746 647 714 3 1 1.316 988 2 975 J.20 2,128 2.222 I! M . 43 1.690
Non-ICGI _ _ 17 124 131 62 - 24 93 98 67 187 - 24 110 222 198 250
Total CroaeDisbursem.tent ALI 7 9 870 978 776 in 1574 L1f9 1.086 65 1,162 1,120 2,152 2,332 1.956 1,637 194G0
Hot Disbureements LeBilateral IGCI 369 360 561 39S 501 273 492 1,322 1,061 304 (141) (3) 861 1,682 1,622 699 359 270
Hultilaceral IGCI 88 184 290 266 208 252 - - - - - - 68 184 290 266 208 2S2
Total ICGI 457 544 8|51 661 709 525 492 1.322 1,06l 304 (141) (3 94S 66 l 912 965 567 522
jon-lGCG (41) (30) (15) 91 62 (10) - (35) (2) 75 31 92 (41) (66) (17) 166 93 62
Total NotDg u-reoeantj 416 1 -836 mJ SIIS 4 1.287 lS9 _ 379 (119) 69 906 1.00 1,8195 1,131 660 604
Net Resource Transfers a
lilatorel IGCC 319 294 472 262 354 84 465 1,229 675 34 (382) (451) 784 1,523 1,347 316 (30) (368)
Multilateral IGI 86 180 282 230 145 167 - - - - - - 86 180 282 230 145 167
Total IGI 405 47 754 S12 499 251 465 1,229 875 __ ( (2 451) 870 1703 1629 546 115 (201)
Hon-ICCI (43) (32) (186) 81 47 (28) - (37) 34 63 12 61 (43) (68) (52) 144 59 34
Total Net Raoourc*Transfers 362 442 736 593 546 223 465 192 641 __17 (370) _390) 627 1.634 1,577 690 174 (167)
clud4ag grants.1auppliers. filnxcial institutions, bonds.
| EqU410 gross disbursements mInus amortt:atton.Ed Equals gross disbureements mnus debt service,
Note; Data In this table refer to disbursemente and resource transfers of public sector mediuu- and long-term debt with a aturity of one year or
more. Figures rounded to nearest mtllton. Totals may not add due to roundtns.
Sourcet IBRD External Debt Reporting Systea based on data provided by Bank Indonesti.
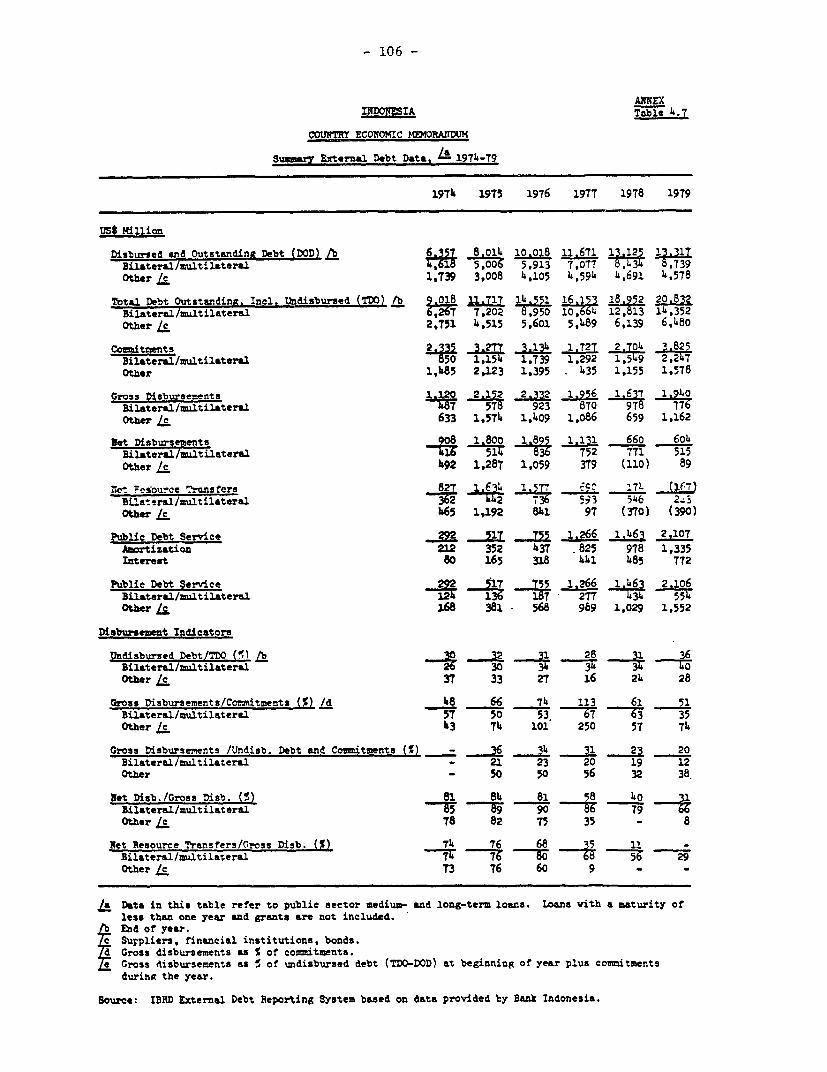
- 106 -
ANNEXINDO!!SIA Table 4.7
courETY ECONOMIC 1MZ.RANDUM
Suin,ry Erternal Debt Data, / 1974-79
1974 1975 1976 1977 1978 1979
US$ Million
Disbursed and Outstanding Debt (DOD) lb 6,357 8 014 10.018 11.671 1312 13.31TBilateral/muitilatersl 5 s,o 5,913 7,077Other /e 1,739 3,008 4,105 4,594 4,691 4,578
Total Debt Outstanding. ela. Undisbursed (TDO) lb 8 ll 7 14 1 1 2 20.832Bilateral/multilateral 6,26T 7,202 8,950 10,6 4 12, 13 IW,352Other /z 2,751 4,515 5,601 5,489 6,139 6,480
Commitments 2. 3.277 3.134 1,727 2.704 '.825Bilateral/lmltilateral -850 1,154 1,739 1,292 1,549 2,247Other 1,485 2,123 1.395 435 1,155 1,578
Gross Disbursements a2 2.152 2,332 1.95 1.637 1.940Bilatersl/multilateral T87 578 923 870 978 776Other /z 633 1.574 1,409 1,086 659 1,162
Net Disbursements 508 1.800 1.895 .131 660 604Bilaterul/multilateral -16 514 8 752 771 515Other /c 492 1,287 1,059 379 (110) 89
r7c =csfouce ransfetrs 8 .. 614 1.5T 4c 17L 6 .7Bilateral/a itilateral --- L42 736 593 5he 2_3Other /c 465 1,192 841 97 (370) (390)
Public Debt Service 292 S1T T55 1.266 1.463 2,107Amortization 212 352 437 .825 978 1,335Interest so 165 318 441 485 772
Public Debt Service 5 755 .266 1,46 2.106Bilateral/multilateral 124 1 I3 187 2771T 554Other . 168 381 - 568 989 1,029 1,552
Disbursement Indicator
Undisbursed Debt/DO) 30 32 31 28 6Bilateral/multilateral ~5 30 -34 3 4 40Other le 37 33 27 16 24 28
Gross Disbursements/Commitments () /d 48 66 74 113 61 51Bilateral/maultilateral 57 50 53 67 63 35Other /e 43 74 101 250 57 74
Gross Disbursements /Undiab. Debt and Commitments () - 36 34 23 20Bilateral/multilateral - 21 23 20 19 12Other - 50 50 56 32 38
Wet Disb./Gross Disb. (5) 81 84 81 58 40 31Bilateral/multilateral 89 90 79Other /e 78 82 75 35 - 8
let Resource Transfers/Gross Diab. (5) T4 76 68 35 11 -Bilateral/multilateral T74 7T 80-r 68 5 29Other /c 73 76 60 9 _ -
/a Data in this table refer to public sector medium- sand long-term loans. Loans with a maturity ofless than one year and grants are not included.
l End of year.Suppliers, ffnaneiaLl institutions, bonds.Gross disbursements as S of commitments.Gross disbursements as % of undisbursed debt (TDO-DOD) at beginning of year plus cosmitmentsduring the year.
Source: IBRD External Debt Reporting System based on data provided by Bank Indonesia.
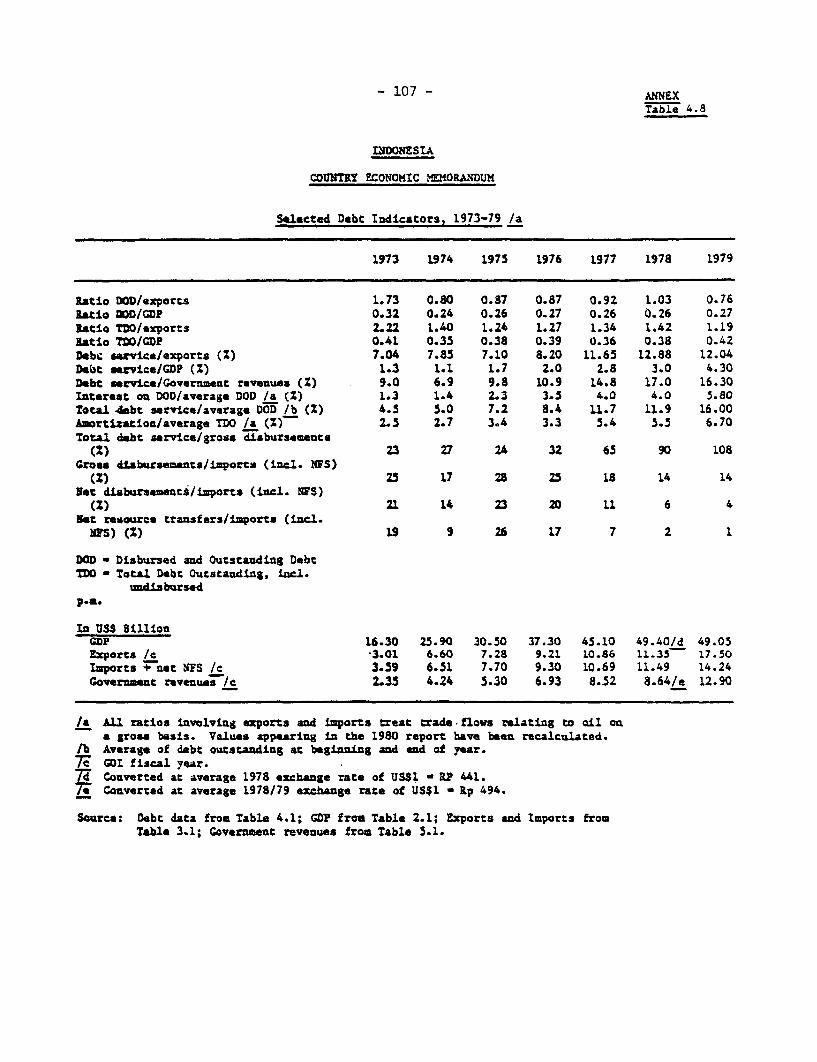
- 107 - ANNEX
Table 4.8
IMDONESIA
COUITRY ECONOMIC MEORANDUM
Selected Debt Indicators, 1973-79 /a
1973 1974 1975 1976 1977 1978 1979
Ratio DOD/exports 1.73 0.80 0.87 0.87 0.92 1.03 0.76latio DOD/COP 0.32 0.24 0.26 0.27 0.26 0.26 0.27Ratio TDO/exports 2.22 1.40 1.24 1.27 1.34 1.42 1.19Ratio TDO/GDP 0.41 0.35 0.38 0.39 0.36 0.38 0.42Debe saevica/exports (Z) 7.04 7.85 7.10 8.20 11.65 12.88 12.04Deobt service/GDP (Z) 1.3 1.1 1.7 2.0 2.8 3.0 4.30Debt service/Governmant revenues (2) 9.0 6.9 9.8 10.9 14.8 17.0 16.30Interest oan DOD/average DOD /a (Z) 1.3 1.4 2.3 3.5 4.0 4.0 5.80Total 4ebt service/average DOD lb (2) 4.5 5.0 7.2 8.4 11.7 11.9 16.00Amortizatioa/average TDO /a (%) 2.5 2.7 3.4 3.3 5.4 5.5 6.70Total debt service/grose disbursements
(2) 23 27 24 32 65 90 108Gross diiburseents/imports (iocl. NFS)
(Z) 25 17 28 25 18 14 14Met disbursement*/imports (incl. NFS)
(2) 21 14 23 20 11 6 4Net resource transfers/imports (mncl.
WPS) (2) 19 9 26 17 7 2 1
DOD - Disbursed and Outstanding DebtTDO - Total Debt Outstanding, mncl.
unalsbursedp...
In US4 BillionGDP 16.30 25.90 30.50 37.30 45.10 49.40/d 49.05Experts /c 3.01 6.60 7.28 9.21 10.86 11.3S 17.50Imports + net NFS /c 3.59 6.51 7.70 9.30 10.69 11.49 14.24Government revenues /c 2.35 4.24 5.30 6.93 8.52 8.64/e 12.90
/a All ratios involving exports and imports treat trade flows relating to oil ona gross basis. Values appearing in the 1980 report have been recalculated.
/b Average of debt outstanding at beginning and and of year.77 GOI fiscal year.7T Converted at average 1978 exchange rate of US$1 - R2 441.7 Converted at average 1978/79 exchange rate of US$1 - Ip 494.
Source: Debt data from Table 4.1; GDP from Table 2.1; Exports and Imports fromTable 3.1; Government revenues from Table 5.1.
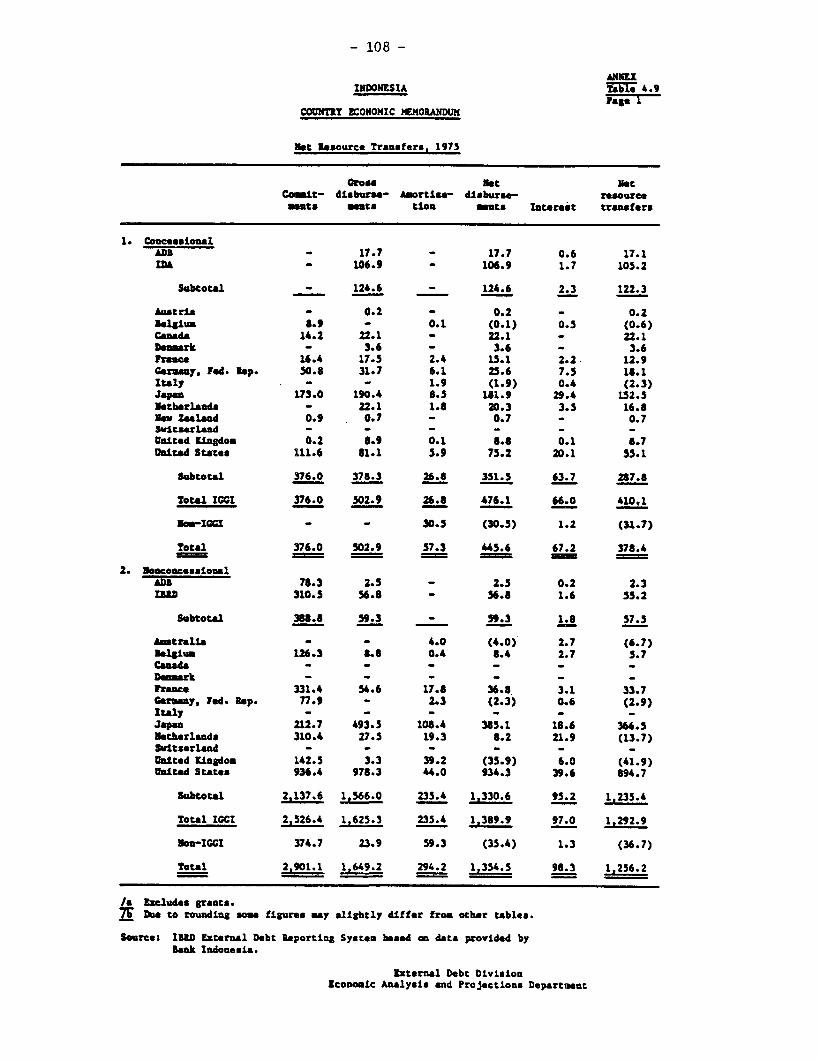
- 108 -
ANNEXINDONESIA 'Tabl 4.9
Page ICOUNTRY CONOMIC MEMORANDUM
Net Resource Transfers, 1975
Gross met metComit- dliburse- Aeortia.- disburse- resourceminats seats tioa *mte Inctroet transfers
1. ConeeseionalADB - 17.7 - 17.7 0.6 17.1DA - 106.9 - 106.9 1.7 105.2
Subtotal - 124.6 - 124.6 2.3 122.3
AustriA - 0.2 - 0.2 - 0.2* lguM 8.9 - 0.1 (0.1) 0.5 (0.6)Canada 14.2 22.1 - 22.1 - 22.1Denmrk - 3.6 - 3.6 - 3.6ternce 16.4 17.5 2.4 15.1 2.2. 12.9Germany, Jed. Rep. 50.8 31.7 6.1 25.6 7.5 18.1Italy - - 1.9 (1.9) 0.4 (2.3)Japga 173.0 190.4 8.5 181.9 29.4 L52.5Netherlaeds - 22.1 1.8 20.3 3.5 16.8Nek Zoalead 0.9 0.7 -0.7 - 0.7Switzerland - - - - - -United XLngdom 0.2 8.9 0.1 8.8 0.1 6.7gaited StAtes 111.6 81.1 5.9 75.2 20.1 55.1
Subtotal 376.0 378.3 26.8 351.5 63.7 237.6
Total IGGI 376.0 502.9 26.8 476.1 66.0 410.1
NmIC4I - - 30.5 (30.5) 1.2 (34.7)
Total 376.0 502.9 57.3 445.6 67.2 378.4
2. Noncone-.sionalADS 78.3 2.5 - 2.5 0.2 2.31 m 310.5 56.8 - 56.8 1.6 55.2
Subtotal 388.8 59.3 - 59.3 1.8 57.5
Australia - - 4.0 (4.0) 2.7 (6.7)Belgium 1i26.3 Z.6 0.4 8.4 2.7 5.7Canada _ _ _Denmrk - - - -
Framne 331.4 54.6 17.8 36.8 3.1 33.7Cermany, Fed. Rep. 77.9 - 2.3 (2.3) 0.6 (2.9)Italy - - - - - -Japsa 212.7 493.5 108.4 385.1 18.6 366.5Natherlands 310.4 27.5 19.3 6.2 21.9 (13.7)Swltzerland - - - - -
Unlted Kingdom 142.5 3.3 39.2 (35.9) 6.0 (41.9)United States 936.4 978.3 44.0 934.3 39.6 894.7
Subtotal 2,137.6 1,566.0 235.4 1,330.6 95.2 1,235.4
Total IGCI 2,526.4 1,625.3 235.4 1.389.9 97.0 1.292.9
Nor-IGGI 374.7 23.9 59.3 (35.4) 1.3 (36.7)
Total 2,901.1 1L649.2 294.2 1,354.5 98.3 1.256.2
/a lacludes grants.7T De to rounding some figures may slightly differ from other tables.
Source: IBUD External Debt Reporting System based on data provided byBank Indonesia.
External Debt DivisionEconomic Analysis and Projections Department
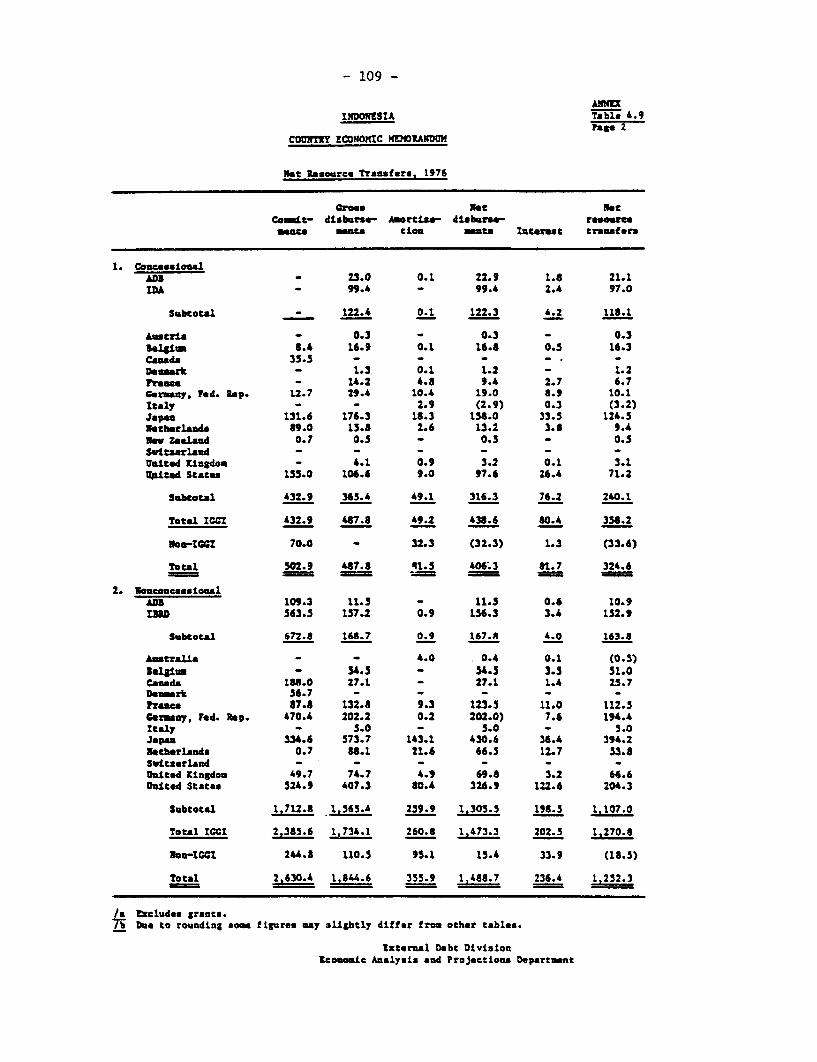
- 109 -
AMuINDOWKSIA Table 4.9
COM ECONO?aC NVOIANDUM
Net Resource Transfer, 1976
Gross Not NotCo t- disburse- _ ArtLsa- disburs.- reseewe
meaue mate tele *mot Iterest tranafore
1. Couce.aionalDI M- 23.0 0.1 22.9 1.8 21.1
IDA - ".4 - 99.4 2.4 97.0
Subtotal _ 122.4 0.1 122.3 4.2 118.1
AustrUi 0.3 - 0.3 - 0.3lelgim 8.4 16.9 0.I 16.8 0.5 16.3Canada 35.5 - - - -
Desmark - 1.3 0.1 1.2 - 1.2France - 14.2 4.8 9.4 2.7 6.7Cermny, Fed. Rep. 12.7 29.4 10.4 19.0 8.9 10.1Italy _ _ 2.9 (2.9) 0.3 (3.2)JIpan 131.6 176.3 18.3 158.0 33.5 124.5Netbhuland 89.0 15.8 2.6 13.2 3.8 9.4Now Zealand 0.7 0.5 - 0.5 - 0.5Swit2erland - - - - - -
unlted Kingdom - 4.1 0.9 3.2 0.1 3.1URited Statan 155.0 106.6 9.0 97.6 26.4 71.2
Subtotal 432.9 365.4 49.1 316.3 76.2 240.1
Total ICCS 432.9 487.8 49.2 438.6 80.4 358.2
bNe-SCCG 70.0 - 32.3 (32.3) 1.3 (33.6)
Total 502.9 487.8 41.5 406.3 81.7 324.6
2. NoucoucesionalADn 109.3 11.5 - 11.5 0.6 10.9hID 563.5 157.2 0.9 156.3 3.4 152.9
Subtotal 672.8 168.7 0.9 167.A 4.0 163.J
Australla - - 4.0 0.4 0.1 (0.3)
telgit. - 54.5 - 54.5 3.5 51.0Canada 188.0 27.1 - 27.1 1.4 25.7Denmrk 56.7 - - - - -
FiaTe 87.8 132.8 9.3 123.5 11.0 112.5gemary, Fed. Rep. 470.4 202.2 0.2 202.0) 7.6 194.4Italy - 5.0 - 5.0 - 5.0JapaD 334.6 573.7 143.1 430.6 36.4 394.2Netherlands 0.7 88.1 21.6 66.5 12.7 53.8Switxerland -Wnited Kingdom 49.7 74.7 4.9 69.8 3.2 66.6
United States 524.9 407.3 80.4 326.9 122.6 204.3
Subtotal 1,712.8 1.565.4 259.9 1,305.5 198.5 1,107.0
Total lCCI 2.385.6 1.734.1 260.8 1,473.3 202.5 1,270.8
Don-tOOl 244.8 110.5 95.1 13.4 33.9 (18.5)
Total 2,630.4 1,844.6 355.9 1,488.7 236.4 1 252.3
/a Excludes grants.73 Due to rounding som flgures may slightly differ from other tables.
External Debt DivisionUcomaomc Analysis and Projectione Department
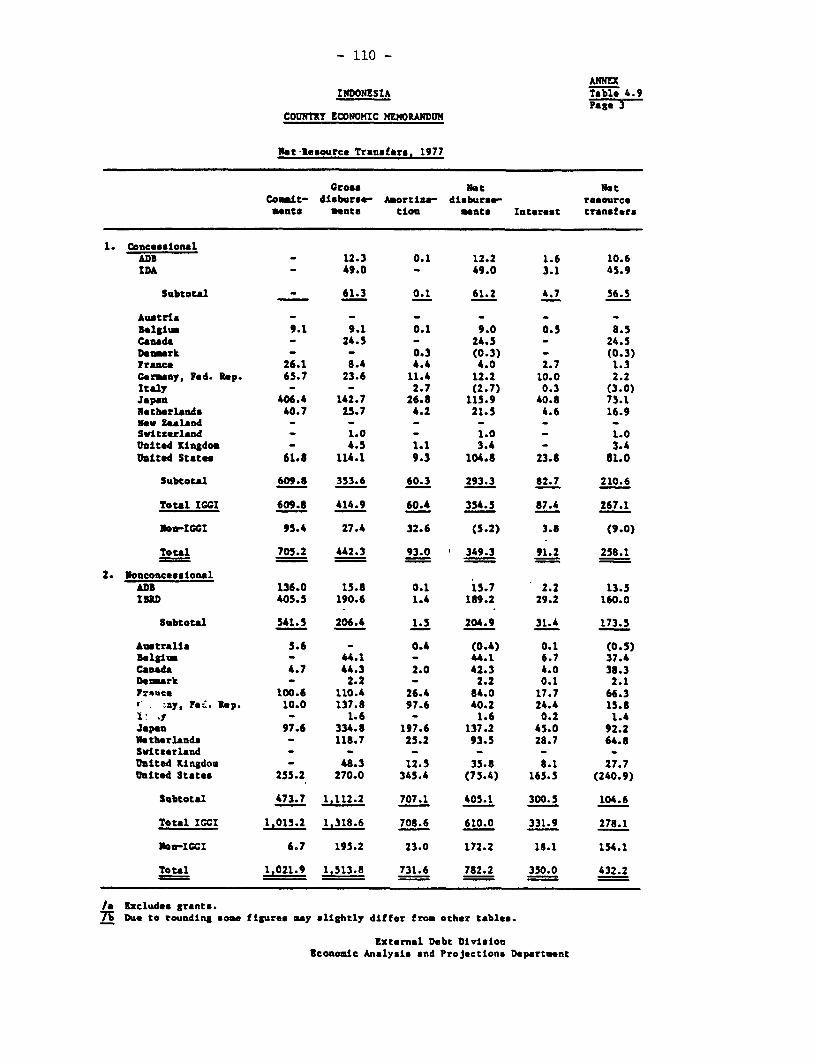
- 110 -
ANNEXIlDONESIA Table 4.9
Page 3COUNTRY ECONOMIC MEMORANDUM
Net-lesource Transf&rs. 1977
Gross Not NotConait- disburse- Amortiza- disburse- rasource
Menat ments tion ments Interest transfers
1. Conc*esionalADD - 12.3 0.1 12.2 1.6 10.6IDA - 49.0 - 49.0 3.1 45.9
Subtotal - 61.3 0.1 61.2 4.7 56.5
Austria - - - - - -Belgium 9.1 9.1 0.1 9.0 0.5 8.5Canada - 24.5 - 24.5 - 24.5De a rk - - 0.3 (0.3) - (0.3)France 26.1 8.4 4.4 4.0 2.7 1.3Cer uky, Fed. Rep. 65.7 23.6 11.4 12.2 10.0 2.2Italy - - 2.7 (2.7) 0.3 (3.0)Japan 406.4 142.7 26.8 115.9 40.8 75.1Netherlands 40.7 2U.7 4.2 21.5 4.6 16.9Now Zealand - - - - - -Switxerland - 1.0 - 1.0 - 1.0United Kingdon - 4.5 1.1 3.4 - 3.4Utited States 61.8 114.1 9.3 104.8 23.8 81.0
Subtotal 609.8 353.6 60.3 293.3 82.7 210.6
Total IGGI 609.8 414.9 60.4 354.5 87.4 267.1
NoW-IGGI 95.4 27.4 32.6 (5.2) 3.8 (9.0)
Total 705.2 442.3 93.0 349.3 91.2 258.1
2. NonconcessionalADS 136.0 15.8 0.1 15.7 2.2 13.5lUND 405.5 190.6 1.4 189.2 29.2 160.0
Subtotal 541.5 206.4 1.5 204.9 31.4 173.5
Australia 5.6 - 0.4 (0.4) 0.1 (0.5)belgius - 4".1 - 44.1 6.7 37.4Can"da 4.7 44.3 2.0 42.3 4.0 38.3Denmark - 2.2 - 2.2 0.1 2.1PFrue 100.6 110.4 26.4 84.0 17.7 66.3
*- . .y, r .. Rep. 10.0 137.8 97.6 40.2 24.4 15.8V . - 1.6 - 1.6 0.2 1.4Japan 97.6 334.8 197.6 137.2 45.0 92.2Netherlands - 118.7 25.2 93.5 28.7 64.8Switzerland - - - - - -United Kingdom - 48.3 12.5 35.8 8.1 27.7United States 255.2 270.0 345.4 (75.4) 165.5 (240.9)
Subtotal 473.7 1,112.2 707.1 405.1 300.5 104.6
Total IGCI 1.015.2 1.318.6 708.6 610.0 331.9 278.1
Non-ICCi 6.7 195.2 23.0 172.2 18.1 154.1
Total 1,021.9 1,513.8 731.6 782.2 350.0 432.2
/a Excludes grants.7S Due to rounding omse figures nay slightly differ from other tables.
External Debt DivisionEconole Analysis and Projections Department
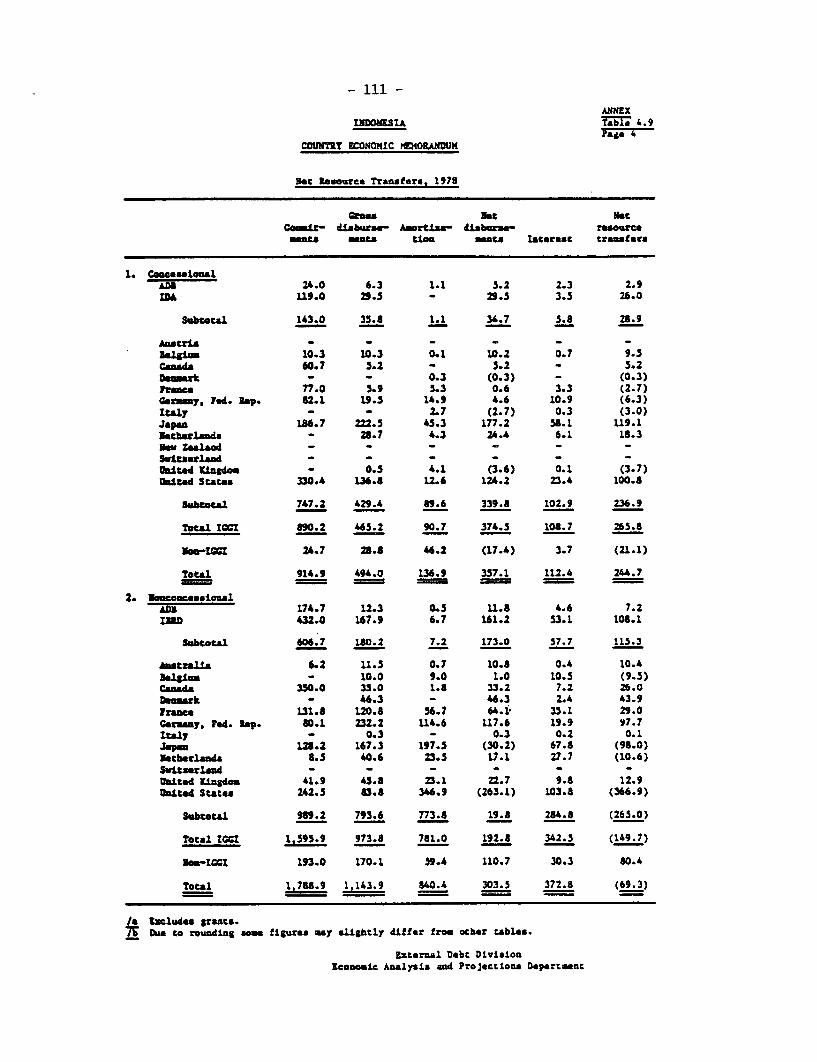
- 111 -
ANNEXINDONESIA Table 4.9
Pag. 4CONTY ECONOMIC ?fORMU
Het Resouree Transfer*, 1978
Goee not netCmait- dibuarse- Amrtit- disburse- resourcemats tun sats Iaterest transfers
1. CasessioalAD8 24.0 6.3 1.1 5.2 2.3 2.9
1U9.0 29.5 - 29.5 3.5 26.0
Subtotal 143.0 35.8 1.1 36.7 5.8 28.9
Austra - - - - - -
1e1gim 10.3 10.3 0.1 10.2 0.7 9.5Canada 60.7 5.2 - 5.1 - 5.2
D dmuLrk - - 0.3 (0.3) - (0.3)Irane 77.0 5.9 5.3 0.6 3.3 (2.7)Germay, led. Rep. 82.1 19.5 14.9 4.6 10.9 (6.3)Italy - - 2.7 (2.7) 0.3 (3.0)
Japan 186.7 222.5 45.3 177.2 58.1 119.1Netherlads - 28.7 4.3 24.4 6.1 18.3Nw. Zealand - - - - - -
Svitserrld - - - _ - _
United Kingdom - 0.5 4.1 (3.6) 0.1 (3.7)Unlted States 330.4 136.8 26 124.2 23.4 100.8
Subotal 747.2 429.4 89.6 339.8 102.9 236.9
Total ICCI 890.2 465.2 90.7 374.5 108.7 265.8
_10-1= 24.7 28.8 46.2 (17.4) 3.7 (21.1)
Total 914.9 494.0 136.9 357.1 112.4 244.7
2. UmeonceesionalADS 174.7 12.3 0.5 11.8 4.6 7.2
432.0 167.9 6.7 161.2 53.1 108.1
Subtotal 606.7 180.2 7.2 173.0 57.7 115.3
Autrala 6.2 11.5 0.7 10.8 0.4 10.4B.1M - 10.0 9.0 1.0 10.5 (9.5)Canada 350.0 35.0 1.8 33.2 7.2 26.0lnmrk - 4.3 - 46.3 2.4 43.9
fraen 131.8 120.8 56.7 64.1; 35.1 29.0Germy, Fed. Rep. 80.1 232.2 114.6 117.6 19.9 97.7Italy - 0.3 - 0.3 0.2 0.1Japan 12.2 167.3 197.5 (30.2) 67.8 (98.0)Netbhrlads 8.5 40.6 23.5 17.1 27.7 (10.6)Switserlsnd - - - - - -
UaLted Kingdom 41.9 45.8 23.1 22.7 9.8 12.9Ulited States 242.5 a.8 346.9 (263.1) 103.8 (366.9)
Subtotal 969.2 793.6 773.8 19.8 284.8 (265.0)
Total ICC! 1,595.9 973.8 781.0 192.8 342.5 (149.7)
3ct-ICCI 193.0 170.1 59.4 110.7 30.3 80.4
Total 1,788.9 1,143.9 840.4 303.5 372.8 (69.3)
1 E ecludes grants.Wea to rounding sm figures may slightly differ fro, ocher tables.
External Debt Divisiongeonmic Analysis and Pro jections Dep.rtmnt
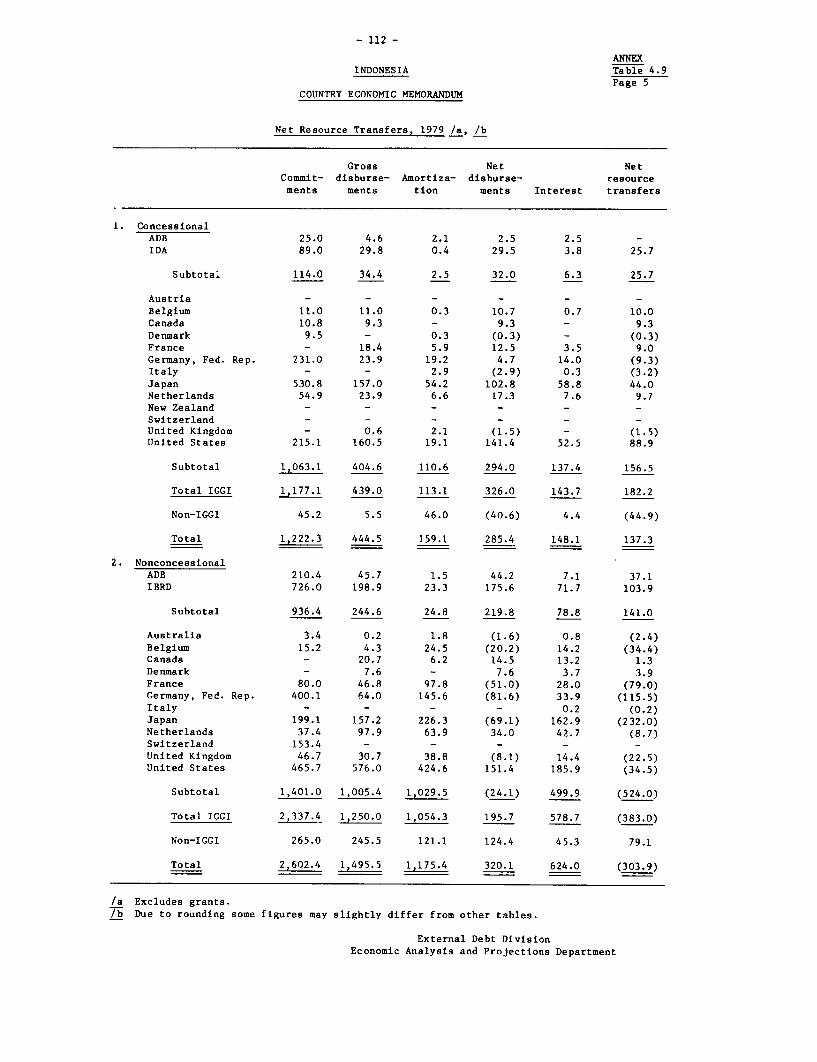
- 112 -
ANNEXINDONESIA Table 4.9
Page 5COUNTRY ECONOMIC MEMORANDUM
Net Resource Transfers, 1979 /a, /b
Gross Net NetCommit- disburse- Amortiza- disburse- resourcements ments tion ments Interest transfers
1. ConcessionalADB 25.0 4.6 2.1 2.5 2.5 -IDA 89.0 29.8 0.4 29.5 3.8 25.7
Subtotal 114.0 34.4 2.5 32.0 6.3 25.7
Austria - - - - - -Belgium 11.0 11.0 0.3 10.7 0.7 10.0Canada 10.8 9.3 - 9.3 - 9.3Denmark 9.5 - 0.3 (0.3) - (0.3)France - 18.4 5.9 12.5 3.5 9.0Germany, Fed. Rep. 231.0 23.9 19.2 4.7 14.0 (9.3)Italy - - 2.9 (2.9) 0.3 (3.2)Japan 530.8 157.0 54.2 102.8 58.8 44.0Netherlands 54.9 23.9 6.6 17.3 7.6 9.7New Zealand - - - - - -Switzerland - -United Kingdom - 0.6 2.1 (1.5) - (1.5)United States 215.1 160.5 19.1 141.4 52.5 88.9
Subtotal 1,063.1 404.6 110.6 294.0 137.4 156.5
Total IGGI 1,177.1 439.0 113.1 326.0 143.7 182.2
Non-IGGI 45.2 5.5 46.0 (40.6) 4.4 (44.9)
Total 1,222.3 444.5 159.1 285.4 148.1 137.3
2. Nonconcessional
ADB 210.4 45.7 1.5 44.2 7.1 37.1IBRD 726.0 198.9 23.3 175.6 71.7 103.9
Subtotal 936.4 244.6 24.8 219.8 78.8 141.0
Australia 3.4 0.2 1.8 (1.6) 0.8 (2.4)Belgium 15.2 4.3 24.5 (20.2) 14.2 (34.4)Canada - 20.7 6.2 14.5 13.2 1.3Denmark - 7.6 - 7.6 3.7 3.9France 80.0 46.8 97.8 (51.0) 28.0 (79.0)Germany, Fed. Rep. 400.1 64.0 145.6 (81.6) 33.9 (115.5)Italy - - - - 0.2 (0.2)
Japan 199.1 157.2 226.3 (69.1) 162.9 (232.0)Netherlands 37.4 97.9 63.9 34.0 42.7 (8.7)Switzerland 153.4 - - - - -
United Kingdom 46.7 30.7 38.8 (8.1) 14.4 (22.5)United States 465.7 576.0 424.6 151.4 185.9 (34.5)
Subtotal 1,401.0 1,005.4 1,029.5 (24.1) 499.9 (524.0)
Total IGGI 2,337.4 1,250.0 1,054.3 195.7 578.7 (383.0)
Non-IGGI 265.0 245.5 121.1 124.4 45.3 79.1
Total 2,602.4 1,495.5 1,175.4 320.1 624.0 (303.9)
/a Excludes grants.7 Due to rounding some figures may slightly differ from other tables.
External Debt DivisionEconomic Analysis and Projections Department
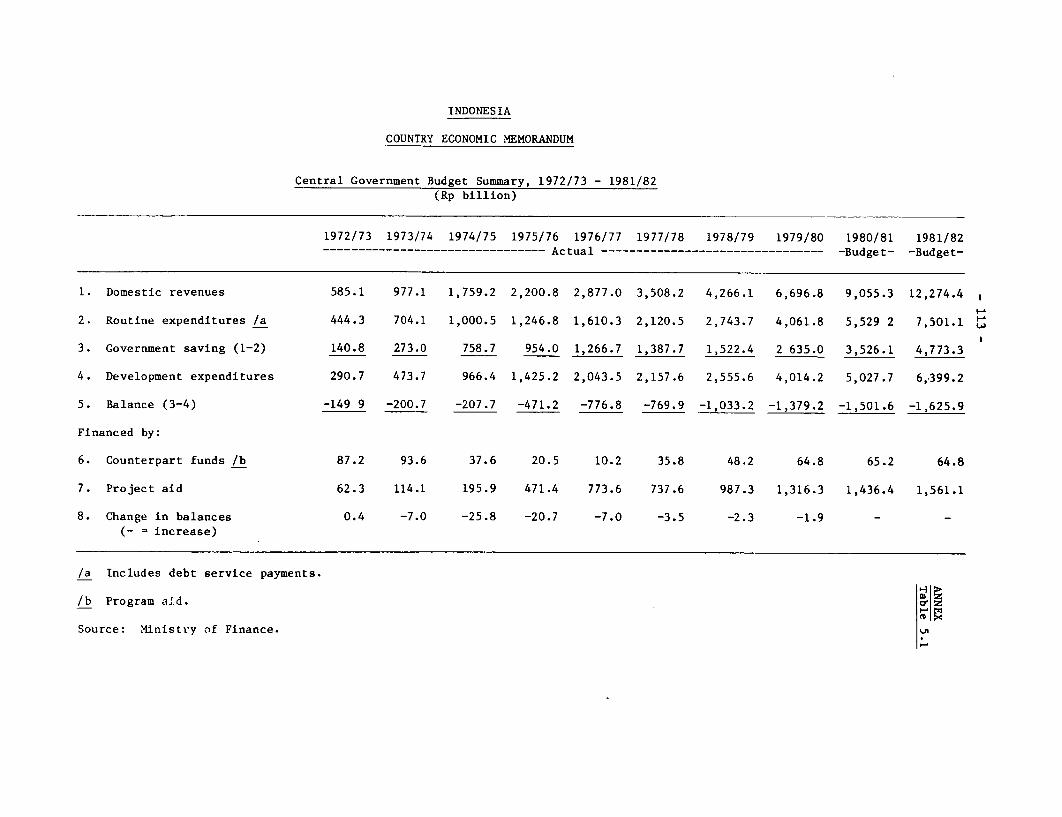
INDONESIA
COUNTRY ECONOMIC MEMORANDUM
Central Government Budget Summary, 1972/73 - 1981/82(Rp billion)
1972/73 1973/74 1974/75 1975/76 1976/77 1977/78 1978/79 1979/80 1980/81 1981/82-------------------------------- Actual -------------------------------- -Budget- -Budget-
1. Domestic revenues 585.1 977.1 1,759.2 2,200.8 2,877.0 3,508.2 4,266.1 6,696.8 9,055.3 12,274.4
2. Routine expenditures /a 444.3 704.1 1,000.5 1,246.8 1,610.3 2,120.5 2,743.7 4,061.8 5,529 2 7,501.1
3. Government saving (1-2) 140.8 273.0 758.7 954.0 1,266.7 1,387.7 1,522.4 2 635.0 3,526.1 4,773.3
4. Development expenditures 290.7 473.7 966.4 1,425.2 2,043.5 2,157.6 2,555.6 4,014.2 5,027.7 6,399.2
5. Balance (3-4) -149 9 -200.7 -207.7 -471.2 -776.8 -769.9 -1,033.2 -1,379.2 -1,501.6 -1,625.9
Financed by:
6. Counterpart funds /b 87.2 93.6 37.6 20.5 10.2 35.8 48.2 64.8 65.2 64.8
7. Project aid 62.3 114.1 195.9 471.4 773.6 737.6 987.3 1,316.3 1,436.4 1,561.1
8. Change in balances 0.4 -7.0 -25.8 -20.7 -7.0 -3.5 -2.3 -1.9 - -(- = increase)
/a Includes debt service payments.
/b Program aid.
Source: Ministvy of Finance. |i
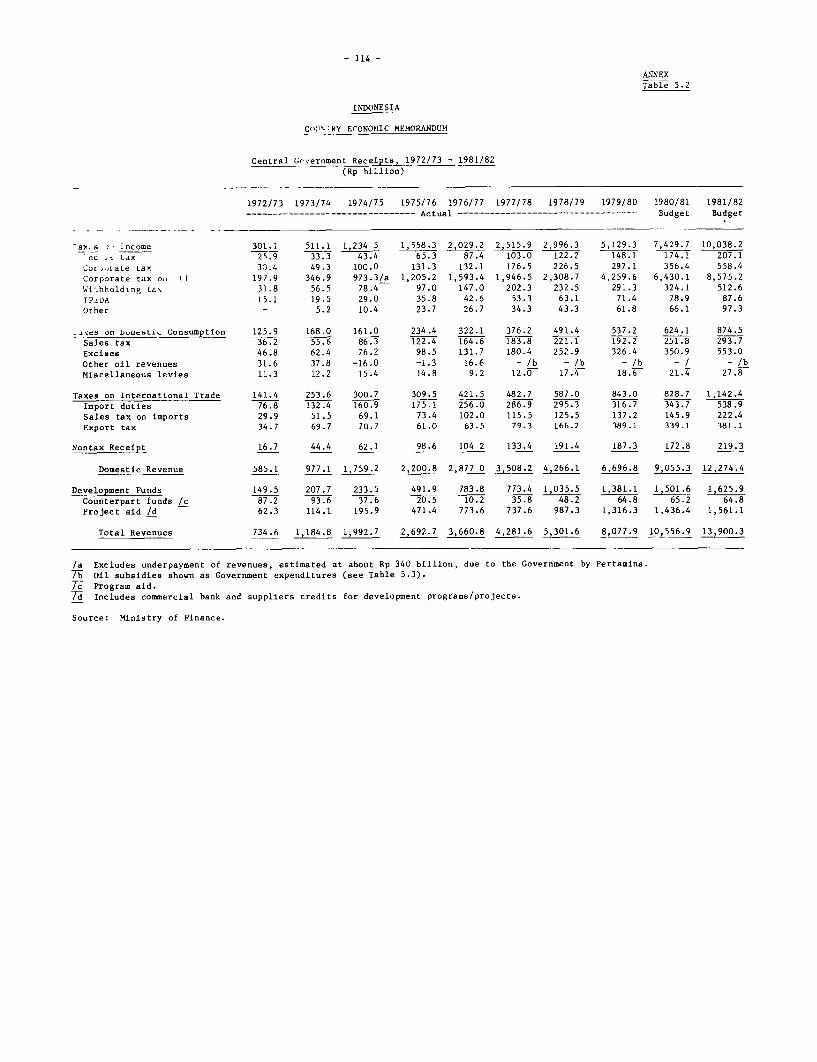
- 114 -
ANNEX
Table 5.2
INDONESIA
C(1:%'RY ECONOMIC MEMORANDUM
Central Government Receipts, 1972/73 - 1981/82
(Rp billion)
1972/73 1973/74 1974/75 1975/76 1976/77 1977/78 1978/79 1979/80 1980/81 1981/82
-------------------------------- Actual ---------------------------------- Budget Budget
'ay-s _ncome 301.1 511.1 1,234 5 1,558.3 2,029.2 2,515.9 2,996.3 5,129.3 7,429.7 10,038.2
.c u tax 2S.9 33.3 43.4 65.3 87.4 103.0 122.2 148.1 174.1 207.1
COu ,late tax 30.4 49.3 100.0 131.3 132.1 176.5 226.5 297.1 356.4 558.4
Corporate tax ot fl 197.9 346.9 973.3/a 1,205.2 1,593.4 1,946.5 2,308.7 4,259.6 6,430.1 8,575.2
Withholding tLa- 31.8 56.5 78.4 97.0 147.0 202.3 232.5 291.3 324.1 512.6
IPU.DA 15.1 19.5 29.0 35.8 42.6 53.3 63.1 71.4 78.9 87.6
Other - 5.2 10.4 23.7 26.7 34.3 43.3 61.8 66.1 97.3
-Aes on b-urstI. Eonsumption 125.9 168.0 161.0 234.4 322.1 376.2 491.4 537.2 624.1 874.5
Sales tax 36.2 55.6 86.3 122.4 164.6 183.8 221.1 192.2 251.8 293.7
Excises 46.8 62.4 76.2 98.5 131.7 180.4 252.9 326.4 350.9 553.0
Other oil revenues 31.6 37.8 -16.0 -1.3 16.6 - /b - /b - /b - / - /b
Miscellaneous levies 11.3 12.2 15.4 14.8 9.2 12.0 17.4 18.6 21.4 27.8
Taxes on International Trade 141.4 253.6 300.7 309.5 421.5 482.7 587.0 843.0 828.7 1,142.4
Import duties 76.8 132.4 160.9 175.1 256.0 286.9 295.3 316.7 343.7 538.9
Sales tax on imports 29.9 51.5 69.1 73.4 102.0 115.5 125.5 137.2 145.9 222.4
Export tax 34.7 69.7 70.7 61.0 63.5 79.3 166.2 389.1 339.1 381.1
Nontax Receipt 16.7 44.4 62.1 98.6 104 2 133.4 191.4 187.3 172.8 219.3
Domestic Revenue 585.1 977.1 1,759.2 2,200.8 2,877 0 3,508.2 4,266.1 6,696.8 9,055.3 12,274.4
Development Funds 149.5 207.7 233.5 491.9 783.8 773.4 1,035.5 1,381.1 1,501.6 1,625.9
Counterpart funds /c 87.2 93.6 37.6 20.5 10.2 35.8 48.2 64.8 65.2 64.8
Project aid /d 62.3 114.1 195.9 471.4 773.6 737.6 987.3 1,316.3 1,436.4 1,561.1
Total Revenues 734.6 1,184.8 1,992.7 2,692.7 3,660.8 4,281.6 5,301.6 8,077.9 10,556.9 13,900.3
/a Excludes underpayment of revenues, estimated at about Rp 340 billion, due to the Government by Pertamina.
7W Oil subsidies shown as Government expenditures (see Table 5.3).
/c Program aid.7W Includes commercial bank and suppliers credits for development programs/projects.
Source: Ministry of Finance.
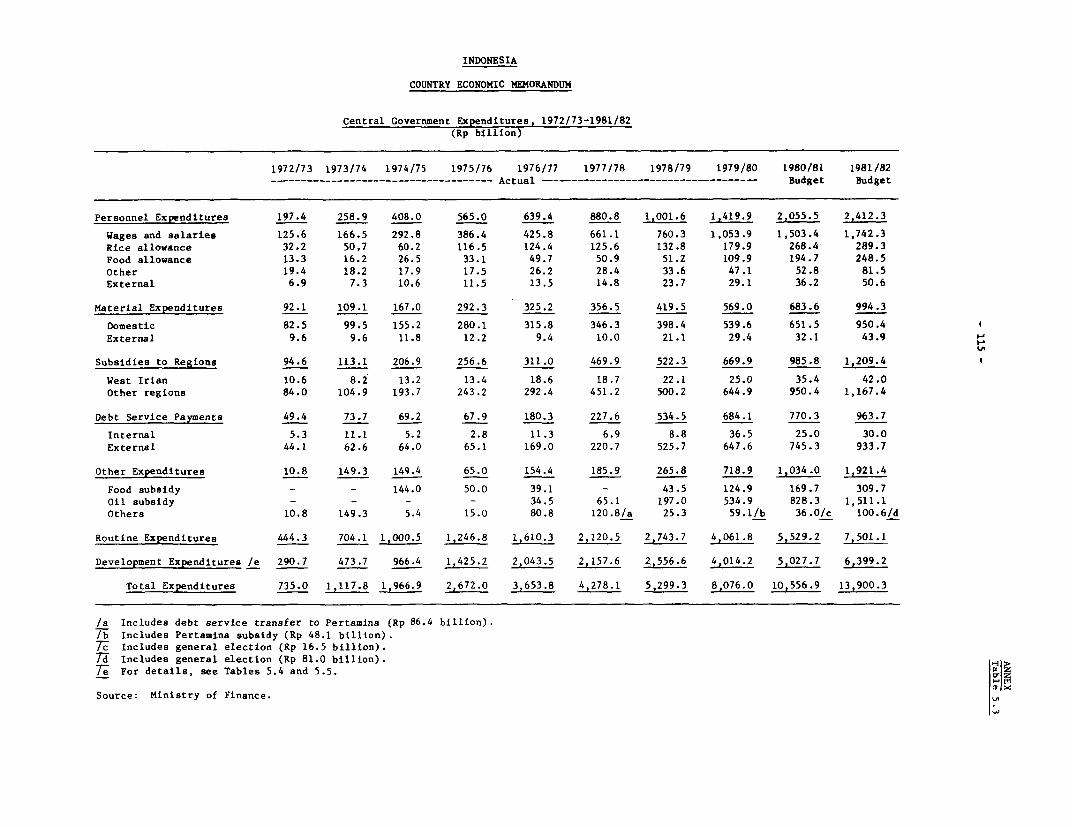
INDONESIA
COUNTRY ECONOMIC MEMORANDUM
Central Government Expenditures, 1972/73-1981/82(Rp billion)
1972/73 1973/74 1974/75 1975/76 1976/77 1977/78 1978/79 1979/80 1980/81 1981/82-- ---------- - ---------------------- Actual ------------------------- - -------- Budget Budget
Personnel Expenditures 197.4 258.9 408.0 565.0 639.4 880.8 1,001.6 1,419.9 2,055.5 2,412.3
Wages and salaries 125.6 166.5 292.8 386.4 425.8 661.1 760.3 1,053.9 1,503.4 1,742.3Rice allowance 32.2 50,7 60.2 116.5 124.4 125.6 132.8 179.9 268.4 289.3Food allowance 13.3 16.2 26.5 33.1 49.7 50.9 51.2 109.9 194.7 248.5Other 19.4 18.2 17.9 17.5 26.2 28.4 33.6 47.1 52.8 81.5External 6.9 7.3 10.6 11.5 13.5 14.8 23.7 29.1 36.2 50.6
Material Expenditures 92.1 109.1 167.0 292.3 325.2 356.5 419.5 569.0 683.6 994.3
Domestic 82.5 99.5 155.2 280.1 315.8 346.3 398.4 539.6 651.5 950.4 fExternal 9.6 9.6 11.8 12.2 9.4 10.0 21.1 29.4 32.1 43.9
Subsidies to Regions 94.6 113.1 206.9 256.6 311.0 469.9 522.3 669.9 985.8 1,209.4
West Irian 10.6 8.2 13.2 13.4 18.6 18.7 22.1 25.0 35.4 42.0Other regions 84.0 104.9 193.7 243.2 292.4 451.2 500.2 644.9 950.4 1,167.4
Debt Service Payments 49.4 73.7 69.2 67.9 180.3 227.6 534.5 684.1 770.3 963.7
Internal 5.3 11.1 5.2 2.8 11.3 6.9 8.8 36.5 25.0 30.0External 44.1 62.6 64.0 65.1 169.0 220.7 525.7 647.6 745.3 933.7
Other Expenditures 10.8 149.3 149.4 65.0 154.4 185.9 265.8 718.9 1,034.0 1,921.4
Food subsidy - - 144.0 50.0 39.1 - 43.5 124.9 169.7 309.7Oil subsidy - - - - 34.5 65.1 197.0 534.9 828.3 1,511.1Others 10.8 149.3 5.4 15.0 80.8 120.8/a 25.3 59.1/b 36.0/c 100.6/d
Routine Expenditures 444.3 704.1 1,000.5 1,246.8 1,610.3 2,120.5 2,743.7 4,061.8 5,529.2 7,501.1
Development Expenditures /e 290.7 473.7 966.4 1,425.2 2,043.5 2,157.6 2,556.6 4,014.2 5,027.7 6,399.2
Total Expenditures 735.0 1,117.8 1,966.9 2,672.O 3,653.8 4,278.1 5,299.3 8,076.0 10,556.9 13,900.3
/a Includes debt service transfer to Pertamina (Rp 86.4 billion).7b Includes Pertamina subsidy (Rp 48.1 billion).7T Includes general election (Rp 16.5 billion).7h Includes general election (Rp 81.0 billion).7e For details, see Tables 5.4 and 5.5. co
Source: Ministry of Finance.
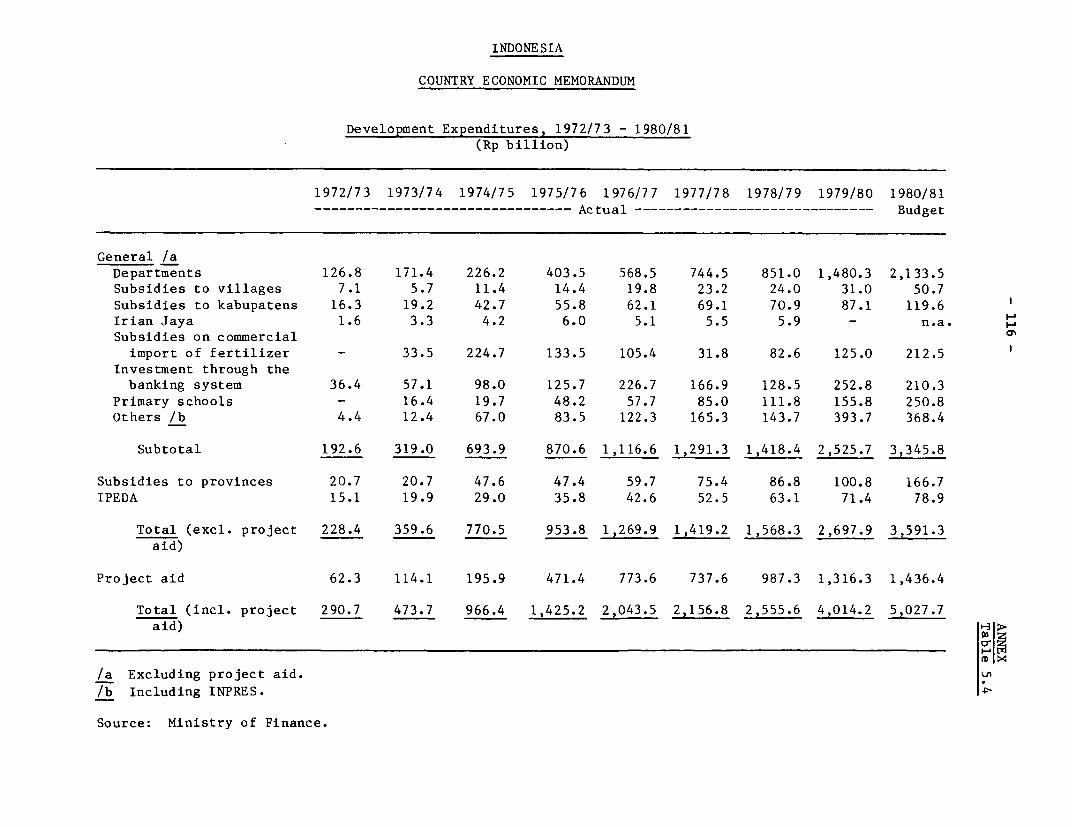
INDONESIA
COUNTRY ECONOMIC MEMORANDUM
Development Expenditures, 1972/73 - 1980/81(Rp billion)
1972/73 1973/74 1974/75 1975/76 1976/77 1977/78 1978/79 1979/80 1980/81
-------------------------------- Actual ------------------------------ Budget
General /aDepartments 126.8 171.4 226.2 403.5 568.5 744.5 851.0 1,480.3 2,133.5
Subsidies to villages 7.1 5.7 11.4 14.4 19.8 23.2 24.0 31.0 50.7
Subsidies to kabupatens 16.3 19.2 42.7 55.8 62.1 69.1 70.9 87.1 119.6
Irian Jaya 1.6 3.3 4.2 6.0 5.1 5.5 5.9 - n.a.
Subsidies on commercialimport of fertilizer - 33.5 224.7 133.5 105.4 31.8 82.6 125.0 212.5
Investment through thebanking system 36.4 57.1 98.0 125.7 226.7 166.9 128.5 252.8 210.3
Primary schools - 16.4 19.7 48.2 57.7 85.0 111.8 155.8 250.8
Others /b 4.4 12.4 67.0 83.5 122.3 165.3 143.7 393.7 368.4
Subtotal 192.6 319.0 693.9 870.6 1,116.6 1,291.3 1,418.4 2,525.7 3,345.8
Subsidies to provinces 20.7 20.7 47.6 47.4 59.7 75.4 86.8 100.8 166.7
IPEDA 15.1 19.9 29.0 35.8 42.6 52.5 63.1 71.4 78.9
Total (excl. project 228.4 359.6 770.5 953.8 1,269.9 1,419.2 1,568.3 2,697.9 3,591.3
aid)
Project aid 62.3 114.1 195.9 471.4 773.6 737.6 987.3 1,316.3 1,436.4
Total (incl. project 290.7 473.7 966.4 1,425.2 2,043.5 2,156.8 2,555.6 4,014.2 5,7.7
aid)
DXI
/a Excluding project aid.
/b Including INPRES.
Source: Ministry of Finance.
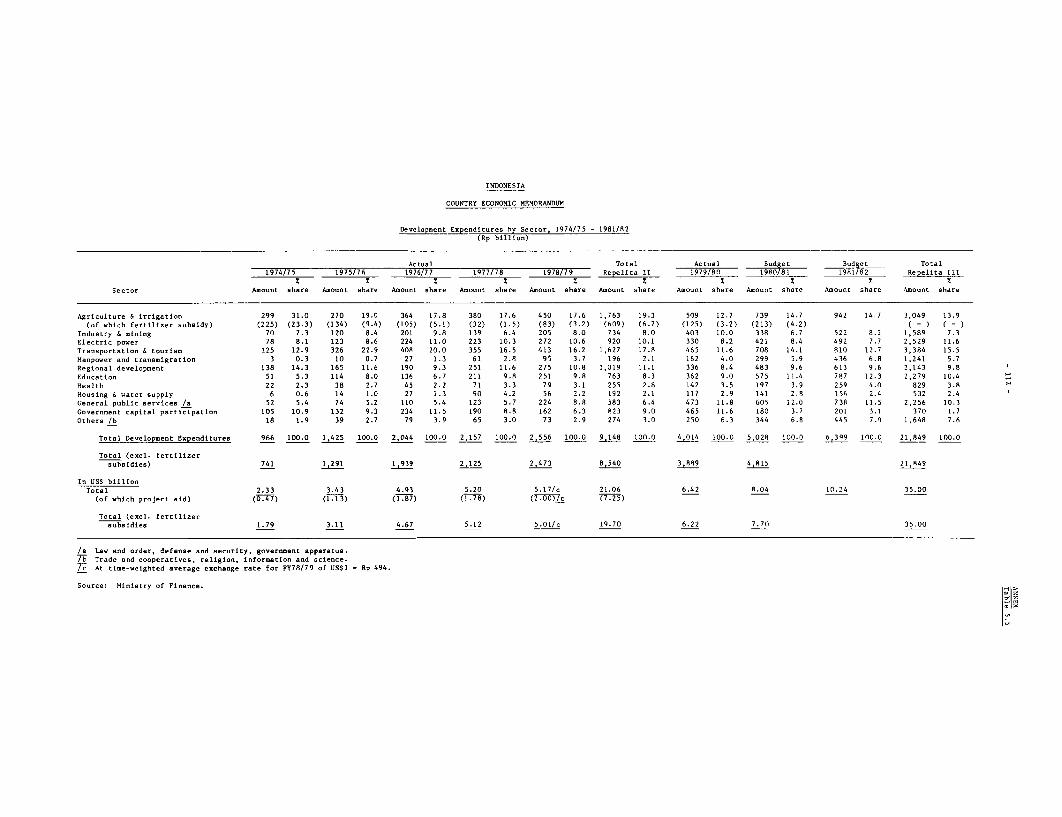
INDONESIA
COUNTRY ECONOMIC MEMORANDUM
Develop=ent Expenditures by Sector, 1974/75 - 1981/82(Rp billion)
Actual Total Actual Bdgetet Total1974/75 1975/76 1976/77 1977/79 1978/79 Repelit. 11 1979/80 T198081 1981712 Repeita III1 1 1 1~~~~~~~~__L777 197 7 -- I 9 91-O 81 R. 1t I
Sector A.ount share Amount share A=ount share Am.ount hare Amount share Asount share Amount share Amount share Amount share Amount share
Agric-lture & irrigation 299 31.0 270 19.0 364 17.8 380 17.6 450 17.6 1,763 19.3 509 12.7 739 14.7 942 14,7 3,049 13.9(of which fertlli.er subsidy) (225) (23.3) (134) (9.4) (105) (5.1) (32) (1.5) (83) (3.2) (609) (6.7) (125) (3.2) (213) (4.2) ( - ) ( - )
Industry 6 miming 70 7.3 120 8.4 201 9.8 139 6.4 205 8.0 734 8.0 403 10.0 338 6.7 522 8.2 1,589 7.3Electric power 78 8.1 123 8.6 224 11.0 223 10.3 272 10.6 920 10.1 330 8.2 421 8.4 492 7.7 2,529 11.6Transportation 4 tourism 125 12.9 326 22.9 408 20.0 355 16.5 413 16.2 1,627 17.8 465 11.6 708 14.1 810 12.7 3,384 15.5
Manpower and trans=igration 3 0.3 10 0.7 27 1.3 61 2.8 95 3.7 196 2.1 162 4.0 299 5.9 436 6.8 1,241 5.7R.egional develop=ent 138 14.3 165 11.6 190 9.3 251 11.6 275 10.8 1,019 11.1 336 8.4 483 9.6 613 9.6 2,143 9.8Education 51 5.3 114 8.0 136 6.7 211 9.8 251 9.8 763 8.3 362 9.0 575 11.4 787 12.3 2,279 10.4Health 22 2.3 38 2.7 45 2.2 71 3.3 79 3.1 255 2.8 142 3.5 197 3.9 259 4.( 829 3.8Housing S water supply 6 0.6 14 1.0 27 1.3 90 4.2 56 2.2 192 2.1 117 2.9 141 2.8 156 2.4 532 2.4Ceneral public services /a 52 5.4 74 5.2 110 5.4 123 5.7 224 8.8 583 6.4 473 11.8 605 12.0 738 11.5 2,256 10.3Government capital participation 105 10.9 132 9.3 234 11.5 190 9.8 162 6.3 823 9.0 465 11.6 180 3.7 201 3.1 370 1.7Others /b 18 1.9 39 2.7 79 3.9 65 3.0 73 2.9 274 3.0 250 6.3 344 6.8 445 7.0 1,648 7.6
Total Developm.ent Expenditures 966 100.0 1,425 100.0 2,044 100.0 2,157 100.0 2 0556 100.0 9,148 100.0 4,014 100.0 5,028 100.0 6,399 1n0.O 21,849 100.0
Total (encl. fertilizersubsidies) 741 1,291 1,939 2,125 2,473 8,540 3,8R9 4,815 21,949
In USS billionTotal 2.33 3.43 4.93 5.20 5.1
7/c 21.06 6.42 R.04 10.24 35.00
(of which project aid) (707) (1.13) (1.87) (1.78) (2.00)/c (7.25)
Total (encl. fertilizersubsidies 1.79 3.11 4.67 5.12 5.01/c 19.70 6.22 7.70 35.00
/a Las and order, defense and security, government apparatus.7i Trade and cooperatives, religium, information and science.77 At ti.e-weighted average exchange rate for FY78/79 of US$1 - Rp 494.
Source: Ministry of Finance.
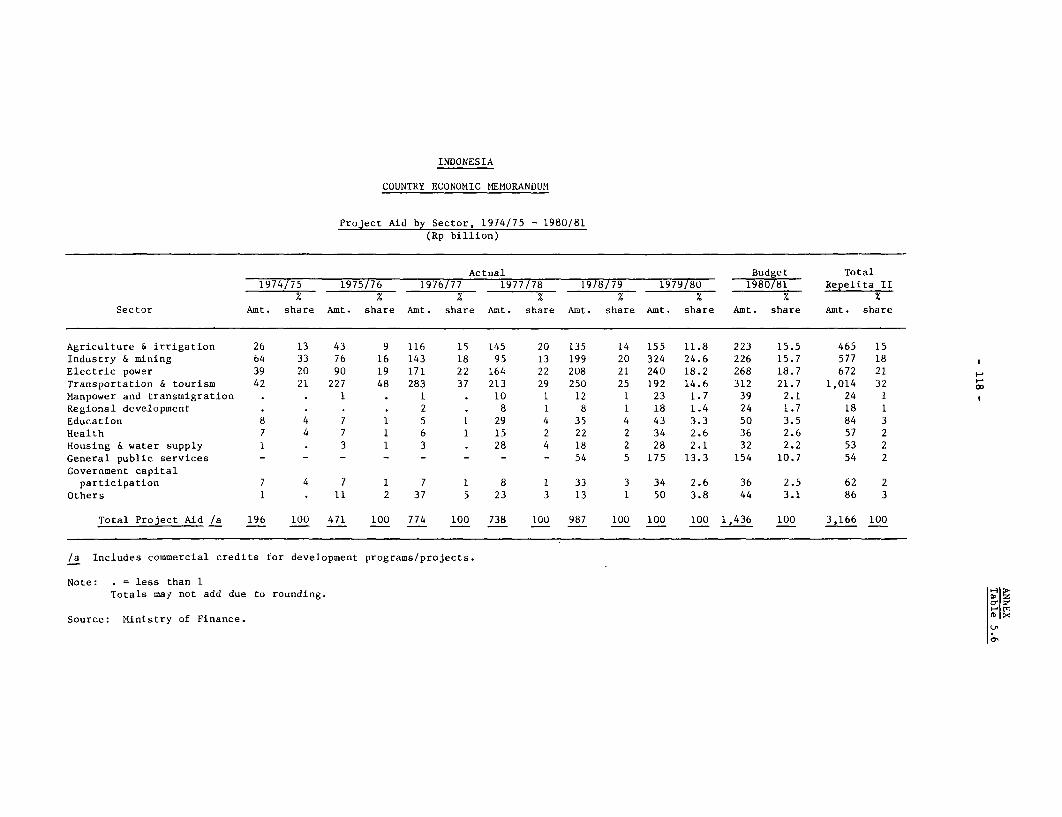
INDONESIA
COUNTRY ECONOMIC MEMORANDUM
Project Aid by Sector, 1974/75 - 1980/81(Rp billion)
Actual Budget Total1974/75 1975/76 1976/77 1977/78 1978/79 1979/80 1980/81 Repelita II
Z % X X % 7% XSector Amt. share Amt. share Amt. share Amt. share Ant. share Amt. share Amt. share Amt. share
Agriculture & irrigation 26 13 43 9 116 15 145 20 135 14 155 11.8 223 15.5 465 15Industry & mining 64 33 76 16 143 18 95 13 199 20 324 24.6 226 15.7 577 18Electric power 39 20 90 19 171 22 164 22 208 21 240 18.2 268 18.7 672 21Transportation & tourism 42 21 227 48 283 37 213 29 250 25 192 14.6 312 21.7 1,014 32Manpower and transmigration . . 1 . 1 . 10 1 12 1 23 1.7 39 2.1 24 1Regional development . . . . 2 . 8 1 8 1 18 1.4 24 1.7 18 1
Education 8 4 7 1 5 1 29 4 35 4 43 3.3 50 3.5 84 3Health 7 4 7 1 6 1 15 2 22 2 34 2.6 36 2.6 57 2Housing & water supply 1 . 3 1 3 . 28 4 18 2 28 2.1 32 2.2 53 2General public services - - - - - - - - 54 5 175 13.3 154 10.7 54 2
Government capitalparticipation 7 4 7 1 7 1 8 1 33 3 34 2.6 36 2.5 62 2
Others 1 . 11 2 37 5 23 3 13 1 50 3.8 44 3.1 86 3
Total Project Aid /a 196 100 471 100 774 100 738 100 987 100 100 100 1,436 100 3,166 100
/a Includes commercial credits for development programs/projects.
Note: . = less than 1Totals may not add due to rounding. m
Sin
Source: Ministry of Finance. m
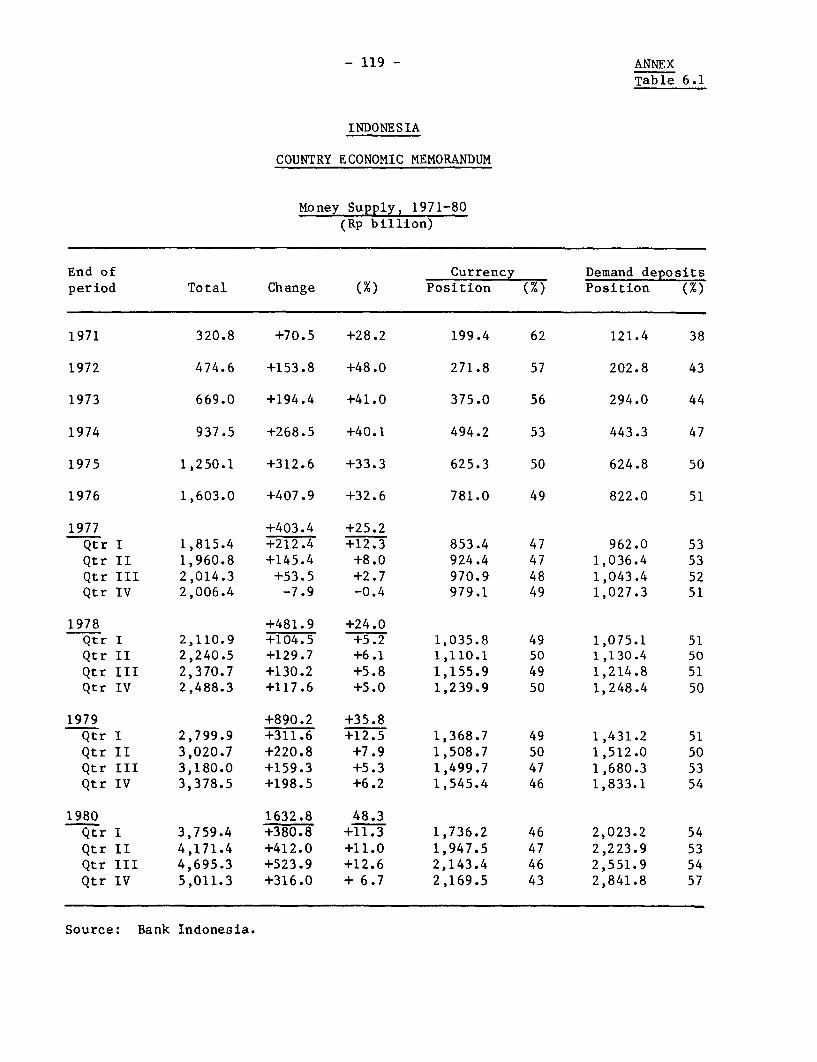
- 119 - ANNEX
Table 6.1
INDONESIA
COUNTRY ECONOMIC MEMORANDUM
Money Supply, 1971-80(Rp billion)
End of Currency Demand depositsperiod Total Change (%) Position (%) Position (%)
1971 320.8 +70.5 +28.2 199.4 62 121.4 38
1972 474.6 +153.8 +48.0 271.8 57 202.8 43
1973 669.0 +194.4 +41.0 375.0 56 294.0 44
1974 937.5 +268.5 +40.1 494.2 53 443.3 47
1975 1,250.1 +312.6 +33.3 625.3 50 624.8 50
1976 1,603.0 +407.9 +32.6 781.0 49 822.0 51
1977 +403.4 +25.2Qtr I 1,815.4 +212.4 +12.3 853.4 47 962.0 53Qtr II 1,960.8 +145.4 +8.0 924.4 47 1,036.4 53Qtr III 2,014.3 +53.5 +2.7 970.9 48 1,043.4 52Qtr IV 2,006.4 -7.9 -0.4 979.1 49 1,027.3 51
1978 +481.9 +24.0Qtr I 2,110.9 +104.5 +5.2 1,035.8 49 1,075.1 51Qtr II 2,240.5 +129.7 +6.1 1,110.1 50 1,130.4 50Qtr III 2,370.7 +130.2 +5.8 1,155.9 49 1,214.8 51Qtr IV 2,488.3 +117.6 +5.0 1,239.9 50 1,248.4 50
1979 +890.2 +35.8Qtr I 2,799.9 +311.6 +12.5 1,368.7 49 1,431.2 51Qtr II 3,020.7 +220.8 +7.9 1,508.7 50 1,512.0 50Qtr III 3,180.0 +159.3 +5.3 1,499.7 47 1,680.3 53Qtr IV 3,378.5 +198.5 +6.2 1,545.4 46 1,833.1 54
1980 1632.8 48.3Qtr I 3,759.4 +380.8 +11.3 1,736.2 46 2,023.2 54Qtr II 4,171.4 +412.0 +11.0 1,947.5 47 2,223.9 53Qtr III 4,695.3 +523.9 +12.6 2,143.4 46 2,551.9 54Qtr IV 5,011.3 +316.0 + 6.7 2,169.5 43 2,841.8 57
Source: Bank Indonesia.
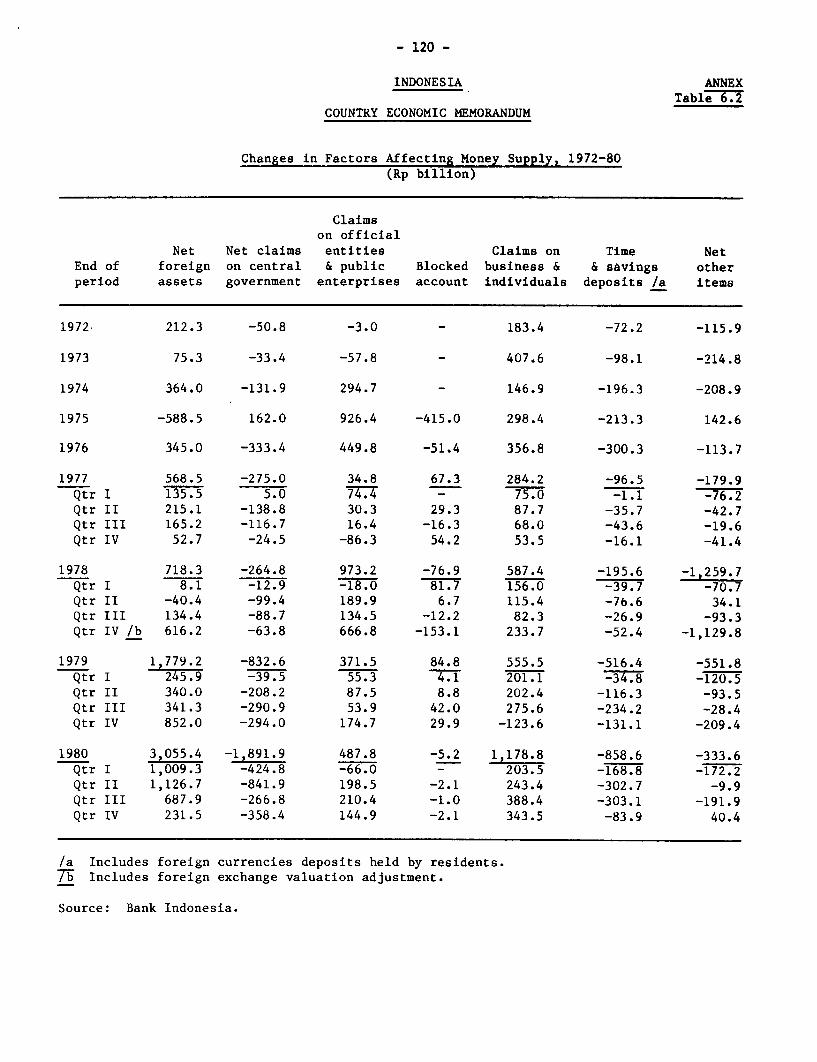
- 120 -
INDONESIA ANNEXTable r.1
COUNTRY ECONOMIC MEMORANDUM
Changes in Factors Affecting Money Supply, 1972-80(Rp billion)
Claimson official
Net Net claims entities Claims on Time NetEnd of foreign on central & public Blocked business & & savings otherperiod assets government enterprises account individuals deposits /a items
1972 212.3 -50.8 -3.0 - 183.4 -72.2 -115.9
1973 75.3 -33.4 -57.8 - 407.6 -98.1 -214.8
1974 364.0 -131.9 294.7 - 146.9 -196.3 -208.9
1975 -588.5 162.0 926.4 -415.0 298.4 -213.3 142.6
1976 345.0 -333.4 449.8 -51.4 356.8 -300.3 -113.7
1977 568.5 -275.0 34.8 67.3 284.2 -96.5 -179.9Qtr I 135.5 5.0 74.4 - 75.0 -1.1 -76.2Qtr II 215.1 -138.8 30.3 29.3 87.7 -35.7 -42.7Qtr III 165.2 -116.7 16.4 -16.3 68.0 -43.6 -19.6Qtr IV 52.7 -24.5 -86.3 54.2 53.5 -16.1 -41.4
1978 718.3 -264.8 973.2 -76.9 587.4 -195.6 -1,259.7Qtr I 8.1 -12.9 -18.0 81.7 156.0 -39.7 -70.7Qtr II -40.4 -99.4 189.9 6.7 115.4 -76.6 34.1Qtr III 134.4 -88.7 134.5 -12.2 82.3 -26.9 -93.3Qtr IV /b 616.2 -63.8 666.8 -153.1 233.7 -52.4 -1,129.8
1979 1P779.2 -832.6 371.5 84.8 555.5 -516.4 -551.8Qtr I 245.9 -39.5 55.3 4.1 201.1 -120.5Qtr II 340.0 -208.2 87.5 8.8 202.4 -116.3 -93.5Qtr III 341.3 -290.9 53.9 42.0 275.6 -234.2 -28.4Qtr IV 852.0 -294.0 174.7 29.9 -123.6 -131.1 -209.4
1980 3,055.4 -1,891.9 487.8 -5.2 1,178.8 -858.6 -333.6Qtr I 1,009.3 -424.8 -66.0 - 203.5 -168.8 -172.2Qtr II 1,126.7 -841.9 198.5 -2.1 243.4 -302.7 -9.9Qtr III 687.9 -266.8 210.4 -1.0 388.4 -303.1 -191.9Qtr IV 231.5 -358.4 144.9 -2.1 343.5 -83.9 40.4
/a Includes foreign currencies deposits held by residents.T7 Includes foreign exchange valuation adjustment.
Source: Bank Indonesia.
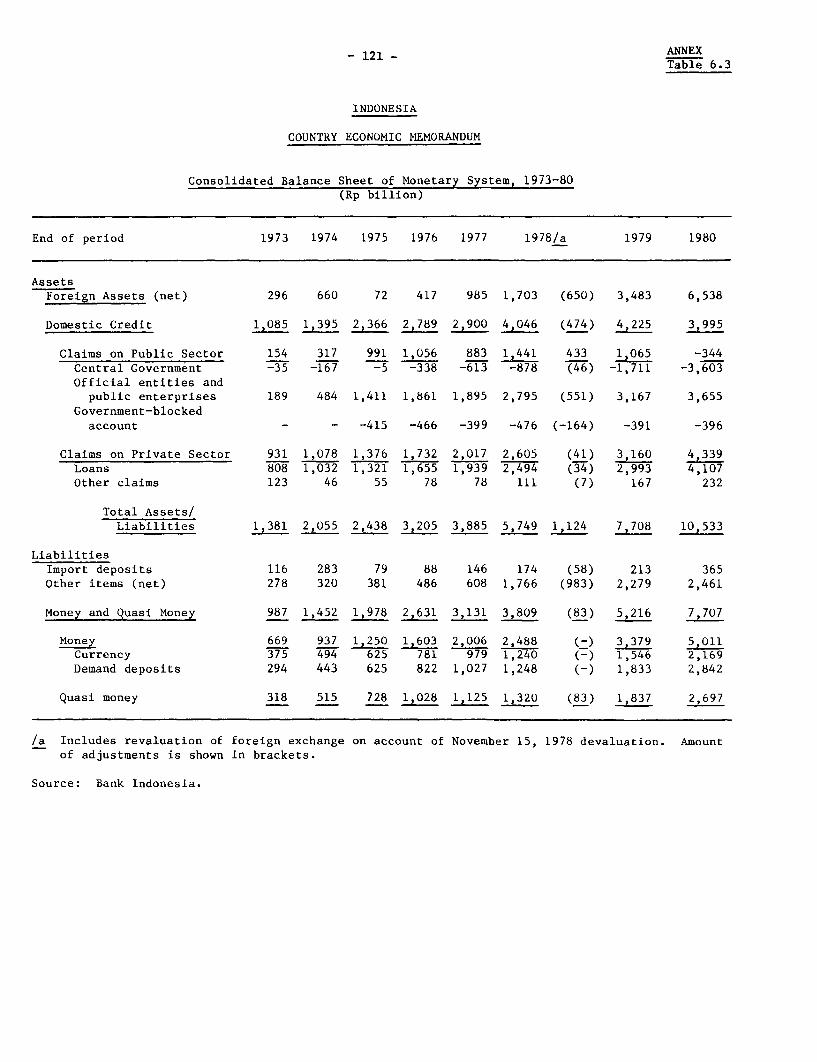
- 121 - ANNEXTable 6.3
INDONESIA
COUNTRY ECONOMIC MEMORANDUM
Consolidated Balance Sheet of Monetary System, 1973-80(Rp billion)
End of period 1973 1974 1975 1976 1977 1978/a 1979 1980
AssetsForeign Assets (net) 296 660 72 417 985 1,703 (650) 3,483 6,538
Domestic Credit 1,085 1,395 2,366 2,789 2,900 4,046 (474) 3995
Claims on Public Sector 154 317 991 1,056 883 1,441 433 1,065 -344Central Government -35 -167 -5 -338 -613 -878 (46) -1,711 -3,603Official entities and
public enterprises 189 484 1,411 1,861 1,895 2,795 (551) 3,167 3,655Government-blockedaccount - - -415 -466 -399 -476 (-164) -391 -396
Claims on Private Sector 931 1,078 1,376 1,732 2,017 2,605 (41) 3,160 4,339Loans 808 1,032 1,321 1,655 1,939 2,494 (34) 2,993 4,107Other claims 123 46 55 78 78 111 (7) 167 232
Total Assets/Liabilities 1,381 2,055 2,438 3,205 3,885 5,749 1,124 7,708 10,533
LiabilitiesImport deposits 116 283 79 88 146 174 (58) 213 365Other items (net) 278 320 381 486 608 1,766 (983) 2,279 2,461
Money and Quasi Money 987 1,452 1,978 2,631 3,131 3,809 (83) 5,216 7,707
Money 669 937 1,250 1,603 2,006 2,488 (-) 3,379 5,011Currency 375 494 625 781 979 1,240 (-) 1,546 2,169Demand deposits 294 443 625 822 1,027 1,248 (-) 1,833 2,842
Quasi money 318 515 728 1,028 1,125 1,320 (83) 1,837 2,697
/a Includes revaluation of foreign exchange on account of November 15, 1978 devaluation. Amountof adjustments is shown in brackets.
Source: Bank Indonesia.
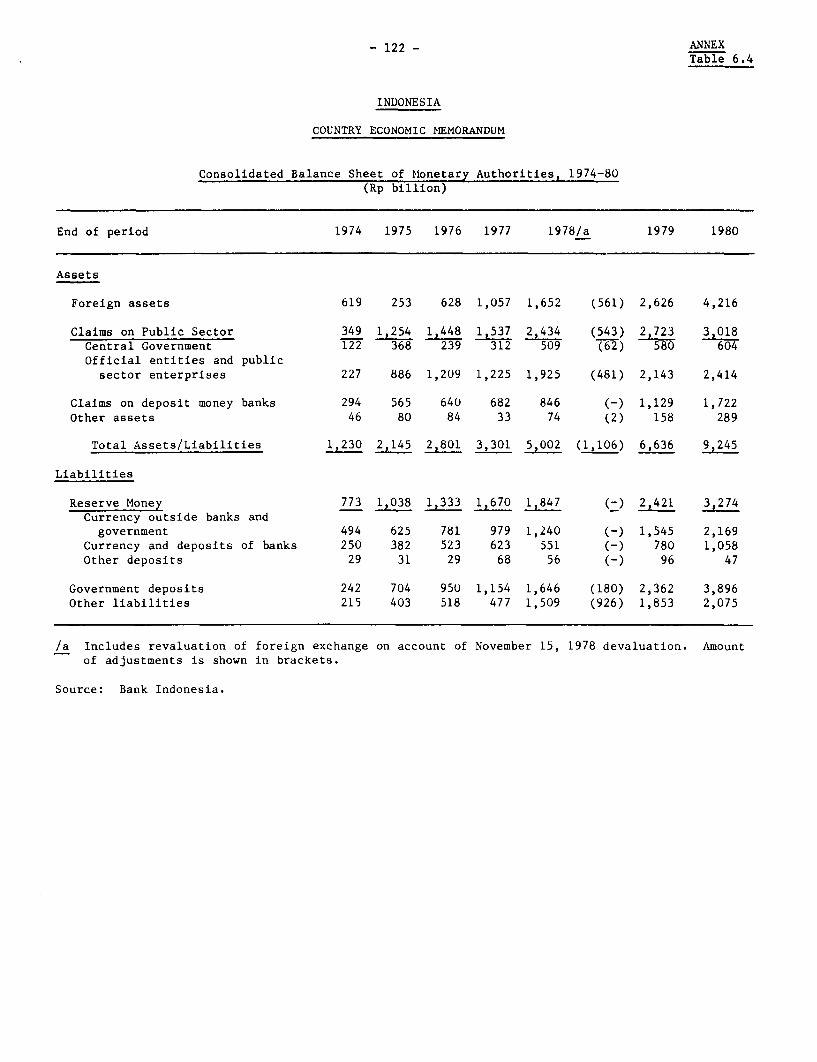
-122 - ANNEXTable 6.4
INDONESIA
COUNTRY ECONOMIC MEMORANDUM
Consolidated Balance Sheet of Monetary Authorities, 1974-80(Rp billion)
End of period 1974 1975 1976 1977 1978/a 1979 1980
Assets
Foreign assets 619 253 628 1,057 1,652 (561) 2,626 4,216
Claims on Public Sector 349 1,254 1,537 2,434 (543) 3,018Central Government 122 368 239 312 509 (62) 580 604Official entities and public
sector enterprises 227 886 1,209 1,225 1,925 (481) 2,143 2,414
Claims on deposit money banks 294 565 640 682 846 (-) 1,129 1,722Other assets 46 80 84 33 74 (2) 158 289
Total Assets/Liabilities 1,230 2, 801 3,301 5,002 (1,106) 6,636 9,245
Liabilities
Reserve Money 773 1,038 1,333 1,670 1847 (-) 2,421 3,274Currency outside banks and
government 494 625 781 979 1,240 (-) 1,545 2,169Currency and deposits of banks 250 382 523 623 551 (-) 780 1,058Other deposits 29 31 29 68 56 (-) 96 47
Government deposits 242 704 950 1,154 1,646 (180) 2,362 3,896Other liabilities 215 403 518 477 1,509 (926) 1,853 2,075
/a Includes revaluation of foreign exchange on account of November 15, 1978 devaluation. Amountof adjustments is shown in brackets.
Source: Bank Indonesia.
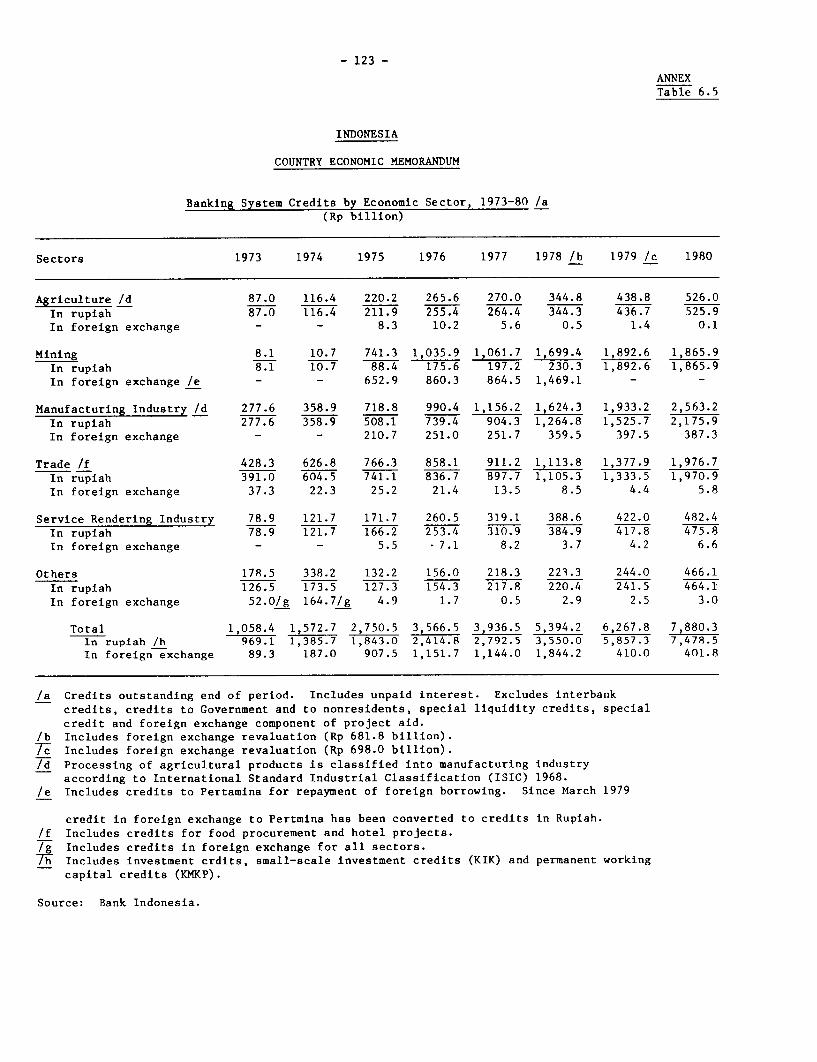
- 123 -
ANNEXTable 6.5
INDONESIA
COUNTRY ECONOMIC MEMORANDUM
Banking System Credits by Economic Sector, 1973-80 /a(Rp billion)
Sectors 1973 1974 1975 1976 1977 1978 /b 1979 /c 1980
Agriculture /d 87.0 116.4 220.2 265.6 270.0 344.8 438.8 526.0
In rupiah 87.0 116.4 211.9 255.4 264.4 344.3 436.7 525.9In foreign exchange - - 8.3 10.2 5.6 0.5 1.4 0.1
Mining 8.1 10.7 741.3 1,035.9 1,061.7 1,699.4 1,892.6 1,865.9In rupiah 8.1 10.7 88.4 175.6 197.2 230.3 1,892.6 1,865.9In foreign exchange /e - - 652.9 860.3 864.5 1,469.1 - -
Manufacturing Industry /d 277.6 358.9 718.8 990.4 1,156.2 1,624.3 1,933.2 2,563.2In rupiah 277.6 358.9 508.1 739.4 904.3 1,264.8 1,525.7 2,175.9In foreign exchange - - 210.7 251.0 251.7 359.5 397.5 387.3
Trade /f 428.3 626.8 766.3 858.1 911.2 1,113.8 1,377.9 1,976.7In rupiah 391.0 604.5 741.1 836.7 897.7 1,105.3 1,333.5 1,970.9
In foreign exchange 37.3 22.3 25.2 21.4 13.5 8.5 4.4 5.8
Service Rendering Industry 78.9 121.7 171.7 260.5 319.1 388.6 422.0 482.4In rupiah 78.9 121.7 166.2 253.4 310.9 384.9 417.8 475.8In foreign exchange - - 5.5 - 7.1 8.2 3.7 4.2 6.6
Others 178.5 338.2 132.2 156.0 218.3 223.3 244.0 466.1In rupiah 126.5 173.5 127.3 154.3 217.8 220.4 241.5 464.1In foreign exchange 52.0/g 164.7/g 4.9 1.7 0.5 2.9 2.5 3.0
Total 1,058.4 1,572.7 2,750.5 3,566.5 3,936.5 5,394.2 6,267.8 7,880.3In rupiah /h 969.1 1,385.7 1,843.0 2,414.8 2,792.5 3,550.0 5,857.3 7,478.5In foreign exchange 89.3 187.0 907.5 1,151.7 1,144.0 1,844.2 410.0 401.8
/a Credits outstanding end of period. Includes unpaid interest. Excludes interbankcredits, credits to Government and to nonresidents, special liquidity credits, specialcredit and foreign exchange component of project aid.
/b Includes foreign exchange revaluation (Rp 681.8 billion).7T Includes foreign exchange revaluation (Rp 698.0 billion).Id Processing of agricultural products is classified into manufacturing industry
according to International Standard Industrial Classification (ISIC) 1968./e Includes credits to Pertamina for repayment of foreign borrowing. Since March 1979
credit in foreign exchange to Pertmina has been converted to credits in Rupiah./f Includes credits for food procurement and hotel projects./g Includes credits in foreign exchange for all sectors.7Ih Includes investment crdits, small-scale investment credits (KIK) and permanent working
capital credits (KMKP).
Source: Bank Indonesia.
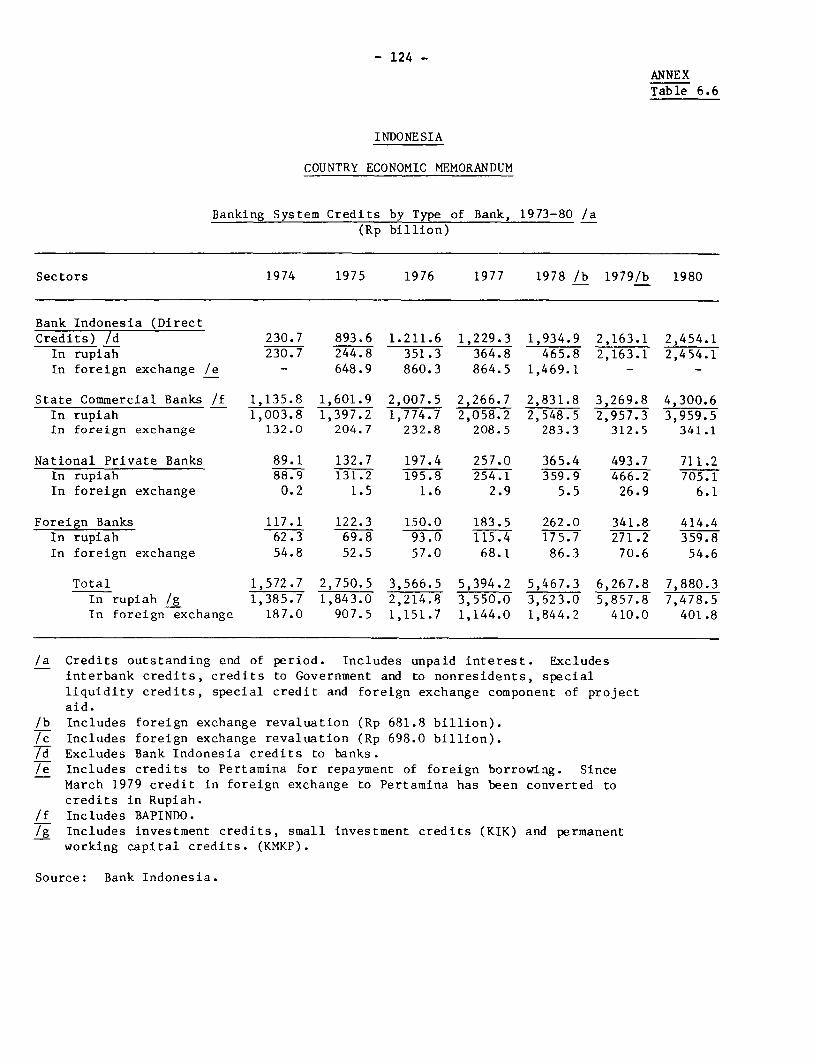
- 124 -
ANNEX
Table 6.6
INDONESIA
COUNTRY ECONOMIC MEMORANDUM
Banking System Credits by Type of Bank, 1973-80 /a(Rp billion)
Sectors 1974 1975 1976 1977 1978 /b 1979/b 1980
Bank Indonesia (Direct
Credits) /d 230.7 893.6 1.211.6 1,229.3 1,934.9 2,163.1 2,454.1In rupiah 230.7 244.8 351.3 364.8 465.8 2,163.1 2,454.1In foreign exchange /e - 648.9 860.3 864.5 1,469.1 - -
State Commercial Banks /f 1,135.8 1,601.9 2,007.5 2,266.7 2,831.8 3,269.8 4,300.6In rupiah 1,003.8 1,397.2 1,774.7 2,058.2 2,548.5 2,957.3 3,959.5In foreign exchange 132.0 204.7 232.8 208.5 283.3 312.5 341.1
National Private Banks 89.1 132.7 197.4 257.0 365.4 493.7 711.2In rupiah 88.9 131.2 195.8 254.1 359.9 466.2 705.1In foreign exchange 0.2 1.5 1.6 2.9 5.5 26.9 6.1
Foreign Banks 117.1 122.3 150.0 183.5 262.0 341.8 414.4In rupiah 62.3 69.8 93.0 115.4 175.7 271.2 359.8
In foreign exchange 54.8 52.5 57.0 68.1 86.3 70.6 54.6
Total 1,572.7 2,750.5 3,566.5 5,394.2 5,467.3 6,267.8 7,880.3In rupiah /g 1,385.7 1,843.0 2,214.8 3,550.0 3,623.0 5,857.8 7,478.5In foreign exchange 187.0 907.5 1,151.7 1,144.0 1,844.2 410.0 401.8
/a Credits outstanding end of period. Includes unpaid interest. Excludesinterbank credits, credits to Government and to nonresidents, specialliquidity credits, special credit and foreign exchange component of projectaid.
/b Includes foreign exchange revaluation (Rp 681.8 billion).
Ic Includes foreign exchange revaluation (Rp 698.0 billion).Th Excludes Bank Indonesia credits to banks./e Includes credits to Pertamina for repayment of foreign borrowing. Since
March 1979 credit in foreign exchange to Pertamina has been converted tocredits in Rupiah.
/f Includes BAPINDO./g Includes investment credits, small investment credits (KIK) and permanent
working capital credits. (KMKP).
Source: Bank Indonesia.
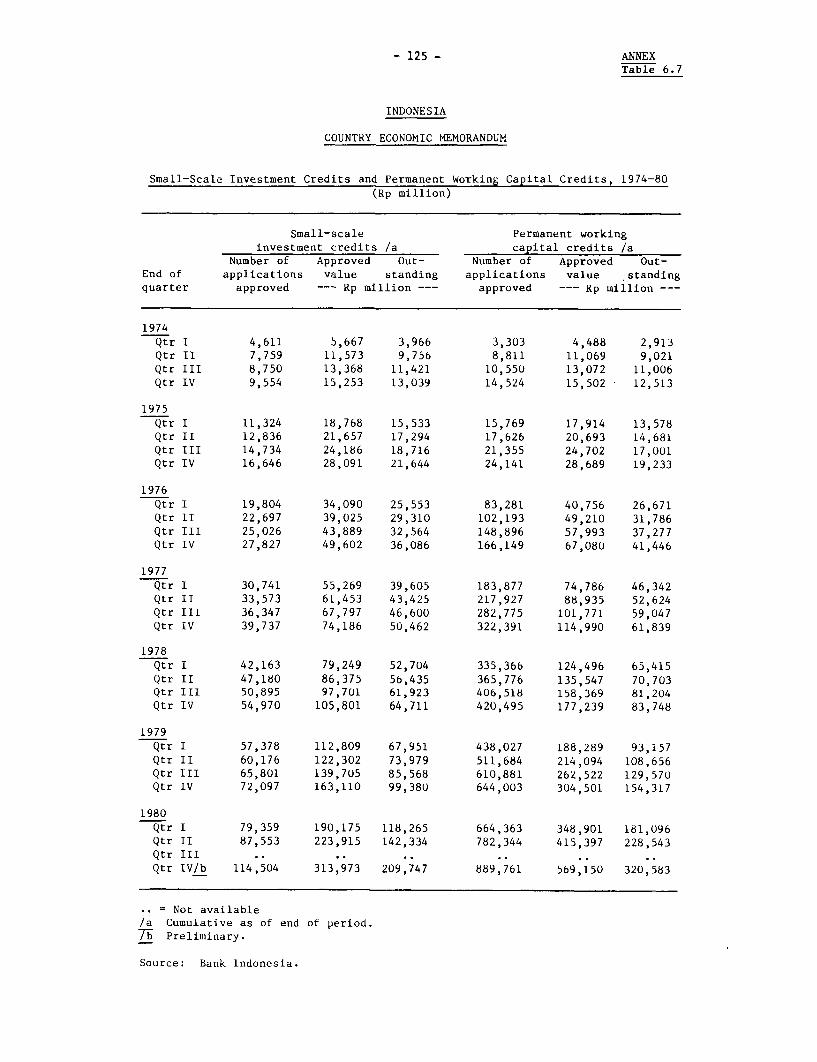
- 125 - ANNEXTable 6.7
INDONESIA
COUNTRY ECONOMIC MEMORANDUM
Small-Scale Investment Credits and Permanent Working Capital Credits, 1974-80(Rp million)
Small-scale Permanent workinginvestment credits /a capital credits /a
Number of Approved Out- Number of Approved Out-End of applications value standing applications value standingquarter approved --- Rp million --- approved --- Rp million ---
1974Qtr I 4,611 5,667 3,966 3,303 4,488 2,913Qtr II 7,759 11,573 9,756 8,811 11,069 9,021Qtr III 8,750 13,368 11,421 10,550 13,072 11,006Qtr IV 9,554 15,253 13,039 14,524 15,502 12,513
1975Qtr I 11,324 18,768 15,533 15,769 17,914 13,578Qtr II 12,836 21,657 17,294 17,626 20,693 14,681Qtr III 14,734 24,186 18,716 21,355 24,702 17,001Qtr IV 16,646 28,091 21,644 24,141 28,689 19,233
1976Qtr I 19,804 34,090 25,553 83,281 40,756 26,671Qtr II 22,697 39,025 29,310 102,193 49,210 31,786Qtr III 25,026 43,889 32,564 148,896 57,993 37,277Qtr IV 27,827 49,602 36,086 166,149 67,080 41,446
1977Qtr I 30,741 55,269 39,605 183,877 74,786 46,342Qtr II 33,573 61,453 43,425 217,927 88,935 52,624Qtr III 36,347 67,797 46,600 282,775 101,771 59,047Qtr IV 39,737 74,186 50,462 322,391 114,990 61,839
1978Qtr I 42,163 79,249 52,704 335,366 124,496 65,415Qtr II 47,180 86,375 56,435 365,776 135,547 70,703Qtr III 50,895 97,701 61,923 406,518 158,369 81,204Qtr IV 54,970 105,801 64,711 420,495 177,239 83,748
1979Qtr I 57,378 112,809 67,951 438,027 188,289 93,157Qtr II 60,176 122,302 73,979 511,684 214,094 108,656Qtr III 65,801 139,705 85,568 610,881 262,522 129,570Qtr IV 72,097 163,110 99,380 644,003 304,501 154,317
1980Qtr I 79,359 190,175 118,265 664,363 348,901 181,096Qtr II 87,553 223,915 142,334 782,344 415,397 228,543Qtr III.........
Qtr IV/b 114,504 313,973 209,747 889,761 569,150 320,583
= Not available/a Cumulative as of end of period.7E Preliminary.
Source: bank lndonesia.
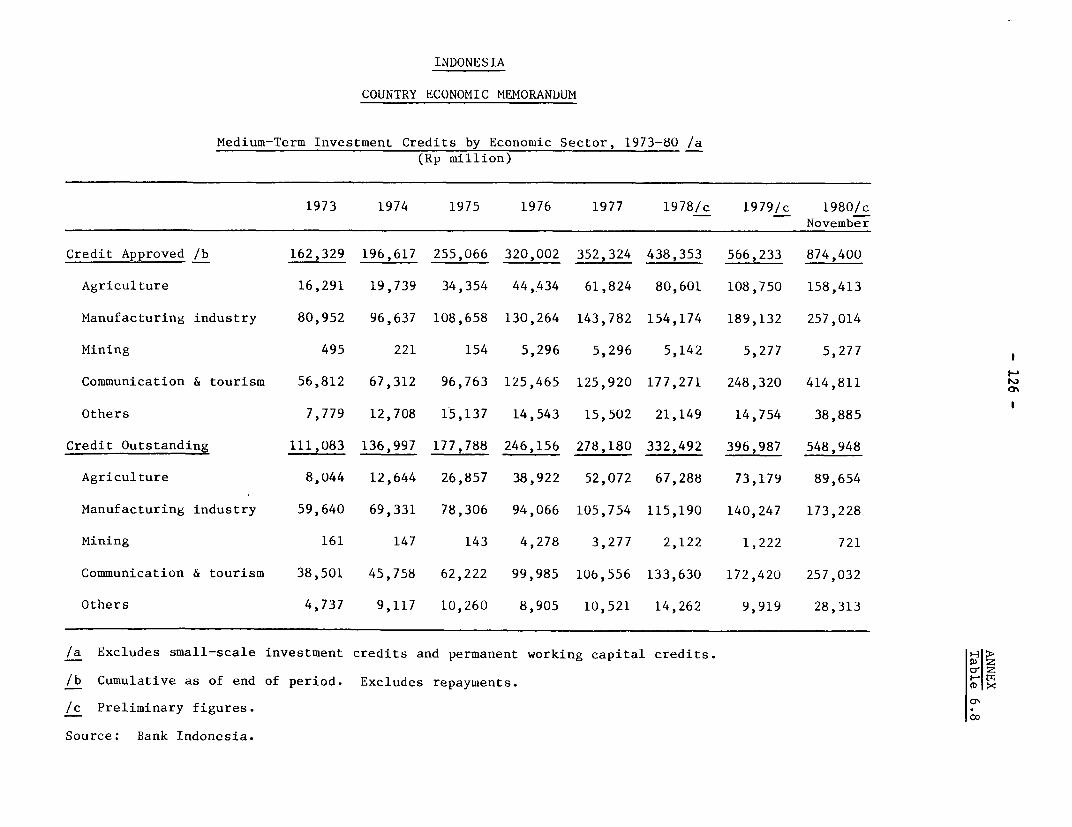
INDONESIA
COUNTRY ECONOMIC MEMORANDUM
Medium-Term Investment Credits by Economic Sector, 1973-80 /a
(Rp million)
1973 1974 1975 1976 1977 1978/c 1979/c 1980/cNovember
Credit Approved /b 162,329 196,617 255,066 320,002 352,324 438,353 566,233 874,400
Agriculture 16,291 19,739 34,354 44,434 61,824 80,601 108,750 158,413
Manufacturing industry 80,952 96,637 108,658 130,264 143,782 154,174 189,132 257,014
Mining 495 221 154 5,296 5,296 5,142 5,277 5,277
Communication & tourism 56,812 67,312 96,763 125,465 125,920 177,271 248,320 414,811
Others 7,779 12,708 15,137 14,543 15,502 21,149 14,754 38,885
Credit Outstanding 111,083 136,997 177,788 246,156 278,180 332,492 396,987 548,948
Agriculture 8,044 12,644 26,857 38,922 52,072 67,288 73,179 89,654
Manufacturing industry 59,640 69,331 78,306 94,066 105,754 115,190 140,247 173,228
Mining 161 147 143 4,278 3,277 2,122 1,222 721
Communication & tourism 38,501 45,758 62,222 99,985 106,556 133,630 172,420 257,032
Others 4,737 9,117 10,260 8,905 10,521 14,262 9,919 28,313
/a Excludes small-scale investment credits and permanent working capital credits.
/b Cumulative as of end of period. Excludes repayments.
/c Preliminary figures.
Source: Bank Indonesia.
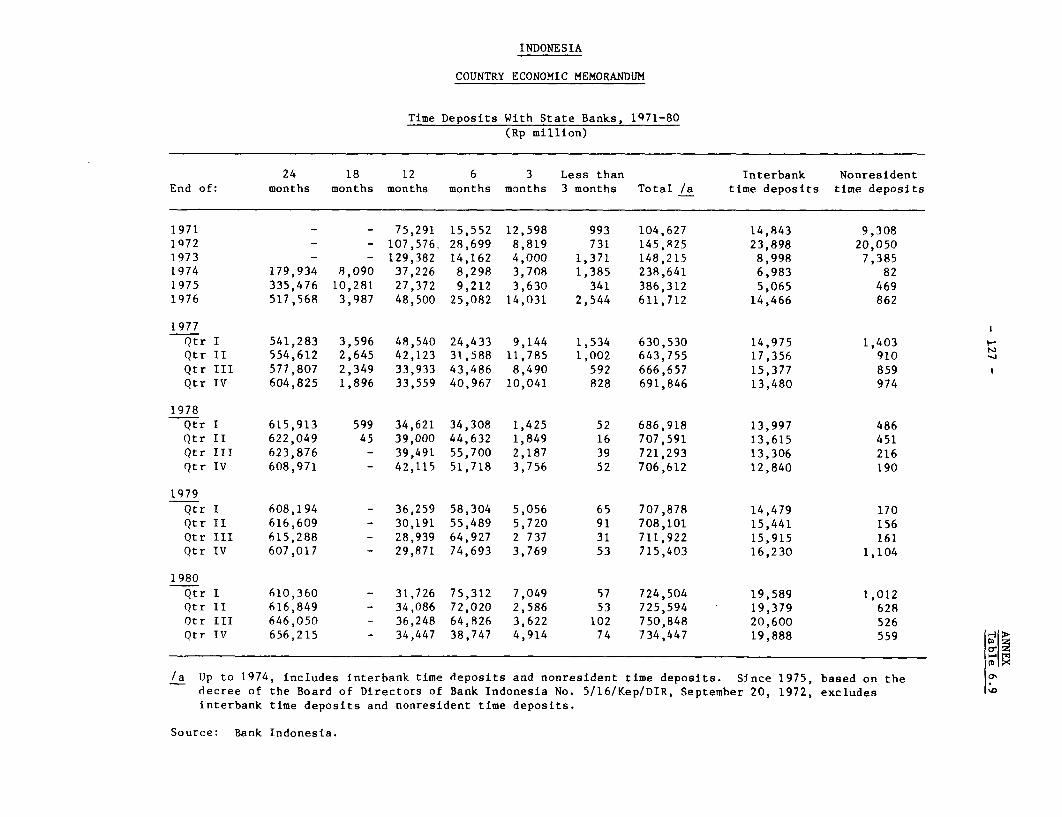
INDONESIA
COUNTRY ECONOMIC MEMORANDUM
Time Deposits With State Banks, 1471-80(Rp million)
24 18 12 6 3 Less than Interbank NonresidentEnd of: months months months months months 3 months Total /a time deposits time deposits
1971 - - 75,291 15,552 12,598 993 104,627 14,843 9,3081472 _ - 107,576, 28,699 8,819 731 145,R25 23,898 20,0501973 - - 129,382 14,162 4,000 1,371 148,215 8,998 7,3851974 179,934 8,090 37,226 8,298 3,708 1,385 238,641 6,983 821975 335,476 10,281 27,372 9,212 3,630 341 386,312 5,065 4691976 517,568 3,987 48,500 25,082 14,031 2,544 611,712 14,466 862
1977Qtr I 541,283 3,596 48,540 24,433 9,144 1,534 630,530 14,975 1,403Qtr II 554,612 2,645 42,123 31,588 11,785 1,002 643,755 17,356 910 -
Qtr III 577,807 2,349 33,933 43,486 8,490 592 666,657 15,377 859Qtr IV 604,825 1,896 33,559 40,967 10,041 828 691,846 13,480 974
1978Qtr I 615,913 599 34,621 34,308 1,425 52 686,918 13,997 486Qtr II 622,049 45 39,000 44,632 1,849 16 707,591 13,615 451Qtr III 623,876 - 39,491 55,700 2,187 39 721,293 13,306 216Qtr IV 608,971 - 42,115 51,718 3,756 52 706,612 12,840 190
1979Qtr I 608,194 - 36,259 58,304 5,056 65 707,878 14,479 170Qtr II 616,609 - 30,191 55,489 5,720 91 708,101 15,441 156Qtr III 615,288 - 28,939 64,927 2 737 31 711,922 15,915 161Qtr IV 607,017 - 29,871 74,693 3,769 53 715,403 16,230 1,104
1980Qtr I 610,360 - 31,726 75,312 7,049 57 724,504 19,589 1,012Qtr II 616,849 - 34,086 72,020 2,586 53 725,594 19,379 628Otr III 646,050 - 36,248 64,826 3,622 102 750,848 20,600 526Qtr IV 656,215 - 34,447 38,747 4,914 74 734,447 19,888 559
Xx
/a Up to 1974, includes interbank time deposits and nonresident time deposits. Since 1975, based on the adecree of the Board of Directors of Bank Indonesia No. 5/16/Kep/DIR, September 20, 1972, excludesinterbank time deposits and nonresident time deposits.
Source: Bank Indonesia.
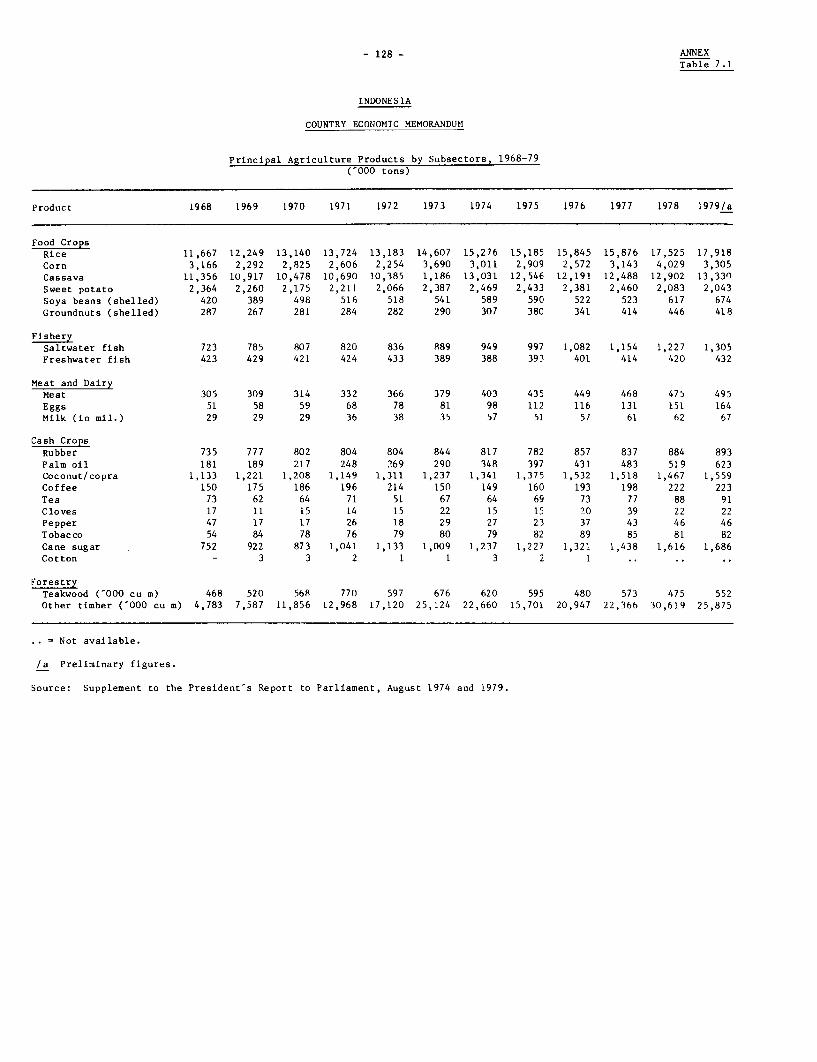
- 128 - ANNEXTable 7.1
INDONESIA
COUNTRY ECONOMIC MEMORANDUM
Principal Agriculture Products by Subsectors, 1968-79( 000 tons)
Product 1968 1969 1970 1971 1972 1973 1974 1975 1976 1977 1978 1979/a
Food Crops
Rice 11,667 12,249 13,140 13,724 13,183 14,607 15,276 15,185 15,845 15,876 17,525 17,918Corn 3,166 2,292 2,825 2,606 2,254 3,690 3,011 2,909 2,572 3,143 4,029 3,305
Cassava 11,356 10,917 10,478 10,690 10,385 1,186 13,031 12,546 12,191 12,488 12,902 13,330
Sweet potato 2,364 2,260 2,175 2,211 2,066 2,387 2,469 2,433 2,381 2,460 2,083 2,043Soya beans (shelled) 420 389 498 516 518 541 589 590 522 523 617 674Groundnuts (shelled) 287 267 281 284 282 290 307 380 341 414 446 418
FisherySaltwater fish 723 785 807 820 836 889 949 997 1,082 1,154 1,227 1,305Freshwater fish 423 429 421 424 433 389 388 393 401 414 420 432
Meat and DairyMeat 305 309 314 332 366 379 403 435 449 468 475 495Eggs 51 58 59 68 78 81 98 112 116 131 151 164Milk (in mil.) 29 29 29 36 38 35 57 51 57 61 62 67
Cash CropsRubber 735 777 802 804 804 844 817 782 857 837 884 893Palm oil 181 189 217 248 269 290 348 397 431 483 519 623Coconut/copra 1,133 1,221 1,208 1,149 1,311 1,237 1,341 1,375 1,532 1,518 1,467 1,559Coffee 150 175 186 196 214 150 149 160 193 198 222 223
Tea 73 62 64 71 51 67 64 69 73 77 88 91
Cloves 17 11 15 14 15 22 15 15 20 39 22 22Pepper 47 17 17 26 18 29 27 23 37 43 46 46Tobacco 54 84 78 76 79 80 79 82 89 85 81 82Cane sugar 752 922 873 1,041 1,133 1,009 1,237 1,227 1,321 1,438 1,616 1,686Cotton - 3 3 2 1 1 3 2 1 .. ..
ForestryTeakwood (-000 cu m) 468 520 568 770 597 676 620 595 480 573 475 552Other timber ('000 cu m) 4,783 7,587 11,856 12,968 17,120 25,124 22,660 15,701 20,947 22,366 30,619 25,875
.= Not available.
/a Preliminary figures.
Source: Supplement to the President's Report to Parliament, August 1974 and 1979.
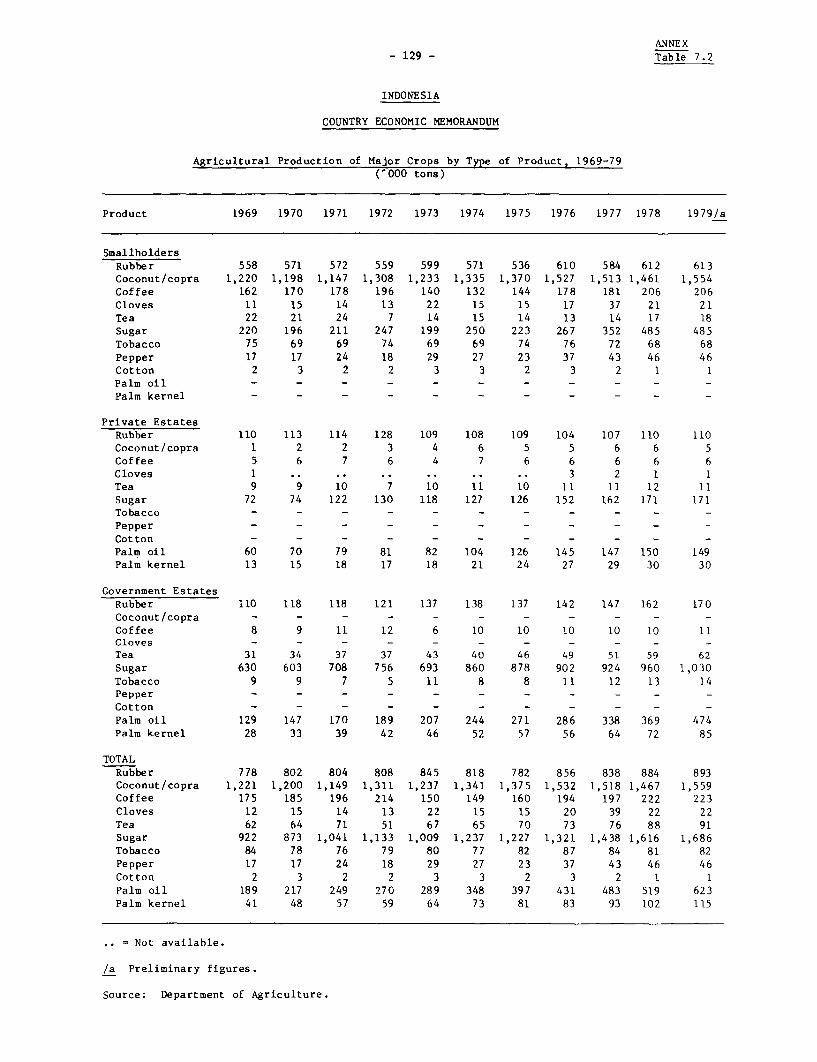
ANNEX
- 129 - Table 7.2
INDONESIA
COUNTRY ECONOMIC MEMORANDUM
Agricultural Production of Major Crops by Type of Product, 1969-79('000 tons)
Product 1969 1970 1971 1972 1973 1974 1975 1976 1977 1978 19 791a
SmnallholdersRubber 558 571 572 559 599 571 536 610 584 612 613Coconut/copra 1,220 1,198 1,147 1,308 1,233 1,335 1,370 1,527 1,513 1,461 1,554Coffee 162 170 178 196 140 132 144 178 181 206 206Cloves 11 15 14 13 22 15 15 17 37 21 21Tea 22 21 24 7 14 15 14 13 14 17 18Sugar 220 196 211 247 199 250 223 267 352 485 485Tobacco 75 69 69 74 69 69 74 76 72 68 68Pepper 17 17 24 18 29 27 23 37 43 46 46Cotton 2 3 2 2 3 3 2 3 2 1 1Palm oil - - - - - - - - - - -
Palm kernel - - - - - - - - - - -
Private EstatesRubber 110 113 114 128 109 108 109 104 107 110 110Coconut/copra 1 2 2 3 4 6 5 5 6 6 5Coffee 5 6 7 6 4 7 6 6 6 6 6Cloves 1I . . . . . . 3 2 1 1
Tea 9 9 10 7' 10 11 10 11 11 12 IISugar 72 74 122 130 118 127 126 152 162 171 171Tobacco - - - - - - - - - - -
Pepper- - - - - - - - --
Cotton- - - - ----- -
Palm oil 60 70 79 81 82 104 126 145 147 150 149Palm kernel 13 15 18 17 18 21 24 27 29 30 30
Government EstatesRubber 110 118 118 121 137 138 137 142 147 162 170coconut/copra - - - - - - - - - - -
Coffee 8 9 11 12 6 10 10 10 10 10 11Cloves - - - - - - - - - - -
Tea 31 34 37 37 43 40 46 49 51 59 62Sugar 630 603 708 756 693 860 878 902 924 960 1,030Tobacco 9 9 7 5 11 8 8 11 12 13 14Pepper - - - - - - - - - - -
Cotton - - - - - - - - - - -
Palm oil 129 147 170 189 207 244 271 286 338 369 474Palm kernel 28 33 39 42 46 52 57 56 64 72 85
TOTALRubber 778 802 804 808 845 818 782 856 838 884 893Coconut/copra 1,221 1,200 1,149 1,311 1,237 1,341 1,375 1,532 1,518 1,467 1,559Coffee 175 185 196 214 150 149 160 194 197 222 223Cloves 12 15 14 13 22 15 15 20 39 22 22Tea 62 64 71 51 67 65 70 73 76 88 91Sugar 922 873 1,041 1,133 1,009 1,237 1,227 1,321 1,438 1,616 1,686Tobacco 84 78 76 79 80 77 82 87 84 81 82Pepper 17 17 24 18 29 27 23 37 43 46 46Cotton 2 3 2 2 3 3 2 3 2 1 1Palm oil 189 217 249 270 289 348 397 431 483 519 623Palm kernel 41 48 57 59 64 73 81 83 93 102 115
- Not available.
/a Preliminary figures.
Source: Department of Agriculture.
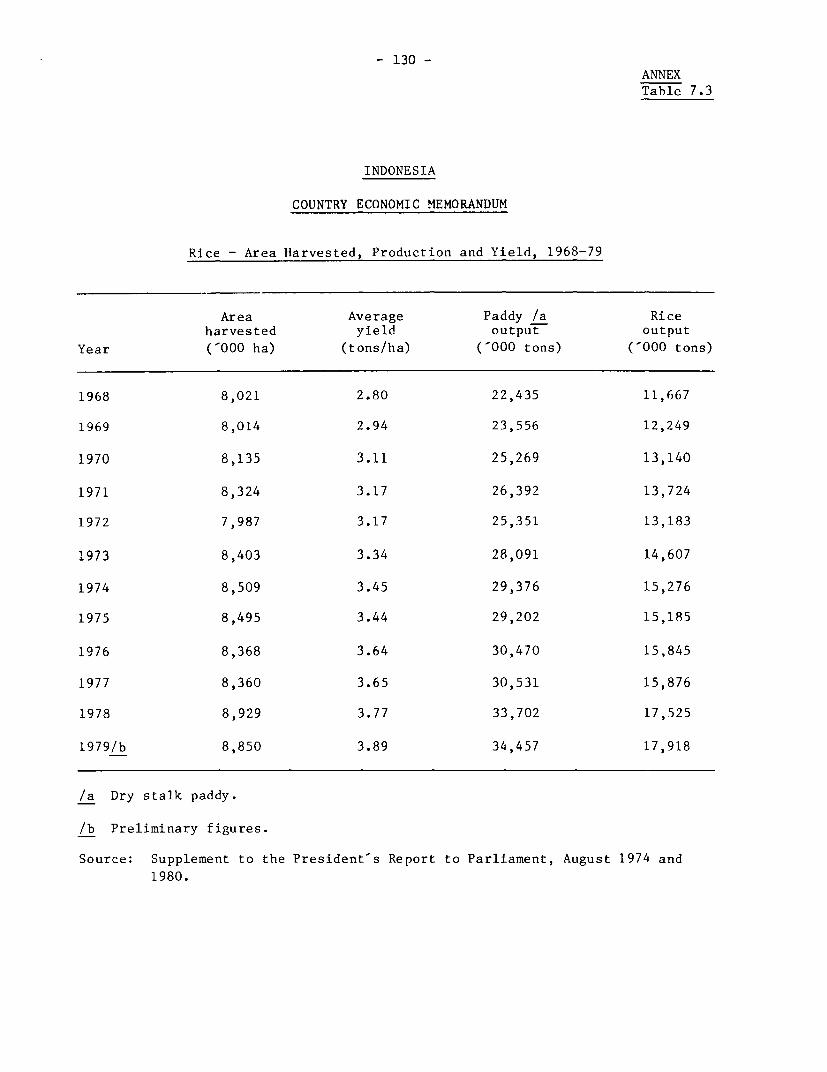
- 130 -ANNEX
Table 7.3
INDONESIA
COUNTRY ECONOMIC MEMORANDUM
Rice - Area Harvested, Production and Yield, 1968-79
Area Average Paddy /a Riceharvested yield output output
Year ('000 ha) (tons/ha) ('000 tons) ( 000 tons)
1968 8,021 2.80 22,435 11,667
1969 8,014 2.94 23,556 12,249
1970 8,135 3.11 25,269 13,140
1971 8,324 3.17 26,392 13,724
1972 7,987 3.17 25,351 13,183
1973 8,403 3.34 28,091 14,607
1974 8,509 3.45 29,376 15,276
1975 8,495 3.44 29,202 15,185
1976 8,368 3.64 30,470 15,845
1977 8,360 3.65 30,531 15,876
1978 8,929 3.77 33,702 17,525
1979/b 8,850 3.89 34,457 17,918
/a Dry stalk paddy.
/b Preliminary figures.
Source: Supplement to the President's Report to Parliament, August 1974 and1980.
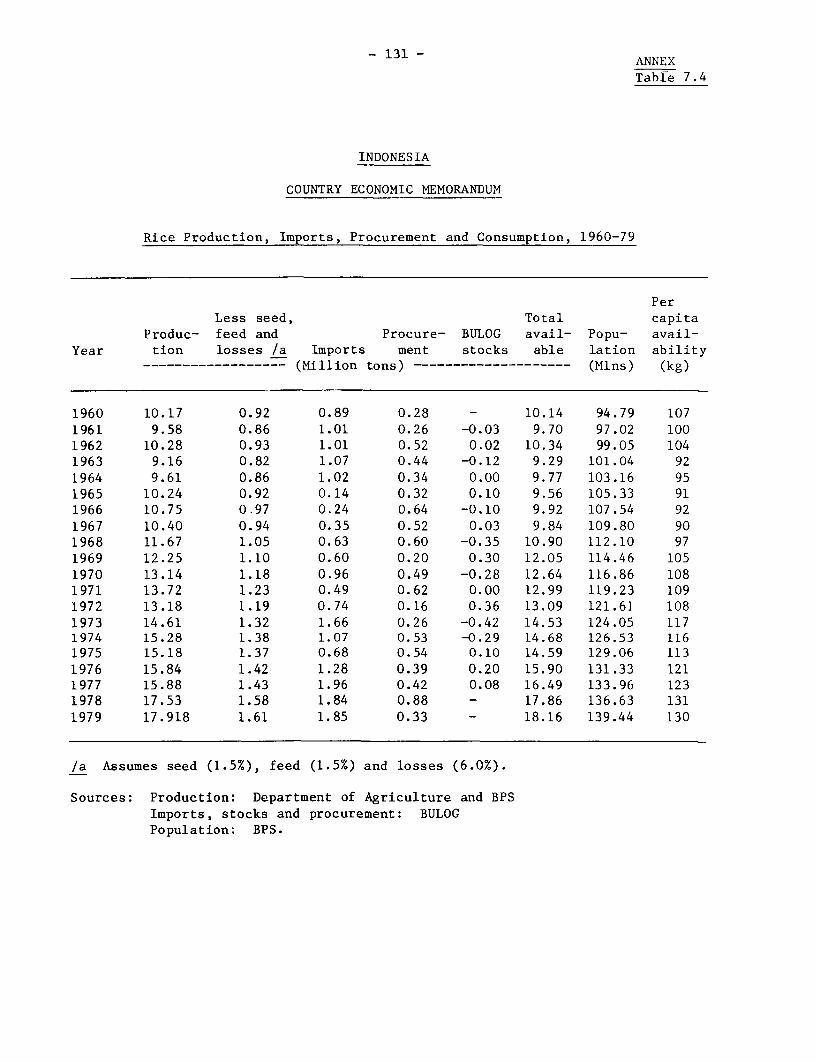
- 131 - ANNEX
Table 7.4
INDONESIA
COUNTRY ECONOMIC MEMORANDUM
Rice Production, Imports, Procurement and Consumption, 1960-79
Per
Less seed, Total capita
Produc- feed and Procure- BULOG avail- Popu- avail-
Year tion losses /a Imports ment stocks able lation ability
------------------ (Million tons) -------------------- (Mlns) (kg)
1960 10.17 0.92 0.89 0.28 - 10.14 94.79 1071961 9.58 0.86 1.01 0.26 -0.03 9.70 97.02 100
1962 10.28 0.93 1.01 0.52 0.02 10.34 99.05 104
1963 9.16 0.82 1.07 0.44 -0.12 9.29 101.04 92
1964 9.61 0.86 1.02 0.34 0.00 9.77 103.16 95
1965 10.24 0.92 0.14 0.32 0.10 9.56 105.33 91
1966 10.75 0.97 0.24 0.64 -0.10 9.92 107.54 92
1967 10.40 0.94 0.35 0.52 0.03 9.84 109.80 90
1968 11.67 1.05 0.63 0.60 -0.35 10.90 112.10 97
1969 12.25 1.10 0.60 0.20 0.30 12.05 114.46 105
1970 13.14 1.18 0.96 0.49 -0.28 12.64 116.86 108
1971 13.72 1.23 0.49 0.62 0.00 12.99 119.23 109
1972 13.18 1.19 0.74 0.16 0.36 13.09 121.61 108
1973 14.61 1.32 1.66 0.26 -0.42 14.53 124.05 1171974 15.28 1.38 1.07 0.53 -0.29 14.68 126.53 1161975 15.18 1.37 0.68 0.54 0.10 14.59 129.06 113
1976 15.84 1.42 1.28 0.39 0.20 15.90 131.33 121
1977 15.88 1.43 1.96 0.42 0.08 16.49 133.96 1231978 17.53 1.58 1.84 0.88 - 17.86 136.63 131
1979 17.918 1.61 1.85 0.33 - 18.16 139.44 130
/a Assumes seed (1.5%), feed (1.5%) and losses (6.0%).
Sources: Production: Department of Agriculture and BPS
Imports, stocks and procurement: BULOG
Population: BPS.
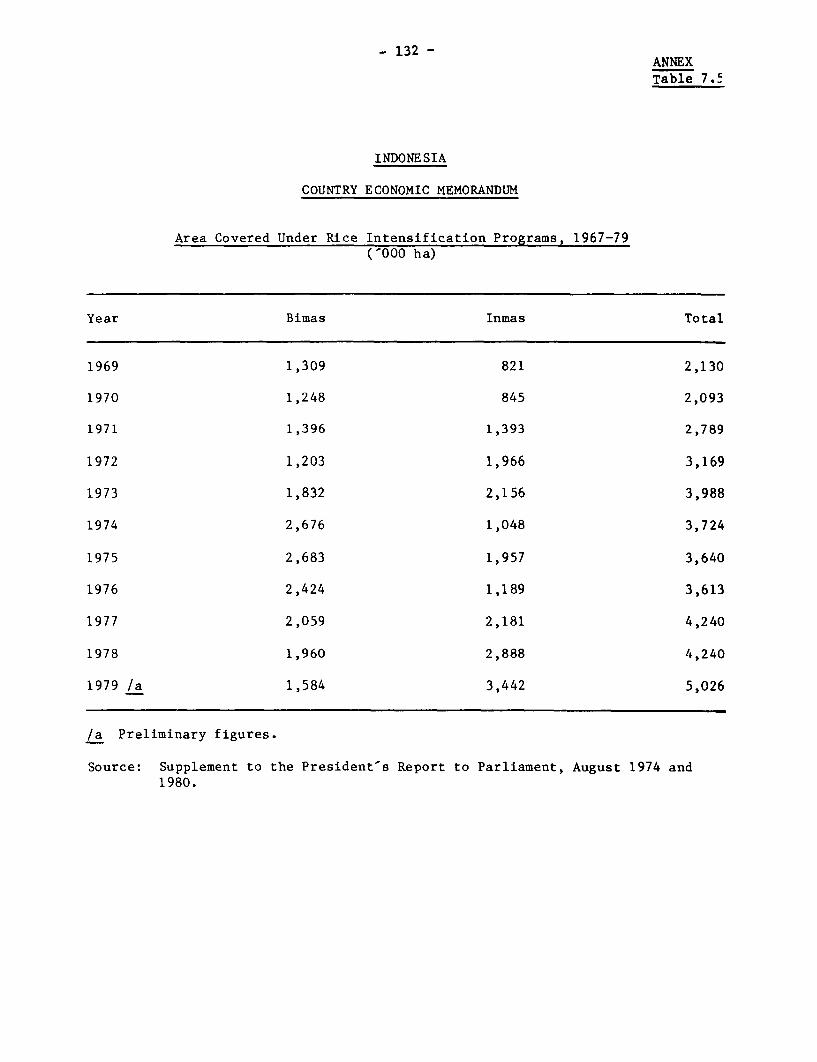
- 132 -ANNEXTable 7.5
INDONESIA
COUNTRY ECONOMIC MEMORANDUM
Area Covered Under Rice Intensification Programs, 1967-79('000 ha)
Year Bimas Inmas Total
1969 1,309 821 2,130
1970 1,248 845 2,093
1971 1,396 1,393 2,789
1972 1,203 1,966 3,169
1973 1,832 2,156 3,988
1974 2,676 1,048 3,724
1975 2,683 1,957 3,640
1976 2,424 1,189 3,613
1977 2,059 2,181 4,240
1978 1,960 2,888 4,240
1979 /a 1,584 3,442 5,026
/a Preliminary figures.
Source: Supplement to the President's Report to Parliament, August 1974 and1980.
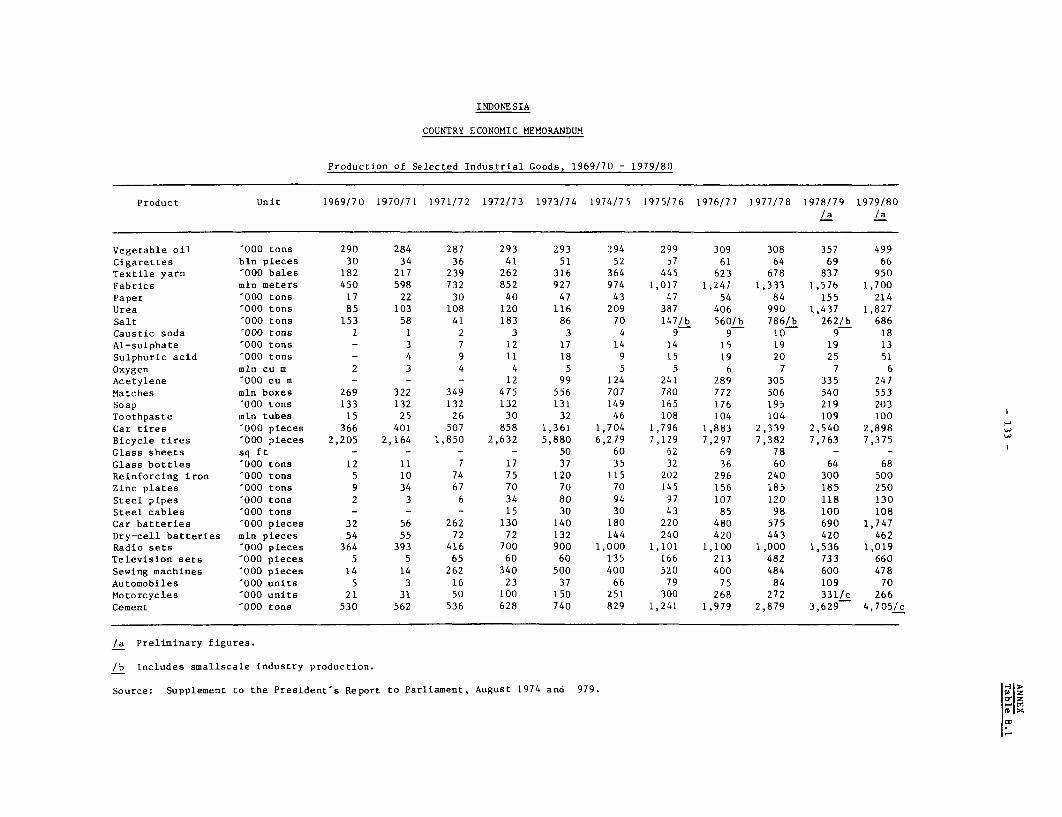
INDONESIA
COUNTRY ECONOMIC MEMORANDUM
Production of Selected Industrial Goods, 1969/70 - 1979/80
Product Unit 1969/70 1970/71 1971/72 1972/73 1973/74 1974/75 1975/76 1976/77 1977/78 1978/79 1979/80
/a /a
Vegetable oil 000 tons 290 284 287 293 293 294 299 309 308 357 499
Cigarettes bln pieces 30 34 36 41 51 52 57 61 64 69 66
Textile yarn 000 bales 182 217 239 262 316 364 445 623 678 837 950
Fabrics mln meters 450 598 732 852 927 974 1,017 1,247 1,333 1,576 1,700
Paper 000 tons 17 22 30 40 47 43 47 54 84 155 214
Urea 000 tons 85 103 108 120 116 209 387 406 990 1,437 1,827
Salt 000 tons 153 58 41 183 86 70 147/b 560/b 786/b 262/b 686
Caustic soda 000 tons 1 1 2 3 3 4 9 9 10 9 18
Al-sulphate 000 tons - 3 7 12 17 14 14 15 19 19 13
Sulphuric acid 000 tons - 4 9 11 18 9 15 19 20 25 51
Oxygen mln cu m 2 3 4 4 5 5 5 6 7 7 6
Acetylene 000 cu m - - - 12 99 124 241 289 305 335 247
Matches mln boxes 269 322 349 475 556 707 780 772 506 540 553
Soap 000 tons 133 132 132 132 131 149 165 176 195 219 203
Toothpaste mln tubes 15 25 26 30 32 46 108 104 104 109 100 I
Car tires 000 pieces 366 401 507 858 1,361 1,704 1,796 1,883 2,339 2,540 2,898 w
Bicycle tires '000 pieces 2,205 2,164 1,850 2,632 5,880 6,279 7,129 7,297 7,382 7,763 7,375 w
Glass sheets sq ft - - - - 50 60 62 69 78 - -
Glass bottles 000 tons 12 11 7 17 37 35 32 36 60 64 68
Reinforcing iron 000 tons 5 10 74 75 120 115 202 296 240 300 500
Zinc plates 000 tons 9 34 67 70 70 70 145 156 185 185 250
Steel pipes 000 tons 2 3 6 34 80 94 97 107 120 118 130
Steel cables '000 tons - - - 15 30 30 43 85 98 100 108
Car batteries '000 pieces 32 56 262 130 140 180 220 480 575 690 1,747
Dry-cell batteries mln pieces 54 55 72 72 132 144 240 420 443 420 462
Radio sets 000 pieces 364 393 416 700 900 1,000 1,101 1,100 1,000 1,536 1,019
Television sets 000 pieces 5 5 65 60 60 135 166 213 482 733 660
Sewing machines 000 pieces 14 14 262 340 500 400 520 400 484 600 478
Automobiles 000 units 5 3 16 23 37 66 79 75 84 109 70
Motorcycles 000 units 21 31 50 100 150 251 300 268 272 331/c 266
Cement 000 tons 530 562 536 628 740 829 1,241 1,979 2,879 3,629 4,705/c
/a Preliminary figures.
/b Includes smallscale industry production.
Source: Supplement to the President-s Report to Parliament, August 1974 and 979.
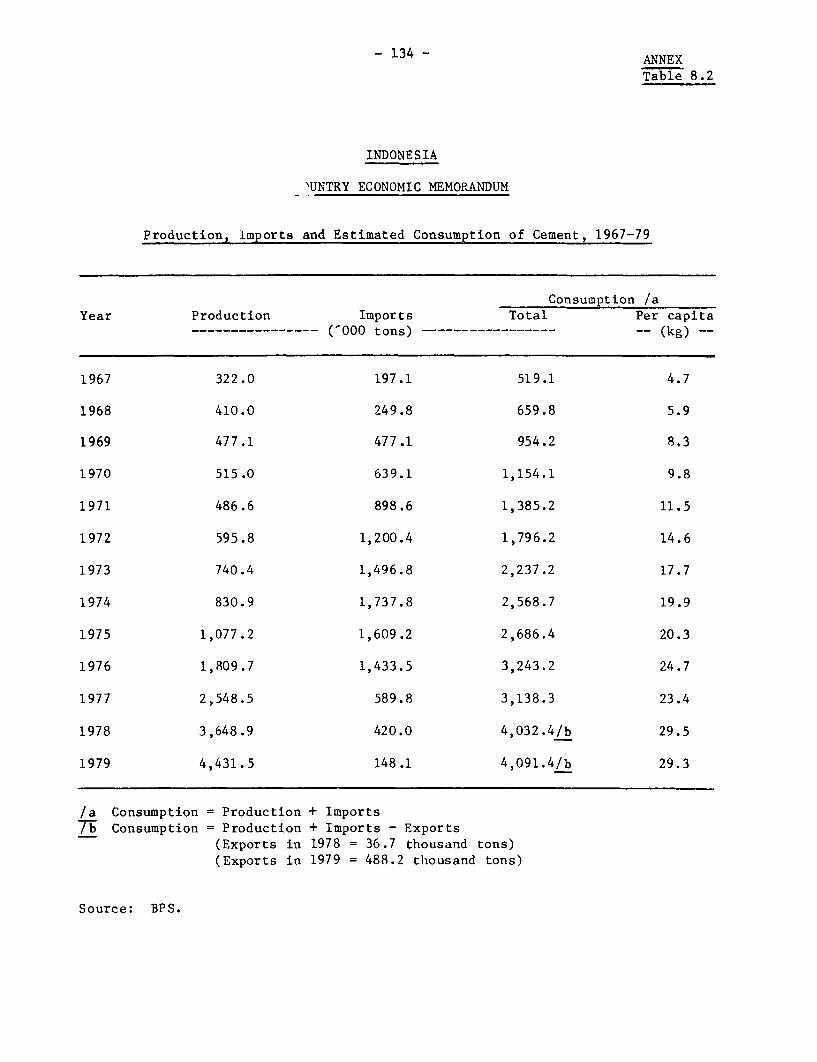
- 134 - ANNEX
Table 8.2
INDONESIA
'UNTRY ECONOMIC MEMORANDUM
Production, lmports and Estimated Consumption of Cement, 1967-79
Consumption /aYear Production Imports Total Per capita
…__------------- ('000 tons) - …-------------- -- (kg) -
1967 322.0 197.1 519.1 4.7
1968 410.0 249.8 659.8 5.9
1969 477.1 477.1 954.2 8.3
1970 515.0 639.1 1,154.1 9.8
1971 486.6 898.6 1,385.2 11.5
1972 595.8 1,200.4 1,796.2 14.6
1973 740.4 1,496.8 2,237.2 17.7
1974 830.9 1,737.8 2,568.7 19.9
1975 1,077.2 1,609.2 2,686.4 20.3
1976 1,809.7 1,433.5 3,243.2 24.7
1977 2,548.5 589.8 3,138.3 23.4
1978 3,648.9 420.0 4,032.4/b 29.5
1979 4,431.5 148.1 4,091.4/b 29.3
/a Consumption = Production + Imports7b Consumption = Production + Imports - Exports
(Exports in 1978 = 36.7 thousand tons)(Exports in 1979 = 488.2 thousand tons)
Source: BPS.
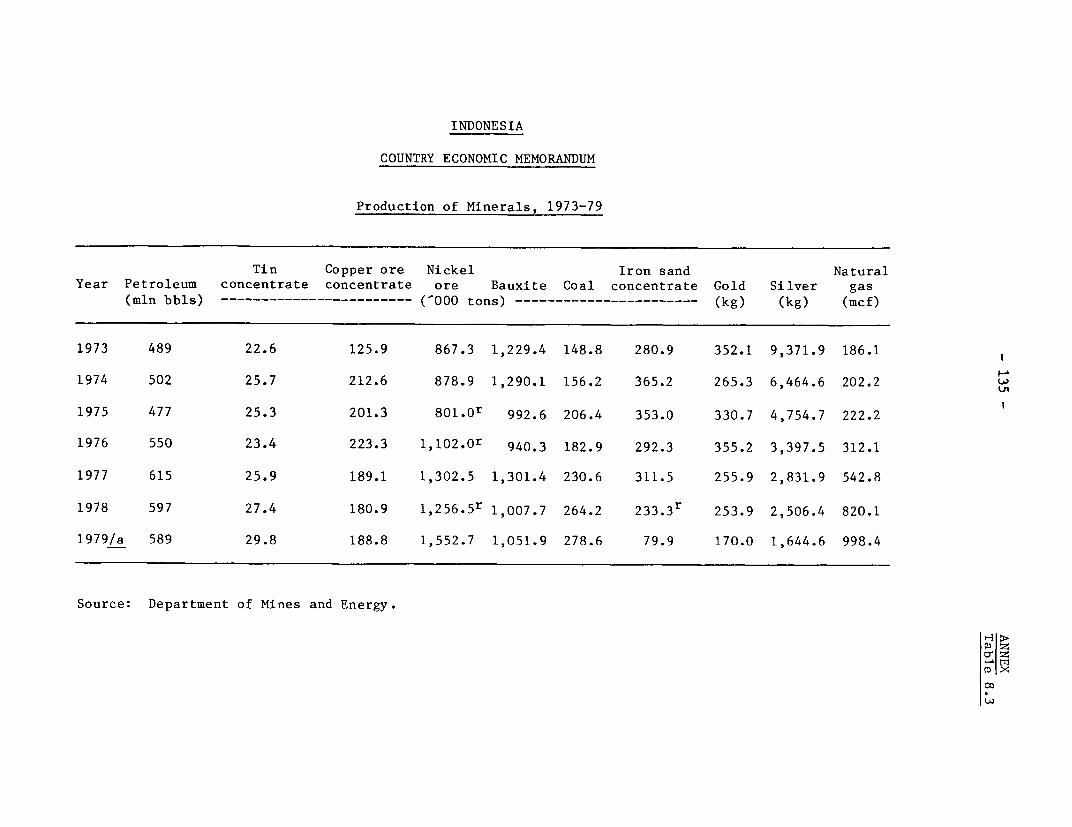
INDONESIA
COUNTRY ECONOMIC MEMORANDUM
Production of Minerals, 1973-79
Tin Copper ore Nickel Iron sand NaturalYear Petroleum concentrate concentrate ore Bauxite Coal concentrate Gold Silver gas
(mln bbls) ------------------------ ('000 tons) ----------------------- (kg) (kg) (mcf)
1973 489 22.6 125.9 867.3 1,229.4 148.8 280.9 352.1 9,371.9 186.1 1
1974 502 25.7 212.6 878.9 1,290.1 156.2 365.2 265.3 6,464.6 202.2 w
1975 477 25.3 201.3 8 0 1 .0r 992.6 206.4 353.0 330.7 4,754.7 222.2
1976 550 23.4 223.3 1,102.Or 940.3 182.9 292.3 355.2 3,397.5 312.1
1977 615 25.9 189.1 1,302.5 1,301.4 230.6 311.5 255.9 2,831.9 542.8
1978 597 27.4 180.9 1,2 56 .5r 1,007.7 264.2 233.3r 253.9 2,506.4 820.1
1979/a 589 29.8 188.8 1,552.7 1,051.9 278.6 79.9 170.0 1,644.6 998.4
Source: Department of Mines and Energy.
l-At
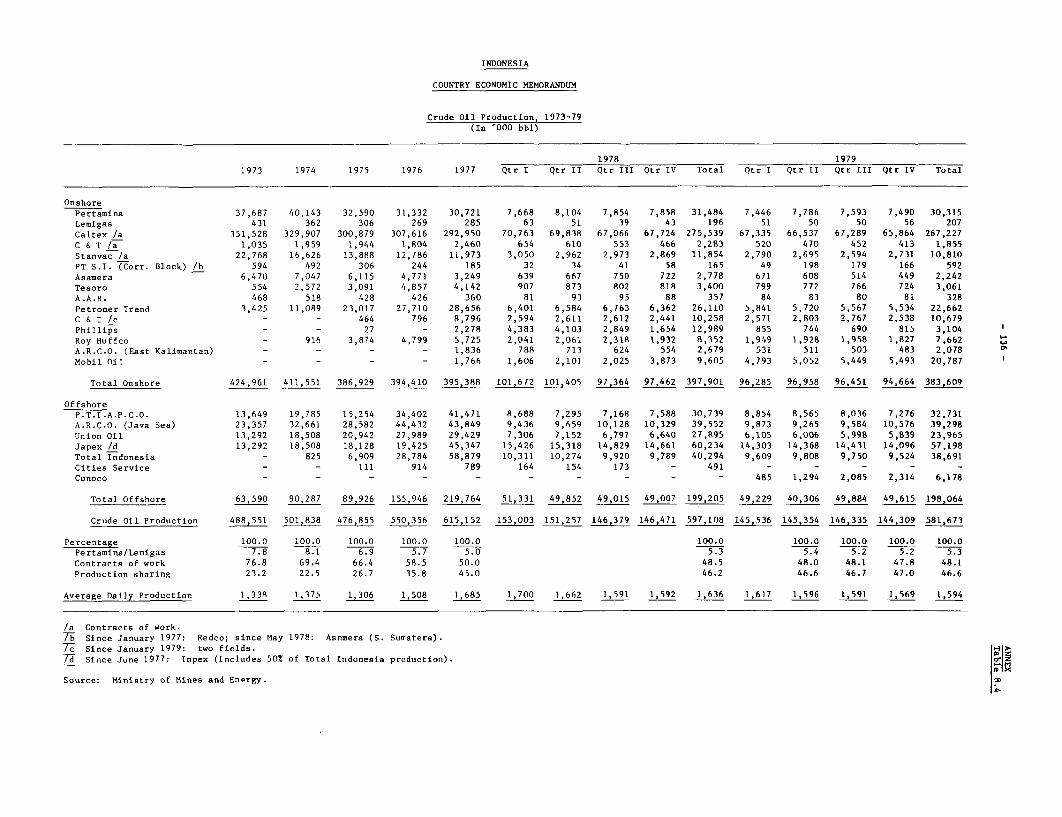
INDONESIA
COUNTRY ECONOMIC MEMORANDUM
Crude Oil Production 1973-79(In 000 bbl)
1978 1979
1973 1974 1975 1976 1977 Qtr I Qtr II Qtr III Qtr IV Total Qtr I Qtr II Qtr III Qtr IV Total
OnshorePertamina 37,687 40,143 32,590 31,332 30,721 7,668 8,104 7,854 7,858 31,484 7,446 7,786 7,593 7,490 30,315
Lemigas 431 362 306 269 285 63 51 39 43 196 51 50 50 56 207
Caltex /a 351,528 329,907 300,879 307,616 292,950 70,763 69,838 67,066 67,724 275,539 67,335 66,537 67,289 65,864 267,227
C & T /a 1,035 1,959 1,944 1,804 2,460 654 610 553 466 2,283 520 470 452 413 1,855
Stanvac /a 22,768 16,626 13,888 12,786 11,973 3,050 2,962 2,973 2,869 11,854 2,790 2,695 2,594 2,731 10,810
PT S.1. (Corr. Block) /b 594 492 306 244 185 32 34 41 58 165 49 198 179 166 592
Asamera 6,470 7,047 6,115 4,771 3,249 639 667 750 722 2,778 671 608 514 449 2,242
Tesoro 554 2,572 3,091 4,857 4,142 907 873 802 818 3,400 799 772 766 724 3,061
A.A.R. 468 518 428 426 360 81 93 95 88 357 84 83 80 81 328
Petromer Trend 3,425 11,089 23,017 27,710 28,656 6,401 6,584 6,763 6,362 26,110 5,841 5,720 5,567 5,534 22,662
C & T /c - - 464 796 8,796 2,594 2,611 2,612 2,441 10,258 2,571 2,803 2,767 2,538 10,679
Phillips - - 27 - 2,278 4,383 4,103 2,849 1,654 12,989 855 744 690 815 3,104
Roy Huffco - 916 3,874 4,799 5,725 2,041 2,061 2,31R 1,932 8,352 1,949 1,928 1,958 1,827 7,662A.R.C.O. (East Kalimantan) - - - - 1,836 788 713 624 554 2,679 531 511 503 483 2,078
Mobil Oil - - - - 1,766 1,606 2,101 2,025 3,873 9,605 4,793 5,052 5,449 5,493 20,787
Total Onshore 424,961 411,551 386,929 394,410 395,388 101,672 101,405 97,364 97,462 397,901 96,285 96,958 96,451 94,664 383,609
OffshoreP.T.I.A.P.C.O. 13,649 19,785 15,254 34,402 41,471 8,688 7,295 7,168 7,588 30,739 8,854 8,565 8,036 7,276 32,731A.R.C.O. (Java Sea) 23,357 32,661 28,582 44,432 43,849 9,436 9,659 10,128 10,329 39,552 9,873 9,265 9,584 10,576 39,298
Union Oil 13,292 18,508 20,942 27,989 29,429 7,306 7,152 6,797 6,640 27,895 6,105 6,006 5,998 5,839 23,965
Japex /d 13,292 18,508 18,128 19,425 45,347 15,426 15,318 14,829 14,661 60,234 14,303 14,368 14,431 14,096 57,198
Total Indonesia - 825 6,909 28,784 58,879 10,311 10,274 9,920 9,789 40,294 9,609 9,808 9,750 9,524 38,691
Cities Service - - 111 914 789 164 154 173 - 491 - - - - -
Conoco - - - - - - - - - - 485 1,294 2,085 2,314 6,178
Total Offshore 63,590 90,287 89,926 155,946 219,764 51,331 49,852 49,015 49,007 199,205 49,229 40,306 49,884 49,615 198,064
Crude Oil Production 488,551 501,838 476,855 550,356 615,152 153,003 151,257 146,379 146,471 597,108 145,536 145,354 146,335 144,309 581,673
Percentage 100.0 100.0 100.0 100.0 100.0 100.0 100.0 100.0 100.0 100.0
Pertamina/Lenigas 7.8 8.1 6.9 5.7 5.0 5.3 5.4 5.2 5.2 5.3
Contracts of work 76.8 69.4 66.4 58.5 50.0 48.5 48.0 48.1 47.8 48.1
Production sharing 23.2 22.5 26.7 35.8 45.0 46.2 46.6 46.7 47.0 46.6
Average Daily Production 1,338 1,375 1,306 1,508 1,685 1,700 1,6f62 1,591 1,592 1,636 1,617 1,596 1,591 1,569 1,594
/a Contracts of work.b Since January 1977: Redco; since May 1978: Asnmera (S. Sumatera).
7 Since January 1979: two fields. .
7- Since June 1977: Inpex (includes 50% of Total Indonesia production).
Source: Ministry of Mines and Energy.
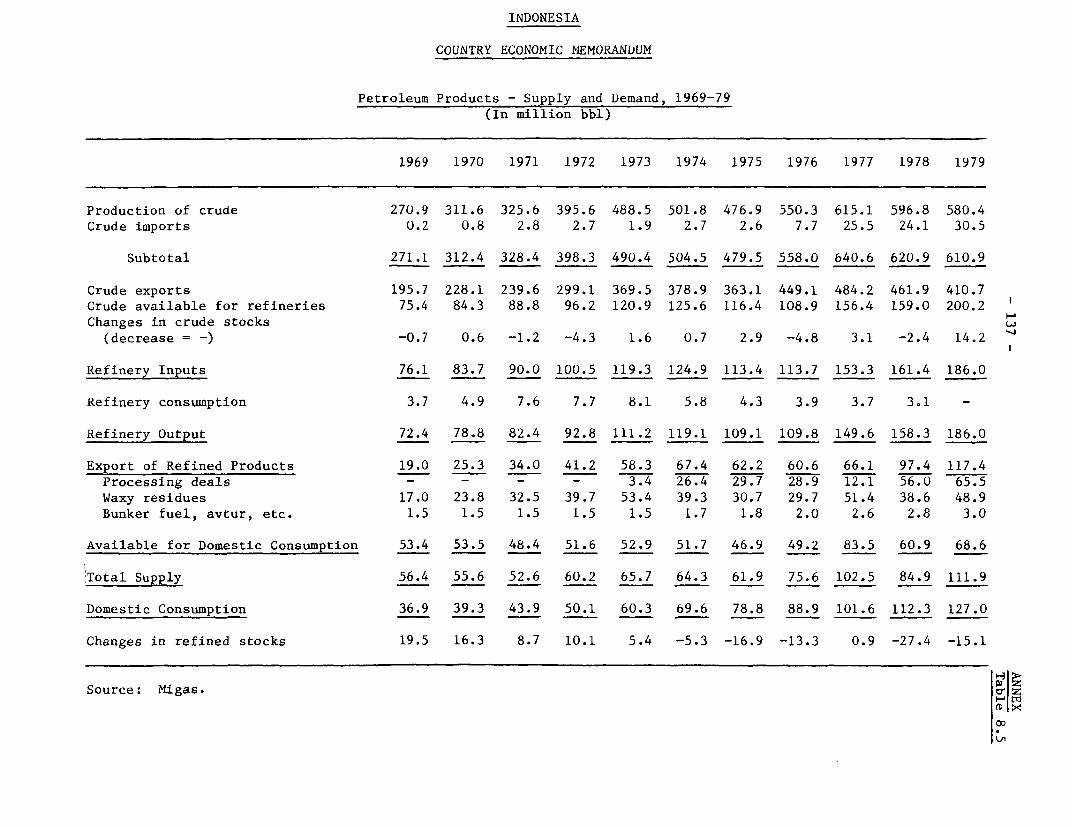
INDONESIA
COUNTRY ECONOMIC MEMORANDUM
Petroleum Products - Supply and Demand, 1969-79(In million bbl)
1969 1970 1971 1972 1973 1974 1975 1976 1977 1978 1979
Production of crude 270.9 311.6 325.6 395.6 488.5 501.8 476.9 550.3 615.1 596.8 580.4Crude imports 0.2 0.8 2.8 2.7 1.9 2.7 2.6 7.7 25.5 24.1 30.5
Subtotal 271.1 312.4 328.4 398.3 490.4 504.5 479.5 558.0 640.6 620.9 610.9
Crude exports 195.7 228.1 239.6 299.1 369.5 378.9 363.1 449.1 484.2 461.9 410.7Crude available for refineries 75.4 84.3 88.8 96.2 120.9 125.6 116.4 108.9 156.4 159.0 200.2Changes in crude stocks
(decrease = -) -0.7 0.6 -1.2 -4.3 1.6 0.7 2.9 -4.8 3.1 -2.4 14.2
Refinery Inputs 76.1 83.7 90.0 100.5 119.3 124.9 113.4 113.7 153.3 161.4 186.0
Refinery consumption 3.7 4.9 7.6 7.7 8.1 5.8 4.3 3.9 3.7 3.1 -
Refinery Output 72.4 78.8 82.4 92.8 111.2 119.1 109.1 109.8 149.6 158.3 186.0
Export of Refined Products 19.0 25.3 34.0 41.2 58.3 67.4 62.2 60.6 66.1 97.4 117.4Processing deals - - - - 3.4 26.4 29.7 28.9 12.1 56.0 65.5Waxy residues 17.0 23.8 32.5 39.7 53.4 39.3 30.7 29.7 51.4 38.6 48.9Bunker fuel, avtur, etc. 1.5 1.5 1.5 1.5 1.5 1.7 1.8 2.0 2.6 2.8 3.0
Available for Domestic Consumption 53.4 53.5 48.4 51.6 52.9 51.7 46.9 49.2 83.5 60.9 68.6
Total Supply 56.4 55.6 52.6 60.2 65.7 64.3 61.9 75.6 102.5 84.9 111.9
Domestic Consumption 36.9 39.3 43.9 50.1 60.3 69.6 78.8 88.9 101.6 112.3 127.0
Changes in refined stocks 19.5 16.3 8.7 10.1 5.4 -5.3 -16.9 -13.3 0.9 -27.4 -15.1
Source: Migas.
?O
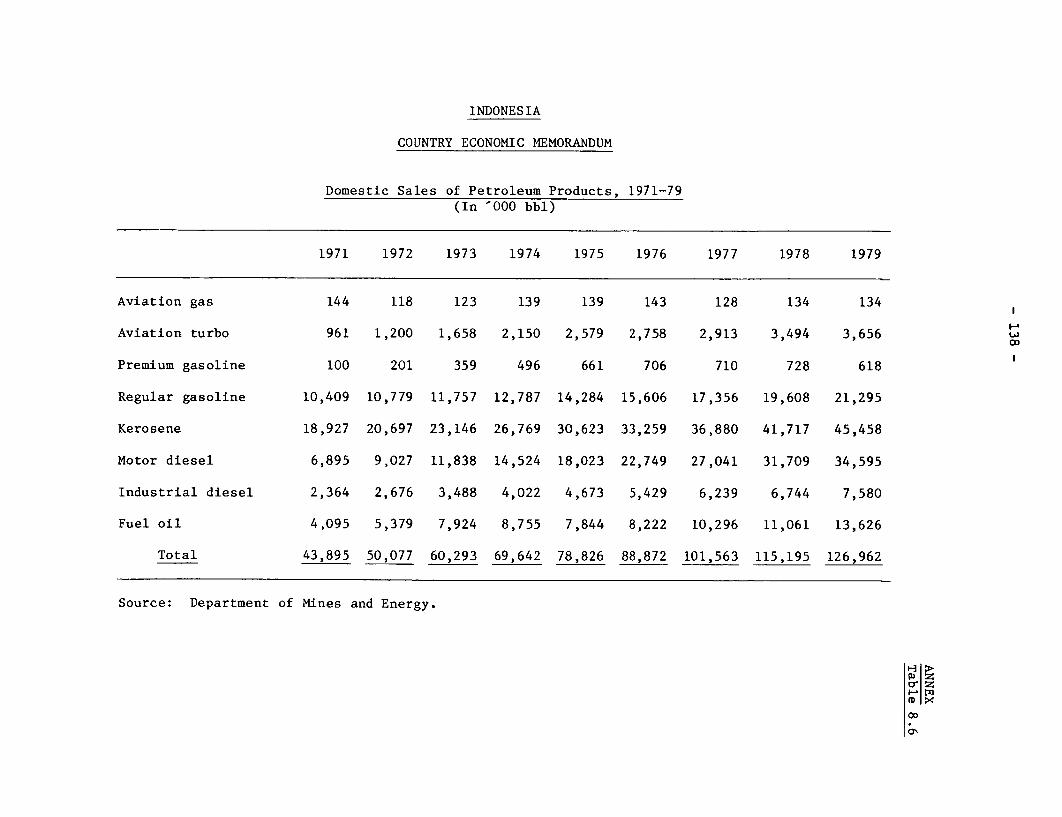
INDONESIA
COUNTRY ECONOMIC MEMORANDUM
Domestic Sales of Petroleum Products, 1971-79(In '000 bbl)
1971 1972 1973 1974 1975 1976 1977 1978 1979
Aviation gas 144 118 123 139 139 143 128 134 134 1
Aviation turbo 961 1,200 1,658 2,150 2,579 2,758 2,913 3,494 3,656 X
Premium gasoline 100 201 359 496 661 706 710 728 618
Regular gasoline 10,409 10,779 11,757 12,787 14,284 15,606 17,356 19,608 21,295
Kerosene 18,927 20,697 23,146 26,769 30,623 33,259 36,880 41,717 45,458
Motor diesel 6,895 9,027 11,838 14,524 18,023 22,749 27,041 31,709 34,595
Industrial diesel 2,364 2,676 3,488 4,022 4,673 5,429 6,239 6,744 7,580
Fuel oil 4,095 5,379 7,924 8,755 7,844 8,222 10,296 11,061 13,626
Total 43,895 50,077 60,293 69,642 78,826 88,872 101,563 115,195 126,962
Source: Department of Mines and Energy.
(D >4
oall<
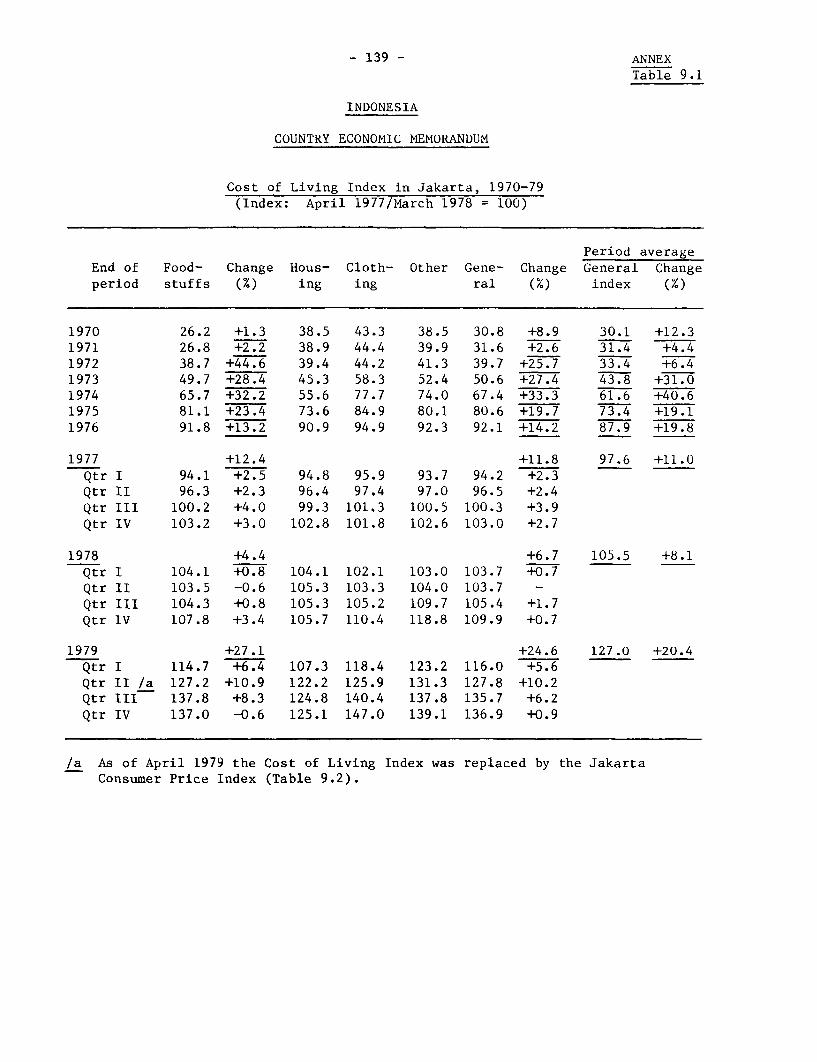
- 139 - ANNEX
Table 9.1
INDONESIA
COUNTRY ECONOMIC MEMORANDUM
Cost of Living Index in Jakarta, 1970-79(Index: April 1977/March 1978 = 100)
Period averageEnd of Food- Change Hous- Cloth- Other Gene- Change General Changeperiod stuffs (x) ing ing ral (Y.) index (X)
1970 26.2 +1.3 38.5 43.3 38.5 30.8 +8.9 30.1 +12.31971 26.8 +2.2 38.9 44.4 39.9 31.6 +2.6 31.4 +4.41972 38.7 +44.6 39.4 44.2 41.3 39.7 +25.7 33.4 +6.41973 49.7 +28.4 45.3 58.3 52.4 50.6 +27.4 43.8 +31.01974 65.7 +32.2 55.6 77.7 74.0 67.4 +33.3 61.6 +40.61975 81.1 +23.4 73.6 84.9 80.1 80.6 +19.7 73.4 +19.11976 91.8 +13.2 90.9 94.9 92.3 92.1 +14.2 87.9 +19.8
1977 +12.4 +11.8 97.6 +11.0Qtr I 94.1 +2.5 94.8 95.9 93.7 94.2 +2.3Qtr II 96.3 +2.3 96.4 97.4 97.0 96.5 +2.4Qtr III 100.2 +4.0 99.3 101.3 100.5 100.3 +3.9Qtr IV 103.2 +3.0 102.8 101.8 102.6 103.0 +2.7
1978 +4.4 +6.7 105.5 +8.1Qtr I 104.1 +0.8 104.1 102.1 103.0 103.7 +0.7Qtr II 103.5 -0.6 105.3 103.3 104.0 103.7 -Qtr III 104.3 +0.8 105.3 105.2 109.7 105.4 +1.7Qtr IV 107.8 +3.4 105.7 110.4 118.8 109.9 +0.7
1979 +27.1 +24.6 127.0 +20.4Qtr I 114.7 +6.4 107.3 118.4 123.2 116.0 +5.6Qtr II /a 127.2 +10.9 122.2 125.9 131.3 127.8 +10.2Qtr III 137.8 +8.3 124.8 140.4 137.8 135.7 +6.2Qtr IV 137.0 -0.6 125.1 147.0 139.1 136.9 +0.9
/a As of April 1979 the Cost of Living Index was replaced by the JakartaConsumer Price Index (Table 9.2).
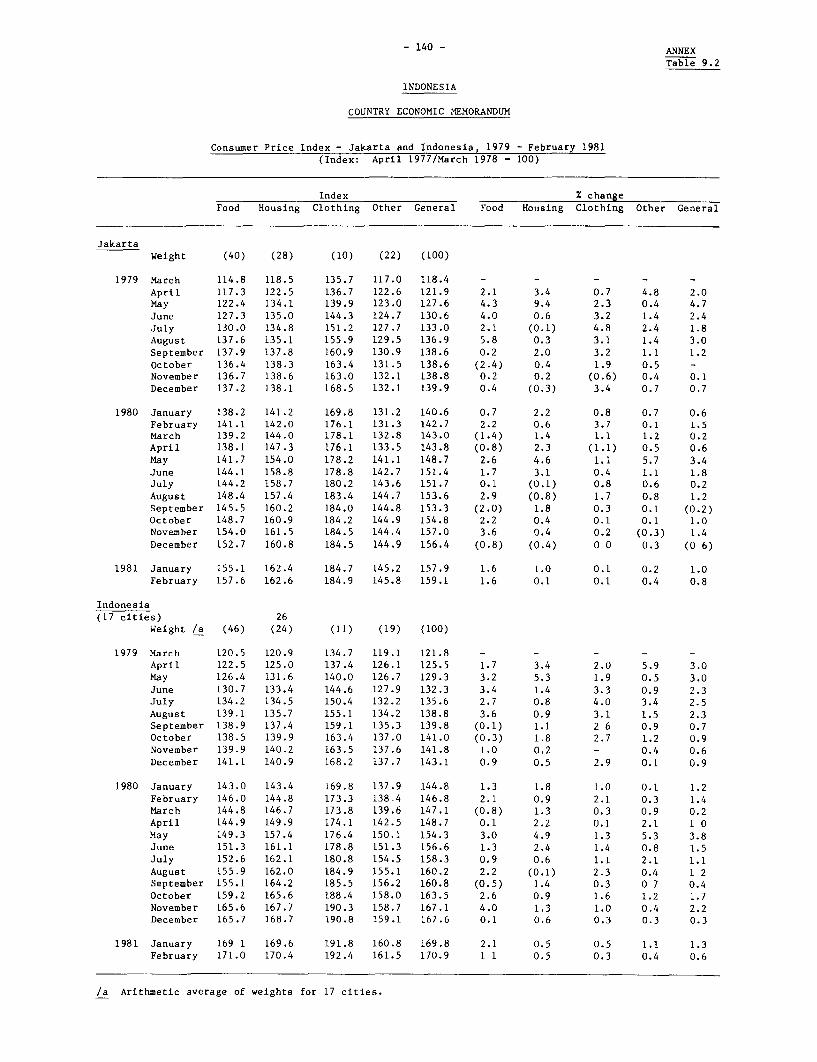
- 140 - ANNEX
Table 9.2
INDONESIA
COUNTRY ECONOMIC MEMORANDUM
Consumer Price Index - Jakarta and Indonesia, 1979 - February 1981(Index: April 1977/March 1978 - 100)
Index % changeFood Housing Clothing Other General Food Housing Clothing Other General
Jakarta
Weight (40) (28) (10) (22) (100)
1979 March 114.8 118.5 135.7 117.0 118.4 - - - - -April 117.3 122.5 136.7 122.6 121.9 2.1 3.4 0.7 4.8 2.0May 122.4 134.1 139.9 123.0 127.6 4.3 9.4 2.3 0.4 4.7
June 127.3 135.0 144.3 124.7 130.6 4.0 0.6 3.2 1.4 2.4July 130.0 134.8 151.2 127.7 133.0 2.1 (0.1) 4.8 2.4 1.8August 137.6 135.1 155.9 129.5 136.9 5.8 0.3 3.1 1.4 3.0September 137.9 137.8 160.9 130.9 138.6 0.2 2.0 3.2 1.1 1.2October 136.4 138.3 163.4 131.5 138.6 (2.4) 0.4 1.9 0.5 -November 136.7 138.6 163.0 132.1 138.8 0.2 0.2 (0.6) 0.4 0.1December 137.2 138.1 168.5 132.1 139.9 0.4 (0.3) 3.4 0.7 0.7
1980 January 138.2 141.2 169.8 131.2 140.6 0.7 2.2 0.8 0.7 0.6February 141.1 142.0 176.1 131.3 142.7 2.2 0.6 3.7 0.1 1.5March 139.2 144.0 178.1 132.8 143.0 (1.4) 1.4 1.1 1.2 0.2April 138.1 147.3 176.1 133.5 143.8 (0.8) 2.3 (1.1) 0.5 0.6
May 141.7 154.0 178.2 141.1 148.7 2.6 4.6 1.1 5.7 3.4
June 144.1 158.8 178.8 142.7 151.4 1.7 3.1 0.4 1.1 1.8July 144.2 158.7 180.2 143.6 151.7 0.1 (0.1) 0.8 0.6 0.2August 148.4 157.4 183.4 144.7 153.6 2.9 (0.8) 1.7 0.8 1.2September 145.5 160.2 184.0 144.8 153.3 (2.0) 1.8 0.3 0.1 (0.2)October 148.7 160.9 184.2 144.9 154.8 2.2 0.4 0.1 0.1 1.0November 154.0 161.5 184.5 144.4 157.0 3.6 0.4 0.2 (0.3) 1.4
December 152.7 160.8 184.5 144.9 156.4 (0.8) (0.4) 0 0 0.3 (O 6)
1981 January 155.1 162.4 184.7 145.2 157.9 1.6 1.0 0.1 0.2 1.0February 157.6 162.6 184.9 145.8 159.1 1.6 0.1 0.1 0.4 0.8
Indonesia(17 cities) 26
Weight /a (46) (24) (11) (19) (100)
1979 March 120.5 120.9 134.7 119.1 121.8 - - - - -April 122.5 125.0 137.4 126.1 125.5 1.7 3.4 2.0 5.9 3.0May 126.4 131.6 140.0 126.7 129.3 3.2 5.3 1.9 0.5 3.0June 130.7 133.4 144.6 127.9 132.3 3.4 1.4 3.3 0.9 2.3July 134.2 134.5 150.4 132.2 135.6 2.7 0.8 4.0 3.4 2.5August 139.1 135.7 155.1 134.2 138.8 3.6 0.9 3.1 1.5 2.3September 138.9 137.4 159.1 135.3 139.8 (0.1) 1.1 2 6 0.9 0.7October 138.5 139.9 163.4 137.0 141.0 (0.3) 1.8 2.7 1.2 0.9November 139.9 140.2 163.5 137.6 141.8 1.0 0.2 - 0.4 0.6
December 141.1 140.9 168.2 137.7 143.1 0.9 0.5 2.9 0.1 0.9
1980 January 143.0 143.4 169.8 137.9 144.8 1.3 1.8 1.0 0.1 1.2February 146.0 144.8 173.3 138.4 146.8 2.1 0.9 2.1 0.3 1.4March 144.8 146.7 173.8 139.6 147.1 (0.8) 1.3 0.3 0.9 0.2April 144.9 149.9 174.1 142.5 148.7 0.1 2.2 0.1 2.1 1 0May 149.3 157.4 176.4 150.1 154.3 3.0 4.9 1.3 5.3 3.8June 151.3 161.1 178.8 151.3 156.6 1.3 2.4 1.4 0.8 1.5July 152.6 162.1 180.8 154.5 158.3 0.9 0.6 1.1 2.1 1.1August 155.9 162.0 184.9 155.1 160.2 2.2 (0.1) 2.3 0.4 1 2September 155.1 164.2 185.5 156.2 160.8 (0.5) 1.4 0.3 0 7 0.4October 159.2 165.6 188.4 158.0 163.5 2.6 0.9 1.6 1.2 1.7November 165.6 167.7 190.3 158.7 167.1 4.0 1.3 1.0 0.4 2.2December 165.7 168.7 190.8 159.1 167.6 0.1 0.6 0.3 0.3 0.3
1981 January 169 1 169.6 191.8 160.8 169.8 2.1 0.5 0.5 1.1 1.3February 171.0 170.4 192.4 161.5 170.9 1 1 0.5 0.3 0.4 0.6
/a Arithmetic average of weights for 17 cities.
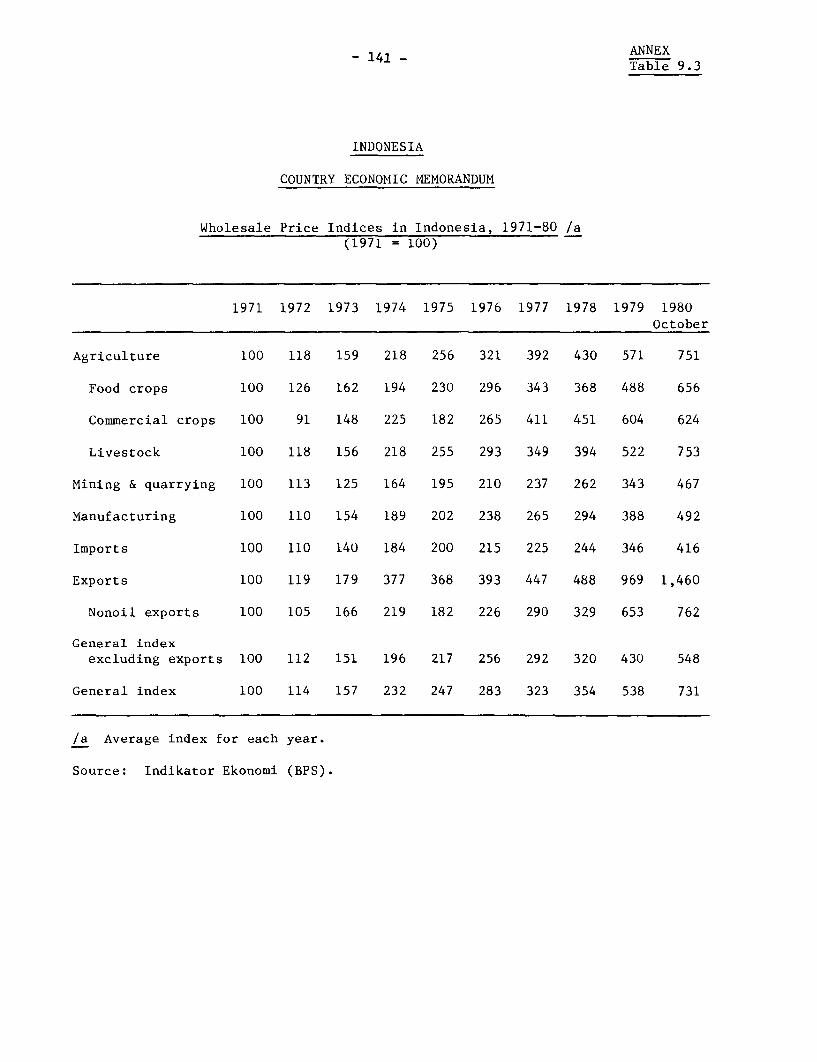
- 141 - ANNEXTable 9.3
INDONESIA
COUNTRY ECONOMIC MEMORANDUM
Wholesale Price Indices in Indonesia, 1971-80 /a(1971 = 100)
1971 1972 1973 1974 1975 1976 1977 1978 1979 1980October
Agriculture 100 118 159 218 256 321 392 430 571 751
Food crops 100 126 162 194 230 296 343 368 488 656
Commercial crops 100 91 148 225 182 265 411 451 604 624
Livestock 100 118 156 218 255 293 349 394 522 753
Mining & quarrying 100 113 125 164 195 210 237 262 343 467
Manufacturing 100 110 154 189 202 238 265 294 388 492
Imports 100 110 140 184 200 215 225 244 346 416
Exports 100 119 179 377 368 393 447 488 969 1,460
Nonoil exports 100 105 166 219 182 226 290 329 653 762
General indexexcluding exports 100 112 151 196 217 256 292 320 430 548
General index 100 114 157 232 247 283 323 354 538 731
/a Average index for each year.
Source: Indikator Ekonomi (BPS).
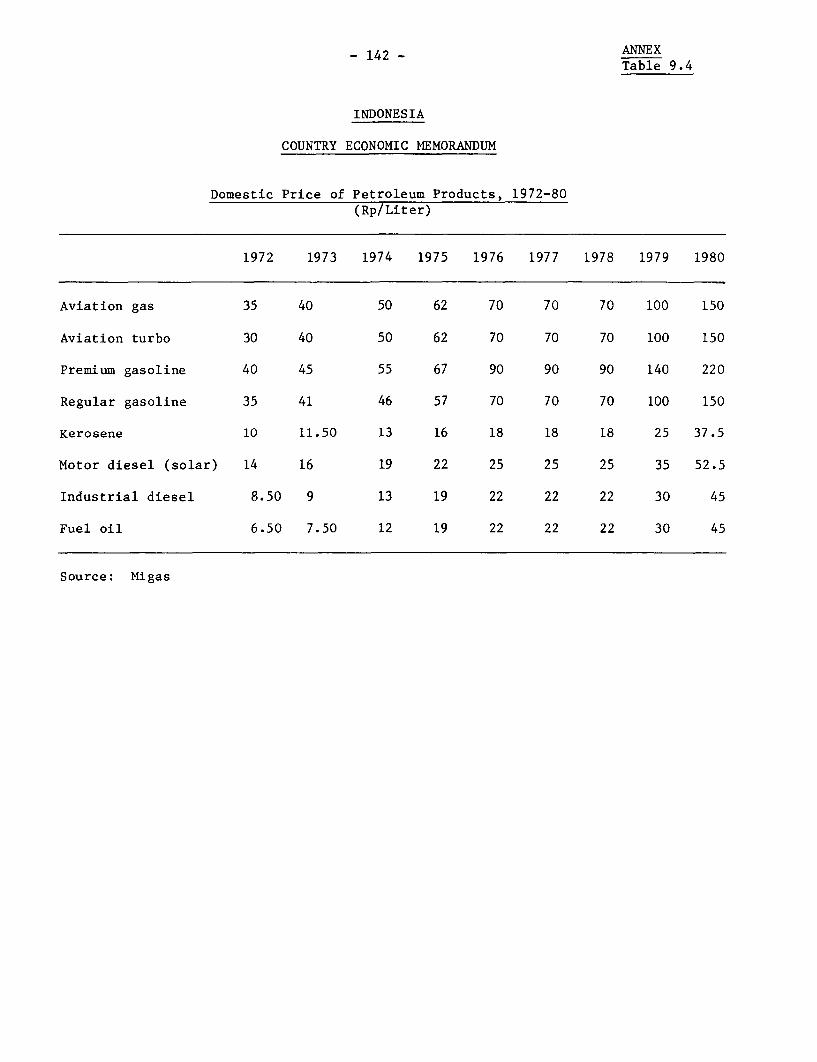
- 142 - ANNEXTable 9.4
INDONESIA
COUNTRY ECONOMIC MEMORANDUM
Domestic Price of Petroleum Products, 1972-80(Rp/Liter)
1972 1973 1974 1975 1976 1977 1978 1979 1980
Aviation gas 35 40 50 62 70 70 70 100 150
Aviation turbo 30 40 50 62 70 70 70 100 150
Premium gasoline 40 45 55 67 90 90 90 140 220
Regular gasoline 35 41 46 57 70 70 70 100 150
Kerosene 10 11.50 13 16 18 18 18 25 37.5
Motor diesel (solar) 14 16 19 22 25 25 25 35 52.5
Industrial diesel 8.50 9 13 19 22 22 22 30 45
Fuel oil 6.50 7.50 12 19 22 22 22 30 45
Source: Migas
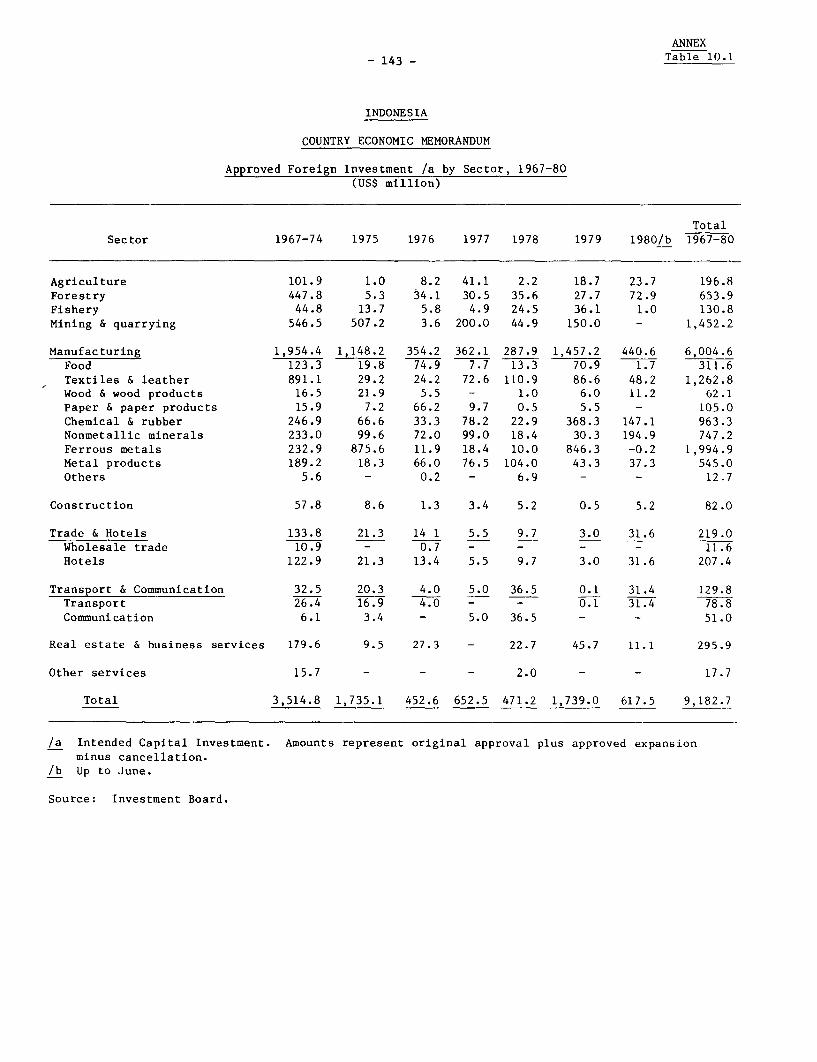
ANNEX- 143 - Table 10.1
INDONESIA
COUNTRY ECONOMIC MEMORANDUM
Approved Foreign Investment /a by Sector, 1967-80(US$ million)
TotalSector 1967-74 1975 1976 1977 1978 1979 1980/b 1967-80
Agriculture 101.9 1.0 8.2 41.1 2.2 18.7 23.7 196.8Forestry 447.8 5.3 34.1 30.5 35.6 27.7 72.9 653.9Fishery 44.8 13.7 5.8 4.9 24.5 36.1 1.0 130.8Mining & quarrying 546.5 507.2 3.6 200.0 44.9 150.0 - 1,452.2
Manufacturing 1,954.4 1,148.2 354.2 362.1 287.9 1,457.2 440.6 6,004.6Food 123.3 19.8 74.9 7.7 13.3 70.9 1.7 311.6Textiles & leather 891.1 29.2 24.2 72.6 110.9 86.6 48.2 1,262.8Wood & wood products 16.5 21.9 5.5 - 1.0 6.0 11.2 62.1Paper & paper products 15.9 7.2 66.2 9.7 0.5 5.5 - 105.0Chemical & rubber 246.9 66.6 33.3 78.2 22.9 368.3 147.1 963.3Nonmetallic minerals 233.0 99.6 72.0 99.0 18.4 30.3 194.9 747.2Ferrous metals 232.9 875.6 11.9 18.4 10.0 846.3 -0.2 1,994.9Metal products 189.2 18.3 66.0 76.5 104.0 43.3 37.3 545.0Others 5.6 - 0.2 - 6.9 - - 12.7
Construction 57.8 8.6 1.3 3.4 5.2 0.5 5.2 82.0
Trade & Hotels 133.8 21.3 14 1 5.5 9.7 3.0 31.6 219.0Wholesale trade 10.9 - 0.7 - - - - 11.6
Hotels 122.9 21.3 13.4 5.5 9.7 3.0 31.6 207.4
Transport & Communication 32.5 20.3 4.0 5.0 36.5 0.1 31.4 129.8Transport 26.4 16.9 4.0 - - 0.1 31.4 78.8Communication 6.1 3.4 - 5.0 36.5 - - 51.0
Real estate & business services 179.6 9.5 27.3 - 22.7 45.7 11.1 295.9
Other services 15.7 - - - 2.0 - - 17.7
Total 3,514.8 1,735.1 452.6 652.5 471.2 1,739.0 617.5 9,182.7
/a Intended Capital Investment. Amounts represent original approval plus approved expansionminus cancellation.
/b Up to June.
Source: Investment Board.
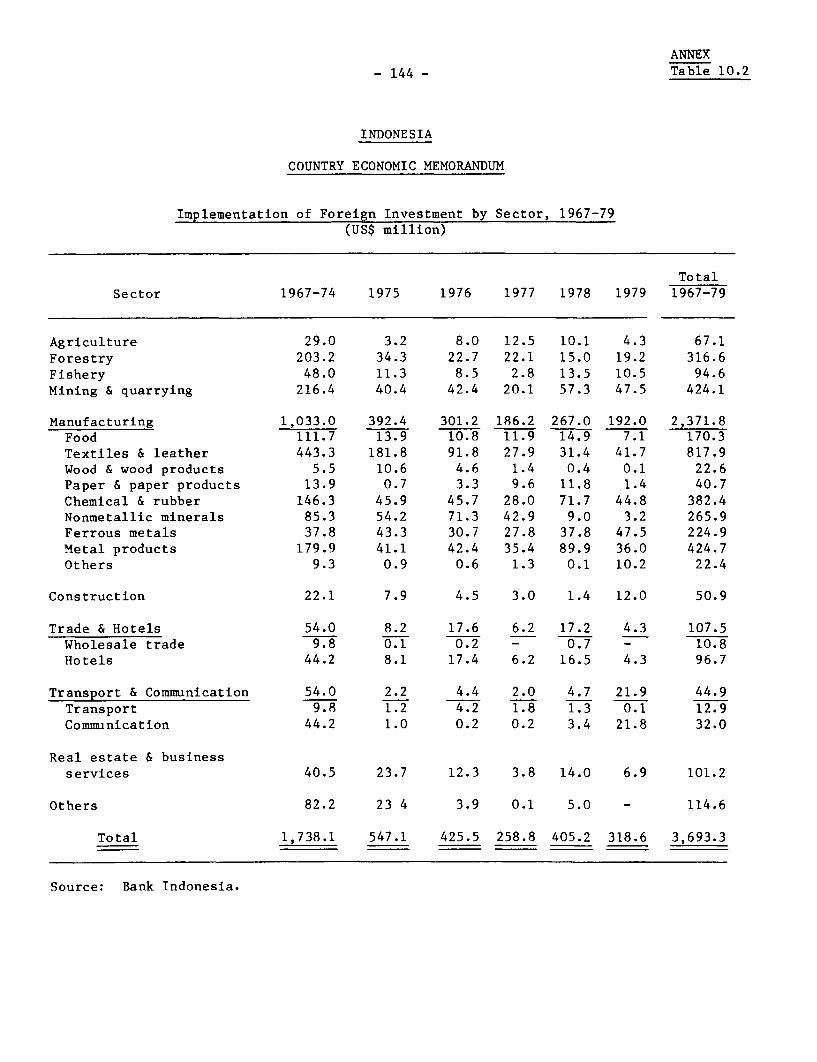
ANNEX
- 144 - Table 10.2
INDONESIA
COUNTRY ECONOMIC MEMORANDUM
Implementation of Foreign Investment by Sector, 1967-79(US$ million)
TotalSector 1967-74 1975 1976 1977 1978 1979 1967-79
Agriculture 29.0 3.2 8.0 12.5 10.1 4.3 67.1Forestry 203.2 34.3 22.7 22.1 15.0 19.2 316.6Fishery 48.0 11.3 8.5 2.8 13.5 10.5 94.6Mining & quarrying 216.4 40.4 42.4 20.1 57.3 47.5 424.1
Manufacturing 1,033.0 392.4 301.2 186.2 267.0 192.0 2,371.8Food 111.7 13.9 10.8 11.9 14.9 7.1 170.3Textiles & leather 443.3 181.8 91.8 27.9 31.4 41.7 817.9Wood & wood products 5.5 10.6 4.6 1.4 0.4 0.1 22.6Paper & paper products 13.9 0.7 3.3 9.6 11.8 1.4 40.7Chemical & rubber 146.3 45.9 45.7 28.0 71.7 44.8 382.4Nonmetallic minerals 85.3 54.2 71.3 42.9 9.0 3.2 265.9Ferrous metals 37.8 43.3 30.7 27.8 37.8 47.5 224.9Metal products 179.9 41.1 42.4 35.4 89.9 36.0 424.7Others 9.3 0.9 0.6 1.3 0.1 10.2 22.4
Construction 22.1 7.9 4.5 3.0 1.4 12.0 50.9
Trade & Hotels 54.0 8.2 17.6 6.2 17.2 4.3 107.5Wholesale trade 9.8 0.1 0.2 - 0.7 - 10.8Hotels 44.2 8.1 17.4 6.2 16.5 4.3 96.7
Transport & Communication 54.0 2.2 4.4 2.0 4.7 21.9 44.9Transport 9.8 1.2 4.2 1.8 1.3 0.1 12.9Communication 44.2 1.0 0.2 0.2 3.4 21.8 32.0
Real estate & businessservices 40.5 23.7 12.3 3.8 14.0 6.9 101.2
Others 82.2 23 4 3.9 0.1 5.0 - 114.6
Total 1,738.1 547.1 425.5 258.8 405.2 318.6 3,693.3
Source: Bank Indonesia.
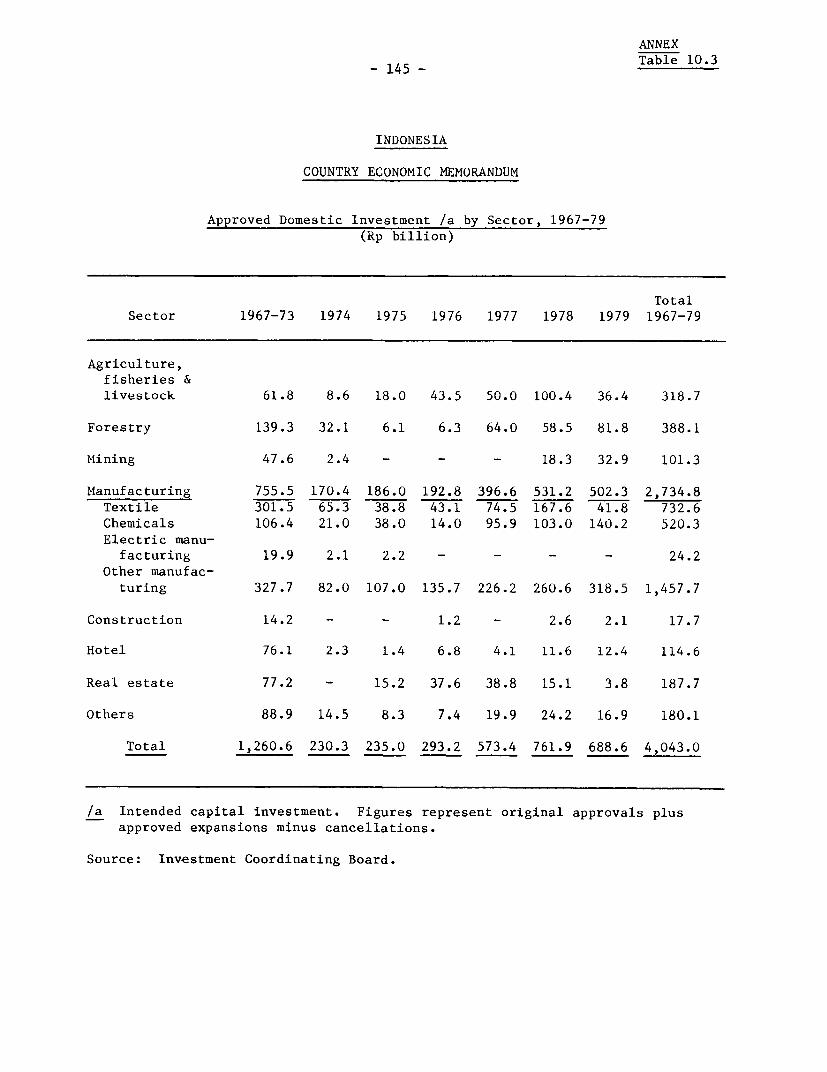
ANNEX
- 145 - Table 10.3
INDONESIA
COUNTRY ECONOMIC MEMORANDUM
Approved Domestic Investment /a by Sector, 1967-79
(Rp billion)
Total
Sector 1967-73 1974 1975 1976 1977 1978 1979 1967-79
Agriculture,fisheries &livestock 61.8 8.6 18.0 43.5 50.0 100.4 36.4 318.7
Forestry 139.3 32.1 6.1 6.3 64.0 58.5 81.8 388.1
Mining 47.6 2.4 - - - 18.3 32.9 101.3
Manufacturing 755.5 170.4 186.0 192.8 396.6 531.2 502.3 2,734.8
Textile 301.5 65.3 38.8 43.1 74.5 167.6 41.8 732.6
Chemicals 106.4 21.0 38.0 14.0 95.9 103.0 140.2 520.3
Electric manu-facturing 19.9 2.1 2.2 - - - - 24.2
Other manufac-turing 327.7 82.0 107.0 135.7 226.2 260.6 318.5 1,457.7
Construction 14.2 - - 1.2 - 2.6 2.1 17.7
Hotel 76.1 2.3 1.4 6.8 4.1 11.6 12.4 114.6
Real estate 77.2 - 15.2 37.6 38.8 15.1 3.8 187.7
Others 88.9 14.5 8.3 7.4 19.9 24.2 16.9 180.1
Total 1,260.6 230.3 235.0 293.2 573.4 761.9 688.6 4,043.0
/a Intended capital investment. Figures represent original approvals plus
approved expansions minus cancellations.
Source: Investment Coordinating Board.

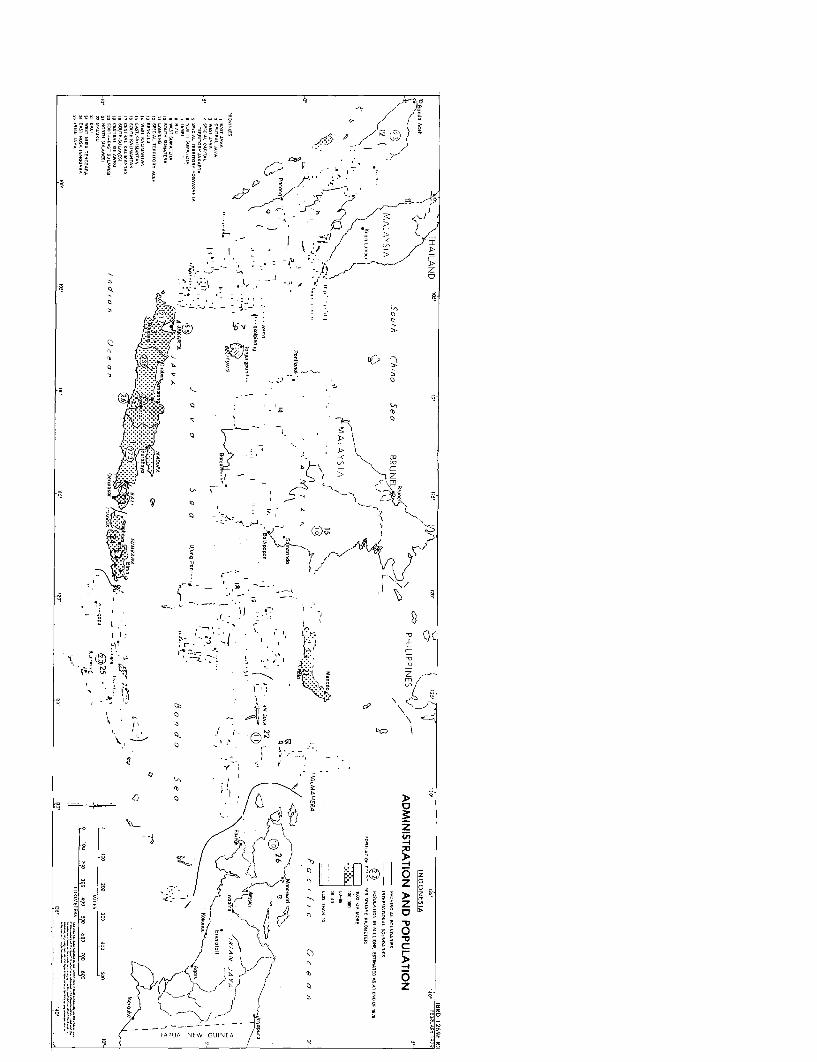
X D (;) ~ ~~~~~~~ l -,0 5 ~ ~ ~ ~~~ ~ ~~~~~~~ ' ---
O d 2 i - ~ ~ ~~~ ~ ~~-~ -< I
0~~~ -_>
3 2 . -~ -
C3
, C - 01 -I -
i 1 | | | 0 --- ;I
PP , GUINE
° z 6 ° } ' iX I w~~~~~~~6
tXiS : ig->~~~~~~~~~~~~~~~~~~~~~
0~ ~~~ '-