Department of Crop Sciences - Abstracts
175
Department of Crop Sciences Head of department: Univ.Prof. Dr.nat.techn. Dipl.‐Ing. Hans‐Peter Kaul Supervisor: Univ.Prof. Dr.sc.agr. Dipl.‐Ing.sc.agr. Astrid Forneck Co‐supervisor: Univ. Prof. Dr.rer.nat. Dipl.‐Chem. Antje Potthast ANALYSIS OF COMPLEX CARBOHYDRATE MIXTURES Dissertation for obtaining doctoral degree of University of Natural Resources and Life Sciences, Vienna Submitted by Manuel Becker (M.Sc.) November 2018, Vienna
-
Upload
khangminh22 -
Category
Documents
-
view
3 -
download
0
Transcript of Department of Crop Sciences - Abstracts
Department of Crop Sciences
Head of department:
Univ.Prof. Dr.nat.techn. Dipl.‐Ing. Hans‐Peter Kaul
Supervisor:
Univ.Prof. Dr.sc.agr. Dipl.‐Ing.sc.agr. Astrid Forneck
Co‐supervisor:
Univ. Prof. Dr.rer.nat. Dipl.‐Chem. Antje Potthast
ANALYSIS OF COMPLEX CARBOHYDRATE MIXTURES
Dissertation
for obtaining doctoral degree of
University of Natural Resources and Life Sciences, Vienna
Submitted by
Manuel Becker (M.Sc.)
November 2018, Vienna
II
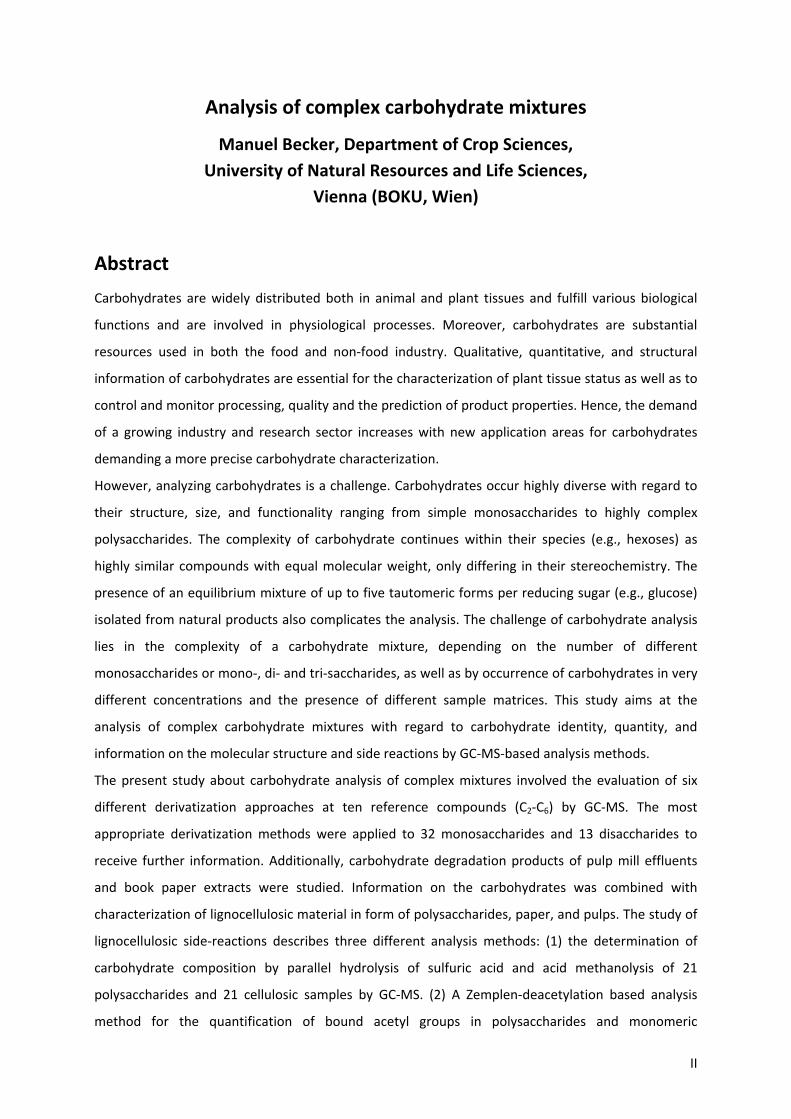
Analysis of complex carbohydrate mixtures
Manuel Becker, Department of Crop Sciences,
University of Natural Resources and Life Sciences,
Vienna (BOKU, Wien)
Abstract
Carbohydrates are widely distributed both in animal and plant tissues and fulfill various biological
functions and are involved in physiological processes. Moreover, carbohydrates are substantial
resources used in both the food and non‐food industry. Qualitative, quantitative, and structural
information of carbohydrates are essential for the characterization of plant tissue status as well as to
control and monitor processing, quality and the prediction of product properties. Hence, the demand
of a growing industry and research sector increases with new application areas for carbohydrates
demanding a more precise carbohydrate characterization.
However, analyzing carbohydrates is a challenge. Carbohydrates occur highly diverse with regard to
their structure, size, and functionality ranging from simple monosaccharides to highly complex
polysaccharides. The complexity of carbohydrate continues within their species (e.g., hexoses) as
highly similar compounds with equal molecular weight, only differing in their stereochemistry. The
presence of an equilibrium mixture of up to five tautomeric forms per reducing sugar (e.g., glucose)
isolated from natural products also complicates the analysis. The challenge of carbohydrate analysis
lies in the complexity of a carbohydrate mixture, depending on the number of different
monosaccharides or mono‐, di‐ and tri‐saccharides, as well as by occurrence of carbohydrates in very
different concentrations and the presence of different sample matrices. This study aims at the
analysis of complex carbohydrate mixtures with regard to carbohydrate identity, quantity, and
information on the molecular structure and side reactions by GC‐MS‐based analysis methods.
The present study about carbohydrate analysis of complex mixtures involved the evaluation of six
different derivatization approaches at ten reference compounds (C2‐C6) by GC‐MS. The most
appropriate derivatization methods were applied to 32 monosaccharides and 13 disaccharides to
receive further information. Additionally, carbohydrate degradation products of pulp mill effluents
and book paper extracts were studied. Information on the carbohydrates was combined with
characterization of lignocellulosic material in form of polysaccharides, paper, and pulps. The study of
lignocellulosic side‐reactions describes three different analysis methods: (1) the determination of
carbohydrate composition by parallel hydrolysis of sulfuric acid and acid methanolysis of 21
polysaccharides and 21 cellulosic samples by GC‐MS. (2) A Zemplen‐deacetylation based analysis
method for the quantification of bound acetyl groups in polysaccharides and monomeric
III
carbohydrates. (3) The volatile organic acid emission potential of storage‐materials present in the
collection of the drawings and prints of Karl Friedrich Schinkel in Berlin and their impact on the
cellulose integrity of two indicator papers.
The evaluation of two single‐step and four two‐step derivatization approaches for liquid GC‐MS
analysis showed that the sequential ethoximation and trimethylsilylation is advantageous to other
approaches. The benefits are a low number of peaks obtained per reducing carbohydrate, good
chromatographic resolution, low limits of detection and quantitation, low relative standard
deviations, a high informational value of mass spectra, and high robustness towards matrix effects.
Consequently, a deeper insight into the O‐ethoximation followed by silylation approach revealed
chromatographic and mass spectrometric properties of 46 carbohydrates. Based on these results, an
oxime peak identifier is proposed, which involves the elution order and the retention time shift of
the syn/anti‐peak to increase the reliability of the identification of reducing carbohydrates. The
analysis of carbohydrate composition also comprises the quantitative and qualitative monomer
distribution of polysaccharides and cellulosic materials. Also, the degradation effects of electron
beam irradiation treatments or aging processes on the carbohydrate composition of cellulosic
samples are investigated. The measurement of the degree of acetylation showed the analysis of
bound acetyl groups at polysaccharides without being affected by the presence of free or adsorbed
acetic acid and acetates. The analysis of methyl acetate in the vapor phase by SPME‐GC‐MS
combined with 4‐O‐(13C2‐acetyl) vanillin for internal standardization, which generates isotopically
labeled methyl 13C2‐acetate in situ, overcomes the contamination problem and eliminates possible
influences, e.g., discrimination effects.
A quantitative analysis of formic acid and acetic acid emission of storage materials by static
headspace GC‐MS with selected‐ion monitoring (SHS‐GC/SIM‐MS) showed significant differences of
acetic acid concentration among storage samples and a formic acid emitting fabric sample. The
indicator‐paper based degradation caused by emissions from Schinkel exhibit materials revealed an
oxidation impact on both indicator papers and a stronger formic acid‐induced hydrolysis in
association with a higher loss of keto groups compared to acetic acid.
IV
Kurzfassung
Kohlenhydrate sind sowohl in tierischen als auch in pflanzlichen Geweben weit verbreitet, erfüllen
verschiedene biologische Funktionen und sind an physiologischen Prozessen beteiligt. Darüber
hinaus sind Kohlenhydrate wichtige Ressourcen, die sowohl in der Lebensmittel‐ als auch in der
Verarbeitungsindustrie verwendet werden. Qualitative, quantitative und strukturelle Informationen
über Kohlenhydrate sind essentiell für die Charakterisierung des Status von Pflanzengeweben sowie
für die Kontrolle und Überwachung der Verarbeitung, der Qualität und der Vorhersage von
Produkteigenschaften. Die Anforderungen eines wachsenden Industrie‐ und Forschungssektors an
eine präzisere Kohlenhydratcharakterisierung steigen daher mit der Etablierung neuer
Anwendungsgebiete für Kohlenhydrate.
Die Analyse von Kohlenhydraten ist jedoch eine Herausforderung. Kohlenhydrate treten hinsichtlich
ihrer Struktur, Größe und Funktionalität sehr unterschiedlich auf und reichen von einfachen
Monosacchariden bis zu hochkomplexen Polysacchariden. Die Komplexität von Kohlenhydraten setzt
sich innerhalb ihrer C‐Gruppe (z. B. Hexosen) als sehr ähnliche Verbindungen mit gleichem
Molekulargewicht fort, die sich in ihrer Stereochemie unterscheiden. Das Auftreten von bis zu fünf
tautomeren Formen pro reduzierendem Zucker (z. B. Glukose) bei der Extraktion aus natürlichen
Produkten erschwert die Analyse. Die Herausforderung der Kohlenhydratanalyse beruht zudem auf
der Komplexität einer Kohlenhydratmischung, die zum einen abhängig von der Anzahl der
verschiedenen Mono‐, Di‐ und Trisaccharide sein kann und zum anderen vom Auftreten dieser
Kohlenhydrate in sehr unterschiedlichen Konzentrationen, sowie der Anwesenheit von
verschiedenen Probenmatrizen beeinflusst wird. Diese Studie zielt darauf ab, komplexe
Kohlenhydratmischungen in Bezug auf Identität und Konzentration der vorhandenen Kohlenhydrate
mittels GC‐MS‐basierter Verfahren zu analysieren und Informationen über die Molekülstruktur und
deren Nebenreaktionen bereit zu stellen.
Die vorliegende Dissertation über komplexe Kohlenhydratmischungen umfasst die Evaluierung von
sechs verschiedenen Derivatisierungsmethoden an zehn verschiedenen Kohlenhydraten (C2‐C6)
mittels GC‐MS. Die am besten geeignete Derivatisierungsmethode wird mit 32 Monosacchariden und
13 Disacchariden nochmals genauer untersucht. Darüber hinaus werden Abbauprodukte von
Kohlehydraten aus Zellstoffabwässern bzw. Buchpapierextrakten und Lignocellulose in Form von
Polysacchariden, Papier und Zellstoffen charakterisiert. Die Analyse von Nebenreaktionen an der
Struktur von Lignocellulose wird anhand dreier verschiedener Verfahren untersucht: (1) die
Bestimmung der Kohlenhydratzusammensetzung durch parallele Hydrolyse von Schwefelsäure und
Methanolyse von 21 Polysacchariden und 21 Zelluloseproben mittels GC‐MS. (2) Ein
Analyseverfahren basierend auf der Zemplén‐Deacetylierung zur Quantifizierung von gebundenen
Acetylgruppen in Polysacchariden und Kohlenhydraten. (3) Die Untersuchung des
V
Emissionspotentials flüchtiger organischer Säuren von Zeichnungen bzw. Drucken der Sammlung Karl
Friedrich Schinkel im Kupferstichkabinett (Berlin) und vorhandenen Lagermaterialien und deren
Auswirkung auf die Zelluloseintegrität.
Die Auswertung von zwei einstufigen und vier zweistufigen Derivatisierungsansätzen für die GC‐MS‐
Analyse zeigte, dass die Ethoximierung und anschließende Trimethylsilylierung anderen
Derivatisierungsmethoden überlegen ist. Die Vorteile sind eine geringe Anzahl von Peaks pro
reduzierendem Kohlenhydrat, eine gute chromatographische Auflösung, niedrige Nachweis‐ und
Bestimmungsgrenzen, geringe relative Standardabweichungen, ein großer Informationswert der
Massenspektren und eine hohe Robustheit gegenüber Matrixeffekten. Aus diesem Grund wurde eine
intensivere Untersuchung der Ethoximierung und anschließender Silylierung von 46 Kohlenhydraten
hinsichtlich chromatographischer und massenspektrometrischer Eigenschaften durchgeführt. Auf
Basis dieser Ergebnisse wurde ein Parameter zur Identifizierung der Oxim‐Peaks vorgeschlagen, um
die Zuverlässigkeit der Identifizierung von reduzierenden Kohlenhydraten zu verbessern. Dieser
begründet sich in der Reihenfolge der Retention und der Verschiebung der Retentionszeit zwischen
dem syn/anti‐Peak. Die Analyse der Kohlehydratzusammensetzung umfasst auch die quantitative
und qualitative Zusammensetzung von Monomeren in Polysacchariden und cellulosehaltigen
Materialien bzw. untersucht den Einfluss von Elektronenbestrahlungen und Alterungsprozessen auf
Degradationseffekte dieser Proben. Die Messung des Acetylierungsgrades zeigte die Analyse von
gebundenen Acetylgruppen an Polysacchariden, ohne durch die Anwesenheit von freier oder
adsorbierter Essigsäure bzw. Acetaten beeinflusst zu werden. Die Analyse von Methylacetat in der
Dampfphase durch SPME‐GC‐MS kombiniert mit 4‐O‐(13C2‐Acetyl)‐Vanillin zur internen
Standardisierung, die in situ isotopenmarkiertes Methyl‐13C2‐Acetat erzeugt, löst das
Kontaminationsproblem und eliminiert mögliche Einflüsse wie Diskriminierungseffekte.
Eine quantitative Analyse der Ameisensäure‐ und Essigsäureemission von Speichermaterialien durch
eine Headspace‐GC‐MS‐Methode mit ausgewähltem Ionen‐Monitoring (SHS‐GC/SIM‐MS) zeigte
signifikante Unterschiede von Essigsäurekonzentration in historischen Materialien und einer
Ameisensäure‐emittierenden Textilprobe. Die ausgasenden Materialien in der Schinkelsammlung
zeigen Degradationseffekte in Form einer oxidativen Wirkung auf Indikatorpapiere und im Vergleich
zu Essigsäure eine stärkere Ameisensäure‐induzierte Hydrolyse in Verbindung mit einem höheren
Verlust an Keto‐Gruppen.
VI
List of publications
The following papers are part of this thesis:
I. Bogolitsyna, A.; Becker, M.; Dupont, A.‐L.; Borgards, A.; Rosenau, T.; Potthast, A. (2011):
Determination of carbohydrate‐ and lignin‐derived components in complex effluents from
cellulose processing by capillary electrophoresis with electrospray ionization‐mass
spectrometric detection. Journal of Chromatography A, vol. 1218, pp. 8561‐8566.
II. Bogolitsyna, A.; Becker, M.; Borgards, A.; Liebner, F.; Rosenau, T.; Potthast, A. (2012):
Degradation products of lignocellulosics in pulp mill effluents – comparison and evaluation of
different gas chromatographic techniques for a comprehensive analysis. Holzforschung, vol.
66, pp 917‐925.
III. Becker, M.; Zweckmair, T.; Forneck, A.; Rosenau, T.; Potthast, A.; Liebner, F. (2013):
Evaluation of different derivatisation approaches for gas chromatographic‐mass
spectrometric analysis of carbohydrates in complex matrices of biological and synthetic
origin. Journal of Chromatography A, vol. 1281, pp. 115‐126.
IV. Becker, M.; Liebner, F.; Rosenau, T.; Potthast, A. (2013): Ethoximation‐silylation approach for
mono‐ and disaccharide analysis and characterization of their identification parameters by
GC‐MS. Talanta, vol. 115, pp. 642‐651.
V. Zweckmair, T.1, Becker, M.1, Ahn, K., Hettegger, H., Kosma, P., Rosenau, T., Potthast, A.
(2014): A novel method to analyze the degree of acetylation in biopolymers, Journal of
Chromatography A, 1372, pp. 212‐220. 1 These authors contributed equally to this work.
VI. Becker, M.; Meyer, F.; Jeong, M.‐J.; Ahn, K.; Henniges, U.; Potthast, A. (2016): The museum in
a test tube – Adding a third dimension to the evaluation of the impact of volatile organic
acids on paper. Polymer Degradation and Stability, vol 130, pp. 109‐117.
VII. Manuel Becker, Kyujin Ahn, Markus Bacher, Chunlin Xu, Anna Sundberg, Stefan Willför,
Thomas Rosenau, Antje Potthast: Comparative hydrolysis analysis of pulps and papers:
carbohydrate compositions and uncovering the supramolecular structure of cellulose. To be
submitted.
VII
List of other related publications
Patel, I.; Opietnik, M.; Böhmdorfer, S.; Becker, M.; Potthast, A.; Saito, T.; Isogai, A.; Rosenau, T.
(2010): Side reactions of 4‐acetamido‐TEMPO as the catalyst in cellulose oxidation systems.
Holzforschung, 64, (5), 549.
Opietnik, M.; Nabihah Binti Syed Jaafar, S.; Becker, M.; Bohmdorfer, S.; Hofinger, A.; Rosenau, T.
(2012): Ascorbigen ‐ Occurrence, Synthesis, and Analytics. Mini‐Reviews in Organic Chemistry, 9, (4),
411‐417.
Theuretzbacher, F.; Bauer, A.; Lizasoain, J.; Becker, M.; Rosenau, T.; Potthast, A.; Friedl, A.; Piringer,
G.; Gronauer, A. (2013): Potential of different Sorghum bicolor (L. Moench) varieties for combined
ethanol and biogas production in the Pannonian climate of Austria. Energy, 55, (0), 107‐113.
Griesser, M.; Weingart, G.; Schoedl‐Hummel, K.; Neumann, N.; Becker, M.; Varmuza, K.; Liebner, F.;
Schuhmacher, R.; Forneck, A. (2015): Severe drought stress is affecting selected primary metabolites,
polyphenols, and volatile metabolites in grapevine leaves (Vitis vinifera cv. Pinot noir). Plant Physiol.
Biochem, 88, 17‐26.
VIII
Table of Contents
Abstract ................................................................................................................................................. II
Kurzfassung ............................................................................................................................................ IV
List of publications.................................................................................................................................. VI
List of other related publications .......................................................................................................... VII
Table of Contents ................................................................................................................................. VIII
Abbreviations .......................................................................................................................................... X
1 Introduction ............................................................................................................................. 1
1.1 Characteristics of carbohydrates ............................................................................................. 2
1.2 Functions of carbohydrates ..................................................................................................... 7
1.3 Complex carbohydrate mixtures ............................................................................................. 9
1.4 Carbohydrate analysis ‐ State of the art ................................................................................ 10
1.4.1 Non‐chromatographic analysis techniques ........................................................................... 10
1.4.2 Chromatographic analysis techniques ................................................................................... 12
1.4.3 GC versus LC ........................................................................................................................... 15
1.5 Derivatization of carbohydrates for GC‐MS analysis ............................................................. 17
1.5.1 Single‐Step derivatization procedures ................................................................................... 19
1.5.2 Multi‐step derivatization procedures .................................................................................... 28
2 Material and Methods .......................................................................................................... 35
2.1 Derivatization methods .......................................................................................................... 35
2.1.1 Ethyloximation‐trimethylsilylation (EtOx‐TMS) ..................................................................... 35
2.1.2 Other derivatization methods ................................................................................................ 35
2.1.3 O‐isopropylidenation (ISP) ..................................................................................................... 36
2.1.4 Oximation reactions followed by trimethylsilylation (TMS) or trifluoroacetylation (TFA) .... 36
2.2 Hydrolysis reactions for polysaccharide analysis ................................................................... 36
2.2.1 Sulfuric acid hydrolysis ........................................................................................................... 36
2.2.2 Acid methanolysis .................................................................................................................. 37
2.2.3 Per‐trimethylsilylation (TMS) of monosaccharides obtained from hydrolysis reactions ...... 37
2.2.3.1 GC‐MS analysis of TMS‐derivatized hydrolysis products ....................................................... 37
2.2.4 Solid‐State NMR ..................................................................................................................... 38
2.2.5 GPC analysis of cellulose samples .......................................................................................... 38
2.3 Analysis of the degree of acetylation in biopolymers ............................................................ 39
IX
2.3.1 Method 1: Direct liquid‐phase analysis ................................................................................. 39
2.3.1.1 Sample preparation ............................................................................................................... 39
2.3.1.2 GC–MS conditions for the analysis of the liquid phase ......................................................... 39
2.3.2 Method 2: Analysis via gas phase .......................................................................................... 39
2.3.2.1 Sample preparation ............................................................................................................... 39
2.3.2.2 GC–MS conditions for the analysis by SPME ......................................................................... 40
2.4 Evaluation of the impact of volatile organic acids on paper ................................................. 41
2.4.1 Analysis of formic acid and acetic acid emission potential by static headspace GC‐MS with
selected‐ion monitoring (SHS‐GC/SIMMS) ............................................................................ 41
2.4.2 Artificial aging ........................................................................................................................ 41
2.4.3 Molar mass and carbonyl content measurement .................................................................. 42
3 Results and discussion .......................................................................................................... 43
3.1 Analysis of carbohydrates, lignocellulosic side‐reactions, and degradation products .......... 43
3.1.1 Analysis of lignocellulosic effluent streams and aged paper extracts (Paper I & II) .............. 43
3.1.1.2 Study of complex mixtures of lignocellulose degradation products by GC‐MS methods ..... 44
3.1.1.3 Comparison of CE‐MS and GC‐MS methods for analyzing complex mixtures of lignocellulose
degradation products ............................................................................................................ 45
3.1.2 Analysis of complex mixtures of carbohydrates (Paper III & IV) ............................................ 46
3.1.2.1 Derivatization methods (Paper III) ......................................................................................... 46
3.1.3 Analysis of lignocellulosic side‐reactions (Paper V, VI and VII) .............................................. 50
3.1.3.1 Applications ........................................................................................................................... 50
3.1.3.1.1 Carbohydrate compositions of polysaccharides (Paper V to be submitted) ......................... 50
3.1.3.1.2 The degree of Acetylation (Paper VI) ..................................................................................... 53
3.1.3.1.3 Volatile organic acids in the paper (Paper VII) ....................................................................... 54
4 Conclusion ............................................................................................................................. 57
Acknowledgements ............................................................................................................................... 60
References ............................................................................................................................................. 61
List of Figures ......................................................................................................................................... 72
Appendix ............................................................................................................................................... 73
X
Abbreviations
AE Anion‐exchange
BeOx O‐benzyl oxime
BSTFA N,O‐bis(trimethylsilyl)trifluoroacetamide
CE Capillary electrophoresis
CI Chemical ionization
CP Cross‐polarization
DMAP 4‐(dimethylamino)pyridine
EE Ethyl acetate
EI Electron ionization
ELSD Evaporative light‐scattering detection
ESI Electrospray ionization
EtOx O‐ethyl oxime
eV Electron volt
FID Flame ionization detector
FPD Flame photometric detector
GC Gas chromatography
GC‐FID Gas chromatography coupled with flame ionization detection
GC‐MS Gas chromatography coupled with mass spectrometry
GFC Gel filtration chromatography
GPC Gel permeation chromatography
HILIC Hydrophilic interaction liquid chromatography
HPLC High performance liquid chromatography
IUPAC International Union of Pure and Applied Chemistry
LC Liquid chromatography (see HPLC)
LC‐MS Liquid chromatography coupled with mass spectrometry
LOD Limit of detection
LOQ Limit of quantification
M+• Molecular ion
MALDI‐TOF Matrix‐assisted laser desorption ionization coupled with time of flight mass
spectrometry
MeOx O‐methyl oxime
MS Mass spectrometry
MSTFA N‐methyl‐N‐(trimethylsilyl)trifluoroacetamide

XI
MW Molecular weight
m/z Mass‐to‐charge
NMR Nuclear magnetic resonance
NPD Nitrogen phosphorus detector
Ox O‐hydroxyl oxime
PAD Pulsed amperometric detection
PCA Principal component analysis
Py‐GC Pyrolysis gas chromatography
RI Refractive Index
SEC Size exclusion chromatography
SIM Selected ion monitoring
SPME Solid phase micro extraction
TIC Total ion current
TMCS Trimethylchlorosilane
TMS Trimethylsilyl
TOF Time‐of‐flight
UV Ultra‐violet
1
1 Introduction
Carbohydrates are the most abundant organic compounds in nature and the most versatile materials
available [1]. In nature, they are synthesized predominantly by photosynthesis and consist of carbon,
hydrogen, and oxygen [2]. Carbohydrates are widely distributed both in animal and plant tissues and
fulfill various biological functions as structural materials, energy storage, and regulators in
physiological processes. Moreover, carbohydrates are substantial resources used in both food and
non‐food industry. Besides their use as a foodstuff, their use also includes food gums, stabilizer or
quality marker. In the non‐food sector, carbohydrates are applied as feedstock in the production of
textiles, paper, plastics, and downstream industries as well as raw material for modification and
transformation to substances, which are primary sources for detergents, emulsifiers, foams or
vitamins [3]. The amount of carbohydrates and their accessibility in plant tissues plays also an
important role for the use as renewable energy. The demands of a growing industry and research
sector and the trend towards more precise carbohydrate data increase with the occurrence of new
possible applications for carbohydrates. The information about the qualitative and quantitative
distribution of carbohydrates in foodstuff, feedstock, and processed materials is essential to control
and monitor processing, quality and prediction of product properties.
However, analyzing carbohydrates is a challenge. Carbohydrates are uncharged and colorless [4].
They occur very diversely regarding structure, size, functionality, and ranging from simple
monosaccharides to highly complex polysaccharides [5]. Monosaccharides with the same number of
carbon atoms (e.g., hexoses) can form isomers, which are analytically similar compounds with equal
molecular weight, only differing in their stereochemistry [6]. Furthermore, reducing sugars (e.g.,
glucose) exist as an equilibrium mixture of up to five tautomeric forms, α‐ & β‐pyranose, α‐ & β‐
furanose and the open‐chain form [7]. The number of different mono‐, di‐ and trisaccharides in a
carbohydrate mixture and their occurrence in very different concentrations affect the complexity of a
carbohydrate blend. The challenge of carbohydrate analysis lays in the complexity of the
carbohydrate mixture. Complex carbohydrate blends can be extracts or samples from plants tissues
(e.g., fruits), honey or hydrolysis products of polysaccharides (e.g., paper).
A wide range of analytical techniques exists for separation and identification of different
carbohydrate species. They range from physical, chemical, and enzymatic measurements to highly
sensitive chromatographic methods. The primary chromatographic methods for analyzing
carbohydrate compounds comprise high‐performance liquid chromatography (HPLC)‐, gas
chromatography (GC)‐ and capillary electrophoresis (CE)‐based methods [3]. The gas chromatograph
coupled to mass spectrometry (GC‐MS) system has been chosen for this study, providing a very high
separation performance combined with highly selective and sensitive ways of detection for
carbohydrates [8]. However, the high polarity, pronounced hydrophilicity with a strong tendency to
2
hydrogen bonding, and near‐zero volatility of carbohydrates denote the drawbacks of applying this
method. Therefore, all carbohydrates require suitable derivatization to convert them into volatile
products prior to GC‐MS analysis [9].
Various derivatization methods and strategies exist to produce carbohydrate derivatives for GC‐MS
analysis. Derivatization of carbohydrates is usually conducted prior GC injection, while the strategies
are differentiated in single‐step and two‐ or multi‐step strategies. The primary single‐step
derivatization strategy applied for analyzing polyalcohols and non‐reducing carbohydrates by GC‐MS
comprises alkylation (particular methylation), acetylation (acetates or trifluoroacetates), silylation
and the formation of cyclic derivatives, e.g., by isopropylidination [9‐11]. However, most of the single
step derivatization procedures retain up to five tautomers per reducing carbohydrate. Two‐ or multi‐
step derivatization strategies have been developed to overcome this drawback by converting the
carbonyl group into a specific derivative (e.g., oxime) to inhibit the formation of different tautomers
by intermolecular conversion prior trimethylsilyl or trifluoroacetyl derivatization [7, 10]. Each method
has its advantages and disadvantages regarding reaction time, handling, costs, and labor. Previous
studies about carbohydrates analysis based only on a few reference standards, sample origins or
compared derivatization methods [12, 13]. There is also a lack of identification data for
carbohydrates beyond the well‐known glucose, fructose, and sucrose.
This study aims to evaluate the most appropriate analysis approaches for the investigation of
complex carbohydrate mixtures. The evaluation includes single and two‐step derivatization methods
for carbohydrates and associated degradation products with regard to their performance for GC‐MS
and CE‐MS analysis. Evaluation criteria are derivatization efficiency, chromatographic resolution
characteristics, informational value, and pattern diversity of mass spectra, the reliability of peak
assignment, reproducibility of quantification results, and robustness towards matrix effects. The
study also includes the analysis of polysaccharides on their monomer composition by hydrolysis
approaches, their degree of acetylation, and the degradation‐caused release of volatile organic
compounds (VOCs).
1.1 Characteristics of carbohydrates
Carbohydrates are polyhydroxy carbonyls, which include a wide range of molecules, occurring in
single or multiple units as low molecular weight mono‐ and disaccharides, intermediate molecular
weight oligosaccharides up to high molecular weight polysaccharides [14, 15].
The classification of monosaccharides takes place according to their number of carbons, available
ketone or aldehyde groups and the corresponding structural configuration. The number of carbon
atoms in the molecules’ carbon chain determines the naming of monosaccharides, starting at trioses
3
(C3), tetroses (C4), pentoses (C5), hexoses (C6), heptoses (C7), et cetera [16]. Monosaccharides, which
contain an aldehyde group at carbon‐1 (C‐1) are aldoses (e.g., glucose). Whereas ketoses (e.g.,
fructose) contain a carbonyl group often located at carbon‐2 (C‐2) but can also occupy any position in
a carbohydrate chain, except the terminal position. According to this naming, there are aldo‐tetroses,
aldo‐pentoses, aldo‐hexoses, et cetera and keto‐tetroses, keto‐pentoses, keto‐hexoses, et cetera.
The carbon atom of the carbonyl or aldehyde groups is the reactive center of the monosaccharide
chain, called the anomeric carbon atom [15, 17].
The high variety of monosaccharides bases on the different stereochemical configurations. The
elongation of the monosaccharides’ carbon chain starting at triose by insertion of one or more
hydroxymethyl groups (–CHOH) generates a new chiral center in the carbohydrate molecule [14].
When drawn in the Fischer projection, carbohydrates showing the hydroxyl group at the reference
carbon atom oriented to the right belong to the D‐chiral family; the hydroxyl group oriented to the
left means the carbohydrate belongs to the L‐chiral family [14, 15]. So, D‐carbohydrates are the
mirror images of L‐carbohydrates. However, they show specific optical rotation [14, 15]. The D‐
configuration is the present form of naturally occurring carbohydrates. L‐carbohydrates rarely appear
in nature, except L‐arabinose and L‐galactose, which exist as monomers in many carbohydrate
polymers [14]. L‐sugars are handled differently in biological systems and are not metabolized by
humans [15]. Epimers and diastereoisomers describe other stereochemical configurations of
carbohydrates. Epimers denote for a pair of carbohydrates, which differ in the configuration of only
one asymmetric atom (chiral center), e.g., D‐glucose and D‐mannose are epimers at the C‐2 position;
D‐glucose and D‐galactose are epimers at the C‐4 position. Carbohydrate pairs differing in more than
one asymmetric carbon atoms (chiral centers) are diastereoisomers [15, 16].
The stereochemical configuration of aldohexoses includes four chiral carbons, which allow the
formation of 16 different sugars with an aldehyde end, and eight different keto‐hexoses. So, there
are 24 different C6‐carbohydrates, 12 belonging to the D‐series, and 12 belonging to the L‐series [14].
Considering that L‐sugars rarely occur in nature, 12 hexoses possess the same empirical formula,
C6H12O6, and own therefore the same molecular weight of 180.16 g*mol−1. The 12 stereochemical
isomers only differ in their orientation of hydroxyl groups within the molecule [6].
Monosaccharides can form a cyclic hemiacetal or hemiketal structure by an intramolecular
nucleophilic addition of an OH‐group at the ketone or aldehyde , resulting in either a five‐membered
or six‐membered ring [16, 18]. A six‐membered cyclic hemiacetal is called pyranose, a five‐
membered cyclic hemiacetal a furanose. Accordingly, the six‐membered ring of glucose is called
glucopyranose and the five‐membered ring of fructose fructofuranose [16]. The cyclization reaction
of monosaccharides in solution is reversible and in hence in equilibrium with e.g. the open chain
form, which is dependent on temperature and pH [18]. The chemical reactivity and functionality of
4
different carbohydrates are directly related to the presence of the hemiacetal, hemiketal, acetal, and
ketal functional groups [15]. Cyclization of carbohydrates produce two new discrete isomeric forms
as the hydroxyl group on the anomeric carbon atom, and formerly achiral center has now two
possible orientations, designated as α and β [14, 15]. These two configurations have different
chemical properties and are called anomers, which differ only at C‐1 for aldoses and C‐2 for ketoses
[15].
Cyclic hemiacetals are particularly stable; usually they are more stable than their open‐chain forms.
So the solid, crystalline form of carbohydrates can consist of molecules with specific anomeric ring
form [16]. When a reducing carbohydrate dissolves in water, different tautomeric forms occur, due
to molecular rearrangements causing ring openings and subsequent ring closures. This process,
described as mutarotation, alter the optical rotation of carbohydrates and produce the α‐ and β‐
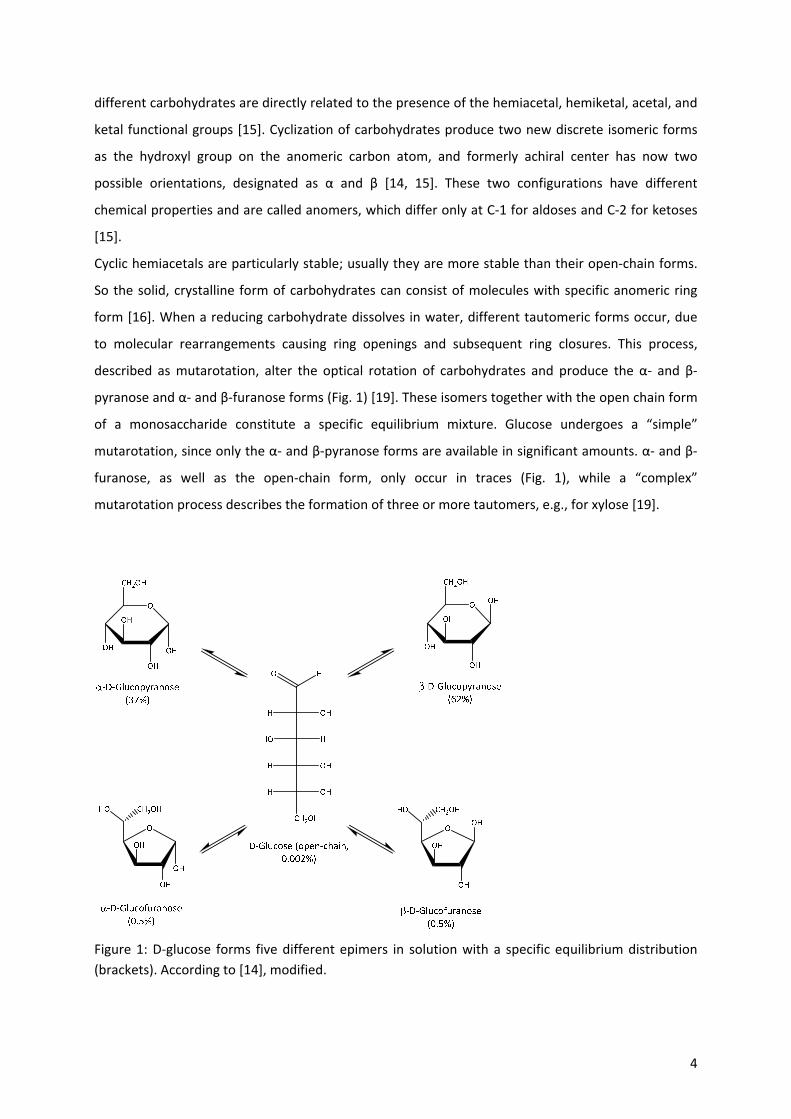
pyranose and α‐ and β‐furanose forms (Fig. 1) [19]. These isomers together with the open chain form
of a monosaccharide constitute a specific equilibrium mixture. Glucose undergoes a “simple”
mutarotation, since only the α‐ and β‐pyranose forms are available in significant amounts. α‐ and β‐
furanose, as well as the open‐chain form, only occur in traces (Fig. 1), while a “complex”
mutarotation process describes the formation of three or more tautomers, e.g., for xylose [19].
Figure 1: D‐glucose forms five different epimers in solution with a specific equilibrium distribution
(brackets). According to [14], modified.
5
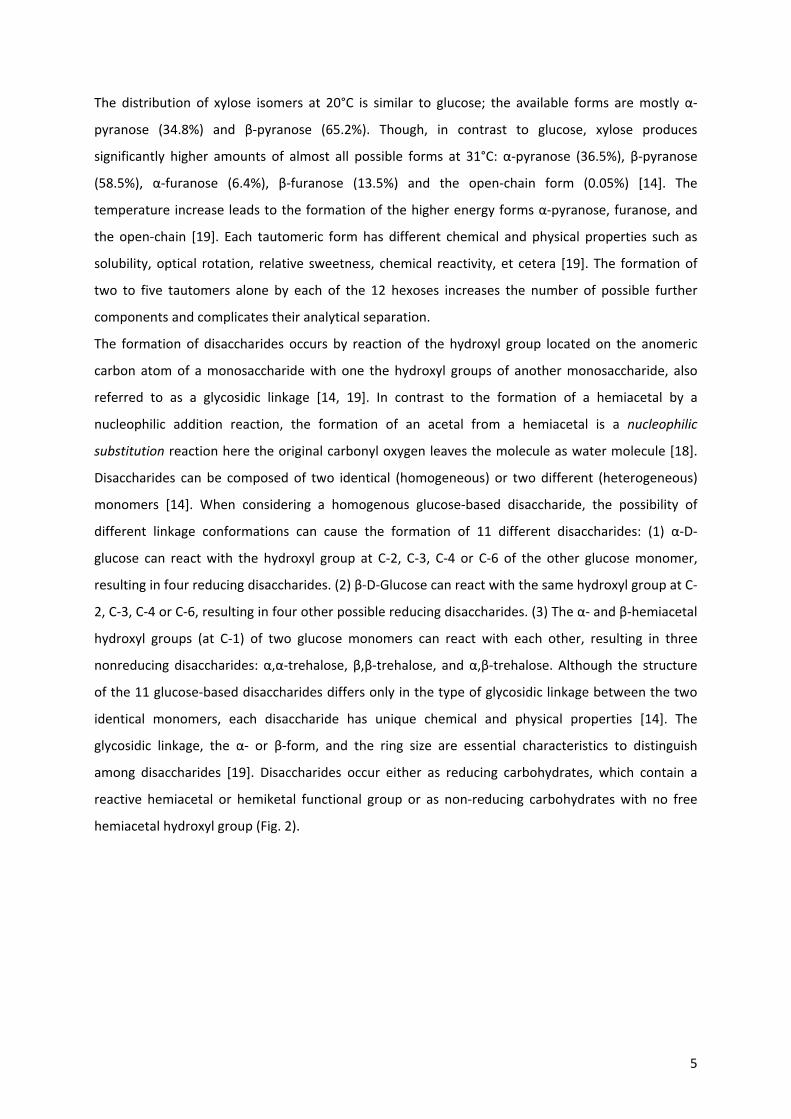
The distribution of xylose isomers at 20°C is similar to glucose; the available forms are mostly α‐
pyranose (34.8%) and β‐pyranose (65.2%). Though, in contrast to glucose, xylose produces
significantly higher amounts of almost all possible forms at 31°C: α‐pyranose (36.5%), β‐pyranose
(58.5%), α‐furanose (6.4%), β‐furanose (13.5%) and the open‐chain form (0.05%) [14]. The
temperature increase leads to the formation of the higher energy forms α‐pyranose, furanose, and
the open‐chain [19]. Each tautomeric form has different chemical and physical properties such as
solubility, optical rotation, relative sweetness, chemical reactivity, et cetera [19]. The formation of
two to five tautomers alone by each of the 12 hexoses increases the number of possible further
components and complicates their analytical separation.
The formation of disaccharides occurs by reaction of the hydroxyl group located on the anomeric
carbon atom of a monosaccharide with one the hydroxyl groups of another monosaccharide, also
referred to as a glycosidic linkage [14, 19]. In contrast to the formation of a hemiacetal by a
nucleophilic addition reaction, the formation of an acetal from a hemiacetal is a nucleophilic
substitution reaction here the original carbonyl oxygen leaves the molecule as water molecule [18].
Disaccharides can be composed of two identical (homogeneous) or two different (heterogeneous)
monomers [14]. When considering a homogenous glucose‐based disaccharide, the possibility of
different linkage conformations can cause the formation of 11 different disaccharides: (1) α‐D‐
glucose can react with the hydroxyl group at C‐2, C‐3, C‐4 or C‐6 of the other glucose monomer,
resulting in four reducing disaccharides. (2) β‐D‐Glucose can react with the same hydroxyl group at C‐
2, C‐3, C‐4 or C‐6, resulting in four other possible reducing disaccharides. (3) The α‐ and β‐hemiacetal
hydroxyl groups (at C‐1) of two glucose monomers can react with each other, resulting in three
nonreducing disaccharides: α,α‐trehalose, β,β‐trehalose, and α,β‐trehalose. Although the structure
of the 11 glucose‐based disaccharides differs only in the type of glycosidic linkage between the two
identical monomers, each disaccharide has unique chemical and physical properties [14]. The
glycosidic linkage, the α‐ or β‐form, and the ring size are essential characteristics to distinguish
among disaccharides [19]. Disaccharides occur either as reducing carbohydrates, which contain a
reactive hemiacetal or hemiketal functional group or as non‐reducing carbohydrates with no free
hemiacetal hydroxyl group (Fig. 2).
6
O
OH
O
OH
CH2OH
OH
Sucrose ( ‐D‐glucopyranosyl‐(1‐2)‐ ‐D‐fructofuranoside)
O
HO
CH2OH
OH
CH2OHO
OH
OH
CH2OH
OH
O
OH
OH
OH
CH2OH
O
Cellobiose ( ‐D‐glucopyranosyl‐(1‐4)‐D‐glucopyranose)
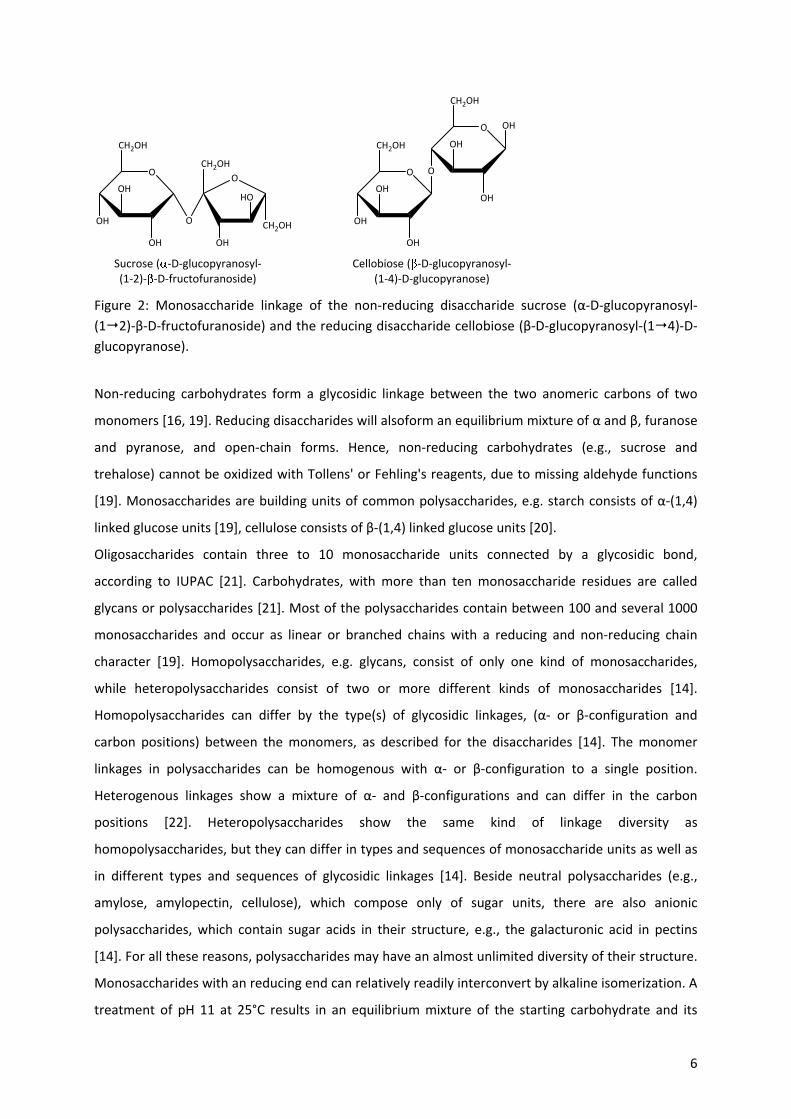
Figure 2: Monosaccharide linkage of the non‐reducing disaccharide sucrose (α‐D‐glucopyranosyl‐
(12)‐β‐D‐fructofuranoside) and the reducing disaccharide cellobiose (β‐D‐glucopyranosyl‐(14)‐D‐
glucopyranose).
Non‐reducing carbohydrates form a glycosidic linkage between the two anomeric carbons of two
monomers [16, 19]. Reducing disaccharides will alsoform an equilibrium mixture of α and β, furanose
and pyranose, and open‐chain forms. Hence, non‐reducing carbohydrates (e.g., sucrose and
trehalose) cannot be oxidized with Tollens' or Fehling's reagents, due to missing aldehyde functions
[19]. Monosaccharides are building units of common polysaccharides, e.g. starch consists of α‐(1,4)
linked glucose units [19], cellulose consists of β‐(1,4) linked glucose units [20].
Oligosaccharides contain three to 10 monosaccharide units connected by a glycosidic bond,
according to IUPAC [21]. Carbohydrates, with more than ten monosaccharide residues are called
glycans or polysaccharides [21]. Most of the polysaccharides contain between 100 and several 1000
monosaccharides and occur as linear or branched chains with a reducing and non‐reducing chain
character [19]. Homopolysaccharides, e.g. glycans, consist of only one kind of monosaccharides,
while heteropolysaccharides consist of two or more different kinds of monosaccharides [14].
Homopolysaccharides can differ by the type(s) of glycosidic linkages, (α‐ or β‐configuration and
carbon positions) between the monomers, as described for the disaccharides [14]. The monomer
linkages in polysaccharides can be homogenous with α‐ or β‐configuration to a single position.
Heterogenous linkages show a mixture of α‐ and β‐configurations and can differ in the carbon
positions [22]. Heteropolysaccharides show the same kind of linkage diversity as
homopolysaccharides, but they can differ in types and sequences of monosaccharide units as well as
in different types and sequences of glycosidic linkages [14]. Beside neutral polysaccharides (e.g.,
amylose, amylopectin, cellulose), which compose only of sugar units, there are also anionic
polysaccharides, which contain sugar acids in their structure, e.g., the galacturonic acid in pectins
[14]. For all these reasons, polysaccharides may have an almost unlimited diversity of their structure.
Monosaccharides with an reducing end can relatively readily interconvert by alkaline isomerization. A
treatment of pH 11 at 25°C results in an equilibrium mixture of the starting carbohydrate and its
7
corresponding C2‐epimer, e.g., D‐glucose can convert into D‐fructose and D‐mannose [16, 22]. The
process of epimerization of two aldoses and the formation of a ketose by enediol rearrangement is
called the Lobry de Bruyn‐Alberda van Eckenstein transformation [16, 22]. The isomerization can be
induced by base or enzyme and at a much slower rate under acid or neutral conditions [14]. Under
stronger alkaline conditions (pH>14) and higher temperatures, the combination of epimerization and
enediol rearrangements will take place along the whole carbohydrate chain and result in a more
complex mixture of sugars [16, 22]. Conditions occurring during Kraft pulping also lead to an alkaline
degradation of polysaccharides and, thus, forming various hydroxyl acids in addition to formic acid,
acetic acid, and small amounts of dicarboxylic acids [23]. D‐glucose, for example, can convert into all
of the possible aldohexoses and ketohexoses (D‐allose, D‐galactose, et cetera) and over 100 other
byproducts [22]. Other derivatives of saccharides are sugar phosphates, deoxy sugars, amino sugars,
and sugar alcohols.
1.2 Functions of carbohydrates
Carbohydrates are widely distributed in nature, both in animal and plant tissues and fulfill different
roles [14]. They have various biological functions: as structural support for cell walls of plants and
microorganisms and the exoskeletons of insects and other arthropods (e.g., cellulose, chitin, xylans,
mannans) [14, 22, 24]. They act as energy storage (e.g., starch, fructans, glycogen) and have different
regulatory roles in physiological processes, e.g., photosynthesis, sink metabolism, nitrogen uptake,
defense reactions, secondary metabolism, and hormonal balance [25, 26]. In many dicotyledons,
sucrose is the form of long‐distance transport in the phloem [27], complemented by sorbitol in
Rosaceous trees (apples, pears, stonefruits) [28].
Carbohydrates enable cell‐cell interaction, receptor binding, infection, and immunity responses and
other signaling effects by biological recognition of carbohydrate moieties [14, 22]. Carbohydrates can
induce signaling effects directly by the molecules or indirectly by affecting gene expression [29].
Oligosaccharides conjugated to protein or lipids are essential components of cell membranes and can
directly interact in the cell to cell recognition and signaling, based on their oligosaccharide moieties
[14]. Studies showed that monosaccharides (e.g., glucose, fructose, and mannose), sugar alcohols
(e.g., galactinol), and disaccharides (e.g., sucrose, trehalose, and sucrose analogs) might regulate
plant metabolism by affecting gene expression [29].
Carbohydrates can act as a marker and key‐component to reflect the plant’s energy status and
indicating biotic or abiotic stress factors [30]. Abiotic stress factors often induce an accumulation of
specific carbohydrates, which either protect organisms from temporal changes in the environment,
such as varying temperatures, pH, and water supply, or by adaptation and fixation of organisms to a
8
specific environmental niche [22]. Cold treatments result in the accumulation of glucose, fructose,
and sucrose in combination with other osmolytes to protect plant cells by osmotic adjustment or by
stabilizing membranes and proteins [31‐33]. Arabinoxylans have also been postulated to inhibiting
intercellular ice formation to enhance winter survival of cereals [14]. On the other hand, heat stress
induced by local application of high temperature at Vitis vinifera Cabernet Sauvignon clusters results
in the accumulation of galactinol in berries, which mainly acts as a galactosyl donor for biosynthesis
of RFOs (raffinose family oligosaccharides) in plants [29, 34]. There are different reports of drought
stress effects on the carbohydrate level at various plant organs. The ribose concentration increased
with increasing water deficit in grapevine leaves [35]. In berry pulp, the level of myo‐inositol and
sucrose increase under water‐deficit stress, which probably also acts as osmoprotectants and
precursors for the formation of raffinose series sugars to enhanced drought stress tolerance [36].
Carbohydrates can also act as protective substances against biotic stress caused by insects, fungi,
viruses or other microorganisms [14, 22]. Specific cell wall polysaccharides of plants operate as
elicitors of antibiotics (phytoalexins), e.g., α‐1,4‐dodecagalacturonide fragments of pectic
polysaccharides in soybean induce the synthesis of a protein that inhibits insect and microbial
proteinases [14]. Some general features in the stress mechanisms can be activated by biotic and
abiotic stimuli. Therefore, galactinol and RFOs are known to act as signaling units as well as real ROS
(reactive oxygen species) scavengers [37].
Beside the functional effect of carbohydrates in organisms, carbohydrates are substantial resources
and feedstocks used both in food and non‐food industry. A distinction among digestible and
indigestible carbohydrates occurs in food industry. The digestive tract directly resorb only
monosaccharides, e.g., D‐glucose and D‐fructose. Therefore, higher saccharides need to be digested
before absorption and utilization. The disaccharides sucrose and lactose, maltooligosaccharides and
maltodextrins, as well as the polysaccharide starch, are readily digested by humans and used as a
source of calories and carbon [2]. All other polysaccharides are non‐digestible [2]. The most
abundant naturally occurring carbohydrate in food products is starch, followed by pectin,
hemicellulose and cell wall materials [38]. The non‐digestible polysaccharide fraction acts as
stabilizers and dietary fiber in food systems. They can significantly influence functional properties as
viscosity, the stability of emulsions and foams, freeze‐thaw stability, water‐holding capacity,
browning, aroma, flavor, and enable a variety of desirable textures from crispness to smooth or soft
gels [2, 38].
Common ingredients with functional properties are food gums, such as carboxymethyl cellulose, guar
gum, gum Arabic, locust bean gum, methylcellulose, modified pectin, xanthan or naturally occurring
cell‐wall polysaccharides, such as pectin, cellulose, hemicelluloses and β‐glucans [2]. The stabilization
of emulsions and avoidance of ice crystal growth in ice cream is achieved by adding guar gum and
9
locust bean gum to the food system [38]. On the other hand, carbohydrate can act as quality markers
in the food sector, such as lactulose, maltulose and difructose anhydrides. Their formation by
isomerization from their corresponding monomers under high temperature indicates heat
treatments of milk, honey, and coffee, respectively [39‐41].
In the non‐food sector, carbohydrates occur as feedstock in the production of textiles, paper, and
plastics. In downstream industries, such as the building and construction industry, carbohydrates are
used as insulation and filling material; the automobile production and the furniture industry uses
processed carbohydrates as upholstery material for furniture and mattresses, et cetera [3, 42]. Also,
monosaccharides are very versatile compounds for many applications, such as modification and
chemical transformation to substances, which are primary sources for detergents, emulsifiers, foams,
and vitamins [3]. Carbohydrates also act as feedstock for bioplastics (e.g., polyurethane, polylactide,
polyalkenoate), nonionic surfactants (alkyl polyglucosides), natural glues, and adhesives, as a source
for biofuels (e.g., bioethanol), organic solvents, and fine chemicals, such as (hydroxymethyl)furfural
and 2,5‐dimethylfuran [43].
Equivalent to the wide‐ranging fields of carbohydrate utilization, the analysis of carbohydrates has to
cover the demands and requirements of the different areas by the implementation of appropriate
methods. The determination of the carbohydrate composition and the amounts of specific
carbohydrates requires quantitative carbohydrate analysis methods to produce reliable and valid
data to meet the requirements of science and industry.
1.3 Complex carbohydrate mixtures
Carbohydrates arise as simple or complex mixtures. The number of involved carbohydrates
significantly influences the complexity of a carbohydrate‐containing sample. Firstly, a diverse mixture
of carbohydrates can be composed of different monosaccharides (pentoses and hexoses) or can
consist of mono‐, di‐ and trisaccharides. Secondly, the occurrence of carbohydrates in very different
concentrations affects the complexity. The complete hydrolysis of polysaccharides can result in a
mixture of different monosaccharides, while the analysis of soluble plant or fruit extracts usually
present glucose, fructose, and sucrose as mono‐ and disaccharides in high concentrations and other
carbohydrate species in much lower concentrations. Further examples of complex plant‐based
carbohydrate mixtures are extracts or samples of leaves, roots or the whole plant, honey, and paper.
The composition of carbohydrates in plant extracts and honey mainly ranges from mono to
trisaccharides, while polysaccharides occurring in cell walls comprise celluloses, xyloglucans,
heteroxylans, mannans, and pectins or consist of starch and fructans, which act as reserve material in
different plant organs [44]. Plant‐based polysaccharides can either have a simple composition of only
10
one monomer, e.g., glucans or can compose of an incredibly complex construction of different
monosaccharides and uronic acids, which apparently differ between different species and by the
function of the cell type [44, 45]. Hydrolytic, enzymatic, and mechanical processes can cleave
polysaccharides into monosaccharides and thereby, enable the carbohydrate analysis of
polysaccharides. Polysaccharides are rarely found in pure form, except polymers in storage organs;
they often occur as a complex mixture or are available in purified form through processing.
Processing of carbohydrate‐containing material in paper industry produces pulp bleaching effluents,
which contain myriad carbohydrates and lignin‐derived compounds in an aqueous matrix with a high
concentration of inorganic salts [46]. These effluents contain a high number of carbohydrate
degradation products, e.g., hydroxy monocarboxylic acids and dicarboxylic acids [47]. A non‐
carbohydrate fraction consisting of fatty acids, resin acids, sterols, and constituents of tall oil also
arises during the pulping process and complicates the analysis of this kind of carbohydrate mixtures
[48]. The sample origin interferes with the analysis of the carbohydrate composition by additional
compounds, which increase the complexity of the sample matrix and commonly interferes the
analysis procedures [49].
The identification and quantification of carbohydrates in a complex mixture, either consisting of
monosaccharides with equal molecular weight (e.g., hexoses) or carbohydrates with different
molecular weights (mono‐, di‐ and trisaccharides) in one sample or both is a challenge for
chromatographic separation and characterization.
1.4 Carbohydrate analysis ‐ State of the art
The knowledge about the qualitative and quantitative carbohydrate composition in fruits, processing
materials, and other natural matrices is essential for controlling and monitoring product properties,
structure elucidation, or understanding metabolic processes. To fulfill the simple demands of
carbohydrate analysis, non‐chromatographic or traditional methods have been developed to
measure, e.g., total carbohydrate content or the amount of reducing carbohydrates by physical and
chemical methods [50]. The increasing demands on a more detailed carbohydrate analysis led to the
development of chromatographic analysis techniques, ensuring the identification of specific
carbohydrates, highly sensitive quantification and the possibility of determining unknown
compounds.
1.4.1 Non‐chromatographic analysis techniques
Physical and chemical methods can measure the concentration of carbohydrate solutions.
Refractometry is based on the refractive index of a carbohydrate solution, polarimetry depends on
11
the optical rotation of the carbohydrate molecule under polarized light, while hydrometry measures
the amounts of solutes in a solution by the density of liquids [50]. In contrast to physical methods,
chemical analysis procedures can detect more specific structural properties, e.g., reducing groups or
distinguishing among aldoses and ketoses [50]. Chemical methods, so called classical methods,
determine reducing carbohydrates by reduction of alkaline metal (particular copper) salt solutions to
the corresponding free metals or oxides [50]. These methods include the reaction or titration with
Fehling’s solution (solution A: CuSO4, solution B: NaOH and Na‐K‐tartrate) and slightly changed
modifications [50]. The reaction with ferricyanide ([Fe(CN)6]3−) solution and the iodometric titration,
allow the determination of aldoses in the presence of ketoses [50]. Chemical methods to quantify
carbohydrates in solution also involve colorimetric measurements. Examples are (1) the neocuproine
method for reducing carbohydrate concentration (orange complex with an absorption maximum at
457 nm), (2) the anthrone method (blue/green color in the presence of carbohydrates larger than
hexoses) or (3) the Nelson‐Somogyi method (molybdenum blue measured at 820 nm). (4) The
phenol‐sulfuric method, which yellow color intensity is proportional to the total carbohydrate
concentration of a solution [50]. Despite the simple application of these methods, the drawbacks are
their dependence on temperature, pH and carbohydrate concentration, time‐consuming chemical
reactions and the requirement of a pure carbohydrate solution because contamination with organic
(proteins, amino acids) and inorganic (metal ions) matter can influence the results [50].
Although physical and chemical methods are common practice in many laboratories [50], nowadays,
there are demands for more information beyond the determination of the total amount of
carbohydrates in a sample. The research and industry sector is exploring and processing
carbohydrate‐based or carbohydrate‐containing materials. It requires information about the identity,
structural distribution and quantitative evaluation of carbohydrate compounds in a mixture of them
[50]. Thus, chromatographic methods with higher sensitivity and enhanced selectivity have been
developed to meet the emerging needs of carbohydrate analysis. High‐performance liquid
chromatography (HPLC) and gas chromatography (GC) largely replaced earlier chromatographic
methods like paper chromatography (PC) and thin‐layer chromatography (TLC). However, older
methods are still applied, when only qualitative or semi‐qualitative results are required. The use of
enzymatic methods for determination and quantification of carbohydrates are based on two
different approaches: (1) the breakdown of a substrate and subsequent measurement of the reaction
products by chemical or physical methods as mentioned above; (2) the quantification of reaction
products by determination of the reaction rate or the end‐product of an enzyme‐substrate
interaction performed with electrochemical or spectrophotometric techniques [50, 51]. The end
products of an enzyme‐substrate interaction can be measured directly (e.g., by H2O2 or NADPH) or by
applying an indicator or dye to form a colored complex, allowing a spectrophotometric measurement
12
[52]. These methods are sensitive, rapid and in theory specific to a certain carbohydrate, but the
specificity depends on enzyme purity [50]. Most of these methods are available in kit form, which
facilitates that the correct concentrations and reaction conditions are compiled [2]. A well‐known
enzymatic method for glucose quantification is the enzymatic conversation of glucose to glucose‐6‐
phosphate and further to 6‐phosphogluconate forming NADPH in the presence of NADP, which can
be quantified at 334 nm [51]. The enzyme glucose oxidase produces hydrogen peroxide (H2O2) that
can be measured by electrochemical oxidation at a platinum electrode [53] or by combination with
the enzyme peroxidase and a colorless indicator, which forms a colored complex, known as glucose
oxidase‐peroxidase method [2].
1.4.2 Chromatographic analysis techniques
The primary chromatographic methods for analysis of carbohydrate compounds consist of HPLC‐ or
GC‐based methods and to a lesser extent, capillary electrophoresis (CE)‐based methods [3]. The
principle of the three techniques comprises the separation of a carbohydrate mixture and the
subsequent detection of the separated compounds. Dependent on the sample matrix, the analysis
methods often involve an intense sample pretreatment to extract the target compounds from
interfering compounds and to clean them up [50]. Beside these primary carbohydrate analysis
methods, other techniques as nuclear magnetic resonance spectroscopy (NMR) and matrix‐assisted
laser desorption ionization coupled with time of flight mass spectrometry (MALDI‐TOF) are available
and increasingly being used, particularly for qualitative polysaccharide analysis.
The widely used separation modes for carbohydrate analysis by HPLC are the chromatography on
normal or reversed phase, followed by ion‐exchange chromatography particular with anionic
exchange resins and size exclusion chromatography (SEC) [2, 5]. The separation on normal phase is
based on stationary phases with trifunctional amino propylsilane bound to spherical silica particles
also called hydrophilic interaction liquid chromatography (HILIC) [5]. In case of reverse phase
separation, the column contains a hydrophilic stationary phase made by adding, e.g., longer alkyl
chains (C‐18 column) or phenyl groups (phenyl column) to the silica gel [2]. Ion‐exchange
chromatography is usually carried out as anion‐exchange (AE) chromatography, where a highly
alkaline mobile phase produces carbohydrate anions by ionization of hydroxyl groups with slight
differences in pKa values, acting as an efficient separation between low molecular‐weight
carbohydrates [2, 50]. Alternatively, the cation exchange or ligand exchange chromatography uses
different bonding strengths between cis‐glycols of carbohydrates with e.g. Ca2+‐ or Ag+‐loading on the
column to separate compounds [5, 51]. The SEC covers the applications gel filtration chromatography
(GFC) and gel permeation chromatography (GPC), while GFC applies an aqueous mobile phase and
GPC an organic phase. The separation technique is based on differences in the hydrodynamic volume
13
of the carbohydrates and use of resins with particular pore size and structure, which influence the
speed of elution of the compounds [5].
The most common detector technique applied to quantify carbohydrates subsequent to a
chromatographic separation without derivatization is refractive index (RI) detection, followed by
pulsed amperometric detection (PAD), evaporative light‐scattering detection (ELSD) and mass
spectrometry (MS) [1, 54]. The RI detector still represents the most widely used detection method
for carbohydrates [50]. The advantage of the universal technique prevails for application with low
sensitivity in the order of 1 mg [51], but interfering solutes in the non‐specific refractometric
detection can complicate peak assignment and fail for gradient elution and trace analysis [5, 50]. The
triple‐pulsed electrochemical detector called PAD (pulsed‐amperometric detector) [2] is also widely
applied in carbohydrate analysis, allowing the specific electrochemical detection of carbohydrates by
direct oxidation of the hydroxyl groups at a gold or platinum electrode in a highly alkaline medium,
making it suitable to being coupled with an AE‐HPLC [5, 50]. The ELSD is becoming increasingly
popular in carbohydrate analysis because the detector provides approximately the same response for
every carbohydrate or compound that is less volatile than the mobile phase [50], however it is
directly associated to the concentration of the carbohydrate [5]. Nebulization and evaporation
techniques prior detection of non‐volatile carbohydrates by light scattering increasingly replace
mobile phase methods, allow gradient elution, and are not sensitive to temperature changes or
variations compared to the mobile phase flow [50]. Among the group of detectors that analyze non‐
derivatized carbohydrates, the PAD provides the highest sensitivity (LODs < 10 µg/L) compared to RI
and ELSD detectors [5]. Carbohydrates are colorless, absorb at small wavelengths, and contain no
ultra‐violet (UV) detectable chromophores. For these reasons, carbohydrates require a pre‐ or post‐
column derivatization to apply UV or fluorescence detectors in HPLC, which increase the sensitivity
markedly but invalidate the most outstanding advantage of HPLC: the avoidance of derivatization [2,
50]. The pre‐ or post‐column derivatization of hydroxyl or carbonyl groups enable the application of
photometric (e.g., anthrone or phenol in sulfuric acid), fluorescence (e.g., benzamidine) or
electrochemical detection of appropriately labeled carbohydrates [5, 55]. Although the detectors
mentioned above show good results, MS is being used increasingly with HPLC, due to enhancing
qualitative and quantitative carbohydrate analysis and due to the possibility of structure elucidation
of unknown saccharides, both at high sensitivity on picogram level [54]. The coupling of liquid
chromatography (e.g., AE‐HPLC or SEC‐HPLC) with electrospray ionization mass spectrometry (ESI‐
MS) volatilize and ionize compounds prior MS, enabling the analysis of carbohydrate at trace level in
complex media [56] or of higher molecular weight (< 2.000 Da) with a single quadrupole analyzer
[57].
14
The capillary electrophoresis (CE) uses high electric fields to migrate ionic compounds through a
capillary, filled with buffer or gel, to separate the carbohydrates by charge and size, respectively [50].
The detection of carbohydrates takes place near the end of the capillary, processed by all types of
detectors applied at liquid chromatography. Spectrometric detection (e.g., absorbance or
fluorescence) is the most applied technique, followed by electrochemical detection (e.g.,
conductivity) and mass spectrometry (e.g., electrospray ionization, ESI) [1]. Most carbohydrates have
no charge, so carbohydrates are converted into charged compounds to move them in the electric
field; the mobility of carbohydrates is enhanced by complexation using alkaline borate buffer or by a
highly alkaline electrolyte solution (pH > 12.5) [1, 4].
The fact, that carbohydrates contain no chromophore or fluorophore moiety requires a pre‐ or on‐
column derivatization of the carbohydrate molecule by suitable chromophores (absorbing light at a
specific wavelength) or fluorophores (absorbing light and re‐emit light at a specific wavelength),
respectively, to allow their detection [1, 50]. The direct UV detection can be performed at 195 nm
[58] or indirect UV detection, carried out by adding a strongly UV‐absorbing reagent as carrier
electrolyte, whereby a carbohydrate induces a decrease in UV absorbance [1]. However, these
universal detection modes are lacking selectivity and sensitivity for carbohydrates [4]. The laser‐
induced fluorescence detection of carbohydrate derivatives is more precise due to the measurement
of their specific wavelength absorbance (e.g., 6‐aminoquinoline at 245 nm) or emission [5, 59].
The carbohydrate analysis by gas chromatography (GC) necessitates the derivatization of the highly
polar and low volatile carbohydrate molecules to increase volatility and stability, e.g., by forming the
corresponding methyl, acetate or trimethylsilyl derivatives [54]. Nowadays, the separation of
carbohydrates is conducted using fused silica capillary columns, coated with dimethyl‐polysiloxane
and diphenyl‐or cyanopropyl‐phenyl‐polysiloxane as the stationary phase and helium or hydrogen as
mobile phase [60]. The routine detection of carbohydrate derivatives is performed almost entirely by
flame ionization detection (FID) with growing use of the MS. The MS enables the identification of
carbohydrates through determination of molecular mass and molecule fragmentation patterns [54].
The FID induces the formation of ions by burning samples in a small hydrogen/air flame [61]. This
process induces the formation of ions, recognized as a small electric current between two electrodes
which intensity is proportional to the rate of ionization and thereby to the concentration of analytes
present in the FID detector [61, 62]. An FID can recognize almost every organic compound, only the
carbohydrate degradation products formaldehyde and formic acid, are non‐detectable [61]. Routine
quantification analysis of carbohydrates usually relies on GC‐FID, while a GC‐MS method previously
identified the target compounds [5]. Chapter 1.5 describes comprehensively the principle of gas
chromatography coupled mass spectrometry (GC‐MS).
15
1.4.3 GC versus LC
GC and LC are the most widely used chromatographic techniques for carbohydrate analysis in
academic and industrial laboratories. The comparison of the respective properties in context to the
field of application leads to a selection of the respective technique. In some cases, selecting the
method is simple. GC‐MS is appropriate for very volatile molecules, while LC‐MS is suitable for very
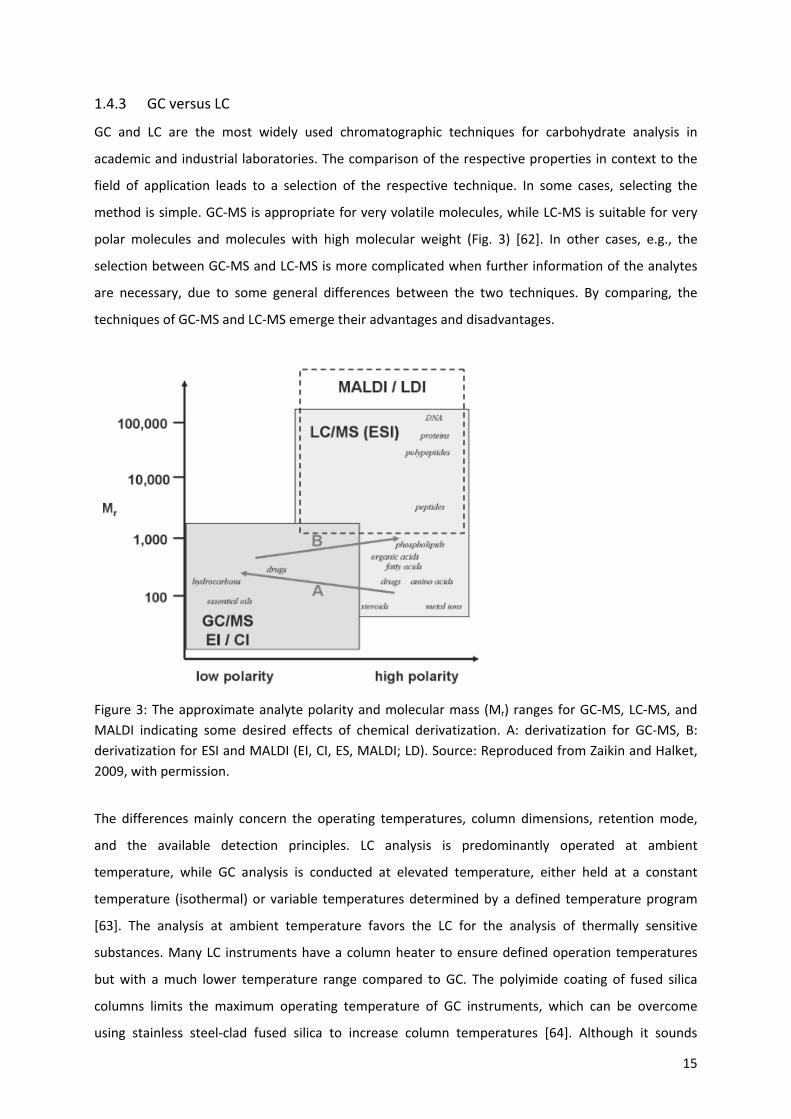
polar molecules and molecules with high molecular weight (Fig. 3) [62]. In other cases, e.g., the
selection between GC‐MS and LC‐MS is more complicated when further information of the analytes
are necessary, due to some general differences between the two techniques. By comparing, the
techniques of GC‐MS and LC‐MS emerge their advantages and disadvantages.
Figure 3: The approximate analyte polarity and molecular mass (Mr) ranges for GC‐MS, LC‐MS, and
MALDI indicating some desired effects of chemical derivatization. A: derivatization for GC‐MS, B:
derivatization for ESI and MALDI (EI, CI, ES, MALDI; LD). Source: Reproduced from Zaikin and Halket,
2009, with permission.
The differences mainly concern the operating temperatures, column dimensions, retention mode,
and the available detection principles. LC analysis is predominantly operated at ambient
temperature, while GC analysis is conducted at elevated temperature, either held at a constant
temperature (isothermal) or variable temperatures determined by a defined temperature program
[63]. The analysis at ambient temperature favors the LC for the analysis of thermally sensitive
substances. Many LC instruments have a column heater to ensure defined operation temperatures
but with a much lower temperature range compared to GC. The polyimide coating of fused silica
columns limits the maximum operating temperature of GC instruments, which can be overcome
using stainless steel‐clad fused silica to increase column temperatures [64]. Although it sounds
16
simple that LC uses a liquid mobile phase and GC a gas as carrier phase, this mobile phase is a critical
factor in the considered methods. LC systems transport any compound, which is soluble in the liquid
phase [63]. Here, the type of mobile phase is manifold and comprises solvents of different polarity,
various pH, and different viscosity. In contrast to LC, the GC system uses only a highly purified gas,
which limits this technique to volatile compounds [64]. In addition to the temperature, the polarity of
the column has a significant influence on the separation efficiency [64]. The expansion of GC
application on non‐volatile compounds requires at least one derivatization step to enhance their
volatility, which complicates sample preparation and limits the analysis of components with
excessive molecular weight [62, 64]. In contrast to GC, LC needs no derivatization to conduct
carbohydrate analysis, but this results in a lower selectivity of the separations [65].
The higher viscosity of liquids compared to gases cause an increased column back pressure in LC and
results in shorter columns with wider diameters compared to substantially longer GC columns with
thinner diameter [63]. Compared to LC systems, the more extended column of GC systems leads to a
superior resolution capability and higher compounds sensitivity [64].
Conventional MS detectors are capable of being coupled with LC and GC, but apply a destructive
detection principle [63]. LC detection usually bases on nondestructive detection (RI, UV, photodiode
array detectors or conductivity) and allow a preparative separation step to gain the analytes for
further analysis, except for MS [63]. In contrast to LC, GC detection is mainly based on destructive
principles (FID, NPD, and FPD) [63]. GC instruments also have lower costs for acquisition,
maintenance, and carrier gases compared to LC instruments and their extensive use of solvents for
analysis [63]. The coupling with a MS detector is more expensive but allows identifying the structure
of the compounds and increases the limits of analyte detection [63]. These differences lead to
definite advantages and disadvantages and hence prefer each method for different applications.
LC systems have some advantages: dissolving polar carbohydrates in the liquid phase facilitates
sample preparation and enable the analysis of low molecular weight monosaccharides and
polysaccharides with high molecular weight. In complex carbohydrate mixtures, e.g., from biological
origin, carbohydrates occur simultaneously with equal molecular weight, which differ only in littlle
with regrad to molecular structure. The analysis of these mixtures requires a system with high
separation efficiency and high sensitivity to identify and quantify the significant carbohydrates and
also carbohydrates in the background, which may act as a biomarker with controlling function of
physiological processes. The higher separation capability and high sensitivity, combined with a fast
and highly accurate quantitative analysis lead to a preference for GC systems over LC systems to
analyze complex carbohydrate mixtures.
The low volatility of carbohydrate limits the analysis by GC mainly at mono‐, di‐ and tri‐saccharides
[5]. A study evaluated more than 40 publications to compare the results of simultaneous
17
carbohydrate and acid analysis by HCPLC and GC systems [65]. The study showed that GC systems
provide a better selectivity, higher sensitivity, and allow the separation and quantitation of the
substantially higher amount of compounds on the same column with the same detector at lower cost
in contrast to HPLC [65].
1.5 Derivatization of carbohydrates for GC‐MS analysis
The GC‐MS technique requires volatile components to conduct the separation of analytes and mass
spectrometric analysis of the analytes. Thus, a derivatization procedure is necessary for compounds
with a high polarity and a high molecular weight to overcome the related very low volatility and
thermal instability [10]. The application of high temperatures at low volatility compounds in GC, e.g.,
carbohydrates would lead to a thermal decomposition before analysis [10]. Functional groups cause
the high polarity of compounds, in case of carbohydrates and associated degradation products, these
are predominantly hydroxyl groups and carboxyl groups, especially sugar acids and low molar mass
carboxylic acids [10, 66]. The hydroxyl and carboxyl groups contain active hydrogens, which form
intermolecular hydrogen bonds and thus, reduce the volatility [10]. Hydrogen atoms can also cause
strong interactions with the stationary phase and induce chromatographic peak tailing, which lower
the chromatographic resolution and reduce the signal‐to‐noise ratios of the corresponding analyte
peaks [62]. Carbonyl groups of aldehydes and ketones do not cause fundamental difficulties in the
GC‐MS analysis [66]. However, the derivatization of carbonyl groups can contribute to the analyte
stability, reduce the polarity due to the reduction of their hydrogen bonding capacity and thus,
improve the peak geometry by reduction of interactions with the stationary phase [66]. Most
importantly, the derivatization of the carbonyl group in ketoses and aldoses hinders the formation of
open chain forms and thereby decrease the number of isomers of reducing carbohydrates. There are
many other reasons derivatizations beside increasing the volatility, reduction of polarity, and
improving stability. Derivatization procedures are also conducted to improve chromatographic
properties to separate closely related compounds, improve the sensitivity and selectivity of
compound detection and to increase the structural information content of mass spectra for
improved compound identification [10, 66]. Nevertheless, derivatization procedures have some
disadvantages: the applications are time‐consuming, may lose analytes during sample preparation,
can cause undesirable side reactions between sample components and can lead to discrimination
effects. Applying derivatization procedures often require concentration and drying prior step
derivatization. These pre‐derivatization steps also lead to a change from an aqueous to the non‐
aqueous solvent system, which might affect the sample integrity condensation reactions of reactive
components.
18
The classical derivatization methods for carbohydrates involve the substitution of active‐hydrogen
atoms in polar groups with less or non‐polar substituents to increase compound volatility [6, 67].
Although the selection of derivatization reagents for carbohydrates is mainly based on the exchange
of active hydrogens in the molecule, there are more demands on derivatization reagents than merely
substitute functional groups in carbohydrate molecules. Furthermore, the kind of reagents, catalysts,
solvents, and by‐products involved in derivatization reaction influence whether the reaction mixture
can be directly injected onto GC column or if a cleaning step is necessary prior injection [11].
Therefore, a derivatization reagent should produce a stable derivative and should not cause a loss,
any rearrangements or structural alterations of carbohydrate compounds during formation of the
derivative [11].
Derivatization of carbohydrates for GC‐MS analysis is conducted prior injection with the distinction
between single‐step, two‐ or multi‐step derivatization strategies. The single‐step derivatization
methods are alkylation (e.g., methylation), acetylation (e.g., trifluoroacetylation), silylation and the
formation of cyclic derivatives are widely used in the analysis of polyalcohols and non‐reducing
carbohydrates by GC‐MS [9‐11]. However, the application of single‐step derivatization procedures at
reducing carbohydrates challenges the user: the theoretical existence of up to five tautomers per
carbohydrate, e.g., an aldohexose can form α‐ and β‐pyranose, α‐ and β‐furanose, and an open‐chain
isomer, which can retain after some derivatization strategies [68, 69]. For this reason, two‐ or multi‐
step derivatization strategies have been developed to reduce the number of isomer peaks for
carbohydrate analysis by GC‐MS and lead to an improvement of chromatographic resolution at
constant or increased informational value of mass spectra [67]. Two‐step carbohydrate derivatization
strategies usually convert the carbonyl group into a specific derivative as the first step, which inhibits
the intermolecular conversion between the different tautomers of a carbohydrate [10]. Possible
reactions aiming at the carbonyl group of carbohydrates are (1) the formation of the corresponding
primary alcohols (alditols) through reduction and (2) the oximation by using pure or substituted
hydroxylamine. The second reaction step derivatizes the available hydroxyl groups of the
carbohydrate by procedures described as single‐step derivatization methods and forms, e.g., in case
of (trifluoro)acetylation the respective alditol acetates or oxime acetates. A significant advantage of
two‐step derivatization strategies is the formation of only one or two derivatives for each
carbohydrate, which enhances the chromatographic behavior. However, the application faces the
user with new problems, such as higher workload by processing additional derivatization steps, and,
as reported for alditol acetates, that different carbohydrates can form the same derivative [67].
19
1.5.1 Single‐Step derivatization procedures
The most commonly used derivatives in single‐step derivatization procedures for carbohydrate
determination are methyl ethers, acetates, trifluoroacetates, and trimethylsilyl ethers [9]. The
description of the following single‐ and multi‐step derivatization methods include the history,
reaction, applied derivatization reagents, recent usage as well as advantages and drawbacks.
1.5.1.1 Alkylation (especially methylation)
The alkylation (or arylation) is a standard derivatization method for the replacement of an active
hydrogen atom in a hydroxyl group (R‐OH) by an alkyl (e.g., methyl) or aryl (e.g., perfluorobenzyl)
group, which result in the formation of ethers (R‐O‐R´) [10]. The derivatization method also replaces
hydrogen atoms both at primary amines (R‐NH2) of amino sugars and carboxyl groups (R‐COOH) of
sugar acids and react the latter to esters (R‐COO‐R) [10].
The alkylation eliminates interfering effects of hydroxyl or carboxyl groups and is commonly applied
to carbohydrates, polyols, and acids in the presence of various catalysts [10, 66]. The procedure
reduces the polarity and forms products with higher thermal stability compared to the starting
compounds [11, 70]. Within alkylation procedures, the per‐methylation of carbohydrates is the most
widely applied method in GC‐MS analysis, because the methylation leads only to a small increase in
molecular mass of the analyte [10, 70]. The per‐methylation combined with a hydrolysis method
followed by a second derivatization step (e.g., deuterated alkyl, alkyl, aralkyl or as their fluorinated
analogs) allow the linkage analysis of polysaccharides for structure elucidation [10, 70].
In 1903, Purdie and Irvine reported the first derivatization of non‐anomeric hydroxyl groups of
carbohydrates into alkyl ethers, accomplished with methyl iodide (CH3I) and silver oxide (Ag2O) as a
catalyst in methanol (Fig. 8) [71]. In 1915, Haworth described the combination of dimethyl sulfate
and sodium hydroxide (NaOH) as derivatization reagents with silver oxide to produce methyl ethers
of carbohydrates [72]. Unfortunately, carbohydrates are susceptible to oxidation in the presence of
silver oxide and higher temperatures, which limits the method in GC‐MS analysis to low molecular
ethyl or alkyl carbohydrate derivatives [73]. Despite this disadvantage, the two methylation reactions
were used for almost 50 years without modification [74]. The introduction of dimethylformamide as
reaction solvent by Kuhn et al. in 1955 and replacement of Ag2O as a catalyst by barium oxide (BaO)
allowed the application to a broader variety of carbohydrates [75, 76]. However, the drawbacks of
extremely long reaction times (several days or even weeks) to reach a complete permethylation of
carbohydrate and undesirable side reactions remained from the previous two methylation
procedures [73]. First, the per‐methylation method of Hakomori in 1964 led to a breakthrough in the
handling and the implementation of methylation as a routine analysis method [77]. Hakomori
introduced the methylsulfinyl carbanion (CH3SOCH2‐), also called "dimsyl" ion, by reaction of

20
dimethylsulfoxide (DMSO) and sodium hydride (NaH) [10, 73]. As a strong base, the dimsyl ion
deprotonates all active hydrogens of carbohydrates, and methyl iodide subsequently methylates the
carbohydrate. [10, 73]. The Hakomori procedure has replaced the older methylations procedures
immediately and was adopted as superior methylation reagent for carbohydrates and
polysaccharides [70, 73, 74]. Nowadays, a reagent mixture for the methylation of carbohydrates
consists of a simple combination of finely milled NaOH and CH3I in DMSO at room temperature [73,
78]. The very hygroscopic characteristic of solid powdered sodium hydroxide, if added in excess,
allows the capture of traces of water from the sample [10].
Figure 4: Etherification reaction of glucose using methyl iodide and silver oxide as a catalyst to form
permethylated glucose (2,3,4,6‐tetra‐O‐methyl‐D‐glucopyranose) [71].
Recent studies propose a large number of reagents for the preparation of alkyl derivatives: among
them are alkyl (e.g., methyl, ethyl, propyl) and benzyl bromides or iodides and their substituted or
fluorinated analogs [10]. The methylation procedure of carbohydrates is most often performed with
methyl iodide (CH3I), followed by dimethyl sulfate (CH3O‐SO2‐OCH3) and dimethyl carbonate (CH3O‐
CO‐OCH3) [62]. Reagents such as methyl triflate (CF3O‐SO2‐OCH3) and methylfluorophosphonate
(FSO2‐OCH3) show a higher reactivity, but their higher toxicity reduces the frequency of use [62].
Other common derivatization reagents to conduct alkylation are boron trifluoride (BF3) in methanol
or butanol, dialkyl acetals, and diazoalkales; but they are not suitable for carbohydrate analysis due
to inefficient methylation of hydroxyl groups [11]. BF3 in methanol or butanol is most commonly used
for acids to form their corresponding methyl or butyl ester, while dialkyl acetals, such as
dimethylformamide (DMF), react quickly with carboxylic acids, phenols, and thiols [11].
The methylation with the reagent diazomethane (DAM, N2CH2) is the fastest and cleanest method to
form methyl esters, and leads to the most reproducible results ‐ but it is carcinogenic, highly toxic,
and an explosive gas and the synthesis of DAM has to be done shortly before derivatization [11, 79].
The use of trimethylsilyl‐diazomethane (TMS‐DAM) overcomes the drawbacks of DAM, because it is
less toxic, non‐explosive, tolerates water, and commercially available [80‐82]. The acetylated alditol
section (1.6.2.1) describes the application of permethylation for carbohydrates as part of the partially
methylated alditol acetates (PMAAs) derivatives.
21
The advantages of alkylation procedures comprise enhanced volatility, improved gas
chromatographic properties, and the detection limit of derivatives at picomole level [10, 70]. The
significant advantage of the methylation reaction compared to other alkylation and arylation
derivatizations is based on the low mass increment of 14 mass units per substituted hydrogen atom,
which allow analysis of a high number of hydroxyl groups containing compounds, e.g., oligomer, via
GC‐MS [70]. The low mass increment engaged the derivatization method for the analysis of
polysaccharides consisting of up to eleven monosaccharide units by application onto high
temperature qualified capillary columns [70]. Some reagents, e.g., diazomethane, allow a rapid and
straightforward conversion of carbohydrates to methyl derivatives in less than one minute even in
aqueous systems without the need of an excessive clean‐up [10, 70]. Some researchers prefer
methylation regents over silylation reagents to examine the carbohydrate analysis, due to the
increased sensitivity of methyl ethers and the fact that the fragmentation spectra of per‐methylated
carbohydrates reveal detailed information of the monosaccharides’ linkage and branching position in
polysaccharides [70].
Significant disadvantages of alkyl derivatives, e.g., methyl ethers of carbohydrates, are that the
reaction forms different tautomeric isomers, which result in complex chromatograms and that the
derivatization procedure with some reagents requires time‐consuming preparation steps [67]. So,
the need of at least one purification step during the preparation of per methyl ethers can complicate
the quantitation of some derivatives [70]. A drawback of alkylation and (arylation) reagents is also
that they are often toxic and require severe reaction conditions, ranging from strongly acidic to
strongly basic and associated with high reaction temperatures, which could lead to thermal
degradation of non‐derivatized carbohydrates [11, 67]. Another reported problems associated with
the methylation procedure is the occurrence of overmethylation, which leads to ions in the mass
spectra that are 30 mass units higher than those of fully methylated carbohydrate [70].
Overmethylation occurs because the permethylation reagent can form small amounts of iodomethyl
ether, which competes with methyl iodide for the reaction of hydroxyl groups and result in the
formation of a methoxymethyl moiety instead of a methyl group, which causes the higher mass
increment [83].
1.5.1.2 Acylation
The acylation process defines the introduction of an acyl moiety (R‐C=O) into a molecule via
substitution of active hydrogen [10]. Almost all active hydrogen atoms of functional groups
(e.g., ‐OH, ‐SH and ‐NH) can substituted by acyl groups, except carboxylic, sulphonic, and phosphoric
acids [10]. Any carboxylic acid residue can be used as derivatization reagent, e.g., acid anhydrides,
acyl halides, and acyl amides [10]. Acylation strongly increases the volatility of polar compounds and
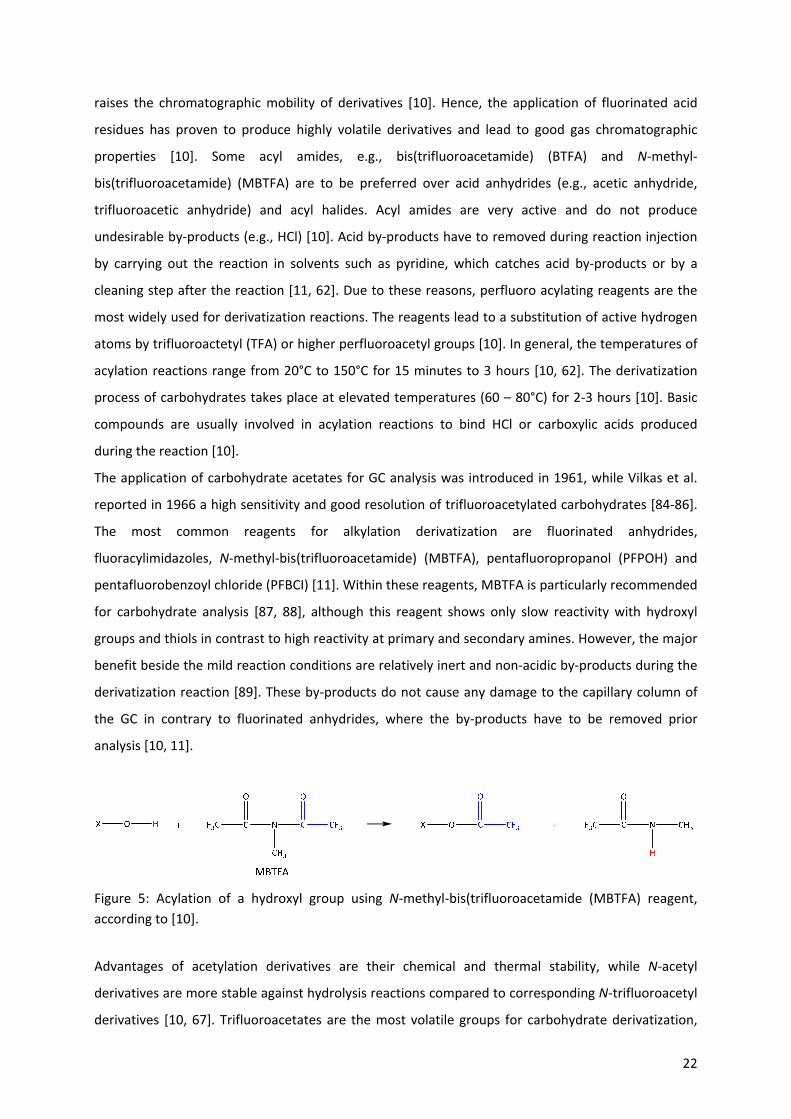
22
raises the chromatographic mobility of derivatives [10]. Hence, the application of fluorinated acid
residues has proven to produce highly volatile derivatives and lead to good gas chromatographic
properties [10]. Some acyl amides, e.g., bis(trifluoroacetamide) (BTFA) and N‐methyl‐
bis(trifluoroacetamide) (MBTFA) are to be preferred over acid anhydrides (e.g., acetic anhydride,
trifluoroacetic anhydride) and acyl halides. Acyl amides are very active and do not produce
undesirable by‐products (e.g., HCl) [10]. Acid by‐products have to removed during reaction injection
by carrying out the reaction in solvents such as pyridine, which catches acid by‐products or by a
cleaning step after the reaction [11, 62]. Due to these reasons, perfluoro acylating reagents are the
most widely used for derivatization reactions. The reagents lead to a substitution of active hydrogen
atoms by trifluoroactetyl (TFA) or higher perfluoroacetyl groups [10]. In general, the temperatures of
acylation reactions range from 20°C to 150°C for 15 minutes to 3 hours [10, 62]. The derivatization
process of carbohydrates takes place at elevated temperatures (60 – 80°C) for 2‐3 hours [10]. Basic
compounds are usually involved in acylation reactions to bind HCl or carboxylic acids produced
during the reaction [10].
The application of carbohydrate acetates for GC analysis was introduced in 1961, while Vilkas et al.
reported in 1966 a high sensitivity and good resolution of trifluoroacetylated carbohydrates [84‐86].
The most common reagents for alkylation derivatization are fluorinated anhydrides,
fluoracylimidazoles, N‐methyl‐bis(trifluoroacetamide) (MBTFA), pentafluoropropanol (PFPOH) and
pentafluorobenzoyl chloride (PFBCI) [11]. Within these reagents, MBTFA is particularly recommended
for carbohydrate analysis [87, 88], although this reagent shows only slow reactivity with hydroxyl
groups and thiols in contrast to high reactivity at primary and secondary amines. However, the major
benefit beside the mild reaction conditions are relatively inert and non‐acidic by‐products during the
derivatization reaction [89]. These by‐products do not cause any damage to the capillary column of
the GC in contrary to fluorinated anhydrides, where the by‐products have to be removed prior
analysis [10, 11].
Figure 5: Acylation of a hydroxyl group using N‐methyl‐bis(trifluoroacetamide (MBTFA) reagent,
according to [10].
Advantages of acetylation derivatives are their chemical and thermal stability, while N‐acetyl
derivatives are more stable against hydrolysis reactions compared to corresponding N‐trifluoroacetyl
derivatives [10, 67]. Trifluoroacetates are the most volatile groups for carbohydrate derivatization,
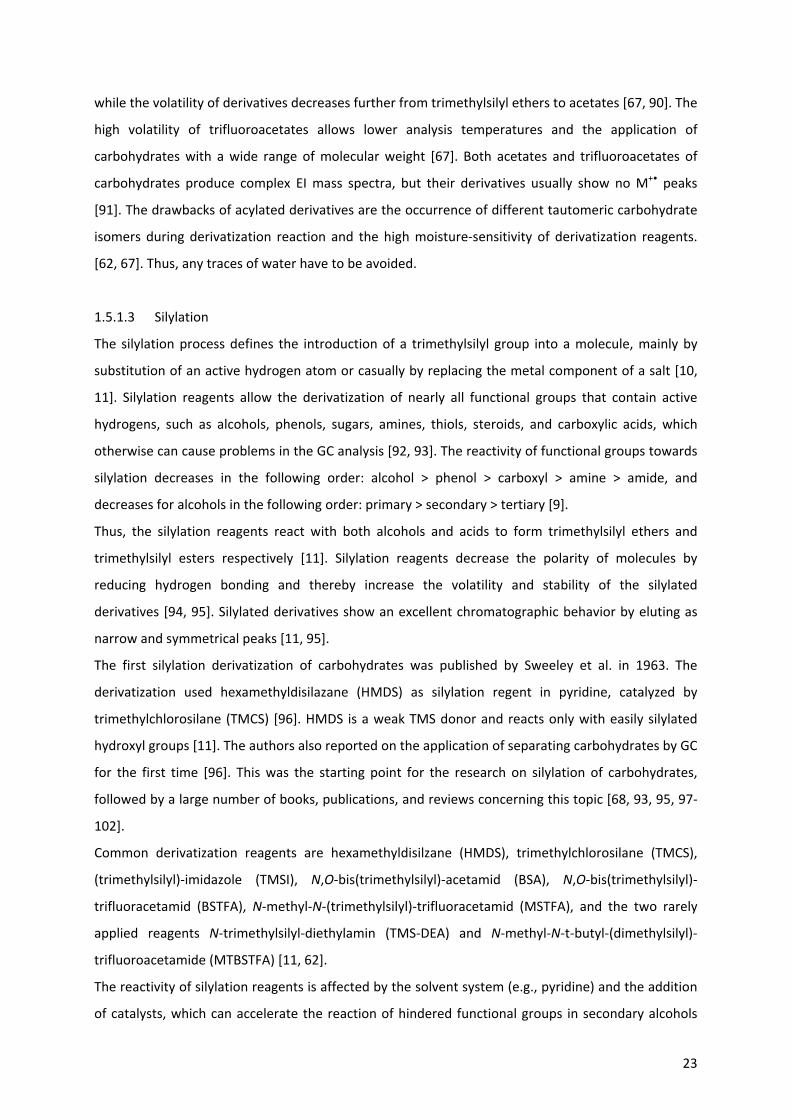
23
while the volatility of derivatives decreases further from trimethylsilyl ethers to acetates [67, 90]. The
high volatility of trifluoroacetates allows lower analysis temperatures and the application of
carbohydrates with a wide range of molecular weight [67]. Both acetates and trifluoroacetates of
carbohydrates produce complex EI mass spectra, but their derivatives usually show no M+• peaks
[91]. The drawbacks of acylated derivatives are the occurrence of different tautomeric carbohydrate
isomers during derivatization reaction and the high moisture‐sensitivity of derivatization reagents.
[62, 67]. Thus, any traces of water have to be avoided.
1.5.1.3 Silylation
The silylation process defines the introduction of a trimethylsilyl group into a molecule, mainly by
substitution of an active hydrogen atom or casually by replacing the metal component of a salt [10,
11]. Silylation reagents allow the derivatization of nearly all functional groups that contain active
hydrogens, such as alcohols, phenols, sugars, amines, thiols, steroids, and carboxylic acids, which
otherwise can cause problems in the GC analysis [92, 93]. The reactivity of functional groups towards
silylation decreases in the following order: alcohol > phenol > carboxyl > amine > amide, and
decreases for alcohols in the following order: primary > secondary > tertiary [9].
Thus, the silylation reagents react with both alcohols and acids to form trimethylsilyl ethers and
trimethylsilyl esters respectively [11]. Silylation reagents decrease the polarity of molecules by
reducing hydrogen bonding and thereby increase the volatility and stability of the silylated
derivatives [94, 95]. Silylated derivatives show an excellent chromatographic behavior by eluting as
narrow and symmetrical peaks [11, 95].
The first silylation derivatization of carbohydrates was published by Sweeley et al. in 1963. The
derivatization used hexamethyldisilazane (HMDS) as silylation regent in pyridine, catalyzed by
trimethylchlorosilane (TMCS) [96]. HMDS is a weak TMS donor and reacts only with easily silylated
hydroxyl groups [11]. The authors also reported on the application of separating carbohydrates by GC
for the first time [96]. This was the starting point for the research on silylation of carbohydrates,
followed by a large number of books, publications, and reviews concerning this topic [68, 93, 95, 97‐
102].
Common derivatization reagents are hexamethyldisilzane (HMDS), trimethylchlorosilane (TMCS),
(trimethylsilyl)‐imidazole (TMSI), N,O‐bis(trimethylsilyl)‐acetamid (BSA), N,O‐bis(trimethylsilyl)‐
trifluoracetamid (BSTFA), N‐methyl‐N‐(trimethylsilyl)‐trifluoracetamid (MSTFA), and the two rarely
applied reagents N‐trimethylsilyl‐diethylamin (TMS‐DEA) and N‐methyl‐N‐t‐butyl‐(dimethylsilyl)‐
trifluoroacetamide (MTBSTFA) [11, 62].
The reactivity of silylation reagents is affected by the solvent system (e.g., pyridine) and the addition
of catalysts, which can accelerate the reaction of hindered functional groups in secondary alcohols
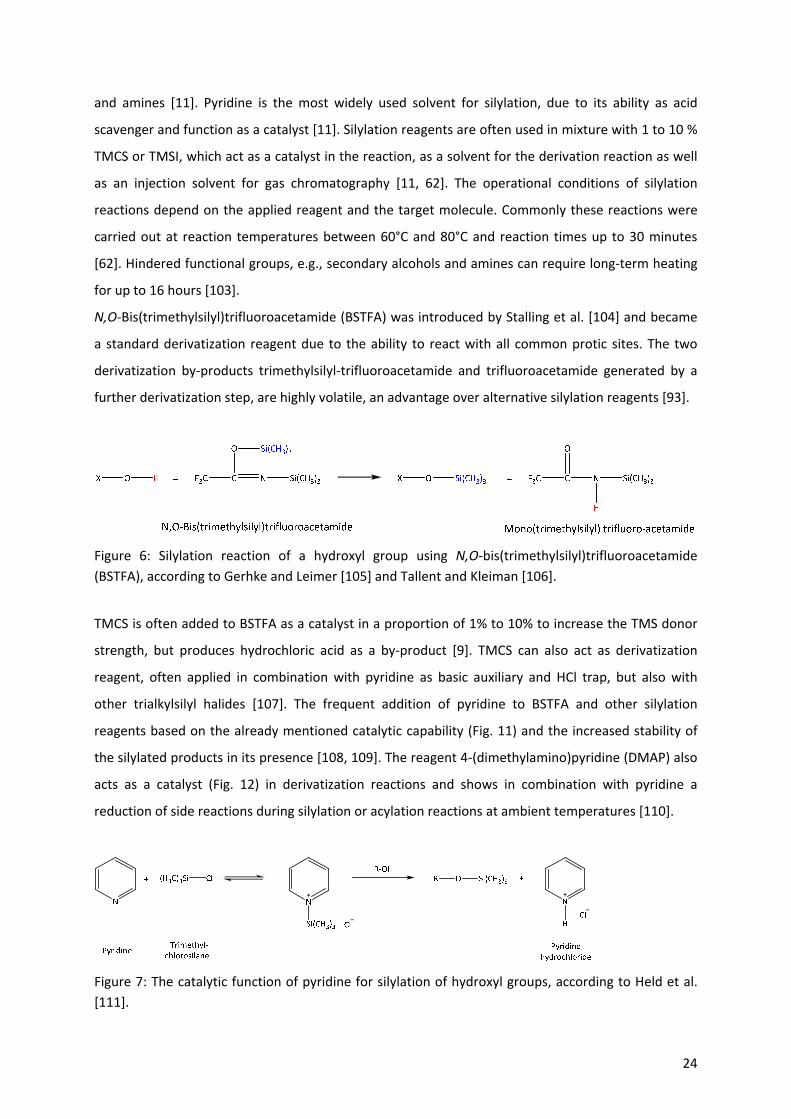
24
and amines [11]. Pyridine is the most widely used solvent for silylation, due to its ability as acid
scavenger and function as a catalyst [11]. Silylation reagents are often used in mixture with 1 to 10 %
TMCS or TMSI, which act as a catalyst in the reaction, as a solvent for the derivation reaction as well
as an injection solvent for gas chromatography [11, 62]. The operational conditions of silylation
reactions depend on the applied reagent and the target molecule. Commonly these reactions were
carried out at reaction temperatures between 60°C and 80°C and reaction times up to 30 minutes
[62]. Hindered functional groups, e.g., secondary alcohols and amines can require long‐term heating
for up to 16 hours [103].
N,O‐Bis(trimethylsilyl)trifluoroacetamide (BSTFA) was introduced by Stalling et al. [104] and became
a standard derivatization reagent due to the ability to react with all common protic sites. The two
derivatization by‐products trimethylsilyl‐trifluoroacetamide and trifluoroacetamide generated by a
further derivatization step, are highly volatile, an advantage over alternative silylation reagents [93].
Figure 6: Silylation reaction of a hydroxyl group using N,O‐bis(trimethylsilyl)trifluoroacetamide
(BSTFA), according to Gerhke and Leimer [105] and Tallent and Kleiman [106].
TMCS is often added to BSTFA as a catalyst in a proportion of 1% to 10% to increase the TMS donor
strength, but produces hydrochloric acid as a by‐product [9]. TMCS can also act as derivatization
reagent, often applied in combination with pyridine as basic auxiliary and HCl trap, but also with
other trialkylsilyl halides [107]. The frequent addition of pyridine to BSTFA and other silylation
reagents based on the already mentioned catalytic capability (Fig. 11) and the increased stability of
the silylated products in its presence [108, 109]. The reagent 4‐(dimethylamino)pyridine (DMAP) also
acts as a catalyst (Fig. 12) in derivatization reactions and shows in combination with pyridine a
reduction of side reactions during silylation or acylation reactions at ambient temperatures [110].
Figure 7: The catalytic function of pyridine for silylation of hydroxyl groups, according to Held et al.
[111].
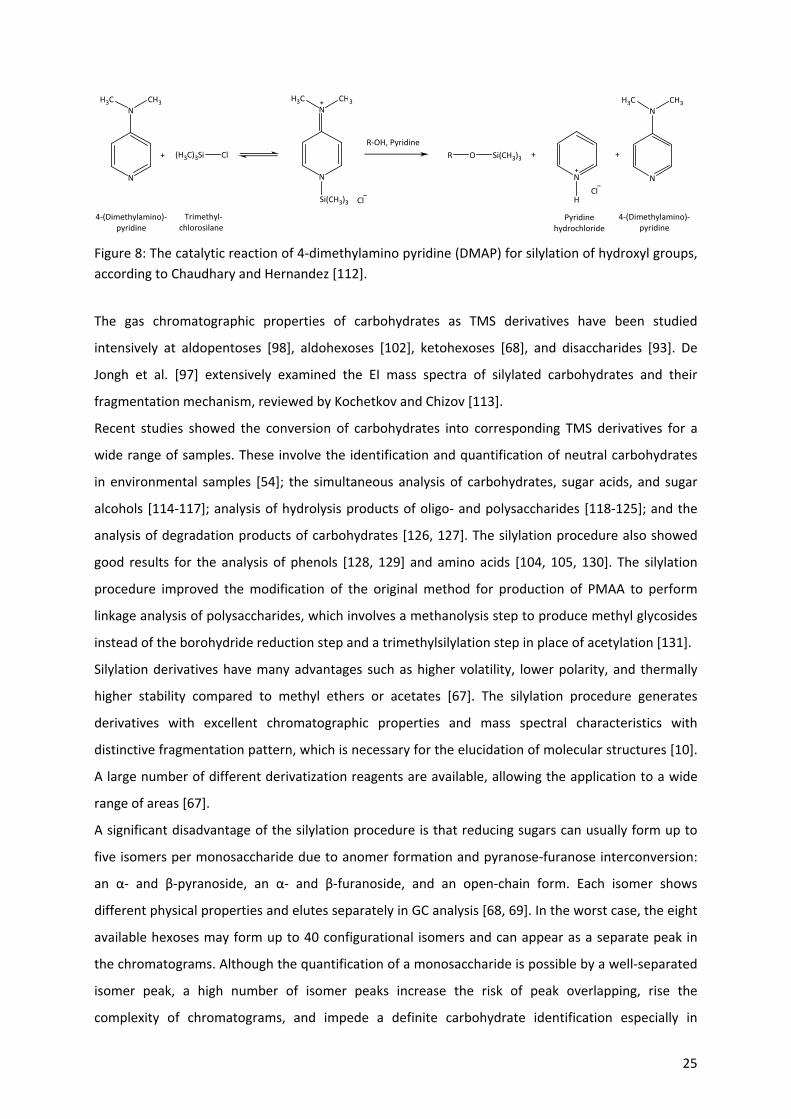
25
N
NCH3H3C
+
N
N
CH3H3C
Si(CH3)3 Cl
+
N
N
CH3H3C
R‐OH, Pyridine
N
+
ClH
4‐(Dimethylamino)‐pyridine
Cl(H3C)3Si
Trimethyl‐chlorosilane
OR Si(CH3)3
Pyridinehydrochloride
4‐(Dimethylamino)‐pyridine
Figure 8: The catalytic reaction of 4‐dimethylamino pyridine (DMAP) for silylation of hydroxyl groups,
according to Chaudhary and Hernandez [112].
The gas chromatographic properties of carbohydrates as TMS derivatives have been studied
intensively at aldopentoses [98], aldohexoses [102], ketohexoses [68], and disaccharides [93]. De
Jongh et al. [97] extensively examined the EI mass spectra of silylated carbohydrates and their
fragmentation mechanism, reviewed by Kochetkov and Chizov [113].
Recent studies showed the conversion of carbohydrates into corresponding TMS derivatives for a
wide range of samples. These involve the identification and quantification of neutral carbohydrates
in environmental samples [54]; the simultaneous analysis of carbohydrates, sugar acids, and sugar
alcohols [114‐117]; analysis of hydrolysis products of oligo‐ and polysaccharides [118‐125]; and the
analysis of degradation products of carbohydrates [126, 127]. The silylation procedure also showed
good results for the analysis of phenols [128, 129] and amino acids [104, 105, 130]. The silylation
procedure improved the modification of the original method for production of PMAA to perform
linkage analysis of polysaccharides, which involves a methanolysis step to produce methyl glycosides
instead of the borohydride reduction step and a trimethylsilylation step in place of acetylation [131].
Silylation derivatives have many advantages such as higher volatility, lower polarity, and thermally
higher stability compared to methyl ethers or acetates [67]. The silylation procedure generates
derivatives with excellent chromatographic properties and mass spectral characteristics with
distinctive fragmentation pattern, which is necessary for the elucidation of molecular structures [10].
A large number of different derivatization reagents are available, allowing the application to a wide
range of areas [67].
A significant disadvantage of the silylation procedure is that reducing sugars can usually form up to
five isomers per monosaccharide due to anomer formation and pyranose‐furanose interconversion:
an α‐ and β‐pyranoside, an α‐ and β‐furanoside, and an open‐chain form. Each isomer shows
different physical properties and elutes separately in GC analysis [68, 69]. In the worst case, the eight
available hexoses may form up to 40 configurational isomers and can appear as a separate peak in
the chromatograms. Although the quantification of a monosaccharide is possible by a well‐separated
isomer peak, a high number of isomer peaks increase the risk of peak overlapping, rise the
complexity of chromatograms, and impede a definite carbohydrate identification especially in
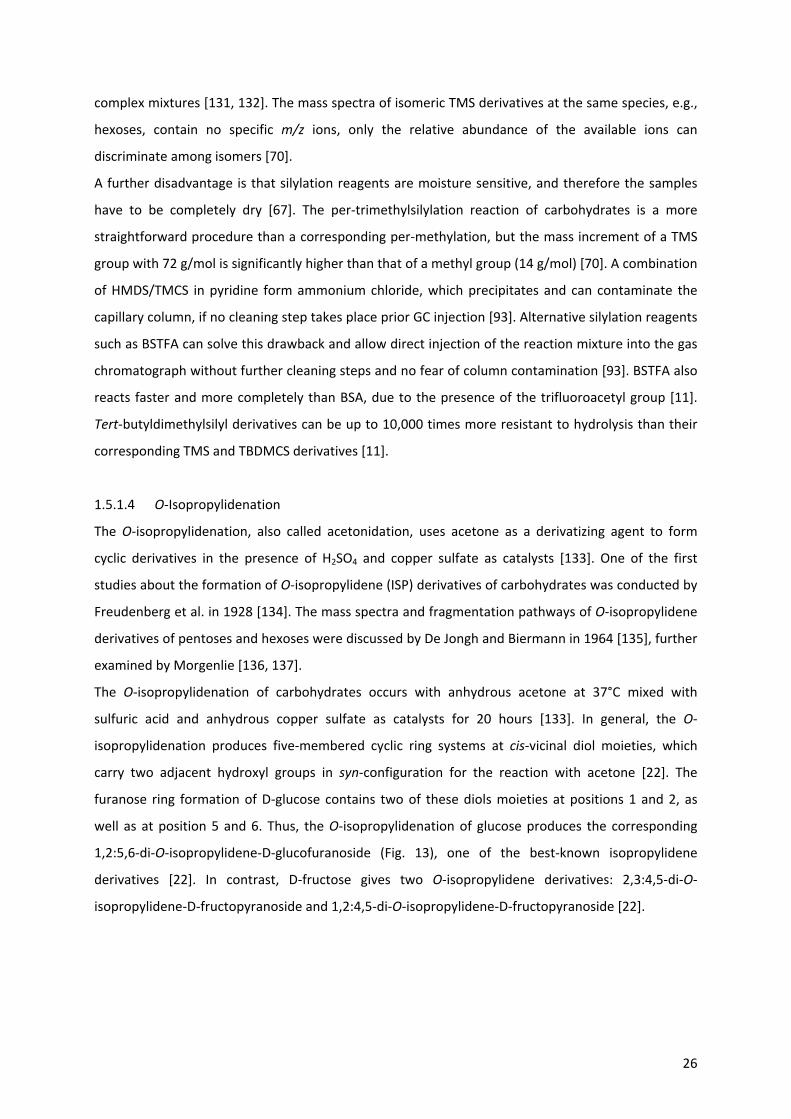
26
complex mixtures [131, 132]. The mass spectra of isomeric TMS derivatives at the same species, e.g.,
hexoses, contain no specific m/z ions, only the relative abundance of the available ions can
discriminate among isomers [70].
A further disadvantage is that silylation reagents are moisture sensitive, and therefore the samples
have to be completely dry [67]. The per‐trimethylsilylation reaction of carbohydrates is a more
straightforward procedure than a corresponding per‐methylation, but the mass increment of a TMS
group with 72 g/mol is significantly higher than that of a methyl group (14 g/mol) [70]. A combination
of HMDS/TMCS in pyridine form ammonium chloride, which precipitates and can contaminate the
capillary column, if no cleaning step takes place prior GC injection [93]. Alternative silylation reagents
such as BSTFA can solve this drawback and allow direct injection of the reaction mixture into the gas
chromatograph without further cleaning steps and no fear of column contamination [93]. BSTFA also
reacts faster and more completely than BSA, due to the presence of the trifluoroacetyl group [11].
Tert‐butyldimethylsilyl derivatives can be up to 10,000 times more resistant to hydrolysis than their
corresponding TMS and TBDMCS derivatives [11].
1.5.1.4 O‐Isopropylidenation
The O‐isopropylidenation, also called acetonidation, uses acetone as a derivatizing agent to form
cyclic derivatives in the presence of H2SO4 and copper sulfate as catalysts [133]. One of the first
studies about the formation of O‐isopropylidene (ISP) derivatives of carbohydrates was conducted by
Freudenberg et al. in 1928 [134]. The mass spectra and fragmentation pathways of O‐isopropylidene
derivatives of pentoses and hexoses were discussed by De Jongh and Biermann in 1964 [135], further
examined by Morgenlie [136, 137].
The O‐isopropylidenation of carbohydrates occurs with anhydrous acetone at 37°C mixed with
sulfuric acid and anhydrous copper sulfate as catalysts for 20 hours [133]. In general, the O‐
isopropylidenation produces five‐membered cyclic ring systems at cis‐vicinal diol moieties, which
carry two adjacent hydroxyl groups in syn‐configuration for the reaction with acetone [22]. The
furanose ring formation of D‐glucose contains two of these diols moieties at positions 1 and 2, as
well as at position 5 and 6. Thus, the O‐isopropylidenation of glucose produces the corresponding
1,2:5,6‐di‐O‐isopropylidene‐D‐glucofuranoside (Fig. 13), one of the best‐known isopropylidene
derivatives [22]. In contrast, D‐fructose gives two O‐isopropylidene derivatives: 2,3:4,5‐di‐O‐
isopropylidene‐D‐fructopyranoside and 1,2:4,5‐di‐O‐isopropylidene‐D‐fructopyranoside [22].
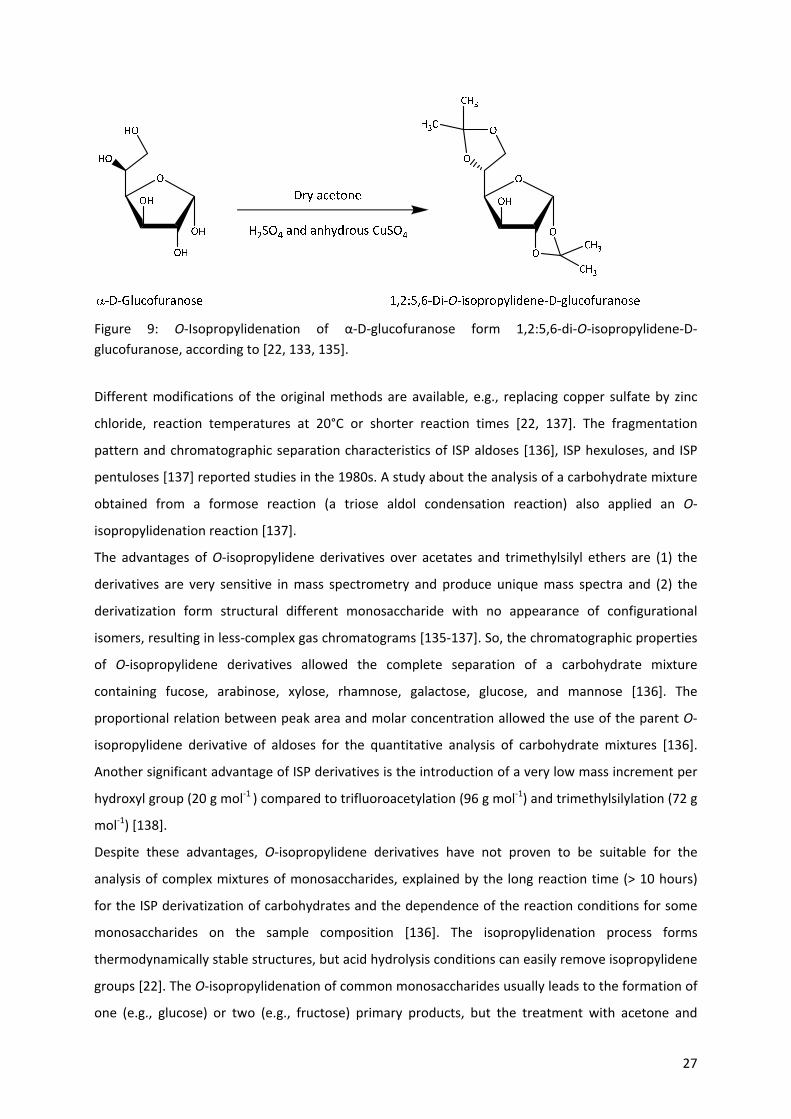
27
Figure 9: O‐Isopropylidenation of α‐D‐glucofuranose form 1,2:5,6‐di‐O‐isopropylidene‐D‐
glucofuranose, according to [22, 133, 135].
Different modifications of the original methods are available, e.g., replacing copper sulfate by zinc
chloride, reaction temperatures at 20°C or shorter reaction times [22, 137]. The fragmentation
pattern and chromatographic separation characteristics of ISP aldoses [136], ISP hexuloses, and ISP
pentuloses [137] reported studies in the 1980s. A study about the analysis of a carbohydrate mixture
obtained from a formose reaction (a triose aldol condensation reaction) also applied an O‐
isopropylidenation reaction [137].
The advantages of O‐isopropylidene derivatives over acetates and trimethylsilyl ethers are (1) the
derivatives are very sensitive in mass spectrometry and produce unique mass spectra and (2) the
derivatization form structural different monosaccharide with no appearance of configurational
isomers, resulting in less‐complex gas chromatograms [135‐137]. So, the chromatographic properties
of O‐isopropylidene derivatives allowed the complete separation of a carbohydrate mixture
containing fucose, arabinose, xylose, rhamnose, galactose, glucose, and mannose [136]. The
proportional relation between peak area and molar concentration allowed the use of the parent O‐
isopropylidene derivative of aldoses for the quantitative analysis of carbohydrate mixtures [136].
Another significant advantage of ISP derivatives is the introduction of a very low mass increment per
hydroxyl group (20 g mol‐1 ) compared to trifluoroacetylation (96 g mol‐1) and trimethylsilylation (72 g
mol‐1) [138].
Despite these advantages, O‐isopropylidene derivatives have not proven to be suitable for the
analysis of complex mixtures of monosaccharides, explained by the long reaction time (> 10 hours)
for the ISP derivatization of carbohydrates and the dependence of the reaction conditions for some
monosaccharides on the sample composition [136]. The isopropylidenation process forms
thermodynamically stable structures, but acid hydrolysis conditions can easily remove isopropylidene
groups [22]. The O‐isopropylidenation of common monosaccharides usually leads to the formation of
one (e.g., glucose) or two (e.g., fructose) primary products, but the treatment with acetone and

28
sulfuric acid can lead to the formation of additional small peaks. However, the small peaks do not
interfere with the identification of O‐isopropylidene carbohydrate derivatives. They show higher
retention times than 2,3‐5,6‐di‐O‐isopropylidene‐D‐mannofuranose, which is the O‐isopropylidene
derivative with the highest retention within the common aldoses [136].
1.5.2 Multi‐step derivatization procedures
The formation of carbohydrate anomers can prevented by (1) reducing neutral carbohydrates to
alditols, (2) forming aldonitriles or (3) oximes prior trimethylsilyl or trifluoroacetyl derivatization [7].
These derivatization procedures consist of two or more reaction steps to produce the desired
derivatives. The trimethylsilyl oximes and ethers are possibly the most used derivatives for the GC
analysis of carbohydrates [13].
1.5.2.1 Alditol acetates
The formation of alditol acetates involves the reduction and acetylation of monomeric carbohydrates
in successive steps, which eliminate the possibility of anomeric derivatives and increase the volatility
the carbohydrate derivative [9]. The alditol acetate method was first described in 1961 by Gunner et
al. [84] and modified by various researchers, such as Sawardeker et al. [139] and Blakeney et al.
[140].
The original derivatization procedure (Fig. 14) involves sodium borohydride (NaBH4) reduction of the
carbohydrate to an alditol as the first step [84]. The formed alditols are present as open chain, which
is a significant difference to many other single step derivatization methods, where the equilibrium
mixture between the ring forms and the open chain form are retained after derivatization [141].
According to the original method, several evaporations with acidic methanol volatilize the borate,
formed during reduction, as methyl borate and removes it [84]. This step is necessary as hydroxyl
groups containing borates lead to interaction with the acetylation reagent and form complexes [84,
141]. The third step of the original method carries out the acetylation of the hydroxyl groups of
carbohydrates by acetic anhydride (Ac2O) in the presence of pyridine [84, 141]. The further
procedure includes the analysis of derivatives by GC [84].
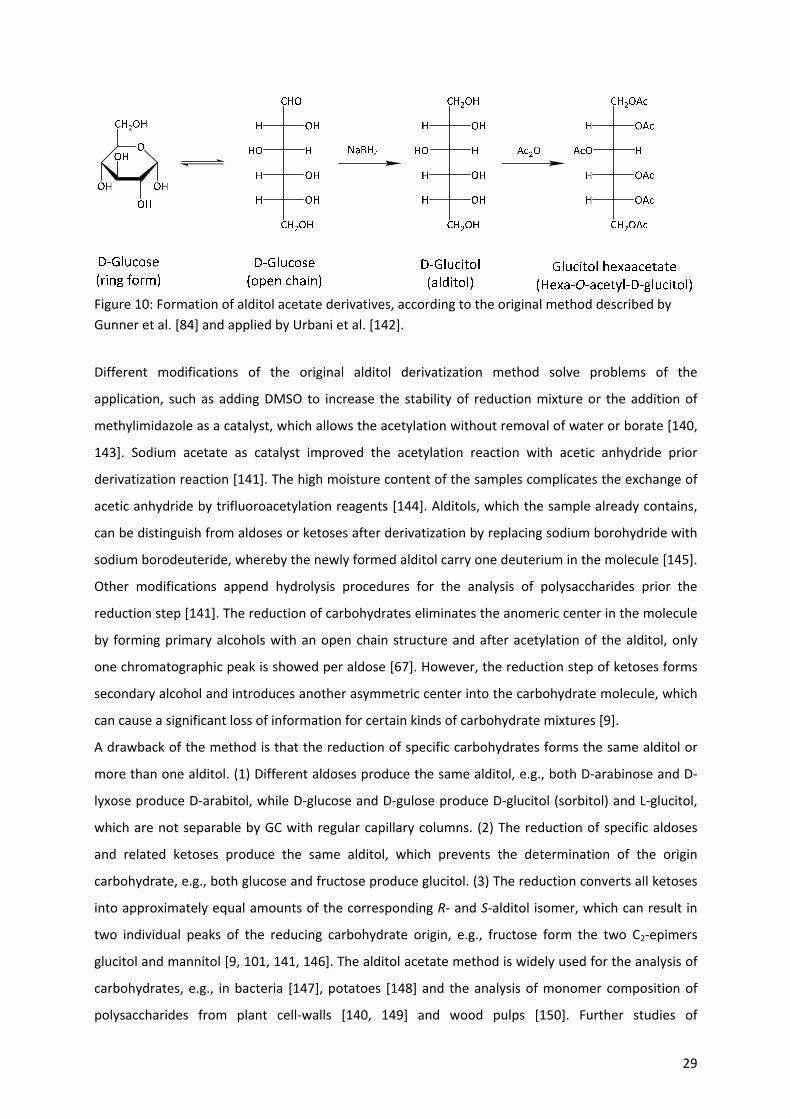
29
Figure 10: Formation of alditol acetate derivatives, according to the original method described by
Gunner et al. [84] and applied by Urbani et al. [142].
Different modifications of the original alditol derivatization method solve problems of the
application, such as adding DMSO to increase the stability of reduction mixture or the addition of
methylimidazole as a catalyst, which allows the acetylation without removal of water or borate [140,
143]. Sodium acetate as catalyst improved the acetylation reaction with acetic anhydride prior
derivatization reaction [141]. The high moisture content of the samples complicates the exchange of
acetic anhydride by trifluoroacetylation reagents [144]. Alditols, which the sample already contains,
can be distinguish from aldoses or ketoses after derivatization by replacing sodium borohydride with
sodium borodeuteride, whereby the newly formed alditol carry one deuterium in the molecule [145].
Other modifications append hydrolysis procedures for the analysis of polysaccharides prior the
reduction step [141]. The reduction of carbohydrates eliminates the anomeric center in the molecule
by forming primary alcohols with an open chain structure and after acetylation of the alditol, only
one chromatographic peak is showed per aldose [67]. However, the reduction step of ketoses forms
secondary alcohol and introduces another asymmetric center into the carbohydrate molecule, which
can cause a significant loss of information for certain kinds of carbohydrate mixtures [9].
A drawback of the method is that the reduction of specific carbohydrates forms the same alditol or
more than one alditol. (1) Different aldoses produce the same alditol, e.g., both D‐arabinose and D‐
lyxose produce D‐arabitol, while D‐glucose and D‐gulose produce D‐glucitol (sorbitol) and L‐glucitol,
which are not separable by GC with regular capillary columns. (2) The reduction of specific aldoses
and related ketoses produce the same alditol, which prevents the determination of the origin
carbohydrate, e.g., both glucose and fructose produce glucitol. (3) The reduction converts all ketoses
into approximately equal amounts of the corresponding R‐ and S‐alditol isomer, which can result in
two individual peaks of the reducing carbohydrate origin, e.g., fructose form the two C2‐epimers
glucitol and mannitol [9, 101, 141, 146]. The alditol acetate method is widely used for the analysis of
carbohydrates, e.g., in bacteria [147], potatoes [148] and the analysis of monomer composition of
polysaccharides from plant cell‐walls [140, 149] and wood pulps [150]. Further studies of
30
polysaccharides applied the alditol acetate method for the analysis of linkage positions between
monosaccharide rings in carbohydrate polymers [151]. In the first step of the analysis of linkage
positions, all hydroxyl groups in a polysaccharide are per‐methylated, then the molecule is
hydrolyzed to obtain monosaccharides with additional free hydroxyl groups at the sites of linkage
[151]. The received monosaccharides are reduced to alditols and finally acetylated, e.g., with acetic
anhydride to produce methylated alditol acetates, also known as PMAAs [70, 151]. The GC‐MS
analysis of the monosaccharide derivatives indicates the position of methylated and acetylated
hydroxyl groups and allows conclusions of the original linkage positions in the polymer [151].
The primary advantage of the alditol acetates method is the formation of only one peak per aldose,
which reduces the complexity of chromatograms and enhances the limit of detection for quantitative
measurements of these carbohydrates [141]. The derivatives are extraordinarily stable and allow
post derivatization and cleaning procedures [141]. The method enhances the separation of complex
carbohydrate mixtures and allows a subsequent hydrolysis reaction of polysaccharides for sugar
composition analysis [67].
The significant disadvantages of the methods are the production of the same alditol from different
carbohydrates and that the reduction of each ketose results in a mixture of two alditols [67]. The
reduction process eliminates the problem of anomeric derivatives at aldoses but creates new
allocation problems in ketoses for the identification and quantification of carbohydrates [9].
Fortunately, the fixed proportion of fructose conversion to glucitol and mannitol allows a
reproductive quantification of this carbohydrates in samples [148]. Carbohydrate derivatives such as
uronic acids, ulosonic acids (e.g., Kdo), or 4‐aminosugars react in the presence of NaBH4 to non‐
volatile sodium salts and require a modification either by dehydration to lactones or by converting
the carboxyl group to an alcohol prior reduction [141]. Drawbacks of the method are also that a large
number of processing steps for derivatization and cleaning steps for removing of by‐products before
analysis, which makes the procedure time‐consuming and increases the workload [67]. Similar to
other derivatization reagents, acylation reagents are moisture sensitive [67, 141]. Studies observed
that the alditol acetate method is not suitable for trace analysis, due to the appearance of
contaminations from side reactions during the derivatization process and their occurrence as
background peaks in the chromatogram [141]. The development of other derivatization methods
such as aldononitrile acetate or O‐methyloxime acetates overcomes these limitations and produce
different derivatives for aldoses and ketoses, which allow the correct determination of the
carbohydrate origin [146, 152].
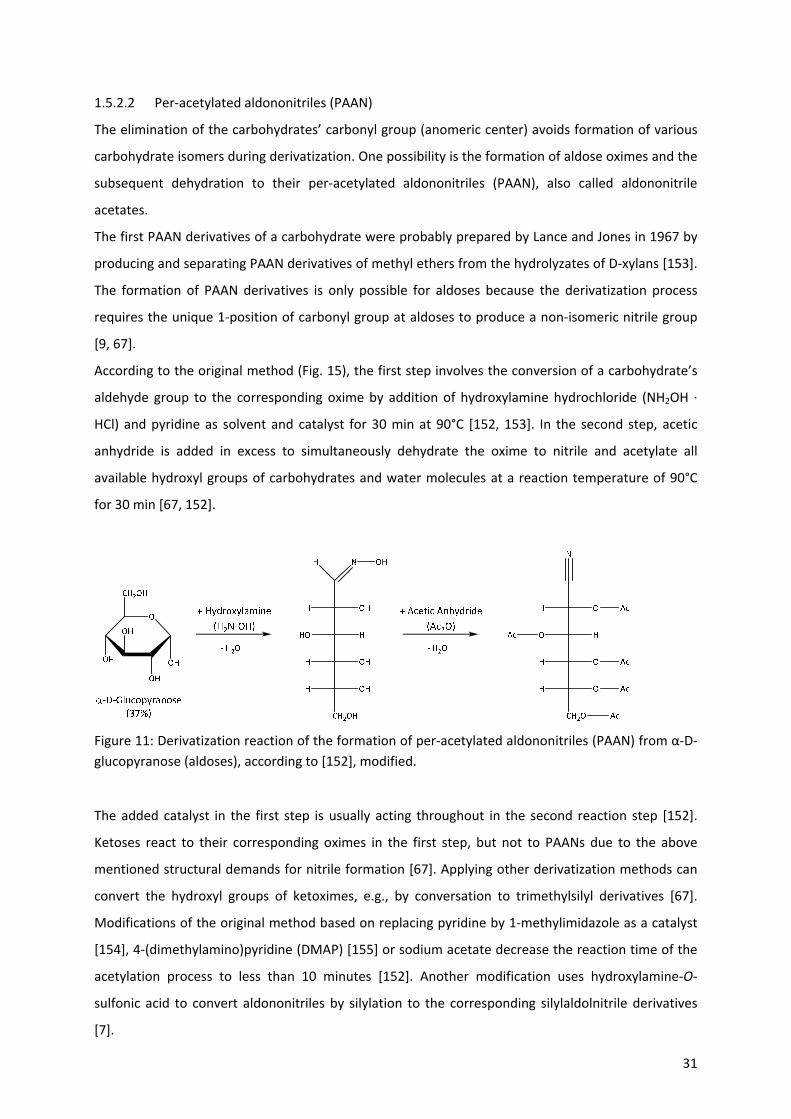
31
1.5.2.2 Per‐acetylated aldononitriles (PAAN)
The elimination of the carbohydrates’ carbonyl group (anomeric center) avoids formation of various
carbohydrate isomers during derivatization. One possibility is the formation of aldose oximes and the
subsequent dehydration to their per‐acetylated aldononitriles (PAAN), also called aldononitrile
acetates.
The first PAAN derivatives of a carbohydrate were probably prepared by Lance and Jones in 1967 by
producing and separating PAAN derivatives of methyl ethers from the hydrolyzates of D‐xylans [153].
The formation of PAAN derivatives is only possible for aldoses because the derivatization process
requires the unique 1‐position of carbonyl group at aldoses to produce a non‐isomeric nitrile group
[9, 67].
According to the original method (Fig. 15), the first step involves the conversion of a carbohydrate’s
aldehyde group to the corresponding oxime by addition of hydroxylamine hydrochloride (NH2OH ∙
HCl) and pyridine as solvent and catalyst for 30 min at 90°C [152, 153]. In the second step, acetic
anhydride is added in excess to simultaneously dehydrate the oxime to nitrile and acetylate all
available hydroxyl groups of carbohydrates and water molecules at a reaction temperature of 90°C
for 30 min [67, 152].
Figure 11: Derivatization reaction of the formation of per‐acetylated aldononitriles (PAAN) from α‐D‐
glucopyranose (aldoses), according to [152], modified.
The added catalyst in the first step is usually acting throughout in the second reaction step [152].
Ketoses react to their corresponding oximes in the first step, but not to PAANs due to the above
mentioned structural demands for nitrile formation [67]. Applying other derivatization methods can
convert the hydroxyl groups of ketoximes, e.g., by conversation to trimethylsilyl derivatives [67].
Modifications of the original method based on replacing pyridine by 1‐methylimidazole as a catalyst
[154], 4‐(dimethylamino)pyridine (DMAP) [155] or sodium acetate decrease the reaction time of the
acetylation process to less than 10 minutes [152]. Another modification uses hydroxylamine‐O‐
sulfonic acid to convert aldononitriles by silylation to the corresponding silylaldolnitrile derivatives
[7].
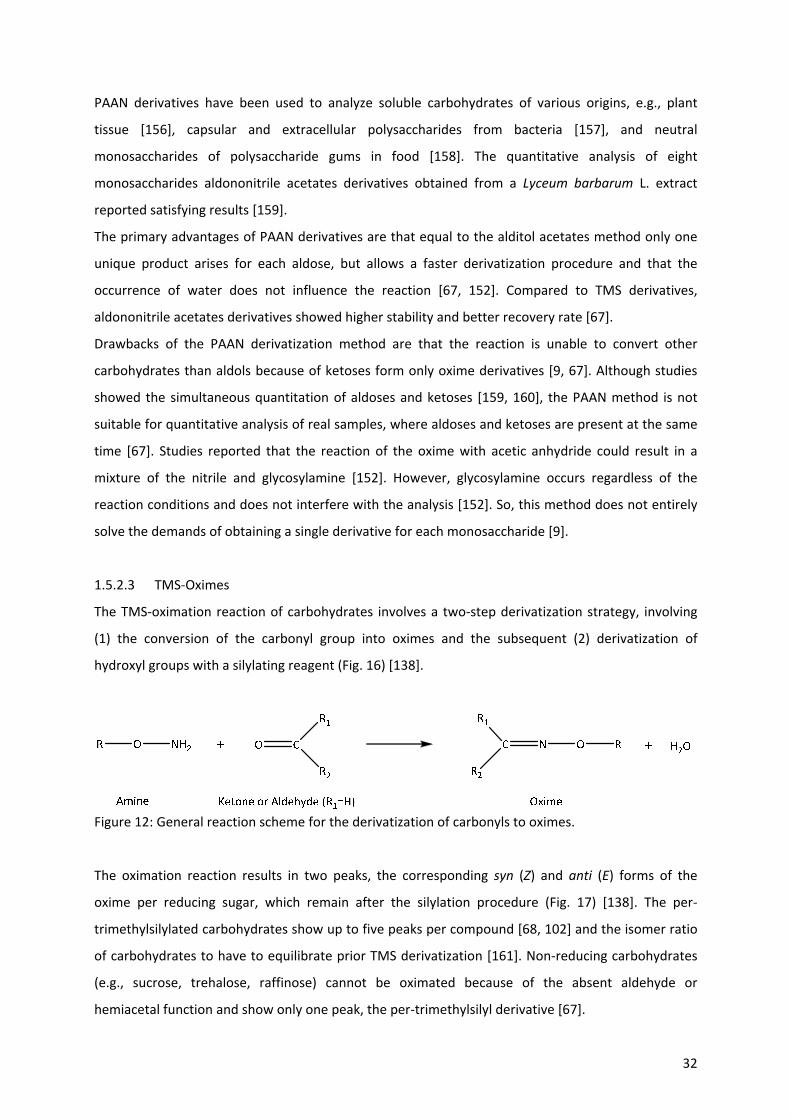
32
PAAN derivatives have been used to analyze soluble carbohydrates of various origins, e.g., plant
tissue [156], capsular and extracellular polysaccharides from bacteria [157], and neutral
monosaccharides of polysaccharide gums in food [158]. The quantitative analysis of eight
monosaccharides aldononitrile acetates derivatives obtained from a Lyceum barbarum L. extract
reported satisfying results [159].
The primary advantages of PAAN derivatives are that equal to the alditol acetates method only one
unique product arises for each aldose, but allows a faster derivatization procedure and that the
occurrence of water does not influence the reaction [67, 152]. Compared to TMS derivatives,
aldononitrile acetates derivatives showed higher stability and better recovery rate [67].
Drawbacks of the PAAN derivatization method are that the reaction is unable to convert other
carbohydrates than aldols because of ketoses form only oxime derivatives [9, 67]. Although studies
showed the simultaneous quantitation of aldoses and ketoses [159, 160], the PAAN method is not
suitable for quantitative analysis of real samples, where aldoses and ketoses are present at the same
time [67]. Studies reported that the reaction of the oxime with acetic anhydride could result in a
mixture of the nitrile and glycosylamine [152]. However, glycosylamine occurs regardless of the
reaction conditions and does not interfere with the analysis [152]. So, this method does not entirely
solve the demands of obtaining a single derivative for each monosaccharide [9].
1.5.2.3 TMS‐Oximes
The TMS‐oximation reaction of carbohydrates involves a two‐step derivatization strategy, involving
(1) the conversion of the carbonyl group into oximes and the subsequent (2) derivatization of
hydroxyl groups with a silylating reagent (Fig. 16) [138].
Figure 12: General reaction scheme for the derivatization of carbonyls to oximes.
The oximation reaction results in two peaks, the corresponding syn (Z) and anti (E) forms of the
oxime per reducing sugar, which remain after the silylation procedure (Fig. 17) [138]. The per‐
trimethylsilylated carbohydrates show up to five peaks per compound [68, 102] and the isomer ratio
of carbohydrates to have to equilibrate prior TMS derivatization [161]. Non‐reducing carbohydrates
(e.g., sucrose, trehalose, raffinose) cannot be oximated because of the absent aldehyde or
hemiacetal function and show only one peak, the per‐trimethylsilyl derivative [67].
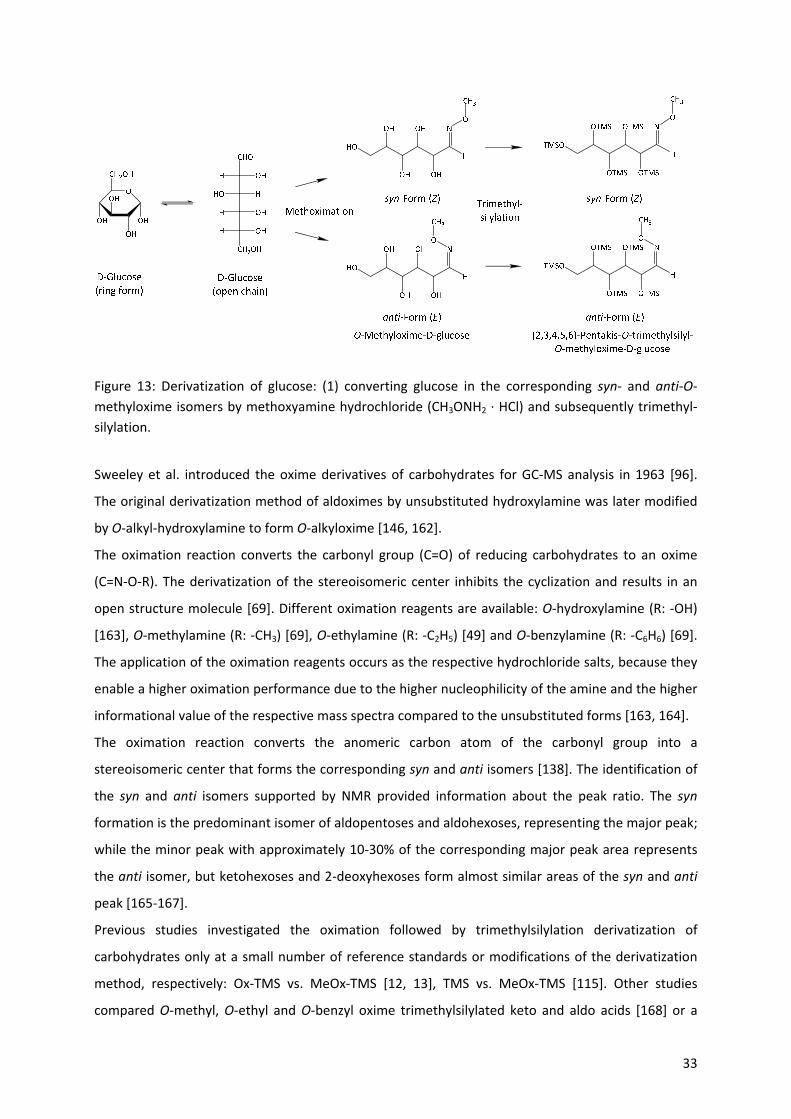
33
Figure 13: Derivatization of glucose: (1) converting glucose in the corresponding syn‐ and anti‐O‐
methyloxime isomers by methoxyamine hydrochloride (CH3ONH2 ∙ HCl) and subsequently trimethyl‐
silylation.
Sweeley et al. introduced the oxime derivatives of carbohydrates for GC‐MS analysis in 1963 [96].
The original derivatization method of aldoximes by unsubstituted hydroxylamine was later modified
by O‐alkyl‐hydroxylamine to form O‐alkyloxime [146, 162].
The oximation reaction converts the carbonyl group (C=O) of reducing carbohydrates to an oxime
(C=N‐O‐R). The derivatization of the stereoisomeric center inhibits the cyclization and results in an
open structure molecule [69]. Different oximation reagents are available: O‐hydroxylamine (R: ‐OH)
[163], O‐methylamine (R: ‐CH3) [69], O‐ethylamine (R: ‐C2H5) [49] and O‐benzylamine (R: ‐C6H6) [69].
The application of the oximation reagents occurs as the respective hydrochloride salts, because they
enable a higher oximation performance due to the higher nucleophilicity of the amine and the higher
informational value of the respective mass spectra compared to the unsubstituted forms [163, 164].
The oximation reaction converts the anomeric carbon atom of the carbonyl group into a
stereoisomeric center that forms the corresponding syn and anti isomers [138]. The identification of
the syn and anti isomers supported by NMR provided information about the peak ratio. The syn
formation is the predominant isomer of aldopentoses and aldohexoses, representing the major peak;
while the minor peak with approximately 10‐30% of the corresponding major peak area represents
the anti isomer, but ketohexoses and 2‐deoxyhexoses form almost similar areas of the syn and anti
peak [165‐167].
Previous studies investigated the oximation followed by trimethylsilylation derivatization of
carbohydrates only at a small number of reference standards or modifications of the derivatization
method, respectively: Ox‐TMS vs. MeOx‐TMS [12, 13], TMS vs. MeOx‐TMS [115]. Other studies
compared O‐methyl, O‐ethyl and O‐benzyl oxime trimethylsilylated keto and aldo acids [168] or a
34
formose mixture of carbohydrates [69]. A study mentioned that O‐alkoxyamines are superior to
hydroxyamines for identification purposes, but the authors published no related data [164].
The primary advantage of the reducing sugars conversion to an oxime prior hydroxyl group
derivatization is the formation of only two isomers instead of up to five isomers compared to other
derivatization methods [67, 146, 164]. The oximation decreases the number of chromatographic
peaks, which reduces the complexity of the chromatogram. The occurrence of two isomers per
reducing carbohydrate also enhanced the sensitivity of analysis compared to single‐step silylation
procedure based on the increased signal intensity [164, 169]. In contrast to the alditol acetate or
aldononitrile acetate method the oximation procedure different syn‐ and anti‐isomers of both
aldoses and ketoses [67]. Further advantages are the increasing volatility of carbonyl‐containing
compounds and the ability to protect keto acids (e.g., 2‐oxoacids and 4‐oxoacids) from
decarboxylation [146, 168, 170].
The disadvantages of the oximation derivatization are the instability of aldoxime derivatives at high
temperatures, and hydrolysis condition as well as the moisture sensitivity of the silylation reagents,
which require an entirely dried sample [67]. High temperatures can cause decomposition of the
oxime into the corresponding nitriles [67]. The use of N‐alkoxy‐oximes instead of aldoximes can
overcome this disadvantage since they are thermally more stable. So, N‐alkoxy‐oximes enable
additional chemical modifications, e.g., the silylation of the oxime derivative without the fear that
analytes decompose into nitriles during the derivatization reaction or GC injection, respectively [66].
35
2 Material and Methods
2.1 Derivatization methods
2.1.1 Ethyloximation‐trimethylsilylation (EtOx‐TMS)
The carbohydrate samples were lyophilized and dissolved in 200 µl of anhydrous pyridine, containing
40 mg/ml O‐ethylhydroxylamine hydrochloride and 1 mg/ml methyl β‐D‐galactopyranoside as an
internal standard. The mixture was heated for one hour at 70°C. Subsequently, 200 µl of a solution
containing 1.5 mg/ml 4‐(dimethylamino)pyridine (DMAP) in anhydrous pyridine was added to the
mixture, followed by 200 µl of N,O‐bis(trimethylsilyl)trifluoroacetamide (BSTFA), containing 10%
trimethylsilyl chloride (TMCS). The mixture was heated for two hours at 70°C. The derivatized
samples were kept at ‐20°C until analysis.
Prior injection, the derivatized samples were diluted with ethyl acetate (600 µl) and filtered (PTFE
membrane, 0.45 µm, 13 mm diameter). Aliquots of 0.2 µl were introduced into the splitless injector
with an Agilent GC Sampler 120 (Agilent Technologies, USA). All standards, chemicals, and reagents
were purchased from Sigma‐Aldrich‐Fluka (Sigma‐Aldrich, Schnelldorf, Germany); they were of GC‐
grade purity and used without further purification.
The GC‐MS analysis was performed on an Agilent 7890A gas chromatograph coupled with an Agilent
5975C mass selective detector. The analysis conditions were as followed: column: HP‐5MS (30m ×
0.25mm x 0.25µm; J&W Scientific, Folsom, CA, USA); carrier gas: helium, injector: 280°C; column
flow: 0.9 ml/min; purge flow: 32.4 ml/min, 0.6 min; oven program: 50°C (2 min), 5°C/min, 280°C (20
min); MS: EI mode, 70 eV, source pressure: 1.13∙10‐7 Pa, source temperature: 230°C. The scan range
was set from 50 to 950 Da.
2.1.2 Other derivatization methods
The GC‐MS analysis of the products of the following derivatization procedures were carried out using
the same GC‐MS analysis conditions as applied to the ethoximation‐silylation approach, mentioned
above. Only the scan range for ISP was set from 35 to 950 Da.
2.1.2.1 Per‐trimethylsilylation (TMS)
A defined amount of freeze‐dried grapevine leaves (10 mg), a crude product of the formose reaction
(50 µl) or reference compound (1 µg to 100 µg) was used for analysis. The sample was dissolved in
200 µl pyridine, which contained 75 µg/ml methyl‐β‐D‐galactopyranoside as internal standard (IS)
and 300 µg/ml of DMAP as a silylation catalyst. The derivatization was accomplished by adding 200 µl
of BSTFA and heating the mixture to 70°C for two hours. The derivatized samples were kept at ‐20°C
until further analysis.
36
2.1.3 O‐isopropylidenation (ISP)
An aliquot of 0.1 ml of an internal standard solution with 13C‐glucose in 50% aqueous methanol
(2 µg/µl) was added to the sample or reference compound. Subsequently, the mixture was freeze‐
dried and stored in vacuum over P4O10 at room temperature for two days. Then, a spatula tip of
anhydrous copper‐(II)‐sulfate was added to the sample prior dissolution in 625 µl dry acetone. The
derivatization procedure was started by adding 7.5 µl of concentrated H2SO4 to the sample. The
reaction was stopped by adding 80 mg of anhydrous sodium carbonate.
2.1.4 Oximation reactions followed by trimethylsilylation (TMS) or trifluoroacetylation (TFA)
Benzyloximation (BO): Similar to O‐ethoximation; 200 µl of a solution containing
40 mg/ml O‐benzylhydroxylamine hydrochloride in pyridine was added for the production of BO‐TMS
derivatives; the half amount of O‐benzylhydroxylamine hydrochloride (20 mg) was added for BO‐TFA.
The reaction mixtures were kept at 75°C for 40 min.
Trimethylsilylation (TMS) of oximated samples (EO‐TMS, BO‐TMS): BSTFA (200 µl) was added to the
solution of oximated derivatives containing the sample or reference, the internal standard, and the
catalyst (see the EtOx‐TMS method). The mixture was kept at 70°C for two hours. After cooling to
ambient temperature, ethyl acetate was added to the solution and stored at ‐20°C.
Trifluoroacetylation (TFA) of oximated samples (EO‐TFA, BO‐TFA): 50 µl (EO‐TFA) or 80 µl (BO‐TFA) of
N‐methyl‐bis(trifluoroacetamide) (MBTFA) were added to the solution of oximated derivatives
containing the sample or reference, the internal standard, and the catalyst (see the EtOx‐TMS
method). The mixture was kept at 70°C for two hours. After cooling to ambient temperature,
pyridine was added to the solution and cooled down to 4°C.
The derivatized samples were diluted with ethyl acetate (TMS: 880 µl; BO‐TMS: 665 µl; ISP: 567.5 µl)
or pyridine (EO‐TFA and BO‐TFA: 665 µl) to a final volume of 1.2 ml and filtered (PTFE membrane,
0.45 µm, 13 mm diameter) prior injection.
2.2 Hydrolysis reactions for polysaccharide analysis
2.2.1 Sulfuric acid hydrolysis
The sulfuric acid hydrolysis was conducted with sample amounts of 40 mg (±1 mg) per polysaccharide
and cellulose sample for analysis. The sulfuric acid hydrolysis was conducted using a two‐step acid
treatment with different concentrations according to Bose et al. (2009), modified for GC‐MS analysis
[171]. During the primary hydrolysis step, 1.5 ml of 72% H2SO4 was added to the sample at room
temperature for two hours. For the second hydrolysis step, 2 ml H2O was added to the primary
hydrolysis mixture to obtain a 40% H2SO4 concentration and subsequently heated in an oven at 80°C
37
for one hour. The hydrolysis solution was cooled down in an ice bath and stored at 4°C overnight to
polymerize the lignin fraction. Then, 7 ml of an internal standard solution (150 mg Sorbitol / 100 ml
H2O) were added to the hydrolysis solution. An aliquot of 1.5 ml was neutralized using sodium
carbonate (Na2CO3) until no more bubbles appeared (approx. 290 mg). The liquid was filtered
(0.45 µm, 13 mm diameter) into a new GC vial and the pH was checked with pH‐paper and adjusted
to pH 7 with one or two drop(s) of acetic acid.
2.2.2 Acid methanolysis
The samples for acid methanolysis were freeze‐dried prior treatment, then 1‐2 mg of polysaccharides
or 10 mg (±2 mg) of cellulose samples were used for analysis. The dried sample materials were
depolymerized through acid methanolysis by addition of 2 ml 2 M HCl in anhydrous methanol
according to Sundberg et al. (1996) [121]. The samples were kept at 100°C for three hours. When the
reaction mixtures reached ambient temperatures, the samples were neutralized with 100 µl pyridine.
Afterwards, 1 ml of an internal standard solution (0.1 mg sorbitol/ml methanol) was added to each
sample. A calibration solution (1 ml) containing 0.1 mg/ml of sugar monomers and uronic acids was
also subjected to the acid methanolysis under same conditions. The sugar monomers consisted of D‐
(‐)‐arabinose, D‐(+)‐galactose, D‐(+)‐glucose, D‐(+)‐mannose, L‐(+)‐rhamnose (6‐deoxy‐mannose) and
D‐(+)‐xylose. The uronic acids consisted of D‐(+)‐galacturonic acid monohydrate (GalA), D‐glucuronic
acid (GlcA)), and 4‐O‐methyl glucuronic acid (4‐O‐MeGlcA). Acid methanolysis samples and
calibration mixtures were evaporated in a water bath (50°C) under nitrogen stream until dryness and
further dried in a vacuum desiccator at room temperature for 30 min.
2.2.3 Per‐trimethylsilylation (TMS) of monosaccharides obtained from hydrolysis reactions
The lyophilized hydrolysates obtained from sulfuric acid hydrolysis or acid methanolysis reaction,
calibration mixtures and reference compounds were dissolved in 200 µl pyridine and incubated at
room temperature for 30 min to ensure proper isomer equilibration. Subsequently, 200 µl of a
solution of 1.5 mg/ml DMAP as a silylation catalyst in pyridine was added to the mixture. The
derivatization was accomplished by adding 200 µl BSTFA (containing 10% TMCS) and heating the
mixture to 70°C for two hours according to Becker et al. [172]. The derivatized samples were kept
at ‐20°C until analysis.
2.2.3.1 GC‐MS analysis of TMS‐derivatized hydrolysis products
The derivatized sulfuric acid hydrolysis or acid methanolysis products were diluted with ethyl acetate
(600 µl) and filtered prior injection. Aliquots of 0.2 µl derivatized sample were introduced into the

38
splitless injector using an Agilent GC Sampler 120. The GC‐MS analysis was performed on an Agilent
7890A gas chromatograph coupled with an Agilent 5975C mass selective detector.
The general GC‐MS analysis conditions were as followed: Column HP‐5MS (30 m × 0.25 mm x 25 µm;
J&W Scientific, Folsom, CA, USA); carrier gas: helium, MS: EI mode, 70 eV, source pressure: 1.13∙10‐7
Pa, purge flow: 36.3 ml/min, 0.6 min; source temperature: 230°C. Scan range was set from 43 to
950 Da.
Parameters for analysis of acid methanolysis products: injector temperature: 140°C (30°C/min to
260°C); column flow: 0.9 ml/min; oven program: 140°C (1 min), 4°C/min to 210°C, then 30°C/min,
260°C (5 min); inlet pressure 78.361 kPa.
Parameters for analysis of sulfuric acid hydrolysis products: injector temperature: 150°C (30°C/min to
260°C); column flow: 0.9 ml/min; oven program: 120°C (2 min), 5°C/min to 230°C, then 20°C/min,
260°C (10 min); inlet pressure 78.361 kPa.
2.2.4 Solid‐State NMR
The Solid‐State NMR experiments were performed on a Bruker Avance III HD 400 spectrometer
(resonance frequency of 1H of 400.13 MHz, and 13C of 100.61 MHz, respectively), equipped with a
4 mm dual broadband CP/MAS probe. The samples were swollen in deionized water overnight before
measurement. 13C spectra were acquired by using the TOSS (total sideband suppression) sequence at
ambient temperature with a spinning rate of 5 kHz, a cross‐polarization (CP), a contact time of 2 ms,
a recycle delay of 2 s, SPINAL 64 1H decoupling and an acquisition time of 43 ms. Chemical shifts were
referenced externally against the carbonyl signal of glycine with δ = 176.03 ppm. The acquired FIDs
were apodized with an exponential function (lb = 1 Hz) before Fourier transformation. Peak fitting
was performed with the Dmfit program [173]. Deconvolution fitting and assignment of fractions were
conducted according to the model and method of Larsson et al. (1997) [174].
2.2.5 GPC analysis of cellulose samples
The characterization of samples was carried out by measuring weight‐average molecular mass (Mw).
The paper samples were dissolved in N,N‐dimethylacetamide containing 9% lithium chloride (w/v).
The measurement was performed on a GPC system consisted of a multi‐angle laser light scattering
detector (Wyatt Dawn DSP with argon ion laser [λ0 = 488 nm]), and a refractive index detector
(Shodex RI‐71). The separation was carried out on a set of four PLgel mixed‐ALS columns (20 µm,
7.5×300 mm, Varian/Agilent)). N,N‐dimethylacetamide containing 0.9% lithium chloride (w/v) was
used as mobile phase. The system was operated at a flow rate of 1.0 ml/min with an injection volume
of 100 µl. Data evaluation was performed with standard Chromeleon 4, Astra 4.73, and GRAMS/32
software packages.
39
2.3 Analysis of the degree of acetylation in biopolymers
2.3.1 Method 1: Direct liquid‐phase analysis
2.3.1.1 Sample preparation
Paper or pulp samples were cut into small pieces (approx. 1–2 mm2). 50 mg of the carbohydrate
polymer sample was transferred into a 1.5 ml vial. The vials were sealed with 1.3 mm silicon/PTFE
septum crimp caps. 700 µl sodium methanolate solution containing one µl/ml toluene was added
through the septum. After 5 min reaction time, the sample was ready for analysis.
2.3.1.2 GC–MS conditions for the analysis of the liquid phase
The GC–MS analysis was performed on an Agilent 7890A gas chromatograph equipped with a Gerstel
PTV inlet, coupled with an Agilent 5975C mass selective detector.
The GC‐MS analysis conditions were as followed: column: HP‐5MS (30m × 0.25 mm i.d. × 0.25 µm
film thickness; J&W Scientific, Folsom, CA, USA); glass liners packed with quartz wool for the PTV‐
inlet were obtained from Gerstel (Mülheim an der Ruhr, Germany); carrier gas: helium; column flow:
1.5 ml/min; purge flow: 50.0 ml/min, 0 min; PTV inlet temperature program: 40°C (2 min), 20°C/min
to 100°C (0 min), then 25°C/min to 270°C (6 min); oven temperature program: 30°C (2 min),
10°C/min to 50°C (0 min), then 25°C/min to 270°C (2 min), MS: EI mode, 70 eV, source pressure:
1.13*10−7 Pa at 230°C. Quadrupole temperature: 150°C, transfer line: 200°C; MS data acquisition in
scan and single ion‐mode (SIM): scan range: 45 – 400 amu; SIM: m/z 60 (acetic acid), m/z 74 (methyl
acetate) and m/z 65 (toluene) at 100 ms dwell time each. Aliquots of 0.3 µl were injected into the
PTV inlet with an Agilent GC Sampler 120. The GC‐MS as well as the autosampler were controlled by
Agilent MSD Chemstation E.02.01 (Agilent Technologies, Santa Clara, CA, USA).
2.3.2 Method 2: Analysis via gas phase
2.3.2.1 Sample preparation
Approximately 2 mg of cellulose or paper sample was transferred into a 1.5 ml vial for analysis.
4‐O‐(13C2‐acetyl) vanillin was selected to generate isotopically labeled methyl13C2‐acetate in situ as an
internal standard. The synthesis was carried out according to [175]. The internal standard solution
consisted of 10 mg of the 13C2‐labeled internal standard dissolved in 4 ml of anhydrous methanol.
50 µl of anhydrous methanol and 20 µl of the internal standard solution were added to each sample.
300 µl of sodium methanolate was transferred to every sample before the vials were sealed with
1.3 mm silicon/PTFE septa crimp caps. The samples were immediately ready for analysis by GC‐MS.
Hemicellulosic samples were prepared in analogy to paper and cellulose samples except using 150 µl
of anhydrous methanol, 40 µl of the internal standard solution and 180 µl of sodium methanolate
solution.
40
2.3.2.2 GC–MS conditions for the analysis by SPME
The SMPE‐GC–MS analysis was carried out on an Agilent 7890A gas chromatograph coupled with an
Agilent 5975C triple axis mass selective detector (MSD). The GC was equipped with two inlets, an
Agilent multimode as well as an Agilent split‐/splitless inlet. Bleed and temperature optimized septa
(Agilent part no. 5183‐4757) were used for covering both inlets. The analysis of methyl acetate was
applied on a VF‐WaxMS column (30 m × 0.25 mm i.d. × 0.25 µm film thickness; J&W Scientific,
Folsom, CA, USA), connected to the multimode inlet on one end and the MSD on the other.
A screening of common SPME fiber types was conducted and revealed that the CAR/PDMS (black)
fiber enabled the highest number of injections. The following optimized SPME‐parameters have been
applied (briefly explained): agitator temperature: 35°C (temperature of the agitator used to
equilibrate the sample vial); incubation time: 20 min (time used for equilibrating the sample at a
specific agitator temperature without enrichment); the enrichment time has been adopted acording
to the methyl acetate concentration of the sample to prevent the fiber from being overloaded (time
used to expose the fiber into the sample headspace for analyte enrichment); desorption time: 12 min
(time used to expose the fiber into the inlet to facilitate analyte desorption); conditioning time:
10 min (time used to expose the fiber at a specific conditioning temperature for preparing the fiber
for the subsequent analyte enrichment).
The split‐/splitless inlet was used for the fiber conditioning before enrichment. A 5 m × 0.25 mm i.d.
fused silica capillary was connected on one end to the split‐/splitless inlet to ensure that a moderate
helium carrier gas pressure was build‐up. The other end just protruded into the GC‐column oven. The
multimode‐inlet was operated under the following conditions: constant column flow: 0.9 ml/min
using helium carrier gas, purge flow: 60.0 ml/min (2.54 min); injector temperature: 90°C constant.
Oven temperature gradient profile: 30°C (1 min), 8°C/min to 50°C (0 min), then 10°C/min to 200°C
(2 min). The MSD was operated in EI‐mode at 70 eV ionization energy and 1.13 × 10⁻⁷ Pa. Ion source
temperature: 230°C, quadrupole: 150°C, transfer line: 200°C. The data was acquired in SIM mode
selecting 74 m/z for detection of the methyl acetate analyte and 76 m/z for detection of its carbon‐
labeled derivate at 50 ms dwell time each. The fully automatized operation of all SPME steps was
realized with a CTC‐PALxt autosampler, which was controlled by Chronos software v.3.5 (Axel
Semrau, Spockhövel, Germany). SPME fibers were obtained from Supelco (Bellefonte, PA, USA).
41
2.4 Evaluation of the impact of volatile organic acids on paper
2.4.1 Analysis of formic acid and acetic acid emission potential by static headspace GC‐MS
with selected‐ion monitoring (SHS‐GC/SIMMS)
Samples of Schinkel exhibit materials were cut into small pieces (approx. 1‐2 mm2) and, depending
on the calibration range of the respective VOC, between 100 mg to 250 mg of the samples were
transferred in a ten ml crimp‐cap vial. The vials were sealed with a crimp cap containing UltraClean
silicon/PTFE septa (45° shore A, 3mm). The addition of 2.5 ml of a toluene‐d8 in mixture with veratrol
(1 µl/ml) was used as the internal standard for headspace measurements. Static headspace GC‐MS
analysis of formic acid and acetic acid was performed on a 7890A gas chromatograph coupled with a
5975C mass selective detector (Agilent Technologies). Samples were introduced by an autosampler
(Agilent GC Sampler 120). Agitator settings: incubation time 1800 s, incubation temperature 120°C,
and syringe temperature 130°C. Injection: 250 µl, split ratio 5:1, 240°C. Separation: A fused silica HP‐
5MS column (30 m x 0.25 mm x 0.25 µm; J&W Scientific, Folsom, CA, USA) and helium as a carrier gas
were used. Column flow: 1.2 ml/min. Oven program: 30°C for 5 min, then 5°C per min to 70°C, and
15°C per min to 280°C, then hold for 5 min. The MS was operated in the electron impact mode at
70 eV (230°C, 1.13 × 10⁻⁷ Pa). Selected ion monitoring (SIM) mode was applied for formic acid at
m/z 46, acetic acid at m/z 60, and toluene‐d8 at m/z 98 to detect peak area.
2.4.2 Artificial aging
The degradation effects of Schinkel exhibit materials were evaluated by artificially aging of each
material with Whatman No. 1, composed of a minimum α‐cellulose content of 98%, or historical rag
paper, according to the test proposed by Strlic et al. [176]. In short, a defined amount of indicator
paper (Whatman No. 1) or historical rag paper, is mounted in the volume of tightly closed 100 ml
Schott bottles, containing at the bottom a defined mass of the suspicious materials that need to be
checked for its volatile emissions. Deviating from Strlic et al., the aging was further carried out in
small (10 ml) crimp cap vials sealed with UltraClean™ silicon/PTFE septa (45° shore A, 3 mm) because
of the small amount of the available original samples and the fact that the 100 ml Schott flasks
showed measurable gas leaking at elevated temperatures. Sample weights of (91.7 ± 0.3) mg
Whatman No.1 or historical rag paper were hinged in the air volume and (183.3 ± 0.3) mg of original
samples to be tested were placed at the bottom of the same vial. Samples of the storage materials to
house the collection and papers were preconditioned in a desiccator at room temperature (25°C,
relative humidity: 52.9%) before aging for 24 hours using saturated magnesium nitrate solution.
Samples were aged at 100°C for five days. After aging, the paper samples were cooled at room
temperature for one hour before opening the vial.
42
2.4.3 Molar mass and carbonyl content measurement
The hydrolysis and oxidation characterization of paper caused of different materials were carried out
by measuring molar mass and carbonyl group content. A CCOA (carbazole‐9‐carbonyl‐oxy‐amine)
labeling for measuring the carbonyl group content was performed according to earlier reports [177,
178]. After labeling, the paper samples were dissolved in N,N‐dimethylacetamide containing 9%
lithium chloride (w/v) after the solvent exchange. The measurement was performed on a GPC system
consisting of a fluorescence detector (TSP FL2000), a multiple‐angle laser light scattering detector
(Wyatt Dawn DSP with argon ion laser, =488 nm), and a refractive index detector (Shodex RI‐71).
The separation was carried out on a set of four PLgel mixed‐A LS columns (20 mm, 7.5 x 300 mm,
Varian/Agilent). N,N‐dimethylacetamide containing 0.9% lithium chloride (w/v) was used for as
mobile phase. The system was operated at a flow rate of 1.0 ml/min with an injection volume of
100 ml. The fluorescence of the CCOA label was detected at an excitation wavelength set at 290 nm,
and the emission wavelength was set at 340 nm. Data evaluation was performed with standard
Chromeleon 4, Astra 4.73, and GRAMS/32 software packages.
43
3 Results and discussion
3.1 Analysis of carbohydrates, lignocellulosic side‐reactions, and degradation
products
3.1.1 Analysis of lignocellulosic effluent streams and aged paper extracts (Paper I & II)
The degradation of cellulose, hemicellulose, and lignin during pulp and paper processing produce a
wide variety of degradation products caused by multiple fragmentations, rearrangement, and
condensation reactions. These lignocellulosic effluent streams consist of different low‐molecular‐
weight carbohydrates, lignin‐derived compounds, and highly concentrated salts, all in an aqueous
solution. Knowledge about the composition of the degradation compounds is essential due to
environmental concerns of the high total organic carbon (TOC) level of effluents, to optimize
processing steps and effluent treatments by examination of degradation mechanism, and because of
degradation products are potentially valuable compounds as resources for future biorefinery
scenarios.
The analytical challenge of analyzing lignocellulosic effluent streams involves the simultaneous
determination of various carbohydrate‐derived reaction products. The degradation of celluloses and
hemicelluloses leads to the formation of aliphatic mono‐ and dicarboxylic acids, hydroxyacids, as well
as aromatic compounds from lignin degradation and chromophores from carbohydrates. The
challenge of analyzing pulp bleaching effluents also consists in the presence of highly concentrated
salts in this aqueous solution and the low concentrations of target compounds. Similar degradation
reactions during pulp processing also occurred under ambient conditions over a more extended
period of natural or artificial accelerated paper aging. The composition of degradation products in
aged paper extracts contains, similar to lignocellulosic effluent streams, structurally similar
degradation products of carbohydrate‐derived reaction products.
3.1.1.1 Study of complex mixtures of lignocellulose degradation products by CE‐MS
The study of complex lignocellulose degradation products in pulp bleaching effluents and
degradation products of paper aging in Paper I analyzed the target compounds by a combination of
capillary electrophoresis (CE) with electrospray ionization‐mass spectrometry (ESI‐MS). The CE‐MS
method allows the simultaneous analysis of lignin and carbohydrate‐derived compounds without the
need of a preliminary derivatization process in contrast to GC analysis (for volatility) or LC analysis
(for UV label attachment). The direct analysis is the primary advantage, which enables a rapid and
straightforward analysis method and avoids the effect of losing compounds, may be possible by
pretreatment steps.
44
The study revealed that the analyzed effluent samples contain a large number of aliphatic carboxylic
acids, comprising short‐chain mono‐ and di‐acids, short chain hydroxy acids, and medium‐chain
monoacids. The examination also detected vanillic, syringic and cinnamic acids as degradation
products of lignin origin. The aged paper extract contained sugar acids and LMM mono‐ and di‐acids
predominantly originated from far‐reaching carbohydrate degradation. The analysis revealed only
vanillic acid as a compound of lignin origin in the aged paper extract, due to the low concentration of
other phenolic compounds.
The study showed that the CE‐MS analysis allows fast and efficient separation of aliphatic carboxylic
acids and phenolic compounds in a single run without the need of solvent exchange. The ESI‐MS
analysis of unknown compounds provides indications of the chemical nature of the compounds. The
method allows the investigation of aqueous or water‐soluble samples and requires only sample
amounts in the range of nanoliters.
Nevertheless, the high concentration of inorganic salts in pulp effluent samples hinders the CE‐MS
analysis, which results in imperfect separation of some compounds and shifting of migration times.
Short chain carboxylic acids (formic acid, acetic acids) could not be analyzed in the paper extract
sample due to limits of the MS detector related to their low molecular weight. The complex mixture
of compounds in the studied samples complicated further fragmentation of analyte ions for structure
information and increased the required analysis time.
The analysis of lignocellulosic degradation products by CE‐MS is a fast and derivatization‐free
approach, which only requires a concentration step of the sample. However, the significant weakness
of the analysis approach is that no fragmentation database exists, in case of missing reference
standards the verification of compounds could not be performed. The GC‐MS approach can
overcome the limitation of compound identification, by providing access to mass spectra databases,
but requires a derivatization step prior analysis.
3.1.1.2 Study of complex mixtures of lignocellulose degradation products by GC‐MS methods
The application of different derivatization methods and GC‐analysis systems (GC‐MS, Py‐GC‐MS, and
HS‐GC‐MS) in the study of bleaching effluents in Paper II revealed a comprehensive overview of the
compounds in the samples. Bleaching effluent samples mainly consist of the carbohydrate
degradation products 3,4‐dihydroxybutyric acid and glycolic acid, as well as smaller amounts of LMW
carboxylic acids. Also, a large number of fatty acids, dimethoxybenzenes, methoxybenzoic acids, and
lignin‐derived compounds were present in the bleaching effluent sample.
However, every method showed discrimination effects during analysis, due to their different
sensitivity to components of a particular class of substance. The use of a single method would
discriminate several compounds by concentration or detectability.
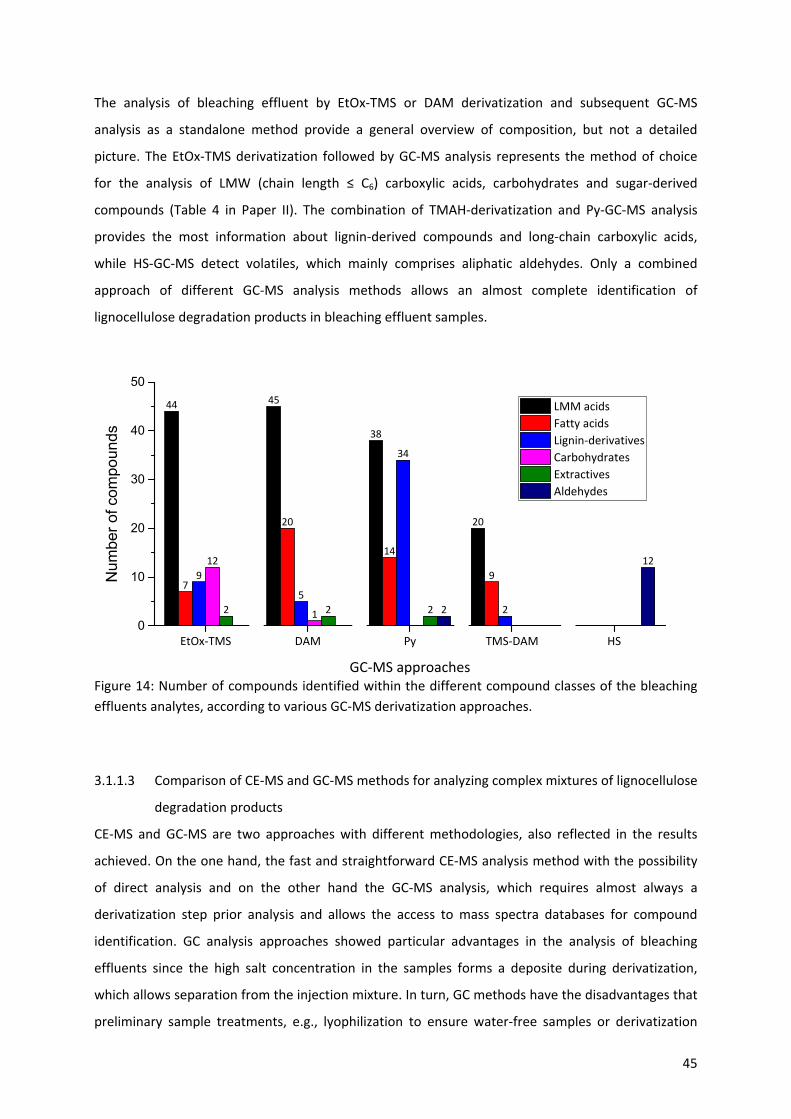
45
44 45
38
20
7
20
14
99
5
34
2
12
12 2 2 2
12
EtOx‐TMS DAM Py TMS‐DAM HS0
10
20
30
40
50
Num
ber
of c
ompo
unds
GC‐MS approaches
LMM acids
Fatty acids
Lignin‐derivatives
Carbohydrates
Extractives
Aldehydes
The analysis of bleaching effluent by EtOx‐TMS or DAM derivatization and subsequent GC‐MS
analysis as a standalone method provide a general overview of composition, but not a detailed
picture. The EtOx‐TMS derivatization followed by GC‐MS analysis represents the method of choice
for the analysis of LMW (chain length ≤ C6) carboxylic acids, carbohydrates and sugar‐derived
compounds (Table 4 in Paper II). The combination of TMAH‐derivatization and Py‐GC‐MS analysis
provides the most information about lignin‐derived compounds and long‐chain carboxylic acids,
while HS‐GC‐MS detect volatiles, which mainly comprises aliphatic aldehydes. Only a combined
approach of different GC‐MS analysis methods allows an almost complete identification of
lignocellulose degradation products in bleaching effluent samples.
Figure 14: Number of compounds identified within the different compound classes of the bleaching
effluents analytes, according to various GC‐MS derivatization approaches.
3.1.1.3 Comparison of CE‐MS and GC‐MS methods for analyzing complex mixtures of lignocellulose
degradation products
CE‐MS and GC‐MS are two approaches with different methodologies, also reflected in the results
achieved. On the one hand, the fast and straightforward CE‐MS analysis method with the possibility
of direct analysis and on the other hand the GC‐MS analysis, which requires almost always a
derivatization step prior analysis and allows the access to mass spectra databases for compound
identification. GC analysis approaches showed particular advantages in the analysis of bleaching
effluents since the high salt concentration in the samples forms a deposite during derivatization,
which allows separation from the injection mixture. In turn, GC methods have the disadvantages that
preliminary sample treatments, e.g., lyophilization to ensure water‐free samples or derivatization
46
steps to produce volatile analytes, require extensive and time‐consuming work. Also, a loss of
components could occur during sample preparation. The effect of compound discriminations in the
various GC analysis methods exists, and the sample analysis must take place according to the desired
target components. However, comparing the results of the bleaching effluents the identification of
components shows the limitation of the CE‐MS method and the advantage of the GC‐MS approach.
The results of CE‐MS analysis showed a very complex electropherogram with a high number of
components, but the data allowed only the identification of 20 compounds (Table 2 in Paper I) in the
bleaching effluent sample, due to the lack of reference compounds and available database systems.
In contrast, the GC‐MS method reveals seven identified compounds by HS‐GC‐MS and between 42
and 60 compounds (Table 1 in Paper II) depended on the different GC‐based analysis approaches. In
total, GC‐MS approaches identified 110 components in the bleaching effluents sample, showing the
high GC separation efficiency.
3.1.2 Analysis of complex mixtures of carbohydrates (Paper III & IV)
The analysis of carbohydrates requires the elimination of various problems, due to the molecular
structure of carbohydrates. The carbohydrate related peculiarities are extensively discussed in the
previous chapters. Also, complex carbohydrate mixtures can show very different amounts of
carbohydrates. The carbohydrate analysis by gas chromatography coupled to mass spectrometry
provides the necessary resolution and sensitivity to study the occurrence of carbohydrates in such
complex mixtures in contrast to CE and HPLC.
3.1.2.1 Derivatization methods (Paper III)
A GC‐based analysis requires the derivatization of carbohydrates to produce volatile derivatives.
However, derivatization methods influence the analysis to a far greater extent than just the increase
of volatility. The studied derivatization approaches included the single‐step derivatization methods
per‐trimethylsilylation and O‐isopropylidenation as well as two‐step derivatization methods, which
comprise sequential oximation (with O‐ethyl‐ or O‐benzylhydroxylamine) followed by
trimethylsilylation or trifluoroacetylation. The six different derivatization methods occurred at eight
monosaccharides (C5–C6), glycolaldehyde, and dihydroxyacetone. The evaluation was performed
according to their derivatization efficiency, chromatographic characteristics (e.g., number of isomers
formed per compound and resolution), analytical sensitivity (limit of detection), informational value
of mass spectra, reproducibility of quantification results and robustness towards matrix effects.
The ISP‐derivatization showed an excellent signal intensity and complex mass spectra. The
chromatographic resolution is good for almost all carbohydrates, since ISP produced only one peak,
except for ribose and fructose. A drawback of the ISP method for carbohydrate analysis is that
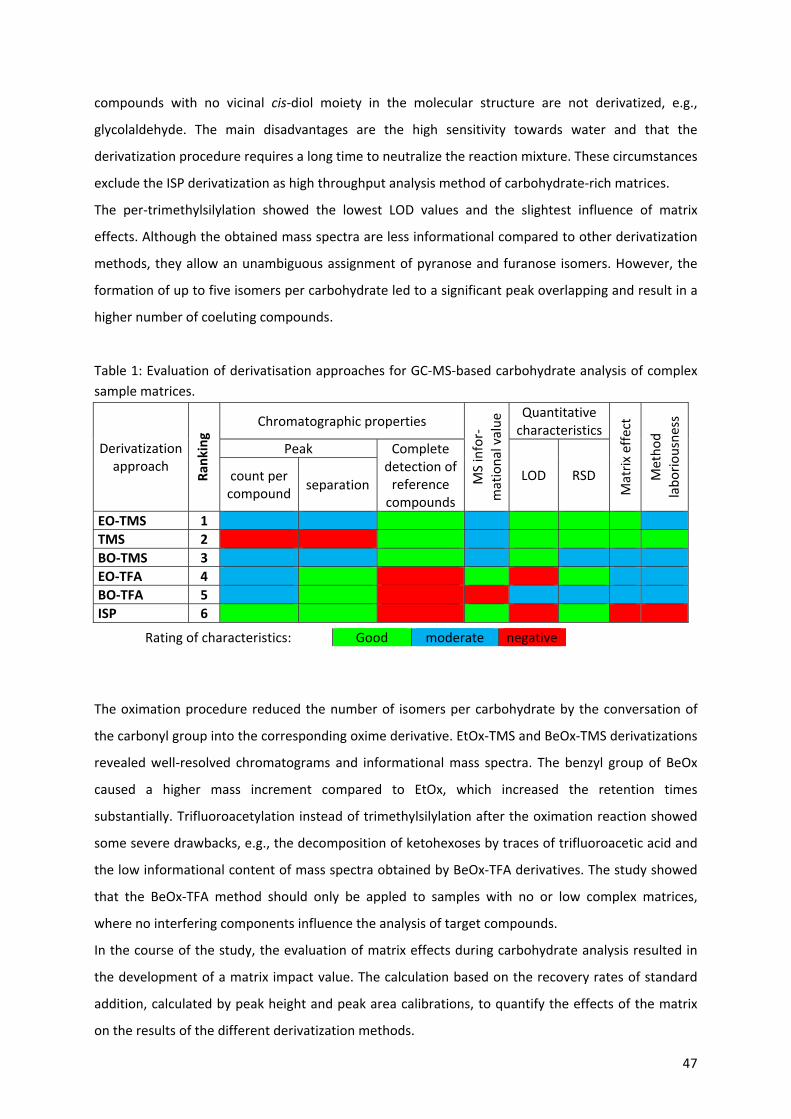
47
compounds with no vicinal cis‐diol moiety in the molecular structure are not derivatized, e.g.,
glycolaldehyde. The main disadvantages are the high sensitivity towards water and that the
derivatization procedure requires a long time to neutralize the reaction mixture. These circumstances
exclude the ISP derivatization as high throughput analysis method of carbohydrate‐rich matrices.
The per‐trimethylsilylation showed the lowest LOD values and the slightest influence of matrix
effects. Although the obtained mass spectra are less informational compared to other derivatization
methods, they allow an unambiguous assignment of pyranose and furanose isomers. However, the
formation of up to five isomers per carbohydrate led to a significant peak overlapping and result in a
higher number of coeluting compounds.
Table 1: Evaluation of derivatisation approaches for GC‐MS‐based carbohydrate analysis of complex
sample matrices.
Derivatization approach
Ran
king
Chromatographic properties
MS infor‐
mational value Quantitative
characteristics
Matrix effect
Method
laboriousness
Peak Complete detection of reference compounds
LOD RSD count per compound
separation
EO‐TMS 1
TMS 2
BO‐TMS 3
EO‐TFA 4
BO‐TFA 5
ISP 6
Rating of characteristics: Good moderate negative
The oximation procedure reduced the number of isomers per carbohydrate by the conversation of
the carbonyl group into the corresponding oxime derivative. EtOx‐TMS and BeOx‐TMS derivatizations
revealed well‐resolved chromatograms and informational mass spectra. The benzyl group of BeOx
caused a higher mass increment compared to EtOx, which increased the retention times
substantially. Trifluoroacetylation instead of trimethylsilylation after the oximation reaction showed
some severe drawbacks, e.g., the decomposition of ketohexoses by traces of trifluoroacetic acid and
the low informational content of mass spectra obtained by BeOx‐TFA derivatives. The study showed
that the BeOx‐TFA method should only be appled to samples with no or low complex matrices,
where no interfering components influence the analysis of target compounds.
In the course of the study, the evaluation of matrix effects during carbohydrate analysis resulted in
the development of a matrix impact value. The calculation based on the recovery rates of standard
addition, calculated by peak height and peak area calibrations, to quantify the effects of the matrix
on the results of the different derivatization methods.
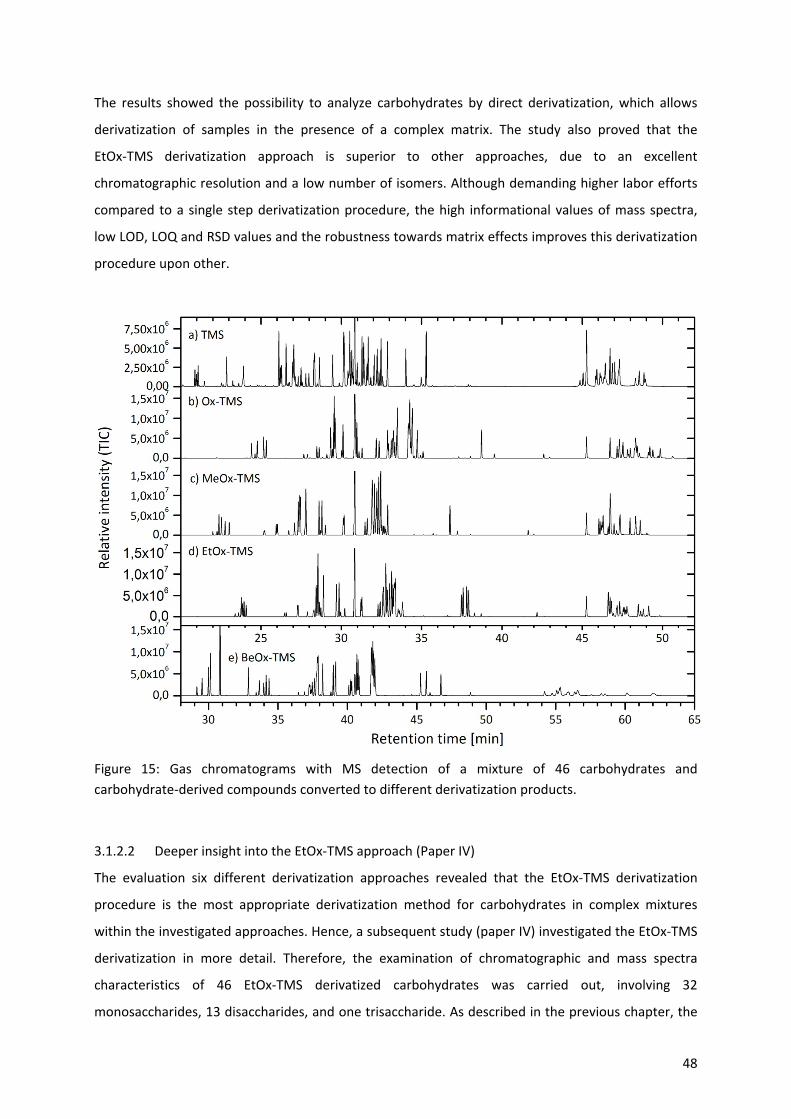
48
The results showed the possibility to analyze carbohydrates by direct derivatization, which allows
derivatization of samples in the presence of a complex matrix. The study also proved that the
EtOx‐TMS derivatization approach is superior to other approaches, due to an excellent
chromatographic resolution and a low number of isomers. Although demanding higher labor efforts
compared to a single step derivatization procedure, the high informational values of mass spectra,
low LOD, LOQ and RSD values and the robustness towards matrix effects improves this derivatization
procedure upon other.
Figure 15: Gas chromatograms with MS detection of a mixture of 46 carbohydrates and
carbohydrate‐derived compounds converted to different derivatization products.
3.1.2.2 Deeper insight into the EtOx‐TMS approach (Paper IV)
The evaluation six different derivatization approaches revealed that the EtOx‐TMS derivatization
procedure is the most appropriate derivatization method for carbohydrates in complex mixtures
within the investigated approaches. Hence, a subsequent study (paper IV) investigated the EtOx‐TMS
derivatization in more detail. Therefore, the examination of chromatographic and mass spectra
characteristics of 46 EtOx‐TMS derivatized carbohydrates was carried out, involving 32
monosaccharides, 13 disaccharides, and one trisaccharide. As described in the previous chapter, the

49
Glycolaldehyde
Methylglyoxal
Glyceraldehyde
Threose
Erythrulose
Erythrose
2‐Deoxy‐D‐ribose
Digitoxose
Xylose
Lyxose
Ribulose
Rhamnose
Fucose
2‐Deoxy‐D‐glucose
Psicose
Tagatose
Allose
Mannose
Gulose
Galactose
Talose
Altrose
Glucose
Sedoheptulose
Glucoheptose
L‐Glycero‐D‐manno‐heptose
Xylobiose
Lactose
Cellobiose
Maltulose
Maltose
Turanose
Leucrose
Gentiobiose
Palatinose
Melibiose ‐‐
10
20
30
40
50
Reten
tion tim
e ‐ syn isomer pea
k
or pea
k 1 [min]
‐40
‐30
‐20
‐10
0
10
20
30
40
50
Retention time ‐ syn isomer peak or peak 1 [min]
Time shift between syn and anti isomer peak or peak 1 and peak 2 [sec]
Time shift betwee
n syn
and anti isomer pea
k
or pea
k 1 and pea
k 2 [sec]
oximation reaction of the carbonyl group in carbohydrates eliminates the occurrence of furanosidic
and pyranosidic isomers. The reaction forms two oximes, the syn (Z) and anti (E) isomer, which
remains after silylation and produces two peaks in the chromatogram.
The mass spectra of EtOx‐TMS derivatized carbohydrates provided high informational content, but
showed congruent mass spectra regarding the fragmentation pattern. The mass spectra information
allows the differentiation between aldose and ketose, but a more precise carbohydrate‐specific
identification is challenging without additional chromatographic characteristics. The
chromatographic characteristics of the two occurring syn and anti isomers are their peak area ratio,
elution order and time shift between the two peaks. For monosaccharides, the syn/anti ratio of peak
area showed high values for aldoses (C3 to C6) in contrast to low values for ketoses (C4 to C6). The
study observed an elution order of syn peak before anti peak at ketotetroses, ketopentoses,
aldohexoses, and aldoheptoses. In contrary to aldotriose, aldotetroses, aldopentoses, ketohexoses,
and ketoheptoses, were the the anti peak eluted before the syn peak. The molecular shape of
monosaccharides also led to an influence on compound retention, by which a more planar molecular
form resulted in higher retention times. The study of disaccharides revealed that the respective type
of glycosidic linkage and the contained monosaccharide moieties influenced the chromatographic
characteristics. The position of the glycosidic linkage showed an effect on the elution order of the syn
peak, which appeared first at 1,4‐linked disaccharides before 1,3‐, 1,5‐ and 1,6‐linked disaccharides.
The molecular shape of the disaccharide explains the influence of the glycosidic bond on the
retention time. Garcia‐Raso et al. proposed that the higher conformational flexibility of 1,6‐
disaccharides cause higher retentions [99].
Figure 16: Retention time of syn peaks (■) and retention time shift (●) between the syn peak and
corresponding anti peak or peak 1 and peak 2 of different EtOx‐TMS derivatized carbohydrates.
50
The monosaccharide moieties of disaccharides influence the syn/anti peak area and anti peak order.
So, galactose‐, glucose‐ or xylose‐containing disaccharides showed high syn/anti peak area ratios
compared to fructose‐containing disaccharides. For that, the anti peak of fructose‐containing
disaccharides eluted before the syn peak, while the syn peak of non‐fructose containing
disaccharides eluted before the anti peak.
The elution order and the time shift between the two oxime peaks are carbohydrate‐specific
identification criteria. The incorporation of the two chromatographic parameters into a compound
identification index, the oxime peak identifier (OPI), allows a reliable identification of carbohydrates.
The OPI based, in contrast to conventional retention indices, on the second peak of the syn/anti pair
as dynamic standard and a static internal standard as an anchor point. In contrast to the relative
retention index, the OPI differs more precise between individual carbohydrates, increases the
resolution between carbohydrate index values and solves the problem of small retention time
differences between stereoisomers.
The EtOx‐TMS derivatization method and subsequent GC‐MS analysis combined with the proposed
oxime peak identifier (OPI) evaluation overcomes several problems of the GC‐MS based
carbohydrate analysis and enables reliable and easy identification of carbohydrates.
3.1.3 Analysis of lignocellulosic side‐reactions (Paper V, VI and VII)
Lignocellulosic materials represent a very complex matrix, as they include cellulose, hemicellulose,
and lignin. The evaluation of chemical and physical properties of lignocellulosic materials
necessitates an analysis regarding lignocellulosic side‐reactions. These lignocellulosic side‐reactions
involve the investigation of polysaccharides, containing acetyl groups, as well as oxidation‐ and
hydrolysis‐reactions. The characterization of chemical and physical properties is essential to provide
extensive information to a broad variety of industrial branches: to ensure a consistent quality of the
produced products or to validate treatments for improving fiber properties, to name only a few
examples. The following applications show the analysis of side‐reactions at polysaccharides, pulp,
and paper samples.
3.1.3.1 Applications
3.1.3.1.1 Carbohydrate compositions of polysaccharides (Paper V to be submitted)
Polysaccharides can contain a large number of different monosaccharides and vary in the occurrence
of them. Information about the monomer composition of fresh and aged pulps, pure polysaccharides
and cellulose samples are essential for their characterization and further processing. The
composition and accessibility of carbohydrates in cellulosic samples can be affected by electron
beam irradiation (e‐beam) treatments or aging processes. Different hydrolysis methods are available
51
to analyze the carbohydrate composition of polysaccharides and cellulosic sample. However, a single
hydrolysis method alone cannot be capable simultaneously for the analysis of pentoses, uronic acids,
and total glucose content. Strong acid hydrolysis leads to a release of reducing monosaccharides but
destroys uronic acids. Sundberg et al. reported in 1996 that mild acid hydrolysis reduces the
degradation of fragile hemicelluloses and allow the possibility to quantify uronic acids, but in case of
crystalline cellulose structures, the method reaches its limit [121].
Paper V describes the parallel hydrolysis of 21 polysaccharides and 21 cellulosic samples by sulfuric
acid and acid methanolysis, followed by GC‐MS analysis of the corresponding hydrolysis products.
The acid methanolysis represents a hydrolysis method under mild conditions and allows the analysis
of monosaccharide and sugar acid composition of hemicelluloses, pectins and an amorphous fraction
of cellulose samples. The acid methanolysis also converts the released monosaccharides into their
corresponding methyl glycosides and stabilize the carboxyl groups of uronic acids with methyl
groups. Silylation derivatization followed the acid methanolysis procedure according to Sundberg et
al. [121] to increase the volatility of hydrolysis products, subsequently analyzed by a modified GC‐MS
analysis. A two‐step sulfuric acid hydrolysis according to Bose et al. [171] allows the determination of
total glucose content, subsequently silylated and analyzed via GC‐MS.
The acid methanolysis of polysaccharides showed a recovery rate of 54.96% – 102.19% of released
monosaccharides and sugar acids. Only Inulin showed a very low recovery rate of 4.29%, because the
polysaccharide consists almost entirely of fructose, which is also available in stachyose.
Unfortunately, fructose decomposes during acid methanolysis, while glucose as the terminal end of
the inulin polymer remained. The primary monosaccharides identified with acid methanolysis in
cellulosic samples were glucose, xylose, and mannose, followed by arabinose and galactose (Figure 3
in Paper V). The hydrolysis of these samples showed recovery rates below 22.71% after
depolymerization. The study observed differences in the chemical composition between historical
and modern rag paper, indicating a diverse origin of the fiber material.
The sulfuric acid hydrolysis of polysaccharides revealed a specific carbohydrate pattern for each
polymer according to their corresponding monosaccharide distribution (Figure 5 in Paper V). The
strong hydrolysis of cellulosic samples showed higher recovery rates compared to acid methanolysis,
because the sulfuric acid hydrolysis affected the amorphous as well as the crystalline fraction of
cellulosic samples. There are several reasons sulfuric acid hydrolysis could not achieve full recovery
rate in this study. The sulfuric acid hydrolysis causes decarboxylation of uronic acids, and can lead to
an information loss during analysis due to the destruction of low‐content existing carbohydrates. No
signals of disaccharides and trisaccharides occurred during GC‐MS analysis. The analysis of hydrolysis
reaction mixture by a HPTLC based method observed cellobiose and higher gluco‐oligosaccharides,
which indicated an incomplete hydrolysis of the cellulosic samples [179]. However, this could not be
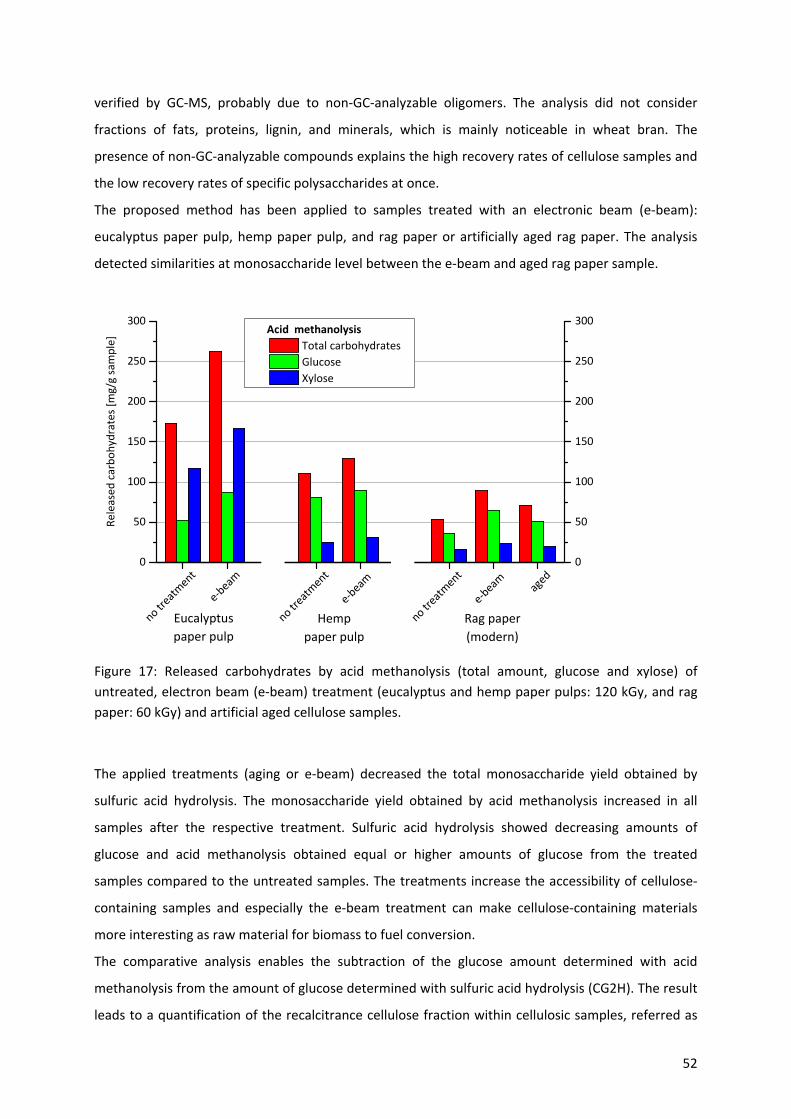
52
verified by GC‐MS, probably due to non‐GC‐analyzable oligomers. The analysis did not consider
fractions of fats, proteins, lignin, and minerals, which is mainly noticeable in wheat bran. The
presence of non‐GC‐analyzable compounds explains the high recovery rates of cellulose samples and
the low recovery rates of specific polysaccharides at once.
The proposed method has been applied to samples treated with an electronic beam (e‐beam):
eucalyptus paper pulp, hemp paper pulp, and rag paper or artificially aged rag paper. The analysis
detected similarities at monosaccharide level between the e‐beam and aged rag paper sample.
no treatment
e‐beam
no treatment
e‐beam
no treatment
e‐beam
aged
0
50
100
150
200
250
300
0
50
100
150
200
250
300
Released carbohydrates [m
g/g sample]
Acid methanolysis
Total carbohydrates
Glucose
Xylose
Eucalyptus
paper pulp
Rag paper
(modern)
Hemp
paper pulp
Figure 17: Released carbohydrates by acid methanolysis (total amount, glucose and xylose) of
untreated, electron beam (e‐beam) treatment (eucalyptus and hemp paper pulps: 120 kGy, and rag
paper: 60 kGy) and artificial aged cellulose samples.
The applied treatments (aging or e‐beam) decreased the total monosaccharide yield obtained by
sulfuric acid hydrolysis. The monosaccharide yield obtained by acid methanolysis increased in all
samples after the respective treatment. Sulfuric acid hydrolysis showed decreasing amounts of
glucose and acid methanolysis obtained equal or higher amounts of glucose from the treated
samples compared to the untreated samples. The treatments increase the accessibility of cellulose‐
containing samples and especially the e‐beam treatment can make cellulose‐containing materials
more interesting as raw material for biomass to fuel conversion.
The comparative analysis enables the subtraction of the glucose amount determined with acid
methanolysis from the amount of glucose determined with sulfuric acid hydrolysis (CG2H). The result
leads to a quantification of the recalcitrance cellulose fraction within cellulosic samples, referred as
53
the index of recalcitrance cellulose fraction (CRCI). While the 13C CP‐MAS NMR method distinguishes
between structural alterations based on the different cellulose fractions (Iα, Iβ and paracrystalline),
the CG2H‐method derived information about the structure elucidation from the carbohydrate
composition and the quantity of individual monosaccharide. Both methods can detect and uncover
structural rearrangements from the crystalline to the amorphous fraction. The NMR method is fast,
but requires expensive equipment, while the CG2H‐method comes along with less expensive
equipment, but is more time‐consuming and requires more labor and analytical resources. The
analysis of artificial aging or electron beam irradiation treated cellulose samples uncovered similar
tendencies in the structural rearrangements from crystalline to amorphous cellulose fraction and a
general loss of total carbohydrates within all samples. Despite a similar behavior of the treatments at
samples’ carbohydrate level, the study indicated that e‐beam treatment caused a significantly higher
effect of chain scission at rag paper in contrast to the ageing treatment.
The results showed that the proposed approach represents a useful analytical tool for determination
of structure elucidation and carbohydrate characterization for a wide range of polysaccharide and
cellulosic samples.
3.1.3.1.2 The degree of Acetylation (Paper VI)
The presence of acetyl groups in polysaccharides is an essential factor, which significantly influences
the properties of polysaccharides. The formation of acetyl groups naturally takes place in the
polysaccharides hemicelluloses, pectin, and lignin. The acetylation can also perform in the presence
of acetic acid, whether intentionally or unintentionally.
Acetyl groups affect various functions of polysaccharides, e.g., the solubility in water and certain
organic acids, and especially the surface properties, such as hydrophobicity, water interaction, and
the reactivity of pulp, fibers, and paper. However, the presence of free acetates as acetic acid
(adsorbed or residues released by processing steps), acetic acid salts or residues of acetylation agents
complicates the analysis of bounded acetyl groups. Acetyl groups containing polysaccharides can also
frequently emit acetic acid, e.g., from hemicelluloses. Although the pulping process leads to
deacetylation and therefore only a few acetyl groups are present in hemicelluloses of paper, small
traces of acetic acid can be formed due to degradation processes. Recent analysis methods cannot
distinguish between bound and free acetates, since they are relying on the cleavage of the esters and
analyze the released acetic acid.
Paper VI describes a Zemplén‐deacetylation based analysis method for the quantification of bound
acetate groups in polysaccharides and carbohydrate‐related materials by GC‐MS, not affected by the
presence of free or adsorbed acetic acid and acetates. The Zemplén‐deacetylation describes a fast
transesterification reaction between covalently specific bound acetyl groups and anhydrous sodium
54
methanolate in methanol, resulting in the formation of methyl acetate. The sodium methanolate acts
as a catalyst; the formation of the corresponding methyl acetate consumes the methanol. However,
free acids can neutralize sodium methanolate and thus, the deacetylation reaction requires higher
amounts beyond catalytic quantities. Paper VI describes two different introduction techniques, a
direct liquid‐phase analysis and the analysis of the methyl acetate containing vapor phase via SPME.
The liquid‐phase based GC‐MS method represents a fast and straightforward method, but revealed
some weaknesses, as (1) the accumulation of aggressive sodium methanolate in the liner and column
head, and (2) the internal standard toluene does not fulfill the common requirements, since it is not
taking part of the actual deacetylation process. So, internal standardization cannot correct entirely
influences as moisture content, adsorptive interactions of the methyl acetate and discrimination
effects by a time‐depended loss of methyl acetate. The analysis of the vapor phase by SPME‐GC‐MS
in combination with 4‐O‐(13C2‐acetyl) vanillin for internal standardization, which generates
isotopically labeled methyl 13C2‐acetate in situ, overcome the contamination problem and eliminates
possible influences and discrimination effects. The degree of acetylation can vary considerably
between the individual samples. This circumstance requires an adaptation of the protocol and
calibration for samples containing trace amounts or higher amounts of acetyl groups.
The analysis of cotton linters and Whatman paper showed only trace amounts of acetyl groups
resulting in a very low degree of acetylation. The absence of hemicelluloses in the sample and an
alkaline purification step, which removes remaining acetyl groups in the samples explain the
observed trace amounts. Book paper and rag paper contained higher amounts of acetyl groups, and
so, the corresponding degree of acetylation is noticeably higher. Analyzing hemicellulose‐containing
samples (spruce, birch, and beech origin) revealed a significant increase in the degree of acetylation.
The results showed that the proposed method enables an accurate and precise quantification of the
degree of acetylation.
3.1.3.1.3 Volatile organic acids in the paper (Paper VII)
Volatile organic compounds (VOCs) can affect the consistency of paper‐based collections, by
accelerating the hydrolytic depolymerization, which leads to a significant loss of physical stability or
changing optical properties. Possible VOCs‐emitting sources in museum collections are storage,
presentation or construction materials as well as furnishings and the objects themselves. Among the
VOCs, formic acid and acidic acid are of particular importance on paper degradation. The knowledge
about VOCs emission by storage‐materials and their impact on paper degradation can help to
improve the storage environment of paper‐based objects.
Paper VII describes an evaluation of the emission and damaging potential of storage‐materials
present in the collection of the drawings and prints of Karl Friedrich Schinkel stored in the
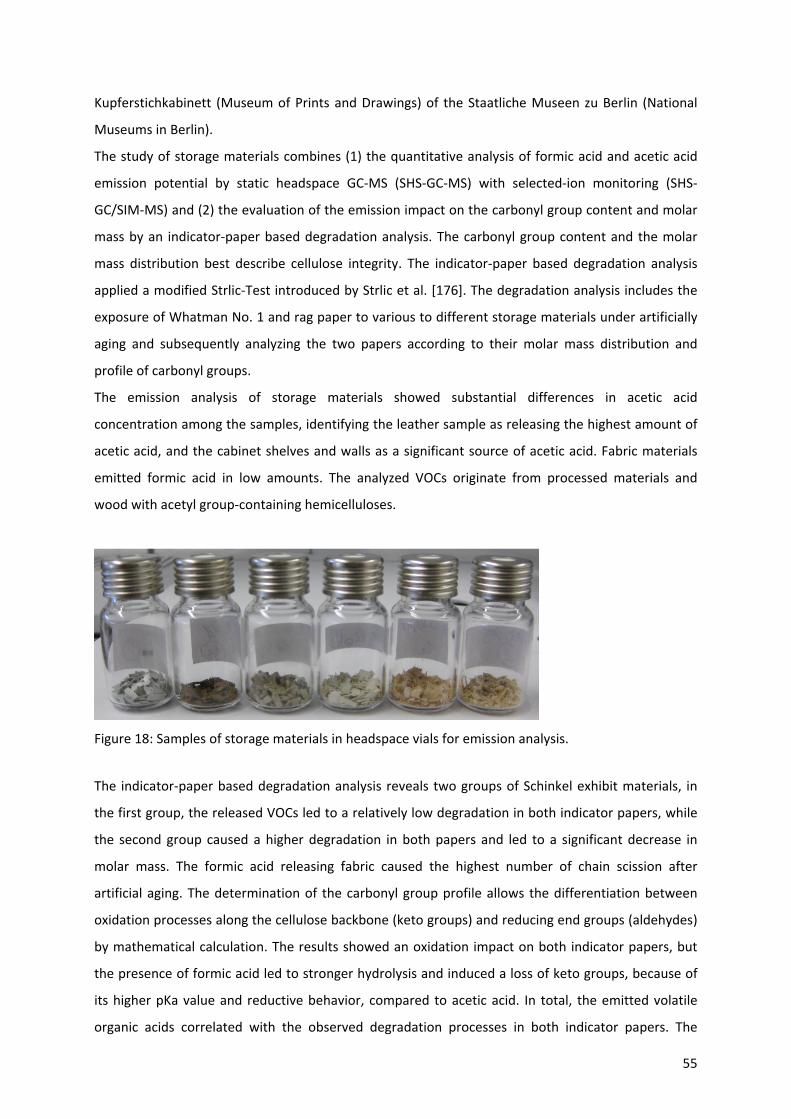
55
Kupferstichkabinett (Museum of Prints and Drawings) of the Staatliche Museen zu Berlin (National
Museums in Berlin).
The study of storage materials combines (1) the quantitative analysis of formic acid and acetic acid
emission potential by static headspace GC‐MS (SHS‐GC‐MS) with selected‐ion monitoring (SHS‐
GC/SIM‐MS) and (2) the evaluation of the emission impact on the carbonyl group content and molar
mass by an indicator‐paper based degradation analysis. The carbonyl group content and the molar
mass distribution best describe cellulose integrity. The indicator‐paper based degradation analysis
applied a modified Strlic‐Test introduced by Strlic et al. [176]. The degradation analysis includes the
exposure of Whatman No. 1 and rag paper to various to different storage materials under artificially
aging and subsequently analyzing the two papers according to their molar mass distribution and
profile of carbonyl groups.
The emission analysis of storage materials showed substantial differences in acetic acid
concentration among the samples, identifying the leather sample as releasing the highest amount of
acetic acid, and the cabinet shelves and walls as a significant source of acetic acid. Fabric materials
emitted formic acid in low amounts. The analyzed VOCs originate from processed materials and
wood with acetyl group‐containing hemicelluloses.
Figure 18: Samples of storage materials in headspace vials for emission analysis.
The indicator‐paper based degradation analysis reveals two groups of Schinkel exhibit materials, in
the first group, the released VOCs led to a relatively low degradation in both indicator papers, while
the second group caused a higher degradation in both papers and led to a significant decrease in
molar mass. The formic acid releasing fabric caused the highest number of chain scission after
artificial aging. The determination of the carbonyl group profile allows the differentiation between
oxidation processes along the cellulose backbone (keto groups) and reducing end groups (aldehydes)
by mathematical calculation. The results showed an oxidation impact on both indicator papers, but
the presence of formic acid led to stronger hydrolysis and induced a loss of keto groups, because of
its higher pKa value and reductive behavior, compared to acetic acid. In total, the emitted volatile
organic acids correlated with the observed degradation processes in both indicator papers. The

56
different degradation behavior of the two‐indicator paper occurred due to differences in the specific
polymer composition, pre‐treatments, and additives. Whatman No.1 paper shows the ability to act as
a universal indicator, due to the sensitive reaction towards hydrolytic degradation, while rag paper
reflects the reality, due to containing additional matrix compounds.
The study observed degradation effects of acetic acids and especially for formic acid. The results
exclude various materials from the suitability of storing paper‐based collections and confirm the
need for a better understanding of storage materials to create a safe environment for paper‐based
cultural heritage.
57
4 Conclusion
Carbohydrates are essential compounds to fulfill various functions in physiological processes and are
substantial resources used both in food and non‐food industry. They occur highly diverse regarding
structure, size, functionality, and range from simple monosaccharides to highly complex
polysaccharides.
The purpose of the current study was to evaluate GC‐MS based analysis methods for complex
carbohydrate mixtures concerning qualitative and qualitative composition in conjunction with side
reactions of the carbohydrate molecule. The complex mixtures occurred as soluble extracts, pure
polysaccharides, processed materials, and degradation products of carbohydrates. The analysis of
the compounds requires the derivatization of low molecular carbohydrates prior GC‐MS analysis or
an additional hydrolysis step, which is necessary to convert oligo‐ and polysaccharides into GC‐MS
measurable units as well as an identification procedure for the carbohydrate analysis.
There are numerous derivatization methods to convert carbohydrates in derivatives, which can be
analyzed by gas chromatography. However, some of these methods have reaction conditions that are
not suitable for a modern laboratory with optimized workflows and high sample throughput. Despite
specific advantages of the different derivatization methods, some have significant disadvantages e.g.,
extremely long reaction times, several derivatization steps and the requirement of neutralization
steps, respectively. The described ExOx‐TMS derivatization method was evaluated based on ten
carbohydrates and compared to five other derivatization methods. The subsequent analysis of 46
carbohydrates using EtOx‐TMS provides comprehensive data for the chromatographic and mass
spectrometric characterization of various mono‐ and disaccharides. Despite two reaction steps and
the need to prepare water‐free samples, the method shows significant advantages in contrast to the
other derivatization methods conducted in the study. Basic features include a low number of peaks,
the suitability for a variety of sample origins, the possibility of a high sample throughput in
combination with derivatization robots, and the reduced sample preparation compared to previous
methods.
The evaluation of the different derivatization methods was carried out with regard to their suitability
to conduct the reaction in the presence of the sample matrix. The derivatization in the sample matrix
has the advantage that target components do not undergo an extraction procedure and thus avoid a
possible loss of components or discrimination effects. It has been observed that the amount of
derivatized target components are least affected in the presence of the sample matrix by conducting
the approaches EtOx‐TMS and TMS. Therefore, these methods are suitable for carrying out the
derivatization reaction on samples without the need of previous extraction steps. The study was
carried out on the following samples: formose reaction, pulp mill effluent, book paper, and
lyophilized and finely ground grapevine leafs. The method revealed the advantage, that the salt
58
precipitates in the presence of the derivatization reaction mixture and cannot interfere further the
analysis, which is especially important for pulp mill effluents.
There is still a need to increase the sample throughput at the derivatization process. Derivatization
robots can partially solve the problem or minimize the workload associated with the derivatization
reaction.
The identification of carbohydrates with equal molecular weight based on retention times is difficult
due to the low elution differences. Especially, routine examinations without mass spectrometry
depend on a reliable identification. The presented EtOx‐TMS‐derivatization prior GC‐MS analysis in
combination with the new oxime peak‐base retention index (oxime peak identifier) show significant
improvements in the retention time‐based identification of carbohydrates. Using both oxime peaks
with an internal standard increases the accuracy and can help to enhance positive carbohydrate
identification, even in highly complex biological samples. The procedure has already been applied in
other studies for the determination of carbohydrates at different types of samples, e.g., extracts of
books, vine roots, and sugar millet plants. Recent studies also applied the procedure to evaluate
different thermal digestion processes of rice straw for ethanol recovery.
However, it must be taken into account, if the analysis base only on one isomer peak, then the
equilibrium between the isomer peaks is essential for the quantification process. Another important
fact to mention is that carbohydrates produce ubiquitous mass ions and very similar mass spectra.
For this reason, the use of mass spectroscopy for carbohydrate identification is still tricky despite
various derivatization procedures.
It is recommended to conduct further investigations to improve the quantification process of EtOx‐
TMS‐derivatized carbohydrates after GC‐MS analysis. Possible approaches to improve the calibration
and the quantification process could be made by providing a better separation of the syn‐ and anti‐
peak to conduct the quantification on both peak areas as well as an automated software‐aided
analysis of the GC chromatogram by considering MS data. The use of carbohydrate isotopes for
internal standardization could further improve the standard derivation and reproducibility of the
derivatization approaches.
The investigations of exhibition and storage materials of the Schinkel collection in the Kupferstich‐
Kabinett in Berlin showed that the shelves as well as the shelf walls consisted of pressed chipboard
material and released a considerable amount of acetic acid, which can lead to the destruction of
cellulose‐based Schinkel exhibits. Likewise, the leather and fabric sample of the magazine cassettes
showed significant levels of absorbed acetic acid or low level of formic acid. The Kupferstich‐Kabinett
responded by replacing the shelves and shelf walls with metal compounds, renewing the magazine
cassettes and by venting the magazines to reduce the high levels of acetic acid in the storage
environment.
59
The analysis of polysaccharide consisting carbohydrate samples was conducted by the parallel
hydrolysis of sulfuric acid and acid methanolysis (CG2H‐method) combined with a GC‐MS‐based
analysis of the hydrolysis products. The comparative analysis enables the subtraction of the glucose
amount determined with acid methanolysis from the amount of glucose determined with sulfuric
acid hydrolysis. The CG2H‐method allows a more detailed view on the carbohydrate profile of
samples and is preferred to discover background information of structural rearrangements compared
to methods, which measure only the crystallinity index of paper samples. The information, obtained
by the proposed CG2H‐approach, can be used to improve the efficiency of current technologies to
increase the carbohydrate accessibility of cellulose‐containing samples. The study revealed that the
e‐beam treatment reduce the crystallinity‐fraction fraction of cellulose towards the amorphous
fraction, which makes the treatment attractive as an application for renewable resources. The e‐
beam irradiation can improve carbohydrate yield by enhancing polysaccharide accessibility towards
enzyme or hydrolysis methods. So, a e‐beam treatment makes cellulose containing materials more
interesting as raw material for biomass to fuel conversion.
More research is necessary to investigate the structure elucidation of polymers and to uncover
internal relationships between the crystalline and amorphous cellulose fraction of cellulosic samples.
Further efforts are needed to understand the effects of various treatments on cellulosic samples to
increase the accessibility of carbohydrates for utilization as renewable resources and to extend the
technique to samples of different biological origin.
The analysis of the degree of acetylation based on the Zemplin reaction method has significant
advantages compared to many previous methods, it is not affected by free or in the sample material
contained acetic acid. The analysis was carried out on materials ranging from powdered
polysaccharides to various types of paper. Due to the high sensitivity of the analysis, it can be applied
to the very small sample amounts. The method is easy to apply and enable in combination with short
reaction times a high sample throughput. The simple reaction conditions and the SPME‐based GC‐MS
analysis method allow the use of the analysis approach in many laborites without high investments in
additional lab equipment.

60
Acknowledgements
First, I would like to thank my supervisors Antje Potthast and Astrid Forneck for teaching me
scientific work, and for introducing me to many different research areas and analysis
methods.
Thanks to Thomas Rosenau and Falk Liebner for always having the door open for questions,
their availability and beautiful evenings.
My colleagues, Stefan Böhmdorfer, Thomas Zweckmair, Sonja Schiesser, Martina Opietnik,
Georg Pour, Gerald Ebner, Johannes Hell, Michaela Griesser, and many other people for their
helpfulness and the many great moments that have enriched the work at the BOKU so much.
I would like to thank all those who have reminded me with their questions about the status
of this thesis that I should finally complete this.
Special thanks to Martin Pour‐Nikfardjam for his motivating words and proofreading.
I want to leave my huge thanks to my family, parents and friends for your support and
the good persuasion.
61
References
1. Klampfl, C.W., M. Himmelsbach, and W. Buchberger, Analysis of Simple Carbohydrates by
Capillary Electrophoresis and Capillary Electrophoresis–Mass Spectrometry, in Capillary
Electrophoresis of Carbohydrates: From Monosaccharides to Complex Polysaccharides, N.
Volpi, Editor. 2011, Humana Press: Totowa, NJ. p. 1‐21.
2. BeMiller, J.N., Carbohydrate Analysis, in Food Analysis. 2010, Springer US: Boston, MA. p.
147‐177.
3. Stevens, C.V., Industrial products from carbohydrates, wood and fibres, in Renewable
Bioresources. 2004.
4. Breadmore, M., E. Hilder, and A. Kazarian, Fluorophores and Chromophores for the
Separation of Carbohydrates by Capillary Electrophoresis, in Capillary Electrophoresis of
Carbohydrates. 2011, Springer. p. 23‐51.
5. Herrero, M., A. Cifuentes, E. Ibáñez, and M.D. del Castillo, Advanced Analysis of
Carbohydrates in Foods, in Methods of Analysis of Food Components and Additives, Second
Edition. 2011, CRC Press. p. 135‐164.
6. Sanz, M.L. and I. Martinez‐Castro, Recent developments in sample preparation for
chromatographic analysis of carbohydrates. Journal of Chromatography A, 2007. 1153(1‐2):
p. 74‐89.
7. Scott, R.P.W., Carbohydrates: Derivatization for GC Analysis, in Encyclopedia of
Chromatography, Third Edition. 2009, Taylor & Francis. p. 306.
8. Sanz, M.L., J. Sanz, and I. Martinez‐Castro, Gas chromatographic‐mass spectrometric method
for the qualitative and quantitative determination of disaccharides and trisaccharides in
honey. Journal of Chromatography A, 2004. 1059(1‐2): p. 143‐8.
9. Knapp, D.R., Handbook of Analytical Derivatization Reactions. 1979, New York: Wiley.
10. Zaikin, V. and J. Halket, A Handbook of Derivatives for Mass Spectrometry. 2009, Chichester:
IM Publications. 517.
11. Orata, F., Derivatization reactions and reagents for gas chromatography analysis, in
Advanced Gas Chromatography ‐ Progress in Agricultural, Biomedical and Industrial
Applications. 2012, Dr. Mustafa Ali Mohd, InTech, Available from:
http://www.intechopen.com/books/advanced‐gaschromatography‐progress‐in‐agricultural‐
biomedical‐and‐industrial‐applications/derivatization‐reactions‐andreagents‐for‐gas‐
chromatography‐analysis.
12. MolnarPerl, I. and K. Horvath, Simultaneous quantitation of mono‐, di‐ and trisaccharides as
their TMS ether oxime derivatives by GC‐MS .1. In model solutions. Chromatographia, 1997.
45: p. 321‐327.
13. Rojas‐Escudero, E., A.L. Alarcon‐Jimenez, P. Elizalde‐Galvan, and F. Rojo‐Callejas,
Optimization of carbohydrate silylation for gas chromatography. Journal of Chromatography
A, 2004. 1027(1‐2): p. 117‐120.
14. Izydorczyk, M., Understanding the Chemistry of Food Carbohydrates, in Food Carbohydrates.
2005, CRC Press.
15. Wrolstad, R.E., Classifying, Identifying, Naming, and Drawing Sugars and Sugar Derivatives, in
Food Carbohydrate Chemistry, R.E. Wrolstad, Editor. 2012a, John Wiley & Sons. p. 1‐21.
16. Wade, L.G., Organic Chemistry. 2013: Pearson.
17. Miljkovic, M., Carbohydrates: synthesis, mechanisms, and stereoelectronic effects. 2009:
Springer Science & Business Media.
62
18. Soderberg, T., Organic Chemistry with a Biological Emphasis Volume II. 2012.
19. Wrolstad, R.E., Reactions of Sugars, in Food Carbohydrate Chemistry, R.E. Wrolstad, Editor.
2012b, John Wiley & Sons. p. 35‐47.
20. French, A.D., Glucose, not cellobiose, is the repeating unit of cellulose and why that is
important. Cellulose, 2017. 24(11): p. 4605‐4609.
21. McNaught, A.D. and A. Wilkinson, Compendium of chemical terminology. Vol. 1669. 1997,
Oxford: Blackwell Scientific Publications.
22. Robyt, J.F., Essentials of carbohydrate chemistry. 1998: Springer Science & Business Media.
23. Sjostrom, E., Chapter 7 ‐ WOOD PULPING, in Wood Chemistry (Second Edition), E. Sjostrom,
Editor. 1993, Academic Press: San Diego. p. 114‐164.
24. Horacio, P. and G. Martinez‐Noel, Sucrose signaling in plants: A world yet to be explored.
Plant Signaling & Behavior, 2013. 8(3): p. e23316.
25. Roitsch, T., Source‐sink regulation by sugar and stress. Current Opinion in Plant Biology,
1999. 2(3): p. 198‐206.
26. Smeekens, S., J. Ma, J. Hanson, and F. Rolland, Sugar signals and molecular networks
controlling plant growth. Current Opinion in Plant Biology, 2010. 13(3): p. 274‐279.
27. Coombe, B. The grape berry as a sink. in VI International Symposium on Growth Regulators in
Fruit Production 239. 1988.
28. Moing, A., Sugar alcohols as carbohydrate reserves in some higher plants. Developments in
Crop Science, 2000. 26: p. 337‐358.
29. Lecourieux, F., C. Kappel, D. Lecourieux, A. Serrano, E. Torres, P. Arce‐Johnson, and S. Delrot,
An update on sugar transport and signalling in grapevine. Journal of Experimental Botany,
2014. 65(3): p. 821‐832.
30. Lastdrager, J., J. Hanson, and S. Smeekens, Sugar signals and the control of plant growth and
development. Journal of Experimental Botany, 2014. 65(3): p. 799‐807.
31. Cook, D., S. Fowler, O. Fiehn, and M.F. Thomashow, A prominent role for the CBF cold
response pathway in configuring the low‐temperature metabolome of Arabidopsis.
Proceedings of the National Academy of Sciences of the United States of America, 2004.
101(42): p. 15243‐15248.
32. Hare, P.D., W.A. Cress, and J. Van Staden, Dissecting the roles of osmolyte accumulation
during stress. Plant, Cell & Environment, 1998. 21(6): p. 535‐553.
33. Kaplan, F., J. Kopka, D.Y. Sung, W. Zhao, M. Popp, R. Porat, and C.L. Guy, Transcript and
metabolite profiling during cold acclimation of Arabidopsis reveals an intricate relationship of
cold‐regulated gene expression with modifications in metabolite content. The Plant Journal,
2007. 50(6): p. 967‐981.
34. Pillet, J., A. Egert, P. Pieri, F. Lecourieux, C. Kappel, J. Charon, E. Gomès, F. Keller, S. Delrot,
and D. Lecourieux, VvGOLS1 and VvHsfA2 are Involved in the Heat Stress Responses in
Grapevine Berries. Plant and Cell Physiology, 2012. 53(10): p. 1776‐1792.
35. Griesser, M., G. Weingart, K. Schoedl‐Hummel, N. Neumann, M. Becker, K. Varmuza, F.
Liebner, R. Schuhmacher, and A. Forneck, Severe drought stress is affecting selected primary
metabolites, polyphenols, and volatile metabolites in grapevine leaves (Vitis vinifera cv. Pinot
noir). Plant Physiology and Biochemistry, 2015. 88: p. 17‐26.
36. Grimplet, J., M.D. Wheatley, H.B. Jouira, L.G. Deluc, G.R. Cramer, and J.C. Cushman,
Proteomic and selected metabolite analysis of grape berry tissues under well‐watered and
water‐deficit stress conditions. Proteomics, 2009. 9(9): p. 2503‐2528.
63
37. Valluru, R. and W. Van den Ende, Myo‐inositol and beyond – Emerging networks under stress.
Plant Science, 2011. 181(4): p. 387‐400.
38. Brummer, Y. and S.W. Cui, Understanding Carbohydrate Analysis, in Food Carbohydrates.
2005, CRC Press.
39. Montilla, A., F.J. Moreno, and A. Olano, A Reliable Gas Capillary Chromatographic
Determination of Lactulose in Dairy Samples. Chromatographia, 2005. 62(5): p. 311‐314.
40. Montilla, A., A.I. Ruiz‐Matute, M.L. Sanz, I. Martínez‐Castro, and M.D. del Castillo, Difructose
anhydrides as quality markers of honey and coffee. Food Research International, 2006. 39(7):
p. 801‐806.
41. Morales, V., A. Olano, and N. Corzo, Ratio of Maltose to Maltulose and Furosine as Quality
Parameters for Infant Formula. Journal of Agricultural and Food Chemistry, 2004. 52(22): p.
6732‐6736.
42. Rymowicz, W., W. Kopec, and C.V. Stevens, Primary Production of Raw Materials, in
Renewable Bioresources. 2004.
43. Rudnik, E., Compostable polymer materials. 1st ed. 2008, Oxford ; Boston: Elsevier. xii, 211 p.
44. Smith, B.G., L.D. Melton, and R.E. Wrolstad, Plant Cell Wall Polysaccharides, in Food
Carbohydrate Chemistry. 2012, John Wiley & Sons Inc. p. 135‐146.
45. Thomas, S., S. Paul, L. Pothan, and B. Deepa, Natural fibres: structure, properties and
applications, in Cellulose Fibers: Bio‐and Nano‐Polymer Composites. 2011, Springer. p. 3‐42.
46. Bogolitsyna, A., M. Becker, A.‐L. Dupont, A. Borgards, T. Rosenau, and A. Potthast,
Determination of carbohydrate‐ and lignin‐derived components in complex effluents from
cellulose processing by capillary electrophoresis with electrospray ionization‐mass
spectrometric detection. Journal of Chromatography A, 2011. 1218(47): p. 8561‐8566.
47. Holmbom, B., A Procedure for Analysis of Toxic Compounds in Pulp and Paper‐Mill Waste‐
Waters. Paperi Ja Puu‐Paper and Timber, 1980. 62(9): p. 523‐531.
48. Niemelä, K., Gas‐Liquid Chromatography‐Mass Spectrometry Studies on Pine Kraft Black
Liquors .3. The Liberation of Carboxylic‐Acids in the Initial Phase of Pulping. Journal of
Chromatography, 1988. 446: p. 247‐252.
49. Koek, M.M., B. Muilwijk, M.J. van der Werf, and T. Hankemeier, Microbial metabolomics with
gas chromatography/mass spectrometry. Analytical Chemistry, 2006. 78(4): p. 1272‐81.
50. Peris‐Tortajada, M., Carbohydrates and starch, in Handbook of Food Analysis, Thirth Edition.
2015, CRC Press. p. 509‐533.
51. Wrolstad, R.E., Food Carbohydrate Chemistry. 2012: John Wiley & Sons Inc.
52. Powers, J.R., Application of Enzymes in Food Analysis, in Food Analysis. 2010, Springer US:
Boston, MA. p. 283‐299.
53. Henshall, A., Analysis of starch and other complex carbohydrates by liquid chromatography.
Cereal foods world (USA), 1996.
54. Medeiros, P.M. and B.R. Simoneit, Analysis of sugars in environmental samples by gas
chromatography‐mass spectrometry. Journal of Chromatography A, 2007. 1141(2): p. 271‐8.
55. Alvarez, J.G., Carbohydrates: HPLC Analysis, in Encyclopedia of Chromatography, Third
Edition. 2009, Taylor & Francis. p. 307‐309.
56. Cheng, C., H.‐R. Tsai, and K.‐C. Chang, On‐line cut‐off technique and organic modifier addition
aided signal enhancement for trace analysis of carbohydrates in cellulase hydrolysate by ion
exclusion chromatography–electrospray ionization mass spectrometry. Journal of
Chromatography A, 2006. 1119(1): p. 188‐196.
64
57. Bruggink, C., R. Maurer, H. Herrmann, S. Cavalli, and F. Hoefler, Analysis of carbohydrates by
anion exchange chromatography and mass spectrometry. Journal of Chromatography A,
2005. 1085(1): p. 104‐109.
58. Jager, A.V., F.G. Tonin, and M.F. Tavares, Comparative evaluation of extraction procedures
and method validation for determination of carbohydrates in cereals and dairy products by
capillary electrophoresis. Journal of separation science, 2007. 30(4): p. 586‐594.
59. Schmitz, O., Carbohydrates: CE Analysis, in Encyclopedia of Chromatography, Third Edition.
2009, Taylor & Francis. p. 303‐305.
60. Folkes, D. and M. Jordan, Mono‐and disaccharides: analytical aspects, in Carbohydrates in
Food ‐ 2nd ed., A.‐C. Eliasson, Editor. 2006, CRC Press.
61. Andersson, J.T., Detectors, in Practical Gas Chromatography: A Comprehensive Reference, K.
Dettmer‐Wilde and W. Engewald, Editors. 2014, Springer: Berlin, Heidelberg. p. 205‐248.
62. Bouchonnet, S., Introduction to GC‐MS Coupling. 2013: CRC Press.
63. Deepak, B. What are the Differences between GC and HPLC? 2014; Available from: http://lab‐
training.com/2014/04/02/what‐are‐the‐differences‐between‐gc‐and‐hplc/.
64. McNair, H.M. and J.M. Miller, Basic gas chromatography. 2011: John Wiley & Sons.
65. Molnar‐Perl, I., Simultaneous quantitation of acids and sugars by chromatography: gas or
high‐performance liquid chromatography? Journal of Chromatography A, 1999. 845(1‐2): p.
181‐195.
66. Drozd, J., Chemical derivatization in gas chromatography. Vol. 19. 1986: Elsevier.
67. Ruiz‐Matute, A.I., O. Hernandez‐Hernandez, S. Rodriguez‐Sanchez, M.L. Sanz, and I. Martinez‐
Castro, Derivatization of carbohydrates for GC and GC‐MS analyses. Journal of
Chromatography B, 2011. 879(17‐18): p. 1226‐40.
68. García‐Raso, A., M. Fernández‐Díaz, M.I. Páez, J. Sanz, and I. Martínez‐Castro, Gas
chromatographic retention of carbohydrate trimethylsilyl ethers. III. Ketohexoses. Journal of
Chromatography A, 1989. 471(C): p. 205‐216.
69. Andrews, M.A., Capillary gas‐chromatographic analysis of monosaccharides: improvements
and comparisons using trifluoroacetylation and trimethylsilylation of sugar O‐benzyl‐ and O‐
methyl‐oximes. Carbohydrate Research, 1989. 194: p. 1‐19.
70. Harvey, D.J., Derivatization of carbohydrates for analysis by chromatography; electrophoresis
and mass spectrometry. Journal of Chromatography B, 2011. 879(17): p. 1196‐1225.
71. Purdie, T. and J.C. Irvine, C.‐The alkylation of sugars. Journal of the Chemical Society,
Transactions, 1903. 83(0): p. 1021‐1037.
72. Haworth, W.N., III.—A new method of preparing alkylated sugars. Journal of the Chemical
Society, Transactions, 1915. 107: p. 8‐16.
73. Levery, S.B., Use of Permethylation with GC‐MS for Linkage and Sequence Analysis of
Oligosaccharides: Historical Perspectives and Recent Developments, in Glycopeptides and
Related Compounds: Synthesis, Analysis, and Applications, D.G. Large and C.D. Warren,
Editors. 1997, CRC Press.
74. Carpita, N.C. and E.M. Shea, Linkage structure of carbohydrates by gas chromatography‐mass
spectrometry (GC‐MS) of partially methylated alditol acetates. Analysis of Carbohydrates by
GLC and MS: p. 157‐216.
75. Kuhn, R., H. Trischmann, and I. Löw, Zur permethylierung von zuckern und glykosiden.
Angewandte Chemie, 1955. 67(1): p. 32‐32.
76. Kuhn, R., H.H. Baer, and A. Seeliger, Zur Methylierung Von N‐Acetylglucosamin‐Derivaten.
Justus Liebigs Annalen der Chemie, 1958. 611(1): p. 236‐241.

65
77. Hakomori, S.‐i., A rapid permethylation of glycolipid, and polysaccharide catalyzed by
methylsulfinyl carbanion in dimethyl sulfoxide. The Journal of Biochemistry, 1964. 55(2): p.
205‐208.
78. Ciucanu, I. and F. Kerek, A simple and rapid method for the permethylation of carbohydrates.
Carbohydrate research, 1984. 131(2): p. 209‐217.
79. Hirschlag, H. and R. Kӧster, Development of a solid‐phase extraction and derivatization
method for polar carboxylic acids from aqueous extracts of inorganic multi‐component
incineration residues. Fresenius J. Anal. Chem., 1998. 263: p. 274‐280.
80. Seyferth, D., A.W. Dow, H. Menzel, and T.C. Flood, Trimethylsilyldiazomethane and
Trimethylsilylcarbene. Journal of the American Chemical Society, 1968. 90(4): p. 1080‐1082.
81. Kühnel, E., D.D.P. Laffan, G.C. Lloyd‐Jones, T. Martínez del Campo, I.R. Shepperson, and J.L.
Slaughter, Mechanism of methyl esterification of carboxylic acids by
thrimethylsilyldiazomethane. Angew. Chem., 2007. 46: p. 7075‐7078.
82. Presser, A. and A. Hufner, Trimethylsilyldiazomethane ‐ A mild and efficient reagent for the
methylation of carboxylic acids and alcohols in natural products. Monatshefte für Chemie,
2004. 135(8): p. 1015‐1022.
83. Robinson, S., A. Routledge, and J. Thomas‐Oates, Characterisation and proposed origin of
mass spectrometric ions observed 30 Th above the ionised molecules of per‐O‐methylated
carbohydrates. Rapid communications in mass spectrometry, 2005. 19(24): p. 3681‐3688.
84. Gunner, S.W., J.K. Jones, and M.B. Perry, THE GAS‐LIQUID PARTITION CHROMATOGRAPHY OF
CARBOHYDRATE DERIVATIVES: PART I THE SEPARATION OF GLYCITOL AND GLYCOSE
ACETATES. Canadian Journal of Chemistry, 1961. 39(10): p. 1892‐1899.
85. VandenHeuvel, W. and E. Horning, Gas chromatographic separations of sugars and related
compounds as acetyl derivatives. Biochemical and biophysical research communications,
1961. 4(6): p. 399‐403.
86. Vilkas, M., M.G. Boussac, and M.M.‐C. Bonnard, Chromatographie en phase vapeur de sucres
a l'etat de trifluoracetates. Tetrahedron Letters, 1966. 7(14): p. 1441‐1446.
87. Matsuhisa, M., Y. Yamasaki, Y. Shiba, I. Nakahara, A. Kuroda, T. Tomita, M. Iida, M. Ikeda, Y.
Kajimoto, and M. Kubota, Important role of the hepatic vagus nerve in glucose uptake and
production by the liver. Metabolism, 2000. 49(1): p. 11‐16.
88. Hannestad, U. and A. Lundblad, Accurate and precise isotope dilution mass spectrometry
method for determining glucose in whole blood. Clinical Chemistry, 1997. 43(5): p. 794‐800.
89. Leloux, M.S., E.G. De Jong, and R.A. Maes, Improved screening method for beta‐blockers in
urine using solid‐phase extraction and capillary gas chromatography—mass spectrometry.
Journal of Chromatography B: Biomedical Sciences and Applications, 1989. 488(2): p. 357‐
367.
90. Pritchard, D.G. and W. Niedermeier, Sensitive gas chromatographic determination of the
monosaccharide composition of glycoproteins using electron capture detection. Journal of
Chromatography A, 1978. 152(2): p. 487‐494.
91. Chizhov, O.S., B.A. Dmitriev, B.M. Zolotarev, A.Y. Chernyak, and N.K. Kochetov, Mass spectra
of alditol trifluoroacetates. Organic Mass Spectrometry, 1969. 2(10): p. 947‐952.
92. Poole, C.F., W.F. Sye, S. Singhawangcha, F. Hsu, A. Zlatkis, A. Arfwidsson, and J. Vessman,
New Electron‐Capturing Pentafluorophenyldialkylchlorosilanes as Versatile Derivatizing
Reagents for Gas‐Chromatography. Journal of Chromatography A, 1980. 199(Oct): p. 123‐
142.
66
93. Evershed, R.P., Advances in silylation, in Handbook of derivatives for chromatography, 2nd
edn, K. Blau and J.M. Halket, Editors. 1993, Wiley: New York. p. 51–108.
94. Kataoka, H., 2.1.2. Gas chromatography of amines as various derivatives, in Journal of
Chromatography Library, M.‐P. Ibolya, Editor. 2005, Elsevier. p. 364‐404.
95. Pierce, A.E., Silylation of Organic Compounds: A Technique for Gasphase Analysis. 1968:
Pierce Chemical Company.
96. Sweeley, C.C., R. Bentley, M. Makita, and W.W. Wells, Gas‐Liquid Chromatography of
Trimethylsilyl Derivatives of Sugars and Related Substances. Journal of the American
Chemical Society, 1963. 85(16): p. 2497‐&.
97. Dejongh, D.C., T. Radford, J.D. Hribar, Hanessia.S, M. Bieber, G. Dawson, and C.C. Sweeley,
Analysis of Trimethylsilyl Derivatives of Carbohydrates by Gas Chromatography and Mass
Spectrometry. Journal of the American Chemical Society, 1969. 91(7): p. 1728‐&.
98. García‐Raso, A., I. Martínez‐Castro, M.I. Páez, J. Sanz, J. García‐Raso, and F. Saura‐Calixto, Gas
chromatographic behaviour of carbohydrate trimethylsilyl ethers. I. Aldopentoses. Journal of
Chromatography A, 1987. 398(C): p. 9‐20.
99. Garcia‐Raso, A., M.I. Paez, I. Martinez‐Castro, J. Sanz, and M.M. Calvo, Gas chromatographic
retention of carbohydrate trimethylsilyl ethers. IV. Disaccharides. Journal of Chromatography
A, 1992. 607(2): p. 221‐225.
100. Haverkamp, J., J.P. Kamerling, and J.F.G. Vliegenthart, Gas‐liquid chromatography of
trimethylsilyl disaccharides. Journal of Chromatography A, 1971. 59(2): p. 281‐287.
101. Kakehi, K. and S. Honda, Silyl ethers of carbohydrates. Analysis of Carbohydrates by GLC and
MS, 1989: p. 43‐85.
102. Martínez‐Castro, I., M.I. Páez, J. Sanz, and A. García‐Raso, Gas chromatographic behaviour of
carbohydrate trimethylsilyl ethers. II. Aldohexoses. Journal of Chromatography A, 1989. 462:
p. 49‐60.
103. Butts, W.C., Two‐column gas chromatography of trimethylsilyl derivatives of biochemically
significant compounds. Analytical biochemistry, 1972. 46(1): p. 187‐199.
104. Stalling, D.L., C.W. Gehrke, and R.W. Zumwalt, A New Silylation Reagent for Amino Acids Bis
(Trimethylsilyl) Trifluoracetamide (Bstfa). Biochemical and Biophysical Research
Communications, 1968. 31(4): p. 616‐&.
105. Gehrke, C.W. and K. Leimer, Trimethylsilylation of amino acids derivatization and
chromatography. Journal of Chromatography A, 1971. 57: p. 219‐238.
106. Tallent, W. and R. Kleiman, Bis (trimethylsilyl) acetamide in the silylation of lipolysis products
for gas‐liquid chromatography. Journal of lipid research, 1968. 9(1): p. 146‐148.
107. Makita, M. and W.W. Wells, Quantitative analysis of fecal bile acids by gas‐liquid
chromatography. Analytical Biochemistry, 1963. 5(6): p. 523‐530.
108. Zhang, Z., A. Hibberd, and J. Zhou, Optimisation of derivatisation for the analysis of
estrogenic compounds in water by solid‐phase extraction gas chromatography–mass
spectrometry. Analytica Chimica Acta, 2006. 577(1): p. 52‐61.
109. Mason, P.S. and E.D. Smith, A Quantitative Study of Reagents and Procedures for Synthesis of
Trimethylsilyl Derivatives. Journal of Gas Chromatography, 1966. 4(11): p. 398‐&.
110. Anumula, K.R. and P.B. Taylor, A Comprehensive Procedure for Preparation of Partially
Methylated Alditol Acetates from Glycoprotein Carbohydrates. Analytical Biochemistry, 1992.
203(1): p. 101‐108.
111. Held, I., A. Villinger, and H. Zipse, The stability of acylpyridinium cations and their relation to
the catalytic activity of pyridine bases. Synthesis, 2005(9): p. 1425‐1430.
67
112. Chaudhary, S. and O. Hernandez, 4‐Dimethylaminopyridine: an efficient and selective catalyst
for the silylation of alcohols. Tetrahedron Letters, 1979. 20(2): p. 99‐102.
113. Kochetkov, N.K. and C.O. S., Mass spectrometry of carbohydrates, in Methods in
Carbohydrate Chemistry. Vol. VI: General Carbohydrate Methods., R.L. Whistler and J.N.
BeMiller, Editors. 1972, Academic Press: New York. p. 540‐554.
114. Adams, M.A., Z.L. Chen, P. Landman, and T.D. Colmer, Simultaneous determination by
capillary gas chromatography of organic acids, sugars, and sugar alcohols in plant tissue
extracts as their trimethylsilyl derivatives. Analytical Biochemistry, 1999. 266(1): p. 77‐84.
115. Bartolozzi, F., G. Bertazza, D. Bassi, and G. Cristoferi, Simultaneous determination of soluble
sugars and organic acids as their trimethylsilyl derivatives in apricot fruits by gas‐liquid
chromatography. Journal of Chromatography A, 1997. 758(1): p. 99‐107.
116. Katona, Z.F., P. Sass, and I. Molnar‐Perl, Simultaneous determination of sugars, sugar
alcohols, acids and amino acids in apricots by gas chromatography‐mass spectrometry.
Journal of Chromatography A, 1999. 847(1‐2): p. 91‐102.
117. Fuzfai, Z., Z.F. Katona, E. Kovacs, and I. Molnar‐Perl, Simultaneous identification and
quantification of the sugar, sugar alcohol, and carboxylic acid contents of sour cherry, apple,
and ber fruits, as their trimethylsilyl derivatives, by gas chromatography‐mass spectrometry.
Journal of Agricultural and Food Chemistry, 2004. 52(25): p. 7444‐7452.
118. Willför, S., A. Pranovich, T. Tamminen, J. Puls, C. Laine, A. Suurnakki, B. Saake, K. Uotila, H.
Simolin, J. Hemming, and B. Holmbom, Carbohydrate analysis of plant materials with uronic
acid‐containing polysaccharides‐A comparison between different hydrolysis and subsequent
chromatographic analytical techniques. Industrial Crops and Products, 2009. 29(2‐3): p. 571‐
580.
119. Mejanelle, P., J. Bleton, A. Tchapla, and S. Goursaud, Chapter 24 Gas chromatography‐mass
spectrometric analysis of monosaccharides after methanolysis and trimethylsilylation.
Potential for the characterization of substances of vegetal origin: Application to the study of
museum objects, in Journal of Chromatography Library, R. Ziad El, Editor. 2002, Elsevier. p.
845‐902.
120. Sundberg, A., A.V. Pranovich, and B. Holmbom, Chemical characterization of various types of
mechanical pulp fines. Journal of Pulp and Paper Science, 2003. 29(5): p. 6.
121. Sundberg, A., K. Sundberg, C. Lillandt, and B. Holmbom, Determination of hemicelluloses and
pectins in wood and pulp fibres by acid methanolysis and gas chromatography. Nordic Pulp
and Paper Research Journal, 1996. 11(4): p. 216‐219+226.
122. Bertaud, F., A. Sundberg, and B. Holmbom, Evaluation of acid methanolysis for analysis of
wood hemicelluloses and pectins. Carbohydrate Polymers, 2002. 48(3): p. 319‐324.
123. Savary, B. and A. Nunez, Gas chromatography–mass spectrometry method for determining
the methanol and acetic acid contents of pectin using headspace solid‐phase microextraction
and stable isotope dilution. Journal of Chromatography A, 2003. 1017(1‐2): p. 151‐159.
124. Willför, S., A. Sundberg, A. Pranovich, and B. Holmbom, Polysaccharides in some industrially
important hardwood species. Wood Science and Technology, 2005. 39(8): p. 601‐617.
125. Huang, Y., L. Indrarti, J. Azuma, and K. Okamura, Simultaneous Determination of Xylose and
Uronic‐Acid in Beech Xylan by Methanolysis. Mokuzai Gakkaishi, 1992. 38(12): p. 1168‐1171.
126. Horvath, K. and I. Molnar‐Perl, Simultaneous GC‐MS quantitation of o‐phosphoric, aliphatic
and aromatic carboxylic acids, proline, hydroxymethylfurfurol and sugars as their TMS
derivatives: In honeys. Chromatographia, 1998. 48(1‐2): p. 120‐126.
68
127. Senila, L., A. Gog, M. Senila, C. Roman, and L. Silaghi‐Dumitrescu, Development of a GC‐MS
method for 5‐hydroxymethylfurfural determination in wood after steam‐explosion
pretreatment. Revista de Chimie, 2012. 63(6): p. 559‐563.
128. Proestos, C., I. Boziaris, G.‐J. Nychas, and M. Komaitis, Analysis of flavonoids and phenolic
acids in Greek aromatic plants: Investigation of their antioxidant capacity and antimicrobial
activity. Food Chemistry, 2006. 95(4): p. 664‐671.
129. Fuzfai, Z. and I. Molnarperl, Gas chromatographic–mass spectrometric fragmentation study
of flavonoids as their trimethylsilyl derivatives: Analysis of flavonoids, sugars, carboxylic and
amino acids in model systems and in citrus fruits. Journal of Chromatography A, 2007.
1149(1): p. 88‐101.
130. Molnar‐Perl, I. and Z.F. Katona, GC‐MS of amino acids as their trimethylsilyl/t‐
butyldimethylsilyl derivatives: in model solutions III. Chromatographia, 2000. 51(1): p. S228‐
S236.
131. Laine, C., T. Tamminen, A. Vikkula, and T. Vuorinen, Methylation analysis as a tool for
structural analysis of wood polysaccharides. Holzforschung, 2002. 56(6): p. 607‐614.
132. Amelung, W., M.V. Cheshire, and G. Guggenberger, Determination of neutral and acidic
sugars in soil by capillary gas‐liquid chromatography after trifluoroacetic acid hydrolysis. Soil
Biology & Biochemistry, 1996. 28(12): p. 1631‐1639.
133. Levene, P.A. and E.T. Stiller, Acetone Derivatives of D‐Ribose. Journal of Biological Chemistry,
1933. 102(1): p. 187‐201.
134. Freudenberg, K., W. Dürr, and H. von Hochstetter, Zur Kenntnis der Aceton‐Zucker, XIII.: Die
Hydrolyse einiger Disaccharide, Glucoside und Aceton‐Zucker. Berichte der deutschen
chemischen Gesellschaft (A and B Series), 1928. 61(8): p. 1735‐1743.
135. De Jongh, D.C. and K. Biemann, Mass spectra of O‐isopropylidene derivatives of pentoses and
hexoses. Journal of the American Chemical Society, 1964. 86(1): p. 67‐74.
136. Morgenlie, S., Analysis of mixtures of the common aldoses by gas chromatography‐mass
spectrometry of their O‐isopropylidene derivatives. Carbohydrate Research, 1975. 41(1): p.
285‐289.
137. Morgenlie, S., Gas chromatography‐mass spectrometry of hexuloses and pentuloses as their
O‐isopropylidene derivatives: analysis of product mixtures from triose aldol‐condensations.
Carbohydrate Research, 1980. 80(2): p. 215‐222.
138. Blau, K. and J.M. Halket, Handbook of Derivatives for Chromatography. 1993, Wiley, New
York.
139. Sawardeker, J.S., J.H. Sloneker, and A. Jeanes, Quantitative Determination of
Monosaccharides as Their Alditol Acetates by Gas Liquid Chromatography. Analytical
Chemistry, 1965. 37(12): p. 1602‐1604.
140. Blakeney, A.B., P.J. Harris, R.J. Henry, and B.A. Stone, A simple and rapid preparation of
alditol acetates for monosaccharide analysis. Carbohydrate Research, 1983. 113(2): p. 291‐
299.
141. Fox, A., S.L. Morgan, and J. Gilbart, Preparation of alditol acetates and their analysis by gas
chromatography (GC) and mass spectrometry (MS). Analysis of Carbohydrates by GLC and
MS, 1989: p. 87‐117.
142. Urbani, R., S. Paola, G. Pletikapić, T.M. Radić, V. Svetličić, and V. Žutić, Diatom
Polysaccharides: Extracellular Production, Isolation and Molecular Characterization, in The
Complex World of Polysaccharides. 2012, InTech.
69
143. McGinnis, G.D., Preparation of aldononitrile acetates using N‐methylimidazole as catalyst
and solvent. Carbohydrate Research, 1982. 108(2): p. 284‐292.
144. Matsui, M., M. Okada, T. lmanari, and Z. Tamura, Gas chromatography of trifluoroacetyl
derivatives of alditols and trimethylsilyl derivatives of aldonolactones. Chemical and
Pharmaceutical Bulletin, 1968. 16(7): p. 1383‐1387.
145. Walla, M.D., P.Y. Lau, S.L. Morgan, A. Fox, and A. Brown, Capillary gas chromatography‐mass
spectrometry of carbohydrate components of legionellae and other bacteria. Journal of
Chromatography A, 1984. 288: p. 399‐413.
146. Neeser, J.R. and T.F. Schweitzer, Analysis of carbohydrates as o‐alkyloxime derivatives by gas‐
liquid chromatography (GLC), in Analysis of Carbohydrates by GLC and MS. 1989, CRC Boca
Raton, FL. p. 143‐156.
147. Steinberg, P. and A. Fox, Automated derivatization instrument: Preparation of alditol acetates
for analysis of bacterial carbohydrates using gas chromatography/mass spectrometry.
Analytical chemistry, 1999. 71(9): p. 1914‐1917.
148. Brunton, N., T. Gormley, and B. Murray, Use of the alditol acetate derivatisation for the
analysis of reducing sugars in potato tubers. Food chemistry, 2007. 104(1): p. 398‐402.
149. Englyst, H.N. and J.H. Cummings, Simplified method for the measurement of total non‐starch
polysaccharides by gas‐liquid chromatography of constituent sugars as alditol acetates.
Analyst, 1984. 109(7): p. 937‐942.
150. Crowell, E.P. and B.B. Burnett, Determination of the carbohydrate composition of wood pulps
by gas chromatography of the alditol acetates. Analytical Chemistry, 1967. 39(1): p. 121‐124.
151. Björndal, H., B. Lindberg, and S. Svensson, Mass spectrometry of partially methylated alditol
acetates. Carbohydrate Research, 1967. 5(4): p. 433‐440.
152. McGinnis, G.D. and C.J. Biermann, Analysis of monosaccharides as per‐O‐acetylated
aldononitrile (PAAN) derivatives by gas–liquid chromatography (GLC), in Analysis of
carbohydrates by GLC and MS. 1989, CRC Press, Inc. Boca Raton, Florida. p. 119‐125.
153. Lance, D. and J. Jones, Gas chromatography of derivatives of the methyl ethers of d‐xylose.
Canadian Journal of Chemistry, 1967. 45(17): p. 1995‐1998.
154. Chen, C.C. and G.D. McGinnis, The use of 1‐methylimidazole as a solvent and catalyst for the
preparation of aldononitrile acetates of aldoses. Carbohydrate Research, 1981. 90(1): p. 127‐
130.
155. Guerrant, G.O. and C.W. Moss, Determination of monosaccharides as aldononitrile, O‐
methyloxime, alditol, and cyclitol acetate derivatives by gas chromatography. Analytical
Chemistry, 1984. 56(4): p. 633‐638.
156. Seymour, F.R., S.L. Unruh, and D.A. Nehlich, Quantitation of free sugars in plant tissue by Glc
of their peracetylated aldononitrile and ketoxime derivatives. Carbohydrate research, 1989.
191(2): p. 175‐189.
157. Jackson, L.K., M.E. Slodki, R.D. Plattner, K.A. Burton, and M.C. Cadmus, Capsular and
extracellular polysaccharides from Rhizobium microsymbionts of Acacia decurrens.
Carbohydrate Research, 1982. 110(2): p. 267‐276.
158. Lawrence, J.F. and J.R. Iyengar, Gas chromatographic determination of polysaccharide gums
in foods after hydrolysis and derivatization. Journal of Chromatography A, 1985. 350: p. 237‐
244.
159. Ye, F., X. Yan, J. Xu, and H. Chen, Determination of aldoses and ketoses by GC‐MS using
differential derivatisation. Phytochemical Analysis, 2006. 17(6): p. 379‐383.

70
160. Zhang, W., H. He, and X. Zhang, Determination of neutral sugars in soil by capillary gas
chromatography after derivatization to aldononitrile acetates. Soil Biology and Biochemistry,
2007. 39(10): p. 2665‐2669.
161. Lehrfeld, J., Separation of Some Perbenzoylated Carbohydrates by High‐Performance Liquid‐
Chromatography. Journal of Chromatography A, 1976. 120(1): p. 141‐147.
162. Laine, R.A. and C.C. Sweeley, O‐methyl oximes of sugars. Analysis as O‐trimethylsilyl
derivatives by gas‐liquid chromatography and mass spectrometry. Carbohydrate Research,
1973. 27(1): p. 199‐213.
163. Mason, B.S. and H.T. Slover, A gas chromatographic method for the determination of sugars
in foods. Journal of Agricultural and Food Chemistry, 1958. 6(6): p. 551‐554.
164. Fiehn, O., J. Kopka, R.N. Trethewey, and L. Willmitzer, Identification of uncommon plant
metabolites based on calculation of elemental compositions using gas chromatography and
quadrupole mass spectrometry. Analytical Chemistry, 2000. 72(15): p. 3573‐3580.
165. Funcke, W. and C. von Sonntag, Syn and Anti Forms of Some Monosaccharide O‐Methyl
Oximes ‐ C‐13‐Nmr and Glc Study. Carbohydrate Research, 1979. 69(Mar): p. 247‐251.
166. Snyder, J.R., An Nmr Investigation of the Aldopentose Oximes. Carbohydrate Research, 1990.
198(1): p. 1‐13.
167. Petersson, G., Gas‐chromatographic analysis of sugars and related hydroxy acids as acyclic
oxime and ester trimethylsilyl derivatives. Carbohydrate Research, 1974. 33(1): p. 47‐61.
168. Chalmers, R.A. and R.W.E. Watts, Derivatives for Identification and Quantitative‐
Determination of Some Keto and Aldo‐Carboxylic Acids by Gas‐Liquid Chromatography.
Analyst, 1972. 97(1161): p. 951‐957.
169. Rumpel, C. and M.F. Dignac, Chromatographic analysis of monosaccharides in a forest soil
profile: Analysis by gas chromatography after trifluoroacetic acid hydrolysis and reduction‐
acetylation. Soil Biology & Biochemistry, 2006. 38(6): p. 1478‐1481.
170. Schweer, H., Gas Chromatography‐Mass Spectrometry of Aldoses as O‐Methoxime, O‐2‐
Methyl‐2‐Propoxime and O‐Normal‐Butoxime Pertrifluoroacetyl Derivatives on Ov‐225 with
Methylpropane as Ionization Agent .1. Pentoses. Journal of Chromatography, 1982. 236(2): p.
355‐360.
171. Bose, S.K., V.A. Barber, E.F. Alves, D.J. Kiemle, A.J. Stipanovic, and R.C. Francis, An improved
method for the hydrolysis of hardwood carbohydrates to monomers. Carbohydrate Polymers,
2009. 78(3): p. 396‐401.
172. Becker, M., T. Zweckmair, A. Forneck, T. Rosenau, A. Potthast, and F. Liebner, Evaluation of
different derivatisation approaches for gas chromatographic‐mass spectrometric analysis of
carbohydrates in complex matrices of biological and synthetic origin. Journal of
Chromatography A, 2013. 1281: p. 115‐26.
173. Massiot, D., F. Fayon, M. Capron, I. King, S. Le Calvé, B. Alonso, J.‐O. Durand, B. Bujoli, Z. Gan,
and G. Hoatson, Modelling one‐ and two‐dimensional solid‐state NMR spectra. Magnetic
Resonance in Chemistry, 2002. 40(1): p. 70‐76.
174. Larsson, P.T., K. Wickholm, and T. Iversen, A CP/MAS13C NMR investigation of molecular
ordering in celluloses. Carbohydrate Research, 1997. 302(1–2): p. 19‐25.
175. Kelly, D.R., S.C. Baker, D.S. King, D.S. de Silva, G. Lord, and J.P. Taylor, Studies of nitrile oxide
cycloadditions, and the phenolic oxidative coupling of vanillin aldoxime by Geobacillus sp.
DDS012 from Italian rye grass silage. Organic & Biomolecular Chemistry, 2008. 6(4): p. 787‐
796.
71
176. Strlič, M., I.K. Cigić, A. Možir, D. Thickett, G. De Bruin, J. Kolar, and M. Cassar, Test for
Compatibility with Organic Heritage materials ‐ A Proposed Procedure. e‐Preservation
Science, 2010. 7: p. 78‐86
177. Rohrling, J., A. Potthast, T. Rosenau, T. Lange, G. Ebner, H. Sixta, and P. Kosma, A novel
method for the determination of carbonyl groups in cellulosics by fluorescence labeling. 1.
Method development. Biomacromolecules, 2002. 3(5): p. 959‐68.
178. Rohrling, J., A. Potthast, T. Rosenau, T. Lange, A. Borgards, H. Sixta, and P. Kosma, A novel
method for the determination of carbonyl groups in cellulosics by fluorescence labeling. 2.
Validation and applications. Biomacromolecules, 2002. 3(5): p. 969‐75.
179. Oberlerchner Josua, T., S. Böhmdorfer, T. Rosenau, and A. Potthast, A matrix‐resistant HPTLC
method to quantify monosaccharides in wood‐based lignocellulose biorefinery streams, in
Holzforschung. 2018. p. 645.
72
List of Figures
Figure 1: D‐glucose forms five different epimers in solution with a specific equilibrium distribution
(brackets). According to [14], modified. ....................................................................................... 4
Figure 2: Monosaccharide linkage of the non‐reducing disaccharide sucrose (α‐D‐glucopyranosyl‐
(12)‐β‐D‐fructofuranoside) and the reducing disaccharide cellobiose (β‐D‐glucopyranosyl‐
(14)‐D‐glucopyranose). .............................................................................................................. 6
Figure 3: The approximate analyte polarity and molecular mass (Mr) ranges for GC‐MS, LC‐MS, and
MALDI indicating some desired effects of chemical derivatization. A: derivatization for GC‐MS,
B: derivatization for ESI and MALDI (EI, CI, ES, MALDI; LD). Source: Reproduced from Zaikin and
Halket, 2009, with permission. ................................................................................................... 15
Figure 4: Etherification reaction of glucose using methyl iodide and silver oxide as a catalyst to form
permethylated glucose (2,3,4,6‐tetra‐O‐methyl‐D‐glucopyranose) [71]. ................................... 20
Figure 5: Acylation of a hydroxyl group using N‐methyl‐bis(trifluoroacetamide (MBTFA) reagent,
according to [10]. ........................................................................................................................ 22
Figure 6: Silylation reaction of a hydroxyl group using N,O‐bis(trimethylsilyl)trifluoroacetamide
(BSTFA), according to Gerhke and Leimer [105] and Tallent and Kleiman [106]. ....................... 24
Figure 7: The catalytic function of pyridine for silylation of hydroxyl groups, according to Held et al.
[111]. ........................................................................................................................................... 24
Figure 8: The catalytic reaction of 4‐dimethylamino pyridine (DMAP) for silylation of hydroxyl groups,
according to Chaudhary and Hernandez [112]. .......................................................................... 25
Figure 9: O‐Isopropylidenation of α‐D‐glucofuranose form 1,2:5,6‐di‐O‐isopropylidene‐D‐
glucofuranose, according to [22, 133, 135]. ............................................................................... 27
Figure 10: Formation of alditol acetate derivatives, according to the original method described by
Gunner et al. [84] and applied by Urbani et al. [142]. ................................................................ 29
Figure 11: Derivatization reaction of the formation of per‐acetylated aldononitriles (PAAN) from α‐D‐
glucopyranose (aldoses), according to [152], modified. ............................................................. 31
Figure 12: General reaction scheme for the derivatization of carbonyls to oximes. ............................ 32
Figure 13: Derivatization of glucose: (1) converting glucose in the corresponding syn‐ and anti‐O‐
methyloxime isomers by methoxyamine hydrochloride (CH3ONH2 ∙ HCl) and subsequently
trimethyl‐silylation. ..................................................................................................................... 33
Figure 14: Number of compounds identified within the different compound classes of the bleaching
effluents analytes, according to various GC‐MS derivatization approaches. ............................. 45
Figure 15: Gas chromatograms with MS detection of a mixture of 46 carbohydrates and
carbohydrate‐derived compounds converted to different derivatization products. ................. 48
Figure 16: Retention time of syn peaks (■) and retention time shift (●) between the syn peak and
corresponding anti peak or peak 1 and peak 2 of different EtOx‐TMS derivatized
carbohydrates. ............................................................................................................................ 49
Figure 17: Released carbohydrates by acid methanolysis (total amount, glucose and xylose) of
untreated, electron beam (e‐beam) treatment (eucalyptus and hemp paper pulps: 120 kGy,
and rag paper: 60 kGy) and artificial aged cellulose samples. .................................................... 52
Figure 18: Samples of storage materials in headspace vials for emission analysis. .............................. 55

73
Appendix
74
Paper I Determination of carbohydrate‐ and lignin‐derived
components in complex effluents from cellulose processing by
capillary electrophoresis with electrospray ionization‐mass
spectrometric detection.
Journal of Chromatography A, vol. 1218, pp. 8561‐8566.
Bogolitsyna, A.; Becker, M.; Dupont, A.‐L.; Borgards, A.; Rosenau, T.; Potthast, A. (2011)
Dee
ATa
Vb
c
a
ARR2AA
KCsCLPP
1
timlaTsf
mba
0d
Journal of Chromatography A, 1218 (2011) 8561– 8566
Contents lists available at SciVerse ScienceDirect
Journal of Chromatography A
jou rn al h om epage: www.elsev ier .com/ locat e/chroma
etermination of carbohydrate- and lignin-derived components in complexffluents from cellulose processing by capillary electrophoresis withlectrospray ionization-mass spectrometric detection
nna Bogolitsynaa, Manuel Beckera, Anne-Laurence Dupontb, Andrea Borgardsc,homas Rosenaua, Antje Potthasta,∗
Department of Chemistry and Christian Doppler Laboratory “Advanced cellulose chemistry and analytics”, University of Natural Resources and Life Sciences, Muthgasse 18, A-1190ienna, AustriaCentre de recherches sur la conservation des collections, Muséum national d’Histoire naturelle, CNRS USR 3224, 36, rue Geoffroy-Saint-Hilaire, F-75005 Paris, FranceProcess Innovation, Lenzing AG, A-4860 Lenzing, Austria
r t i c l e i n f o
rticle history:eceived 30 May 2011eceived in revised form2 September 2011ccepted 23 September 2011vailable online 29 September 2011
eywords:apillary electrophoresis-mass
a b s t r a c t
Degradation products from lignocellulosic materials receive increasing attention due to the continuouslygrowing interest in their utilization. The inherent structural variance of lignocellulosics combined withthe intricacy of lignocellulosic processing (e.g. pulping of wood and bleaching of cellulosic pulps) and thecomplexity of degradation processes occurring therein result in rather complex mixtures in the processstreams and effluents that contain a large quantity of structurally different degradation products. This istrue for most processing steps, but also for degradation reactions occurring during aging of lignocellulosicmaterials, such as paper, cellulosic tissue or textiles. In order to render such mixtures better analyticallyaccessible than hitherto possible a CE-ESI-MS method was established for the simultaneous determina-
pectrometryarboxylic acidsignocellulosesulp bleaching effluentaper aging
tion of aliphatic carboxylic acids from the degradation of (hemi)celluloses and aromatic compounds fromlignin degradation. CE and ESI-MS parameters have been optimized towards sensitivity and good repro-ducibility. The method was tested in two real-world scenarios: the determination of major componentsin effluents from bleaching stages in the pulp and paper industry, and the analysis of degradation prod-ucts in extracts of naturally aged papers. The advantages and drawbacks of this approach are criticallydiscussed.
© 2011 Elsevier B.V. All rights reserved.
. Introduction
The analysis of lignocellulose degradation and identification ofhe products formed from these materials are still posing analyt-cal challenges, especially due to the complexity of the reaction
ixtures. This applies to nearly all byproduct streams in lignocel-ulose processing, no matter whether related to “classical” pulpnd paper processing or to more recent biorefinery scenarios.
he degradation products in industrial effluents after differentteps of pulp bleaching have large similarities to the productsound in extracts of aged paper. The mixtures of degradationAbbreviations: CE, capillary electrophoresis; ESI-MS, electrospray ionization-ass spectrometry; GC–MS, gas chromatography–mass spectrometry; BGE,
ackground electrolyte; LMM, low molecular mass; MT, migration time; PA, peakrea.∗ Corresponding author. Tel.: +43 1 47654 6071; fax: +43 1 47654 6059.
E-mail address: [email protected] (A. Potthast).
021-9673/$ – see front matter © 2011 Elsevier B.V. All rights reserved.oi:10.1016/j.chroma.2011.09.063
products of low-molecular weight carbohydrates under stronglyalkaline, alkaline-oxidative or acidic-oxidative conditions arecomplex, being formed by superposition of multiple fragmentation,rearrangement, and condensation reactions. These carbohydrate-derived products come along with fragmentation products of(residual) lignin. In the pulp and paper industries, such degrada-tion products contribute significantly to the spent liquor streams,and hence also to the corresponding organic effluent load (totalorganic carbon). Degradation reactions similar to those enforcedduring the pulp bleaching stages by drastic reaction environmentsare proceeding also under ambient conditions over longer timesupon natural or artificially accelerated paper aging. Also here, car-bohydrates and lignins are fragmented and degraded into verycomplex compound mixtures. Degradation processes in paper aredetermined by numerous factors including the material of the
paper (fiber type, sizing, fillers, etc.) as well as storage condi-tions (temperature, relative humidity, acids, pollutants, etc.). As aresult of such degradation, mechanical and optical properties ofpaper can suffer dramatically [1]. More detailed information on the
8 matog
dgad
aadrei(Tv[l[
eoaIamT[
slbvpc[imta
anmno(pdp
2
2
wS
ai((aatpt
562 A. Bogolitsyna et al. / J. Chro
egradation mechanisms and the reaction products formed is ofreat significance for a suitable conservation treatment of papernd in summary for the general understanding of lignocelluloseegradation.
For the separation of degradation products of (hemi)celluloses,n analytical methodology is required which shows high sensitivitynd robustness as well as the ability to simultaneously determineegradation products of both carbohydrates and lignin. The task isendered even more complicated by the complexity in case of efflu-nt mixtures, the matrix and the rather low concentrations of itsndividual components. Gas chromatography/mass spectrometryGC–MS) is often applied for the analysis of such complex mixtures.his method requires preliminary sample derivatization to produceolatile analytes, e.g. by esterification, etherification, silylation, etc.2–4]. This is not only a time-consuming procedure, but might effectosses during sample preparation, and cause discrimination effects5–7].
In the recent years capillary electrophoresis (CE) has beenstablished as a fast and suitable method for both the analysisf carbohydrates, their degradation products (aliphatic carboxyliccids) and the determination of phenolic and aromatic compounds.t provides short analysis times and, at the same time, high sep-ration efficiencies without a preliminary derivatization step. Inost cases UV-detection is applied after separation by CE [8–11].
his method was used to study effluents of pulping woody biomass12–14], which offers complex matrices.
Hyphenation to MS provides more information on the actualtructures of the analytes. CE-MS was applied for the analysis ofow molecular mass carboxylic acids in atmospheric particles [7],everages [5,15], biological fluids [16,17], urban atmosphere andehicle emissions [6]. CE-MS was used further for the analysis ofhenolic compounds (with similar structures to the lignin-derivedompounds) in biomass pyrolysis and burning [18], virgin olive oil19,20], walnut [21] and atmospheric aerosols [22]. Pulp bleach-ng effluents and celluloses aging extracts have been studied by CE
uch less extensively, since due to dilution effects of the processhe overall concentrations – at similarly complex compositions –re significantly lower.
In this study, we would like to communicate our efforts towards CE-MS-based analytical technique for the simultaneous determi-ation of carbohydrate-derived reaction products, such as aliphaticono- and di-carboxylic acids and hydroxy-acids, as well as phe-
olic lignin-fragments in effluents of pulp bleaching and extractsf aged paper artifacts. Together with our parallel study onhemi)cellulose and lignin degradation products in artificially agedapers [23], this is the first report on a MS-hyphenated method forirect analysis of the complex pulp bleaching effluents and agedaper extracts.
. Materials and methods
.1. Chemicals
All chemicals were of the highest purity available and were usedithout further purification. Ultrahigh quality water (HPLC grade,
igma–Aldrich) was used for all aqueous solutions.The chemicals were obtained from the following suppliers:
mmonium formate (97%), ammonium hydroxide solution (≥25%n water) and sodium hydroxide (≥98%) from Sigma–Aldrich–FlukaSchnelldorf, Germany), 2-propanol (99.9%) from Fisher ScientificGermany). All the model compounds (either as the free acids ors their sodium salts) were obtained from Sigma–Aldrich–Fluka,
t a purity of 97% or better except lactic acid (90%). Stock solu-ions of each model compound with a concentration of 1 g/l wererepared in deionized water and stored at 4 ◦C. Solid phase extrac-ion cartridges SupelTM-Select HLB SPE 1 g/20 ml were purchasedr. A 1218 (2011) 8561– 8566
from Supelco (Bellefonte, PA, USA). Phenex polytetrafluoroethy-lene (PTFE) syringe filters with pore size of 0.2 and 0.45 �m andvarious diameters were supplied by Phenomenex (Aschaffenburg,Germany).
2.2. Sample preparation
2.2.1. Pulp bleaching effluentsThe pulp bleaching effluent sample was obtained from com-
bined effluents of a totally chlorine free (TCF) bleaching ofhardwood sulfite pulp, prior to the biological effluent treatment,from Lenzing AG, Lenzing, Austria. The sample was stored at 4 ◦Cand was warmed to room temperature before sample preparation,which started with vacuum filtration through 0.4 �m membranefilters. As the concentration of analytes was too low for thedirect analysis, effluent samples were concentrated by solid-phaseextraction (SPE) according the following procedure [24]: the SPEcartridge was conditioned with 10 ml methanol and 10 ml ofdeionized water, 200 ml of sample was loaded with 1 drop persecond. Salts are not retained on the SPE cartridge, which thusallows the separation of organic analytes from salts in the load-ing step. Carboxylic acids were eluted from the cartridge with amethanol/acetonitrile mixture (v/v = 1:1). The organic solvent wasremoved in vacuum under exclusion of oxygen, and the samplewas redissolved in deionized water. This removes long-chain car-boxylic acids in amounts according to their solubility in water[25]: acids with up to 10–12 carbon atoms are still in the sam-ple, larger ones are completely removed. This step is necessaryto protect the separation capillary from clogging. Evaporation ofthe organic solvent did not cause changes in the analyte compo-sition which was proved by GC–MS analyses of silylated samplesbefore and after the treatment (recovery above 90%). Prior toinjection, the sample was filtered through a 0.2 �m membranefilter.
2.2.2. Aged paper extractsAqueous extracts from an old book and aged papers were pre-
pared as follows: 17 g of air dry book paper were extracted in 230 mlof deionized water containing 10% methanol for 45 h. The extractwas brought to a volume of about 25 ml by freeze-drying and wasfiltered through a 0.2 �m membrane filter prior to injection.
Characteristics of the book paper: publication year 1924, brit-tle paper, double fold number: 2. The weighted average molecularweight (Mw) of the cellulose as determined by GPC in DMAc/LiCl[26] was between 100 and 120 kg/mol.
2.3. CE-ESI-MS
CE-MS analysis was performed on a G1600 Agilent capil-lary electrophoresis system (Agilent Technologies, Waldbronn,Germany) in combination with an Agilent 6320 series ion trap massspectrometer equipped with an Agilent CE-ESI-MS sprayer (Agi-lent Technologies). For separation, a fused-silica capillary (AgilentTechnologies) with a total length of 60 cm and an inner diameterof 50 �m was used. For maintaining constant performance overtime, the capillary was flushed daily with 0.1 M sodium hydroxidefor 10 min, water for 10 min and background electrolyte (BGE) for5 min. Between the actual runs, the capillary was preconditionedby flushing 5 min with water and 5 min with BGE. BGE and sampleswere filtered through 0.2 �m membranes. Hydrodynamic injec-tion was used at 50 mbar for 10 s followed by injection of buffer
at 50 mbar for 5 s. The separation voltage was 20 kV, the resultingcurrent was 20 �A. The capillary was thermostated at 25 ◦C.The sheath liquid was delivered by an Agilent 1200 series iso-cratic pump equipped with a 1:100 splitter. System control, data
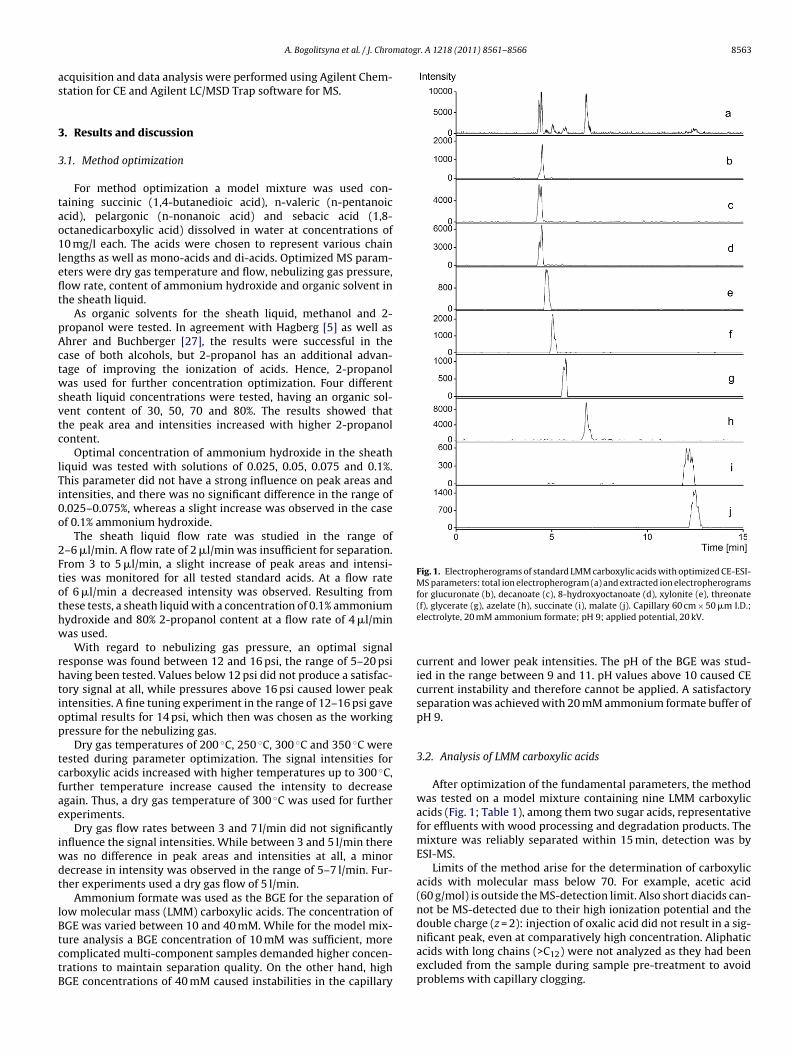
matogr. A 1218 (2011) 8561– 8566 8563
as
3
3
tao1leflt
pActwsvtc
lTi0o
2Ftothw
rhtiop
tcfae
iwdt
lBtctB
Fig. 1. Electropherograms of standard LMM carboxylic acids with optimized CE-ESI-MS parameters: total ion electropherogram (a) and extracted ion electropherogramsfor glucuronate (b), decanoate (c), 8-hydroxyoctanoate (d), xylonite (e), threonate
A. Bogolitsyna et al. / J. Chro
cquisition and data analysis were performed using Agilent Chem-tation for CE and Agilent LC/MSD Trap software for MS.
. Results and discussion
.1. Method optimization
For method optimization a model mixture was used con-aining succinic (1,4-butanedioic acid), n-valeric (n-pentanoiccid), pelargonic (n-nonanoic acid) and sebacic acid (1,8-ctanedicarboxylic acid) dissolved in water at concentrations of0 mg/l each. The acids were chosen to represent various chain
engths as well as mono-acids and di-acids. Optimized MS param-ters were dry gas temperature and flow, nebulizing gas pressure,ow rate, content of ammonium hydroxide and organic solvent inhe sheath liquid.
As organic solvents for the sheath liquid, methanol and 2-ropanol were tested. In agreement with Hagberg [5] as well ashrer and Buchberger [27], the results were successful in thease of both alcohols, but 2-propanol has an additional advan-age of improving the ionization of acids. Hence, 2-propanolas used for further concentration optimization. Four different
heath liquid concentrations were tested, having an organic sol-ent content of 30, 50, 70 and 80%. The results showed thathe peak area and intensities increased with higher 2-propanolontent.
Optimal concentration of ammonium hydroxide in the sheathiquid was tested with solutions of 0.025, 0.05, 0.075 and 0.1%.his parameter did not have a strong influence on peak areas andntensities, and there was no significant difference in the range of.025–0.075%, whereas a slight increase was observed in the casef 0.1% ammonium hydroxide.
The sheath liquid flow rate was studied in the range of–6 �l/min. A flow rate of 2 �l/min was insufficient for separation.rom 3 to 5 �l/min, a slight increase of peak areas and intensi-ies was monitored for all tested standard acids. At a flow ratef 6 �l/min a decreased intensity was observed. Resulting fromhese tests, a sheath liquid with a concentration of 0.1% ammoniumydroxide and 80% 2-propanol content at a flow rate of 4 �l/minas used.
With regard to nebulizing gas pressure, an optimal signalesponse was found between 12 and 16 psi, the range of 5–20 psiaving been tested. Values below 12 psi did not produce a satisfac-ory signal at all, while pressures above 16 psi caused lower peakntensities. A fine tuning experiment in the range of 12–16 psi gaveptimal results for 14 psi, which then was chosen as the workingressure for the nebulizing gas.
Dry gas temperatures of 200 ◦C, 250 ◦C, 300 ◦C and 350 ◦C wereested during parameter optimization. The signal intensities forarboxylic acids increased with higher temperatures up to 300 ◦C,urther temperature increase caused the intensity to decreasegain. Thus, a dry gas temperature of 300 ◦C was used for furtherxperiments.
Dry gas flow rates between 3 and 7 l/min did not significantlynfluence the signal intensities. While between 3 and 5 l/min there
as no difference in peak areas and intensities at all, a minorecrease in intensity was observed in the range of 5–7 l/min. Fur-her experiments used a dry gas flow of 5 l/min.
Ammonium formate was used as the BGE for the separation ofow molecular mass (LMM) carboxylic acids. The concentration ofGE was varied between 10 and 40 mM. While for the model mix-
ure analysis a BGE concentration of 10 mM was sufficient, moreomplicated multi-component samples demanded higher concen-rations to maintain separation quality. On the other hand, highGE concentrations of 40 mM caused instabilities in the capillary(f), glycerate (g), azelate (h), succinate (i), malate (j). Capillary 60 cm × 50 �m I.D.;electrolyte, 20 mM ammonium formate; pH 9; applied potential, 20 kV.
current and lower peak intensities. The pH of the BGE was stud-ied in the range between 9 and 11. pH values above 10 caused CEcurrent instability and therefore cannot be applied. A satisfactoryseparation was achieved with 20 mM ammonium formate buffer ofpH 9.
3.2. Analysis of LMM carboxylic acids
After optimization of the fundamental parameters, the methodwas tested on a model mixture containing nine LMM carboxylicacids (Fig. 1; Table 1), among them two sugar acids, representativefor effluents with wood processing and degradation products. Themixture was reliably separated within 15 min, detection was byESI-MS.
Limits of the method arise for the determination of carboxylicacids with molecular mass below 70. For example, acetic acid(60 g/mol) is outside the MS-detection limit. Also short diacids can-not be MS-detected due to their high ionization potential and thedouble charge (z = 2): injection of oxalic acid did not result in a sig-nificant peak, even at comparatively high concentration. Aliphatic
acids with long chains (>C12) were not analyzed as they had beenexcluded from the sample during sample pre-treatment to avoidproblems with capillary clogging.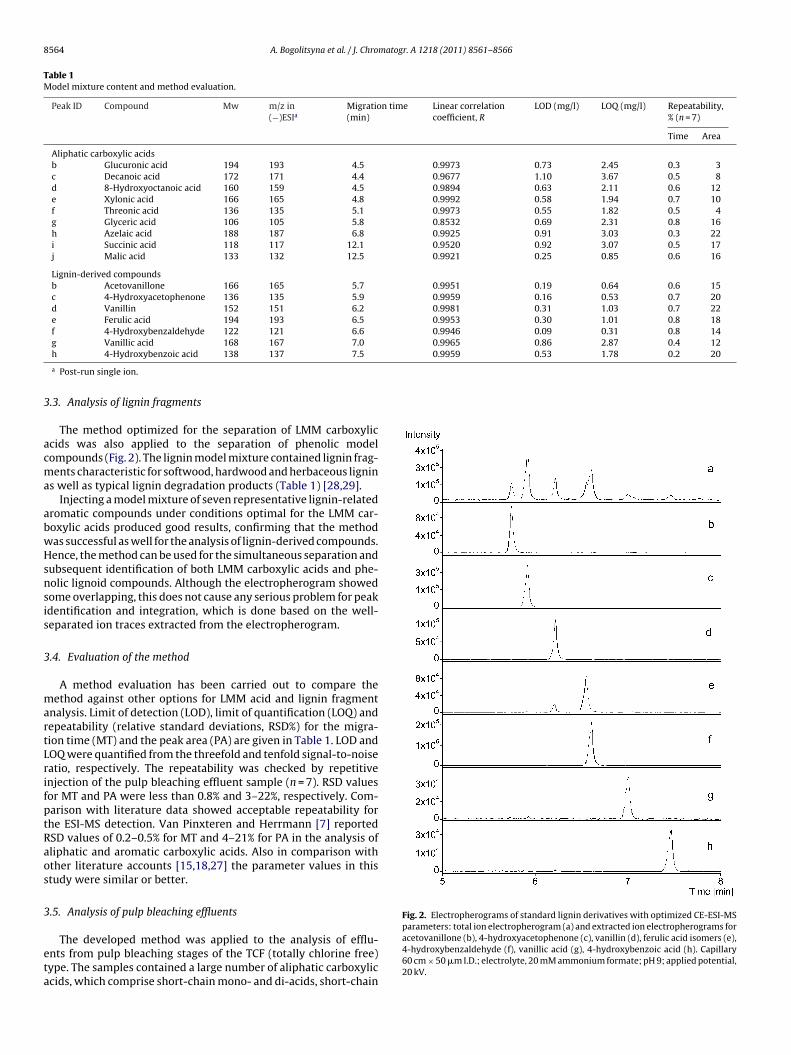
8564 A. Bogolitsyna et al. / J. Chromatogr. A 1218 (2011) 8561– 8566
Table 1Model mixture content and method evaluation.
Peak ID Compound Mw m/z in(−)ESIa
Migration time(min)
Linear correlationcoefficient, R
LOD (mg/l) LOQ (mg/l) Repeatability,% (n = 7)
Time Area
Aliphatic carboxylic acidsb Glucuronic acid 194 193 4.5 0.9973 0.73 2.45 0.3 3c Decanoic acid 172 171 4.4 0.9677 1.10 3.67 0.5 8d 8-Hydroxyoctanoic acid 160 159 4.5 0.9894 0.63 2.11 0.6 12e Xylonic acid 166 165 4.8 0.9992 0.58 1.94 0.7 10f Threonic acid 136 135 5.1 0.9973 0.55 1.82 0.5 4g Glyceric acid 106 105 5.8 0.8532 0.69 2.31 0.8 16h Azelaic acid 188 187 6.8 0.9925 0.91 3.03 0.3 22i Succinic acid 118 117 12.1 0.9520 0.92 3.07 0.5 17j Malic acid 133 132 12.5 0.9921 0.25 0.85 0.6 16
Lignin-derived compoundsb Acetovanillone 166 165 5.7 0.9951 0.19 0.64 0.6 15c 4-Hydroxyacetophenone 136 135 5.9 0.9959 0.16 0.53 0.7 20d Vanillin 152 151 6.2 0.9981 0.31 1.03 0.7 22e Ferulic acid 194 193 6.5 0.9953 0.30 1.01 0.8 18f 4-Hydroxybenzaldehyde 122 121 6.6 0.9946 0.09 0.31 0.8 14g Vanillic acid 168 167 7.0 0.9965 0.86 2.87 0.4 12
0.9959 0.53 1.78 0.2 20
3
acma
abwHsnsis
3
martLrifptRaos
3
eta
Fig. 2. Electropherograms of standard lignin derivatives with optimized CE-ESI-MSparameters: total ion electropherogram (a) and extracted ion electropherograms for
h 4-Hydroxybenzoic acid 138 137 7.5
a Post-run single ion.
.3. Analysis of lignin fragments
The method optimized for the separation of LMM carboxyliccids was also applied to the separation of phenolic modelompounds (Fig. 2). The lignin model mixture contained lignin frag-ents characteristic for softwood, hardwood and herbaceous lignin
s well as typical lignin degradation products (Table 1) [28,29].Injecting a model mixture of seven representative lignin-related
romatic compounds under conditions optimal for the LMM car-oxylic acids produced good results, confirming that the methodas successful as well for the analysis of lignin-derived compounds.ence, the method can be used for the simultaneous separation and
ubsequent identification of both LMM carboxylic acids and phe-olic lignoid compounds. Although the electropherogram showedome overlapping, this does not cause any serious problem for peakdentification and integration, which is done based on the well-eparated ion traces extracted from the electropherogram.
.4. Evaluation of the method
A method evaluation has been carried out to compare theethod against other options for LMM acid and lignin fragment
nalysis. Limit of detection (LOD), limit of quantification (LOQ) andepeatability (relative standard deviations, RSD%) for the migra-ion time (MT) and the peak area (PA) are given in Table 1. LOD andOQ were quantified from the threefold and tenfold signal-to-noiseatio, respectively. The repeatability was checked by repetitivenjection of the pulp bleaching effluent sample (n = 7). RSD valuesor MT and PA were less than 0.8% and 3–22%, respectively. Com-arison with literature data showed acceptable repeatability forhe ESI-MS detection. Van Pinxteren and Herrmann [7] reportedSD values of 0.2–0.5% for MT and 4–21% for PA in the analysis ofliphatic and aromatic carboxylic acids. Also in comparison withther literature accounts [15,18,27] the parameter values in thistudy were similar or better.
.5. Analysis of pulp bleaching effluents
The developed method was applied to the analysis of efflu-nts from pulp bleaching stages of the TCF (totally chlorine free)ype. The samples contained a large number of aliphatic carboxyliccids, which comprise short-chain mono- and di-acids, short-chain
acetovanillone (b), 4-hydroxyacetophenone (c), vanillin (d), ferulic acid isomers (e),4-hydroxybenzaldehyde (f), vanillic acid (g), 4-hydroxybenzoic acid (h). Capillary60 cm × 50 �m I.D.; electrolyte, 20 mM ammonium formate; pH 9; applied potential,20 kV.

A. Bogolitsyna et al. / J. Chromatogr. A 1218 (2011) 8561– 8566 8565
Fig. 3. Base peak electropherogram of combined bleaching effluent prior biologicalt
hnateptwttspcm
cps
TC
Fig. 4. Base peak electropherogram of aqueous extract from naturally aged bookpaper. For peak labeling see Table 3.
Table 3Compounds identified in the aqueous paper extract.
Peak ID Compound Mw m/z in(−)ESIa
1 Xylonic acid 166 1652 Threonic acid 136 1353 Vanillic acid 168 1674 Glyceric acid 106 1055 Lactic acid 90 896 Glycolic acid 76 757 Unidentified sugar acid 196 1958 Succinic acid 118 1179 Malic acid 134 133
10 Tartaric acid 150 149
reatment. For peak labeling see Table 2.
ydroxyacids, and medium-chain monoacids; components origi-ating from lignin detected in the sample were vanillic, syringicnd cinnamic acids (Fig. 3; Table 2). Peak assignment and quan-ification has been performed using the post-run single-ion tracesxtracted from the electropherogram, and were verified by com-arison of the migration time with standard compounds. Due tohe lack of standard compounds, not every peak was verified in thisay. Identification of compounds by ion fragmentation was rather
ime consuming due to the complexity of sample. Combination ofhe CE-MS analysis with a GC–MS approach (after derivatization,uch as silylation) provided additional information on the sam-le composition as it offers access to a much broader database ofhemical compounds which was used to support the data for CE-MSethod development.Generally, difficulties in the analysis arise from the high con-
entration of inorganic salts in the sample, which might hamper aerfect separation of some compounds in the effluent sample andhift the migration times.
able 2ompounds identified in the bleaching effluent sample.
Peak ID Compound Mw m/z in(−)ESIa
1 Syringic acid 198 1972 8-Hydroxyoctanoic acid 160 1593 Threonic acid 136 1354 Decanoic acid 172 1715 2-Hydroxyhexanoic acid 132 1316 Octanoic acid 144 1437 Tricarboxylic acid (citric or isocitric) 192 1918 Cinnamic acid 148 1479 Xylonic acid 166 165
10 Vanillic acid 168 16711 Unidentified sugar acid 196 19512 Azelaic acid 188 18713 Hexanedioic acid 146 14514 2-Ketogluconic acid 211 21015 2,4,5-Trihydroxypentanoic acid 150 14916 Malonic acid 104 10317 Unidentified sugar acid 166 16518 Succinic acid 118 11719 Malic acid 134 13320 Maleic acid 116 115
a Post-run single ion.
11 Maleic acid 116 115
a Post-run single ion.
3.6. Analysis of extract from aged paper
The extract from aged paper (Fig. 4; Table 3) mainly containedLMM mono- and di-acids, originating from far-reaching carbohy-drate degradation, as well as sugar acids. As mentioned above,carboxylic acids with very short carbon chain length (e.g. formicacid and acetic acid) were not detected due to their low molecularmass beyond the grasp of the MS detector, but they can be deter-mined by other means, e.g. conventional CE with UV-detection.As to the phenolic compounds from lignin, only vanillic acid wasdetected in the sample. The concentrations of the other lignin-derived compounds in the sample were too low to be identified.A matrix effect has been observed during the analysis of the paperextract sample as well, but it was by far not as strong as comparedto the effluent sample and did not disturb the separation. This canmainly be attributed to the missing inorganic salt freight comparedto the bleaching effluent.
4. Conclusions
The present CE-MS method offers an approach to direct analysisof most individual organic components, especially polar ones suchas acids and phenols, in some overly complex mixtures of carbo-hydrate and lignin degradation products, as occurring in industrialpulp processing or upon aging of cellulosic materials. The directanalysis refers to the fact that no derivatization is necessary as
in GC analysis (for volatility) which renders the method simpleand rapid, and the loss of components during such pretreatmentsteps is avoided. For unknown components not being identifiableby comparison to standards, the ESI-MS-hyphenation additionally
8 matog
ptaicpavo
cuoCoprpiodlcs
A
Ntp
DCgMAD
[[[[
[
[[[[[
[
[
[
[[
[
[Biomacromolecules 3 (2002) 959.
[27] W. Ahrer, W. Buchberger, J. Chromatogr. A 854 (1999) 275.
566 A. Bogolitsyna et al. / J. Chro
rovides (albeit limited) indications as to the chemical nature ofhese compounds. A comparably fast and efficient separation ofliphatic carboxylic acids and phenolic compounds from the stud-ed analytes can be achieved in one single run without the need tohange solvents. Only sample pre-concentration might be requiredrior the injection in case of very dilute solutions. The method ispplicable to any aqueous or water soluble sample and requiresery small sample amounts as the injection volume is in the rangef nanoliters.
The method presented can be complemented by other analyti-al methods as for instance GC–MS, which on one hand offers thetilization of more comprehensive compound databases, but on thether hand entails a derivatization step. Compared to GC–MS, theE-MS method shows lower sensitivity, but presents informationn the unaltered sample composition as no derivatization or sam-le preparation is involved as in the case of GC, and it offers moreapid and robust analysis. Although method improvements couldossibly further reduce the negative matrix effects of inorganic salts
n the analyte samples, the present method, being the first reportf the simultaneous determination of (hemi)cellulose and ligninegradation products by CE-ESI-MS in very complex mixtures of
ignocellulosic degradation products, is expected to find wide appli-ation in the pulp and paper industries as well as in conservationcience of historic cellulosic objects.
cknowledgements
The authors would like to thank Kyujin Ahn, MSc, University ofatural Resources and Life Sciences, Vienna, for providing data on
he book sample and Dr. Sonja Kirschnerova, for the book samplereparations.
The financial support by COST Action FP0901, the Christianoppler Research Society (CD laboratory “Advanced Cellulosehemistry and Analytics”) and Lenzing AG, Lenzing, Austria, is
ratefully acknowledged. We appreciate the helpful advice of Dr.arkus Himmelsbach and Dr. Manuela Haunschmidt, Institute ofnalytical Chemistry, Johannes-Kepler-University Linz, Austria andr. G. Götzinger, Lenzing AG, Lenzing, Austria.
[[
r. A 1218 (2011) 8561– 8566
References
[1] M. Strlic, J. Kolar, Ageing and Stabilization of Paper, National and UniversityLibrary, Ljubljana, 2005.
[2] R. Malinen, E. Sjöström, Paperi ja Puu 11 (1975) 728.[3] K. Niemelä, R. Alen, in: E. Sjöström, R. Alen (Eds.), Analytical Methods in Wood
Chemistry, Pulping, and Papermaking, Springer, Heidelberg, Germany, 1999.[4] H. Hirschlag, R. Küster, Fresen. J. Anal. Chem. 263 (1998) 274.[5] J. Hagberg, J. Chromatogr. A 988 (2003) 127.[6] E. Dabek-Zlotorzynska, R. Aranda-Rodriguez, L. Graham, J. Sep. Sci. 28 (2005)
1520.[7] D. van Pinxteren, H. Herrmann, J. Chromatogr. A 1171 (2007) 112.[8] E. Sjoholm, N.-O. Nilvebrant, A. Colmsjo, J. Wood Chem. Technol. 13 (1993)
529.[9] A.-L. Dupont, C. Egasse, A. Morin, F. Vasseur, Carbohydr. Polym. 68 (2007) 1.10] T. Javor, W. Buchberger, O. Faix, Anal. Chim. Acta 484 (2003) 181.11] C. Klampfl, W. Buchberger, Trends Anal. Chem. 16 (1997) 221.12] D. Volgger, A. Zemann, G. Bonn, J. High Res. Chromatogr. 21 (1998) 3.13] D.T. Nguyen, H. Lerch, A. Zemann, G. Bonn, Chromatographia 46 (1997)
113.14] S.M. Masselter, A.J. Zemann, G.K. Bonn, J. High Res. Chromatogr. 19 (1996)
131.15] H. Sawada, C. Nogami, Analyt. Chim. Acta 507 (2004) 191.16] B. Baena, A. Cifuentes, C. Barbas, Electrophoresis 26 (2005) 2622.17] W.-C. Yang, F.E. Regnier, J. Adamec, Electrophoresis 29 (2008) 4549.18] Y. Iinuma, H. Herrmann, J. Chromatogr. A 1018 (2003) 105.19] A. Carrasco-Pancorbo, L. Cerretani, A. Bendini, A. Segura-Carretero, G. Lercker,
A. Fernandez-Gutierrez, J. Agric. Food Chem. 55 (2007) 4771.20] J.J.B. Nevado, G.C. Penalvo, V.R. Robledo, G.V. Martinez, Talanta 79 (2009)
1238.21] A.M. Gomez-Caravaca, V. Verardo, A. Segura-Carretero, M.F. Caboni, A.
Fernandez-Gutierrez, J. Chromatogr. A 1209 (2008) 238.22] M.M. Yassine, E. Dabek-Zlotorzynska, P. Schmitt-Kopplin, Electrophoresis 30
(2009) 1756.23] A.L. Dupont, A. Seeman, B. Lavedrine, Talanta (submitted for publication).24] Supel-Select HLB SPE Instruction/Data Sheet & Troubleshooting Guide;
Data Sheet No. T708013, SUPELCO, Bellefonte, PA, 2008. http://www.sigmaaldrich.com/etc/medialib/docs/Supelco/Datasheet/t708013.Par.0001.File.tmp/t708013.pdf (accessed 7.02.11).
25] J. Dee, H.S. Stoker, Organic and Biological Chemistry, Cengage Learning,Brooks/Cole, 2009.
26] J. Röhrling, A. Potthast, T. Rosenau, T. Lange, G. Ebner, H. Sixta, P. Kosma,
28] E. Adler, Wood Sci. Technol. 11 (1977) 169.29] D. Fengel, G. Wegener, Wood: Chemistry, Ultrastructure, Reactions, Walter de
Gruyter, Berlin/New York, 1989.
81
Paper II Degradation products of lignocellulosics in pulp mill effluents
– comparison and evaluation of different gas chromatographic
techniques for a comprehensive analysis.
Holzforschung, vol. 66, pp. 917‐925.
Bogolitsyna, A.; Becker, M.; Borgards, A.; Liebner, F.; Rosenau, T.; Potthast, A. (2012)
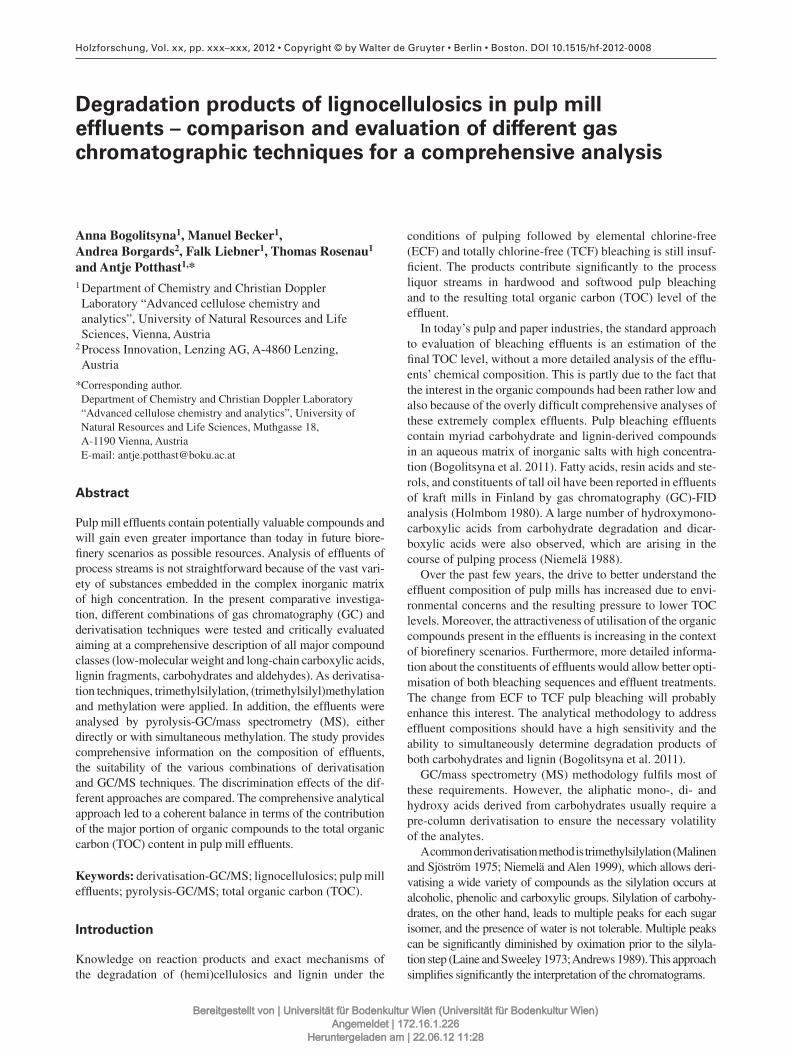
Holzforschung, Vol. xx, pp. xxx–xxx, 2012 • Copyright © by Walter de Gruyter • Berlin • Boston. DOI 10.1515/hf-2012-0008
Degradation products of lignocellulosics in pulp mill effl uents – comparison and evaluation of different gas chromatographic techniques for a comprehensive analysis
Anna Bogolitsyna 1 , Manuel Becker 1 , Andrea Borgards 2 , Falk Liebner 1 , Thomas Rosenau 1 and Antje Potthast 1, *
1 Department of Chemistry and Christian Doppler Laboratory “ Advanced cellulose chemistry and analytics ” , University of Natural Resources and Life Sciences, Vienna , Austria
2 Process Innovation , Lenzing AG, A-4860 Lenzing , Austria
* Corresponding author.Department of Chemistry and Christian Doppler Laboratory “ Advanced cellulose chemistry and analytics ” , University of Natural Resources and Life Sciences, Muthgasse 18, A-1190 Vienna, AustriaE-mail: [email protected]
Abstract
Pulp mill effl uents contain potentially valuable compounds and will gain even greater importance than today in future biore-fi nery scenarios as possible resources. Analysis of effl uents of process streams is not straightforward because of the vast vari-ety of substances embedded in the complex inorganic matrix of high concentration. In the present comparative investiga-tion, different combinations of gas chromatography (GC) and derivatisation techniques were tested and critically evaluated aiming at a comprehensive description of all major compound classes (low-molecular weight and long-chain carboxylic acids, lignin fragments, carbohydrates and aldehydes). As derivatisa-tion techniques, trimethylsilylation, (trimethyl silyl)methylation and methylation were applied. In addition, the effl uents were analysed by pyrolysis-GC/mass spectrometry (MS), either directly or with simultaneous methylation. The study provides comprehensive information on the composition of effl uents, the suitability of the various combinations of derivatisation and GC/MS techniques. The discrimination effects of the dif-ferent approaches are compared. The comprehensive analytical approach led to a coherent balance in terms of the contribution of the major portion of organic compounds to the total organic carbon (TOC) content in pulp mill effl uents.
Keywords: derivatisation-GC/MS; lignocellulosics; pulp mill effl uents; pyrolysis-GC/MS; total organic carbon (TOC).
Introduction
Knowledge on reaction products and exact mechanisms of the degradation of (hemi)cellulosics and lignin under the
conditions of pulping followed by elemental chlorine-free (ECF) and totally chlorine-free (TCF) bleaching is still insuf-fi cient. The products contribute signifi cantly to the process liquor streams in hardwood and softwood pulp bleaching and to the resulting total organic carbon (TOC) level of the effl uent.
In today ’ s pulp and paper industries, the standard approach to evaluation of bleaching effl uents is an estimation of the fi nal TOC level, without a more detailed analysis of the effl u-ents ’ chemical composition. This is partly due to the fact that the interest in the organic compounds had been rather low and also because of the overly diffi cult comprehensive analyses of these extremely complex effl uents. Pulp bleaching effl uents contain myriad carbohydrate and lignin-derived compounds in an aqueous matrix of inorganic salts with high concentra-tion (Bogolitsyna et al. 2011 ). Fatty acids, resin acids and ste-rols, and constituents of tall oil have been reported in effl uents of kraft mills in Finland by gas chromatography (GC)-FID analysis (Holmbom 1980 ). A large number of hydroxymono-carboxylic acids from carbohydrate degradation and dicar-boxylic acids were also observed, which are arising in the course of pulping process (Niemel ä 1988 ).
Over the past few years, the drive to better understand the effl uent composition of pulp mills has increased due to envi-ronmental concerns and the resulting pressure to lower TOC levels. Moreover, the attractiveness of utilisation of the organic compounds present in the effl uents is increasing in the context of biorefi nery scenarios. Furthermore, more detailed informa-tion about the constituents of effl uents would allow better opti-misation of both bleaching sequences and effl uent treatments. The change from ECF to TCF pulp bleaching will probably enhance this interest. The analytical methodology to address effl uent compositions should have a high sensitivity and the ability to simultaneously determine degradation products of both carbohydrates and lignin (Bogolitsyna et al. 2011 ).
GC/mass spectrometry (MS) methodology fulfi ls most of these requirements. However, the aliphatic mono-, di- and hydroxy acids derived from carbohydrates usually require a pre-column derivatisation to ensure the necessary volatility of the analytes.
A common derivatisation method is trimethylsilylation (Malinen and Sj ö str ö m 1975 ; Niemel ä and Alen 1999 ), which allows deri-vatising a wide variety of compounds as the silylation occurs at alcoholic, phenolic and carboxylic groups. Silylation of carbohy-drates, on the other hand, leads to multiple peaks for each sugar isomer, and the presence of water is not tolerable. Multiple peaks can be signifi cantly diminished by oximation prior to the silyla-tion step (Laine and Sweeley 1973 ; Andrews 1989 ). This approach simplifi es signifi cantly the interpretation of the chromatograms.
Bereitgestellt von | Universität für Bodenkultur Wien (Universität für Bodenkultur Wien)Angemeldet | 172.16.1.226
Heruntergeladen am | 22.06.12 11:28
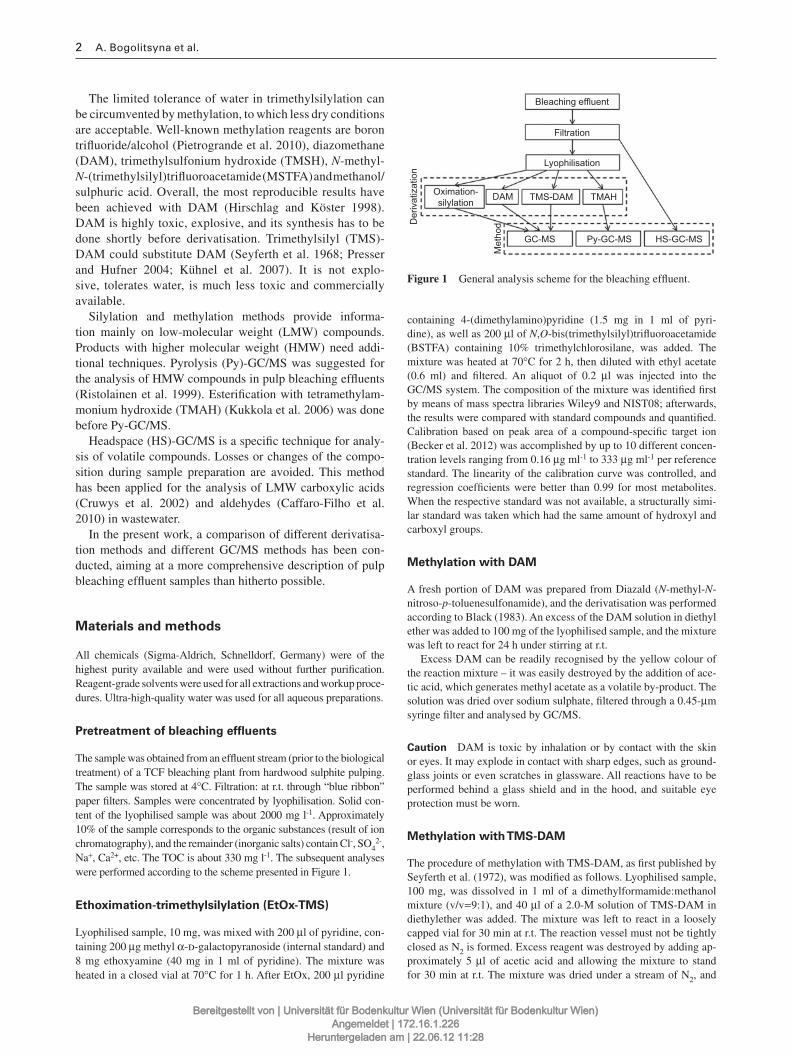
2 A. Bogolitsyna et al.
The limited tolerance of water in trimethylsilylation can be circumvented by methylation, to which less dry conditions are acceptable. Well-known methylation reagents are boron trifl uoride/alcohol (Pietrogrande et al. 2010 ), diazomethane (DAM), trimethylsulfonium hydroxide (TMSH), N -methyl- N -(trimethylsilyl)trifl uoroacetamide (MSTFA) and methanol/sulphuric acid. Overall, the most reproducible results have been achieved with DAM (Hirschlag and K ö ster 1998 ). DAM is highly toxic, explosive, and its synthesis has to be done shortly before derivatisation. Trimethylsilyl (TMS)-DAM could substitute DAM (Seyferth et al. 1968 ; Presser and Hufner 2004 ; K ü hnel et al. 2007 ). It is not explo-sive, tolerates water, is much less toxic and commercially available.
Silylation and methylation methods provide informa-tion mainly on low-molecular weight (LMW) compounds. Products with higher molecular weight (HMW) need addi-tional techniques. Pyrolysis (Py)-GC/MS was suggested for the analysis of HMW compounds in pulp bleaching effl uents (Ristolainen et al. 1999 ). Esterifi cation with tetramethylam-monium hydroxide (TMAH) (Kukkola et al. 2006 ) was done before Py-GC/MS.
Headspace (HS)-GC/MS is a specifi c technique for analy-sis of volatile compounds. Losses or changes of the compo-sition during sample preparation are avoided. This method has been applied for the analysis of LMW carboxylic acids (Cruwys et al. 2002 ) and aldehydes (Caffaro -Filho et al. 2010 ) in wastewater.
In the present work, a comparison of different derivatisa-tion methods and different GC/MS methods has been con-ducted, aiming at a more comprehensive description of pulp bleaching effl uent samples than hitherto possible.
Materials and methods
All chemicals (Sigma-Aldrich, Schnelldorf, Germany) were of the highest purity available and were used without further purifi cation. Reagent-grade solvents were used for all extractions and workup proce-dures. Ultra-high-quality water was used for all aqueous preparations.
Pretreatment of bleaching effl uents
The sample was obtained from an effl uent stream (prior to the biological treatment) of a TCF bleaching plant from hardwood sulphite pulping. The sample was stored at 4 ° C. Filtration: at r.t. through “ blue ribbon ” paper fi lters. Samples were concentrated by lyophilisation. Solid con-tent of the lyophilised sample was about 2000 mg l -1 . Approximately 10 % of the sample corresponds to the organic substances (result of ion chromatography), and the remainder (inorganic salts) contain Cl - , SO 4
2- , Na + , Ca 2 + , etc. The TOC is about 330 mg l -1 . The subsequent analyses were performed according to the scheme presented in Figure 1 .
Ethoximation-trimethylsilylation (EtOx-TMS)
Lyophilised sample, 10 mg, was mixed with 200 μ l of pyridine, con-taining 200 μ g methyl α -d-galactopyranoside (internal standard) and 8 mg ethoxyamine (40 mg in 1 ml of pyridine). The mixture was heated in a closed vial at 70 ° C for 1 h. After EtOx, 200 μ l pyridine
containing 4-(dimethylamino)pyridine (1.5 mg in 1 ml of pyri-dine), as well as 200 μ l of N , O -bis(trimethylsilyl)trifl uoro acetamide (BSTFA) containing 10 % trimethylchlorosilane, was added. The mixture was heated at 70 ° C for 2 h, then diluted with ethyl acetate (0.6 ml) and fi ltered. An aliquot of 0.2 μ l was injected into the GC/MS system. The composition of the mixture was identifi ed fi rst by means of mass spectra libraries Wiley9 and NIST08; afterwards, the results were compared with standard compounds and quantifi ed. Calibration based on peak area of a compound-specifi c target ion (Becker et al. 2012 ) was accomplished by up to 10 different concen-tration levels ranging from 0.16 μ g ml -1 to 333 μ g ml -1 per reference standard. The linearity of the calibration curve was controlled, and regression coeffi cients were better than 0.99 for most metabolites. When the respective standard was not available, a structurally simi-lar standard was taken which had the same amount of hydroxyl and carboxyl groups.
Methylation with DAM
A fresh portion of DAM was prepared from Diazald ( N -methyl- N -nitroso- p -toluenesulfonamide), and the derivatisation was performed according to Black (1983) . An excess of the DAM solution in diethyl ether was added to 100 mg of the lyophilised sample, and the mixture was left to react for 24 h under stirring at r.t.
Excess DAM can be readily recognised by the yellow colour of the reaction mixture – it was easily destroyed by the addition of ace-tic acid, which generates methyl acetate as a volatile by-product. The solution was dried over sodium sulphate, fi ltered through a 0.45- μ m syringe fi lter and analysed by GC/MS.
Caution DAM is toxic by inhalation or by contact with the skin or eyes. It may explode in contact with sharp edges, such as ground-glass joints or even scratches in glassware. All reactions have to be performed behind a glass shield and in the hood, and suitable eye protection must be worn.
Methylation with TMS-DAM
The procedure of methylation with TMS-DAM, as fi rst published by Seyferth et al. (1972) , was modifi ed as follows. Lyophilised sample, 100 mg, was dissolved in 1 ml of a dimethylformamide:methanol mixture (v/v = 9:1), and 40 μ l of a 2.0-M solution of TMS-DAM in diethylether was added. The mixture was left to react in a loosely capped vial for 30 min at r.t. The reaction vessel must not be tightly closed as N 2 is formed. Excess reagent was destroyed by adding ap-proximately 5 μ l of acetic acid and allowing the mixture to stand for 30 min at r.t. The mixture was dried under a stream of N 2 , and
Der
ivat
izat
ion
Met
hod
Bleaching effluent
Filtration
Lyophilisation
Oximation-silylation DAM TMS-DAM
GC-MS HS-GC-MSPy-GC-MS
TMAH
Figure 1 General analysis scheme for the bleaching effl uent.
Bereitgestellt von | Universität für Bodenkultur Wien (Universität für Bodenkultur Wien)Angemeldet | 172.16.1.226
Heruntergeladen am | 22.06.12 11:28
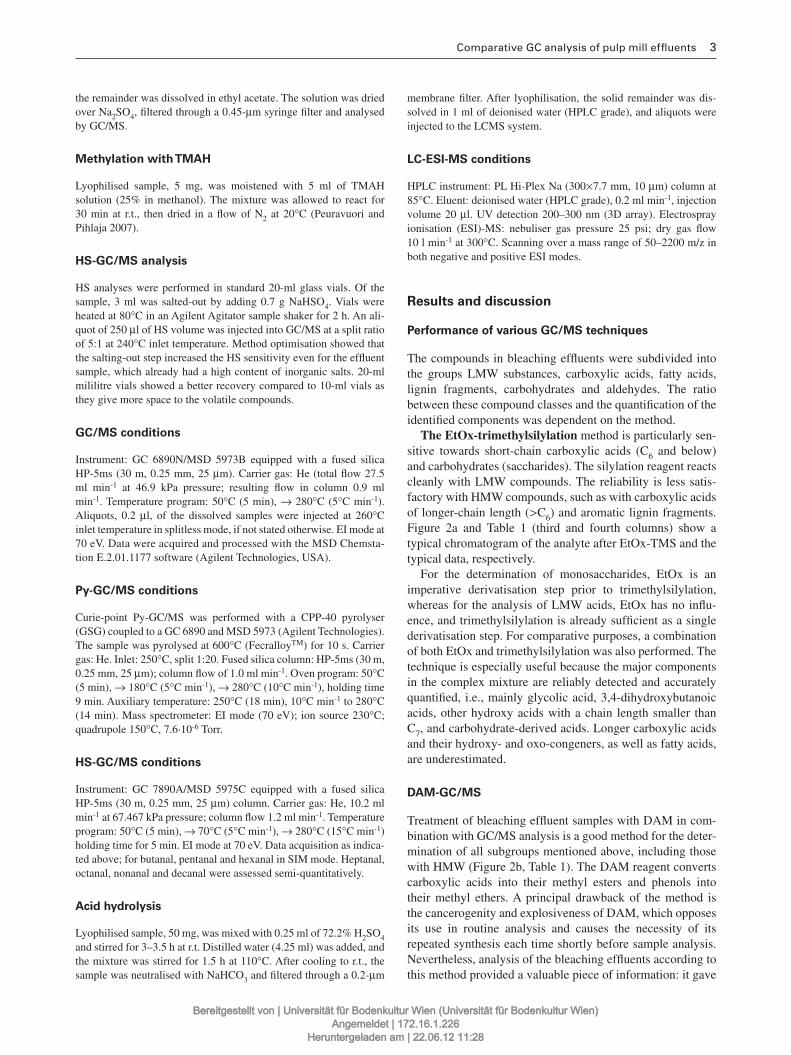
Comparative GC analysis of pulp mill effl uents 3
the remainder was dissolved in ethyl acetate. The solution was dried over Na 2 SO 4 , fi ltered through a 0.45- μ m syringe fi lter and analysed by GC/MS.
Methylation with TMAH
Lyophilised sample, 5 mg, was moistened with 5 ml of TMAH solution (25 % in methanol). The mixture was allowed to react for 30 min at r.t., then dried in a fl ow of N 2 at 20 ° C (Peuravuori and Pihlaja 2007 ).
HS-GC/MS analysis
HS analyses were performed in standard 20-ml glass vials. Of the sample, 3 ml was salted-out by adding 0.7 g NaHSO 4 . Vials were heated at 80 ° C in an Agilent Agitator sample shaker for 2 h. An ali-quot of 250 μ l of HS volume was injected into GC/MS at a split ratio of 5:1 at 240 ° C inlet temperature. Method optimisation showed that the salting-out step increased the HS sensitivity even for the effl uent sample, which already had a high content of inorganic salts. 20-ml mililitre vials showed a better recovery compared to 10-ml vials as they give more space to the volatile compounds.
GC/MS conditions
Instrument: GC 6890N/MSD 5973B equipped with a fused silica HP-5ms (30 m, 0.25 mm, 25 μ m). Carrier gas: He (total fl ow 27.5 ml min -1 at 46.9 kPa pressure; resulting fl ow in column 0.9 ml min -1 . Temperature program: 50 ° C (5 min), → 280 ° C (5 ° C min -1 ). Aliquots, 0.2 μ l, of the dissolved samples were injected at 260 ° C inlet temperature in splitless mode, if not stated otherwise. EI mode at 70 eV. Data were acquired and processed with the MSD Chemsta-tion E.2.01.1177 software (Agilent Technologies, USA).
Py-GC/MS conditions
Curie-point Py-GC/MS was performed with a CPP-40 pyrolyser (GSG) coupled to a GC 6890 and MSD 5973 (Agilent Technologies). The sample was pyrolysed at 600 ° C (Fecralloy TM ) for 10 s. Carrier gas: He. Inlet: 250 ° C, split 1:20. Fused silica column: HP-5ms (30 m, 0.25 mm, 25 μ m); column fl ow of 1.0 ml min -1 . Oven program: 50 ° C (5 min), → 180 ° C (5 ° C min -1 ), → 280 ° C (10 ° C min -1 ), holding time 9 min. Auxiliary temperature: 250 ° C (18 min), 10 ° C min -1 to 280 ° C (14 min). Mass spectrometer: EI mode (70 eV); ion source 230 ° C; quadrupole 150 ° C, 7.6 · 10 -6 Torr.
HS-GC/MS conditions
Instrument: GC 7890A/MSD 5975C equipped with a fused silica HP-5ms (30 m, 0.25 mm, 25 μ m) column. Carrier gas: He, 10.2 ml min -1 at 67.467 kPa pressure; column fl ow 1.2 ml min -1 . Temperature program: 50 ° C (5 min), → 70 ° C (5 ° C min -1 ), → 280 ° C (15 ° C min -1 ) holding time for 5 min. EI mode at 70 eV. Data acquisition as indica-ted above; for butanal, pentanal and hexanal in SIM mode. Heptanal, octanal, nonanal and decanal were assessed semi-quantitatively.
Acid hydrolysis
Lyophilised sample, 50 mg, was mixed with 0.25 ml of 72.2 % H 2 SO 4 and stirred for 3 – 3.5 h at r.t. Distilled water (4.25 ml) was added, and the mixture was stirred for 1.5 h at 110 ° C. After cooling to r.t., the sample was neutralised with NaHCO 3 and fi ltered through a 0.2- μ m
membrane fi lter. After lyophilisation, the solid remainder was dis-solved in 1 ml of deionised water (HPLC grade), and aliquots were injected to the LCMS system.
LC-ESI-MS conditions
HPLC instrument: PL Hi-Plex Na (300 × 7.7 mm, 10 μ m) column at 85 ° C. Eluent: deionised water (HPLC grade), 0.2 ml min -1 , injection volume 20 μ l. UV detection 200 – 300 nm (3D array). Electrospray ionisation (ESI)-MS: nebuliser gas pressure 25 psi; dry gas fl ow 10 l min -1 at 300 ° C. Scanning over a mass range of 50 – 2200 m/z in both negative and positive ESI modes.
Results and discussion
Performance of various GC/MS techniques
The compounds in bleaching effl uents were subdivided into the groups LMW substances, carboxylic acids, fatty acids, lignin fragments, carbohydrates and aldehydes. The ratio between these compound classes and the quantifi cation of the identifi ed components was dependent on the method.
The EtOx-trimethylsilylation method is particularly sen-sitive towards short-chain carboxylic acids (C 6 and below) and carbohydrates (saccharides). The silylation reagent reacts cleanly with LMW compounds. The reliability is less satis-factory with HMW compounds, such as with carboxylic acids of longer-chain length ( > C 6 ) and aromatic lignin fragments. Figure 2 a and Table 1 (third and fourth columns) show a typical chromatogram of the analyte after EtOx-TMS and the typical data, respectively.
For the determination of monosaccharides, EtOx is an imperative derivatisation step prior to trimethylsilylation, whereas for the analysis of LMW acids, EtOx has no infl u-ence, and trimethylsilylation is already suffi cient as a single derivatisation step. For comparative purposes, a combination of both EtOx and trimethylsilylation was also performed. The technique is especially useful because the major components in the complex mixture are reliably detected and accurately quantifi ed, i.e., mainly glycolic acid, 3,4-dihydroxybutanoic acids, other hydroxy acids with a chain length smaller than C 7, and carbohydrate-derived acids. Longer carboxylic acids and their hydroxy- and oxo-congeners, as well as fatty acids, are underestimated.
DAM-GC/MS
Treatment of bleaching effl uent samples with DAM in com-bination with GC/MS analysis is a good method for the deter-mination of all subgroups mentioned above, including those with HMW (Figure 2b, Table 1). The DAM reagent converts carboxylic acids into their methyl esters and phenols into their methyl ethers. A principal drawback of the method is the cancerogenity and explosiveness of DAM, which opposes its use in routine analysis and causes the necessity of its repeated synthesis each time shortly before sample analysis. Nevertheless, analysis of the bleaching effl uents according to this method provided a valuable piece of information: it gave
Bereitgestellt von | Universität für Bodenkultur Wien (Universität für Bodenkultur Wien)Angemeldet | 172.16.1.226
Heruntergeladen am | 22.06.12 11:28
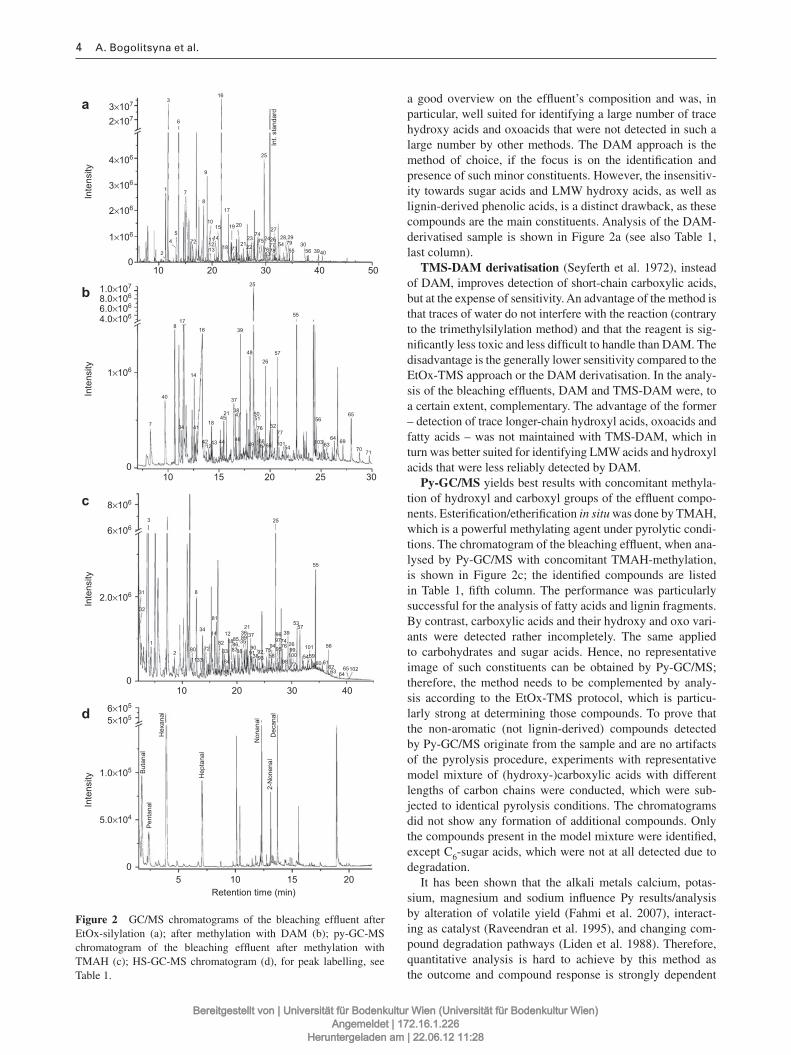
4 A. Bogolitsyna et al.
a good overview on the effl uent ’ s composition and was, in particular, well suited for identifying a large number of trace hydroxy acids and oxoacids that were not detected in such a large number by other methods. The DAM approach is the method of choice, if the focus is on the identifi cation and presence of such minor constituents. However, the insensitiv-ity towards sugar acids and LMW hydroxy acids, as well as lignin-derived phenolic acids, is a distinct drawback, as these compounds are the main constituents. Analysis of the DAM-derivatised sample is shown in Figure 2a (see also Table 1, last column).
TMS-DAM derivatisation (Seyferth et al. 1972 ), instead of DAM, improves detection of short-chain carboxylic acids, but at the expense of sensitivity. An advantage of the method is that traces of water do not interfere with the reaction (contrary to the trimethylsilylation method) and that the reagent is sig-nifi cantly less toxic and less diffi cult to handle than DAM. The disadvantage is the generally lower sensitivity compared to the EtOx-TMS approach or the DAM derivatisation. In the analy-sis of the bleaching effl uents, DAM and TMS-DAM were, to a certain extent, complementary. The advantage of the former – detection of trace longer-chain hydroxyl acids, oxoacids and fatty acids – was not maintained with TMS-DAM, which in turn was better suited for identifying LMW acids and hydroxyl acids that were less reliably detected by DAM.
Py-GC/MS yields best results with concomitant methyla-tion of hydroxyl and carboxyl groups of the effl uent compo-nents. Esterifi cation/etherifi cation in situ was done by TMAH, which is a powerful methylating agent under pyrolytic condi-tions. The chromatogram of the bleaching effl uent, when ana-lysed by Py-GC/MS with concomitant TMAH-methylation, is shown in Figure 2c; the identifi ed compounds are listed in Table 1, fi fth column. The performance was particularly successful for the analysis of fatty acids and lignin fragments. By contrast, carboxylic acids and their hydroxy and oxo vari-ants were detected rather incompletely. The same applied to carbohydrates and sugar acids. Hence, no representative image of such constituents can be obtained by Py-GC/MS; therefore, the method needs to be complemented by analy-sis according to the EtOx-TMS protocol, which is particu-larly strong at determining those compounds. To prove that the non-aromatic (not lignin-derived) compounds detected by Py-GC/MS originate from the sample and are no artifacts of the pyrolysis procedure, experiments with representative model mixture of (hydroxy-)carboxylic acids with different lengths of carbon chains were conducted, which were sub-jected to identical pyrolysis conditions. The chromatograms did not show any formation of additional compounds. Only the compounds present in the model mixture were identifi ed, except C 6 -sugar acids, which were not at all detected due to degradation.
It has been shown that the alkali metals calcium, potas-sium, magnesium and sodium infl uence Py results/analysis by alteration of volatile yield (Fahmi et al. 2007 ), interact-ing as catalyst (Raveendran et al. 1995 ), and changing com-pound degradation pathways (Liden et al. 1988 ). Therefore, quantitative analysis is hard to achieve by this method as the outcome and compound response is strongly dependent
a
b
d
Retention time (min)5
0
5.0×10⁴
1.0×10⁵
5×1056×105
2.0×10⁶
6×10⁶
8×10⁶
0
Inte
nsity
Inte
nsity
0
1×10⁶
4.0×1066.0×1068.0×1061.0×107
Inte
nsity
1×10⁶
2×10⁶
3×10⁶
4×10⁶
2×1073×107
0
Inte
nsity
Pen
tana
lB
utan
al
Hep
tana
l
Hex
anal
Int.
stan
dard
Non
anal
2-N
onen
alD
ecan
al
10 15 20
2010
1
2 80
1133
72
34
32
31 8
81
82
14 1221
36 3735
389375
94
969774,
769558
98 77
10099,26
39
53
55
253
7
40
34 41
4212
43 44 46
4521
37
3847 50,
265748
39
25
2
45
721312,11,14
10 20
217318 22
2374
757778
5428,29
7955
3056 3940
2426
27
7653
15 19
817
7
9
6
316
25
1
55
1617
8
14
51
76 5256
103 6364 69
65
70 71
776649 6768 101
54
18
57
101
5459
56
60 616263 64
65102
85,90,91 92,
86,18
83 8788
89
84
30 40
20 2510 15 30
20 3010 5040
c
Figure 2 GC/MS chromatograms of the bleaching effl uent after EtOx-silylation (a); after methylation with DAM (b); py-GC-MS chromatogram of the bleaching effl uent after methylation with TMAH (c); HS-GC-MS chromatogram (d), for peak labelling, see Table 1.
Bereitgestellt von | Universität für Bodenkultur Wien (Universität für Bodenkultur Wien)Angemeldet | 172.16.1.226
Heruntergeladen am | 22.06.12 11:28
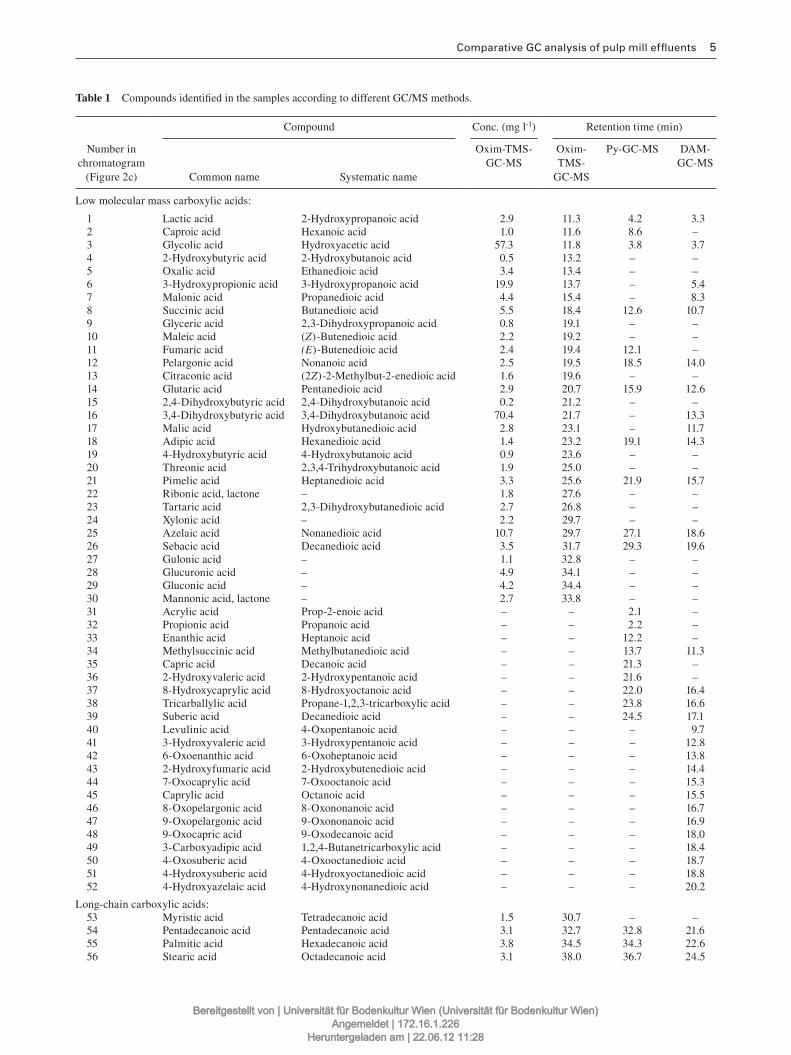
Comparative GC analysis of pulp mill effl uents 5
Table 1 Compounds identifi ed in the samples according to different GC/MS methods.
Number in chromatogram
(Figure 2c)
Compound Conc. (mg l -1 ) Retention time (min)
Common name Systematic name
Oxim-TMS-GC-MS
Oxim-TMS-
GC-MS
Py-GC-MS DAM-GC-MS
Low molecular mass carboxylic acids:
1 Lactic acid 2-Hydroxypropanoic acid 2.9 11.3 4.2 3.3 2 Caproic acid Hexanoic acid 1.0 11.6 8.6 – 3 Glycolic acid Hydroxyacetic acid 57.3 11.8 3.8 3.7 4 2-Hydroxybutyric acid 2-Hydroxybutanoic acid 0.5 13.2 – – 5 Oxalic acid Ethanedioic acid 3.4 13.4 – – 6 3-Hydroxypropionic acid 3-Hydroxypropanoic acid 19.9 13.7 – 5.4 7 Malonic acid Propanedioic acid 4.4 15.4 – 8.3 8 Succinic acid Butanedioic acid 5.5 18.4 12.6 10.7 9 Glyceric acid 2,3-Dihydroxypropanoic acid 0.8 19.1 – – 10 Maleic acid ( Z )-Butenedioic acid 2.2 19.2 – – 11 Fumaric acid (E )-Butenedioic acid 2.4 19.4 12.1 – 12 Pelargonic acid Nonanoic acid 2.5 19.5 18.5 14.0 13 Citraconic acid (2 Z )-2-Methylbut-2-enedioic acid 1.6 19.6 – – 14 Glutaric acid Pentanedioic acid 2.9 20.7 15.9 12.6 15 2,4-Dihydroxybutyric acid 2,4-Dihydroxybutanoic acid 0.2 21.2 – – 16 3,4-Dihydroxybutyric acid 3,4-Dihydroxybutanoic acid 70.4 21.7 – 13.3 17 Malic acid Hydroxybutanedioic acid 2.8 23.1 – 11.7 18 Adipic acid Hexanedioic acid 1.4 23.2 19.1 14.3 19 4-Hydroxybutyric acid 4-Hydroxybutanoic acid 0.9 23.6 – – 20 Threonic acid 2,3,4-Trihydroxybutanoic acid 1.9 25.0 – – 21 Pimelic acid Heptanedioic acid 3.3 25.6 21.9 15.7 22 Ribonic acid, lactone – 1.8 27.6 – – 23 Tartaric acid 2,3-Dihydroxybutanedioic acid 2.7 26.8 – – 24 Xylonic acid – 2.2 29.7 – – 25 Azelaic acid Nonanedioic acid 10.7 29.7 27.1 18.6 26 Sebacic acid Decanedioic acid 3.5 31.7 29.3 19.6 27 Gulonic acid – 1.1 32.8 – – 28 Glucuronic acid – 4.9 34.1 – – 29 Gluconic acid – 4.2 34.4 – – 30 Mannonic acid, lactone – 2.7 33.8 – – 31 Acrylic acid Prop-2-enoic acid – – 2.1 – 32 Propionic acid Propanoic acid – – 2.2 – 33 Enanthic acid Heptanoic acid – – 12.2 – 34 Methylsuccinic acid Methylbutanedioic acid – – 13.7 11.3 35 Capric acid Decanoic acid – – 21.3 – 36 2-Hydroxyvaleric acid 2-Hydroxypentanoic acid – – 21.6 – 37 8-Hydroxycaprylic acid 8-Hydroxyoctanoic acid – – 22.0 16.4 38 Tricarballylic acid Propane-1,2,3-tricarboxylic acid – – 23.8 16.6 39 Suberic acid Decanedioic acid – – 24.5 17.1 40 Levulinic acid 4-Oxopentanoic acid – – – 9.7 41 3-Hydroxyvaleric acid 3-Hydroxypentanoic acid – – – 12.8 42 6-Oxoenanthic acid 6-Oxoheptanoic acid – – – 13.8 43 2-Hydroxyfumaric acid 2-Hydroxybutenedioic acid – – – 14.4 44 7-Oxocaprylic acid 7-Oxooctanoic acid – – – 15.3 45 Caprylic acid Octanoic acid – – – 15.5 46 8-Oxopelargonic acid 8-Oxononanoic acid – – – 16.7 47 9-Oxopelargonic acid 9-Oxononanoic acid – – – 16.9 48 9-Oxocapric acid 9-Oxodecanoic acid – – – 18.0 49 3-Carboxyadipic acid 1,2,4-Butanetricarboxylic acid – – – 18.4 50 4-Oxosuberic acid 4-Oxooctanedioic acid – – – 18.7 51 4-Hydroxysuberic acid 4-Hydroxyoctanedioic acid – – – 18.8 52 4-Hydroxyazelaic acid 4-Hydroxynonanedioic acid – – – 20.2
Long-chain carboxylic acids: 53 Myristic acid Tetradecanoic acid 1.5 30.7 – – 54 Pentadecanoic acid Pentadecanoic acid 3.1 32.7 32.8 21.6 55 Palmitic acid Hexadecanoic acid 3.8 34.5 34.3 22.6 56 Stearic acid Octadecanoic acid 3.1 38.0 36.7 24.5
Bereitgestellt von | Universität für Bodenkultur Wien (Universität für Bodenkultur Wien)Angemeldet | 172.16.1.226
Heruntergeladen am | 22.06.12 11:28
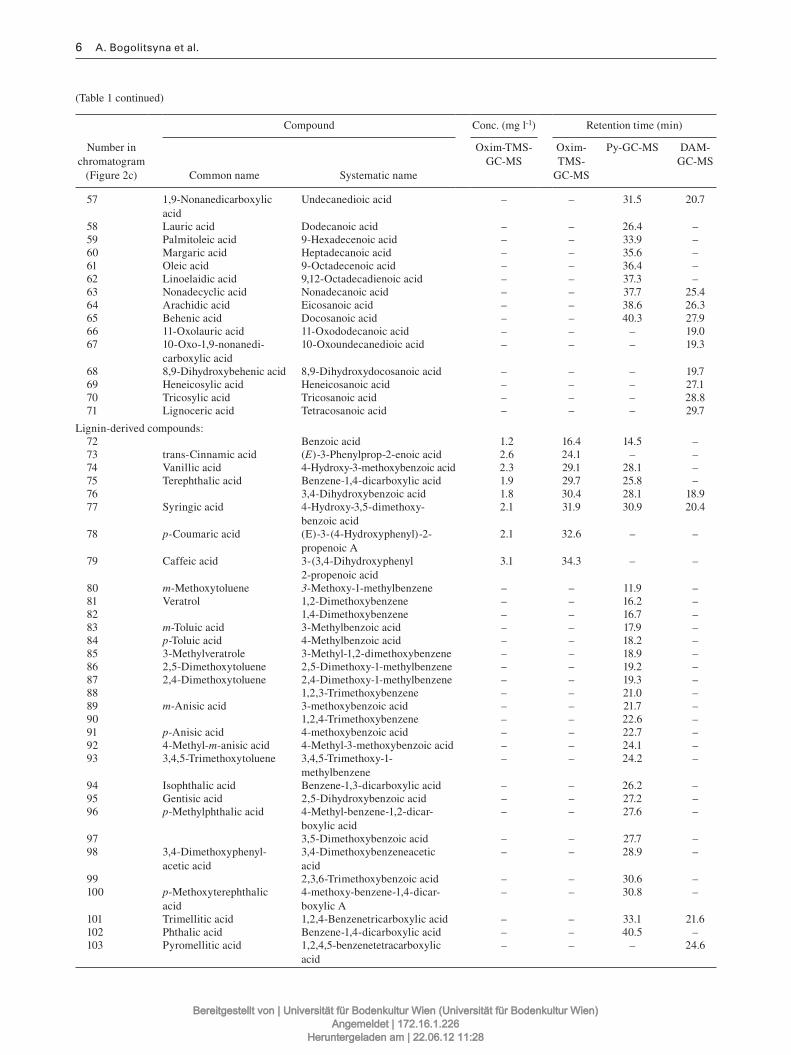
6 A. Bogolitsyna et al.
Number in chromatogram
(Figure 2c)
Compound Conc. (mg l -1 ) Retention time (min)
Common name Systematic name
Oxim-TMS-GC-MS
Oxim-TMS-
GC-MS
Py-GC-MS DAM-GC-MS
57 1,9-Nonanedicarboxylic acid
Undecanedioic acid – – 31.5 20.7
58 Lauric acid Dodecanoic acid – – 26.4 – 59 Palmitoleic acid 9-Hexadecenoic acid – – 33.9 – 60 Margaric acid Heptadecanoic acid – – 35.6 – 61 Oleic acid 9-Octadecenoic acid – – 36.4 – 62 Linoelaidic acid 9,12-Octadecadienoic acid – – 37.3 – 63 Nonadecyclic acid Nonadecanoic acid – – 37.7 25.4 64 Arachidic acid Eicosanoic acid – – 38.6 26.3 65 Behenic acid Docosanoic acid – – 40.3 27.9 66 11-Oxolauric acid 11-Oxododecanoic acid – – – 19.0 67 10-Oxo-1,9-nonanedi-
carboxylic acid10-Oxoundecanedioic acid – – – 19.3
68 8,9-Dihydroxybehenic acid 8,9-Dihydroxydocosanoic acid – – – 19.7 69 Heneicosylic acid Heneicosanoic acid – – – 27.1 70 Tricosylic acid Tricosanoic acid – – – 28.8 71 Lignoceric acid Tetracosanoic acid – – – 29.7
Lignin-derived compounds: 72 Benzoic acid 1.2 16.4 14.5 – 73 trans - Cinnamic acid ( E )-3-Phenylprop-2-enoic acid 2.6 24.1 – – 74 Vanillic acid 4-Hydroxy-3-methoxybenzoic acid 2.3 29.1 28.1 – 75 Terephthalic acid Benzene-1,4-dicarboxylic acid 1.9 29.7 25.8 – 76 3,4-Dihydroxybenzoic acid 1.8 30.4 28.1 18.9 77 Syringic acid 4-Hydroxy-3,5-dimethoxy-
benzoic acid 2.1 31.9 30.9 20.4
78 p- Coumaric acid (E)-3-(4-Hydroxyphenyl)-2-propenoic A
2.1 32.6 – –
79 Caffeic acid 3-(3,4-Dihydroxyphenyl 2-propenoic acid
3.1 34.3 – –
80 m -Methoxytoluene 3 -Methoxy-1-methylbenzene – – 11.9 – 81 Veratrol 1,2-Dimethoxybenzene – – 16.2 – 82 1,4-Dimethoxybenzene – – 16.7 – 83 m -Toluic acid 3-Methylbenzoic acid – – 17.9 – 84 p -Toluic acid 4-Methylbenzoic acid – – 18.2 – 85 3-Methylveratrole 3-Methyl-1,2-dimethoxybenzene – – 18.9 – 86 2,5-Dimethoxytoluene 2,5-Dimethoxy-1-methylbenzene – – 19.2 – 87 2,4-Dimethoxytoluene 2,4-Dimethoxy-1-methylbenzene – – 19.3 – 88 1,2,3-Trimethoxybenzene – – 21.0 – 89 m -Anisic acid 3-methoxybenzoic acid – – 21.7 – 90 1,2,4-Trimethoxybenzene – – 22.6 – 91 p -Anisic acid 4-methoxybenzoic acid – – 22.7 – 92 4-Methyl- m -anisic acid 4-Methyl-3-methoxybenzoic acid – – 24.1 – 93 3,4,5-Trimethoxytoluene 3,4,5-Trimethoxy-1-
methylbenzene – – 24.2 –
94 Isophthalic acid Benzene-1,3-dicarboxylic acid – – 26.2 – 95 Gentisic acid 2,5-Dihydroxybenzoic acid – – 27.2 – 96 p -Methylphthalic acid 4-Methyl-benzene-1,2-dicar-
boxylic acid – – 27.6 –
97 3,5-Dimethoxybenzoic acid – – 27.7 – 98 3,4-Dimethoxypheny l-
acetic acid3,4-Dimethoxybenzeneacetic acid
– – 28.9 –
99 2,3,6-Trimethoxybenzoic acid – – 30.6 – 100 p -Methoxyterephthalic
acid4-methoxy-benzene-1,4-dicar-boxylic A
– – 30.8 –
101 Trimellitic acid 1,2,4-Benzenetricarboxylic acid – – 33.1 21.6 102 Phthalic acid Benzene-1,4-dicarboxylic acid – – 40.5 – 103 Pyromellitic acid 1,2,4,5-benzenetetracarboxylic
acid – – – 24.6
(Table 1 continued)
Bereitgestellt von | Universität für Bodenkultur Wien (Universität für Bodenkultur Wien)Angemeldet | 172.16.1.226
Heruntergeladen am | 22.06.12 11:28
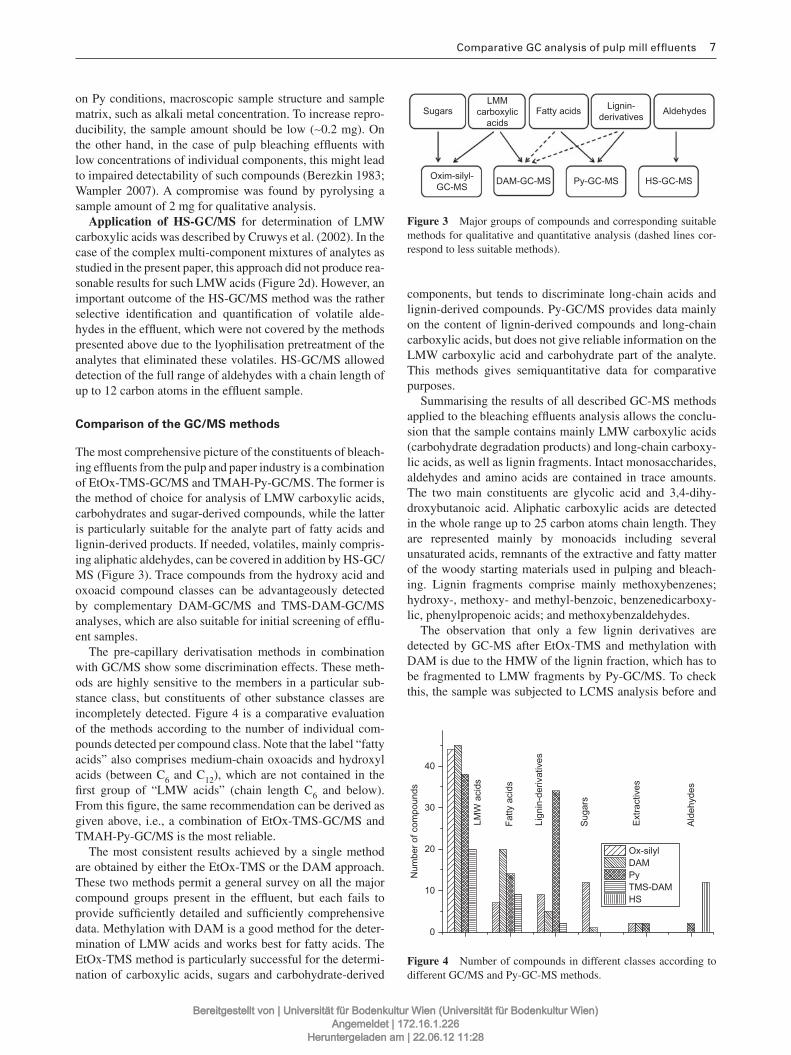
Comparative GC analysis of pulp mill effl uents 7
on Py conditions, macroscopic sample structure and sample matrix, such as alkali metal concentration. To increase repro-ducibility, the sample amount should be low ( ∼ 0.2 mg). On the other hand, in the case of pulp bleaching effl uents with low concentrations of individual components, this might lead to impaired detectability of such compounds (Berezkin 1983 ; Wampler 2007 ). A compromise was found by pyrolysing a sample amount of 2 mg for qualitative analysis.
Application of HS-GC/MS for determination of LMW carboxylic acids was described by Cruwys et al. (2002) . In the case of the complex multi-component mixtures of analytes as studied in the present paper, this approach did not produce rea-sonable results for such LMW acids (Figure 2d). However, an important outcome of the HS-GC/MS method was the rather selective identifi cation and quantifi cation of volatile alde-hydes in the effl uent, which were not covered by the methods presented above due to the lyophilisation pretreatment of the analytes that eliminated these volatiles. HS-GC/MS allowed detection of the full range of aldehydes with a chain length of up to 12 carbon atoms in the effl uent sample.
Comparison of the GC/MS methods
The most comprehensive picture of the constituents of bleach-ing effl uents from the pulp and paper industry is a combination of EtOx-TMS-GC/MS and TMAH-Py-GC/MS. The former is the method of choice for analysis of LMW carboxylic acids, carbohydrates and sugar-derived compounds, while the latter is particularly suitable for the analyte part of fatty acids and lignin-derived products. If needed, volatiles, mainly compris-ing aliphatic aldehydes, can be covered in addition by HS-GC/MS (Figure 3 ). Trace compounds from the hydroxy acid and oxoacid compound classes can be advantageously detected by complementary DAM-GC/MS and TMS-DAM-GC/MS analyses, which are also suitable for initial screening of effl u-ent samples.
The pre-capillary derivatisation methods in combination with GC/MS show some discrimination effects. These meth-ods are highly sensitive to the members in a particular sub-stance class, but constituents of other substance classes are incompletely detected. Figure 4 is a comparative evaluation of the methods according to the number of individual com-pounds detected per compound class. Note that the label “ fatty acids ” also comprises medium-chain oxoacids and hydroxyl acids (between C 6 and C 12 ), which are not contained in the fi rst group of “ LMW acids ” (chain length C 6 and below). From this fi gure, the same recommendation can be derived as given above, i.e., a combination of EtOx-TMS-GC/MS and TMAH-Py-GC/MS is the most reliable.
The most consistent results achieved by a single method are obtained by either the EtOx-TMS or the DAM approach. These two methods permit a general survey on all the major compound groups present in the effl uent, but each fails to provide suffi ciently detailed and suffi ciently comprehensive data. Methylation with DAM is a good method for the deter-mination of LMW acids and works best for fatty acids. The EtOx-TMS method is particularly successful for the determi-nation of carboxylic acids, sugars and carbohydrate-derived
0
10
20
30
40
Ald
ehyd
es
Ext
ract
ives
Sug
ars
Lign
in-d
eriv
ativ
es
Fatty
aci
ds
Num
ber o
f com
poun
ds
Ox-silyl DAM Py TMS-DAM HS
LMW
aci
ds
Figure 4 Number of compounds in different classes according to different GC/MS and Py-GC-MS methods.
Sugars
Oxim-silyl-GC-MS DAM-GC-MS Py-GC-MS HS-GC-MS
LMMcarboxylic
acidsFatty acids Lignin-
derivatives Aldehydes
Figure 3 Major groups of compounds and corresponding suitable methods for qualitative and quantitative analysis (dashed lines cor-respond to less suitable methods).
components, but tends to discriminate long-chain acids and lignin-derived compounds. Py-GC/MS provides data mainly on the content of lignin-derived compounds and long-chain carboxylic acids, but does not give reliable information on the LMW carboxylic acid and carbohydrate part of the analyte. This methods gives semiquantitative data for comparative purposes.
Summarising the results of all described GC-MS methods applied to the bleaching effl uents analysis allows the conclu-sion that the sample contains mainly LMW carboxylic acids (carbohydrate degradation products) and long-chain carboxy-lic acids, as well as lignin fragments. Intact monosaccharides, aldehydes and amino acids are contained in trace amounts. The two main constituents are glycolic acid and 3,4-dihy-droxybutanoic acid. Aliphatic carboxylic acids are detected in the whole range up to 25 carbon atoms chain length. They are represented mainly by monoacids including several unsaturated acids, remnants of the extractive and fatty matter of the woody starting materials used in pulping and bleach-ing. Lignin fragments comprise mainly methoxybenzenes; hydroxy-, methoxy- and methyl-benzoic, benzenedicarboxy-lic, phenylpropenoic acids; and methoxybenzaldehydes.
The observation that only a few lignin derivatives are detected by GC-MS after EtOx-TMS and methylation with DAM is due to the HMW of the lignin fraction, which has to be fragmented to LMW fragments by Py-GC/MS. To check this, the sample was subjected to LCMS analysis before and
Bereitgestellt von | Universität für Bodenkultur Wien (Universität für Bodenkultur Wien)Angemeldet | 172.16.1.226
Heruntergeladen am | 22.06.12 11:28
8 A. Bogolitsyna et al.
after an acidic hydrolysis under conditions typical for deg-radation of oligosaccharidic and polysaccharidic materials. The molecular weights of the constituents in the original sam-ple were mainly in the range of 200 – 600, with a minor part being in the 600 – 1000 range. As no signifi cant changes in the molecular weight were noticed after hydrolytic treatment, the conclusion was drawn that the HMW compounds in the sample correspond to a lignin fraction rather than a carbohy-drate matrix. This is in agreement with the observations by Py-GC/MS.
To get an overview on the actual concentrations of the main effl uent compounds, quantifi cation of LMW car-boxylic acids, fatty acids, lignin derivatives and monosac-charides has been performed (see Table 1, third column). The two main components of the effl uent, glycolic and 3,4-dihydroxy butanoic acid, make up more than two-thirds of the organic matter in the sample, their individual con-tents being 57 mg l -1 and 70 mg l -1 , respectively. It should be noted that the presence of such high amounts of 3,4-dihydroxybutanoic acid has not been reported before for such effl uents. This might be due to the fact that the com-pound is present in a dynamic equilibrium between the open chain and the lactone forms, which make it LC-silent so that it was missed by all previous LC-based analytical approaches. A mechanism for oxidative hexose degradation under conditions relevant for pulp bleaching was described by Hollingsworth (1991) . The proposed main degrada-tion products are the same as found in the present study, i.e., glycolic acid and 3,4-dihydroxybutanoic acid, as also observed by Niemel ä and Sj ö str ö m (1986) during cellulose degradation. The other predominant LMW carboxylic acid compounds in the mixture, such as 3-hydroxypropanoic, azelaic or succinic acid, originate from competitive minor degradation pathways.
Conclusion
The analysis results of bleaching effl uents were dependent on the method applied; no method was free from discrimination effects. The EtOx-TMS or the DAM approach might provide a general map, but not a detailed picture. A combination of EtOx-TMS-GC/MS and Py-GC/MS provides the most com-prehensive account, which can be further complemented by the HS-GC/MS method to cover trace volatile compounds in the effl uent. Such a combined approach allows for identifi ca-tion of a high number of components in the wastewater effl u-ents. The main compounds were 3,4-dihydroxybutyric acid and glycolic acids, along with smaller amounts of other LMW carboxylic acids. In addition, a large number of fatty acids, dimethoxybenzenes, methoxybenzoic acids and other lignin-derived compounds are present.
Acknowledgements
The fi nancial support by the Christian Doppler Research Society (CD lab “ Advanced Cellulose Chemistry and Analytics ” ) and by Lenzing AG, Lenzing, Austria, is gratefully acknowledged.
References
Andrews, M.A. (1989) Capillary gas-chromatographic analysis of monosaccharides: improvements and comparisons using trif-luoroacetylation and trimethylsilylation of sugar O-benzyl- and O-methyl-oximes. Carbohydr. Res. 194:1 – 19.
Becker, M., Liebner, F., Rosenau, T., Potthast, A. (2012) Ethoximation-silylation approach with expanded retention index for mono- and disaccharide analysis by GCMS. J. Chromatogr. A, in press.
Berezkin, V.G. Chemical Methods in Gas Chromatography (Journal of chromatography library, V.24). Elsevier Science Publishers, Amsterdam, The Netherlands, 1983.
Black, T.H. (1983) The preparation and reactions of diazomethane. Aldrichim. Acta 16:3 – 10.
Bogolitsyna, A., Becker, M., Dupont, A.-L., Borgards, A., Rosenau, T., Potthast, A. (2011) Determination of carbohydrate- and lignin-derived components in complex effl uents from cellulose process-ing by capillary electrophoresis with electrospray ionization-mass spectrometric detection. J. Chromatogr. A 1218:8561 – 8566.
Caffaro-Filho, R.A., Wagner, R., Umbuzeiro, G.A., Grossman, M.J., Durrant, L.R. (2010) Identifi cation of alpha-beta unsatu-rated aldehydes as sources of toxicity to activated sludge bio-mass in polyester manufacturing wastewater. Water Sci. Technol. 61:2317 – 2324.
Cruwys, J.A., Dinsdale, R.M., Hawkes, F.R., Hawkes, D.L. (2002) Development of a static headspace gas chromatographic proce-dure for the routine analysis of volatile fatty acids in waste waters. J. Chromatogr. A 945:195 – 209.
Fahmi, R., Bridgwater, A.V., Darvell, L.I., Jones, J.M., Yates, N., Thain, S., Donnison, I.S. (2007) The effect of alkali metals on combustion and pyrolysis of Lolium and Festuca grasses, switch-grass and willow. Fuel 86:1560 – 1569.
Hirschlag, H., K ö ster, R. (1998) Development of a solid-phase extraction and derivatization method for polar carboxylic acids from aqueous extracts of inorganic multi-component incineration residues. Fresenius J. Anal. Chem. 263:274 – 280.
Hollingsworth, R.L. (1991) Process for the preparation of 3,4-dihy-droxybutanoic acid and salts thereof. EP 91114350.1.
Holmbom, B. (1980) A Procedure for Analysis of Toxic Compounds in Pulp and Paper-Mill Waste-Waters. Pap. Puu-Pap. Tim. 62:523 – 531.
K ü hnel, E., Laffan, D.D.P., Lloyd-Jones, G.C., Mart í nez del Campo, T., Shepperson, I.R., Slaughter, J.L. (2007) Mechanism of methyl esterifi cation of carboxylic acids by thrimethylsilyldiazomethane. Angew. Chem. Int. Ed. 46:7075 – 7078.
Kukkola, J., Knuutinen, J., Paasivirta, J., Herve, S., Pessala, P., Schultz, E. (2006) Characterization of high molecular mass material in ECF and TCF bleaching liquors by Py-GC/MS with and without TMAH methylation. J. Anal. Appl. Pyrolysis 76:214 – 221.
Laine, R.A., Sweeley, C.C. (1973) O-methyl oximes of sugars. Analysis as O-trimethylsilyl derivatives by gas-liquid chroma-tography and mass spectrometry. Carbohydr. Res. 27:199 – 213.
Liden, A.G., Berruti, F., Scott, D.S. (1988) A kinetic-model for the production of liquids from the Flash Pyrolysis of Biomass. Chem. Eng. Commun. 65:207 – 221.
Malinen, R., Sj ö str ö m, E. (1975) The formation of carboxylic acids from wood polysaccharides during kraft pulping. Pap. Puu. 11:728 – 736.
Niemel ä , K. (1988) Gas-Liquid Chromatography-Mass Spectrometry Studies on Pine Kraft Black Liquors. 3. The Liberation of Carboxylic-Acids in the Initial Phase of Pulping. J. Chromatogr. 446:247 – 252.
Bereitgestellt von | Universität für Bodenkultur Wien (Universität für Bodenkultur Wien)Angemeldet | 172.16.1.226
Heruntergeladen am | 22.06.12 11:28
Comparative GC analysis of pulp mill effl uents 9
Niemel ä , K., Alen, R. (1999) Characterization of pulping liquors. In: Analytical Methods in Wood Chemistry, Pulping, and Papermaking. Eds. Sj ö str ö m, E., Alen, R. Springer, Heidelberg, Germany. pp. 193 – 231.
Niemel ä , K., Sj ö str ö m, E. (1986) The conversion of cellulose into carboxylic-acids by a drastic alkali treatment. Biomass 11:215 – 221.
Peuravuori, J., Pihlaja, K. (2007) Advanced TMAH and TMAAc thermochemolysis – pyrolysis techniques for molecular character-ization of size-separated fractions from aquatic dissolved organic matter. Anal. Bioanal. Chem. 389:475 – 491.
Pietrogrande, M.C., Bacco, D., Mercuriali, M. (2010) GC-MS analy-sis of low-molecular-weight dicarboxylic acids in atmospheric aerosol: comparison between silylation and esterifi cation deriva-tization procedures. Anal. Bioanal. Chem. 396:877 – 885.
Presser, A., Hufner, A. (2004) Trimethylsilyldiazomethane – a mild and effi cient reagent for the methylation of carboxylic acids and alcohols in natural products. Monatsh. Chem. 135:1015 – 1022.
Raveendran, K., Ganesh, A., Khilar, K.C. (1995) Infl uence of mineral matter on biomass pyrolysis characteristics. Fuel 74:1812 – 1822.
Ristolainen, M., Alen, R., Toivanen, J. (1999) Characterization of totally chlorine-free effl uents from kraft pulp bleaching III – analytical pyrolysis of high-molecular-mass hardwood-derived material. J. Anal. Appl. Pyrol. 52:225 – 237.
Seyferth, D., Dow, A.W., Menzel, H., Flood, T.C. (1968) Trimethylsilyldiazomethane and trimethylsilylcarbene. J. Am. Chem. Soc. 90:1080 – 1082.
Seyferth, D., Menzel, H., Dow, A.W., Flood, T.C. (1972) Trime-thylsilyl-substituted diazoalkanes. I. Trimethylsilyldiazomethane. J. Organomet. Chem. 44:279 – 290.
Wampler, T.P. (2007) Applied Pyrolysis Handbook. CRC Press, Boca Raton, London, New York.
Received January 16, 2012. Accepted April 26, 2012 .
Bereitgestellt von | Universität für Bodenkultur Wien (Universität für Bodenkultur Wien)Angemeldet | 172.16.1.226
Heruntergeladen am | 22.06.12 11:28
91
Paper III Evaluation of different derivatisation approaches for gas
chromatographic‐mass spectrometric analysis of
carbohydrates in complex matrices of biological and synthetic
origin.
Journal of Chromatography A, vol. 1281, pp. 115‐26.
Becker, M.; Zweckmair, T.; Forneck, A.; Rosenau, T.; Potthast, A.; Liebner, F. (2013)
Ess
Ma
b
a
ARRAA
KGCOOTT
1
lcuebQuopecp
t
0h
Journal of Chromatography A, 1281 (2013) 115– 126
Contents lists available at SciVerse ScienceDirect
Journal of Chromatography A
jou rn al h om epage: www.elsev ier .com/ locat e/chroma
valuation of different derivatisation approaches for gas chromatographic–masspectrometric analysis of carbohydrates in complex matrices of biological andynthetic origin
. Beckera, T. Zweckmaira, A. Forneckb, T. Rosenaua, A. Potthasta, F. Liebnera,∗
University of Natural Resources and Life Sciences, Department of Chemistry, Konrad-Lorenz-Str. 24, A-3430 Tulln, AustriaUniversity of Natural Resources and Life Sciences, Department of Crop Sciences, Division of Viticulture and Pomology, Konrad Lorenz-Straße 24, A-3430 Tulln, Austria
r t i c l e i n f o
rticle history:eceived 22 June 2012eceived in revised form 11 January 2013ccepted 14 January 2013vailable online 21 January 2013
eywords:C/MSarbohydrate analysis-isopropylidenationximationrimethylsilylation
a b s t r a c t
Gas chromatographic analysis of complex carbohydrate mixtures requires highly effectiveand reliable derivatisation strategies for successful separation, identification, and quanti-tation of all constituents. Different single-step (per-trimethylsilylation, isopropylidenation)and two-step approaches (ethoximation–trimethylsilylation, ethoximation–trifluoroacetylation,benzoximation–trimethylsilylation, benzoximation–trifluoroacetylation) have been comprehensivelystudied with regard to chromatographic characteristics, informational value of mass spectra, easeof peak assignment, robustness toward matrix effects, and quantitation using a set of referencecompounds that comprise eight monosaccharides (C5–C6), glycolaldehyde, and dihydroxyacetone. Ithas been shown that isopropylidenation and the two oximation-trifluoroacetylation approaches areleast suitable for complex carbohydrate matrices. Whereas the former is limited to compounds thatcontain vicinal dihydroxy moieties in cis configuration, the latter two methods are sensitive to traces of
rifluoroacetylation trifluoroacetic acid which strongly supports decomposition of ketohexoses. It has been demonstratedfor two “real” carbohydrate-rich matrices of biological and synthetic origin, respectively, that two-stepethoximation–trimethylsilylation is superior to other approaches due to the low number of peaksobtained per carbohydrate, good peak separation performance, structural information of mass spectra,low limits of detection and quantitation, minor relative standard deviations, and low sensitivity toward
matrix effects.. Introduction
Analysis of complex carbohydrate mixtures is still a chal-enging issue with regard to separation and identification of allonstituents and reliable quantitation of target compounds. Nat-ral, carbohydrate-rich samples are ubiquitous and include plantxtracts, body fluids, or hydrolysates of polysaccharides (e.g.,iomass processing) and glycoproteins (O- and N-glycans etc.).uantitation of the sugar composition might be required for prod-ct or process control, structure elucidation, or understandingf metabolic processes. Deviations in the natural sugar finger-rint of healthy grapevine parts (leaves, roots), for example, arexpected to provide immediate information about stress situationsaused by drought stress, enhanced UV radiation, fungal attack, or
arasites.On the other hand, carbohydrates play a considerable role inechnical applications where they are used as nonionic surfactants
∗ Corresponding author. Tel.: +43 1 47654 6452; fax: +43 1 47654 6059.E-mail address: [email protected] (F. Liebner).
021-9673/$ – see front matter © 2013 Elsevier B.V. All rights reserved.ttp://dx.doi.org/10.1016/j.chroma.2013.01.053
© 2013 Elsevier B.V. All rights reserved.
(alkyl polyglucosides), natural adhesives, feedstock for bioplas-tics (e.g., polyurethane, polylactide, polyalkanoate), acid stabilizersin food technology, or as a source for bioethanol, organic sol-vents, or fine chemicals such as hydroxymethylfurfural and2,5-dimethylfurane [1]. The huge global sugar consumption, theincreasing number of carbohydrate-based industrial applications,and the awakening awareness of the necessity of utilizing alter-native carbohydrate sources are some of the reasons that recentlyfortified efforts to establish synthetic approaches to low-molecularcarbohydrates. The reaction of formaldehyde with calcium hydrox-ide, known as formose reaction, is regarded as a promising syntheticapproach in this respect even though the complexity of the reac-tion mixtures would render the isolation of individual compoundsa challenging task.
Regardless of their biological or synthetic origin, both of thesample matrices described above are characterized by a complexcarbohydrate composition with constituents that vary significantly
in molecular weight and polarity [2,3]. Depending on their origin,analysis of the sugar pattern is interfered by further constituentsthat add to the complexity of the matrix, and may interfere withanalysis and derivatisation [4].
1 atogr
tmrmlattdEtcti
ssctbblstyiea�chstvm
cicth
sotcdobnsf
cr
pfmdbgcot
16 M. Becker et al. / J. Chrom
Capillary gas chromatography (GC) is a powerful separationechnique that complements high performance liquid chro-
atography and capillary electrophoresis. In particular, the higheproducibility, lower sensitivity of the separation column towardatrix effects, and the availability of comprehensive mass spectra
ibraries render GC in combination with mass spectroscopy (MS) powerful technique for quantitative analysis of complex mix-ures. However, unlike HPLC, polar, hydrophilic, low-volatile, orhermally sensitive compounds like carbohydrates are not suited toirect analysis by GC/MS and require preceding derivatisation [5].ffective derivatisation strategies have been developed to increasehe signal intensity and stability of derivatives, to improve theompound-specific fragmentation pattern, and to allow for simul-aneous analysis of both lower and higher molecular compoundsn one run.
High-performance GC/MS analysis requires derivatisationtrategies that allow for simultaneous analysis of a wide range oftructurally different targeted and non-targeted compounds, suffi-ient chromatographic resolution, and high informational value ofhe obtained mass spectra. The latter are both required for unam-iguous peak assignment and quantitation, respectively, and cane controlled by choosing a suitable derivatisation reagent [6]. Sily-
ation, methylation, acetylation, and trifluoroacetylation (TFA) areingle-step derivatising techniques that are widely employed inhe analysis of polyalcohols and non-reducing sugars [7]. The anal-sis of reducing sugars is more challenging due to the variety ofsomers that co-exist in aqueous solutions with instable hemiac-tals being usually the dominating species [8]. Derivatisation of anldohexose, for example, can theoretically afford five tautomers:- and �-pyranose, �- and �-furanose, and the respective open-hain aldohexose [9]. Two- or multi-step derivatisation proceduresave been developed for GC/MS analysis of carbohydrate-richamples to reduce the number of isomer-derived peaks ando improve both chromatographic resolution and informationalalue of mass spectra, which is of particular use for complexatrices [10].Two-step derivatisation approaches commonly convert first the
arbonyl group into a specific derivative that no longer supportsnterconversion of the different tautomers described above [6]. Thisan be accomplished either by reduction, which affords the respec-ive primary alcohols (alditols), or by oximation using (substituted)ydroxylamine.
In the second step, the remaining “un-protected” primary andecondary hydroxyl groups are derivatised such as by (triflu-ro) acetylation (alditol acetates, oxime acetates), which leaveshe originally polar carbohydrates lipophilic compounds with aonsiderably higher volatility. However, even though two-steperivatisation approaches have commonly the great advantage thatnly one or two derivatives for each sugar is formed, their applica-ility suffers sometimes from certain weaknesses such as the largeumber of manual processing steps needed or the fact one and theame derivative can be formed from different sugars as reportedor alditol acetates [10].
Unlike reduction, oximation quantitatively converts reducingarbohydrates that preferably form cyclic hemiacetals into the cor-esponding open-chain aldose derivatives.
During this process, the anomeric carbon atom is converted viarochiral aldehyde groups into a stereo isomeric center that canorm the corresponding syn- and anti-isomers. The benefit of oxi-
ation from the analytical point of view is that the number oferivatisation products obtained from reducing carbohydrates cane reduced from five to two peaks [8,11], and even down to one sin-
le peak for aldoses if the latter are dehydrated and subsequentlyonverted into the respective aldonitrile acetates [10]. In general,ximation simultaneously improves the chromatographic resolu-ion; it disperses and, therefore, separates peaks originating from. A 1281 (2013) 115– 126
reducing sugars and those derived from alditols or lactones [8] andprotects �-keto acids from decarboxylation [5].
The conversion of reducing sugars into oxime derivativeshas been recently advanced using O-alkylated or O-aralkylsubstituted hydroxylamines, such as O-methylhydroxylamine[8],O-ethylhydroxylamine [4,12] and O-benzylhydroxylamine [8],commonly applied as the respective hydrochloride, instead of theunsubstituted oximation reagent [13]. This measure has been con-firmed as affording a higher oximation performance due to bothhigher nucleophilicity of the amine and higher informational valueof the respective mass spectra [14].
Cu(II)-catalyzed formation of cyclic O-isopropylidene deriva-tives [15] under acidic conditions using acetone as derivatisingagent is another technique that has been successfully appliedto carbohydrate analysis. The low mass increment of 20 g mol−1
introduced per hydroxyl group (96 g mol−1 for trifluoroacetylation,72 g mol−1 for trimethylsilylation) is probably the major advantageof this derivatisation approach [5].
The aim of the current study was to evaluate different derivati-sation approaches with regard to their performance for GC/MSanalysis of carbohydrate-rich, complex matrices. The evaluationcriteria were derivatisation efficiency, chromatographic charac-teristics (number of isomers formed per compound, resolutionetc.), analytical sensitivity (limit of detection), informational valueof mass spectra and hence reliability of peak assignment, repro-ducibility of quantification results, and robustness toward matrixeffects. Besides common single-step derivatisation techniques,such as per-trimethylsilylation and O-isopropylidenation, two-step approaches comprising sequential oximation (with O-ethyl-or O-benzylhydroxylamine) followed by trifluoroacetylation ortrimethylsilylation were also studied. The different derivatisationapproaches were compared using a set of eight monosaccharides(C5 to C6), glycolaldehyde (GA), and dihydroxyacetone (DHA). Eventhough the latter two compounds are not members of the monosac-charide family in the strict sense due to the lacking stereo center,these di- (GA) and trioses (DHA) were included in the study as theyare involved in many metabolic processes. The different derivatisa-tion methods were also applied to “real” carbohydrate-rich samplesof biological and synthetic origin to verify the results obtainedfor the set of reference compounds described above. Furthermore,their robustness toward matrix effects was investigated based onrecovery rates, which were determined by a standard additionapproach.
2. Materials and methods
2.1. Chemicals and reagents
All reference compounds (Table 1), the internal standardmethyl �-d-galactopyranoside, calcium hydroxide, anhy-drous pyridine, 36% aqueous formaldehyde stabilized withCH3OH, anhydrous CuSO4, molecular sieve 3 A, anhydroussodium carbonate, dichloromethane (DCM), ethyl acetate,N,O-bis(trimethylsilyl)trifluoroacetamide (BSTFA), N-methyl-bis(trifluoroacetamide) (MBTFA), O-ethylhydroxylaminehydrochloride, O-benzylhydroxylamine hydrochloride and4-(dimethylamino)pyridine (DMAP) were purchased fromSigma–Aldrich (Sigma–Aldrich Handels GmbH, Vienna, Austria).d-glucose-13C6, 99 atom% 13C6 (13C-glucose) were supplied byIsotec, Miamisburg, OH, USA. Methanol, sulfuric acid, hydrochloricacid, and anhydrous acetone were obtained from Carl Roth (Graz,
Austria). Acetone used for preparation of O-isopropylidene deriva-tives was further dried over freshly vacuum-dried molecular sieve3 A in an argon atmosphere for two days. Sodium hydroxide wasobtained from Merck (Vienna, Austria). All standards, chemicals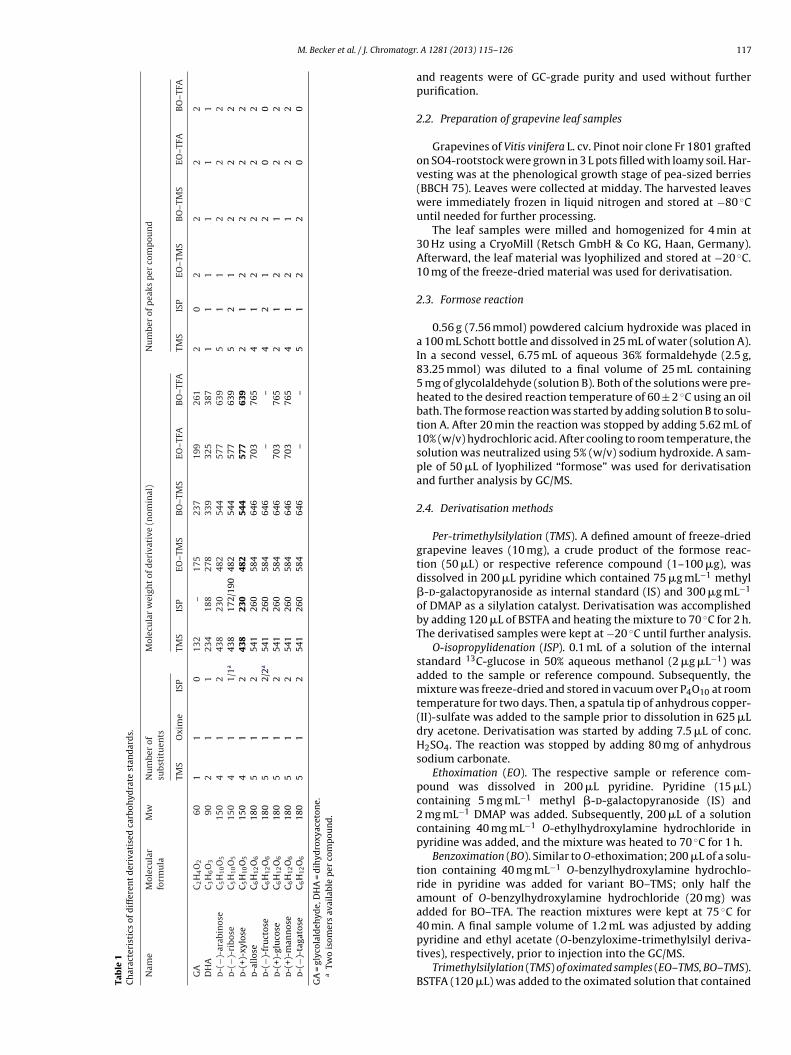
M. Becker et al. / J. Chromatogr
Tab
le
1C
har
acte
rist
ics
of
dif
fere
nt
der
ivat
ised
carb
ohyd
rate
stan
dar
ds.
Nam
e
Mol
ecu
lar
form
ula
Mw
Nu
mbe
r
ofsu
bsti
tuen
tsM
olec
ula
r
wei
ght
of
der
ivat
ive
(nom
inal
)
Nu
mbe
r
of
pea
ks
per
com
pou
nd
TMS
Oxi
me
ISP
TMS
ISP
EO–T
MS
BO
–TM
S
EO–T
FA
BO
–TFA
TMS
ISP
EO–T
MS
BO
–TM
S EO
–TFA
BO
–TFA
GA
C2H
4O
260
11
0
132
–
175
237
199
261
2
0
2
2
2
2D
HA
C3H
6O
390
2
1
1
234
188
278
339
325
387
1
1
1
1 1
1d
-(−)
-ara
bin
ose
C5H
10O
515
0
4
1
2
438
230
482
544
577
639
5
1
1
2 2
2d
-(−)
-rib
ose
C5H
10O
515
0
4
1
1/1a
438
172/
190
482
544
577
639
5
2
1
2
2
2d
-(+)
-xyl
ose
C5H
10O
515
0
4
1
2
438
230
482
544
577
639
2
1
2
2
2
2d
-all
ose
C6H
12O
618
05
12
541
260
584
646
703
765
4
1
2
2
2
2d
-(−)
-fru
ctos
e
C6H
12O
618
0
5
1
2/2a
541
260
584
646
–
–
4
2
1 2
0
0d
-(+)
-glu
cose
C6H
12O
618
0
5
1
2
541
260
584
646
703
765
2
1
2 1
2
2d
-(+)
-man
nos
e
C6H
12O
618
0
5
1
2
541
260
584
646
703
765
4
1
2
1
2
2d
-(−)
-tag
atos
e
C6H
12O
618
0
5
1
2
541
260
584
646
–
–
5
1 2
2
0
0
GA
=
glyc
olal
deh
yde,
DH
A
=
dih
ydro
xyac
eton
e.a
Two
isom
ers
avai
labl
e
per
com
pou
nd
.
. A 1281 (2013) 115– 126 117
and reagents were of GC-grade purity and used without furtherpurification.
2.2. Preparation of grapevine leaf samples
Grapevines of Vitis vinifera L. cv. Pinot noir clone Fr 1801 graftedon SO4-rootstock were grown in 3 L pots filled with loamy soil. Har-vesting was at the phenological growth stage of pea-sized berries(BBCH 75). Leaves were collected at midday. The harvested leaveswere immediately frozen in liquid nitrogen and stored at −80 ◦Cuntil needed for further processing.
The leaf samples were milled and homogenized for 4 min at30 Hz using a CryoMill (Retsch GmbH & Co KG, Haan, Germany).Afterward, the leaf material was lyophilized and stored at −20 ◦C.10 mg of the freeze-dried material was used for derivatisation.
2.3. Formose reaction
0.56 g (7.56 mmol) powdered calcium hydroxide was placed ina 100 mL Schott bottle and dissolved in 25 mL of water (solution A).In a second vessel, 6.75 mL of aqueous 36% formaldehyde (2.5 g,83.25 mmol) was diluted to a final volume of 25 mL containing5 mg of glycolaldehyde (solution B). Both of the solutions were pre-heated to the desired reaction temperature of 60 ± 2 ◦C using an oilbath. The formose reaction was started by adding solution B to solu-tion A. After 20 min the reaction was stopped by adding 5.62 mL of10% (w/v) hydrochloric acid. After cooling to room temperature, thesolution was neutralized using 5% (w/v) sodium hydroxide. A sam-ple of 50 �L of lyophilized “formose” was used for derivatisationand further analysis by GC/MS.
2.4. Derivatisation methods
Per-trimethylsilylation (TMS). A defined amount of freeze-driedgrapevine leaves (10 mg), a crude product of the formose reac-tion (50 �L) or respective reference compound (1–100 �g), wasdissolved in 200 �L pyridine which contained 75 �g mL−1 methyl�-d-galactopyranoside as internal standard (IS) and 300 �g mL−1
of DMAP as a silylation catalyst. Derivatisation was accomplishedby adding 120 �L of BSTFA and heating the mixture to 70 ◦C for 2 h.The derivatised samples were kept at −20 ◦C until further analysis.
O-isopropylidenation (ISP). 0.1 mL of a solution of the internalstandard 13C-glucose in 50% aqueous methanol (2 �g �L−1) wasadded to the sample or reference compound. Subsequently, themixture was freeze-dried and stored in vacuum over P4O10 at roomtemperature for two days. Then, a spatula tip of anhydrous copper-(II)-sulfate was added to the sample prior to dissolution in 625 �Ldry acetone. Derivatisation was started by adding 7.5 �L of conc.H2SO4. The reaction was stopped by adding 80 mg of anhydroussodium carbonate.
Ethoximation (EO). The respective sample or reference com-pound was dissolved in 200 �L pyridine. Pyridine (15 �L)containing 5 mg mL−1 methyl �-d-galactopyranoside (IS) and2 mg mL−1 DMAP was added. Subsequently, 200 �L of a solutioncontaining 40 mg mL−1 O-ethylhydroxylamine hydrochloride inpyridine was added, and the mixture was heated to 70 ◦C for 1 h.
Benzoximation (BO). Similar to O-ethoximation; 200 �L of a solu-tion containing 40 mg mL−1 O-benzylhydroxylamine hydrochlo-ride in pyridine was added for variant BO–TMS; only half theamount of O-benzylhydroxylamine hydrochloride (20 mg) wasadded for BO–TFA. The reaction mixtures were kept at 75 ◦C for40 min. A final sample volume of 1.2 mL was adjusted by adding
pyridine and ethyl acetate (O-benzyloxime-trimethylsilyl deriva-tives), respectively, prior to injection into the GC/MS.Trimethylsilylation (TMS) of oximated samples (EO–TMS, BO–TMS).BSTFA (120 �L) was added to the oximated solution that contained
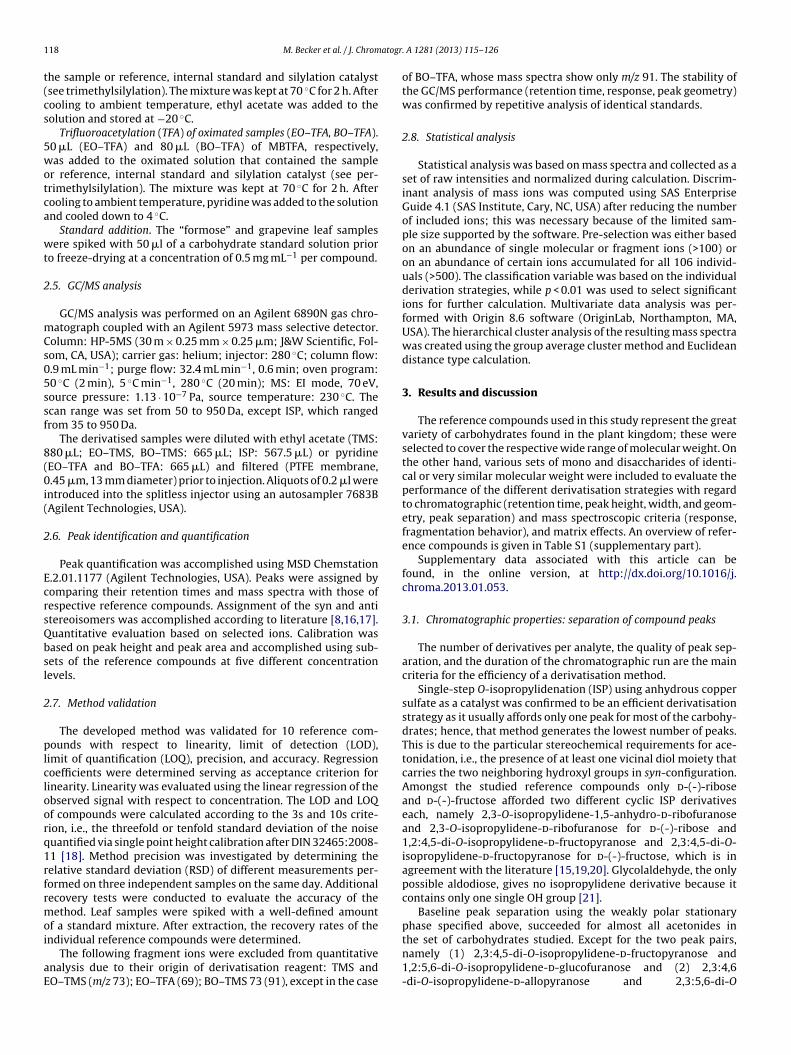
1 atogr
t(cs
5wotca
wt
2
mCs05ssf
8(0i(
2
EcrsQbsl
2
plcloorq1rfrmoi
aE
18 M. Becker et al. / J. Chrom
he sample or reference, internal standard and silylation catalystsee trimethylsilylation). The mixture was kept at 70 ◦C for 2 h. Afterooling to ambient temperature, ethyl acetate was added to theolution and stored at −20 ◦C.
Trifluoroacetylation (TFA) of oximated samples (EO–TFA, BO–TFA).0 �L (EO–TFA) and 80 �L (BO–TFA) of MBTFA, respectively,as added to the oximated solution that contained the sample
r reference, internal standard and silylation catalyst (see per-rimethylsilylation). The mixture was kept at 70 ◦C for 2 h. Afterooling to ambient temperature, pyridine was added to the solutionnd cooled down to 4 ◦C.
Standard addition. The “formose” and grapevine leaf samplesere spiked with 50 �l of a carbohydrate standard solution prior
o freeze-drying at a concentration of 0.5 mg mL−1 per compound.
.5. GC/MS analysis
GC/MS analysis was performed on an Agilent 6890N gas chro-atograph coupled with an Agilent 5973 mass selective detector.
olumn: HP-5MS (30 m × 0.25 mm × 0.25 �m; J&W Scientific, Fol-om, CA, USA); carrier gas: helium; injector: 280 ◦C; column flow:.9 mL min−1; purge flow: 32.4 mL min−1, 0.6 min; oven program:0 ◦C (2 min), 5 ◦C min−1, 280 ◦C (20 min); MS: EI mode, 70 eV,ource pressure: 1.13 · 10−7 Pa, source temperature: 230 ◦C. Thecan range was set from 50 to 950 Da, except ISP, which rangedrom 35 to 950 Da.
The derivatised samples were diluted with ethyl acetate (TMS:80 �L; EO–TMS, BO–TMS: 665 �L; ISP: 567.5 �L) or pyridineEO–TFA and BO–TFA: 665 �L) and filtered (PTFE membrane,.45 �m, 13 mm diameter) prior to injection. Aliquots of 0.2 �l were
ntroduced into the splitless injector using an autosampler 7683BAgilent Technologies, USA).
.6. Peak identification and quantification
Peak quantification was accomplished using MSD Chemstation.2.01.1177 (Agilent Technologies, USA). Peaks were assigned byomparing their retention times and mass spectra with those ofespective reference compounds. Assignment of the syn and antitereoisomers was accomplished according to literature [8,16,17].uantitative evaluation based on selected ions. Calibration wasased on peak height and peak area and accomplished using sub-ets of the reference compounds at five different concentrationevels.
.7. Method validation
The developed method was validated for 10 reference com-ounds with respect to linearity, limit of detection (LOD),
imit of quantification (LOQ), precision, and accuracy. Regressionoefficients were determined serving as acceptance criterion forinearity. Linearity was evaluated using the linear regression of thebserved signal with respect to concentration. The LOD and LOQf compounds were calculated according to the 3s and 10s crite-ion, i.e., the threefold or tenfold standard deviation of the noiseuantified via single point height calibration after DIN 32465:2008-1 [18]. Method precision was investigated by determining theelative standard deviation (RSD) of different measurements per-ormed on three independent samples on the same day. Additionalecovery tests were conducted to evaluate the accuracy of theethod. Leaf samples were spiked with a well-defined amount
f a standard mixture. After extraction, the recovery rates of the
ndividual reference compounds were determined.The following fragment ions were excluded from quantitativenalysis due to their origin of derivatisation reagent: TMS andO–TMS (m/z 73); EO–TFA (69); BO–TMS 73 (91), except in the case
. A 1281 (2013) 115– 126
of BO–TFA, whose mass spectra show only m/z 91. The stability ofthe GC/MS performance (retention time, response, peak geometry)was confirmed by repetitive analysis of identical standards.
2.8. Statistical analysis
Statistical analysis was based on mass spectra and collected as aset of raw intensities and normalized during calculation. Discrim-inant analysis of mass ions was computed using SAS EnterpriseGuide 4.1 (SAS Institute, Cary, NC, USA) after reducing the numberof included ions; this was necessary because of the limited sam-ple size supported by the software. Pre-selection was either basedon an abundance of single molecular or fragment ions (>100) oron an abundance of certain ions accumulated for all 106 individ-uals (>500). The classification variable was based on the individualderivation strategies, while p < 0.01 was used to select significantions for further calculation. Multivariate data analysis was per-formed with Origin 8.6 software (OriginLab, Northampton, MA,USA). The hierarchical cluster analysis of the resulting mass spectrawas created using the group average cluster method and Euclideandistance type calculation.
3. Results and discussion
The reference compounds used in this study represent the greatvariety of carbohydrates found in the plant kingdom; these wereselected to cover the respective wide range of molecular weight. Onthe other hand, various sets of mono and disaccharides of identi-cal or very similar molecular weight were included to evaluate theperformance of the different derivatisation strategies with regardto chromatographic (retention time, peak height, width, and geom-etry, peak separation) and mass spectroscopic criteria (response,fragmentation behavior), and matrix effects. An overview of refer-ence compounds is given in Table S1 (supplementary part).
Supplementary data associated with this article can befound, in the online version, at http://dx.doi.org/10.1016/j.chroma.2013.01.053.
3.1. Chromatographic properties: separation of compound peaks
The number of derivatives per analyte, the quality of peak sep-aration, and the duration of the chromatographic run are the maincriteria for the efficiency of a derivatisation method.
Single-step O-isopropylidenation (ISP) using anhydrous coppersulfate as a catalyst was confirmed to be an efficient derivatisationstrategy as it usually affords only one peak for most of the carbohy-drates; hence, that method generates the lowest number of peaks.This is due to the particular stereochemical requirements for ace-tonidation, i.e., the presence of at least one vicinal diol moiety thatcarries the two neighboring hydroxyl groups in syn-configuration.Amongst the studied reference compounds only d-(-)-riboseand d-(-)-fructose afforded two different cyclic ISP derivativeseach, namely 2,3-O-isopropylidene-1,5-anhydro-d-ribofuranoseand 2,3-O-isopropylidene-d-ribofuranose for d-(-)-ribose and1,2:4,5-di-O-isopropylidene-d-fructopyranose and 2,3:4,5-di-O-isopropylidene-d-fructopyranose for d-(-)-fructose, which is inagreement with the literature [15,19,20]. Glycolaldehyde, the onlypossible aldodiose, gives no isopropylidene derivative because itcontains only one single OH group [21].
Baseline peak separation using the weakly polar stationaryphase specified above, succeeded for almost all acetonides in
the set of carbohydrates studied. Except for the two peak pairs,namely (1) 2,3:4,5-di-O-isopropylidene-d-fructopyranose and1,2:5,6-di-O-isopropylidene-d-glucofuranose and (2) 2,3:4,6-di-O-isopropylidene-d-allopyranose and 2,3:5,6-di-O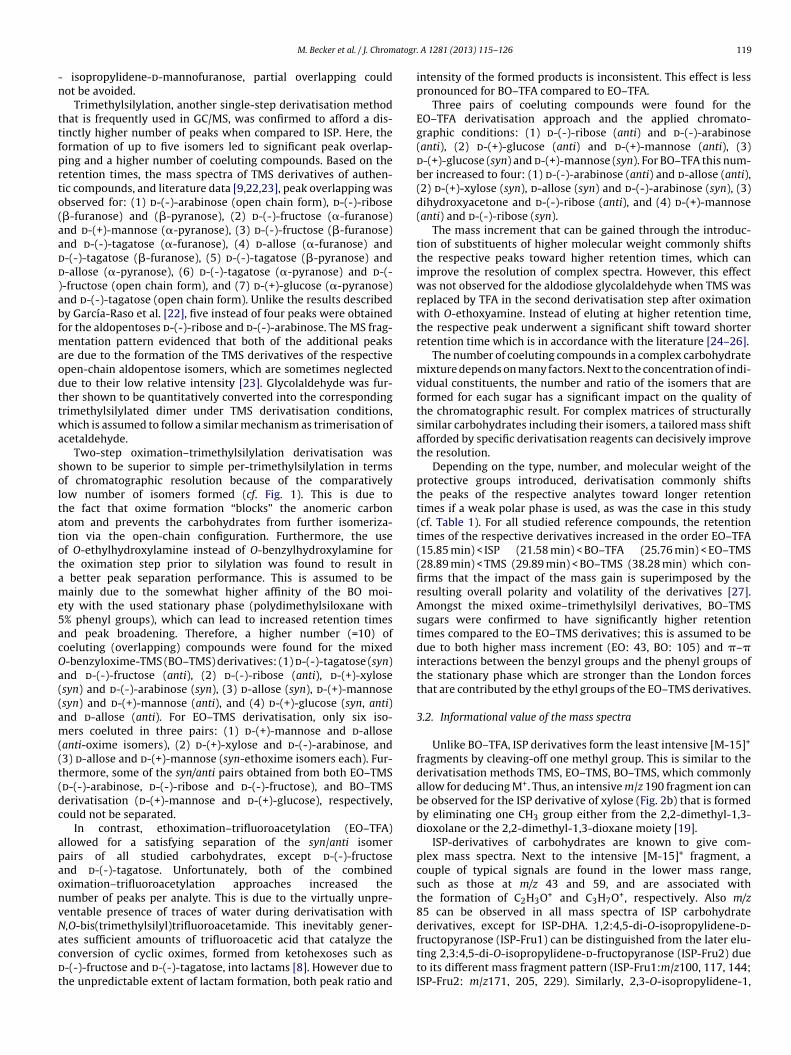
atogr
-n
ttfprto(aadd)abfmaodttwa
soltatotame5acOa((am((t(dc
apaonvNacdt
M. Becker et al. / J. Chrom
isopropylidene-d-mannofuranose, partial overlapping couldot be avoided.
Trimethylsilylation, another single-step derivatisation methodhat is frequently used in GC/MS, was confirmed to afford a dis-inctly higher number of peaks when compared to ISP. Here, theormation of up to five isomers led to significant peak overlap-ing and a higher number of coeluting compounds. Based on theetention times, the mass spectra of TMS derivatives of authen-ic compounds, and literature data [9,22,23], peak overlapping wasbserved for: (1) d-(-)-arabinose (open chain form), d-(-)-ribose�-furanose) and (�-pyranose), (2) d-(-)-fructose (�-furanose)nd d-(+)-mannose (�-pyranose), (3) d-(-)-fructose (�-furanose)nd d-(-)-tagatose (�-furanose), (4) d-allose (�-furanose) and-(-)-tagatose (�-furanose), (5) d-(-)-tagatose (�-pyranose) and-allose (�-pyranose), (6) d-(-)-tagatose (�-pyranose) and d-(--fructose (open chain form), and (7) d-(+)-glucose (�-pyranose)nd d-(-)-tagatose (open chain form). Unlike the results describedy García-Raso et al. [22], five instead of four peaks were obtainedor the aldopentoses d-(-)-ribose and d-(-)-arabinose. The MS frag-
entation pattern evidenced that both of the additional peaksre due to the formation of the TMS derivatives of the respectivepen-chain aldopentose isomers, which are sometimes neglectedue to their low relative intensity [23]. Glycolaldehyde was fur-her shown to be quantitatively converted into the correspondingrimethylsilylated dimer under TMS derivatisation conditions,hich is assumed to follow a similar mechanism as trimerisation of
cetaldehyde.Two-step oximation–trimethylsilylation derivatisation was
hown to be superior to simple per-trimethylsilylation in termsf chromatographic resolution because of the comparativelyow number of isomers formed (cf. Fig. 1). This is due tohe fact that oxime formation “blocks” the anomeric carbontom and prevents the carbohydrates from further isomeriza-ion via the open-chain configuration. Furthermore, the usef O-ethylhydroxylamine instead of O-benzylhydroxylamine forhe oximation step prior to silylation was found to result in
better peak separation performance. This is assumed to beainly due to the somewhat higher affinity of the BO moi-
ty with the used stationary phase (polydimethylsiloxane with% phenyl groups), which can lead to increased retention timesnd peak broadening. Therefore, a higher number (=10) ofoeluting (overlapping) compounds were found for the mixed-benzyloxime-TMS (BO–TMS) derivatives: (1) d-(-)-tagatose (syn)nd d-(-)-fructose (anti), (2) d-(-)-ribose (anti), d-(+)-xylosesyn) and d-(-)-arabinose (syn), (3) d-allose (syn), d-(+)-mannosesyn) and d-(+)-mannose (anti), and (4) d-(+)-glucose (syn, anti)nd d-allose (anti). For EO–TMS derivatisation, only six iso-ers coeluted in three pairs: (1) d-(+)-mannose and d-allose
anti-oxime isomers), (2) d-(+)-xylose and d-(-)-arabinose, and3) d-allose and d-(+)-mannose (syn-ethoxime isomers each). Fur-hermore, some of the syn/anti pairs obtained from both EO–TMSd-(-)-arabinose, d-(-)-ribose and d-(-)-fructose), and BO–TMSerivatisation (d-(+)-mannose and d-(+)-glucose), respectively,ould not be separated.
In contrast, ethoximation–trifluoroacetylation (EO–TFA)llowed for a satisfying separation of the syn/anti isomerairs of all studied carbohydrates, except d-(-)-fructosend d-(-)-tagatose. Unfortunately, both of the combinedximation–trifluoroacetylation approaches increased theumber of peaks per analyte. This is due to the virtually unpre-entable presence of traces of water during derivatisation with,O-bis(trimethylsilyl)trifluoroacetamide. This inevitably gener-
tes sufficient amounts of trifluoroacetic acid that catalyze theonversion of cyclic oximes, formed from ketohexoses such as-(-)-fructose and d-(-)-tagatose, into lactams [8]. However due tohe unpredictable extent of lactam formation, both peak ratio and. A 1281 (2013) 115– 126 119
intensity of the formed products is inconsistent. This effect is lesspronounced for BO–TFA compared to EO–TFA.
Three pairs of coeluting compounds were found for theEO–TFA derivatisation approach and the applied chromato-graphic conditions: (1) d-(-)-ribose (anti) and d-(-)-arabinose(anti), (2) d-(+)-glucose (anti) and d-(+)-mannose (anti), (3)d-(+)-glucose (syn) and d-(+)-mannose (syn). For BO–TFA this num-ber increased to four: (1) d-(-)-arabinose (anti) and d-allose (anti),(2) d-(+)-xylose (syn), d-allose (syn) and d-(-)-arabinose (syn), (3)dihydroxyacetone and d-(-)-ribose (anti), and (4) d-(+)-mannose(anti) and d-(-)-ribose (syn).
The mass increment that can be gained through the introduc-tion of substituents of higher molecular weight commonly shiftsthe respective peaks toward higher retention times, which canimprove the resolution of complex spectra. However, this effectwas not observed for the aldodiose glycolaldehyde when TMS wasreplaced by TFA in the second derivatisation step after oximationwith O-ethoxyamine. Instead of eluting at higher retention time,the respective peak underwent a significant shift toward shorterretention time which is in accordance with the literature [24–26].
The number of coeluting compounds in a complex carbohydratemixture depends on many factors. Next to the concentration of indi-vidual constituents, the number and ratio of the isomers that areformed for each sugar has a significant impact on the quality ofthe chromatographic result. For complex matrices of structurallysimilar carbohydrates including their isomers, a tailored mass shiftafforded by specific derivatisation reagents can decisively improvethe resolution.
Depending on the type, number, and molecular weight of theprotective groups introduced, derivatisation commonly shiftsthe peaks of the respective analytes toward longer retentiontimes if a weak polar phase is used, as was the case in this study(cf. Table 1). For all studied reference compounds, the retentiontimes of the respective derivatives increased in the order EO–TFA(15.85 min) < ISP (21.58 min) < BO–TFA (25.76 min) < EO–TMS(28.89 min) < TMS (29.89 min) < BO–TMS (38.28 min) which con-firms that the impact of the mass gain is superimposed by theresulting overall polarity and volatility of the derivatives [27].Amongst the mixed oxime–trimethylsilyl derivatives, BO–TMSsugars were confirmed to have significantly higher retentiontimes compared to the EO–TMS derivatives; this is assumed to bedue to both higher mass increment (EO: 43, BO: 105) and �–�interactions between the benzyl groups and the phenyl groups ofthe stationary phase which are stronger than the London forcesthat are contributed by the ethyl groups of the EO–TMS derivatives.
3.2. Informational value of the mass spectra
Unlike BO–TFA, ISP derivatives form the least intensive [M-15]+
fragments by cleaving-off one methyl group. This is similar to thederivatisation methods TMS, EO–TMS, BO–TMS, which commonlyallow for deducing M+. Thus, an intensive m/z 190 fragment ion canbe observed for the ISP derivative of xylose (Fig. 2b) that is formedby eliminating one CH3 group either from the 2,2-dimethyl-1,3-dioxolane or the 2,2-dimethyl-1,3-dioxane moiety [19].
ISP-derivatives of carbohydrates are known to give com-plex mass spectra. Next to the intensive [M-15]+ fragment, acouple of typical signals are found in the lower mass range,such as those at m/z 43 and 59, and are associated withthe formation of C2H3O+ and C3H7O+, respectively. Also m/z85 can be observed in all mass spectra of ISP carbohydratederivatives, except for ISP-DHA. 1,2:4,5-di-O-isopropylidene-d-
fructopyranose (ISP-Fru1) can be distinguished from the later elu-ting 2,3:4,5-di-O-isopropylidene-d-fructopyranose (ISP-Fru2) dueto its different mass fragment pattern (ISP-Fru1:m/z100, 117, 144;ISP-Fru2: m/z171, 205, 229). Similarly, 2,3-O-isopropylidene-1,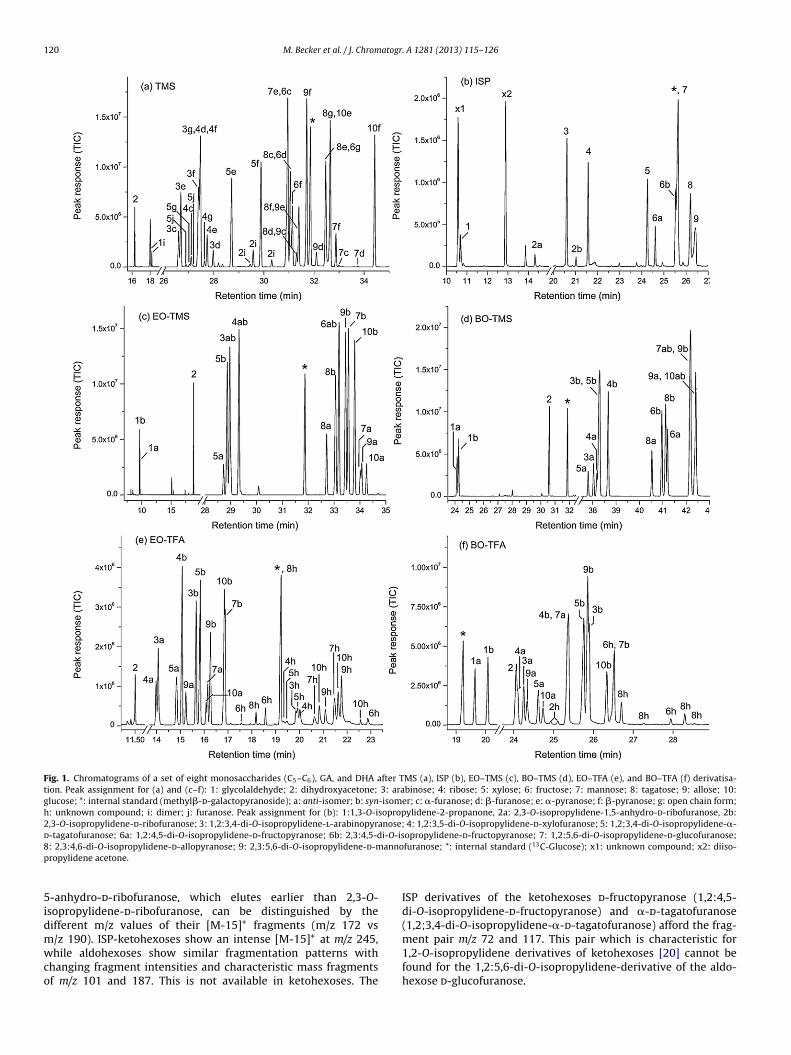
120 M. Becker et al. / J. Chromatogr. A 1281 (2013) 115– 126
Fig. 1. Chromatograms of a set of eight monosaccharides (C5–C6), GA, and DHA after TMS (a), ISP (b), EO–TMS (c), BO–TMS (d), EO–TFA (e), and BO–TFA (f) derivatisa-tion. Peak assignment for (a) and (c–f): 1: glycolaldehyde; 2: dihydroxyacetone; 3: arabinose; 4: ribose; 5: xylose; 6: fructose; 7: mannose; 8: tagatose; 9: allose; 10:glucose; *: internal standard (methyl�-d-galactopyranoside); a: anti-isomer; b: syn-isomer; c: �-furanose; d: �-furanose; e: �-pyranose; f: �-pyranose; g: open chain form;h: unknown compound; i: dimer; j: furanose. Peak assignment for (b): 1:1,3-O-isopropylidene-2-propanone, 2a: 2,3-O-isopropylidene-1,5-anhydro-d-ribofuranose, 2b:2,3-O-isopropylidene-d-ribofuranose; 3: 1,2:3,4-di-O-isopropylidene-l-arabinopyranose; 4: 1,2:3,5-di-O-isopropylidene-d-xylofuranose; 5: 1,2;3,4-di-O-isopropylidene-�-d-tagatofuranose; 6a: 1,2:4,5-di-O-isopropylidene-d-fructopyranose; 6b: 2,3:4,5-di-O-isopropylidene-d-fructopyranose; 7: 1,2:5,6-di-O-isopropylidene-d-glucofuranose;8 annop
5idmwco
: 2,3:4,6-di-O-isopropylidene-d-allopyranose; 9: 2,3:5,6-di-O-isopropylidene-d-mropylidene acetone.
-anhydro-d-ribofuranose, which elutes earlier than 2,3-O-sopropylidene-d-ribofuranose, can be distinguished by theifferent m/z values of their [M-15]+ fragments (m/z 172 vs
/z 190). ISP-ketohexoses show an intense [M-15]+ at m/z 245,hile aldohexoses show similar fragmentation patterns withhanging fragment intensities and characteristic mass fragmentsf m/z 101 and 187. This is not available in ketohexoses. The
furanose; *: internal standard (13C-Glucose); x1: unknown compound; x2: diiso-
ISP derivatives of the ketohexoses d-fructopyranose (1,2:4,5-di-O-isopropylidene-d-fructopyranose) and �-d-tagatofuranose(1,2;3,4-di-O-isopropylidene-�-d-tagatofuranose) afford the frag-
ment pair m/z 72 and 117. This pair which is characteristic for1,2-O-isopropylidene derivatives of ketohexoses [20] cannot befound for the 1,2:5,6-di-O-isopropylidene-derivative of the aldo-hexose d-glucofuranose.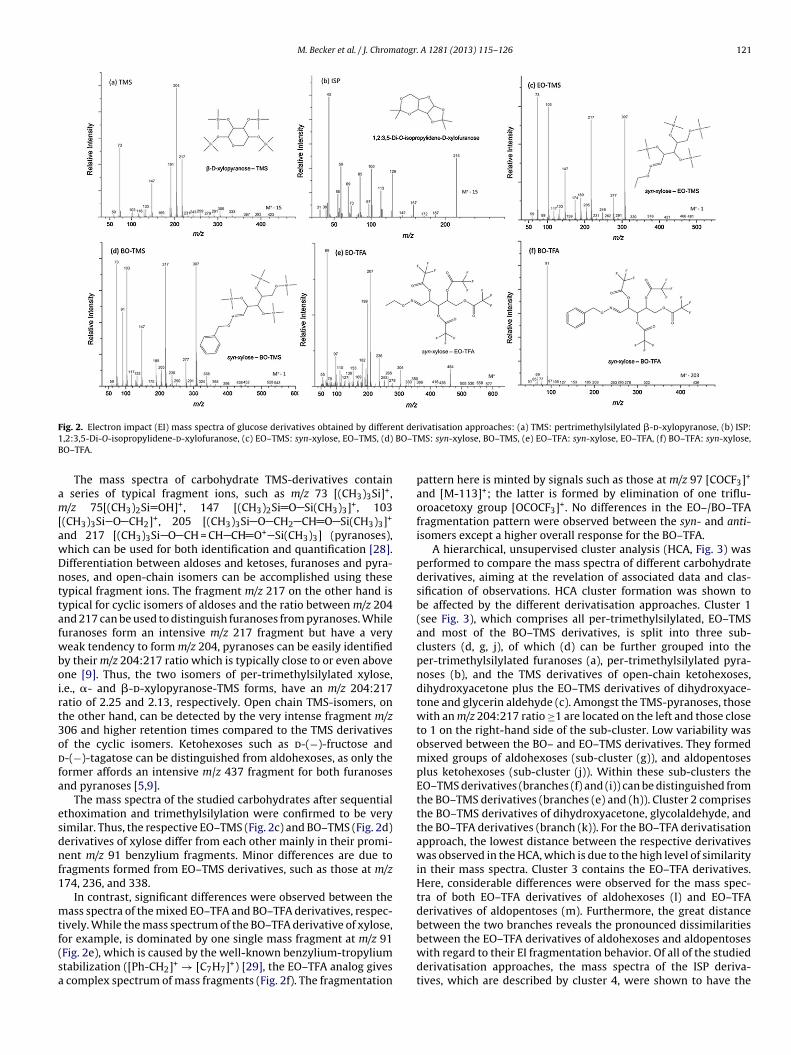
M. Becker et al. / J. Chromatogr. A 1281 (2013) 115– 126 121
F nt der1 BO–TB
am[awDnttafwboirt3odfa
esdnf1
mtf(sa
ig. 2. Electron impact (EI) mass spectra of glucose derivatives obtained by differe,2:3,5-Di-O-isopropylidene-d-xylofuranose, (c) EO–TMS: syn-xylose, EO–TMS, (d)O–TFA.
The mass spectra of carbohydrate TMS-derivatives contain series of typical fragment ions, such as m/z 73 [(CH3)3Si]+,/z 75[(CH3)2Si OH]+, 147 [(CH3)2Si O Si(CH3)3]+, 103
(CH3)3Si O CH2]+, 205 [(CH3)3Si O CH2 CH O Si(CH3)3]+
nd 217 [(CH3)3Si O CH = CH CH O+ Si(CH3)3] (pyranoses),hich can be used for both identification and quantification [28].ifferentiation between aldoses and ketoses, furanoses and pyra-oses, and open-chain isomers can be accomplished using theseypical fragment ions. The fragment m/z 217 on the other hand isypical for cyclic isomers of aldoses and the ratio between m/z 204nd 217 can be used to distinguish furanoses from pyranoses. Whileuranoses form an intensive m/z 217 fragment but have a veryeak tendency to form m/z 204, pyranoses can be easily identified
y their m/z 204:217 ratio which is typically close to or even abovene [9]. Thus, the two isomers of per-trimethylsilylated xylose,.e., �- and �-d-xylopyranose-TMS forms, have an m/z 204:217atio of 2.25 and 2.13, respectively. Open chain TMS-isomers, onhe other hand, can be detected by the very intense fragment m/z06 and higher retention times compared to the TMS derivativesf the cyclic isomers. Ketohexoses such as d-(−)-fructose and-(−)-tagatose can be distinguished from aldohexoses, as only the
ormer affords an intensive m/z 437 fragment for both furanosesnd pyranoses [5,9].
The mass spectra of the studied carbohydrates after sequentialthoximation and trimethylsilylation were confirmed to be veryimilar. Thus, the respective EO–TMS (Fig. 2c) and BO–TMS (Fig. 2d)erivatives of xylose differ from each other mainly in their promi-ent m/z 91 benzylium fragments. Minor differences are due to
ragments formed from EO–TMS derivatives, such as those at m/z74, 236, and 338.
In contrast, significant differences were observed between theass spectra of the mixed EO–TFA and BO–TFA derivatives, respec-
ively. While the mass spectrum of the BO–TFA derivative of xylose,
or example, is dominated by one single mass fragment at m/z 91Fig. 2e), which is caused by the well-known benzylium-tropyliumtabilization ([Ph-CH2]+ → [C7H7]+) [29], the EO–TFA analog givescomplex spectrum of mass fragments (Fig. 2f). The fragmentation
ivatisation approaches: (a) TMS: pertrimethylsilylated �-d-xylopyranose, (b) ISP:MS: syn-xylose, BO–TMS, (e) EO–TFA: syn-xylose, EO–TFA, (f) BO–TFA: syn-xylose,
pattern here is minted by signals such as those at m/z 97 [COCF3]+
and [M-113]+; the latter is formed by elimination of one triflu-oroacetoxy group [OCOCF3]+. No differences in the EO–/BO–TFAfragmentation pattern were observed between the syn- and anti-isomers except a higher overall response for the BO–TFA.
A hierarchical, unsupervised cluster analysis (HCA, Fig. 3) wasperformed to compare the mass spectra of different carbohydratederivatives, aiming at the revelation of associated data and clas-sification of observations. HCA cluster formation was shown tobe affected by the different derivatisation approaches. Cluster 1(see Fig. 3), which comprises all per-trimethylsilylated, EO–TMSand most of the BO–TMS derivatives, is split into three sub-clusters (d, g, j), of which (d) can be further grouped into theper-trimethylsilylated furanoses (a), per-trimethylsilylated pyra-noses (b), and the TMS derivatives of open-chain ketohexoses,dihydroxyacetone plus the EO–TMS derivatives of dihydroxyace-tone and glycerin aldehyde (c). Amongst the TMS-pyranoses, thosewith an m/z 204:217 ratio ≥1 are located on the left and those closeto 1 on the right-hand side of the sub-cluster. Low variability wasobserved between the BO– and EO–TMS derivatives. They formedmixed groups of aldohexoses (sub-cluster (g)), and aldopentosesplus ketohexoses (sub-cluster (j)). Within these sub-clusters theEO–TMS derivatives (branches (f) and (i)) can be distinguished fromthe BO–TMS derivatives (branches (e) and (h)). Cluster 2 comprisesthe BO–TMS derivatives of dihydroxyacetone, glycolaldehyde, andthe BO–TFA derivatives (branch (k)). For the BO–TFA derivatisationapproach, the lowest distance between the respective derivativeswas observed in the HCA, which is due to the high level of similarityin their mass spectra. Cluster 3 contains the EO–TFA derivatives.Here, considerable differences were observed for the mass spec-tra of both EO–TFA derivatives of aldohexoses (l) and EO–TFAderivatives of aldopentoses (m). Furthermore, the great distancebetween the two branches reveals the pronounced dissimilarities
between the EO–TFA derivatives of aldohexoses and aldopentoseswith regard to their EI fragmentation behavior. Of all of the studiedderivatisation approaches, the mass spectra of the ISP deriva-tives, which are described by cluster 4, were shown to have the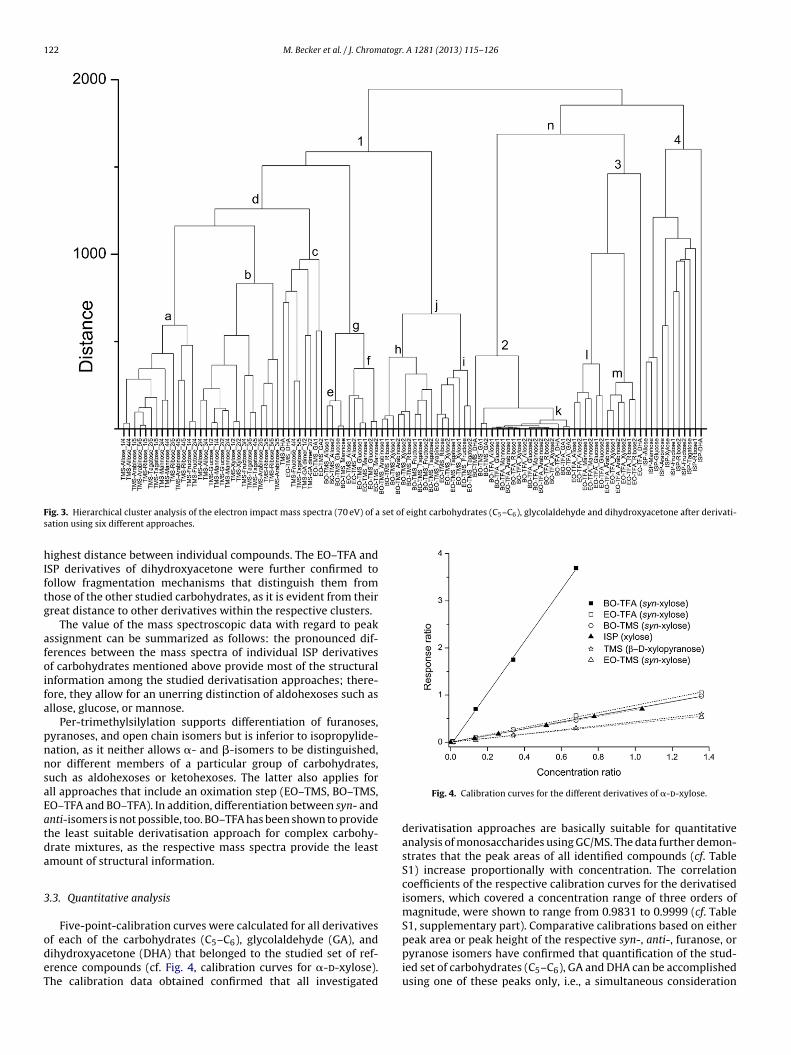
122 M. Becker et al. / J. Chromatogr. A 1281 (2013) 115– 126
F set of eight carbohydrates (C5–C6), glycolaldehyde and dihydroxyacetone after derivati-s
hIftg
afoifa
pnnsaEatda
3
odeT
ig. 3. Hierarchical cluster analysis of the electron impact mass spectra (70 eV) of aation using six different approaches.
ighest distance between individual compounds. The EO–TFA andSP derivatives of dihydroxyacetone were further confirmed toollow fragmentation mechanisms that distinguish them fromhose of the other studied carbohydrates, as it is evident from theirreat distance to other derivatives within the respective clusters.
The value of the mass spectroscopic data with regard to peakssignment can be summarized as follows: the pronounced dif-erences between the mass spectra of individual ISP derivativesf carbohydrates mentioned above provide most of the structuralnformation among the studied derivatisation approaches; there-ore, they allow for an unerring distinction of aldohexoses such asllose, glucose, or mannose.
Per-trimethylsilylation supports differentiation of furanoses,yranoses, and open chain isomers but is inferior to isopropylide-ation, as it neither allows �- and �-isomers to be distinguished,or different members of a particular group of carbohydrates,uch as aldohexoses or ketohexoses. The latter also applies forll approaches that include an oximation step (EO–TMS, BO–TMS,O–TFA and BO–TFA). In addition, differentiation between syn- andnti-isomers is not possible, too. BO–TFA has been shown to providehe least suitable derivatisation approach for complex carbohy-rate mixtures, as the respective mass spectra provide the leastmount of structural information.
.3. Quantitative analysis
Five-point-calibration curves were calculated for all derivatives
f each of the carbohydrates (C5–C6), glycolaldehyde (GA), andihydroxyacetone (DHA) that belonged to the studied set of ref-rence compounds (cf. Fig. 4, calibration curves for �-d-xylose).he calibration data obtained confirmed that all investigatedFig. 4. Calibration curves for the different derivatives of �-d-xylose.
derivatisation approaches are basically suitable for quantitativeanalysis of monosaccharides using GC/MS. The data further demon-strates that the peak areas of all identified compounds (cf. TableS1) increase proportionally with concentration. The correlationcoefficients of the respective calibration curves for the derivatisedisomers, which covered a concentration range of three orders ofmagnitude, were shown to range from 0.9831 to 0.9999 (cf. TableS1, supplementary part). Comparative calibrations based on either
peak area or peak height of the respective syn-, anti-, furanose, orpyranose isomers have confirmed that quantification of the stud-ied set of carbohydrates (C5–C6), GA and DHA can be accomplishedusing one of these peaks only, i.e., a simultaneous consideration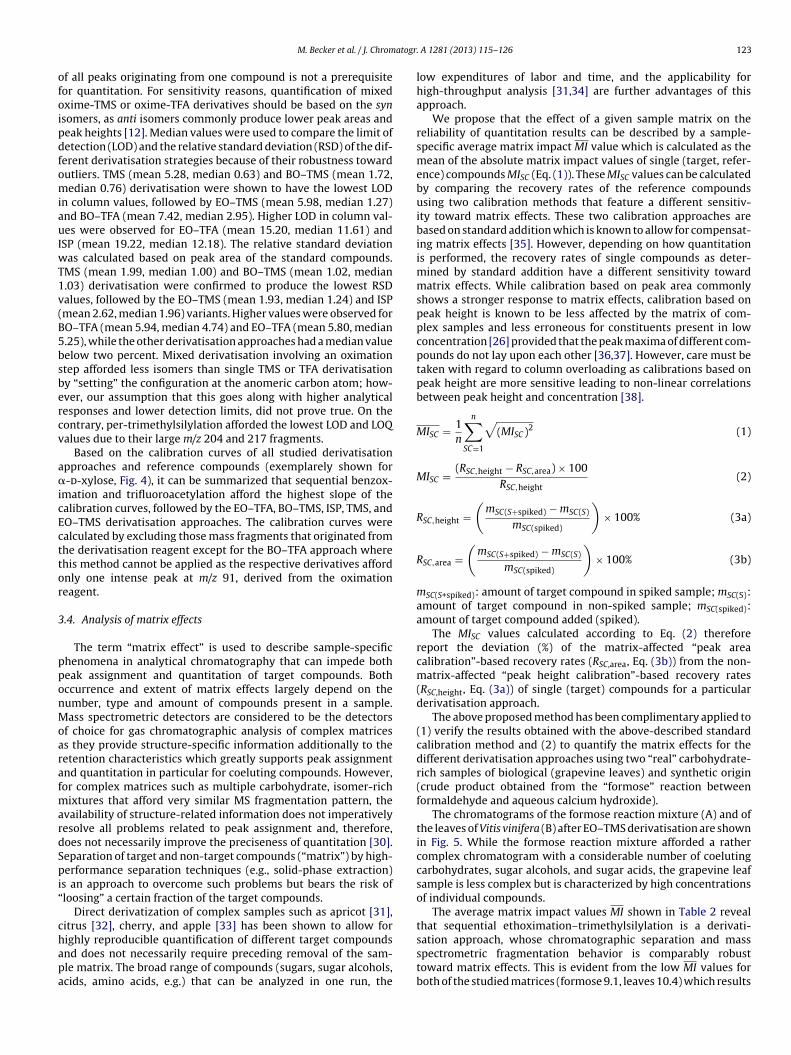
atogr
ofoipdfomiauIwT1v(B5bsbercv
a�icEcttor
3
pponMoarafmardSpi“
chapa
M. Becker et al. / J. Chrom
f all peaks originating from one compound is not a prerequisiteor quantitation. For sensitivity reasons, quantification of mixedxime-TMS or oxime-TFA derivatives should be based on the synsomers, as anti isomers commonly produce lower peak areas andeak heights [12]. Median values were used to compare the limit ofetection (LOD) and the relative standard deviation (RSD) of the dif-erent derivatisation strategies because of their robustness towardutliers. TMS (mean 5.28, median 0.63) and BO–TMS (mean 1.72,edian 0.76) derivatisation were shown to have the lowest LOD
n column values, followed by EO–TMS (mean 5.98, median 1.27)nd BO–TFA (mean 7.42, median 2.95). Higher LOD in column val-es were observed for EO–TFA (mean 15.20, median 11.61) and
SP (mean 19.22, median 12.18). The relative standard deviationas calculated based on peak area of the standard compounds.
MS (mean 1.99, median 1.00) and BO–TMS (mean 1.02, median.03) derivatisation were confirmed to produce the lowest RSDalues, followed by the EO–TMS (mean 1.93, median 1.24) and ISPmean 2.62, median 1.96) variants. Higher values were observed forO–TFA (mean 5.94, median 4.74) and EO–TFA (mean 5.80, median.25), while the other derivatisation approaches had a median valueelow two percent. Mixed derivatisation involving an oximationtep afforded less isomers than single TMS or TFA derivatisationy “setting” the configuration at the anomeric carbon atom; how-ver, our assumption that this goes along with higher analyticalesponses and lower detection limits, did not prove true. On theontrary, per-trimethylsilylation afforded the lowest LOD and LOQalues due to their large m/z 204 and 217 fragments.
Based on the calibration curves of all studied derivatisationpproaches and reference compounds (exemplarely shown for-d-xylose, Fig. 4), it can be summarized that sequential benzox-
mation and trifluoroacetylation afford the highest slope of thealibration curves, followed by the EO–TFA, BO–TMS, ISP, TMS, andO–TMS derivatisation approaches. The calibration curves werealculated by excluding those mass fragments that originated fromhe derivatisation reagent except for the BO–TFA approach wherehis method cannot be applied as the respective derivatives affordnly one intense peak at m/z 91, derived from the oximationeagent.
.4. Analysis of matrix effects
The term “matrix effect” is used to describe sample-specifichenomena in analytical chromatography that can impede botheak assignment and quantitation of target compounds. Bothccurrence and extent of matrix effects largely depend on theumber, type and amount of compounds present in a sample.ass spectrometric detectors are considered to be the detectors
f choice for gas chromatographic analysis of complex matricess they provide structure-specific information additionally to theetention characteristics which greatly supports peak assignmentnd quantitation in particular for coeluting compounds. However,or complex matrices such as multiple carbohydrate, isomer-rich
ixtures that afford very similar MS fragmentation pattern, thevailability of structure-related information does not imperativelyesolve all problems related to peak assignment and, therefore,oes not necessarily improve the preciseness of quantitation [30].eparation of target and non-target compounds (“matrix”) by high-erformance separation techniques (e.g., solid-phase extraction)
s an approach to overcome such problems but bears the risk ofloosing” a certain fraction of the target compounds.
Direct derivatization of complex samples such as apricot [31],itrus [32], cherry, and apple [33] has been shown to allow for
ighly reproducible quantification of different target compoundsnd does not necessarily require preceding removal of the sam-le matrix. The broad range of compounds (sugars, sugar alcohols,cids, amino acids, e.g.) that can be analyzed in one run, the. A 1281 (2013) 115– 126 123
low expenditures of labor and time, and the applicability forhigh-throughput analysis [31,34] are further advantages of thisapproach.
We propose that the effect of a given sample matrix on thereliability of quantitation results can be described by a sample-specific average matrix impact MI value which is calculated as themean of the absolute matrix impact values of single (target, refer-ence) compounds MISC (Eq. (1)). These MISC values can be calculatedby comparing the recovery rates of the reference compoundsusing two calibration methods that feature a different sensitiv-ity toward matrix effects. These two calibration approaches arebased on standard addition which is known to allow for compensat-ing matrix effects [35]. However, depending on how quantitationis performed, the recovery rates of single compounds as deter-mined by standard addition have a different sensitivity towardmatrix effects. While calibration based on peak area commonlyshows a stronger response to matrix effects, calibration based onpeak height is known to be less affected by the matrix of com-plex samples and less erroneous for constituents present in lowconcentration [26] provided that the peak maxima of different com-pounds do not lay upon each other [36,37]. However, care must betaken with regard to column overloading as calibrations based onpeak height are more sensitive leading to non-linear correlationsbetween peak height and concentration [38].
MISC = 1n
n∑SC=1
√(MISC )2 (1)
MISC = (RSC,height − RSC,area) × 100RSC,height
(2)
RSC,height =(
mSC(S+spiked) − mSC(S)
mSC(spiked)
)× 100% (3a)
RSC,area =(
mSC(S+spiked) − mSC(S)
mSC(spiked)
)× 100% (3b)
mSC(S+spiked): amount of target compound in spiked sample; mSC(S):amount of target compound in non-spiked sample; mSC(spiked):amount of target compound added (spiked).
The MISC values calculated according to Eq. (2) thereforereport the deviation (%) of the matrix-affected “peak areacalibration”-based recovery rates (RSC,area, Eq. (3b)) from the non-matrix-affected “peak height calibration”-based recovery rates(RSC,height, Eq. (3a)) of single (target) compounds for a particularderivatisation approach.
The above proposed method has been complimentary applied to(1) verify the results obtained with the above-described standardcalibration method and (2) to quantify the matrix effects for thedifferent derivatisation approaches using two “real” carbohydrate-rich samples of biological (grapevine leaves) and synthetic origin(crude product obtained from the “formose” reaction betweenformaldehyde and aqueous calcium hydroxide).
The chromatograms of the formose reaction mixture (A) and ofthe leaves of Vitis vinifera (B) after EO–TMS derivatisation are shownin Fig. 5. While the formose reaction mixture afforded a rathercomplex chromatogram with a considerable number of coelutingcarbohydrates, sugar alcohols, and sugar acids, the grapevine leafsample is less complex but is characterized by high concentrationsof individual compounds.
The average matrix impact values MI shown in Table 2 revealthat sequential ethoximation–trimethylsilylation is a derivati-
sation approach, whose chromatographic separation and massspectrometric fragmentation behavior is comparably robusttoward matrix effects. This is evident from the low MI values forboth of the studied matrices (formose 9.1, leaves 10.4) which results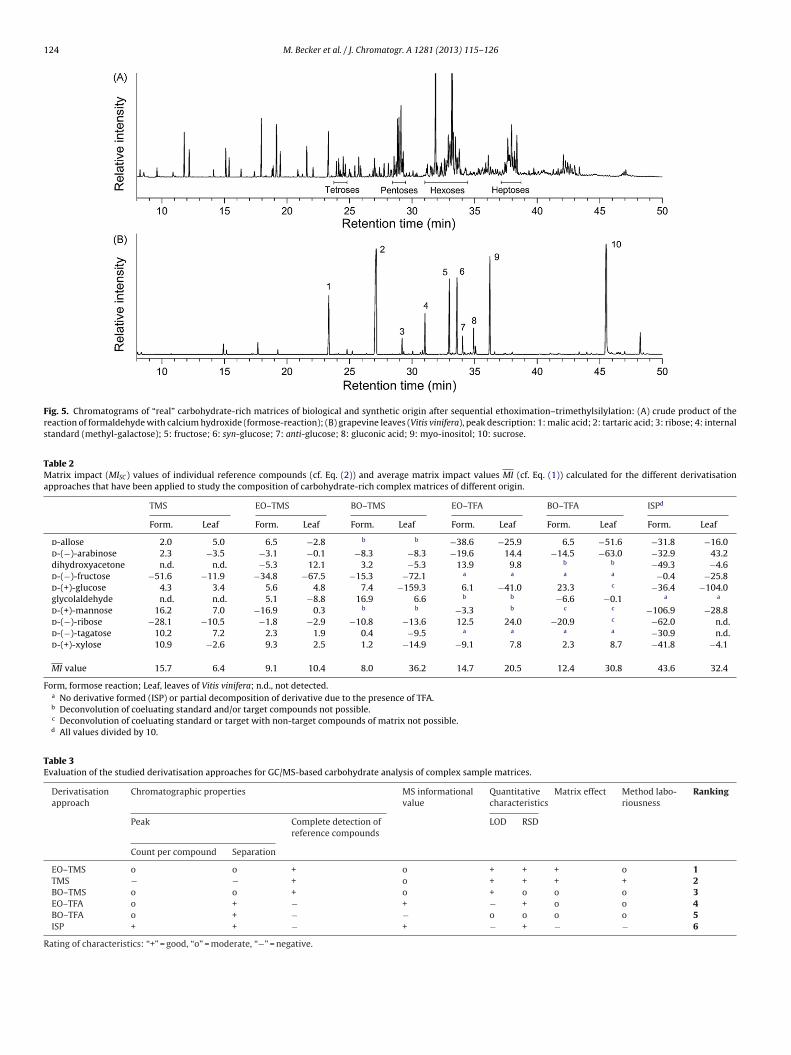
124 M. Becker et al. / J. Chromatogr. A 1281 (2013) 115– 126
Fig. 5. Chromatograms of “real” carbohydrate-rich matrices of biological and synthetic origin after sequential ethoximation–trimethylsilylation: (A) crude product of thereaction of formaldehyde with calcium hydroxide (formose-reaction); (B) grapevine leaves (Vitis vinifera), peak description: 1: malic acid; 2: tartaric acid; 3: ribose; 4: internalstandard (methyl-galactose); 5: fructose; 6: syn-glucose; 7: anti-glucose; 8: gluconic acid; 9: myo-inositol; 10: sucrose.
Table 2Matrix impact (MISC) values of individual reference compounds (cf. Eq. (2)) and average matrix impact values MI (cf. Eq. (1)) calculated for the different derivatisationapproaches that have been applied to study the composition of carbohydrate-rich complex matrices of different origin.
TMS EO–TMS BO–TMS EO–TFA BO–TFA ISPd
Form. Leaf Form. Leaf Form. Leaf Form. Leaf Form. Leaf Form. Leaf
d-allose 2.0 5.0 6.5 −2.8 b b −38.6 −25.9 6.5 −51.6 −31.8 −16.0d-(−)-arabinose 2.3 −3.5 −3.1 −0.1 −8.3 −8.3 −19.6 14.4 −14.5 −63.0 −32.9 43.2dihydroxyacetone n.d. n.d. −5.3 12.1 3.2 −5.3 13.9 9.8 b b −49.3 −4.6d-(−)-fructose −51.6 −11.9 −34.8 −67.5 −15.3 −72.1 a a a a −0.4 −25.8d-(+)-glucose 4.3 3.4 5.6 4.8 7.4 −159.3 6.1 −41.0 23.3 c −36.4 −104.0glycolaldehyde n.d. n.d. 5.1 −8.8 16.9 6.6 b b −6.6 −0.1 a a
d-(+)-mannose 16.2 7.0 −16.9 0.3 b b −3.3 b c c −106.9 −28.8d-(−)-ribose −28.1 −10.5 −1.8 −2.9 −10.8 −13.6 12.5 24.0 −20.9 c −62.0 n.d.d-(−)-tagatose 10.2 7.2 2.3 1.9 0.4 −9.5 a a a a −30.9 n.d.d-(+)-xylose 10.9 −2.6 9.3 2.5 1.2 −14.9 −9.1 7.8 2.3 8.7 −41.8 −4.1
MI value 15.7 6.4 9.1 10.4 8.0 36.2 14.7 20.5 12.4 30.8 43.6 32.4
Form, formose reaction; Leaf, leaves of Vitis vinifera; n.d., not detected.a No derivative formed (ISP) or partial decomposition of derivative due to the presence of TFA.b Deconvolution of coeluating standard and/or target compounds not possible.c Deconvolution of coeluating standard or target with non-target compounds of matrix not possible.d All values divided by 10.
Table 3Evaluation of the studied derivatisation approaches for GC/MS-based carbohydrate analysis of complex sample matrices.
Derivatisationapproach
Chromatographic properties MS informationalvalue
Quantitativecharacteristics
Matrix effect Method labo-riousness
Ranking
Peak Complete detection ofreference compounds
LOD RSD
Count per compound Separation
EO–TMS o o + o + + + o 1TMS − − + o + + + + 2BO–TMS o o + o + o o o 3EO–TFA o + − + − + o o 4BO–TFA o + − − o o o o 5ISP + + − + − + − − 6
Rating of characteristics: “+” = good, “o” = moderate, “−” = negative.
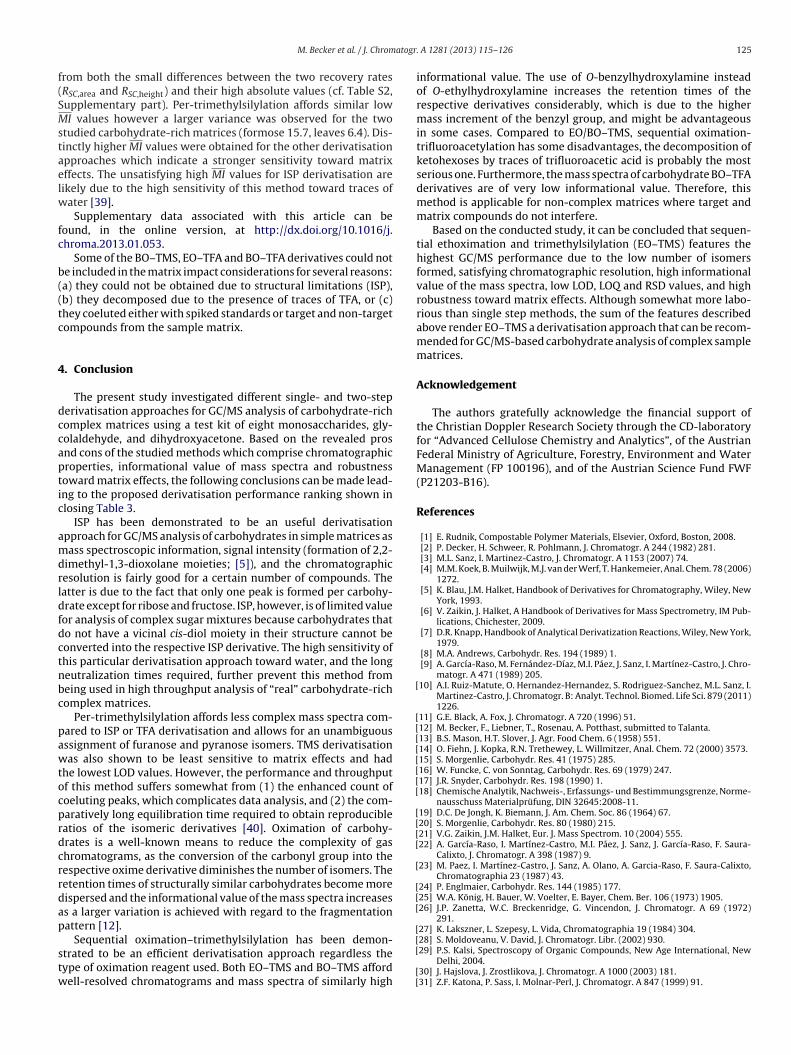
atogr
f(SMstaelw
fc
b((tc
4
dccaptic
amdrldfdctnbc
pawtocprdcrrdap
stw
[
[[[[[[[[
[[[[
[
[[[
[
M. Becker et al. / J. Chrom
rom both the small differences between the two recovery ratesRSC,area and RSC,height) and their high absolute values (cf. Table S2,upplementary part). Per-trimethylsilylation affords similar lowI values however a larger variance was observed for the two
tudied carbohydrate-rich matrices (formose 15.7, leaves 6.4). Dis-inctly higher MI values were obtained for the other derivatisationpproaches which indicate a stronger sensitivity toward matrixffects. The unsatisfying high MI values for ISP derivatisation areikely due to the high sensitivity of this method toward traces of
ater [39].Supplementary data associated with this article can be
ound, in the online version, at http://dx.doi.org/10.1016/j.hroma.2013.01.053.
Some of the BO–TMS, EO–TFA and BO–TFA derivatives could note included in the matrix impact considerations for several reasons:a) they could not be obtained due to structural limitations (ISP),b) they decomposed due to the presence of traces of TFA, or (c)hey coeluted either with spiked standards or target and non-targetompounds from the sample matrix.
. Conclusion
The present study investigated different single- and two-steperivatisation approaches for GC/MS analysis of carbohydrate-richomplex matrices using a test kit of eight monosaccharides, gly-olaldehyde, and dihydroxyacetone. Based on the revealed prosnd cons of the studied methods which comprise chromatographicroperties, informational value of mass spectra and robustnessoward matrix effects, the following conclusions can be made lead-ng to the proposed derivatisation performance ranking shown inlosing Table 3.
ISP has been demonstrated to be an useful derivatisationpproach for GC/MS analysis of carbohydrates in simple matrices asass spectroscopic information, signal intensity (formation of 2,2-
imethyl-1,3-dioxolane moieties; [5]), and the chromatographicesolution is fairly good for a certain number of compounds. Theatter is due to the fact that only one peak is formed per carbohy-rate except for ribose and fructose. ISP, however, is of limited valueor analysis of complex sugar mixtures because carbohydrates thato not have a vicinal cis-diol moiety in their structure cannot beonverted into the respective ISP derivative. The high sensitivity ofhis particular derivatisation approach toward water, and the longeutralization times required, further prevent this method fromeing used in high throughput analysis of “real” carbohydrate-richomplex matrices.
Per-trimethylsilylation affords less complex mass spectra com-ared to ISP or TFA derivatisation and allows for an unambiguousssignment of furanose and pyranose isomers. TMS derivatisationas also shown to be least sensitive to matrix effects and had
he lowest LOD values. However, the performance and throughputf this method suffers somewhat from (1) the enhanced count ofoeluting peaks, which complicates data analysis, and (2) the com-aratively long equilibration time required to obtain reproducibleatios of the isomeric derivatives [40]. Oximation of carbohy-rates is a well-known means to reduce the complexity of gashromatograms, as the conversion of the carbonyl group into theespective oxime derivative diminishes the number of isomers. Theetention times of structurally similar carbohydrates become moreispersed and the informational value of the mass spectra increasess a larger variation is achieved with regard to the fragmentationattern [12].
Sequential oximation–trimethylsilylation has been demon-trated to be an efficient derivatisation approach regardless theype of oximation reagent used. Both EO–TMS and BO–TMS affordell-resolved chromatograms and mass spectra of similarly high
[[
[[
. A 1281 (2013) 115– 126 125
informational value. The use of O-benzylhydroxylamine insteadof O-ethylhydroxylamine increases the retention times of therespective derivatives considerably, which is due to the highermass increment of the benzyl group, and might be advantageousin some cases. Compared to EO/BO–TMS, sequential oximation-trifluoroacetylation has some disadvantages, the decomposition ofketohexoses by traces of trifluoroacetic acid is probably the mostserious one. Furthermore, the mass spectra of carbohydrate BO–TFAderivatives are of very low informational value. Therefore, thismethod is applicable for non-complex matrices where target andmatrix compounds do not interfere.
Based on the conducted study, it can be concluded that sequen-tial ethoximation and trimethylsilylation (EO–TMS) features thehighest GC/MS performance due to the low number of isomersformed, satisfying chromatographic resolution, high informationalvalue of the mass spectra, low LOD, LOQ and RSD values, and highrobustness toward matrix effects. Although somewhat more labo-rious than single step methods, the sum of the features describedabove render EO–TMS a derivatisation approach that can be recom-mended for GC/MS-based carbohydrate analysis of complex samplematrices.
Acknowledgement
The authors gratefully acknowledge the financial support ofthe Christian Doppler Research Society through the CD-laboratoryfor “Advanced Cellulose Chemistry and Analytics”, of the AustrianFederal Ministry of Agriculture, Forestry, Environment and WaterManagement (FP 100196), and of the Austrian Science Fund FWF(P21203-B16).
References
[1] E. Rudnik, Compostable Polymer Materials, Elsevier, Oxford, Boston, 2008.[2] P. Decker, H. Schweer, R. Pohlmann, J. Chromatogr. A 244 (1982) 281.[3] M.L. Sanz, I. Martinez-Castro, J. Chromatogr. A 1153 (2007) 74.[4] M.M. Koek, B. Muilwijk, M.J. van der Werf, T. Hankemeier, Anal. Chem. 78 (2006)
1272.[5] K. Blau, J.M. Halket, Handbook of Derivatives for Chromatography, Wiley, New
York, 1993.[6] V. Zaikin, J. Halket, A Handbook of Derivatives for Mass Spectrometry, IM Pub-
lications, Chichester, 2009.[7] D.R. Knapp, Handbook of Analytical Derivatization Reactions, Wiley, New York,
1979.[8] M.A. Andrews, Carbohydr. Res. 194 (1989) 1.[9] A. García-Raso, M. Fernández-Díaz, M.I. Páez, J. Sanz, I. Martínez-Castro, J. Chro-
matogr. A 471 (1989) 205.10] A.I. Ruiz-Matute, O. Hernandez-Hernandez, S. Rodriguez-Sanchez, M.L. Sanz, I.
Martinez-Castro, J. Chromatogr. B: Analyt. Technol. Biomed. Life Sci. 879 (2011)1226.
11] G.E. Black, A. Fox, J. Chromatogr. A 720 (1996) 51.12] M. Becker, F., Liebner, T., Rosenau, A. Potthast, submitted to Talanta.13] B.S. Mason, H.T. Slover, J. Agr. Food Chem. 6 (1958) 551.14] O. Fiehn, J. Kopka, R.N. Trethewey, L. Willmitzer, Anal. Chem. 72 (2000) 3573.15] S. Morgenlie, Carbohydr. Res. 41 (1975) 285.16] W. Funcke, C. von Sonntag, Carbohydr. Res. 69 (1979) 247.17] J.R. Snyder, Carbohydr. Res. 198 (1990) 1.18] Chemische Analytik, Nachweis-, Erfassungs- und Bestimmungsgrenze, Norme-
nausschuss Materialprüfung, DIN 32645:2008-11.19] D.C. De Jongh, K. Biemann, J. Am. Chem. Soc. 86 (1964) 67.20] S. Morgenlie, Carbohydr. Res. 80 (1980) 215.21] V.G. Zaikin, J.M. Halket, Eur. J. Mass Spectrom. 10 (2004) 555.22] A. García-Raso, I. Martínez-Castro, M.I. Páez, J. Sanz, J. García-Raso, F. Saura-
Calixto, J. Chromatogr. A 398 (1987) 9.23] M. Paez, I. Martínez-Castro, J. Sanz, A. Olano, A. Garcia-Raso, F. Saura-Calixto,
Chromatographia 23 (1987) 43.24] P. Englmaier, Carbohydr. Res. 144 (1985) 177.25] W.A. König, H. Bauer, W. Voelter, E. Bayer, Chem. Ber. 106 (1973) 1905.26] J.P. Zanetta, W.C. Breckenridge, G. Vincendon, J. Chromatogr. A 69 (1972)
291.27] K. Lakszner, L. Szepesy, L. Vida, Chromatographia 19 (1984) 304.
28] S. Moldoveanu, V. David, J. Chromatogr. Libr. (2002) 930.29] P.S. Kalsi, Spectroscopy of Organic Compounds, New Age International, NewDelhi, 2004.30] J. Hajslova, J. Zrostlikova, J. Chromatogr. A 1000 (2003) 181.31] Z.F. Katona, P. Sass, I. Molnar-Perl, J. Chromatogr. A 847 (1999) 91.

1 atogr
[[
[[[
[
26 M. Becker et al. / J. Chrom
32] Z. Fuzfai, I. Molnarperl, J. Chromatogr. A 1149 (2007) 88.
33] Z. Fuzfai, Z.F. Katona, E. Kovacs, I. Molnar-Perl, J. Agr. Food Chem. 52 (2004)7444.34] I. Molnar-Perl, J. Chromatogr. A 845 (1999) 181.35] K. Mastovska, S.J. Lehotay, M. Anastassiades, Anal. Chem. 77 (2005) 8129.36] R.W. Dixon, G. Baltzell, J. Chromatogr. A 1109 (2006) 214.
[
[[
. A 1281 (2013) 115– 126
37] L.R. Snyder, J.J. Kirkland, J.W. Dolan, Introduction to Modern Liquid Chromatog-
raphy, Wiley, Hoboken, NJ, 2010.38] R.L. Grob, E.F. Barry, Modern Practice of Gas Chromatography, Wiley-Interscience, Hoboken, NJ, 2004.
39] R.F. Brady Jr., Adv. Carbohydr. Chem. Biochem. 26 (1971) 197.40] J. Lehrfeld, J. Chromatogr. A 120 (1976) 141.
104
Paper IV
Ethoximation‐silylation approach for mono‐ and disaccharide
analysis and characterization of their identification
parameters by GC/MS.
Talanta, vol. 115, pp. 642‐651.
Becker, M.; Liebner, F.; Rosenau, T.; Potthast, A. (2013)
Talanta 115 (2013) 642–651
Contents lists available at SciVerse ScienceDirect
Talanta
0039-91http://d
n CorrE-m
journal homepage: www.elsevier.com/locate/talanta
Ethoximation-silylation approach for mono- and disaccharide analysisand characterization of their identification parameters by GC/MS
M. Becker n, F. Liebner, T. Rosenau, A. PotthastUniversity of Natural Resources and Life Sciences, Department of Chemistry, Division of Chemistry of Renewables and Christian-Doppler Laboratory“Advanced Cellulose Chemistry and Analytics”, Muthgasse 18, A-1190 Vienna, Austria
a r t i c l e i n f o
Article history:Received 1 February 2013Received in revised form17 May 2013Accepted 21 May 2013Available online 28 May 2013
Keywords:CarbohydratesDerivatizationGC/MSEthoximationRetention indexTrimethylsilylation
40/$ - see front matter & 2013 Elsevier B.V. Ax.doi.org/10.1016/j.talanta.2013.05.052
esponding author. Tel.: +43 1 47654 6412; faxail address: [email protected] (M. Be
a b s t r a c t
The qualitative and quantitative analysis of complex carbohydrate mixtures is a challenging problem.When tackled by GC/MS, close retention times and largely similar mass spectra with no specific featurescomplicate unambiguous identification, especially of monosaccharides. An optimized pre-capillaryethoximation-silylation GC/MS method for determination of monosaccharides and disaccharides wasapplied to a wide range of analytes (46 compounds). The two-step derivatization resulted in a pair of synand anti peaks with specific retention and intensity ratio. The resulting dataset of mass spectra wassubjected to a PCA-based pattern recognition. An oxime peak identifier (OPI) of the carbohydrateanalytes, based on the combination of an internal standard and the corresponding syn/anti peak ratios,increased the reliability of the identification of reducing carbohydrates. Finally, the introduced EtOx-TMSderivatization method was applied to four different carbohydrate matrices (agave sirup, maple sirup,palm sugar, and honey).
& 2013 Elsevier B.V. All rights reserved.
1. Introduction
Carbohydrate analysis is diverse, multifaceted, and encounteredin a large number of applications. One important area is the identi-fication and quantification of low-molecular weight carbohydrates,especially monosaccharides and small oligosaccharides, in differentmatrices. Examples where this type of analysis is needed are theevaluation of stress responses for plant breeding [1], analysis of com-plex mixtures from different biorefinery scenarios for production ofbiofuels and biomaterials [2], and food quality monitoring [3].
Analysis of mono- and disaccharide constituents in complexmixtures is commonly performed by MS-hyphenated gas chromato-graphy (GC/MS) following an appropriate pre-capillary derivatization[4]. Gas chromatography today is an affordable and widespreadtechnique and is superior to capillary electrophoresis and high perfor-mance liquid chromatography due to its relatively high resolution andsensitivity [5]. Its main limitation arises from the similar molecularweights of the carbohydrate analytes, and determination beyond trisa-ccharides is usually not feasible. All carbohydrates, before analysis byGC/MS, require a suitable derivatization to convert them into volatilederivatives since they naturally exhibit high polarity, pronouncedhydrophilicity with a strong tendency to hydrogen bonding, and near-zero volatility [6]. The derivatization strategies aim at enhancing
ll rights reserved.
: +43 1 47654 6059.cker).
signal intensity and compound stability, increasing the informationcontent of the mass spectra, and improving quantification [7].
A wide range of derivatization strategies is available for GC/MScarbohydrate analysis, and the type of pre-capillary derivatization isthe main factor that distinguishes the different approaches. Silylationand trifluoroacetylation reactions are single-step derivatization meth-ods that are widely employed in analysis of polyalcohols and non-reducing sugars [8,9]. Nearly all functional groups are present in therelevant analytes and most of them are problematic in gas chromato-graphic analysis in one way or another due to their polarity andhydrogen bonding capacity. These groups, which include hydroxyl,amine, amide, phosphate and thiol groups can be converted into theirtrialkylsilyl derivates by displacement of the active proton [10,11]. Thereagent N,O-Bis(trimethylsilyl)trifluoroacetamide (BSTFA), introducedby Stalling et al. [12], has the ability to react with all common proticsites and has become a quasi-standard derivatization reagent. Thehigh volatility of the derivatization by-products, namely trimethylsilyltrifluoroacetamide and trifluoroacetamide, is an additional advantageover alternative silylation reagents [11]. Trimethylsilyl chloride (TMS-Cl) has been added to BSTFA as a catalyst to increase the silyl donorstrength [6]. When used on its own as reagent, TMS-Cl is oftencombined with pyridine, which acts as a basic auxiliary and HCl trap,as it does with other trialkylsilyl halides [13]. The advantages ofpyridine are its catalytic capability [14] and the increased stability ofthe silylated products in its presence [15]. A mixture of 4-(dimethyl-amino)pyridine (DMAP) and pyridine, when used at ambient tem-peratures, has been shown to minimize side reactions during
M. Becker et al. / Talanta 115 (2013) 642–651 643
silylation and acylation, and thus reduce the complexity of thechromatograms [16].
The analysis of mixtures of reducing monosaccharides in solutionis generally hindered by their structural similarity and the existence ofup to five isomers (α- and β-pyranosides, α- and β-furanosides, andthe open-chain form) per monosaccharide [17,18]. The eight hexoses,for instance, may form up to 40 of these configurational isomers, eachof which might appear as a separate peak in the chromatograms.After silylation, these isomer peaks increase the risk of peak over-lapping, especially in complex mixtures, although a well-separatedpeak from one of the isomers can be used for quantification andmight also improve the possibility of compound identification [19,20].
Oximation of carbonyl functionalities eliminates the occurrenceof furanosidic and pyranosidic isomers, and thus significantlyreduces chromatogram complexity. The sensitivity of the sugaranalysis is boosted because of the increasing signal intensity withdecreasing amounts of isomers and peaks [21,22]. At the sametime, the formed oximes also result in only two peaks correspond-ing to the syn (E) and anti (Z) forms of the oxime. Non-reducingcarbohydrates (e.g., sucrose, trehalose, raffinose) show only onepeak, since they cannot form the corresponding oxime due to themissing aldehyde (hemiacetal) function [23].
Combining silylation (for rendering the compound volatile) andoximation (for reducing the numbers of isomers, and thus, peaks)consequently requires a two-step derivatization strategy: (1) con-version into oximes with hydroxylamine or alkoxyamines, prior to(2) trialkylsilylation with an appropriate silylating agent. Oximationis always carried out as the first derivatization step. An additionaladvantage of an oximation step is the protection of α-keto acidsagainst decarboxylation [24]. In previous work, reducing carbohy-drates were analyzed as their oxime [25], O-methyloxime [18],O-ethyloxime [8], and O-benzyloxime trimethylsilyl derivatives [18].
The distinction of monosaccharides by MS-hyphenated chroma-tographic techniques, based on retention times and mass spectra, israther difficult and attempts have revealed the general difficulties inthis type of carbohydrate analysis [26]. The derivatized compoundsof similar molecular weight show only small differences in retentiontime, which results in partial peak overlapping or even complete co-elution. The mass spectra of these structural isomers are quite similarand differences are mainly related to fragment intensity. This similarfragmentation pattern of carbohydrate isomers largely hampers theuse of databases for identification purposes.
In a previous study of carbohydrate derivatization with oximationreagents followed by trimethylsilylation, we applied ethoximationfollowed by trimethylsilylation derivatization to complex matrices ofbiological (grapevine leaf) and synthetic (formose mixture) origins.This method showed advantages compared to other derivatizationapproaches due to low limits of detection and quantitation, minorrelative standard deviations, and low sensitivity toward matrixeffects [26]. Peak assignment was supported by NMR and providedinformation on the peak ratios: 2-deoxyhexoses and ketohexosesformed almost equal ratios of the syn and anti peak, while aldopen-toses and aldohexoses were solely reported as the syn form [27,28].However, complex matrices may easily contain more sugars than areavailable as reference standards and syn/anti peak ratios might beinfluenced by matrix effects.
All these difficulties point to the great need for a standardizedand robust analytical method that overcomes at least some of thecurrent limitations in qualitative and quantitative mono- anddisaccharide analysis, especially regarding the problems of similarmass spectra and close retention times. Obligatory methodologicalrequirements are high derivatization efficiency, reproducibility,and stability of products, low number of by-products, and aconstant ratio of syn/anti forms of the oximes. Other important,but less pressing, demands are easy handling, acceptable analysistimes, and low overall costs. Today's requirements also include
compatibility with automated derivatization robots and the pos-sibility for simultaneously analysis of a wide range of other organic(non-carbohydrate) compounds (e.g., in metabolome analysis).
In this study, we communicate a two-step derivatization methodthat begins with an initial formation of O-ethyloximes, followedby trimethylsilylation, for optimized GC/MS analysis of mono- anddisaccharides in complex matrices. Derivatization conditions andderivatization efficiency were optimized. The chromatographic andmass spectra characteristics for 46 carbohydrates ranging fromcarbohydrate-related C2- and C3-bodies to monosaccharides(tetroses to heptoses) and up to disaccharides and one trisaccharide.Of particular interest were the separation and identification char-acteristics of derivatized carbohydrates with similar structures andidentical masses. An oxime peak identifier (OPI) to improve carbo-hydrate identification is presented, which was elaborated based onthe combination of an internal standard and the retention of thecorresponding syn/anti peaks of the reducing carbohydrates.
2. Material and methods
2.1. Chemicals and reagents
The reference compounds (Supplemental Table S1) included 1,3-dihydroxyacetone dimer, glycolaldehyde dimer, methylglyoxal solu-tion (ca. 40% in H2O), D-(+)-glyceraldehyde, D-(−)-threose, L-(+)-ery-thrulose, D-(−)-erythrose, D-(+)-xylose, D-(−)-lyxose, D-ribulose,D-psicose, D-(−)-tagatose, D-allose, D-(+)-mannose, L-(+)-gulose,D-(+)-galactose, D-(+)-talose, D-altrose, D-(+)-glucose, D-apiose solution,D-(−)-arabinose, D-(−)-fructose, D-(−)-ribose, L-sorbose, 2-deoxy-D-ribose, 2-deoxy-D-glucose, D-(+)-fucose, L-(+)-rhamnose, D-(+)-digitox-ose, D-glucoheptose, D-(+)-trehalose (glucose-α,α′-(1-1)-glucose),sucrose (glucose-α-(1-2)-fructose), D-(+)-turanose (glucose-α(1-3)-fructose), D-(+)-maltose monohydrate (glucose-α-(1-4)-glucose), D-(+)-cellobiose (glucose-β-(1-4)-glucose), D-lactose monohydrate(galactose-β-(1-4)-glucose), lactulose (galactose-β-(1-4)-fructose),xylobiose (xylose-β(1-4)-xylose), maltulose monohydrate (glucose-α(1-4)-fructose), leucrose (fructose-(1-5)-glucose), β-gentiobiose(glucose-β-(1-6)-glucose), D-(+)-melibiose (galactose-(1-6)-glu-cose), palatinose hydrate (glucose-(1-6)-fructose), D-(+)-raffinose,the internal standard methyl α-D-galactopyranoside, C7–C40 saturatedalkane mixture, anhydrous pyridine, ethyl acetate, N,O-bis(trimethyl-silyl)trifluoroacetamide (BSTFA), O-ethylhydroxylamine hydrochloride,4-(dimethylamino)pyridine (DMAP), dimethyl formamide (DMF),dimethyl sulfoxide (DMSO) and trimethylsilyl chloride (TMS-Cl); allwere purchased from Sigma-Aldrich-Fluka (Sigma-Aldrich, Schnell-dorf, Germany). All standards, chemicals, and reagents were of GCgrade and used without further purification. L-glycero-D-Mannohep-tose and D-sedoheptulose were kindly provided by P. Kosma, Depart-ment of Chemistry, BOKU, Vienna, Austria.
2.2. Carbohydrate samples
Different carbohydrate-containing samples of biological originwere analyzed with the EtOx-TMS method, focusing on fructose,glucose, and sucrose content. Orange honey from Spain (Allos GmbH,Drebber, Germany), buckwheat honey (Rainbauer, St. Magdalena,Austria), honeydew honey from EU and non-EU countries (Honig-mayr, Tenneck, Austria), agave sirup from Mexico (Allos GmbH,Drebber, Germany), maple sirup (grade C) from Canada (DennreeGmbH, Töpen, Germany), and palm sugar (Gula Java Brut/Amanprana,coconut blossom sugar) from Indonesia (Noble House, Brasschaat,Belgium) were purchased from local supermarkets.
M. Becker et al. / Talanta 115 (2013) 642–651644
2.3. Optimized method
2.3.1. Derivatization: O-ethyloximation (EtOx)/trimethylsilylation(TMS)
Different volumes (0.5 ml–1000 ml) of carbohydrate model solu-tions (0.4 mg/ml in MeOH/H2O, 80:20, v/v) and the honey samplewere lyophilized. The lyophilized model mixtures (containing 0.2 mg–400 mg per carbohydrate) and the honey sample (2.33 mg) weredissolved in 200 ml of anhydrous pyridine containing 40 mg/ml O-ethylhydroxylamine hydrochloride and 1 mg/ml methyl α-D-galacto-pyranoside (internal standard, IS) and were heated at 70 1C for 1 h.Subsequently, 200 ml of a solution of 1.5 mg/ml DMAP in pyridinewas added to the mixture, followed by 200 ml of BSTFA (containing10% TMCS). The mixture was heated at 70 1C for 2 h. The derivatizedsamples were kept at −20 1C until analysis.
2.3.2. GC/MS analysisGC/MS analysis was performed on an Agilent 7890A gas
chromatograph coupled with an Agilent 5975C mass selectivedetector. Column: HP-5 MS (30 m�0.25 mm�0.25 mm; J&WScientific, Folsom, CA, USA); carrier gas: helium, injector: 280 1C;column flow: 0.9 ml/min; purge flow: 32.4 ml/min, 0.6 min; ovenprogram: 50 1C (2 min), 5 1C/min, 280 1C (20 min); MS: EI mode,70 eV, source pressure: 1.13�10–7 Pa, source temperature: 230 1C.Scan range was set from 50 to 950 Da. The derivatized sampleswere diluted with ethyl acetate (600 ml) and filtered prior toinjection. Aliquots of 0.2 ml were introduced into the splitlessinjector with an Agilent GC Sampler 120.
2.4. Peak identification and quantification
Peak assignment and quantification was accomplished withMSD Chemstation E.2.01.1177 (Agilent Technologies, USA). Peakswere assigned by comparing their retention times and massspectra with those of respective reference compounds. Calibrationcurves were based on peak areas obtained for up to ten concen-tration levels.
2.5. Method validation
The optimized method was validated for all reference com-pounds with respect to linearity, limit of detection (LOD), limitof quantification (LOQ), and precision. Regression coefficients weredetermined as acceptance criterion for linearity. The linearityof the calibration curve, based on peak area, was evaluatedwith respect to concentration, corrected by an internal standard.The LOD and LOQ were calculated according to the 3s- and10s-criteria, i.e., the three- and tenfold standard deviation of thenoise quantified by single point calibration (8.33 mg/ml), accordingto DIN 32465:2008–11 [29]. The stability of the GC/MS perfor-mance (retention time, peak response and peak geometry) wasconfirmed by repetitive analysis of identical standards.
2.6. Statistical analysis
Multivariate data analysis was performed with Origin 8.6 soft-ware (OriginLab, Northampton, MA, USA). Principal componentanalysis (PCA), an unsupervised clustering method, was used tocompare GC/MS originated mass spectra of different carbohydratesto uncover data structures that account for a large percentage ofthe total variance and to create new hypothetical constructs thatmay be employed to predict or classify observations into groups.Each mass spectrum was collected as a set of raw intensities andnormalized during calculation. PCA was applied using the elevenmass fragments with the largest fragment intensity. The calculated
eigenvalues greater than one were used as criteria to determinethe number of components.
3. Results and discussion
3.1. Method optimization
The chromatographic and mass spectrometric characteristics ofthe ethoxime-TMS derivatives of 46 carbohydrates and carbohydrate-related compounds were analyzed. The substances were selected in away that comprised all compounds relevant in biorefinery analytics,plant hydrolysates, and plant metabolom analysis.
The derivatization procedure and GC/MS conditions were opti-mized using a solution that contained mono-, di- and trisaccharides inwater/methanol solution (80:20, v/v) at a concentration of 100 mg/mleach. The effects of different solvents (pyridine, N,N-dimethylform-amide, dimethyl sulfoxide) on the efficiency of ethoximation andsilylation were studied. The success of the ethoximation reaction wasinvestigated with regards to the concentration of O-ethylhydro-xylamine hydrochloride (20–60 mg/ml solvent) and the time of thederivatization (30–120 min). Further parameters studied for optimi-zation included the volume ratio between solvent and silylationreagent (1:1–2:3, v/v), silylation temperature (room temperature,50 1C, 70 1C), and silylation time (30–240 min). The effect of catalystson the derivatization efficiency was examined at various concentra-tions of DMAP (0–1.5 mg/ml) and TMS-Cl (0–10%). Derivatizedsamples were either diluted with ethyl acetate or dried with nitrogengas and re-dissolved in ethyl acetate prior to GC/MS analysis.Optimization of the GC/MS program mainly involved the heatingrate (4–12 1C min−1) and the column flow (0.6–1.3 ml min−1).
We verified that an oximation time period of 1 h at 70 1C wassufficient to complete the conversion of saccharidic carbonyl groupsinto oximes, as no non-ethoximated TMS-derivatives were observed.The optimization of the silylation procedure showed no significantpeak area increase between 1–2 h of derivatization, so that 1 happeared to be a sufficiently long reaction time. However, to ensurecomplete derivatization of compounds in complex matrices, silyla-tion time was set to 2 h at 70 1C. The high volatility of derivatizationby-products and the possibility for injection of the reaction mixturedirectly into GC without harming the GC columns led to a preferencefor use of BSTFA over other silylation agents [11].
The overall two-step derivatization strategy is straightforwardand facile. The combination of oximation and trimethylsilylation canbe carried out in the same vial and allows injection of the reactionmixture into GC/MS without any additional sample manipulation.
Different techniques were applied to enhance method sensitivity,such as stripping the solvent in a stream of nitrogen and removingexcess BSTFA by rotavaporation. However, these attempts to reducethe volume of the reaction mixture led to precipitation of sugarphosphates, so they were not subsequently performed so that therange of application was not limited. Pyridine, DMF, and DMSO weretested as solvents to optimize the efficiency of ethoximation andsilylation. Eventually, pyridine was chosen as the most promisingsolvent for the combination of both ethoximation and silylation. Theadvantage of pyridine is its catalytic effect, in addition to its action asa solvent for derivatized compounds. The amount of the derivatiza-tion mixture used must be sufficient to cover the complete sampleduring the ethoximation process; see experimental section. Thevolumes applied should be as small as possible to maintain goodmethod sensitivity, but at the same time enough solvent must bepresent to avoid precipitation of excess O-ethylhydroxylaminehydrochloride.
The derivatization catalysts TMCS and DMAP were used tofurther increase the silylation efficiency. The combination of DMAPand TMCS with BSTFA was used for the first time in the present
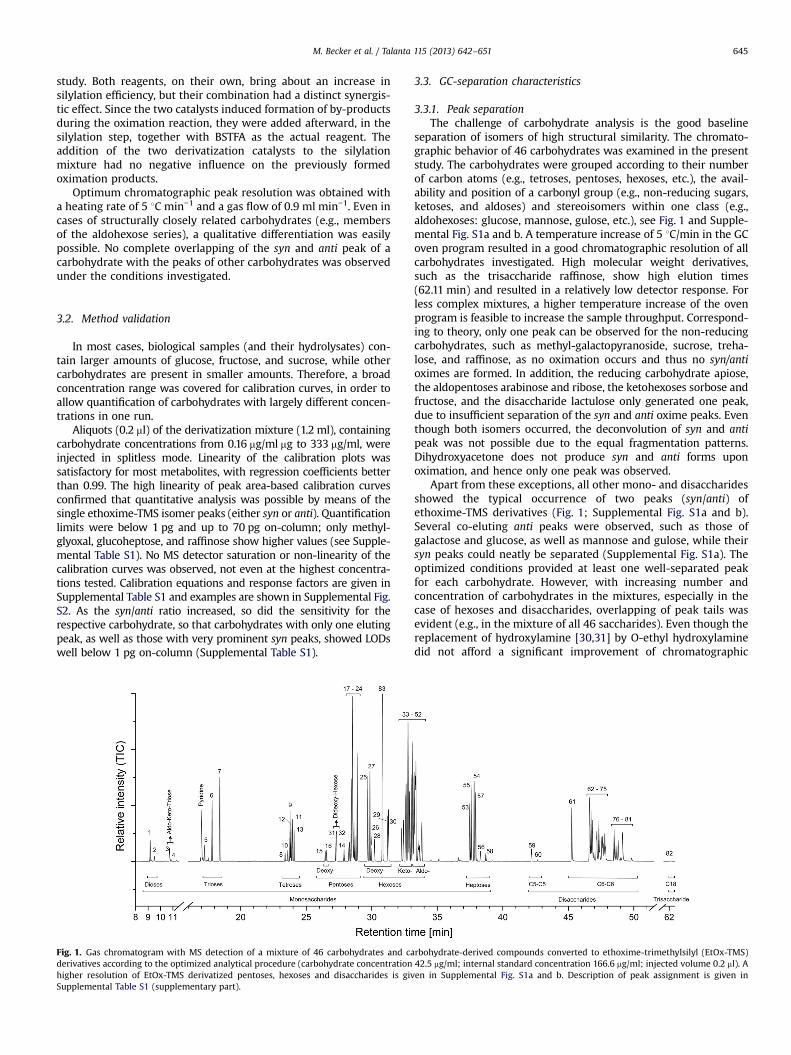
M. Becker et al. / Talanta 115 (2013) 642–651 645
study. Both reagents, on their own, bring about an increase insilylation efficiency, but their combination had a distinct synergis-tic effect. Since the two catalysts induced formation of by-productsduring the oximation reaction, they were added afterward, in thesilylation step, together with BSTFA as the actual reagent. Theaddition of the two derivatization catalysts to the silylationmixture had no negative influence on the previously formedoximation products.
Optimum chromatographic peak resolution was obtained witha heating rate of 5 1C min−1 and a gas flow of 0.9 ml min−1. Even incases of structurally closely related carbohydrates (e.g., membersof the aldohexose series), a qualitative differentiation was easilypossible. No complete overlapping of the syn and anti peak of acarbohydrate with the peaks of other carbohydrates was observedunder the conditions investigated.
3.2. Method validation
In most cases, biological samples (and their hydrolysates) con-tain larger amounts of glucose, fructose, and sucrose, while othercarbohydrates are present in smaller amounts. Therefore, a broadconcentration range was covered for calibration curves, in order toallow quantification of carbohydrates with largely different concen-trations in one run.
Aliquots (0.2 ml) of the derivatization mixture (1.2 ml), containingcarbohydrate concentrations from 0.16 mg/ml mg to 333 mg/ml, wereinjected in splitless mode. Linearity of the calibration plots wassatisfactory for most metabolites, with regression coefficients betterthan 0.99. The high linearity of peak area-based calibration curvesconfirmed that quantitative analysis was possible by means of thesingle ethoxime-TMS isomer peaks (either syn or anti). Quantificationlimits were below 1 pg and up to 70 pg on-column; only methyl-glyoxal, glucoheptose, and raffinose show higher values (see Supple-mental Table S1). No MS detector saturation or non-linearity of thecalibration curves was observed, not even at the highest concentra-tions tested. Calibration equations and response factors are given inSupplemental Table S1 and examples are shown in Supplemental Fig.S2. As the syn/anti ratio increased, so did the sensitivity for therespective carbohydrate, so that carbohydrates with only one elutingpeak, as well as those with very prominent syn peaks, showed LODswell below 1 pg on-column (Supplemental Table S1).
Fig. 1. Gas chromatogram with MS detection of a mixture of 46 carbohydrates and caderivatives according to the optimized analytical procedure (carbohydrate concentrationhigher resolution of EtOx-TMS derivatized pentoses, hexoses and disaccharides is givSupplemental Table S1 (supplementary part).
3.3. GC-separation characteristics
3.3.1. Peak separationThe challenge of carbohydrate analysis is the good baseline
separation of isomers of high structural similarity. The chromato-graphic behavior of 46 carbohydrates was examined in the presentstudy. The carbohydrates were grouped according to their numberof carbon atoms (e.g., tetroses, pentoses, hexoses, etc.), the avail-ability and position of a carbonyl group (e.g., non-reducing sugars,ketoses, and aldoses) and stereoisomers within one class (e.g.,aldohexoses: glucose, mannose, gulose, etc.), see Fig. 1 and Supple-mental Fig. S1a and b. A temperature increase of 5 1C/min in the GCoven program resulted in a good chromatographic resolution of allcarbohydrates investigated. High molecular weight derivatives,such as the trisaccharide raffinose, show high elution times(62.11 min) and resulted in a relatively low detector response. Forless complex mixtures, a higher temperature increase of the ovenprogram is feasible to increase the sample throughput. Correspond-ing to theory, only one peak can be observed for the non-reducingcarbohydrates, such as methyl-galactopyranoside, sucrose, treha-lose, and raffinose, as no oximation occurs and thus no syn/antioximes are formed. In addition, the reducing carbohydrate apiose,the aldopentoses arabinose and ribose, the ketohexoses sorbose andfructose, and the disaccharide lactulose only generated one peak,due to insufficient separation of the syn and anti oxime peaks. Eventhough both isomers occurred, the deconvolution of syn and antipeak was not possible due to the equal fragmentation patterns.Dihydroxyacetone does not produce syn and anti forms uponoximation, and hence only one peak was observed.
Apart from these exceptions, all other mono- and disaccharidesshowed the typical occurrence of two peaks (syn/anti) ofethoxime-TMS derivatives (Fig. 1; Supplemental Fig. S1a and b).Several co-eluting anti peaks were observed, such as those ofgalactose and glucose, as well as mannose and gulose, while theirsyn peaks could neatly be separated (Supplemental Fig. S1a). Theoptimized conditions provided at least one well-separated peakfor each carbohydrate. However, with increasing number andconcentration of carbohydrates in the mixtures, especially in thecase of hexoses and disaccharides, overlapping of peak tails wasevident (e.g., in the mixture of all 46 saccharides). Even though thereplacement of hydroxylamine [30,31] by O-ethyl hydroxylaminedid not afford a significant improvement of chromatographic
rbohydrate-derived compounds converted to ethoxime-trimethylsilyl (EtOx-TMS)42.5 mg/ml; internal standard concentration 166.6 mg/ml; injected volume 0.2 ml). Aen in Supplemental Fig. S1a and b. Description of peak assignment is given in
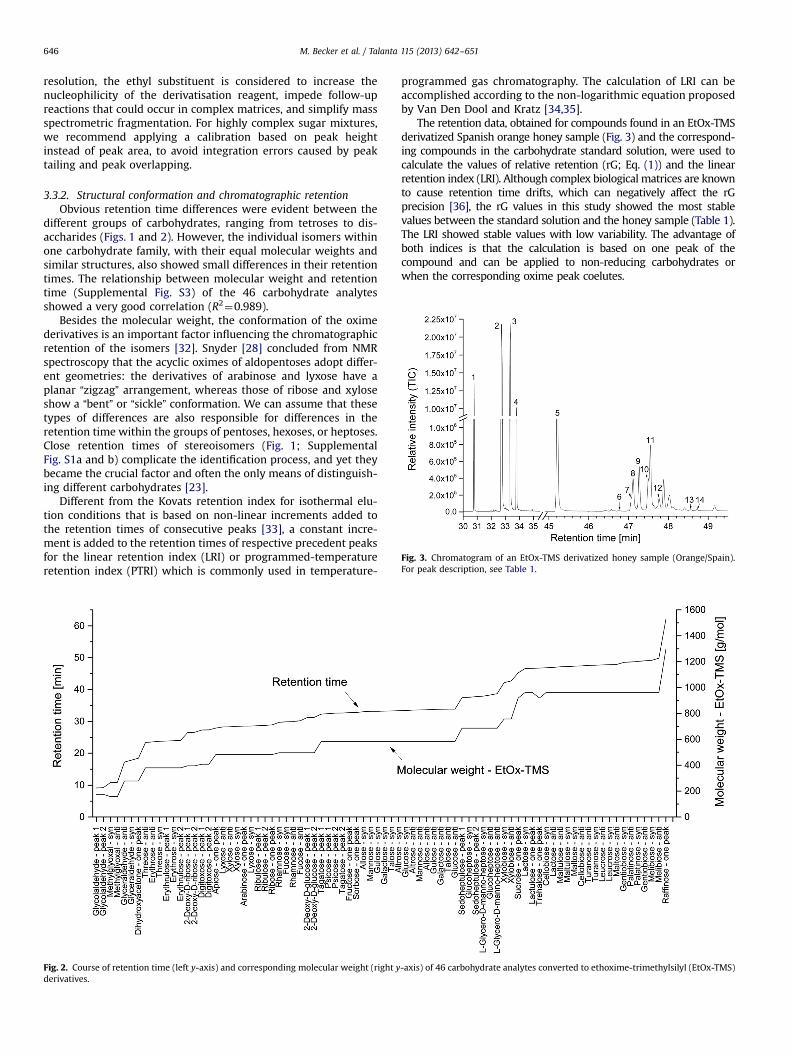
Fig. 3. Chromatogram of an EtOx-TMS derivatized honey sample (Orange/Spain).For peak description, see Table 1.
M. Becker et al. / Talanta 115 (2013) 642–651646
resolution, the ethyl substituent is considered to increase thenucleophilicity of the derivatisation reagent, impede follow-upreactions that could occur in complex matrices, and simplify massspectrometric fragmentation. For highly complex sugar mixtures,we recommend applying a calibration based on peak heightinstead of peak area, to avoid integration errors caused by peaktailing and peak overlapping.
3.3.2. Structural conformation and chromatographic retentionObvious retention time differences were evident between the
different groups of carbohydrates, ranging from tetroses to dis-accharides (Figs. 1 and 2). However, the individual isomers withinone carbohydrate family, with their equal molecular weights andsimilar structures, also showed small differences in their retentiontimes. The relationship between molecular weight and retentiontime (Supplemental Fig. S3) of the 46 carbohydrate analytesshowed a very good correlation (R2¼0.989).
Besides the molecular weight, the conformation of the oximederivatives is an important factor influencing the chromatographicretention of the isomers [32]. Snyder [28] concluded from NMRspectroscopy that the acyclic oximes of aldopentoses adopt differ-ent geometries: the derivatives of arabinose and lyxose have aplanar “zigzag” arrangement, whereas those of ribose and xyloseshow a “bent” or “sickle” conformation. We can assume that thesetypes of differences are also responsible for differences in theretention time within the groups of pentoses, hexoses, or heptoses.Close retention times of stereoisomers (Fig. 1; SupplementalFig. S1a and b) complicate the identification process, and yet theybecame the crucial factor and often the only means of distinguish-ing different carbohydrates [23].
Different from the Kovats retention index for isothermal elu-tion conditions that is based on non-linear increments added tothe retention times of consecutive peaks [33], a constant incre-ment is added to the retention times of respective precedent peaksfor the linear retention index (LRI) or programmed-temperatureretention index (PTRI) which is commonly used in temperature-
Fig. 2. Course of retention time (left y-axis) and corresponding molecular weight (right yderivatives.
programmed gas chromatography. The calculation of LRI can beaccomplished according to the non-logarithmic equation proposedby Van Den Dool and Kratz [34,35].
The retention data, obtained for compounds found in an EtOx-TMSderivatized Spanish orange honey sample (Fig. 3) and the correspond-ing compounds in the carbohydrate standard solution, were used tocalculate the values of relative retention (rG; Eq. (1)) and the linearretention index (LRI). Although complex biological matrices are knownto cause retention time drifts, which can negatively affect the rGprecision [36], the rG values in this study showed the most stablevalues between the standard solution and the honey sample (Table 1).The LRI showed stable values with low variability. The advantage ofboth indices is that the calculation is based on one peak of thecompound and can be applied to non-reducing carbohydrates orwhen the corresponding oxime peak coelutes.
-axis) of 46 carbohydrate analytes converted to ethoxime-trimethylsilyl (EtOx-TMS)
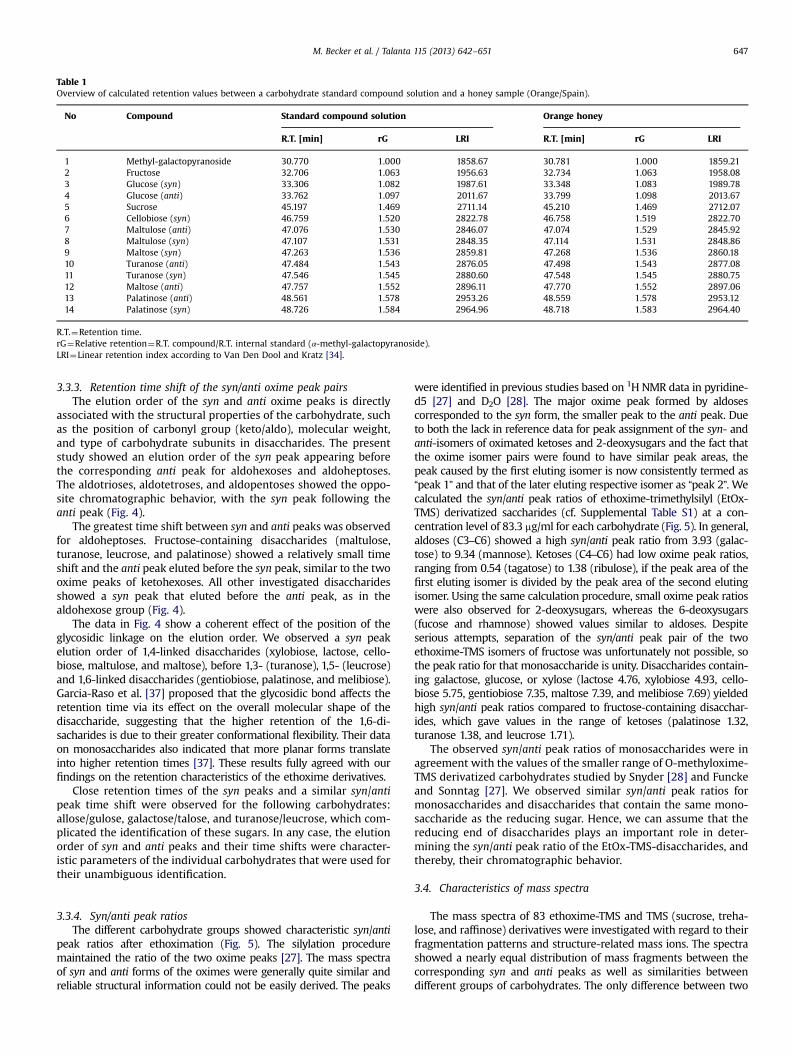
Table 1Overview of calculated retention values between a carbohydrate standard compound solution and a honey sample (Orange/Spain).
No Compound Standard compound solution Orange honey
R.T. [min] rG LRI R.T. [min] rG LRI
1 Methyl-galactopyranoside 30.770 1.000 1858.67 30.781 1.000 1859.212 Fructose 32.706 1.063 1956.63 32.734 1.063 1958.083 Glucose (syn) 33.306 1.082 1987.61 33.348 1.083 1989.784 Glucose (anti) 33.762 1.097 2011.67 33.799 1.098 2013.675 Sucrose 45.197 1.469 2711.14 45.210 1.469 2712.076 Cellobiose (syn) 46.759 1.520 2822.78 46.758 1.519 2822.707 Maltulose (anti) 47.076 1.530 2846.07 47.074 1.529 2845.928 Maltulose (syn) 47.107 1.531 2848.35 47.114 1.531 2848.869 Maltose (syn) 47.263 1.536 2859.81 47.268 1.536 2860.1810 Turanose (anti) 47.484 1.543 2876.05 47.498 1.543 2877.0811 Turanose (syn) 47.546 1.545 2880.60 47.548 1.545 2880.7512 Maltose (anti) 47.757 1.552 2896.11 47.770 1.552 2897.0613 Palatinose (anti) 48.561 1.578 2953.26 48.559 1.578 2953.1214 Palatinose (syn) 48.726 1.584 2964.96 48.718 1.583 2964.40
R.T.¼Retention time.rG¼Relative retention¼R.T. compound/R.T. internal standard (α-methyl-galactopyranoside).LRI¼Linear retention index according to Van Den Dool and Kratz [34].
M. Becker et al. / Talanta 115 (2013) 642–651 647
3.3.3. Retention time shift of the syn/anti oxime peak pairsThe elution order of the syn and anti oxime peaks is directly
associated with the structural properties of the carbohydrate, suchas the position of carbonyl group (keto/aldo), molecular weight,and type of carbohydrate subunits in disaccharides. The presentstudy showed an elution order of the syn peak appearing beforethe corresponding anti peak for aldohexoses and aldoheptoses.The aldotrioses, aldotetroses, and aldopentoses showed the oppo-site chromatographic behavior, with the syn peak following theanti peak (Fig. 4).
The greatest time shift between syn and anti peaks was observedfor aldoheptoses. Fructose-containing disaccharides (maltulose,turanose, leucrose, and palatinose) showed a relatively small timeshift and the anti peak eluted before the syn peak, similar to the twooxime peaks of ketohexoses. All other investigated disaccharidesshowed a syn peak that eluted before the anti peak, as in thealdohexose group (Fig. 4).
The data in Fig. 4 show a coherent effect of the position of theglycosidic linkage on the elution order. We observed a syn peakelution order of 1,4-linked disaccharides (xylobiose, lactose, cello-biose, maltulose, and maltose), before 1,3- (turanose), 1,5- (leucrose)and 1,6-linked disaccharides (gentiobiose, palatinose, and melibiose).Garcia-Raso et al. [37] proposed that the glycosidic bond affects theretention time via its effect on the overall molecular shape of thedisaccharide, suggesting that the higher retention of the 1,6-di-sacharides is due to their greater conformational flexibility. Their dataon monosaccharides also indicated that more planar forms translateinto higher retention times [37]. These results fully agreed with ourfindings on the retention characteristics of the ethoxime derivatives.
Close retention times of the syn peaks and a similar syn/antipeak time shift were observed for the following carbohydrates:allose/gulose, galactose/talose, and turanose/leucrose, which com-plicated the identification of these sugars. In any case, the elutionorder of syn and anti peaks and their time shifts were character-istic parameters of the individual carbohydrates that were used fortheir unambiguous identification.
3.3.4. Syn/anti peak ratiosThe different carbohydrate groups showed characteristic syn/anti
peak ratios after ethoximation (Fig. 5). The silylation proceduremaintained the ratio of the two oxime peaks [27]. The mass spectraof syn and anti forms of the oximes were generally quite similar andreliable structural information could not be easily derived. The peaks
were identified in previous studies based on 1H NMR data in pyridine-d5 [27] and D2O [28]. The major oxime peak formed by aldosescorresponded to the syn form, the smaller peak to the anti peak. Dueto both the lack in reference data for peak assignment of the syn- andanti-isomers of oximated ketoses and 2-deoxysugars and the fact thatthe oxime isomer pairs were found to have similar peak areas, thepeak caused by the first eluting isomer is now consistently termed as“peak 1” and that of the later eluting respective isomer as “peak 2”. Wecalculated the syn/anti peak ratios of ethoxime-trimethylsilyl (EtOx-TMS) derivatized saccharides (cf. Supplemental Table S1) at a con-centration level of 83.3 mg/ml for each carbohydrate (Fig. 5). In general,aldoses (C3–C6) showed a high syn/anti peak ratio from 3.93 (galac-tose) to 9.34 (mannose). Ketoses (C4–C6) had low oxime peak ratios,ranging from 0.54 (tagatose) to 1.38 (ribulose), if the peak area of thefirst eluting isomer is divided by the peak area of the second elutingisomer. Using the same calculation procedure, small oxime peak ratioswere also observed for 2-deoxysugars, whereas the 6-deoxysugars(fucose and rhamnose) showed values similar to aldoses. Despiteserious attempts, separation of the syn/anti peak pair of the twoethoxime-TMS isomers of fructose was unfortunately not possible, sothe peak ratio for that monosaccharide is unity. Disaccharides contain-ing galactose, glucose, or xylose (lactose 4.76, xylobiose 4.93, cello-biose 5.75, gentiobiose 7.35, maltose 7.39, and melibiose 7.69) yieldedhigh syn/anti peak ratios compared to fructose-containing disacchar-ides, which gave values in the range of ketoses (palatinose 1.32,turanose 1.38, and leucrose 1.71).
The observed syn/anti peak ratios of monosaccharides were inagreement with the values of the smaller range of O-methyloxime-TMS derivatized carbohydrates studied by Snyder [28] and Funckeand Sonntag [27]. We observed similar syn/anti peak ratios formonosaccharides and disaccharides that contain the same mono-saccharide as the reducing sugar. Hence, we can assume that thereducing end of disaccharides plays an important role in deter-mining the syn/anti peak ratio of the EtOx-TMS-disaccharides, andthereby, their chromatographic behavior.
3.4. Characteristics of mass spectra
The mass spectra of 83 ethoxime-TMS and TMS (sucrose, treha-lose, and raffinose) derivatives were investigated with regard to theirfragmentation patterns and structure-related mass ions. The spectrashowed a nearly equal distribution of mass fragments between thecorresponding syn and anti peaks as well as similarities betweendifferent groups of carbohydrates. The only difference between two

Fig. 4. Retention time of syn peaks (■) and retention time shift (○) between the syn peak and corresponding anti peak or peak 1 and peak 2 of different ethoxime-trimethylsilyl (EtOx-TMS) derivatized carbohydrates. A positive retention time shift corresponds to the appearance of the anti peak after the corresponding syn peak. The firsteluting isomer of oximated ketoses and 2-deoxysugars has been termed as “peak 1” and that of the later eluting respective isomer as “peak 2”.
Fig. 5. Isomer ratios (based on peak area) between the syn peaks and corresponding anti peaks or peak 1 and peak 2 of different ethoxime-trimethylsilyl (EtOx-TMS)derivatized carbohydrates. The first eluting isomer of oximated ketoses and 2-deoxysugars has been termed as “peak 1” and that of the later eluting respective isomer as“peak 2”.
M. Becker et al. / Talanta 115 (2013) 642–651648
corresponding oxime peaks was recognized as a lower overallintensity of fragments of the anti isomer compared to syn isomerspectra, especially evident for aldohexoses and aldopentoses.MacLeod et al. [38] also observed these differences in methoxime-TMS derivatized keto sugars, where both isomers showed very lowintensities of the molecular ion [M] or the [M - CH3] ion.
The ethoxime-carrying moiety in the mass spectra of the EtOx-TMS derivatized aldohexose D-glucose, selected as example (Sup-plemental Fig. S4a), appeared as the m/z 174 ion (C2H5ON=C-CH-OTMS). This fragment contained the former reducing end ofglucose. The spectrum of non-oximated TMS-glucose is differentfrom that of EtOx-TMS-glucose; although it contains some
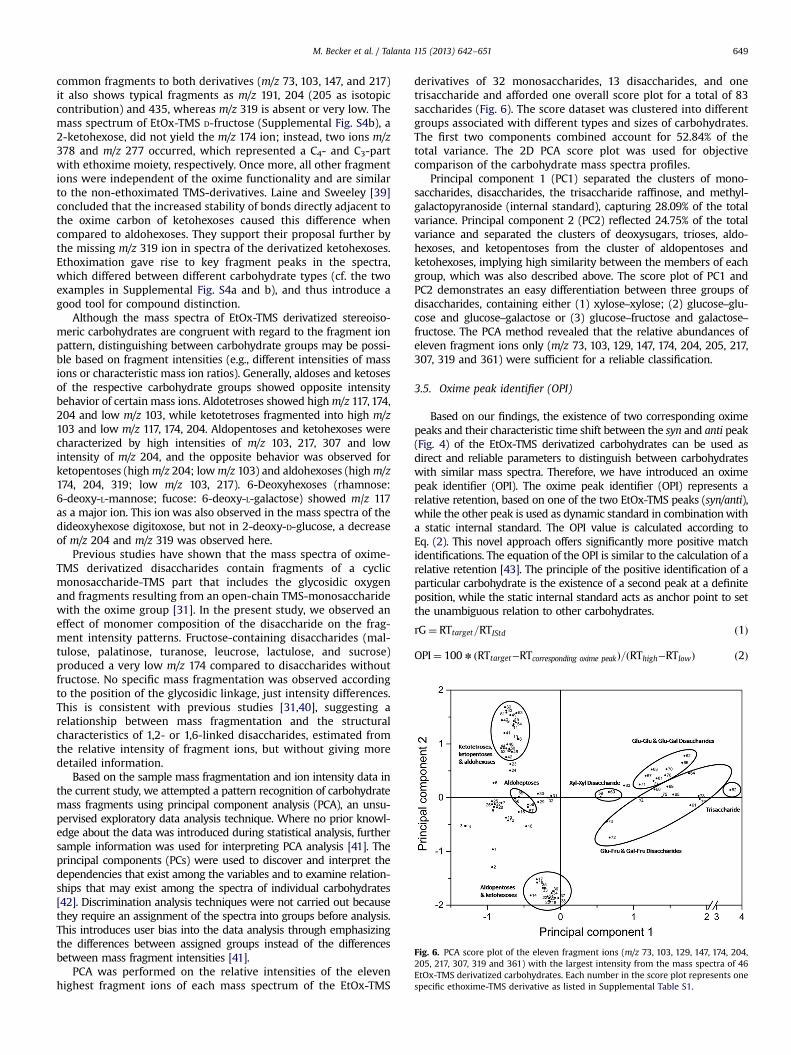
Fig. 6. PCA score plot of the eleven fragment ions (m/z 73, 103, 129, 147, 174, 204,205, 217, 307, 319 and 361) with the largest intensity from the mass spectra of 46EtOx-TMS derivatized carbohydrates. Each number in the score plot represents onespecific ethoxime-TMS derivative as listed in Supplemental Table S1.
M. Becker et al. / Talanta 115 (2013) 642–651 649
common fragments to both derivatives (m/z 73, 103, 147, and 217)it also shows typical fragments as m/z 191, 204 (205 as isotopiccontribution) and 435, whereas m/z 319 is absent or very low. Themass spectrum of EtOx-TMS D-fructose (Supplemental Fig. S4b), a2-ketohexose, did not yield the m/z 174 ion; instead, two ions m/z378 and m/z 277 occurred, which represented a C4- and C3-partwith ethoxime moiety, respectively. Once more, all other fragmentions were independent of the oxime functionality and are similarto the non-ethoximated TMS-derivatives. Laine and Sweeley [39]concluded that the increased stability of bonds directly adjacent tothe oxime carbon of ketohexoses caused this difference whencompared to aldohexoses. They support their proposal further bythe missing m/z 319 ion in spectra of the derivatized ketohexoses.Ethoximation gave rise to key fragment peaks in the spectra,which differed between different carbohydrate types (cf. the twoexamples in Supplemental Fig. S4a and b), and thus introduce agood tool for compound distinction.
Although the mass spectra of EtOx-TMS derivatized stereoiso-meric carbohydrates are congruent with regard to the fragment ionpattern, distinguishing between carbohydrate groups may be possi-ble based on fragment intensities (e.g., different intensities of massions or characteristic mass ion ratios). Generally, aldoses and ketosesof the respective carbohydrate groups showed opposite intensitybehavior of certain mass ions. Aldotetroses showed highm/z 117, 174,204 and low m/z 103, while ketotetroses fragmented into high m/z103 and low m/z 117, 174, 204. Aldopentoses and ketohexoses werecharacterized by high intensities of m/z 103, 217, 307 and lowintensity of m/z 204, and the opposite behavior was observed forketopentoses (highm/z 204; lowm/z 103) and aldohexoses (highm/z174, 204, 319; low m/z 103, 217). 6-Deoxyhexoses (rhamnose:6-deoxy-L-mannose; fucose: 6-deoxy-L-galactose) showed m/z 117as a major ion. This ion was also observed in the mass spectra of thedideoxyhexose digitoxose, but not in 2-deoxy-D-glucose, a decreaseof m/z 204 and m/z 319 was observed here.
Previous studies have shown that the mass spectra of oxime-TMS derivatized disaccharides contain fragments of a cyclicmonosaccharide-TMS part that includes the glycosidic oxygenand fragments resulting from an open-chain TMS-monosaccharidewith the oxime group [31]. In the present study, we observed aneffect of monomer composition of the disaccharide on the frag-ment intensity patterns. Fructose-containing disaccharides (mal-tulose, palatinose, turanose, leucrose, lactulose, and sucrose)produced a very low m/z 174 compared to disaccharides withoutfructose. No specific mass fragmentation was observed accordingto the position of the glycosidic linkage, just intensity differences.This is consistent with previous studies [31,40], suggesting arelationship between mass fragmentation and the structuralcharacteristics of 1,2- or 1,6-linked disaccharides, estimated fromthe relative intensity of fragment ions, but without giving moredetailed information.
Based on the sample mass fragmentation and ion intensity data inthe current study, we attempted a pattern recognition of carbohydratemass fragments using principal component analysis (PCA), an unsu-pervised exploratory data analysis technique. Where no prior knowl-edge about the data was introduced during statistical analysis, furthersample information was used for interpreting PCA analysis [41]. Theprincipal components (PCs) were used to discover and interpret thedependencies that exist among the variables and to examine relation-ships that may exist among the spectra of individual carbohydrates[42]. Discrimination analysis techniques were not carried out becausethey require an assignment of the spectra into groups before analysis.This introduces user bias into the data analysis through emphasizingthe differences between assigned groups instead of the differencesbetween mass fragment intensities [41].
PCA was performed on the relative intensities of the elevenhighest fragment ions of each mass spectrum of the EtOx-TMS
derivatives of 32 monosaccharides, 13 disaccharides, and onetrisaccharide and afforded one overall score plot for a total of 83saccharides (Fig. 6). The score dataset was clustered into differentgroups associated with different types and sizes of carbohydrates.The first two components combined account for 52.84% of thetotal variance. The 2D PCA score plot was used for objectivecomparison of the carbohydrate mass spectra profiles.
Principal component 1 (PC1) separated the clusters of mono-saccharides, disaccharides, the trisaccharide raffinose, and methyl-galactopyranoside (internal standard), capturing 28.09% of the totalvariance. Principal component 2 (PC2) reflected 24.75% of the totalvariance and separated the clusters of deoxysugars, trioses, aldo-hexoses, and ketopentoses from the cluster of aldopentoses andketohexoses, implying high similarity between the members of eachgroup, which was also described above. The score plot of PC1 andPC2 demonstrates an easy differentiation between three groups ofdisaccharides, containing either (1) xylose–xylose; (2) glucose–glu-cose and glucose–galactose or (3) glucose–fructose and galactose–fructose. The PCA method revealed that the relative abundances ofeleven fragment ions only (m/z 73, 103, 129, 147, 174, 204, 205, 217,307, 319 and 361) were sufficient for a reliable classification.
3.5. Oxime peak identifier (OPI)
Based on our findings, the existence of two corresponding oximepeaks and their characteristic time shift between the syn and anti peak(Fig. 4) of the EtOx-TMS derivatized carbohydrates can be used asdirect and reliable parameters to distinguish between carbohydrateswith similar mass spectra. Therefore, we have introduced an oximepeak identifier (OPI). The oxime peak identifier (OPI) represents arelative retention, based on one of the two EtOx-TMS peaks (syn/anti),while the other peak is used as dynamic standard in combinationwitha static internal standard. The OPI value is calculated according toEq. (2). This novel approach offers significantly more positive matchidentifications. The equation of the OPI is similar to the calculation of arelative retention [43]. The principle of the positive identification of aparticular carbohydrate is the existence of a second peak at a definiteposition, while the static internal standard acts as anchor point to setthe unambiguous relation to other carbohydrates.
rG¼ RTtarget=RTIStd ð1Þ
OPI¼ 100 n ðRTtarget−RTcorresponding oxime peakÞ=ðRThigh−RTlowÞ ð2Þ
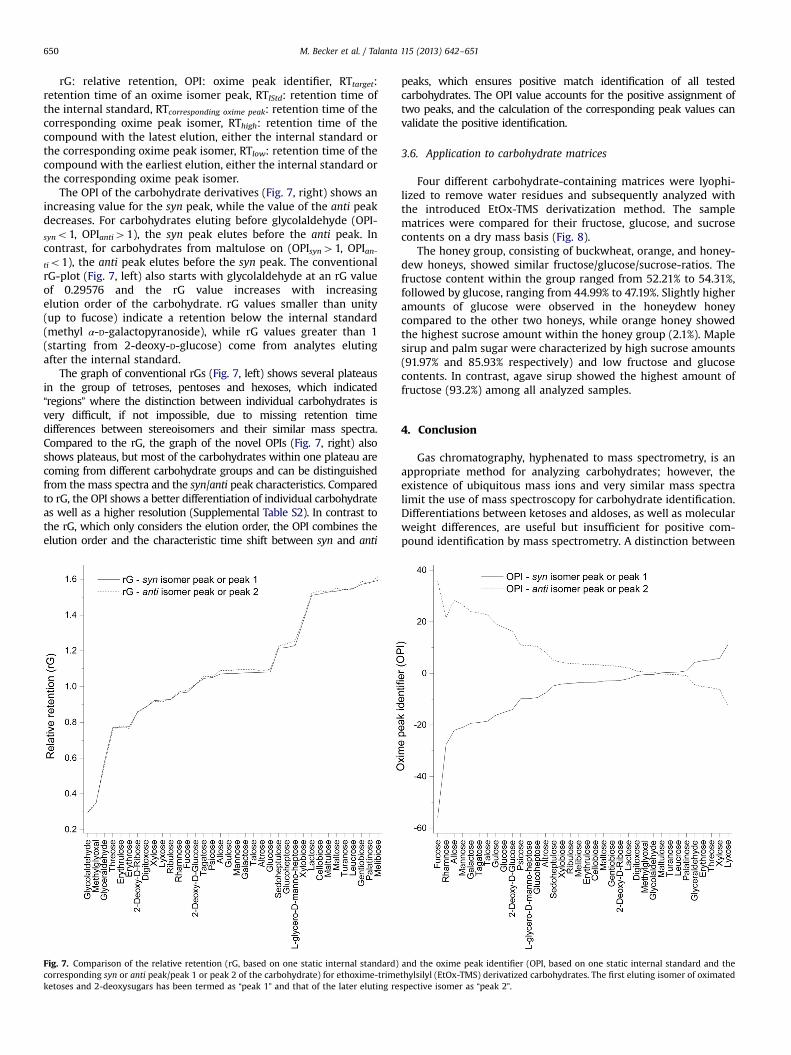
M. Becker et al. / Talanta 115 (2013) 642–651650
rG: relative retention, OPI: oxime peak identifier, RTtarget:retention time of an oxime isomer peak, RTIStd: retention time ofthe internal standard, RTcorresponding oxime peak: retention time of thecorresponding oxime peak isomer, RThigh: retention time of thecompound with the latest elution, either the internal standard orthe corresponding oxime peak isomer, RTlow: retention time of thecompound with the earliest elution, either the internal standard orthe corresponding oxime peak isomer.
The OPI of the carbohydrate derivatives (Fig. 7, right) shows anincreasing value for the syn peak, while the value of the anti peakdecreases. For carbohydrates eluting before glycolaldehyde (OPI-syno1, OPIanti41), the syn peak elutes before the anti peak. Incontrast, for carbohydrates from maltulose on (OPIsyn41, OPIan-tio1), the anti peak elutes before the syn peak. The conventionalrG-plot (Fig. 7, left) also starts with glycolaldehyde at an rG valueof 0.29576 and the rG value increases with increasingelution order of the carbohydrate. rG values smaller than unity(up to fucose) indicate a retention below the internal standard(methyl α-D-galactopyranoside), while rG values greater than 1(starting from 2-deoxy-D-glucose) come from analytes elutingafter the internal standard.
The graph of conventional rGs (Fig. 7, left) shows several plateausin the group of tetroses, pentoses and hexoses, which indicated“regions” where the distinction between individual carbohydrates isvery difficult, if not impossible, due to missing retention timedifferences between stereoisomers and their similar mass spectra.Compared to the rG, the graph of the novel OPIs (Fig. 7, right) alsoshows plateaus, but most of the carbohydrates within one plateau arecoming from different carbohydrate groups and can be distinguishedfrom the mass spectra and the syn/anti peak characteristics. Comparedto rG, the OPI shows a better differentiation of individual carbohydrateas well as a higher resolution (Supplemental Table S2). In contrast tothe rG, which only considers the elution order, the OPI combines theelution order and the characteristic time shift between syn and anti
Fig. 7. Comparison of the relative retention (rG, based on one static internal standard)corresponding syn or anti peak/peak 1 or peak 2 of the carbohydrate) for ethoxime-trimeketoses and 2-deoxysugars has been termed as “peak 1” and that of the later eluting re
peaks, which ensures positive match identification of all testedcarbohydrates. The OPI value accounts for the positive assignment oftwo peaks, and the calculation of the corresponding peak values canvalidate the positive identification.
3.6. Application to carbohydrate matrices
Four different carbohydrate-containing matrices were lyophi-lized to remove water residues and subsequently analyzed withthe introduced EtOx-TMS derivatization method. The samplematrices were compared for their fructose, glucose, and sucrosecontents on a dry mass basis (Fig. 8).
The honey group, consisting of buckwheat, orange, and honey-dew honeys, showed similar fructose/glucose/sucrose-ratios. Thefructose content within the group ranged from 52.21% to 54.31%,followed by glucose, ranging from 44.99% to 47.19%. Slightly higheramounts of glucose were observed in the honeydew honeycompared to the other two honeys, while orange honey showedthe highest sucrose amount within the honey group (2.1%). Maplesirup and palm sugar were characterized by high sucrose amounts(91.97% and 85.93% respectively) and low fructose and glucosecontents. In contrast, agave sirup showed the highest amount offructose (93.2%) among all analyzed samples.
4. Conclusion
Gas chromatography, hyphenated to mass spectrometry, is anappropriate method for analyzing carbohydrates; however, theexistence of ubiquitous mass ions and very similar mass spectralimit the use of mass spectroscopy for carbohydrate identification.Differentiations between ketoses and aldoses, as well as molecularweight differences, are useful but insufficient for positive com-pound identification by mass spectrometry. A distinction between
and the oxime peak identifier (OPI, based on one static internal standard and thethylsilyl (EtOx-TMS) derivatized carbohydrates. The first eluting isomer of oximatedspective isomer as “peak 2”.

Fig. 8. Analysis of fructose/glucose/sucrose-ratio (%) in dry mass of different sugarmatrices: agave sirup, maple sirup, palm sugar, and honeys (buckwheat, orange,and honeydew).
M. Becker et al. / Talanta 115 (2013) 642–651 651
isomeric carbohydrates is only possible using retention times andchromatographic behavior as discrimination parameters, but asthis is not generally successful, different derivatizations are usuallyperformed to improve their chromatographic behavior.
The combination of oximation followed by silylation for carbohy-drate analysis is a particularly powerful approach for carbohydrateanalysis, its full potential has not yet been exploited. We have aimed atadvancing the ethoxime-trimethylsilyl derivatization method withregard to both practical aspects and data interpretation. This methodis probably the best one amongst all related procedures that werehitherto assayed by the authors. Together with the proposed oximepeak identifier (OPI), this method overcomes several pressing pro-blems in GC/MS carbohydrate analysis and allows for a reliable andstraightforward identification of a large range of analytes.
The chromatographic and mass spectra characteristics of 46different carbohydrates were used to evaluate possible unambig-uous identification criteria. Specific parameters for the individualcarbohydrates were the area ratio of syn and anti oxime peaks, theirelution order, and the retention time shift between the two peaks.Two of these parameters were incorporated into the oxime peakidentifier (OPI), which allows reliable identification of the carbohy-drates. In addition, in contrast to conventional retention indices, theOPI is based on the second peak of the syn/anti pair as dynamicstandard. In the case of disaccharides, the anti peak order and syn/anti peak area were influenced by the monosaccharide moieties,while the syn peak elution was effected by the position of theglycosidic linkage. We are confident that the present EtOx-TMSderivatization with GC/MS analysis and the developed oxime peakidentifier evaluation can help to enhance positive carbohydrateidentification, even in highly complex biological samples. Our hopeis that this approach will become widely accepted in different areasof carbohydrate analysis and quantification.
Acknowledgments
The financial support by the Christian Doppler Research Society(CD lab “Advanced Cellulose Chemistry and Analytics”) and LenzingAG, Austria are gratefully acknowledged. We thank P. Kosma,
Department of Chemistry, BOKU, Vienna, Austria, for donating thetwo sugars L-glycero-D-manno-heptose and D-sedoheptulose.
Appendix A. Supporting information
Supplementary data associated with this article can be found inthe online version at http://dx.doi.org/10.1016/j.talanta.2013.05.052.
References
[1] B. Vinocur, A. Altman, Curr. Opin. Biotechnol. 16 (2005) 123–132.[2] S.N. Naik, V.V. Goud, P.K. Rout, A.K. Dalai, Renewable Sustainable Energy Rev.
14 (2010) 578–597.[3] A. Cifuentes, Electrophoresis 27 (2006) 283–303.[4] C. Birkemeyer, J. Chromatogr. A 993 (2003) 89–102.[5] M.L. Sanz, J. Sanz, I. Martinez-Castro, J. Chromatogr. A 1059 (2004) 143–148.[6] D.R. Knapp, Handbook of Analytical Derivatization Reactions, Wiley, New York,
1979.[7] V. Zaikin, J. Halket, A Handbook of Derivatives for Mass Spectrometry, IM
Publications, Chichester, 2009.[8] M.M. Koek, B. Muilwijk, M.J. van der Werf, T. Hankemeier, Anal. Chem. 78
(2006) 1272–1281.[9] P.M. Medeiros, B.R. Simoneit, J. Chromatogr. A 1141 (2007) 271–278.[10] C.F. Poole, W.F. Sye, S. Singhawangcha, F. Hsu, A. Zlatkis, A. Arfwidsson,
J. Vessman, J. Chromatogr. A 199 (1980) 123–142.[11] R.P. Evershed, Advances in silylation, in: K. Blau, J.M. Halket (Eds.), Handbook
of Derivatives for Chromatography, second ed.,Wiley, New York, 1993,pp. 51–108.
[12] D.L. Stalling, C.W. Gehrke, R.W. Zumwalt, Biochem. Biophys. Res. Commun. 31(1968) 616–622.
[13] M. Makita, W.W. Wells, Anal. Biochem. 5 (1963) 523–530.[14] P.S. Mason, E.D. Smith, J. Gas Chromatogr. 4 (1966) 398.[15] Z. Zhang, A. Hibberd, J. Zhou, Anal. Chim. Acta 577 (2006) 52–61.[16] K.R. Anumula, P.B. Taylor, Anal. Biochem. 203 (1992) 101–108.[17] A. García-Raso, M. Fernández-Díaz, M.I. Páez, J. Sanz, I. Martínez-Castro,
J. Chromatogr. A 471 (1989) 205–216.[18] M.A. Andrews, Carbohydr. Res. 194 (1989) 1–19.[19] W. Amelung, M.V. Cheshire, G. Guggenberger, Soil Biol. Biochem. 28 (1996)
1631–1639.[20] C. Laine, T. Tamminen, A. Vikkula, T. Vuorinen, Holzforschung 56 (2002)
607–614.[21] C. Rumpel, M.F. Dignac, Soil Biol. Biochem. 38 (2006) 1478–1481.[22] O. Fiehn, J. Kopka, R.N. Trethewey, L. Willmitzer, Anal. Chem. 72 (2000)
3573–3580.[23] A.I. Ruiz-Matute, O. Hernandez-Hernandez, S. Rodriguez-Sanchez, M.L. Sanz,
I. Martinez-Castro, J. Chromatogr. B: Anal. Technol. Biomed. Life Sci. 879 (2011)1226–1240.
[24] K. Blau, J.M. Halket, Handbook of Derivatives for Chromatography, Wiley, NewYork, 1993.
[25] B.S. Mason, H.T. Slover, J. Agric. Food Chem. 6 (1958) 551–554.[26] M. Becker, T. Zweckmair, A. Forneck, T. Rosenau, A. Potthast, F. Liebner,
J. Chromatogr. A 1281 (2013) 115–126.[27] W. Funcke, C. von Sonntag, Carbohydr. Res. 69 (1979) 247–251.[28] J.R. Snyder, Carbohydr. Res. 198 (1990) 1–13.[29] DIN 32645:2008-11 Chemische Analytik; Nachweis-, Erfassungs- und Bestim-
mungsgrenze unter Wiederholbedingungen; Begriffe, Verfahren, Auswertung.[30] Z. Fuzfai, Z.F. Katona, E. Kovacs, I. Molnar-Perl, J. Agric. Food Chem. 52 (2004)
7444–7452.[31] M.L. Sanz, J. Sanz, I. Martinez-Castro, Chromatographia 56 (2002) 617–622.[32] A. García-Raso, I. Martínez-Castro, M.I. Páez, J. Sanz, J. García-Raso, F. Saura-
Calixto, J. Chromatogr. A 398 (1987) 9–20.[33] E. Kováts, Helv. Chim. Acta 41 (1958) 1915–1932.[34] H. Van Den Dool, P.D. Kratz, J. Chromatogr. A 11 (1963) 463–471.[35] B.d.A. Zellner, C. Bicchi, P. Dugo, P. Rubiolo, G. Dugo, L. Mondello, Flavour Fragr.
J. 23 (2008) 297–314.[36] N. Strehmel, J. Hummel, A. Erban, K. Strassburg, J. Kopka, J. Chromatogr. B:
Anal. Technol. Biomed. Life Sci. 871 (2008) 182–190.[37] A. Garcia-Raso, M.I. Paez, I. Martinez-Castro, J. Sanz, M.M. Calvo, J. Chromatogr.
A 607 (1992) 221–225.[38] J.K. MacLeod, I.L. Flanigan, J.F. Williams, J.G. Collins, J. Mass Spectrom. 36
(2001) 500–508.[39] R.A. Laine, C.C. Sweeley, Carbohydr. Res. 27 (1973) 199–213.[40] I. MolnarPerl, K. Horvath, Chromatographia 45 (1997) 321–327.[41] M.S. Wagner, B.J. Tyler, D.G. Castner, Anal. Chem. 74 (2002) 1824–1835.[42] N.H. Timm, Applied Multivariate Analysis, Springer-Verlag, New York, 2002.[43] L. Ettre, Pure Appl. Chem. 65 (1993) 819.
115
Paper V
A novel method to analyze the degree of acetylation in
biopolymers.
Journal of Chromatography A, vol. 1372, pp. 212‐220.
Zweckmair, T. 1, Becker, M. 1, Ahn, K., Hettegger, H., Kosma, P., Rosenau, T., Potthast, A.
(2014)
1 These authors contributed equally to this work.
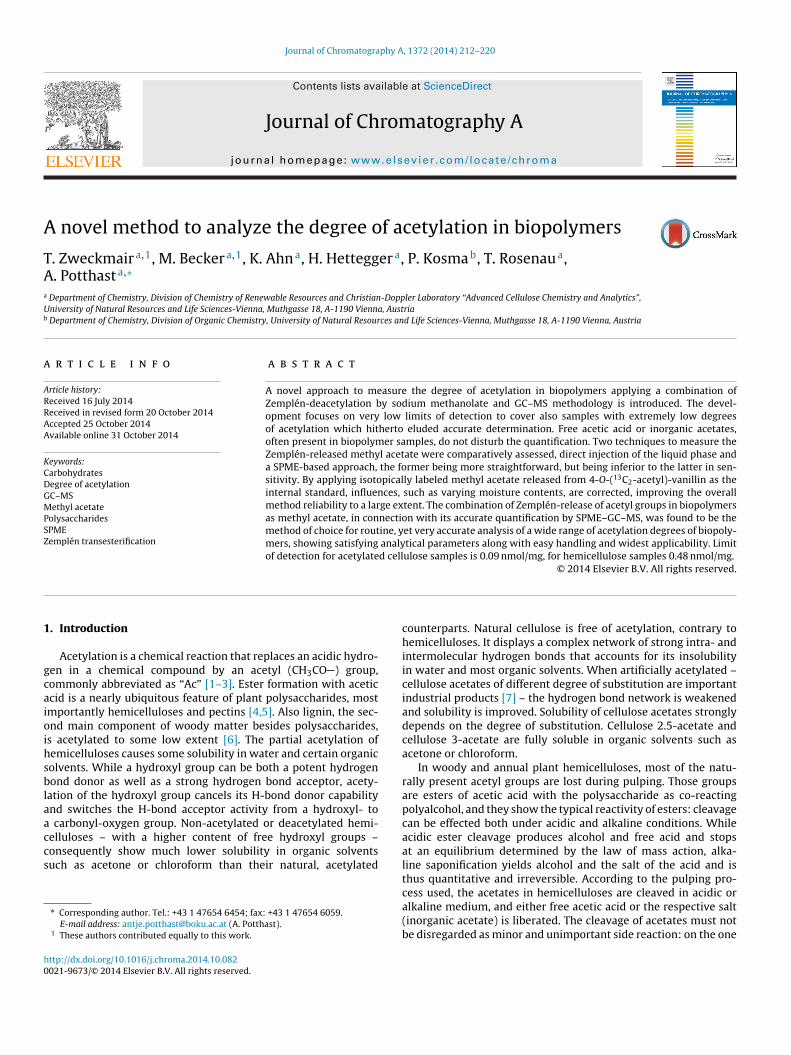
A
TAa
Ub
a
ARRAA
KCDGMPSZ
1
gcaioihsblaaccs
h0
Journal of Chromatography A, 1372 (2014) 212–220
Contents lists available at ScienceDirect
Journal of Chromatography A
jo ur nal ho me pag e: www.elsev ier .com/ locate /chroma
novel method to analyze the degree of acetylation in biopolymers
. Zweckmaira,1, M. Beckera,1, K. Ahna, H. Hetteggera, P. Kosmab, T. Rosenaua,. Potthasta,∗
Department of Chemistry, Division of Chemistry of Renewable Resources and Christian-Doppler Laboratory “Advanced Cellulose Chemistry and Analytics”,niversity of Natural Resources and Life Sciences-Vienna, Muthgasse 18, A-1190 Vienna, AustriaDepartment of Chemistry, Division of Organic Chemistry, University of Natural Resources and Life Sciences-Vienna, Muthgasse 18, A-1190 Vienna, Austria
r t i c l e i n f o
rticle history:eceived 16 July 2014eceived in revised form 20 October 2014ccepted 25 October 2014vailable online 31 October 2014
eywords:arbohydratesegree of acetylationC–MS
a b s t r a c t
A novel approach to measure the degree of acetylation in biopolymers applying a combination ofZemplén-deacetylation by sodium methanolate and GC–MS methodology is introduced. The devel-opment focuses on very low limits of detection to cover also samples with extremely low degreesof acetylation which hitherto eluded accurate determination. Free acetic acid or inorganic acetates,often present in biopolymer samples, do not disturb the quantification. Two techniques to measure theZemplén-released methyl acetate were comparatively assessed, direct injection of the liquid phase anda SPME-based approach, the former being more straightforward, but being inferior to the latter in sen-sitivity. By applying isotopically labeled methyl acetate released from 4-O-(13C2-acetyl)-vanillin as theinternal standard, influences, such as varying moisture contents, are corrected, improving the overall
ethyl acetateolysaccharidesPMEemplén transesterification
method reliability to a large extent. The combination of Zemplén-release of acetyl groups in biopolymersas methyl acetate, in connection with its accurate quantification by SPME–GC–MS, was found to be themethod of choice for routine, yet very accurate analysis of a wide range of acetylation degrees of biopoly-mers, showing satisfying analytical parameters along with easy handling and widest applicability. Limitof detection for acetylated cellulose samples is 0.09 nmol/mg, for hemicellulose samples 0.48 nmol/mg.
© 2014 Elsevier B.V. All rights reserved.
. Introduction
Acetylation is a chemical reaction that replaces an acidic hydro-en in a chemical compound by an acetyl (CH3CO ) group,ommonly abbreviated as “Ac” [1–3]. Ester formation with aceticcid is a nearly ubiquitous feature of plant polysaccharides, mostmportantly hemicelluloses and pectins [4,5]. Also lignin, the sec-nd main component of woody matter besides polysaccharides,s acetylated to some low extent [6]. The partial acetylation ofemicelluloses causes some solubility in water and certain organicolvents. While a hydroxyl group can be both a potent hydrogenond donor as well as a strong hydrogen bond acceptor, acety-
ation of the hydroxyl group cancels its H-bond donor capabilitynd switches the H-bond acceptor activity from a hydroxyl- to
carbonyl-oxygen group. Non-acetylated or deacetylated hemi-
elluloses – with a higher content of free hydroxyl groups –onsequently show much lower solubility in organic solventsuch as acetone or chloroform than their natural, acetylated∗ Corresponding author. Tel.: +43 1 47654 6454; fax: +43 1 47654 6059.E-mail address: [email protected] (A. Potthast).
1 These authors contributed equally to this work.
ttp://dx.doi.org/10.1016/j.chroma.2014.10.082021-9673/© 2014 Elsevier B.V. All rights reserved.
counterparts. Natural cellulose is free of acetylation, contrary tohemicelluloses. It displays a complex network of strong intra- andintermolecular hydrogen bonds that accounts for its insolubilityin water and most organic solvents. When artificially acetylated –cellulose acetates of different degree of substitution are importantindustrial products [7] – the hydrogen bond network is weakenedand solubility is improved. Solubility of cellulose acetates stronglydepends on the degree of substitution. Cellulose 2.5-acetate andcellulose 3-acetate are fully soluble in organic solvents such asacetone or chloroform.
In woody and annual plant hemicelluloses, most of the natu-rally present acetyl groups are lost during pulping. Those groupsare esters of acetic acid with the polysaccharide as co-reactingpolyalcohol, and they show the typical reactivity of esters: cleavagecan be effected both under acidic and alkaline conditions. Whileacidic ester cleavage produces alcohol and free acid and stopsat an equilibrium determined by the law of mass action, alka-line saponification yields alcohol and the salt of the acid and isthus quantitative and irreversible. According to the pulping pro-
cess used, the acetates in hemicelluloses are cleaved in acidic oralkaline medium, and either free acetic acid or the respective salt(inorganic acetate) is liberated. The cleavage of acetates must notbe disregarded as minor and unimportant side reaction: on the one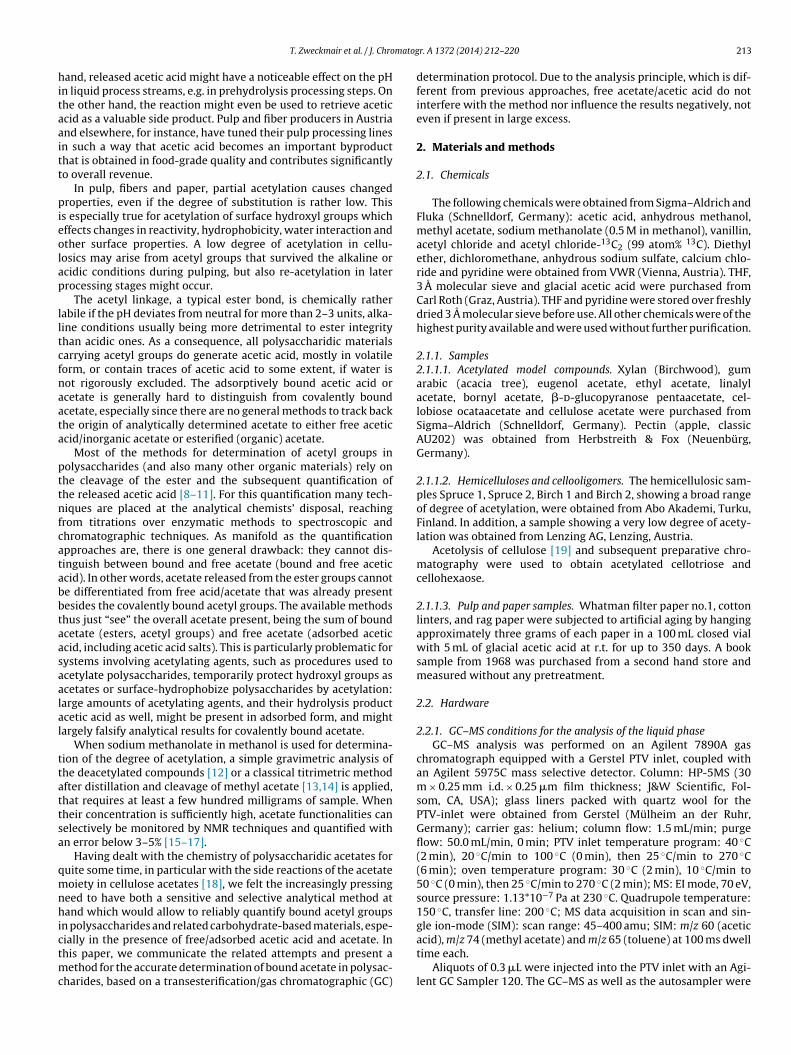
matog
hitaaitt
pieolap
lltcfnaata
pttnfcatabbtaasaalal
ttattsa
qmnhictmc
T. Zweckmair et al. / J. Chro
and, released acetic acid might have a noticeable effect on the pHn liquid process streams, e.g. in prehydrolysis processing steps. Onhe other hand, the reaction might even be used to retrieve aceticcid as a valuable side product. Pulp and fiber producers in Austriand elsewhere, for instance, have tuned their pulp processing linesn such a way that acetic acid becomes an important byproducthat is obtained in food-grade quality and contributes significantlyo overall revenue.
In pulp, fibers and paper, partial acetylation causes changedroperties, even if the degree of substitution is rather low. This
s especially true for acetylation of surface hydroxyl groups whichffects changes in reactivity, hydrophobicity, water interaction andther surface properties. A low degree of acetylation in cellu-osics may arise from acetyl groups that survived the alkaline orcidic conditions during pulping, but also re-acetylation in laterrocessing stages might occur.
The acetyl linkage, a typical ester bond, is chemically ratherabile if the pH deviates from neutral for more than 2–3 units, alka-ine conditions usually being more detrimental to ester integrityhan acidic ones. As a consequence, all polysaccharidic materialsarrying acetyl groups do generate acetic acid, mostly in volatileorm, or contain traces of acetic acid to some extent, if water isot rigorously excluded. The adsorptively bound acetic acid orcetate is generally hard to distinguish from covalently boundcetate, especially since there are no general methods to track backhe origin of analytically determined acetate to either free aceticcid/inorganic acetate or esterified (organic) acetate.
Most of the methods for determination of acetyl groups inolysaccharides (and also many other organic materials) rely onhe cleavage of the ester and the subsequent quantification ofhe released acetic acid [8–11]. For this quantification many tech-iques are placed at the analytical chemists’ disposal, reaching
rom titrations over enzymatic methods to spectroscopic andhromatographic techniques. As manifold as the quantificationpproaches are, there is one general drawback: they cannot dis-inguish between bound and free acetate (bound and free aceticcid). In other words, acetate released from the ester groups cannote differentiated from free acid/acetate that was already presentesides the covalently bound acetyl groups. The available methodshus just “see” the overall acetate present, being the sum of boundcetate (esters, acetyl groups) and free acetate (adsorbed aceticcid, including acetic acid salts). This is particularly problematic forystems involving acetylating agents, such as procedures used tocetylate polysaccharides, temporarily protect hydroxyl groups ascetates or surface-hydrophobize polysaccharides by acetylation:arge amounts of acetylating agents, and their hydrolysis productcetic acid as well, might be present in adsorbed form, and mightargely falsify analytical results for covalently bound acetate.
When sodium methanolate in methanol is used for determina-ion of the degree of acetylation, a simple gravimetric analysis ofhe deacetylated compounds [12] or a classical titrimetric methodfter distillation and cleavage of methyl acetate [13,14] is applied,hat requires at least a few hundred milligrams of sample. Whenheir concentration is sufficiently high, acetate functionalities canelectively be monitored by NMR techniques and quantified withn error below 3–5% [15–17].
Having dealt with the chemistry of polysaccharidic acetates foruite some time, in particular with the side reactions of the acetateoiety in cellulose acetates [18], we felt the increasingly pressing
eed to have both a sensitive and selective analytical method atand which would allow to reliably quantify bound acetyl groups
n polysaccharides and related carbohydrate-based materials, espe-
ially in the presence of free/adsorbed acetic acid and acetate. Inhis paper, we communicate the related attempts and present aethod for the accurate determination of bound acetate in polysac-harides, based on a transesterification/gas chromatographic (GC)
r. A 1372 (2014) 212–220 213
determination protocol. Due to the analysis principle, which is dif-ferent from previous approaches, free acetate/acetic acid do notinterfere with the method nor influence the results negatively, noteven if present in large excess.
2. Materials and methods
2.1. Chemicals
The following chemicals were obtained from Sigma–Aldrich andFluka (Schnelldorf, Germany): acetic acid, anhydrous methanol,methyl acetate, sodium methanolate (0.5 M in methanol), vanillin,acetyl chloride and acetyl chloride-13C2 (99 atom% 13C). Diethylether, dichloromethane, anhydrous sodium sulfate, calcium chlo-ride and pyridine were obtained from VWR (Vienna, Austria). THF,3 A molecular sieve and glacial acetic acid were purchased fromCarl Roth (Graz, Austria). THF and pyridine were stored over freshlydried 3 A molecular sieve before use. All other chemicals were of thehighest purity available and were used without further purification.
2.1.1. Samples2.1.1.1. Acetylated model compounds. Xylan (Birchwood), gumarabic (acacia tree), eugenol acetate, ethyl acetate, linalylacetate, bornyl acetate, �-d-glucopyranose pentaacetate, cel-lobiose ocataacetate and cellulose acetate were purchased fromSigma–Aldrich (Schnelldorf, Germany). Pectin (apple, classicAU202) was obtained from Herbstreith & Fox (Neuenbürg,Germany).
2.1.1.2. Hemicelluloses and cellooligomers. The hemicellulosic sam-ples Spruce 1, Spruce 2, Birch 1 and Birch 2, showing a broad rangeof degree of acetylation, were obtained from Abo Akademi, Turku,Finland. In addition, a sample showing a very low degree of acety-lation was obtained from Lenzing AG, Lenzing, Austria.
Acetolysis of cellulose [19] and subsequent preparative chro-matography were used to obtain acetylated cellotriose andcellohexaose.
2.1.1.3. Pulp and paper samples. Whatman filter paper no.1, cottonlinters, and rag paper were subjected to artificial aging by hangingapproximately three grams of each paper in a 100 mL closed vialwith 5 mL of glacial acetic acid at r.t. for up to 350 days. A booksample from 1968 was purchased from a second hand store andmeasured without any pretreatment.
2.2. Hardware
2.2.1. GC–MS conditions for the analysis of the liquid phaseGC–MS analysis was performed on an Agilent 7890A gas
chromatograph equipped with a Gerstel PTV inlet, coupled withan Agilent 5975C mass selective detector. Column: HP-5MS (30m × 0.25 mm i.d. × 0.25 �m film thickness; J&W Scientific, Fol-som, CA, USA); glass liners packed with quartz wool for thePTV-inlet were obtained from Gerstel (Mülheim an der Ruhr,Germany); carrier gas: helium; column flow: 1.5 mL/min; purgeflow: 50.0 mL/min, 0 min; PTV inlet temperature program: 40 ◦C(2 min), 20 ◦C/min to 100 ◦C (0 min), then 25 ◦C/min to 270 ◦C(6 min); oven temperature program: 30 ◦C (2 min), 10 ◦C/min to50 ◦C (0 min), then 25 ◦C/min to 270 ◦C (2 min); MS: EI mode, 70 eV,source pressure: 1.13*10−7 Pa at 230 ◦C. Quadrupole temperature:150 ◦C, transfer line: 200 ◦C; MS data acquisition in scan and sin-gle ion-mode (SIM): scan range: 45–400 amu; SIM: m/z 60 (acetic
acid), m/z 74 (methyl acetate) and m/z 65 (toluene) at 100 ms dwelltime each.Aliquots of 0.3 �L were injected into the PTV inlet with an Agi-lent GC Sampler 120. The GC–MS as well as the autosampler were
2 matog
cg
2
mdlawatto
abtehtcda
tnhi
tpptataad
wsw
2v(itaGEw
2
22m
2smsm
14 T. Zweckmair et al. / J. Chro
ontrolled by Agilent MSD Chemstation E.02.01 (Agilent Technolo-ies, Santa Clara, CA, USA).
.2.2. GC–MS conditions for the analysis by SPMEGC–MS analysis was carried out on an Agilent 7890A gas chro-
atograph coupled with an Agilent 5975C triple axis mass selectiveetector (MSD). The GC was equipped with two inlets, an Agi-
ent multimode as well as an Agilent split-/splitless inlet. Bleednd temperature optimized septa (Agilent part no. 5183-4757)ere used for covering both inlets. For the analysis of methyl
cetate, a VF-WaxMS column (30 m × 0.25 mm i.d. × 0.25 �m filmhickness; J&W Scientific, Folsom, CA, USA) was connected tohe multimode inlet on one end and to the MSD on thether.
The SPME-parameters optimized should briefly be explained:gitator temperature: temperature of the agitator used to equili-rate the sample vial; incubation time: time used for equilibratinghe sample at a specific agitator temperature without enrichment;nrichment time: time used to expose the fiber into the sampleeadspace for analyte enrichment; desorption time: time usedo expose the fiber into the inlet to facilitate analyte desorption;onditioning time: time used to expose the fiber at a specific con-itioning temperature for preparing the fiber for the subsequentnalyte enrichment.
The split-/splitless inlet was used for fiber conditioning prioro enrichment. A 5 m × 0.25 mm i.d. fused silica capillary was con-ected on one end to the split-/splitless inlet to ensure a moderateelium carrier gas pressure build-up. The other end just protruded
nto the GC-column oven.The multimode-inlet was operated under the following condi-
ions: constant column flow: 0.9 mL/min using helium carrier gas,urge flow: 60.0 mL/min (2.54 min); injector: 90 ◦C constant. Tem-erature gradient profile: 30 ◦C (1 min), 8 ◦C/min to 50 ◦C (0 min),hen 10 ◦C/min to 200 ◦C (2 min). The MSD was operated in EI-modet 70 eV ionization energy and 1.13 × 10⁻⁷ Pa. Ion source tempera-ure: 230 ◦C, quadrupole: 150 ◦C, transfer line: 200 ◦C. The data wascquired in SIM mode selecting 74 m/z for detection of the methylcetate analyte as well as 76 m/z for detection of its carbon-labelederivate at 50 ms dwell time each.
The fully automatized operation of all SPME steps was realizedith a CTC-PALxt autosampler which was controlled by Chronos
oftware v.3.5 (Axel Semrau, Spockhövel, Germany). SPME fibersere obtained from Supelco (Bellefonte, PA, USA).
.2.2.1. Characterization of acetyl vanillin and 4-O-(13C2-acetyl)-anillin. An Agilent XCT 6320 Ion Trap-MS coupled to an ESI-sourceboth Agilent Technologies, Santa Clara, CA, USA) was used. Theon trap was operated by LC/MSD Trap software 5.3 (Bruker Dal-onik GmbH, Bremen, Germany). NMR spectra were recorded on
400 MHz BRUKER Avance II NMR spectrometer (Rheinstetten,ermany) using TopSpin 2.1 (Bruker) for data processing. A Perkinlmer Frontier IR Single-Range spectrometer (Waltham, MA, USA)as used in ATR mode for FTIR measurements.
.3. Methods
.3.1. Method 1: Direct liquid-phase analysis
.3.1.1. Internal standard. Toluene was added to the sodiumethanolate solution as an internal standard.
.3.1.2. Sample preparation. Paper or pulp samples were cut into
mall pieces (approx. 1–2 cm2). 50 mg of the carbohydrate poly-er sample were transferred into a 1.5 mL vial. The vials wereealed with 1.3 mm silicon/PTFE septum crimp caps. 700 �L sodiumethanolate solution containing 1 �L/mL toluene was added
r. A 1372 (2014) 212–220
through the septum. After 5 min reaction time the sample wasready for analysis.
2.3.2. Method 2: Analysis via gas phase2.3.2.1. Internal standard. 4-O-(13C2-acetyl) vanillin was selectedto generate isotopically labeled methyl 13C2-acetate in situ, actingas an internal standard. The synthesis was carried out according to[20]. In brief: a two-necked round-bottomed flask was equippedwith a stirring bar, septum and a drying tube containing CaCl2 asa drying agent. Vanillin (395 mg, 2.56 mmol) was dissolved in THF(1.75 mL) and the solution was cooled to 0 ◦C. A solution of acetylchloride-13C2 (250 mg, 3.08 mmol) in THF (1 mL) was added drop-wise to the ice cooled solution of vanillin. After completion of theaddition, a solution of pyridine (250 �L, 3.10 mmol) in THF (1 mL)was carefully added dropwise to the reaction mixture. Immediatelya white precipitate appeared. The reaction mixture was stirred for1 h at 0 ◦C and for 6 h at room temperature. The progress of the reac-tion was monitored with TLC (n-heptane/ethyl acetate, v/v = 1:2).The white precipitate was filtered off and washed with diethyl ether(2 mL). The turbid filtrate was evaporated and the residue was dis-solved in hot THF (2 mL). After filtration the filter cake was washedwith hot THF (1 mL) and the filtrate was evaporated. The residuewas dissolved in CH2Cl2 (3 mL) and washed with water and brine(each 1 mL). The organic layer was carefully dried with anhydrousNa2SO4 and filtered. The solvent was evaporated yielding a color-less oil. The liquid product was allowed to solidify under ambientconditions and then dried under high vacuum at room temper-ature overnight. Yield: 404 mg of a white solid (1.91 mmol, yield75%); TLC (n-heptane/ethyl acetate, v/v = 1:2): vanillin Rf = 0.47; 4-O-acetyl vanillin Rf = 0.55; FTIR [cm−1]: 1688, 1598, 1506, 1471,1426, 1394, 1277, 1180, 1123. 1H NMR (400.13 MHz, CDCl3) ı[ppm] = 9.97 (s, 1H), 7.52 (s, 1H), 7.50 (d, 1H, J = 9.0 Hz), 7.24 (d,1H, J = 7.8 Hz), 3.93 (s, 3H), 2.37 (dd, 3H, J = 130.3, 7.0 Hz), 1H–13Cheteronuclear coupling clearly visible through the duplet of dupletsat 2.37 ppm; 13C NMR (100.62 MHz, CDCl3) ı [ppm] = 191.0 (CHO),168.3 (d, 13C O, J = 60.5 Hz), 152.0 (Cq), 145.0 (Cq), 135.2 (Cq),124.7 (CarH), 123.4 (CarH), 110.9 (CarH), 56.1 (CH3), 20.6 (d, 13CH3,J = 60.5 Hz), 13C–13C homonuclear coupling clearly visible by thetwo duplets at 168.3 and 20.6 ppm. ESI-MS (5 ppm in THF, positiveionization mode) [m/z]: 153.0 (100%, [M−13CH3
13CO+H]+, C8H9O3),218.9 (12%, [M+Na]+, 13C2
12C8H10O4Na).
2.3.2.2. Sample preparation. 10 mg of 13C2-labeled internalstandard were dissolved in 4 mL of anhydrous methanol (stock A).Approximately 2 mg of cellulose or paper sample were transferredinto a 1.5 mL vial for analysis. 50 �L of anhydrous methanol and20 �L of stock A were added to each sample. 300 �L of sodiummethanolate was transferred to every sample before the vials weresealed with 1.3 mm silicon/PTFE septa crimp caps. The sampleswere immediately ready for analysis by GC–MS.
Hemicellulosic samples were prepared in analogy topaper/cellulose samples except for using 150 �L of anhydrousmethanol, 40 �L of stock A and 180 �L of sodium methanolatesolution.
2.3.3. Statistical data evaluationPairs of datasets were compared using the fitCmpData x-
function of Origin 9.0 (OriginLab, Northhampton, MA, USA). The testfunction compares two datasets, which are fitted with the same fit-ting function, by applying an F-test to determine whether the twodata sets are significantly different from each other.
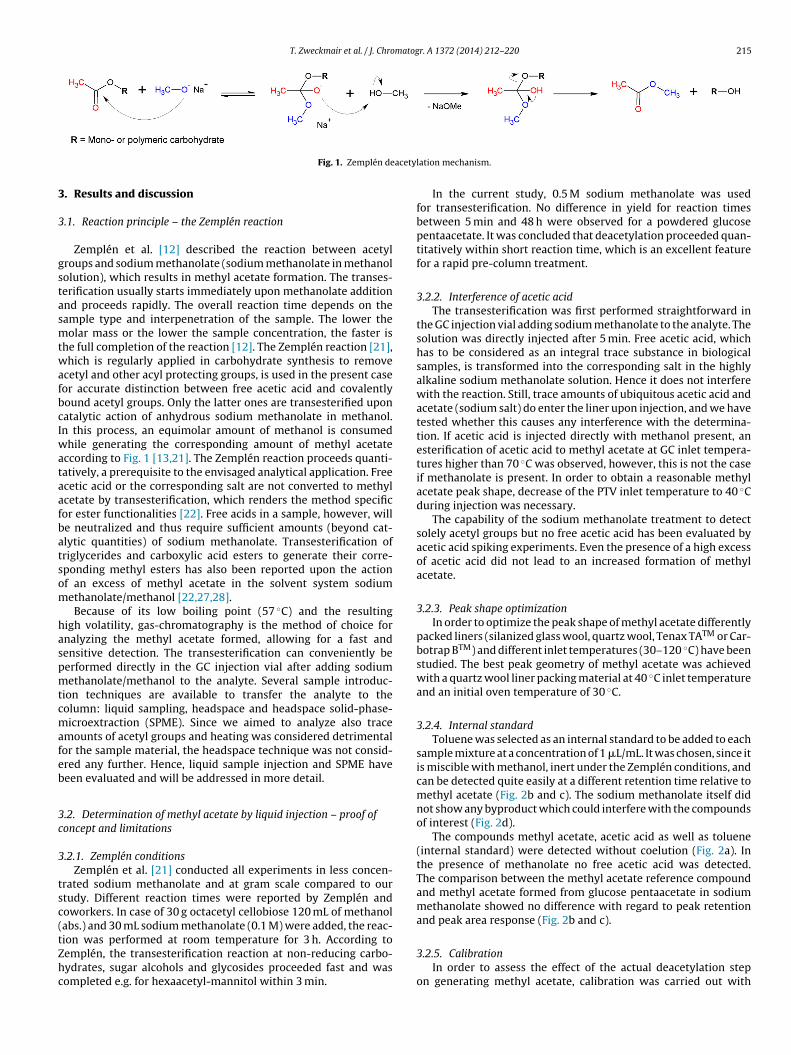
T. Zweckmair et al. / J. Chromatogr. A 1372 (2014) 212–220 215
acety
3
3
gstasmtwafbcIwataafbatsom
haspmtcmafeb
3c
3
tsc(tZhc
Fig. 1. Zemplén de
. Results and discussion
.1. Reaction principle – the Zemplén reaction
Zemplén et al. [12] described the reaction between acetylroups and sodium methanolate (sodium methanolate in methanololution), which results in methyl acetate formation. The transes-erification usually starts immediately upon methanolate additionnd proceeds rapidly. The overall reaction time depends on theample type and interpenetration of the sample. The lower theolar mass or the lower the sample concentration, the faster is
he full completion of the reaction [12]. The Zemplén reaction [21],hich is regularly applied in carbohydrate synthesis to remove
cetyl and other acyl protecting groups, is used in the present caseor accurate distinction between free acetic acid and covalentlyound acetyl groups. Only the latter ones are transesterified uponatalytic action of anhydrous sodium methanolate in methanol.n this process, an equimolar amount of methanol is consumed
hile generating the corresponding amount of methyl acetateccording to Fig. 1 [13,21]. The Zemplén reaction proceeds quanti-atively, a prerequisite to the envisaged analytical application. Freecetic acid or the corresponding salt are not converted to methylcetate by transesterification, which renders the method specificor ester functionalities [22]. Free acids in a sample, however, wille neutralized and thus require sufficient amounts (beyond cat-lytic quantities) of sodium methanolate. Transesterification ofriglycerides and carboxylic acid esters to generate their corre-ponding methyl esters has also been reported upon the actionf an excess of methyl acetate in the solvent system sodiumethanolate/methanol [22,27,28].Because of its low boiling point (57 ◦C) and the resulting
igh volatility, gas-chromatography is the method of choice fornalyzing the methyl acetate formed, allowing for a fast andensitive detection. The transesterification can conveniently beerformed directly in the GC injection vial after adding sodiumethanolate/methanol to the analyte. Several sample introduc-
ion techniques are available to transfer the analyte to theolumn: liquid sampling, headspace and headspace solid-phase-icroextraction (SPME). Since we aimed to analyze also trace
mounts of acetyl groups and heating was considered detrimentalor the sample material, the headspace technique was not consid-red any further. Hence, liquid sample injection and SPME haveeen evaluated and will be addressed in more detail.
.2. Determination of methyl acetate by liquid injection – proof ofoncept and limitations
.2.1. Zemplén conditionsZemplén et al. [21] conducted all experiments in less concen-
rated sodium methanolate and at gram scale compared to ourtudy. Different reaction times were reported by Zemplén andoworkers. In case of 30 g octacetyl cellobiose 120 mL of methanolabs.) and 30 mL sodium methanolate (0.1 M) were added, the reac-
ion was performed at room temperature for 3 h. According toemplén, the transesterification reaction at non-reducing carbo-ydrates, sugar alcohols and glycosides proceeded fast and wasompleted e.g. for hexaacetyl-mannitol within 3 min.lation mechanism.
In the current study, 0.5 M sodium methanolate was usedfor transesterification. No difference in yield for reaction timesbetween 5 min and 48 h were observed for a powdered glucosepentaacetate. It was concluded that deacetylation proceeded quan-titatively within short reaction time, which is an excellent featurefor a rapid pre-column treatment.
3.2.2. Interference of acetic acidThe transesterification was first performed straightforward in
the GC injection vial adding sodium methanolate to the analyte. Thesolution was directly injected after 5 min. Free acetic acid, whichhas to be considered as an integral trace substance in biologicalsamples, is transformed into the corresponding salt in the highlyalkaline sodium methanolate solution. Hence it does not interferewith the reaction. Still, trace amounts of ubiquitous acetic acid andacetate (sodium salt) do enter the liner upon injection, and we havetested whether this causes any interference with the determina-tion. If acetic acid is injected directly with methanol present, anesterification of acetic acid to methyl acetate at GC inlet tempera-tures higher than 70 ◦C was observed, however, this is not the caseif methanolate is present. In order to obtain a reasonable methylacetate peak shape, decrease of the PTV inlet temperature to 40 ◦Cduring injection was necessary.
The capability of the sodium methanolate treatment to detectsolely acetyl groups but no free acetic acid has been evaluated byacetic acid spiking experiments. Even the presence of a high excessof acetic acid did not lead to an increased formation of methylacetate.
3.2.3. Peak shape optimizationIn order to optimize the peak shape of methyl acetate differently
packed liners (silanized glass wool, quartz wool, Tenax TATM or Car-botrap BTM) and different inlet temperatures (30–120 ◦C) have beenstudied. The best peak geometry of methyl acetate was achievedwith a quartz wool liner packing material at 40 ◦C inlet temperatureand an initial oven temperature of 30 ◦C.
3.2.4. Internal standardToluene was selected as an internal standard to be added to each
sample mixture at a concentration of 1 �L/mL. It was chosen, since itis miscible with methanol, inert under the Zemplén conditions, andcan be detected quite easily at a different retention time relative tomethyl acetate (Fig. 2b and c). The sodium methanolate itself didnot show any byproduct which could interfere with the compoundsof interest (Fig. 2d).
The compounds methyl acetate, acetic acid as well as toluene(internal standard) were detected without coelution (Fig. 2a). Inthe presence of methanolate no free acetic acid was detected.The comparison between the methyl acetate reference compoundand methyl acetate formed from glucose pentaacetate in sodiummethanolate showed no difference with regard to peak retentionand peak area response (Fig. 2b and c).
3.2.5. CalibrationIn order to assess the effect of the actual deacetylation step
on generating methyl acetate, calibration was carried out with
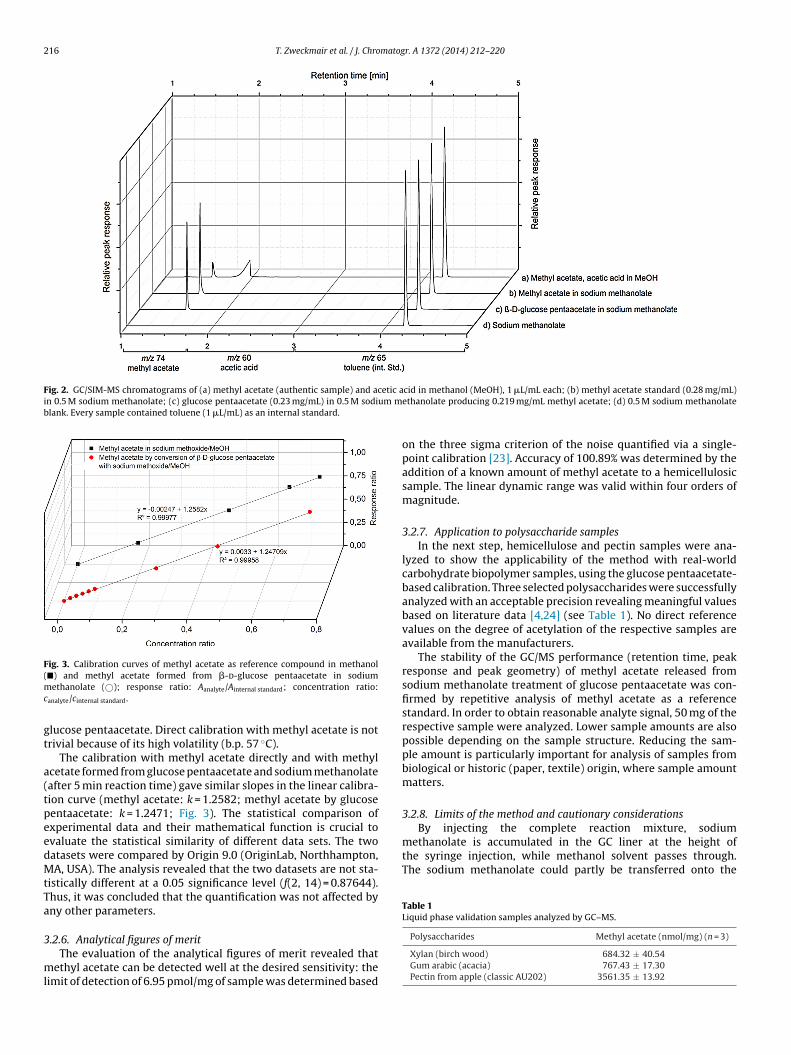
216 T. Zweckmair et al. / J. Chromatogr. A 1372 (2014) 212–220
Fig. 2. GC/SIM-MS chromatograms of (a) methyl acetate (authentic sample) and acetic ain 0.5 M sodium methanolate; (c) glucose pentaacetate (0.23 mg/mL) in 0.5 M sodium mblank. Every sample contained toluene (1 �L/mL) as an internal standard.
Fig. 3. Calibration curves of methyl acetate as reference compound in methanol(mc
gt
a(tpeedMtTa
3
ml
By injecting the complete reaction mixture, sodiummethanolate is accumulated in the GC liner at the height ofthe syringe injection, while methanol solvent passes through.The sodium methanolate could partly be transferred onto the
Table 1Liquid phase validation samples analyzed by GC–MS.
�) and methyl acetate formed from �-d-glucose pentaacetate in sodiumethanolate (©); response ratio: Aanalyte/Ainternal standard; concentration ratio:
analyte/cinternal standard.
lucose pentaacetate. Direct calibration with methyl acetate is notrivial because of its high volatility (b.p. 57 ◦C).
The calibration with methyl acetate directly and with methylcetate formed from glucose pentaacetate and sodium methanolateafter 5 min reaction time) gave similar slopes in the linear calibra-ion curve (methyl acetate: k = 1.2582; methyl acetate by glucoseentaacetate: k = 1.2471; Fig. 3). The statistical comparison ofxperimental data and their mathematical function is crucial tovaluate the statistical similarity of different data sets. The twoatasets were compared by Origin 9.0 (OriginLab, Northhampton,A, USA). The analysis revealed that the two datasets are not sta-
istically different at a 0.05 significance level (f(2, 14) = 0.87644).hus, it was concluded that the quantification was not affected byny other parameters.
.2.6. Analytical figures of meritThe evaluation of the analytical figures of merit revealed that
ethyl acetate can be detected well at the desired sensitivity: theimit of detection of 6.95 pmol/mg of sample was determined based
cid in methanol (MeOH), 1 �L/mL each; (b) methyl acetate standard (0.28 mg/mL)ethanolate producing 0.219 mg/mL methyl acetate; (d) 0.5 M sodium methanolate
on the three sigma criterion of the noise quantified via a single-point calibration [23]. Accuracy of 100.89% was determined by theaddition of a known amount of methyl acetate to a hemicellulosicsample. The linear dynamic range was valid within four orders ofmagnitude.
3.2.7. Application to polysaccharide samplesIn the next step, hemicellulose and pectin samples were ana-
lyzed to show the applicability of the method with real-worldcarbohydrate biopolymer samples, using the glucose pentaacetate-based calibration. Three selected polysaccharides were successfullyanalyzed with an acceptable precision revealing meaningful valuesbased on literature data [4,24] (see Table 1). No direct referencevalues on the degree of acetylation of the respective samples areavailable from the manufacturers.
The stability of the GC/MS performance (retention time, peakresponse and peak geometry) of methyl acetate released fromsodium methanolate treatment of glucose pentaacetate was con-firmed by repetitive analysis of methyl acetate as a referencestandard. In order to obtain reasonable analyte signal, 50 mg of therespective sample were analyzed. Lower sample amounts are alsopossible depending on the sample structure. Reducing the sam-ple amount is particularly important for analysis of samples frombiological or historic (paper, textile) origin, where sample amountmatters.
3.2.8. Limits of the method and cautionary considerations
Polysaccharides Methyl acetate (nmol/mg) (n = 3)
Xylan (birch wood) 684.32 ± 40.54Gum arabic (acacia) 767.43 ± 17.30Pectin from apple (classic AU202) 3561.35 ± 13.92
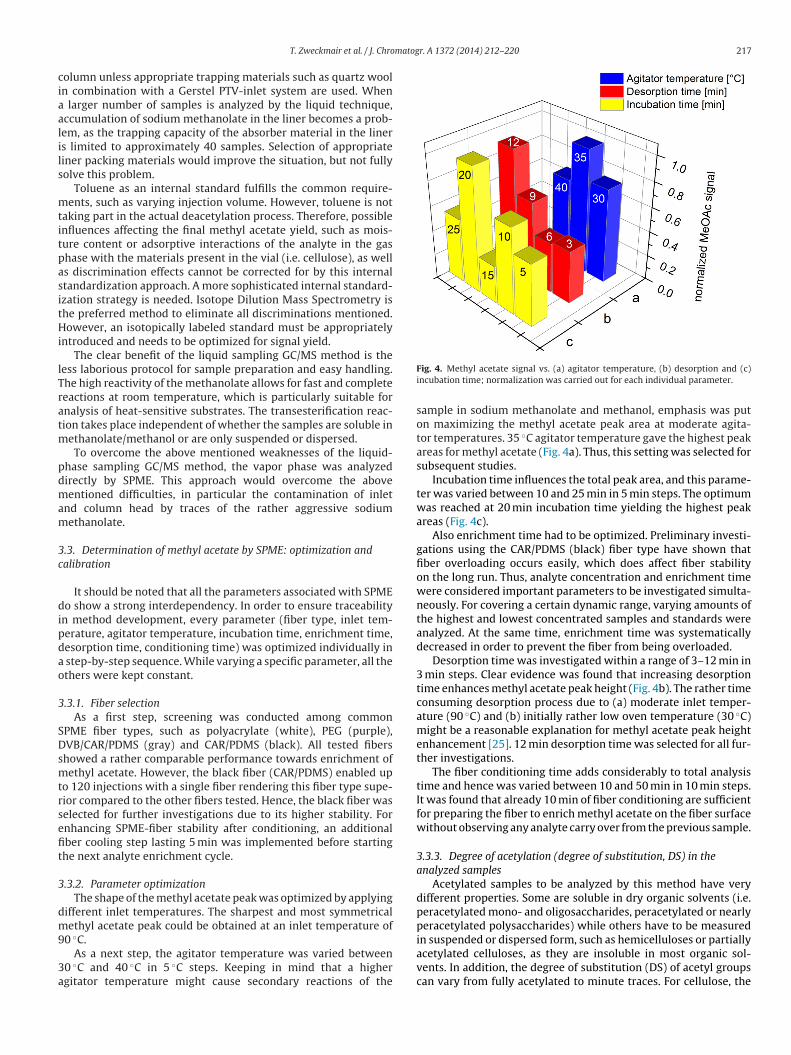
matogr. A 1372 (2014) 212–220 217
ciaalils
mtitpasitHi
lTratm
pdmam
3c
dipdao
3
SDsmtrsefit
3
dm9
3a
T. Zweckmair et al. / J. Chro
olumn unless appropriate trapping materials such as quartz wooln combination with a Gerstel PTV-inlet system are used. When
larger number of samples is analyzed by the liquid technique,ccumulation of sodium methanolate in the liner becomes a prob-em, as the trapping capacity of the absorber material in the liners limited to approximately 40 samples. Selection of appropriateiner packing materials would improve the situation, but not fullyolve this problem.
Toluene as an internal standard fulfills the common require-ents, such as varying injection volume. However, toluene is not
aking part in the actual deacetylation process. Therefore, possiblenfluences affecting the final methyl acetate yield, such as mois-ure content or adsorptive interactions of the analyte in the gashase with the materials present in the vial (i.e. cellulose), as wells discrimination effects cannot be corrected for by this internaltandardization approach. A more sophisticated internal standard-zation strategy is needed. Isotope Dilution Mass Spectrometry ishe preferred method to eliminate all discriminations mentioned.owever, an isotopically labeled standard must be appropriately
ntroduced and needs to be optimized for signal yield.The clear benefit of the liquid sampling GC/MS method is the
ess laborious protocol for sample preparation and easy handling.he high reactivity of the methanolate allows for fast and completeeactions at room temperature, which is particularly suitable fornalysis of heat-sensitive substrates. The transesterification reac-ion takes place independent of whether the samples are soluble in
ethanolate/methanol or are only suspended or dispersed.To overcome the above mentioned weaknesses of the liquid-
hase sampling GC/MS method, the vapor phase was analyzedirectly by SPME. This approach would overcome the aboveentioned difficulties, in particular the contamination of inlet
nd column head by traces of the rather aggressive sodiumethanolate.
.3. Determination of methyl acetate by SPME: optimization andalibration
It should be noted that all the parameters associated with SPMEo show a strong interdependency. In order to ensure traceability
n method development, every parameter (fiber type, inlet tem-erature, agitator temperature, incubation time, enrichment time,esorption time, conditioning time) was optimized individually in
step-by-step sequence. While varying a specific parameter, all thethers were kept constant.
.3.1. Fiber selectionAs a first step, screening was conducted among common
PME fiber types, such as polyacrylate (white), PEG (purple),VB/CAR/PDMS (gray) and CAR/PDMS (black). All tested fibers
howed a rather comparable performance towards enrichment ofethyl acetate. However, the black fiber (CAR/PDMS) enabled up
o 120 injections with a single fiber rendering this fiber type supe-ior compared to the other fibers tested. Hence, the black fiber waselected for further investigations due to its higher stability. Fornhancing SPME-fiber stability after conditioning, an additionalber cooling step lasting 5 min was implemented before startinghe next analyte enrichment cycle.
.3.2. Parameter optimizationThe shape of the methyl acetate peak was optimized by applying
ifferent inlet temperatures. The sharpest and most symmetricalethyl acetate peak could be obtained at an inlet temperature of
0 ◦C.As a next step, the agitator temperature was varied between
0 ◦C and 40 ◦C in 5 ◦C steps. Keeping in mind that a highergitator temperature might cause secondary reactions of the
Fig. 4. Methyl acetate signal vs. (a) agitator temperature, (b) desorption and (c)incubation time; normalization was carried out for each individual parameter.
sample in sodium methanolate and methanol, emphasis was puton maximizing the methyl acetate peak area at moderate agita-tor temperatures. 35 ◦C agitator temperature gave the highest peakareas for methyl acetate (Fig. 4a). Thus, this setting was selected forsubsequent studies.
Incubation time influences the total peak area, and this parame-ter was varied between 10 and 25 min in 5 min steps. The optimumwas reached at 20 min incubation time yielding the highest peakareas (Fig. 4c).
Also enrichment time had to be optimized. Preliminary investi-gations using the CAR/PDMS (black) fiber type have shown thatfiber overloading occurs easily, which does affect fiber stabilityon the long run. Thus, analyte concentration and enrichment timewere considered important parameters to be investigated simulta-neously. For covering a certain dynamic range, varying amounts ofthe highest and lowest concentrated samples and standards wereanalyzed. At the same time, enrichment time was systematicallydecreased in order to prevent the fiber from being overloaded.
Desorption time was investigated within a range of 3–12 min in3 min steps. Clear evidence was found that increasing desorptiontime enhances methyl acetate peak height (Fig. 4b). The rather timeconsuming desorption process due to (a) moderate inlet temper-ature (90 ◦C) and (b) initially rather low oven temperature (30 ◦C)might be a reasonable explanation for methyl acetate peak heightenhancement [25]. 12 min desorption time was selected for all fur-ther investigations.
The fiber conditioning time adds considerably to total analysistime and hence was varied between 10 and 50 min in 10 min steps.It was found that already 10 min of fiber conditioning are sufficientfor preparing the fiber to enrich methyl acetate on the fiber surfacewithout observing any analyte carry over from the previous sample.
3.3.3. Degree of acetylation (degree of substitution, DS) in theanalyzed samples
Acetylated samples to be analyzed by this method have verydifferent properties. Some are soluble in dry organic solvents (i.e.peracetylated mono- and oligosaccharides, peracetylated or nearlyperacetylated polysaccharides) while others have to be measured
in suspended or dispersed form, such as hemicelluloses or partiallyacetylated celluloses, as they are insoluble in most organic sol-vents. In addition, the degree of substitution (DS) of acetyl groupscan vary from fully acetylated to minute traces. For cellulose, the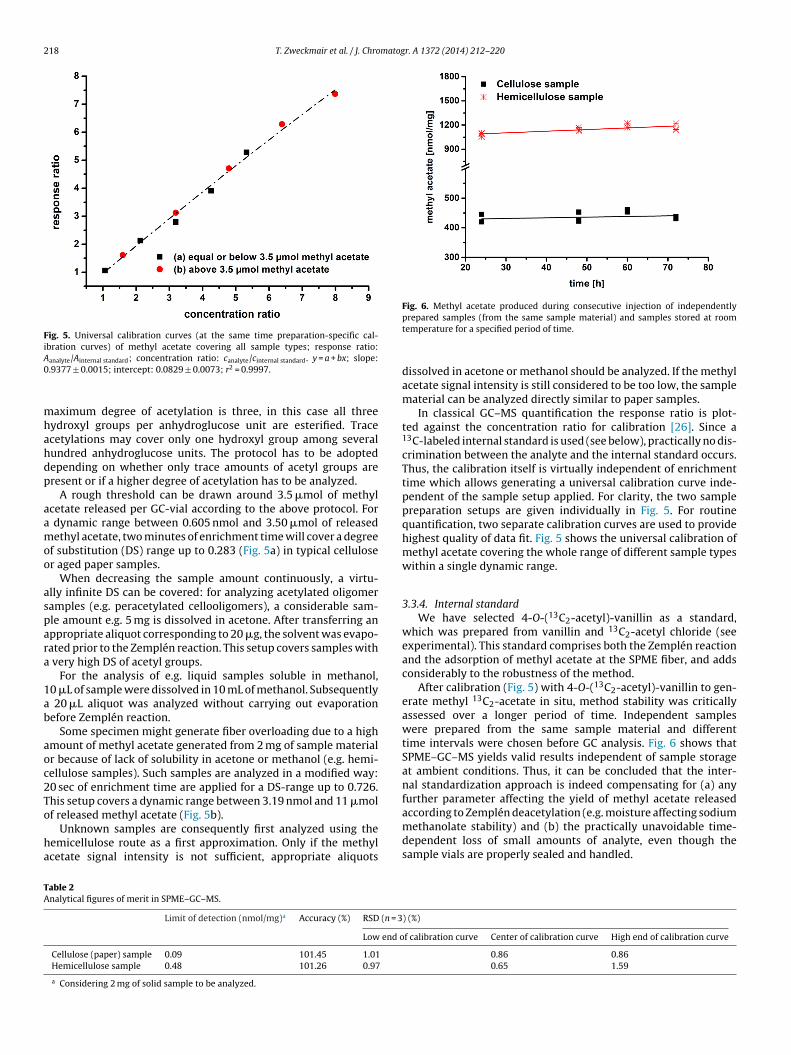
218 T. Zweckmair et al. / J. Chromatogr. A 1372 (2014) 212–220
Fig. 5. Universal calibration curves (at the same time preparation-specific cal-ibration curves) of methyl acetate covering all sample types; response ratio:A0
mhahdp
aamoo
aspara
1ab
aoc2To
ha
Fig. 6. Methyl acetate produced during consecutive injection of independently
TA
analyte/Ainternal standard; concentration ratio: canalyte/cinternal standard. y = a + bx; slope:.9377 ± 0.0015; intercept: 0.0829 ± 0.0073; r2 = 0.9997.
aximum degree of acetylation is three, in this case all threeydroxyl groups per anhydroglucose unit are esterified. Tracecetylations may cover only one hydroxyl group among severalundred anhydroglucose units. The protocol has to be adoptedepending on whether only trace amounts of acetyl groups areresent or if a higher degree of acetylation has to be analyzed.
A rough threshold can be drawn around 3.5 �mol of methylcetate released per GC-vial according to the above protocol. For
dynamic range between 0.605 nmol and 3.50 �mol of releasedethyl acetate, two minutes of enrichment time will cover a degree
f substitution (DS) range up to 0.283 (Fig. 5a) in typical celluloser aged paper samples.
When decreasing the sample amount continuously, a virtu-lly infinite DS can be covered: for analyzing acetylated oligomeramples (e.g. peracetylated cellooligomers), a considerable sam-le amount e.g. 5 mg is dissolved in acetone. After transferring anppropriate aliquot corresponding to 20 �g, the solvent was evapo-ated prior to the Zemplén reaction. This setup covers samples with
very high DS of acetyl groups.For the analysis of e.g. liquid samples soluble in methanol,
0 �L of sample were dissolved in 10 mL of methanol. Subsequently 20 �L aliquot was analyzed without carrying out evaporationefore Zemplén reaction.
Some specimen might generate fiber overloading due to a highmount of methyl acetate generated from 2 mg of sample materialr because of lack of solubility in acetone or methanol (e.g. hemi-ellulose samples). Such samples are analyzed in a modified way:0 sec of enrichment time are applied for a DS-range up to 0.726.his setup covers a dynamic range between 3.19 nmol and 11 �molf released methyl acetate (Fig. 5b).
Unknown samples are consequently first analyzed using theemicellulose route as a first approximation. Only if the methylcetate signal intensity is not sufficient, appropriate aliquots
able 2nalytical figures of merit in SPME–GC–MS.
Limit of detection (nmol/mg)a Accuracy (%) RSD (n = 3
Low end o
Cellulose (paper) sample 0.09 101.45 1.01
Hemicellulose sample 0.48 101.26 0.97
a Considering 2 mg of solid sample to be analyzed.
prepared samples (from the same sample material) and samples stored at roomtemperature for a specified period of time.
dissolved in acetone or methanol should be analyzed. If the methylacetate signal intensity is still considered to be too low, the samplematerial can be analyzed directly similar to paper samples.
In classical GC–MS quantification the response ratio is plot-ted against the concentration ratio for calibration [26]. Since a13C-labeled internal standard is used (see below), practically no dis-crimination between the analyte and the internal standard occurs.Thus, the calibration itself is virtually independent of enrichmenttime which allows generating a universal calibration curve inde-pendent of the sample setup applied. For clarity, the two samplepreparation setups are given individually in Fig. 5. For routinequantification, two separate calibration curves are used to providehighest quality of data fit. Fig. 5 shows the universal calibration ofmethyl acetate covering the whole range of different sample typeswithin a single dynamic range.
3.3.4. Internal standardWe have selected 4-O-(13C2-acetyl)-vanillin as a standard,
which was prepared from vanillin and 13C2-acetyl chloride (seeexperimental). This standard comprises both the Zemplén reactionand the adsorption of methyl acetate at the SPME fiber, and addsconsiderably to the robustness of the method.
After calibration (Fig. 5) with 4-O-(13C2-acetyl)-vanillin to gen-erate methyl 13C2-acetate in situ, method stability was criticallyassessed over a longer period of time. Independent sampleswere prepared from the same sample material and differenttime intervals were chosen before GC analysis. Fig. 6 shows thatSPME–GC–MS yields valid results independent of sample storageat ambient conditions. Thus, it can be concluded that the inter-nal standardization approach is indeed compensating for (a) anyfurther parameter affecting the yield of methyl acetate releasedaccording to Zemplén deacetylation (e.g. moisture affecting sodium
methanolate stability) and (b) the practically unavoidable time-dependent loss of small amounts of analyte, even though thesample vials are properly sealed and handled.) (%)
f calibration curve Center of calibration curve High end of calibration curve
0.86 0.860.65 1.59
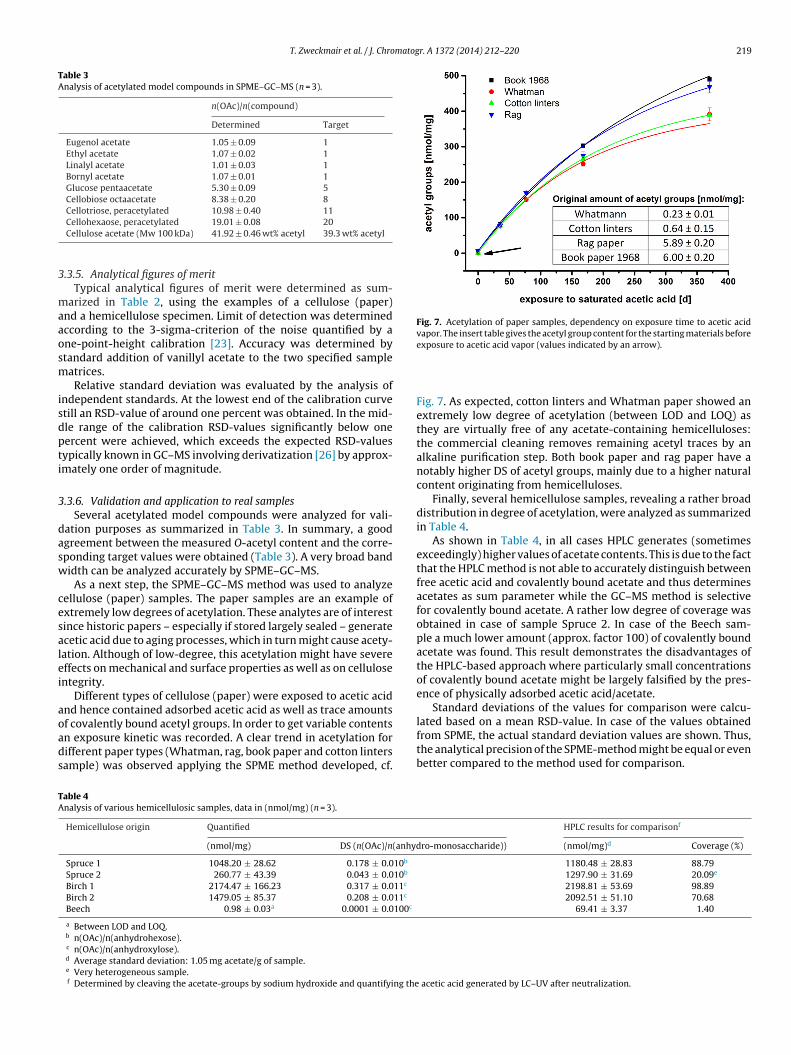
T. Zweckmair et al. / J. Chromatogr. A 1372 (2014) 212–220 219
Table 3Analysis of acetylated model compounds in SPME–GC–MS (n = 3).
n(OAc)/n(compound)
Determined Target
Eugenol acetate 1.05 ± 0.09 1Ethyl acetate 1.07 ± 0.02 1Linalyl acetate 1.01 ± 0.03 1Bornyl acetate 1.07 ± 0.01 1Glucose pentaacetate 5.30 ± 0.09 5Cellobiose octaacetate 8.38 ± 0.20 8Cellotriose, peracetylated 10.98 ± 0.40 11
3
maaosm
isdpti
3
dasw
cesalei
aoads
Fig. 7. Acetylation of paper samples, dependency on exposure time to acetic acidvapor. The insert table gives the acetyl group content for the starting materials before
TA
Cellohexaose, peracetylated 19.01 ± 0.08 20Cellulose acetate (Mw 100 kDa) 41.92 ± 0.46 wt% acetyl 39.3 wt% acetyl
.3.5. Analytical figures of meritTypical analytical figures of merit were determined as sum-
arized in Table 2, using the examples of a cellulose (paper)nd a hemicellulose specimen. Limit of detection was determinedccording to the 3-sigma-criterion of the noise quantified by ane-point-height calibration [23]. Accuracy was determined bytandard addition of vanillyl acetate to the two specified sampleatrices.Relative standard deviation was evaluated by the analysis of
ndependent standards. At the lowest end of the calibration curvetill an RSD-value of around one percent was obtained. In the mid-le range of the calibration RSD-values significantly below oneercent were achieved, which exceeds the expected RSD-valuesypically known in GC–MS involving derivatization [26] by approx-mately one order of magnitude.
.3.6. Validation and application to real samplesSeveral acetylated model compounds were analyzed for vali-
ation purposes as summarized in Table 3. In summary, a goodgreement between the measured O-acetyl content and the corre-ponding target values were obtained (Table 3). A very broad bandidth can be analyzed accurately by SPME–GC–MS.
As a next step, the SPME–GC–MS method was used to analyzeellulose (paper) samples. The paper samples are an example ofxtremely low degrees of acetylation. These analytes are of interestince historic papers – especially if stored largely sealed – generatecetic acid due to aging processes, which in turn might cause acety-ation. Although of low-degree, this acetylation might have severeffects on mechanical and surface properties as well as on cellulosentegrity.
Different types of cellulose (paper) were exposed to acetic acidnd hence contained adsorbed acetic acid as well as trace amounts
f covalently bound acetyl groups. In order to get variable contentsn exposure kinetic was recorded. A clear trend in acetylation forifferent paper types (Whatman, rag, book paper and cotton lintersample) was observed applying the SPME method developed, cf.able 4nalysis of various hemicellulosic samples, data in (nmol/mg) (n = 3).
Hemicellulose origin Quantified
(nmol/mg) DS (n(OAc)/n(anhyd
Spruce 1 1048.20 ± 28.62 0.178 ± 0.010b
Spruce 2 260.77 ± 43.39 0.043 ± 0.010b
Birch 1 2174.47 ± 166.23 0.317 ± 0.011c
Birch 2 1479.05 ± 85.37 0.208 ± 0.011c
Beech 0.98 ± 0.03a 0.0001 ± 0.0100c
a Between LOD and LOQ.b n(OAc)/n(anhydrohexose).c n(OAc)/n(anhydroxylose).d Average standard deviation: 1.05 mg acetate/g of sample.e Very heterogeneous sample.f Determined by cleaving the acetate-groups by sodium hydroxide and quantifying the
exposure to acetic acid vapor (values indicated by an arrow).
Fig. 7. As expected, cotton linters and Whatman paper showed anextremely low degree of acetylation (between LOD and LOQ) asthey are virtually free of any acetate-containing hemicelluloses:the commercial cleaning removes remaining acetyl traces by analkaline purification step. Both book paper and rag paper have anotably higher DS of acetyl groups, mainly due to a higher naturalcontent originating from hemicelluloses.
Finally, several hemicellulose samples, revealing a rather broaddistribution in degree of acetylation, were analyzed as summarizedin Table 4.
As shown in Table 4, in all cases HPLC generates (sometimesexceedingly) higher values of acetate contents. This is due to the factthat the HPLC method is not able to accurately distinguish betweenfree acetic acid and covalently bound acetate and thus determinesacetates as sum parameter while the GC–MS method is selectivefor covalently bound acetate. A rather low degree of coverage wasobtained in case of sample Spruce 2. In case of the Beech sam-ple a much lower amount (approx. factor 100) of covalently boundacetate was found. This result demonstrates the disadvantages ofthe HPLC-based approach where particularly small concentrationsof covalently bound acetate might be largely falsified by the pres-ence of physically adsorbed acetic acid/acetate.
Standard deviations of the values for comparison were calcu-lated based on a mean RSD-value. In case of the values obtainedfrom SPME, the actual standard deviation values are shown. Thus,
the analytical precision of the SPME-method might be equal or evenbetter compared to the method used for comparison.HPLC results for comparisonf
ro-monosaccharide)) (nmol/mg)d Coverage (%)
1180.48 ± 28.83 88.791297.90 ± 31.69 20.09e
2198.81 ± 53.69 98.892092.51 ± 51.10 70.68
69.41 ± 3.37 1.40
acetic acid generated by LC–UV after neutralization.
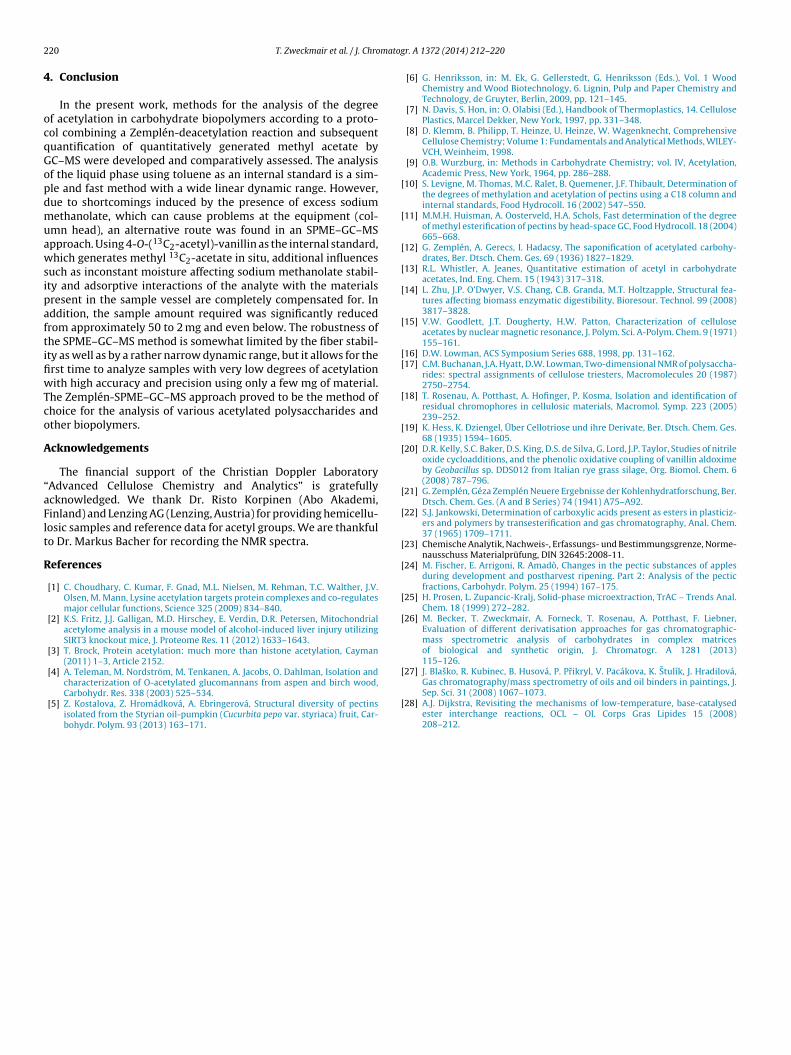
2 matog
4
ocqGopdmuawsipaftifiwTco
A
“aFlt
R
[
[
[
[
[
[
[[
[
[
[
[
[
[
[
[
[
[
20 T. Zweckmair et al. / J. Chro
. Conclusion
In the present work, methods for the analysis of the degreef acetylation in carbohydrate biopolymers according to a proto-ol combining a Zemplén-deacetylation reaction and subsequentuantification of quantitatively generated methyl acetate byC–MS were developed and comparatively assessed. The analysisf the liquid phase using toluene as an internal standard is a sim-le and fast method with a wide linear dynamic range. However,ue to shortcomings induced by the presence of excess sodiumethanolate, which can cause problems at the equipment (col-
mn head), an alternative route was found in an SPME–GC–MSpproach. Using 4-O-(13C2-acetyl)-vanillin as the internal standard,hich generates methyl 13C2-acetate in situ, additional influences
uch as inconstant moisture affecting sodium methanolate stabil-ty and adsorptive interactions of the analyte with the materialsresent in the sample vessel are completely compensated for. Inddition, the sample amount required was significantly reducedrom approximately 50 to 2 mg and even below. The robustness ofhe SPME–GC–MS method is somewhat limited by the fiber stabil-ty as well as by a rather narrow dynamic range, but it allows for therst time to analyze samples with very low degrees of acetylationith high accuracy and precision using only a few mg of material.
he Zemplén-SPME–GC–MS approach proved to be the method ofhoice for the analysis of various acetylated polysaccharides andther biopolymers.
cknowledgements
The financial support of the Christian Doppler LaboratoryAdvanced Cellulose Chemistry and Analytics” is gratefullycknowledged. We thank Dr. Risto Korpinen (Abo Akademi,inland) and Lenzing AG (Lenzing, Austria) for providing hemicellu-osic samples and reference data for acetyl groups. We are thankfulo Dr. Markus Bacher for recording the NMR spectra.
eferences
[1] C. Choudhary, C. Kumar, F. Gnad, M.L. Nielsen, M. Rehman, T.C. Walther, J.V.Olsen, M. Mann, Lysine acetylation targets protein complexes and co-regulatesmajor cellular functions, Science 325 (2009) 834–840.
[2] K.S. Fritz, J.J. Galligan, M.D. Hirschey, E. Verdin, D.R. Petersen, Mitochondrialacetylome analysis in a mouse model of alcohol-induced liver injury utilizingSIRT3 knockout mice, J. Proteome Res. 11 (2012) 1633–1643.
[3] T. Brock, Protein acetylation: much more than histone acetylation, Cayman(2011) 1–3, Article 2152.
[4] A. Teleman, M. Nordström, M. Tenkanen, A. Jacobs, O. Dahlman, Isolation and
characterization of O-acetylated glucomannans from aspen and birch wood,Carbohydr. Res. 338 (2003) 525–534.[5] Z. Kostalova, Z. Hromádková, A. Ebringerová, Structural diversity of pectinsisolated from the Styrian oil-pumpkin (Cucurbita pepo var. styriaca) fruit, Car-bohydr. Polym. 93 (2013) 163–171.
[
r. A 1372 (2014) 212–220
[6] G. Henriksson, in: M. Ek, G. Gellerstedt, G. Henriksson (Eds.), Vol. 1 WoodChemistry and Wood Biotechnology, 6. Lignin, Pulp and Paper Chemistry andTechnology, de Gruyter, Berlin, 2009, pp. 121–145.
[7] N. Davis, S. Hon, in: O. Olabisi (Ed.), Handbook of Thermoplastics, 14. CellulosePlastics, Marcel Dekker, New York, 1997, pp. 331–348.
[8] D. Klemm, B. Philipp, T. Heinze, U. Heinze, W. Wagenknecht, ComprehensiveCellulose Chemistry; Volume 1: Fundamentals and Analytical Methods, WILEY-VCH, Weinheim, 1998.
[9] O.B. Wurzburg, in: Methods in Carbohydrate Chemistry; vol. IV, Acetylation,Academic Press, New York, 1964, pp. 286–288.
10] S. Levigne, M. Thomas, M.C. Ralet, B. Quemener, J.F. Thibault, Determination ofthe degrees of methylation and acetylation of pectins using a C18 column andinternal standards, Food Hydrocoll. 16 (2002) 547–550.
11] M.M.H. Huisman, A. Oosterveld, H.A. Schols, Fast determination of the degreeof methyl esterification of pectins by head-space GC, Food Hydrocoll. 18 (2004)665–668.
12] G. Zemplén, A. Gerecs, I. Hadacsy, The saponification of acetylated carbohy-drates, Ber. Dtsch. Chem. Ges. 69 (1936) 1827–1829.
13] R.L. Whistler, A. Jeanes, Quantitative estimation of acetyl in carbohydrateacetates, Ind. Eng. Chem. 15 (1943) 317–318.
14] L. Zhu, J.P. O’Dwyer, V.S. Chang, C.B. Granda, M.T. Holtzapple, Structural fea-tures affecting biomass enzymatic digestibility, Bioresour. Technol. 99 (2008)3817–3828.
15] V.W. Goodlett, J.T. Dougherty, H.W. Patton, Characterization of celluloseacetates by nuclear magnetic resonance, J. Polym. Sci. A-Polym. Chem. 9 (1971)155–161.
16] D.W. Lowman, ACS Symposium Series 688, 1998, pp. 131–162.17] C.M. Buchanan, J.A. Hyatt, D.W. Lowman, Two-dimensional NMR of polysaccha-
rides: spectral assignments of cellulose triesters, Macromolecules 20 (1987)2750–2754.
18] T. Rosenau, A. Potthast, A. Hofinger, P. Kosma, Isolation and identification ofresidual chromophores in cellulosic materials, Macromol. Symp. 223 (2005)239–252.
19] K. Hess, K. Dziengel, Über Cellotriose und ihre Derivate, Ber. Dtsch. Chem. Ges.68 (1935) 1594–1605.
20] D.R. Kelly, S.C. Baker, D.S. King, D.S. de Silva, G. Lord, J.P. Taylor, Studies of nitrileoxide cycloadditions, and the phenolic oxidative coupling of vanillin aldoximeby Geobacillus sp. DDS012 from Italian rye grass silage, Org. Biomol. Chem. 6(2008) 787–796.
21] G. Zemplén, Géza Zemplén Neuere Ergebnisse der Kohlenhydratforschung, Ber.Dtsch. Chem. Ges. (A and B Series) 74 (1941) A75–A92.
22] S.J. Jankowski, Determination of carboxylic acids present as esters in plasticiz-ers and polymers by transesterification and gas chromatography, Anal. Chem.37 (1965) 1709–1711.
23] Chemische Analytik, Nachweis-, Erfassungs- und Bestimmungsgrenze, Norme-nausschuss Materialprüfung, DIN 32645:2008-11.
24] M. Fischer, E. Arrigoni, R. Amadò, Changes in the pectic substances of applesduring development and postharvest ripening. Part 2: Analysis of the pecticfractions, Carbohydr. Polym. 25 (1994) 167–175.
25] H. Prosen, L. Zupancic-Kralj, Solid-phase microextraction, TrAC – Trends Anal.Chem. 18 (1999) 272–282.
26] M. Becker, T. Zweckmair, A. Forneck, T. Rosenau, A. Potthast, F. Liebner,Evaluation of different derivatisation approaches for gas chromatographic-mass spectrometric analysis of carbohydrates in complex matricesof biological and synthetic origin, J. Chromatogr. A 1281 (2013)115–126.
27] J. Blasko, R. Kubinec, B. Husová, P. Prikryl, V. Pacákova, K. Stulík, J. Hradilová,
Gas chromatography/mass spectrometry of oils and oil binders in paintings, J.Sep. Sci. 31 (2008) 1067–1073.28] A.J. Dijkstra, Revisiting the mechanisms of low-temperature, base-catalysedester interchange reactions, OCL – Ol. Corps Gras Lipides 15 (2008)208–212.

125
Paper VI
The museum in a test tube – Adding a third dimension to the
evaluation of the impact of volatile organic acids on paper.
Polymer Degradation and Stability, vol. 130, pp. 109‐117.
Becker, M.; Meyer, F.; Jeong, M.‐J.; Ahn, K.; Henniges, U.; Potthast, A. (2016)

lable at ScienceDirect
Polymer Degradation and Stability 130 (2016) 109e117
Contents lists avai
Polymer Degradation and Stability
journal homepage: www.elsevier .com/locate /polydegstab
The museum in a test tube e Adding a third dimension to theevaluation of the impact of volatile organic acids on paper
M. Becker a, F. Meyer b, M.-J. Jeong a, c, K. Ahn a, U. Henniges a, A. Potthast a, *
a University of Natural Resources and Life Sciences, Department of Chemistry, Christian-Doppler-Laboratory “Advanced Cellulose Chemistry and Analytics”,Department of Chemistry, Konrad-Lorenz-Str. 24, A-3430, Tulln, Austriab Staatliche Museen zu Berlin (National Museums in Berlin), Kupferstichkabinett (Museum of Prints and Drawings), Matth€aikirchplatz 4, D-10785, Berlin,Germanyc Department of Biological and Environmental Science, Dongguk University-Seoul, Seoul, 100-715, Republic of Korea
a r t i c l e i n f o
Article history:Received 25 January 2016Received in revised form19 May 2016Accepted 29 May 2016Available online 31 May 2016
Keywords:Acetic acidFormic acidPaper degradationStatic headspace gas chromatographyVolatile organic compounds (VOC)Cellulose analysis
* Corresponding author.E-mail address: [email protected] (A. Pott
http://dx.doi.org/10.1016/j.polymdegradstab.2016.05.00141-3910/© 2016 Elsevier Ltd. All rights reserved.
a b s t r a c t
Collections of art on paper, libraries and archives in general, are striving for optimal storage conditionsfor cultural heritage in their deposits and exhibition facilities. Therefore, properly estimating the risk ofvolatile organic compounds emitted from historic and recent storage materials on paper-based collec-tions is of utmost importance. Applying an optimized static headspace gas chromatography and massspectrometry approach combined with cellulose-specific analysis provides insight into the potentialdegradation effects and mechanisms acting on two different paper samples (Whatman No.1 and historicrag paper) used as degradation indicators. Acetic and formic acid, two powerful volatile organic acids,were quantified with differing amounts, depending on the type of historic storage material tested. Molarmass and carbonyl group content were used to monitor cellulose degradation of the indicator papers.Combining these results in 3D plots helps to visualize synergies that evolve from mutual emission ofacetic and formic acids. In addition, choosing between the two paper-based degradation indicators helpsto evaluate different phenomena: Whatman No.1 reacts toward acid hydrolysis and is more sensitive,while rag paper helps to evaluate buffering phenomena as occurring in original materials.
© 2016 Elsevier Ltd. All rights reserved.
1. Introduction
In the last 10 years, indoor air quality has gained increasingresearch interest. Volatile organic compounds (VOCs) have beenreported to be present at high levels in museum environments.They are associated with damages of cultural heritage objects.Therefore, cultural heritage objects kept in museum collectionsemerged as the focus of research because theymay find themselvesexposed to high levels of VOCs as well. Possible emission sourcesare construction materials, furnishings, materials used for storageor presentation of objects, or the objects themselves [1]. Thenegative effect of slow but constant exposure to detrimental off-gassing is often discovered only after noticeable damage hasoccurred on pieces of historic or artistic value. VOCs are known tocause distinct deterioration phenomena on inorganic materials,such as corrosion on metals or efflorescence on calcareous
hast).
26
materials and glass, which appears shortly after the contamination[2]. However, the decomposition of organic materials, such as pa-per, in the presence of VOCs manifests itself in accelerated hydro-lytic depolymerization, which is only recognizable when it hasalready led to a significant loss of physical stability or a change inthe optical properties, thus in an advanced stage of deterioration.Other factors besides VOCs, such as detrimental or unfavorableclimate and lighting conditions and intrinsic contamination withreactive substances, can contribute to the accelerated depolymer-ization of organic materials. Even in ideal storage conditions,organic materials are subjected to a continuous, albeit slow, processof natural deterioration. For these reasons, it is difficult to evaluatethe effect of VOCs (especially those that are acidic) on organicmaterials, such as paper, and to assess the risk they pose.
Among VOCs, acetic acid has been the focus of research for quitesome time. Dupont and Tetreault [3] found an increased degrada-tion of paper substrates with increasing concentration of aceticacid. The lowest concentration of 3 mg per m3 acetic acid did notlead to a noticeable degradation. An increase from 3 mg per m3 to20 mg per m3 noticeably accelerated the deterioration of the paper,

M. Becker et al. / Polymer Degradation and Stability 130 (2016) 109e117110
and an increase to 200 mg per m3 caused a further, yet decelerated,increase of degradation. In later publications by the same authors,the results are put into a different perspective. Significant cellulosedegradation (decreased DP and loss in mechanical strength) couldnot be shown in the presence of 50 ppm acetic acid, formaldehyde,and furfural. Only formic acid vapor led to measurable cellulosedegradation [4]. According to Pedersoli et al., the impact of volatileacetic acid on the aging process of papers is probably negligible, atleast at levels of 0.7 mg per m3: for neutral paper without anyalkaline and acid components, the absorption of acetic acid woulddecrease the pH of their aqueous extracts from 7 to about 5.5 [5].Zou et al. showed, for paper with a pH above 4.0, that the contri-bution of acid catalysis to the rate of cellulose depolymerization byhydrolysis is minor [6]. In acidic papers, which contain stronger orhigher concentrations of acids, or both, resulting in a pH below 4,the absorption of additional acetic acid is not expected to impactsignificantly on the decay rate, but a final proof is needed. Likewise,papers with a filler material, such as calcium carbonate, would notbe negatively impacted because the alkaline components wouldneutralize organic acids absorbed from the environment, which areno longer available for chemical reactions with the cellulose.
To assess the compatibility of materials for the storage anddisplay of cultural assets, the Oddy-Test [7] is often suggested. TheOddy-Test is an accelerated corrosion test inwhich samples of lead,copper, and silver are exposed to the test material at increasedlevels of humidity and temperature in a tightly closed vessel. If thetest materials emit VOCs, they will corrode the respective metalpieces. This observation leads to a negative evaluation of the testmaterial as potentially harmful to metal-based museum artefacts,for which the test was initially developed. Subsequently, the Oddy-Test has also been used in a more general context to assess thecompatibility of materials with non-metallic, even organic, objects.In addition to its simple and inexpensive nature, one key advantageof the Oddy-Test lies in its low specificity, which enables thedetection of a broad spectrum of volatile compounds and theestimation of the general emission potential of a material. However,a qualitative or quantitative determination of VOCs is not possible.Furthermore, despite the use of the Oddy-Test for 30 years, it hasnot been adequately standardized, and a broad variation of pro-cedures is described in the literature leading to hardly comparableresults [8e11]. Overall, the Oddy-Test has proven valuable as anexclusion test: a material that did not cause any corrosion duringthe test is expected to be safe in combinationwith museum objectsof both inorganic and organic composition [11]. However, whetherthe VOC-induced corrosion of test metals caused by a materialunder extreme conditions can be a meaningful indicator of itsgeneral deteriorating effect on cultural assets, especially organicmaterials under moderate climate conditions, remainsquestionable.
Strli�c et al. [12] proposed a new rapid test method (we refer to asStrli�c -Test) for assessing the compatibility of materials for housingand display of paper-based heritage objects. In this test, a piece ofthe material to be tested is enclosed in a vial with a reference paper(Whatman No. 1 or ground wood paper) and, subsequently, isartificially aged. The impact of the VOCs emitted by the test ma-terials on the reference papers is evaluated by determining thedecrease of the degree of polymerization of the reference paper.
To judge the effect of formic and acetic acid emitted fromdifferent materials used in archival collections on paper, and to seehow strong the effect of the acids really is connected to paperdegradation, we aimed at combining the quantitative emissionanalysis of volatile organic acids with the modified Oddy-Testdeveloped by Strli�c et al. As an example, the collection of thedrawings and prints of Karl Friedrich Schinkel (1781e1841) storedin the Kupferstichkabinett (Museum of Prints and Drawings) of the
Staatliche Museen zu Berlin (National Museums in Berlin) in cabi-nets made of laminated chipboard panels were chosen to demon-strate our concept. To get an initial idea about the VOCs beingpresent at the current storage situation and to assess their con-centrations, qualitative and quantitative determination of the VOCsinside the cabinet were performed using active sampling in com-binationwith gas chromatography andmass spectrometry (GC-MS)and high-performance liquid chromatography (HPLC) respectively.
To estimate the risk of the detected VOCs on the paper-basedartworks stored within the cabinets, and to take measures ac-cording to the determined risk, it seemed to be reasonable to getmore information about the emission and the damaging potentialof the single materials being present at the current housing situa-tion. Acetic acid and formic acid, two VOCs with high destructionpotential, require more detailed research. The emissions of formicand acetic acid from different storagematerials used in the Schinkelcollection were examined using headspace GC-MS. To extend thescope of the test further, the degree of polymerization and theentire molar mass distribution and carbonyl group profiles wereanalyzed. This approach yields additional data on oxidativeprocesses.
2. Material and methods
2.1. Chemicals
Acetic acid, formic acid, N,N-dimethylacetamide, lithium chlo-ride, toluene-d8 and 1,2-dimethoxybenzol (common name “vera-trol”), 2-(2-chloro-6-fluorophenyl)-acetoaceton (“acetoaceton”),methanol-d3, aceton-d6, 4-pentan-1-ol, 3-pentanone, and hexanalwere purchased from Sigma-Aldrich (Sigma-Aldrich Han-delsGmbH, Vienna, Austria). All standards and chemicals were ofHPLC- or GC-grade purity and were used without furtherpurification.
2.2. Sample material
The selection of sample materials reflects the storage situationfound in theMuseum of Prints and Drawings in Berlin and is furthermotivated and supported by previous studies [13]. A historic ragpaper similar to the one Schinkel used, representative materialsfrom the paperboard mounts that were in direct contact with thedrawings and prints, materials that constitute the portfolio inwhich they are stored, and cabinet materials were used for theexaminations. The dates of origin vary from 1800 to 1990 (Table 1).
Whatman filter paper No. 1 and historic rag paper (material no.1; Table 1) were additionally used for the modified Strli�c -Test.
2.3. Analysis of formic acid and acetic acid emission potential bystatic headspace GC-MS with selected-ion monitoring (SHS-GC/SIM-MS)
Sample materials were cut into small pieces (approx. 1e2 mm2)and, depending on the calibration range of the respective VOC,between 100 mg and 250 mg of the samples were transferred in a10 mL crimp-cap vial. The vials were sealed with a crimp capcontaining UltraClean silicon/PTFE septa (45� shore A, 3 mm). Staticheadspace GC-MS analysis of formic acid and acetic acid was per-formed on a 7890A gas chromatograph coupled with a 5975C massselective detector (Agilent Technologies). Samples were introducedby an auto sampler (Agilent GC Sampler 120). Agitator settings:incubation time 1800 s, incubation temperature 120 �C, and syringetemperature 130 �C. Injection: 250 mL, split ratio 5:1, 240 �C. Sep-aration: Fused silica HP-5MS column (30 m � 0.25 mm � 0.25 mm;J&W Scientific, Folsom, CA, USA) using helium as carrier gas.
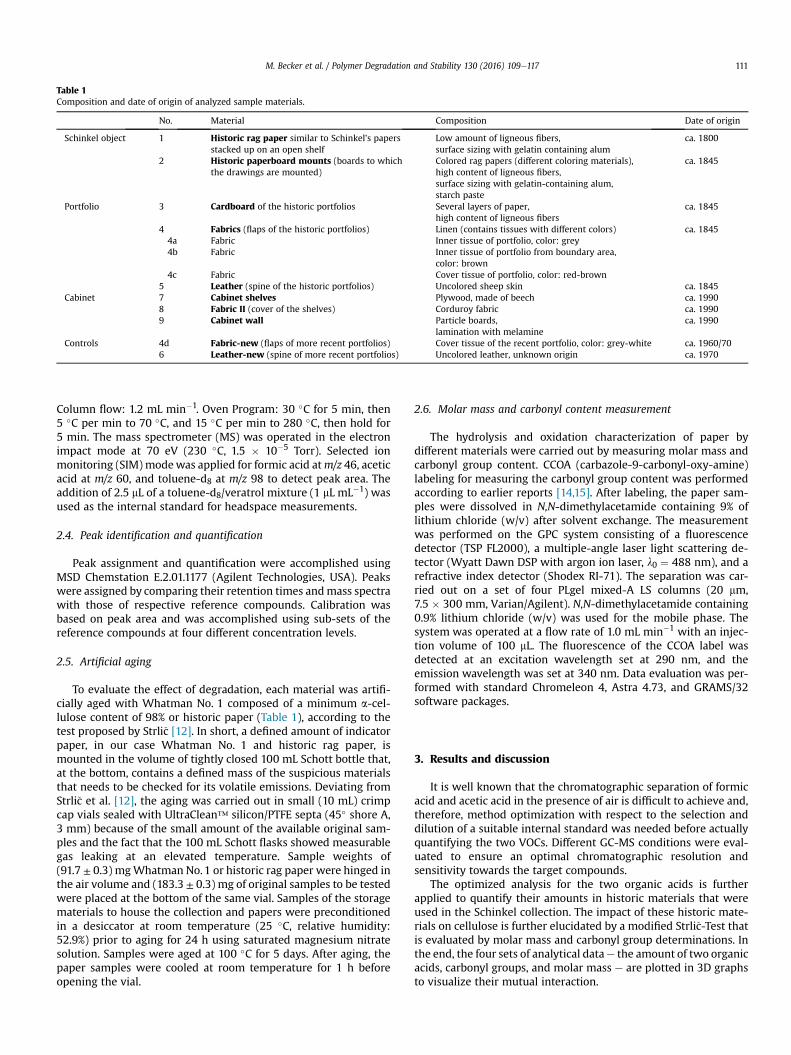
Table 1Composition and date of origin of analyzed sample materials.
No. Material Composition Date of origin
Schinkel object 1 Historic rag paper similar to Schinkel’s papersstacked up on an open shelf
Low amount of ligneous fibers,surface sizing with gelatin containing alum
ca. 1800
2 Historic paperboard mounts (boards to whichthe drawings are mounted)
Colored rag papers (different coloring materials),high content of ligneous fibers,surface sizing with gelatin-containing alum,starch paste
ca. 1845
Portfolio 3 Cardboard of the historic portfolios Several layers of paper,high content of ligneous fibers
ca. 1845
4 Fabrics (flaps of the historic portfolios) Linen (contains tissues with different colors) ca. 18454a Fabric Inner tissue of portfolio, color: grey4b Fabric Inner tissue of portfolio from boundary area,
color: brown4c Fabric Cover tissue of portfolio, color: red-brown
5 Leather (spine of the historic portfolios) Uncolored sheep skin ca. 1845Cabinet 7 Cabinet shelves Plywood, made of beech ca. 1990
8 Fabric II (cover of the shelves) Corduroy fabric ca. 19909 Cabinet wall Particle boards,
lamination with melamineca. 1990
Controls 4d Fabric-new (flaps of more recent portfolios) Cover tissue of the recent portfolio, color: grey-white ca. 1960/706 Leather-new (spine of more recent portfolios) Uncolored leather, unknown origin ca. 1970
M. Becker et al. / Polymer Degradation and Stability 130 (2016) 109e117 111
Column flow: 1.2 mL min�1. Oven Program: 30 �C for 5 min, then5 �C per min to 70 �C, and 15 �C per min to 280 �C, then hold for5 min. The mass spectrometer (MS) was operated in the electronimpact mode at 70 eV (230 �C, 1.5 � 10�5 Torr). Selected ionmonitoring (SIM)modewas applied for formic acid atm/z 46, aceticacid at m/z 60, and toluene-d8 at m/z 98 to detect peak area. Theaddition of 2.5 mL of a toluene-d8/veratrol mixture (1 mL mL�1) wasused as the internal standard for headspace measurements.
2.4. Peak identification and quantification
Peak assignment and quantification were accomplished usingMSD Chemstation E.2.01.1177 (Agilent Technologies, USA). Peakswere assigned by comparing their retention times andmass spectrawith those of respective reference compounds. Calibration wasbased on peak area and was accomplished using sub-sets of thereference compounds at four different concentration levels.
2.5. Artificial aging
To evaluate the effect of degradation, each material was artifi-cially aged with Whatman No. 1 composed of a minimum a-cel-lulose content of 98% or historic paper (Table 1), according to thetest proposed by Strli�c [12]. In short, a defined amount of indicatorpaper, in our case Whatman No. 1 and historic rag paper, ismounted in the volume of tightly closed 100 mL Schott bottle that,at the bottom, contains a defined mass of the suspicious materialsthat needs to be checked for its volatile emissions. Deviating fromStrli�c et al. [12], the aging was carried out in small (10 mL) crimpcap vials sealed with UltraClean™ silicon/PTFE septa (45� shore A,3 mm) because of the small amount of the available original sam-ples and the fact that the 100 mL Schott flasks showed measurablegas leaking at an elevated temperature. Sample weights of(91.7 ± 0.3) mgWhatman No.1 or historic rag paper were hinged inthe air volume and (183.3 ± 0.3) mg of original samples to be testedwere placed at the bottom of the same vial. Samples of the storagematerials to house the collection and papers were preconditionedin a desiccator at room temperature (25 �C, relative humidity:52.9%) prior to aging for 24 h using saturated magnesium nitratesolution. Samples were aged at 100 �C for 5 days. After aging, thepaper samples were cooled at room temperature for 1 h beforeopening the vial.
2.6. Molar mass and carbonyl content measurement
The hydrolysis and oxidation characterization of paper bydifferent materials were carried out by measuring molar mass andcarbonyl group content. CCOA (carbazole-9-carbonyl-oxy-amine)labeling for measuring the carbonyl group content was performedaccording to earlier reports [14,15]. After labeling, the paper sam-ples were dissolved in N,N-dimethylacetamide containing 9% oflithium chloride (w/v) after solvent exchange. The measurementwas performed on the GPC system consisting of a fluorescencedetector (TSP FL2000), a multiple-angle laser light scattering de-tector (Wyatt Dawn DSP with argon ion laser, l0 ¼ 488 nm), and arefractive index detector (Shodex RI-71). The separation was car-ried out on a set of four PLgel mixed-A LS columns (20 mm,7.5 � 300 mm, Varian/Agilent). N,N-dimethylacetamide containing0.9% lithium chloride (w/v) was used for the mobile phase. Thesystem was operated at a flow rate of 1.0 mL min�1 with an injec-tion volume of 100 mL. The fluorescence of the CCOA label wasdetected at an excitation wavelength set at 290 nm, and theemission wavelength was set at 340 nm. Data evaluation was per-formed with standard Chromeleon 4, Astra 4.73, and GRAMS/32software packages.
3. Results and discussion
It is well known that the chromatographic separation of formicacid and acetic acid in the presence of air is difficult to achieve and,therefore, method optimization with respect to the selection anddilution of a suitable internal standard was needed before actuallyquantifying the two VOCs. Different GC-MS conditions were eval-uated to ensure an optimal chromatographic resolution andsensitivity towards the target compounds.
The optimized analysis for the two organic acids is furtherapplied to quantify their amounts in historic materials that wereused in the Schinkel collection. The impact of these historic mate-rials on cellulose is further elucidated by a modified Strli�c-Test thatis evaluated by molar mass and carbonyl group determinations. Inthe end, the four sets of analytical datae the amount of two organicacids, carbonyl groups, and molar mass e are plotted in 3D graphsto visualize their mutual interaction.
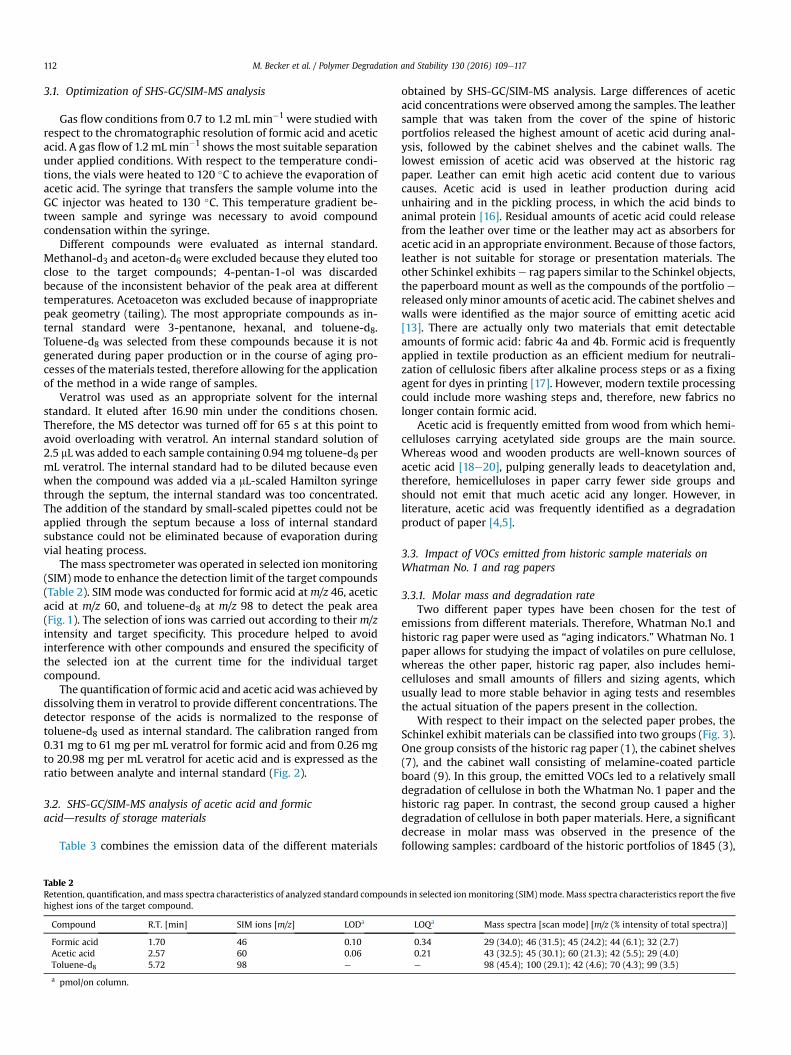
M. Becker et al. / Polymer Degradation and Stability 130 (2016) 109e117112
3.1. Optimization of SHS-GC/SIM-MS analysis
Gas flow conditions from 0.7 to 1.2 mL min�1 were studied withrespect to the chromatographic resolution of formic acid and aceticacid. A gas flow of 1.2 mLmin�1 shows the most suitable separationunder applied conditions. With respect to the temperature condi-tions, the vials were heated to 120 �C to achieve the evaporation ofacetic acid. The syringe that transfers the sample volume into theGC injector was heated to 130 �C. This temperature gradient be-tween sample and syringe was necessary to avoid compoundcondensation within the syringe.
Different compounds were evaluated as internal standard.Methanol-d3 and aceton-d6 were excluded because they eluted tooclose to the target compounds; 4-pentan-1-ol was discardedbecause of the inconsistent behavior of the peak area at differenttemperatures. Acetoaceton was excluded because of inappropriatepeak geometry (tailing). The most appropriate compounds as in-ternal standard were 3-pentanone, hexanal, and toluene-d8.Toluene-d8 was selected from these compounds because it is notgenerated during paper production or in the course of aging pro-cesses of thematerials tested, therefore allowing for the applicationof the method in a wide range of samples.
Veratrol was used as an appropriate solvent for the internalstandard. It eluted after 16.90 min under the conditions chosen.Therefore, the MS detector was turned off for 65 s at this point toavoid overloading with veratrol. An internal standard solution of2.5 mL was added to each sample containing 0.94 mg toluene-d8 permL veratrol. The internal standard had to be diluted because evenwhen the compound was added via a mL-scaled Hamilton syringethrough the septum, the internal standard was too concentrated.The addition of the standard by small-scaled pipettes could not beapplied through the septum because a loss of internal standardsubstance could not be eliminated because of evaporation duringvial heating process.
The mass spectrometer was operated in selected ion monitoring(SIM) mode to enhance the detection limit of the target compounds(Table 2). SIM mode was conducted for formic acid atm/z 46, aceticacid at m/z 60, and toluene-d8 at m/z 98 to detect the peak area(Fig. 1). The selection of ions was carried out according to their m/zintensity and target specificity. This procedure helped to avoidinterference with other compounds and ensured the specificity ofthe selected ion at the current time for the individual targetcompound.
The quantification of formic acid and acetic acid was achieved bydissolving them in veratrol to provide different concentrations. Thedetector response of the acids is normalized to the response oftoluene-d8 used as internal standard. The calibration ranged from0.31 mg to 61 mg per mL veratrol for formic acid and from 0.26 mgto 20.98 mg per mL veratrol for acetic acid and is expressed as theratio between analyte and internal standard (Fig. 2).
3.2. SHS-GC/SIM-MS analysis of acetic acid and formicaciddresults of storage materials
Table 3 combines the emission data of the different materials
Table 2Retention, quantification, andmass spectra characteristics of analyzed standard compounhighest ions of the target compound.
Compound R.T. [min] SIM ions [m/z] LODa
Formic acid 1.70 46 0.10Acetic acid 2.57 60 0.06Toluene-d8 5.72 98 e
a pmol/on column.
obtained by SHS-GC/SIM-MS analysis. Large differences of aceticacid concentrations were observed among the samples. The leathersample that was taken from the cover of the spine of historicportfolios released the highest amount of acetic acid during anal-ysis, followed by the cabinet shelves and the cabinet walls. Thelowest emission of acetic acid was observed at the historic ragpaper. Leather can emit high acetic acid content due to variouscauses. Acetic acid is used in leather production during acidunhairing and in the pickling process, in which the acid binds toanimal protein [16]. Residual amounts of acetic acid could releasefrom the leather over time or the leather may act as absorbers foracetic acid in an appropriate environment. Because of those factors,leather is not suitable for storage or presentation materials. Theother Schinkel exhibits e rag papers similar to the Schinkel objects,the paperboard mount as well as the compounds of the portfolio e
released onlyminor amounts of acetic acid. The cabinet shelves andwalls were identified as the major source of emitting acetic acid[13]. There are actually only two materials that emit detectableamounts of formic acid: fabric 4a and 4b. Formic acid is frequentlyapplied in textile production as an efficient medium for neutrali-zation of cellulosic fibers after alkaline process steps or as a fixingagent for dyes in printing [17]. However, modern textile processingcould include more washing steps and, therefore, new fabrics nolonger contain formic acid.
Acetic acid is frequently emitted from wood from which hemi-celluloses carrying acetylated side groups are the main source.Whereas wood and wooden products are well-known sources ofacetic acid [18e20], pulping generally leads to deacetylation and,therefore, hemicelluloses in paper carry fewer side groups andshould not emit that much acetic acid any longer. However, inliterature, acetic acid was frequently identified as a degradationproduct of paper [4,5].
3.3. Impact of VOCs emitted from historic sample materials onWhatman No. 1 and rag papers
3.3.1. Molar mass and degradation rateTwo different paper types have been chosen for the test of
emissions from different materials. Therefore, Whatman No.1 andhistoric rag paper were used as “aging indicators.” Whatman No. 1paper allows for studying the impact of volatiles on pure cellulose,whereas the other paper, historic rag paper, also includes hemi-celluloses and small amounts of fillers and sizing agents, whichusually lead to more stable behavior in aging tests and resemblesthe actual situation of the papers present in the collection.
With respect to their impact on the selected paper probes, theSchinkel exhibit materials can be classified into two groups (Fig. 3).One group consists of the historic rag paper (1), the cabinet shelves(7), and the cabinet wall consisting of melamine-coated particleboard (9). In this group, the emitted VOCs led to a relatively smalldegradation of cellulose in both the Whatman No. 1 paper and thehistoric rag paper. In contrast, the second group caused a higherdegradation of cellulose in both paper materials. Here, a significantdecrease in molar mass was observed in the presence of thefollowing samples: cardboard of the historic portfolios of 1845 (3),
ds in selected ionmonitoring (SIM) mode. Mass spectra characteristics report the five
LOQa Mass spectra [scan mode] [m/z (% intensity of total spectra)]
0.34 29 (34.0); 46 (31.5); 45 (24.2); 44 (6.1); 32 (2.7)0.21 43 (32.5); 45 (30.1); 60 (21.3); 42 (5.5); 29 (4.0)e 98 (45.4); 100 (29.1); 42 (4.6); 70 (4.3); 99 (3.5)
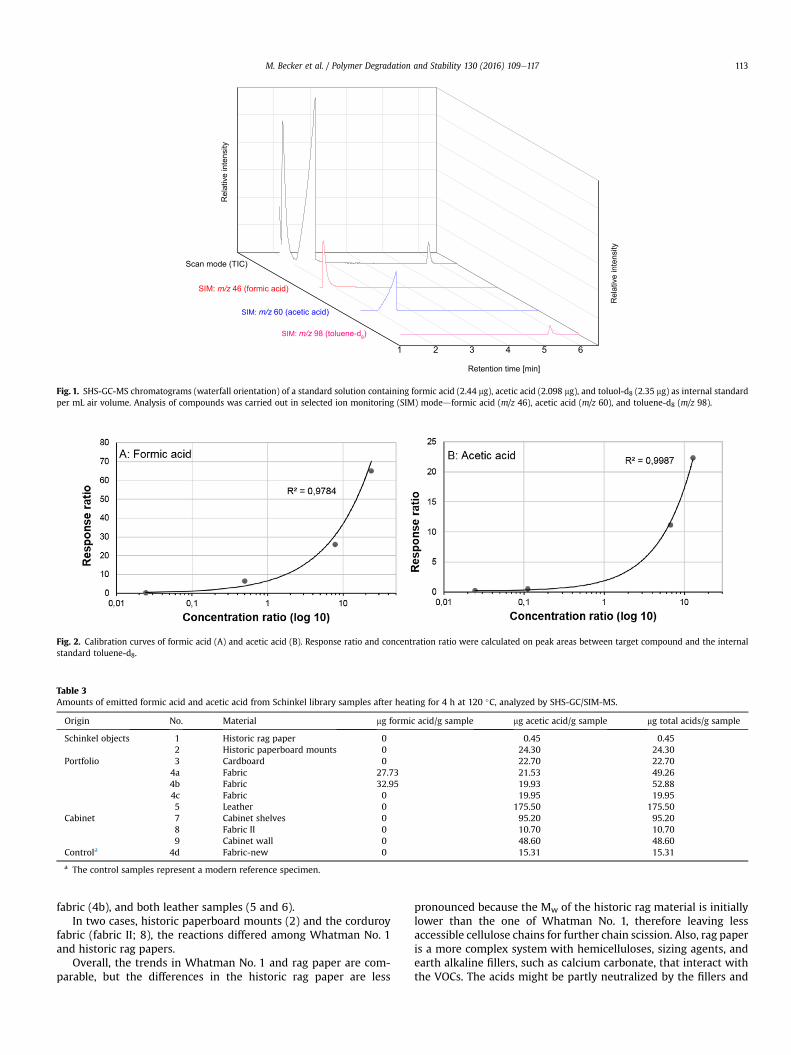
1 2 3 4 5 6
Rel
ativ
e in
tens
ity
Rel
ativ
e in
tens
ity
Scan mode (TIC)
SIM: m/z 46 (formic acid)
SIM: m/z 60 (acetic acid)
SIM: m/z 98 (toluene-d8)
Retention time [min]
Fig. 1. SHS-GC-MS chromatograms (waterfall orientation) of a standard solution containing formic acid (2.44 mg), acetic acid (2.098 mg), and toluol-d8 (2.35 mg) as internal standardper mL air volume. Analysis of compounds was carried out in selected ion monitoring (SIM) modedformic acid (m/z 46), acetic acid (m/z 60), and toluene-d8 (m/z 98).
Fig. 2. Calibration curves of formic acid (A) and acetic acid (B). Response ratio and concentration ratio were calculated on peak areas between target compound and the internalstandard toluene-d8.
Table 3Amounts of emitted formic acid and acetic acid from Schinkel library samples after heating for 4 h at 120 �C, analyzed by SHS-GC/SIM-MS.
Origin No. Material mg formic acid/g sample mg acetic acid/g sample mg total acids/g sample
Schinkel objects 1 Historic rag paper 0 0.45 0.452 Historic paperboard mounts 0 24.30 24.30
Portfolio 3 Cardboard 0 22.70 22.704a Fabric 27.73 21.53 49.264b Fabric 32.95 19.93 52.884c Fabric 0 19.95 19.955 Leather 0 175.50 175.50
Cabinet 7 Cabinet shelves 0 95.20 95.208 Fabric II 0 10.70 10.709 Cabinet wall 0 48.60 48.60
Controla 4d Fabric-new 0 15.31 15.31
a The control samples represent a modern reference specimen.
M. Becker et al. / Polymer Degradation and Stability 130 (2016) 109e117 113
fabric (4b), and both leather samples (5 and 6).In two cases, historic paperboard mounts (2) and the corduroy
fabric (fabric II; 8), the reactions differed among Whatman No. 1and historic rag papers.
Overall, the trends in Whatman No. 1 and rag paper are com-parable, but the differences in the historic rag paper are less
pronounced because the Mw of the historic rag material is initiallylower than the one of Whatman No. 1, therefore leaving lessaccessible cellulose chains for further chain scission. Also, rag paperis a more complex system with hemicelluloses, sizing agents, andearth alkaline fillers, such as calcium carbonate, that interact withthe VOCs. The acids might be partly neutralized by the fillers and
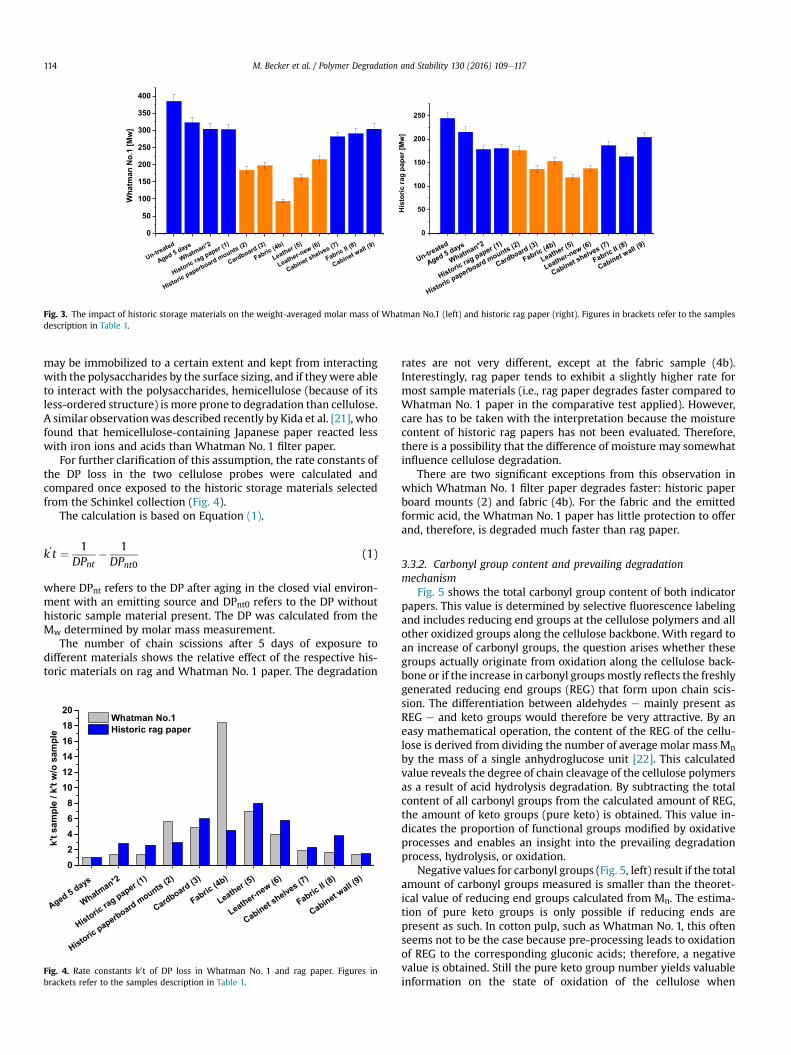
Un-treated
Aged 5 days
Whatman*2
Historic rag paper (1)
Historic paperboard mounts (2)
Cardboard (3)
Fabric (4b)
Leather (5)
Leather-new (6)
Cabinet shelves (7)
Fabric II (8)
Cabinet wall (9)
0
50
100
150
200
250
300
350
400
Wha
tman
No.
1 [M
w]
Un-treated
Aged 5 days
Whatman*2
Historic rag paper (1)
Historic paperboard mounts (2)
Cardboard (3)
Fabric (4b)
Leather (5)
Leather-new (6)
Cabinet shelves (7)
Fabric II (8)
Cabinet wall (9)
0
50
100
150
200
250
His
toric
rag
pape
r [M
w]
Fig. 3. The impact of historic storage materials on the weight-averaged molar mass of Whatman No.1 (left) and historic rag paper (right). Figures in brackets refer to the samplesdescription in Table 1.
M. Becker et al. / Polymer Degradation and Stability 130 (2016) 109e117114
may be immobilized to a certain extent and kept from interactingwith the polysaccharides by the surface sizing, and if theywere ableto interact with the polysaccharides, hemicellulose (because of itsless-ordered structure) is more prone to degradation than cellulose.A similar observationwas described recently by Kida et al. [21], whofound that hemicellulose-containing Japanese paper reacted lesswith iron ions and acids than Whatman No. 1 filter paper.
For further clarification of this assumption, the rate constants ofthe DP loss in the two cellulose probes were calculated andcompared once exposed to the historic storage materials selectedfrom the Schinkel collection (Fig. 4).
The calculation is based on Equation (1).
k’t ¼ 1DPnt
� 1DPnt0
(1)
where DPnt refers to the DP after aging in the closed vial environ-ment with an emitting source and DPnt0 refers to the DP withouthistoric sample material present. The DP was calculated from theMw determined by molar mass measurement.
The number of chain scissions after 5 days of exposure todifferent materials shows the relative effect of the respective his-toric materials on rag and Whatman No. 1 paper. The degradation
Aged 5 days
Whatman*2
Historic ra
g paper (1)
Historic paperboard mounts (2)
Cardboard (3)
Fabric (4b)
Leather (5)
Leather-new (6)
Cabinet shelves (7)
Fabric II (
8)
Cabinet wall (9
)02468
101214161820
elpmas
o/wt'k/
elpmast'k
Whatman No.1Historic rag paper
Fig. 4. Rate constants k0t of DP loss in Whatman No. 1 and rag paper. Figures inbrackets refer to the samples description in Table 1.
rates are not very different, except at the fabric sample (4b).Interestingly, rag paper tends to exhibit a slightly higher rate formost sample materials (i.e., rag paper degrades faster compared toWhatman No. 1 paper in the comparative test applied). However,care has to be taken with the interpretation because the moisturecontent of historic rag papers has not been evaluated. Therefore,there is a possibility that the difference of moisture may somewhatinfluence cellulose degradation.
There are two significant exceptions from this observation inwhich Whatman No. 1 filter paper degrades faster: historic paperboard mounts (2) and fabric (4b). For the fabric and the emittedformic acid, the Whatman No. 1 paper has little protection to offerand, therefore, is degraded much faster than rag paper.
3.3.2. Carbonyl group content and prevailing degradationmechanism
Fig. 5 shows the total carbonyl group content of both indicatorpapers. This value is determined by selective fluorescence labelingand includes reducing end groups at the cellulose polymers and allother oxidized groups along the cellulose backbone. With regard toan increase of carbonyl groups, the question arises whether thesegroups actually originate from oxidation along the cellulose back-bone or if the increase in carbonyl groupsmostly reflects the freshlygenerated reducing end groups (REG) that form upon chain scis-sion. The differentiation between aldehydes e mainly present asREG e and keto groups would therefore be very attractive. By aneasy mathematical operation, the content of the REG of the cellu-lose is derived from dividing the number of average molar mass Mnby the mass of a single anhydroglucose unit [22]. This calculatedvalue reveals the degree of chain cleavage of the cellulose polymersas a result of acid hydrolysis degradation. By subtracting the totalcontent of all carbonyl groups from the calculated amount of REG,the amount of keto groups (pure keto) is obtained. This value in-dicates the proportion of functional groups modified by oxidativeprocesses and enables an insight into the prevailing degradationprocess, hydrolysis, or oxidation.
Negative values for carbonyl groups (Fig. 5, left) result if the totalamount of carbonyl groups measured is smaller than the theoret-ical value of reducing end groups calculated from Mn. The estima-tion of pure keto groups is only possible if reducing ends arepresent as such. In cotton pulp, such as Whatman No. 1, this oftenseems not to be the case because pre-processing leads to oxidationof REG to the corresponding gluconic acids; therefore, a negativevalue is obtained. Still the pure keto group number yields valuableinformation on the state of oxidation of the cellulose when
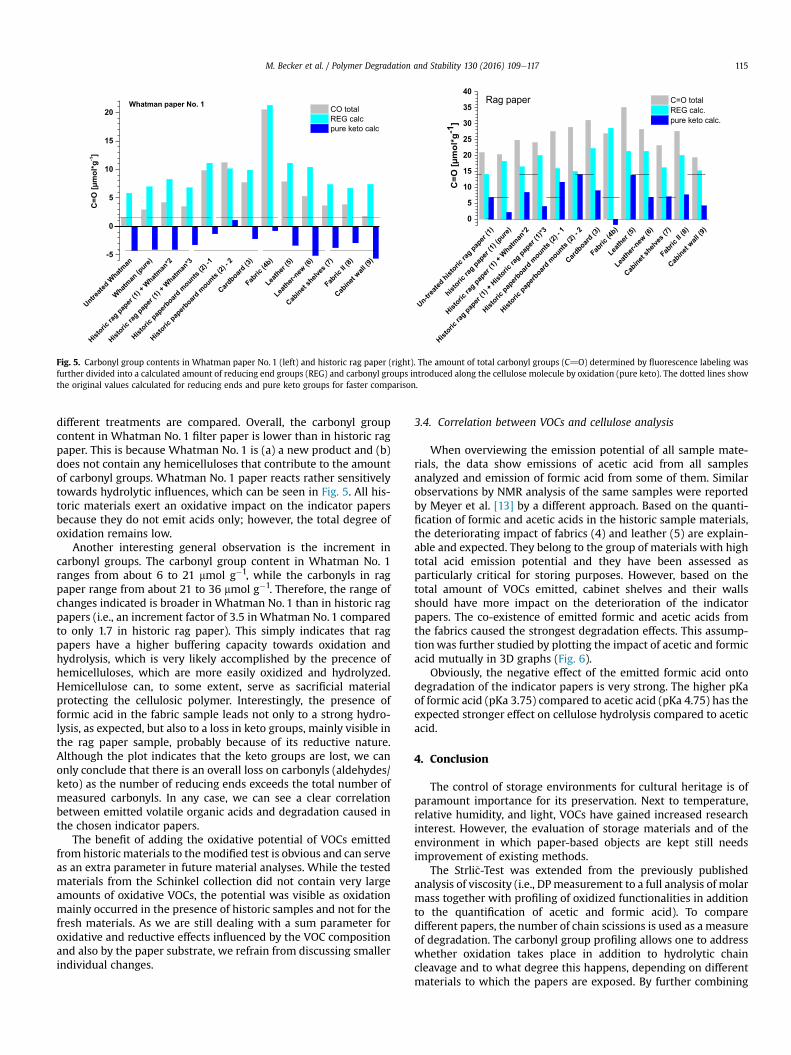
Untreate
d Whatm
an
Whatman
(pure)
Historic
rag pap
er (1)
+ Whatm
an*2
Historic
rag pap
er (1)
+ Whatm
an*3
Historic
paperb
oard m
ounts (2)
-1
Historic
paperb
oard m
ounts (2)
- 2
Cardboard
(3)
Fabric
(4b)
Leather
(5)
Leather-
new (6
)
Cabinet
shelv
es (7
)
Fabric
II (8)
Cabinet
wall (9
)-5
0
5
10
15
20
C=O
[μm
ol*g
-1]
CO total REG calc pure keto calc
Whatman paper No. 1
Un-trea
ted hist
oric ra
g paper
(1)
historic
rag pap
er (1)
(pure)
Historic
rag pap
er (1)
+ Whatm
an*2
Historic
rag pap
er (1)
+ Hist
oric ra
g paper
(1)*3
Historic
paperb
oard m
ounts (2)
- 1
Historic
paperb
oard m
ounts (2)
- 2
Cardboard
(3)
Fabric
(4b)
Leather
(5)
Leather-
new (6
)
Cabinet
shelv
es (7
)
Fabric
II (8)
Cabinet
wall (9
)0
5
10
15
20
25
30
35
40
C=O
[μm
ol*g
-1]
C=O total REG calc. pure keto calc.
Rag paper
Fig. 5. Carbonyl group contents in Whatman paper No. 1 (left) and historic rag paper (right). The amount of total carbonyl groups (C]O) determined by fluorescence labeling wasfurther divided into a calculated amount of reducing end groups (REG) and carbonyl groups introduced along the cellulose molecule by oxidation (pure keto). The dotted lines showthe original values calculated for reducing ends and pure keto groups for faster comparison.
M. Becker et al. / Polymer Degradation and Stability 130 (2016) 109e117 115
different treatments are compared. Overall, the carbonyl groupcontent in Whatman No. 1 filter paper is lower than in historic ragpaper. This is because Whatman No. 1 is (a) a new product and (b)does not contain any hemicelluloses that contribute to the amountof carbonyl groups. Whatman No. 1 paper reacts rather sensitivelytowards hydrolytic influences, which can be seen in Fig. 5. All his-toric materials exert an oxidative impact on the indicator papersbecause they do not emit acids only; however, the total degree ofoxidation remains low.
Another interesting general observation is the increment incarbonyl groups. The carbonyl group content in Whatman No. 1ranges from about 6 to 21 mmol g�1, while the carbonyls in ragpaper range from about 21 to 36 mmol g�1. Therefore, the range ofchanges indicated is broader in Whatman No. 1 than in historic ragpapers (i.e., an increment factor of 3.5 in Whatman No. 1 comparedto only 1.7 in historic rag paper). This simply indicates that ragpapers have a higher buffering capacity towards oxidation andhydrolysis, which is very likely accomplished by the precence ofhemicelluloses, which are more easily oxidized and hydrolyzed.Hemicellulose can, to some extent, serve as sacrificial materialprotecting the cellulosic polymer. Interestingly, the presence offormic acid in the fabric sample leads not only to a strong hydro-lysis, as expected, but also to a loss in keto groups, mainly visible inthe rag paper sample, probably because of its reductive nature.Although the plot indicates that the keto groups are lost, we canonly conclude that there is an overall loss on carbonyls (aldehydes/keto) as the number of reducing ends exceeds the total number ofmeasured carbonyls. In any case, we can see a clear correlationbetween emitted volatile organic acids and degradation caused inthe chosen indicator papers.
The benefit of adding the oxidative potential of VOCs emittedfrom historic materials to themodified test is obvious and can serveas an extra parameter in future material analyses. While the testedmaterials from the Schinkel collection did not contain very largeamounts of oxidative VOCs, the potential was visible as oxidationmainly occurred in the presence of historic samples and not for thefresh materials. As we are still dealing with a sum parameter foroxidative and reductive effects influenced by the VOC compositionand also by the paper substrate, we refrain from discussing smallerindividual changes.
3.4. Correlation between VOCs and cellulose analysis
When overviewing the emission potential of all sample mate-rials, the data show emissions of acetic acid from all samplesanalyzed and emission of formic acid from some of them. Similarobservations by NMR analysis of the same samples were reportedby Meyer et al. [13] by a different approach. Based on the quanti-fication of formic and acetic acids in the historic sample materials,the deteriorating impact of fabrics (4) and leather (5) are explain-able and expected. They belong to the group of materials with hightotal acid emission potential and they have been assessed asparticularly critical for storing purposes. However, based on thetotal amount of VOCs emitted, cabinet shelves and their wallsshould have more impact on the deterioration of the indicatorpapers. The co-existence of emitted formic and acetic acids fromthe fabrics caused the strongest degradation effects. This assump-tionwas further studied by plotting the impact of acetic and formicacid mutually in 3D graphs (Fig. 6).
Obviously, the negative effect of the emitted formic acid ontodegradation of the indicator papers is very strong. The higher pKaof formic acid (pKa 3.75) compared to acetic acid (pKa 4.75) has theexpected stronger effect on cellulose hydrolysis compared to aceticacid.
4. Conclusion
The control of storage environments for cultural heritage is ofparamount importance for its preservation. Next to temperature,relative humidity, and light, VOCs have gained increased researchinterest. However, the evaluation of storage materials and of theenvironment in which paper-based objects are kept still needsimprovement of existing methods.
The Strli�c-Test was extended from the previously publishedanalysis of viscosity (i.e., DPmeasurement to a full analysis of molarmass together with profiling of oxidized functionalities in additionto the quantification of acetic and formic acid). To comparedifferent papers, the number of chain scissions is used as a measureof degradation. The carbonyl group profiling allows one to addresswhether oxidation takes place in addition to hydrolytic chaincleavage and to what degree this happens, depending on differentmaterials to which the papers are exposed. By further combining
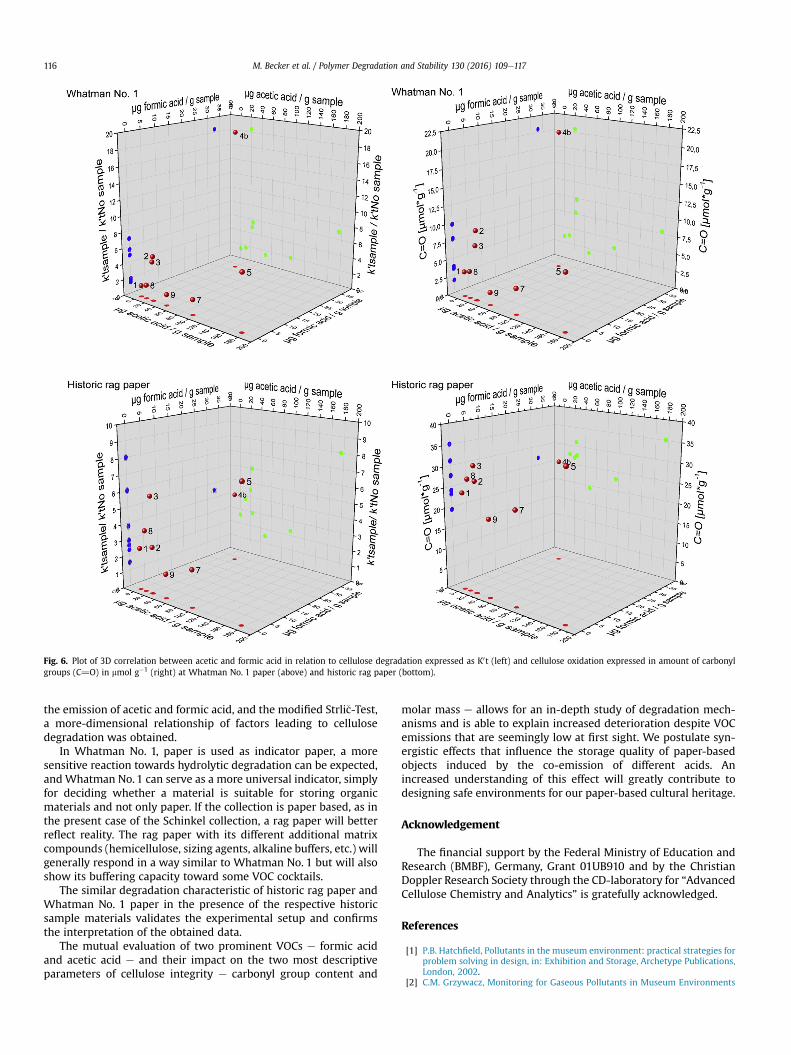
Fig. 6. Plot of 3D correlation between acetic and formic acid in relation to cellulose degradation expressed as K0t (left) and cellulose oxidation expressed in amount of carbonylgroups (C]O) in mmol g�1 (right) at Whatman No. 1 paper (above) and historic rag paper (bottom).
M. Becker et al. / Polymer Degradation and Stability 130 (2016) 109e117116
the emission of acetic and formic acid, and the modified Strli�c-Test,a more-dimensional relationship of factors leading to cellulosedegradation was obtained.
In Whatman No. 1, paper is used as indicator paper, a moresensitive reaction towards hydrolytic degradation can be expected,and Whatman No. 1 can serve as a more universal indicator, simplyfor deciding whether a material is suitable for storing organicmaterials and not only paper. If the collection is paper based, as inthe present case of the Schinkel collection, a rag paper will betterreflect reality. The rag paper with its different additional matrixcompounds (hemicellulose, sizing agents, alkaline buffers, etc.) willgenerally respond in a way similar to Whatman No. 1 but will alsoshow its buffering capacity toward some VOC cocktails.
The similar degradation characteristic of historic rag paper andWhatman No. 1 paper in the presence of the respective historicsample materials validates the experimental setup and confirmsthe interpretation of the obtained data.
The mutual evaluation of two prominent VOCs e formic acidand acetic acid e and their impact on the two most descriptiveparameters of cellulose integrity e carbonyl group content and
molar mass e allows for an in-depth study of degradation mech-anisms and is able to explain increased deterioration despite VOCemissions that are seemingly low at first sight. We postulate syn-ergistic effects that influence the storage quality of paper-basedobjects induced by the co-emission of different acids. Anincreased understanding of this effect will greatly contribute todesigning safe environments for our paper-based cultural heritage.
Acknowledgement
The financial support by the Federal Ministry of Education andResearch (BMBF), Germany, Grant 01UB910 and by the ChristianDoppler Research Society through the CD-laboratory for “AdvancedCellulose Chemistry and Analytics” is gratefully acknowledged.
References
[1] P.B. Hatchfield, Pollutants in the museum environment: practical strategies forproblem solving in design, in: Exhibition and Storage, Archetype Publications,London, 2002.
[2] C.M. Grzywacz, Monitoring for Gaseous Pollutants in Museum Environments
M. Becker et al. / Polymer Degradation and Stability 130 (2016) 109e117 117
(Tools for Conservation), Getty Conservation Institute, Los Angeles, 2006.[3] A.L. Dupont, J. T�etreault, Cellulose degradation in an acetic acid environment,
Stud. Conservation 45 (2000) 201e210.[4] J. T�etreault, A.L. Dupont, P. B�egin, S. Paris, The impact of volatile compounds
released by paper on cellulose degradation in ambient hygrothermal condi-tions, Polym. Degrad. Stab. 98 (2013) 1827e1837.
[5] J.L. Pedersoli, F.J. Ligterink, M. van Bommel, Non-destructive determination ofacetic acid and furfural in books by solid-phase micro-extraction (SPME) andgas chromatography-mass spectrometry (GC/MS), Restaurator 32 (2011)110e134.
[6] X. Zou, T. Uesaka, N. Gurnagul, Prediction of paper permanence by acceleratedaging II. Comparison of the predictions with natural aging results, Cellulose 3(1996) 269e279.
[7] W.A. Oddy, An unsuspected danger in display, Museums J. 73 (1973) 27e28.[8] L. Robinet, D. Thickett, A new methodology for accelerated corrosion testing,
Stud. Conservation 48 (2004) 263e268.[9] J.A. Bamberger, E.G. Howe, G. Wheeler, A variant Oddy test procedure for
evaluating materials used in storage and display cases, Stud. Conservation 44(1999) 86e90.
[10] L.R. Lee, D. Thickett, Selection of materials for the storage or display ofmuseum objects, Br. Mus. Occas. Pap. 111 (1996) 13e15. The British MuseumCompany Ltd, 46 Bloomsbury Street, London WC1B.
[11] L.R. Green, D. Thickett, Testing materials for use in the storage and display ofantiquities - a revised methodology, Stud. Conservation 40 (1995) 145e152.
[12] M. Strli�c, I.K. Cigi�c, A. Mo�zir, D. Thickett, G. De Bruin, J. Kolar, et al., Test forcompatibility with organic heritage materials - a proposed procedure, e-Preservation Sci. 7 (2010) 78e86.
[13] F. Meyer, D. Hansen, V. Knjasev, G. Volland, The “Schinkel’s legacy” project at
the Kupferstichkabinett Berlin, Restaurator 35 (2014) 81.[14] J. R€ohrling, A. Potthast, T. Rosenau, T. Lange, A. Borgards, H. Sixta, et al.,
A novel method for the determination of carbonyl groups in cellulosics byfluorescence labeling. 2. Validation and applications, Biomacromolecules 3(2002) 969e975.
[15] J. R€ohrling, A. Potthast, T. Rosenau, T. Lange, G. Ebner, H. Sixta, et al., A novelmethod for the determination of carbonyl groups in cellulosics by fluores-cence labeling. 1. Method development, Biomacromolecules 3 (2002)959e968.
[16] A.D. Covington, T. Covington, Tanning Chemistry: the Science of Leather, RoyalSociety of Chemistry, 2009.
[17] W. Bernard, Druck von Textilien: mechanische und chemische Technologie,Springer-Verlag, 2013.
[18] S. Colak, G. Colakoglu, Volatile acetic acid and formaldehyde emission fromplywood treated with boron compound, Build. Environ. 39 (2004) 533e536.
[19] L.T. Gibson, B.G. Cooksey, D. Littlejohn, N.H. Tennent, A diffusion tube samplerfor the determination of acetic acid and formic acid vapours in museumcabinets, Anal. Chim. Acta 341 (1997) 11e19.
[20] M. Risholm-Sundman, M. Lundgren, E. Vestin, P. Herder, Emissions of aceticacid and other volatile organic compounds from different species of solidwood, Holz als Roh - Werkst. 56 (1998) 125e129.
[21] K. Kida, A. Potthast, M. Inaba, N. Hayakawa, The effect of iron ions fromprussian blue pigment on the deterioration of Japanese paper, Restaurator 36(2015) 251.
[22] A. Potthast, U. Henniges, G. Banik, Iron gall ink-induced corrosion of cellulose:aging, degradation and stabilization. Part 1: model paper studies, Cellulose 15(2008) 849e859.
135
Paper VII
Comparative hydrolysis analysis of pulps and papers:
carbohydrate compositions and uncovering supramolecular
structure of cellulose.
To be submitted.
Manuel Becker, Kyujin Ahn, Markus Bacher, Chunlin Xu, Anna Sundberg, Stefan Willför,
Thomas Rosenau, Antje Potthast
Comparative hydrolysis analysis of cellulose samples: carbohydrate compositions and uncovering 1
the supramolecular structure of cellulose 2
3
4
Manuel Beckera, Kyujin Ahna, Markus Bachera, Chunlin Xub, Anna Sundbergb, Stefan Willförb, Thomas 5
Rosenaua, Antje Potthasta* 6
a Department of Chemistry, Division of Chemistry of Renewables and Christian‐Doppler Laboratory 7
“Advanced Cellulose Chemistry and Analytics”, University of Natural Resources and Life 8
Sciences, Muthgasse 18, A‐1190 Vienna, Austria 9
b Process Chemistry Centre, C/o Laboratory of Wood and Paper Chemistry, Åbo Akademi University, 10
Porthaninkatu 3, 20500 Turku, Finland 11
12
* Corresponding author: 13
Phone: +43 1 47654 6454, Fax: +43 1 47654 6059, E‐mail address: [email protected] 14
15
16
17
18
19
20
21
22
23
24
25
26
27
28
29
30
31
32
33
34
35
Abstract 36
Knowledge about carbohydrate composition of cellulose samples is essential for their 37
characterization and further processing. Therefore, a novel strategy for the determination of 38
inaccessible cellulose fractions is described. The proposed method based on the sulfuric acid 39
hydrolysis and acid methanolysis, followed by GC‐MS analysis of the corresponding products. The 40
study involved the analysis of 42 polysaccharides and cellulose samples. A statistical comparison of 41
polysaccharides’ monomer patterns with those of cellulosic sample had been carried out to estimate 42
their polysaccharide distribution. The comparison of hydrolysis data was used to calculate the index 43
of recalcitrance cellulose fraction (CRCI) to elucidate the structure of cellulosic samples further. 44
Results of the proposed approach had been compared to NMR data and weight‐average molecular 45
mass data. The application of the proposed analysis method to e‐beam treated or artificially aged 46
samples uncovered structural rearrangements and alteration at the monomer level. 47
48
Keywords 49
Methanolysis, cellulose, crystallinity, electron beam irradiation, hemicellulose, sulfuric acid hydrolysis 50
51
Abbreviations 52
CG2H = Comparison of glucose data obtained by two hydrolysis methods 53
CRCI = Index of recalcitrance cellulose fraction 54
E‐beam = Electron beam irradiation 55
ECF = Elemental chlorine free 56
GC‐FID = Gas chromatography ‐ flame ionization detection 57
GC‐MS = Gas chromatography ‐ mass spectrometry 58
GPC = Gel permeation chromatography 59
TMP = Thermo mechanical pulping 60
61
Highlights 62
Monomer analysis of cellulose and hemicellulose‐containing samples 63
Comparison of polysaccharides’ subunit pattern with cellulose sample pattern by PCA 64
Supramolecular structure elucidation of cellulose by sulfuric acid hydrolysis and acid 65
methanolysis 66
Announcing the index of recalcitrance cellulose fraction (CRCI) 67
Comparison of CRCI (based on proposed CG2H‐method) and CrI (based on NMR analysis) 68
Application of the proposed analysis method to e‐beam treated or artificially aged samples 69
70
1 Introduction 71
The analysis of supramolecular structure and carbohydrate composition of cellulose samples is 72
essential for characterization of their chemical and physical properties and further processing. The 73
sample properties of the monomer composition, crystallinity and amorphous fraction were affected 74
by aging processes and electron beam (e‐beam) irradiation treatments, inducing structural 75
rearrangements.1‐4 The crystallinity index (CrI) has been used to describe the relative amount of 76
crystalline material in cellulose.5 The index based on the assumption, that cellulose contains a two‐77
phase system with crystalline (highly ordered) and non‐crystalline (highly disordered) regions.6 This 78
simple concept of cellulose structure provides an approximation to the real structure of cellulose.5 79
The non‐crystalline portion of cellulose, frequently called amorphous has the meaning of complete 80
lack of order. Different hypotheses were made, such as the possibility of the existence of a 81
continuous range of degree of order in cellulose, since long chain cellulose molecules are known to 82
pass both crystalline and amorphous regions.5 A less‐ordered or paracrystalline 'in‐core' structure 83
with somewhat larger mobility than that of the crystalline cellulose was also announced in 84
literature.7 The quantification of the crystalline and amorphous fraction of a sample provides 85
information about their physical and mechanical properties, aging processes and structural integrity.8 86
The analysis of these fraction ratio was analyzed by measurement methods such as x‐ray diffraction 87
(XRD)3, 9‐11, Fourier transform infrared spectroscopy (FTIR)12‐13, near infrared (NIR) spectroscopy13 und 88
solid‐state 13C CP‐MAS NMR7, 10, 14‐15. Recent studies have been found, that crystallinity value varies 89
significantly, depending on the choice of these measurement methods, applied calculations, or 90
both.10‐11, 13 Inconsistent crystallinity values were also observed at XRD and 13C CP‐MAS NMR, only 91
the order of crystallinity for analyzed cellulosic samples was relatively consistent within each 92
measurement technique.10‐11 Another study used FTIR and NIR spectroscopy to analyses the 93
crystallinity changes during paper aging. These authors observed significantly different crystallinity 94
values of the cellulosic material. The errors in the measurement were too large to allow a 95
quantitative interpretation, so it was not possible to identify any apparent tendency during extended 96
aging.13 The question, which method provides the most accurate evaluation of cellulose crystallinity 97
could not be answered. 98
The carbohydrate composition of cellulosic materials shows glucose predominantly from the 99
cellulose fraction and smaller amounts of pentoses, hexoses, and deoxy sugar from the hemicellulose 100
fraction. Hydrolysis is a necessary tool to cleave the glycosidic bond of polysaccharides. Enzymatically 101
and acid hydrolysis is known to form single/subunits of a polysaccharide. Acid hydrolysis is a standard 102
method and involves sulfuric acid, trifluoroacetic acid, and hydrochloric acid under strong or mild 103
conditions.16 Monosaccharides liberated from polysaccharides were subsequently analyzed with 104
HPLC17, GC18 or NMR19‐20. 105
Unfortunately, there are differences of the hydrolysis rate of monosaccharides and their glycosidic 106
linkages. Hydrolysis efficiency is affected by hydrolysis conditions like the type of acid, acid strength, 107
duration, and temperature.21 The efficiency also depends on parameters associated with the origin of 108
the sample like the type(s) of glycosidic bond, position of bondage, sugar structure (α‐/β‐anomer), 109
chain order degree of cross‐linking and number of hydrogen bonds between sugars.21 110
Strong hydrolysis with sulfuric acid leads to a release of reducing monosaccharides. While acid 111
methanolysis represents a hydrolysis method under mild conditions, the free monosaccharides were 112
converted into their corresponding methyl glycosides, and the carboxyl groups of uronic acids are 113
esterified with methyl groups.22 These methyl glycosides formed by acid methanolysis lose their 114
anomeric configuration and equilibrate to α‐ and ß‐anomers.23 The occurrence of up to four isomers 115
after acid methanolysis reduces the risk of complete peak overlapping, and the constant ratio of 116
isomers enables the possibility of compound identification and quantification on one single peak.23‐24 117
On the other hand, the formation of more isomers per compound leads to an increase in 118
chromatogram complexity and may decrease the sensitivity of sugar analysis, because of decreasing 119
signal intensity with increasing amount of isomers.25 The advantages of acid methanolysis compared 120
to sulfuric acid hydrolysis are much less degradation of fragile hemicelluloses and the possibility to 121
quantify uronic acids.26 However, mild acid hydrolysis was reported to cleave crystalline cellulose 122
structure only slightly, here strong acid hydrolysis methods are recommended.18 Therefore, a 123
combined analysis of total glucose, pentose, and uronic acids is not available by a single hydrolysis 124
method. This leads to a preference for the methodology according to the target of analysis, either 125
cellulose or hemicellulose content. 126
In this study, the two hydrolysis methods sulfuric acid hydrolysis and acid methanolysis were applied 127
to characterize monomer composition of reference polysaccharides and cellulose samples, covering a 128
wide range of monosaccharides and sugar acid compounds. The current approach analyzes the 129
fraction of hemicelluloses, pectin and amorphous cellulose by acid methanolysis, followed by 130
silylation and gas chromatography (GC) according to Sundberg et al.18 The determination of whole 131
cellulose/total glucose content is carried out using sulfuric acid hydrolysis according to Bose et al.17 132
Thus, the subtraction of liberated glucose units by acid methanolysis from glucose units determined 133
by acid hydrolysis has been considered as the glucose content only in the cellulose fraction of the 134
respective sample.27‐29 This method has been accepted to measure the cellulose fraction of pulp and 135
paper samples.27‐28, 30 136
The glucose content determined by the two hydrolysis methods sulfuric acid hydrolysis and acid 137
methanolysis was implemented to quantify the index of recalcitrance cellulose fraction (CRCI) to 138
elucidate the supramolecular structure of cellulose of different cellulose samples. The proposed 139
analysis method was conducted at experimental series to answer the question, how the application 140
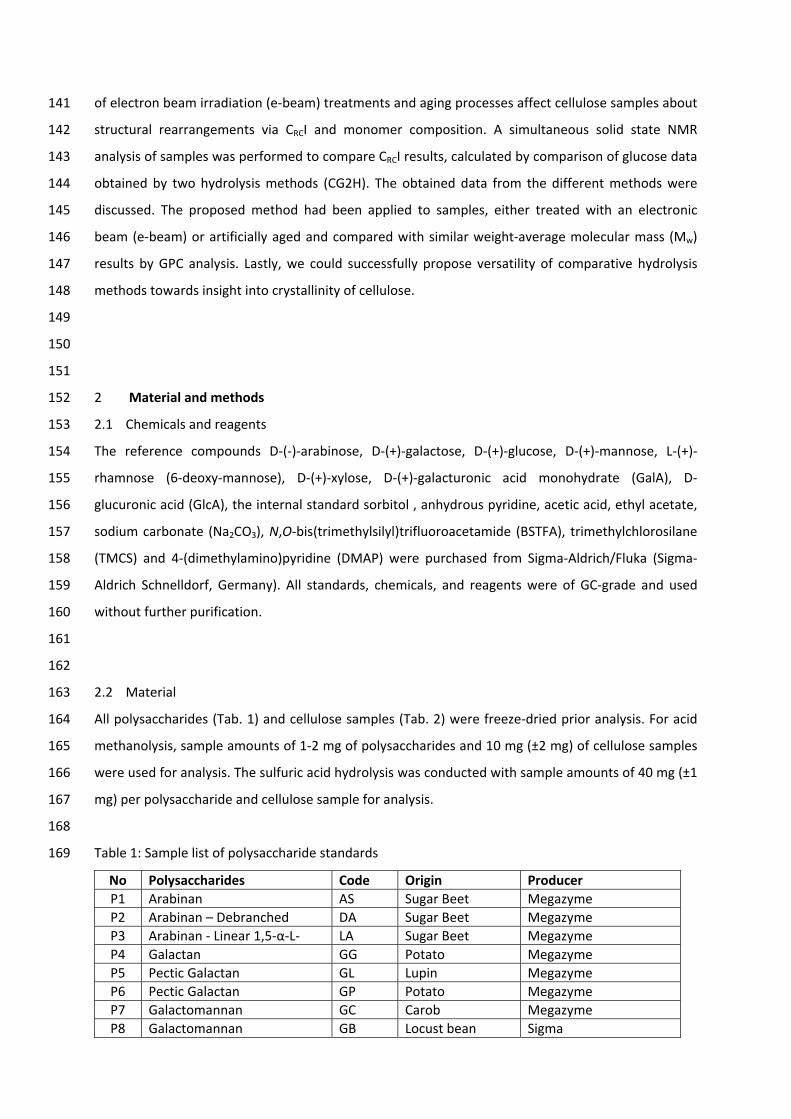
of electron beam irradiation (e‐beam) treatments and aging processes affect cellulose samples about 141
structural rearrangements via CRCI and monomer composition. A simultaneous solid state NMR 142
analysis of samples was performed to compare CRCI results, calculated by comparison of glucose data 143
obtained by two hydrolysis methods (CG2H). The obtained data from the different methods were 144
discussed. The proposed method had been applied to samples, either treated with an electronic 145
beam (e‐beam) or artificially aged and compared with similar weight‐average molecular mass (Mw) 146
results by GPC analysis. Lastly, we could successfully propose versatility of comparative hydrolysis 147
methods towards insight into crystallinity of cellulose. 148
149
150
151
2 Material and methods 152
2.1 Chemicals and reagents 153
The reference compounds D‐(‐)‐arabinose, D‐(+)‐galactose, D‐(+)‐glucose, D‐(+)‐mannose, L‐(+)‐154
rhamnose (6‐deoxy‐mannose), D‐(+)‐xylose, D‐(+)‐galacturonic acid monohydrate (GalA), D‐155
glucuronic acid (GlcA), the internal standard sorbitol , anhydrous pyridine, acetic acid, ethyl acetate, 156
sodium carbonate (Na2CO3), N,O‐bis(trimethylsilyl)trifluoroacetamide (BSTFA), trimethylchlorosilane 157
(TMCS) and 4‐(dimethylamino)pyridine (DMAP) were purchased from Sigma‐Aldrich/Fluka (Sigma‐158
Aldrich Schnelldorf, Germany). All standards, chemicals, and reagents were of GC‐grade and used 159
without further purification. 160
161
162
2.2 Material 163
All polysaccharides (Tab. 1) and cellulose samples (Tab. 2) were freeze‐dried prior analysis. For acid 164
methanolysis, sample amounts of 1‐2 mg of polysaccharides and 10 mg (±2 mg) of cellulose samples 165
were used for analysis. The sulfuric acid hydrolysis was conducted with sample amounts of 40 mg (±1 166
mg) per polysaccharide and cellulose sample for analysis. 167
168
Table 1: Sample list of polysaccharide standards 169
No Polysaccharides Code Origin Producer
P1 Arabinan AS Sugar Beet Megazyme
P2 Arabinan – Debranched DA Sugar Beet Megazyme
P3 Arabinan ‐ Linear 1,5‐α‐L‐ LA Sugar Beet Megazyme
P4 Galactan GG Potato Megazyme
P5 Pectic Galactan GL Lupin Megazyme
P6 Pectic Galactan GP Potato Megazyme
P7 Galactomannan GC Carob Megazyme
P8 Galactomannan GB Locust bean Sigma
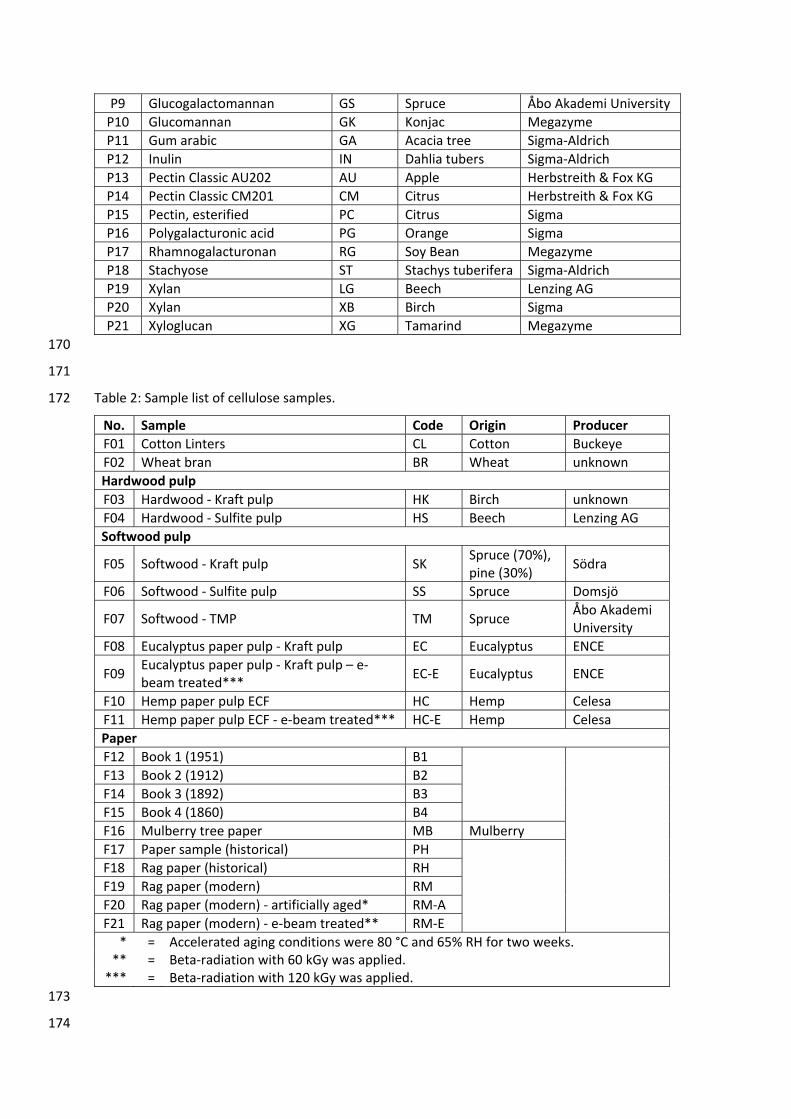
P9 Glucogalactomannan GS Spruce Åbo Akademi University
P10 Glucomannan GK Konjac Megazyme
P11 Gum arabic GA Acacia tree Sigma‐Aldrich
P12 Inulin IN Dahlia tubers Sigma‐Aldrich
P13 Pectin Classic AU202 AU Apple Herbstreith & Fox KG
P14 Pectin Classic CM201 CM Citrus Herbstreith & Fox KG
P15 Pectin, esterified PC Citrus Sigma
P16 Polygalacturonic acid PG Orange Sigma
P17 Rhamnogalacturonan RG Soy Bean Megazyme
P18 Stachyose ST Stachys tuberifera Sigma‐Aldrich
P19 Xylan LG Beech Lenzing AG
P20 Xylan XB Birch Sigma
P21 Xyloglucan XG Tamarind Megazyme
170
171
Table 2: Sample list of cellulose samples. 172
No. Sample Code Origin Producer
F01 Cotton Linters CL Cotton Buckeye
F02 Wheat bran BR Wheat unknown
Hardwood pulp
F03 Hardwood ‐ Kraft pulp HK Birch unknown
F04 Hardwood ‐ Sulfite pulp HS Beech Lenzing AG
Softwood pulp
F05 Softwood ‐ Kraft pulp SK Spruce (70%), pine (30%)
Södra
F06 Softwood ‐ Sulfite pulp SS Spruce Domsjö
F07 Softwood ‐ TMP TM Spruce Åbo Akademi University
F08 Eucalyptus paper pulp ‐ Kraft pulp EC Eucalyptus ENCE
F09 Eucalyptus paper pulp ‐ Kraft pulp – e‐beam treated***
EC‐E Eucalyptus ENCE
F10 Hemp paper pulp ECF HC Hemp Celesa
F11 Hemp paper pulp ECF ‐ e‐beam treated*** HC‐E Hemp Celesa
Paper
F12 Book 1 (1951) B1
F13 Book 2 (1912) B2
F14 Book 3 (1892) B3
F15 Book 4 (1860) B4
F16 Mulberry tree paper MB Mulberry
F17 Paper sample (historical) PH
F18 Rag paper (historical) RH
F19 Rag paper (modern) RM
F20 Rag paper (modern) ‐ artificially aged* RM‐A
F21 Rag paper (modern) ‐ e‐beam treated** RM‐E
* = Accelerated aging conditions were 80 °C and 65% RH for two weeks. ** = Beta‐radiation with 60 kGy was applied. *** = Beta‐radiation with 120 kGy was applied.
173
174
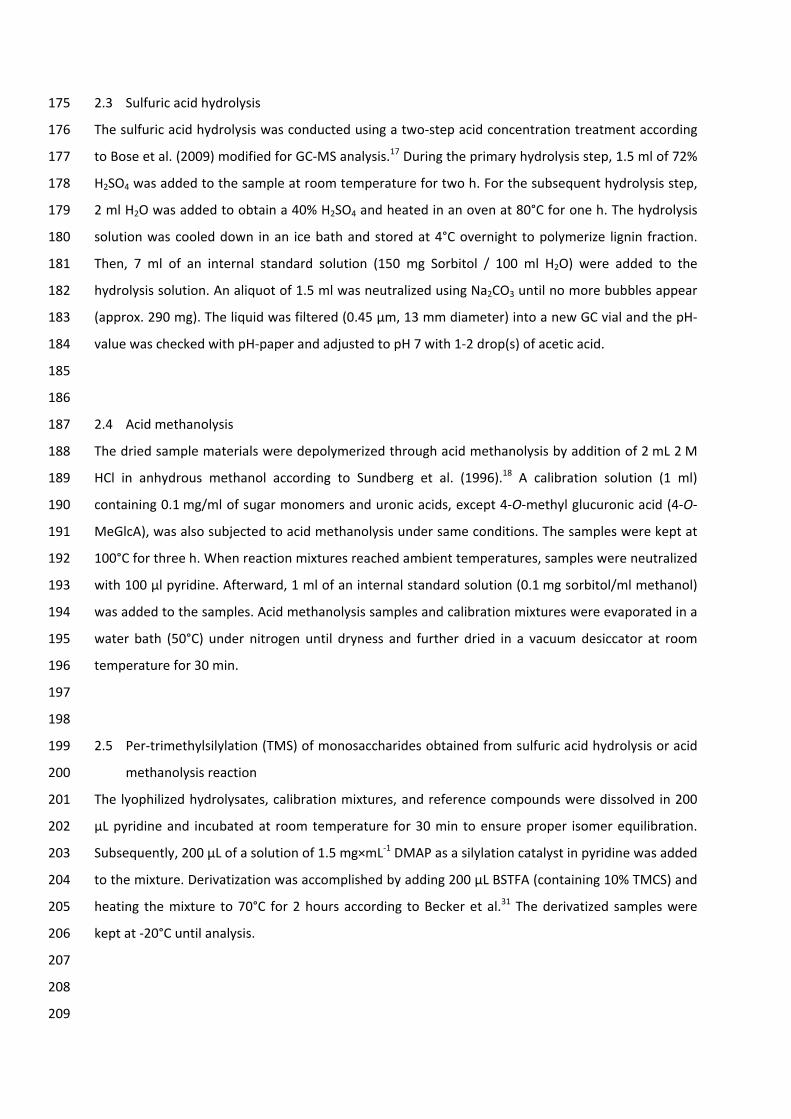
2.3 Sulfuric acid hydrolysis 175
The sulfuric acid hydrolysis was conducted using a two‐step acid concentration treatment according 176
to Bose et al. (2009) modified for GC‐MS analysis.17 During the primary hydrolysis step, 1.5 ml of 72% 177
H2SO4 was added to the sample at room temperature for two h. For the subsequent hydrolysis step, 178
2 ml H2O was added to obtain a 40% H2SO4 and heated in an oven at 80°C for one h. The hydrolysis 179
solution was cooled down in an ice bath and stored at 4°C overnight to polymerize lignin fraction. 180
Then, 7 ml of an internal standard solution (150 mg Sorbitol / 100 ml H2O) were added to the 181
hydrolysis solution. An aliquot of 1.5 ml was neutralized using Na2CO3 until no more bubbles appear 182
(approx. 290 mg). The liquid was filtered (0.45 µm, 13 mm diameter) into a new GC vial and the pH‐183
value was checked with pH‐paper and adjusted to pH 7 with 1‐2 drop(s) of acetic acid. 184
185
186
2.4 Acid methanolysis 187
The dried sample materials were depolymerized through acid methanolysis by addition of 2 mL 2 M 188
HCl in anhydrous methanol according to Sundberg et al. (1996).18 A calibration solution (1 ml) 189
containing 0.1 mg/ml of sugar monomers and uronic acids, except 4‐O‐methyl glucuronic acid (4‐O‐190
MeGlcA), was also subjected to acid methanolysis under same conditions. The samples were kept at 191
100°C for three h. When reaction mixtures reached ambient temperatures, samples were neutralized 192
with 100 µl pyridine. Afterward, 1 ml of an internal standard solution (0.1 mg sorbitol/ml methanol) 193
was added to the samples. Acid methanolysis samples and calibration mixtures were evaporated in a 194
water bath (50°C) under nitrogen until dryness and further dried in a vacuum desiccator at room 195
temperature for 30 min. 196
197
198
2.5 Per‐trimethylsilylation (TMS) of monosaccharides obtained from sulfuric acid hydrolysis or acid 199
methanolysis reaction 200
The lyophilized hydrolysates, calibration mixtures, and reference compounds were dissolved in 200 201
µL pyridine and incubated at room temperature for 30 min to ensure proper isomer equilibration. 202
Subsequently, 200 µL of a solution of 1.5 mg×mL‐1 DMAP as a silylation catalyst in pyridine was added 203
to the mixture. Derivatization was accomplished by adding 200 µL BSTFA (containing 10% TMCS) and 204
heating the mixture to 70°C for 2 hours according to Becker et al.31 The derivatized samples were 205
kept at ‐20°C until analysis. 206
207
208
209
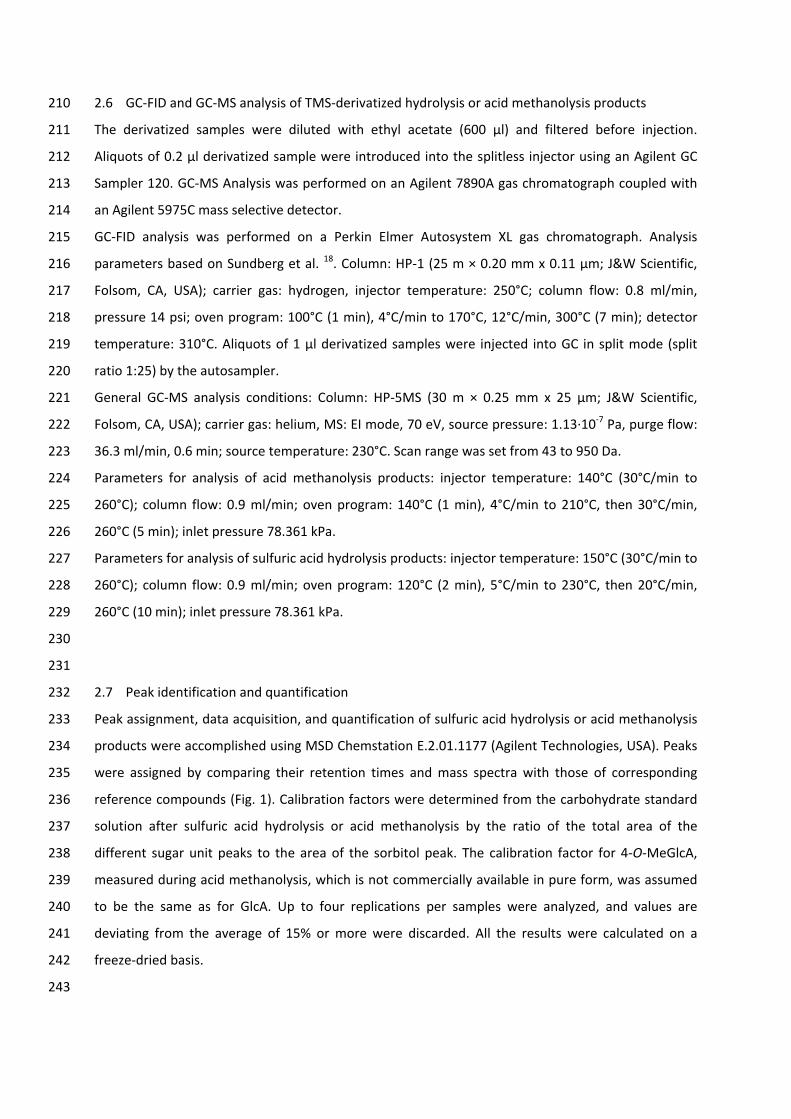
2.6 GC‐FID and GC‐MS analysis of TMS‐derivatized hydrolysis or acid methanolysis products 210
The derivatized samples were diluted with ethyl acetate (600 µl) and filtered before injection. 211
Aliquots of 0.2 µl derivatized sample were introduced into the splitless injector using an Agilent GC 212
Sampler 120. GC‐MS Analysis was performed on an Agilent 7890A gas chromatograph coupled with 213
an Agilent 5975C mass selective detector. 214
GC‐FID analysis was performed on a Perkin Elmer Autosystem XL gas chromatograph. Analysis 215
parameters based on Sundberg et al. 18. Column: HP‐1 (25 m × 0.20 mm x 0.11 µm; J&W Scientific, 216
Folsom, CA, USA); carrier gas: hydrogen, injector temperature: 250°C; column flow: 0.8 ml/min, 217
pressure 14 psi; oven program: 100°C (1 min), 4°C/min to 170°C, 12°C/min, 300°C (7 min); detector 218
temperature: 310°C. Aliquots of 1 µl derivatized samples were injected into GC in split mode (split 219
ratio 1:25) by the autosampler. 220
General GC‐MS analysis conditions: Column: HP‐5MS (30 m × 0.25 mm x 25 µm; J&W Scientific, 221
Folsom, CA, USA); carrier gas: helium, MS: EI mode, 70 eV, source pressure: 1.13∙10‐7 Pa, purge flow: 222
36.3 ml/min, 0.6 min; source temperature: 230°C. Scan range was set from 43 to 950 Da. 223
Parameters for analysis of acid methanolysis products: injector temperature: 140°C (30°C/min to 224
260°C); column flow: 0.9 ml/min; oven program: 140°C (1 min), 4°C/min to 210°C, then 30°C/min, 225
260°C (5 min); inlet pressure 78.361 kPa. 226
Parameters for analysis of sulfuric acid hydrolysis products: injector temperature: 150°C (30°C/min to 227
260°C); column flow: 0.9 ml/min; oven program: 120°C (2 min), 5°C/min to 230°C, then 20°C/min, 228
260°C (10 min); inlet pressure 78.361 kPa. 229
230
231
2.7 Peak identification and quantification 232
Peak assignment, data acquisition, and quantification of sulfuric acid hydrolysis or acid methanolysis 233
products were accomplished using MSD Chemstation E.2.01.1177 (Agilent Technologies, USA). Peaks 234
were assigned by comparing their retention times and mass spectra with those of corresponding 235
reference compounds (Fig. 1). Calibration factors were determined from the carbohydrate standard 236
solution after sulfuric acid hydrolysis or acid methanolysis by the ratio of the total area of the 237
different sugar unit peaks to the area of the sorbitol peak. The calibration factor for 4‐O‐MeGlcA, 238
measured during acid methanolysis, which is not commercially available in pure form, was assumed 239
to be the same as for GlcA. Up to four replications per samples were analyzed, and values are 240
deviating from the average of 15% or more were discarded. All the results were calculated on a 241
freeze‐dried basis. 242
243
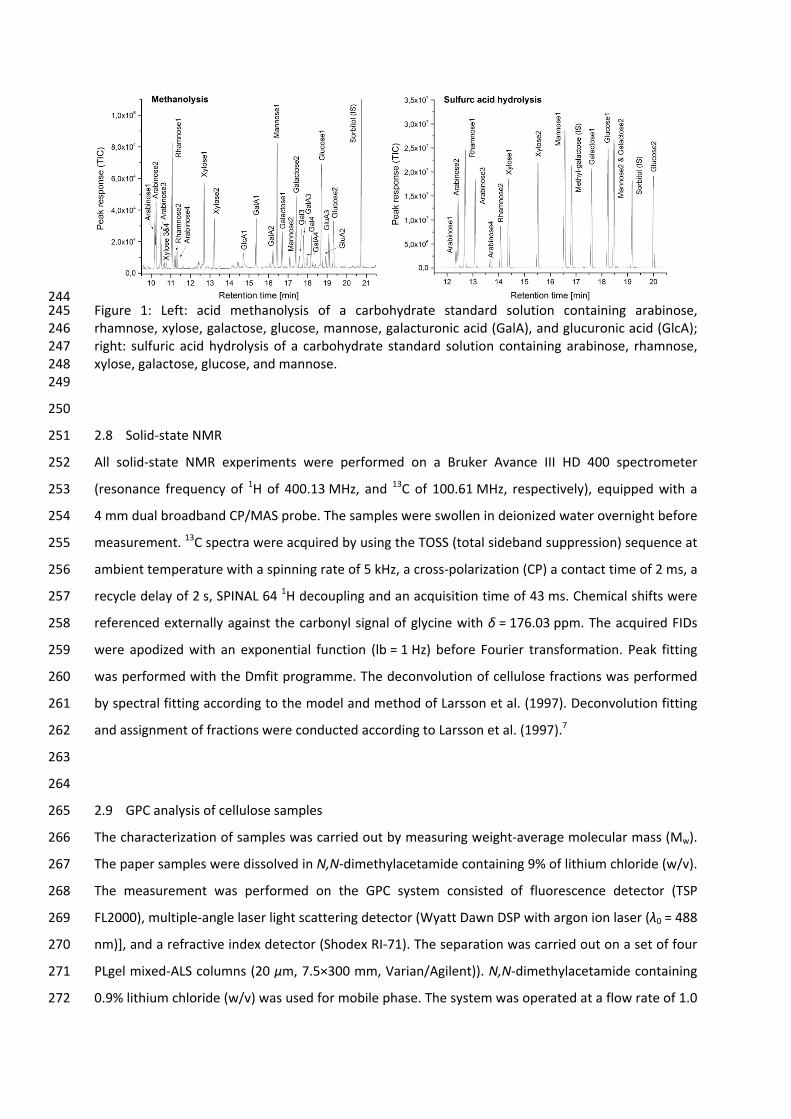
244 Figure 1: Left: acid methanolysis of a carbohydrate standard solution containing arabinose, 245 rhamnose, xylose, galactose, glucose, mannose, galacturonic acid (GalA), and glucuronic acid (GlcA); 246 right: sulfuric acid hydrolysis of a carbohydrate standard solution containing arabinose, rhamnose, 247 xylose, galactose, glucose, and mannose. 248 249
250
2.8 Solid‐state NMR 251
All solid‐state NMR experiments were performed on a Bruker Avance III HD 400 spectrometer 252
(resonance frequency of 1H of 400.13 MHz, and 13C of 100.61 MHz, respectively), equipped with a 253
4 mm dual broadband CP/MAS probe. The samples were swollen in deionized water overnight before 254
measurement. 13C spectra were acquired by using the TOSS (total sideband suppression) sequence at 255
ambient temperature with a spinning rate of 5 kHz, a cross‐polarization (CP) a contact time of 2 ms, a 256
recycle delay of 2 s, SPINAL 64 1H decoupling and an acquisition time of 43 ms. Chemical shifts were 257
referenced externally against the carbonyl signal of glycine with δ = 176.03 ppm. The acquired FIDs 258
were apodized with an exponential function (lb = 1 Hz) before Fourier transformation. Peak fitting 259
was performed with the Dmfit programme. The deconvolution of cellulose fractions was performed 260
by spectral fitting according to the model and method of Larsson et al. (1997). Deconvolution fitting 261
and assignment of fractions were conducted according to Larsson et al. (1997).7 262
263
264
2.9 GPC analysis of cellulose samples 265
The characterization of samples was carried out by measuring weight‐average molecular mass (Mw). 266
The paper samples were dissolved in N,N‐dimethylacetamide containing 9% of lithium chloride (w/v). 267
The measurement was performed on the GPC system consisted of fluorescence detector (TSP 268
FL2000), multiple‐angle laser light scattering detector (Wyatt Dawn DSP with argon ion laser (λ0 = 488 269
nm)], and a refractive index detector (Shodex RI‐71). The separation was carried out on a set of four 270
PLgel mixed‐ALS columns (20 µm, 7.5×300 mm, Varian/Agilent)). N,N‐dimethylacetamide containing 271
0.9% lithium chloride (w/v) was used for mobile phase. The system was operated at a flow rate of 1.0 272
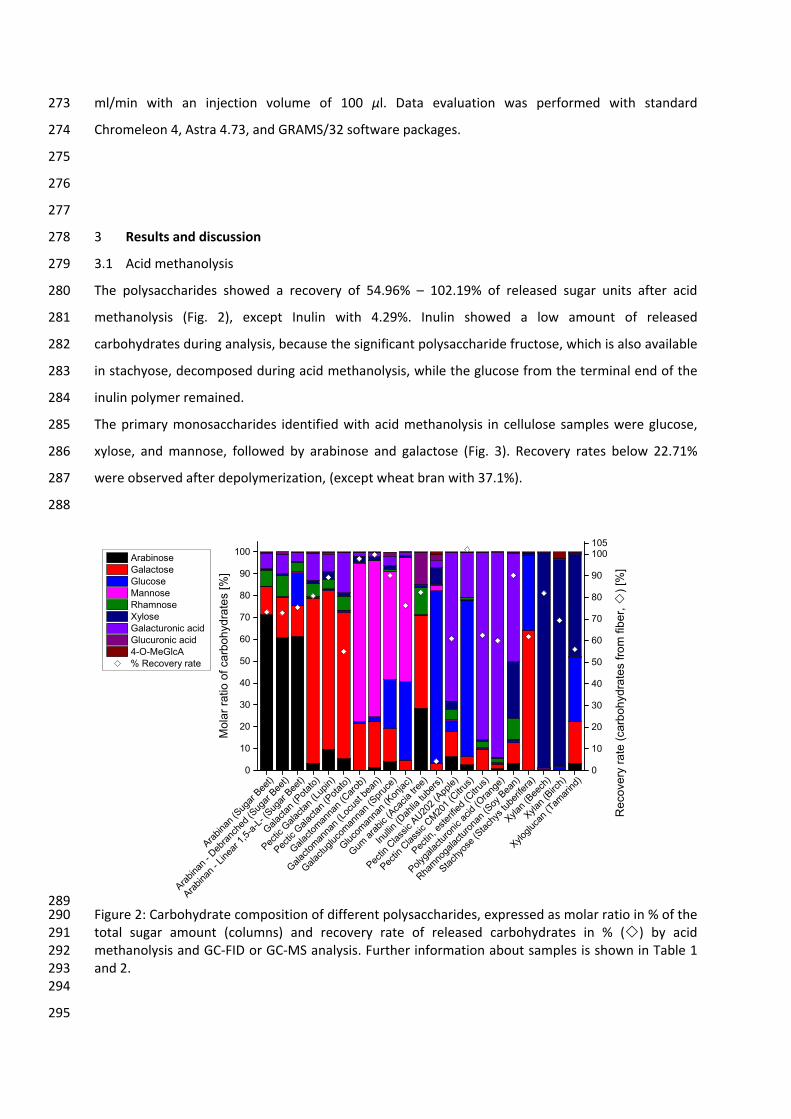
ml/min with an injection volume of 100 µl. Data evaluation was performed with standard 273
Chromeleon 4, Astra 4.73, and GRAMS/32 software packages. 274
275
276
277
3 Results and discussion 278
3.1 Acid methanolysis 279
The polysaccharides showed a recovery of 54.96% – 102.19% of released sugar units after acid 280
methanolysis (Fig. 2), except Inulin with 4.29%. Inulin showed a low amount of released 281
carbohydrates during analysis, because the significant polysaccharide fructose, which is also available 282
in stachyose, decomposed during acid methanolysis, while the glucose from the terminal end of the 283
inulin polymer remained. 284
The primary monosaccharides identified with acid methanolysis in cellulose samples were glucose, 285
xylose, and mannose, followed by arabinose and galactose (Fig. 3). Recovery rates below 22.71% 286
were observed after depolymerization, (except wheat bran with 37.1%). 287
288
Arabin
an (S
ugar
Bee
t)
Arabin
an -
Debra
nche
d (S
ugar
Bee
t)
Arabin
an -
Linea
r 1,5
-a-L
- (Sug
ar B
eet)
Galacta
n (P
otat
o)
Pectic
Gala
ctan
(Lup
in)
Pectic
Gala
ctan
(Pot
ato)
Galacto
man
nan
(Car
ob)
Galact
oman
nan
(Loc
ust b
ean)
Galactu
gluco
man
nan
(Spr
uce)
Glucom
anna
n (K
onjac
)
Gum a
rabic
(Aca
cia tr
ee)
Inull
in (D
ahlia
tube
rs)
Pectin
Clas
sic A
U202
(App
le)
Pectin
Clas
sic C
M20
1 (C
itrus
)
Pectin
, este
rified
(Citr
us)
Polyga
lactu
ronic
acid
(Ora
nge)
Rham
noga
lactu
rona
n (S
oy B
ean)
Stach
yose
(Sta
chys
tube
rifer
a)
Xylan
(Bee
ch)
Xylan
(Birc
h)
Xyloglu
can
(Tam
arind
)0
10
20
30
40
50
60
70
80
90
100
Mol
ar
ratio
of c
arb
ohyd
rate
s [%
]
Arabinose Galactose Glucose Mannose Rhamnose Xylose Galacturonic acid Glucuronic acid 4-O-MeGlcA
0
10
20
30
40
50
60
70
80
90
100105
% Recovery rate
Re
cove
ry r
ate
(ca
rboh
ydra
tes
fro
m fi
ber
, )
[%]
289 Figure 2: Carbohydrate composition of different polysaccharides, expressed as molar ratio in % of the 290 total sugar amount (columns) and recovery rate of released carbohydrates in % () by acid 291 methanolysis and GC‐FID or GC‐MS analysis. Further information about samples is shown in Table 1 292 and 2. 293 294
295
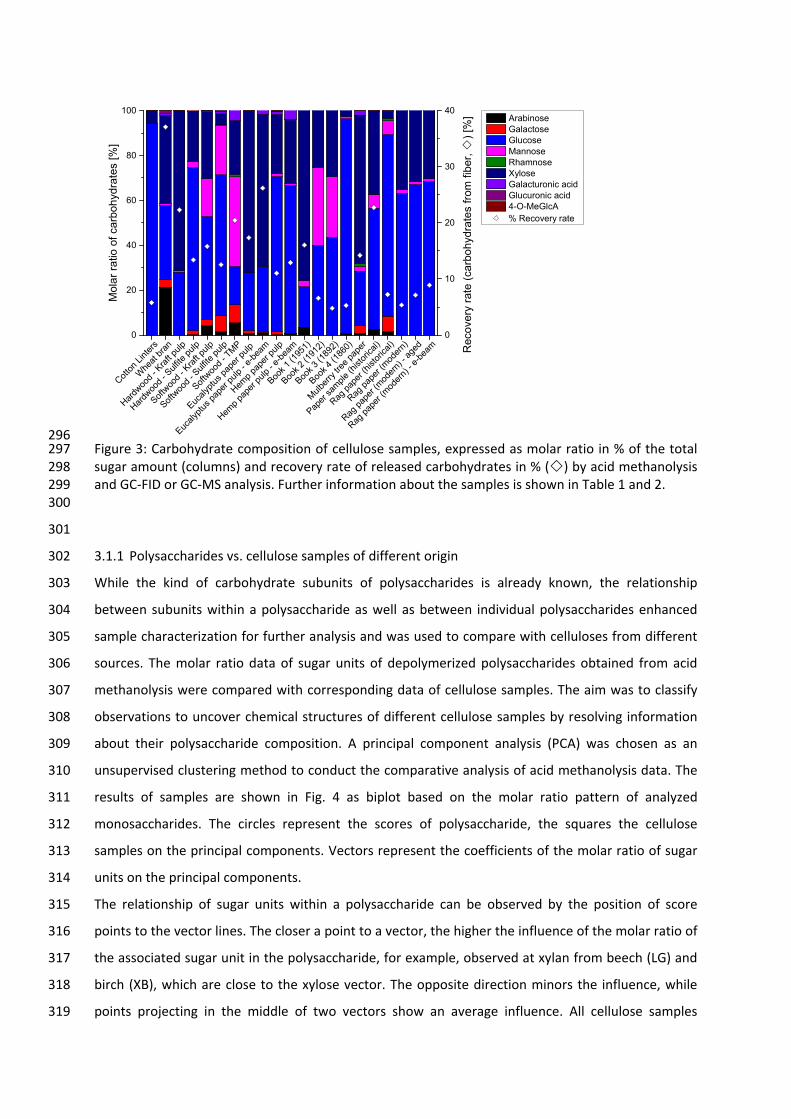
Cotto
n Lin
ters
Whe
at b
ran
Hardw
ood
- Kra
ft pu
lp
Hardw
ood
- Sulf
ite p
ulp
Softw
ood
- Kra
ft pu
lp
Softw
ood
- Sulf
ite p
ulp
Softw
ood
- TM
P
Eucalyp
tus p
aper
pulp
Eucalyp
tus p
aper
pul
p - e
-bea
m
Hemp
pape
r pulp
Hemp
pape
r pulp
- e-
beam
Book 1
(195
1)
Book 2
(191
2)
Book 3
(189
2)
Book 4
(186
0)
Mulb
erry
tree
pap
er
Paper
sam
ple
(hist
orica
l)
Rag p
aper
(hist
orica
l)
Rag p
aper
(mod
ern)
Rag p
aper
(mod
ern)
- ag
ed
Rag p
aper
(mod
ern)
- e-
beam
0
20
40
60
80
100M
ola
r ra
tio o
f ca
rboh
ydra
tes
[%]
Arabinose Galactose Glucose Mannose Rhamnose Xylose Galacturonic acid Glucuronic acid 4-O-MeGlcA
0
10
20
30
40
% Recovery rate
Rec
ove
ry r
ate
(car
bohy
drat
es f
rom
fib
er,
) [%
]
296 Figure 3: Carbohydrate composition of cellulose samples, expressed as molar ratio in % of the total 297 sugar amount (columns) and recovery rate of released carbohydrates in % () by acid methanolysis 298 and GC‐FID or GC‐MS analysis. Further information about the samples is shown in Table 1 and 2. 299 300
301
3.1.1 Polysaccharides vs. cellulose samples of different origin 302
While the kind of carbohydrate subunits of polysaccharides is already known, the relationship 303
between subunits within a polysaccharide as well as between individual polysaccharides enhanced 304
sample characterization for further analysis and was used to compare with celluloses from different 305
sources. The molar ratio data of sugar units of depolymerized polysaccharides obtained from acid 306
methanolysis were compared with corresponding data of cellulose samples. The aim was to classify 307
observations to uncover chemical structures of different cellulose samples by resolving information 308
about their polysaccharide composition. A principal component analysis (PCA) was chosen as an 309
unsupervised clustering method to conduct the comparative analysis of acid methanolysis data. The 310
results of samples are shown in Fig. 4 as biplot based on the molar ratio pattern of analyzed 311
monosaccharides. The circles represent the scores of polysaccharide, the squares the cellulose 312
samples on the principal components. Vectors represent the coefficients of the molar ratio of sugar 313
units on the principal components. 314
The relationship of sugar units within a polysaccharide can be observed by the position of score 315
points to the vector lines. The closer a point to a vector, the higher the influence of the molar ratio of 316
the associated sugar unit in the polysaccharide, for example, observed at xylan from beech (LG) and 317
birch (XB), which are close to the xylose vector. The opposite direction minors the influence, while 318
points projecting in the middle of two vectors show an average influence. All cellulose samples 319
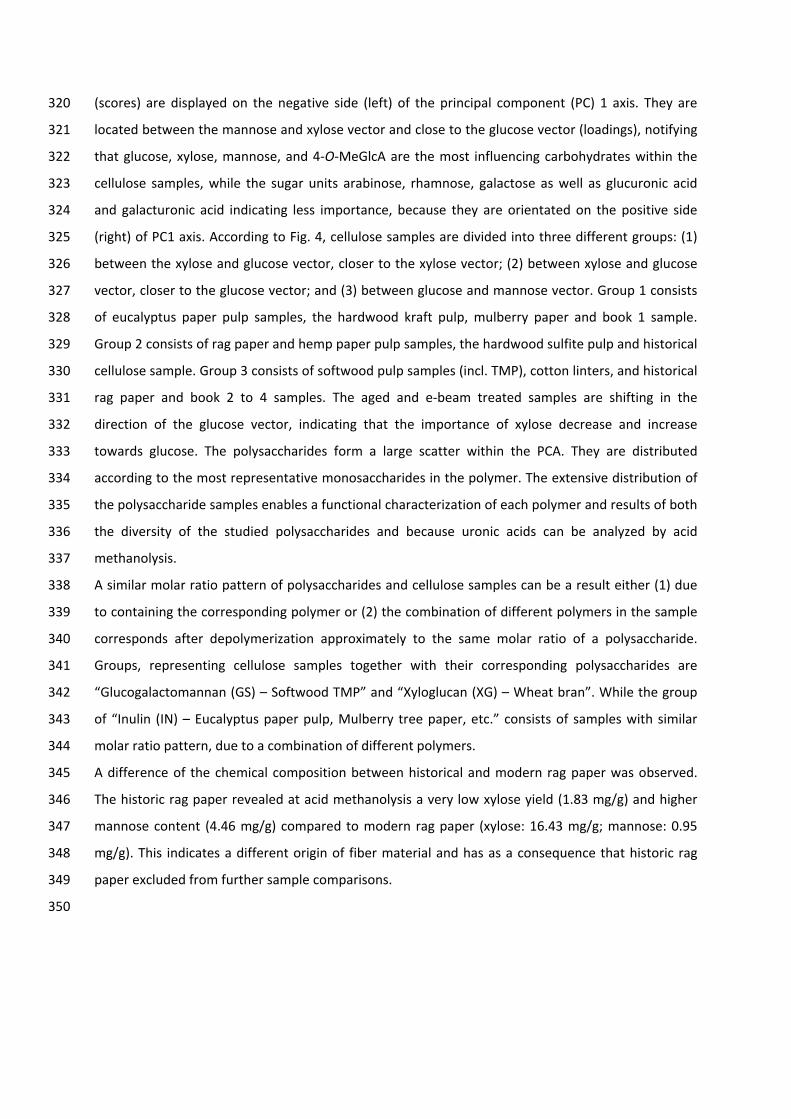
(scores) are displayed on the negative side (left) of the principal component (PC) 1 axis. They are 320
located between the mannose and xylose vector and close to the glucose vector (loadings), notifying 321
that glucose, xylose, mannose, and 4‐O‐MeGlcA are the most influencing carbohydrates within the 322
cellulose samples, while the sugar units arabinose, rhamnose, galactose as well as glucuronic acid 323
and galacturonic acid indicating less importance, because they are orientated on the positive side 324
(right) of PC1 axis. According to Fig. 4, cellulose samples are divided into three different groups: (1) 325
between the xylose and glucose vector, closer to the xylose vector; (2) between xylose and glucose 326
vector, closer to the glucose vector; and (3) between glucose and mannose vector. Group 1 consists 327
of eucalyptus paper pulp samples, the hardwood kraft pulp, mulberry paper and book 1 sample. 328
Group 2 consists of rag paper and hemp paper pulp samples, the hardwood sulfite pulp and historical 329
cellulose sample. Group 3 consists of softwood pulp samples (incl. TMP), cotton linters, and historical 330
rag paper and book 2 to 4 samples. The aged and e‐beam treated samples are shifting in the 331
direction of the glucose vector, indicating that the importance of xylose decrease and increase 332
towards glucose. The polysaccharides form a large scatter within the PCA. They are distributed 333
according to the most representative monosaccharides in the polymer. The extensive distribution of 334
the polysaccharide samples enables a functional characterization of each polymer and results of both 335
the diversity of the studied polysaccharides and because uronic acids can be analyzed by acid 336
methanolysis. 337
A similar molar ratio pattern of polysaccharides and cellulose samples can be a result either (1) due 338
to containing the corresponding polymer or (2) the combination of different polymers in the sample 339
corresponds after depolymerization approximately to the same molar ratio of a polysaccharide. 340
Groups, representing cellulose samples together with their corresponding polysaccharides are 341
“Glucogalactomannan (GS) – Softwood TMP” and “Xyloglucan (XG) – Wheat bran”. While the group 342
of “Inulin (IN) – Eucalyptus paper pulp, Mulberry tree paper, etc.” consists of samples with similar 343
molar ratio pattern, due to a combination of different polymers. 344
A difference of the chemical composition between historical and modern rag paper was observed. 345
The historic rag paper revealed at acid methanolysis a very low xylose yield (1.83 mg/g) and higher 346
mannose content (4.46 mg/g) compared to modern rag paper (xylose: 16.43 mg/g; mannose: 0.95 347
mg/g). This indicates a different origin of fiber material and has as a consequence that historic rag 348
paper excluded from further sample comparisons. 349
350
351
Figure 4: PCA biplot on scores (polysaccharides: ●, cellulose samples: ) and loadings (grey) based 352 on their molar ratio of carbohydrate composition, obtained by acid methanolysis and followed by 353 GC‐FID or GC‐MS analysis. See Table 1 and 2 for abbreviations and further information about 354 samples. 355 356
357
3.2 Sulfuric acid hydrolysis 358
The sulfuric acid hydrolysis data of polysaccharides revealed a specific carbohydrate pattern for each 359
polymer according to their corresponding monosaccharide distribution (Fig. 5). Galactomannans, 360
glucomannans, xylans, galactans, and arabinans showed their sugar units as significant compounds 361
after analysis. In comparison to acid methanolysis results of polysaccharides, most of the analyzed 362
samples showed different recovery values, and none of the four uronic acids were observed after 363
sulfuric acid hydrolysis of polysaccharides (Fig. 5). The recovery values of polysaccharides after 364
sulfuric acid hydrolysis ranged from 0.22% to 68.96%. The highest recovery values of polysaccharides 365
at sulfuric acid hydrolysis showed the galactomannan, glucomannan, and xylan, which correspond to 366
the acid methanolysis results. The different recovery values were influenced by several aspects. On 367
the one hand, very low amounts of individual carbohydrate could be destroyed during strong acid 368
hydrolysis treatment of a sample. In this case, the destroyed monosaccharides cannot be 369
compensated by calibration, and no information about the presence of the carbohydrate in the 370
sample would be available. Regarding the data analysis of arabinans, influences of different chain 371
structures and polysaccharide linkage on monosaccharide recovery values can be observed. On the 372
other hand, the sugar acid content of up to 56.8% (at polygalacturonic acid) measured by acid 373
methanolysis was entirely absence under current sulfuric acid hydrolysis conditions, due to 374
-2,0 -1,5 -1,0 -0,5 0,0 0,5 1,0 1,5 2,0 2,5 3,0 3,5 5,5-2,5
-2,0
-1,5
-1,0
-0,5
0,0
0,5
1,0
1,5
4,5
5,0-0,4 -0,2 0,0 0,2 0,4 0,6 0,8
-0,6
-0,4
-0,2
0,0
0,2
0,4
0,6
AS
DA
LA
GG
GL GP
GCGB
GS
GK
GAIN
AU
CMPC
PG
RG
ST
LG
XB
XG
CL
BR
HK
HS
SK
SSTM
EC
EC-E
HCHC-E
B1
B2
B3
B4
MB
PH
RH
RMRM-ARM-E
Arabinose
GalactoseGlucose
Mannose
Rhamnose
Xylose
Galacturonic acid
Glucuronic acid
4-O-MeGlcA
Prin
cipa
l Com
pone
nt 2
(sc
ores
)
Principal Component 1 (scores)
= Pulp and paper samples= Polysaccharides
Prin
cipa
l Com
pone
nt 2
(lo
adin
gs)
Principal Component 1 (loadings)
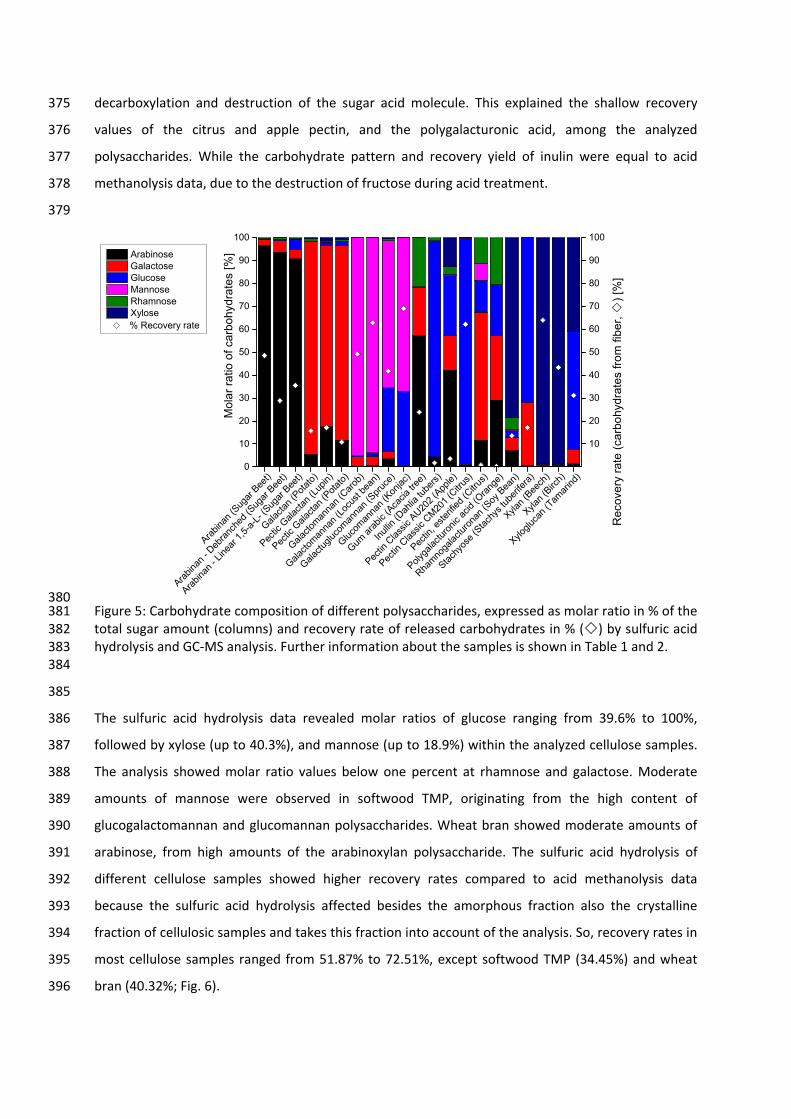
decarboxylation and destruction of the sugar acid molecule. This explained the shallow recovery 375
values of the citrus and apple pectin, and the polygalacturonic acid, among the analyzed 376
polysaccharides. While the carbohydrate pattern and recovery yield of inulin were equal to acid 377
methanolysis data, due to the destruction of fructose during acid treatment. 378
379
Arabin
an (S
ugar
Bee
t)
Arabin
an -
Debra
nche
d (S
ugar
Bee
t)
Arabin
an -
Linea
r 1,5
-a-L
- (Sug
ar B
eet)
Galacta
n (P
otat
o)
Pectic
Gala
ctan
(Lup
in)
Pectic
Gala
ctan
(Pot
ato)
Galacto
man
nan
(Car
ob)
Galacto
man
nan
(Loc
ust b
ean)
Galactu
gluco
man
nan
(Spr
uce)
Glucom
anna
n (K
onjac
)
Gum a
rabic
(Aca
cia tr
ee)
Inull
in (D
ahlia
tube
rs)
Pectin
Clas
sic A
U202
(App
le)
Pectin
Clas
sic C
M20
1 (C
itrus
)
Pectin
, este
rified
(Citr
us)
Polyga
lactu
ronic
acid
(Ora
nge)
Rham
noga
lactu
rona
n (S
oy B
ean)
Stach
yose
(Sta
chys
tube
rifer
a)
Xylan
(Bee
ch)
Xylan
(Birc
h)
Xyloglu
can
(Tam
arind
)0
10
20
30
40
50
60
70
80
90
100M
ola
r ra
tio o
f car
bohy
drat
es [%
] Arabinose Galactose Glucose Mannose Rhamnose Xylose
10
20
30
40
50
60
70
80
90
100
% Recovery rate
Rec
over
y ra
te (
carb
ohy
drat
es fr
om
fib
er,
) [%
]
380 Figure 5: Carbohydrate composition of different polysaccharides, expressed as molar ratio in % of the 381 total sugar amount (columns) and recovery rate of released carbohydrates in % () by sulfuric acid 382 hydrolysis and GC‐MS analysis. Further information about the samples is shown in Table 1 and 2. 383 384
385
The sulfuric acid hydrolysis data revealed molar ratios of glucose ranging from 39.6% to 100%, 386
followed by xylose (up to 40.3%), and mannose (up to 18.9%) within the analyzed cellulose samples. 387
The analysis showed molar ratio values below one percent at rhamnose and galactose. Moderate 388
amounts of mannose were observed in softwood TMP, originating from the high content of 389
glucogalactomannan and glucomannan polysaccharides. Wheat bran showed moderate amounts of 390
arabinose, from high amounts of the arabinoxylan polysaccharide. The sulfuric acid hydrolysis of 391
different cellulose samples showed higher recovery rates compared to acid methanolysis data 392
because the sulfuric acid hydrolysis affected besides the amorphous fraction also the crystalline 393
fraction of cellulosic samples and takes this fraction into account of the analysis. So, recovery rates in 394
most cellulose samples ranged from 51.87% to 72.51%, except softwood TMP (34.45%) and wheat 395
bran (40.32%; Fig. 6). 396

Cotto
n Lin
ters
Whe
at b
ran
Hardw
ood
- Kra
ft pu
lp
Hardw
ood
- Sulf
ite p
ulp
Softw
ood
- Kra
ft pu
lp
Softw
ood
- Sulf
ite p
ulp
Softw
ood
- TM
P
Eucaly
ptus
pap
er p
ulp
Eucaly
ptus
pap
er p
ulp -
e-be
am
Hemp
pape
r pulp
Hemp
pape
r pulp
- e-
beam
Book 1
(195
1)
Book 2
(191
2)
Book 3
(189
2)
Book 4
(186
0)
Mulb
erry
tree
pap
er
Paper
sam
ple (h
istor
ical)
Rag p
aper
(hist
orica
l)
Rag p
aper
(mod
ern)
Rag p
aper
(mod
ern)
- ag
ed
Rag p
aper
(mod
ern)
- e-
beam
0
20
40
60
80
100M
ola
r ra
tio o
f ca
rbo
hydr
ates
[%
] Arabinose Galactose Glucose Mannose Rhamnose
Xylose
0
10
20
30
40
50
60
70
80
90
100
% Recovery rate
Re
cove
ry r
ate
(ca
rbo
hyd
rate
s fr
om f
ibe
r,
) [%
]
397 Figure 6: Carbohydrate composition of cellulose samples, expressed as molar ratio in % of the total 398 sugar amount (columns) and recovery rate of released carbohydrates in % () by sulfuric acid 399 hydrolysis and GC‐MS analysis. Further information about the samples is shown in Table 1 and 2. 400 401
402
There are several reasons sulfuric acid hydrolysis could not be achieved full recovery rate in this 403
study. The sulfuric acid hydrolysis caused decarboxylation of uronic acids, and the possible 404
destruction of low‐content carbohydrates leads to an information loss compared to acid 405
methanolysis. The existence of oligomers was excluded because no signals of disaccharides and 406
trisaccharides were present in GC, but non‐GC‐analyzable oligomers might be present. The fractions 407
of fats, proteins, lignin, and minerals were not considered during this study, which is mainly 408
noticeable in wheat bran. This explains the high recovery rates of cellulose samples and the low 409
recovery rates of specific polysaccharides at once. 410
The acid concentrations, reaction temperatures and processing times of the two‐step sulfuric acid 411
hydrolysis method applied in this study was optimized by Bose et al.17 and adapted for GC/MS 412
analysis by the authors to obtain a high sugar yield of samples, which contain both cellulose and 413
hemicellulose. The sugar yield is defined as the number of monosaccharides theoretically obtained 414
from cellulose and hemicellulose conversion of present samples after treatment such as hydrolysis. 415
While the recovery rate refers to the total sample weight and includes ash, lignin, and other residues. 416
In many scientific trails, the sugar yield is used as target parameters for hydrolysis performance. The 417
amount of the non‐analyzed fraction is of less importance if any. Therefore, little is known about the 418
molecular structure of this inaccessible fraction, which is more difficult to hydrolyze. Crystallinity, the 419
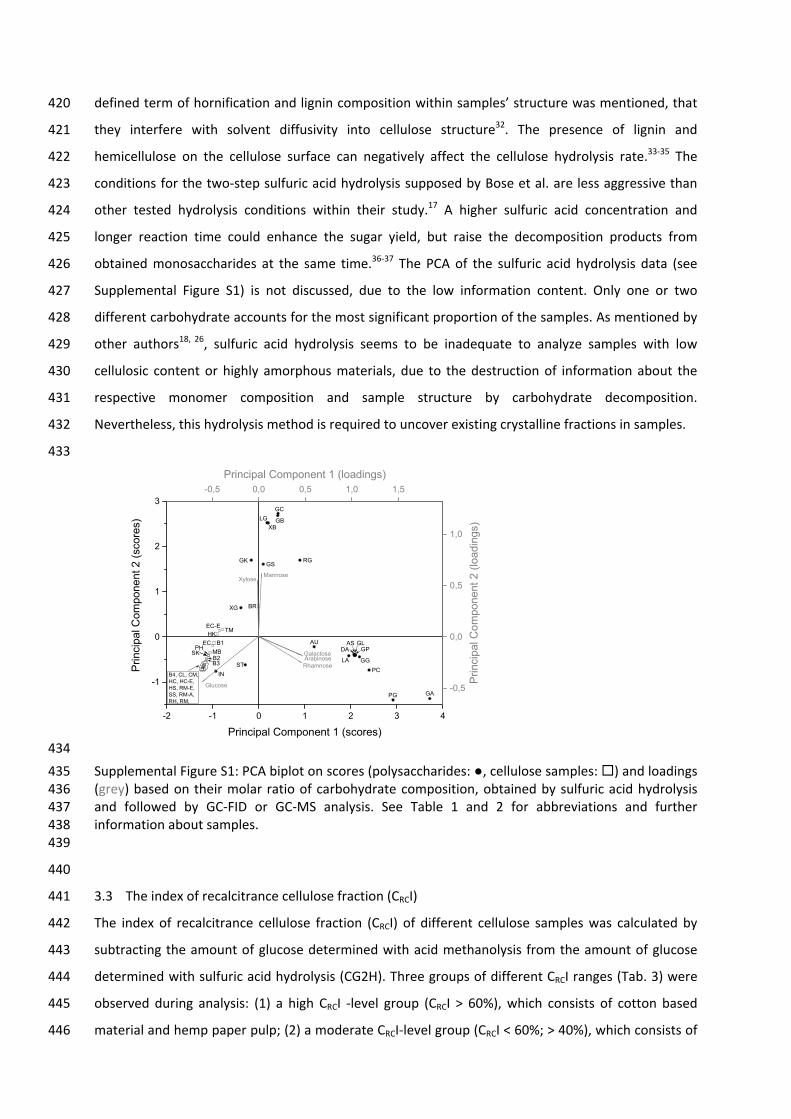
defined term of hornification and lignin composition within samples’ structure was mentioned, that 420
they interfere with solvent diffusivity into cellulose structure32. The presence of lignin and 421
hemicellulose on the cellulose surface can negatively affect the cellulose hydrolysis rate.33‐35 The 422
conditions for the two‐step sulfuric acid hydrolysis supposed by Bose et al. are less aggressive than 423
other tested hydrolysis conditions within their study.17 A higher sulfuric acid concentration and 424
longer reaction time could enhance the sugar yield, but raise the decomposition products from 425
obtained monosaccharides at the same time.36‐37 The PCA of the sulfuric acid hydrolysis data (see 426
Supplemental Figure S1) is not discussed, due to the low information content. Only one or two 427
different carbohydrate accounts for the most significant proportion of the samples. As mentioned by 428
other authors18, 26, sulfuric acid hydrolysis seems to be inadequate to analyze samples with low 429
cellulosic content or highly amorphous materials, due to the destruction of information about the 430
respective monomer composition and sample structure by carbohydrate decomposition. 431
Nevertheless, this hydrolysis method is required to uncover existing crystalline fractions in samples. 432
433
434
Supplemental Figure S1: PCA biplot on scores (polysaccharides: ●, cellulose samples: ) and loadings 435 (grey) based on their molar ratio of carbohydrate composition, obtained by sulfuric acid hydrolysis 436 and followed by GC‐FID or GC‐MS analysis. See Table 1 and 2 for abbreviations and further 437 information about samples. 438 439
440
3.3 The index of recalcitrance cellulose fraction (CRCI) 441
The index of recalcitrance cellulose fraction (CRCI) of different cellulose samples was calculated by 442
subtracting the amount of glucose determined with acid methanolysis from the amount of glucose 443
determined with sulfuric acid hydrolysis (CG2H). Three groups of different CRCI ranges (Tab. 3) were 444
observed during analysis: (1) a high CRCI ‐level group (CRCI > 60%), which consists of cotton based 445
material and hemp paper pulp; (2) a moderate CRCI‐level group (CRCI < 60%; > 40%), which consists of 446
-2 -1 0 1 2 3 4
-1
0
1
2
3-0,5 0,0 0,5 1,0 1,5
-0,5
0,0
0,5
1,0
ASDA
LA GG
GLGP
GC
GB
GSGK
GA
IN
AU
PC
PG
RG
ST
LG
XB
XG BR
HK
SK
TM
EC
EC-E
B1
B2B3
MBPH
ArabinoseGalactose
Glucose
Mannose
Rhamnose
Xylose
Prin
cipa
l Com
pone
nt 2
(sc
ores
)
Principal Component 1 (scores)
B4, CL, CM, HC, HC-E, HS, RM-E, SS, RM-A, RH, RM,
Prin
cipa
l Co
mpo
nent
2 (
load
ings
)Principal Component 1 (loadings)
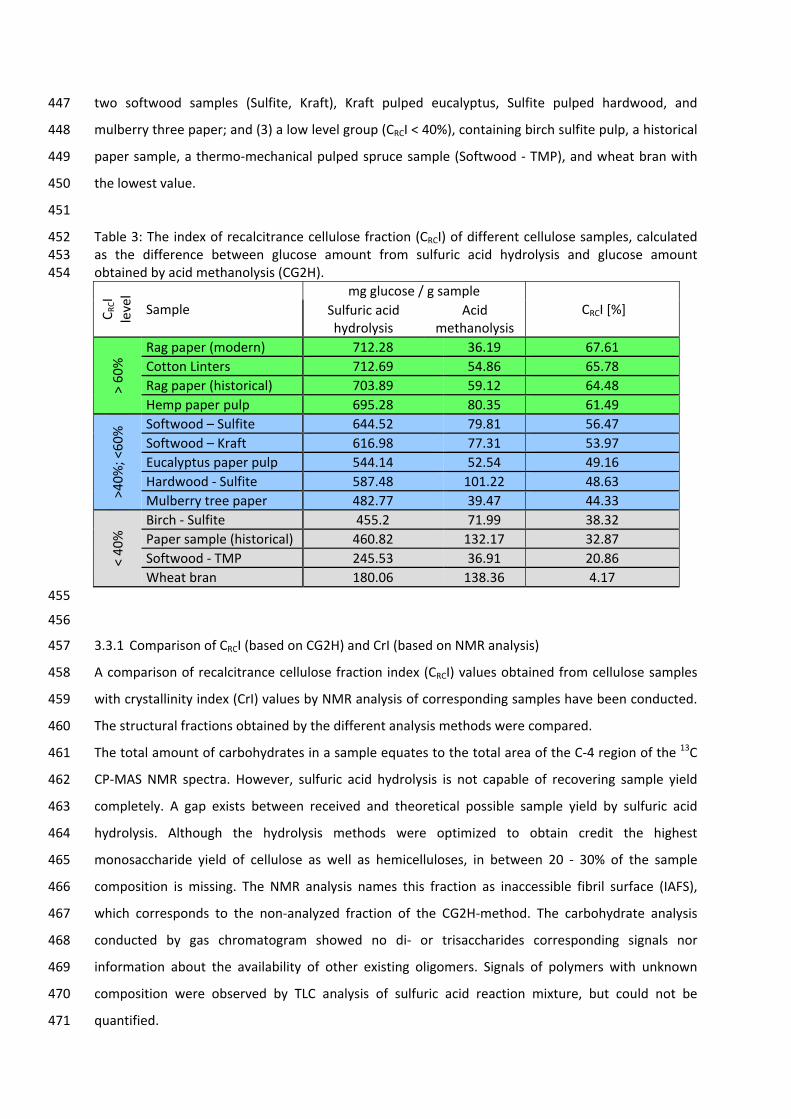
two softwood samples (Sulfite, Kraft), Kraft pulped eucalyptus, Sulfite pulped hardwood, and 447
mulberry three paper; and (3) a low level group (CRCI < 40%), containing birch sulfite pulp, a historical 448
paper sample, a thermo‐mechanical pulped spruce sample (Softwood ‐ TMP), and wheat bran with 449
the lowest value. 450
451
Table 3: The index of recalcitrance cellulose fraction (CRCI) of different cellulose samples, calculated 452 as the difference between glucose amount from sulfuric acid hydrolysis and glucose amount 453 obtained by acid methanolysis (CG2H). 454
CRCI
level
Sample
mg glucose / g sample
CRCI [%] Sulfuric acid hydrolysis
Acid methanolysis
> 60% Rag paper (modern) 712.28 36.19 67.61
Cotton Linters 712.69 54.86 65.78
Rag paper (historical) 703.89 59.12 64.48
Hemp paper pulp 695.28 80.35 61.49
>40%; <60% Softwood – Sulfite 644.52 79.81 56.47
Softwood – Kraft 616.98 77.31 53.97
Eucalyptus paper pulp 544.14 52.54 49.16
Hardwood ‐ Sulfite 587.48 101.22 48.63
Mulberry tree paper 482.77 39.47 44.33
< 40% Birch ‐ Sulfite 455.2 71.99 38.32
Paper sample (historical) 460.82 132.17 32.87
Softwood ‐ TMP 245.53 36.91 20.86
Wheat bran 180.06 138.36 4.17 455
456
3.3.1 Comparison of CRCI (based on CG2H) and CrI (based on NMR analysis) 457
A comparison of recalcitrance cellulose fraction index (CRCI) values obtained from cellulose samples 458
with crystallinity index (CrI) values by NMR analysis of corresponding samples have been conducted. 459
The structural fractions obtained by the different analysis methods were compared. 460
The total amount of carbohydrates in a sample equates to the total area of the C‐4 region of the 13C 461
CP‐MAS NMR spectra. However, sulfuric acid hydrolysis is not capable of recovering sample yield 462
completely. A gap exists between received and theoretical possible sample yield by sulfuric acid 463
hydrolysis. Although the hydrolysis methods were optimized to obtain credit the highest 464
monosaccharide yield of cellulose as well as hemicelluloses, in between 20 ‐ 30% of the sample 465
composition is missing. The NMR analysis names this fraction as inaccessible fibril surface (IAFS), 466
which corresponds to the non‐analyzed fraction of the CG2H‐method. The carbohydrate analysis 467
conducted by gas chromatogram showed no di‐ or trisaccharides corresponding signals nor 468
information about the availability of other existing oligomers. Signals of polymers with unknown 469
composition were observed by TLC analysis of sulfuric acid reaction mixture, but could not be 470
quantified. 471
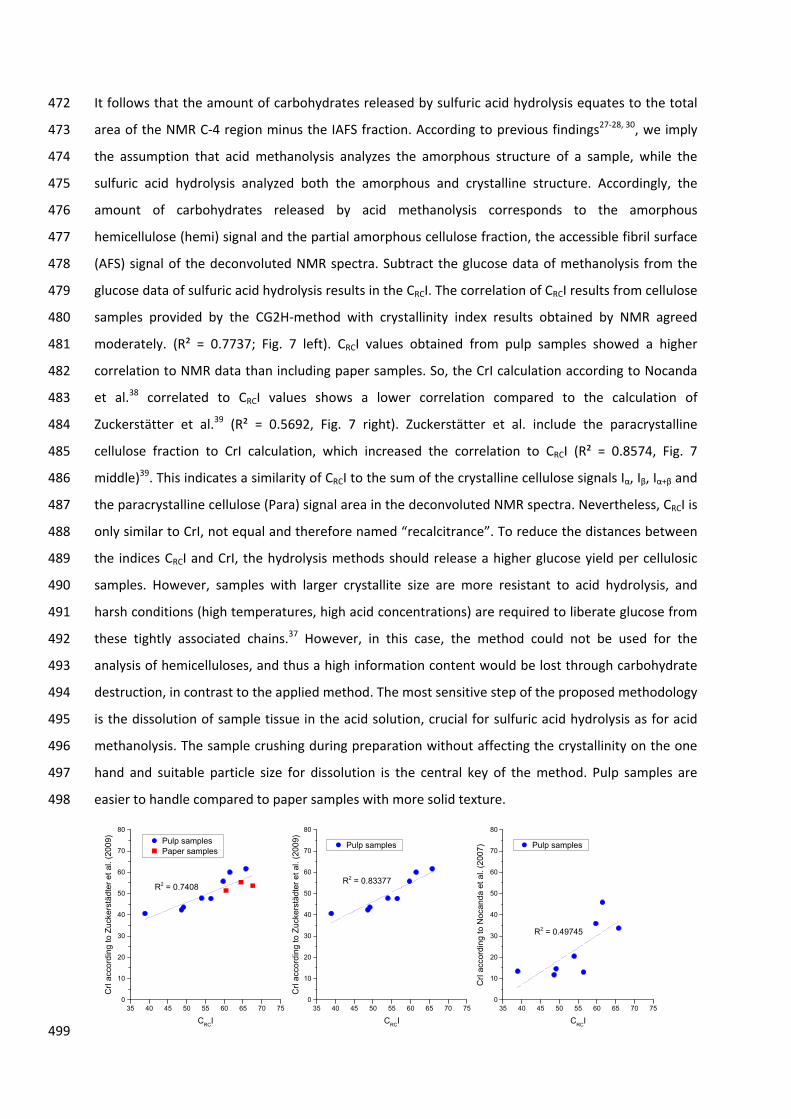
It follows that the amount of carbohydrates released by sulfuric acid hydrolysis equates to the total 472
area of the NMR C‐4 region minus the IAFS fraction. According to previous findings27‐28, 30, we imply 473
the assumption that acid methanolysis analyzes the amorphous structure of a sample, while the 474
sulfuric acid hydrolysis analyzed both the amorphous and crystalline structure. Accordingly, the 475
amount of carbohydrates released by acid methanolysis corresponds to the amorphous 476
hemicellulose (hemi) signal and the partial amorphous cellulose fraction, the accessible fibril surface 477
(AFS) signal of the deconvoluted NMR spectra. Subtract the glucose data of methanolysis from the 478
glucose data of sulfuric acid hydrolysis results in the CRCI. The correlation of CRCI results from cellulose 479
samples provided by the CG2H‐method with crystallinity index results obtained by NMR agreed 480
moderately. (R² = 0.7737; Fig. 7 left). CRCI values obtained from pulp samples showed a higher 481
correlation to NMR data than including paper samples. So, the CrI calculation according to Nocanda 482
et al.38 correlated to CRCI values shows a lower correlation compared to the calculation of 483
Zuckerstätter et al.39 (R² = 0.5692, Fig. 7 right). Zuckerstätter et al. include the paracrystalline 484
cellulose fraction to CrI calculation, which increased the correlation to CRCI (R² = 0.8574, Fig. 7 485
middle)39. This indicates a similarity of CRCI to the sum of the crystalline cellulose signals Iα, Iβ, Iα+β and 486
the paracrystalline cellulose (Para) signal area in the deconvoluted NMR spectra. Nevertheless, CRCI is 487
only similar to CrI, not equal and therefore named “recalcitrance”. To reduce the distances between 488
the indices CRCI and CrI, the hydrolysis methods should release a higher glucose yield per cellulosic 489
samples. However, samples with larger crystallite size are more resistant to acid hydrolysis, and 490
harsh conditions (high temperatures, high acid concentrations) are required to liberate glucose from 491
these tightly associated chains.37 However, in this case, the method could not be used for the 492
analysis of hemicelluloses, and thus a high information content would be lost through carbohydrate 493
destruction, in contrast to the applied method. The most sensitive step of the proposed methodology 494
is the dissolution of sample tissue in the acid solution, crucial for sulfuric acid hydrolysis as for acid 495
methanolysis. The sample crushing during preparation without affecting the crystallinity on the one 496
hand and suitable particle size for dissolution is the central key of the method. Pulp samples are 497
easier to handle compared to paper samples with more solid texture. 498
35 40 45 50 55 60 65 70 750
10
20
30
40
50
60
70
80
CrI
acc
ord
ing
to Z
uck
erst
ädte
r e
t al.
(200
9)
CRC
I
Pulp samples Paper samples
35 40 45 50 55 60 65 70 750
10
20
30
40
50
60
70
80
R2 = 0.7408
R2 = 0.49745
CrI
acc
ordi
ng t
o N
ocan
da
et a
l. (2
007)
CrI
acc
ord
ing
to Z
uck
erst
ädte
r e
t al.
(200
9)
CRC
I
Pulp samples
R2 = 0.83377
35 40 45 50 55 60 65 70 750
10
20
30
40
50
60
70
80
CRC
I
Pulp samples
499
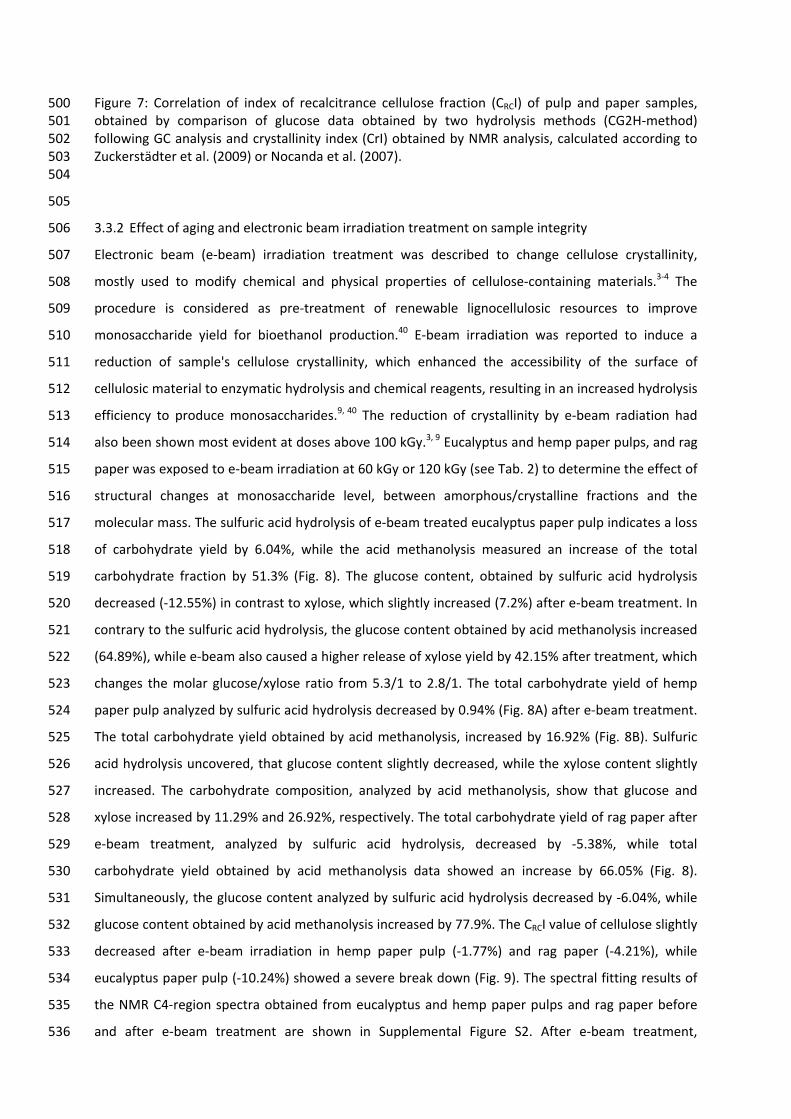
Figure 7: Correlation of index of recalcitrance cellulose fraction (CRCI) of pulp and paper samples, 500 obtained by comparison of glucose data obtained by two hydrolysis methods (CG2H‐method) 501 following GC analysis and crystallinity index (CrI) obtained by NMR analysis, calculated according to 502 Zuckerstädter et al. (2009) or Nocanda et al. (2007). 503 504
505
3.3.2 Effect of aging and electronic beam irradiation treatment on sample integrity 506
Electronic beam (e‐beam) irradiation treatment was described to change cellulose crystallinity, 507
mostly used to modify chemical and physical properties of cellulose‐containing materials.3‐4 The 508
procedure is considered as pre‐treatment of renewable lignocellulosic resources to improve 509
monosaccharide yield for bioethanol production.40 E‐beam irradiation was reported to induce a 510
reduction of sample's cellulose crystallinity, which enhanced the accessibility of the surface of 511
cellulosic material to enzymatic hydrolysis and chemical reagents, resulting in an increased hydrolysis 512
efficiency to produce monosaccharides.9, 40 The reduction of crystallinity by e‐beam radiation had 513
also been shown most evident at doses above 100 kGy.3, 9 Eucalyptus and hemp paper pulps, and rag 514
paper was exposed to e‐beam irradiation at 60 kGy or 120 kGy (see Tab. 2) to determine the effect of 515
structural changes at monosaccharide level, between amorphous/crystalline fractions and the 516
molecular mass. The sulfuric acid hydrolysis of e‐beam treated eucalyptus paper pulp indicates a loss 517
of carbohydrate yield by 6.04%, while the acid methanolysis measured an increase of the total 518
carbohydrate fraction by 51.3% (Fig. 8). The glucose content, obtained by sulfuric acid hydrolysis 519
decreased (‐12.55%) in contrast to xylose, which slightly increased (7.2%) after e‐beam treatment. In 520
contrary to the sulfuric acid hydrolysis, the glucose content obtained by acid methanolysis increased 521
(64.89%), while e‐beam also caused a higher release of xylose yield by 42.15% after treatment, which 522
changes the molar glucose/xylose ratio from 5.3/1 to 2.8/1. The total carbohydrate yield of hemp 523
paper pulp analyzed by sulfuric acid hydrolysis decreased by 0.94% (Fig. 8A) after e‐beam treatment. 524
The total carbohydrate yield obtained by acid methanolysis, increased by 16.92% (Fig. 8B). Sulfuric 525
acid hydrolysis uncovered, that glucose content slightly decreased, while the xylose content slightly 526
increased. The carbohydrate composition, analyzed by acid methanolysis, show that glucose and 527
xylose increased by 11.29% and 26.92%, respectively. The total carbohydrate yield of rag paper after 528
e‐beam treatment, analyzed by sulfuric acid hydrolysis, decreased by ‐5.38%, while total 529
carbohydrate yield obtained by acid methanolysis data showed an increase by 66.05% (Fig. 8). 530
Simultaneously, the glucose content analyzed by sulfuric acid hydrolysis decreased by ‐6.04%, while 531
glucose content obtained by acid methanolysis increased by 77.9%. The CRCI value of cellulose slightly 532
decreased after e‐beam irradiation in hemp paper pulp (‐1.77%) and rag paper (‐4.21%), while 533
eucalyptus paper pulp (‐10.24%) showed a severe break down (Fig. 9). The spectral fitting results of 534
the NMR C4‐region spectra obtained from eucalyptus and hemp paper pulps and rag paper before 535
and after e‐beam treatment are shown in Supplemental Figure S2. After e‐beam treatment, 536
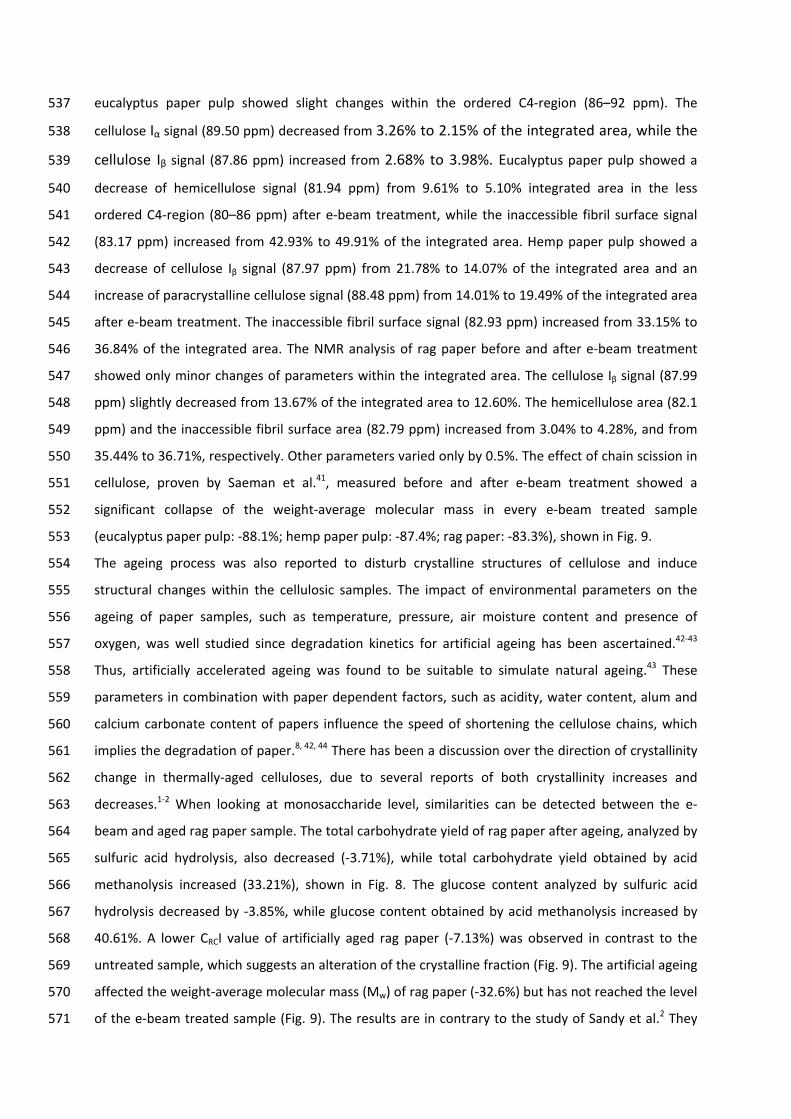
eucalyptus paper pulp showed slight changes within the ordered C4‐region (86–92 ppm). The 537
cellulose Iα signal (89.50 ppm) decreased from 3.26% to 2.15% of the integrated area, while the 538
cellulose Iβ signal (87.86 ppm) increased from 2.68% to 3.98%. Eucalyptus paper pulp showed a 539
decrease of hemicellulose signal (81.94 ppm) from 9.61% to 5.10% integrated area in the less 540
ordered C4‐region (80–86 ppm) after e‐beam treatment, while the inaccessible fibril surface signal 541
(83.17 ppm) increased from 42.93% to 49.91% of the integrated area. Hemp paper pulp showed a 542
decrease of cellulose Iβ signal (87.97 ppm) from 21.78% to 14.07% of the integrated area and an 543
increase of paracrystalline cellulose signal (88.48 ppm) from 14.01% to 19.49% of the integrated area 544
after e‐beam treatment. The inaccessible fibril surface signal (82.93 ppm) increased from 33.15% to 545
36.84% of the integrated area. The NMR analysis of rag paper before and after e‐beam treatment 546
showed only minor changes of parameters within the integrated area. The cellulose Iβ signal (87.99 547
ppm) slightly decreased from 13.67% of the integrated area to 12.60%. The hemicellulose area (82.1 548
ppm) and the inaccessible fibril surface area (82.79 ppm) increased from 3.04% to 4.28%, and from 549
35.44% to 36.71%, respectively. Other parameters varied only by 0.5%. The effect of chain scission in 550
cellulose, proven by Saeman et al.41, measured before and after e‐beam treatment showed a 551
significant collapse of the weight‐average molecular mass in every e‐beam treated sample 552
(eucalyptus paper pulp: ‐88.1%; hemp paper pulp: ‐87.4%; rag paper: ‐83.3%), shown in Fig. 9. 553
The ageing process was also reported to disturb crystalline structures of cellulose and induce 554
structural changes within the cellulosic samples. The impact of environmental parameters on the 555
ageing of paper samples, such as temperature, pressure, air moisture content and presence of 556
oxygen, was well studied since degradation kinetics for artificial ageing has been ascertained.42‐43 557
Thus, artificially accelerated ageing was found to be suitable to simulate natural ageing.43 These 558
parameters in combination with paper dependent factors, such as acidity, water content, alum and 559
calcium carbonate content of papers influence the speed of shortening the cellulose chains, which 560
implies the degradation of paper.8, 42, 44 There has been a discussion over the direction of crystallinity 561
change in thermally‐aged celluloses, due to several reports of both crystallinity increases and 562
decreases.1‐2 When looking at monosaccharide level, similarities can be detected between the e‐563
beam and aged rag paper sample. The total carbohydrate yield of rag paper after ageing, analyzed by 564
sulfuric acid hydrolysis, also decreased (‐3.71%), while total carbohydrate yield obtained by acid 565
methanolysis increased (33.21%), shown in Fig. 8. The glucose content analyzed by sulfuric acid 566
hydrolysis decreased by ‐3.85%, while glucose content obtained by acid methanolysis increased by 567
40.61%. A lower CRCI value of artificially aged rag paper (‐7.13%) was observed in contrast to the 568
untreated sample, which suggests an alteration of the crystalline fraction (Fig. 9). The artificial ageing 569
affected the weight‐average molecular mass (Mw) of rag paper (‐32.6%) but has not reached the level 570
of the e‐beam treated sample (Fig. 9). The results are in contrary to the study of Sandy et al.2 They 571
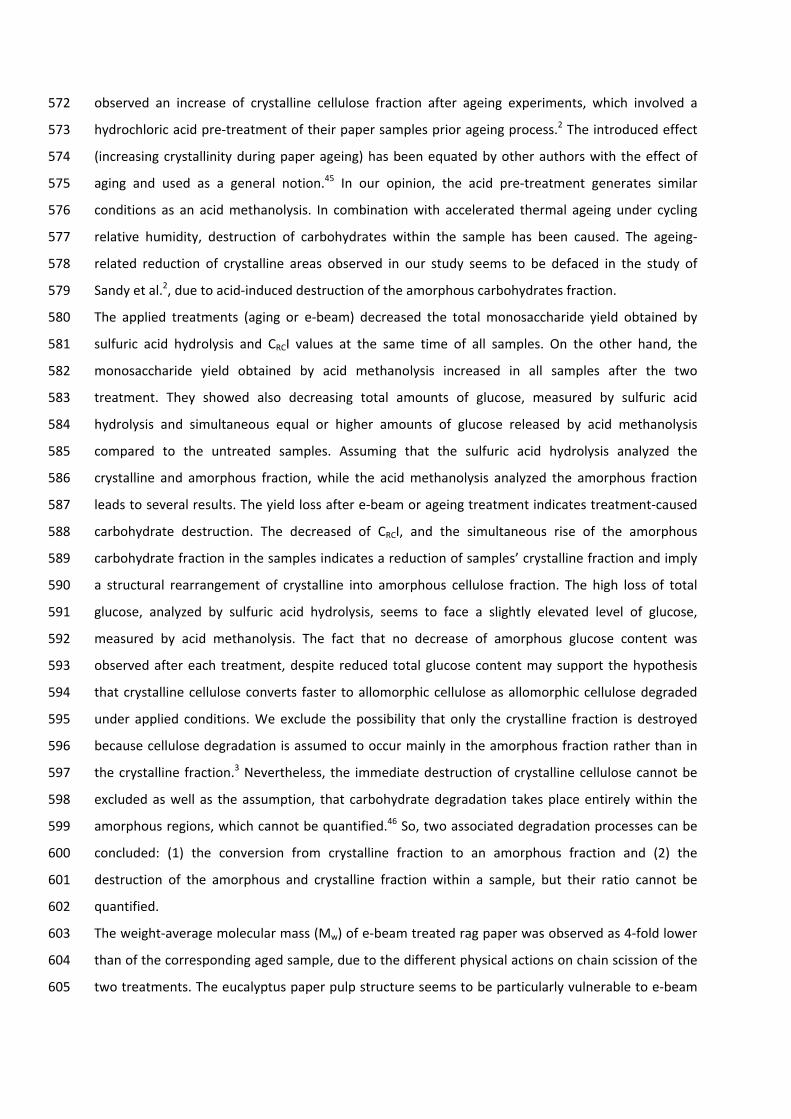
observed an increase of crystalline cellulose fraction after ageing experiments, which involved a 572
hydrochloric acid pre‐treatment of their paper samples prior ageing process.2 The introduced effect 573
(increasing crystallinity during paper ageing) has been equated by other authors with the effect of 574
aging and used as a general notion.45 In our opinion, the acid pre‐treatment generates similar 575
conditions as an acid methanolysis. In combination with accelerated thermal ageing under cycling 576
relative humidity, destruction of carbohydrates within the sample has been caused. The ageing‐577
related reduction of crystalline areas observed in our study seems to be defaced in the study of 578
Sandy et al.2, due to acid‐induced destruction of the amorphous carbohydrates fraction. 579
The applied treatments (aging or e‐beam) decreased the total monosaccharide yield obtained by 580
sulfuric acid hydrolysis and CRCI values at the same time of all samples. On the other hand, the 581
monosaccharide yield obtained by acid methanolysis increased in all samples after the two 582
treatment. They showed also decreasing total amounts of glucose, measured by sulfuric acid 583
hydrolysis and simultaneous equal or higher amounts of glucose released by acid methanolysis 584
compared to the untreated samples. Assuming that the sulfuric acid hydrolysis analyzed the 585
crystalline and amorphous fraction, while the acid methanolysis analyzed the amorphous fraction 586
leads to several results. The yield loss after e‐beam or ageing treatment indicates treatment‐caused 587
carbohydrate destruction. The decreased of CRCI, and the simultaneous rise of the amorphous 588
carbohydrate fraction in the samples indicates a reduction of samples’ crystalline fraction and imply 589
a structural rearrangement of crystalline into amorphous cellulose fraction. The high loss of total 590
glucose, analyzed by sulfuric acid hydrolysis, seems to face a slightly elevated level of glucose, 591
measured by acid methanolysis. The fact that no decrease of amorphous glucose content was 592
observed after each treatment, despite reduced total glucose content may support the hypothesis 593
that crystalline cellulose converts faster to allomorphic cellulose as allomorphic cellulose degraded 594
under applied conditions. We exclude the possibility that only the crystalline fraction is destroyed 595
because cellulose degradation is assumed to occur mainly in the amorphous fraction rather than in 596
the crystalline fraction.3 Nevertheless, the immediate destruction of crystalline cellulose cannot be 597
excluded as well as the assumption, that carbohydrate degradation takes place entirely within the 598
amorphous regions, which cannot be quantified.46 So, two associated degradation processes can be 599
concluded: (1) the conversion from crystalline fraction to an amorphous fraction and (2) the 600
destruction of the amorphous and crystalline fraction within a sample, but their ratio cannot be 601
quantified. 602
The weight‐average molecular mass (Mw) of e‐beam treated rag paper was observed as 4‐fold lower 603
than of the corresponding aged sample, due to the different physical actions on chain scission of the 604
two treatments. The eucalyptus paper pulp structure seems to be particularly vulnerable to e‐beam 605
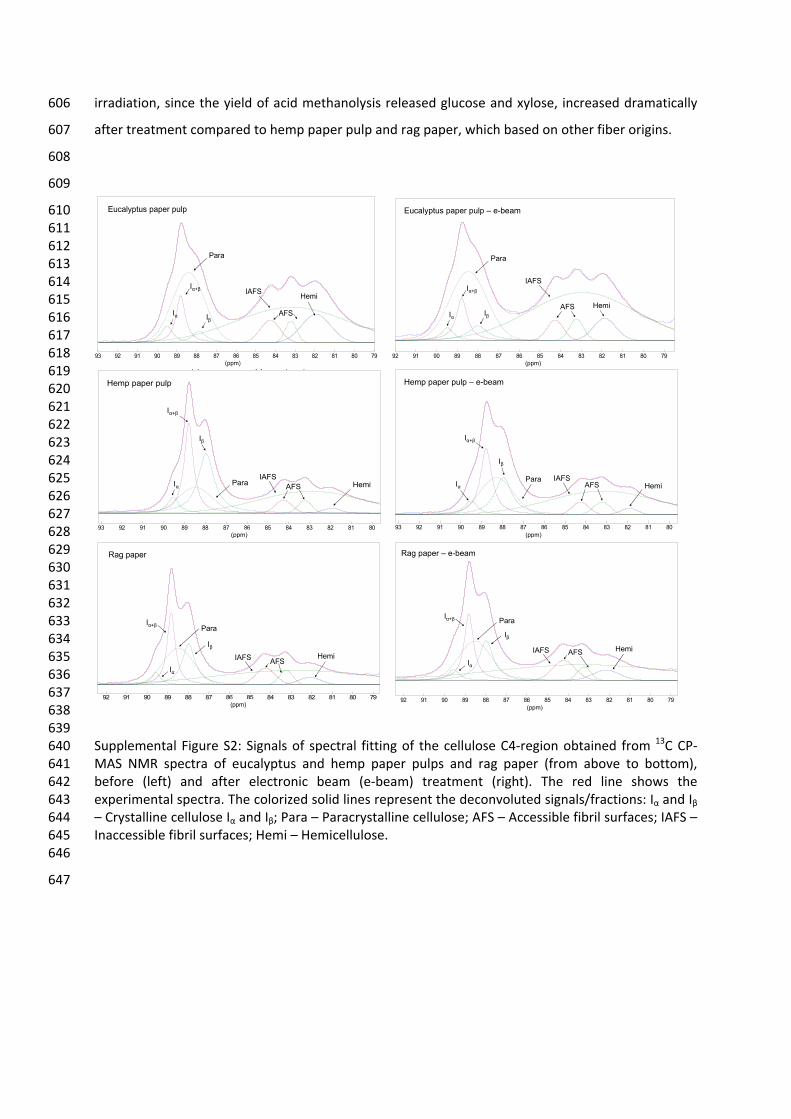
irradiation, since the yield of acid methanolysis released glucose and xylose, increased dramatically 606
after treatment compared to hemp paper pulp and rag paper, which based on other fiber origins. 607
608
609
610 611 612 613 614 615 616 617 618 619 620 621 622 623 624 625 626 627 628 629 630 631 632 633 634 635 636 637 638 639 Supplemental Figure S2: Signals of spectral fitting of the cellulose C4‐region obtained from 13C CP‐640 MAS NMR spectra of eucalyptus and hemp paper pulps and rag paper (from above to bottom), 641 before (left) and after electronic beam (e‐beam) treatment (right). The red line shows the 642 experimental spectra. The colorized solid lines represent the deconvoluted signals/fractions: Iα and Iβ 643 – Crystalline cellulose Iα and Iβ; Para – Paracrystalline cellulose; AFS – Accessible fibril surfaces; IAFS – 644 Inaccessible fibril surfaces; Hemi – Hemicellulose. 645 646
647
(ppm)8081828384858687888990919293
p p y j p p
Hempcell
IAFSAFS HemiPara
Iα+β
Iβ
Iα
Hemp paper pulp
(ppm)(ppm)
8081828384858687888990919293
IAFSAFS Hemi
Para
Iα+β
Iβ
Iα
Hemp paper pulp – e-beam
(ppm)
(ppm)7980818283848586878889909192
IAFS AFSHemi
ParaIα+β
Iβ
Iα
Rag paper
(ppm) (ppm)7980818283848586878889909192
IAFS AFS Hemi
ParaIα+β
Iβ
Iα
Rag paper – e-beam
(ppm)
(ppm)7980818283848586878889909192
IAFS
AFS Hemi
Para
Iα+β
IβIα
Eucalyptus paper pulp – e-beam
(ppm)(ppm)798081828384858687888990919293
IAFS
AFS
Hemi
Para
Iα+β
IβIα
(ppm)
Eucalyptus paper pulp

no tr
eatm
ent
e-be
am
no tr
eatm
ent
e-be
am
no tr
eatm
ent
e-be
am
aged
0
100
200
300
400
500
600
700
800
900
1000
0
100
200
300
400
500
600
700
800
900
1000A)
Rel
ease
d ca
rboh
ydra
tes
[mg/
g sa
mp
le]
Sulfuric acid hydrolysis Total carbohydrates Glucose Xylose
Eucalyptuspaper pulp
Rag paper(modern)
Hemppaper pulp
no tr
eatm
ent
e-be
am
no tr
eatm
ent
e-be
am
no tr
eatm
ent
e-be
am
aged
0
50
100
150
200
250
300
0
50
100
150
200
250
300B)
Rel
ease
d ca
rboh
ydra
tes
[mg/
g sa
mpl
e] Acid methanolysis Total carbohydrates Glucose Xylose
Eucalyptuspaper pulp
Rag paper(modern)
Hemppaper pulp 648
Figure 8: Released carbohydrates (total amount, glucose and xylose) of untreated, electron beam (e‐649 beam) treatment (eucalyptus and hemp paper pulps: 120 kGy, and rag paper: 60 kGy) and artificially 650 aged cellulose samples. A) represents sulfuric acid hydrolysis data; B) represents acid methanolysis 651 data. 652 653
654
321
,3
38,
3
438,
7
55,
1
354,
5
59,2
238
,9
no tr
eatm
ent
e-be
am
no tr
eatm
ent
e-be
am
no tr
eatm
ent
e-be
am
aged
0
10
20
30
40
50
60
70
Wei
ght-
aver
age
mol
ecul
ar m
ass
(Mw
, )
CRC
I
Mw
Inde
x of
rec
alci
tran
ce c
ellu
lose
frac
tion
(CR
CI)
0
100
200
300
400
500
600
700
Eucalyptus paper pulp
Rag paper(modern)
Hemppaper pulp
655 Figure 9: The index of recalcitrance cellulose fraction (CRCI, columns) of untreated, electron beam 656 irradiated (e‐beam) and artificially aged cellulose samples (eucalyptus and hemp paper pulps: 120 657 kGy, and rag paper: 60 kGy) and corresponding weight‐average molecular mass (Mw, ). Index 658 values were calculated by subtracting the amount of glucose determined by acid methanolysis from 659 the amount of glucose determined by sulfuric acid hydrolysis. 660 661
662
663
4 Conclusion 664
The current study showed that the two applied hydrolysis methods, alone or in combination, 665
followed by GC‐MS analysis, represents a useful analytical tool for determination of structure 666
elucidation and carbohydrate characterization of a wide range of polysaccharide and cellulose 667
samples. The similarity of polysaccharides’ carbohydrate pattern compared to cellulose samples can 668
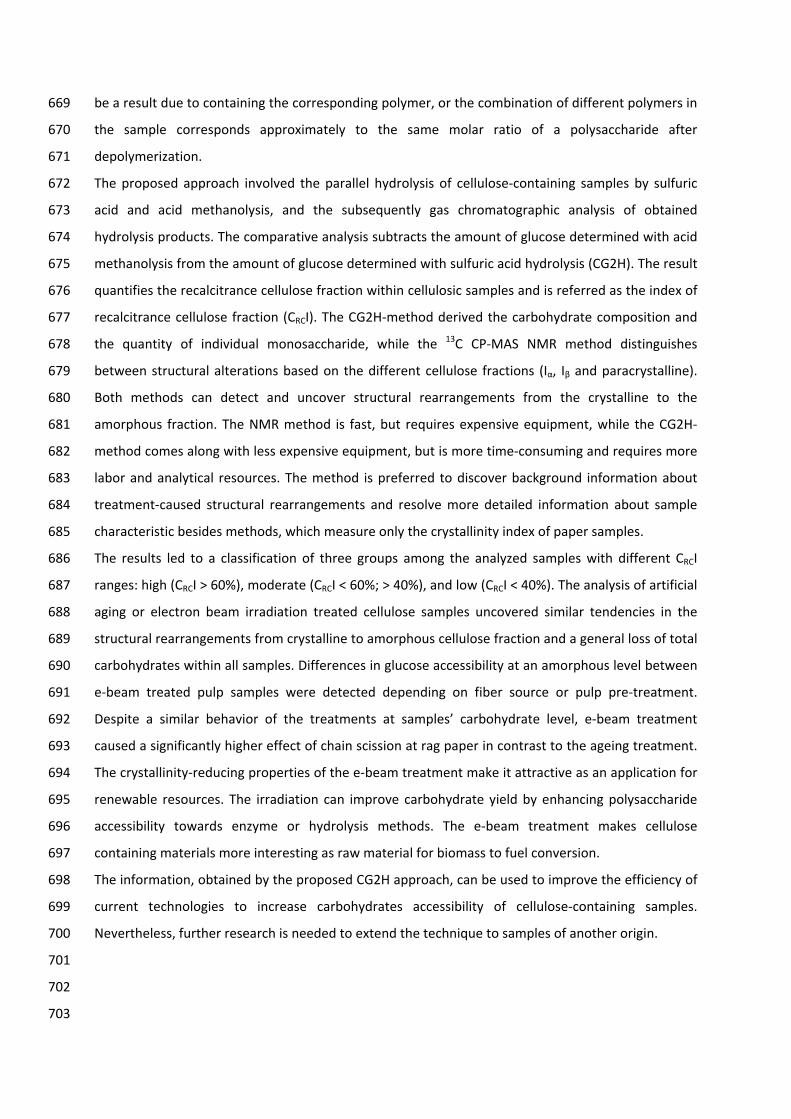
be a result due to containing the corresponding polymer, or the combination of different polymers in 669
the sample corresponds approximately to the same molar ratio of a polysaccharide after 670
depolymerization. 671
The proposed approach involved the parallel hydrolysis of cellulose‐containing samples by sulfuric 672
acid and acid methanolysis, and the subsequently gas chromatographic analysis of obtained 673
hydrolysis products. The comparative analysis subtracts the amount of glucose determined with acid 674
methanolysis from the amount of glucose determined with sulfuric acid hydrolysis (CG2H). The result 675
quantifies the recalcitrance cellulose fraction within cellulosic samples and is referred as the index of 676
recalcitrance cellulose fraction (CRCI). The CG2H‐method derived the carbohydrate composition and 677
the quantity of individual monosaccharide, while the 13C CP‐MAS NMR method distinguishes 678
between structural alterations based on the different cellulose fractions (Iα, Iβ and paracrystalline). 679
Both methods can detect and uncover structural rearrangements from the crystalline to the 680
amorphous fraction. The NMR method is fast, but requires expensive equipment, while the CG2H‐681
method comes along with less expensive equipment, but is more time‐consuming and requires more 682
labor and analytical resources. The method is preferred to discover background information about 683
treatment‐caused structural rearrangements and resolve more detailed information about sample 684
characteristic besides methods, which measure only the crystallinity index of paper samples. 685
The results led to a classification of three groups among the analyzed samples with different CRCI 686
ranges: high (CRCI > 60%), moderate (CRCI < 60%; > 40%), and low (CRCI < 40%). The analysis of artificial 687
aging or electron beam irradiation treated cellulose samples uncovered similar tendencies in the 688
structural rearrangements from crystalline to amorphous cellulose fraction and a general loss of total 689
carbohydrates within all samples. Differences in glucose accessibility at an amorphous level between 690
e‐beam treated pulp samples were detected depending on fiber source or pulp pre‐treatment. 691
Despite a similar behavior of the treatments at samples’ carbohydrate level, e‐beam treatment 692
caused a significantly higher effect of chain scission at rag paper in contrast to the ageing treatment. 693
The crystallinity‐reducing properties of the e‐beam treatment make it attractive as an application for 694
renewable resources. The irradiation can improve carbohydrate yield by enhancing polysaccharide 695
accessibility towards enzyme or hydrolysis methods. The e‐beam treatment makes cellulose 696
containing materials more interesting as raw material for biomass to fuel conversion. 697
The information, obtained by the proposed CG2H approach, can be used to improve the efficiency of 698
current technologies to increase carbohydrates accessibility of cellulose‐containing samples. 699
Nevertheless, further research is needed to extend the technique to samples of another origin. 700
701
702
703
5 Acknowledgment 704
The financial support by the Christian Doppler Research Society (CD lab “Advanced Cellulose 705
Chemistry and Analytics”) and an STSM grant from the European COST B21 Action FP0901 (COST‐706
STSM‐FP0901‐9940) is gratefully acknowledged. 707
708
709
710
6 References 711
1. Henniges, U.; Bjerregaard, L.; Ludwig, B.; Potthast, A., Controversial influence of aqueous 712 treatments on historic textiles. Polym Degrad Stabil 2011, 96 (4), 588‐594. 713
2. Sandy, M.; Manning, A.; Bollet, F., Changes in the Crystallinity of Cellulose in Response to 714 Changes in Relative Humidity and Acid Treatment. In Restaurator, 2010; Vol. 31, p 1. 715
3. Driscoll, M.; Stipanovic, A.; Winter, W.; Cheng, K.; Manning, M.; Spiese, J.; Galloway, R. A.; 716 Cleland, M. R., Electron beam irradiation of cellulose. Radiation Physics and Chemistry 2009, 717 78 (7‐8), 539‐542. 718
4. Henniges, U.; Okubayashi, S.; Rosenau, T.; Potthast, A., Irradiation of cellulosic pulps: 719 Understanding its impact on cellulose oxidation. Biomacromolecules 2012, 13 (12), 4171‐720 4178. 721
5. Mann, J., Modern methods of determining crystallinity in cellulose. Pure Appl. Chem. 1962, 5 722 (1‐2), 91‐106. 723
6. Black, G. E.; Fox, A., Recent progress in the analysis of sugar monomers from complex 724 matrices using chromatography in conjunction with mass spectrometry or stand‐alone 725 tandem mass spectrometry. Journal of Chromatography A 1996, 720 (1‐2), 51‐60. 726
7. Larsson, P. T.; Wickholm, K.; Iversen, T., A CP/MAS13C NMR investigation of molecular 727 ordering in celluloses. Carbohydrate Research 1997, 302 (1–2), 19‐25. 728
8. Kato, K. L.; Cameron, R. E., A Review of the Relationship Between Thermally‐Accelerated 729 Ageing of Paper and Hornification. Cellulose 1999, 6 (1), 23‐40. 730
9. Chung, B. Y.; Lee, J. T.; Lee, S. S.; Kim, U. J.; Wi, S. G.; Bai, H. W.; Cho, J. Y., A comparison of 731 the efficiency of electron beam irradiation on enzymatic hydrolysis between 4 doses of 25 732 kGy and a single dose of 100 kGy for bioethanol production. Journal of the Korean Society for 733 Applied Biological Chemistry 2012, 55 (3), 385‐389. 734
10. Park, S.; Baker, J. O.; Himmel, M. E.; Parilla, P. A.; Johnson, D. K., Cellulose crystallinity index: 735 measurement techniques and their impact on interpreting cellulase performance. 736 Biotechnology for biofuels 2010, 3, 10. 737
11. Thygesen, A.; Oddershede, J.; Lilholt, H.; Thomsen, A. B.; Ståhl, K., On the determination of 738 crystallinity and cellulose content in plant fibres. Cellulose 2005, 12 (6), 563‐576. 739
12. Agarwal, U. P.; Reiner, R. R.; Ralph, S. A. In Cellulose crystallinity of woods, wood pulps, and 740 agricultural fibers by FT‐Raman spectroscopy, Proceedings 16th international symposium on 741 wood, fiber and pulping chemistry. 2011 June 8‐10. Tianjin, China. Beijing, China: China Light 742 Industry Press: 69‐74, 2011. 743
13. Ali, M.; Emsley, A. M.; Herman, H.; Heywood, R. J., Spectroscopic studies of the ageing of 744 cellulosic paper. Polymer 2001, 42 (7), 2893‐2900. 745
14. Lennholm, H.; Larsson, T.; Iversen, T., Determination of cellulose Iα and Iβ in lignocellulosic 746 materials. Carbohydrate Research 1994, 261 (1), 119‐131. 747
15. Maunu, S.; Liitiä, T.; Kauliomäki, S.; Hortling, B.; Sundquist, J., 13C CPMAS NMR investigations 748 of cellulose polymorphs in different pulps. Cellulose 2000, 7 (2), 147‐159. 749
16. Bertaud, F.; Sundberg, A.; Holmbom, B., Evaluation of acid methanolysis for analysis of wood 750 hemicelluloses and pectins. Carbohydrate Polymers 2002, 48 (3), 319‐324. 751
17. Bose, S. K.; Barber, V. A.; Alves, E. F.; Kiemle, D. J.; Stipanovic, A. J.; Francis, R. C., An 752 improved method for the hydrolysis of hardwood carbohydrates to monomers. Carbohydrate 753 Polymers 2009, 78 (3), 396‐401. 754
18. Sundberg, A.; Sundberg, K.; Lillandt, C.; Holmbom, B., Determination of hemicelluloses and 755 pectins in wood and pulp fibres by acid methanolysis and gas chromatography. Nordic Pulp 756 and Paper Research Journal 1996, 11 (4), 216‐219+226. 757
19. Marques, G.; Gutiérrez, A.; del Río, J. C.; Evtuguin, D. V., Acetylated heteroxylan from Agave 758 sisalana and its behavior in alkaline pulping and TCF/ECF bleaching. Carbohydrate Polymers 759 2010, 81 (3), 517‐523. 760
20. Duquesnoy, E.; Castola, V.; Casanova, J., Identification and quantitative determination of 761 carbohydrates in ethanolic extracts of two conifers using 13C NMR spectroscopy. 762 Carbohydrate Research 2008, 343 (5), 893‐902. 763
21. Panagiotopoulos, C.; Sempere, R., Analytical methods for the determination of sugars in 764 marine samples: A historical perspective and future directions. Limnol Oceanogr‐Meth 2005, 765 3, 419‐454. 766
22. Huang, Y.; Indrarti, L.; Azuma, J.; Okamura, K., Simultaneous Determination of Xylose and 767 Uronic‐Acid in Beech Xylan by Methanolysis. Mokuzai Gakkaishi 1992, 38 (12), 1168‐1171. 768
23. Laine, C.; Tamminen, T.; Vikkula, A.; Vuorinen, T., Methylation analysis as a tool for structural 769 analysis of wood polysaccharides. Holzforschung 2002, 56 (6), 607‐614. 770
24. Amelung, W.; Cheshire, M. V.; Guggenberger, G., Determination of neutral and acidic sugars 771 in soil by capillary gas‐liquid chromatography after trifluoroacetic acid hydrolysis. Soil Biol 772 Biochem 1996, 28 (12), 1631‐1639. 773
25. Rumpel, C.; Dignac, M. F., Chromatographic analysis of monosaccharides in a forest soil 774 profile: Analysis by gas chromatography after trifluoroacetic acid hydrolysis and reduction‐775 acetylation. Soil Biol Biochem 2006, 38 (6), 1478‐1481. 776
26. Chambers, R. E.; Clamp, J. R., Assessment of Methanolysis and Other Factors Used in Analysis 777 of Carbohydrate‐Containing Materials. Biochem J 1971, 125 (4), 1009‐&. 778
27. Kilic, A.; Hafizoglu, H.; Tümen, I.; Dönmez, I. E.; Sivrikaya, H.; Sundberg, A.; Holmbom, B., 779 Polysaccharides in cones of eleven coniferous species growing in Turkey. Wood Science and 780 Technology 2010, 44 (3), 523‐529. 781
28. Willför, S.; Sundberg, A.; Hemming, J.; Holmbom, B., Polysaccharides in some industrially 782 important softwood species. Wood Science and Technology 2005, 39 (4), 245‐257. 783
29. Willför, S.; Sundberg, A.; Pranovich, A.; Holmbom, B., Polysaccharides in some industrially 784 important hardwood species. Wood Science and Technology 2005, 39 (8), 601‐617. 785
30. Sundberg, A.; Pranovich, A. V.; Holmbom, B., Chemical characterization of various types of 786 mechanical pulp fines. Anglais 2003, 29 (5), 6. 787
31. Becker, M.; Zweckmair, T.; Forneck, A.; Rosenau, T.; Potthast, A.; Liebner, F., Evaluation of 788 different derivatisation approaches for gas chromatographic‐mass spectrometric analysis of 789 carbohydrates in complex matrices of biological and synthetic origin. Journal of 790 Chromatography A 2013, 1281, 115‐26. 791
32. Wijaya, Y. P.; Putra, R. D. D.; Widyaya, V. T.; Ha, J.‐M.; Suh, D. J.; Kim, C. S., Comparative study 792 on two‐step concentrated acid hydrolysis for the extraction of sugars from lignocellulosic 793 biomass. Bioresource Technology 2014, 164 (0), 221‐231. 794
33. Bhandari, N.; Macdonald, D. G.; Bakhshi, N. N., Kinetic studies of corn stover saccharification 795 using sulphuric acid. Biotechnol Bioeng 1984, 26 (4), 320‐327. 796
34. Singh, A.; Das, K.; Sharma, D. K., Production of reducing sugars from bagasse and rice husk by 797 acid hydrolysis. Agricultural Wastes 1984, 9 (2), 131‐145. 798
35. Zhang, Y.‐H. P.; Ding, S.‐Y.; Mielenz, J. R.; Cui, J.‐B.; Elander, R. T.; Laser, M.; Himmel, M. E.; 799 McMillan, J. R.; Lynd, L. R., Fractionating recalcitrant lignocellulose at modest reaction 800 conditions. Biotechnol Bioeng 2007, 97 (2), 214‐223. 801
36. Girisuta, B.; Janssen, L. P. B. M.; Heeres, H. J., Kinetic Study on the Acid‐Catalyzed Hydrolysis 802 of Cellulose to Levulinic Acid. Ind Eng Chem Res 2007, 46 (6), 1696‐1708. 803
37. Morales‐delaRosa, S.; Campos‐Martin, J.; Fierro, J. G., Optimization of the process of 804 chemical hydrolysis of cellulose to glucose. Cellulose 2014, 21 (4), 2397‐2407. 805
38. Nocanda, X.; Larsson Per, T.; Spark, A.; Bush, T.; Olsson, A.; Madikane, M.; Bissessur, A.; 806 Iversen, T., Cross polarisation/magic angle spinning 13C‐NMR spectroscopic studies of 807 cellulose structural changes in hardwood dissolving pulp process. In Holzforschung, 2007; 808 Vol. 61, p 675. 809
39. Zuckerstätter, G.; Schild, G.; Wollboldt, P.; Röder, T.; Weber, H. K.; Sixta, H., The elucidation 810 of cellulose supramolecular structure by 13C CP‐MAS NMR. Lenzinger Berichte 2009, 87, 38‐811 46. 812
40. Sundar, S.; Begey, N. S.; Salamanca‐Cardona, L.; Stipanovic, A.; Driscoll, M., Electron beam 813 pretreatment of switchgrass to enhance enzymatic hydrolysis to produce sugars for biofuels. 814 Carbohydrate Polymers 2013. 815
41. Saeman, J. F.; Millett, M. A.; Lawton, E. J., Effect of High‐Energy Cathode Rays on Cellulose. 816 Industrial & Engineering Chemistry 1952, 44 (12), 2848‐2852. 817
42. Barański, A., Ageing kinetics of cellulose and paper. Restaurator 2002, 23 (2), 77‐88. 818 43. Zou, X.; Uesaka, T.; Gurnagul, N., Prediction of paper permanence by accelerated aging I. 819
Kinetic analysis of the aging process. Cellulose 1996, 3 (1), 243‐267. 820 44. Strlic, M.; Cigic, I. K.; Kolar, J.; de Bruin, G.; Pihlar, B., Non‐destructive evaluation of historical 821
paper based on pH estimation from VOC emissions. Sensors 2007, 7 (12), 3136‐3145. 822 45. Menart, E.; De Bruin, G.; Strlič, M., Dose–response functions for historic paper. Polym Degrad 823
Stabil 2011, 96 (12), 2029‐2039. 824 46. Emsley, A. M.; Stevens, G. C., Kinetics and mechanisms of the low‐temperature degradation 825
of cellulose. Cellulose 1994, 1 (1), 26‐56. 826
827
163
Curriculum vitae ‐ M.Sc. agr. Manuel BECKER
PERSONAL DETAILS
Name: Becker
Forenames: Manuel Stefan
Date of Birth: May 31, 1981
Place of Birth: Heidelberg, Germany
Nationality: German
ACADEMIC CREDENTIALS
10/2001 – 07/2004 Agricultural Sciences / Bachelor
University of Hohenheim, Germany
Major: Plant sciences
10/2004 – 11/2006 Agricultural Sciences / Master
University of Hohenheim, Germany
Major: Plant sciences
Main focus: Yield physiology and management (V. vinifera L.)
Master thesis: „Genetisches Potential von Pinot meunier untersucht
anhand eines Wildtyp/Mutanten‐Vergleichs (hairy/non hairy
phenotype)“
Since 04/2007 Doctorate at the Institute of Horticulture, Fruit‐Growing and
Viticulture, Department of Applied Plant Sciences and Plant
Biotechnology, University of Natural Resources and Applied Life
Sciences, Vienna: „Analyse of complex carbohydrate mixtures“
WORKING EXPERIENCE
04/2007 – 04/2010 Research associate at the Institute of Horticulture, Fruit‐Growing
and Viticulture, Department of Applied Plant Sciences and
Plant Biotechnology, University of Natural Resources and
Applied Life Sciences, Vienna
04/2010 – 09/2012 Research associate at the Christian‐Doppler‐Laboratory at the
Department of Chemistry, University of Natural Resources and
Applied Life Science, Vienna, Austria
01/2012 – 02/2012 Research visit at Åbo Akademi University, Turku, Finland
Project: Determination of carbohydrate composition in Pulps
and Papers
10/2012 – 04/2014 Internship at the ministry of rural development and consumer
protection (MLR), Stuttgart, Baden‐Württemberg, Germany
Since 06/2014 Head, Viticulture and plant protection Section, State research
institute for viticulture and pomiculture, Weinsberg, Germany

164
Erklärung
Hiermit versichere ich, dass ich die vorliegende Arbeit ohne unzulässige Hilfe Dritter und ohne
Benutzung anderer als der angegebenen Hilfsmittel angefertigt habe; die aus fremden Quellen direkt
oder indirekt übernommenen Gedanken sind als diese kenntlich gemacht worden. Bei der Auswahl
und Auswertung des Materials sowie bei der Herstellung des Manuskriptes habe ich Unterstützungs‐
leistungen von folgenden Personen erhalten:
Weitere Personen waren an der geistigen Herstellung der vorliegenden Arbeit nicht beteiligt.
Insbesondere habe ich nicht die Hilfe eines oder mehrerer Promotionsberater(s) in Anspruch
genommen. Dritte haben von mir weder unmittelbar noch mittelbar geldwerte Leistungen für
Arbeiten erhalten, die im Zusammenhang mit dem Inhalt der vorgelegten Dissertation stehen.
Die Arbeit wurde bisher weder im Inland noch im Ausland in gleicher oder ähnlicher Form einer
anderen Prüfungsbehörde zum Zwecke der Promotion vorgelegt.
..........................................................
Ort, Datum
..........................................................
Unterschrift (Manuel Becker)