Abstracts A – C
54
Abstracts A – C
-
Upload
khangminh22 -
Category
Documents
-
view
9 -
download
0
Transcript of Abstracts A – C

AbstractsA – C
NSCA National Conference & Exhibition Abstracts 2
1Rm Prediction From The Linear Velocity And The Rate Of Perceived Exertion In Bench Press And Paralell Squat.
Fernando Ayllon, Eneko Larumbe, Alfonso Jiménez, Brent Alvar
PURPOSE: The goal of this study was to determine the accuracy of the Scale of Perceived Exertion (RPE) OMNI
RES 0-10 and the Linear Velocity (V) to predict the 1RM value in two resistance training exercises: Bench Press
(BP) and Parallel Squat (PS), in a group of young baseball players. METHOD: 32 young men baseball players
(15.6+0.7 yr) performed a progressive test (PRT) in BP and PS with incremental load until reach the maximum
load that can be mobilized (1 RM). The RPE OMNI-RES 0-10 Scale was used to assess the effort’s perception
experimented at the end of the PRT set and a rotating encoder was used to get the average lineal velocity
reached with each load. Two lineal regression analyses where made to predict the 1 RM percentages and
calculate the 1 RM. 1) One between the V (as independent variable) and % 1 RM (as dependent variable) 2)
The other one between the RPE (as independent variable) and % 1 RM (as dependent variable). RESULTS:
The averaged 1 RM achieved were 66.8±12.8 and 153.8±22.6 for BP and PS respectively. The 1 RM prediction
models were statistically significant (p<0.01) for either velocity (r = 0.97 SEE% 12.2 and r=0.93 SEE 14.6%) or
RPE (r=0.90 SEE% 6.4% and r=0.97 SEE% 6.7%) for BP or PS respectively. The regression equation developed
for each model were: 1 RM BP = 100 x kg / (1.050+(-0.517) v) and 1MR BP = 100 x kg / (0.266+0.075(RPE)); 1 RM
PS = 100 x kg / ((1.094+(-0.388) v) and 1 RM PS =100 x kg / (0.572+0.043(RPE)). The covaried analysis showed
significant differences (p<0.05) between the regression RPE-%1RM regression line developed for BP and PS,
but not for the two BP or PS v-%1RM regression. CONCLUSIONS: For both exercises (BP and PS), we can esti-
mate the 1 RM value from the velocity or the RPE determined during or at the end of a short set of only 1 to 3
rep with a submaximal load mobilized with the maximal possible velocity. PRACTICAL APPLICATIONS: These
equations allow a continuous control of the strength evolutions during the training process, although when
the V is utilized as the predictive variable we can assign the same equation for BP or PS, but when you uses
the RPE we have to develop a specific equation for each different exercise. Furthermore, from the SEE% the
RPE equation shows a more accurate value than the V equation.
Application Of Gps Technology To Assess The Demands In Soccer Competition At College-Aged Level
Fernando Ayllon, David Viejo-Romero, Alfonso Jiménez, Brent Alvar
PURPOSE The main objective of this study was to describe and quantify the total distance crossed by a group of the
College-aged Soccer players during different competition matches, differentiating between the positions in field
(defense, midfielder and forward). As second objective, we compare the distance measures in this category with
those registered in first class soccer Spanish players (Spanish League and European Champions League). METHODS
10 male college-aged soccer players led a global positioning satellite (GPS) device (SPI Elite) for 14 league matches
of the season 2008/2009. These devices can measure the distance and calculate the running speed and acceleration
made by each player along the match RESULTS: There were 140 entries total. The average distance completed by all
players without differentiating the position was 8902.53 ± 250.4 m, with a range between 7963.5 m and 11161.6 m.
When the sample was classified by the position, midfield players completed 9271.34 ± 130.99m (p <0.05), an 8%
increase over the defense players (8565.6 ± 309.5 m) and 4% compared to the forwards players (8870.6 ± 871.0m),
with no significant differences identified between the last two groups (p> 0.05). The distance completed by college-
aged soccer players was significantly lower (p <0.05), than the distance registered from elite level players (Spanish
League and European Champions League), where midfield players run 12008.5 ± 776 m (+22%), the defense players
11405.3 ± 893 m (+25%) and the forwards players 11254 ± 894 m (+21%) CONCLUSION: Our results are similar to the
data showed by other studies which had used other tools, as cameras and tracking system (computerized tracking
system) regarding the distance crossed by grade or competition level. Independently of the competition level, the
midfielders covered the major distance during the matches PRACTICAL APPLICATIONS: The midfielder will require
greater attention to Conditioning, especially for the specific endurance capacity, to enable them to cope with the
game demands.
The Effects Of An Acute Bout Of Static Vs. Dynamic Stretching On Performance In College Soccer Players
Shawn M. Arent, Patrick M. Davitt, Danielle Gallo, Danielle Facchine, Chris D’Andrea
While considerable debate has surrounded the potential effects of dynamic (DS) and static (SS) stretching on per-
formance outcomes, very little has been done to directly compare the two modes of stretching, particularly in
both male and female high-level athletes. Furthermore, many of the SS protocols have used unrealistic stretch-
ing durations. PURPOSE: To compare the effects of externally valid SS and DS lower body stretching protocols on
vertical jump and knee extension and flexion peak torque in high-level male and female soccer players. METHODS:
Male (n = 11, M<sub>height</sub> = 1.8 +/- 0.1 m; M<sub>weight</sub> = 75.7 +/- 7.4kg) and female (n = 10,
M<sub>height</sub> = 1.6 +/- 0.1 m, M<sub>weight</sub> = 64.6 +/- 5.7 kg) Division I college soccer players
participated in the study. Following an initial familiarization session that included instruction and practice of the
stretches and tests to be used in the study, subjects were randomly assigned to order of completion of SS and DS
conditions, which were separated by at least 3 days. Following a 5 min systemic warm-up, each of the stretching
protocols lasted approximately 15 min and focused on the lower body and core. After stretching, subjects per-
formed 2 efforts of a countermovement vertical jump with no arm swing (CMVJ) using a Just Jump mat (Probotics,
Inc.), and knee extension and flexion with their dominant leg at 180 °·s<sup>-1</sup> and 300 °·s<sup>-1</sup>
on a Biodex System 3 isokinetic dynamometer (Biodex Medical Systems, Inc.). The best effort for the CMVJ was
used and peak torque was measured at each speed on the Biodex. RESULTS: Compared to SS, DS produced greater
performance for CMVJ (SS = 18.6 +/- 3.8 in; DS = 20.0 +/- 4.4 in; P=.001), peak torque at 180 °·s<sup>-1</sup> for
flexion (SS = 49.5 +/- 18.2 ft-lbs; DS = 53.4 +/- 18.8 ft-lbs; P=.039), and peak torque at 300 °·s<sup>-1</sup> for both
extension (SS = 72.2 +/- 21.3 ft-lbs; DS = 79.1 +/- 24.3 ft-lbs; P=.027) and flexion (SS = 41.6 +/- 13.1 ft-lbs; DS = 45.6 +/-
14.1 ft-lbs; P=.03). Gender differences emerged for all variables (P.10). CONCLUSIONS: Compared to static stretching,
dynamic stretching resulted in significantly greater vertical jump height and peak torque for knee extension and
flexion in both male and female soccer players. These findings are particularly notable given that these measures
have previously been associated with greater performance and success in high-level soccer players. PRACTICAL
APPLICATIONS: It appears that static stretching as part of a warm-up is not an effective tool to improve key perfor-
mance markers in high-level male and female soccer players. Instead, coaches and athletes should consider using
dynamic stretching as part of their warm-up protocol to facilitate enhanced performance on movements associated
with greater success in soccer.
The Effect Of Daily Undulated Periodization As Compared To Linear Periodization In Strength Gains Of Collegiate Athletes
Brent Alvar, Rich Wenner, Daniel J. Dodd
Strength and conditioning coaches are always looking for ways to optimize gains in muscular strength. Previous
resistance training research has examined the efficacy of non periodized multiple-set versus single-set, and linear
as compared to non periodized multiple-set models on gains in muscular strength. Conversely, less research has
examined the linear and undulating periodization models, especially when equating for volume and intensity.
Purpose: This study was designed to examine the effects of a linear periodization intervention as compared to a
daily undulating periodization intervention on maximal strength gains in Division I athletes while controlling for
volume and intensity. Methods: Twenty subjects were recruited from a Division I athletic program. All subjects
performed a one repetition maximum (1RM) bench press test prior to beginning the training program and imme-
diately upon completion of the six week training program. Participants were assigned to one of two groups, Linear
Periodization (LP) or Daily Undulated Periodization (DUP). The LP group followed a plan that decreased volume
of repetitions performed while increasing intensity (percent of 1RM) over the course of six weeks. The DUP group
performed a high volume, low intensity workout; a medium volume and medium intensity workout; and a low vol-
ume, high intensity workout each week. Results: Statistical analysis showed that there was a significant difference
between the pre and post test results for both training models (p<0.05), with the DUP group producing a slightly
higher strength increase as compared to the LP group, however there was no statistically significant difference
found between the training interventions (p>0.05). Conclusions: DUP as well as LP will produce a significant training
effect when implemented in a collegiate strength training program in a six week training cycle. Practical Applica-
tions: This research study provides strength coaches scientific affirmation that different periodization models are an
effective means of resistance training design for collegiate athletes. Both DUP and LP have been shown to increase
muscular strength in the bench press in this population. This information gives the strength and conditioning
coach some latitude in program design. Theoretically, variety in program design can alleviate the monotony that
may occur during strength training for advanced athletes.
NSCA National Conference & Exhibition Abstracts 3
The Effect Of Music Listening On Running Performance And Rating Of Percieved Exertion Of College Students
Randy Bonnette, Morgan C. Smith III, Frank Spaniol, Don Melrose, Liette Ocker
PURPOSE: To investigate the effect listening of music has on running performance and rating of perceived exertion
of college students. METHODS: Twenty-eight undergraduate kinesiology students (17 males, 11 females; age = 22.9
+/- 5.9 yrs) were studied to determine if running performance and rating of perceived exertion were affected by lis-
tening to music. Running performance (RP) was measured by a 1.5mile run. Two trials were performed, the first was
a running performance without music listening (RPWOML = 12.94 +/- 3.35 min) and the second trial was a running
performance while music listening (RPWML = 12.50 +/- 2.48 min). The second trial was measured five days post the
initial trial. Listening to music (music listening) was defined as the subject’s self selection of music tracks and use of
a personal digital audio player (eg., Ipod and MP3) during exercise. Perceived exertion without music listening (PE-
WOML = 14.7 +/- 1.3) and perceived exertion with music listening (PEWML = 15.2 +/- 2.4) was measured by the Borg
6 to 20 RPE scale. RESULTS: Data analysis was performed on the raw data by utilizing dependent t-tests to calculate
and compare sample means. Statistical analyses determined a significant difference (p < .05) between running per-
formance without music listening (RPWOML = 12.94 +/- 3.35 min) and running performance with music listening
(RPWML = 12.50 +/- 2.48 min). However, no significant difference (p < .05) was determined between perceived exer-
tion without music listening (PEWOML = 14.7 +/- 1.3) and perceived exertion with music listening (PEWML = 15.2
+/- 2.4) as measured by the Borg 6 to 20 RPE scale. CONCLUSIONS: The results of this study indicate that music listen-
ing has a significant effect on running performance during a maximal 1.5 mile run. However, music listening had no
significant effect on rating of perceived exertion during a maximal 1.5 mile run. PRACTICAL APPLICATION: Coaches,
athletes, and traditional exercisers should consider music listening to enhance aerobic running performance.
Comparison Of Acute Exercise Responses During Single Versus Competitive Bouts Of
Isometric Resistance Exergaming
Anthony J. Bonetti, Dan Drury PhD, Jerome Danoff PhD, Todd Miller PhD
Purpose: Exergaming is a relatively new area of entertainment that couples physical activity and video gaming.
To date, research that has focused on the physiological responses to Exergaming has been focused exclusively on
aerobic-type activities. The purpose of this project was to describe the acute exercise responses (i.e. VO2, Heart
Rate, & RPE) to Exergaming using full-body isometric muscle resistance, and to determine whether these responses
are different during single versus opponent based play. Methods: Male subjects (n=32) were randomly and equally
divided into either an Experimental (EXP) or Control (CON) group. Acute exercise responses (VO2, Heart Rate, and
RPE) were measured in all subjects during both solo and opponent-based video game play. Subjects in the EXP
group played using a game controller that relied on full body isometric muscle resistance to manipulate the on
screen character, while CON subjects used a conventional hand held controller. Results: There were no differences
in the exercise response within groups between single and competitive play. Results between groups during solo
play are presented in the following table, and are expressed as means±SD:
VO2 (ml/kg/min)Heart Rate
(BPM)
Energy Expendi-
ture (kcal/min)
RPE
EXP 9.60 0.50* 106 5.2 3.50 0.14* 10.06
CON 5.05 0.16 89 4.3 1.92 0.07 7.56
*Represents significant difference between CON
Conclusion: These results suggest that whole body isometric exergaming results in greater energy expenditure
than conventional video gaming, with no increase in perceived exertion during play. This could have important
implications regarding long term energy expenditure in gamers. Practical Applications: The results of this study
provide support for the use of low intensity isometric activity as a viable means of increasing energy expenditure
during video gaming.
Segmental Limb Length And Vertical Jump Height
Tony Black, Bryan Messick, Daniel Cipriani
PURPOSE: To examine the role that lower extremity segmental length plays on vertical jump displacement. Previous research
examining the relationship between segmental limb length and vertical jump ability revealed poor correlations. However, prior re-
search did not use a reliable method to measure jump height (Davis et al, 2006). METHODS: Thirty-one subjects participated (males
= 21, females = 9) with a mean a 21.3 + 1.3 years. All subjects were physical active and engaged in general exercise. Measurements
included height, weight, thigh length, shank (shin) length, truncated foot length, total foot length, and maximum vertical jump
height. Segmental limb lengths were measured according to methods previously described. All measures were repeated twice for
reliability analysis. The Just Jump mat (Probotics Inc.) was used to measure vertical jump height. This jump measure yields reliable
and valid data. The Just Jump estimates vertical jump height, based on the gravitational affect of a projectile using the following:
y = 2[0.5(g)(t2)], where y = vertical displacement, g = acceleration from gravity (-9.81 m/s^2), and t = time of fall from peak height.
Subjects were instructed to jump as high as possible three times on the Just Jump mat. Each of the scores were recorded and the
highest vertical jump value was used in the analysis. Statistical analysis included reliability analysis using the intraclass correlation
coefficient (ICC) as well as Pearson’s correlation to test the relationship between maximum vertical jump height and the different
segmental limb lengths. In addition, segmental length ratios (e.g., thigh:tibia, thigh:foot, height:foot, etc), were also tested for
relationships with vertical jump height. RESULTS: Reliability of the segmental data and the vertical jump data were very good
with all ICC values exceeding 0.75. The ICC for vertical jump measures was 0.96. Statistical analysis demonstrated that maximum
jump height and segmental lengths were gender dependent. Therefore, analysis was separated by gender. For males, maximum
jump height was significantly (p < 0.05) correlated with tibial length (r = -0.33) as well as the ratio of femur:tibia length (r = 0.39)
and height:tibial length (r = 0.40). For females, truncated foot length was correlated with jump height (r = -0.44), as well as the
ratios of femur:truncated foot length (r = 0.43), tibia:truncated foot length (r = 0.52) and height:truncated foot length length (r =
0.48). DISCUSSION: While long limb segments potentially produce greater torque, this is offset by an increase in angular inertia.
Long segments may create a challenge to generate angular velocity for vertical jumping. The fact that truncated foot length
(females) and tibial length (males) were negatively correlated with jump height suggest that limb length may influence vertical
jump ability. These findings contradict earlier research. However, this present study used a reliable method of vertical jump height,
while the previous research used a questionable method to measure this key outcome. PRACTICAL APPLICATION: Athletes with
long feet (relative to height) and/or long tibia length (relative to height) may be at a mechanical disadvantage for vertical jump
ability. Screening such athletes in order to consider additional jump training may allow these athletes to maximize their jumping
potential.
Rate Of Velocity Development For Knee Extensors: Crossover To Untrained Speeds
Laurie Black, Stephen B. Kelly, Lee E. Brown, Jared W. Coburn, Diamond Nguyen, Daniel J. Dodd, Brent A. Alvar
Rate of velocity development is the measured range of motion traveled from 0 to the target velocity, therefore, a
lower value equates to greater limb acceleration. The time it takes to reach max velocity is a critical component
to success for athletes. This may contribute to converting the foundation of strength into performance velocity,
which is essential in sport performance. PURPOSE: The purpose of this study was to examine whether training at
a low velocity with single versus multiple set protocols had a differential effect on rate of velocity development in
the knee extensors at a faster isokinetic speed. METHODS: Forty subjects were randomly assigned into one of three
groups: control (C; n=7), single set (SS; n=14), or multiple sets (MS; n=19) to perform 8 maximal knee extensions at
60 d/s on an Biodex System 3 isokinetic dynamometer twice a week for eight weeks. The SS group performed one
set while the MS group performed three sets. All groups were tested pre, mid (4 weeks), and post tested at 60d/s
and 180 d/s. RESULTS: A 3x3x2 (Group x Time x Speed) mixed factor repeated measures ANOVA revealed a Group x
Time interaction (p < 0.05). A Tukey post hoc comparison determined that the MS group demonstrated significant
(6.36+ 1.66, p = 0.023) decreases in rate of velocity development at 180d/s as compared to the control group at
the final testing period (8 weeks). There were no significant group differences at baseline or mid-testing (4 weeks);
however, there was a trend toward improvement in both single and multiple set groups from baseline (SS, 6.98 +
1.37; MS, 6.73 + 1.03) to 8 weeks (SS, 6.88 + 1.41; MS, 6.36 + 1.66). The control group showed increases in rate of
velocity development from baseline (7.44 + 1.31) to 8 weeks (8.20 + 1.58). There were no significant differences at
any time in any group at 60d/s. CONCLUSIONS: It was concluded that both single and multiple sets of isokinetic
knee extension were superior to the non-trained control condition in non specific velocity training for improving
rate of velocity development; however, only multiple set training incurred a significant decrease from the control
group. PRACTICAL APPLICATIONS: Rate of velocity development is essential in sport performance as the goal of
athletes should always be to reach maximal velocity in the shortest amount of time. This study suggests that while
both multiple and single set protocols decreased rate of velocity development, multiple set training may be more
efficacious for eliciting greater changes in the given training period.
NSCA National Conference & Exhibition Abstracts 4
Measurement Of Body Composition And Athletic Performance During NCAA-Division I Women’s Volleyball And Softball Seasons
Sarah Cahill, Margaret T. Jones
PURPOSE: The current study was designed to assess the relationship between body composition and performance testing in
NCAA-Division I volleyball and softball athletes. METHODS: Subjects consisted of NCAA- Division I female volleyball (VB, n=16) and
softball (SB, n=18) athletes. Body composition utilizing air displacement plethysmography (Bod Pod) and performance testing
[vertical jump (VJ), hang clean (HC), bench press (BP), front squat (FS), pro agility (PRO: SB only), t-test (TT: VB only), and 300 yd
shuttle run (SR)] were measured immediately following completion of a 4 month off-season training program. Data were analyzed
by correlating body fat with performance testing results. Pearson product moment correlation coefficients were computed for
each group individually, to determine if there was a relationship between body composition and performance variables. RESULTS:
VB athletes A significant positive correlation (p ≤ .05, r=0.45) was found between SR times and body composition among the VB
group. Therefore, the higher the body fat percentage among VB athletes, the slower the SR time. SB athletes A significant negative
correlation (p ≤ .05, r= - 0.45) was found between body composition and VJ with the SB athletes. Additionally, a significant positive
correlation (p ≤ .01, r=0.79) was found between body composition and PRO run times with SB. A significant positive correlation
(p ≤ 0.01, r=0.72) was found between body composition and SR times among the SB group. BP, FS and HC were not significantly
related to body composition for either VB or SB groups. CONCLUSIONS: In conclusion, a significant relationship was found between
body composition and certain performance tests for both SB and VB groups. However, the strength of the relationship between
variables in the VB group was not as strong as that observed with the SB group. VB is a sport that requires players to execute similar
skills while utilizing quick, reactive multi-directional, movements in a relatively small court. VB athletes tend to have similar body
types. Ugarkovic (2) concluded body composition is a weak predictor of performance in sports with athletes of relatively homoge-
neous body types. Significant relationships were found in the SB group between body composition and the PRO, VJ and SR tests.
Unlike the sport of VB, the demands of SB (and baseball) differ by position, resulting in more heterogeneous body types (1). For
example, outfielders are more likely to require greater speed than pitchers or catchers in order to move to the ball and catch it out
of the air. In-fielders require better agility and faster reaction time. PRACTICAL APPLICATION: The leaner SB players performed
better on the running and agility tests. Therefore, body composition data may be utilized by coaches to determine the most ap-
propriate positional roles for their athletes. Future research that addresses the relationship between body composition and injury
may provide a broader understanding of the importance of implementing proper nutrition, strength training, and conditioning
programs prior to and during competitive athletic seasons.
Exercise As A Factor In The Job Satisfaction Of Law Enforcement Officers
Eric Bruce, MS
It is generally known that exercising is a factor in the improvement of an individual’s lifelong wellness. Physical
activity has been shown to have a positive impact on an individual’s job satisfaction. But there is no literature that
has investigated the impact of physical activity and job satisfaction on law enforcement officers. PURPOSE: To de-
termine if exercising is a factor in the job satisfaction of law enforcement officers. METHODS: A questionnaire was
constructed using extant theory of job satisfaction and exercise. The demographics questions will ask the officers
to evaluate themselves on a nominal scale of yes/no on whether they exercise or not. The researcher developed
the demographics and exercise sections of the survey. The job satisfaction section of the survey (which contains
seven statements about job satisfaction) was developed and adapted from an online job satisfaction survey found
on www.careervision.org. The researcher distributed an anonymous survey entitled, “Law Enforcement Officers Ex-
ercise and Job Satisfaction Survey” to law enforcement officers who volunteer to be part of the study. Distribution
of the survey took take place at the end of each briefing before the officer goes on patrol, within a twenty-four
hour period. During that period, there will be five patrol shifts of officers (various day and swing shifts), one shift
called, “Community Response Team” which deals with undercover drug crimes (vice squad), and a shift of “Criminal
Investigations Unit”, (better known as detectives unit) that will be voluntarily asked to take part in the study. The
twenty-four hour window to distribute the survey is to ensure that an officer will not fill out a survey twice. RESULTS:
Fifty-six surveys were successfully completed for results and analysis. Forty-six (82.1%) subjects answered, “yes” to
being current exercisers and ten (17.9%) subjects answered “no” to being current exercisers. A high frequency of
positive responses from the subjects to job satisfaction statements was noted. CONCLUSIONS: Three key findings
were found in regards to the answers supplied by law enforcement officers in this study. First, the rate of physical
activity adherence by law enforcement officers compared to the general population of the United States. Secondly,
that a majority of law enforcement officers are satisfied with their jobs. Finally, survey items that measured job
satisfaction indirectly did not directly correlate with the officer’s exercise and job satisfaction responses. PRACTICAL
APPLICATIONS: These findings suggest that law enforcement agencies should promote officer participation in regu-
larly scheduled physical activity to increase job satisfaction. For an officer, physical activity can improve quality of
life and reduce the risk of injury during stressful situations on duty. From an administrators view, increased physical
activity and increased job satisfaction are links to decreased use of benefit dollars for sick leave and overtime pay.
The Effect of Gender on Functional Deficits During Selected Tests for ACLR Patients
Jensen Brent, Gregory D. Myer, Kevin R. Ford, Kim D. Foss, Bradley J. Scherer, Laura C. Schmitt, Jon G. Divine, Robert S. Heidt Jr., Timothy E. Hewett
Female athletes are 4 to 6 times more likely to suffer an injury to their anterior cruciate ligament (ACL) com-
pared to male athletes. Previous studies indicate that following ACL reconstruction (ACLR) surgery and reha-
bilitation, functional deficits persist in female athletes longer than males. Thus, it is important to identify sex spe-
cific tests that are sensitive to persistent deficits in females in order to determine readiness to return to sport.
PURPOSE: The purpose of this study was to determine if there was an effect of sex on the performance of predic-
tive tests developed to identify functional deficits and determine readiness for athletes to return to sport follow-
ing ACLR and rehabilitation. The hypothesis was that unilateral tests of functional ability would show deficits in
the involved limb of females and not for males in athletes cleared for return to unrestricted sport participation.
METHODS: Seventeen females (17.1 ± 1.3 yrs, 166.5 ± 5.3 cm, 60.5 ± 8.0 kg) and ten males (17.4 ± 2.0 yrs, 181.9 ± 6.0 cm, 98.0 ± 17.6 kg)
who returned to their sport within a year following ACLR were matched to control subjects (CTRL) based on sex, sport, age, mass, and
height. Functional performance was tested in broad jump, vertical jump, long shuttle, pro shuttle, modified agility test (MAT), timed
hop, triple hop, single hop and cross-over hop. A mixed-design repeated measures ANOVA (2X2) was used to test for the main effect
and interactions of group (ACLR vs. CTRL) side (involved vs. uninvolved) on the dependant performance variables for both genders.
RESULTS: There were no effects of limb involvement or group in either sex for the broad jump, vertical jump, long shuttle, pro
shuttle, timed hop and MAT (p>0.05), which indicated that athletic ability was similar between groups. Two single leg tests,
triple hop and cross-over hop, showed a significant interaction and a decrease in the involved limb of ACLR (p<0.05) for fe-
males, but not for males. Single hop showed a significant decrease in the involved limb for both males and females (p<0.05).
CONCLUSIONS: The study hypothesis was supported by the findings, as females with ACLR demonstrated de-
creased performance in unilateral tests in the involved limb, while males with ACLR did not, when both were
compared to controls. These results indicate that unilateral hopping tasks should be utilized in females in or-
der to identify functional deficits that should be targeted for further rehabilitation before full return to sport.
PRACTICAL APPLICATIONS: As strength and conditioning professionals become more involved in the post ACLR re-
habilitation process, understanding of objective criteria for measuring readiness to return to sports becomes of para-
mount importance. These findings indicate that sex differences exist in ACLR patients and should be considered to
determine an athlete’s ability to participate in unrestricted sport participation. Sports medicine professionals should em-
phasize correcting side to side deficits in female athletes during post ACLR rehabilitation and return to sport training.
ACKNOWLEDGEMENTS: The authors would like to acknowledge funding support from National Institutes of Health Grant R01
AR049735 and R01 AR055563.
Physiological Differences In Mixed Martial Artist And Traditional Martial Artists: A Pilot Study
Michael T. Braswell, David J. Szymanski, Jessica M. Szymanski, Erin E. Dixon, Shane T. Gilliam, Roy J. Wood, Andrew T. Britt and Charles F. Cicciarella
PURPOSE: To determine the difference, if any, in the physiological characteristics of mixed martial arts athletes and
traditional martial arts athletes. METHODS: Twelve male participants age 18 to 36 yr volunteered for the study.
Group 1 (n = 6) was comprised of professional and amateur mixed martial artists from northern Louisiana. Group
2 (n = 6) was traditional martial artists recruited from a local karate tournament. Each group performed the same
tests. Tests included height, weight, body composition (TanitaTM bioelectrical impedance device), flexibility (sit and
reach), leg power (vertical jump), muscular endurance (1-minute push-up and 1-minute sit-up), grip strength (20.5
kg plate hold), muscular strength (1 rep max bench press), and VO2 max. RESULTS: Body composition was the only
significant difference (p < 0.05) between the 2 groups. CONCLUSION: The mixed martial artists were significantly
leaner than the traditional martial artists. This was not surprising because class separation for traditional martial art-
ists goes by age rank, while mixed martial arts competition is broken down into weight classes. In order to compete
in a lower weight class, mixed martial artists reduce their body mass to make a specific weight class. In doing this,
percent body fat is typically reduced. PRACTICAL APPLICATION: There were 2 major limitations to this study. One
was the timing of testing. The traditional martial artists were tested 1-2 hr after competing in a karate tournament,
while the mixed martial artists were tested weeks before their next fight. The other limitation was the number of
participants. Though only one significant difference was found between the groups, it can be suggested that a high
level of physical fitness is essential for performance in mixed martial arts and traditional martial art competitions.
Mixed martial artists usually train at high intensities with various forms of interval training to improve their aerobic
capacity. This helps condition them for their fights. Although VO2max was not found to be significantly different
between the 2 groups, there was a trend for the mixed martial artists having higher aerobic capacities. Had there
been more participants and lower standard deviations for VO2max, this variable may have been significantly differ-
ent. Future studies should attempt to test the groups during the same time frame, have more participants, measure
psychological characteristics, and consider using a DXA scan to measure bone mineral density. Acknowledgments:
We would like to thank Dr. David Jordan for letting us use his tournament to recruit participants.
NSCA National Conference & Exhibition Abstracts 5
Anthropometric And Physical Performance Characteristics Of Elite Male Wheelchair Basketball Athletes
Dale Chapman, Dr, Sacha Fulton, Clare Gough
Purpose: Wheelchair basketball is a popular Paralympic sport; however there is a paucity of research describing the physical qualities of elite wheelchair athletes. The objective of this study was to provide
anthropometric and physical performance characteristics from field tests of elite male basketball players. Methods: Data was collected during two training camps for a national wheelchair basketball squad
(n=19) as part of periodic physical conditioning evaluation. Athletes were only included in the analysis if they were free of injury and illness at the time of testing and were able to complete the entire test
battery. Athletes were requested to use the same wheelchair configuration throughout each testing session. All provided written informed consent and testing was approved by the ethics committee of
the Australian Institute of Sport. Anthropometric assessment (seated height, weight, arm span and ∑4 skinfolds) and field-based tests; 20 m sprint speed, Wheelchair Illinois agility test, 10 m speed agility
(left or right veer), Wheelchair basketball line drill and work capacity push test, were used to determine the physical conditioning status. All testing was performed on an indoor sprung wooden basketball
court with a minimum of five minutes rest provided between tests. Strong verbal encouragement was provided to all athletes during each assessment to ensure a maximum effort. Results were examined
in relation to the smallest worthwhile change for each test and relationships between variables were examined using a Pearson’s correlation. Results: There was no significant relationship between an-
thropometric variables of weight, arm span and ∑4 skinfolds and performance in any of these field tests. Strong relationships between tests of short sprint duration (sprint speed, speed agility and Illinois
agility) with the work capacity push test were observed.
Table 1. The anthropometric characteristics and performance results (mean (SD)) for elite male wheelchair basketball athletes (n=19) presented in their ability classification with the smallest worthwhile
change score for each performance measure
Anthropometry Field Tests
Seated height
(m)Weight (kg) Arm span (m)
Skinfold Sum
of 4 sites
(mm)
20 m sprint (s)Illinois agil-
ity (s)
Speed agil-
ity (s)
Basketball line
drill (s)
Work Capacity
Push Test
Classification
1.0 (n=4) 0.865 (0.08) 67.1 (7.7) 1.841 (0.04) 49.9 (6.9) 5.40 (0.34) 25.77 (0.55)L: 3.68 (0.19)
R: 3.59 (0.22)46.40 (2.01) 18.2 (0.9)
1.5 (n=2) 0.869 (0.08) 55.6 (20.1) 1.728 (0.16) 37.8 (19.1) 5.17 (0.24) 25.21 (0.21)L: 3.57 (0.13)
R: 3.49 (0.02)44.72 (1.97) 19.6 (1.2)
2.0 (n=2) 0.945 (0.04) 75.0 (9.5) 1.840 (0.18) 81.4 (25.0) 5.37 (0.23) 26.26 (0.01)L: 3.57 (0.04)
R: 3.45 (0.04)48.88 (0.71) 18.1 (0.7)
3.0 (n=3) 0.912 (0.06) 67.8 (16.7) 1.805 (0.14) 56.3 (26.9) 5.20 (0.30) 25.60 (0.75)L: 3.45 (0.15)
R: 3.36 (0.18)46.52 (2.36) 19.6 (1.6)
3.5 (n=1) 0.865 48.0 1.785 24.3 5.77 26.09L: 3.68
R: 3.5947.20 20.25
4.0 (n=4) 0.948 (0.02) 75.6 (11.6) 1.823 (0.10) 51.5 (20.4) 4.83 (0.14) 24.07 (1.22)L: 3.30 (0.06)
R: 3.19 (0.15)43.30 (3.59) 21.8 (0.6)
4.5 (n=3) 1.003 (0.02) 97.2 (15.0) 1.942 (0.03) 56.5 (17.1) 5.01 (0.26) 25.03 (0.90)L: 3.38 (0.21)
R: 3.28 (0.16)42.45 (2.50) 21.1 (1.8)
Mean (n=19) 0.914 (0.07) 71.3 (16.6) 1.829 (0.12) 54.7 (22.0) 5.18 (0.32) 25.33 (0.93)L: 3.49 (0.20)
R: 3.40 (0.21)45.77 (2.51) 19.7 (1.7)
SWC 0.01 3.26 0.02 4.0 0.07 0.19 0.04 0.65 0.32
Conclusions: The lack of observed relationships between anthropometric variables of weight, arm span and ∑4 skinfolds and performance in any of the field tests questions the utility of these measures in
an elite wheelchair athlete population. The lack of relationship indicates that in this elite athlete population, anthropometry measures do not significantly influence the physical requirements of wheelchair
basketball. Logically though strong relationships between performance tests were observed. Practical Applications: This data provides the basis to begin an extensive profiling of elite wheelchair athletes
using reliable and inexpensive field testing protocols. Interestingly the described protocols could become a resource for coaches and scientists to use theses tests as a benchmark for training program
design and talent identification for elite male wheelchair basketball players.
Comparison Of Muscular Strength Gains Utilizing Eccentric, Standard And Concentric
Resistance Training Protocols
Kyle Carothers, Kyle F. Carothers, Brent A. Alvar, Daniel J. Dodd, Jeremy C. Johanson, Brian J. Kincade, &
Stephen B. Kelly
PURPOSE: The purpose of this study was to examine the strength benefits of an eccentric-only protocol versus a standard and
concentric-only protocol in a multi-joint lift (bench press). Additionally, a secondary purpose was to examine the same proto-
col’s ability to elicit power benefits (seated medicine ball put). METHODS: Forty-Two men (mean±SD, age 24.9 ± 5.1 yr., height
71.0 ± 3.0 in, weight 189.2 ± 31.1 lbs) with recreational resistance training experience (>6 months at least two times per week)
performed two sessions a week for 6 weeks utilizing the bench press exercise. Subjects were tested for concentric, standard and
eccentric 1-RM pre and post study. Subjects were randomized into one of three groups, eccentric-only (ECC), standard (ECCON) or
concentric-only (CON). Subjects performed 4 sets of 4-8 repetitions with 80% of their 1-RM in the repetition type characterized by
their group. Subjects moved up 5% when 4 sets of 8 repetitions were completed successfully. Rest time between sets was fixed
at 3-5 minutes. Subjects were also tested for power using a 3-kg seated medicine ball put for distance pre and post study and for
body composition using air density plethysmography (Life Measurement Inc., Bod Pod, Concord, CA). All statistics were analyzed
using SPSS for Windows 15.0 (Chicago, Ill.). Paired sample t-tests were used to test differences pre to post study. One-Way analysis
of variance (ANOVA) was used to analyze percentage differences between groups. Tukey HSD test was used as a post hoc when
necessary. The level of significance for statistical analysis was set at p≤ .05. RESULTS: All three groups significantly increased their
strength from pre to post study (p<.01). No significant between group differences were seen in standard or concentric 1-RM.
Group ECC showed a significantly greater increase in strength over group (ECCON) in eccentric 1-RM (22% vs. 9%). No significant
increases were seen pre to post study or between groups for power. CONCLUSIONS: The significant finding of this study was a
between group difference between group (ECC) and (ECCON) in the eccentric 1-RM. This finding suggests that eccentric-only
protocols preferentially increase strength development over standard protocols. Standard protocols are commonly utilized in ath-
letic resistance training protocols. This finding becomes even more significant when considering the magnitude of the gain (22%
in only 6 weeks) with a recreationally-trained group of participants. Increases of this magnitude are usually attributed to neural
changes in untrained subjects. PRACTICAL APPLICATIONS: These results suggest that eccentric muscle actions are underutilized
in standard resistance training protocols. This evidence could indicate that athletes possessing low levels of eccentric strength
may have a diminished capability to perform the stretch-shortening cycle (SSC); the SSC is a sequence of movements utilizing an
eccentric muscle action immediately followed by a concentric muscle action in order to produce a more forceful concentric muscle
action. The SSC is commonly used in athletic activities like running, jumping and throwing. Future research should examine the
ability of eccentric-only resistance training protocols to elicit performance benefits in athletic populations especially as it relates
to increasing the capability of the SSC.
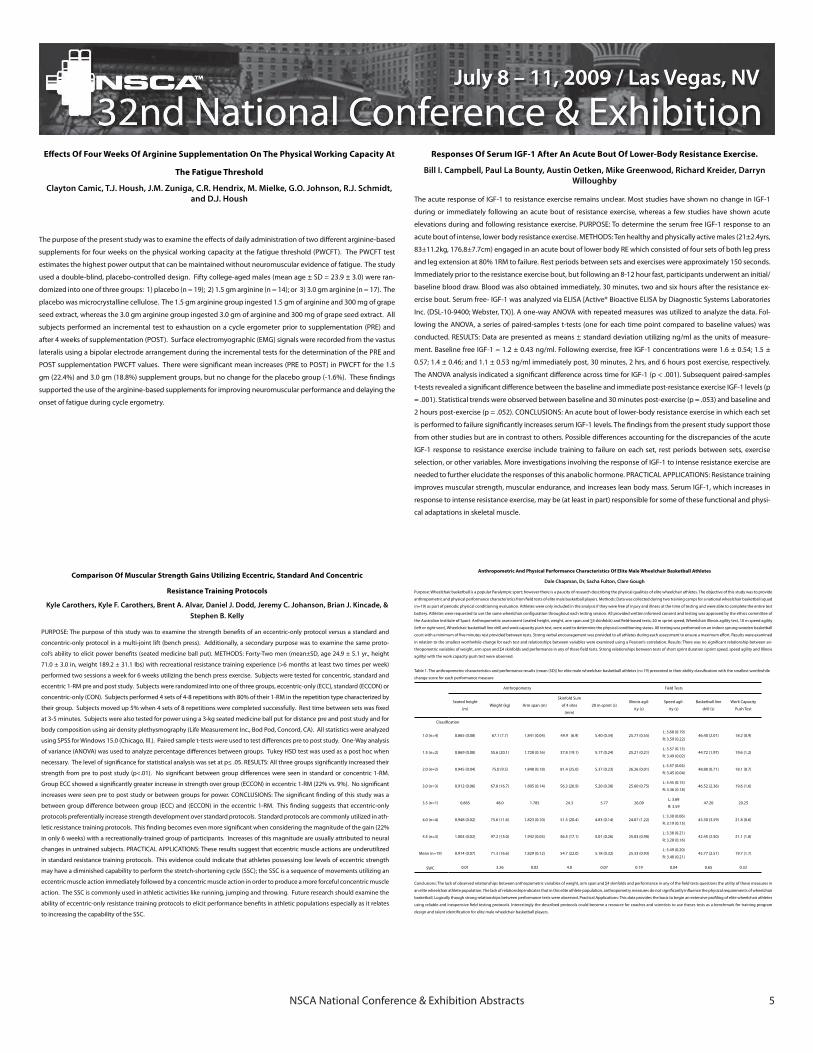
Responses Of Serum IGF-1 After An Acute Bout Of Lower-Body Resistance Exercise.
Bill I. Campbell, Paul La Bounty, Austin Oetken, Mike Greenwood, Richard Kreider, Darryn Willoughby
The acute response of IGF-1 to resistance exercise remains unclear. Most studies have shown no change in IGF-1
during or immediately following an acute bout of resistance exercise, whereas a few studies have shown acute
elevations during and following resistance exercise. PURPOSE: To determine the serum free IGF-1 response to an
acute bout of intense, lower body resistance exercise. METHODS: Ten healthy and physically active males (21±2.4yrs,
83±11.2kg, 176.8±7.7cm) engaged in an acute bout of lower body RE which consisted of four sets of both leg press
and leg extension at 80% 1RM to failure. Rest periods between sets and exercises were approximately 150 seconds.
Immediately prior to the resistance exercise bout, but following an 8-12 hour fast, participants underwent an initial/
baseline blood draw. Blood was also obtained immediately, 30 minutes, two and six hours after the resistance ex-
ercise bout. Serum free- IGF-1 was analyzed via ELISA [Active® Bioactive ELISA by Diagnostic Systems Laboratories
Inc. (DSL-10-9400; Webster, TX)]. A one-way ANOVA with repeated measures was utilized to analyze the data. Fol-
lowing the ANOVA, a series of paired-samples t-tests (one for each time point compared to baseline values) was
conducted. RESULTS: Data are presented as means ± standard deviation utilizing ng/ml as the units of measure-
ment. Baseline free IGF-1 = 1.2 ± 0.43 ng/ml. Following exercise, free IGF-1 concentrations were 1.6 ± 0.54; 1.5 ±
0.57; 1.4 ± 0.46; and 1.1 ± 0.53 ng/ml immediately post, 30 minutes, 2 hrs, and 6 hours post exercise, respectively.
The ANOVA analysis indicated a significant difference across time for IGF-1 (p < .001). Subsequent paired-samples
t-tests revealed a significant difference between the baseline and immediate post-resistance exercise IGF-1 levels (p
= .001). Statistical trends were observed between baseline and 30 minutes post-exercise (p = .053) and baseline and
2 hours post-exercise (p = .052). CONCLUSIONS: An acute bout of lower-body resistance exercise in which each set
is performed to failure significantly increases serum IGF-1 levels. The findings from the present study support those
from other studies but are in contrast to others. Possible differences accounting for the discrepancies of the acute
IGF-1 response to resistance exercise include training to failure on each set, rest periods between sets, exercise
selection, or other variables. More investigations involving the response of IGF-1 to intense resistance exercise are
needed to further elucidate the responses of this anabolic hormone. PRACTICAL APPLICATIONS: Resistance training
improves muscular strength, muscular endurance, and increases lean body mass. Serum IGF-1, which increases in
response to intense resistance exercise, may be (at least in part) responsible for some of these functional and physi-
cal adaptations in skeletal muscle.
Effects Of Four Weeks Of Arginine Supplementation On The Physical Working Capacity At
The Fatigue Threshold
Clayton Camic, T.J. Housh, J.M. Zuniga, C.R. Hendrix, M. Mielke, G.O. Johnson, R.J. Schmidt, and D.J. Housh
The purpose of the present study was to examine the effects of daily administration of two different arginine-based
supplements for four weeks on the physical working capacity at the fatigue threshold (PWCFT). The PWCFT test
estimates the highest power output that can be maintained without neuromuscular evidence of fatigue. The study
used a double-blind, placebo-controlled design. Fifty college-aged males (mean age ± SD = 23.9 ± 3.0) were ran-
domized into one of three groups: 1) placebo (n = 19); 2) 1.5 gm arginine (n = 14); or 3) 3.0 gm arginine (n = 17). The
placebo was microcrystalline cellulose. The 1.5 gm arginine group ingested 1.5 gm of arginine and 300 mg of grape
seed extract, whereas the 3.0 gm arginine group ingested 3.0 gm of arginine and 300 mg of grape seed extract. All
subjects performed an incremental test to exhaustion on a cycle ergometer prior to supplementation (PRE) and
after 4 weeks of supplementation (POST). Surface electromyographic (EMG) signals were recorded from the vastus
lateralis using a bipolar electrode arrangement during the incremental tests for the determination of the PRE and
POST supplementation PWCFT values. There were significant mean increases (PRE to POST) in PWCFT for the 1.5
gm (22.4%) and 3.0 gm (18.8%) supplement groups, but no change for the placebo group (-1.6%). These findings
supported the use of the arginine-based supplements for improving neuromuscular performance and delaying the
onset of fatigue during cycle ergometry.
NSCA National Conference & Exhibition Abstracts 6
The Long-Term Effects Of Resisted Sprint Training Using Weighted Sleds Versus Weighted Vests
Kenneth Clark, Cory Walts, Anthony Miller, David Stearne
Linear sprinting is composed of acceleration and maximum velocity (MV) phases, and improving performance in each phase
may require specific training methods. Although resisted sprint training using weighted sleds (WS) or weighted vests (WV) has
recently become common practice, empirical evidence supporting their effectiveness for improving MV sprint performance is
lacking. Furthermore, it has been suggested that these modalities may have different long-term effects on sprint kinematics,
with WS potentially increasing stride length and WV decreasing ground-contact time and thus increasing stride rate. PURPOSE:
To determine the long-term effects of WS and WV training on MV sprint performance and kinematic parameters. METHODS: 20
male NCAA Division-III lacrosse players (age: 19.82 ± 0.95 years, mass: 83.13 ± 11.69kg) voluntarily participated as part of their
off-season training program. Subjects were randomly divided into a WS group (n = 7), a WV group (n = 6), and an unresisted (UR)
active control group (n = 7). All subjects completed 13 60-minute training sessions over a 7-week period. WS subjects towed loads
of 10% body mass, and WV subjects were loaded with 18.5% body mass. Pilot testing indicated these loads elicited acute decreases
in MV approaching 10% and thus were appropriate for long-term training based on recommendations from the literature. Pre- and
post-test measures of sprint time and average velocity across the distance interval of 18.3-54.9m were used to assess MV sprint
performance, while high-speed video (300 Hz) and motion-analysis software were used to analyze kinematic measures of stride
length (SL), stride rate (SR), average step ground time (GT), and average step flight time (FT). RESULTS: A 3 (training group) x 2
(time) repeated measures ANOVA revealed no significant between-group differences for either 18.3-54.9m sprint times or average
velocities. Effect size statistics (ES) suggested small improvements in average velocity for the UR group (ES = 0.63) but only trivial
improvements for the WS (ES = 0.02) and WV groups (ES = 0.24). A 3 x 2 repeated measures ANOVA also revealed no significant be-
tween-group differences for any of the kinematic stride cycle measures. Effect size statistics suggested small increases in SR (ES =
0.42) and decreases in GT (ES = 0.38) for the UR group, small decreases in SL (ES = 0.42) for the WS group, as well as small decreases
in SL (ES = 0.37), moderate increases in SR (ES = 0.78), and large decreases in FT (ES = 1.00) for the WV group. CONCLUSIONS: The
results indicate that WS and WV training had no beneficial effect compared with UR training. In fact, for the loads employed by WS
and WV in this study, UR training may actually be superior for improving MV sprint performance in the 18.3-54.9m interval. Also of
note, the WS group did not demonstrate significant increases in SL and the WV group did not demonstrate significant decreases
in GT as expected. PRACTICAL APPLICATIONS: For the loading schemes employed in this study, the results suggest that MV sprint
performance might be most effectively enhanced by UR training protocols. Future research should be directed at manipulating
the resistance load for the WS and WV groups to explore the effects of lighter loads that more closely match the kinematics of UR
sprinting or heavier loads that increase the resistive training stimulus. ACKNOWLEDGEMENT: This investigation was supported by
an NSCA Student Research Grant.
Assessing Weightlifting Bar Mechanical Characteristics
Loren Chiu, PhD, CSCS
Weightlifting bars are among the most versatile implements in strength and conditioning, allowing numerous exercises, such
as squats, cleans and snatches to be performed. Although generally considered a rigid object, empirical evidence and recent
research indicates that the weightlifting bar deforms when loaded and/or is lifted with sufficient velocity. PURPOSE: The purpose
of this investigation was to assess the mechanical characteristics of eight weightlifting and one general purpose weight training
bar. METHODS: Bar deformation was tested using a modified four-point bending method. Portable squat stands were placed
66.2cm apart and bars centered across the stands to simulate the pulling phase of the clean. Bars were loaded and unloaded
in two cycles by adding 25kg rubber bumper plates. Plates were added in pairs (i.e. left and right ends), allowed to settle for 1
minute, and an image was taken using a digital camera. Deformation of bars was determined as the difference in height between
the center of the bar and a horizontal line through the left and right ends of the bar. Bending moment about the center of the bar
was estimated using static calculations. Apparent barbell stiffness was calculated as the slope of bar deformation (x-axis) versus
bending moment (y-axis) plots. RESULTS: All bars displayed linear hysteresis plots, characteristic of elastic (such as steel) rather
than viscoelastic materials. Three of the bars, the make of which have been used in elite international competition (i.e. world
is reported by weightlifters to have the greatest spring. Alternately, the bars used for the high end of the criterion are reported to
have a high stiffness, thus the current data support these subjective reports. As these bars have been used in elite international
competition, they can be used as a criterion for bar mechanical characteristics. Bars with an apparent stiffness between these bars
would be appropriate for use when performing weightlifting exercises, such as in an athletic performance training program. Bars
with greater apparent stiffness may not be appropriate for weightlifting exercises, but may be used when less bar deformation is
-
ate for weightlifting exercises. Appropriate equipment should be used for exercises such as cleans, snatches, and jerks,to allow
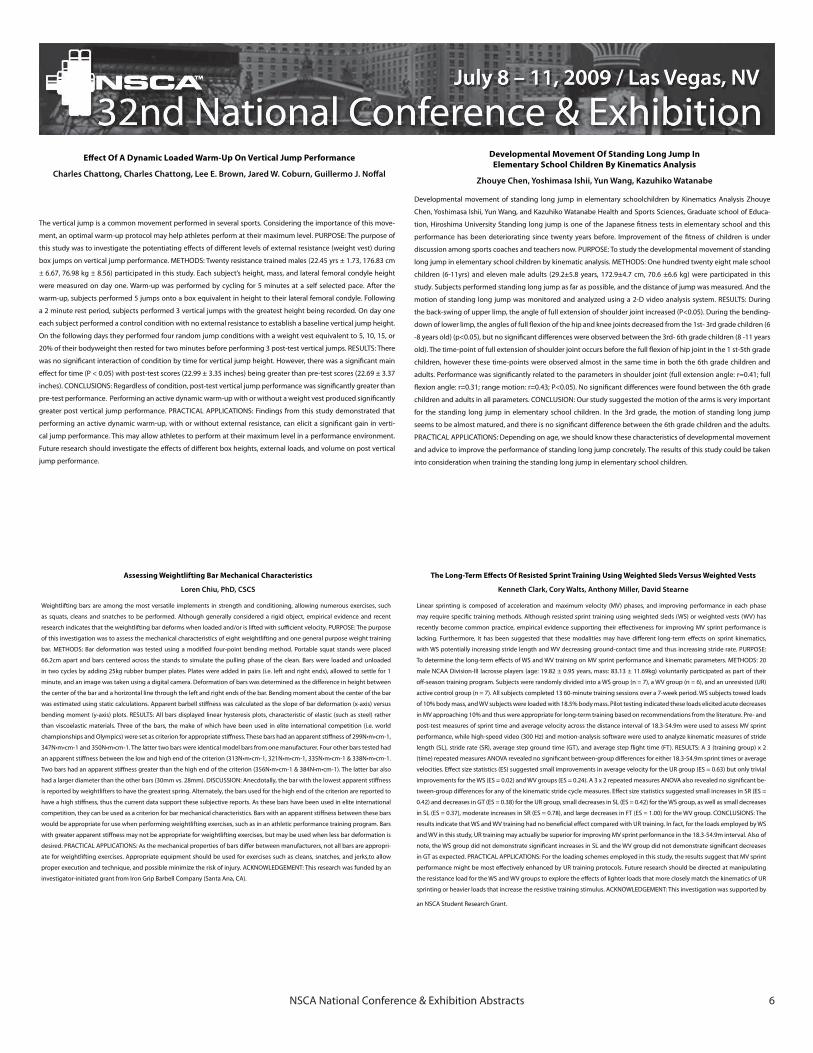
Developmental Movement Of Standing Long Jump In Elementary School Children By Kinematics Analysis
Zhouye Chen, Yoshimasa Ishii, Yun Wang, Kazuhiko Watanabe
Developmental movement of standing long jump in elementary schoolchildren by Kinematics Analysis Zhouye
Chen, Yoshimasa Ishii, Yun Wang, and Kazuhiko Watanabe Health and Sports Sciences, Graduate school of Educa-
tion, Hiroshima University Standing long jump is one of the Japanese fitness tests in elementary school and this
performance has been deteriorating since twenty years before. Improvement of the fitness of children is under
discussion among sports coaches and teachers now. PURPOSE: To study the developmental movement of standing
long jump in elementary school children by kinematic analysis. METHODS: One hundred twenty eight male school
children (6-11yrs) and eleven male adults (29.2±5.8 years, 172.9±4.7 cm, 70.6 ±6.6 kg) were participated in this
study. Subjects performed standing long jump as far as possible, and the distance of jump was measured. And the
motion of standing long jump was monitored and analyzed using a 2-D video analysis system. RESULTS: During
the back-swing of upper limp, the angle of full extension of shoulder joint increased (P<0.05). During the bending-
down of lower limp, the angles of full flexion of the hip and knee joints decreased from the 1st- 3rd grade children (6
-8 years old) (p<0.05), but no significant differences were observed between the 3rd- 6th grade children (8 -11 years
old). The time-point of full extension of shoulder joint occurs before the full flexion of hip joint in the 1 st-5th grade
children, however these time-points were observed almost in the same time in both the 6th grade children and
adults. Performance was significantly related to the parameters in shoulder joint (full extension angle: r=0.41; full
flexion angle: r=0.31; range motion: r=0.43; P<0.05). No significant differences were found between the 6th grade
children and adults in all parameters. CONCLUSION: Our study suggested the motion of the arms is very important
for the standing long jump in elementary school children. In the 3rd grade, the motion of standing long jump
seems to be almost matured, and there is no significant difference between the 6th grade children and the adults.
PRACTICAL APPLICATIONS: Depending on age, we should know these characteristics of developmental movement
and advice to improve the performance of standing long jump concretely. The results of this study could be taken
into consideration when training the standing long jump in elementary school children.
Effect Of A Dynamic Loaded Warm-Up On Vertical Jump Performance
Charles Chattong, Charles Chattong, Lee E. Brown, Jared W. Coburn, Guillermo J. Noffal
The vertical jump is a common movement performed in several sports. Considering the importance of this move-
ment, an optimal warm-up protocol may help athletes perform at their maximum level. PURPOSE: The purpose of
this study was to investigate the potentiating effects of different levels of external resistance (weight vest) during
box jumps on vertical jump performance. METHODS: Twenty resistance trained males (22.45 yrs ± 1.73, 176.83 cm
± 6.67, 76.98 kg ± 8.56) participated in this study. Each subject’s height, mass, and lateral femoral condyle height
were measured on day one. Warm-up was performed by cycling for 5 minutes at a self selected pace. After the
warm-up, subjects performed 5 jumps onto a box equivalent in height to their lateral femoral condyle. Following
a 2 minute rest period, subjects performed 3 vertical jumps with the greatest height being recorded. On day one
each subject performed a control condition with no external resistance to establish a baseline vertical jump height.
On the following days they performed four random jump conditions with a weight vest equivalent to 5, 10, 15, or
20% of their bodyweight then rested for two minutes before performing 3 post-test vertical jumps. RESULTS: There
was no significant interaction of condition by time for vertical jump height. However, there was a significant main
effect for time (P < 0.05) with post-test scores (22.99 ± 3.35 inches) being greater than pre-test scores (22.69 ± 3.37
inches). CONCLUSIONS: Regardless of condition, post-test vertical jump performance was significantly greater than
pre-test performance. Performing an active dynamic warm-up with or without a weight vest produced significantly
greater post vertical jump performance. PRACTICAL APPLICATIONS: Findings from this study demonstrated that
performing an active dynamic warm-up, with or without external resistance, can elicit a significant gain in verti-
cal jump performance. This may allow athletes to perform at their maximum level in a performance environment.
Future research should investigate the effects of different box heights, external loads, and volume on post vertical
jump performance.
NSCA National Conference & Exhibition Abstracts 7
Influence Of Training Status On Power Absorption & Production During Lower Body Stretch-Shorten Cycle Move-ments
Prue Cormie, Michael R. McGuigan, Robert U. Newton
It has been well established that the utilisation of a stretch-shorten cycle (SSC) results in more powerful movements. Extensive investigation has
focused on how concentric phase variables (i.e. maximal power) respond to training interventions. However, there is little research that reports
the impact of training on eccentric phase variables of SSC movements. PURPOSE: 1) Examine if training status affects power absorption (i.e. nega-
tive work, energy flow into the muscles) and production (i.e. positive work, energy flow to the rigid segments); and 2) identify if factors commonly
associated with a SSC (i.e. time between eccentric and concentric phases, rate and magnitude of stretch) affect power absorption and produc-
tion. METHODS: Thirty-two men with previous resistance training experience were randomized into one of four groups based on their squat one
repetition maximum to body weight ratio (1RM:BM): stronger power training group (SP, n=8, 1RM:BM=1.97), weaker power training group (WP,
n=8, 1RM:BM=1.32), weaker strength training group (WS, n=8, 1RM:BM=1.28), or control group (C, n=8, 1RM:BM=1.37). The experimental groups
completed 10 weeks of either explosive jump squat training (SP & WP) or heavy squat training (WS) with the control group maintaining their
normal level of activity. One week prior to initiating training all subjects underwent a familiarization and testing session involving a squat 1RM,
40m sprint, static jump and countermovement jump. Testing was conducted again after week 5 (mid-test) and week 10 (post-test). Data was
collected utilizing a digital camera as well as a linear position transducer and a force plate sampling at 1000Hz and analyzed using previously vali-
dated protocols. RESULTS: Power production (average concentric power) improved significantly (p ≤ 0.05) for each experimental group following
training (SPbaseline= 32±4 W/kg, SPpost= 41±3 W/kg; WPbaseline= 26±3 W/kg, WPpost= 34±3 W/kg; WSbaseline= 26±4 W/kg, WSpost= 32±3
W/kg). More pronounced improvements (p ≤ 0.05) in power absorption (average eccentric power) were observed (SPbaseline= -11±3 W/kg, SP-
post= -15±2 W/kg; WPbaseline= -8±1 W/kg, WPpost= -15±1 W/kg; WSbaseline= -9±3 W/kg, WSpost= -14±3 W/kg). Changes to power absorption
and production appeared to be driven in some part by significant decreases in time to take off and significant changes to force throughout the
movement. Non-significant trends towards increased rate of stretch and decreased magnitude of stretch were also observed. Following training,
significant differences existed between the experimental and control groups in both power absorption and production. SP displayed a non-
significant but practically relevant decrease in 1RM:BM (0.10; effect size = 0.91) after the 10 weeks. CONCLUSIONS: Power training in both strong
and weak individuals resulted in changes to power absorption and production. Increased strength was also associated with an enhanced ability
to absorb and produce power in the absence of any specific power training. The decrease in maximal strength of the SP group may have resulted
in a diminished response to the power training. It remains unclear whether the SP group would have displayed even greater improvements if
strength maintenance sessions were included in the 10 week program. PRACTICAL APPLICATIONS: A foundation of strength prior to initiation of
power training may allow for greater improvement in SSC performance.
Acute Effects Of Passive Stretching On The Electromechanical Delay and Evoked Twitch Properties
Pablo Brando Costa, Katie M. Hoge, Eric D. Ryan, Trent J. Herda, Ashley A. Walter, Travis W. Beck, and Joel T. Cramer
Studies have shown passive stretching may transiently decrease force and alter twitch-related properties. However,
the effects of passive stretching on the electromechanical delay (EMD) are still unknown. PURPOSE: To examine the
acute effects of passive stretching on the EMD, peak twitch force (PTF), rate of force development (RFD), and peak-
to-peak M-wave (PPM) for the soleus muscle during evoked isometric plantar flexion muscle actions. METHODS:
Fourteen men (mean ± SD age = 21.2 ± 2.4 yrs; body mass = 80.0 ± 14.9 kg; height = 176.9 ± 7.2 cm) volunteered for
the study. Five transcutaneous electrical stimuli (each separated by 5 seconds) were delivered to the tibial nerve be-
fore and after passive stretching. The stretching protocol consisted of nine repetitions of passive assisted stretching
designed to stretch the calf muscles. Each repetition was held for 135 seconds with 5-10 seconds of rest between
each passive stretching repetition. An average of three pre- and post-stretching twitches were used to analyze each
variable. Dependent-samples t-tests (pre- vs. post-stretching) were used to analyze the EMD, PTF, RFD, and PPM
data. RESULTS: There were no significant changes (p > 0.05) from pre- to post-stretching for any of the variables, in-
cluding EMD (pre- and post-stretching mean ± SE = 29.9 ± 1.1 and 28.8 ± 1.4 ms), PTF (14.5 ± 1.1 and 14.7 ± 1.1), RFD
(225.1 ± 15.7 and 211.6 ± 19.1), or PPM (3.7 ± 0.5 and 3.4 ± 0.5), CONCLUSIONS: Our findings indicated no significant
stretching-related changes in EMD, PTF, RFD, or PPM. These findings suggested that passive stretching of the calf
muscles did not affect the mechanical aspects of force production from the onset of the electrically-evoked twitch
to the peak twitch force. PRACTICAL APPLICATIONS: These results may help to explain the mechanisms underlying
the stretching-induced force deficit that has been reported as either “mechanical” or “electrical” in origin. These
findings suggested that if there is a stretching-related decrease in muscle force production, it may be more related
to decreases in neural drive (i.e., electrical) than alterations in the mechanical components of muscle contraction.
These findings may also be useful for strength and conditioning professionals who are concerned with the potential
for performance decreases associated with acute passive stretching.
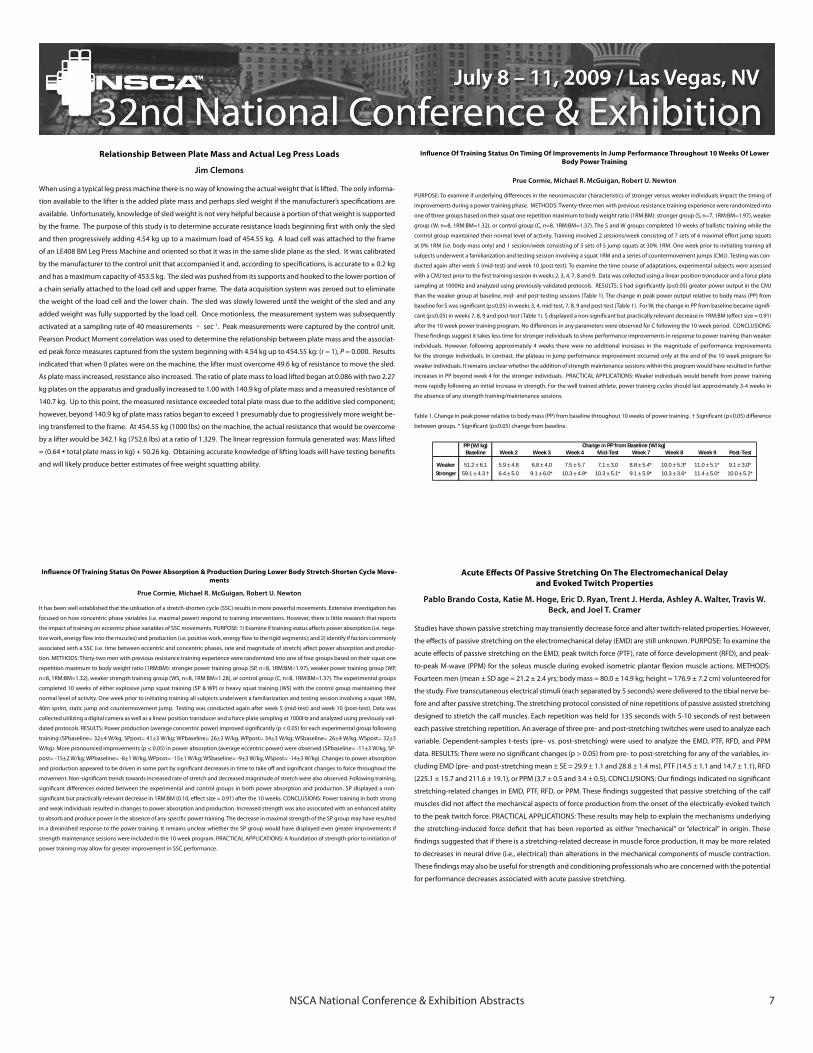
Influence Of Training Status On Timing Of Improvements In Jump Performance Throughout 10 Weeks Of Lower Body Power Training
Prue Cormie, Michael R. McGuigan, Robert U. Newton
PURPOSE: To examine if underlying differences in the neuromuscular characteristics of stronger versus weaker individuals impact the timing of
improvements during a power training phase. METHODS: Twenty-three men with previous resistance training experience were randomized into
one of three groups based on their squat one repetition maximum to body weight ratio (1RM:BM): stronger group (S, n=7, 1RM:BM=1.97), weaker
group (W, n=8, 1RM:BM=1.32), or control group (C, n=8, 1RM:BM=1.37). The S and W groups completed 10 weeks of ballistic training while the
control group maintained their normal level of activity. Training involved 2 sessions/week consisting of 7 sets of 6 maximal effort jump squats
at 0% 1RM (i.e. body mass only) and 1 session/week consisting of 5 sets of 5 jump squats at 30% 1RM. One week prior to initiating training all
subjects underwent a familiarization and testing session involving a squat 1RM and a series of countermovement jumps (CMJ). Testing was con-
ducted again after week 5 (mid-test) and week 10 (post-test). To examine the time course of adaptations, experimental subjects were assessed
with a CMJ test prior to the first training session in weeks 2, 3, 4, 7, 8 and 9. Data was collected using a linear position transducer and a force plate
sampling at 1000Hz and analyzed using previously validated protocols. RESULTS: S had significantly (p≤0.05) greater power output in the CMJ
than the weaker group at baseline, mid- and post-testing sessions (Table 1). The change in peak power output relative to body mass (PP) from
baseline for S was significant (p≤0.05) in weeks 3, 4, mid-test, 7, 8, 9 and post-test (Table 1). For W, the change in PP from baseline became signifi-
cant (p≤0.05) in weeks 7, 8, 9 and post-test (Table 1). S displayed a non-significant but practically relevant decrease in 1RM:BM (effect size = 0.91)
after the 10 week power training program. No differences in any parameters were observed for C following the 10 week period. CONCLUSIONS:
These findings suggest it takes less time for stronger individuals to show performance improvements in response to power training than weaker
individuals. However, following approximately 4 weeks there were no additional increases in the magnitude of performance improvements
for the stronger individuals. In contrast, the plateau in jump performance improvement occurred only at the end of the 10 week program for
weaker individuals. It remains unclear whether the addition of strength maintenance sessions within this program would have resulted in further
increases in PP beyond week 4 for the stronger individuals. PRACTICAL APPLICATIONS: Weaker individuals would benefit from power training
more rapidly following an initial increase in strength. For the well trained athlete, power training cycles should last approximately 3-4 weeks in
the absence of any strength training/maintenance sessions.
Table 1. Change in peak power relative to body mass (PP) from baseline throughout 10 weeks of power training. † Significant (p≤0.05) difference
between groups. * Significant (p≤0.05) change from baseline.
PP (W/kg)Baseline Week 2 Week 3 Week 4 Mid-Test Week 7 Week 8 Week 9 Post-Test
Weaker 51.2 ± 6.1 5.9 ± 4.8 6.8 ± 4.0 7.5 ± 5.7 7.1 ± 3.0 8.8 ± 5.4* 10.0 ± 5.3* 11.0 ± 5.1* 9.1 ± 3.0*
Stronger 59.1 ± 4.3 † 6.4 ± 5.0 9.1 ± 6.0* 10.3 ± 4.9* 10.3 ± 5.1* 9.1 ± 5.9* 10.3 ± 3.6* 11.4 ± 5.0* 10.0 ± 5.2*
Change in PP from Baseline (W/kg)
Relationship Between Plate Mass and Actual Leg Press Loads
Jim Clemons
When using a typical leg press machine there is no way of knowing the actual weight that is lifted. The only informa-
tion available to the lifter is the added plate mass and perhaps sled weight if the manufacturer’s specifications are
available. Unfortunately, knowledge of sled weight is not very helpful because a portion of that weight is supported
by the frame. The purpose of this study is to determine accurate resistance loads beginning first with only the sled
and then progressively adding 4.54 kg up to a maximum load of 454.55 kg. A load cell was attached to the frame
of an LE408 BM Leg Press Machine and oriented so that it was in the same slide plane as the sled. It was calibrated
by the manufacturer to the control unit that accompanied it and, according to specifications, is accurate to 0.2 kg
and has a maximum capacity of 453.5 kg. The sled was pushed from its supports and hooked to the lower portion of
a chain serially attached to the load cell and upper frame. The data acquisition system was zeroed out to eliminate
the weight of the load cell and the lower chain. The sled was slowly lowered until the weight of the sled and any
added weight was fully supported by the load cell. Once motionless, the measurement system was subsequently
activated at a sampling rate of 40 measurements sec-1. Peak measurements were captured by the control unit.
Pearson Product Moment correlation was used to determine the relationship between plate mass and the associat-
ed peak force measures captured from the system beginning with 4.54 kg up to 454.55 kg: (r = 1), P = 0.000. Results
indicated that when 0 plates were on the machine, the lifter must overcome 49.6 kg of resistance to move the sled.
As plate mass increased, resistance also increased. The ratio of plate mass to load lifted began at 0.086 with two 2.27
kg plates on the apparatus and gradually increased to 1.00 with 140.9 kg of plate mass and a measured resistance of
140.7 kg. Up to this point, the measured resistance exceeded total plate mass due to the additive sled component;
however, beyond 140.9 kg of plate mass ratios began to exceed 1 presumably due to progressively more weight be-
ing transferred to the frame. At 454.55 kg (1000 lbs) on the machine, the actual resistance that would be overcome
by a lifter would be 342.1 kg (752.6 lbs) at a ratio of 1.329. The linear regression formula generated was: Mass lifted
= (0.64 total plate mass in kg) + 50.26 kg. Obtaining accurate knowledge of lifting loads will have testing benefits
and will likely produce better estimates of free weight squatting ability.

NSCA National Conference & Exhibition Abstracts 8
The Effects Of A Combined Resistance Training And Cardiovascular Exercise Program In College Females:
Does Order Matter?
Patrick M. Davitt, Jarrett Schanzer, Harisics Tjionas, Joseph Pellegrino, Cynthia A. Jaouhari, Shawn M. Arent
While both resistance training (RT) and cardiovascular (C) exercise have been shown to improve various health and fitness variables, there is still
considerable debate regarding the optimal ordering of these modes of exercise within an exercise bout. It is often assumed that order should be
dictated by the priority of the desired fitness outcomes. PURPOSE: To determine the effects of performing C before RT (C-RT) or RT before C (RT-C)
on strength, VO2max, body composition, and LBM over the course of an 8-week exercise program. METHODS: College females (N = 23, 19.9 + 2.1
yrs; 162.6 + 21.6 cm; 60.9 + 11.8 kg) not engaged in a structured exercise program were randomly assigned to either a C-RT group (n = 13) or an
RT-C group (n= 10). Subjects participated in 4 days of exercise per week over the 8-week study. The C component of the program consisted of 30
min of aerobic exercise at 70-80%HRR, and HR and RPE were monitored continuously. The RT component utilized a 3-way split routine (chest and
back; shoulders, biceps, and triceps; lower body) with subjects performing 3 sets of 8-12 repetitions for 5-6 different exercises using a load equal
to 90-100% 10RM. At the beginning and end of the 8 weeks, all subjects completed 2 days of testing to determine strength, VO2max, and body
composition. 10RM for chest press and leg press was used to determine strength and body composition was measured using air displacement
plethysmography (BODPOD; Life Measurement, Inc.). RESULTS: There were significant improvements in chest press (Pre = 34.4 + 7.3 kg; Post =
46.1 + 8.8 kg; P<.001), leg press (Pre = 76.0 + 30.2 kg; Post = 105.5 + 33.4 kg; P<.001), VO2max (Pre = 38.8 + 6.8 ml·kg-1·min-1; Post = 44.9 + 6.4
ml·kg-1·min-1; P<.001), and LBM (Pre = 43.2 + 6.4 kg; Post = 44.1 + 5.9 kg; P = .005) across both groups over the 8 weeks. Weight also significantly
increased (Pre = 60.9 + 11.8 kg; Post = 61.7 + 10.8 kg; P =.038), but %BF did not change (Pre = 28.4 + 6.5 %; Post = 28.0 + 5.6 %; P =.46). There were
no differences in fitness improvements as a function of group (P>.267). CONCLUSIONS: There were significant improvements in strength, aerobic
capacity, and LBM over an 8-week combined RT and C training program in previously inactive college females. These improvements occurred
regardless of the order in which RT and C were performed. There were no changes in %BF in either group, which may partly be a function of
weight gain often seen in a college population over the course of a semester. PRACTICAL APPLICATIONS: Contrary to popular belief, it appears
that fitness markers improve similarly regardless of the order of RT or C in a 4-day per week workout program. It is possible that differences may
emerge with longer training programs or in a more active population. Given the similarities of fitness outcomes, it appears that the order of RT
and C exercises for beginning exercisers should be organized based on personal preference as well as to facilitate adherence.
Difference in Vertical Jump Performance by Force Production
Nicole Dabbs, Nicole C. Dabbs, Andy V. Khamoui, Diamond Nguyen, Brandon P. Uribe, Tai Tran, Edward Jo, Lee E.
Brown, Jared W. Coburn, Daniel A. Judelson, Guillermo J. Noffal
Vertical jump performance may be influenced by force production thereby improving performance. Purpose: The purpose of this study was to
evaluate the relationship between force production and vertical jump performance. Methods: Forty-eight healthy students (age men 24.68+/-
5.05y women 25.63 +/- 7.92y, height men 177.07 +/- 8.42cm women 167.24 +/- 8.37, body mass men 79.40 +/- 16.10kg women 60.94 +/- 11.68kg)
volunteered to participate in one testing session. Each subject started with a five-minute warm-up on a cycle ergometer at 25W (50rmp). Fol-
lowing warm-up, subjects performed three countermovement vertical jumps with arm swing on the force plate. Dependent variables include
relative peak ground reaction force (GRF), vertical jump height (VJH), take off velocity (TOV) and peak velocity (PV). To ascertain the effects of
force on jump characteristics, investigators divided subjects into two groups: relative GRF greater than the mean and relative GRF less than the
mean. Males and females were analyzed separately. Results: Data were analyzed with one- way ANOVA’s with mean relative GRF (men 21.52
+/- 4.34 N/kg, women 18.86 +/- 3.32 N/kg) as the grouping variable. Comparisons were made on VJH, PV, and TOV. Males possessing relative
GRF greater than the mean exhibited significantly (p>0.05) greater values on all dependent variables compared to males who had relative GRF
less than the mean. However, no significant difference (p>0.05) existed in any variables between females who had relative GRF greater than the
mean and females possessing relative GRF less than the mean. Conclusion: These results indicate that males with greater relative GRF produce
greater vertical jump performance than males with less relative GRF, yet females exhibited no similar relationship in vertical jump performance
in relation to their relative GRF. Males who are greater than the mean vs. males who are less than the mean exhibit differences in vertical jump
performance in relation to relative force production while women who are greater than the mean vs. women who are less than the mean appear
to exhibit no differences in vertical jump performance in relation to relative force production. Practical Application: Females may benefit from
incorporating greater strength work into their training. Utilizing strength training might transfer to enhanced force-generating capabilities of
muscle and increased performance.
Leg Asymmetries During Running In Australian Rules Football Players
With Previous Hamstring Injuries
John Cronin
Asymmetries between lower body limbs during athletic movements are thought to increase the risk of injury and
compromise performance. Very little is known about the magnitude of leg asymmetries during human running,
especially after an acute hamstring injury. Purpose: The purpose of this study was to quantify the magnitude of leg
asymmetries in a number of mechanical variables during running in non-injured and previously injured Australian
Rules football (ARF) players. METHODS: A group of non-injured ARF players (n = 11) and a group of previously
injured ARF players (n = 11; hamstring injuries in previous two years) were compared. The legs of the non-injured
players were classified as dominant and non-dominant whereas the legs of the injured players were classified as
injured or non-injured. The players ran on a non-motorized force treadmill at approximately 80% of their maximum
velocity. Kinetic and kinematic data was collected from 12 consecutive steps. RESULTS: For the non-injured players,
there were no significant differences between dominant and non-dominant legs for any of the variables - hori-
zontal and vertical force production, vertical stiffness, leg stiffness, contact times, impulse, resonance frequency,
positive work and vertical centre of mass displacement. For the injured players, the only variable that was signifi-
cantly (p<0.001) different between the injured and non-injured leg was horizontal force production (175 ± 30 vs.
326 ± 44 N). Furthermore, the injured leg (injured group) produced significantly less horizontal force than either
legs (dominant and non-dominant legs) of the non-injured group (p<0.05), and the non-injured leg produced sig-
nificantly more horizontal force than either legs of the non-injured group (p<0.05). CONCLUSIONS: In the present
study, hamstring injures have an influence on leg asymmetries in horizontal but not vertical force production dur-
ing running at sub-maximal velocities. Furthermore, there may be an increase in horizontal force capability in the
non-injured leg as a possible compensatory adaptation to the hamstring injury. PRACTICAL APPLICATIONS: Given
the high incidence of hamstring injuries and the strength and conditioning coach’s role in rehabilitation of injury
and improvement of performance, it would seem good practice to monitor and improve horizontal force capability
in the hamstring injured athlete.
Effects Of Eccentric Exercise On Injury Occurrence And Optimum Length Of The Knee Flexors And Extensors In Professional Soccer Players
John Cronin
Muscle strains are the most common lower body injuries in professional soccer. Particularly, the biceps femoris and
rectus femoris muscles are thought to be at great risk during fast movements (i.e. sprinting, accelerating, change of
direction, kicking, landing, etc.) due to their bi-articulate design. PURPOSES: The primary objective of this training
study was to determine the effects of eccentric exercise on the optimum length of both the knee flexors and exten-
sors, and to monitor hamstring and quadriceps injuries over the pre-season (i.e. 4 weeks) in professional soccer.
METHODS: Twenty-eight athletes from a professional Spanish soccer team (Division II) were randomly assigned to
an eccentric exercise intervention group (EG) or a control group (CG). Over the intervention two athletes from the
control group suffered quadriceps injuries and two athletes were contracted by other clubs. After these exclusions,
both groups (EG, n = 13; and CG, n = 11) performed regular soccer training during the four week study, which was
conducted during the clubs pre-season. The EG performed an additional 10-15 minutes of eccentric exercise, three
times per week for the four weeks. Isokinetic dynamometry was used to quantify the optimum length of the knee
flexors and extensors, as well as the ratio of peak torque between quadriceps and hamstrings. RESULTS: After the
four week intervention, the optimum length of the knee flexors were significantly (p<0.05) increased by 2.3° in the
CG and by 4.0° in the EG. The change in the EG was significantly greater than that of the CG. The optimum lengths
of the knee extensors were significantly increased only in the EG by 6.5°. Peak torque levels and ratios of quadri-
ceps to hamstring were not significantly altered throughout the study for either group. CONCLUSIONS: A relatively
short duration eccentric pre-season programme can significantly increase the optimum length of both the knee
extensors and flexors, which may have positive benefits in reducing the risk of injury. PRACTICAL APPLICATIONS:
Given the strength and conditioning coach’s role in prevention of injury and improvement of performance, it would
seem good practice to at the very least include bouts of eccentric exercise in the athlete conditioning programme.

AbstractsD – F
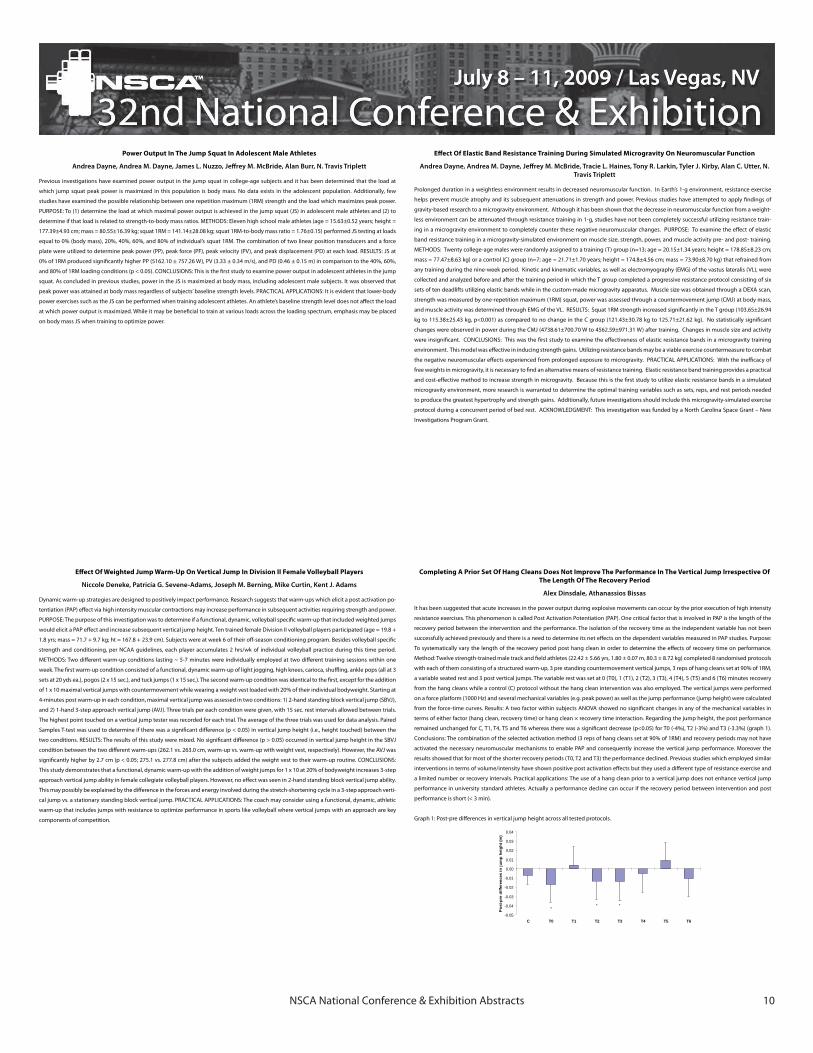
NSCA National Conference & Exhibition Abstracts 10
Completing A Prior Set Of Hang Cleans Does Not Improve The Performance In The Vertical Jump Irrespective Of The Length Of The Recovery Period
Alex Dinsdale, Athanassios Bissas
It has been suggested that acute increases in the power output during explosive movements can occur by the prior execution of high intensity
resistance exercises. This phenomenon is called Post Activation Potentiation (PAP). One critical factor that is involved in PAP is the length of the
recovery period between the intervention and the performance. The isolation of the recovery time as the independent variable has not been
successfully achieved previously and there is a need to determine its net effects on the dependent variables measured in PAP studies. Purpose:
To systematically vary the length of the recovery period post hang clean in order to determine the effects of recovery time on performance.
Method: Twelve strength-trained male track and field athletes (22.42 ± 5.66 yrs, 1.80 ± 0.07 m, 80.3 ± 8.72 kg) completed 8 randomised protocols
with each of them consisting of a structured warm-up, 3 pre standing countermovement vertical jumps, 3 reps of hang cleans set at 90% of 1RM,
a variable seated rest and 3 post vertical jumps. The variable rest was set at 0 (T0), 1 (T1), 2 (T2), 3 (T3), 4 (T4), 5 (T5) and 6 (T6) minutes recovery
from the hang cleans while a control (C) protocol without the hang clean intervention was also employed. The vertical jumps were performed
on a force platform (1000 Hz) and several mechanical variables (e.g. peak power) as well as the jump performance (jump height) were calculated
from the force-time curves. Results: A two factor within subjects ANOVA showed no significant changes in any of the mechanical variables in
terms of either factor (hang clean, recovery time) or hang clean × recovery time interaction. Regarding the jump height, the post performance
remained unchanged for C, T1, T4, T5 and T6 whereas there was a significant decrease (p<0.05) for T0 (-4%), T2 (-3%) and T3 (-3.3%) (graph 1).
Conclusions: The combination of the selected activation method (3 reps of hang cleans set at 90% of 1RM) and recovery periods may not have
activated the necessary neuromuscular mechanisms to enable PAP and consequently increase the vertical jump performance. Moreover the
results showed that for most of the shorter recovery periods (T0, T2 and T3) the performance declined. Previous studies which employed similar
interventions in terms of volume/intensity have shown positive post activation effects but they used a different type of resistance exercise and
a limited number or recovery intervals. Practical applications: The use of a hang clean prior to a vertical jump does not enhance vertical jump
performance in university standard athletes. Actually a performance decline can occur if the recovery period between intervention and post
performance is short (< 3 min).
Graph 1: Post-pre differences in vertical jump height across all tested protocols.
-0.05
-0.04
-0.03
-0.02
-0.01
0.00
0.01
0.02
0.03
0.04
C T0 T1 T2 T3 T4 T5 T6
Pos
t-pre
diff
eren
ces
in ju
mp
heig
ht (m
)
** *
Effect Of Weighted Jump Warm-Up On Vertical Jump In Division II Female Volleyball Players
Niccole Deneke, Patricia G. Sevene-Adams, Joseph M. Berning, Mike Curtin, Kent J. Adams
Dynamic warm-up strategies are designed to positively impact performance. Research suggests that warm-ups which elicit a post activation po-
tentiation (PAP) effect via high intensity muscular contractions may increase performance in subsequent activities requiring strength and power.
PURPOSE: The purpose of this investigation was to determine if a functional, dynamic, volleyball specific warm-up that included weighted jumps
would elicit a PAP effect and increase subsequent vertical jump height. Ten trained female Division II volleyball players participated (age = 19.8 +
1.8 yrs; mass = 71.7 + 9.7 kg; ht = 167.8 + 23.9 cm). Subjects were at week 6 of their off-season conditioning program. Besides volleyball specific
strength and conditioning, per NCAA guidelines, each player accumulates 2 hrs/wk of individual volleyball practice during this time period.
METHODS: Two different warm-up conditions lasting ~ 5-7 minutes were individually employed at two different training sessions within one
week. The first warm-up condition consisted of a functional, dynamic warm-up of light jogging, high knees, carioca, shuffling, ankle pops (all at 3
sets at 20 yds ea.), pogos (2 x 15 sec.), and tuck jumps (1 x 15 sec.). The second warm-up condition was identical to the first, except for the addition
of 1 x 10 maximal vertical jumps with countermovement while wearing a weight vest loaded with 20% of their individual bodyweight. Starting at
4-minutes post warm-up in each condition, maximal vertical jump was assessed in two conditions: 1) 2-hand standing block vertical jump (SBVJ),
and 2) 1-hand 3-step approach vertical jump (AVJ). Three trials per each condition were given, with 15 sec. rest intervals allowed between trials.
The highest point touched on a vertical jump tester was recorded for each trial. The average of the three trials was used for data analysis. Paired
Samples T-test was used to determine if there was a significant difference (p < 0.05) in vertical jump height (i.e., height touched) between the
two conditions. RESULTS: The results of this study were mixed. No significant difference (p > 0.05) occurred in vertical jump height in the SBVJ
condition between the two different warm-ups (262.1 vs. 263.0 cm, warm-up vs. warm-up with weight vest, respectively). However, the AVJ was
significantly higher by 2.7 cm (p < 0.05; 275.1 vs. 277.8 cm) after the subjects added the weight vest to their warm-up routine. CONCLUSIONS:
This study demonstrates that a functional, dynamic warm-up with the addition of weight jumps for 1 x 10 at 20% of bodyweight increases 3-step
approach vertical jump ability in female collegiate volleyball players. However, no effect was seen in 2-hand standing block vertical jump ability.
This may possibly be explained by the difference in the forces and energy involved during the stretch-shortening cycle in a 3-step approach verti-
cal jump vs. a stationary standing block vertical jump. PRACTICAL APPLICATIONS: The coach may consider using a functional, dynamic, athletic
warm-up that includes jumps with resistance to optimize performance in sports like volleyball where vertical jumps with an approach are key
components of competition.
Effect Of Elastic Band Resistance Training During Simulated Microgravity On Neuromuscular Function
Andrea Dayne, Andrea M. Dayne, Jeffrey M. McBride, Tracie L. Haines, Tony R. Larkin, Tyler J. Kirby, Alan C. Utter, N. Travis Triplett
Prolonged duration in a weightless environment results in decreased neuromuscular function. In Earth’s 1-g environment, resistance exercise
helps prevent muscle atrophy and its subsequent attenuations in strength and power. Previous studies have attempted to apply findings of
gravity-based research to a microgravity environment. Although it has been shown that the decrease in neuromuscular function from a weight-
less environment can be attenuated through resistance training in 1-g, studies have not been completely successful utilizing resistance train-
ing in a microgravity environment to completely counter these negative neuromuscular changes. PURPOSE: To examine the effect of elastic
band resistance training in a microgravity-simulated environment on muscle size, strength, power, and muscle activity pre- and post- training.
METHODS: Twenty college-age males were randomly assigned to a training (T) group (n=13; age = 20.15±1.34 years; height = 178.85±8.23 cm;
mass = 77.47±8.63 kg) or a control (C) group (n=7; age = 21.71±1.70 years; height = 174.8±4.56 cm; mass = 73.90±8.70 kg) that refrained from
any training during the nine-week period. Kinetic and kinematic variables, as well as electromyography (EMG) of the vastus lateralis (VL), were
collected and analyzed before and after the training period in which the T group completed a progressive resistance protocol consisting of six
sets of ten deadlifts utilizing elastic bands while in the custom-made microgravity apparatus. Muscle size was obtained through a DEXA scan,
strength was measured by one-repetition maximum (1RM) squat, power was assessed through a countermovement jump (CMJ) at body mass,
and muscle activity was determined through EMG of the VL. RESULTS: Squat 1RM strength increased significantly in the T group (103.65±26.94
kg to 115.38±25.43 kg, p<0.001) as compared to no change in the C group (121.43±30.78 kg to 125.71±21.62 kg). No statistically significant
changes were observed in power during the CMJ (4738.61±700.70 W to 4562.59±971.31 W) after training. Changes in muscle size and activity
were insignificant. CONCLUSIONS: This was the first study to examine the effectiveness of elastic resistance bands in a microgravity training
environment. This model was effective in inducing strength gains. Utilizing resistance bands may be a viable exercise countermeasure to combat
the negative neuromuscular effects experienced from prolonged exposure to microgravity. PRACTICAL APPLICATIONS: With the inefficacy of
free weights in microgravity, it is necessary to find an alternative means of resistance training. Elastic resistance band training provides a practical
and cost-effective method to increase strength in microgravity. Because this is the first study to utilize elastic resistance bands in a simulated
microgravity environment, more research is warranted to determine the optimal training variables such as sets, reps, and rest periods needed
to produce the greatest hypertrophy and strength gains. Additionally, future investigations should include this microgravity-simulated exercise
protocol during a concurrent period of bed rest. ACKNOWLEDGMENT: This investigation was funded by a North Carolina Space Grant – New
Investigations Program Grant.
Power Output In The Jump Squat In Adolescent Male Athletes
Andrea Dayne, Andrea M. Dayne, James L. Nuzzo, Jeffrey M. McBride, Alan Burr, N. Travis Triplett
Previous investigations have examined power output in the jump squat in college-age subjects and it has been determined that the load at
which jump squat peak power is maximized in this population is body mass. No data exists in the adolescent population. Additionally, few
studies have examined the possible relationship between one repetition maximum (1RM) strength and the load which maximizes peak power.
PURPOSE: To (1) determine the load at which maximal power output is achieved in the jump squat (JS) in adolescent male athletes and (2) to
determine if that load is related to strength-to-body mass ratios. METHODS: Eleven high school male athletes (age = 15.63±0.52 years; height =
177.39±4.93 cm; mass = 80.55±16.39 kg; squat 1RM = 141.14±28.08 kg; squat 1RM-to-body mass ratio = 1.76±0.15) performed JS testing at loads
equal to 0% (body mass), 20%, 40%, 60%, and 80% of individual’s squat 1RM. The combination of two linear position transducers and a force
plate were utilized to determine peak power (PP), peak force (PF), peak velocity (PV), and peak displacement (PD) at each load. RESULTS: JS at
0% of 1RM produced significantly higher PP (5162.10 ± 757.26 W), PV (3.33 ± 0.34 m/s), and PD (0.46 ± 0.15 m) in comparison to the 40%, 60%,
and 80% of 1RM loading conditions (p < 0.05). CONCLUSIONS: This is the first study to examine power output in adolescent athletes in the jump
squat. As concluded in previous studies, power in the JS is maximized at body mass, including adolescent male subjects. It was observed that
peak power was attained at body mass regardless of subjects’ baseline strength levels. PRACTICAL APPLICATIONS: It is evident that lower-body
power exercises such as the JS can be performed when training adolescent athletes. An athlete’s baseline strength level does not affect the load
at which power output is maximized. While it may be beneficial to train at various loads across the loading spectrum, emphasis may be placed
on body mass JS when training to optimize power.

NSCA National Conference & Exhibition Abstracts 11
Electromyographic Analysis Of Concurrent Activation Potentiation
William P. Ebben, Christopher Geiser, Erich J. Petushek, McKenzie L. Fauth, David H. Leigh, Luke R. Garceau
PURPOSE: This study evaluated the effect of remote voluntary contractions (RVC) on peak torque, rate of torque development, power, and work,
the activation of the involved muscles, and gender differences therein. METHODS: Eleven men and 12 women performed isokinetic knee exten-
sion and flexion tests on a dynamometer in RVC and normal (NO-RVC) test conditions. The RVC condition included jaw clenching, hand gripping,
and the Valsalva maneuver. Electromyography (EMG) was used to quantify muscle activation. A two way mixed ANOVA with repeated measures
for test condition was used to evaluate the main effects for peak torque, rate of torque development, power, and work, as well as the EMG of the
prime movers, their antagonist, and muscles involved in the RVCs, and the interaction between test condition and gender. RESULTS: Subjects
produced higher mean peak torque, rate of torque development, power, and work in the RVC condition for all tests, with significant differences
for 6 of the 8 outcome variables for men (P ≤ 0.05) and 2 or the 8 outcome variables for women (P ≤ 0.05). Significant interactions between test
condition and gender indicate differences in response to RVCs during knee extension tests for power (P ≤ 0.01) and work (P ≤ 0.02), and for
knee flexion tests for peak torque (P ≤ 0.03) and power (P ≤ 0.049). Prime mover activation was greater in the RVC condition for most tests (P ≤
0.05). Gender difference in the activation of the left and right flexor digitorum longus during all tests (P ≤ 0.05) suggest that the comparatively
lower response of women during the CAP condition may be due to gender differences in hand gripping RVCs. CONCLUSION: Remote voluntary
contractions result in statistically significant enhancement of performance of 6.2 to 12.5% for men and 3.3 to 4.2% for women, for a number of
outcome variables assessed, which coincides with remote muscle activation and the concomitant increase in EMG of the prime mover. PRACTI-
CAL APPLICATION: Athletes and exercisers may attain enhanced strength performance and muscle activation of prime movers by incorporating
RVC’s into their training.
The Effects Of Activity Based Interventions On Selected Health Fitness Parameters Of University Students
John Downing, Gerald L. Masterson, Regis Noroski
PURPOSE: Lack of exercise is related to the development of heart disease, and can also impact other conditions such as obesity, hypertension,
hyperlipidemia, atherosclerosis and diabetes. Conversely, understanding the benefits of and engaging in regular physical activity can positively
modify these risk factors. PURPOSE: The purpose of this study was to examine the effects of a prescribed exercise program implemented in a
required university core fitness course on selected student health fitness parameters. METHODS: One thousand two-hundred and forty-four
students originally volunteered to participate in the study. Each student was concurrently enrolled in a content area lecture, and a fitness activity
laboratory that convened twice a week. During the initial two weeks of the semester and under laboratory instructor supervision, students were
required to complete 8 valid health fitness tests, compile this pre-intervention data on standardized forms and submit them to the instructors.
The test items included: resting heart rate and blood pressure, one minute bent-knee sit-ups and push-ups, low back sit and reach flexibility, body
composition via 3 site skinfold testing, 8” step test, and a validated cardiorespiratory test, e.g., Rockport/Walkport 1 mile walk, 1.5 mile run, 12
minute run. Over the subsequent 11 weeks, the subjects engaged in personalized activity based interventions that included a variety of cardiore-
spiratory and resistance training activities, e.g., walking, running, machine aerobics, resistance and flexibility training. During the final two weeks
of the semester, post-testing of the original testing items was concluded, compiled on the original forms and returned to the instructors. Four
hundred sixty-two students completed all pre and post testing items, and were retained as subjects in the study. RESULTS: Pre/post testing means
and standard deviations were calculated as follows: resting heart rate – M = 74.87/71.09, σ = 12.20/11.47; blood pressure – M = 119.19/73.02,
118.53/72.51, σ = 14.93/9.4/ 12.80/ 10.15; bent knee sit-ups – M = 39/42.76, σ = 12.37/14.10; push-ups – M = 30/98/34.76, σ = 13.35/13.03; sit
and reach flexibility – M = 13.52/14.35, σ = 3.21/3.30; skinfold body composition – M = 21.28/20.53, σ = 8.83/8.51; 8” step test recovery time – M
= 51.82/48.10, σ = 13.36/11.67; cardiorespiratory testing – M = 14.64/14.10, σ = 2.57/3.06. A multivariate within subjects repeated measures
design was employed to evaluate the pre and post testing data. Results demonstrated significant gains (p < .001) for all pre-post test dependent
variables except for blood pressure (means calculated as acceptable over both tests), and the 8” step test. CONCLUSIONS: In general, the activity
interventions were mildly effective for this student sample with consideration to the minimum number of days students were required to engage
in the prescribed exercise sessions. RECOMMENDATIONS: For future modifications to this study, it is suggested that (1) investigators track and
document the actual number of days – minimum or additional, out of class – that students engage in exercise regimens, (2) the course integrate
specialty labs, e.g., integrated exercise-weight management, nutrition counseling,10k training, into the laboratory component based on interest
and need, and (3) course staff continue to impress on the students the value of regimented, consistent exercise and the importance of tracking
personal results.
The Effectiveness Of Manual Resistance Versus Weight Training On Fitness Test Achievement Scores In Adolescents
Sandor Dorgo
Manual Resistance Training (MRT) has recently gained popularity and previous research suggested that MRT may be effective in improving mus-
cular fitness in adults. As resistance training is an effective method to improve the fitness of adolescents, a variety of resistance training modalities
have been applied for this population. The advantage of the MRT modality is the low cost due to the minimal equipment and space requirements.
PURPOSE: To compare the changes in fitness test scores between adolescents trained by the MRT and by traditional Weight Training (WT). METH-
ODS: One hundred seventy-four adolescents attending school-based physical education classes were pre-tested on their physical attributes by
the Fitnessgram assessment tool, including the 1-mile run, curl-up, push-up, trunk lift, flexed arm hang, and modified pull-up tests. Classes of
students were then assigned to either the MRT or WT protocol. Resistance training programs were used to complement the physical education
classes and were applied for 30-45 minutes three times per week for 18 weeks. Students were tested prior to the intervention, at 9 weeks and at
the end of the 18-week period. Data were analyzed using a General Linear Mixed Model Analysis with Tukey’s post-hoc procedure for mean com-
parisons. RESULTS: At baseline, there were no significant differences between groups for age, height or weight (p>0.05). However, adolescents
in the WT group scored significantly higher in all measures of the Fitnessgram tool (p<0.002). By 9-week both the MRT and WT groups showed
significant improvements in the curl-up and trunk lift measures (p<0.002) with the MRT group showing greater improvements. For the 1-mile run,
push-up, flexed arm hang, and modified pull-up measures only the MRT group showed significant improvements (p<0.005). Fitness scores for the
WT group remained significantly higher for the 1-mile run and flexed arm hang tests (p<0.012), but the significant group differences disappeared
for the curl-up, trunk lift, push-up, and modified pull-up measures (p>0.54). Neither group showed further significant improvement by 18-week in
the 1-mile run, curl-up, trunk lift, flexed arm hang, or the modified pull-up measures (p>0.09). In the push-up measure, only the WT group showed
improvement from 9-week to 18-week (p=0.019). At 18-week fitness scores were significantly higher in the WT group for the 1-mile run, curl-up,
push-up, flexed arm hang and modified pull-up tests (p<0.038). From baseline to 18-week both groups showed significant improvements in
curl-up, trunk lift and push-up tests (p<0.049), but only the MRT group showed significant improvements for the 1-mile run, flexed arm hang,
and modified pull-up tests (p<0.005). CONCLUSION: While the WT program was effective in improving some measures of adolescents’ fitness,
the MRT appeared to improve all measures. Adolescents trained by the MRT modality achieved greater improvements in the first half, but either
only minimal improvements or some decrements in the second half of the 18-week intervention. Adolescents in the WT group generally made
smaller but more progressive improvements throughout the 18-week intervention. PRACTICAL APPLICATION: Both the MRT and the traditional
WT systems are appropriate for improving Fitnessgram scores within school-based physical education programs. The MRT modality appears to
be effective in improving adolescents’ fitness scores within 9 weeks of program application.
Effects Of Resistance Training On The Hamstring To Quadriceps Strength Ratio In Males And Females
Sandor Dorgo, Pradeep Edupuganti
The imbalance in the hamstring to quadriceps (H:Q) ratio results in an increased susceptibility to hamstring strains and ACL injuries. Previous
studies stipulated that compared to males the lower H:Q ratios may play an important role in the higher likelihood of ACL injuries in females. No
known research has investigated the changes in H:Q ratios between males and females after an identical resistance training program. PURPOSE:
to compare the changes in hamstring and quadriceps strength and in the H:Q strength ratios between males and females following an identi-
cal resistance training program. METHODS: Male (n=16) and female (n=17) college-age subjects with no history of lower-body injuries were
recruited. All subjects were recreationally active but novice to lower-body resistance training. A 12-week resistance training program was ap-
plied consisting two 45-60 minutes sessions per week focusing on hamstring and quadriceps development. Subjects’ hamstring and quadriceps
and the conventional and functional H:Q ratios. Pre- and post-training data were analyzed using an ANOVA with repeated measures. RESULTS:
Males’ concentric and eccentric hamstring strength and their concentric quadriceps strength improved significantly from baseline to 12-week
at all angular velocities (p<0.002). Females showed significant improvements in the concentric and eccentric hamstring strength at all angular
conventional and 1.1-1.4 functional H:Q ratios. CONCLUSION: While concentric and eccentric hamstring strength improved similarly in males and
subjects’ relative quadriceps strength to that necessary for adequate functional performance. PRACTICAL APPLICATION: A 12-week systematic
of quadriceps and hamstring relative strength values are recommended in addition to the H:Q ratios.

NSCA National Conference & Exhibition Abstracts 12
The Impact Of Wearable Weights On Cardiovascular, Metabolic, And Perceptual Responses To Treadmill Walking
Kristine M. Fallon, Ashley T. Kuczynski, Marcus W. Kilpatrick, Bill I. Campbell
The growing public health burden associated with insufficient physical activity has resulted in the development of numerous health initiatives
and products aimed at stabilizing and reversing the negative trends reported in epidemiological literature. A relatively novel product that has
only recently made its way to the market are wearable weights. These products are designed to be worn on the lower legs and arms along with
regular clothing as a means to increase caloric expenditure. However, no research to date has tested the efficacy of this product. PURPOSE:
Compare the physiological and psychological responses within bouts of aerobic exercise that vary on intensity and the presence of wearable
weights. METHODS: Thirteen (8 female, 5 male, mean age = 24 years, mean BMI = 24) healthy volunteers were tested for aerobic fitness on a
treadmill to determine VO2 max (mean = 44 ml x kg-1 x min-1). Participants then completed eight 30-minute walking trials on a treadmill while
oxygen consumption (VO2), heart rate (HR), and ratings of perceived exertion (RPE) were monitored while walking at different speeds and with
varying combination of upper and lower body wearable weights. The design included two intensities (slow walking and brisk walking) and four
conditions (no weights, arm weights, leg weights, and arm and leg weights) for a total of eight experimental trials. RESULTS: Data were analyzed
using ANOVA and pairwise comparisons. Analyses revealed a that VO2 was significantly lower without the wearable weights in comparison to
wearing both upper and lower weights in the slow walk trial (P < 0.001; ES = 0.97) and trended towards significance in the brisk walk trial (P <
0.09; ES = 0.37). HR did not differ across trials for the slow or brisk walk trials (P > 0.05). RPE was significantly elevated while wearing upper and
lower weights in the brisk walk trial (P < 0.05; ES = 0.55), but not in the slow walk trial (P > 0.05). CONCLUSIONS: Findings suggest that exercising
while using wearable weights increases energy expenditure, has no impact on HR, and impacts RPE only during the faster walking trials. The in-
creased energy expenditure associated with wearing the weights was modest, but the increases within the slower walking trial occurred without
increased RPE. PRACTICAL APPLICATIONS: This finding suggests that physical activity associated with daily living could be enhanced through
the wearing of weights that can be worn under clothing without increasing perceptions of effort. In contrast, findings relative to brisk walking
suggest that any beneficial increase in energy expenditure is potentially offset by significantly increased effort.
The Effects Of Multiaxial And Uniaxial Unstable Surface Balance Training In College Athletes
Tracey Eisen, Jerome Danoff, James Leone, Todd Miller
PURPOSE: The purpose of this study was to compare the effects of two different types of unstable surface balance training (uniaxial on a rocker-
board (RB) and multiaxial on a dynadisc (DD)) on balance in Division 1 collegiate athletes in sports that are high-risk for ankle sprains. METHODS:
Subjects (n=36) consisted of male soccer players, and female volleyball and soccer players, and were equally and randomly assigned to one of
three groups (CON, DD, RB). Balance training consisting of balancing on one leg on either the RB or DD, while repeatedly catching a 1kg ball was
performed 3 times per week for 4 weeks. Balance was tested with the Star Excursion Balance Test (SEBT) prior to, halfway through, and at the
completion of the balance training. Control (CON) subjects also were given the balance test, but did not participate in the training. RESULTS: A
3-way repeated ANOVA revealed that no group individually changed SEBT scores from pre (CON; 0.98 ± 0.086, DD; 0.98 ± 0.083, RB; 0.97 ± 0.085)
to post (CON; 1.00 ± 0.090, DD; 1.01 ± 0.088, RB; 1.02 ± 0.068) following balance training. When the two treatment groups were combined (DD and
RB), the P value decreased and came closer to significance (p=0.136). When all three groups were combined, there was a significant difference
in SEBT scores from pretraining (CON+DD+RB; 0.98 ± 0.085) to post training (CON+DD+RB; 1.01 ± 0.082), which likely indicates low statistical
power. CONCLUSION: The increase in physical activity the subjects experienced during the return to in-season activity, may have contributed to
the significant differences in SEBT scores over time but not between DD or RB training. PRACTICAL APPLICATIONS: Therefore, a threshold level of
physical activity may exist that is necessary to maintain balance during the off season.
The Effects Of A Self-Designed Off-Season Training Program On Physiological Variables In Division Iii Collegiate Athletes
Brian P. Edlbeck, Morgan K. Anderson
Many aerobic-based athletes at small colleges and universities take it upon themselves to design their off-season training programs. They piece
together knowledge they have acquired from past and current coaches along with their limited knowledge of exercise physiology and condition-
ing. PURPOSE: The intent of this study was to determine if a self-designed aerobic training program will have positive effects on physiological
variables of division III collegiate athletes. METHODS: Seven student-athletes (4 female and 3 male) were asked to participate in three testing
sessions over an eight week period during the summer of 2008. In between testing sessions, the student-athletes were required to work out a
minimum of three days per week on a self-designed program. A testing session included a submaximal program with five six-minute stages, in
which stage three was set at their self-determined 10 kilometer running pace. Stage one was then set at 1.0mph under their self determined
pace, and each stage was increased by 0.5mph. The incline was maintained at 1.0% incline for the entire test. After the submaximal test was
completed, the individual was allowed to recover for approximately 10 minutes and then partook in a maximal test. The maximal test pace was
set at the pace just below lactate threshold as determined by the submaximal test. The maximal test began at 0.0% incline for two minutes.
In stage two, the incline was increased to 4.0% for two minutes and then increased by 1.0% every minute thereafter until volitional fatigue.
The speed remained constant during the entire maximal test. Variables collected during testing included: oxygen uptake, lactate, respiratory
exchange ratio, and heart rate. RESULTS: All student-athletes showed an improvement in the physiological variables measured. This included
a decrease in respiratory exchange ratio (<0.05), an increase in oxygen uptake maximal values (<0.05), and a rightward shift of their lactate
threshold curves (<0.05). CONCLUSION: Positive adaptations were found among the student-athletes who were consistent with the goals of
their off-season workouts. PRACTICAL APPLICATIONS: The results of this study show that self-designed training programs can elicit the results
that student-athletes have desired. With proper experience and education, student-athletes can successfully design effective training programs.
Do High Hamstring To Quadriceps Activation Ratios Impair Jumping Performance?
William P. Ebben, Erich J. Petushek, McKenzie L. Fauth, Luke R. Garceau, Katlin Millin, Mark Spadavecchia, Kelly Petrauskas, Christine R. Feldmann
Recent reports suggest that training to increase the amount of hamstring activation and hamstring to quadriceps activation ratios (H:Q) may
stabilize the knee during jump landings and cutting, and potentially prevent anterior cruciate ligament injuries. However, the potential effect of
increased antagonist activation may impair the agonist, including the performance of activities involving knee extension. PURPOSE: This study
evaluated the relationship between H:Q and countermovement jump (CMJ) height. METHODS: Subjects included 43 female high school and
college students (age = 19.14 ± 1.8 years). All subjects provided informed consent, as well as parental consent for those who were less than 18
years old. The study was approved by the university review board. Subjects performed 2 repetitions of maximum voluntary isometric contrac-
tions (MVIC) for the quadriceps and hamstring muscles. Subjects also performed 2 repetitions each of the drop jump from a height equal to their
countermovement jump (DJ). Electromyographic (EMG) data were collected for the rectus femoris, vastus lateralis, vastus medialis, lateral ham-
string, and medial hamstring. Root mean square (RMS) signal processing was used on all EMG data which were analyzed to assess the magnitude
and timing of the muscles’ bursts pre and post landing for the DJ using the average of both trials and normalized to MVIC. The timing of the foot
contact was synchronized with the EMG data using a switch mat. The H:Q were calculated from the collective average of the hamstring muscles
divided by the collective average of the quadriceps muscles. Data were evaluated using a Pearson’s correlation coefficient in order to examine
the relationship between the subject’s H:Q and CMJ height for both the pre and post foot contact phase of the DJ. RESULTS: Results revealed that
pre landing H:Q was positively correlated to CMJ height (r = .35, p = 0.02). Post-landing H:Q was not correlated to CMJ height (r = .21, p = 0.18)
CONCLUSION: This study demonstrates that high levels of hamstring activation, relative to the quadriceps, do not impair, and may be positively
associated with CMJ performance. PRACTICAL APPLICATION: The prescription of additional hamstring training for female athletes appears un-
likely to impair performance of exercises that involve dynamic knee and hip extension, such as the countermovement jump.

NSCA National Conference & Exhibition Abstracts 13
Effects Of A Whole Body Compression Garment On Markers Of Recovery After An Intense Whole Body Resistance Training Workout In Men
Shawn Flanagan
Purpose: The primary purpose of this investigation was to evaluate the influence of a whole body compression garment on recovery from a
typical heavy resistance training workout in resistance trained men. Methods: Eleven resistance trained men [mean±SD, age (yr) 23.0 ±2.9,
height (cm) 178.5± 9.9, body mass (kg) 86.1±9.7] gave informed consent to participate in the study. A within-group [each subject acted as their
own control], balanced and randomized treatment design was used. A whole body heavy resistance exercise protocol using barbells [3sets 8-10
RM, 2.0-2.5 min rest] consisting of a back squat, bench press, stationary lunge, bent over row, Romanian dead lift, biceps curl, sit-ups and high
pull from a hang was performed after which the subject showered and put on a whole body compression garment (CG) (75% Nylon and 25%
Spandex,) or just wore his normal non-compression clothing (CON). Subjects were then tested 24 hr later in the laboratory immediately after
they removed the compression garment and put on their workout attire in order to determine recovery differences between conditions. Nutri-
tional intakes, activity, and behavioral patterns (e.g., no pain medications, ice or long showers over the 24 hr) were replicated with test protocol
sequences separated by 72 hours. Dependent measures included, sleep quality, vitality rating, resting fatigue rating, muscle soreness, muscle
swelling via ultrasound, reaction movement times, bench throw power, countermovement vertical jump power (CMVJ), and serum concentra-
tions of creatine kinase (CK) measured from a blood sample obtained via venipuncture of an arm vein. An analysis of variance was used to
determine differences between treatments and P ≤0.05 was defined as significance in this study. Results: There was no significant difference in
sleep quality between conditions; vitality rating, with 7 the highest quality rating, the CG [6.0+0.5] was significantly higher than CON [2.9+1.1],
resting fatigue was significantly lower in CG [1.75+0.84] vs CON [3.77+1.25], muscle soreness was significantly lower in CG [1.33+0.65] vs CON
[3.06+2.1], muscle swelling was significantly lower in CG [18.8+4.0 cm] vs CON [23.7+2.6 cm], no differences were observed in reaction/move-
ment time, bench press throw power was significantly higher in CG [950.3+193.3 W] vs CON [705.4+292.9 W], no differences for CMVJ, and resting
CK was significantly lower in CG [318+188 IU/L] vs CON [597+330 IU/L]. Conclusions: A whole body compression garment worn during the 24
hr recovery period after an intense heavy resistance training workout enhances various psychological, physiological and performance markers
of recovery compared to control garment conditions. Practical Applications: The use of compression has been previously shown to help athletic
performance, reduce damage from soft tissue injury and now it appears that compression can help in the recovery process from an intense
resistance training workout in men.
Activation Of Core Musculature During Exercise With Stable And Unstable Loads On Stable And Unstable Surfaces
Sean Flanagan, James M. Kohler, William C. Whiting
Purpose: Training on unstable surfaces is thought to increase the activation of the core (trunk) musculature because of the greater demands
for stability. While greater activation of the core has been found with equivalent external resistances, the amount of external force produced
by a group of muscles has been found to decrease when the same exercise is performed on an unstable surface. Additionally, while training on
unstable surfaces is the most common form of instability training, an individual is more likely to encounter an unstable external resistance rather
than an unstable surface, outside of the gym setting. It is unclear how the core muscle activation would compare if relative, rather than absolute,
resistances were used, or if an unstable load was used rather than an unstable surface. The purpose of this investigation was to determine the ef-
fect of both loading mode and surface condition on the amount of weight lifted during a 10 repetition maximum (10-RM) and the corresponding
activation of the core musculature, as measured by surface electromyography (sEMG). Methods: Twenty recreationally trained adults performed
the overhead press under two loading conditions (barbell/stable load and dumbbell/unstable load) while on two different surfaces (exercise
bench/stable surface and Swiss ball/unstable surface). For each condition, subjects performed 3 sets of 3 repetitions with a resistance that was
equivalent to a previously determined 10-RM for each condition with sEMG electrodes attached to the following muscles: rectus abdominis (RA),
external oblique (EO), upper erector spinae (UES), and lower erector spinae (LES). sEMG signals were collected at 1000 Hz, amplified by 1000 mV,
and filtered using a band-pass filter between 20-500 Hz. The root mean square of each signal during a 125ms window was then calculated using
a computer algorithm. Peak (pRMS) and integrated (iRMS) root mean square values of each EMG signal were averaged across the three trials for
each subject. A 2 x 2 factorial ANOVA with repeated measures was used to compared group mean differences between the 4 conditions (α =
0.05). Results: Stable loads resulted in a 15.6% greater 10-RM, and stable surfaces resulted in an 11.4% greater 10-RM. For the RA, there was no
effect for load or surface. For the EO there was a main effect for surface, with 12.5% greater pRMS and 16.8% greater iRMS on the stable surface.
For the LES and UES, there was a main effect for load, with the stable load requiring 49.4% and 67.1% greater iRMS, respectively. Additionally, for
the UES, the stable load resulted in a 50% greater pRMS. There were no significant interactions. Conclusions: The amount of weight lifted declined
with increasing instability of either the load or surface. The RA does not appear to play a strong role in stabilizing the trunk during the overhead
press. While the other core musculature responded to changes in surface and loading conditions, increased activation appeared to be a function
of the amount of weight lifted overhead. The LES did not increase in peak magnitude, suggesting an overall increase in activation rather than at
a specific point in time. Practical Applications: Greater activation of the core musculature appears to occur by lifting a heavier weight overhead
than by lifting a lighter weight overhead either with an unstable load or on an unstable surface.
Differences in Glucose Uptake Following High Intensity and Low Intensity Cardiovascular Exercise
Bryan Fillmore, D.E. Lankford, J. Nightingale, E. Herb, C. Pence, R. Porter
INTRODUCTION: While it is recognized that muscle contraction results in elevated glucose uptake, there is little application of this concept in
exercise prescription. Previous investigations have determined that high resistance training results in greater glucose uptake, compared to low
resistance training; while performing the same amount of total work. However, there is little information regarding glucose uptake following
cardiovascular exercise when performed at different intensities. PURPOSE: The purpose of this study was to investigate the differences in glucose
uptake between high intensity interval aerobic exercise and low intensity sustained aerobic exercise, while keeping work the same between
trials. METHODS: 19 college aged males participated in a high intensity interval sprint trial and an endurance trial on separate days. Trials were
performed at least 3 days apart, and were performed in a repeated random order. Immediately post exercise, subjects drank a high carbohydrate
solution. Blood glucose levels were recorded until they returned to baseline or until 1.5 hours post exercise. Glucose area under the curve was
calculated and a paired T-test was used to determine differences. RESULTS: High intensity interval aerobic exercise resulted in significantly
greater glucose uptake post exercise compared to low intensity sustained aerobic exercise (p=.037). CONCLUSION: High intensity intermittent
exercise is better at regulating glucose uptake than low intensity sustained aerobic exercise of equal work. PRACTICAL APPLICATION: We pro-
pose that increased attention be given to the “type of exercise” in regulation of blood glucose, rather than strictly “exercise”. It appears that “how”
you run, bike, or swim when performing your daily exercise is important in populations attempting to regulate blood glucose levels.
Potentiating Effects of Depth and Box Jumps on Vertical Jump Performance in Female Collegiate Volleyball Players
Kim Faulkinbury, Jennie L. Stieg, Lee E. Brown, Jared W. Coburn, Daniel A. Judelson
Box jumps and depth jumps might elicit post activiation potentiation (PAP), which can improve vertical jump performance. Purpose: The purpose
of this study was to compare the potentiating effects of a depth jump vs. a box jump warm-up on vertical jump performance. Methods: Ten NCAA
Division I female volleyball players participated in this study (age; 19.10 ± 1.28 yrs, height; 177.33 ± 8.13 cm, mass; 73.92 ± 5.30 kg). Participants
completed three testing sessions each separated by at least 48 hours. Investigators measured each subject’s height, mass, and standing reach on
Day one. On each day, subjects warmed up for five minutes on the cycle ergometer at a moderate self-selected pace with 0.5 kps of resistance.
Subjects then performed three maximum countermovement jumps with arm-swing (vertical jumps), which served as a pre-test for that day.
Subjects then performed one of three experimental conditions in random order: a control condition (no intervention), a box jump condition (ten
jumps onto a box), and a depth jump condition (ten trials of stepping off a box with immediate maximal rebound). Individualized box height
equaled the distance from the floor to the halfway point between the greater trochanter and the lateral femoral condyle. Upon completion of
each condition, subjects rested for ten minutes. Subjects then performed three final vertical jumps (post-test). Dependent variables included
vertical jump height (as measured by a Vertec and force plate) and ground reaction force. Results: ANOVA revealed a significant (p < 0.05) interac-
tion for condition by time on vertical jump height measured by the Vertec. Vertical jump height (as measured by the Vertec) significantly (p<0.05)
decreased for the control condition. No significant differences existed in vertical jump height for the box jump (pre = 43.94 ± 5.28 cm; post =
44.70 ± 6.45 cm) or depth jump conditions (pre = 44.70 ± 7.11 cm; post = 45.08 ± 6.70 cm). ANOVA revealed no significant difference from pre to
post for vertical jump height and ground reaction force as measured by the force plate for any condition. Conclusion: The significant decrease in
performance during the control trial suggests that 1) ten minutes of seated rest and/or 2) the performance of three preliminary jumps impaired
subsequent jumping performance. The box and depth jumps tended to increase vertical jump height (as measured by the Vertec), suggesting
these jumps at a greater intensity might elicit PAP. This might also indicate that ten minutes rest is too long for these types of jumps at this
intensity. Practical Application: Ten box jumps or depth jumps at this intensity should not be used for female collegiate volleyball players as a
warm-up since these exercises fail to elicit a PAP response in the vertical jump.
NSCA National Conference & Exhibition Abstracts 14
Acute Effects Of A Pre-Exercise Supplement On Critical Velocity And Anaerobic Running
Capacity In College-Aged Men And Women
David Fukuda, Abbie E. Smith, Kristina L. Kendall, Jennifer L. Graef, Jordan R. Moon, and Jeffrey R. Stout
The critical velocity test provides two measures: critical velocity (CV) and anaerobic running capacity (ARC). In theory, CV represents the maxi-
mum running velocity that can be maintained without fatigue, which is regarded as an aerobic measure. The ARC is an estimate of the anaerobic
energy reserves in muscle, such as adenosine triphosphate and phosphocreatine. However, no previous studies have examined the effects of
any nutritional supplements on CV and ARC. PURPOSE: To examine the effects of a pre-exercise supplement on CV and ARC in college-aged
men and women. METHODS: Ten moderately-trained men and women (mean ± SD; age 25.7 ± 3.4 yrs; height: 172.2 ± 7.5 cm; weight: 70.9 ±
11.7 kg; VO2MAX: 50.6 ± 6.6 ml∙kg-1∙min-1) volunteered to participate in this randomized, double-blinded, placebo-controlled, cross-over study.
Thirty minutes prior to testing, participants consumed the active supplement (ACT; 17.6g; whey protein, cordyceps sinensis, arginine, creatine
ethyl ester, citrulline, ginseng, and caffeine) or placebo (PLA; 17.6g; maltodextrin, natural and artificial flavors and colors). After 3 familiarization
sessions, the testing was conducted over 3 non-consecutive days for the randomly-ordered ACT and PLA trials (6 days total). A maximal oxygen
consumption test (VO2MAX) on a treadmill was performed on day 1 to establish peak velocity output (PV) at VO2MAX. Day 2 involved treadmill
running at 110% and 90% of the PV, while day 3 involved running at 105% and 100% of the PV. CV was the slope, and ARC was the y-intercept
of the linear relationship between running distances plotted over the times-to-exhaustion (s) at each velocity. RESULTS: The ACT supplement
elicited a 10.8% higher (P = 0.02) ARC compared to the PLA. However, the 0.6% higher CV for the ACT trial was not different (P = 0.38) from the PLA
trial. CONCLUSIONS: These findings suggest that the acute ingestion of this pre-exercise supplement may be an effective strategy for improving
ARC (anaerobic energy), but appears to have no effect on CV (aerobic performance). PRACTICAL APPLICATIONS: Taking the ACT supplement 30
min prior to testing improved the anaerobic energy reserves associated with high-speed running, which may be useful for athletes who rely on
these metabolic demands, such as football, basketball, baseball, softball, soccer, and rugby players.
Training Experience Alters Myosin Heavy Chain Relationships With Performance
Andrew Fry, Brian K. Schilling, Loren Z.F. Chiu, Lawrence W. Weiss and Joan M. Eckerson.
Numerous reports exist concerning relationships between muscle fiber types or myosin heavy chain expression and in vivo human muscle per-
formance. Whereas in vitro high power performances in single muscle cells are most associated with type IIB/X fibers expressing primarily MHC
IIb/x, these relationships are not always observed for in vivo volitional performances in humans. Indeed, previous data suggest that high power
performances in humans may be correlated with other MHC isoforms (i.e., MHC I or IIa), depending on prior training experience. Comparisons
of data are somewhat difficult when different measures of power or different assessments of fiber characteristics are used. Additionally, training
experiences of subjects are sometimes difficult to ascertain when comparing different studies. Purpose: To compare relationships between each
MHC isoform and muscle power for subjects with differing training histories. Methods: Healthy adult men with a variety of training backgrounds
served as subjects for this study (n=37, [X±SD] age = 23.3±4.0 yrs., hgt. = 178.4±6.3 cm, BW = 84.8±21.4 kg, % fat = 12.5±6.7 %). Subjects were
divided into three subject groups; elite lifters (ELITE; n=5, 10 yrs. trng experience, 4-5 training sessions.wk-1), moderately weight trained (MOD;
n=27, 1-3 yrs. training experience, 2-3 training sessions.wk-1), and sedentary (SED; n=5, no training ≥3 yrs.). All subjects performed depth vertical
jumps (DVJ) from a height of 0.9 m from which peak power (W) was estimated. Muscle biopsies were obtained from the vastus lateralis m. and an-
alyzed via SDS-PAGE to determine relative expression of myosin heavy chain (MHC) isoform expression. Regression analyses were performed for
each subject group between each MHC isoform (i.e., I, IIa, IIb/x) and DVJ peak power (p.81), MOD = MHC type IIb/x (r2>.29), and ELITE = MHC type
IIa (r2>.44). Conclusions: The ability to optimize fiber recruitment for a high power movement such as a DVJ is not achieved until large volumes
of training have occurred. Untrained individuals most readily recruit the low threshold motor units that contain primarily MHC type I. Moderately
trained individuals who still express some MHC IIb/x can recruit these motor units when necessary for activities such as a DVJ. Highly trained
individuals who express little or no MHC IIb/x depend preferentially on motor units containing MHC type IIa. Practical Applications: This training-
dependent continuum of fiber contributions to high power performance indicates that optimizing high power performance depends on intense,
long-term training programs (e.g., >1-3 yrs., >2-3 sessions.wk-1). Funded by grants from the NSCA, the Fed Ex Technology Institute, and GNC, Inc.
Upper And Lower Body Strength Increases Consequent To Different Inter-Set Rest Intervals In Trained Men
Belmiro Freitas de Salles, Belmiro Freitas de Salles, Roberto Simão, Humberto Miranda, Martim Bottaro, Ewertton de Souza Bezerra, Fabio Fontana, Jeffrey M. Willardson
There has been considerable debate about the effectiveness of different rest interval lengths on strength gains. OBJECTIVE: The purpose of the
current study was to examine the effects of different rest interval durations on upper- and lower-body strength during and after a 16 week resis-
tance training program. METHODS: Thirty-six recreationally trained men were randomly assigned to one (G1; n = 12), three (G3; n = 12) or five (G5;
n = 12) minutes rest interval groups. Each group performed the same program in a nonlinear periodized training model. Maximal strength was
assessed at baseline, mid-point (eight weeks) and post-training (16 weeks) for the bench press and leg press exercises. RESULTS: For the bench
press, significant increases were demonstrated within G3 and G5 at eight weeks and 16 weeks versus baseline (p < .05). Additionally, G5 (98.2 ±
3.7 kg) was significantly stronger than G1 (92.5 ± 3.8 kg) at 16 weeks (p < .05). For the leg press, significant increases were demonstrated within
all groups at eight weeks and 16 weeks versus baseline (p < .05). Additionally, there were significant differences between groups at eight weeks
[i.e. G5 (290.8 ± 23.5 kg) significantly stronger than G1 (251.0 ± 15.8 kg); p < .01] and 16 weeks [i.e. G3 (305.0 ± 23.9 kg) and G5 (321.7 ± 21.7 kg)
significantly stronger than G1 (276.7 ± 10.7 kg); p < .05]. CONCLUSION: The findings of the current study indicate that longer rest intervals may
result in significantly greater increases in upper and lower body strength after the early weeks of training, when compared to shorter rest inter-
vals. PRATICAL APPLICATIONS: Shorter rest intervals can be effective for strength increases in less trained muscles or exercises; this may apply to
advanced athletes following a layoff or novice athletes beginning a resistance training program. Longer rest intervals (up to five minutes) are best
applied in highly trained muscles and exercises and the window for adaptation narrows.
Effects Of A Whole Body Compression Garment On Markers Of Recovery After An Intense Whole Body Resistance Training Workout In Women
Maren S. Fragala
Purpose: The primary purpose of this investigation was to evaluate the influence of a whole body compression garment on recovery from a
typical heavy resistance training workout in resistance trained women. Methods: Nine resistance trained women [mean±SD, age (yr) 23.1 ±2.2,
height (cm) 161.6± 6.2, body mass (kg) 59.5.±5.5] gave informed consent to participate in the study. A within-group [each subject acted as their
own control], balanced and randomized treatment design was used. A whole body heavy resistance exercise protocol using barbells [3sets 8-10
RM, 2.0-2.5 min rest] consisting of a back squat, bench press, stationary lunge, bent over row, Romanian dead lift, biceps curl, sit-ups and high
pull from a hang was performed after which the subject showered and put on a whole body compression garment (CG) (75% Nylon and 25%
Spandex,) or just wore her normal non-compression clothing (CON). Subjects were then tested 24 hr later in the laboratory immediately after
they removed the compression garment and put on their workout attire on in order to determine recovery differences between conditions.
Nutritional intakes, activity, and behavioral patterns (e.g., no pain medications, ice or long showers over the 24 hr) were replicated with test
protocol sequences separated by 72 hours. Dependent measures included, sleep quality, vitality rating, resting fatigue rating, muscle soreness,
muscle swelling via ultrasound, reaction movement times, bench throw power, countermovement vertical jump power (CMVJ), and serum con-
centrations of creatine kinase (CK) measured from a blood sample obtained via venipuncture of an arm vein. An analysis of variance was used to
determine differences between treatments and P ≤0.05 was defined as significance in this study. Results: There was no significant difference in
sleep quality between conditions; vitality rating, with 7 the highest rating, the CG [6.0+0.6]was significantly higher than CON [3.2+0.6], resting fa-
tigue was significantly lower in CG [1.86+1.28] vs CON [3.58+1.84], muscle soreness was significantly lower in CG [1.52+0.56] vs CON [2.92+1.34],
muscle swelling was significantly lower in CG [19.3+1.3 cm] vs CON [21.7+1.2, cm], no differences were observed in reaction/movement time,
bench press throw power was significantly higher in CG [239.5+56.3 W] vs CON [173.2.+18.5 W], no differences for CMVJ, and resting CK was
significantly lower in CG [119.1+52.9 IU/L] vs CON [266.6+185.6 IU/L]. Conclusions: A whole body compression garment worn during the 24 hr
recovery period after an intense heavy resistance training workout enhances various psychological, physiological and performance markers of
recovery compared to control garment conditions. Practical Applications: The use of compression has been previously shown to help athletic
performance, reduce damage from soft tissue injury and now it appears that compression can help in the recovery process from an intense
resistance training workout in women.

AbstractsG – I
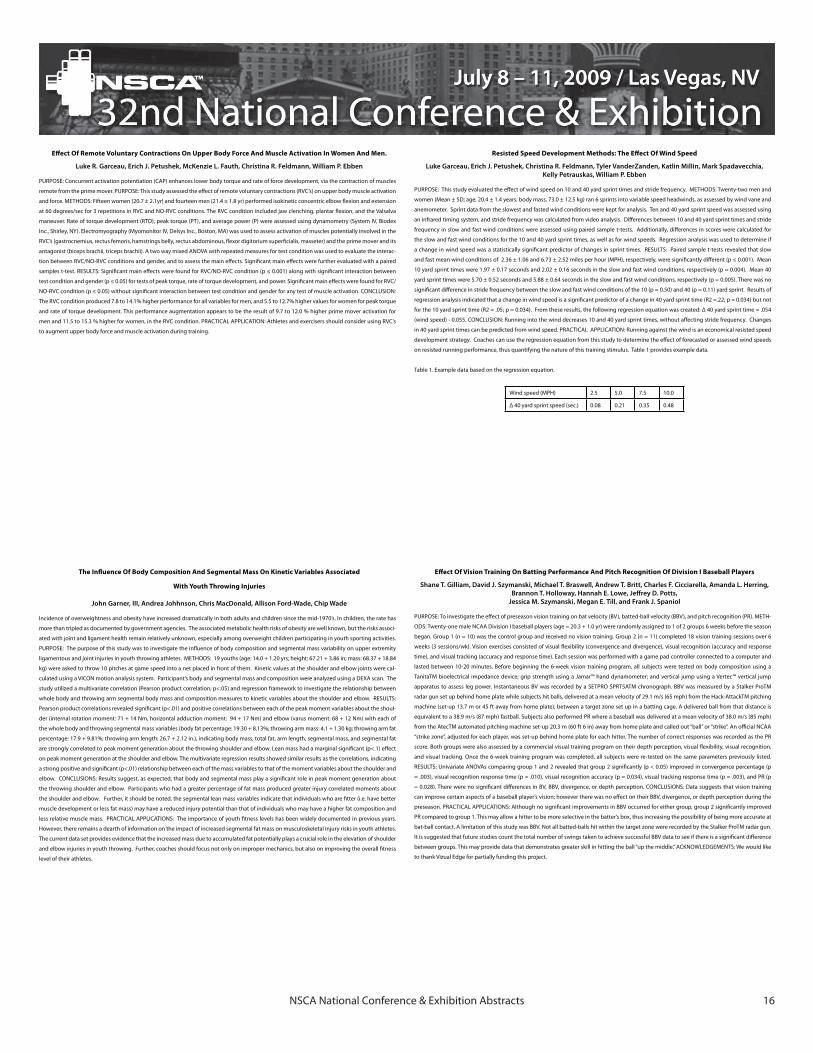
NSCA National Conference & Exhibition Abstracts 16
Effect Of Vision Training On Batting Performance And Pitch Recognition Of Division I Baseball Players
Shane T. Gilliam, David J. Szymanski, Michael T. Braswell, Andrew T. Britt, Charles F. Cicciarella, Amanda L. Herring, Brannon T. Holloway, Hannah E. Lowe, Jeffrey D. Potts,
Jessica M. Szymanski, Megan E. Till, and Frank J. Spaniol
PURPOSE: To investigate the effect of preseason vision training on bat velocity (BV), batted-ball velocity (BBV), and pitch recognition (PR). METH-
ODS: Twenty-one male NCAA Division I baseball players (age = 20.3 + 1.0 yr) were randomly assigned to 1 of 2 groups 6 weeks before the season
began. Group 1 (n = 10) was the control group and received no vision training. Group 2 (n = 11) completed 18 vision training sessions over 6
weeks (3 sessions/wk). Vision exercises consisted of visual flexibility (convergence and divergence), visual recognition (accuracy and response
time), and visual tracking (accuracy and response time). Each session was performed with a game pad controller connected to a computer and
lasted between 10-20 minutes. Before beginning the 6-week vision training program, all subjects were tested on body composition using a
TanitaTM bioelectrical impedance device; grip strength using a Jamar™ hand dynamometer; and vertical jump using a Vertec™ vertical jump
apparatus to assess leg power. Instantaneous BV was recorded by a SETPRO SPRT5ATM chronograph. BBV was measured by a Stalker ProTM
radar gun set up behind home plate while subjects hit balls, delivered at a mean velocity of 29.1 m/s (65 mph) from the Hack-AttackTM pitching
machine (set-up 13.7 m or 45 ft away from home plate), between a target zone set up in a batting cage. A delivered ball from that distance is
equivalent to a 38.9 m/s (87 mph) fastball. Subjects also performed PR where a baseball was delivered at a mean velocity of 38.0 m/s (85 mph)
from the AtecTM automated pitching machine set-up 20.3 m (60 ft 6 in) away from home plate and called out “ball” or “strike”. An official NCAA
“strike zone”, adjusted for each player, was set-up behind home plate for each hitter. The number of correct responses was recorded as the PR
score. Both groups were also assessed by a commercial visual training program on their depth perception, visual flexibility, visual recognition,
and visual tracking. Once the 6-week training program was completed, all subjects were re-tested on the same parameters previously listed.
RESULTS: Univariate ANOVAs comparing group 1 and 2 revealed that group 2 significantly (p < 0.05) improved in convergence percentage (p
= .003), visual recognition response time (p = .010), visual recognition accuracy (p = 0.034), visual tracking response time (p = .003), and PR (p
= 0.028). There were no significant differences in BV, BBV, divergence, or depth perception. CONCLUSIONS: Data suggests that vision training
can improve certain aspects of a baseball player’s vision; however there was no effect on their BBV, divergence, or depth perception during the
preseason. PRACTICAL APPLICATIONS: Although no significant improvements in BBV occurred for either group, group 2 significantly improved
PR compared to group 1. This may allow a hitter to be more selective in the batter’s box, thus increasing the possibility of being more accurate at
bat-ball contact. A limitation of this study was BBV. Not all batted-balls hit within the target zone were recorded by the Stalker ProTM radar gun.
It is suggested that future studies count the total number of swings taken to achieve successful BBV data to see if there is a significant difference
between groups. This may provide data that demonstrates greater skill in hitting the ball “up the middle.” ACKNOWLEDGEMENTS: We would like
to thank Vizual Edge for partially funding this project.
The Influence Of Body Composition And Segmental Mass On Kinetic Variables Associated
With Youth Throwing Injuries
John Garner, III, Andrea Johhnson, Chris MacDonald, Allison Ford-Wade, Chip Wade
Incidence of overweightness and obesity have increased dramatically in both adults and children since the mid-1970’s. In children, the rate has
more than tripled as documented by government agencies. The associated metabolic health risks of obesity are well known, but the risks associ-
ated with joint and ligament health remain relatively unknown, especially among overweight children participating in youth sporting activities.
PURPOSE: The purpose of this study was to investigate the influence of body composition and segmental mass variability on upper extremity
ligamentous and joint injuries in youth throwing athletes. METHODS: 19 youths (age: 14.0 + 1.20 yrs; height: 67.21 + 3.86 in; mass: 68.37 + 18.84
kg) were asked to throw 10 pitches at game speed into a net placed in front of them. Kinetic values at the shoulder and elbow joints were cal-
culated using a VICON motion analysis system. Participant’s body and segmental mass and composition were analyzed using a DEXA scan. The
study utilized a multivariate correlation (Pearson product correlation; p<.05) and regression framework to investigate the relationship between
whole body and throwing arm segmental body mass and composition measures to kinetic variables about the shoulder and elbow. RESULTS:
Pearson product correlations revealed significant (p<.01) and positive correlations between each of the peak moment variables about the shoul-
der (internal rotation moment: 71 + 14 Nm, horizontal adduction moment: 94 + 17 Nm) and elbow (varus moment: 68 + 12 Nm) with each of
the whole body and throwing segmental mass variables (body fat percentage: 19.30 + 8.13%; throwing arm mass: 4.1 + 1.30 kg; throwing arm fat
percentage: 17.9 + 9.81%; throwing arm length: 26.7 + 2.12 in.), indicating body mass, total fat, arm length, segmental mass, and segmental fat
are strongly correlated to peak moment generation about the throwing shoulder and elbow. Lean mass had a marginal significant (p<.1) effect
on peak moment generation at the shoulder and elbow. The multivariate regression results showed similar results as the correlations, indicating
a strong positive and significant (p<.01) relationship between each of the mass variables to that of the moment variables about the shoulder and
elbow. CONCLUSIONS: Results suggest, as expected, that body and segmental mass play a significant role in peak moment generation about
the throwing shoulder and elbow. Participants who had a greater percentage of fat mass produced greater injury correlated moments about
the shoulder and elbow. Further, it should be noted, the segmental lean mass variables indicate that individuals who are fitter (i.e. have better
muscle development or less fat mass) may have a reduced injury potential than that of individuals who may have a higher fat composition and
less relative muscle mass. PRACTICAL APPLICATIONS: The importance of youth fitness levels has been widely documented in previous years.
However, there remains a dearth of information on the impact of increased segmental fat mass on musculoskeletal injury risks in youth athletes.
The current data set provides evidence that the increased mass due to accumulated fat potentially plays a crucial role in the elevation of shoulder
and elbow injuries in youth throwing. Further, coaches should focus not only on improper mechanics, but also on improving the overall fitness
level of their athletes.
Resisted Speed Development Methods: The Effect Of Wind Speed
Luke Garceau, Erich J. Petushek, Christina R. Feldmann, Tyler VanderZanden, Katlin Millin, Mark Spadavecchia, Kelly Petrauskas, William P. Ebben
PURPOSE: This study evaluated the effect of wind speed on 10 and 40 yard sprint times and stride frequency. METHODS: Twenty-two men and
women (Mean ± SD; age, 20.4 ± 1.4 years; body mass, 73.0 ± 12.5 kg) ran 6 sprints into variable speed headwinds, as assessed by wind vane and
anemometer. Sprint data from the slowest and fasted wind conditions were kept for analysis. Ten and 40 yard sprint speed was assessed using
an infrared timing system, and stride frequency was calculated from video analysis. Differences between 10 and 40 yard sprint times and stride
frequency in slow and fast wind conditions were assessed using paired sample t-tests. Additionally, differences in scores were calculated for
the slow and fast wind conditions for the 10 and 40 yard sprint times, as well as for wind speeds. Regression analysis was used to determine if
a change in wind speed was a statistically significant predictor of changes in sprint times. RESULTS: Paired sample t-tests revealed that slow
and fast mean wind conditions of 2.36 ± 1.06 and 6.73 ± 2.52 miles per hour (MPH), respectively, were significantly different (p ≤ 0.001). Mean
10 yard sprint times were 1.97 ± 0.17 seconds and 2.02 ± 0.16 seconds in the slow and fast wind conditions, respectively (p = 0.004). Mean 40
yard sprint times were 5.70 ± 0.52 seconds and 5.88 ± 0.64 seconds in the slow and fast wind conditions, respectively (p = 0.005). There was no
significant difference in stride frequency between the slow and fast wind conditions of the 10 (p = 0.50) and 40 (p = 0.11) yard sprint. Results of
regression analysis indicated that a change in wind speed is a significant predictor of a change in 40 yard sprint time (R2 =.22; p = 0.034) but not
for the 10 yard sprint time (R2 = .05; p = 0.034). From these results, the following regression equation was created: Δ 40 yard sprint time = .054
(wind speed) - 0.055. CONCLUSION: Running into the wind decreases 10 and 40 yard sprint times, without affecting stride frequency. Changes
in 40 yard sprint times can be predicted from wind speed. PRACTICAL APPLICATION: Running against the wind is an economical resisted speed
development strategy. Coaches can use the regression equation from this study to determine the effect of forecasted or assessed wind speeds
on resisted running performance, thus quantifying the nature of this training stimulus. Table 1 provides example data.
Table 1. Example data based on the regression equation.
Wind speed (MPH) 2.5 5.0 7.5 10.0
Δ 40 yard sprint speed (sec.) 0.08 0.21 0.35 0.48
Effect Of Remote Voluntary Contractions On Upper Body Force And Muscle Activation In Women And Men.
Luke R. Garceau, Erich J. Petushek, McKenzie L. Fauth, Christina R. Feldmann, William P. Ebben
PURPOSE: Concurrent activation potentiation (CAP) enhances lower body torque and rate of force development, via the contraction of muscles
remote from the prime mover. PURPOSE: This study assessed the effect of remote voluntary contractions (RVC’s) on upper body muscle activation
and force. METHODS: Fifteen women (20.7 ± 2.1yr) and fourteen men (21.4 ± 1.8 yr) performed isokinetic concentric elbow flexion and extension
at 60 degrees/sec for 3 repetitions in RVC and NO-RVC conditions. The RVC condition included jaw clenching, plantar flexion, and the Valsalva
maneuver. Rate of torque development (RTD), peak torque (PT), and average power (P) were assessed using dynamometry (System IV, Biodex
Inc., Shirley, NY). Electromyography (Myomonitor IV, Delsys Inc., Boston, MA) was used to assess activation of muscles potentially involved in the
RVC’s (gastrocnemius, rectus femoris, hamstrings belly, rectus abdominous, flexor digitorium superficialis, masseter) and the prime mover and its
antagonist (biceps brachii, triceps brachii). A two way mixed ANOVA with repeated measures for test condition was used to evaluate the interac-
tion between RVC/NO-RVC conditions and gender, and to assess the main effects. Significant main effects were further evaluated with a paired
samples t-test. RESULTS: Significant main effects were found for RVC/NO-RVC condition (p ≤ 0.001) along with significant interaction between
test condition and gender (p ≤ 0.05) for tests of peak torque, rate of torque development, and power. Significant main effects were found for RVC/
NO-RVC condition (p ≤ 0.05) without significant interaction between test condition and gender for any test of muscle activation. CONCLUSION:
The RVC condition produced 7.8 to 14.1% higher performance for all variables for men, and 5.5 to 12.7% higher values for women for peak torque
and rate of torque development. This performance augmentation appears to be the result of 9.7 to 12.0 % higher prime mover activation for
men and 11.5 to 15.3 % higher for women, in the RVC condition. PRACTICAL APPLICATION: Athletes and exercisers should consider using RVC’s
to augment upper body force and muscle activation during training.

NSCA National Conference & Exhibition Abstracts 17
The Relationship Between The Eccentric Utilization Ratio, Reactive Strength, And Pre-Stretch Augmentation And Selected Dynamic And Isometric Muscle Actions.
G. Haff, R. Ruben, M. Molinari, K. Painter, M.W. Ramsey, M.E. Stone, and M.H. Stone
The ability to use the stretch shortening cycle (SSC) is essential for many sporting activities. There are several approaches by which to assess
the SSC. These include the eccentric utilization ratio (EUR), the reactive strength calculation (RSC), and the percent pre-stretch augmentation
(PPA). These measures are typically quantified for vertical jump displacements and power outputs. The assessment of the SSC activity via jump-
ing activities may yield valuable information of the athletes training status and potential training interventions to improve SSC performance.
PURPOSE: To determine if EUR, RSC and PPA are related to dynamic and isometric muscle actions. METHODS: Twenty seven college track athletes
(age=19.6±1.0 y; body mass = 83.0±25.2 kg; height=176.9±8.8 cm) performed three types of countermovement vertical jumps (CMJ) and static
vertical jumps (SJ) on a force plate. Both CMJ and SJ were performed in unloaded and loaded (11 kg and 20 kg) conditions. All jump data were
analyzed for vertical displacement, peak force (PF), and rate of force development (RFD). The EUR (CMJ/SJ), RSC (CMJ-SJ), and PPA ((CMJ-SJ)/SJ)
x 100) were calculated for jump height, peak power, and peak force Additionally, subjects performed 2 isometric mid-thigh pull with previously
established methods. The isometric mid-thigh pulls were analyzed for PF and RFD. Finally, each subject performed a one repetition maximum
back squat test (1-RM) and a maximal ball throw test. RESULTS: There were no significant correlations between the EUR (jump height, PP, PF) for
loaded or unloaded jumps and back squat, ball throw, isometric PF, and RFD. All EUR values were above 1, which is indicative of well trained ath-
letes. Significant inverse relationships were found between the PPA calculation for PF during the unloaded condition and squat 1-RM (r=-0.85),
ball throw distance (r=-0.74), and isometric PF (r=-0.55). Additionally, during the loaded conditions (11 and 20 kg) the PPA calculation for PF was
significantly correlated with the back squat 1-RM (11 kg: r=-0.89; 20kg: r=-0.81), ball throw distance (11 kg: r=-0.824; 20kg: r=-0.65), isometric PF
(11kg:r=-0.60; 20kg: r=-0.56), and the isometric RFD (11kg: r=-0.43; 20kg:r=-0.36). The PPA calculation for peak power during the loaded condi-
tions was significantly correlated with the 1-RM back squat (11kg; r=-0.89; 20kg: r=-0.62), ball throw (11kg: r=-0.72; 20kg: r= -0.56), isometric PF
(11kg: r=-0.47; 20kg:r=-0.40), isometric RFD (11kg: r=-0.43; 20kg: r=-0.42). The isometric RFD can be estimated by the equation: RFD = -58168.7
(PPA for PP 11kg) + 10866.415 or RFD=-142636.9 (PPA for PP 20 kg) + 10340.226. CONCLUSIONS: This study suggests that unloaded or loaded
PPA has a relationship with an athlete’s 1-RM in the back squat, the ball throw distance, and isometric PF generating capacity. Additionally, under
loaded conditions the PPA appears to be related to the isometric RFD. PRACTICAL APPLCIATIONS: The utilization of CMJ and SJ testing is common
place in strength and conditioning and the data calculated from these measures may yield valuable information about performance capacity.
The significant relationship between the 1-RM back squat and PPA suggests that strength is an underlying mechanism in the ability to utilize the
SSC. Additionally, the PPA assessment may be useful in predicting the isometric RFD.
Ingesting Amino Acid-Carbohydrate Prior To And During Consecutive Bouts Of Resistance Training Elevates Resting Energy Expenditure
Kyle Hackney, Andrew R. Kelleher, Lori L. Ploutz-Snyder
Increases in resting energy expenditure (REE) and decreases in the respiratory exchange ratio (RER) have been reported following a single bout
of resistance training (RT), indicating enhanced energy utilization and a greater reliance on lipids. It is hypothesized that elevations in REE oc-
cur because the synthesis of proteins following muscle damage is energetically expensive, requiring four adenosine-triphosphate equivalent
molecules for every amino acid added to the peptide chain. During this process, there may be a greater reliance on lipids in order to meet the
required energy need. Recently, a wealth of evidence suggests that timing the intake of amino acid-carbohydrate (AACHO) close to the RT session
can increase muscle protein synthesis and reduce indicators of muscle damage. Thus, this strategy could modulate REE and RER following RT and
have significant implications for body composition. PURPOSE: To determine the effect of timed AACHO intake with consecutive days of RT on REE,
RER, and rate of perceived muscle soreness (RPMS). METHODS: Ten resistance-trained, male participants (23 ± 0.8 yrs, 175 ± 3 cm, 77.8 ± 4 kg, 14 ±
2%) completed two separate seven-day trials in a double-blind counterbalanced design. In trial 1, REE, RER, and RPMS were assessed each morn-
ing (~6:30am) with days 1 and 2 serving as baseline. After assessments on days 2, 3, 4, and 5, ~979 kJ of either AACHO (22.5g protein, [6g essential
amino acids], 35g sugars) or carbohydrate only (CHO) (58.5g sugars) was consumed with RT (3 sets, 6 exercises, 75% 1 RM, lower body RT on days
2 and 4, upper body RT on days 3 and 5). Half of the supplement was provided immediately prior and the remaining amount was ingested during
each RT session. Follow-up assessments of REE, RER, and RPMS also occurred on days 6 and 7 of the trial. Total energy intake was monitored dur-
ing trial 1. In trial 2, all procedures were the same except the opposite supplement was provided. Nutritional intake during trial 1 was replicated
in trial 2. RESULTS: There were no differences in total energy intake between or within AACHO (132 ± 3.6 kJ · kg -1 · day -1) or CHO (136 ± 3.3 kJ ·
kg -1 · day -1, p > 0.05). However, protein intake was greater in AACHO (1.72 ± 0.06 g · kg-1 · day-1) compared to CHO (1.49 ± 0.04 g · kg-1 · day-1,
p < 0.05). A main effect of supplement condition was found for REE, indicating on average the elevation observed in AACHO (103 ± 1.4 kJ · kg -1
· day -1) was greater than CHO (99 ± 0.81 kJ · kg -1 · day -1, p < 0.05). Main effects for time were also determined for REE, RER, and RPMS (Table 1).
Variable Baseline Day 3 Day 4 Day 5 Day 6 Day 7
REE (kJ × kg -1 × day -1) 94.0 ± 3.63 105 ± 4.78* 102 ± 4.48* 102 ± 4.1* 103 ± 3.32* 102 ± 3.79*
RER (VCO2 × VO2-1) 0.83 ± 0.01 0.76 ± 0.01* 0.77 ± 0.02* 0.77 ± 0.01* 0.77 ± 0.01* 0.80 ± 0.02
RPMS (0-6 scale) 0.81± .035 1.1 ± 0.13* 1.83 ± 0.21* 1.50 ± 0.22* 0.92 ± 0.15* 0.19 ± 0.07
*Statistically greater than baseline, p < 0.05. Mean ± Standard Error.
Conclusion: When AACHO was provided prior to and during RT, post-exercise REE was increased ~7% above that of CHO. PRACTICAL APPLICA-
TIONS: Utilizing this simple strategy may increase energy utilization during the post-exercise period, which could facilitate reductions in body
fat composition.
The Effects Of Four Weeks Of High-Intensity Interval Training And Creatine Supplementation On Cardiorespiratory Fitness In College-Aged Men
Jennifer Graef, Kristina L. Kendall, David H. Fukuda, Abbie E. Smith, Jordan R. Moon, Travis W. Beck, Joel T. Cramer, and Jeffrey R. Stout
PURPOSE: The purpose of this study was to determine the effects of four weeks of interval training with concurrent creatine supplementa-
tion on cardiorespiratory fitness and endurance performance (maximal oxygen consumption (VO2PEAK), time-to-exhaustion (VO2PEAKTTE),
ventilatory threshold (VT), and total work done (TWD)) in college-aged men. METHODS: Forty-three recreationally active college-aged men
(Age: 23.5±4.8 yrs; VO2PEAK: 43.9±9.9 ml∙kg∙min-1) volunteered to participate in this double-blind, placebo-controlled study. Participants were
randomly assigned to one of three groups: creatine (Cr—5g Cr plus 15g flavored dextrose; n=16), placebo (PL—20g flavored dextrose; n=17),
or control (n=10) groups. Each supplement group ingested the assigned supplement twice daily on training days only (10g/day, 5 days/week).
Prior to and following supplementation, each participant performed a continuous maximal oxygen consumption test (VO2PEAK) on a cycle
ergometer (Corival Lode, Gronigen, the Netherlands), which was further used to establish VO2PEAKTTE (seconds) and VT (l∙min-1). Participants
were further assessed for TWD (kJ), calculated from the total time (T; seconds) completed at a workload corresponding to 110% of their maximal
power output (watt, W) determined from the maximal oxygen consumption test [TWD (kJ)= (T x W)/1000]. Following initial testing, a two week
familiarization period of training and supplementing occurred. Baseline values were then measured and all participants in the Cr and PL groups
engaged in four weeks of high-intensity interval training (HIIT) training on a cycle ergometer. Each training session consisted of 5 bouts of a 2:1
minute cycling work to rest ratio, introduced in an undulating progression starting at 80% VO2PEAK power output and reaching 120%. Separate
two-way ANOVAs (group [Cr vs. PL vs. CON] x time [Baseline- vs. Post-]) were used to identify any group by time interactions. RESULTS: A sig-
nificant time x treatment interaction occurred for VO2PEAK (p < 0.001) and VO2PEAKTTE (p < 0.001). Post hoc analyses indicated no significant
differences between groups. Both groups increased in VO2PEAK (Cr: 7.5%; Pl: 9.6%) and VO2PEAKTTE (Cr: 6.2%; PL: 7.4%) following four weeks of
HIIT. A significant time x treatment interaction occurred for VT (p = 0.040). Post hoc analyses indicated improvements in only the Cr (p = 0.001;
16.4% increase) group over time. No changes were observed in TWD in any group over time. CONCLUSIONS: Both VO2PEAK and VO2PEAKTTE
improved following four weeks of HIIT. Cr supplementation seemed to only have an effect on VT, since improvements were observed in the Cr
group while there were no changes in the PL group. TWD did not change following HIIT or Cr supplementation. PRACTICAL APPLICATIONS: HIIT
seems to be an effective and time-efficient way to improve maximal endurance performance. The addition of Cr seemed to improve VT, but did
not increase TWD. Therefore, 10g of Cr per day for 5 days per week does not seem to further augment maximal oxygen consumption, greater
than HIIT alone; however, Cr supplementation may improve submaximal exercise performance.
The Effects of Caffeine Supplementation on Strength and Muscular Endurance in Resistance-Trained Women
Erica Goldstein, Patrick Jacobs, Jose Antonio, Michael Whitehurst, Tina Penhollow
The role of caffeine supplementation in strength and power performance is progressively emerging, but with varied results. Moreover, research
that has specifically examined the effects of caffeine in strength and women is limited. PURPOSE: To determine the acute effects of caffeine
supplementation on strength and muscular endurance in resistance-trained women. METHODS: In a randomized, double-blind crossover de-
sign, fifteen women (mean ± SD age = 25 ± 7 yrs; body mass = 64 ± 8 kg; height = 166 ± 9 cm) consumed caffeine (6 mg/kg) or placebo (PL) in
randomized order, seven days apart. Sixty min following supplementation, participants performed a one-repetition maximum (1RM) barbell
bench press test and repetitions to failure at 60% of 1RM. Heart rate, blood pressure (systolic and diastolic), and rating of perceived exertion were
assessed at rest, 60 minutes post-consumption, and immediately following completion of repetitions to failure. A one-way ANOVA for repeated
measures was used to analyze potential differences between caffeine and placebo conditions. RESULTS: Analysis indicated a significantly greater
bench press maximum with caffeine (p≤0.05) (52.9 ± 11.1 kg vs. 52.1 ± 11.7 kg) with no significant differences between conditions in 60% 1RM
repetitions (p=0.81). The only statistically significant differences between conditions in physiological measures was a greater systolic blood pres-
sure immediately following exercise, with caffeine (p<0.05) (116.8 ± 5.3 mmHg vs. 112.9 ± 4.9 mmHg). CONCLUSIONS: Our findings indicate that
caffeine appears to be effective for improving upper extremity strength in resistance-trained women. PRACTICAL APPLICATIONS: A moderate
dose of caffeine may be sufficient for enhancing strength performance in resistance-trained women.
NSCA National Conference & Exhibition Abstracts 18
The Effects Of An Acute Resistance Exercise Bout On Insulin Like Growth Factor-I And 3 Binding Proteins In Well-Trained Men And Women
Disa L. Hatfield, Kraemer W.J., Vingren J.L., Anderson J.M., Volek J.S., Nindl B.C., Thomas G.A., Ho J.Y., Fragala M.S., and Maresh C.M.
Introduction: Insulin-Like Growth Factor I (IGF-I), known to mediate many of the growth and repair processes of skeletal muscle in response to
long term resistance training, is acutely and chronically regulated by its family of six binding proteins (BPs). In contrast to the circulating con-
centrations of IGF-I, the IGFBP’s show a more consistent response to an acute bout of resistance exercise, despite receiving less attention in the
literature than circulating IGF-I. Furthermore, gender differences in the responses of the IGFBPs to resistance exercise have not been examined.
Purpose: Thus, the primary purpose of this investigation was to assess the response of IGF-I and three IGFBPs (IGFBP-1, -2, and -3) to an acute
resistance exercise bout in well-trained men and women. Methods: Eight men (BM: 87.0±18.5 kg; Ht: 175.3±6.7 cm; Age: 21±1 yrs) and seven
women (BM: 76.4±8.8 kg; Ht: 164.6±6.7 cm; Age: 24±5 yrs) volunteered to participate in this study. Each subject performed an acute resistance
exercise bout and blood was collected pre-, immediately post- (IP), and 70 minutes (+70) post-exercise. Results: Women had significantly (P≤
0.05) higher concentrations of IGF-I and IGFBP-3 at rest and IP, although exercise-induced increases in circulating IGF-I were observed in both
genders. Significant (P≤ 0.05) exercise-induced increases were observed for IGFBP-1 in the women at IP and +70 and at +70 in the men, and for
IGFBP-2 at IP in both genders. Conclusion: The results from this study demonstrate the dynamic nature of IGF-I and its family of BPs and illustrate
potential gender differences in the regulation of IGF-I bioavailability surrounding an acute bout of resistance exercise. Practical Applications:
Since the IGFBPs are greatly affected by nutrition, training, and gender, a better understanding of the dynamics of the IGF-I family surrounding a
resistance training bout may be used to prescribe dietary and training regimes in order to optimize their response.
Effects Of Concentric And Eccentric Muscle Contractions On Il-6 Signaling In Human Skeletal Muscle And Downstream Regulation Of Hsp-72 Gene Expression
Travis Harvey, Brian D. Shelmadine, Jennifer J. Moreillon, Jason Liang, Lori Greenwood, Mike Greenwood, Richard Kreider, and Darryn Willoughby
Inflammation response in exercise of healthy humans is significantly different than that which is commonly reported for chronic inflammatory
conditions. Regardless of the scenario, cytokines such as Tumor Necrosis Factor (TNF)-α and Interleukin (IL)-1b have demonstrated pro-inflam-
matory functions, while IL-6 has demonstrated versatile pro- and anti-inflammatory roles when exercise is a factor. Prolonged skeletal muscle
contractions of sufficient intensity have been shown to induce significant muscle protein damage and a complex inflammatory cascade involv-
ing IL-6 and, separately, Heat Shock Proteins (HSP), and components of the Mitogen-Activated Protein Kinase (MAPK) pathway. This cascade not
completely understood in any scenario, particularly in humans. Thus the role of inflammation in regards to exercise, particularly resistance train-
ing, has not been elucidated. PURPOSE: To determine the effects of concentric (CON) and eccentric (ECC) contractions on creatine kinase (CK),
lactate dehydrogenase (LDH), and IL-6 signaling in regards to IL-1b, TNF-α, HSP-72, Nuclear Factor-kappa B (NF-кB), p38 MAPK, Signal Transducer
and Activator of Transcription (STAT)-1 and STAT-3 and the potential cytoprotection HSP-27. METHODS: Six active males (19.33 ± 1.03 yrs; 181.94
± 6.40 cm; 72.83 ± 12.78 kg) participated in two separate bouts of 10 X 10 unilateral isokinetic knee extensions at 30°/sec. Each bout consisted of
either CON or ECC contractions on either the right or left leg; each contraction type and leg was utilized once for each subject. Isokinetic strength
tests were performed five days pre- and 24 and 48 hours post-exercise. Serum CK, LDH, IL-6, IL-1b, and TNF-α were assessed immediately pre-
exercise (PRE), immediately post-exercise (PX), and at 2, 6, 24, and 48 hr PX. IL-6, HSP-27, and HSP-72, NF-кB, p38 MAPK, STAT-1 and STAT-3 protein
and mRNA expression of IL-6, HSP-27, and HSP-72 were assessed from vastus lateralis biopsies (Bergstrom ) collected at PRE, PX, and 2 and 6 hr
PX. Repeated measures MANOVAs and subsequent univariate analyses were performed on all data. RESULTS: Peak torque decreased (p < 0.05) at
24 and 48 hr PX. CK, but not LDH, increased (p < 0.05) similarly following CON and ECC. Serum cytokines were different (p < 0.05) between CON
and ECC, but did not change over time. In muscle, NF-кB (p < 0.05) increased and STAT-1 decreased (p < 0.05). ECC contractions demonstrated
significantly greater expression for IL-6, p38 MAPK, and STAT-3 than did CON, with a trend (p = 0.093) for STAT-1. There was significant CON/ECC
interaction among NF-кB and STAT-1 and a trend (p = 0.074) for HSP-72. Skeletal muscle mRNA expression demonstrated no significant results.
CONCLUSIONS: Both CON and ECC bouts demonstrated muscle damage and fatigue, but were not sufficient to induce a systemic inflammatory
response. Intramuscular inflammatory response was most robust for NF-кB and STAT-1. The hypothesis of ECC stimulating the IL-6 pathway more
so than CON is supported the relationship in expression of IL-6, p38 MAPK, STAT-1 and STAT-3. PRACTICAL APPLICATIONS: This is novel evidence
of a relationship among these factors. Bouts of resistance exercise that include ECC contractions can favorably affect the exercise inflammation
response; perhaps more so than lower intensity CON-only contractions.
Power And Muscular Endurance Repeatability With 48 Hours Rest
Kelley Hammond, Brian K. Schilling, Adrianna A. Weber, Richard J. Bloomer, Lawrence W. Weiss, Lucas C. Ferreira
Purpose: Athletes often perform intense workouts with short intervals between sessions. The purpose of this investigation was to examine the
ability to repeat a high volume chest press workout following a 48 hour rest interval between sessions, as part of a larger intervention. Methods:
15 resistance trained men (age 26±4) were recruited from the university population. Subjects performed a one-repetition maximum (1RM) in the
bench press exercise on a machine device that allowed independent movement of each arm (Hammer Strength™). Two to four minutes of rest
was given between attempts. The highest load lifted in good form was recorded as their 1RM. The following week subjects reported to the lab
for two testing sessions 48 hours apart. Power testing was measured by performing bench press throws (BPT) using a weight equivalent to 30%
of predetermined machine 1-RM using a ProSpot® device. This apparatus utilizes a self spotting mechanism that contains an electronic sensor,
allowing the subject to release the bar at the end range of motion, ensuring a ballistic measure. The subjects laid on a flat bench placed on a
uniaxial force plate (Roughdeck) and a position transducer was tethered to the center of the ProSpot® barbell. The first derivative of position with
respect to time was taken to calculate velocity of the barbell (Datapak5) and multiplied by force to calculate power (Watts). Data was sampled at
1000Hz and low-pass filtered with a cutoff frequency of 30 Hz. Three BPTs were performed with 90 seconds rest between each effort. The best
power output of the 3 BPTs was recorded. Subjects were then given 10 minutes of rest before performing 10 sets of the bench press exercise
using a load equal to 60% of 1RM. Each set was performed to a point of momentary muscular failure, using a controlled speed. Subjects were
given 90 seconds of rest between each set. Results: No significant differences were observed in power output, 1st set repetitions, total repeti-
tions, mean reps, or volume load from day 1 to day 2 (see table). Although not statistically significant, bench press power was decreased from
day 1 to day 2 of testing (2.3%), while bench press endurance measures were slightly increased from day 1 to day 2 of testing (3.2% total reps,
3.6% total volume load). Conclusion: A 48 hour rest interval is sufficient for recovery of power and repeatability of muscular endurance workouts
in resistance trained men. Further research is needed to examine the repeatability of shorter or longer rest intervals between workouts. Practical
Application: Coaches can design periodized training programs that allow for high-volume muscle group training sessions to be repeated at 48
hours at certain times of the training cycle.
Variable Day 1 Day 2
Bench press power (W) 2038±132 1945±132
Reps 1st set 21±1 21±1
Total reps 76±4 81±5
Mean reps 8±1 8±1
Total volume load (kg) 6728±416 7233±537
Mean volume load (kg) 673±42 723±54
Effect Of Load On Bar, Body And System Power Output In The Power Clean
Tracie Haines, Jeffrey M. McBride, Jared Skinner, Mark Woodall, Tony R. Larkin, Tyler J. Kirby, Andrea M. Dayne
Various methods of calculation can affect power output values in the power clean. This may be due to analysis of the bar, body and system using
different kinetic and kinematic variables. PURPOSE: The purpose of this study was to utilize the combination of a force plate and videography
to determine power output of the bar, the body, and the system independent of one another. METHODS: Seven college-aged males (height
= 175.29±5.47 cm, weight = 80.84±7.18 kg, age = 24.7±2.06 yr, 1RM = 97.14±6.36 kg) with at least one year experience in the power clean
performed two sets of one repetition each at 30, 40, 50, 60, 70, 80, and 90% of their 1 repetition maximum (1RM) in a randomized order. Force,
power, and velocity were obtained for the bar, body and system independently. RESULTS: Peak power (PP) of the bar was found to be at 90% of
1RM (2308±229.1 W), PP of the body at 90% of 1RM (1077±538.7 W) and PP of the system at 80% of 1RM (1768±470.7 W). Significant differences
(p ≤ 0.05) in PP were found between the bar and body at 40%, 50%, 60%, and 70% of 1RM, while 60% of 1RM also showed significant differences
between the system and body. Significant differences between the bar, body and system occurred at 80% and 90% of 1RM for PP. Peak velocity
(PV) occurred for the bar, body and system at 30% of 1RM (Bar PV 30% = 2.38±0.15 m/s), 30% of 1RM (Body PV 30% = 0.79±0.21 m/s) and 60% of
1RM (System PV 60% = 0.90±0.16 m/s), respectively. Every load displayed significant differences in PV between the bar and body and between
the bar and system, except for 60% of 1RM, where a significant difference occurred between the bar, body, and system. Peak force (PF) was high-
est at 90% of 1RM for the bar (1291±72.9 N), while both the body and system PF occurred at 80% of 1RM (Body PF 80% = 1505±270.1 N, System
PF 80% = 2797±618.2 N). Significant differences in peak force were found between the bar, body and system at every load, except 90% of 1RM
where significant differences were between the bar and body and between the bar and system. CONCLUSION: In conclusion, bar, body, and
system values for PP, PV, and PF are influenced differently across the loading spectrum. PRACTICAL APPLICATION: Proper training loads for the
power clean maybe influenced by whether PP of the bar, body or system is desired.

NSCA National Conference & Exhibition Abstracts 19
Correlation Between Muscle Fiber Cross-Sectional Area And Strength Gain Using Three Different Resistance-Training Programs In College-Aged Women
Jennifer R. Herman, Sharon R. Rana, Gary S. Chleboun, Roger M. Gilders, Fredrick C. Hageman, Robert S. Hikida, Michael R. Kushnick, Kerry E. Ragg, Robert S. Staron, Kumika Toma
Purpose: The purpose of this investigation was to report the formerly uninvestigated relationship between previously reported muscle fiber
cross-sectional area and muscle performance changes for college-aged women using one of three resistance-training methods. Methods: Thirty-
four healthy adult females (21.1±2.7 y) were randomly divided into four groups: control (C), traditional strength training (TS), traditional endur-
ance training (TE), and low velocity training (LV). Workouts consisted of three exercises: leg press, back squat, and knee extension. Each subject
was pre- and post-tested for 1 Repetition Maximum (1-RM), and relative muscular endurance (60% 1-RM). Pre- and post-training vastus lateralis
muscle biopsies were also analyzed for fiber cross-sectional area (CSA). For each training session, TS trained at 6-10 RM (6-10 repetitions to failure)
with 1-2 s concentric/1-2 s eccentric; TE trained at 20-30 RM (1-2 s concentric/1-2 s eccentric); and LV trained at 6-10 RM, with 10 s concentric/4 s
eccentric. Both TE and LV trained at the same relative intensity (40-60% 1RM), whereas TS trained at 80-85% 1RM. Each training group attended a
minimum of 16 out of 17 training sessions in which the exercises were performed to fatigue for each of 3 sets. For this investigation, the percent
change in strength (%strength) was averaged across the three exercises, as was the percent change in number of repetitions (%reps) and volume
(%vol) performed during the muscular endurance test (volume was calculated as load times repetitions performed). Results: Significance was set
at an alpha of 0.05. The %strength was significantly greater for TS compared to all other groups and also for LV as compared to C. The %vol was
significantly greater for TS as compared to LV and C, and LV and TE as compared to C. The %reps was significantly greater for TE as compared to
C. As previously reported, percent change in CSA for type I, IIa, and mean CSA was significantly greater for TS as compared to all other groups,
and for type IIx, TS was significantly greater than C only. The %strength was significantly correlated with percent change in CSA for type I, IIa
and mean CSA, %vol was correlated with percent change in CSA for type IIa and mean CSA, and there were no significant correlations between
%reps and any percent change in CSA. Conclusions: Strength gains are correlated with increases in type I and IIa, as well as mean CSA. Changes
in muscle endurance as found by changes in number of repetitions at a relative % 1-RM are not correlated with changes in CSA. However, when
using volume instead of repetitions, muscle endurance is correlated to muscle fiber CSA changes. Practical Application: It appears that the higher
load used with TS is associated with the highest percent increases in both strength and muscle fiber CSA, and is therefore the most beneficial
training method of the three presented if considering these outcomes.
Relationships Among Muscle Fiber Type, Mechanomyographic, And Electromyographic Amplitude
Response Patterns During Ramped Isometric Muscle Actions
Trent Herda, Terry J. Housh, Andrew C. Fry, Travis W. Beck, Joseph P. Weir, Brian K. Schilling, Eric D. Ryan, Joel T. Cramer
PURPOSE: The purpose of this study was to examine the mechanomyographic (MMGRMS) and electromyographic (EMGRMS) amplitude vs. force
relationships of the vastus lateralis (VL) for aerobically-trained (AT), resistance-trained (RT), and sedentary individuals (SED). METHODS: Five RT
(mean ± SD age = 23 ± 3 yrs; body mass = 101 ± 37 kg; height = 176 ± 8 cm), 5 AT (32 ± 5 yrs; 67 ± 4 kg; 176 ± 2 cm), and 5 SED (23 ± 4 yrs; 93 ±
32 kg; 180 ± 5 cm) men volunteered to perform two 6-s isometric ramp muscle actions from 5% to 100% of their maximal voluntary contraction
(MVC) while MMG (m∙s-2) and EMG (μV) signals were recorded from the VL muscle. Thigh skinfold measurements and Bergstrom muscle biopsies
were taken from the VL. The muscle samples were analyzed for myosin heavy chain (MHC) isoform content. Simple linear regression models were
fit to the natural log-transformed EMGRMS and MMGRMS vs. force relationships. The slope (b term) and the antilog of the Y-intercept (a term)
were calculated for each relationship. RESULTS: For %MHC, the AT group had a greater percentage of type I fibers than the RT and SED groups
(P≤0.05). The RT group had a greater percentage of type IIa fibers than the AT group (P≤0.05), and the SED group had a greater percentage of
type IIx fibers than the AT and RT groups (P≤0.05). For both the log-transformed EMGRMS and MMGRMS vs. force relationships, the mean a term
for the AT group was higher than the RT and SED groups (P≤0.05). For the log-transformed MMGRMS vs. force relationships, however, the b term
for the AT group was lower than the RT and SED groups (P≤0.05). There were no differences (P>0.05) among the b terms of the AT, RT, and SED
groups for the log-transformed EMGRMS vs. force relationships. In addition, the mean skinfold for the SED group was higher than the AT group
(P≤0.05) (AT =8.7±2.2mm, RT=15.4±7.6mm, and SED=25.4±9.2mm). CONCLUSIONS: The group-related differences among the a terms for both
the log-transformed EMGRMS and MMGRMS patterns might be best explained by the group differences in skinfold thickness. However, the fact
that the AT group had a lower mean b term for the log-transformed MMGRMS vs. force relationships may suggest that the differences in motor
control strategies between individuals with predominantly type I vs. type II fibers in the vastus lateralis could be detectible with the MMG signal,
but not EMG. The lower b term for the AT group suggested that the MMG-force relationship may have been sensitive to the earlier achieve-
ment of rate coding, whereas the RT and SED groups relied more on motor unit recruitment to reach higher force levels. The b terms from the
EMGRMS vs. force relationships were unable to differentiate among the groups. PRACTICAL APPLICATIONS: The log-transformed MMGRMS, but
not EMGRMS, vs. force relationships may be useful as non-invasive measurements to determine the onset of rate coding, which may differ among
muscles that are predominantly type I vs. type II fiber types. Therefore, the MMG signal may offer an attractive, simple technique for examining
changes in the motor control strategies that govern incremental isometric force production.
A Comparison Of Critical Torque And The Electromyographic Mean Power Frequency Fatigue Threshold During Isometric Leg Extension
C. Hendrix, Terry J. Housh, Michelle Mielke, Clayton L. Camic, Jorge M. Zuniga, Glen O. Johnson, and Richard J. Schmidt.
Theoretically, the critical torque (CT) and electromyographic mean power frequency fatigue threshold (EMG MPFFT) demarcate fatiguing from
non-fatiguing isometric torque levels. PURPOSE: The purpose of this study was twofold: 1) to determine if the mathematical model for estimating
the electromyographic fatigue threshold (EMGFT) from the amplitude of the EMG signal was applicable to the frequency domain of the EMG
signal to estimate the EMG MPFFT; and 2) to compare the torque level derived from the CT test to that of the EMG MPFFT test for the vastus late-
ralis (VL) muscle during isometric muscle actions of the leg extensors. METHODS: Nine adults (4 men and 5 women; mean ± SD age = 21.6 ±1.2
yr) volunteered for this study. The first of five visits served as an orientation. Maximum voluntary isometric contraction (MVIC) was determined
during the second visit. During visits 2-5, each subject performed one continuous, fatiguing isometric muscle action to exhaustion to determine
the time to exhaustion (limit time; Tlim) at a randomly ordered percentage of MVIC (30%, 45%, 60%, or 75%). Surface EMG signals were recorded
during each fatiguing isometric muscle action. The slope coefficient of the linear relationship between total isometric “work” (Wlim in N∙m∙s =
Torque x Tlim) and Tlim was defined as the CT. The EMG MPFFT was defined as the y-intercept of the isometric torque versus slope coefficient
(EMG MPF versus time) plot. RESULTS: The paired-samples t-tests indicated that there were no significant (p > 0.05) mean differences between
absolute or %MVIC values for CT (25.3 ± 11.4 N∙m and 17.6 ± 5.8 %MVIC) and EMG MPFFT (29.8 ± 22.9 N∙m and 21.4 ± 8.7 %MVIC). CONCLUSION:
The results of the present study indicated that there were no differences in the isometric torque levels associated with fatigue thresholds esti-
mated from neuromuscular responses (EMG MPFFT) for the VL muscle and the torque versus duration relationship (CT). In addition, the current
findings indicated that the mean CT occurred at a torque level (17.6 %MVIC) that is typically not affected by circulatory occlusion (20 %MVIC).
It is likely, however, that continuous isometric muscle actions at the EMG MPFFT for the VL (21.4 %MVIC) muscle would be limited, in part, by
restricted blood flow to the working muscles. PRACTICAL APPLICATION: These findings indicated that the mathematical model used to estimate
the EMGFT during isometric muscle actions was applicable to the frequency domain of the EMG signal to estimate the EMG MPFFT. The tests
(EMGFT and EMG MPFFT), however, utilize different domains of the EMG signal (the EMGFT test is based on fatigue-induced increases in EMG
amplitude, while the EMG MPFFT test is based on decreases in EMG MPF). Therefore, the EMG MPFFT test can be used to examine neuromuscular
fatigue characteristics associated with a decrease in muscle fiber action potential conduction velocity.
The Effects Of External Load On Vertical Jump Peak Power And Eccentric Utilization Ratio
Peter Hellberg, Michael J. Hartman, Jason B. Winchester
The ability to utilize the stretch shortening cycle (SSC) efficiently is a critical factor for success in many sports that involve sprinting, jumping, and
production of maximal muscular power. Given the advances of sports equipment, many athletes are now wearing protective clothing or equip-
ment while participating in competitive or recreational sports. It is not known to what extent the use of protective equipment, or application
of the equipment as an external load, may have on the SSC or sports performance. Purpose: The purpose of this research was to examine the
influence of external loading on vertical jump and SSC performance in recreationally active college-aged adults. Methods: Twenty-four subjects
(12 male, 12 female) who routinely participate in recreational sports or exercise volunteered for this study. Vertical jump height was determined
using a static jump (SJ) and counter movement jump (CMJ) using a contact-mat under normal and loaded conditions. An external load equal
to 5% of the subject’s body mass was applied via a weighted vest. Following a standardized warm-up, subjects were allowed one practice jump
at each condition. Subjects maintained a hands-on-hip position in order to concentrate on hip-leg power and minimize jumping technique
differences resulting from arm swing. Three trials were given for each condition, with instruction to obtain maximal height on each jump. Peak
power was estimated from vertical jumps using the equation developed by Sayers et al. [PP (W) = (60.7) x jump height (cm) + 45.3 x body mass
(kg) –2055]. The reliance of SSC was determined using the eccentric utilization ratio (EUR), which is derived from the difference between SJ
and CMJ and was determined under both conditions. A repeated measures ANOVA was used to determine group differences and differences
between jumps and loading conditions. Results: There were significant differences in jump performance (p<0.05) between males and females
as such all results are analyzed by gender. Comparisons of jumps under different loading conditions determined that the application of external
load significantly reduced jump height (p<0.05) in SJ and CMJ for both groups, whereas peak power was only significantly reduced (p<0.05) for
CMJ in the male group. When subjects were tested for SSC utilization, the external load had a significant effect on EUR power in only the male
group (1.37%; p=0.02). Conclusion: Data from this investigation suggests that an external load, such as protective athletic equipment, may have
an influence on vertical jump and SSC performance in recreational athletes. In males, an applied external load decreases CMJ power output
and influences the ability to maximize the use of SSC. Practical Applications: Given that the CMJ is a commonly used tool to assess performance
capabilities, practitioners may wish to consider the addition of an external load while testing to more accurately reflect the conditions in which
sport performance will occur for their particular event. Further investigation is needed to determine if the results from this study are consistent
when testing highly trained athletes.
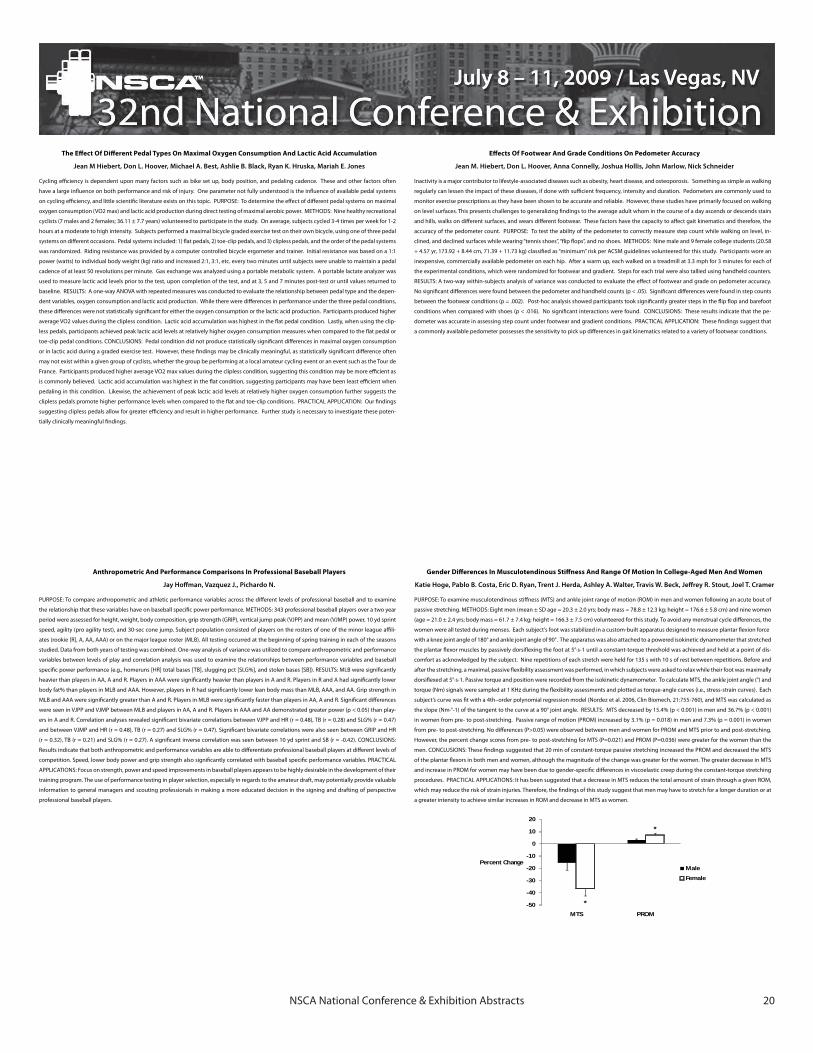
NSCA National Conference & Exhibition Abstracts 20
Gender Differences In Musculotendinous Stiffness And Range Of Motion In College-Aged Men And Women
Katie Hoge, Pablo B. Costa, Eric D. Ryan, Trent J. Herda, Ashley A. Walter, Travis W. Beck, Jeffrey R. Stout, Joel T. Cramer
PURPOSE: To examine musculotendinous stiffness (MTS) and ankle joint range of motion (ROM) in men and women following an acute bout of
passive stretching. METHODS: Eight men (mean ± SD age = 20.3 ± 2.0 yrs; body mass = 78.8 ± 12.3 kg; height = 176.6 ± 5.8 cm) and nine women
(age = 21.0 ± 2.4 yrs; body mass = 61.7 ± 7.4 kg; height = 166.3 ± 7.5 cm) volunteered for this study. To avoid any menstrual cycle differences, the
women were all tested during menses. Each subject's foot was stabilized in a custom-built apparatus designed to measure plantar flexion force
with a knee joint angle of 180° and ankle joint angle of 90°. The apparatus was also attached to a powered isokinetic dynamometer that stretched
the plantar flexor muscles by passively dorsiflexing the foot at 5°∙s-1 until a constant-torque threshold was achieved and held at a point of dis-
comfort as acknowledged by the subject. Nine repetitions of each stretch were held for 135 s with 10 s of rest between repetitions. Before and
after the stretching, a maximal, passive flexibility assessment was performed, in which subjects were asked to relax while their foot was maximally
dorsiflexed at 5°∙s-1. Passive torque and position were recorded from the isokinetic dynamometer. To calculate MTS, the ankle joint angle (°) and
torque (Nm) signals were sampled at 1 KHz during the flexibility assessments and plotted as torque-angle curves (i.e., stress-strain curves). Each
subject’s curve was fit with a 4th–order polynomial regression model (Nordez et al. 2006, Clin Biomech, 21:755-760), and MTS was calculated as
the slope (Nm∙°-1) of the tangent to the curve at a 90° joint angle. RESULTS: MTS decreased by 15.4% (p < 0.001) in men and 36.7% (p < 0.001)
in women from pre- to post-stretching. Passive range of motion (PROM) increased by 3.1% (p = 0.018) in men and 7.3% (p = 0.001) in women
from pre- to post-stretching. No differences (P>0.05) were observed between men and women for PROM and MTS prior to and post-stretching.
However, the percent change scores from pre- to post-stretching for MTS (P=0.021) and PROM (P=0.036) were greater for the women than the
men. CONCLUSIONS: These findings suggested that 20 min of constant-torque passive stretching increased the PROM and decreased the MTS
of the plantar flexors in both men and women, although the magnitude of the change was greater for the women. The greater decrease in MTS
and increase in PROM for women may have been due to gender-specific differences in viscoelastic creep during the constant-torque stretching
procedures. PRACTICAL APPLICATIONS: It has been suggested that a decrease in MTS reduces the total amount of strain through a given ROM,
which may reduce the risk of strain injuries. Therefore, the findings of this study suggest that men may have to stretch for a longer duration or at
a greater intensity to achieve similar increases in ROM and decrease in MTS as women.
-50
-40
-30
-20
-10
0
10
20
MTS PROM
Percent Change Male
Female
*
*
Anthropometric And Performance Comparisons In Professional Baseball Players
Jay Hoffman, Vazquez J., Pichardo N.
PURPOSE: To compare anthropometric and athletic performance variables across the different levels of professional baseball and to examine
the relationship that these variables have on baseball specific power performance. METHODS: 343 professional baseball players over a two year
period were assessed for height, weight, body composition, grip strength (GRIP), vertical jump peak (VJPP) and mean (VJMP) power, 10 yd sprint
speed, agility (pro agility test), and 30-sec cone jump. Subject population consisted of players on the rosters of one of the minor league affili-
ates (rookie [R], A, AA, AAA) or on the major league roster (MLB). All testing occurred at the beginning of spring training in each of the seasons
studied. Data from both years of testing was combined. One-way analysis of variance was utilized to compare anthropometric and performance
variables between levels of play and correlation analysis was used to examine the relationships between performance variables and baseball
specific power performance (e.g., homeruns [HR] total bases [TB], slugging pct [SLG%], and stolen bases [SB]). RESULTS: MLB were significantly
heavier than players in AA, A and R. Players in AAA were significantly heavier than players in A and R. Players in R and A had significantly lower
body fat% than players in MLB and AAA. However, players in R had significantly lower lean body mass than MLB, AAA, and AA. Grip strength in
MLB and AAA were significantly greater than A and R. Players in MLB were significantly faster than players in AA, A and R. Significant differences
were seen in VJPP and VJMP between MLB and players in AA, A and R. Players in AAA and AA demonstrated greater power (p < 0.05) than play-
ers in A and R. Correlation analyses revealed significant bivariate correlations between VJPP and HR (r = 0.48), TB (r = 0.28) and SLG% (r = 0.47)
and between VJMP and HR (r = 0.48), TB (r = 0.27) and SLG% (r = 0.47). Significant bivariate correlations were also seen between GRIP and HR
(r = 0.32), TB (r = 0.21) and SLG% (r = 0.27). A significant inverse correlation was seen between 10 yd sprint and SB (r = -0.42). CONCLUSIONS:
Results indicate that both anthropometric and performance variables are able to differentiate professional baseball players at different levels of
competition. Speed, lower body power and grip strength also significantly correlated with baseball specific performance variables. PRACTICAL
APPLICATIONS: Focus on strength, power and speed improvements in baseball players appears to be highly desirable in the development of their
training program. The use of performance testing in player selection, especially in regards to the amateur draft, may potentially provide valuable
information to general managers and scouting professionals in making a more educated decision in the signing and drafting of perspective
professional baseball players.
Effects Of Footwear And Grade Conditions On Pedometer Accuracy
Jean M. Hiebert, Don L. Hoover, Anna Connelly, Joshua Hollis, John Marlow, Nick Schneider
Inactivity is a major contributor to lifestyle-associated diseases such as obesity, heart disease, and osteoporosis. Something as simple as walking
regularly can lessen the impact of these diseases, if done with sufficient frequency, intensity and duration. Pedometers are commonly used to
monitor exercise prescriptions as they have been shown to be accurate and reliable. However, these studies have primarily focused on walking
on level surfaces. This presents challenges to generalizing findings to the average adult whom in the course of a day ascends or descends stairs
and hills, walks on different surfaces, and wears different footwear. These factors have the capacity to affect gait kinematics and therefore, the
accuracy of the pedometer count. PURPOSE: To test the ability of the pedometer to correctly measure step count while walking on level, in-
clined, and declined surfaces while wearing “tennis shoes”, “flip flops”, and no shoes. METHODS: Nine male and 9 female college students (20.58
+ 4.57 yr, 173.92 + 8.44 cm, 71.39 + 11.73 kg) classified as “minimum” risk per ACSM guidelines volunteered for this study. Participants wore an
inexpensive, commercially available pedometer on each hip. After a warm up, each walked on a treadmill at 3.3 mph for 3 minutes for each of
the experimental conditions, which were randomized for footwear and gradient. Steps for each trial were also tallied using handheld counters.
RESULTS: A two-way within-subjects analysis of variance was conducted to evaluate the effect of footwear and grade on pedometer accuracy.
No significant differences were found between the pedometer and handheld counts (p < .05). Significant differences were found in step counts
between the footwear conditions (p = .002). Post-hoc analysis showed participants took significantly greater steps in the flip flop and barefoot
conditions when compared with shoes (p < .016). No significant interactions were found. CONCLUSIONS: These results indicate that the pe-
dometer was accurate in assessing step count under footwear and gradient conditions. PRACTICAL APPLICATION: These findings suggest that
a commonly available pedometer possesses the sensitivity to pick up differences in gait kinematics related to a variety of footwear conditions.
The Effect Of Different Pedal Types On Maximal Oxygen Consumption And Lactic Acid Accumulation
Jean M Hiebert, Don L. Hoover, Michael A. Best, Ashlie B. Black, Ryan K. Hruska, Mariah E. Jones
Cycling efficiency is dependent upon many factors such as bike set up, body position, and pedaling cadence. These and other factors often
have a large influence on both performance and risk of injury. One parameter not fully understood is the influence of available pedal systems
on cycling efficiency, and little scientific literature exists on this topic. PURPOSE: To determine the effect of different pedal systems on maximal
oxygen consumption (VO2 max) and lactic acid production during direct testing of maximal aerobic power. METHODS: Nine healthy recreational
cyclists (7 males and 2 females; 36.11 ± 7.7 years) volunteered to participate in the study. On average, subjects cycled 3-4 times per week for 1-2
hours at a moderate to high intensity. Subjects performed a maximal bicycle graded exercise test on their own bicycle, using one of three pedal
systems on different occasions. Pedal systems included: 1) flat pedals, 2) toe-clip pedals, and 3) clipless pedals, and the order of the pedal systems
was randomized. Riding resistance was provided by a computer controlled bicycle ergometer and trainer. Initial resistance was based on a 1:1
power (watts) to individual body weight (kg) ratio and increased 2:1, 3:1, etc. every two minutes until subjects were unable to maintain a pedal
cadence of at least 50 revolutions per minute. Gas exchange was analyzed using a portable metabolic system. A portable lactate analyzer was
used to measure lactic acid levels prior to the test, upon completion of the test, and at 3, 5 and 7 minutes post-test or until values returned to
baseline. RESULTS: A one-way ANOVA with repeated measures was conducted to evaluate the relationship between pedal type and the depen-
dent variables, oxygen consumption and lactic acid production. While there were differences in performance under the three pedal conditions,
these differences were not statistically significant for either the oxygen consumption or the lactic acid production. Participants produced higher
average VO2 values during the clipless condition. Lactic acid accumulation was highest in the flat pedal condition. Lastly, when using the clip-
less pedals, participants achieved peak lactic acid levels at relatively higher oxygen consumption measures when compared to the flat pedal or
toe-clip pedal conditions. CONCLUSIONS: Pedal condition did not produce statistically significant differences in maximal oxygen consumption
or in lactic acid during a graded exercise test. However, these findings may be clinically meaningful, as statistically significant difference often
may not exist within a given group of cyclists, whether the group be performing at a local amateur cycling event or an event such as the Tour de
France. Participants produced higher average VO2 max values during the clipless condition, suggesting this condition may be more efficient as
is commonly believed. Lactic acid accumulation was highest in the flat condition, suggesting participants may have been least efficient when
pedaling in this condition. Likewise, the achievement of peak lactic acid levels at relatively higher oxygen consumption further suggests the
clipless pedals promote higher performance levels when compared to the flat and toe-clip conditions. PRACTICAL APPLICATION: Our findings
suggesting clipless pedals allow for greater efficiency and result in higher performance. Further study is necessary to investigate these poten-
tially clinically meaningful findings.
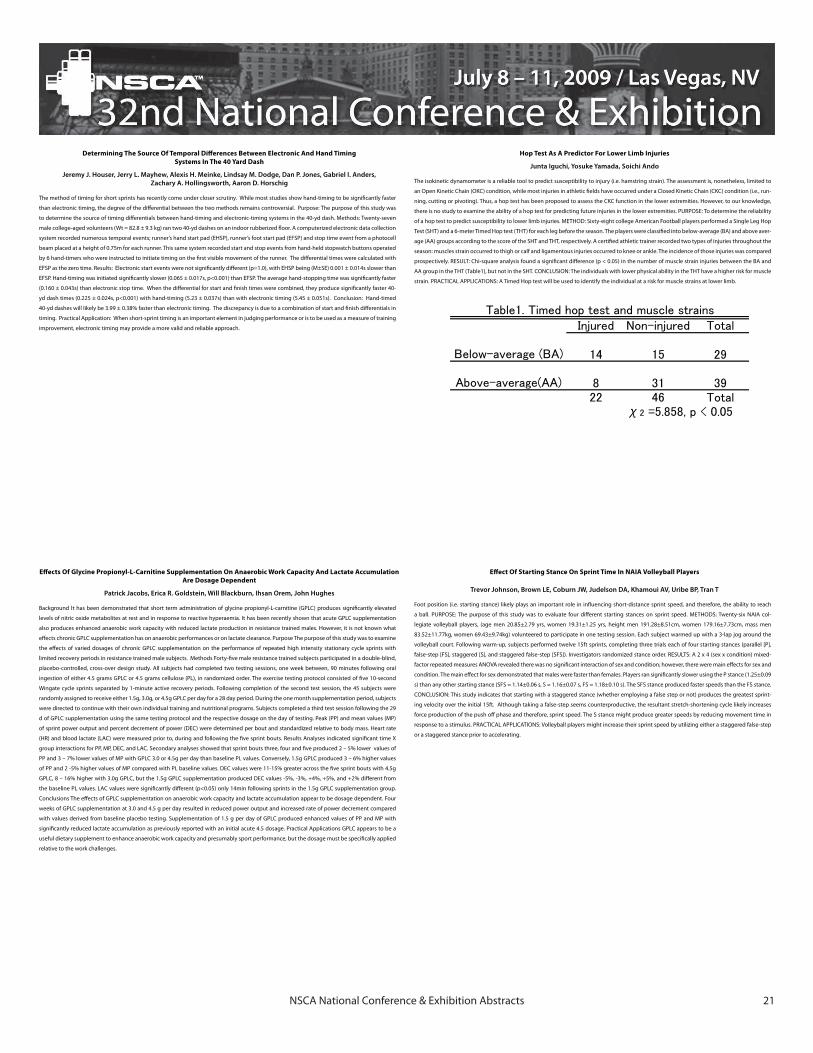
NSCA National Conference & Exhibition Abstracts 21
Effect Of Starting Stance On Sprint Time In NAIA Volleyball Players
Trevor Johnson, Brown LE, Coburn JW, Judelson DA, Khamoui AV, Uribe BP, Tran T
Foot position (i.e. starting stance) likely plays an important role in influencing short-distance sprint speed, and therefore, the ability to reach
a ball. PURPOSE: The purpose of this study was to evaluate four different starting stances on sprint speed. METHODS: Twenty-six NAIA col-
legiate volleyball players, (age men 20.85±2.79 yrs, women 19.31±1.25 yrs, height men 191.28±8.51cm, women 179.16±7.73cm, mass men
83.52±11.77kg, women 69.43±9.74kg) volunteered to participate in one testing session. Each subject warmed up with a 3-lap jog around the
volleyball court. Following warm-up, subjects performed twelve 15ft sprints, completing three trials each of four starting stances (parallel [P],
false-step [FS], staggered [S], and staggered false-step [SFS]). Investigators randomized stance order. RESULTS: A 2 x 4 (sex x condition) mixed-
factor repeated measures ANOVA revealed there was no significant interaction of sex and condition; however, there were main effects for sex and
condition. The main effect for sex demonstrated that males were faster than females. Players ran significantly slower using the P stance (1.25±0.09
s) than any other starting stance (SFS = 1.14±0.06 s, S = 1.16±0.07 s, FS = 1.18±0.10 s). The SFS stance produced faster speeds than the FS stance.
CONCLUSION: This study indicates that starting with a staggered stance (whether employing a false step or not) produces the greatest sprint-
ing velocity over the initial 15ft. Although taking a false-step seems counterproductive, the resultant stretch-shortening cycle likely increases
force production of the push off phase and therefore, sprint speed. The S stance might produce greater speeds by reducing movement time in
response to a stimulus. PRACTICAL APPLICATIONS: Volleyball players might increase their sprint speed by utilizing either a staggered false-step
or a staggered stance prior to accelerating.
Effects Of Glycine Propionyl-L-Carnitine Supplementation On Anaerobic Work Capacity And Lactate Accumulation Are Dosage Dependent
Patrick Jacobs, Erica R. Goldstein, Will Blackburn, Ihsan Orem, John Hughes
Background It has been demonstrated that short term administration of glycine propionyl-L-carnitine (GPLC) produces significantly elevated
levels of nitric oxide metabolites at rest and in response to reactive hyperaemia. It has been recently shown that acute GPLC supplementation
also produces enhanced anaerobic work capacity with reduced lactate production in resistance trained males. However, it is not known what
effects chronic GPLC supplementation has on anaerobic performances or on lactate clearance. Purpose The purpose of this study was to examine
the effects of varied dosages of chronic GPLC supplementation on the performance of repeated high intensity stationary cycle sprints with
limited recovery periods in resistance trained male subjects. Methods Forty-five male resistance trained subjects participated in a double-blind,
placebo-controlled, cross-over design study. All subjects had completed two testing sessions, one week between, 90 minutes following oral
ingestion of either 4.5 grams GPLC or 4.5 grams cellulose (PL), in randomized order. The exercise testing protocol consisted of five 10-second
Wingate cycle sprints separated by 1-minute active recovery periods. Following completion of the second test session, the 45 subjects were
randomly assigned to receive either 1.5g, 3.0g, or 4.5g GPLC per day for a 28 day period. During the one month supplementation period, subjects
were directed to continue with their own individual training and nutritional programs. Subjects completed a third test session following the 29
d of GPLC supplementation using the same testing protocol and the respective dosage on the day of testing. Peak (PP) and mean values (MP)
of sprint power output and percent decrement of power (DEC) were determined per bout and standardized relative to body mass. Heart rate
(HR) and blood lactate (LAC) were measured prior to, during and following the five sprint bouts. Results Analyses indicated significant time X
group interactions for PP, MP, DEC, and LAC. Secondary analyses showed that sprint bouts three, four and five produced 2 – 5% lower values of
PP and 3 – 7% lower values of MP with GPLC 3.0 or 4.5g per day than baseline PL values. Conversely, 1.5g GPLC produced 3 – 6% higher values
of PP and 2 -5% higher values of MP compared with PL baseline values. DEC values were 11-15% greater across the five sprint bouts with 4.5g
GPLC, 8 – 16% higher with 3.0g GPLC, but the 1.5g GPLC supplementation produced DEC values -5%, -3%, +4%, +5%, and +2% different from
the baseline PL values. LAC values were significantly different (p<0.05) only 14min following sprints in the 1.5g GPLC supplementation group.
Conclusions The effects of GPLC supplementation on anaerobic work capacity and lactate accumulation appear to be dosage dependent. Four
weeks of GPLC supplementation at 3.0 and 4.5 g per day resulted in reduced power output and increased rate of power decrement compared
with values derived from baseline placebo testing. Supplementation of 1.5 g per day of GPLC produced enhanced values of PP and MP with
significantly reduced lactate accumulation as previously reported with an initial acute 4.5 dosage. Practical Applications GPLC appears to be a
useful dietary supplement to enhance anaerobic work capacity and presumably sport performance, but the dosage must be specifically applied
relative to the work challenges.
Hop Test As A Predictor For Lower Limb Injuries
Junta Iguchi, Yosuke Yamada, Soichi Ando
The isokinetic dynamometer is a reliable tool to predict susceptibility to injury (i.e. hamstring strain). The assessment is, nonetheless, limited to
an Open Kinetic Chain (OKC) condition, while most injuries in athletic fields have occurred under a Closed Kinetic Chain (CKC) condition (i.e., run-
ning, cutting or pivoting). Thus, a hop test has been proposed to assess the CKC function in the lower extremities. However, to our knowledge,
there is no study to examine the ability of a hop test for predicting future injuries in the lower extremities. PURPOSE: To determine the reliability
of a hop test to predict susceptibility to lower limb injuries. METHOD: Sixty-eight college American Football players performed a Single Leg Hop
Test (SHT) and a 6-meter Timed Hop test (THT) for each leg before the season. The players were classified into below-average (BA) and above aver-
age (AA) groups according to the score of the SHT and THT, respectively. A certified athletic trainer recorded two types of injuries throughout the
season: muscles strain occurred to thigh or calf and ligamentous injuries occurred to knee or ankle. The incidence of those injuries was compared
prospectively. RESULT: Chi-square analysis found a significant difference (p < 0.05) in the number of muscle strain injuries between the BA and
AA group in the THT (Table1), but not in the SHT. CONCLUSION: The individuals with lower physical ability in the THT have a higher risk for muscle
strain. PRACTICAL APPLICATIONS: A Timed Hop test will be used to identify the individual at a risk for muscle strains at lower limb.
Determining The Source Of Temporal Differences Between Electronic And Hand Timing Systems In The 40 Yard Dash
Jeremy J. Houser, Jerry L. Mayhew, Alexis H. Meinke, Lindsay M. Dodge, Dan P. Jones, Gabriel I. Anders, Zachary A. Hollingsworth, Aaron D. Horschig
The method of timing for short sprints has recently come under closer scrutiny. While most studies show hand-timing to be significantly faster
than electronic timing, the degree of the differential between the two methods remains controversial. Purpose: The purpose of this study was
to determine the source of timing differentials between hand-timing and electronic-timing systems in the 40-yd dash. Methods: Twenty-seven
male college-aged volunteers (Wt = 82.8 ± 9.3 kg) ran two 40-yd dashes on an indoor rubberized floor. A computerized electronic data collection
system recorded numerous temporal events; runner’s hand start pad (EHSP), runner’s foot start pad (EFSP) and stop time event from a photocell
beam placed at a height of 0.75m for each runner. This same system recorded start and stop events from hand-held stopwatch buttons operated
by 6 hand-timers who were instructed to initiate timing on the first visible movement of the runner. The differential times were calculated with
EFSP as the zero time. Results: Electronic start events were not significantly different (p=1.0), with EHSP being (M±SE) 0.001 ± 0.014s slower than
EFSP. Hand-timing was initiated significantly slower (0.065 ± 0.017s, p<0.001) than EFSP. The average hand-stopping time was significantly faster
(0.160 ± 0.043s) than electronic stop time. When the differential for start and finish times were combined, they produce significantly faster 40-
yd dash times (0.225 ± 0.024s, p<0.001) with hand-timing (5.23 ± 0.037s) than with electronic timing (5.45 ± 0.051s). Conclusion: Hand-timed
40-yd dashes will likely be 3.99 ± 0.38% faster than electronic timing. The discrepancy is due to a combination of start and finish differentials in
timing. Practical Application: When short-sprint timing is an important element in judging performance or is to be used as a measure of training
improvement, electronic timing may provide a more valid and reliable approach.

AbstractsJ – L
NSCA National Conference & Exhibition Abstracts 23
The Impact Of Certification On High School Strength Facilities, Equipment, And Safety/Utilization
Lawrence W. Judge, Jeffrey Petersen, Bruce Craig
Strength and conditioning facilities (SCFs) have become an integral component of high schools for use in physical education, athletics, and com-
munity wellness programs. The rapid growth and use of high school SCFs creates a need to research and better understand these vital facilities.
PURPOSE: This study was developed to gather descriptive and quantitative data on the secondary SCFs in a US Midwestern state and to assess
the impact of the NSCA certified strength and conditioning specialist (CSCS) on factors such as equipment, facility size, and safety/utilization.
METHODS: A total of 390 questionnaires were distributed via email to high school athletic directors in the state. A 70-item survey instrument,
developed with expert input from certified strength professionals, was utilized to collect data regarding the SCFs in high schools throughout
this state. This survey was formatted for online completion using the InQsit system. All descriptive and one-way ANOVA statistical analyses were
conducted on SPSS 15.0 with a p < .05 significance level. RESULTS: A total of 108 valid and complete surveys were returned for a response rate
of 27.7%. These results were balanced amongst all five school enrollment levels (1A to 5A) with 22.2% class 1A, 20.4% class 2A, 11.1% class 3A,
18.5% class 4A, and 27.8% class 5A. There were significant differences in equipment, facility size, and safety factors between school facilities with
CSCS leadership and those without CSCS leadership. There were significantly greater numbers of bench press stations in CSCS led facilities (7.33
per school) than non-CSCS led facilities (4.89 per school), F(1,105) = 11.20, p = .001. The 8.86 mean number of squat stations for CSCS led facilities
were significantly greater than the 4.49 mean squat stations for non-CSCS led facilities, F(1,105) = 15.60, p < .001. Additionally the mean number
of power clean stations were significantly greater for CSCS led schools at 8.81 to 3.47 for non-CSCS led schools, F(1,105) = 20.26, p < .001. The
average number of Olympic bars were significantly higher in CSCS led schools at 25.00 compared to 12.85 for non-CSCS led schools F(1,104) =
22.84, p < .001. Mean facility size measured in square footage was significantly greater for CSCS led schools at 4283 square feet compared to
2434 square feet for non-CSCS led schools, F(1,87) = 9.21, p = .003. From a safety/utilization perspective the level of daily facility student use is
significantly greater, F(1,104) = 15.56, p < .001, for CSCS led schools with an average of 278.1 users compared to 140.7 daily users in non-CSCS
led facilities. Additionally, the maximum safe capacity estimated for each facility was significantly greater, F(1,104) = 10.42, p = .002, for CSCS
operated facilities with a mean capacity of 75.7 than for non-CSCS led facilities with a mean capacity of 47.7. CONCLUSION: The leadership of a
CSCS in interscholastic programs impacts facility size, the selection of equipment, and safety/utilization. It appears the CSCS’s application of their
scientific knowledge goes beyond training athletes for the goal of improving athletic performance as it actually influences the SCF. PRACTICAL
APPLICATIONS: Athletic administrators at the high school level need to recognize the impact CSCS program leadership can have on the overall
quality of the strength and conditioning program. Future research should expand this study to regional and national levels.
Efficacy Of Potentiation Of Shot Put Performance Through Pre-Activity Heavy Medicine Ball Throws
Lawrence W. Judge, David Bellar, Ellen L. Glickman
It has become increasingly prevalent among track and field throw’s coaches to utilize heavy implements as part of the pre-activity warm-up in
an attempt to enhance shot put performance. Though the trend exists among coaches, little research has been done to test the efficacy of the
use of heavy implements for enhancement of athletic performance. PURPOSE: To examine the potentiation effect of throwing a heavy medicine
ball on subsequent standing shot put performance. METHODS: The participants were five college-aged female shot putters (age: 20.0±1.7yrs, ht:
167.2±10.9cm, wt: 98.5±23.6kg, best competition shot put performance: 11.2m±1.2). A within subjects design was used to compare the possible
potentiation effects of throwing a heavy medicine ball prior to a competition shot put. Participants reported to the gymnasium on four separate
occasions. On the first visit, participants became familiar with the technique of the standing shot put throw, and a maximal throw for height with
a heavy medicine ball beginning from the ground. On the second through forth visits participants warmed up (~ 15 min of dynamic stretching)
and then completed five, maximal effort, standing throws with a competition indoor shot put (4kg). Each attempt was preceded by one of three
randomly assigned treatments. The treatments included a maximal throw for height with either an 8kg or 18.2kg medicine ball, or no medicine
ball throw (control). The distance for each of the maximal effort shot put attempt was measured. RESULTS: ANOVA (treatment x time) revealed
no significant main effect for treatment (F=1.738, ηp=0.303, p=0.236) or time (F=0.784, ηp=0.164, p=0.552) as well as no significant interaction
effects (F=0.801, ηp=0.167, p=0.607). Compared to the control (8.5m±1.5), the 8kg (8.2m±1.5) and 18.2kg (8.1m±1.4) treatments produced mean
distances that were shorter, though the difference was not significant. CONCLUSION: In moderately trained female athletes the use of heavy
medicine balls as part of the pre-activity warm-up does not enhance exercise performance based upon the data from the present investigation.
Though the findings were not significant a trend existed for a reduction in performance with the increased weight of the pre-throw medicine
ball. PRACTICAL APPLICATIONS: Further research is needed to determine the impact of an athlete’s strength and training status on pre-activity
protocols utilizing post activation potentiation.
Performance Testing In British Middle School Aged Boys And Girls
Margaret T. Jones, Diane C. Lorenzo, Tracey D. Matthews
PURPOSE: The purpose of the current study was to assess power, speed and agility in British boys and girls of middle school age. METHODS: Sub-
jects (N = 196; Males: n = 59; Females: n = 137; age: M = 11.9+0.6 yr) attended one of two English boarding schools. School 1 was coeducational
and located in a rural area while School 2 was for girls only and set in a large metropolitan area. Most subjects were athletes who participated
in one or more of the following sports: equestrian, field hockey, rugby, and soccer. Testing data were collected from vertical jump (VJ), standing
long jump (SLJ), seated medicine ball throw (SMBT), 20 yd shuttle run (pro agility), curl-ups, and 20 yd sprint (20 yd SP) over two separate ses-
sions. Data were compared based on gender and school. Independent groups t-tests were run to examine gender differences in School 1for the
performance variables. Additionally, differences in the performance variables were examined for females comparing Schools 1 and 2 using an
independent groups t test. Pearson product moment correlation coefficients were also computed for the female data to determine if relation-
ships existed among the performance variables. RESULTS: Test scores from School 1 were analyzed for gender differences. Male scores were
significantly (p < 0.05) higher in SLJ (64.2+9.5 vs. 58.9+8.6 in) and curl-ups (35+10 vs. 30+10). Female test scores for School 1 and School 2 were
compared. Subjects from School 2 performed better (p < 0.05) on VJ (11.6+2.7 vs. 9.9+2.2 in), pro agility (5.75+0.38 vs. 6.15+0.55 sec), and SMBT
(11.6+1.8 vs. 9.2+2.6 ft) than School 1. However, School 1 scored better (p < 0.01) on the 20 yd SP (3.73+0.36 vs. 4.05+0.31 sec) than School 2. No
differences were observed in SLJ or curl-ups between the female subjects at School 1 and School 2. Correlations were run between performance
tests for all female data. SLJ had the strongest correlations with the majority of the performance tests:
SLJ and VJ (n=117, r=0.59, p < 0.01)
SLJ and pro agility (n=114, r= -0.71, p < 0.01)
SLJ and 20 yd SP (n=108, r= -0.62, p < 0.01)
VJ and pro agility (n=114, r= -0.68, p < 0.01)
CONCLUSION: Before puberty there are few differences in body size, strength, power or speed between boys and girls (2,3,4,6). Of the 6 perfor-
mance tests administered in the current study, School 1 males scored higher in SLJ and curl-ups when compared to School 1 females. Previous
research with American boys and girls of similar age to those of the current study found no gender differences in VJ or SLJ (3,4,6). VJ values for
boys and girls of School 1 are comparable to those previously published (3,4), as is SLJ for boys of School 1. Previous research with American boys
and girls ranging in age from 7-12 years found a significant correlation between SLJ and VJ (6), a finding that was supported by the current study.
No relationship was found between upper and lower body power among females in the current study, a result that has been demonstrated in
male and female collegiate athletes (1,5). PRACTICAL APPLICATION: SLJ and VJ are reasonable predictors of each other; therefore, either may be
used for a measure of lower body power in middle school aged children. Linear speed (20 yd SP) related better to SLJ than to VJ, which may point
to SLJ being a more suitable test for younger athletes.
Effect Of Starting Stance On Sprint Time In NAIA Volleyball Players
Trevor Johnson, Brown L.E., Coburn J.W., Judelson D.A., Khamoui A.V., Uribe B.P., Tran T.
Foot position (i.e. starting stance) likely plays an important role in influencing short-distance sprint speed, and therefore, the ability to reach
a ball. PURPOSE: The purpose of this study was to evaluate four different starting stances on sprint speed. METHODS: Twenty-six NAIA col-
legiate volleyball players, (age men 20.85±2.79 yrs, women 19.31±1.25 yrs, height men 191.28±8.51cm, women 179.16±7.73cm, mass men
83.52±11.77kg, women 69.43±9.74kg) volunteered to participate in one testing session. Each subject warmed up with a 3-lap jog around the
volleyball court. Following warm-up, subjects performed twelve 15ft sprints, completing three trials each of four starting stances (parallel [P],
false-step [FS], staggered [S], and staggered false-step [SFS]). Investigators randomized stance order. RESULTS: A 2 x 4 (sex x condition) mixed-
factor repeated measures ANOVA revealed there was no significant interaction of sex and condition; however, there were main effects for sex and
condition. The main effect for sex demonstrated that males were faster than females. Players ran significantly slower using the P stance (1.25±0.09
s) than any other starting stance (SFS = 1.14±0.06 s, S = 1.16±0.07 s, FS = 1.18±0.10 s). The SFS stance produced faster speeds than the FS stance.
CONCLUSION: This study indicates that starting with a staggered stance (whether employing a false step or not) produces the greatest sprint-
ing velocity over the initial 15ft. Although taking a false-step seems counterproductive, the resultant stretch-shortening cycle likely increases
force production of the push off phase and therefore, sprint speed. The S stance might produce greater speeds by reducing movement time in
response to a stimulus. PRACTICAL APPLICATIONS: Volleyball players might increase their sprint speed by utilizing either a staggered false-step
or a staggered stance prior to accelerating.
NSCA National Conference & Exhibition Abstracts 24
Effects Of Whole-Body-Electromyostimulation On Resting Metabolic Rate, Anthropometric And Neuromuscular Parameters In The Elderly
Wolfgang Kemmler, Simon von Stengel, Jerry Mayhew
Purpose: We evaluated the effect of a whole-body-electromyostimulation over 14 weeks on anthropometrical, physiological and muscular pa-
rameters in postmenopausal women. Methods: 30 females (64.5 +/-5.5 years) with a long experience in physical training were randomly assigned
either to a control-group, (CG: n=15), that maintained their general-training-program (2x60 min/week endurance and dynamic strength), or to
an electromyostimulation-group (ESG: n=15), that additionally performed a 20 min whole-body-electromyostimulation training each 5 days.
Resting metabolic rate (RMR) was selected as the primary endpoint, however, body circumferences, subcutaneous body-fat, strength and power
as well as drop-out and adherence were also determined. Results: RMR maintained in the ESG (-0.1 kcal/h) and decreased in the CG (-3.2 kcal,
p=.038), however, group differences did not reach significance (p=.095, Effect size (ES): Cohens d=.62). Sums of skinfolds (-8.6%) and waist-
circumference (-2.3%) significantly decreased in the ESG while both parameters increased in the CG (1.4% and 0.1%). Between-group-differences
were significant for both parameters (p=.001, ES: 1.37 and 1.64). Isometric strength changes of the trunk-extensors and leg-extensors signifi-
cantly (p=.006) differed between groups (9.9 vs. -6.4%, ES: d=1.53; 9.6 vs. -4.5%, ES: d=1.43). No significant differences (p=.089) were observed
for trunk-flexors changes (6.6 vs. -5.6%; ES: d=.72). Further, between-group-differences (p=.001) were determined for leg-extensor power (8.6
vs. -1.2%, ES: d=1.50). Conclusion and practible applications: We conclude that for the elderly subject unable or unwilling to perform dynamic
strength exercises, electromyostimulation may be a “smooth” alternative to maintain lean body mass, strength and power.
Accuracy Of Bioelectrical Impedance Analyzers In College Athletes: Does Hydration Matter?
C. David Kemble, Junbae Mun, David A. Rowe, Katrina D. DuBose, Thomas D. Raedeke, & Matthew T. Mahar
PURPOSE: To examine the accuracy of different methods of bioelectrical impedance analyzers (BIA) for body composition measurement com-
pared to air displacement plethysmography (ADP) in college athletes. A secondary purpose was to examine the impact of hydration status on the
accuracy of BIA. METHODS: Percent fat estimates from the following types of BIA models were compared to percent fat from ADP: hand -to- hand
(HH), foot -to- foot (FF), commercially available hand -to- foot (CHF) model, and laboratory hand -to- foot (LHF). Participants were 53 college
athletes (21 males and 32 females, aged 19.8 ± 1.5 years). Hydration status was measured with an optical urine specific gravity refractometer and
participants were classified as adequately hydrated (≤ 1.020 g.mL-1; 42% of sample) or significantly dehydrated (> 1.020 g.mL-1; 58% of sample).
Intraclass correlations were calculated between body composition methods. A two-way (method x gender) analysis of variance with repeated
measures and Fisher’s LSD tests were used to compare the means estimated by ADP and BIA models. Cohen’s Delta (ES) was used to quantify the
size of the differences between means. Simple regression analysis was used to examine the agreement between ADP and BIA models, and to
quantify prediction accuracy for each BIA model. RESULTS: BIA estimates of percent fat were moderately to highly correlated with ADP (R = .74 to
.90). No method x gender interaction affect was found (p > .05). Mean estimated percent fat from FF (21.5 ± 7.7% fat) did not differ from ADP (21.5
± 7.1% fat). LHF (20.0 ± 6.0% fat), HH (19.6 ± 4.9% fat), and CHF (27.6 ± 6.9% fat) produced estimates of percent fat that were significantly different
from ADP. Mean differences were small (ES ≤ 0.32) between ADP vs. HH, FF, and LHF, but the mean difference was large (ES = 0.87) between ADP
and CHF. Regression analysis produced total errors of 4.2% fat for HH, 4.4% fat for FF, 6.9% fat for CHF, and 4.1% fat for LHF. Regression analysis
was also used to examine the effect of hydration on BIA accuracy. Hydration status did not add significantly to the prediction of ADP from BIA
models. CONCLUSION: Compared to ADP, the CHF model did not provide accurate estimates of percent fat. HH, FF, and LHF provided reasonably
accurate estimates of percent fat. The effect of hydration status on the accuracy of BIA models was minimal. PRACTICAL APPLICATION: Accurate
body composition assessment is an important consideration in collegiate athletics from both a safety and performance standpoint. Athletic train-
ers and strength and conditioning specialists often do not have access to laboratory methods to assess body composition so practical methods
should be easy to use, inexpensive, reliable, and accurate. The currently recommended BIA pre-assessment procedures (i.e., no food or drink for 4
hours prior to testing) may contribute to a high prevalence of dehydration among college athletes. In the current study the CHF model produced
less accurate estimates of percent fat than the other BIA models tested. While proper hydration is important for safety and athletic performance
it appears to have little influence on the accuracy of BIA models.
The Effect Of Single Versus Multiple Sets: Carryover To Untrained Speeds
Stephen Kelly, Lee E. Brown, Jared W. Coburn, Diamond Nguyen, Laurie E. Black, Daniel J. Dodd, Brent A. Alvar
Literature has clearly demonstrated that in a population with some resistance training experience, performing multiple sets per training session
of a resistance exercise is superior to performing a single set for eliciting strength. It is less clear, however, whether this remains true in measures
other than those specifically targeted in training. PURPOSE: The purpose of this study was to examine whether training at a specific isokinetic
speed had different carryover effects to other speeds when comparing single set and multiple set protocols. METHODS: Forty subjects were
randomly assigned into one of three groups: control (C; n=8), single set (SS; n=14), or multiple sets (MS; n=18) to perform 8 maximal knee exten-
sions at 60 d/s on an Biodex System 3 isokinetic dynamometer twice a week for eight weeks. The SS group performed one set while the MS group
performed three sets. All groups were tested pre, mid (4 weeks), and post at 30, 60, and 180 d/s. Strength was expressed as peak torque (PT).
RESULTS: A 3x3x3 (Time x Group x Speed) mixed factor repeated measures ANOVA revealed a Group x Time x Speed interaction. The MS group
demonstrated significant (p < 0.05) increases in strength at all three speeds. Pre-testing was not different from mid-testing but was different
from post-testing at 30 d/s (Pre = 209.23 + 72.99 Nm; Mid = 218.92 + 73.79 Nm; Post = 232.93 + 83.46 Nm). At 60 d/s, strength increased from
pre to mid-testing with no further significant strength gain from mid to post-testing (Pre = 188.32 + 63.06 Nm; Mid = 208.01 + 72.12 Nm; Post
= 215.10 + 78.81 Nm). This trend was the same for the MS group at 180 d/s (Pre = 138.76 + 45.41 Nm; Mid = 149.96 + 53.92 Nm; Post = 151.12
+ 51.71 Nm). Neither the C nor SS groups demonstrated any change in strength across any time at any speed. CONCLUSIONS: It was concluded
that performing multiple sets of isokinetic knee extension was superior to performing a single set for eliciting strength at the training speed,
as well as across other speeds tested. PRACTICAL APPLICATIONS: Multiple sets of resistance exercises have been demonstrated more effective
for increasing strength than single sets. The current study suggests that this principle is not necessarily specific to the training velocity, but may
include a spectrum of speeds.
Validation Of An Electronic Armband Sensor In Healthy Individuals Engaged In Low Intensity Activity
David J. Kato, Cait Yarborough, Robert G. Haennel
Purpose: Electronic sensor armbands (ESA) appear to be valid and reliable in comparison to indirect calorimetry when measuring resting energy
expenditure (EE). However, questions remain in terms of the ESA’s ability to measure EE under exercise conditions. The purpose of this study was
to evaluate the validity and reliability of the ESA to estimate the EE at rest and during selected activities of daily living.
Methods: Fifteen volunteers, 10 females (29 ± 11 yrs.) and 5 males (40 ± 14 yrs.) were assessed on two occasions. On the initial visit, height and
weight were recorded. Following 10 minutes of quiet rest heart rate and blood pressure were recorded. Participants then completed 20 minutes
of level walking on a treadmill. The treadmill exercise was divided into two stages of walking; 10 minutes at 3 mph followed by 10 minutes at
4 mph. Following the treadmill exercise, subjects completed a six minute self paced walk test and then 10 minutes of self-paced stair exercise
(walking up and down a 3 storey staircase). Exercises were separated by 5 minutes of quiet rest.
Throughout the protocol, EE was measured by mobile open-circuit direct indirect calorimetry and the ESA. A mobile metabolic system (MMS)
was used as the criterion measurement. Minute by minute oxygen uptake and respiratory exchange ratio (RER) was measured and EE (kcal∙min-1)
was calculated by multiplying the oxygen uptake (L∙min-1) by the caloric equivalent based on the RER. In the second visit, subjects rested for 10
minutes and then completed the treadmill protocol that was used during the initial visit.
Results: At the initial visit the EE estimated from the ESA were significantly higher than that recorded by the MMS at both 3 mph (4.8 ± 1.3 vs.
3.8 ± 1.3 kcal·min-1) and 4 mph (6.8 ± 1.7 vs. 6.0 ± 1.4 kcal·min-1) p<.000. For the six minute walk test EE, ESA was 4.7 ± 1.8 kcal·min-1 vs. 3.5 ±
1.6 kcal·min-1 for the MMS p<.000. For the self paced stair exercise EE was; ESA (5.6 ± 1.6 kcal·min-1) and MMS (6.6 ± 3.3 kcal·min-1) p<.000. The
second visit ESA EE at 3 mph was again significantly higher than that observed on the MMS (4.5 ± 1.6 kcal·min-1 vs. 4.1 ± .9 kcal·min-1 p<.001).
EE measures between the ESA and MSS demonstrated an intraclass correlation of .745 and Cronbach’s alpha of .854 p<.000 for the first visit and
an intraclass correlation of .831 and Cronbach’s alpha of .90 p<.000 for the second visit.
Conclusion: The strong intraclass correlations suggest that the ESA was sensitive to changes in EE during treadmill walking. However, the ESA
consistently overestimated EE for both self-paced and treadmill walking and underestimated EE during self-paced stair climbing.
Practical Application: The use of ESA’s to estimate EE during exercise is becoming increasingly popular and while these devices appear sensitive
to variations in EE they have a tendency to overestimate EE. To improve the accuracy in these devices during activities such as self paced walking
or stair climbing, subjects should be encouraged to swing their arms freely.
NSCA National Conference & Exhibition Abstracts 25
An Examination Of Biases And Perceptions Of Contemporary Strength And Conditioning Professionals At The University Level
Marcus W. Kilpatrick, Jeremy M. Powers, Candi A. Ashley, Bill I. Campbell, & Robert F. Dedrick
The backgrounds of strength and conditioning coaches employed by Division I athletic programs are diverse. The diversity of the backgrounds
can be described along a multitude of variables including: educational background, professional certifications, physical size and fitness, and com-
petitive playing experiences, to name a few. Though research has not yet addressed this matter directly, it is possible that the background and
characteristics of strength and conditioning coaches may bias professional assessment of prospective hires. PURPOSE: Determine the presence of
biases within a large sample of collegiate strength and conditioning coaches with respect to the relative importance of education, certifications,
physical attributes, and playing experience. It is predicted that coaches will have biases that favor the qualities found in a coach that most closely
resembles their own personal characteristics. METHODS: The design of the study utilized electronic mail recruitment of strength and condition-
ing coaches at all Division I athletic programs. One hundred fifty-six (34 female, 122 male, mean age = 33 years) full-time strength and condi-
tioning coaches at NCAA Division 1 universities responded to the online questionnaire. Items related to education, professional certifications,
playing experience, coaching experience, body composition, and importance of background on effectiveness as a professional were included.
RESULTS: Analyses utilizing ANOVA and t-tests revealed several significant findings in line with the research hypothesis. Specifically, strength and
conditioning coaches possessing CSCS certification indicated this characteristic is more essential than those coaches without that certification (P
< 0.05; ES = 1.17). Coaches with degrees in the exercise science field indicated this characteristic is more essential than coaches trained in fields
outside of exercise science (P < 0.05; ES = 0.86). Coaches with collegiate playing experience indicated that such experience is more essential
than coaches without collegiate playing experience (P < 0.05; ES = 0.59). Lastly, coaches describing themselves as highly muscular indicated
that being physically larger was more essential for a coach than those describing themselves as less muscular (P < 0.05; ES = 1.00). DISCUSSION:
These results generally confirm the hypothesis that strength and conditioning professionals generally perceive their personal background to
be more essential for effectiveness as a coach than are background characteristics they do not personally possess. While these findings are not
surprising given the reality that our life experiences shape our perceptions, this work does confirm the perspective that many strength and
conditioning professionals view their path to professional achievement as the most appropriate. PRACTICAL APPLICATIONS: This study indicates
that aspiring young professionals should be fully aware that the professional opinions provided to them by current strength and conditioning
coaches may well be biased. It is expected that biases suggesting that being physically large in stature and having high level athletic experience
will be diminished over time as the field evolves and moves away from many existing stereotypes. Aspiring strength and conditioning coaches
are encouraged to seek out all available means and all available professional counsel to improve their employment profile and enhance their
candidacy for positions within the field.
Relationship Between Dynamic Kinematics And Isometric Force-Time Characteristics
Andy V. Khamoui, Andy V. Khamoui, Diamond Nguyen, Brandon P. Uribe, Tai Tran, Edward Jo, Lee E. Brown,
Jared W. Coburn, Daniel A. Judelson, Guillermo J. Noffal
Previous research has investigated the force-time curve characteristics of isometric muscle actions, however, few have addressed their relation-
ship to the kinematics of dynamic movements. PURPOSE: The purpose of this study was to investigate relationships between dynamic kinemat-
ics [high pull peak velocity, high pull rate of velocity development, vertical jump peak velocity (VJPV), vertical jump rate of velocity development
(VJRVD)] and isometric force-time curve characteristics [peak force (IsoPF), peak force relative to body mass (IsoPF/BM), rate of force development
at various time frames (RFD50ms, RFD100ms, RFD150ms, RFD200ms, RFD250ms, RFDMax)].
METHODS: Forty-eight men and women (age 22.83±1.75 y; height 173.43± 9.08 cm; mass 72.24±17.63 kg) completed two testing sessions. The
first session began with a five minute warm-up on a cycle ergometer at 50 rpm (25 watts). Following the warm-up, subjects performed three
maximum isometric mid-thigh pulls with each repetition held for three seconds. All repetitions of the isometric and dynamic mid-thigh pulls
were performed inside a power rack on a force plate that sampled at 1000Hz. On the second testing session, subjects completed the same five
minute warm-up followed by three dynamic mid-thigh high pulls with a 30% IsoPF load. Two position transducers attached adjacent to the
bar collars determined high pull peak velocity and rate of velocity development. Following the dynamic high pulls, subjects performed three
countermovement vertical jumps with arm swing on the force plate. Investigators determined VJPV by subtracting body weight from the force-
time curve, dividing by body mass, and integrating with respect to time using the trapezoidal rule for numerical integration. VJRVD resulted by
calculating the slope of the velocity-time record.
RESULTS: VJPV significantly (p<0.05) correlated with IsoPF (r=0.531), RFD150 (r=0.507), RFD200 (r=0.467), RFD250 (r=0.475), and IsoPF/BM
(r=0.397). VJRVD significantly (p<0.05) correlated with IsoPF (r=0.456), RFD150 (r=0.590), RFD200 (r=0.474), RFD250 (r=0.528), RFDmax (r=0.359)
and IsoPF/BM (r=0.399). No other variables significantly correlated.
CONCLUSIONS: These correlations suggest that explosive isometric force production within windows of 150-250ms appear to be associated with
the ability to accelerate one’s body mass and attain high velocity during dynamic movements. The weak correlations between vertical jump
kinematics (VJPV, VJRVD) and IsoPF/BM indicate absolute isometric strength might exhibit greater transfer to dynamic performance than relative
isometric strength.
PRACTICAL APPLICATIONS:
Individuals needing to accelerate their own body mass and achieve high velocities (such as in jumping and sprinting) may want to consider
training modalities targeting both maximum and explosive strength within the context of a comprehensive strength and conditioning program.
Effects Of Beta-Alanine Supplementation On Performance And Body Composition In
Collegiate Wrestlers And Football Players
Ben Kern, Dr. Tracey L. Robinson
Supplementation with β-alanine has been associated with improved strength, anaerobic endurance, body composition and performance on tests of anaerobic
power output following varying training protocols, including high intensity interval training (HIIT) and heavy resistance training. Early season training for colle-
giate wrestling includes repeated bouts of high intensity exercise with intermittent rest periods; this type of training parallels HIIT from a metabolic standpoint.
Collegiate wrestlers also use moderate to high intensity resistance training with high work to rest ratios. In-season football training includes repeated bouts
of short sprints and Olympic/ power lifting with low work to rest ratios. PURPOSE: The purpose of this study was to examine the effectiveness of β-alanine
as an ergogenic aid in tests of anaerobic power output following 8 week high intensity interval, repeated sprint, and resistance training in previously trained
collegiate wrestlers and football players. METHODS: 22 Division II college wrestlers (19.9 ± 1.9 yr, age ± SD) & 15 football players (18.6 ± 1.5 yr) completed this
double-blind, placebo controlled study. Each subject ingested either 4 g/day β-alanine or placebo in powdered capsule form. Subjects were tested pre & post
treatment in timed 300 yd. shuttle, 90˚ flexed arm hang (FAH), body composition, and blood lactate accumulation during 300 yd. shuttle. Wrestlers trained
5 days per week, including HIIT 3 days/ week & resistance training with high work: rest ratios 2 days/ week. Football players trained 5 days/ week, including
repeated sprints with low work: rest ratios 3 times/ week and Olympic/ power lifting 4 times/ week. RESULTS: The subjects taking β-alanine achieved more
desirable results on all tests compared to placebo (NS, p>0.05). Performance improvements were greatest in the football supplement group, decreasing 300
shuttle time by 1.1 sec (vs. 0.4 sec. placebo) and increasing FAH (3.0 sec vs. 0.39). The wrestlers, both placebo and supplement lost weight (as was the goal,
i.e. weight bracket allowance); however, the supplement group increased lean mass by 1.1 lb., while the placebo group lost lean mass (-0.98 lb). Both football
groups gained weight; however, the supplement group gained an average 2.1 lb lean mass compared to 1.1 lb for placebo.
Test FB Placebo
(n=8)
FB Supple-
ment
(n=7)
WR Placebo
(n=12)
WR Supple-
ment
(n=10)
Δ bodyweight 2.8 ± 1.2 2.6 ± 1.9 -3.2 ± 4.9 -0.43 ± 4.6
Δ bodyfat% 0.88 ± 1.5 0.1 ± 1.1 -1.1 ± 1.4 -0.89 ± 0.66
Δ lean mass 1.1 ± 2.3 2.1 ± 3.6 -0.98 ± 2.9 1.1 ± 4.3
Δ 300 shuttle -0.4 ± 2.2 -1.1 ± 0.94 -1.3 ± 1.7 -1.6 ± 2.2
Δ 90˚ FAH 0.39 ± 6.5 3.0 ± 5.4 5.0 ± 3.9 6.5 ± 7.3
Δ Lactate 1.5 ± 3.3 0.03 ± 3.7 -2.3 ± 4.7 -2.6 ± 4.7
CONCLUSIONS: Supplementation with beta-alanine appears to have the ability to augment performance and stimulate lean mass accrual in a short amount
of time (8 weeks) in previously trained athletes. β-alanine may magnify the expected performance outcomes of training programs with different metabolic
demands. PRACTICAL APPLICATIONS: Adding β-alanine to athletes’ training programs may improve anaerobic endurance and may aid in lean mass accrual &/or
preservation. Supplementation with β-alanine may assist wrestlers in maintaining lean mass while cutting weight. Supplemented football players may experi-
ence faster improvements in strength, speed and body composition.
The Effects Of Four Weeks Of High-Intensity Interval Training And Creatine Supplementation On Critical Power And Anaerobic Working Capacity In College-Aged Men
Kristina L. Kendall, Jennifer L. Graef, David H. Fukuda, Abbie E. Smith, Jordan R. Moon, Travis W. Beck, Joel T. Cramer, and Jeffrey R. Stout
The critical power test provides two measures, critical power (CP) and anaerobic working capacity (AWC). In theory, the CP measurement repre-
sents the maximal power output that can be maintained without fatigue, which is regarded as an aerobic measure. AWC is an estimate of work
capacity associated with muscle energy reserves adenosine triphosphate (ATP) and phosphocreatine (PCr). High- intensity interval training (HIIT)
has been shown to be an effective training method for improving endurance performance, including CP and AWC measures. In addition, creatine
(Cr) supplementation has been reported to improve AWC without training; however, Cr had no effect on CP. To date, no one has examined the
effect of Cr supplementation during HIIT on CP and AWC. PURPOSE: The purpose of this study was to examine the effects of four weeks of HIIT
in conjunction with Cr supplementation on CP and AWC in college-aged men. METHODS: Forty-two recreationally active men (mean ± SD; age
23.62 ± 4.78 yrs; height: 177.48 ± 7.05 cm; weight: 82.23 ± 12.70kg) volunteered to participate in this study. Participants were assigned to one of
three groups: Cr (n=16) 10g Cr + 10g dextrose powder blend; placebo (PL, n=16) 20g dextrose powder blend; control (CON, n=10) no treatment.
Prior to and following supplementation, each participant performed a continuous maximal oxygen consumption test (VO2PEAK) on a cycle
ergometer to establish peak power output (PPO). Participants then completed a CP test, consisting of three exercise bouts to exhaustion with
the workloads set as a percentage of their PPO to determine CP and AWC. Following initial testing, a 2-week familiarization period of training and
supplementing occurred. Baseline values were then measured and all participants in the Cr and PL groups engaged in 4 weeks of HIIT training on
a cycle ergometer. Training consisted of either five or six sets of 2-minutes work with 1-minute passive rest, five days per week. Training intensity
followed an undulating model starting at 80% PPO and reaching 120%. RESULTS: Significant two-way interactions [time (base- vs. post-) x treat-
ment (Cr vs. PL vs. CON)] were discovered for CP (p=0.007). Follow-up analyses indicated that the Cr group increased 6.72% ± 2.54%, while PL and
CON showed no significant change in CP (3.87% ± 2.30% and -6.27% ± 2.38%, respectively). Furthermore, no changes in AWC were observed in
any of the groups following treatment. CONCLUSIONS: The current findings suggest that the HIIT and supplementation protocol may be an effec-
tive method for improving CP, but had no effect on AWC. PRACTICAL APPLICATIONS: It would appear that Cr supplementation may enhance the
effect of intense interval endurance training on aerobic performance changes as measure by the CP test. ACKNOWLEGMENTS: This investigation
was supported by FSI Nutrition, Omaha, Nebraska.

NSCA National Conference & Exhibition Abstracts 26
Construct Validity Of The Myotest® In Measuring Force And Power Production
William Kraemer
Purpose: The purpose of this investigation was to determine the construct validity of the Myotest instrument by comparing it the “gold standard”
force plate and linear transducer data when measuring force and power production in the bench press/bench throw and squat/squat jump in
men and women. Methods: In this study 54 men and 43 women (age range18 to 30 yrs) gave informed consent to participate in the investiga-
tion. In order to produce a normal distribution a wide range of strength fitness capabilities were represented by the subjects who participated
in the study (1 RM strength ranges when using the Smith machine: bench press: women-18-80 kg, men- 39-171 kg; Squat women 30-115 kg,
men-75-221 kg. In addition, to the Myotest device placed on the bar, two directly interfaced computerized systems (Ballistic Measurement Sys-
tem [BMS] Innervations Inc, Fitness Technology force plate,. Australia), were used to validate and assess the experimental variables during both
1 repetition maximum (RM) maximal strength test and during power testing using the BMS Smith machine set up. Subjects performed a 1 RM
test for both the squat and bench press exercises in which maximal force was measured during the 1 RM repetition. Power testing consisted of
subjects performing the jump squat and the bench throw on the BMS at 30% of their 1RM. Regression analysis was used to determine pair wise
relationships between the Myotest instrument and the direct online measurement systems. Significance in this study was set at P≤0.05. Results:
All assumptions for linear statistics were met and statistical power was ≥ 0.89. Similar relationships were observed for men and women. The
reliability of the measures demonstrated intra-class correlation coefficients of R ≥ 0.96. The overall simple regression analyses for the Myotest to
the direct measurement systems demonstrated high significant correlations with the following results presented as R2 to represent the amount
of shared variance between the measures: bench throw force, R2= 0.92, bench throw power R2= 0.93, squat jump force R2= 0.97, squat jump
power R2= 0.82. Conclusions: The Myotest instrument demonstrated a high reliability in testing strength and power. In addition, the Myotest
instrument demonstrated a high set of construct validity scores in measuring strength and power in men and women of various strength fitness
capabilities. Practical Applications: The Myotest instrument represents an appropriate instrument and a valid method for measuring force and
power in commonly used strength and power exercise movements.
Personality Factors And Intercollegiate Tennis Association Ranking
Mark Kovacs, PhD, CSCS
In tennis players, personality characteristics may be an important component to determine success. PURPOSE: To examine the influence per-
sonality plays in collegiate male tennis players. METHODS: 93 active NCAA Division I collegiate tennis players participated in this study which
involved the International Personality Item Pool (IPIP) 50 item questionnaire focused on the big-five personality characteristics. These five per-
sonality characteristics are extraversion, agreeableness, conscientiousness, openness and emotional stability. Nine demographic questions were
also administered looking at sleeping habits, collegiate grade point average (GPA), handedness collegiate singles and doubles ranking. Bivariate
correlations were used to analyze personality and tennis ranking in collegiate tennis players. A One-way (3X2) ANOVA was used to analyze
differences between high, low and non-ranked collegiate tennis players for each of the big five personality traits (high and low). RESULTS: A
high correlation was found between singles and doubles rankings (.82), and a moderate correlation between GPA and hours of sleep (.44). The
personality characteristics showed low and moderate correlations with Intercollegiate Tennis Association (ITA) rankings. Tennis players who are
high in conscientiousness had higher Intercollegiate Tennis Association singles rankings F (1,91) = 9.58, p<.05. Tennis players who were high in
emotional stability had higher ITA singles rankings F (1,91) = 15.18, p<.05. Follow up odds ratios were examined to determine likelihoods, with
higher rankings predicted approximately a three times higher likelihood of also having high ratings of conscientiousness and emotional stabil-
ity. PRACTICAL APPLICATIONS: This information is important as it may increase the interest in the relationship between personality and tennis
performance and could become beneficial as tool to use during the athlete recruiting process.
Effect Of Speed-Jump Training On Volleyball Specific Measurements Skills In Female Athletes
Aaron Kleinwolterink, Scott Moody, Jerry Mayhew
A major objective in volleyball training is to increase vertical jump height and jump speed. Various training approaches have been attempted to
enhance the specificity of training for these elements of the game. Further investigation is needed to determine the degree to which selected
jump training techniques might enhance game-specific performance. The purpose of this study was to determine the effect of speed-jump
training on countermovement vertical jump (CMJ), 3-step approach vertical jump (AVJ), standing blocking transition jump (SBTJ), and approach
blocking transition jump (ABTJ). Female volleyball players (n = 21, age 15-21 yrs) served as subjects. Prior to training, each athlete was measured
for maximum CMJ and AVJ using a vertical pole with moveable veins that measure vertical touch height. The training program consisted of per-
forming 4 sets of 4 reactive jumps and was performed 3X/week for 6 weeks on an automated jump mat that recorded ground reaction time and
the average of the 4 jumps. During training, each athlete attempted to perform her jumps as quickly as possible while maintaining an average
jump height of at least 85% of their best CMJ. Following training, players improved significantly in CMJ (20.0 ± 2.3 to 21.0 ± 2.2 ins), AVJ (21.9 ±
3.1 to 23.0 ± 2.8 ins), SBTJ (17.7 ± 2.9 to 20.0 ± 2.4 ins), and ABTJ (20.8 ± 3.3 to 22.4 ± 2.8 ins). The relative increase in SBTJ (14.0 ± 8.9%) was signifi-
cantly greater than for ABTJ (9.1 ± 9.6%), AVJ (5.9 ± 8.2%), and (4.8 ± 4.2%), with no significant difference noted among the latter. It appears that
concentrating on quickness in jump training while attempting to maintain a near-maximal effort can produce improvements in both jumping
performance and game-specific quickness.
Effect Of Squat Depth On Vertical Jump Performance Variables
Tyler Kirby, Jeffrey M. McBride, Tony R. Larkin, Tracie L. Haines, Andrea M. Dayne, Amanda R. Roberts
Maximizing vertical jump performance is a critical element to success in many athletic situations. Certain individual kinetic and kinematic vari-
ables may have greater contributing roles to vertical jump outcome. Squat depth prior to the initiation of the concentric motion would seem
to have an impact on these variables, yet there are limited investigations comparing squat depths and vertical jump performance variables.
PURPOSE: To determine the effect of squat depth on vertical jump performance variables. METHODS: Seven recreationally-trained males (Height
= 177.9±4.7 cm, Weight = 83.6±10.5 kg) performed static jumps (SJ) and countermovement jumps (CMJ) from six squat depths (0.15 m, 0.30 m,
0.45 m, 0.60 m, 0.75 m and preferred depth) in a randomized order. Subjects held a weightless bar across their upper back attached to two linear
position transducers ensuring the bar did not move independently of the body while standing on a force plate. Peak force (PF), impulse (I) and
jump height (JH) were measured. RESULTS: Significant differences were found between 0.15 m squat depth and other squat depths (0.30 m, 0.45
m, 0.60 m and 0.75 m) for both the SJ and CMJ for PF, I and JH. SJ PF was significantly higher (p<0.05) at 0.15m (2683.3±281.5 N) in comparison
to 0.30m (2285.3±239.6 N), 0.45m (1992.4±190.3 N), 0.60m (1842.5±181.3 N), 0.75m (1761.9±214.2 N). SJ I was significantly lower at 0.15 m
(282.3±53.9 N-s) in comparison to 0.30m (377.8±53.3 N-s), 0.45 m (453.0±41.2 N-s), 0.60 m (526.0±62.5 N-s), 0.75 m (597.3±58.1 N-s). SJ JH was
significantly lower at 0.15 m (0.275±0.046 m) in comparison to 0.30 m (0.374±0.074 m), 0.45 m (0.447±0.070 m), 0.60 m (0.477±0.078 m), 0.75 m
(0.490±0.070 m). CMJ PF was significantly higher at 0.15 m (3068.9±455.6 N) in comparison to 0.30 m (2389.1±294.7 N), 0.45 m (2082.8± 266.1 N),
0.60 m (1912.8±228.0 N), 0.75 m (1709.7±210.5 N). CMJ I was significantly lower at 0.15 m (566.9±96.7 N-s) in comparison to 0.30m (816.4±119.3
N-s), 0.45m (930.3±128.1 N-s), 0.60m (1060.6±137.1 N-s), 0.75 m (1123.9±136.2 N-s). CMJ JH was significantly lower at 0.15 m (0.311±0.064 m) in
comparison to 0.30 m (0.444±0.055 m), 0.45 m (0.475±0.053 m), 0.60 m (0.508±0.078 m), 0.75m (0.540±0.060 m). For both SJ and CMJ preferred
squat depth occurred at the depth that maximized displacement (SJ-0.443±0.060 m, CMJ-0.533±0.037 m) while minimizing contact time (SJ-
253.7±40.6 ms, CMJ-716.9±97.4 ms). CONCLUSIONS: A shallow squat depth resulted in higher PF, lower I, and lower JH than squat depths of
0.30 m and lower. High PF values and low I values did not correspond with increased jump height. To maximize jump height a squat depth of
at least 0.30m should be utilized for both CMJ and SJ. When self-selecting squat depth, subjects chose a depth that would produce the highest
displacement with the shortest amount of contact time. PRACTICAL APPLICATIONS: While a shallow squat depth may decrease the time needed
to initiate a jump during competition, the result will be a decrease in jump height. While decreased contact time may be required in competition,
if the situation allows for an increased contact time it may result in greater jump height which could influence performance.
NSCA National Conference & Exhibition Abstracts 27
Effect Of Overload Sprint Cycling On Subsequent Power Output
Marcus Lawrence, Patricia G. Sevene-Adams, Joseph M. Berning, Mark DeBeliso, Kent J. Adams
Research suggests that warm-ups which elicit a post activation potentiation (PAP) effect via high intensity muscular contractions may increase
performance in subsequent activities requiring strength and power. Warm-up strategies designed to elicit a PAP may positively impact perfor-
mance. PURPOSE: The purpose of this investigation was to determine if a cycling warm-up that included a maximal overload would elicit a PAP
effect and increase subsequent sprint cycling power output. METHODS: Ten (age = 22 + 2 yrs; mass = 75 + 15 kg; ht = 173 + 11 cm) recreationally
trained athletic males (n=7) and females (n=3) participated in a with-in subjects design consisting of two randomly ordered sessions of sprint
cycling on a bicycle ergometer with computer interface to assess power output. Two warm-up conditions were employed over two days. The
standard warm-up condition consisted of a 4 minute stationary cycle ride with little resistance (1 kg) at a self-selected cadence. The overload
warm-up condition consisted of the standard warm-up, plus an overload condition. That is, after the standard warm-up, in the overload condi-
tion subjects rested for 4-minutes while the weight basket was loaded to full capacity (10 kg). At 4 minutes, subjects pedaled the cycle as fast as
possible. At maximal pedaling rpm, the weight basket was dropped manually, loading the cycle and starting a 10-second timer. In order to elicit
complete fatigue (i.e. failure to pedal) within 8-10 seconds, the researcher pressed down as needed on the weight basket thereby increasing cy-
cling resistance. After completing each individual warm-up condition, subjects then rested for 4-minutes, while 7.5% of the subject’s body weight
(kg) was loaded on the weight basket. At the 4-minute mark, subjects then pedaled the cycle as fast as possible. Once the subject reached 150
rpm (near maximal) on the cycle, the weight basket dropped, loading the cycle and starting a 10-second timer; the subject continued to pedal
as hard as possible throughout the 10-second test. Paired Samples T-test was used to determine if there was a significant difference (p < 0.05) in
power output between the two conditions. RESULTS: The results of this study demonstrated a significant increase (p < 0.05) in relative (W/kg) and
absolute (Watts) power output (13.1 + 3.0 vs. 13.4 + 3.0 and 1002.0 + 273.4 vs. 1030.2 + 270.5, respectively) after subjects performed a maximal
sprint cycle overload as compared to a standard warm-up. Despite an increase in power in the overload condition, no difference was observed in
fatigue (percent power drop) between the two conditions. CONCLUSIONS: Data from this study suggests that the use of an overload sprint cycle
warm-up may enhance activities where peak power output is required and needs to be maintained for short bouts. PRACTICAL APPLICATIONS:
The coach may consider using this type of variation in overload during their dynamic, athletic warm-up to optimize performance in sports where
peak and short-term power output are key components of competition.
Effects Of Six Weeks Periodized Squat Training With Or Without Whole Body Vibration Upon The Relationship Between Isometric And Dynamic Performance
Hugh Lamont, Joel T. Cramer, Christopher MacDonald, Michael G. Bemben
Resistance training interventions aimed at increasing lower body power and rates of force development have produced varying results. Poten-
tially, the use of WBLFV in between sets of resistance training may increase high-threshold motor unit recruitment and synchronization leading
to greater adaptations in both isometric and dynamic performance. The relationship between isometric force/time characteristics and dynamic
performance and their respective changes in response to resistance training is of practical importance to strength and conditioning practi-
tioners. PURPOSE: To determine the effects of applying whole body vibration prior to and then intermittently between sets of Smith Machine
squats upon training induced changes in isometric and dynamic performance and their relationships to one another. METHODS: Twenty four
recreationally resistance trained men were randomly assigned to one of two groups, resistance only (SQT n = 11), or resistance plus whole body
vibration (SQTV n = 13). An isometric squat test as well as Squat Jumps (SQJ) and Depth Jumps (DJ) were performed prior to, and following a six-
week, periodized Smith Machine squat program. WBLFV was applied 180 s prior to the first work set (50Hz 2 - 4mm, 30 s) and intermittently (50Hz
4 - 6mm, 3 x 10 s, 60s between exposures) within a 240s inter-set rest period. Subjects were instructed to assume a quarter squat posture while
positioning their feet directly under their center of mass which was modified using a hand held goniometer to a knee angle of 135±5°. Measures
of isometric force (N) and isometric rates of force development (N.s-1) were recorded from the onset of contraction (F0) to time points corre-
sponding to F30ms, F80ms, F250ms, Force at initial peak (Finitial), Force at 50% of MVC (MVC50) Time Finitial (ms) as well as the Peak Isometric
Force (MVCp) and Peak Isometric Rate of Force Development (PISORFD).Squat jumps were performed with a 20kg Olympic barbell with a linear
position transducer attached while the DJ utilized body mass as resistance while dropping from a height of 30cm onto a switch mat. Measures
recorded during jumps included jump height (cm) peak power (PMax, W), peak power per kg of body mass (PMax/kg, W/kg) and mean power
(Pav, W) for both jump conditions. RESULTS: Correlation matrices matching isometric force/ time variables and dynamic (SQJ, DJ) performance
within group between weeks 1 and 7 (Pre – Post training) revealed multiple significant positive, and negative correlations (p = * <.05 and** <.001,
range, r = -.624 to .859). A greater total amount of positive correlations were seen for SQTV (24) compared to SQT (2). Correlation coefficients
(r) calculated between percent change (%Δ) scores for similar variables revealed small to moderate r values with the only significant correlation
seen for the SQTV group between F30ms and DJ height (cm) (r = -.589, R2 = -.347, p <.05). More positive correlations were seen for isometric and
dynamic %Δ variables that for SQTV (9) compared to SQT (7). CONCLUSIONS: The addition of WBLFV to the SQTV group appeared to effect neuro-
muscular training adaptation differently from SQT as reflected in the percent change relationship between isometric and dynamic performance
measures following six weeks of exposure. PRACTICAL APPLICATIONS: WBLFV may help facilitate early phase adaptations to resistance exercise
with a tendency to improve early force time components of isometric and dynamic performance.
Development Of Exercise Programs For The Elderly Based On Training Methods For Athletes, And Their Posture-Improving Effects
Atsuro Kushima, Syuzo Ueki, Atsuo Kasugai, Masashi Ogasawara, Minako Ono
PURPOSE: With the purpose of reducing fall-related accidents in the elderly, we not only developed, based on the opinions of community resi-
dents, original exercise programs, but also revised existing programs designed for athletes, and examined their effects on the physical strength of
the elderly and posture improvement in an upright position. METHODS: Between November and March 2006, we held a fall prevention school 15
times in Sadowara Town, Miyazaki City, Miyazaki Prefecture. Participants were elderly people aged sixty-five years or older, including 14 members
from Group A (Group Vigor) and five candidates for leaders (19 in total) (74.32 ± 6.15) as well as 16 members from Group B (Group Energy) (80.65
± 6.38); they were divided into two groups according to the time taken to stand up from a sitting position: Groups A (Group Vigor: about three
seconds) and B (Group Energy: about five seconds).
1. Full body stretch (ten types)
2. Originally-developed fall prevention exercise
(Two kinds of Exercise for Healthy Elderly and for Frail Elderly)
3. Walking training (Light Walking)
1) Walking on heels, toes, with long strides, and while being conscious of the thighs and waist (two types of walking training for each of eleven
exercise levels)
2) Training using equipment
- Ladder Drills (nineteen types) and low hurdles (three types for each of three exercise levels)
4. Muscle training (using five types of ceramic band and three types of small ball)
5. Aerobic exercise (Step Up for Your Health)
We filmed the participants to record their postures from the front and back (frontal plane), using a digital video camera, before and after exer-
cise sessions. We used image analysis software, Dartfish (Dartfish Co., Ltd), to examine the positions of the following body parts and the angles
between them: the head, trunk, lower limbs, shoulders, hips, and the area between the top of the head and heels. RESULTS: We assessed the
physical fitness of the elderly before and after the training sessions. In Group A, improvements were observed for all eleven items, and significant
differences were shown regarding seven items. In Group B, improvements were observed for seven items, and marked differences were shown re-
garding two items. The results demonstrated an overall increase in the physical function of the elderly in both groups. However, smaller improve-
ments were made in Group B, compared to A, particularly in lower limb function. This is probably because most elderly in Group B participated
in programs that did not require vigorous exercise, including a light exercise session. CONCLUSIONS: We revised existing programs, which were
designed to train athletes, for the elderly, and implemented them along with our originally-developed exercise programs. Significant improve-
ments were observed for five of the six assessment items in the examination on the frontal plane, and the level of exercise performance was
increased in most elderly people. The exercise programs were designed to improve the sense of equilibrium in the elderly by training the muscles
on the both sides of their bodies evenly, and they proved to be effective. PRACTICLAL APPLICATION: These training programs offer considerable
benefits to the elderly, including an increase in physical function, posture improvement, and pain relief.
Power Fatigue Across Five Sets For Three Different Lifting Protocols
Rebecca Kudrna, Andrew C. Fry
Power development is a common training goal for many resistance exercisers. Because strength coaches attempt to meet these goals by manipu-
lating the number of repetitions, sets, and intensity, it is important to understand how each of these variables alter movement power. PURPOSE:
The purpose of this study is to determine how average power changes across 5 sets of squats in 3 different lifting protocols. METHODS: Seven
healthy recreationally trained males (21.4±1.67 years, 72.1±2.0 in., 202.9±21.4 lbs.), who had squatted regularly, completed each of three speed
squat (emphasizing speed of the concentric phase) protocols in randomized order and on non-consecutive days. The three testing protocols
consisted of 5 sets of 10 repetition at 30% of 1RM; 5 sets of 5 repetitions at 70% of 1RM; and 5 sets of 3 repetitions at 90% of 1RM. Power measures
accounted for system mass (bar weight + body mass) instead of merely the bar mass. Set average power (SAP) was calculated as the mean of the
repetition average power. Resting and post exercise lactate was also measured. Two way repeated measures ANOVA examined the effect of load
and set number for SAP. Post hoc tests of within-subject contrasts using Tukey’s LSD procedure were also performed. A separate repeated mea-
sures ANOVA tested for differences in lactate measures between the three protocols. RESULTS: Lactate measures were not significantly different
between the three testing protocols. Mean SAP±SE was 1040±78.9 for the 90% load, 1301±87.4 for 70% load, and 1518.5 for the 30% load. There
was a significant main effect for load (F=10.23, p= 0.004), but not for set (F= 0.883, p= 0.520). The average power was lower for the 90% protocol
than for the 30% protocol (F= 28.96, p<0.01), but there was no difference between average power produced at the 70% and 30% loads or the 70
% and 90% protocol. A significant interaction (F= 4.98, p< 0.001) was found. A post hoc analysis indicated that at the 90% load the average power
for each set decreased from sets 1 to set number 5, while in the 30% protocol SAP significant increased in set 5 compared to set 1. CONCLUSIONS:
Resistance load appears to affect power fatigue across five sets of resistance exercise. The heaviest load had the highest power fatigue, while the
moderate or 70% load did not show any evidence of power fatigue. It should also be noted that five sets at 30% 1RM produced a warm-up effect
in that SAP increased from set 1 to set five. PRACTICAL APPLICATIONS: At the intensities most frequently utilized to develop power, there is no
evidence of decreased power over 5 sets of speed squats. Practitioners attempting to train for power at higher loads (i.e. 90%) may wish to limit
the number of sets of such exercises in the training program.

NSCA National Conference & Exhibition Abstracts 28
Validity Of The Kansas Squat Test For Track And Field Sprinters And Jumpers
Paul Luebbers, Andrew C. Fry
The ability to generate power is an essential component to achieving optimal performance in several track and field events, particularly the
throws, sprints and jumps. The Wingate Anaerobic Test (WAnT) is one of the most established forms of standardized anaerobic power testing. The
WAnT is performed utilizing a cycle ergometer and has been shown to be both reliable and valid. Sprinters and jumpers train for power using
a combination of running and strength training techniques. The WAnT may be appropriate for testing the running component of training due
to its cyclical nature, but it might not be the most fitting test for addressing the more linear weight lifting component. A lift-specific power test
could allow for a more comprehensive assessment of the trained status of sprinters and jumpers than a cyclic test alone. The Kansas Squat Test
(KST) is a repetitive lifting test that has been designed to measure similar indices of power as the WAnT. PURPOSE: To examine the relationship
between the WAnT and the KST on measures of Peak Power (PP), Average Power (AP), Minimum Power (MP), Fatigue [ % Power Drop (FTG)], and
Post-test Lactate (La) for collegiate track and field sprinters and jumpers. METHODS: Seven male (72.91±10.0kg, 180.70±4.0cm) and seven female
(64.43±5.05kg, 171.63±3.55cm) members of a collegiate track and field sprinters and jumpers squad participated in this study. Each participant
completed separate familiarization sessions with both the WAnT and KST prior to the data collection sessions. A 1-RM squat was determined us-
ing a smith machine, also during an individual session. The data collection sessions were conducted at the beginning of track practice, separated
Load). Pre- and post-test lactate concentrations were also recorded. RESULTS: Pearson correlations between the WAnT and KST are as follows:
PP, r=.869**; AP, r=.875**; MP, r=.839*; FGT, r=-.369; La, r=.110 (**p<0.01; *p<0.05). CONCLUSION: These data indicate that the KST is a feasible
alternative to the WAnT for measuring Peak, Average and Minimum Power for sprinters and jumpers. PRACTICAL APPLICATIONS: Collegiate track
and field sprinters and jumpers train for power using both running and weightlifting exercises. The current study demonstrates a potential
testing method that is lift-specific which, when incorporated into a testing battery, may aid in providing a more comprehensive analysis of the
athletes’ power status.
Relationship Between Body Composition And Bat Swing Velocity Of College Softball Players
Hannah E. Lowe, Hannah E. Lowe, David J. Szymanski, Brittney L. Bankston, Michael T. Braswell, Andrew T. Britt, ShaneT. Gilliam, Amanda L. Herring, Brannon T. Holloway, David W. Lowe, Jeffrey D. Potts, Jessica M. Szymanski, Megan E.
Till.
PURPOSE: To determine the relationship of various physiological and anthropometric characteristics to bat swing velocity (BV). METHODS:
Twenty female NCAA Division I softball players (age = 19.6 + 1.0 yr) volunteered for this study. All subjects were tested for height (stadiometer);
body mass, lean body mass (LBM), body fat, and percent body fat using a TanitaTM bioelectrical impedance device; grip strength using a Jamar™
hand dynamometer; and vertical jump using a Vertec™ vertical jump apparatus to assess leg power. Instantaneous BV was recorded by a SETPRO
SPRT5ATM chronograph. For batted-ball velocity (BBV), subjects were instructed to hit balls between a zone set up on the softball field while BBV
was measured by a Stalker ProTM radar gun set up behind home plate. Subjects also visually tracked balls delivered from the Jugs¬TM automated
pitching machine and called out “ball” or “strike” as quickly as possible. An official NCAA “strike zone”, adjusted for each player, was set-up behind
each hitter. The number of correct responses was recorded as the visual tracking score. RESULTS: Correlation coefficients were calculated for all
variables by utilizing a correlation matrix from raw scores. Statistical analysis indicated significant moderate positive relationship (p < 0.05) be-
tween BV and body mass (r = 0.50), LBM (r = 0.43), and body fat (r = 0.41). Coefficient of determination were calculated for body mass (r2 = 0.25),
LBM (r2 = 0.18), and body fat (r2 = 0.17). CONCLUSION: These data suggest that significant relationships do exist between body composition and
BV, but one cannot interpret this to mean a cause and affect relationship. PRACTICAL APPLICATIONS: Strength and conditioning coaches wanting
to improve BV for female college softball players should focus on developing LBM. This should aid in the development of softball-specific power
production. Of further interest to strength and conditioning coaches, grip strength and leg power did not significantly relate to BV. These data
are similar to previous softball research.
The Effects Of Growth And Maturation On Leg Stiffness And Reactive Strength Index In Youths Aged 7 – 18 Years
Rhodri Lloyd, Oliver, Jon Hughes, Michael Williams, Craig
Stretch-shortening cycle (SSC) function, recognized as fundamental for effective plyometrics and sprinting, can be estimated from measures of
leg stiffness and reactive strength index (RSI). Whilst published data for these measures exist for adult populations, limited data is available within
paediatric populations. Given the significance of SSC to explosive ability, it is deemed necessary to identify potential sensitive periods of growth
and development which may produce accelerated adaptations. PURPOSE: (i) determine differences in leg stiffness and RSI between chronologi-
cal- and maturity-divided groups of schoolchildren (2nd-11th Grade) and (ii) investigate whether age- or maturity-related factors were dominant
contributors to RSI and leg stiffness performance. METHODS: Two hundred and fifty high school-aged boys performed four maximal hopping tri-
als and a single trial of sub-maximal hopping (2.5Hz). RSI was calculated from the maximal hopping task, whilst leg stiffness was calculated from
the sub-maximal test. Additionally, four trials of both squat- (SJ) and countermovement-jumps (CMJ) were performed, representing concentric
strength and slow SSC respectively, with the mean of the best two jump heights being used for analysis. RESULTS: One-way ANOVA’s revealed
significant increases in leg stiffness between grades 3-5 and 7-10; and between grades 4-6 and 7-10 for RSI. When grouped according to esti-
mated maturity, significant differences were found for both leg stiffness and RSI between -3 years pre-PHV (mean -2.97 yr) and PHV (mean -0.05
yr), and between PHV and +3 years post PHV (mean 2.99 yr). Multiple stepwise regression analysis revealed that body mass (R2 change = 0.62),
RSI (R2 change = 0.02) and maturity status (R2 change = 0.02) produced the greatest explained variance for leg stiffness (R2 = 0.66; p < 0.001).
When leg stiffness was normalised to body mass, height (R2 change = 0.28), RSI (R2 change = 0.09) and maturity (R2 change = 0.03) produced
the greatest explained variance (R2 = 0.40; p < 0.001). For RSI, SJ (R2 change = 0.54), stiffness (R2 change = 0.03), body mass (R2 change = 0.02),
CMJ (R2 change = 0.01) and age (R2 change = 0.01) produced the largest explained variance (R2 = 0.61; p < 0.02). Statistics for both tolerance (>
0.1) and VIF (< 10) suggested minimal risk of multicolinearity for both models. CONCLUSIONS: The greatest variance in leg stiffness and RSI can
be explained by maturational factors (body mass and concentric strength respectively). Therefore the windows of accelerated adaptation should
be expressed in relation to the onset of PHV as opposed to chronological age. Three years pre- and post-PHV should be considered as suitable
windows in which to maximise SSC adaptation. PRACTICAL APPLICATIONS: Periods of accelerated adaptation have been suggested to reflect
a time when a system(s) is most sensitive to manipulation, therefore SSC-type training may be most beneficial during the identified maturity
related periods of accelerated adaptation. Within these identified periods training emphasis should be placed on concentric strength expression
for RSI development. Whilst body mass was identified as the main contributor to leg stiffness, owing to the limited amount of explained variance
for relative leg stiffness alternative biomechanical, neuromuscular or motor control variables should be considered in future research.
Development And Validation Of The Adolescent Body Image Satisfaction Scale (ABISS):
Implications For The Strength And Conditioning Professional
James E. Leone, Joyce V. Fetro, Mark J. Kittleson, Kathleen Welshimer, Julie A. Patridge, Stacia A. Roberston, Suanne Maurer-Starks, Michael W. Olson
Purpose: The present research sought to develop and validate a novel instrument for the assessment of body image dissatisfaction and negative
health behaviors in adolescent males. Additionally, this research was focused on providing a useful tool for the strength and conditioning profes-
sional to use when assessing clinical adolescent populations who may be at risk for body image disorders related to their sport performance.
Methods: A comprehensive search of relevant medical and socio-behavioral databases was conducted for years 1990-2005 yielding 293 useable
studies (244 empirical and 49 theoretical) for inclusion in a content analysis. Search terms included ‘body image,’ ‘adolescence,’ ‘satisfaction,’ and
‘males.’ Statistically relevant interpersonal, intrapersonal, and social factors were coded and classified. The most statistically relevant factors were
formulated into questions and subscales to form the overall pilot instrument. The instrument was piloted with a sample of 27 adolescent boys
and was adjusted and revised based on feedback. Results: The initial instrument was reviewed by a panel of five content area experts. Each of the
28 scale questions were evaluated for relevance and readability. Four out of five experts (80%) had to approve the question for it to be included
in the scale. Content, face, discrepant, and convergent validity was established using the objective measures evaluated by the expert panel.
Each of the final 28 questions was determined to be appropriate and valid to be included in the scale. Nine questions were omitted based on
the evaluation and inclusion criteria. Initial pilot reliability was judge to be somewhat acceptable for the body image scale with a Cronbach’s α =
.66. Final reliability of the Adolescent Body Image Satisfaction Scale [ABISS] after the modification of 9 items was judged to be acceptable with
a Cronbach’s α = .82. Conclusions: Following the adjustments made to the ABISS during the pilot study, the instrument was used to study 330
adolescent males. Based on subjective as well as objective feedback, the ABISS appears to be a valid and reliable instrument that can be used to
measure the psychobehavioral attributes of adolescent males pertaining to body image satisfaction. Practical Applications: Strength and condi-
tioning professionals should be aware of the psychological attributes of their athletes and clients as much as their physiologic attributes. Having
an understanding of how adolescents view their bodies and the image of it will assist professionals in designing appropriate, health-promotive
strength programs, while at the same time monitoring for signs of body image dissatisfaction, which can lead to negative health practices (e.g.,
performance-enhancing drug use, exercise addictions, disordered eating). The ABISS appears to be a valid and reliable instrument to assess for
the aforementioned features, but should be further validated with other populations.

AbstractsM – O

NSCA National Conference & Exhibition Abstracts 30
Transference Of Kettlebell Training To Traditional Olympic Weight Lifting And Muscular Endurance
Pat Manocchia, David K. Spierer, Jackie Minichiello, Steven Braut, Jessica Castro, Ross Markowitz
PURPOSE: Kettlebells are commonly used across a broad spectrum of strength and conditioning programs, from novice or beginner recreational
users to elite level athletes. Many of the movements conducted with kettlebells are of a ballistic nature, similar to that of Olympic lifts. Since ket-
tlebell training and Olympic lifts display some similarities regarding the technique, we hypothesized that training with kettlebells would translate
into a resultant improvement in strength and power during Olympic style lifts. This may be of significance when deciding proper training regi-
mens or seeking an alternative to traditional lifting. The research data purporting the efficacy of kettlebell training is, to our knowledge, scarce,
and scientific examination as to whether this exercise modality positively correlates to Olympic lift strength/power is nonexistent. The purpose
of this study was to examine the translational effect that a10 week Kettlebell training program would have on strength, power and endurance
for Olympic style barbell lifts and bodyweight exercises. METHODS: Using a standard periodization model, 15 subjects, age range (20-72 years)
with various levels of experience in physical fitness regimens underwent a 10 week, 2 day per week program using only kettlebells consisting of
group (class) training sessions. Each subject was tested prior to (T1) and after the completion of the 10-week session (T2). To determine changes
in strength, power and endurance subjects were tested on a barbell clean and jerk (3 rep max), barbell bench press (3 rep max), a vertical jump
and a 900 back extension to failure. RESULTS: Statistical analysis using paired t-tests were conducted on all dependent variables. Kettlebell train-
ing results in a translation of strength, power and endurance measured in traditional lifting techniques. Data demonstrate significant differences
in bench press strength (51.7 ± 25.0 kg vs 56.4 ± 27.1 kg, p< .05) and back extension endurance (45 ± 5.7 reps vs 54 ± 9.3 reps, p< .05). Kettlebell
training produced a highly significant difference in the traditional clean and jerk, (30.8 ± 16.7 kg vs 38.5 ± 17.1 kg, p< .001). No differences were
apparent in the vertical jump. CONCLUSIONS: These data suggest a significant improvement of strength, power and endurance as a result of
kettlebell training. Although gains in the traditional Olympic lifts were greater than that seen in lower extremity power, kettlebells proved to
have a considerable transferability to traditional weight training and bodyweight exercises. PRACTICAL APPLICATIONS: Our findings indicate that
kettlebell training provides a measurable improvement of strength, power and endurance as measured by barbell and body weight exercises.
Taking into consideration that our subject demographic was broad in regards to training experience and age, our data suggest that kettlebells
can be used as an effective method for improving fitness and is not restricted to either highly skilled or elite level athletes. While further investiga-
tion into this subject is recommended, our data suggests that due to the positive translation of kettlebell training to that of Olympic lifts, the use
of kettlebells as a training implement is an excellent alternative to traditional weight lifting.
Upper Body Muscular Endurance Among Active Duty Male And Female Firefighters
Peter Magyari, Tom Fonger, Jessica May
Purpose: This study was conducted to examine the age and sex related differences in upper body muscular endurance among active duty fire-
fighters (FF). Methods: Muscular endurance was assessed using the standard YMCA Bench Press protocol on 535 (502 male and 33 female) active
duty FF. Subjects were categorized by age (< 35 years of age or > 35 years of age) and sex (male or female).Males FF lifted a 80 pound bar and
female FF lifted a 35 pound bar through the full range of motion, at a set cadence, with proper form until subjects reached fatigue. Raw scores as
well as age and gender percentile rankings were then analyzed to determine if differences exist. Level of significance was set at p < 0.05. Results:
Significant mean raw score differences existed between young (37.6 reps) and old (32.3 reps) male FF but not between young (50.8 reps) and old
(47.7 reps) female FF. Female FF lifted significantly more repetitions than male FF in both age categories. When scores were compared to age and
sex stratified normative data, the mean percentile ranking of the old male FF (78%) was significantly greater than the percentile ranking of the
young male FF (73%). Again, no differences existed among the percentile rankings of young (86%) and old (88%) female FF. Female FF ranked
significantly higher than male FF when compared to normative data in both age categories. Conclusions: Both male and female FF have a high
level of upper body muscular endurance. Age has a greater impact on upper body muscular endurance in male FF. Female FF score higher than
male FF when the YMCA Bench Press test is used to assess upper body muscular endurance. Practical Applications: Further study in this area is
needed to identify whether the age related decrease in muscle endurance observed in male FF is task relevant.
A Comparison Of The Effects Of 6 Weeks Of 3 Different Training Modes On Measures Of Strength And Anthropometrics
Christopher MacDonald, Hugh S. Lamont, John C. Garner
The focus on combining different training protocols, like resistance, plyometric training, or a combination, into a periodized program is an area of
increasing interest in the strength and conditioning field. Complex training alternates between heavy and lighter load resistance exercises with
similar movement patterns in a single exercise session. This may bring about a state of Post Activation Potentiation (PAP) resulting in increased
dynamic power (Pmax) and rate of force development (DRFD) during the lighter load exercise. Such a method may be more efficient than either
modality used independently for developing sport specific strength and power. PURPOSE: The purpose of this research was to compare the
effects of resistance, plyometric, and complex training on lower body strength measures and anthropometrics in recreationally trained college
aged males. METHODS: 30 recreationally trained college aged males were trained using 1 of 3 methods; resistance (RT) (n = 11; height: 181.52
± 3.64 cm; mass: 85.34 ± 22.14), plyometric (PT) (n = 9; height: 182.67 ± 8.29 cm; mass: 82.63 ± 10.80 kg), or complex (CT) (n = 10; height: 185.17
± 5.56 cm; mass: 87.54 ± 9.04 kg) twice a week for 6 weeks. Participants were tested pre and post training to assess back squat strength (kg),
Romanian dead lift (RDL) strength (kg), standing calf raise (SCR) strength (kg), quadriceps girth (cm), triceps surae girth (cm), body mass (kg), and
fat free mass (%). RESULTS: Repeated measures ANOVA (Group (3) x Time (3)) revealed a significant increase for squat strength (F2, 27 = 71.05,
p < 0.00), RDL strength (F2, 27 = 85.72, p < 0.00), and SCR strength (F2, 27 = 139.02, p < 0.00) for all groups, from pre to post, with no significant
differences between groups. There was also a main effect for time for the girth measures of the quadriceps muscle group (F2, 27 = 8.49, p < 0.00),
the triceps surae muscle group (F2, 27 = 8.32, p < 0.00), and body mass (F2, 27 = 3.55, p < 0.05; post hoc revealed no significant difference). Finally,
there were main effects for time as well as group * time interactions for fat free mass % (time: F2, 27 = 19.86, p < 0.00; group * time: F2, 27 = 2.62,
p < 0.05). CONCLUSIONS: The incorporation of different modes of resistance training, over a 6 week cycle, resulted in increases in back squat, RDL,
and SCR strength for all 3 groups as well as increases in upper and lower leg size. There was a significant increase in the RT and the PT groups’
fat free mass; however, there was no change in the CT group. Significant changes in strength and anthropometrics in the CT group may have
been seen if the training protocol was longer than the allotted 6 weeks to allow for hypertrophic adaptations to this training group, who had no
complex training experience. PRACTICAL APPLICATIONS: Results from the current study suggest that complex training mirrors the benefits seen
with traditional resistance or plyometric training. Moreover, complex training revealed no decrement in strength and anthropometric values and
it appears to be a viable training modality. Further, complex training allows for the incorporation of various modalities into a single work session,
offering variability and time efficient training regimens into a power athlete’s periodization. Further research is warranted to determine the opti-
mal set/repetition/timing scheme of complex training, in this population, to maximize the benefits of this hybrid training method.
Validity Of The Kansas Squat Test For Track And Field Sprinters And Jumpers
Paul Luebbers, Andrew C. Fry
The ability to generate power is an essential component to achieving optimal performance in several track and field events, particularly the
throws, sprints and jumps. The Wingate Anaerobic Test (WAnT) is one of the most established forms of standardized anaerobic power testing. The
WAnT is performed utilizing a cycle ergometer and has been shown to be both reliable and valid. Sprinters and jumpers train for power using
a combination of running and strength training techniques. The WAnT may be appropriate for testing the running component of training due
to its cyclical nature, but it might not be the most fitting test for addressing the more linear weight lifting component. A lift-specific power test
could allow for a more comprehensive assessment of the trained status of sprinters and jumpers than a cyclic test alone. The Kansas Squat Test
(KST) is a repetitive lifting test that has been designed to measure similar indices of power as the WAnT. PURPOSE: To examine the relationship
between the WAnT and the KST on measures of Peak Power (PP), Average Power (AP), Minimum Power (MP), Fatigue [ % Power Drop (FTG)], and
Post-test Lactate (La) for collegiate track and field sprinters and jumpers. METHODS: Seven male (72.91±10.0kg, 180.70±4.0cm) and seven female
(64.43±5.05kg, 171.63±3.55cm) members of a collegiate track and field sprinters and jumpers squad participated in this study. Each participant
completed separate familiarization sessions with both the WAnT and KST prior to the data collection sessions. A 1-RM squat was determined us-
ing a smith machine, also during an individual session. The data collection sessions were conducted at the beginning of track practice, separated
Load). Pre- and post-test lactate concentrations were also recorded. RESULTS: Pearson correlations between the WAnT and KST are as follows:
PP, r=.869**; AP, r=.875**; MP, r=.839*; FGT, r=-.369; La, r=.110 (**p<0.01; *p<0.05). CONCLUSION: These data indicate that the KST is a feasible
alternative to the WAnT for measuring Peak, Average and Minimum Power for sprinters and jumpers. PRACTICAL APPLICATIONS: Collegiate track
and field sprinters and jumpers train for power using both running and weightlifting exercises. The current study demonstrates a potential
testing method that is lift-specific which, when incorporated into a testing battery, may aid in providing a more comprehensive analysis of the
athletes’ power status.

NSCA National Conference & Exhibition Abstracts 31
Effect Of Absolute And Relative Loading On Muscle Activity During Stable And Unstable Squatting
Jeffrey McBride, Tony R. Larkin, Andrea M. Dayne, Tracie L. Haines, Tyler J. Kirby
Studies have reported various results with respect the level of muscle activity present during the performance of exercises in stable and unstable
conditions. Some of the contradictions may be due to the use of relative or absolute loading during the comparisons of the two conditions.
PURPOSE: The purpose of this investigation was to determine the effect of stable and unstable conditions on one repetition maximum strength
and muscle activity during dynamic squatting using both relative and absolute loading. METHODS: Ten recreationally weight trained males par-
ticipated in this study (age = 24.1±2.0 yrs, height = 178.0±5.6 cm, body mass = 83.7±13.4 kg, 1RM/body mass = 1.53±0.31), which involved two
laboratory sessions separated by one week. Linear position transducers were used to track bar displacement while subjects stood on a force plate
for all trials. Vastus lateralis (VL), biceps femoris (BF) and erector spinae (L1) muscle activity (average integrated EMG (IEMG)) was also recorded
during all trials. During the first session subjects complete a one repetition maximum test in a stable dynamic squat (S1RM = 128.0±31.4 kg)
and an unstable dynamic squat (U1RM = 83.8±17.3 kg) in a randomized order with a thirty minute rest period between conditions. The second
session consisted of the performance of three trials each for twelve different conditions in a randomized order: 1) unstable squats using 70%
of US1RM, 2) unstable squats using 80% of US1RM, 3) unstable squats using 90% of US1RM, 4) stable squats using 70% of S1RM, 5) stable squat
using 80% of S1RM 6) stable squats using 90% of S1RM, 7) unstable squats using 58.6±12.1 kg, 8) unstable squats using 67.0±13.9 kg, 9) unstable
squats using 75.4±15.6 kg, 10) stable squats using 58.6±12.1 kg, 11) stable squats using 67.0±13.9 kg, and 12) stable squats using 75.4±15.6 kg.
RESULTS: Results revealed a statistically significant difference between S1RM and US1RM values (p ≤ 0.05). The stable trials resulted in the same
or a significantly higher value for VL, BF and L1 muscle activity in comparison to the unstable trials for all twelve conditions. CONCLUSIONS: It
appears that an unstable condition during dynamic squatting results in the same or significantly lower values of muscle activity in comparison
to stable squatting. PRACTICAL APPLICATION: Unstable exercises are not recommended for utilization by practitioners as they do not increase
muscle activation in comparison to stable exercise modalities and may limit possible physiological adaptations.
Comparison Of Changes In Upper And Lower Body Strength Following Resistance Training Among Adolescent Men And Women
Jerry Mayhew, Lori Peters, Tom Godfredsen, Alexander J. Koch
The stigma against women engaging in heavy resistance training has all but disappeared. This has opened the way for women to train with pro-
grams comparable to those of men. Limited data exist to determine if women make the same gains as men from comparable resistance training
programs. PURPOSE: To compare the effect of similar resistance training programs on maximal strength and muscle endurance of adolescent
men and women. METHODS: Adolescent men (n = 50, age = 16.9 ± 0.7 yrs) and women (n = 24, age = 16.9 ± 0.9 yrs) were evaluated for 1-RM
free-weight bench press (BP) and squat (SQ) before and after training 4X/wk for 8 wk. In addition, each subject performed repetitions-to-fatigue
(RTF) using a weight that allowed between 2 and 10 RTF. Both groups utilized a linear periodization program designed to enhance muscle
strength. Participants were instructed to perform post-training RTF at the same %1-RM as pre-training RTF. RESULTS: Men had significantly
greater absolute and relative BP and SQ performances before and after training compared to women. Men had a comparable percent increase
in BP (11.6 ± 10.0%) compared to women (11.6 ± 12.2%); however, women made a significantly greater percent increase in SQ (20.0 ± 13.7%)
than men (7.0 ± 6.9%). The BP:SQ ratios were not significantly different between men (0.64 ± 0.13) and women (0.67 ± 0.10) before training but
tended to increase slightly after training in men (0.68 ± 0.08, p = 0.08) but significantly decrease in women (0.59 ± 0.12, p<0.01). This change
was due to the greater relative increase in SQ by women compared to their BP which produced a significant difference in BP:SQ ratio between
the genders after training (p<0.001). Men and women produced approximately the same number of RTF at comparable %1-RM for both BP and
SQ before and after training. Strength changes were not significantly correlated with RTF change in BP or SQ. CONCLUSION: Adolescent men
and women make comparable relative increases in BP after resistance training, but women may have a greater capacity for increasing SQ. Rela-
tive muscular endurance is not altered by short term increases in muscle strength for upper or lower body exercises. PRACTICAL APPLICATION:
Given the same training program, adolescent women show comparable percent increases in upper body strength but greater gains in lower
body strength than adolescent men.
Difference In 40-Yd Dash And Pro-Agility Times On Artificial Turf And Natural Grass
Jerry Mayhew, Graydon Gaines, Andy Swedenhjelm, Jesse Cooper, Michael Bird, and Jeremy Houser
Artificial turf has become the state of the art for the playing surface in football. Anecdotal evidence suggests that artificial turf may enhance
sprint speed, but there seems to be little scientific data to support this claim. Purpose: The purpose of this study was to determine the difference
in 40-yd dash and pro-agility time on artificial turf (AT) and natural grass (NG). Methods: Red-shirt freshmen Div II college football players (n =
24) performed two trials each of a 40-yd dash and pro-agility run on each surface. The first test series was performed on AT, and the second test
series was performed a week later on NG. Players wore shorts, T-shirts, and regulation football cleats. Two sprints were timed by an electronic
timing system (ET) and by 2 hand timers (HT). Agility was timed on each surface by 2 hand timers; the average of the two timers was used. Results:
Intraclass correlation coefficients (ICC) for repeated trials ranged from 0.80 (pro-agility) to 0.99 (ET 40-yd dash). There was no significant differ-
ence in 40-yd dash times between ET on turf (5.39 ± 0.30 s) and on NG (5.38 ± 0.33 s). HT 40-yd dashes (AT: 5.12 ± 0.30 s, NG: 5.16 ± 0.30s) were
significantly faster than ET 40-yd dashes (AT: 5.39 ± 0.30 s, NG: 5.38 ± 0.33 s) on both surfaces. The difference between HT and ET on turf (0.28
± 0.8 s) was significantly greater than the difference on NG (0.22 ± 0.05 s), and the differences were nonsignificantly correlated (ICC = 0.21). The
relationship between the difference between HT and ET vs the criterion ET was greater for NG (r = 0.65, p<0.01) than for AT (r = 0.16, p=0.35). Pro-
agility times were significantly faster on turf (4.64 ± 0.28 s) than on grass (4.76 ± 0.32 s). Conclusion: Sprint speed is no faster on AT than on NG,
but cutting speed may be faster on AT. Based on the difference between HT and ET, hand-timers may disproportionately anticipate players to be
faster on AT than on NG. Furthermore, the slower a player is on NG, the faster his time was anticipated to be by HT. Practical Application: Artificial
turf may not enhance straight-ahead speed but may aid change-of-direction speed in college football players. Anticipation of straight-ahead
speed by hand-timers may cause a slightly faster recording of 40-yd dash speed when sprints are performed on AT.
Educational Contents Analysis Of Ncca Accredited Personal Training Certification Programs
Iván Gonzalo Martínez, Pedro J. Benito, Peinado Esther, Morencos Martínez
We are attending a vertiginous growth of the implantation of personal training (PT) services in Spain. However, there´s a great confusion on
what type of knowledge, skills and abilities (KSAs) should PT have due to it´s width and fast implementation, together with the absence of
professional regulation.
PURPOSE: The aim of this study is to determine the relative importance that several international certifications, accredited by National Com-
mission For Certifying Agencies (NCCA) as of December 2008, grant to different knowledge fields. METHODS: Contents of 10 PT certifications
programs were analyzed: NSCA, ACSM, NASM, ACE, IFPA, NCSF, NETA, NESTA, NFPT and The Cooper Institute. Distribution of the contents in 8
categories that include all KSAs that should have a PT, according to these organizations. A international panel of experts validated the election
and definition of the categories, afterwards we distributed the contents of each certification in these categories. When any content didn’t agree
exactly with those owned to this study, an interpretation was carried out, assigning the relative importance based on panel of experts criteria.
Statistical analysis used measures of central tendency (mean and standard deviations), as well as coefficient of variability (C.V.), using SPSS
software (v.15.0; SPSS, Inc. Chicago, IL). RESULTS: The categories resulted from the analysis are (Table 1): exercise programming and prescription
(EPP), applied sciences (AS), physical fitness testing and interpretation (PFT), exercises technique (ET), nutrition (N), marketing and business
applications (MB), safety and emergency management (SEM), legal issues (LI). The most relevant category is EEP, with an average of importance
among all certifications of 24,8%. It´s followed by AS (22,5%), PFT (19%), and ET (17,3%). Resting categories (N, MB, SEM and LI), have an
importance average lower than 10%. The relevance of the MB category is the most heterogeneous, data that indicates a great disagreement
among the studied certifications in relation to this aspect of PT competence. CONCLUSIONS: EPP is the most important content, followed by
AS, PFT and ET. On the other hand, N, MB, SEM and LI are the categories considered as less relevant. PRACTICAL APPLICATIONS: PT educational
programs should distribute their contents and load assigned to them in a similar way to the results obtained in this study.
Table 1. Personal training certification programs contents and measurements of central tendency
CONTENTS CERTIFICATION PROGRAM
Mean SD C.V. ACE ACSM NASM NSCA TCI NCSF NETA NFPT NESTA IFPA
Exercise programming and prescription 23 28 20 25 27,5 20 37,5 25 23 19 24,8 5,42 22%
Applied sciences 25 28 8 10 30 35 10 35 15 29 22,5 10,67 47% Physical fitness testing
and interpretation 24 13 25 15 17,5 12 32,5 20 8 23 19 7,33 39%
Exercises technique 15 10 25 35 10 15 15 10 23 15 17,3 8,06 47% Nutrition 5 9 10 5 5 18 -- 5 -- 8 8,12 4,48 55%
Marketing and business applications -- 2 7 -- 5 -- -- -- 15 -- 7,25 5,56 77%
Safety and emergency management 4 8 2 6 2,5 -- 2 2 8 8 4,72 2,77 59%
Legal issues 4 2 3 4 2,5 -- 3 3 8 -- 3,68 1,86 51%
NSCA National Conference & Exhibition Abstracts 32
Vo2 Max And Lactate Recovery Are Related To Repeat Sprint Ability In College Hockey Players
Edward McNeely, Stephanie Millette, Ken Brunet and Kevin Wilson
PURPOSE: Hockey is a repeat sprint sport with shifts lasting 30-90 seconds. Hockey players will perform 60-90 sprints per game depending on
position and level of play. It has been suggested that aerobic fitness and blood lactate removal ability plays a role in recovery between sprints
and the ability to maintain speed or power output during repeat sprint activities. The purpose of this study was to determine the relationship
between repeat sprint ability and aerobic fitness and lactate removal in elite hockey players. METHODS: Data collected on 21 Division I male
hockey players, forwards and defencemen, during fitness testing at preseason training camp was used in the study. Testing was conducted in
two sessions, a week apart. In the first session the subjects performed the Reed Repeat Sprint Test, an on ice test that involves skating from the
goal line to the far goal line and back to the near blue line, covering 300 feet. A repeat is performed every 30s seconds for a total of six repeats.
Subjects are electronically timed for each repeat. After the final repeat heart rate recovery is measured every 30s for the first two minutes of the
recovery period. Blood lactate samples are taken 60, 180, and 300 seconds after the final repeat. In the second session all subjects completed a
multistage ramp test on a Monark bicycle ergometer to determine VO2 max. Expired gases were collected throughout the test and analyzed on
a Sensormedics V-Max metabolic cart. The test was terminated when the subjects could not maintain the required workoload. RESULTS: Mean
time for each repeat can be seen in table 1. The average time for the six trials was 13.37 ±0.50s. The average drop off, the difference between
the best and worst time was 2.70±1.14 seconds. The Fatigue Index, the drop off divided by the best time was 22.7% ±0.10. Lactate recovery was
calculated as the difference between the peak lactate from the 60s or 180s post sample and the 300s post sample. Mean lactate recovery was
-1.37±1.78 mMol. The mean VO2 max was 59.6 ± 5.48 ml/kg/min. Significant correlations were found between VO2 max and drop off, r = -0.47
(p< 0.05); drop off percentage, r = -0.455 (p< 0.05) and worst time, r = -0.49 (p< 0.05). Lactate recovery was significantly correlated to drop off (r
= - 0.49; p< 0.05) and drop off percentage (r = - 0.54; p< 0.05) but not worst time. CONCLUSION: These results indicate that aerobic fitness and
lactate removal are related to repeat sprint abilities in ice hockey players perform an on ice repeat sprint test. PRACTICAL APPLICATION: Even
though ice hockey is often considered an anaerobic repeat sprint sport, the development of aerobic fitness should be considered an important
part of a hockey players training program.
Figure 1.
Trial 1 2 3 4 5 6
Mean time 11.96 12.58 13.23 13.77 14.25 14.50
STD 0.40 0.52 0.59 0.66 0.74 1.07
In Season Changes In On Ice Fitness In Division I Ice Hockey Players
Edward McNeely
PURPOSE: During the college hockey season players are faced with increased travel, school schedules and NCAA regulations that limit the
amount of time that they can dedicate to hockey. In addition a change in focus from conditioning to technical and tactical development can
result much less time dedicated to fitness activities compared to the summer months. Recently papers on fitness levels of basketball and foot-
ball players have suggested that there is a decline in fitness during the competitive season. The purpose of this study was to determine in on
ice fitness changes during a hockey season. METHODS: Data collected on 21 Division I male hockey players, forwards and defencemen, during
fitness testing at preseason training camp (Sept) and follow up testing mid season, five months after the first test (Jan), was used in the study.
All athletes had been on ice for at least three weeks prior to the first round of testing. In both sessions the subjects performed the Reed Repeat
Sprint Test, an on ice test that involves skating from the goal line to the far goal line and back to the near blue line, covering 300 feet. A repeat
is performed every 30s seconds for a total of six repeats. Subjects are electronically timed for each repeat. Blood lactate samples are taken 60,
180, and 300 seconds after the final repeat. Data was analyzed by one-way repeated measures ANOVA. When a significant difference (p<0.05)
was indicated the Tukey HSD post hoc test was applied. Results are reported below as mean ± SD. RESULTS: Mean time for each repeat can be
seen in table 1. There were no differences for the time of each repeat between Sept and Jan. There was also no change in fastest time for any of
the repeats. The average of the six sprints was significantly (p < 0.05) lower in Jan compared to Sep (13.07±0.34ss vs. 13.37 ±0.50s). The average
drop off, the difference between the best and worst time was less in Jan compared to Sep (2.09±0.52s vs 2.70±1.14s; p<0.05). The Fatigue Index,
the drop off divided by the best time was lower in Jan ( 0.176 ±0.05 vs 0.227 ±0.10; p<0.05). Lactate recovery was calculated as the difference
between the peak lactate from the 60s or 180s post sample and the 300s post sample. Mean lactate recovery in Sept was -1.37±1.78 mMol and
-1.22±1.59mMol in the Jan trial, with no difference between the trials. CONCLUSION: While some of the improvement in performance may be
attributed to improved skating technique as a result of skating everyday during the season compared to three weeks of skating prior to the first
test, the amount of dedicated training and practice during the season is sufficient to improve on ice fitness in male division I college hockey
players but not sufficient to increase peak speed for a single 300 foot repeat. PRACTICAL APPLICATION: Despite the challenges associated with
class schedules, travel and the need for technical and tactical practices, the training time that is available is of sufficient duration and intensity to
see improvements in on ice conditioning.
Figure 1.
Trial 1 2 3 4 5 6
Mean time (Sept) 11.96 12.58* 13.23* 13.77* 14.25 14.50
STD 0.40 0.52 0.59 0.66 0.74 1.07
Mean time (Jan) 11.87 12.39* 13.06* 13.43* 13.79* 13.87
STD 0.34 0.39 0.40 0.42 0.46 0.51
* Significantly different than the preceding repeat in the same trial period
Assessment Of The Reliability Of Vertical Jump Performance From An Instrumented Platform
Jessica McLagan, Jeremy Daily, Catherine Shepherd, Nathan Olson, Mallory Marshall, John Caruso
PURPOSE: Vertical jump performance is an integral component to success in many athletic endeavors. Measurement of an athlete’s jump prowess
is typically accomplished with a Vertec (Sports Imports; Columbus, OH) which merely indicates the vertical height attained. However a recently
created device calculates jump height from measurements collected as a person ascends, remains in the air, and lands on an instrumented
platform. Before the new device can be used instead of a Vertec, the reliability of its jump heights in relation to the latter device must first be
ascertained. Thus the purpose of this project is to assess the reliability of jump heights measured from the instrumented platform to those con-
currently obtained from the Vertec. METHODS: Subjects (n = 105) performed two separate jump trials. Preceded by a familiarization session, each
trial consisted of a warm-up, followed by a series of vertical jumps performed with maximal effort. The instrumented device included a triangular-
shaped platform and three load cells that measures forces associated with the vertical jump. Next to the instrumented platform was a Vertec,
which is equipped with slap sticks separated by 1.27cm increments to provide simultaneous measurement of subject’s performance. Thus with
each jump, values derived from the instrumented platform were compared to those of the Vertec to assess the reliability of the former device.
On-line data collection and software (Labview 8.0, Austin, TX) calculated subject’s jump performance from the instrumented platform based on
their takeoff, hang time, and landing. Reliability assessed platform vertical jump estimates from takeoff, hang time and landing to Vertec values.
RESULTS: Intraclass correlation coefficients were used to determine reliability. With Vertec values as the criterion measure, intraclass correlation
coefficients were as follows: takeoff = 0.90, hang time = 0.93 and landing = 0.67. CONCLUSIONS: Results suggest vertical jump estimates from
takeoff and hang time, but not landing, serve as reliable measures from performance assessed from the Vertec. Apparently as subjects landed
on the platform, impact forces reduced the reliability of height estimates derived from landing. In contrast, since subjects remained motionless
at the start of jumps, this may have reduced the variability of the data and increased the reliability of measurements derived from takeoff on
the platform. PRACTICAL APPLICATIONS: Future work should attempt to derive more reliable estimated from landing measurements, yet current
results suggest the instrumented platform may be beneficial in the assessment of vertical jump performance.
The Relationship Between Unilateral And Bilateral Jump Kinematics And Sprint Performance
Kevin McCurdy, John Walker, Mike Guerrero, Matt Kutz
Purpose: The purpose of this study was to determine the relationship between measures of unilateral and bilateral jumping performance and
10- and 25-meter sprint performance. Methods: Fifteen division I women soccer players (height 165 ± 2.44 cm, mass 61.65 ± 7.7 kg, age 20.19
± 0.91 yrs) volunteered to participate in this study. After a 10-minute warm up and dynamic stretches, the subjects completed a 10-meter and
25-meter sprint test. Sprint time was measured with an accelerometer using an electronic timing gate system (Inform Sport Training Systems,
Victoria, BC. Canada). The accelerometer was worn at the waist, which also measured step length, step frequency and jump kinematics. The
following jump kinematic variables were measured: vertical jump height, horizontal jump distance, total contact time (eccentric through con-
centric time), concentric contact time, and flight time. Two trials at each sprint distance were completed with 2 minutes of rest between each
trial while the best time was recorded for analysis. After a minimum of 48 hours of rest, the subjects completed the jump tests. After a 10-minute
warm up and dynamic stretches, the following jumps were completed in random order with a 1-minute rest period between each trial: bilateral
countermovement vertical jump (BCV), bilateral countermovement horizontal jump (BCH), bilateral 40 cm drop vertical jump (BDV), bilateral 40
cm drop horizontal jump (BDH), unilateral countermovement vertical jump (UCV), unilateral countermovement horizontal jump (UCH), unilateral
20 cm drop vertical jump (UDV), and unilateral 20 cm drop horizontal jump (UDH). The unilateral jumps were performed on each leg. The trial
with the best reactive strength (RS) (jump height or distance/total contact time) was recorded to analyze the relationship between jump kine-
matics and sprint performance. The relationship between the best flight time to concentric contact time ratio (FT/CCT) and sprint performance
was also analyzed. Results: None of the bilateral jump kinematics significantly correlated with 10 m and 25 m sprint time, step length, or step
frequency. However, RS significantly correlated with 25 m step length during the left leg UCV (r = 0.63, p = 0.02, SEE = 0.057 m). Right leg jump
height (r = -0.71, p = 0.006, SEE = 0.152 s), RS (r = -0.67, p = 0.012, SEE = 0.161 s), and FT/CCT (r = -0.58, p = 0.04, SEE = 0.176 s) were significantly
correlated with the 25 m sprint time during the UCV. Right leg FT/CCT was also significantly related to 25 m step length (r = 0.68, p = 0.03, SEE
= 0.06 m) during the UDV. Conclusion: In comparison to bilateral jumps, unilateral vertical jumps produced a stronger relationship with sprint
performance. Practical Application: The data indicate that greater emphasis on unilateral jump training may produce better improvement in
sprint performance than bilateral training.

NSCA National Conference & Exhibition Abstracts 33
The Effects Of High Volume Aquatic Plyometric Training On Vertical Jump, Muscle Power, And Torque
Mike Miller, Adam H. Ploeg, Travis J. Dibbet, William R. Holcomb, David C. Berry, Jennifer O’Donoghue
Plyometric and aquatic plyometric exercises have been shown to improve athletic performance. One benefit of aquatic plyometric activities is
the ability to decrease stresses on the body due to the buoyant properties of water. Buoyancy acts as a counterforce to gravity by supporting
the body as it moves downward and should allow an athlete to complete higher volumes of aquatic plyometrics with the potential for increased
physical outcomes. PURPOSE: The purpose of this study was to examine the effects of high volume aquatic-based plyometrics versus traditional
land or aquatic plyometric training on vertical jump (VJ), muscular peak power and torque in the dominant knee. METHODS: A random sample of
forty-seven healthy subjects started the training, but only thirty-nine (n=39) completed the protocol due to non-compliancy issues and injuries
that occurred outside of the training protocol (16 males: age 21.8 ± 2.3, height 181.9 ± 6.9cm, weight 80.7 ± 9.2kg; 23 females: age 22.4 ± 3.5,
height 166.5 ± 5.8cm, weight 65.7 ± 10.0kg). The subjects were randomly assigned to one of four groups prior to the data collection process:
aquatic group 1 (APT1, 10 subjects), aquatic group 2 (APT2, 11 subjects), land group (LPT1, 8 subjects), and control group (CON, 10 subjects). A
six-week plyometric training program for the three exercise groups was conducted twice a week for approximately 30 minutes. APT1 performed
a plyometric program in the aquatic setting, while LPT performed the same protocol on land. APT2 performed double the volume of the plyo-
metric program in the aquatic setting. The control group did not participate in any plyometric training and were instructed not to alter their
current exercise habits. The exercise groups participated in a plyometric training program that focused on hops and jumps of differing intensities
both forward, backward, and laterally. Barriers of different heights were also included in the training program. All subjects were pre and post
tested in the performance variables of vertical jump using a VerTec and concentric peak torque and power of the hamstrings and quadriceps
using the dominant knee on a KinCom isokinetic dynamometer. A 2 (time) X 4 (group) ANOVA with repeated measures was used to determine
if differences existed between the performance variables. RESULTS: At the conclusion of the six-week training program, we found no significant
differences in any groups for all tested variables. However, APT2 showed the greatest increased average VJ (+ 1.3cm), overall peak power values
(hamstrings, + 14.8W, quadriceps, + 1.2W), and peak torque (quadriceps, + 3.2 ft.lbs) of all training groups. CONCLUSION: Although we found no
significant differences in the performance variables, APT2 improved the most in four out of five tested performance variables showing there are
still benefits to aquatic plyometric training. More research is needed to determine aquatic training parameters for optical performance. PRACTI-
CAL APPLICATION: Despite the fact that our training groups did not differ in their performance, there has been previous research that supports
plyometric training in the aquatic environment. Health care professionals can utilize the buoyant properties of water to decrease the potential
for injury and provide an excellent training environment for athletes and clients alike to increase their performance.
Identification Of Position-Specfic Combine Test Score Thresholds For Drafted And Non-Drafted Defensive Players Entering The National Football League
Jason Miller, P.A. Eisenman, M.A. Waller, T.A. VanHaitsma, D.P. Williams
PURPOSE: The National Football League (NFL) Combine (COM) is a test battery designed to identify the collegiate players that could be success-
fully drafted into the NFL. Although another study has investigated the prediction of draft status from multiple COM test scores, the specific
identification of threshold values from each COM test score that distinguishes subgroups of players with a greater or a lesser chance of being
drafted is unknown. The purpose of this study was to identify, for each defensive position, the specific COM tests and their threshold values that
contribute to an increased or decreased likelihood of being drafted. METHODS: The COM data for 758 defensive players (average round drafted
4.0±1.9), 127 defensive tackles (DT), 155 defensive ends (DE), 81 inside linebackers (ILB), 125 outside linebackers (OLB), 138 cornerbacks (CB)
and 132 safeties (S) from 1999 to 2008 was gathered from www.nfldraftscout.com, a source of COM data in other investigations. Only players
who had a complete set of the COM variables: height (HT), weight (WT), body mass index (body weight/height2) (BMI), 40-(FD), 20-(TW) and
10-(TE) yard dash, 3-cone drill (3C), pro agility (PA), vertical jump (VJ), broad jump (BJ), and 225lb bench press (BP) repetitions-to-failure were in-
cluded in the study. Signal detection analysis (SDA) (sensitivity & specificity = 50%) identified the significant COM test subgroups and decision
tree for each position. RESULTS: A decision tree with DE is shown in Figure 1.
Figure 1. DE decision tree, 4 subgroups.
The SDA yielded 4 subgroups of varying percentages of drafted players for all positions. However, ILB and CB only had 3 subgroups due to
smaller undrafted sample sizes in those positions. The subgroup with the highest number of drafted players for each position is as follows, for
DT: WT>299lbs and a TE<1.85s (83.1% drafted), DE: FD<4.88s and a WT>254lbs (94.4% drafted), ILB: TW<2.81s and a BP>20 repetitions (85%
drafted), OLB: TE<1.68s and a PA<4.36s (88.2% drafted), CB: FD<4.59s and a PA<4.33s (91.9% drafted) and S: FD<4.59s and a TW<2.65s (86.0%
drafted). CONCLUSION: The identified COM tests for each position matched the perceived on field demands of that position. Speed coupled
with lateral quickness or acceleration was important for CB and S who cover offensive backs and receivers in passing routes. Speed or accelera-
tion along with body size was important for the DT and DE who must elude offensive linemen, stop the run and rush the quarterback (QB).
Acceleration and strength were important for ILB who play a quick and physically demanding position, while acceleration and lateral quickness
were important for OLB who not only cover backs and receivers in passing routes but also rush the QB. PRACTICAL APPLICATION: The present
identification of position-specific COM test score thresholds may provide useful training goals that, if reached, could increase the likelihood of
being drafted.
The Effects Of Shoulder Girdle Dynamics, Reach, And Jump Mode On Vertical Jump Performance
Don Melrose, Mary L. Barnes, Liette B. Ocker, Frank J. Spaniol, Randy Bonnette, and George Woods
PURPOSE: The purpose of this study was two-fold; 1) to investigate the effects of shoulder girdle dynamics, reach, and scapular elevation on verti-
cal jump performance and 2) to investigate why measurements of vertical jump in Kinesiology students ascertained from a traditional vertical
jumping apparatus (VVJ) are significantly different from those measurements taken from an electronic vertical jump mat (MVJ). A recent class
sample of 50 students revealed a significant difference (p<0.05) between vertical jumps performed with a traditional vertical jump apparatus
(54.4±12.6 cm) and the electronic jump mat (50.9±11.8 cm). In this sample the MVJ measurement was significantly lower than that of the tradi-
tional apparatus. METHODS: Twenty volunteers, 10 women and 10 men, aged 24.1 ± 5.5 years were tested. All subjects were Kinesiology students
at Texas A&M University-Corpus Christi. Population demographics for women were as follows: height: 163.8±5.3 cm, weight: 63.2±5.5 kg, body
fat: 23.3±5.9% and BMI: 23.6±2.5 kg/m2. Population demographics for men were as follows: height: 175.1±5.5 cm, weight: 83.8±13.9 kg, body
fat: 16.8±5.3% and BMI: 27.5±5.9 kg/m2. All testing occurred in two sessions, one week apart, and in randomized order. One session consisted
of three jump trials utilizing the MVJ only (49.9±10.8 cm), the second session consisted of three jump trials that utilized the VVJ only. Shoulder
girdle measurements were taken during both sessions. These measurements consisted of reach height at shoulder extension (RHSE) (214.3±10.6
cm), reach height at maximal scapular elevation after shoulder extension (MRH) (222.8±4.3 cm), scapular rotation (SR), and shoulder elevation
displacement (SD). Vertical jumps using the traditional vertical jumping apparatus were calculated using both the RHSE (54.7±13.7 cm) and MRH
(44.9±10.9 cm). A one-way RM ANOVA with a pair-wise comparison post-hoc, utilizing a Bonferonni adjustment was used to analyze differences
between jump heights. A Pearson’s r correlation was utilized to analyze relationships between all data. Significance for all statistics was accepted
at p<0.05. RESULTS: All three jump styles were significantly different when comparing the MVJ and VVJ/MRH (p = 0.00), MVJ and VVJ/RHSE (p =
0.016), and VVJ/RHSE and VVJ/MRH (p = 0.00). There was a significant difference in reach between RHSE and MRH (p=0.00). The average differ-
ence in reach was 8.5±7.3 cm. There were no significant correlations between any jump and shoulder girdle measurements. However, there was
a significant, moderate correlation (r = 0.49) between reach difference and shoulder elevation displacement. CONCLUSIONS: Results suggest
that not properly measuring reach when using a traditional vertical jump apparatus will incorrectly inflate measurements on this apparatus.
Properly measuring reach will correctly decrease the appearance of vertical jump measurements. Traditional vertical jumping requires maximal
reaching and jumping. Proper reach measurements and performance using maximal reach must be used. Furthermore, the MVJ measurement
remains significantly different from the properly measured VVJ with MRH. Our results suggest that the significantly lower MVJ measurements,
as compared to the traditional apparatus in the above mentioned class sample, are likely due, in part, to reach measurement errors. PRACTICAL
APPLICATION: It is vital that proper attention be given to protocol when performing vertical jumps using a traditional vertical jump apparatus.
The Effect Of Dance Dance Revolution On Energy Expenditure And Enjoyment In Severely Overweight Children Compared To Alternate Forms Of Activity
Lisa Mealey, J.M. Jakicic, M.D. Marcus, A.D. Mealey
Dance, Dance Revolution (DDR) is an innovative product that combines the popularity of video games with a dance activity component. DDR
has the potential to be an activity that results in sufficient energy expenditure (EE) and one children will find enjoyable. Research is necessary to
quantify and provide more adequate data on the EE of DDR. In addition, to date there are no published data on the enjoyment of DDR. PURPOSE:
To examine the EE and enjoyment of a single bout of DDR in severely overweight children compared to alternative forms of physical activity.
METHODS: Twenty severely overweight (body mass percentile for age and sex = 98.3 + 0.86%) children (10 boys and 10 girls) between 9 and 12
years of age (10.6 + 1.23 years) performed experimental trials for three separate modes of activity; treadmill walking, in-home walking video, and
DDR. Each testing session consisted of a single activity bout that was 15 minutes in duration. EE was assessed using indirect calorimetry with data
summed over the 15 minute activity session. Perceived enjoyment was assessed immediately after each testing session using the Physical Activ-
ity Enjoyment Scale. RESULTS: No significant differences were found for EE (p = 0.115) among modes of activity. Separate comparisons revealed
DDR elicited a statistically lower EE than the walk video (70.84 + 16.58 vs. 60.65 + 15.95 kcal; p = 0.010) and a non-statistically lower EE than the
treadmill walk (78.0 + 34.42 vs. 62.30 + 15.53 kcal; p = 0.093). Significant differences were found for enjoyment (p = 0.598) among mode of activ-
ity. DDR elicited a higher level of enjoyment than the treadmill walk and walk video (71.45 + 10.72 vs. 64.25 + 9.71 vs. 66.75 + 11.85; p = 001).
No gender effect was observed for EE (p = 0.446) or enjoyment (p = 0.468) across modes of activity. CONCLUSIONS: The present investigation
demonstrated that DDR resulted in a lower total EE compared to the treadmill walk and the walk video. Results also demonstrated that the enjoy-
ment was similar for all modes of activity examined. These findings related to EE and enjoyment were not affected by gender (boys vs. girls) for
the severely overweight children that participated in this study. PRACTICAL APPLICATION: The present investigation was the first to investigate
the EE and enjoyment of DDR in severely overweight children. It was also the first to compare the EE and enjoyment of DDR to alternate forms
of activity. The findings of this investigation may assist in further understanding how interactive video games such as DDR may be successfully
used in interventions to promote physical activity in children. Future research should further investigate the EE and enjoyment of DDR and how
this compares to alternate forms of activity.
NSCA National Conference & Exhibition Abstracts 34
Training Impulse (Trimp) Values During One Week Of Practices And Games
At The End Of An Elite Youth Hockey Season
Christoper J Myatt, Robert W. Wilson II, Jacob T. Malzahn, Ann C. Snyder
During a season of competition training, programs change as a means of managing the cumulative stresses of training and performing. Managing this process
can be difficult to accomplish in team sports where relative exercise intensity can be dependent on position and role on the team, and effort put forth during
training and competition. Measuring exercise variables, such as heart rate, lactate threshold and rating of perceived exertion, are easier to obtain and control
during individual training than team training sessions. Recent advances in heart rate monitoring technology have allowed heart rate monitors to be worn by
teams during practices and competitions, without interference between belts. Also, equations have been developed to calculate training intensities, referred
to as training impulses (TRIMPs) for team athletes. The TRIMP technique was recently modified by Stagno et al. (2007) for implementation during team sport
activities. PURPOSE: To determine TRIMP values of both practice and competition during a single week at the end of their season for elite youth hockey players.
METHODS: 5 forwards and 4 defenders (n = 9; mean age: 15.7 ± 0.5 years) served as the participants. Heart rates were monitored during an entire week at the
end of the season (week 28 of 29) consisting of three practices [Monday (P1), Tuesday (P2), and Thursday (P3)] and three games [one on Saturday (G1) and two
on Sunday (G2, G3)]. Games were played on 24 weekends during the 29 week season. Heart rate measurements were recorded during practices and games by
coded heart rate monitors that stored the data in the strap. TRIMP values were calculated from the data for each practice and game using the modified TRIMP
equation. Stagno et al. (2007) created five heart rates zones between 65-100% of maximal heart rate. Minutes spent in each zone are multiplied by a weight-
ing factor corresponding to each zone. These values are summed to determine total TRIMP value for each event. Maximal heart rate for each participant was
determined using the equation developed by Gellish et al. (2007). RESULTS: TRIMP Zones, Total TRIMPs and TRIMPs per minute values are presented below
(mean ±SD):
Zones (multiplier) P1 (90 min) P2 (40 min) P3 (69 min) G1 (117 min) G2 (112.5 min) G3 (99 min)
5 (5.16/min) 2.3 ± 4.5 13.7 ± 20.5 25.2 ± 36.0 81.8 ± 49.6 59.8 ± 40.1 30.0 ± 37.2
4 (3.61/min) 21.7 ± 20.0 24.3 ± 16.6 50.0 ± 25.5 59.0 ± 13.5 59.1 ± 16.5 42.9 ± 16.1
3 (2.54/min) 33.1 ± 21.5 16.0 ± 8.4 31.5 ± 8.3 38.4 ± 12.6 28.9 ± 8.2 32.4 ± 11.1
2 (1.71/min) 24.3 ± 12.0 10.1 ± 8.2 20.9 ± 10.3 35.3 ± 15.7 24.7 ± 11.4 26.3 ± 16.2
1 (1.25/min) 22.5 ± 8.2 6.2 ± 3.8 12.7 ± 5.2 21.8 ± 4.7 23.5 ± 10.0 17.5 ± 6.1
Total TRIMPs 103.9 ± 43.6 70.3 ± 40.9 140.3 ± 56.6 236.3 ± 74.1 195.9 ± 58.5 149.0 ± 65.9
TRIMPs/min 1.16 1.76 2.03 2.02 1.74 1.51
CONCLUSIONS: Each training session varied in time, Total TRIMPs and TRIMPs/ min. Games decreased in TRIMPs and TRIMPs/ min with slight decreases in time.
Even though TRIMPs/ min data are similar between some practices and some games (P2=G2; P3=G1), only G3 and P3 are similar in Total TRIMPs. Therefore, this
coach has managed the time of practices to evoke game-like intensities but not durations. PRACTICAL APPLICATIONS: The use of TRIMPs gives coaches an ac-
curate look at the intensity of practices and games for team activities. At the end of the season, when athletes may be more fatigued, an objective method of
determining physiological load (i.e. TRIMP equations) should help coaches assess and track athlete responses.
Concerns And Limitations Of Dual-Energy X-Ray Absorptiometry (Dxa) For The Evaluation Of Fat And Fat-Free Mass In Older Men And Women.
Jordan Moon, Jordan R. Moon, Abbie E. Smith, Kristina L. Kendall, Jennifer L. Graef, David H. Fukuda, Travis W. Beck, Joel T. Cramer, Marshall L. Rea, Jeffrey R. Stout FNSCA
PURPOSE: The purpose of the present study was to evaluate Dual-energy X-ray absorptiometry (DXA) for estimating fat mass (FM), percent fat
(%FAT), and fat-free mass (FFM) in older men and women compared to a four-compartment model (4C). METHODS: Forty men and women (65-
84yr, 20 men and 20 women) participated in the study. Body fat calculations included a criterion 4C model and DXA-derived FFM, %FAT, and FFM.
The criterion 4C model included body volume from air-displacement plethysmography (ADP), total body water from deuterium dilution, and
bone mineral content from DXA. Constant error (CE), standard error of estimate (SEE), total error (TE), and the 95% limits of agreement were used
to compare DXA values to the 4C model. RESULTS: All DXA mean values (CE) were significantly different than the 4C model. DXA %fat values were
the least accurate with the largest TE and a y-intercept significantly different than zero (p = 0.035). Bland and Altman analysis indicated that no
DXA-derived value produced a significant trend. Compared to DXA, the Siri two-compartment (2C) model using ADP produced non-significant (p
> 0.106) CE values, lower TE values (< 1.66), lower SEE values (< 1.65), and smaller individual errors (95% limits of agreement < 3.17).
Method Mean ± SD r2 SEE TE CE ± 95% limits
DXA (FM) 25.81 ± 8.21 0.96 1.68 1.94 1.04* ± 3.26
DXA (%FAT) 34.80 ± 8.43 0.90 2.62 2.85 1.09* ± 5.23
DXA (FFM) 49.22 ± 11.52 0.96 1.79 2.12 -1.16* ± 3.53
4C (FM) 26.85 ± 8.25All Subjects (n = 40)
FM and FFM = kg
* = p < 0.017
4C (%FAT) 35.89 ± 8.17
4C (FFM) 48.06 ± 11.32
CONCLUSION: DXA appears to be biased in older men and women when comparing mean values of FM, FFM, and %FAT compared to a 4C model.
%FAT produced the largest individual errors with limits of agreement ± 5.23%FAT. However, DXA produced acceptable TE values and can be
considered a valid method for predicting body composition. Nonetheless, regardless of the significant CE values for DXA, using ADP alone in a 2C
model produced more accurate, non-biased results compared to the 4C model for all values, as indicated by a reduced SEE and smaller individual
errors. PRACTICAL APPLICATION: FM and FFM DXA values were more accurate than %FAT values compared to a 4C model. However, the Siri 2C
model was more accurate than all DXA derived values. Additionally, DXA produced significantly different FM, FFM, and %FAT values compared to
a 4C model. Therefore, DXA is not suggested for use in older men and women when attempting to predict FM, FFM, or %fat. Furthermore, choos-
ing ADP for use in the Siri 2C model to predict FM, FFM, and %FAT appears to be more accurate than DXA in this population.
Comparison Of A Soccer-Specific Test With Individual Nonspecific Performance Tests
Scott Moody, Aaron Kleinwolterink, and Jerry L. Mayhew
PURPOSE: Game-specific fitness tests are becoming more accepted for evaluating readiness for play. Further investigation is needed, however, to
determine how well such specific tests can replace individual nonspecific performance test in the evaluation of game readiness. The purpose of
this study was to determine the relationships among nonspecific and game-specific performance tests. Male (n = 50) and female (n = 54) soccer
players (ages 15-17 yrs) performed a 20-yd sprint, 20 yd shuttle run, countermovement vertical jump, 3-step approach vertical jump, beep test,
and a newly developed soccer-specific test. Men (179.0 ± 3.8 cm) were significantly taller than women (170.9 ± 5.3 cm), but women (62.2 ± 7.9 kg)
were nonsignificantly heavier than men (60.4 ± 8.0 kg), resulting in a significantly greater BMI for women (21.2 ± 2.2 kg/m2) than for men (18.8 ±
2.5 kg/m2). Men had significantly better performances on all tests except the beep test and prompted a separate analysis for each gender. Step-
wise multiple regression analysis in men selecting the beep test distance, approach vertical jump, and countermovement jump in that order to
predict the distance covered in the soccer-specific test. These variables had a multiple R = 0.98 (SEE = 74m, CV = 4.6%). Of the common variance,
the beep test accounted for the majority of it (90%), leaving approach vertical jump (8%) and countermovement jump (2%) to account for far less.
In women, stepwise multiple regression analysis selected approach vertical jump, beep test distance, and 20-yd dash in that order to predict the
distance covered in the soccer-specific test. These variables had a multiple R = 0.66 (SEE = 157m, CV = 11.7%). Of the common variance, approach
vertical jump (35%), beep test distance (32%), and 20-yd dash (34%) contributed equally. The new soccer-specific test appears to be more global
in evaluating game readiness in women than in men. The new soccer-specific test combined elements of endurance, speed, and power into one
easily administered performance evaluation tool.
A Comparison Of Bone Mineral Density And Body Composition In Post-Menopausal Athletic, Active, And Sedentary Women
Amanda Mittleman, Ralph Rozenek, Albert C. Russo, Susan E. Sklar
Menopause has been shown to produce numerous physiological changes including decrements in bone mineral density (BMD) and increases in
body fat content. Evidence suggests that physical activity may attenuate the changes observed in these measurements. However, the amount of
physical activity necessary to slow the changes remains to be elucidated. PURPOSE: The purpose of this cross-sectional study was to investigate
BMD and body composition of post-menopausal women participating in various levels of physical activity. METHODS: Ninety age-matched post-
menopausal women (mean age+s.d. = 60.8+7.7 years) participated. Subjects were recruited based upon their history and level of physical activity
and divided into 3 groups: Sedentary (S), n=30; Active (AC), n=30; and Athlete (AT); n=30. Bone mineral content (BMC), BMD, and body composi-
tion including android and gynoid fat was determined by dual-energy x-ray absorptiometry. RESULTS: MANCOVA revealed higher (p<0.05) BMD
in AT and AC compared to S in the left and right femur. Total body BMD showed the same result. However, spine BMD was greater (p<0.05) in AC
than either AT or S (Table 1). Total BMC was also higher (p<0.05) in the active groups compared to S.
Table 1: Bone mineral densities of athletic, active, and sedentary group
BMD (g x cm-2)
Group Spine L Femur R Femur Total Body
mean s.d. mean s.d. mean s.d. mean s.d.
Athletes 1.165 0.193 * 0.961 0.097 * 0.966 0.112 * 1.136 0.098
Active * 1.196 0.169 * 0.954 0.146 * 0.964 0.137 * 1.147 0.085
Sedentary 1.100 0.148 0.914 0.115 0.911 0.103 1.104 0.084
MANCOVA: covariates = body mass, years post-estrogen. * = significantly different from Sedentary group (p<0.05).
Body fat percentage (BF%) in S (40.8+7.8%) was higher (p<0.05) compared to either AC (32.1+7.5%) or AT (27.4+8.1%). AT (40.3+4.0 kg) and AC
(39.8+3.9 kg) had significantly larger (p<0.05) amounts of lean body mass (LBM) than S (38.0+4.2 kg). No differences between AT and AC were
observed for either BF% or LBM. Android (A) and gynoid (G) fat distribution patterns showed that AT (A= 30.5+11.2%: G= 36.9+8.1%) and AC
(A= 35.4+11.5%: G= 40.9+6.6%) had significantly less fat distributed in these areas than did S (A= 46.2+11.6%: G= 47.8+6.2%). DISCUSSION:
Results from this study support evidence indicating that long-term physical activity has positive effects on bone and body composition in post-
menopausal women. However there did not appear to be any distinct advantage for the women who had been competitive athletes and who
generally trained at higher exercise intensities than the recreationally active women. PRACTICAL APPLICATION: Moderate levels of physical activ-
ity appear to have the same beneficial effects on bone and body composition as higher intensity physical activity in post-menopausal women.
This has important implications for the prevention and control of chronic diseases such as osteoporosis, obesity, and type II diabetes that occur
with increasing frequency in older populations.
NSCA National Conference & Exhibition Abstracts 35
A Study Of The Resistive Forces Provided By Elastic Supplemental Band Resistance During The Back Squat Exer-cise: A Case Report
Kurt Neelly, Sean A. Carter, Joe G. Terry
The use of elastic bands to supplement traditional plate weight resistance to the back squat has become increasingly popular in weight rooms.
By using supplemental elastic bands, a variable resistance is produced. This variable resistance will progressively increase the amount of resis-
tance throughout the range of motion of an exercise that possesses an ascending strength curve. The set-up and technique for using elastic
bands has been described in the literature, however, the resistance of the bands during an actual squat has not been measured. PURPOSE: The
purpose of this study was to measure the actual resistive forces provided by various supplemental elastic bands during the back squat exercise.
A secondary purpose was to compare these measured resistive forces with the manufacturers reported values. METHODS: The subject (height =
1.83 m; weight = 111.4 kg), an experienced weight lifter, was analyzed performing a back squat with supplemental elastic band resistance. Plate
weight was set at approximately 50% of the lifters self-reported 1 RM. The elastic bands were looped under the bottom of the power cage and
one end threaded back through the other to properly affix the band to the cage. The elastic bands were attached to load cells via a carabiner clip.
The load cells were affixed to standard 0.05 m sleeve collars for placement on the barbell. The use of the load cells allowed for the measurement
of the resistive forces being provided by the elastic bands throughout the entire squat. The subject performed one set of 3 repetitions with a pair
of purple “light” elastic bands and again with a pair of green “average” elastic bands. RESULTS: The pair of light (purple) elastic bands provided
an average maximum resistance of 273 N. The average (green) elastic bands provided an average maximum resistance of 405 N. CONCLUSION:
The manufacturer of the elastic bands provides a chart approximating the amount of resistance provided by their bands. They report, depending
upon the attachment technique, a single “light” purple band provides up to 222 N of resistance, while a single “average” green band provides up
to 334 N of resistance. The resistive forces we reported are the total forces provided by both elastic bands when performing a back squat. Per the
manufacturer’s guidelines, the resistance provided from a pair of “light” purple bands would be up to 444 N while the resistance provided from
a pair of “average” green bands would be up to 668 N. The resistance provided by the elastic bands in our study was only 61% of the manufac-
turer reported values. PRACTICAL APPLICATION: The amount of resistance provided by elastic bands should have a linear relationship with the
amount they are stretched, the more they are stretched, the more resistance they produce. The resistive force produced when our 1.83 m tall
subject completed a parallel depth squat was only 61% of those values reported by the manufacturer. One should expect greater amounts of
resistance from a taller individual and less resistance from a shorter individual.
Prelanned And Reactive Agility Training Influence On Agility Test Performance In Male Adolescents
Heidi Neitzke, Michael Miller, Christopher Cheatham, Jennifer O’Donoghue
Agility is an important skill in athletic performance because it integrates intermittent, dynamic, and skilled movements. Preplanned agility skills
are closed skills and have no temporal or spatial uncertainty. Reactive skills, also known as open skills, have temporal and spatial uncertainty and
are designed to mimic play in sports. Recognizing the development of adolescent athletes while challenging them in these skills are important.
Sufficient research is not present to endorse current agility training for adolescents. PURPOSE: To investigate two forms of agility training, pre-
planned and reactive protocols, and determine the effectiveness on 3 agility tests. METHODS: 30 male adolescents (age 16.33 +1.06; height 69.85
+2.95 in; weight 154.51+22.23 lbs) participated in 1 of 3 treatment groups: 1) Control Group; 2) Preplanned Protocol; 3) Reactive Protocol. The
three agility tests were the T-test, Illinois Agility test, and SPAD (Speed and Agility Drill). Subjects pre-tested on each agility test and then divided
into 3 groups based upon performance to equate scores for all 3 groups. Agility protocols were performed on 2 non-consecutive days per week
for 6 weeks. Subjects performed a 10-minute warm-up followed by 4 agility drills with 3 repetitions at maximal intensity. Subjects post-tested on
the agility tests at the completion of the 6 week program. A 2 (time) X 3 (group) repeated measures ANOVA was used to determine if differences
existed between the agility tests. RESULTS: This study found that groups significantly improved their scores over time in the T-test (p=.009) and
SPAD (p=.001) tests respectively. Refer to Table 1 for the means/standard deviations of the best time trials for each group. CONCLUSIONS: All three
groups improved throughout the 6 week study. The limited experience of adolescents may affect cognitive improvements, and biomechanical
changes may incur initially as seen in the overall improvement of time trials for the T-test and SPAD. The specific type of agility testing measures in
this study may have confounded the results. More examination into specific reactive agility testing measures and adolescent training is needed.
PRACTICAL APPLICATIONS: The utilization of preplanned or reactive agility training has shown improvements for adolescent athletes. Athletes
may require longer periods of training for perceptible Central Nervous System adaptations and improvements to occur. Agility training, espe-
cially in adolescent athletics can be implemented to prevent injuries and assist in developing correct biomechanics and increase performance.
Table 1. Mean of Best Time Trials
Agility Test Control Preplanned Reactive
Pre T-Test 11.06 +.39 10.44 +.39 10.51 +.61
Post T-Test 10.99 +.70 9.98 +.75 10.06 +.47
Pre Illinois Agility Test 17.33 +.91 16.74+.97 16.84 +.93
Post Illinois Agility Test 17.25 +.99 16.40 +.77 16.68 +.70
Pre SPAD 10.51 +1.19 10.50 +1.55 10.50 +1.48
Post SPAD 10.44 +1.18 8.68 +1.00 9.53 +1.29
The Effects Of An 8-Week Supplemental Heavy Chain Resistance Training Program On Lower Extremity Power In An Elite Athlete: A Single-Subject Study
Kurt Neelly, Seth Langevin, Jonathon Hamm, Kory Begy, Joe G. Terry
Traditional free weight resistance training has been the preferred method for athletes to increase strength and power. However, the use of
supplemental heavy chain resistance (SHCR) has increased in recent years. The use of SHCR in exercises exhibiting ascending strength curves
provides a variable resistance through the range of motion of the lift that possesses the greatest mechanical advantage. PURPOSE: To assess
the change in functional lower extremity (LE) power measures in a professional baseball player after completion of an 8-week pitching-specific
training program with a periodized SHCR back squat component. METHODS: The subject was a 20 year old professional baseball pitcher (height
= 1.99 m, weight = 106.8 kg) performing an off-season training program. Pre-test LE power was measured utilizing the following functional
tests: countermovement vertical jump measured via a waist belt with tape measure, two-legged standing long jump, and an electronically timed
10-yard dash. The subject then completed an 8-week training program utilizing SHCR in a periodized back squat program (twice per week).
Throughout this time, the subject also completed a pitching-specific training program which included general plyometric, agility, and core
stability exercises (twice per week), a shoulder strengthening exercise regimen (three time per week), and an off-season throwing program. Post-
test LE power measures were completed after completion of the 8-week program. RESULTS: Pre-test - Post-test comparisons (Table 1) showed
an 8.57% increase in vertical jump height, a 4.41% increase in standing long jump distance, and a 2.30% improvement in 10-yard dash time.
CONCLUSION: The results of this study suggest that performing the back squat exercise utilizing SHCR, in conjunction with general plyometric,
agility, and core stability exercises, can increase functional LE power measures in trained athletes. PRACTICAL APPLICATIONS: Limited research
is currently available regarding the technique and set-up when using SHCR as a form of variable resistance. It has been recommended that
athletes possess adequate strength and experience with static resistance in the desired lift prior to advancing to SHCR. Additionally, athletes
must understand the proper set-up technique and use of chains prior to their use. This study suggests that using SHCR in the back squat may be
a valuable technique for improving LE power output.
Table 1: Pre-test Post-test Power Comparisons
Functional Power Measurement Pre-Test Post-Test Percent Improvement
Countermovement Vertical Jump 66.67 cm (26.25”) 72.39 cm (28.5”) 8.57 %
Standing Long Jump 2.59 m (102”) 2.705 m (106.5”) 4.41 %
10-Yard Dash 1.74 sec. 1.70 sec 2.30 %
Incidence And Potential Pathomechanics Of Patellofemoral Pain In Female Athletes
Greg Myer, Kevin R. Ford, Kim D. Barber Foss, Arlene Goodman, Adrick Harrison, Mitchell J. Rauh, Jon G. Divine,
Timothy E. Hewett
Patellofemoral pain (PFP) is a common disorder in female athletes with an undefined etiology. PFP symptoms can affect up to 30% of adoles-
cents (13-19 years). Of these, PFP may cause 74% to limit or stop their sport participation. Purpose: The purpose of this study was to evaluate
measures of lower extremity strength, motion and load prospectively to examine their relationship with PFP development. Our hypothesis
was that increased dynamic knee abduction and decreased hip abduction strength would be associated with PFP in female athletes relative to
teammates without PFP. Methods: Two hundred forty middle and high school aged female athletes were evaluated by a physician for active PFP
(APFP) prior to the start of their basketball season. In addition, laboratory analyses of each athlete’s hip isokinetic strength and hip, knee and
ankle biomechanics during landing were conducted. The athletes were monitored on a weekly basis for athletic exposures (AEs) and the onset of
any new PFP (NPFP). The athletes were also subsequently re-evaluated for any new PFP by the same physician at the conclusion of the basketball
season. Results: The point prevalence of APFP at the beginning of the season was 14.2 per 100 athletes. The cumulative incidence risk and rate
for the development of NPFP during the season was 9.7 per 100 athletes and 1.09 per 1000 AEs, respectively. All new cases of PFP occurred in the
middle school-aged athletes. Biomechanical analyses indicated a significant interaction (p=0.04) of increased knee abduction moment at initial
contact in APFP and NPFP involved limbs relative to CTRL and their uninvolved limbs (Figure 1). The post hoc analysis of involved limbs showed
that external knee abduction moment at initial contact was increased (95%CI: 0.49 to 4.40 Nm) in the APFP relative to CTRL. Hip strength or static
knee abduction angle did not discriminate between study groups (p>0.05). Conclusions: The current study results did not directly support the
hypothesis that decreased hip abduction strength was related to PFP development. The increased knee abduction in APFP, and the interaction of
increased knee abduction in APFP and NPFP involved limbs relative to CTRL and their uninvolved limbs, indicate that increased knee abduction
loads at landing may contribute to increased risk of PFP. Future prospective and longitudinal study designs of these potential neuromuscular
correlates underlying PFP in middle school aged female basketball players are warranted. PRACTICAL APPLICATIONS: Interestingly all new PFP
occurred in the middle school aged female basketball players. The data suggest that neuromuscular training focused to reduce initial contact
knee abduction implemented at a young age (10-12 years) level should be assessed to determine its effectiveness to minimize lower extremity
pathomechanics to PFP and reduce the occurrence of PFP during sports participation in middle school or higher school levels.
Figure 1. Comparison of uninvolved and involved limb external
knee abduction moment between those with new (NPFP), active
(APFP) and CTRL measures of PFP.

NSCA National Conference & Exhibition Abstracts 36
Relationship Of Backward Overhead Medicine Ball Throw With Olympic Weightlifting Performances
Mathew V. Palozola, Alexander J. Koch, Jerry L. Mayhew
The backward overhead medicine ball (BOMB) throw has gained some attention as a simple measure for estimating total body explosive power.
However, previous research indicates varying degrees of relationship with standard power measurement. PURPOSE: to determine the relation-
ship between a BOMB throw and maximal snatch (S) and clean & jerk (CJ) performances of collegiate weightlifters. METHODS: 12 collegiate
Olympic weightlifters (8 men, 4 women, weight = 75.3 ± 15.4 kg, age = 21 ± 1 y) performed 6 maximal attempts of the BOMB throw with a 3.63
kg medicine ball with 1-min rest between throws. The best throw was recorded for analysis. Three to five days after the throws, the subjects
competed in a sanctioned weightlifting meet, and their best lifts in the S and CJ were correlated with BOMB throw. RESULTS: Intraclass correla-
tion coefficient across all 6 trial (ICC = 0.99) indicated a high degree of reliability. There was no significant difference across trials, although the
average percent improvement between successive throws did not level off until the 3rd throw (1.2 ± 19.6%). Best BOMB throw was significantly
correlated (p<0.01) with S (r = 0.85) and CJ (r = 0.90). Body mass was significantly correlated with BOMB throw (r = 0.78), S (r = 0.83), and CJ
(r = 0.82). The correlation of BOMB throw with Sinclair-adjusted S(r = 0.81) and CJ (r = 0.86) were significant. When body mass were partialed
out, the relationship of BOMB throw with S (r = 0.59) and CJ (r = 0.72) decreased but remained significant. When gender was partialed out, the
relationship of BOMB throw with S (r = 0.49, p=0.13) and CJ (r = 0.67, p=0.03) decreased more for S than for CJ. Partialing out both body mass
and gender reduced the correlations of BOMB throw with S (r = 0.04, p=0.90) and CJ ((r = 0.43, p=0.21) to nonsignificance. CONCLUSION: The
strong correlations between the BOMB throw and maximal S and CJ performances of collegiate weightlifter maybe dependent on body mass.
PRACTICAL APPLICATION: The BOMB throw distance may be strongly dependant on body mass but may reflect a unique aspect of total body
power. Further research is warranted to determine if an adjustment scaling technique is required to facilitate its use on a wide variety of athletes.
A Study Of The Power Production And The Muscle Activity During Bench Press And Elbow Curl
Junichi Okada, Kohei Iijima, Seita Okazaki, Norihide Sugisaki and Kiyotada Kato
It was considered that to reveal the muscle activity producing the higher power output is very important for program design of resistance train-
ing. PURPOSE: The purpose of this study was to clarify the variation of the power production and muscle activity pattern during the resistance
exercise, according to the power measurement at various loads and the quantified estimation of the muscle activity. METHODS: We adopted the
elbow curl for the single joint exercise, and the bench press for the multi joint exercise as the most popular resistance exercise. Two modified
exercises that simulated elbow curl and bench press were executed by each experimental group with maximum effort through the range of mo-
tion in the power test. Eight (23.1/1.7yr, 175.4/4.8cm, 74.5/13.0kg, Mean/SD) and ten (21.7/1.6yr, 178.0/5.8cm, 68.6/3.3kg) healthy male subjects
volunteered in elbow curl and bench press respectively. Both tests included force, velocity and power measurement using the special apparatus
with isotonic load. Isometric test was included for both tests. Surface EMG was recorded from the biceps brachii, pectoralis major, deltoid, long
head and lateral head of triceps brachii muscles. Root mean square (RMS) values were calculated in concentric phase. Normalization was done
using the highest RMS value among the load of each exercise test. RESULTS: There were no significant correlations between the power output
and muscle activity levels in both of the single and multi joint movement. Peak power appeared at the range from 70 to 80 percent of the total
bar displacement in the attempt produced maximum power during the bench press. There were significant differences between the muscles,
when RMS was expressed with normalized value during the bench press exercise (Fig1). These muscle activity patterns varied depend on the dif-
ferences in the force - velocity relationships at the various loads. COCLUSION: Present study was carried out the movement with maximum effort
for the power output. Root mean square values derived from EMG revealed that muscle activity levels during power test with maximum effort
did not different, even if produced power was relatively high or low values. It considered that the pectoralis major, deltoid, lateral head of triceps
brachii and biceps brachii contributed for stabilizing and horizontal flexion of shoulder joint in the initial phase of the bench press. Activity of
long head of triceps brachii showed peak value at latter phase of the total bar displacement. PRACTICAL APPLICATIONS: To increase the training
stimulus for the targeted muscle, we add partial range method to a certain basic program. Maximum effort results in the higher muscle activity,
even if lifted load and power output are relatively low.
Lag Time: The Effect Of A Two Week Cessation From Resistance Training On Force, Velocity And Power In Elite Softball Players
Sophia Nimphius
There is limited research examining the effect of “lag time” on maximal testing. Following the completion of a phase of resistance training, many coaches test
athletes to measure improvements as a result of training. However, accumulated fatigue and inadequate time for an athlete to learn how to utilize increased
strength and power may result in lower testing results immediately post (within 48-96 hours) the last training session. PURPOSE: To examine the difference
between a typical cessation (96 hours) and an extended cessation (14 days) from resistance training on countermovement jump (CMJ) height and associated
force, velocity and power characteristics of the CMJ in concurrently training elite softball players. METHODS: Seven elite female softball players (18.6 ± 1.8 =
years; height =165.1 ± 6.3 cm; weight of 77.3 ± 7.6 kg; 1RM squat = 82.5 ± 7.7 kg) participated in this study. Following a seven week strength mesocycle subjects
performed a CMJ on a force plate (400 Series, Fitness Technology) while holding a light weight plastic bar attached to a position transducer (PT9510, Celesco).
Software (BMS, Fitness Technology) was utilized to calculate all variables presented in Table 1. Repeated measure ANOVA was used to compare differences be-
tween 96 hours and 14 days cessation from training. The relationships between JH and F, V and P variables were examined by Pearson’s correlation coefficient.
Statistical significance was set at an alpha level of p < 0.05. The magnitude of effect was also calculated for each measure. RESULTS: A significant increase in ve-
locity at PP occurred from 96 hours to 14 days post training and a moderate to large effect occurred in PV, relative PF, relative PP and velocity at PP (Table 1). The
correlation between JH and PV increased from .741 (p=.056) to .908 (p=.005) as did the relationship between JH and velocity at PP; .743 (p=.056) to .873 (p=.010).
CONCLUSION: It appears a longer period of time between the completion of a mesocycle and subsequent testing has no effect on CMJ height. However, in these
concurrently training athletes, the means by which they produce power during the CMJ did alter. Increases in PV and relative PP with apparent decreases in
relative PF indicate that athletes may adopt an improved rate of force development instead of a maximal force approach to attain their JH. This alteration may
be a result of having time to utilize their “new strength” in a way which is more beneficial to their sport. The athletes continued to train on the field, possibly
allowing them to have a transfer of learning effect which resulted in utilizing force more efficiently as indicated by the large improvement (18.1%) in velocity at
PP. PRACTICAL APPLICATION: Examining changes in magnitude and timing of the variables associated with maximal JH may improve the understanding of how
an athlete utilizes their force and velocity capabilities to produce power, especially when investigating transfer of learning.
Table 1 Difference In Force, Velocity And Power Variables
Variable 96 hours 14 days % Change p value Effect size
Jump height (m) 0.33 ± 0.06 0.33 ± 0.04 -1.29 .460 -0.07
Peak velocity (m/s) 2.48 ± 0.19 2.57 ± 0.26 3.96 .879 0.49
Relative PF (N/kg) 24.8 ± 4.95 22.1 ± 2.25 -10.77 .218 -0.54
Relative PP (W/kg) 40.2 ± 9.79 48.7 ± 5.72 21.3 .069 0.87
Velocity at PP (m/s) 2.10 ± 0.18 2.48 ± 0.29† 18.1 .013 2.06
Relative Force at PP (N/kg) 19.0 ± 3.52 19.7 ± 1.52 3.76 .632 0.20
Influence Of Prior Exercise On Skill And Fitness Measurements In Female Soccer Athletes
Clayton Nicks, Michael Mangum, Daniel Muns, Chris Kendrick
A number of quality tests are available to evaluate the fitness and skill levels of soccer players. Since fitness and skill are essential throughout the
duration of a competition, the timing of test administration should be considered by coaches. PURPOSE: The purpose of the study was to de-
termine the effects of prior exercise on fitness and skill measurements in female collegiate soccer players. METHODS: Thirteen female collegiate
athletes volunteered for the study (age = 19.6 ± 1.3 yrs, height =1.66 ± .07 m, weight = 64.8 ± 7.2 kg). After a familiarization session, participants
completed two trials (at least 5 days apart) of a modified Hoff soccer test. Prior to both tests, subjects completed a light 5 to 10 minute cardio-
vascular warm-up. During one session (W), participants completed an additional ~15 minute workout designed to tax upper and lower body
musculature. No additional work was added to the other test session (NW). All subjects were randomly assigned to one of two groups so that the
order of the testing (W or NW) was counterbalanced. Upon completion of the Hoff tests, heart rate (HR) was recorded as well as the total distance
(TD) covered during the session. During each lap of the Hoff test, subjects were required to kick a soccer ball over three consecutive hurdles. Skill
(SK) was determined by determining the average number of hurdle attempts per lap completed. Therefore, 3.0 was a perfect score and scores
>3.0 were interpreted as lower skill. In addition, we tested for bias in error rate across all conditions (N = 26) by comparing the total number of
errors (TE) to the TD covered in the Hoff test. RESULTS: Average (±SD) TD for W and NW were 999.6 ± 80.8 and 1053 ± 63.1 meters, respectively.
SK for the two sessions was W = 3.5 ± .39 and NW = 3.2 ± .20. In addition, ending HR (n = 5) averaged 193.6 ± 7.1 and 188.4 ± 13.5 for W and NW,
respectively. Paired t-tests revealed significant differences between W and NW for TD (p =.002) and SK (p = .031). No significant difference was
detected for HR between the two conditions (p > 0.05). There was no relationship between TE and TD (r = -.047, p >.05). CONCLUSION: The ad-
dition of a brief muscular endurance workout prior to fitness testing significantly decreased SK and TD in these soccer players. TD was unrelated
to TE suggesting that the error measure (SK) was not biased against high fitness performers. PRACTICAL APPLICATIONS: These data reinforce
the concept that coaches should standardize conditions for fitness and skill testing. Further, the results of this study indicate that as little as 15
minutes of muscular work may negatively impact skill and performance. However, these results also demonstrate that fatiguing athletes prior to
assessment could offer insight into how they perform in the latter stages of competition.

AbstractsP – R
NSCA National Conference & Exhibition Abstracts 38
Effect Of Gender And Exercise Type On Relative Hand Grip Strength
Erin Peterson, Will Murray, Jean M. Hiebert
Previous studies indicate hand grip strength in males is greater than females. As these values are typically reported as absolute hand grip
strength, they do not take into account the smaller stature of females. Hand strength as reflected relative to anthropometrics such as hand
length have not been thoroughly investigated. To investigate this question hand grip strength and body anthropometrics of two groups of
physically active females and males was measured. PURPOSE: To assess grip strength of males and females relative to body stature as reflected
by hand length, BMI, and percent body fat in two different groups (rock climbers and runners). METHODS: 20 subjects volunteered for this study.
Eleven (8 males, 3 females) were recreational rock climbers and nine (4 males, 5 females) were recreational runners. Inclusion criteria for runners
required a minimum one year history of running 20 miles/week at 6-8 minutes/mile; climbers required an ability to climb a minimum of Class 5.1
on the Yosemite Decimal System. Grip strength and sustained grip strength of subject’s dominant hand were measured using a computerized,
electronic hand grip dynamometer. Strength in five different grip size settings and sustained grip were assessed per manufacturer’s directions.
Height and hand length from the distal palmar crease to tip of middle finger was assessed using a tape measure. The relative hand grip strength
was calculated as the relationship between absolute hand grip strength (lbs.) and the subject’s hand length (in.). body weight, body composition
using sum of skinfolds (SSF), and body mass index (BMI) were also assessed. RESULTS: Data were analyzed using SPSS 13.0. Independent sample
T-tests revealed no difference in sustained hand grip, hand length, BMI, and percent body fat with regards to rock climbers and runners. Gender
differences were found in hand length (males > females), and percent body fat (females> males), though no difference was noted in BMI. Analysis
of variance tests compared the effect of gender and exercise on relative hand grip strength. Relative hand strength was not different between
climbers and runners. However, relative strength was different based on gender (p=.000), males stronger than females, and hand grip setting
(p=.000), position 2>3>4>5>1. The only interaction was between grip setting and gender (p=.009). Males were stronger in grip setting three,
whereas females were stronger in the smaller grip position two. CONCLUSIONS: Our findings indicated relative strength was not different based
upon physical activity. However, relative strength was greater in males than females and is in agreement with studies assessing absolute hand
grip strength. The decreased hand size of females in relation to males may explain the effect of grip position on maximum strength. PRACTICAL
APPLICATION: Further studies utilizing subjects of different anthropometric characteristic would provide further insight as to the importance
of reporting grip strength as a relative value. Our findings suggest different grip settings should be used when assessing strength of males and
females regardless of typical mode of physical activity.
The Effect Of Cryotherpay On Quadriceps Point Tenderness After Intense Eccentric Exercise
Michelle Peluaga, Mack D. Rubley, William R. Holcomb, and Richard D. Tandy
Cryotherapy, a cold modality that results in heat withdrawal when applied to the body, is the most common modality used in the treatment of
acute musculoskeletal injury. It has been argued that eccentric exercise-induced muscle damage may lead to ultra-structural changes within
skeletal muscle(s) caused by mechanical stress. The excessive loading of muscle tissue during eccentric exercise may cause the development
of delayed on-set muscle soreness (DOMS). PURPOSE: The purpose of this study was to investigate the effect of an immediate 45-minute cryo-
therapy application once daily for 3 days post DOMS-inducing eccentric exercise on quadriceps point tenderness. METHODS: Sixteen healthy
subjects (8 male, 8 female; 26.81 ± 1.22 years; height 168.32 ± 2.22 cm; and weight 72.9 ± 3.89 kg) with no reported injury in the last 6 months
to the knee joint or surrounding musculature, no concurrent lower body weight training and no hypersensitivity or allergy to ice volunteered for
this study. Day 1 point tenderness was evaluated prior to exercise and after each subject performed 3 maximal eccentric contractions. On day 2
subjects performed 8 sets of 10 maximal eccentric contractions with 60-seconds rest between each set immediately followed by a 45-minute ice
bag application directly covering 2/3 of the quadriceps for each subject. On day 2 point tenderness values were assessed immediately prior to
and following eccentric exercise and then again following the 45-minute ice bag application. This process was repeated on days 3 and 4; with the
only difference being subjects only performed 3 maximal eccentric contractions. On day 5 point tenderness was evaluated pre- and post-exercise
only. Point tenderness values were based on a modified Borg pain scale from 0-10, with “0” being no discomfort/tenderness and “10” being
maximal/unbearable pain/discomfort. Point tenderness was taken at the VMO, and 5, 10, 15, and 20cm above knee joint line. RESULTS: A factorial
repeated measures ANOVA (α = .05 and Bonferroni adjustment for multiple comparisons) was used for all data reduction. If significance for time
by treatment was found, a paired T-test was performed for simple main effects. There were no statistical significances for any variables at 5 and
10cm above joint line. At the VMO, there was statistical significance for post-treatment time (F2.00, 30.00 = 4.65, p = .017) where point tenderness
was greater on day 3 (2.42±.44) than on day 2 (1.45±.30) post-intense eccentric exercise (p = .012). VMO post-cryotherapy treatment were statisti-
cally significant for treatment by time interaction (F1.41, 21.07 = 6.07, p = .015). However, with further analysis there were no statistical signifi-
cances found between the treated and untreated limb. For all values at 15cm and 20cm superior to joint line there were statistical differences for
all time values whether pre- or post-exercise or post-treatment. CONCLUSION: This suggests that point tenderness peaked around 24-48 hours
post-intense eccentric exercise. This study is consistent with current research that after an intense eccentric exercise muscle soreness peaks 24-
48 hours. PRACTICAL APPLICATIONS: Furthermore a once daily 45-minute ice bag application is not effective in reducing the point tenderness
felt following DOMS. It may be more appropriate to treat multiple times per day rather than once daily to limit the negative effects of DOMS.
The Effect Of Cryotherpay On Eccentric Peak Torque Recovery After Intense Eccentric Exercise
Michelle Peluaga, Mack D. Rubley, William R. Holcomb, and Richard D. Tandy
Cryotherapy, a cold modality that results in heat withdrawal when applied to the body, is the most common modality used in the treatment of
acute musculoskeletal injury. It has been argued that eccentric exercise-induced muscle damage may lead to ultra-structural changes within
skeletal muscle caused by mechanical stress. Thus this excessive eccentric loading during exercise in muscle tissue may cause the develop-
ment of delayed on-set muscle soreness (DOMS). PURPOSE: The purpose of this study was to investigate the effect of an immediate 45-minute
cryotherapy application once daily for 3 days post DOMS-inducing eccentric exercise on the recovery of the quadriceps muscles quantified by
mean eccentric peak torque. METHODS: Sixteen healthy subjects (8 male, 8 female; 26.81 ± 1.22 years; height 168.32 ± 2.22 cm; and weight 72.9
± 3.89 kg) with no reported injury in the last 6 months to the knee joint or surrounding musculature, no concurrent lower body weight training
and no hypersensitivity or allergies to ice volunteered for this study. Subjects performed all strength testing and exercise on a Biodex System 3
dynamometer. On day 1 each subject performed 3 maximal eccentric contractions. On day 2 subjects performed 8 sets of 10 maximal eccentric
contractions with 60-seconds rest between each set immediately followed by a 45-minute ice bag application directly on the skin covering 2/3
of the quadriceps for each subject. On days 3 and 4 subjects performed 3 maximal eccentric contractions followed by the 45-minute ice bag
application. On day 5 subjects performed their final 3 maximal eccentric contractions, with no ice bag application following exercise on this day.
Eccentric mean peak torque values were normalized by dividing mean peak torque by body weight. RESULTS: A factorial repeated measures
ANOVA (α = .05 and Bonferroni adjustment for multiple comparisons) was used for all data reduction. Analysis of eccentric mean peak torque
resulted in no statistical differences for treatment (F1.00, 15.00 = .001, p = .979) or treatment by time interaction (F3.00, 45.00 = 1.742, p = .172).
However, there was a statistical significance for time (F1.97, 29.48 = 4.480, p = .020) where quadriceps mean eccentric peak torque at day 1
(3.14 ± .16 Nm/BW) was greater than day 3 (2.62 ± .16 Nm/BW) which was 24 hours post-intense eccentric exercise (p = .029). Days 4 and 5 were
not statistically different from day 1, 3 or each other. CONCLUSION: Thus a once daily 45-minute ice bag application is not effective in reducing
the decreased ability to maintain peak torque following DOMS. PRACTICAL APPLICATIONS: This supports the suggestion that repeated ice bag
application throughout the day may be more effective in limiting the formation of edema and decrease secondary injury that may occur with
DOMS following eccentric exercise.
Effects Of A 16-Week Employee-Based Walking Program On Selected Physical Fitness Components
Sally Paulson, Russell Robinson, Amanda Wade, Danielle Haas, David Sipes
Work place health promotion and educational programs have been implemented by employers in hopes to reduce costs by increasing positive
lifestyle behavior changes among their employees. Health improvements have been reported when sedentary individuals increase physical
activity to reflect more of a moderately active lifestyle. It is imperative to promote physical activity programs as more and more people in the
U.S. are becoming more physically inactive. PURPOSE: The purpose of this study was to track and evaluate the effectiveness of a four-month
employee-based walking program on selected measures of physical fitness. METHODS: Twenty-four female (M±SD age = 47.17±9.45 yrs; mass =
73.38±17.00 kg; height = 161.62±7.11 cm; BMI = 28.02±5.90 kg/m2) and 5 male employees (M±SD age = 44.80±7.80 yrs; mass = 79.22±12.61 kg;
height = 169.10±3.91 cm; BMI = 27.72±4.31 kg/m2) volunteered for the study. Height and weight, body mass index (BMI), girth measurements,
upper body bioelectrical impedance analysis (BIA), Rockport one-mile walking test were assessed initially and every four weeks thereafter. Daily
step frequency (SF) was used to determine baseline activity level by averaging seven consecutive days of pedometer data. The subjects then
followed a ramping protocol designed to increase SF weekly by 1,000 steps until they reached a goal of a weekly average of 10,000 steps/day.
Subjects maintained 10,000 steps/day for four weeks with some self-selecting to ramp to a weekly average of 12,500 steps/day. Over the course
of the walking program daily SF was tracked using a pedometer. SF data were reported weekly. RESULTS: Repeated measures ANOVA and descrip-
tive statistics (Table 1) were used to analyze the data. Subjects experienced significant decreases in mass (p = .02), BMI (p = .01), and girth percent
body fat (p = .01). There was also a significant increase in aerobic capacity estimated via the Rockport one-mile walk (p <.01). BIA percent body
fat (p = .06) showed a non-significant downward trend. CONCLUSION: The results of this study suggest the use of an employer-based pedometer
walking program can positively impact components of physical fitness in employees. The use of a pedometer walking program to increase physi-
cal activity was successful in improving aerobic capacity, decreasing body mass, BMI and body fat percentage in participants. PRACTICAL APPLI-
CATION: Participation in worksite physical activity promotional programs has been shown to improve health benefits of employees. Employers
that offer these programs may improve health-related components of physical fitness of their employees. In addition, these programs may result
in decreased medical and/or treatment costs associated with chronic diseases related to physical inactivity.
NSCA National Conference & Exhibition Abstracts 39
Willard Peveler, PhD
In the sport of cycling it is important to properly adjust saddle height for optimal performance and injury prevention. Scientific literature indicates that
there are two methods recommended for setting saddle height. The Holmes method recommends use of a 25 to 35° knee angle to adjust saddle height
for injury prevention. Conversely, the Hamley method recommends use of 109% of inseam to adjust saddle height for optimal performance. Previous
research has demonstrated that these two methods produce significantly different saddle heights and can lead to alterations in cycling performance.
PURPOSE: The purpose of this study was to examine the effect of saddle height on cycling performance by comparing difference in anaerobic
power between a saddle height set using a 25° knee angle, a 35° knee angle and 109% of inseam in highly trained cyclists.
METHODS: Subjects were ten highly trained (VO2max = 61.55 ± 4.72 ml/kg/min) male cyclists. The anaerobic power trials consisted of four
30-second Wingate tests conducted with at least one day rest between trials. The 30-second Wingate test has been shown to be a valid predictor
of cycling performance. The initial trial was conducted as a familiarization trial only. Saddle height during the three remaining trials was set at a
25° knee angle, a 35° knee angle and 109% of inseam. The last three trials were counterbalanced to protect against an ordering effect. Dependant
measures for anaerobic power (PP and MP) were compared using repeated measures ANOVA (alpha = 0.05).
RESULTS: Peak power at a 25° knee angle (1041.55 ± 169 W) was significantly higher in relation to 109% of inseam (1002.05 ± 148 W). There were
no significant differences in peak power detected between a 25° and 35° knee angle or between a 35° knee angle and 109% of inseam. Mean
power at a 25° knee angle (672.37 ± 90 W) was significantly higher in relation to a 35° knee angle (654.71 ± 81 W). Mean power was significantly
higher at 109% of inseam (667.88 ± 80 W) in relation to a 35° knee angle (654.71 ± 81 W), but there were no significant differences found between
a 25° knee angle and 109% of inseam. Intra-class correlation coefficients were found to be high in the dependant variables measured (PP = .98
and MP = .99).
CONCLUSIONS: Use of 109% of inseam to adjust saddle height led to cyclists’ knee angle falling outside the recommended 25-35° range 73% of
the time. Use of a 25° appears to provide improved performance in relation to the use of a 35° knee angle and 109% of inseam. Contradictory to
previous research, use of 109% of inseam provided higher mean power in relation to a 35° knee angle. This could be the result of 109% of inseam
producing a wide array of knee angles, which ranged from 19 to 44°. Use of 109% of inseam to adjust saddle height does not take into account
individual variations in femur, tibia, and foot length. The results of this study support previous work, which indicates increased performance with
the use of a 25°.
PRACTICAL APPLICATIONS
From these findings a 25° knee angle can be recommended for increased performance while keeping knee angle within the recommended range
for injury prevention. However it is important to note that this is just a starting point and slight alterations may need to be made due to individual
variations in anthropometrics while adjusting saddle height.
Hamstring To Quadriceps Timing And Activation Ratios Of High School Athletes During Cutting And Jumping
Erich Petushek, Jason Hilgendorf, McKenzie Fauth, Kelly Petrauskus, Christina R. Feldmann, William P. Ebben
PURPOSE: This study assessed hamstring and quadriceps timing and hamstring to quadriceps activation ratios (H:Q), and gender differences
therein, during jump landings and cutting maneuvers. METHODS: Subjects included 6 boys (age = 17.1 ± 0.9 years) and 6 girls (age = 15.7 ± 1.2
years). All subjects provided informed and parental consent and the study was approved by the university review board. Subjects performed
2 repetitions each of the drop jump from a height equal to their maximum vertical jump (J) as well as a sprint and cut at a 45 degree angle (C).
Electromyographic (EMG) data were collected for the rectus femoris (RF), vastus lateralis (VL), vastus medialis (VM), lateral hamstring (LH), and
medial hamstring (MH). Root mean square (RMS) signal processing was used on all EMG data which were analyzed to assess the magnitude and
timing of the muscles bursts pre and post landing for the J and C, using the average of 2 trials and normalized to maximal voluntary isometric
contraction. The H:Q were calculated from the collective average of the hamstring muscles divided by the collective average of the quadriceps
muscles. The timing of the foot contact was synchronized with the EMG system using a switch mat. Data were evaluated using an independent
samples t-test to assess differences in muscle timing and H:Q for the pre and post foot contact for the J and C, for all muscles assessed. RESULTS:
Significant gender differences were found for the timing of the MH activation (p ≤ 0.05) pre and post contact during the J, with boys demonstrat-
ing 24.4% earlier MH activation and a 19.8% longer burst after foot contact. Compared to boys, girls demonstrated 17.2% earlier MH activation
during the C (p ≤ 0.05). Significant gender differences were also found in the H:Q activation ratios with boys demonstrating a 56.3% higher H:Q
ratio after J landing (p ≤ 0.05). No other significant gender differences in the timing of muscle activation or the H:Q ratios were found. Counter-
movement jump height was assessed as a measure of gender difference in training status. Girls demonstrated 73.7% of the jumping ability of the
boys. CONCLUSION: This study confirms the existence of gender differences in the timing and magnitude of activation of MH during movements
that are similar to those that cause ACL injuries. PRACTICAL APPLICATION: Strength and conditioning professionals are encouraged to prescribe
hamstring training to their female athletes in an attempt to remediate gender differences in hamstring activation during J landings.
Effect Of Remote Voluntary Contractions On Squat And Jump Squat Kinetics
Erich Petushek, McKenzie L. Fauth, Clare Kaufmann, William P. Ebben
PURPOSE: Concurrent activation potentiation (CAP) enhances muscular force during open kinetic chain isometric and isokinetic exercises via re-
mote voluntary contractions (RVC’s). PURPOSE: The purpose of this study was to evaluate the effect of RVC’s on the performance of ground based
exercises such as the squat and jump squat. METHODS: Subjects included 13 men (21.4 ± 1.5 years) who performed the test exercises in RVC and
normal (NO-RVC) test conditions. In the RVC condition subjects clenched their jaw on a mouth guard, forcefully gripped and pulled the barbell
down into the trapezius, and performed a Valsalva maneuver. The NO-RVC condition included exercises performed with an open mouth, pursed
lips, normal grip, and consistent cycling between inspiratory and expiratory flow. The test exercises were assessed with a force platform. Peak
ground reaction force (GRF), rate of force development during the first 100 ms (RFD 100), RFD to peak (RFDp), and jump squat height (JH) were
calculated from the force-time records. Data were analyzed using an ANOVA. RESULTS: Compared to the NO-RVC condition, the RVC condition
produced 4.0 and 2.9 % higher GRF, and 23.1 and 32.2 % higher RFD 100, during the squat and jump squat, respectively (p ≤ 0.05). Compared to
the NO-RVC condition, the RVC condition produced 8.3% higher RFDp (p ≤ 0.01) and 26.1% higher JH (p ≤ 0.05) during the jump squat. DISCUS-
SION: This is the first study to evaluate the effect of RVC’s during closed kinetic chain exercises such as the squat and jump squat. Remote vol-
untary contractions augmented the variables assessed by 2.9 to 32.2 %. PRACTICAL APPLICATION: To enhance strength and power performance
during exercises such as the squat and jump squat, practitioners should encourage athletes to incorporate RVC’s into their training programs.
The Contribution Of Volume Load Variation On Strength And Hypertrophy During Unilateral Resistance Training In The Elbow Flexors
Mark D. Peterson, Matt Kampert, G. Gregory Haff, Paul M. Gordon
Purpose: Previous investigations have suggested that volume load (VL) predicts the adaptive hypertrophic response of muscle to resistance
training (RT). However, much of these studies were performed with small samples and/or used less sensitive outcome measures. Consequently,
we sought to confirm the relationship between VL variation using sensitive measures of muscular size and strength in a large sample of healthy,
untrained participants. A secondary aim was to evaluate the differential effects of training between men and women. Methods: This study was a
subset of the Functional Polymorphisms Associated with Human Muscle Size and Strength (FAMuSS) investigation. Eighty-two subjects (n = 39
women, n = 43 men; age = 25.12 ± 5.5yr) were recruited to participate in unilateral elbow flexion RT twice per week, for 12 weeks. Prior to, and
following the training intervention, all subjects were tested using isometric (MVC) and dynamic (one-repetition maximum-1RM) strength of the
elbow flexor muscles, and magnetic resonance imaging (MRI) of the upper arm. All RT took place with the non-dominant arm. The progression of
training included: Weeks 1–4: 3 sets of 12 RMs; Weeks 5–9: 3 sets of 8 RMs; Weeks 10–12: 3 sets of 6 RMs. Individual variations in load and repeti-
tions (i.e. VL) occurred as subjects progressed in strength capacity. Results: Relative increases in whole muscle CSA and volume were significant
from baseline for women (13.05% and 13.15 %), and men (16.56% and 15.95%), respectively. Similarly, relative increases in 1RM and MVC strength
were significant from baseline for women (70.95% and 26.21%), and men (50.69% and 18.09%), respectively. Moderate correlations (p < 0.01),
were observed between VL and absolute changes in whole muscle CSA (r = 0.374) and volume (r = 0.340), as well as MVC (r = 0.508) and 1RM (r =
0.458), for the combined group. When analyzed by gender, VL was only positively correlated to absolute changes in whole muscle CSA (r = 0.518,
p < 0.01) and volume (r = 0.516, p < 0.01) for women. For men, VL was negatively correlated to relative change in CSA (r = -0.341, p < 0.05) and
volume (r = -0.337, p < 0.05). However, baseline strength was also negatively association with relative change in CSA (r = -0.451; p < 0.01) and
volume (r = -0.460, p < 0.01) among men, respectively. Conclusions: The underlying correlation between VL and muscle size in the total group
appears to be driven by gender specific responses. VL and training intensity were associated with absolute increases in muscle mass in women,
only. Untrained men and women experience significant, yet differential adaptations to RT, with women demonstrating significantly greater rela-
tive improvements in strength compared to men. Moreover for men, baseline strength and VL are demonstrated to be inversely related to relative
increases in muscular hypertrophy. Practical Applications: These data suggest that VL is moderately associated with muscle size adaptations
following 12 weeks of RT in untrained individuals. Further, the gender-specific discrepancies indicates that muscle mass development is only
partially attributable to VL. Subsequent research is needed to examine the underlying mechanisms for these discrepancies.
NSCA National Conference & Exhibition Abstracts 40
The Effects Of Rest Interval Length On Bench Press Performance In Resistance-Trained Men And Women
Nicholas Ratamess, Jr., Avery D. Faigenbaum, Ryan E. Ross, Stefanie L. Rashti, Christopher P. Tranchina, Jie Kang, Jay R. Hoffman
PURPOSE: To examine the effects of rest interval (RI) length on acute bench press kinematic and kinetic performances in resistance-trained
men and women. METHODS: Twenty-one resistance-trained men [age = 21.2 ± 2.2 yrs; height = 178.8 ± 7.1 cm; body mass = 85.0 ± 14.5 kg; one
repetition-maximum (1RM) bench press = 104.8 ± 22.1 kg] and 16 women (age = 22.4 ± 6.9 yrs; height = 164.3 ± 6.0 cm; body mass = 62.6 ± 7.3
kg; 1RM bench press = 42.0 ± 12.4 kg) reported to the laboratory on three occasions (following a maximal strength testing session consisting
of obtaining a 1RM and 10RM bench press) in randomized order. Each session consisted of performing the bench press exercise for 3 sets of up
to 10 repetitions with each subjects’ respective 10RM load using 1-, 2-, or 3-min RIs. A transducer was attached to the barbell to measure the
average bar velocity and power of each repetition. The mean velocity and power per set, fatigue rate from set 1 to 3, and repetitions completed
(per set and total for 3 sets) were analyzed. RESULTS: For 1-min RI, repetitions performed decreased significantly (P < 0.05) for sets 2 and 3 in both
groups. The response was significantly different between groups (total repetitions: men = 18.0 ± 3.8; women = 23.3 ± 3.8). For 2- and 3-min RIs,
repetitions decreased significantly in sets 2 and 3 in men and in set 3 only in women compared to set 1. The response was significantly different
between groups (total repetitions: men = 21.4 ± 3.8; women = 27.1 ± 2.6 for 2-min RI; men = 23.5 ± 5.1; women = 28.7 ± 1.5 for 3-min RI). Men
with 3-min RI performed the same number of repetitions as women with 1-min RI. Average velocity and power decreased significantly for sets 2
and 3 in both groups for all RIs with the magnitude greatest during 1-min RI and least during 3-min RI. However, the velocity and power fatigue
rates in men were higher than women for 1-min RI only (~38 versus 29%). For all sets, average power in men was significantly higher than women.
When male and female data were pooled, significant negative correlations were shown between 1RM strength and total repetitions completed
across all RIs (r = -0.50 to -0.62). CONCLUSIONS: RI length significantly affects acute bench press performance with 10RM loads in men and women
with the largest effect seen in 1-min RI and smallest effects seen in 3-min RI. However, gender differences were observed where female bench
press performances were maintained to a greater extent despite the RI length. Based on correlation data, it may be the gender effects observed
resulted from significant strength differences between men and women. PRACTICAL APPLICATION: The results of the present study indicated
that men and women respond differently with RI manipulation during resistance exercise. These data may impact how resistance exercise RI
length is prescribed in the future.
A Comparison Of Resting Metabolic Rate Assessment Techniques On Collegiate Gymnasts
Thomas Pujol, C.L. Elder, J.T. Barnes, M. Nahikian-Nelms, M.L. Kearney, J.P. Loenneke, R.D. Williams
Purpose: The purpose of this study was to compare techniques for estimation of resting energy expenditure with a handheld indirect calorimetry
device in a sample of 16 female Division 1 Collegiate Gymnasts. Methods: Resting metabolic rate (RMR) was measured via a handheld indirect
calorimetry device, estimated by a commercial bioelectrical impedance analyzer (BIA), and estimated using the Harris-Benedict equation. All
measurements were taken during the same session and preceded practice sessions. The RMR attained via indirect calorimetry was compared
to the estimated RMR for each of the methods by one-way ANOVA. Statistical analyses were performed using SPSS with an alpha level of 0.05.
Results: The subjects’ (mean age 19.9yr; ht 161cm; wt 59.9kg) mean RMR measured via indirect calorimetry was 1517.5kcal(199.98), while estima-
tions via BIA and Harris-Benedict were 1304.62kcal(80.13) and 1087.6kcal(55.4), respectively. No significant differences were identified between
the measures. Conclusions: While the difference between the RMR attained by the Harris-Benedict and the other means was quite large the
difference was not significant. As has been seen in other studies the Harris-Benedict equation provided a lower estimate of RMR in a cohort of
athletes. Practical Applications: Of primary concern are the large difference in estimated kcals between the three methods and the large stan-
dard deviation found for the indirect calorimetry device. Such discrepancies could potentially leave an athlete with a significant caloric deficit.
Results suggest a need for continued research to best provide nutrition assessment and guidelines for collegiate gymnasts and perhaps for all
collegiate athletes.
Low Intensity Vertebral Mechanical Axial Traction Decreases Lower Extremity Performance In Healthy Subjects
Christopher Proulx, Joseph A. Gallo
The influence of the spinal treatment and related conditions on lower extremity function has become more of interest, not only in the treat-
ment of conditions, but also the influence to athletic performance. PURPOSE: To determine the influence of vertebral axial distraction via Y-axis
mechanical traction, to the lumbar spine and its influence on lower extremity performance in healthy subjects. METHODS: Seven subjects (male
= 3; female = 4) of college age (m=20.86+0.69) volunteered to participate in the study. All subjects were familiarized with the treatment and
testing procedures and free of lower extremity and spinal injury or pain for at least one year. Measurements of pre- and post-isometric and
isokinetic knee extensions, heart rate, and blood pressure were collected on each subject. Surface EMG was collected on the dominant erector
spinae pre-, mind-, and post-treatment of each subject. Each subject performed a supine position rest period of six minutes for baseline data on
measurement, prior to treatment. Subjects were secured to a digitally controlled mechanical traction device to provide the intermittent lumbar
traction protocol, following the static pre-tension of 9.09 kg. The intermittent protocol incorporated an upper intensity (UI) of 40% of BW (not to
exceed 32 kg) for 60 sec and lower intensity (LI) of 60% UI, with a minimum of 14 kg, for 20 sec. Total treatment time was six minutes, following
pre-tension. RESULTS: There was no significant difference in EMG activity of the erector spinae (p > 0.05) or blood pressure (p > 0.05). Heart rate
was decreased significantly (p = 0.03) and isometric and isokinetic knee extension decreased significantly by the 18 and 14 percent, respectively
(p < 0.0.5). CONCLUSION: Spinal distraction, in the form of supine mechanical traction, causes a decrease in quadriceps performance in knee ex-
tension isometrically and isokinetically. PRACTICAL APPLICATION: Consideration should be taken when prescribing exercises or other treatments
that affect the spine due to its potential influence on lower extremity performance.
Directing Attentional Focus Does Not Influence Standing Broad Jump Performance
Jared M. Porter, Julie A. Partridge, Toby Brooks
Many experiments have shown that providing instructions to performers that prompt them to focus attention externally rather than internally
greatly improves performance on a variety of tasks including accuracy (ex: throwing a ball to a target), static balance, and limb coordination (ex:
swinging a bat). What has not been established is whether or not an external focus will also enhance the performance of tasks requiring a whole
body movement. PURPOSE: The purpose of this experiment was to investigate if whole body movements (ex: standing broad jump) are influ-
enced by an internal or external focus of attention. METHOD: Female participants (N=30) completed a five minute dynamic warm-up by riding a
stationary bike at a comfortable speed. The warm-up was followed by a two minute seated rest. After the two minute seated rest each participant
completed a standing broad jump which was followed by a two minute seated rest. This pattern was followed until each participant completed a
total of five jumps. Prior to each jump participants in the internal (INT) group (n=15) were instructed to focus their attention on “extending their
knees as rapidly as possible” with the goal of jumping as far as possible. The participants in the external (EXT) group (n=15) were instructed to
focus their attention on a stationary cone on the floor perpendicular to the jump line. The EXT participant’s specific instructions were to “focus
on jumping as far past the cone as possible.” The instructions given to the INT participants were designed to focus their attention internally by
prompting them to think about extending their knees. Instructions given to the EXT group were designed to focus attention externally by direct-
ing them to focus their attention on the cone. RESULTS: An independent samples t-test revealed there was no significant (p=0.114) difference
in the distance jumped between the EXT (158.12 ± 32.6 cm) group and the INT group (135.44 ± 23.11 cm). CONCLUSION: The purpose of this
experiment was to investigate if the advantages of using an external focus are limited to tasks that do not require a whole body movement. The
results of this experiment provide initial evidence that tasks requiring a whole body movement may not be negatively influenced by the use of an
internal focus of attention. PRACTICAL APPLICATION: When the goal is to improve performance of skills not requiring a whole body movement,
practitioners should provide instructions that focus the performers’ attention externally. However, based on the results of this experiment when
the skill being performed requires a whole body movement it seems that instructions that focus attention internally or externally are appropriate.

NSCA National Conference & Exhibition Abstracts 41
Agonist- Antagonist Muscle Balance: Effects On Explosive Upper-Body Exercise In Trained Male Athletes
Daniel Rickaby, Glenn A. Wright
The shoulder and surrounding musculature is involved with many sporting activities by pressing away and pulling in external resistances. A bal-
anced strength ratio in the muscles that move the upper arm is likely important, however; it has not been researched to find its relation to power
output. PURPOSE: To observe the strength ratio involving the upper body muscles that involve pressing away and pulling in and to determine
the relationship between this strength ratio to the ability to maximize power output in a rapid ballistic pressing movement. METHODS: 50 NCAA
Division III male athletes of various sports performed one repetition max (1RM) tests of the barbell bench press (1RM BP) and then chin-up (1RM
CU) exercises. Athletes then performed maximal bench throws on a Plyometric Power System in a counter-balanced order at 30 and 45% of
their 1RM BP score. Two sets of 3 repetitions of bench throws at each load were performed. All tests were performed on separate days with 2
full days of recovery between each test. RESULTS: (See Table 1) Pearson’s correlations identified very strong relationships between strength-ratio
(1RM CU/1RM BP) and power output during bench throws at both 30 (BT 30) and 45% (BT 45) of 1RM BP. Nearly perfect relationships between
1RM BP and power output at both BT 30 and BT 45 were observed. The power output at BT 45 (484.3 +114.1) compared to BT 30 (392.2 +97.5)
was found to be higher with every subject. CONCLUSIONS: The results of the study indicate that athletes who have a lower strength ratio (bench
press dominant) and higher 1RM BP scores also have higher power outputs with an explosive upper-body pressing movement. Exercises that
use 45% of 1RM for explosive upper-body movements are more practical than using 30% for achieving higher power outputs. PRACTICAL AP-
PLICATION: Strength and conditioning professionals who want to increase upper-body power in their athletes should be encouraged to increase
their pressing strength to obtain a more favorable strength-ratio and to improve both their pressing and pulling strength for shoulder strength
development.
Table 1. Correlations between bench press and chin up 1RM and bench throw power output.
Trial 1RM BP 1RM CU Strength Ratio
BT 30 .976** .891** -.842**
BT 45 .967** .881** -.838**
** Correlation is significant at the 0.01 level (2-tailed). BT 30 and BT 45, power produced during bench throw using 30 and 45% of 1RM bench
press, respectively. n=50
Comparison Of Two Base Stealing Techniques In Division I Baseball Players
Jacob Reed, Stephanie Anderson, Bradly Brons, Whitney Schindler, Robin Lund
PURPOSE: The purpose of this study is to determine the effectiveness of two baseball stealing techniques, cross-over step (CS) and jab step (JS) in
Division-I baseball players on total distance traveled (meters, m), total time (seconds, s) and velocity (m/s) over the first two sprint strides. METH-
OD: Eight Division-I baseball players from the University of Northern Iowa volunteered for this study. Each subject attended one session and
performed six total repetitions of (JS) and (CS), three for each technique. Technique assignment was assigned randomly to eliminate any order
effect. RESULTS: The results of the Hotelling’s T2 indicate that there was a significant treatment effect (F(7,1) = 958750, p<0.001) on at least one of
the measurements. Post hoc analysis concluded that the jab step resulted in significantly greater distance traveled (t(7)=4.35, p=0.003), however
it took significantly more total time (t(7)=4.64,p=0.002) to cover this distance resulting in no difference in overall sprint velocity over the first two
strides. CONCLUSIONS: It appears that both techniques will produce similar results in initiating the baseball steal. PRACTICAL APPLICATION: CS
or JS are appropriate to teach in initializing the baseball steal with neither showing an advantage over the other. Though it required less time to
perform the first two strides during CS, the total distance was shorter than JS ending in both techniques resulting in nearly identical velocities.
Comparison Of Two Strategies On Recovery After Exhaustive Exercise
Jacob Reed, Stephanie Anderson, Bradly Brons, Chelsea Drumheller, Jill Kirkenberg.
PURPOSE: The purpose of this study is to examine the effects of two recovery strategies on the ability to lower heart rate (HR) following an ex-
haustive exercise bout. Additionally, tidal volume (VT), respiratory rate (RR), and oxygen consumption (VO2) were also collected. METHOD: Nine
recreationally active males from the University of Northern Iowa volunteered for the study. Each subject participated in two test sessions with
different recovery strategies. Both sessions involved the subjects warming up on a treadmill then being subjected to exhaustive exercise. Once
exhaustion was achieved the subjects were instructed to place their hands on their head (HH) or knees (HK). RESULTS: Hotelling’s T2 was rejected
(F = 13.55, 4, 5, p = 0.007). Paired samples t-tests indicated that a significant treatment effect existed for HR (t = 3.619, 8, p=0.007) and VO2 (t =
2.747, 8, p=0.025) but no significant effect for VT or RR. Though no significance was recorded, VT was higher and RR lower in HK. CONCLUSIONS: It
appears that HK is a potentially superior recovery method, despite the historical usage of the HH method by coaches. PRACTICAL APPLICATION:
When in a recovery phase of exhaustive exercise using the HK method maybe preferable if the goal is to lower HR more rapidly however it is
unknown if this advantage in HR reduction will actually improve performance.
The Effects Of Rest Interval Length On Bench Press Performance In Resistance-Trained Men And Women
Nicholas Ratamess, Jr., Avery D. Faigenbaum, Ryan E. Ross, Stefanie L. Rashti, Christopher P. Tranchina, Jie Kang, Jay R. Hoffman
PURPOSE: To examine the effects of rest interval (RI) length on acute bench press kinematic and kinetic performances in resistance-trained
men and women. METHODS: Twenty-one resistance-trained men [age = 21.2 ± 2.2 yrs; height = 178.8 ± 7.1 cm; body mass = 85.0 ± 14.5 kg; one
repetition-maximum (1RM) bench press = 104.8 ± 22.1 kg] and 16 women (age = 22.4 ± 6.9 yrs; height = 164.3 ± 6.0 cm; body mass = 62.6 ± 7.3
kg; 1RM bench press = 42.0 ± 12.4 kg) reported to the laboratory on three occasions (following a maximal strength testing session consisting
of obtaining a 1RM and 10RM bench press) in randomized order. Each session consisted of performing the bench press exercise for 3 sets of up
to 10 repetitions with each subjects’ respective 10RM load using 1-, 2-, or 3-min RIs. A transducer was attached to the barbell to measure the
average bar velocity and power of each repetition. The mean velocity and power per set, fatigue rate from set 1 to 3, and repetitions completed
(per set and total for 3 sets) were analyzed. RESULTS: For 1-min RI, repetitions performed decreased significantly (P < 0.05) for sets 2 and 3 in both
groups. The response was significantly different between groups (total repetitions: men = 18.0 ± 3.8; women = 23.3 ± 3.8). For 2- and 3-min RIs,
repetitions decreased significantly in sets 2 and 3 in men and in set 3 only in women compared to set 1. The response was significantly different
between groups (total repetitions: men = 21.4 ± 3.8; women = 27.1 ± 2.6 for 2-min RI; men = 23.5 ± 5.1; women = 28.7 ± 1.5 for 3-min RI). Men
with 3-min RI performed the same number of repetitions as women with 1-min RI. Average velocity and power decreased significantly for sets 2
and 3 in both groups for all RIs with the magnitude greatest during 1-min RI and least during 3-min RI. However, the velocity and power fatigue
rates in men were higher than women for 1-min RI only (~38 versus 29%). For all sets, average power in men was significantly higher than women.
When male and female data were pooled, significant negative correlations were shown between 1RM strength and total repetitions completed
across all RIs (r = -0.50 to -0.62). CONCLUSIONS: RI length significantly affects acute bench press performance with 10RM loads in men and women
with the largest effect seen in 1-min RI and smallest effects seen in 3-min RI. However, gender differences were observed where female bench
press performances were maintained to a greater extent despite the RI length. Based on correlation data, it may be the gender effects observed
resulted from significant strength differences between men and women. PRACTICAL APPLICATION: The results of the present study indicated
that men and women respond differently with RI manipulation during resistance exercise. These data may impact how resistance exercise RI
length is prescribed in the future.
NSCA National Conference & Exhibition Abstracts 42
A Comparison Of Muscle Activation Between A Smith Machine And Free Weight Bench Press
Evan E. Schick, Jared W. Coburn, Lee E. Brown, Daniel A. Judelson, Andy V. Khamoui, Tai Tran, Brandon P. Uribe, Christian Reyes
PURPOSE: The purpose of this study was to compare muscle activation of the anterior deltoid, medial deltoid, and pectoralis major during a Smith
machine and free weight bench press at lower (70% 1RM) and higher (90% 1RM) intensities.
METHODS: Fourteen experienced (age, 19.9 ± 2.1 years; height, 176.3 ± 7.5 cm; mass, 88.5 ± 19.4 kg) and twelve inexperienced (age, 20.5 ± 2.1
years; height, 179.8 ± 8.0 cm; mass, 75.5 ± 10.4 kg) men completed two testing sessions. Investigators counterbalanced the order of conditions
(free weight, Smith machine) and randomized the order of loads (70 and 90% 1RM) to control for biasing of order for each participant. The ses-
sions consisted of determining each subject’s 1RM on either the Smith Machine or free weight bench press followed by two repetitions at 70%
1RM and two repetitions at 90% 1RM on the tested mode. One week later, subjects completed the same protocol for the other mode. Surface
EMG electrodes were placed superficial to the anterior deltoid, medial deltoid and pectoralis major muscles prior to data collection.
RESULTS: Activation of the medial deltoid was significantly greater on the free weight bench press compared to the Smith machine bench press,
regardless of load or experience level. There was no difference in the activation of the anterior deltoid or pectoralis major between modes or
experience level. Muscle activation was significantly greater at the 90% 1RM load compared to the 70% 1RM load.
Conclusion: The results suggest that the instability caused by the free weight bench press necessitates a greater response by the medial deltoid
as a stabilizer of the humerus in the glenohumeral joint. The relative constancy in muscle activation of the anterior deltoid and pectoralis major
between modes suggests that these two muscles do not play as large a role in stabilizing the shoulder on free weight bench. Alternatively, it
may be that the increased stability offered by the Smith machine decreases the need for the anterior deltoid and pectoralis major to stabilize,
allowing them to produce more force.
PRACTICAL APPLICATION: The bench press is a common exercise performed by both athletes and recreational lifters and prescribed by trainers.
The results of this study help both the practitioner and trainer in providing more information about the differences in between performing the
bench press exercise on a Smith machine and on a free weight bench. Specifically, these results suggest that the free weight bench press may
lead to an increased requirement for stabilization from muscles such as the medial deltoid.
The Influence Of Flexibility On The Stretching-Induced Force Deficit And Maximal Joint Range Of Motion
Eric Ryan, Trent J. Herda, Pablo B. Costa, Ashley A. Walter, Katherine M. Hoge, Jeffery R. Stout, Travis W. Beck, Joel T. Cramer
Many previous studies have reported a temporary decrease in muscle strength following an acute bout of stretching, which has been termed
the “stretching-induced force deficit.” It has also been suggested that the stretching-induced force deficit may be joint angle-specific and influ-
enced by initial level of flexibility. PURPOSE: To examine the effects of initial flexibility on the stretching-induced force deficit in the plantar flexor
muscles at multiple joint angles and ankle joint range of motion (ROM). METHODS: Fourteen men with limited dorsiflexion ROM (mean age ±
SD = 21 ± 2 yrs; stature = 173 ± 9 cm; mass = 75 ± 12 kg; dorsiflexion ROM = 11 ± 6º) and 14 men with a normal ROM (22 ± 2 yrs; 177 ± 8 cm; 75
± 14 kg; 28 ± 6º) (Roaas et al. 1982, Acta Othropedic 53(2): 205 – 208) performed stretch tolerance assessments and isometric maximal voluntary
contractions (MVCs) at -19º, -9º, 1º, and 12º of dorsiflexion (0º = neutral ankle joint angle) designed to examine the ROM and strength, respec-
tively. Testing was performed on a custom-built load cell apparatus attached to a calibrated isokinetic dynamometer before and after a bout of
passive stretching. To assess stretch tolerance, the dynamometer lever arm passively dorsiflexed the foot at 5˚s-1 from -20º of dorsiflexion to
the maximum tolerable ROM (as acknowledged by the subjects). For the MVC assessments, subjects were instructed to provide maximal force
of the plantar flexors for 4 s at each randomly-ordered joint angle. The position signal (°) from the dynamometer and force signal (N) from the
load cell were sampled at 1 KHz during the flexibility and strength assessments, respectively. The passive stretching protocol consisted of nine
135-s constant-torque passive stretches, which was held by the dynamometer at each subject’s maximum tolerable passive stretching force (the
point of discomfort). Five to 10 s was allowed between each stretching repetition. A three way mixed factorial ANOVA [time × angle × group;
2 × 4 × 2] was used to analyze the MVC data, while a two way mixed factorial ANOVA [time × group; 2 × 2] was used to analyze the ROM data.
RESULTS: There was a 9% decrease in plantar flexor MVC strength from pre- to post-stretching across all joint angles for both groups (P<0.001).
Conversely, there was a 4% increase in dorsiflexion ROM from pre- to post-stretching for both groups (P<0.001), however, the normal ROM group
had higher dorsiflexion ROM values than the limited ROM group (P<0.001) at all time points. The magnitude of change for MVC strength and
dorsiflexion ROM from pre- to post-stretching was not affected (P>0.05) by the joint angle or limitations of ROM. CONCLUSIONS: These findings
suggested that the initial level of flexibility does not influence the force deficit or increases in dorsiflexion ROM following an acute bout of passive
stretching in the plantar flexor muscles. These results also indicated that the stretching-induced force deficit occurs at all the ankle joint angles
tested. PRACTICAL APPLICATIONS: These findings may be useful for strength and conditioning professionals or other allied health practitioners
who may incorporate stretching prior to testing or performance. Regardless of initial flexibility, 20 min of passive stretching appears to increase
dorsiflexion ROM, but decrease the maximal strength capabilities of the plantar flexors at all of the joint angles tested in the present study.
The Effects Of Heavy-Loaded Squats On Performance During Plyometric Jumps
Ryan Ruben, M. Molinari, C. Bibbee, M. Childress, M. Harman, K. Reed, K. Fowler, S. Burgess, and G. G. Haff
The use of near-maximal or heavy loaded conditions have been shown to improve movements which require large muscular power outputs
such as sprinting, vertical jumping, and long jumping. The performance increases noted in the scientific literature are often attributed to a post-
activation potentiation (PAP) effect within the stimulated muscle groups, which results in a greater force production by the muscles as a result
of an increased contractile activity (5). Despite the evidence supporting the use of heavy resistance exercises used as a potentiating activity for
explosive performance, there is no evidence on the effects of heavy loaded resistance exercise on subsequent multiple jump plyometric activi-
ties. PURPOSE: To determine the effects of heavy loaded squats on multiple hurdle jump performance. METHODS: Twelve trained college aged
males (age=21.5±2.8 y; body mass = 82.2±14.2 kg; height=175.3±6.7 cm) who could squat a minimum of 1.5 times body mass (back squat / body
mass = 1.73±0.2) were recruited to be subjects in the present study. All subjects had their 1-repetition maximum (1-RM) back squat assessed and
underwent a familiarization session one week prior to the first testing session. Subjects were then randomly assigned to a treatment condition,
with each subject performing both the control (CN) and potentiation (POT) protocols. Each treatment condition was separated by 7 days. During
both condition the subjects performed a warm-up consisting of 5 minutes of cycling at 90-100 W followed by 5 minutes of dynamic stretching.
In the CN condition, the subjects performed the 5 hurdle plyometric test 5 minutes after the warm-up. During POT subjects rested for 5 minutes
after the warm-up and then performed a series of heavy loaded squats, which consisted of 4 ascending sets (1x5 30% 1-RM; 1x3 50% 1-RM; 1x3
70% 1-RM; 1x3 90% 1-RM). Five minutes after the completion of the POT protocol the subjects performed the 5 hurdle hop plyometric test. Dur-
ing all tests each subject wore an accelerometer which quantified velocity, force, and jump height. Data from the accelerometer was used to
calculate the rate of force development and power output. RESULTS: The POT protocol resulted in a significantly greater average jump height
(CN=38.2±5.6 cm; POT=41.2±5.5 cm, p=0.002), maximum jump height (CN=43.1±5.8 cm; POT=45.1±6.2 cm, p = 0.05), average power output
(CON=3986.3±514.3 W; POT=4169.9±552.1 W, p=0.002), peak power output (CN=4284.6±570.5 W; POT=4405.0±543.7 W, p=0.05), average force
(CN=3374.2±898.4 N; POT=3873.0±1092.7, p=0.011) and peak force (CN=3873.0±1092.7 N; POT=4540.6±1368.0 N, p=0.004). CONCLUSIONS: The
performance of multiple hurdle hops is potentiated 5 minutes after the performance of heavy loaded squats. PRACTICAL APPLICATIONS: The
results of the present study add to the body of scientific knowledge which suggests that heavy load resistance activities improve subsequent
explosive activities such as sprinting, vertical jumping, and long jumping. Therefore, strength and conditioning professionals should consider
the use of heavy load squats prior to an explosive plyometric activity during phases of training which specifically target power development.
The Effect Of A Competitive Collegiate Season On Drop Jump Performance Characteristics In Women Basketball Players: Pilot Study
Stephen Rossi, M. Van Dyke, T.A. Buckley, B. Petty, R. Newcomer, J.N. Metzler, J. McMillan
Strenuous sport training and competition without adequate rest and recovery may lead to decreases in physical performance which may be a
predictor of under recovery. PURPOSE: The aim of the present study was to observe the influence of a competitive collegiate women’s basketball
season on drop jump performance characteristics: relative peak force (RPF), contact time (CT), and flight time (FT). METHODS: Drop jump test-
ing was conducted during in-season conference play on 11 NCAA Division I women basketball players (19.4 ± 1.5 yr). Following a recovery day,
participants reported to the lab (same day and time) for 5 weeks. Participants followed the same general 3-min warm-up on a cycle ergometer
followed by a specific dynamic warm-up each week. Participants were then given the same verbal instructions and visual demonstration on how
to correctly perform the drop jump test. Participants performed two-drop jump trials from a box height of 30 cm, onto a force plate (1000Hz).
RESULTS: Repeated measures ANOVA revealed no significant change in RPF, CT, and FT across 5 weeks of competitive conference play. CONCLU-
SION: These data indicate that drop jump characteristics were not altered by in-season sport training and competition. These results suggest
participants were allowed adequate recovery from training and competition. However, it is possible meaningful changes in performance may
have occurred within individual participants which were not detected in mean scores. PRACTICAL APPLICATION: Jump tests provide an inex-
pensive, non-invasive, and simple tool for sport and conditioning coaches to monitor the physiological stress of sport training and in-season
competition. This weekly assessment protocol could provide necessary information concerning player readiness, recovery status, along with
physical and sport training needs.

AbstractsS – U

NSCA National Conference & Exhibition Abstracts 44
Anthropometry As A Predictor Of Front Squat Performance In College Football Players
Catherine Shepherd, Jessica McLagan, Nathan Olson, Skyler Taylor, Lauren Gilliland, Dustin Kline, Alex Detwiler, Shawn Griswold, John Caruso
PURPOSE: The front squat exercise is routinely used in strength and conditioning programs to enhance athletic performance. The purpose of this
study was to determine if anthropometry may act as a predictor of front squat performance variance. METHODS: Front squat performance was
measured in college football players (n = 18) with a triple-axis accelerometer (Myotest Inc., Royal Oak MI) during their standard off-season weight
training workouts. In successive sets, subjects performed 3-6 repetitions with 55, 65, 75 and 80% of their 1RM (one repetition maximum) load. At
the conclusion of each set, the accelerometer measured peak power, force and velocity. Data were collected and averaged from two front squat
workouts separated by one week, in which subjects performed identical front squat protocols. Prior to the first workout, subjects were measured
for the following anthropometric measurements: height, weight, body mass index, hip width, as well as thigh, shank, total leg and torso lengths.
Subjects stood in a relaxed upright posture; length measurements were taken from the right side of subjects’ bodies. In addition, ratios of height
and weight were each made with individual body segments and calculated, in an attempt to account for greater amounts of front squat variance.
RESULTS: Using multivariate regression, a grand total of sixteen anthropometric measures attempted to predict the performance variance from
each of twelve criterion variables (peak power, force and velocity at each of the four loads). With an a = 0.05, anthropometry predicted significant
amounts of performance variance for seven of the criterion variables. R (.934 - .987) and R2 (.872 - .974) among the seven criterion variables were
very high. In addition the seven criterion variables yielded modest standard error of estimate values, thus anthropometry accounted for much
of the variance associated with front squat performance in our subjects. Results show performance variability was lowest with the heaviest (80%
1RM) load. CONCLUSIONS: Subject’s body weights accounted for much front squat performance variance only at the heaviest load. Overall, body
mass index and the weight/torso length ratio served as the best predictors of front squat performance variance. PRACTICAL APPLICATIONS: In
lieu of current R, R2, and standard error of estimate values, our results suggest anthropometry serves as an accurate predictor of front squat
performance in college football players. Current project prediction equations should offer a great deal of accuracy in the assessment of the front
squat, thus measurement of body dimensions should provide a good estimate of an athlete’s peak power, force and velocity performance for
this exercise.
An Analysis Of Playing Positions In Elite International Mens’ Volleyball: Considerations For Competition Demands And Physiological Characteristics
Jeremy Sheppard, Tim Gabbett, Luiz Claudio Reeberg Stanganelli, Robert U. Newton
Purpose: The purpose of this study was to investigate the physiological demands, physiological characteristics and jumping ability of different
playing positions and in different playing levels of elite male volleyball players. Methods: The first investigation involved an analysis of 16 senior
international mens’ volleyball matches involving highly ranked national teams. The second investigation involved an analysis of the anthropo-
metric and jump performance characteristics of 142 development national team (DNT, n=91) and senior national team (SNT, n=51) international
volleyball players comprising the positions of middle (n=49), setter (n=22), and outside (n=71). The players were from 4 different countries, with
senior men’s national team world rankings of 1, 6, 11, and 16. Results: Mean (± SD) frequency of Block Jumps for middles (11.00 ± 3.14) was sig-
nificantly greater than for setters (6.25 ± 2.87, p < 0.001) and outsides (6.50 ± 3.16, p < 0.001). Attack Jumps were performed more frequently by
middles (7.75 ± 1.88) and this was found to be significantly more than setters (0.38 ± 1.06, p < 0.001), and outsides (5.75 ± 3.25, p < 0.01). Middles
were taller than outsides and setters (p <0.001). Consequently, middles had a significantly higher reach and greater body mass than outsides
(p<0.001, p<0.003) and setters (p<0.001, p<0.001). Both middles and outsides had superior counter movement vertical jump (CMVJ) and spike
jump (SPJ) scores compared to setters (p<0.001). Position-specific comparisons between DNT players and SNT players demonstrated that the
SNT players were superior in relative CMVJ and SPJ scores (p<0.05) across all positions, with large magnitude of effect (d>0.99). Conclusions:
The results of this study highlight the large jumping and landing demands placed on the taller and heavier players in the middle position. The
results of this study also establish the large magnitude of difference in jumping ability between junior and senior national team players. Practical
Applications: In managing player training loads, strength and conditioning coaches and medical staff must carefully consider the very large addi-
tional jumping and landing stress that is placed on the taller, heavier middle players, aiming to manage the dose-response relationship to reduce
injury potential and increase performance. Talent identification and talent development for aspiring male volleyball players should consider the
importance of stature in position-selection, and the importance of vertical jump as a discriminator between higher and lower performers across
all offensive positions.
Effect Of Different Set Configurations On Barbell Velocity During Cleans
Ambrose J. Serrano, Alexander J. Koch
Purpose: The purpose of this study was to determine how different set configurations (constant and varying intensity) during training affect the
velocity of the barbell during the clean lift. Methods: 15 Olympic weightlifters from Truman State University (9 men, 6 women) performed a clean
workout consisting of 6 sets of single repetitions in both the constant (C) and varying (V) set configurations. In the C, 6 sets of single repetitions
were performed at 85% of the subjects’ 1 repetition maximum (1RM) clean and jerk. The V configuration had subjects perform 6 sets of singles at
80, 85, 90, 90, 85, and 80% of maximum clean and jerk. All subjects performed a standardized warm-up before each workout. All data were col-
lected and analyzed with a V-Scope Weightlifting Analysis System. Peak velocity (PV) was analyzed for each repetition and compared between set
configurations using repeated measures ANOVA. Results: There was a significant time effect for the velocity (p=.007) and significant interaction
effect for time x set configuration (p=.008). Tukey’s HSD found no significant differences between velocities at any specific repetition. However,
there was a trend towards a faster velocity in the 2nd repetition during C versus the 4th repetition of V. Differences in velocity between repeti-
tions 1&2 and 5&6 by configuration showed a trend as well. Conclusion: This study shows that there are trends toward differences in velocities
between the constant and varying set configurations during the clean lift. Practical Application: Varying load across the sets may produce greater
variation in maximum barbell velocity.
Job Satisfaction Of Division I-AA Collegiate Strength And Conditioning Coaches
Nicole Scott, Donna Winham, Brent Alvar, Debra Crews
PURPOSE: The study purpose was to establish a descriptive measure of how strength and conditioning coaches feel about various aspects of
their jobs using the Job Satisfaction Survey (Specter, 1997). Participants were strength and conditioning coaches from three major Division I-AA
conferences. Data were collected using the standard Job Satisfaction Survey and a demographics questionnaire. The Job Satisfaction Survey was
developed by Paul Spector and consists of nine facets: pay, promotion, supervision, benefits, contingent rewards, operating procedures, cowork-
ers, nature of work, and communication. The 36-item survey is measured using 6 point rating scale: disagree very much, disagree moderately,
disagree slightly, agree slightly, agree moderately, and agree very much.
METHODS: Fifty Division I-AA strength and conditioning coaches were contacted via email using Survey Monkey to participate in the study, ad-
ditionally, follow up hard copy surveys were mailed to the non-responders. Of the 50 strength and conditioning coaches, 32 participated in the
research for a completion rate of 64 percent. Twenty-eight of the respondents were White Americans and five were African American. A t-test
was run on job satisfaction scores for strength and conditioning coaches versus societal norms as reported by Paul Spector. Additionally, correla-
tions between variables were examined for Job Satisfaction Scores and years of experience, age, job title, education, and ethnicity.
RESULTS: Statistically significant differences were found in total satisfaction scores between the sample strength and conditioning coaches and
societal norms (p = .001). Significant correlations were found between job satisfaction and age (R2 = .379; p = 0.03), and ethnicity (R2 = -.345; p
= 0.049). All other tests analyzed were found to be non-significant.
CONCLUSIONS: Based on the findings, collegiate strength and conditioning coaches at the Division I-AA level have a significantly lower job
satisfaction than reported societal norms from other groups using the job satisfaction survey. Additionally, it appears that job satisfaction differs
with age and ethnicity. Specifically, as strength and conditioning coaches age, job satisfaction increases and African American strength and
conditioning coaches have lower job satisfaction than their white counterparts.
PRACTICAL APPLICATIONS: For aspiring strength and conditioning coaches, various aspects of the job satisfaction of the Division I-AA strength
and conditioning professional can be taken from this research study. The longer strength and conditioning coaches are in the profession, the
greater the level of job satisfaction. Unfortunately, these data suggest that job satisfaction can vary by ethnicity. More research needs to be
done on a larger scale with Division I-A strength and conditioning coaches to further examine job satisfaction in all coaches.
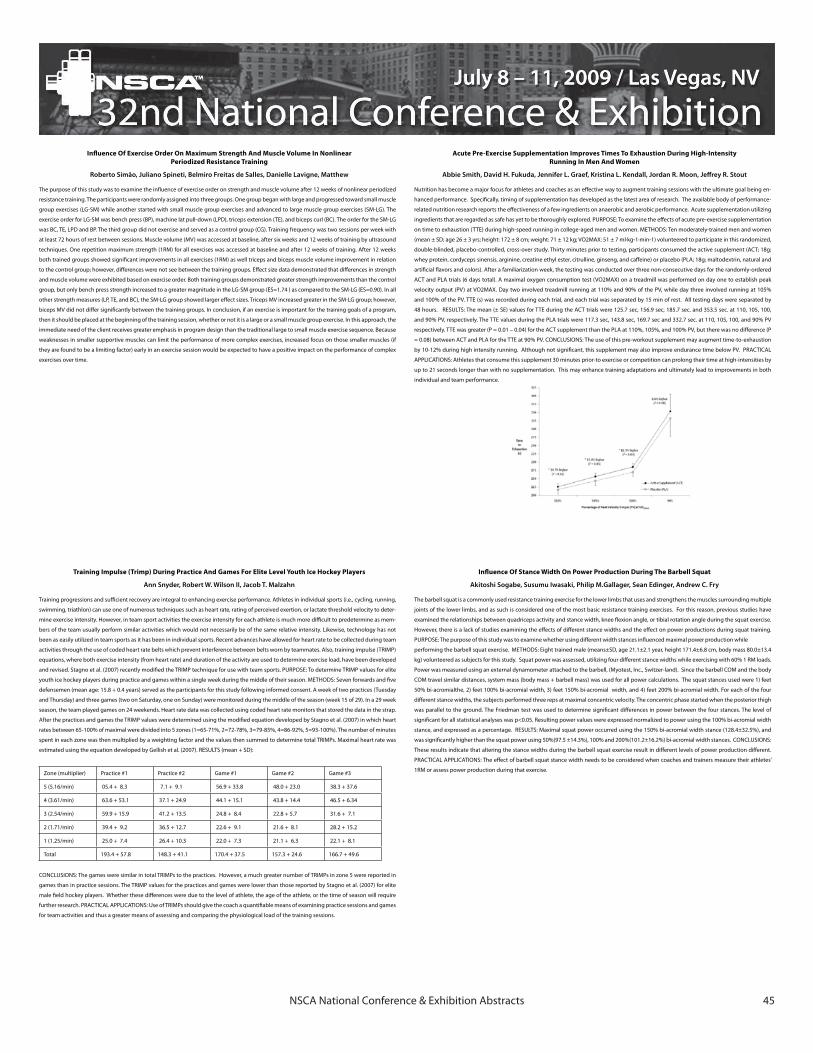
NSCA National Conference & Exhibition Abstracts 45
Influence Of Stance Width On Power Production During The Barbell Squat
Akitoshi Sogabe, Susumu Iwasaki, Philip M.Gallager, Sean Edinger, Andrew C. Fry
The barbell squat is a commonly used resistance training exercise for the lower limbs that uses and strengthens the muscles surrounding multiple
joints of the lower limbs, and as such is considered one of the most basic resistance training exercises. For this reason, previous studies have
examined the relationships between quadriceps activity and stance width, knee flexion angle, or tibial rotation angle during the squat exercise.
However, there is a lack of studies examining the effects of different stance widths and the effect on power productions during squat training.
PURPOSE: The purpose of this study was to examine whether using different width stances influenced maximal power production while
performing the barbell squat exercise. METHODS: Eight trained male (means±SD, age 21.1±2.1 year, height 171.4±6.8 cm, body mass 80.0±13.4
kg) volunteered as subjects for this study. Squat power was assessed, utilizing four different stance widths while exercising with 60% 1 RM loads.
Power was measured using an external dynamometer attached to the barbell, (Myotest, Inc., Switzer-land). Since the barbell COM and the body
COM travel similar distances, system mass (body mass + barbell mass) was used for all power calculations. The squat stances used were 1) feet
50% bi-acromialthe, 2) feet 100% bi-acromial width, 3) feet 150% bi-acromial width, and 4) feet 200% bi-acromial width. For each of the four
different stance widths, the subjects performed three reps at maximal concentric velocity. The concentric phase started when the posterior thigh
was parallel to the ground. The Friedman test was used to determine significant differences in power between the four stances. The level of
significant for all statistical analyses was p<0.05. Resulting power values were expressed normalized to power using the 100% bi-acromial width
stance, and expressed as a percentage. RESULTS: Maximal squat power occurred using the 150% bi-acromial width stance (128.4±32.5%), and
was significantly higher than the squat power using 50%(97.5 ±14.3%), 100% and 200%(101.2±16.2%) bi-acromial width stances. CONCLUSIONS:
These results indicate that altering the stance widths during the barbell squat exercise result in different levels of power production different.
PRACTICAL APPLICATIONS: The effect of barbell squat stance width needs to be considered when coaches and trainers measure their athletes’
1RM or assess power production during that exercise.
Training Impulse (Trimp) During Practice And Games For Elite Level Youth Ice Hockey Players
Ann Snyder, Robert W. Wilson II, Jacob T. Malzahn
Training progressions and sufficient recovery are integral to enhancing exercise performance. Athletes in individual sports (i.e., cycling, running,
swimming, triathlon) can use one of numerous techniques such as heart rate, rating of perceived exertion, or lactate threshold velocity to deter-
mine exercise intensity. However, in team sport activities the exercise intensity for each athlete is much more difficult to predetermine as mem-
bers of the team usually perform similar activities which would not necessarily be of the same relative intensity. Likewise, technology has not
been as easily utilized in team sports as it has been in individual sports. Recent advances have allowed for heart rate to be collected during team
activities through the use of coded heart rate belts which prevent interference between belts worn by teammates. Also, training impulse (TRIMP)
equations, where both exercise intensity (from heart rate) and duration of the activity are used to determine exercise load, have been developed
and revised. Stagno et al. (2007) recently modified the TRIMP technique for use with team sports. PURPOSE: To determine TRIMP values for elite
youth ice hockey players during practice and games within a single week during the middle of their season. METHODS: Seven forwards and five
defensemen (mean age: 15.8 + 0.4 years) served as the participants for this study following informed consent. A week of two practices (Tuesday
and Thursday) and three games (two on Saturday, one on Sunday) were monitored during the middle of the season (week 15 of 29). In a 29 week
season, the team played games on 24 weekends. Heart rate data was collected using coded heart rate monitors that stored the data in the strap.
After the practices and games the TRIMP values were determined using the modified equation developed by Stagno et al. (2007) in which heart
rates between 65-100% of maximal were divided into 5 zones (1=65-71%, 2=72-78%, 3=79-85%, 4=86-92%, 5=93-100%). The number of minutes
spent in each zone was then multiplied by a weighting factor and the values then summed to determine total TRIMPs. Maximal heart rate was
estimated using the equation developed by Gellish et al. (2007). RESULTS (mean + SD):
Zone (multiplier) Practice #1 Practice #2 Game #1 Game #2 Game #3
5 (5.16/min) 05.4 + 8.3 7.1 + 9.1 56.9 + 33.8 48.0 + 23.0 38.3 + 37.6
4 (3.61/min) 63.6 + 53.1 37.1 + 24.9 44.1 + 15.1 43.8 + 14.4 46.5 + 6.34
3 (2.54/min) 59.9 + 15.9 41.2 + 13.5 24.8 + 8.4 22.8 + 5.7 31.6 + 7.1
2 (1.71/min) 39.4 + 9.2 36.5 + 12.7 22.6 + 9.1 21.6 + 8.1 28.2 + 15.2
1 (1.25/min) 25.0 + 7.4 26.4 + 10.3 22.0 + 7.3 21.1 + 6.3 22.1 + 8.1
Total 193.4 + 57.8 148.3 + 41.1 170.4 + 37.5 157.3 + 24.6 166.7 + 49.6
CONCLUSIONS: The games were similar in total TRIMPs to the practices. However, a much greater number of TRIMPs in zone 5 were reported in
games than in practice sessions. The TRIMP values for the practices and games were lower than those reported by Stagno et al. (2007) for elite
male field hockey players. Whether these differences were due to the level of athlete, the age of the athlete, or the time of season will require
further research. PRACTICAL APPLICATIONS: Use of TRIMPs should give the coach a quantifiable means of examining practice sessions and games
for team activities and thus a greater means of assessing and comparing the physiological load of the training sessions.
Acute Pre-Exercise Supplementation Improves Times To Exhaustion During High-Intensity Running In Men And Women
Abbie Smith, David H. Fukuda, Jennifer L. Graef, Kristina L. Kendall, Jordan R. Moon, Jeffrey R. Stout
Nutrition has become a major focus for athletes and coaches as an effective way to augment training sessions with the ultimate goal being en-
hanced performance. Specifically, timing of supplementation has developed as the latest area of research. The available body of performance-
related nutrition research reports the effectiveness of a few ingredients on anaerobic and aerobic performance. Acute supplementation utilizing
ingredients that are regarded as safe has yet to be thoroughly explored. PURPOSE: To examine the effects of acute pre-exercise supplementation
on time to exhaustion (TTE) during high-speed running in college-aged men and women. METHODS: Ten moderately-trained men and women
(mean ± SD; age 26 ± 3 yrs; height: 172 ± 8 cm; weight: 71 ± 12 kg; VO2MAX: 51 ± 7 ml∙kg-1∙min-1) volunteered to participate in this randomized,
double-blinded, placebo-controlled, cross-over study. Thirty minutes prior to testing, participants consumed the active supplement (ACT; 18g;
whey protein, cordyceps sinensis, arginine, creatine ethyl ester, citrulline, ginseng, and caffeine) or placebo (PLA; 18g; maltodextrin, natural and
artificial flavors and colors). After a familiarization week, the testing was conducted over three non-consecutive days for the randomly-ordered
ACT and PLA trials (6 days total). A maximal oxygen consumption test (VO2MAX) on a treadmill was performed on day one to establish peak
velocity output (PV) at VO2MAX. Day two involved treadmill running at 110% and 90% of the PV, while day three involved running at 105%
and 100% of the PV. TTE (s) was recorded during each trial, and each trial was separated by 15 min of rest. All testing days were separated by
48 hours. RESULTS: The mean (± SE) values for TTE during the ACT trials were 125.7 sec, 156.9 sec, 185.7 sec. and 353.5 sec. at 110, 105, 100,
and 90% PV, respectively. The TTE values during the PLA trials were 117.3 sec, 143.8 sec, 169.7 sec and 332.7 sec. at 110, 105, 100, and 90% PV
respectively. TTE was greater (P = 0.01 – 0.04) for the ACT supplement than the PLA at 110%, 105%, and 100% PV, but there was no difference (P
= 0.08) between ACT and PLA for the TTE at 90% PV. CONCLUSIONS: The use of this pre-workout supplement may augment time-to-exhaustion
by 10-12% during high intensity running. Although not significant, this supplement may also improve endurance time below PV. PRACTICAL
APPLICATIONS: Athletes that consume this supplement 30 minutes prior-to exercise or competition can prolong their time at high-intensities by
up to 21 seconds longer than with no supplementation. This may enhance training adaptations and ultimately lead to improvements in both
individual and team performance.
Influence Of Exercise Order On Maximum Strength And Muscle Volume In Nonlinear Periodized Resistance Training
Roberto Simão, Juliano Spineti, Belmiro Freitas de Salles, Danielle Lavigne, Matthew
The purpose of this study was to examine the influence of exercise order on strength and muscle volume after 12 weeks of nonlinear periodized
resistance training. The participants were randomly assigned into three groups. One group began with large and progressed toward small muscle
group exercises (LG-SM) while another started with small muscle group exercises and advanced to large muscle group exercises (SM-LG). The
exercise order for LG-SM was bench press (BP), machine lat pull-down (LPD), triceps extension (TE), and biceps curl (BC). The order for the SM-LG
was BC, TE, LPD and BP. The third group did not exercise and served as a control group (CG). Training frequency was two sessions per week with
at least 72 hours of rest between sessions. Muscle volume (MV) was accessed at baseline, after six weeks and 12 weeks of training by ultrasound
techniques. One repetition maximum strength (1RM) for all exercises was accessed at baseline and after 12 weeks of training. After 12 weeks
both trained groups showed significant improvements in all exercises (1RM) as well triceps and biceps muscle volume improvement in relation
to the control group; however, differences were not see between the training groups. Effect size data demonstrated that differences in strength
and muscle volume were exhibited based on exercise order. Both training groups demonstrated greater strength improvements than the control
group, but only bench press strength increased to a greater magnitude in the LG-SM group (ES=1.74 ) as compared to the SM-LG (ES=0.90). In all
other strength measures (LP, TE, and BC), the SM-LG group showed larger effect sizes. Triceps MV increased greater in the SM-LG group; however,
biceps MV did not differ significantly between the training groups. In conclusion, if an exercise is important for the training goals of a program,
then it should be placed at the beginning of the training session, whether or not it is a large or a small muscle group exercise. In this approach, the
immediate need of the client receives greater emphasis in program design than the traditional large to small muscle exercise sequence. Because
weaknesses in smaller supportive muscles can limit the performance of more complex exercises, increased focus on those smaller muscles (if
they are found to be a limiting factor) early in an exercise session would be expected to have a positive impact on the performance of complex
exercises over time.
NSCA National Conference & Exhibition Abstracts 46
Acute Effects Of Depth Jump Volume On Vertical Jump Performance In Ncaa Di Women Soccer Players
Jennie Stieg, Kimberly J. Faulkinbury, Lee E. Brown, Jared W. Coburn, Daniel A. Judelson
Post activation potentiation (PAP) improves vertical jump performance. Depth jumps might elicit PAP resulting in improved vertical jump perfor-
mance. Purpose: The purpose of this study was to compare different volumes of depth jumps with rebound in order to find the optimal warm-up
for explosive jumping. Methods: Nine NCAA Div. I women soccer players (age; 19.11 ± 0.92 yrs, height; 170.05 ± 6.42 cm, mass; 64.45 ± 6.17 kg)
volunteered to participate in five testing sessions separated by at least 48 hours. Each subject warmed-up on the cycle ergometer for 5 minutes
at 25 watts at a comfortable RPM. Following warm-up, subjects performed three pre test countermovement jumps followed by 0, 3, 6, 9, or 12
depth jumps. Subjects experienced each condition in a random order on separate days. Subjects then rested for ten minutes followed by three
post test countermovement jumps. Dependent variables included vertical jump height as measured by the Vertec and ground reaction force
(GRF) measured by a force plate. Investigators individualized box height for each subject at the height of her lateral femoral condyle. Results:
ANOVA revealed no significant difference from pre to post - test on vertical jump height or GRF for any of the five conditions. Conclusions: These
results suggest the volume and/or box height used in this study were insufficiently intense to elicit PAP and therefore failed to increase jumping
performance. The athletic populations we tested might require a greater volume or higher box height to activate PAP. Also, the rest time might
have been too long between jump tests for this population, thus missing optimal PAP durations. Practical Applications: This study suggests that
NCAA Div I women soccer players do not use depth jumps at knee height with these volumes as a warm-up in an effort to increase vertical jump
performance.
Comparison Of Distances Covered By A Soccer Referee During
High School And College Matches
Scott Staiger
Being a soccer referee requires a high level of aerobic fitness depending on the level of the game. It is assumed that referees with higher levels of
fitness will cover more distance while keeping up with play, thereby improving their ability to make correct decisions. The actual distance covered
depends on several variables including the age and ability of the players, size of the field, and experience of the referee. A global position satellite
(GPS) watch is a device that can be worn by a referee to measure the distance covered during a soccer match. PURPOSE: To use a GPS watch to
analyze and compare distances covered during high school and college soccer matches. METHODS: During this pilot study, one soccer referee
volunteered to participate. The referee (age = 37.5 years, height = 1.70 m, weight = 71.8 kg) wore a GPS watch during 8 college (4 men, and 4
women) and 10 high school (5 boys and 5 girls) soccer matches. After the separate seasons, the data from the watch was downloaded to a com-
puter. The data was later categorized and statistically analyzed. RESULTS: The results of the study indicated that the referee covered significantly
more distance during a college (10,002.07 ± 908.71 m) match than during a high school (8,476.41 ± 503.01 m) match (p=0.001). However, the
college matches were 10 minutes longer in duration, so the distances were adjusted to reflect a common measure, meters per minute (m/min.).
After this adjustment, there were no differences in distance covered between college (110.40 ± 10.33 m/min) and high school (105.96 ± 6.29 m/
min). CONCLUSIONS: The study supported prior research indicating that soccer referees move a large distance during a match. However, there is
no difference in distance covered between high school and college matches when compared by time on the field. PRACTICAL APPLICATIONS: The
use of a GPS watch can help soccer officials measure the distance covered during segments of a match or the entire match. This information can
be used during the post-game analysis. Another benefit is that the information may help the referees with off-season training, such as design-
ing training programs. The GPS watch could also be worn during off-season training sessions to replicate the demands of a soccer match. More
research is needed to validate the use of GPS watches by soccer officials and to further compare the distances covered at different levels of play.
The Relationship Between Speed And Agility Of Professional Arena League Football Players
Frank Spaniol, Johnny Flores, Randy Bonnette, Don Melrose, Liette Ocker
PURPOSE: The purpose of this study was to investigate the relationship between speed and agility of professional arena league football players.
Speed was determined by 40 yard dash times and agility by 20 yard shuttle times. METHODS: One hundred and twenty three male subjects,
ranging in age from 20 to 31 years, participated in this study. All subjects had a minimum of two years professional football playing experience
in an Arena Football League or higher level of competition. All subjects were tested for speed by the 40 yard dash and agility the by the 20 yard
shuttle. Additional data collection included height (HT) and weight (WT). All tests were performed in one testing session in an indoor facility on
artificial turf. Each test was administered by two timers with hand held stop watches. The best of two trials were recorded to the nearest hun-
dredth second. Subjects were divided into four groups based on playing position: quarterbacks (n = 8, HT = 73.2 ± 1.9 in., WT = 222.25 ± 12.8 lbs.),
fullbacks and linebackers (n =17, HT= 72.2 ±1.8 in., WT= 252 ± 26.8 lbs.), offensive and defensive linemen (n = 34, HT = 74.9 ± 1.15 in., WT = 311.6
± 28.5 lbs.), and wide receivers and defensive backs (n = 64, HT = 71 ± 2.2 in., WT = 191.7 ± 15.8 lbs.). Speed times (S) by playing position were as
follows: quarterbacks (S = 4.90 ± .10), fullbacks and linebackers (S = 5.54 ± .06), linemen (S = 5.92 ± .32), wide receivers and defensive backs (S =
4.67 ± .20). Agility times (A) by playing position were as follows: quarterbacks (A = 4.52 ± .15), fullbacks and linebackers (A = 4.64 ± .26), linemen
(A= 5.04 ± .34), wide receivers and defensive backs (A = 4.4 ± .21). RESULTS: Data analysis was performed on the raw data by utilizing Pearson’s r
correlation coefficients to determine the relationship between speed and agility among their respective positions. Statistical analyses (p < .05)
indicated significant relationships between speed and agility for all positions: quarterbacks (r = .66), fullbacks and linebackers (r = .48), offensive
and defensive linemen (r = .60), and wide receivers and defensive backs (r = .48). CONCLUSIONS: The results of this study indicate a significant
relationship between speed and agility of professional arena league football players. PRACTICAL APPLICATION: Since a causal relationship cannot
be assumed for speed and agility, it is suggested that coaches, players, and trainers include drills specifically designed to improve speed as well
as drills that enhance agility.
The Relationship Between Static Strength, Rotational Strength, Rotational Power, Bat Speed, And Batted-Ball Velocity Of NCAA Division I Baseball Players
Frank Spaniol, Jeff Paluseo, Randy Bonnette, Don Melrose, Liette Ocker, David Szymanski
PURPOSE: To investigate the relationship between static strength, rotational strength, rotational power, bat speed and batted-ball velocity of
NCAA Division I baseball players. METHODS: Thirty-three NCAA Division I male baseball players (age 20.36 +/- 1.41 yrs.) were studied to determine
static strength, rotational strength, rotational power, bat speed, and batted-ball velocity. Static strength (SS = 68.4 +/- 12.83 lb.) was measured by
a cable tensiometer at the contact point (bat and ball) in a static hitting position. The maximum of three trials was recorded. Rotational strength
(RS = 194.39 +/- 21.46 lbs.) was measured by a 1RM on a Cybex Torso Rotational Machine. Rotational power (RP = 21.09 +/- 1.11 mph) was mea-
sured by a Stalker Pro digital sports radar gun during a rotational medicine ball toss using a 3 kg medicine ball. Bat speed (BS = 84.4 mph +/- 5.87
mph) was measured with the ATEC 2000® Bat Speed Chronograph by recording the maximum result of five swings on a batting tee. Batted-ball
velocity (BBV = 82.00 +/- 5.28 mph) was measured with the Stalker Pro digital sports radar gun by recording the maximum velocity of five batted
balls from a batting tee. Height (HT= 72.19 +/- 2.66 in.) was measured to the nearest half-inch and body weight (BW = 201.88 +/- 27.41 lb.) to
the nearest pound. The three-site skin fold test was used to determine percent body fat (%BF = 12.89 +/- 3.94) and lean body mass (LBM = 173.2
+/- 21.1 lb.). RESULTS: Data analysis was performed on the raw data by utilizing a correlation matrix to calculate correlation coefficients for all
variables. Statistical analyses (p < .05) indicated moderate to high positive relationships between static strength and bat speed (r = .58) and static
strength and batted-ball velocity (r = .62). Additional moderate positive relationships existed for rotational strength and bat speed (r = .41), rota-
tional strength and batted-ball velocity speed (r = .43), rotational power and bat speed (r = .36), and rotational power and batted-ball velocity (r =
.43). CONCLUSIONS: The results of this study indicate that a significant relationship existed among static strength, rotational strength, rotational
power, bat speed and batted-ball velocity. PRACTICAL APPLICATION: Baseball coaches, players, and trainers should consider the relationship of
static strength, rotational strength, and rotational power, when training for bat speed and batted-ball velocity. ACKNOWLEDGEMENTS: This study
was funded by a grant from the Center for Educational Development, Evaluation, and Research (CEDER) at Texas A&M University-Corpus Christi.
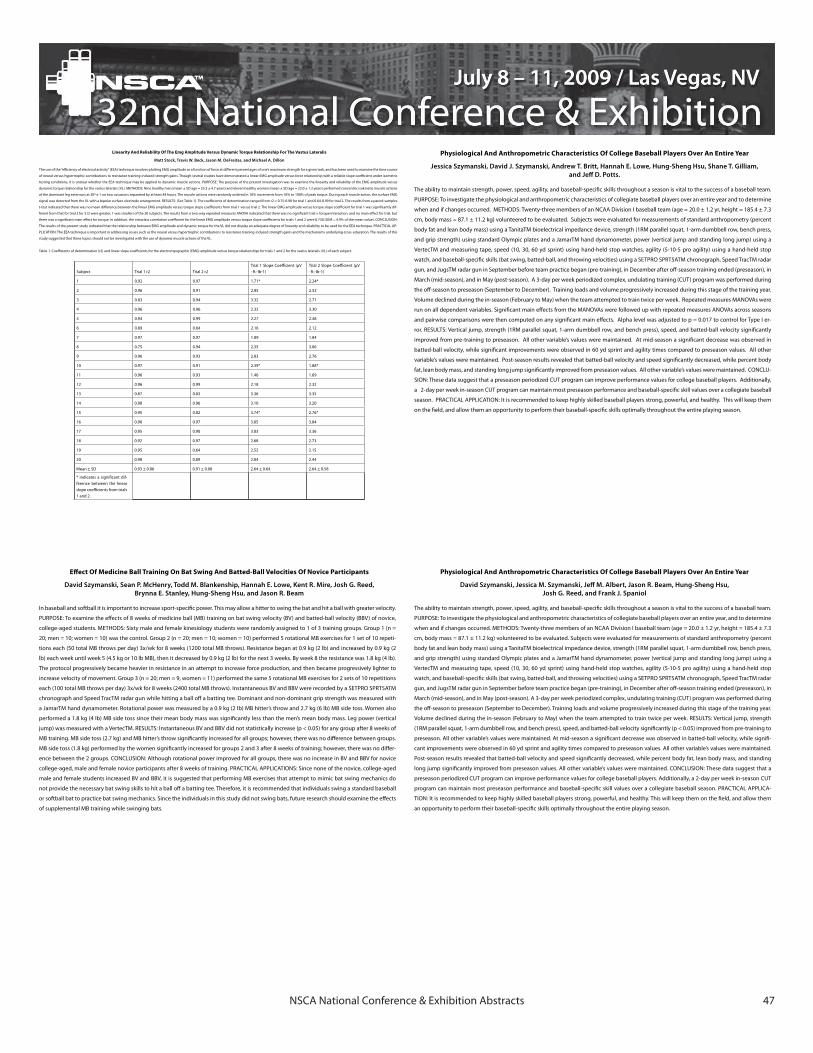
NSCA National Conference & Exhibition Abstracts 47
Effect Of Medicine Ball Training On Bat Swing And Batted-Ball Velocities Of Novice Participants
David Szymanski, Sean P. McHenry, Todd M. Blankenship, Hannah E. Lowe, Kent R. Mire, Josh G. Reed, Brynna E. Stanley, Hung-Sheng Hsu, and Jason R. Beam
In baseball and softball it is important to increase sport-specific power. This may allow a hitter to swing the bat and hit a ball with greater velocity.
PURPOSE: To examine the effects of 8 weeks of medicine ball (MB) training on bat swing velocity (BV) and batted-ball velocity (BBV) of novice,
college-aged students. METHODS: Sixty male and female kinesiology students were randomly assigned to 1 of 3 training groups. Group 1 (n =
20; men = 10; women = 10) was the control. Group 2 (n = 20; men = 10; women = 10) performed 5 rotational MB exercises for 1 set of 10 repeti-
tions each (50 total MB throws per day) 3x/wk for 8 weeks (1200 total MB throws). Resistance began at 0.9 kg (2 lb) and increased by 0.9 kg (2
lb) each week until week 5 (4.5 kg or 10 lb MB), then it decreased by 0.9 kg (2 lb) for the next 3 weeks. By week 8 the resistance was 1.8 kg (4 lb).
The protocol progressively became heavier in resistance in an attempt to increase force production, and then became progressively lighter to
increase velocity of movement. Group 3 (n = 20; men = 9, women = 11) performed the same 5 rotational MB exercises for 2 sets of 10 repetitions
each (100 total MB throws per day) 3x/wk for 8 weeks (2400 total MB throws). Instantaneous BV and BBV were recorded by a SETPRO SPRT5ATM
chronograph and Speed TracTM radar gun while hitting a ball off a batting tee. Dominant and non-dominant grip strength was measured with
a JamarTM hand dynamometer. Rotational power was measured by a 0.9 kg (2 lb) MB hitter’s throw and 2.7 kg (6 lb) MB side toss. Women also
performed a 1.8 kg (4 lb) MB side toss since their mean body mass was significantly less than the men’s mean body mass. Leg power (vertical
jump) was measured with a VertecTM. RESULTS: Instantaneous BV and BBV did not statistically increase (p < 0.05) for any group after 8 weeks of
MB training. MB side toss (2.7 kg) and MB hitter’s throw significantly increased for all groups; however, there was no difference between groups.
MB side toss (1.8 kg) performed by the women significantly increased for groups 2 and 3 after 8 weeks of training; however, there was no differ-
ence between the 2 groups. CONCLUSION: Although rotational power improved for all groups, there was no increase in BV and BBV for novice
college-aged, male and female novice participants after 8 weeks of training. PRACTICAL APPLICATIONS: Since none of the novice, college-aged
male and female students increased BV and BBV, it is suggested that performing MB exercises that attempt to mimic bat swing mechanics do
not provide the necessary bat swing skills to hit a ball off a batting tee. Therefore, it is recommended that individuals swing a standard baseball
or softball bat to practice bat swing mechanics. Since the individuals in this study did not swing bats, future research should examine the effects
of supplemental MB training while swinging bats.
Physiological And Anthropometric Characteristics Of College Baseball Players Over An Entire Year
David Szymanski, Jessica M. Szymanski, Jeff M. Albert, Jason R. Beam, Hung-Sheng Hsu, Josh G. Reed, and Frank J. Spaniol
The ability to maintain strength, power, speed, agility, and baseball-specific skills throughout a season is vital to the success of a baseball team.
PURPOSE: To investigate the physiological and anthropometric characteristics of collegiate baseball players over an entire year, and to determine
when and if changes occurred. METHODS: Twenty-three members of an NCAA Division I baseball team (age = 20.0 ± 1.2 yr, height = 185.4 ± 7.3
cm, body mass = 87.1 ± 11.2 kg) volunteered to be evaluated. Subjects were evaluated for measurements of standard anthropometry (percent
body fat and lean body mass) using a TanitaTM bioelectrical impedance device, strength (1RM parallel squat, 1-arm dumbbell row, bench press,
and grip strength) using standard Olympic plates and a JamarTM hand dynamometer, power (vertical jump and standing long jump) using a
VertecTM and measuring tape, speed (10, 30, 60 yd sprint) using hand-held stop watches, agility (5-10-5 pro agility) using a hand-held stop
watch, and baseball-specific skills (bat swing, batted-ball, and throwing velocities) using a SETPRO SPRT5ATM chronograph, Speed TracTM radar
gun, and JugsTM radar gun in September before team practice began (pre-training), in December after off-season training ended (preseason), in
March (mid-season), and in May (post-season). A 3-day per week periodized complex, undulating training (CUT) program was performed during
the off-season to preseason (September to December). Training loads and volume progressively increased during this stage of the training year.
Volume declined during the in-season (February to May) when the team attempted to train twice per week. RESULTS: Vertical jump, strength
(1RM parallel squat, 1-arm dumbbell row, and bench press), speed, and batted-ball velocity significantly (p < 0.05) improved from pre-training to
preseason. All other variable’s values were maintained. At mid-season a significant decrease was observed in batted-ball velocity, while signifi-
cant improvements were observed in 60 yd sprint and agility times compared to preseason values. All other variable’s values were maintained.
Post-season results revealed that batted-ball velocity and speed significantly decreased, while percent body fat, lean body mass, and standing
long jump significantly improved from preseason values. All other variable’s values were maintained. CONCLUSION: These data suggest that a
preseason periodized CUT program can improve performance values for college baseball players. Additionally, a 2-day per week in-season CUT
program can maintain most preseason performance and baseball-specific skill values over a collegiate baseball season. PRACTICAL APPLICA-
TION: It is recommended to keep highly skilled baseball players strong, powerful, and healthy. This will keep them on the field, and allow them
an opportunity to perform their baseball-specific skills optimally throughout the entire playing season.
Physiological And Anthropometric Characteristics Of College Baseball Players Over An Entire Year
Jessica Szymanski, David J. Szymanski, Andrew T. Britt, Hannah E. Lowe, Hung-Sheng Hsu, Shane T. Gilliam, and Jeff D. Potts.
The ability to maintain strength, power, speed, agility, and baseball-specific skills throughout a season is vital to the success of a baseball team.
PURPOSE: To investigate the physiological and anthropometric characteristics of collegiate baseball players over an entire year and to determine
when and if changes occurred. METHODS: Twenty-three members of an NCAA Division I baseball team (age = 20.0 ± 1.2 yr, height = 185.4 ± 7.3
cm, body mass = 87.1 ± 11.2 kg) volunteered to be evaluated. Subjects were evaluated for measurements of standard anthropometry (percent
body fat and lean body mass) using a TanitaTM bioelectrical impedance device, strength (1RM parallel squat, 1-arm dumbbell row, bench press,
and grip strength) using standard Olympic plates and a JamarTM hand dynamometer, power (vertical jump and standing long jump) using a
VertecTM and measuring tape, speed (10, 30, 60 yd sprint) using hand-held stop watches, agility (5-10-5 pro agility) using a hand-held stop
watch, and baseball-specific skills (bat swing, batted-ball, and throwing velocities) using a SETPRO SPRT5ATM chronograph, Speed TracTM radar
gun, and JugsTM radar gun in September before team practice began (pre-training), in December after off-season training ended (preseason), in
March (mid-season), and in May (post-season). A 3-day per week periodized complex, undulating training (CUT) program was performed during
the off-season to preseason (September to December). Training loads and volume progressively increased during this stage of the training year.
Volume declined during the in-season (February to May) when the team attempted to train twice per week. Repeated measures MANOVAs were
run on all dependent variables. Significant main effects from the MANOVAs were followed up with repeated measures ANOVAs across seasons
and pairwise comparisons were then computed on any significant main effects. Alpha level was adjusted to p = 0.017 to control for Type I er-
ror. RESULTS: Vertical jump, strength (1RM parallel squat, 1-arm dumbbell row, and bench press), speed, and batted-ball velocity significantly
improved from pre-training to preseason. All other variable’s values were maintained. At mid-season a significant decrease was observed in
batted-ball velocity, while significant improvements were observed in 60 yd sprint and agility times compared to preseason values. All other
variable’s values were maintained. Post-season results revealed that batted-ball velocity and speed significantly decreased, while percent body
fat, lean body mass, and standing long jump significantly improved from preseason values. All other variable’s values were maintained. CONCLU-
SION: These data suggest that a preseason periodized CUT program can improve performance values for college baseball players. Additionally,
a 2-day per week in-season CUT program can maintain most preseason performance and baseball-specific skill values over a collegiate baseball
season. PRACTICAL APPLICATION: It is recommended to keep highly skilled baseball players strong, powerful, and healthy. This will keep them
on the field, and allow them an opportunity to perform their baseball-specific skills optimally throughout the entire playing season.
Linearity And Reliability Of The Emg Amplitude Versus Dynamic Torque Relationship For The Vastus Lateralis
Matt Stock, Travis W. Beck, Jason M. DeFreitas, and Michael A. Dillon
The use of the “efficiency of electrical activity” (EEA) technique involves plotting EMG amplitude as a function of force at different percentages of one’s maximum strength for a given task, and has been used to examine the time course
of neural versus hypertrophic contributions to resistance training-induced strength gains. Though several studies have demonstrated a linear EMG amplitude versus force relationship with a reliable slope coefficient under isometric
testing conditions, it is unclear whether the EEA technique may be applied to dynamic muscle actions. PURPOSE: The purpose of the present investigation was to examine the linearity and reliability of the EMG amplitude versus
dynamic torque relationship for the vastus lateralis (VL). METHODS: Nine healthy men (mean ± SD age = 25.3 ± 4.7 years) and eleven healthy women (mean ± SD age = 22.0 ± 1.3 years) performed concentric isokinetic muscle actions
t-test indicated that there was no mean difference between the linear EMG amplitude versus torque slope coefficients from trial 1 versus trial 2. The linear EMG amplitude versus torque slope coefficient for trial 1 was significantly dif-
ferent from that for trial 2 for 3 (2 were greater, 1 was smaller) of the 20 subjects. The results from a two-way repeated measures ANOVA indicated that there was no significant trial × torque interaction, and no main effect for trial, but
-
study suggested that these topics should not be investigated with the use of dynamic muscle actions of the VL.
Subject Trial 1 r2 Trial 2 r2 · ft.-lb-1) · ft.-lb-1)
1 0.92 0.97 1.71* 2.24*
2 0.91 2.52
3 0.94 3.32 2.71
4 2.32 3.30
5 0.94 0.99 2.27
2.12
7 0.97 0.97
0.75 0.94 2.35
9 0.93
10 0.97 0.91 2.39*
11 0.93
12 0.99 2.32
13 3.35
14 3.10 3.20
15 0.95 3.74*
0.97
17 0.95 0.90 3.03
0.92 0.97 2.73
19 0.95 2.52 2.15
20 2.44
Mean ± SD
* indicates a significant dif-
ference between the linear
slope coefficients from trials
1 and 2.

NSCA National Conference & Exhibition Abstracts 48
The Effect Of An Extended Warm-Up On Diurnal Performance Differences In Loaded Counter-Movement Jumps
Kristie-Lee Taylor, Michael Barker, John Cronin, Nicholas Gill, Dale Chapman, Jeremy Sheppard
PURPOSE: We have previously shown that the performance of a loaded counter-movement jump, which is frequently used in the assessment of
an athlete’s neuromuscular capabilities, is affected by the time of day that the assessment is conducted. This study aimed to extend those find-
ings by examining whether such variations in performance can be accounted for by the diurnal fluctuations known to exist in body temperature.
METHODS: Eight recreationally trained males (29.8 ± 5.2 yrs; 178.3 ± 5.2 cm; 80.3 ± 6.5 kg) with a minimum of 6 months resistance training his-
tory completed four separate sessions (differing in time of day and type of warm-up completed). In a randomised order, jump performance was
assessed following (a) control warm-up at 8am (b) control warm-up at 4pm (c) extended warm-up at 8am and (d) extended warm-up at 4pm.
The control warm-up consisted of dynamic exercises and practice jumps equivalent to the standard warm-up for strength and power assess-
ment used in our laboratory. The extended warm-up incorporated a 20min general warm-up period on a stationary bike (150 – 200 W), prior to
completion of the control warm-up. Body temperature was measured using a combination of skin and core temperature to estimate overall body
temperature. Peak power, mean power, peak velocity, peak force and jump height were measured using a linear position transducer attached
to an Olympic lifting bar with an additional load of 20kg (i.e. total load of 40kg). Subjects performed 2 sets of 3 repetitions of maximal effort
countermovement jumps with the bar across their shoulders. RESULTS: Prior to jump testing for the AM and PM control conditions, whole body
temperature was 36.5 and 36.8°C respectively, which increased to 36.8 and 36.9°C during AM and PM extended warm-up conditions. All kinetic
and kinematic variables were higher (ES range = 0.2 – 0.3) during the PM as compared to the AM control condition (Table 1). Following the ex-
tended AM warm-up, when body temperature was ~ equivalent to the PM control condition, performance was comparable (ES <0.1), except for
peak power where the AM extended condition produced greater results (ES = 0.3).
Table 1. Mean (SD) results for kinetic and kinematic variables (mean of 6 trials) measured during 40kg countermovement jumps.
ConditionPk Power
(W)Mean Power (W)
Pk Velocity
(m.sec-1)
Peak Force
(N)
Height
(cm)
AM CONTROL 3747 (636) 2054 (329) 2.15 (0.21) 1697 (152) 26.3 (4.5)
AM EXTENDED 4090 (768) 2159 (371) 2.24 (0.21) 1738 (167) 27.9 (4.5)
PM CONTROL 3899 (543) 2152 (312) 2.22 (0.16) 1733 (149) 28.0 (3.7)
PM EXTENDED 4047 (705) 2223 (361) 2.25 (0.22) 1761 (157) 28.5 (4.1)
CONCLUSIONS: The results of this study indicate that the diurnal variation in whole body temperature, which peaks in the early evening, may
explain the diurnal performance differences existent in explosive power output and associated variables. The performance of an extended warm-
up, designed to increase the whole body temperature, resulted in an improvement in the kinetic and kinematic variables commonly reported
from jump performance in the AM condition. PRACTICAL APPLICATIONS: It is suggested that warm-up protocols designed to increase body tem-
perature may be beneficial for reducing diurnal differences in jump performance. This is important for ensuring maximal performance results,
and for monitoring performance changes over time, when it may be impractical to standardise the time of day that testing takes place.
Effect Of Bosu Balance Trainer® Vs Original Step® On Health- And Skill-Related Components Of Physical Fitness
Erica Taylor, Jason R. Beam, Shane T. Gilliam
INTRODUCTION: Unstable surface training, such as the BOSU Balance Trainer, has grown in popularity in many rehabilitation and general exercise
settings as a way to improve general fitness and athletic performance through balance training. However, most studies that have examined these
claims have come back with insignificant results. PURPOSE: To determine if the BOSU Balance Trainer provided additional benefits for the health-
related and skill-related components of physical fitness compared to performing the same exercise program on the Original Step for healthy,
active individuals. METHODS: Fifteen subjects (ages 19-24 yr) were randomly assigned to 1 of 3 groups. The two treatment groups (BOSU = 5 and
Step = 5) followed the 30-minute BOSU Total Body Workout DVD 3 days/week for 6 weeks. The control group (n = 5) was not allowed to participate
in any resistance training program for the 6 weeks. Body composition (bioelectrical impedance device), flexibility (sit-in-reach), muscular endur-
ance (1-minute sit-up and push-up), muscular strength (3 repetition maximum parallel squat), cardiovascular endurance (YMCA 3-minute step
test), and balance (Stork test) were assessed before and after the 6 weeks of training. RESULTS: There were no significant differences between
groups for any of the health-related and skill-related components tested. CONCLUSION: The BOSU Balance Trainer did not provide any additional
benefits or increases in general fitness compared to the Original Step or control group. PRACTICAL APPLICATIONS: Based on responses to a
questionnaire, subjects in group 3 did not like performing the BOSU Balance Trainer exercise program on the Original Step. Group 2 liked training
on the BOSU; however, both groups indicated that the intensity of the training DVD did not progress. Because of this, subjects were unmotivated
and bored. Future research should take into account the duration, intensity, and progression of the DVD training program.
The Effect Of Weightlifting Training On The Testosterone:cortisol Ratio
Jillian K. Tappendorf, Matthew V. Palozola, Alexander J. Koch
The ratio between testosterone (T) and cortisol (C) has been proposed as a marker of training status. Specifically, a higher ratio is thought to
represent a more favorable hormonal milieu for muscle hypertrophy and strength gain. Purpose: We examined the impact of weightlifting train-
ing on the ratio of serum testosterone to cortisol (T:C) as athletes prepared for a competition. We hypothesized that athletes who experienced
a greater increase in T:C during the pre-competition taper would tend to perform better. Methods: Eight male weightlifters (body mass= 82.0 ±
10.8 kg, height = 176 ± 9 cm, age= 20 ± 1 y) completed nine weeks of periodized training before competing in a USAW-sanctioned weightlifting
meet. Fasting blood samples were obtained from subjects at four time points (weeks 3, 5, 7, and 9) over the training period. The blood sam-
ples were analyzed for T and C concentrations using an enzyme-linked immunosorbent assay. Results: Training volume significantly decreased
(p<0.001) as athletes approached competition. Training intensity significantly increased (p= 0.01) before tapering for competition. Following
training, lifters achieved significant gains in the clean & jerk (p=0.021) and the total (p = 0.002) but not the snatch (p = 0.296) or the front squat
(p=0.067). The T:C ratio did not significantly change over time (p=0.416). Changes in T:C from week 7 (high intensity and volume) to week 9
(taper) did not correlate significantly to improvements in competition total (r = -0.22, p=0.962). No other correlations were found. Conclusion:
These data indicate that the T:C ratio is not a sensitive indicator of training status. Practical Applications: Weightlifters can make improvements
in performance despite a lack of measurable change in the testosterone:cortisol ratio.
Body Composition In Division II Football Players
Scott Talpey, Robert Axtell, Kurt Sollanek, Robert Thiel
In recent years body composition studies on American Football players have focused on participants at the professional, NCAA Division I and
NCAA Division III levels. Recent data utilizing skinfold and hydrostatic weighing to measure the body composition of NCAA Division II football
players is currently not available. Purpose: The purpose of the present investigation was to examine the body composition of NCAA Division
II football players utilizing both hydrostatic weighing and skinfold measurements. Methods: Sixty-eight NCAA Division II (DII) football players
volunteered for this study. Body height (HT), body weight (BW), forced vital capacity and percent body fat were measured. Percent body fat was
assessed across all playing positions: offensive line/tightends (OL/TE), defensive line (DL), offensive backs/receivers (OB/WR), defensive backs
(DB), linebackers (LB) and quarterbacks/kickers (QB/K) through eight skinfold measurements (chest, abdominal, thigh, calf, subscapular, suprail-
liac, triceps & biceps) and hydrostatic weighing. Body density was calculated from skinfold measurements utilizing six regression equations
with a pooled median value utilized for analysis. Percent body fat was calculated using the Schutte equation for African Americans and the Siri
equation for Caucasian athletes. Results: Percent body fat calculated from skinfold measurements: OL/TE = 28.26 (± 1.19%) DL = 25.04 (± 2.82%)
OB/WR = 15.12 (± 1.24%) DB = 15.40 (± 0.66%) LB = 18.63 (± 1.20%) QB/K = 17.86 (± 1.70%). Percent body fat calculated from hydrostatic weigh-
ing: OL/TE = 25.29 (± 1.42%) DL = 22.05 (± 3.21%) OB/WR = 11.98 (± 1.35%) DB = 12.76 (± 1.03%) LB = 14.99 (± 1.39%) QB/K = 14.53 (± 1.73%).
Discussion: Upon inspection, these data show DII football players possessed a higher percentage of body fat when compared to their Division I
(DI) counterparts published by Noel, Vanheest, Zaneteas & Rodgers (2003) (See table 1.). Practical Application: These data will allow strength and
conditioning professionals and nutritionists to better monitor training and dietary programs of NCAA Division II football players.
Table 1. Comparison of percentage of body fat between NCAA Division II football players and NCAA Division I football players.
Player Position Skinfold DII
Talpey, 2009
Skinfold DI
Noel et al. 2003
Hydrostatic DII
Talpey, 2009
Hydrostatic DI
Noel et al. 2003
OL/TE 28.26 (± 1.19%) 25.79 (± 8.15%) 25.29 (± 1.42%) 21.07 (± 2.37%)
DL 25.04 (± 2.82%) 23.62 (± 7.33%) 22.05 (± 3.21%) 16.3 (± 0.84%)
OB/WR 15.12 (± 1.24%) 13.83 (± 4.90%) 11.98 (± 1.35%) 7.48 (± 2.48%)
DB 15.40 (± 0.66%) 13.39 (± 4.09%) 12.76 (± 1.03%) 8.24 (± 0.97%)
LB 18.63 (± 1.20%) 18.54 (± 4.27%) 14.99 (± 1.39%) N/A
QB/K 17.86 (± 1.70%) 15.45 (± 4.03%) 14.53 (± 1.73%) 10.45(± 1.05%)
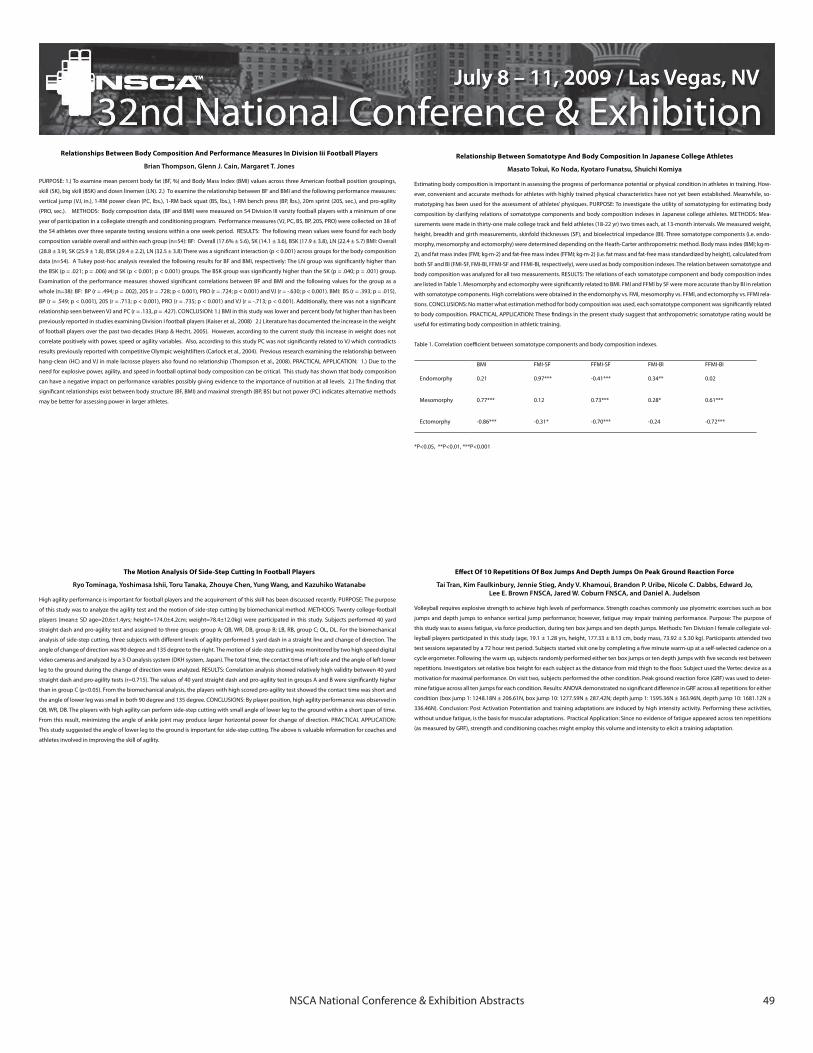
NSCA National Conference & Exhibition Abstracts 49
The Motion Analysis Of Side-Step Cutting In Football Players
Ryo Tominaga, Yoshimasa Ishii, Toru Tanaka, Zhouye Chen, Yung Wang, and Kazuhiko Watanabe
High agility performance is important for football players and the acquirement of this skill has been discussed recently. PURPOSE: The purpose
of this study was to analyze the agility test and the motion of side-step cutting by biomechanical method. METHODS: Twenty college-football
players (mean± SD age=20.6±1.4yrs; height=174.0±4.2cm; weight=78.4±12.0kg) were participated in this study. Subjects performed 40 yard
straight dash and pro-agility test and assigned to three groups: group A; QB, WR, DB, group B; LB, RB, group C; OL, DL. For the biomechanical
analysis of side-step cutting, three subjects with different levels of agility performed 5 yard dash in a straight line and change of direction. The
angle of change of direction was 90 degree and 135 degree to the right. The motion of side-step cutting was monitored by two high speed digital
video cameras and analyzed by a 3-D analysis system (DKH system, Japan). The total time, the contact time of left sole and the angle of left lower
leg to the ground during the change of direction were analyzed. RESULTS: Correlation analysis showed relatively high validity between 40 yard
straight dash and pro-agility tests (r=0.715). The values of 40 yard straight dash and pro-agility test in groups A and B were significantly higher
than in group C (p<0.05). From the biomechanical analysis, the players with high scored pro-agility test showed the contact time was short and
the angle of lower leg was small in both 90 degree and 135 degree. CONCLUSIONS: By player position, high agility performance was observed in
QB, WR, DB. The players with high agility can perform side-step cutting with small angle of lower leg to the ground within a short span of time.
From this result, minimizing the angle of ankle joint may produce larger horizontal power for change of direction. PRACTICAL APPLICATION:
This study suggested the angle of lower leg to the ground is important for side-step cutting. The above is valuable information for coaches and
athletes involved in improving the skill of agility.
Effect Of 10 Repetitions Of Box Jumps And Depth Jumps On Peak Ground Reaction Force
Tai Tran, Kim Faulkinbury, Jennie Stieg, Andy V. Khamoui, Brandon P. Uribe, Nicole C. Dabbs, Edward Jo, Lee E. Brown FNSCA, Jared W. Coburn FNSCA, and Daniel A. Judelson
Volleyball requires explosive strength to achieve high levels of performance. Strength coaches commonly use plyometric exercises such as box
jumps and depth jumps to enhance vertical jump performance; however, fatigue may impair training performance. Purpose: The purpose of
this study was to assess fatigue, via force production, during ten box jumps and ten depth jumps. Methods: Ten Division I female collegiate vol-
leyball players participated in this study (age, 19.1 ± 1.28 yrs, height, 177.33 ± 8.13 cm, body mass, 73.92 ± 5.30 kg). Participants attended two
test sessions separated by a 72 hour rest period. Subjects started visit one by completing a five minute warm-up at a self-selected cadence on a
cycle ergometer. Following the warm up, subjects randomly performed either ten box jumps or ten depth jumps with five seconds rest between
repetitions. Investigators set relative box height for each subject as the distance from mid thigh to the floor. Subject used the Vertec device as a
motivation for maximal performance. On visit two, subjects performed the other condition. Peak ground reaction force (GRF) was used to deter-
mine fatigue across all ten jumps for each condition. Results: ANOVA demonstrated no significant difference in GRF across all repetitions for either
condition (box jump 1: 1248.18N ± 206.61N, box jump 10: 1277.59N ± 287.42N; depth jump 1: 1595.36N ± 363.96N, depth jump 10: 1681.12N ±
336.46N). Conclusion: Post Activation Potentiation and training adaptations are induced by high intensity activity. Performing these activities,
without undue fatigue, is the basis for muscular adaptations. Practical Application: Since no evidence of fatigue appeared across ten repetitions
(as measured by GRF), strength and conditioning coaches might employ this volume and intensity to elicit a training adaptation.
Relationship Between Somatotype And Body Composition In Japanese College Athletes
Masato Tokui, Ko Noda, Kyotaro Funatsu, Shuichi Komiya
Estimating body composition is important in assessing the progress of performance potential or physical condition in athletes in training. How-
ever, convenient and accurate methods for athletes with highly trained physical characteristics have not yet been established. Meanwhile, so-
matotyping has been used for the assessment of athletes’ physiques. PURPOSE: To investigate the utility of somatotyping for estimating body
composition by clarifying relations of somatotype components and body composition indexes in Japanese college athletes. METHODS: Mea-
surements were made in thirty-one male college track and field athletes (18-22 yr) two times each, at 13-month intervals. We measured weight,
height, breadth and girth measurements, skinfold thicknesses (SF), and bioelectrical impedance (BI). Three somatotype components (i.e. endo-
morphy, mesomorphy and ectomorphy) were determined depending on the Heath-Carter anthropometric method. Body mass index (BMI; kg·m-
2), and fat mass index (FMI; kg·m-2) and fat-free mass index (FFMI; kg·m-2) (i.e. fat mass and fat-free mass standardized by height), calculated from
both SF and BI (FMI-SF, FMI-BI, FFMI-SF and FFMI-BI, respectively), were used as body composition indexes. The relation between somatotype and
body composition was analyzed for all two measurements. RESULTS: The relations of each somatotype component and body composition index
are listed in Table 1. Mesomorphy and ectomorphy were significantly related to BMI. FMI and FFMI by SF were more accurate than by BI in relation
with somatotype components. High correlations were obtained in the endomorphy vs. FMI, mesomorphy vs. FFMI, and ectomorphy vs. FFMI rela-
tions. CONCLUSIONS: No matter what estimation method for body composition was used, each somatotype component was significantly related
to body composition. PRACTICAL APPLICATION: These findings in the present study suggest that anthropometric somatotype rating would be
useful for estimating body composition in athletic training.
Table 1. Correlation coefficient between somatotype components and body composition indexes.
BMI FMI-SF FFMI-SF FMI-BI FFMI-BI
Endomorphy 0.21 0.97*** -0.41*** 0.34** 0.02
Mesomorphy 0.77*** 0.12 0.73*** 0.28* 0.61***
Ectomorphy -0.86*** -0.31* -0.70*** -0.24 -0.72***
*P<0.05, **P<0.01, ***P<0.001
Relationships Between Body Composition And Performance Measures In Division Iii Football Players
Brian Thompson, Glenn J. Cain, Margaret T. Jones
PURPOSE: 1.) To examine mean percent body fat (BF, %) and Body Mass Index (BMI) values across three American football position groupings,
skill (SK), big skill (BSK) and down linemen (LN). 2.) To examine the relationship between BF and BMI and the following performance measures:
vertical jump (VJ, in.), 1-RM power clean (PC, lbs.), 1-RM back squat (BS, lbs.), 1-RM bench press (BP, lbs.), 20m sprint (20S, sec.), and pro-agility
(PRO, sec.). METHODS: Body composition data, (BF and BMI) were measured on 54 Division III varsity football players with a minimum of one
year of participation in a collegiate strength and conditioning program. Performance measures (VJ, PC, BS, BP, 20S, PRO) were collected on 38 of
the 54 athletes over three separate testing sessions within a one week period. RESULTS: The following mean values were found for each body
composition variable overall and within each group (n=54): BF: Overall (17.6% ± 5.6), SK (14.1 ± 3.6), BSK (17.9 ± 3.8), LN (22.4 ± 5.7) BMI: Overall
(28.8 ± 3.9), SK (25.9 ± 1.8), BSK (29.4 ± 2.2), LN (32.5 ± 3.8) There was a significant interaction (p < 0.001) across groups for the body composition
data (n=54). A Tukey post-hoc analysis revealed the following results for BF and BMI, respectively: The LN group was significantly higher than
the BSK (p = .021; p = .006) and SK (p < 0.001; p < 0.001) groups. The BSK group was significantly higher than the SK (p = .040; p = .001) group.
Examination of the performance measures showed significant correlations between BF and BMI and the following values for the group as a
whole (n=38): BF: BP (r = .494; p = .002), 20S (r = .728; p < 0.001), PRO (r = .724; p < 0.001) and VJ (r = -.630; p < 0.001). BMI: BS (r = .393; p = .015),
BP (r = .549; p < 0.001), 20S (r = .713; p < 0.001), PRO (r = .735; p < 0.001) and VJ (r = -.713; p < 0.001). Additionally, there was not a significant
relationship seen between VJ and PC (r = .133, p = .427). CONCLUSION: 1.) BMI in this study was lower and percent body fat higher than has been
previously reported in studies examining Division I football players (Kaiser et al., 2008) 2.) Literature has documented the increase in the weight
of football players over the past two decades (Harp & Hecht, 2005). However, according to the current study this increase in weight does not
correlate positively with power, speed or agility variables. Also, according to this study PC was not significantly related to VJ which contradicts
results previously reported with competitive Olympic weightlifters (Carlock et al., 2004). Previous research examining the relationship between
hang-clean (HC) and VJ in male lacrosse players also found no relationship (Thompson et al., 2008). PRACTICAL APPLICATION: 1.) Due to the
need for explosive power, agility, and speed in football optimal body composition can be critical. This study has shown that body composition
can have a negative impact on performance variables possibly giving evidence to the importance of nutrition at all levels. 2.) The finding that
significant relationships exist between body structure (BF, BMI) and maximal strength (BP, BS) but not power (PC) indicates alternative methods
may be better for assessing power in larger athletes.

AbstractsV – Z

NSCA National Conference & Exhibition Abstracts 51
Effects Of Resistance Training Volume And Whey Protein Supplementation On Lower-Body Strength And Muscle Cross-Sectional Area
Ashley Walter, Katherine M. Hoge, Trent J. Herda, Pablo B. Costa, Eric D. Ryan, Jeffrey R. Stout FNSCA, Joel T. Cramer FNSCA
Based on recent studies, it may be possible to use a reduced-volume resistance training program in conjunction with whey protein supplemen-
tation to achieve similar increases in strength and hypertrophy compared to traditional-volume resistance training without supplementation.
PURPOSE: To examine the effects of eight weeks of reduced-volume resistance training with whey protein supplementation versus traditional-
volume resistance training without supplementation on leg press strength (LPMAX) and thigh muscle cross-sectional area (mCSA) in college-
aged men. METHODS: Twenty-two healthy, recreationally active men (mean ± SD age: 21.5 ± 3 yrs; height: 180 ± 7.1 cm; weight: 81.6 ± 13.8 kg)
volunteered for LPMAX and mCSA testing before and after an 8-week resistance training intervention. LPMAX was determined using a standard
one-repetition maximum (1-RM) protocol on a 45° hip sled, and mCSA at mid-thigh was assessed using a peripheral quantitative computed
tomography scanner. Participants were randomly assigned to either the whey protein (WP) or control (CON) group. The CON group (n=10)
performed workouts with no supplementation 3 times per week at 80% of their LPMAX for 8 weeks, where week 1 consisted of 3 sets of 6 repeti-
tions, week 2 was 4 sets of 6 repetitions, and weeks 3 – 8 were 5 sets of 6 repetitions. The WP group (n=12) consumed a whey protein drink (20g
polyethylene glycosylated whey protein concentrate, 7g leucine, and 200mg proteases) 30 minutes before and immediately after each training
session and completed 1 set of 6 repetitions during week 1, 2 sets of 6 repetitions during week 2, and 3 sets of 6 repetitions during weeks 3 – 8.
Resistance training volume was calculated as sets × repetitions × load (kg). RESULTS: An independent-samples t-test indicated that the volume of
the CON group (mean ± SD = 144,215 ± 31,332) was 1.9 times greater than (p<0.001) the volume of the WP group (75,552 ± 17,362). The two-way
ANOVAs indicated 28% (WP) and 22% (CON) increases (p<0.001) from pre- to post-training for LPMAX, while mCSA increased (p<0.001) by 3.4%
(WP) and 4.4% (CON). However, there were no interactions (p>0.05) and no differences (p>0.05) between the WP and CON groups at either pre- or
post-training. CONCLUSIONS: These findings suggested that resistance training with 48% less volume plus whey protein supplementation for 8
weeks resulted in similar increases in leg press strength and thigh mCSA as a higher-volume resistance training program with no supplementa-
tion. PRACTICAL APPLICATIONS: These results demonstrated the general importance of nutritional strategies (i.e., protein timing) in conjunction
with resistance training for increasing muscle strength and size. These findings may be particularly useful when resistance training volume must
remain low, such as during injury rehabilitation and in-season resistance training mesocycles.
Pre-training Post-training Pre-training Post-training
Whey Protein151.3(5.6)
156.3 *(5.7)
249.1(16.5)
316.0 *(18.3)
Control155.9(5.4)
162.5 *(5.3)
269.4(18.7)
327.0 *(19.2)
Table 1. mCSA and LPMAX values for the whey protein (WP) and control (CON) groups.
Data are means (SE). * Indicates a significant (p <0.05) increase from pre- to post-training.
mCSA (cm 2 ) LPMAX (kg)
Surveying The Nutritional Habits And Behaviors Of NCAA-Division III Athletes
Courtney C. Wall, Mary Ann Coughlin, Margaret T. Jones
PURPOSE: The purpose of the current study was to assess nutritional habits and behaviors of NCAA-Division III athletes. METHODS: Varsity ath-
letes (N = 241; Males: n = 119; Females: n = 122; age: M = 19.59 + 1.21yr) completed a questionnaire designed to gather information about
nutritional habits and behaviors. Subjects ranged from the 2nd to 10th semester of their undergraduate education.
Team sport vs. individual athlete representation was:
Males – 73% team sport athletes, 27% individual sport athletes
Females – 66% team sport athletes, 34% individual sport athletes
Team sports represented were: basketball, field hockey (female), football (male), lacrosse, soccer, softball (female), and volleyball. Individual sport
athletes came from tennis and track and field.
Questionnaires were administered to athletes before or after a team lift or practice session. Differences were assessed between: 1.) males and
females, 2.) freshmen and seniors, and 3.) team and individual sports. Independent sample Mann-Whitney U and Chi Squared tests were run.
RESULTS: On average, athletes reported eating between 3-6 times per day. Approximately 49% drank 7-8 daily servings of water. Less than one
third (28%) of athletes ate a daily breakfast.
The following findings were significant (p<0.05):
Males ate more daily servings of proteins (3-4) than females (1-2), while females consumed more vegetable servings (3-4) than males (1-2).
More team sport athletes were trying to maintain or gain weight than individual sport athletes.
More females (37%) reported trying to lose weight than males (14%).
Male athletes consumed more servings of sports drinks than females.
Seniors drank more coffee than 1st year student-athletes.
Team sport athletes consumed more servings of alcohol more frequently than individual sport athletes.
Males consumed more protein supplements, while females consumed more vitamin and mineral supplements.
Vitamins and minerals (86%), protein (39%), omega-3 fish oils (10%), and creatine (8%) were the most popular supplements.
CONCLUSION: Proper diet has been found to help athletes improve physical activity and aid in recovery from exercise (1). When comparing
results to the USDA Food Guide Pyramid, it was found that collegiate football players need to consume more servings of fruits and vegetables
(2), which is similar to the present study where, on average, insufficient servings of fruits and vegetables were consumed. The present study also
presented the need for carbohydrate consumption, with only 3-4 servings being taken in throughout the day. Mullin (4) suggested eight 8-ounce
daily servings of water would be an accurate estimate for the average person to stay hydrated, with training athletes requiring more. Water loss
and dehydration during exercise was a problem for collegiate football players (2,3) and for Division III athletes, as an average of 5-6 eight ounce
servings of water were consumed daily. In the current study, 37% of athletes reported taking a dietary supplement. Similarly, Swirzinski (5) found
31% of football players were consuming supplements. Limited knowledge about supplements and ergogenic aids can lead to improper use.
PRACTICAL APPLICATION: Nutritional education is recommended for: 1.) daily food choices, 2.) weekend caloric intake, 3.) hydration techniques,
and 4.) supplement usage. Improved knowledge of coaches and availability of certified nutritionists would benefit the nutritional habits of
athletes.
The Effect Of A Competitive Collegiate Basketball Season On Recovery Cue Seven Questionnaire Scores And Drop Jump Height A Pilot Study
Michelle Van Dyke, J. McMillan, T. Buckley, R. Newcomer, B. Petty, J. Metzler, S. Rossi
Overtraining often comes about when athletes are unable to fully recover from their training demands. Overtraining affects various aspects of
an athlete’s physical and/or mental ability to perform at an optimal level. Practical and effective monitoring for overtraining needs to incorporate
both physiological and psychological measures that allow for immediate feedback for either the athlete, strength and conditioning specialist or
coach in order to keep athletes from suffering from the possible downfalls of overtraining symptoms. PURPOSE: This study examined the effect
of a competitive collegiate season on drop jump heights and recovery cue seven questionnaire scores in division 1 women’s basketball players.
METHODS: Eleven female division one collegiate basketball players (mean ± SD; age= 19.4±1.5 yr; height= 179.4±10.6 cm; weight= 81.0±10.9
kg; BMI= 25.2±3.5 kg/m2) volunteered to participate in the study. Prior to data collection, subjects signed an approved informed consent, were
instructed how to complete the recovery cue seven and practiced the drop jump technique. During conference play, players reported to the
Biomechanics lab each Wednesday following their day off from mandatory basketball workouts for five weeks. The players completed a recovery
cue seven questionnaire. Following a 3-minute warm-up on a cycle-ergometer, players performed a self-selected dynamic warm up. Following
the warm up, the investigator visually reviewed the drop jump procedure with the subjects. The subjects then performed two-drop jump tri-
als from a box height of 30 cm, onto a force plate (AMTI, Watertown, MA). Jump height was calculated by multiplying 9.81 by Flight Time2/8.
RESULTS: An ANOVA with repeated measures was used to analyze each of the seven different scales of the recovery cue seven questionnaire
along with jump height. No significant differences (p>0.01) were found between time points on the recovery cue seven questionnaire or jump
height. CONCLUSION: Although no significant differences were found with this study, future research in this area may need to consider analyzing
individual player’s results as opposed to analyzing data from the team as a whole. PRACTICAL APPLICATION: The use of a simple performance test,
such as a drop jump and the use of a short psychological assessment, such as the recovery cue seven are very practical tools that can be done on
a weekly basis to monitor athlete’s levels of fatigue and possible signs of overtraining. Coaches, athletic trainers and strength and conditioning
specialists may benefit by implementing weekly measurements of fatigue into training as a way of monitoring for possible signs of overtraining
or underrecovery.
Rate Of Velocity Development Positively Correlates With Quadriceps Cross Sectional Area
Brandon Uribe, Andy V. Khamoui, Tai Tran, Diamond Nguyen, Nicole C. Dabbs, Lee E. Brown, Jared W. Coburn, Daniel A. Judelson
PURPOSE: Although isokinetic dynamometers purport to move a limb at a constant speed, the tested limb achieves a variety of velocities through
the range of motion. To perform an isokinetic movement, the tested limb must overcome its inertia through increased torque until the limb
angular velocity equals the velocity prescribed by the isokinetic device. The rate of change of velocity over time necessary to achieve the pre-
scribed angular velocity is known as RVD. The purpose of this study was to determine the relationship between muscle cross-sectional area
(CSA) and RVD of the quadriceps in recreationally trained males during isokinetic concentric knee extension. METHODS: On two separate visits,
57 male (age 23.67 ± 2.17 years; height 178.39 ± 7.58 cm; mass 80.49 ± 15.33 kg) subjects performed three maximal concentric knee extension
repetitions of their dominant leg on an isokinetic dynamometer at 15 randomized angular velocities (30-500°·s<sup>-1</sup>). Investigators
calculated muscle cross sectional area (CSA) via the Housh equation using skinfold and circumference of the anterior thigh. A Pearson correla-
tion calculated the relationship between muscle CSA of the quadriceps and RVD. RESULTS: Muscle CSA of the quadriceps significantly (p<0.05)
correlated with RVD measures from 90°·s<sup>-1</sup> through 500°·s<sup>-1</sup> with r values increasing from 0.33 to 0.56, respectively.
However, no significant correlation existed between muscle CSA and RVD at speeds of 30°·s<sup>-1</sup> and 60°·s<sup>-1</sup>. CONCLU-
SIONS: Muscle CSA significantly correlated with RVD at the tested angular velocities between 90°·s<sup>-1</sup> through 500°·s<sup>-1</
sup> with an increasing trend. Consequently, increased muscle quantity may lead to increased RVD during an isokinetic knee extension exercise.
Therefore, training at high velocities and with sufficient loads to induce muscle hypertrophy might improve performance during high velocity
dynamic movements. PRACTICAL APPLICATIONS: Training designed to increase muscle CSA might increase RVD during isokinetic knee extension
movements. Increasing RVD (and therefore reducing time to achieve a desired velocity) might represent a desirable adaptation for any dynamic
movement.

NSCA National Conference & Exhibition Abstracts 52
Muscle Vibration’s Effect On The Threshold Frequency Of An Electrically Induced Muscle Cramp
Joshua D. Williamson, James E. Leone, Jeffrey Edwards, Marcus B. Stone, Timothy J. Demchak
Purpose: The purpose of this study was to evaluate the effect of muscle vibration on the threshold frequency of an electrically-induced muscle
cramp of the flexor hallucis brevis. Methods: This study used a 2 x 2 factorial study design. The independent variables consisted of treatment
(control and vibration) and time (pre-test and post-test). The dependent variable was the threshold frequency of an electrically induced muscle
cramp. We tested 16 healthy individuals, (21.6 ± 8.0 years), free from any lower extremity neurological, muscular, or vascular pathology. Subjects
reported on three consecutive days for testing. Day 1 consisted of an introductory session in which a cramp was induced in the flexor hallucis
brevis. Days 2 and 3 were random assignment of treatment order in which the subject had a cramp induced followed by a rest and control session
on one day and a rest and vibration session on the other day. Each treatment was followed by another cramp induction. Measurements were
taken of EMG data that was collected pre-treatment, treatment, and post-treatment. Threshold frequency to cramp was recorded pre-treatment
and post-treatment. Cramp was determined by subject report, great toe flexion, and EMG data. Results: A 2 x 2 fully repeated ANOVA showed
no condition by test interaction; treatment (F1,15 = 0.190, P = 0.669, 1-β = 0.069), test (F1,15 = 0.080, P = 0.669781, 1-β = 0.058), and treatment
by test (F1,15 = 0.364, P = 0.555, 1-β = 0.087). Conclusions: This study did not show a difference between the threshold frequency of the control
session and the vibration session for the parameters used. Practical Applications: This study is novel because it is the first study conducted in
which vibration’s effects on muscle spindles was used to simulate one component of neuromuscular fatigue with respect to cramp. Understand-
ing how to attenuate cramp response can assist the strength and conditioning professional in tailoring programs to reduce the risk of muscle
injury while enhancing performance. Further research should be conducted in this area accounting for the limitations of this study by adjusting
the present test parameters.
Comparison Of Body Composition Assessment Techniques In A Non-Athletic, Non-Obese Young Adult Population
Ronald D. Williams, Jr., Jeremy T. Barnes, Thomas J. Pujol
PURPOSE: The purpose of this study was to examine the reliability of six different body composition measurement methods for use among non-
athletic, non-obese young adults.
METHODS: Criterion body composition was measured using DEXA (Lunar Prodigy Advance). Five different bioelectrical impedance analysis
(BIA) instruments and the Jackson-Pollock three-site skinfold measurement were used to compare body composition. The five BIA instruments
were the Tanita BF-350, Tanita BF-522, Omron HBF-500, Omron HBF-306, and Omron HBF-300. Subjects of the study were 17 non-obese college
students including both males (n=9) and females (n=8).
RESULTS: Mean (+ SD) subject characteristics were age 22.53 (+2.83) yrs, height 1.75 (+0.13) m, weight 76.67 (+18.95) kg, and body mass index
(BMI) 24.71 (+3.35) kg/m2. The percent body fat results were as follows: Tanita BF-350 = 23.46 + 9.45, Tanita BF-522 = 23.40 + 9.58, Omron HBF-
500 = 26.66 + 11.15, Omron HBF-306 = 19.84 + 9.70, Omron HBF-300 = 19.20 + 9.71, skinfolds = 22.52 + 11.26, and DEXA = 26.19 + 12.51. Data
were analyzed using repeated measures analysis of variance (ANOVA) and post-hoc paired sample t-tests. A significant F (F = 85.654, p < .001)
was found for the seven different measures of body composition. Post-hoc tests showed no significant differences between the Tanita models
(p=.830); however a significant difference was found between Tanita models and DEXA (Tanita BF-350 p=.037; Tanita BF-522 p=.021). The Omron
HBF-300 and 306 were significantly (p < .001) different than the DEXA. However, there was no significant difference in the Omron HBF-500 and
the DEXA (p=.609). There were significant (p < .001) differences between the Omron HBF-500 and the other two Omron models.
CONCLUSIONS: Results of this study suggest that for non-athletic, non-obese young adults, the Omron HBF-500 may provide a valid assessment
of body composition in non-laboratory settings. However, the other four models all significantly underestimate percent body fat. Considering the
inherent possibilities of skinfold inaccuracy, this method may also produce inaccurate estimates of body composition.
PRACTICAL APPLCATIONS: Personal trainers, fitness specialists, and other strength and conditioning professionals who utilize BIA instruments
for measurements of body mass index should be aware of the possibility of inaccurate measurements. In this population, the Omron HBF-500
provides the most appropriate measure of BMI when compared to DEXA measurements.
Comparative Force Outputs From Non-Centered Accelerometers During Loaded Barbell Jump Squats
Lawrence Weiss, Lucas Ferreira, Brian Schilling, Kelley Hammond, John Trepanowski, Doug Landrum, Marvin Grindle
The direct acquisition of ground reaction force data during isoinertial resistance tasks typically requires a force platform. As this is not always practical, alternative devices have
been used to estimate dynamic force by directly measuring other variables and then using inverse dynamics to calculate it. For example, linear position and linear velocity
transducers have been tethered to bars and used for this purpose. Recently, a dynamometer incorporating an accelerometer and no tether became available for this applica-
tion. However, since barbell equipment inherently allows for asymmetrical movement through multiple planes, it follows that force output may differ depending upon bar
orientation, especially deviations from horizontal. Furthermore, differences related to dynamometer placement and/or variations in the lifting movement pattern could be
problematic if training-induced changes are to be monitored. PURPOSE: To determine if peak force differed during barbell jump squats using non-centered accelerometer
placements. METHODS: 52 subjects (27 women & 25 men) with squat training experience were recruited from a university population. Subjects performed duplicate load-
spectrum countermovement jump squats (CMJ) and static jump squats (SJ) (20%, 30% & 40% of their back squat 1RM) on two separate days in a counterbalanced sequence.
A triaxial accelerometer device was directly affixed to each end of the barbell midway between the lateral-most aspect of the shoulder and the thumb side of each hand.
Acceleration data were downsampled from 1.5 KHz to 500Hz by averaging every 3 data points. These data were then low-pass filtered (4th order Butterworth) with a cutoff
frequency of 10Hz via proprietary software. Force was determined via inverse dynamics with mass considered the sum of body and barbell weights. Peak force data from the
two dynamometers were always obtained from the same trial. Paired t-tests were used for data analysis. RESULTS: Dynamometers provided similar peak force values for both
CMJ and SJ at 20% and 40% 1RM loads (p > .05) and different values at the 30% 1RM load (p < .01). Mean differences (20, 30, & 40%, respectively) for the CMJ were 9.8N, 15.1N,
8.1N and for the SJ were -1.5N, 15.4N, 5.9N (Table 1). CONCLUSION: For relatively light countermovement and static jump squats, dynamometer placement on both ends of
barbell may result in differential peak force output. PRACTICAL APPLICATIONS: It appears that accelerometer placement during jump squats should either be as close as
possible to the center of the bar or a squat machine with a horizontally-fixed bar should be used. Although not tested herein, it is likely that linear position and linear velocity
transducers would have the identical constraints. As contiguous accelerometer placement was not tried herein, it is unclear what, if any, contribution the dynamometers
made to measurement error.
Table 1. Peak force values (newtons) for load-spectrum jump squats.
Mean N SD t-ratio 2-tailed Sig.
*A1 PkF CMJ 20% 1,979.9 96 413.641.155 .251
A2 PkF CMJ 20% 1,970.1 96 409.55
A1 PkF CMJ 30% 2,008.2 93 407.585.544 .000
A2 PkF CMJ 30% 1,993.1 93 406.93
A1 PkF CMJ 40% 2,064.6 100 445.401.578 .118
A2 PkF CMJ 40% 2,056.5 100 445.21
A1 PkF SJ 20% 1,871.1 93 414.22-.100 .921
A2 PkF SJ 20% 1,872.6 93 417.67
A1 PkF SJ 30% 1,923.4 98 439.273.845 .000
A2 PkF SJ 30% 1,908.0 98 436.21
A1 PkF SJ 40% 2,000.0 98 436.091.328 .187
A2 PkF SJ 40% 1,994.1 98 437.70
*A1 & A2 = accelerometers 1 & 2, respectively
The Ergogenic Effects Of Carbohydrate Supplementation On Force Output And Slope Of Fatigue During A Selected Resistance Protocol
Ben Wax, Steve Kinzey, Brian Lyons and Stan Brown
The ergogenic effects of carbohydrate ingestion prior to and during resistance training has yielded mixed results over the years. A number of
investigations have attempted to determine the ergogenic effects of carbohydrate supplementations utilizing squats or some type of circuit
style of resistance training. Past These investigations measured performance in terms of a specific number of repetitions successfully performed,
which failed to account for central fatigue factors related to the specific exercise chosen. Few investigations have measured the relationship
between carbohydrate supplementation ingestion and force output during periods of voluntary and stimulated contractions. PURPOSE: To
determine the ergogenic effects of carbohydrate ingestion supplementation on force output during a selected resistance protocol. METHODS: 6
male subjects with a minimum of 3 years of bodybuilding and/or power lifting backgrounds training performed one mock trial and two randomly
assigned exercise trials one week apart, in which the experimental treatment, glucose polymer (GP) and placebo (P), were randomly assigned and
administered in a double blind fashion. The subjects were seated with the knee at an angle slightly less than 900 by a horizontal strap securely
anchored just above the malleoli and attached at the other end to the a strain gauge. Subjects were strapped at the waist to maintain muscle
length and prevent substantial use of hip extensors. The subjects ingested either a 10% GP solution (0.1gkg-1 body mass) or P 5 minutes
before performing a maximal voluntary contraction with their perceived dominant leg to determine force output. Following another 5 minute
rest and thereafter at 6 minute intervals a GP (0.17gkg-1 body mass) or P solution was ingested during the protocol. The protocol consisted
of one leg isometric contractions at 50% of their previously determined one repetition maximum for 20 seconds, followed by 40 seconds of rest
between contractions, until failure occurred. Failure was defined as the inability to sustain target force for 5 consecutive seconds. The decrease
in force generating capacity was tested from brief maximal voluntary contractions (MVC’s) and short bursts of 60 Hz stimulation applied at 5
minute intervals. Force was measured using a Transducer Techniques 300 pound strain gauge type load cell, which sent a signal to an amplifier
through a fixed wire. Once the signal was amplified it was transferred to a desktop computer for interpretation. Sampling was recorded at 1000
Hz. RESULTS: A paired sample T-test revealed performance measured in time to exhaustion (29 ± 13.08 minutes for GP and 16 ± 8.12 for P), total
force production (492.92 ± 192.42 kilograms for GP and 306.62 ± 130.07 kilograms for P), and slope of fatigue (-.0594 ± -.0299 for GP and -.0300 ±
-.0109 for P) were significantly different in the GP than Pbetween treatments (p < .05). CONCLUSIONS: The results suggest GP ingestion prior to
and during selected resistance protocols increase time to exhaustion, total force production and slope of fatigue in well trained lifters. PRATICAL
APPLICATION: In conclusion, the ingestion of a liquid carbohydrate supplement prior to and intermittently during selected resistance protocols
appears to provide an ergogenic effect that is reflected by increased force production and delayed time to fatigue.
NSCA National Conference & Exhibition Abstracts 53
Relationships Between Reactive Leg Strength Index And Average Running Velocity During 5000M Race For Long Distance Runner
Takeshi Yamauchi, Hiroshi Hasegawa, Toshihiro Shibutani, Tetsuji Adachi, Kiichi Sugiyama, Nanki Nakashima, Michirou Itou, Dai Susa
PURPOSE: Some researches have observed that explosive-strength training or plyometric training enhance running economy in highly trained
long distance runners. Plyometric training may increase muscle stiffness and reduce time of stretch-shortening cycle and improve running econ-
omy in long distance running. Plyometric training generally improves explosive power, which is frequently assessed on the basis of the reactive
leg strength index (RLS index). The purpose of this study was to investigate the relationships between the RLS index and the average running
velocity during 5000m race (Av5000m) for long distance runners, and get useful information to help improve traditional methods in Japan,
where most long distance runners do not use explosive-strength training. METHODS: Well-trained college-level distance runners and healthy
recreational distance runners were categorized into 4 major group; CM: 18 college-level male runners (age=21.1±1.9years, height=171.3±5.1cm,
mass=58.2±4.2kg mean±SD), CF: 9 college-level female distance runners (19.2±1.0years, 158.3±4.3cm, 47.7±5.1kg), RM: 13 recreational male
runners (46.2±8.3years, 168.2±7.7cm, 61.1±7.1kg), RF: 12 recreational female runners (39.4±5.6years, 157.6±4.6cm, 47.9±4.1kg). The RLS index
was assessed though a counter-movement-jump test using FiTRO jumper (Slovakia). The subjects were instructed to jump for maximal height
and minimum ground contact time. The RLS index was calculated using the jump height-ground contact time ratio (Jh/Ct). The relationship be-
tween the RLS index and Av5000m was analyzed for the four groups through ANOVA. In the event of a significant F ratio, a multiple comparison
procedure (Tukey test) was employed. RESULTS: Av5000m for CM, CF, RM and RF was 320.5 ±12.2, 281.7 ±5.2, 232.2 ±23.4 and 206.2 ±6.4 m/
min, respectively. Ct was 0.161 ±0.009, 0.179 ±0.011, 0.170 ±0.015 and 0.175 ±0.013 seconds, respectively. Jh was 32.1 ±3.4, 26.8 ±2.9, 23.7 ±2.3
and 21.4 ±2.4 cm, respectively. The RLS index was 200.3 ±25.8, 150.5 ± 17.6, 122.6 ±16.9 and 121.1 ±24.3, respectively. Av5000m was CM > CF
> RM > RF, the RLS index was CM > CF, RM, RF, and Jh was CM > CF, RM, RF. No significant difference could be observed in Ct between the four
groups. Av5000m and Jh correlate strongly for CM (r = 0.686, p < 0.01) and RM (r = 0.765, p < 0.01), and correlate less strongly for CF (r = 0.795, p
< 0.05) and RF (r = 0.689, p < 0.05). Av5000m and the RLS index strongly correlate for CM (r = 0.741, p < 0.01), and correlate less strongly for CF
(r = 0.790, p < 0.05). There was no significant correlation for RM and RF. There was also no significant correlation between Av5000m and Ct for
the four groups. CONCLUSION AND PRACTICAL APPLICATION: The results show that Jh and the RLS index relate to Av5000m for long-distance
runners. Jh has particularly strong effects on Av5000m. Ct does not relate to Av5000m. Both Jh and RLS appear to be useful for evaluating
long-distance running ability, while Ct appears not to be important. Further work will be required to evaluate the significance of explosive-
strength training in long-distance training.
The Relationship Between Isometric And Dynamic Strength In College Aged Males
Jason Winchester, Michael R. McGuigan, Arnold G. Nelson, and Mike Newton
The purpose of this investigation was to examine the relationships between measures of maximal isometric force (PF), rate of force development
(RFD), vertical jump performance (VJ) and one repetition maximum (1RM) strength in recreationally trained men. The subjects in this study were
26 men ((mean ± SD): age 22 ± 1 years; height 175 ± 7 cm; mass 90 ± 10 kg). They were tested for PF using the isometric mid thigh pull exercise.
The 1RM for the squat and bench press exercise were determined as a measure of dynamic strength. Explosive strength was measured as RFD
from the isometric force-time curve. Correlations between the variables were calculated using Pearson product moment correlation coefficient.
There was a nearly perfect correlation between measures of PF and 1RM squat (r = 0.97, p<0.05) and 1RM bench press (r = 0.99, p<0.05). The
correlations were very strong between VJ and PF (r = 0.72, p<0.05) and 1RM bench press (r = 0.70, p<0.05). There were also strong correlations
between VJ and 1RM squat (r = 0.69, p<0.05). There were no significant correlations with RFD. The results showed that isometric maximum
strength determined during the isometric mid thigh pull test correlated well with 1RM and VJ testing. However, RFD measured during the same
test did not appear to correlate as well with other measures. The isometric mid thigh pull provides an efficient method for assessing strength in
recreationally trained individuals. Practioners wishing to obtain performance data related to maximum strength may wish to consider isometric
testing as a less time intensive method of testing.
Trimps For Forwards And Defensemen During Ice Hockey Games On Different Sized Rinks On Consecutive Days
Robert Wilson, Ann C. Snyder, Jacob T. Malzahn
The scientific understanding of the physiological load during practices and competitions is quite limited. While sports coaches may be able to
assess the stresses and cumulative fatigue of their players, these perceptions can be biased and inaccurate. Therefore, a need exists to develop
a method of determining acute and cumulative loads throughout a sports season. The Training Impulse (TRIMP) method was devised for this
purpose and has been recently revised by Stagno, et, al. (2007) for use with team sports. PURPOSE: To compare TRIMP values for forwards and
defensemen during ice hockey games on different sized rinks on consecutive days using the new team-based TRIMP formula. Our hypothesis was
that TRIMP scores would be greater for the game on the larger ice surface as more area must be covered. METHODS: The six participants (mean
age: 15.7 + 0.5 years) were forwards and defensemen playing on a regionally elite male ice hockey team. Heart rates were collected by a heart rate
system that records and saves the data within a chest strap. Two games played on consecutive days (on the 19th week of a 29 week season) on
different sized ice rinks were monitored. Game 1 (G1) was played on a rink that measured 200 x 85 feet, while the rink for Game 2 (G2) measured
200 x 100 feet. Each game began with a twenty minute on-ice warm-up. During G1 the ice was resurfaced between all periods. During G2, a short
break was taken between the 1st and 2nd periods and the ice was resurfaced between the 2nd and 3rd periods. The TRIMPs were calculated for
warm-ups, resurfacing times and playing time. Data is presented for the total time period (from the warm-up to the end of the game) and for the
game period (only while the game was in progress). RESULTS: Data are presented in table below:
Game Total TRIMP Time (minutes) TRIMP/min
G1 – Total time 288.6 + 59.6 132.67 2.2 + 0.5
G1 –Game 223.1 + 38.5 73.0 3.1 + 0.5
G2 – Total time 222.4 + 45.0 130.0 1.4 + 0.3
G2 – Game 213.0 + 50.0 97.0 2.2 + 0.5
DISCUSSION: Our research hypothesis was based on the logic that playing on a larger ice surface would lead to greater TRIMPs. This was not found
to be true. G1 produced greater TRIMPs and greater TRIMPs per minute than G2 even though the second game was on the larger ice surface.
TRIMP values for G2 may have been lower as it was the second game within a 24 hour period. While the athletes are used to playing two or three
games during a two-day weekend, the second game may have lower TRIMP values due to fatigue. Thus fatigue may influence TRIMPs more than
rink size. Further analyses of other game weekends may indicate a trend. PRACTICAL APPLICATIONS: As there is now a heart rate monitoring
system that will capture data without the need for an external data capturing module, it is now more feasible to obtain heart rate data from
team sports such as hockey and soccer. Since the revised TRIMP formula only requires heart rate data, it can now be used by coaches to track
physiological loads during practice sessions and competitions. For coaches and trainers that are concerned about unintended overreaching/
overtraining, this method may be a beneficial component to add to their tracking system.
Comparison Of The Us Army Tape Test To Skin Fold And Underwater Weighing Measures Of Body Composition
Chris C. Wilson, C.J. Harp, Alexander J. Koch
Purpose: The United States Army has recently modified its measuring tape test to determine the percent body fat for soldiers who surpass their
training weight. This study was conducted to determine the correlations amongst the new US Army tape test (USATT), a seven-site skin fold test
using the Jackson-Pollock equation to estimate body density (JP7), and underwater weighing (UW) in both subjects who were within and above
the army’s recommended training weight. Methods: Twenty-two college age subjects (17 men and 5 women) between the ages of 18–22 were
recruited through convenience sampling. Each subject’s height and weight was recorded and then they were assessed with the USATT, JP7, and
UW in that order. Results: All three tests showed significant, though moderate, correlations (r = 0.647-0.734, p ≤ 0.01) to one another when all
subjects were tested. The USATT and JP7 had the strongest correlation (r= 0.0734) between them. Both the JP7 and the USATT had almost identi-
cal correlations with UW (r=0.6475 and r=0.6472, respectively). Among subjects who were within the recommended training weight standards
(n=14) significant correlations (p ≤ 0.01) were found between USATT and JP7 (r= 0.842), skin fold and UW (r=0.706), and tape and UW (r=0.718).
However, among the subjects who were over their regulated Army weight (n=8), no significant correlations (p>0.05) were found between any
of the tests. Conclusion: For the general population, the USATT correlates moderately well to other estimations of percent body fat. However,
the strength of these relationships is diminished when the tape test is administered to subjects who are above their training weight. Practical
Application: In practice, the USATT is only administered to soldiers who surpass their training body mass. From these preliminary data, it appears
that the USATT correlates poorly to other measures of percent fat in this population, and thus is not a suitable test for which it was designed.

NSCA National Conference & Exhibition Abstracts 54
Gender Comparisons Of Anthropometric Characteristics Of Young Sprint Swimmers
Jorge Zuniga, Terry J. Housh, FNSCA, Clayton L. Camic, Michelle Mielke, C. Russell Hendrix, Glen O. Johnson, Richard J. Schmidt, and Dona J. Housh
PURPOSE: Physical and anthropometric characteristics have been associated with differences between levels of swimming performance, swim-
ming events, training status, gender, and age. It has been suggested that the greater body fatness observed in girl swimmers than boy swimmers
could explain the gender differences in performance. Few studies, however, have examined gender differences in the physical and anthropomet-
ric characteristics of young swimmers. PURPOSE: The purpose of this study was to compare the body composition, body build, and anthropomet-
ric characteristics of boy and girl sprint swimmers. METHODS: Two groups (boys, n = 38 and girls, n = 31) of sprint swimmers (mean age ± SD =
11.03 ± 2.29 and 10.45 ± 2.29, years, respectively) volunteered for this study. The subjects were members of local swimming clubs who competed
in sprint swimming events (≤ 200 m). Gender comparisons were made for age, body weight (BW), height (HT), fat-free weight (FFW), percent
body fat (%fat), endomorphic rating, mesomorphic rating, ectomorphic rating, sum of 12 diameters, sum of 11circumferences, biacromial diam-
eter/biiliac diameter, and FFW/HT. RESULTS: The results of the independent t-tests indicated that the only mean differences between the boy and
girl sprint swimmers were for % fat (boys = 9.40 ± 5.35 % fat; girls = 12.73 ± 6.19 % fat) and endomorphic rating (boys = 2.87 ± 0.96; girls = 4.29 ±
1.22). CONCLUSIONS: For the current age group of sprint swimmers, the only gender differences were for measures associated with body fatness
and there were no differences for body build measures associated with musculoskeletal size, muscularity, skeletal size, total body mass, or body
breadth dimensions. Further studies are needed to examine gender differences in the body composition and body build of distance swimmers,
older sprint and distance swimmers, and athletes in sports other than swimming. PRACTICAL APPLICATIONS: These findings suggest that gender
differences in sprint swimming performance may be reduced through training programs for girls designed to reduce body fatness.