South African Maize Crop
140
South African Maize Crop Quality Report 2016/2017 Season
-
Upload
khangminh22 -
Category
Documents
-
view
1 -
download
0
Transcript of South African Maize Crop

South African Maize Crop
Quality Report 2016/2017 Season

Page
Introduction 1 - 2
Provincial contribution to the production of the 2016/2017 crop (Graph 1) 1
Production 3 - 6
Maize production in RSA from the 2006/2007 to 2016/2017 seasons (Graph 2) 3
Total RSA area utilized for maize production from the 2006/2007 to 2016/2017 seasons (Graph 3) 3 RSA maize yield from the 2006/2007 to 2016/2017 seasons (Graph 4) 4
Maize production overview, dryland vs irrigation in the 2016/2017 season (Table 1) 4
Area utilized for maize production per province over three seasons (Graph 5) 5
Maize production per province over three seasons (Graph 6) 5 Maize yield per province over three seasons (Graph 7) 5
Area utilized for maize production in the Free State, Mpumalanga and North West since 2006/2007 6(Graphs 8, 10 and 12)
Maize production in the Free State, Mpumalanga and North West since 2006/2007 (Graphs 9, 11 and 13) 6
Supply and Demand 7 Maize supply and demand overview 2016/2017 marketing season (Graph 14) 7
Maize supply and demand overview 2017/2018 marketing season (Graph 15) 7 SAGIS Total Maize Supply and Demand Figures 8
Total Maize: Supply and demand graphs over 10 marketing seasons (Graphs 16 - 19) 9
SAGIS White Maize Supply and Demand Figures 10
White Maize: Supply and demand graphs over 10 marketing seasons (Graphs 20 - 23) 11
SAGIS Yellow Maize Supply and Demand Figures 12
Yellow Maize: Supply and demand graphs over 10 marketing seasons (Graphs 24 - 27) 13
SAGIS White Maize Exports/Imports figures per country and harbour 2017/2018 marketing season 14
Major destinations for RSA white maize exports 2017/2018 season (Graph 28) 14 SAGIS Yellow Maize Exports/Imports figures per country and harbour 2017/2018 marketing season 15
Major destinations for RSA yellow maize exports 2017/2018 season (Graph 29) 15
SAGIS Maize Product Information 16
White and yellow maize products manufactured from May 2017 to March 2018 (Graphs 30 – 33) 16
SAGIS Maize Products Manufactured per Marketing Year 17
Index
SAGIS Maize Products Imported per Marketing Year 18
SAGIS Maize Products Exported per Marketing Year 19
Maize Crop Quality 2016/2017 - summary of results 20 - 21
Summary of RSA maize quality 2016/2017 season (weighted averages) (Table 2) 22
RSA Production Regions 23
RSA Provinces (Figure 1) 23
RSA Crop Production Regions (Figure 2) 24
List of grain production regions with silo/intake stands and type of storage structure 25 - 28 Main maize producing provinces – comparison of results 29
RSA grading of white maize according to grade (Table 3) 30 – 32
RSA grading of white maize (Table 4) 33
RSA grading of yellow maize according to grade (Table 5) 34 - 36
RSA grading of yellow maize (Table 6) 37
Grading quality over 10 seasons (Table 7) 38 Percentage Defective kernels and Combined deviations over 10 seasons (Graphs 34 - 36) 39
USA grading of white maize according to grade (Table 8) 40 - 42
USA grading of yellow maize according to grade (Table 9) 43 - 44
RSA and USA Grading Regulations (Tables 10 and 11) 45 Physical quality of white maize according to grade (Table 12) 46 - 48
Physical quality factors of white maize (Table 13) 49
Physical quality of yellow maize according to grade (Table 14) 50 - 52
Physical quality factors of yellow maize (Table 15) 53
Physical quality factors over 10 seasons (Table 16) 54
Test weight (kg/hl) over 10 seasons (Graph 37) 54
100 Kernel mass and kernel size over 10 seasons (Graphs 38 - 40) 55
Roff milling and whiteness index of white maize according to grade (Table 17) 56 - 58 Roff milling and whiteness index of white maize (Table 18) 59
Nutritional values of white (Table 19) and yellow maize (Table 20) according to grade 60 - 62
Nutritional values of white and yellow maize (Table 21) 63 - 64
Nutritional values over 10 seasons (Table 22) 65
Fat, protein and starch content over 10 seasons (Graphs 41 - 43) 66

Presence of Genetically Modified Maize (Table 23) 67
Mycotoxin results discussion (Graphs 44 – 56) 68 – 73
National Mycotoxin Regulations 74
International Mycotoxin Regulations (Foods and Feeds) 75 – 78
Mycotoxin results for the 2016/2017 season (Table 24) 79 - 90
Mycotoxin results summary from 2005/2006 to 2016/2017 (Table 25) 91
Methods 92 – 96
SANAS Certificate and Schedule of Accreditation 97 - 100
International and National proficiency testing certificates 101
South African Weather Service – Seasonal Climate Watch May to September 2018 102 - 119
South African Weather Service – Average Monthly Rainfall graphs for the Free State, Mpumalanga 120 - 123and North West provinces
Grading Regulations for Maize, Government Notice No. R.473 of 8 May 2009 124 - 132
Industry-wide Dispensation REF NO: 20/4/14/1 of 15 April 2010 133 - 134
Compiled and issued by:
The Southern African Grain Laboratory NPC
Grain Building - Agri-Hub Office477 Witherite Road
The WillowsPretoria
SOUTH AFRICA
PostNet Suite # 391Private Bag X 1
The Willows
0041
Tel: +27 (12) 807 4019Fax: +27(12) 807 4160E-mail: [email protected]: www.sagl.co.za

South African Maize Crop Quality Report 2016/2017 Season
1
Acknowledgments
With gratitude to:
• The Maize Trust for financial support in conducting this survey.• Agbiz Grain and its members for providing the samples to make this survey possible.• The Crop Estimates Committee (CEC) of the Department of Agriculture, Forestry and Fisheries for providing
production related figures.• South African Grain Information Service (SAGIS) for providing supply and demand figures relating to maize
and maize products.• The Bureau for Food and Agricultural Policy (BFAP) for providing research based market analysis.
• South African Weather Service for providing seasonal climate watch and rainfall information.
Introduction
During the harvesting season (April to August 2017), a representative sample of each delivery of maize at the various silos was taken according to the prescribed grading regulation. The sampling procedure for the samples used in this survey is described on page 92. A total of 1 000 composite samples, representing white and yellow maize of each production region, were received and analysed for quality. The samples consisted of 549 white and 451 yellow maize samples.
The quality attributes which were tested for, include: 1. RSA grading: All samples were graded according to the following factors, as defined in the South African
grading regulation: defective kernels above and below the 6.35 mm sieve, total defective kernels, foreign matter, other colour kernels, combined deviations and pinked kernels.
2. USA grading according to regulation on all samples to determine the following factors: Test weight per bushel (pounds), heat damaged kernels, total damaged kernels, broken corn and foreign matter (BCFM) and other colour.
3. Nutritional values (on all samples): Moisture, crude protein, crude fat and starch. 4. Physical Quality factors (on all samples): Test weight (kg/hl), 100 kernel mass, kernel size, breakage
susceptibility, stress cracks, milling index and grit yield all. 5. All white maize samples were milled on the Roff laboratory mill and the whiteness index of the maize
meal determined.
Western Cape and Eastern Cape
1%Northern Cape
4%
Free State44%
KwaZulu-Natal4%
Mpumalanga20%
Limpopo3%
Gauteng5%
North West19%
Graph 1: Contribution of the nine provinces to the 2016/2017 maize crop
production
Figures provided by the CEC.
South AfricanCOMMERCIAL MAIZE QUALITY 2016/2017

South African Maize Crop Quality Report 2016/2017 Season
2
Mycotoxin analyses were performed on 350 samples representative of white and yellow maize produced per region.
Testing for the presence of Genetically Modified (GM) maize were performed on 100 samples representative of white and yellow maize produced per region.
Please refer to pages 92 - 96 for the methodologies followed.
The maize crop quality survey is performed annually by the Southern African Grain Laboratory NPC (SAGL). SAGL was established in 1997 on request of the Grain Industry. SAGL is an ISO 17025 accredited testing laboratory and participates in a number of proficiency testing schemes, both nationally and internationally, as part of our ongoing quality assurance procedures to demonstrate technical competency and international comparability.
The results of this, as well as previous surveys are available on the SAGL website (www.sagl.co.za). Hard copy reports are distributed to all stakeholders and interested parties. The report is also available for download in a PDF format from the website.
In addition to the quality information, production figures (obtained from the Crop Estimates Committee (CEC)) relating to hectares planted, tons produced and yields obtained on a national as well as provincial basis, over an eleven season period, are provided in this report. SAGIS (South African Grain Information Service) supply and demand figures over several years are provided in table and graph format, as is import and export data. Information on the manufacture, import and export of maize products is also included in this report. The national grading regulations as published in the Government Gazette of 8 May 2009, are provided (pages 124 to 134), as is seasonal climate watch data from the South African Weather Service.
The goal of this crop quality survey is to accumulate quality data on the commercial maize crop on a national level. This valuable data reveals general tendencies, highlight quality differences in the commercial maize produced in different local production regions and provide important information on the quality of commercial maize intended for export. During seasons when maize is imported for domestic use, the quality of the imported maize can also be compared to that of locally produced maize.
The Maize Trust investment in the annual Crop Quality Surveys, has created a unique and extremely useful database of crop quality measurements over several seasons and regions. Up to now, the data has only been presented in table and graph format and has never been used for trend analyses or to assist in the development of prediction models such as the Milling Index Model.
In order to address this issue, SAGL undertook a data mining project, titled “Data Mining of past eleven years’ Milling Index and Crop Survey Results”, funded by the Maize Trust. A complete statistical analysis of the maize quality data from the 2001/2002 to 2011/2012 seasons were performed for the following measurements: Protein (crude), starch, fat (crude), hectolitre mass, 100 kernel mass, total deviations (grading data), Roff Milling Index, Break 1 flour yield, Break 2 flour yield, Break 3 flour yield, Grits yield and Bran yield (all Roff milling data). Data is added annually to this data set.
As part of the project, the possibility of developing a Geographic Information System (GIS) map system, where grain production regions (with the boundaries illustrated) are presented on a map of South Africa, was explored. SIQ (with additional data from Agbiz Grain on the regional boundary specifications) created a software package based on an open source GIS package (QGIS). These GIS maps show mean values for a trait for a specific region as an average for all seasons combined or as individual seasons on a year to year basis. The results of the crop quality traits are represented in a colour scale format – highest to lowest values are indicated by the darkest to the lightest colour. Mean values are showed as a legend. This GIS tool provides a good starting point but will however require further optimization in future.
The project outcome provides a decision-making tool to the maize industry stakeholders to assist in the identification of potential problem areas in maize quality and to focus future research activities.
South African Maize Crop Quality Report 2016/2017 Season
3
0
1 000 000
2 000 000
3 000 000
4 000 000
2006
/07
2007
/08
2008
/09
2009
/10
2010
/11
2011
/12
2012
/13
2013
/14
2014
/15
2015
/16
2016
/17
Ha
Season
WhiteYellowTotal
2 000 000
4 000 000
6 000 000
8 000 000
10 000 000
12 000 000
14 000 000
16 000 000
18 000 000
2006
/07
2007
/08
2008
/09
2009
/10
2010
/11
2011
/12
2012
/13
2013
/14
2014
/15
2015
/16
2016
/17
Tons
Season
WhiteYellowTotal
Graph 3: Total RSA area utilized for maize production from 2006/2007 to 2016/2017
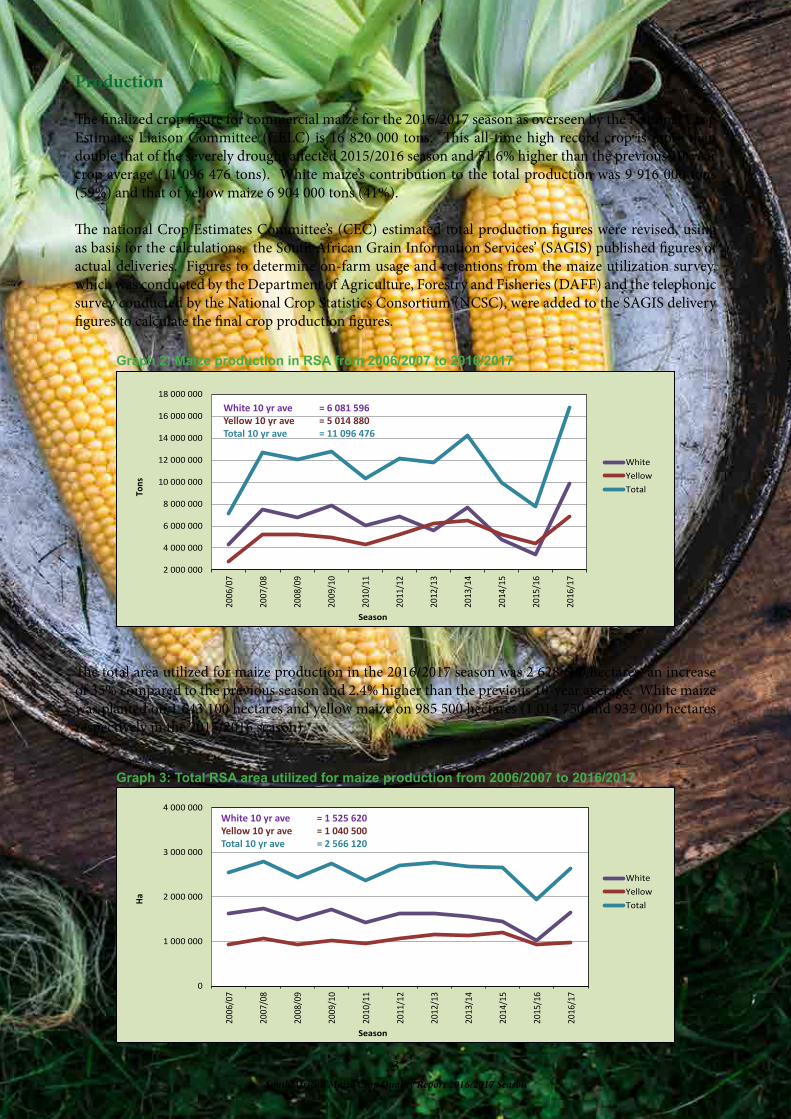
Graph 2: Maize production in RSA from 2006/2007 to 2016/2017
The total area utilized for maize production in the 2016/2017 season was 2 628 600 hectares, an increase of 35% compared to the previous season and 2.4% higher than the previous 10-year average. White maize was planted on 1 643 100 hectares and yellow maize on 985 500 hectares (1 014 750 and 932 000 hectares respectively in the 2015/2016 season).
Production
The finalized crop figure for commercial maize for the 2016/2017 season as overseen by the National Crop Estimates Liaison Committee (CELC) is 16 820 000 tons. This all-time high record crop is more than double that of the severely drought affected 2015/2016 season and 51.6% higher than the previous 10-year crop average (11 096 476 tons). White maize’s contribution to the total production was 9 916 000 tons (59%) and that of yellow maize 6 904 000 tons (41%).
The national Crop Estimates Committee’s (CEC) estimated total production figures were revised, using as basis for the calculations, the South African Grain Information Services’ (SAGIS) published figures of actual deliveries. Figures to determine on-farm usage and retentions from the maize utilization survey, which was conducted by the Department of Agriculture, Forestry and Fisheries (DAFF) and the telephonic survey conducted by the National Crop Statistics Consortium (NCSC), were added to the SAGIS delivery figures to calculate the final crop production figures.
White 10 yr ave = 1 525 620
Yellow 10 yr ave = 1 040 500
Total 10 yr ave = 2 566 120
White 10 yr ave = 6 081 596
Yellow 10 yr ave = 5 014 880
Total 10 yr ave = 11 096 476

South African Maize Crop Quality Report 2016/2017 Season
4
2.00
3.00
4.00
5.00
6.00
7.00
8.00
2006
/07
2007
/08
2008
/09
2009
/10
2010
/11
2011
/12
2012
/13
2013
/14
2014
/15
2015
/216
2016
/17
t/ha
Season
WhiteYellowTotal
Graph 4: RSA Maize yield from 2006/2007 to 2016/2017
As with commercial maize production, both the area planted as well as the crop size of maize planted in the non-commercial agricultural sector increased compared to the previous season. The expected maize crop for this sector is 731 000 tons. Approximately 64% of non-commercial maize is produced in the Eastern Cape.
The maize yield also reached an all-time high of 6.40 t/ha this season compared to the 4.00 t/ha in the previous season and a 4.31 t/ha 10-year average. White maize yielded 6.03 t/ha and yellow maize 7.01 t/ha.
Province Type of production
White Yellow
Hectares
planted,
ha
Production,
tons
Yield,
t/ha
Hectares
planted,
ha
Production,
tons
Yield,
t/ha
Western Cape
Dryland - - - - - -
Irrigation 200 2 000 10.00 2 000 20 000 10.00
Total 200 2 000 10.00 2 000 20 000 10.00
Northern Cape
Dryland - - - - - -
Irrigation 3 500 46 200 13.20 45 000 666 000 14.80
Total 3 500 46 200 13.20 45 000 666 000 14.80
Free State
Dryland 770 000 4 723 400 6.13 335 000 2 034 000 6.07
Irrigation 35 000 386 600 11.05 20 000 218 000 10.90
Total 805 000 5 110 000 6.35 355 000 2 252 000 6.34
Eastern Cape
Dryland 3 050 15 860 5.20 5 900 28 500 4.83
Irrigation 1 350 14 940 11.07 3 600 38 000 10.56
Total 4 400 30 800 7.00 9 500 66 500 7.00
KwaZulu-Natal
Dryland 39 000 231 750 5.94 35 000 230 000 6.57
Irrigation 11 000 118 250 10.75 15 000 160 000 10.67
Total 50 000 350 000 7.00 50 000 390 000 7.80
Mpumalanga
Dryland 149 500 973 500 6.51 308 000 2 105 000 6.83
Irrigation 10 500 114 500 10.90 22 000 237 500 10.80
Total 160 000 1 088 000 6.80 330 000 2 342 500 7.10
Limpopo
Dryland 18 000 63 500 3.53 8 000 27 000 3.38
Irrigation 22 000 236 500 10.75 16 000 165 000 10.31
Total 40 000 300 000 7.50 24 000 192 000 8.00
Gauteng
Dryland 54 000 320 000 5.93 54 600 352 000 6.45
Irrigation 6 000 70 000 11.67 5 400 62 000 11.48
Total 60 000 390 000 6.50 60 000 414 000 6.90
North West
Dryland 487 000 2 244 250 4.61 100 000 456 000 4.56
Irrigation 33 000 354 750 10.75 10 000 105 000 10.50
Total 520 000 2 599 000 5.00 110 000 561 000 5.10
RSA
Dryland 1 520 550 8 572 260 5.64 846 500 5 232 500 6.18
Irrigation 122 550 1 343 740 10.96 139 000 1 671 500 12.03
Total 1 643 100 9 916 000 6.03 985 500 6 904 000 7.01
Figures provided by the CEC.
Table 1: Maize production overview - 2016/2017 season
White 10 yr ave = 3.96
Yellow 10 yr ave = 4.80
RSA 10 yr ave = 4.31

South African Maize Crop Quality Report 2016/2017 Season
5
0.00
2.00
4.00
6.00
8.00
10.00
12.00
14.00
16.00
2014/15 2015/16 2016/17
t/ha
Western Cape
Northern Cape
Free State
Eastern Cape
KwaZulu-Natal
Mpumalanga
Limpopo
Gauteng
North West
0
1 000 000
2 000 000
3 000 000
4 000 000
5 000 000
6 000 000
7 000 000
8 000 000
2014/15 2015/16 2016/17
Tons
Western Cape
Northern Cape
Free State
Eastern Cape
KwaZulu-Natal
Mpumalanga
Limpopo
Gauteng
North West
Graph 6: Maize production per province over three seasons
Graph 7: Maize yield per province over three seasons
Figures provided by the CEC.
Graph 5: Area utilized for maize production per province over three seasons
0
200 000
400 000
600 000
800 000
1 000 000
1 200 000
1 400 000
2014/15 2015/16 2016/17
Ha
Western Cape
Northern Cape
Free State
Eastern Cape
KwaZulu-Natal
Mpumalanga
Limpopo
Gauteng
North West
The major commercial maize-producing provinces are the Free State, Mpumalanga and North West, contributing 83% of the total maize production in the RSA. The Free State produced 7 362 000 tons of maize on 1 160 000 hectares with a yield of 6.35 t/ha. Mpumalanga produced 3 430 500 tons of maize on 490 000 hectares with a yield of 7.00 t/ha and North West harvested 3 160 000 tons of maize on 630 000 hectares yielding 5.02 t/ha. Yellow maize contributed 68% of the total maize production in Mpumalanga while the majority of maize produced in the North West (82%) and Free State (69%) was white.
Please see graphs 5 to 7 for provincial figures for area planted, production and yield over the last three seasons.

South African Maize Crop Quality Report 2016/2017 Season
6
100 000 200 000 300 000 400 000 500 000 600 000 700 000 800 000 900 000
20
06
/07
20
07
/08
20
08
/09
20
09
/10
20
10
/11
20
11
/12
20
12
/13
20
13
/14
20
14
/15
20
15
/16
20
16
/17
Ha White
Yellow
Total 500 000
1 000 000
1 500 000
2 000 000
2 500 000
3 000 000
3 500 000
20
06
/07
20
07
/08
20
08
/09
20
09
/10
20
10
/11
20
11
/12
20
12
/13
20
13
/14
20
14
/15
20
15
/16
20
16
/17
Tons
White
Yellow
Total
100 000
200 000
300 000
400 000
500 000
600 000
20
06
/07
20
07
/08
20
08
/09
20
09
/10
20
10
/11
20
11
/12
20
12
/13
20
13
/14
20
14
/15
20
15
/16
20
16
/17
Ha White
Yellow
Total
500 000
1 000 000
1 500 000
2 000 000
2 500 000
3 000 000
3 500 000
4 000 000
20
06/
07
20
07/
08
20
08/
09
20
09/
10
20
10/
11
20
11/
12
20
12/
13
20
13/
14
20
14/
15
20
15/
16
20
16/
17
Tons
White
Yellow
Total
Graph 10: Area utilized for maize production in
Mpumalanga since 2006/2007
Graph 11: Maize production in Mpumalanga since
2006/2007
Graph 12: Area utilized for maize production in North
West since 2006/2007
Graph 13: Maize production in North West since
2006/2007
Figures provided by the CEC.
Graphs 8 to 13 provide an overview of the area planted and production figures for the Free State, Mpumalanga and North West from the 2006/2007 to 2016/2017 seasons.
200 000
400 000
600 000
800 000
1 000 000
1 200 000
1 400 000
2006
/07
2007
/08
2008
/09
2009
/10
2010
/11
2011
/12
2012
/13
2013
/14
2014
/15
2015
/16
2016
/17
Ha White
Yellow
Total
1 000 000
2 000 000
3 000 000
4 000 000
5 000 000
6 000 000
7 000 000
8 000 000
2006
/07
2007
/08
2008
/09
2009
/10
2010
/11
2011
/12
2012
/13
2013
/14
2014
/15
2015
/16
2016
/17
Tons White
Yellow
Total
Graph 8: Area utilized for maize production in the Free
State since 2006/2007
Graph 9: Maize production in the Free State since
2006/2007

South African Maize Crop Quality Report 2016/2017 Season
7
7 778 500
3 408 500
4 370 000
7 469 600
3 551 8223 917 778
9 838 709
4 331 787
5 506 922
1 026 302587 423 438 879
2 236 743
644 144
1 592 599
0
2000
4000
6000
8000
10000
12000
Total White Yellow
CEC Prod deliveries Processed Exports Imports
Thousa
nd Ton
Graph 14: Maize supply and demand overview 2016/2017 marketing season
Information provided by SAGIS.
Supply and Demand
World maize production for the 2016/2017 season is estimated at 1 087.6 million tons according to the International Grains Council Grain Market Report GMR 487 – 26 April 2018, with the major maize producing countries being the USA, China and Brazil. The USA, Argentina, Ukraine and Brazil are the biggest exporters of maize. Maize usage figures are estimated at 119.5, 279.9 and 603.6 million tons respectively for food, industrial and feed purposes. World production for the 2017/2018 season is forecasted at 1 045.9 million tons and the 2018/2019 figure is projected to be 1 054.1 million tons.
According to the BFAP Agricultural Outlook 2017 – 2026, total maize area is expected to be 2.7 million hectares by 2026, 2.3 million hectares of which will be cultivated by the commercial sector and the remainder by small scale producers. Yellow maize and oilseed area continues to expand at the expense of white maize, enabling commercial yellow maize area to exceed that of white maize in the later years of the outlook period. Yellow maize production is projected to increase annually by on average 3% over the next ten years and exceed 8.5 million tons by 2026. This is due to a combination of area expansion and yield growth. Both white and yellow maize are expected to produce exportable surpluses over the next ten years, stable weather permitted. The size of the yellow maize surplus is however expected to decline over this period. Demand for maize as animal feed is expected to increase by an annual average of 2.3% per annum over the next 10 years, to exceed 6.5 million tons by 2026.
Due to the record local crop no maize where imported during the period May 2017 to April 2018. Please see graphs 28 and 29 on pages 14 and 15 for the major destinations of exported white and yellow South African maize. Local Supply and Demand figures compiled by SAGIS is provided in graphs and tables below and on pages 8 to 13.
16 820 000
9 916 000
6 904 000
15 481 137
9 194 649
6 286 488
9 452 621
5 937 612
3 515 009
2 265 806
738 422
1 527 384
0
2000
4000
6000
8000
10000
12000
14000
16000
18000
Total White Yellow
CEC Prod deliveries Processed Exports Imports
Thousa
nd Ton
Graph 15: Maize supply and demand overview 2017/2018 marketing season

South African Maize Crop Quality Report 2016/2017 Season
8
TO
TA
L M
AIZ
E:
SU
PP
LY
AN
D D
EM
AN
D T
AB
LE
BA
SE
D O
N S
AG
IS' IN
FO
(T
ON
)
Pu
bli
ca
tio
n d
ate
: 2
01
8-0
4-2
5
Mar
ketin
g Se
ason
(May
- Ap
r)
Curr
ent
10
Ye
ar
aver
age
Seas
on
May
- Fe
b
Seas
on9
9/0
00
0/0
10
1/0
20
2/0
30
3/0
40
4/0
50
5/0
60
6/0
70
7/0
80
8/0
90
9/1
01
0/1
11
1/1
21
2/1
31
3/1
41
4/1
51
5/1
61
6/1
71
7/1
820
07/8
-2
01
6/1
7
**
*
10
CEC
(Cro
p Es
timat
e)6
71
6 0
00
10
14
1 0
00
7 2
25
00
09
73
2 0
00
9 3
92
00
09
48
2 0
00
11
45
0 0
00
6 6
18
00
07
12
5 0
00
12
70
0 0
00
12
05
0 0
00
12
81
5 0
00
10
36
0 0
00
12
12
0 6
56
11
81
0 6
00
14
25
0 0
00
9 9
55
00
07
77
8 5
00
16
82
0 0
00
11
09
6 4
76
CEC
(Ret
entio
n)5
02
00
06
14
00
04
14
00
04
62
00
03
66
00
04
10
00
07
54
00
04
80
00
03
37
00
05
54
00
03
89
00
05
27
00
04
74
00
04
33
00
04
57
81
05
50
00
00
00
42
0 1
81
SU
PP
LY
Open
ing
stoc
k (1
May
)8
47
00
09
83
00
02
11
5 0
00
1 2
02
00
02
71
0 0
00
2 6
24
00
03
14
8 0
00
3 1
69
00
02
07
0 0
00
1 0
49
00
01
58
1 0
00
2 1
31
00
02
33
6 0
00
99
4 0
00
1 4
17
39
35
89
02
82
07
3 6
35
2 4
71
06
71
09
4 6
38
1 6
71
21
2
Prod
del
iver
ies*
7 0
75
00
01
0 4
09
00
07
93
6 0
00
9 3
10
00
08
40
9 0
00
9 0
93
00
01
0 0
55
00
06
70
7 0
00
6 8
82
00
01
1 8
99
00
01
1 6
29
00
01
2 0
16
00
01
0 3
40
00
01
1 9
29
00
01
0 9
91
99
51
3 8
27
63
29
79
4 3
32
7 4
69
60
01
5 4
81
13
71
0 6
77
85
6
Impo
rts
56
9 0
00
03
95
00
09
25
00
04
41
00
02
19
00
03
60
00
09
31
00
01
12
0 0
00
27
00
02
7 0
00
04
21
00
01
1 0
00
79
68
26
5 2
50
1 9
63
61
02
23
6 7
43
05
95
12
9
Surp
lus
00
00
40
00
00
03
2 0
00
29
00
03
0 0
00
68
00
07
7 0
00
54
00
04
2 0
00
12
2 6
08
26
15
35
2 9
30
44
41
74
5 5
07
54
61
1
Tota
l Sup
ply
8 4
91
00
01
1 3
92
00
01
0 4
46
00
01
1 4
37
00
01
1 6
00
00
01
1 9
36
00
01
3 5
63
00
01
0 8
39
00
01
0 1
01
00
01
3 0
05
00
01
3 3
05
00
01
4 2
24
00
01
3 1
51
00
01
2 9
76
00
01
2 6
11
67
81
4 5
08
06
31
3 8
84
50
71
2 2
21
82
71
6 6
21
28
21
2 9
98
80
8
DE
MA
ND
Proc
esse
d6
36
2 0
00
6 8
52
00
07
15
1 0
00
6 9
83
00
07
24
3 0
00
7 2
83
00
07
46
2 0
00
7 6
60
00
08
02
9 0
00
8 6
13
00
08
65
8 0
00
8 8
57
00
08
94
1 0
00
8 9
35
00
09
34
8 6
70
9 9
26
51
91
0 2
48
99
49
83
8 7
09
9 4
52
62
19
13
9 5
89
-hum
an3
42
6 0
00
3 5
89
00
03
87
7 0
00
3 7
08
00
03
71
2 0
00
3 7
40
00
03
82
5 0
00
3 8
16
00
03
80
9 0
00
4 5
24
00
04
47
1 0
00
4 5
13
00
04
51
2 0
00
4 4
99
00
04
58
2 3
10
4 8
40
02
14
69
8 4
82
4 8
09
22
14
56
0 7
94
4 5
25
80
3
-ani
mal
/indu
stria
l2
93
6 0
00
3 0
68
00
03
14
6 0
00
3 1
55
00
03
41
6 0
00
3 4
27
00
03
53
7 0
00
3 7
63
00
04
15
7 0
00
4 0
20
00
04
10
1 0
00
4 2
71
00
04
36
2 0
00
4 3
78
00
04
71
5 2
95
5 0
40
64
75
52
0 2
48
5 0
03
81
04
86
3 9
69
4 5
56
90
0
-gris
ting
n/a
19
5 0
00
12
8 0
00
12
0 0
00
11
5 0
00
11
6 0
00
10
0 0
00
81
00
06
3 0
00
69
00
08
6 0
00
73
00
06
7 0
00
58
00
05
1 0
65
45
85
13
0 2
64
25
67
82
7 8
58
56
88
6
-bio
-fuel
00
00
00
00
00
00
00
00
00
00
With
draw
n by
pro
duce
rs0
50
0 0
00
32
5 0
00
30
1 0
00
29
9 0
00
25
5 0
00
31
5 0
00
24
1 0
00
21
7 0
00
27
3 0
00
29
1 0
00
26
7 0
00
14
2 0
00
13
8 0
00
14
8 9
09
12
4 5
08
76
88
89
4 9
48
93
72
71
77
32
5
Rele
ased
to e
nd-c
onsu
mer
s4
23
00
02
67
00
02
14
00
02
06
00
02
24
00
03
51
00
03
40
00
02
35
00
02
30
00
02
20
00
03
78
00
05
26
00
04
84
00
04
78
00
02
80
43
22
05
57
71
86
29
61
57
46
01
65
41
43
14
57
7
Net r
ecei
pts(
-)/di
sp(+
)0
2 0
00
63
00
03
5 0
00
25
00
01
8 0
00
28
00
03
6 0
00
42
00
04
9 0
00
51
00
04
4 0
00
15
00
06
2 0
00
12
04
32
2 1
00
21
45
19
77
06
32
03
2 8
36
Defic
it7
9 0
00
16
8 0
00
15
6 0
00
14
00
00
49
00
01
2 0
00
00
00
00
00
00
00
0
Tota
l Exp
orts
65
2 0
00
1 4
88
00
01
33
5 0
00
1 1
88
00
01
18
5 0
00
83
2 0
00
2 2
37
00
05
97
00
05
34
00
02
26
9 0
00
1 7
96
00
02
19
4 0
00
2 5
75
00
01
94
6 0
00
2 2
32
59
62
15
5 7
24
87
9 8
11
1 0
26
30
22
26
5 8
06
1 7
60
84
3
Pro
duct
s0
65
00
05
4 0
00
11
8 0
00
89
00
01
00
00
09
4 0
00
49
00
06
2 0
00
10
7 0
00
12
6 0
00
12
8 0
00
12
9 0
00
13
3 0
00
17
6 9
78
19
8 3
19
18
6 3
83
18
9 1
12
17
5 3
03
14
3 5
79
Afri
can
Coun
trie
s0
28
00
03
8 0
00
61
00
03
4 0
00
48
00
05
6 0
00
28
00
03
5 0
00
67
00
08
7 0
00
84
00
08
6 0
00
95
00
01
23
04
01
37
74
21
32
90
01
44
22
91
05
72
99
9 1
91
Oth
er C
ount
ries
03
7 0
00
16
00
05
7 0
00
55
00
05
2 0
00
38
00
02
1 0
00
27
00
04
0 0
00
39
00
04
4 0
00
43
00
03
8 0
00
53
93
86
0 5
77
53
48
34
4 8
83
69
57
44
4 3
88
Who
le m
aize
01
42
3 0
00
1 2
81
00
01
07
0 0
00
1 0
96
00
07
32
00
02
14
3 0
00
54
8 0
00
47
2 0
00
2 1
62
00
01
67
0 0
00
2 0
66
00
02
44
6 0
00
1 8
13
00
02
05
5 6
18
1 9
57
40
56
93
42
88
37
19
02
09
0 5
03
1 6
17
26
4
Bor
der P
osts
03
52
00
07
52
00
01
03
3 0
00
95
0 0
00
59
1 0
00
1 3
11
00
04
88
00
04
72
00
01
33
2 0
00
70
3 0
00
62
9 0
00
58
4 0
00
61
3 0
00
92
1 4
54
69
1 6
59
68
4 8
34
80
4 3
22
53
6 0
88
74
3 5
27
Har
bour
s0
1 0
71
00
05
29
00
03
7 0
00
14
6 0
00
14
1 0
00
83
2 0
00
60
00
00
83
0 0
00
96
7 0
00
1 4
37
00
01
86
2 0
00
1 2
00
00
01
13
4 1
64
1 2
64
32
68
59
43
2 8
68
1 5
54
41
58
73
59
5
Tota
l Dem
and
7 5
16
00
09
27
7 0
00
9 2
44
00
08
72
7 0
00
8 9
76
00
08
78
8 0
00
10
39
4 0
00
8 7
69
00
09
05
2 0
00
11
42
4 0
00
11
17
4 0
00
11
88
8 0
00
12
15
7 0
00
11
55
9 0
00
12
02
2 6
50
12
43
4 4
28
11
41
3 4
40
11
12
7 1
89
11
98
3 8
88
11
42
5 1
71
Endi
ng S
tock
(30
Apr)
97
5 0
00
2 1
15
00
01
20
2 0
00
2 7
10
00
02
62
4 0
00
3 1
48
00
03
16
9 0
00
2 0
70
00
01
04
9 0
00
1 5
81
00
02
13
1 0
00
2 3
36
00
09
94
00
01
41
7 0
00
58
9 0
28
2 0
73
63
52
47
1 0
67
1 0
94
63
84
63
7 3
94
1 5
73
63
7
- pr
oces
sed
p/m
onth
53
0 2
00
57
1 0
00
59
5 9
00
58
1 9
00
60
3 6
00
60
6 9
00
62
1 8
00
63
8 3
00
66
9 1
00
71
7 8
00
72
1 5
00
73
8 1
00
74
5 1
00
74
4 5
83
77
9 0
56
82
7 2
10
85
4 0
83
81
9 8
92
85
9 3
29
76
1 6
42
- m
onth
s' st
ock
1.8
3.7
2.0
4.7
4.3
5.2
5.1
3.2
1.6
2.2
3.0
3.2
1.3
1.9
0.8
2.5
2.9
1.3
5.4
2
Note
: ***
Figu
res f
or cu
rren
t sea
son
up to
dat
e

South African Maize Crop Quality Report 2016/2017 Season
9
0
2000
4000
6000
8000
10000
12000
14000
16000
08/09 09/10 10/11 11/12 12/13 13/14 14/15 15/16 16/17 17/18
Thou
sand
ton
CEC Estimate Retentions+deliveries SAGIS deliveries CEC Retentions
0
500
1000
1500
2000
2500
3000
08/09 09/10 10/11 11/12 12/13 13/14 14/15 15/16 16/17 17/18
Thousa
nd Ton
Imports Exports
3200
3700
4200
4700
5200
5700
08/09 09/10 10/11 11/12 12/13 13/14 14/15 15/16 16/17 17/18
Thou
sand
Ton
Human Animal
0
500
1000
1500
2000
2500
3000
3500
4000
4500
5000
08/09 09/10 10/11 11/12 12/13 13/14 14/15 15/16 16/17 17/18
Thousa
nd Ton
Opening stocks Ending stocks
Graph 16: Maize: CEC Estimate, Retentions and SAGIS deliveries over 10 marketing seasons
Graph 17: Maize: Imports and exports over 10 marketing seasons
Graph 18: Maize: RSA consumption over 10 marketing seasons
Graph 19: Maize: Opening and ending stocks over 10 marketing seasons
Information provided by SAGIS.

South African Maize Crop Quality Report 2016/2017 Season
10
WH
ITE
MA
IZE
: S
UP
PLY
AN
D D
EM
AN
D T
AB
LE
BA
SE
D O
N S
AG
IS' IN
FO
(T
ON
)
Pu
bli
ca
tio
n d
ate
: 2
01
8-0
4-2
5
Mar
ketin
g Se
ason
(May
- Ap
r)
Curr
ent
10
Ye
ar
aver
age
Seas
on
May
- Fe
b
Seas
on9
9/0
00
0/0
10
1/0
20
2/0
30
3/0
40
4/0
50
5/0
60
6/0
70
7/0
80
8/0
90
9/1
01
0/1
11
1/1
21
2/1
31
3/1
41
4/1
51
5/1
61
6/1
71
7/1
820
07/8
-2
01
6/1
7
**
*
11
CEC
(Cro
p Es
timat
e)4
14
1 0
00
6 1
55
00
04
11
0 0
00
5 5
38
00
06
36
6 0
00
5 8
05
00
06
54
1 0
00
4 1
87
00
04
31
5 0
00
7 4
80
00
06
77
5 0
00
7 8
30
00
06
05
2 0
00
6 9
03
65
65
60
6 8
00
7 7
10
00
04
73
5 0
00
3 4
08
50
09
91
6 0
00
6 0
81
59
6
CEC
(Ret
entio
n)1
24
00
01
89
00
01
05
00
01
39
00
01
16
00
01
13
00
01
84
00
01
44
00
01
1 0
00
12
0 0
00
83
00
01
19
00
01
00
00
01
14
00
01
10
91
01
50
00
00
00
80
79
1
SU
PP
LY
Open
ing
stoc
k (1
May
)5
13
00
06
09
00
01
27
3 0
00
55
9 0
00
1 7
18
00
02
12
3 0
00
2 4
02
00
02
30
1 0
00
1 6
30
00
06
18
00
07
62
00
01
36
2 0
00
1 6
09
00
05
18
00
07
57
21
42
74
31
81
28
2 5
81
1 3
07
86
75
97
83
71
01
2 0
98
Prod
del
iver
ies*
4 6
52
00
06
44
0 0
00
4 6
36
00
05
57
6 0
00
5 8
45
00
05
64
7 0
00
6 1
08
00
04
39
2 0
00
4 3
09
00
07
19
0 0
00
6 7
37
00
07
51
8 0
00
6 1
05
00
06
88
0 0
00
5 3
42
20
47
59
2 8
93
4 8
08
27
93
55
1 8
22
9 1
94
64
96
00
3 4
20
Impo
rts
00
47
00
02
74
00
03
3 0
00
00
1 0
00
46
00
00
00
13
3 0
00
11
00
00
01
00
80
36
44
14
40
93
49
5
Surp
lus
00
00
40
00
00
4 0
00
20
00
01
9 0
00
25
00
04
8 0
00
45
00
01
8 0
00
22
00
06
9 8
59
8 8
08
17
47
43
1 9
94
23
05
43
0 5
14
Tota
l Sup
ply
5 1
65
00
07
04
9 0
00
5 9
56
00
06
40
9 0
00
7 6
36
00
07
77
0 0
00
8 5
14
00
06
71
4 0
00
6 0
04
00
07
83
3 0
00
7 5
47
00
08
92
5 0
00
7 8
65
00
07
43
1 0
00
6 1
69
27
77
87
6 0
19
6 2
09
13
75
53
5 8
27
9 8
15
54
07
25
7 3
43
DE
MA
ND
Proc
esse
d3
68
7 0
00
4 3
42
00
04
20
2 0
00
3 6
79
00
04
21
2 0
00
4 3
13
00
04
18
6 0
00
4 3
85
00
04
75
1 0
00
4 9
22
00
04
55
5 0
00
5 8
71
00
05
37
4 0
00
5 0
47
00
04
80
8 6
74
5 8
62
43
84
31
9 6
97
4 3
31
78
75
93
7 6
12
4 9
84
26
0
-hum
an3
23
5 0
00
3 3
77
00
03
63
0 0
00
3 4
59
00
03
46
7 0
00
3 4
78
00
03
55
9 0
00
3 5
26
00
03
55
2 0
00
4 1
98
00
04
12
5 0
00
4 1
57
00
04
11
9 0
00
4 0
95
00
04
11
8 4
48
4 3
61
29
54
18
3 0
67
4 2
32
58
34
06
6 2
12
4 1
14
13
9
-ani
mal
/indu
stria
l4
52
00
07
83
00
04
46
00
01
05
00
06
41
00
07
33
00
05
43
00
07
87
00
01
14
2 0
00
66
2 0
00
36
2 0
00
1 6
58
00
01
20
2 0
00
90
4 0
00
65
1 9
25
1 4
69
00
21
18
52
28
6 1
53
1 8
59
56
08
25
56
0
-gris
ting
n/a
18
2 0
00
12
6 0
00
11
5 0
00
10
4 0
00
10
2 0
00
84
00
07
2 0
00
57
00
06
2 0
00
68
00
05
6 0
00
53
00
04
8 0
00
38
30
13
2 1
41
18
10
81
3 0
51
11
84
04
4 5
60
-bio
-fuel
00
00
00
00
00
00
00
00
00
00
With
draw
n by
pro
duce
rs0
34
9 0
00
16
4 0
00
14
4 0
00
14
4 0
00
10
7 0
00
10
1 0
00
11
2 0
00
10
7 0
00
11
1 0
00
81
00
01
08
00
04
6 0
00
36
00
03
2 4
09
36
94
01
3 3
85
14
08
33
2 8
54
58
58
2
Rele
ased
to e
nd-c
onsu
mer
s2
22
00
09
6 0
00
64
00
04
0 0
00
76
00
01
81
00
07
1 0
00
80
00
06
9 0
00
45
00
06
2 0
00
18
9 0
00
12
6 0
00
95
00
04
3 0
00
38
93
41
3 9
87
5 6
60
27
78
06
8 7
58
Net r
ecei
pts(
-)/di
sp(+
)0
7 0
00
43
00
01
1 0
00
12
00
01
7 0
00
11
00
02
7 0
00
28
00
02
7 0
00
10
00
02
2 0
00
7 0
00
28
00
01
95
31
4 3
19
-2 8
62
-96
36
00
81
3 4
45
Defic
it5
8 0
00
12
1 0
00
11
2 0
00
00
38
00
00
00
00
00
00
00
00
0
Tota
l Exp
orts
59
4 0
00
86
1 0
00
81
2 0
00
81
7 0
00
1 0
69
00
07
12
00
01
84
4 0
00
48
0 0
00
43
1 0
00
1 9
66
00
01
47
7 0
00
1 1
26
00
01
79
4 0
00
1 4
68
00
01
00
8 9
23
64
0 8
07
55
7 0
63
58
7 4
23
73
8 4
22
1 1
05
62
2
Pro
duct
s0
54
00
05
2 0
00
73
00
06
5 0
00
44
00
05
8 0
00
20
00
03
1 0
00
69
00
06
9 0
00
77
00
06
0 0
00
68
00
08
2 8
77
93
30
78
3 6
36
41
04
25
6 6
91
67
48
6
Afri
can
Coun
trie
s1
7 0
00
37
00
03
7 0
00
22
00
02
3 0
00
51
00
01
4 0
00
24
00
05
7 0
00
58
00
06
2 0
00
47
00
05
6 0
00
72
03
27
7 9
30
73
06
13
6 5
73
48
35
15
6 3
60
Oth
er C
ount
ries
37
00
01
5 0
00
36
00
04
3 0
00
21
00
07
00
06
00
07
00
01
2 0
00
11
00
01
5 0
00
13
00
01
2 0
00
10
84
51
5 3
77
10
57
54
46
98
34
01
1 1
27
Who
le m
aize
08
07
00
07
60
00
07
44
00
01
00
4 0
00
66
8 0
00
1 7
86
00
04
60
00
04
00
00
01
89
7 0
00
1 4
08
00
01
04
9 0
00
1 7
34
00
01
40
0 0
00
92
6 0
46
54
7 5
00
47
3 4
27
54
6 3
81
68
1 7
31
1 0
38
13
5
Bor
der P
osts
31
9 0
00
67
1 0
00
73
7 0
00
88
1 0
00
52
7 0
00
1 2
10
00
04
00
00
04
00
00
01
24
1 0
00
56
6 0
00
50
9 0
00
43
9 0
00
46
2 0
00
72
7 9
89
53
8 1
28
47
3 4
27
52
0 2
00
37
6 9
81
58
7 6
74
Har
bour
s4
88
00
08
9 0
00
7 0
00
12
3 0
00
14
1 0
00
57
6 0
00
60
00
00
65
6 0
00
84
2 0
00
54
0 0
00
1 2
95
00
09
38
00
01
98
05
79
37
20
26
18
13
04
75
04
50
46
1
Tota
l Dem
and
4 5
61
00
05
77
6 0
00
5 3
97
00
04
69
1 0
00
5 5
13
00
05
36
8 0
00
6 2
13
00
05
08
4 0
00
5 3
86
00
07
07
1 0
00
6 1
85
00
07
31
6 0
00
7 3
47
00
06
67
4 0
00
5 8
94
95
96
59
3 4
38
4 9
01
27
04
93
7 9
90
6 7
42
67
66
23
0 6
66
Endi
ng S
tock
(30
Apr)
60
4 0
00
1 2
73
00
05
59
00
01
71
8 0
00
2 1
23
00
02
40
2 0
00
2 3
01
00
01
63
0 0
00
61
8 0
00
76
2 0
00
1 3
62
00
01
60
9 0
00
51
8 0
00
75
7 0
00
27
4 3
18
1 2
82
58
11
30
7 8
67
59
7 8
37
3 0
72
86
49
08
86
0
- pr
oces
sed
p/m
onth
30
7 3
00
36
1 8
00
35
0 2
00
30
6 6
00
35
1 0
00
35
9 4
00
34
8 8
00
36
5 4
00
39
5 9
00
41
0 2
00
37
9 6
00
48
9 3
00
44
7 8
00
42
0 5
83
40
0 7
23
48
8 5
37
35
9 9
75
36
0 9
82
53
9 7
83
41
5 3
60
- m
onth
s' st
ock
2.0
3.5
1.6
5.6
6.0
6.7
6.6
4.5
1.6
1.9
3.6
3.3
1.2
1.8
0.7
2.6
3.6
1.7
5.7
2
Note
: ***
Figu
res f
or cu
rren
t sea
son
up to
dat
e

South African Maize Crop Quality Report 2016/2017 Season
11
0
2000
4000
6000
8000
10000
12000
08/09 09/10 10/11 11/12 12/13 13/14 14/15 15/16 16/17 17/18
Thou
sand
Ton
CEC Estimate Retentions+deliveries SAGIS deliveries CEC Retentions
0
500
1000
1500
2000
2500
08/09 09/10 10/11 11/12 12/13 13/14 14/15 15/16 16/17 17/18
Thousa
nd Ton
Imports Exports
0
500
1000
1500
2000
2500
3000
3500
4000
4500
5000
08/09 09/10 10/11 11/12 12/13 13/14 14/15 15/16 16/17 17/18
Thou
sand
Ton
Human Animal feed
0
500
1000
1500
2000
2500
3000
3500
08/09 09/10 10/11 11/12 12/13 13/14 14/15 15/16 16/17 17/18
Thousa
nd Ton
Opening stocks Ending stocks
Graph 20: White Maize: CEC Estimate, Retentions and SAGIS deliveries over 10 marketing seasons
Graph 21: White Maize: Imports and exports over 10 marketing seasons
Graph 23: White Maize: Opening and ending stocks over 10 marketing seasons
Graph 22: White Maize: RSA consumption over 10 marketing seasons
Information provided by SAGIS.
South African Maize Crop Quality Report 2016/2017 Season
12
YE
LL
OW
MA
IZE
: S
UP
PLY
AN
D D
EM
AN
D T
AB
LE
BA
SE
D O
N S
AG
IS' IN
FO
(T
ON
)
Pu
bli
ca
tio
n d
ate
: 2
01
8-0
4-2
5
Mar
ketin
g Se
ason
(May
- Ap
r)
Curr
ent
10
Ye
ar
aver
age
Seas
on
May
-Feb
Seas
on9
9/0
00
0/0
10
1/0
20
2/0
30
3/0
40
4/0
50
5/0
60
6/0
70
7/0
80
8/0
90
9/1
01
0/1
11
1/1
21
2/1
31
3/1
41
4/1
51
5/1
61
6/1
71
7/1
820
07/8
-2
01
6/1
7
**
*
11
CEC
(Cro
p Es
timat
e)2
57
5 0
00
3 9
86
00
03
11
5 0
00
4 1
94
00
03
02
6 0
00
3 6
77
00
04
90
9 0
00
2 4
31
00
02
81
0 0
00
5 2
20
00
05
27
5 0
00
4 9
85
00
04
30
8 0
00
5 2
17
00
06
20
3 8
00
6 5
40
00
05
22
0 0
00
4 3
70
00
06
90
4 0
00
5 0
14
88
0
CEC
(Ret
entio
n)3
78
00
04
25
00
03
09
00
03
23
00
02
50
00
02
97
00
05
70
00
03
36
00
03
26
00
04
34
00
03
06
00
04
08
00
03
74
00
03
19
00
03
46
90
04
00
00
00
00
29
1 3
90
SU
PP
LY
Open
ing
stoc
k (1
May
)3
34
00
03
74
00
08
42
00
06
43
00
09
92
00
05
01
00
07
46
00
08
68
00
04
40
00
04
31
00
08
19
00
07
69
00
07
27
00
04
76
00
06
60
17
93
14
71
07
91
05
41
16
3 2
00
49
6 8
01
65
9 1
14
Prod
del
iver
ies*
2 4
23
00
03
96
9 0
00
3 3
00
00
03
73
4 0
00
2 5
64
00
03
44
6 0
00
3 9
47
00
02
31
5 0
00
2 5
73
00
04
70
9 0
00
4 8
92
00
04
49
8 0
00
4 2
35
00
05
04
9 0
00
5 6
49
79
16
23
4 7
39
4 9
86
05
33
91
7 7
78
6 2
86
48
84
67
4 4
36
Impo
rts
56
9 0
00
03
48
00
06
51
00
04
08
00
02
19
00
03
60
00
09
30
00
01
07
4 0
00
27
00
02
7 0
00
02
88
00
00
79
68
26
5 2
50
1 8
62
80
71
59
2 5
99
05
01
63
4
Surp
lus
00
00
00
01
2 0
00
10
00
05
00
02
0 0
00
32
00
03
6 0
00
20
00
05
2 7
49
17
34
53
5 4
56
12
42
32
2 4
53
24
09
7
Tota
l Sup
ply
3 3
26
00
04
34
3 0
00
4 4
90
00
05
02
8 0
00
3 9
64
00
04
16
6 0
00
5 0
53
00
04
12
5 0
00
4 0
97
00
05
17
2 0
00
5 7
58
00
05
29
9 0
00
5 2
86
00
05
54
5 0
00
6 4
42
40
16
63
2 0
44
7 6
75
37
06
68
6 0
00
6 8
05
74
25
85
9 2
82
DE
MA
ND
Proc
esse
d2
67
5 0
00
2 5
10
00
02
94
9 0
00
3 3
04
00
03
03
1 0
00
2 9
70
00
03
27
6 0
00
3 2
75
00
03
27
8 0
00
3 6
91
00
04
10
3 0
00
2 9
86
00
03
56
7 0
00
3 8
88
00
04
53
9 9
96
4 0
64
08
15
92
9 2
97
5 5
06
92
23
51
5 0
09
4 1
55
33
0
-hum
an1
91
00
02
12
00
02
47
00
02
49
00
02
45
00
02
62
00
02
66
00
02
90
00
02
57
00
03
26
00
03
46
00
03
56
00
03
93
00
04
04
00
04
63
86
24
78
72
65
15
41
55
76
63
84
94
58
24
11
66
4
-ani
mal
/indu
stria
l2
48
4 0
00
2 2
85
00
02
70
0 0
00
3 0
50
00
02
77
5 0
00
2 6
94
00
02
99
4 0
00
2 9
76
00
03
01
5 0
00
3 3
58
00
03
73
9 0
00
2 6
13
00
03
16
0 0
00
3 4
74
00
04
06
3 3
70
3 5
71
64
55
40
1 7
26
4 9
17
65
73
00
4 4
09
3 7
31
34
0
-gris
ting
n/a
13
00
02
00
05
00
01
1 0
00
14
00
01
6 0
00
9 0
00
6 0
00
7 0
00
18
00
01
7 0
00
14
00
01
0 0
00
12
76
41
3 7
10
12
15
61
2 6
27
16
01
81
2 3
26
-bio
-fuel
00
00
00
00
00
00
00
00
00
00
With
draw
n by
pro
duce
rs0
15
1 0
00
16
1 0
00
15
7 0
00
15
5 0
00
14
8 0
00
21
4 0
00
12
9 0
00
11
0 0
00
16
2 0
00
21
0 0
00
15
9 0
00
96
00
01
02
00
01
16
50
08
7 5
68
63
50
38
0 8
65
60
87
31
18
74
4
Rele
ased
to e
nd-c
onsu
mer
s2
01
00
01
71
00
01
50
00
01
66
00
01
48
00
01
70
00
02
69
00
01
55
00
01
61
00
01
75
00
03
16
00
03
37
00
03
58
00
03
83
00
02
37
43
21
66
64
31
72
30
91
51
80
01
37
63
42
45
81
8
Net r
ecei
pts(
-)/di
sp(+
)0
-5 0
00
20
00
02
4 0
00
13
00
01
00
01
7 0
00
9 0
00
14
00
02
2 0
00
41
00
02
2 0
00
8 0
00
34
00
01
0 0
90
7 7
81
24
31
31
0 7
33
31
21
9 3
92
Defic
it2
1 0
00
47
00
04
4 0
00
14
00
00
11
00
01
6 0
00
00
00
00
00
00
00
0
Tota
l Exp
orts
58
00
06
27
00
05
23
00
03
71
00
01
16
00
01
20
00
03
93
00
01
17
00
01
03
00
03
03
00
03
19
00
01
06
8 0
00
78
1 0
00
47
8 0
00
1 2
23
67
31
51
4 9
17
32
2 7
48
43
8 8
79
1 5
27
38
46
55
22
2
Pro
duct
s0
11
00
02
00
04
5 0
00
24
00
05
6 0
00
36
00
02
9 0
00
31
00
03
8 0
00
57
00
05
1 0
00
69
00
06
5 0
00
94
10
11
05
01
21
02
74
71
48
07
01
18
61
27
6 0
93
Afri
can
Coun
trie
s1
1 0
00
1 0
00
24
00
01
2 0
00
25
00
05
00
01
4 0
00
11
00
01
0 0
00
29
00
02
2 0
00
39
00
03
9 0
00
51
00
85
9 8
12
59
83
91
07
65
65
7 3
78
42
83
2
Oth
er C
ount
ries
1 0
00
21
00
01
2 0
00
31
00
03
1 0
00
15
00
02
0 0
00
28
00
02
8 0
00
29
00
03
0 0
00
26
00
04
3 0
93
45
20
04
2 9
08
40
41
46
1 2
34
33
26
2
Who
le m
aize
06
16
00
05
21
00
03
26
00
09
2 0
00
64
00
03
57
00
08
8 0
00
72
00
02
65
00
02
62
00
01
01
7 0
00
71
2 0
00
41
3 0
00
1 1
29
57
21
40
9 9
05
22
0 0
01
29
0 8
09
1 4
08
77
25
79
12
9
Bor
der P
osts
33
00
08
1 0
00
29
6 0
00
69
00
06
4 0
00
10
1 0
00
88
00
07
2 0
00
91
00
01
37
00
01
20
00
01
45
00
01
51
00
01
93
46
51
53
53
12
11
40
72
84
12
21
59
10
71
55
85
3
Har
bour
s5
83
00
04
40
00
03
0 0
00
23
00
00
25
6 0
00
00
17
4 0
00
12
5 0
00
89
7 0
00
56
7 0
00
26
2 0
00
93
6 1
07
1 2
54
95
48
59
46
68
71
24
9 6
65
42
3 1
34
Tota
l Dem
and
2 9
55
00
03
50
1 0
00
3 8
47
00
04
03
6 0
00
3 4
63
00
03
42
0 0
00
4 1
85
00
03
68
5 0
00
3 6
66
00
04
35
3 0
00
4 9
89
00
04
57
2 0
00
4 8
10
00
04
88
5 0
00
6 1
27
69
15
84
0 9
90
6 5
12
17
06
18
9 1
99
5 2
41
21
25
19
4 5
05
Endi
ng S
tock
(30
Apr)
37
1 0
00
84
2 0
00
64
3 0
00
99
2 0
00
50
1 0
00
74
6 0
00
86
8 0
00
44
0 0
00
43
1 0
00
81
9 0
00
76
9 0
00
72
7 0
00
47
6 0
00
66
0 0
00
31
4 7
10
79
1 0
54
1 1
63
20
04
96
80
11
56
4 5
30
66
4 7
77
- pr
oces
sed
p/m
onth
22
2 9
00
20
9 2
00
24
5 8
00
27
5 3
00
25
2 6
00
24
7 5
00
27
3 0
00
27
2 9
00
27
3 2
00
30
7 6
00
34
1 9
00
24
8 8
00
29
7 3
00
32
4 0
00
37
8 3
33
33
8 6
73
49
4 1
08
45
8 9
10
31
9 5
46
34
6 2
83
- m
onth
s' st
ock
1.7
4.0
2.6
3.6
2.0
3.0
3.2
1.6
1.6
2.7
2.2
2.9
1.6
2.0
0.8
2.3
2.4
1.1
4.9
2
Note
: ***
Figu
res f
or cu
rren
t sea
son
up to
dat
e

South African Maize Crop Quality Report 2016/2017 Season
13
0
1000
2000
3000
4000
5000
6000
7000
8000
08/09 09/10 10/11 11/12 12/13 13/14 14/15 15/16 16/17 17/18
Thou
sand
Ton
CEC Estimate Retentions+deliveries SAGIS deliveries CEC Retentions
0
200
400
600
800
1000
1200
1400
1600
1800
2000
08/09 09/10 10/11 11/12 12/13 13/14 14/15 15/16 16/17 17/18
Thousa
nd Ton
Imports Exports
0
1000
2000
3000
4000
5000
6000
08/09 09/10 10/11 11/12 12/13 13/14 14/15 15/16 16/17 17/18
Thou
sand
Ton
Human Animal feed
0
200
400
600
800
1000
1200
1400
1600
1800
08/09 09/10 10/11 11/12 12/13 13/14 14/15 15/16 16/17 17/18
Thousa
nd Ton
Opening stocks Ending stocks
Graph 24: Yellow Maize: CEC Estimate, Retentions and SAGIS deliveries over 10 marketing
seasons
Graph 25: Yellow Maize: Imports and exports over 10 marketing seasons
Graph 26: Yellow Maize: RSA consumption over 10 marketing seasons
Graph 27: Yellow Maize: Opening and ending stocks over 10 marketing seasons
Information provided by SAGIS.

South African Maize Crop Quality Report 2016/2017 Season
14
Kenya32.1%
Botswana23.6%
Lesotho9.5%
Mozambique8.6%
Namibia7.3%
Spain6.6%
Venezuela4.2%
Swaziland3.6%Uganda
3.2%Other1.4%
Graph 28: Major destinations for RSA white maize exported during the 2017/2018
marketing season
WHITE MAIZE EXPORT/IMPORTS
2017/2018 Season (29 Apr 2017 - 27 Apr 2018)
RSA EXPORTS IMPORTS FOR RSA IMPORTS FOR EXPORTS
EXPORTS OF IMPORTED MAIZE
IMPORTS PER
HARBOUR
EXPORTS PER
HARBOUR
To Country Tons From Country Tons From Country Tons To Country Tons Harbour Tons Harbour Tons
Botswana 181 367 - - - - Botswana 1 492 - - Durban 355 337
Kenya 247 250 - - - - Zimbabwe 23 376 - - Richards Bay 22
Lesotho 72 904 - - - - - -
Mozambique 66 290 - - - - - -
Namibia 56 074 - - - - - -
Somalia 480 - - - - - -
Spain 50 631 - - - - - -
Swaziland 27 502 - - - - - -
Uganda 24 998 - - - - - -
Venezuela 32 000 - - - - - -
Zimbabwe 10 477 - - - - - -
Total 769 973 Total 0 Total 0 Total 24 868 Total 0 Total 355 359
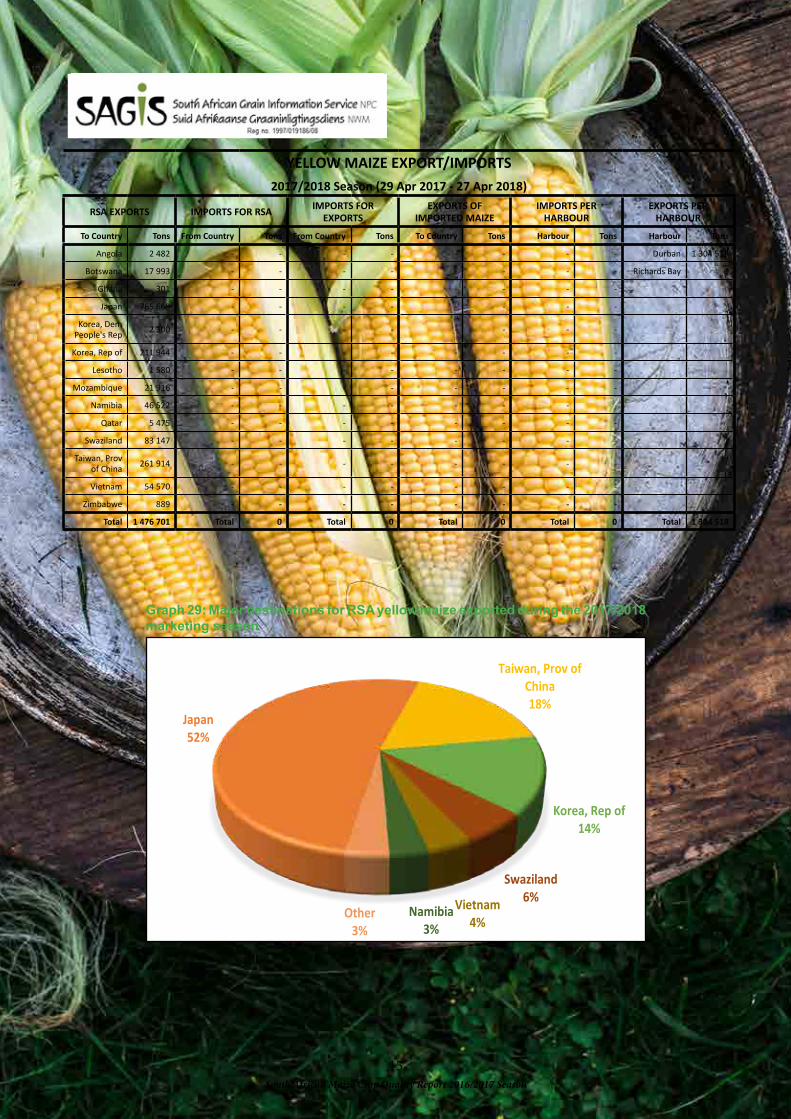
South African Maize Crop Quality Report 2016/2017 Season
15
YELLOW MAIZE EXPORT/IMPORTS
2017/2018 Season (29 Apr 2017 - 27 Apr 2018)
RSA EXPORTS IMPORTS FOR RSA IMPORTS FOR EXPORTS
EXPORTS OF IMPORTED MAIZE
IMPORTS PER
HARBOUR
EXPORTS PER
HARBOUR
To Country Tons From Country Tons From Country Tons To Country Tons Harbour Tons Harbour Tons
Angola 2 482 - - - - - - - - Durban 1 304 518
Botswana 17 993 - - - - - - - - Richards Bay 0
Ghana 301 - - - - - - - -
Japan 765 668 - - - - - - - -
Korea, Dem
People's Rep2 300 - - - - - - - -
Korea, Rep of 211 944 - - - - - - - -
Lesotho 1 580 - - - - - - - -
Mozambique 21 916 - - - - - - - -
Namibia 46 522 - - - - - - - -
Qatar 5 475 - - - - - - - -
Swaziland 83 147 - - - - - - - -
Taiwan, Prov
of China261 914 - - - - - - - -
Vietnam 54 570 - - - - - - - -
Zimbabwe 889 - - - - - - - -
Total 1 476 701 Total 0 Total 0 Total 0 Total 0 Total 1 304 518
Graph 29: Major destinations for RSA yellow maize exported during the 2017/2018
marketing season
Japan52%
Taiwan, Prov of China18%
Korea, Rep of14%
Swaziland6%Vietnam
4%Namibia
3%Other
3%

South African Maize Crop Quality Report 2016/2017 Season
16
SAGIS Maize Product Information
On 14 November 2014, the Minister of Agriculture, Forestry & Fisheries announced new statutory measures for the manufacturing of maize & wheaten products.
To comply with the abovementioned statutory measures, manufacturers of these products have to register with SAGIS and submit information with regards to the manufacture, import and export of maize products.
Please see graphs 30 to 33 below for an overview of the white and yellow maize products as well as white and yellow maize meal manufactured for the period May 2017 to March 2018. The tables on pages 15 to 17 provide a summary of the figures for maize products manufactured, imported and exported for the periods May 2016 to April 2017 as well as May 2017 to March 2018.
Super 85.2%
Special 13.0%
Sifted and Unsifted 1.7%
Total White Maize Meal: 2 552 532 t
Graph 30: White maize products manufactured from
May 2017 to March 2018
Graph 32: White maize meal manufactured from May
2017 to March 2018
Maize Meal 61.7%
Rice, Grits, Samp 4.1%
Maize Chop31.7%
Other 2.5%
Total White Maize Products: 4 136 536 t
Maize Meal 12.4%
Rice, Grits, Samp 47.2%
Maize Chop30.4%
Other 10.1%
Total Yellow Maize Products: 522 166 t
Super 46.0%Special 6.0%
Sifted and Unsifted 48.0%
Total Yellow Maize Meal: 64 645 t
Graph 31: Yellow maize products manufactured from
May 2017 to March 2018
Graph 33: Yellow maize meal manufactured from May
2017 to March 2018

South African Maize Crop Quality Report 2016/2017 Season
17
MA
IZE
PR
OD
UC
TS
MA
NU
FA
CT
UR
ED
PE
R M
AR
KE
TIN
G Y
EA
R
Date
Pu
bli
sh
ed
: 2018/0
5/0
4
Mark
eti
ng
year:
May 2
016 -
Ap
r 2017
Ma
rke
tin
g y
ea
r: M
ay
20
17
- A
pr
20
18
Man
ufa
ctu
red
Ma
nu
fac
ture
d
To
ns
To
ns
Pro
gre
ssiv
e:
12 M
on
ths
Pro
gre
ss
ive
: 11
Mo
nth
s (
Ma
y -
Ma
r)
Wh
ite
Maiz
eY
ell
ow
M
aiz
eTo
tal
Maiz
eW
hit
e
Ma
ize
Ye
llo
w
Ma
ize
To
tal
Ma
ize
Maiz
e C
ho
p 1
305 5
65
184 1
30
1 4
89 6
95
1 3
11
09
4
15
8 7
40
1 4
69
83
4
Maiz
e R
ice
8 8
94
*
8 8
94
8
01
3*
8
01
3
Maiz
e G
rits
47 3
92
*
47
39
2
55
44
4*
5
5 4
44
Sam
p
107 9
65
*
107
96
5
10
4 9
97
*
10
4 9
97
* To
tal Y
ello
w M
aiz
e R
ice / M
aiz
e G
rits
/ S
am
p
290 3
88
290
38
8
24
6 2
13
2
46
21
3
Sif
ted
Maiz
e M
eal
28 0
05
43 5
82
71 5
87
3
4 2
29
3
1 0
37
6
5 2
66
Sp
ecia
l M
aiz
e M
eal
401 3
44
16 0
87
417 4
31
3
32
87
3
3 8
81
3
36
75
4
Su
per
Maiz
e M
eal
2 2
75 0
99
38 7
77
2 3
13 8
76
2 1
75
68
6
29
72
5 2
20
5 4
11
Un
sif
ted
Maiz
e M
eal
12 2
90
1 2
02
13
49
2
9 7
44
2
9
74
6
Oth
er
maiz
e p
rod
ucts
in
ten
ded
fo
r H
um
an
co
nsu
mp
tio
n
90 4
75
60 4
37
150
91
2
10
4 4
56
5
2 5
68
1
57
02
4
To
tal
4 2
77 0
29
634 6
03
4 9
11
63
2 4
13
6 5
36
5
22
16
6 4
65
8 7
02
* In
clu
ded tota
l fo
r ye
llow
ric
e, grits
and s
am
p

South African Maize Crop Quality Report 2016/2017 Season
18
MA
IZE
PR
OD
UC
TS
IM
PO
RT
ED
PE
R M
AR
KE
TIN
G Y
EA
R
D
ate
Pu
bli
sh
ed
: 2018/0
5/0
4
Mark
eti
ng
year:
May 2
016 -
Ap
r 2017
Ma
rke
tin
g y
ea
r: M
ay
20
17
- A
pr
20
18
Imp
ort
ed
Imp
ort
ed
To
ns
To
ns
Pro
gre
ssiv
e:
12 M
on
ths
Pro
gre
ss
ive
: 11
Mo
nth
s (
Ma
y -
Ma
r)
Wh
ite
Maiz
eY
ell
ow
M
aiz
eTo
tal
Maiz
eW
hit
e
Ma
ize
Ye
llo
w
Ma
ize
To
tal
Ma
ize
Maiz
e C
ho
p
4 9
85
0
4 9
85
1
36
5
0
1 3
65
Maiz
e R
ice
0
*
0
0*
0
Maiz
e G
rits
0
*
0
0*
0
Sam
p
0*
0
0
*
0
* To
tal Y
ello
w M
aiz
e R
ice / M
aiz
e G
rits
/ S
am
p
44
4
4
22
2
2
Sif
ted
Maiz
e M
eal
0
0
0
5
60
9
0
5 6
09
Sp
ecia
l M
aiz
e M
eal
5 6
18
0
5
61
8
0
0
0
Su
per
Maiz
e M
eal
0
0
0
0
0
0
Un
sif
ted
Maiz
e M
eal
0
0
0
0
0
0
Oth
er
maiz
e p
rod
ucts
in
ten
ded
fo
r H
um
an
co
nsu
mp
tio
n
0
0
0
0
0
0
To
tal
10 6
03
4
4
10 6
47
6
97
4
22
6
99
6
* In
clu
ded tota
l fo
r ye
llow
ric
e, grits
and s
am
p
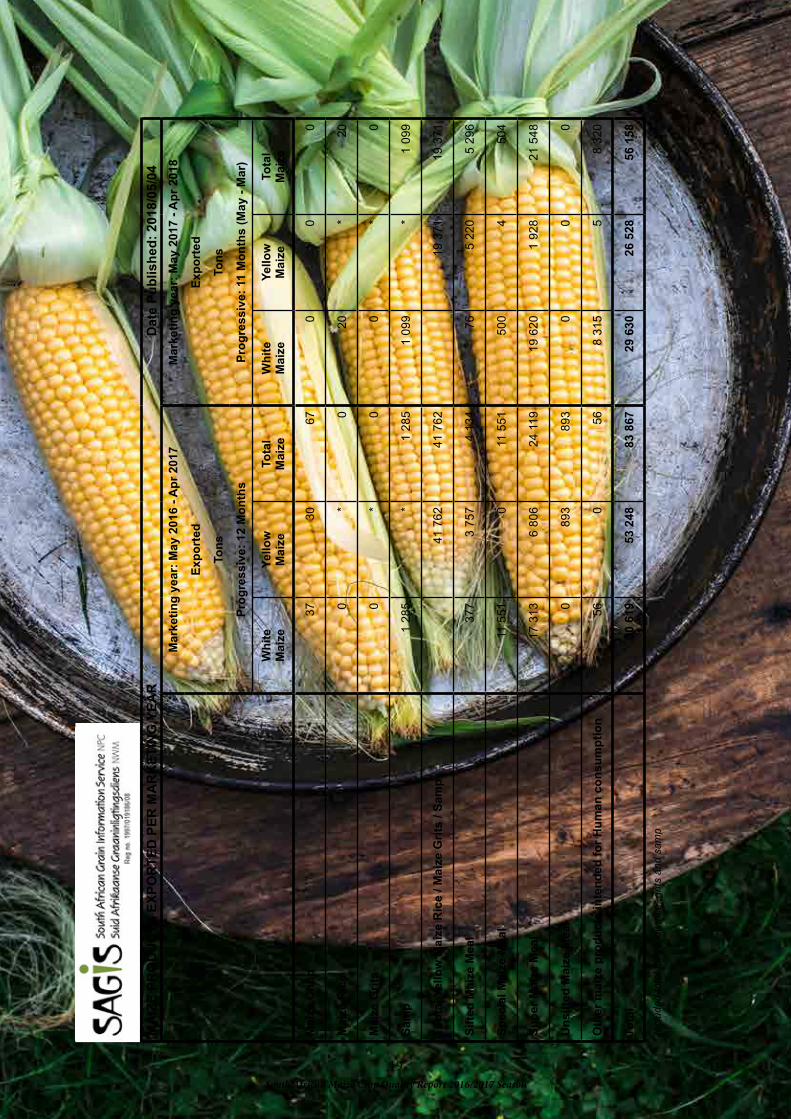
South African Maize Crop Quality Report 2016/2017 Season
19
MA
IZE
PR
OD
UC
TS
EX
PO
RT
ED
PE
R M
AR
KE
TIN
G Y
EA
R
D
ate
Pu
bli
sh
ed
: 2018/0
5/0
4
Mark
eti
ng
year:
May 2
016 -
Ap
r 2017
Ma
rke
tin
g y
ea
r: M
ay
20
17
- A
pr
20
18
Exp
ort
ed
Ex
po
rte
d
To
ns
To
ns
Pro
gre
ssiv
e:
12 M
on
ths
Pro
gre
ss
ive
: 11
Mo
nth
s (
Ma
y -
Ma
r)
Wh
ite
Maiz
eY
ell
ow
M
aiz
eTo
tal
Maiz
eW
hit
e
Ma
ize
Ye
llo
w
Ma
ize
To
tal
Ma
ize
Maiz
e C
ho
p
37
3
0
67
0
0
0
Maiz
e R
ice
0
*
0
20
*
20
Maiz
e G
rits
0
*
0
0*
0
Sam
p
1 2
85
*
1 2
85
1
09
9*
1
09
9
* To
tal Y
ello
w M
aiz
e R
ice / M
aiz
e G
rits
/ S
am
p
41 7
62
41
76
2
19
37
1
19
37
1
Sif
ted
Maiz
e M
eal
3
77
3 7
57
4
13
4
76
5
22
0
5 2
96
Sp
ecia
l M
aiz
e M
eal
11 5
51
0
11 5
51
5
00
4
5
04
Su
per
Maiz
e M
eal
17 3
13
6 8
06
24
11
9
19
62
0
1 9
28
2
1 5
48
Un
sif
ted
Maiz
e M
eal
0
8
93
8
93
0
0
0
Oth
er
maiz
e p
rod
ucts
in
ten
ded
fo
r H
um
an
co
nsu
mp
tio
n
56
0
5
6
8 3
15
5
8
32
0
To
tal
30 6
19
53 2
48
83 8
67
2
9 6
30
2
6 5
28
5
6 1
58
* In
clu
ded tota
l fo
r ye
llow
ric
e, grits
and s
am
p

South African Maize Crop Quality Report 2016/2017 Season
20
Maize Crop Quality 2016/2017 -
summary of results
RSA Grading
The maize crop was of very good quality, with 85% of white and 92% of yellow maize, graded as maize grade one, compared to the 72% and 78% of the 2015/2016 season. The percentage total defective kernels above and below the 6.35 mm sieve, 4.7% for white and 4.4% for yellow maize, was 1.5% and 1.3% respectively lower than the previous season. The percentages Diplodia as well as Fusarium infected kernels on both white and yellow maize were between 0.2% and 0.4% lower than in the previous season.
Foreign matter did not pose significant problems, with seven white and three yellow maize samples downgraded to class other maize due to foreign matter exceeding 0.75%. Only one yellow maize sample was downgraded as a result of other colour maize that exceeded 5%. The average percentage combined deviations of white maize was 5.1% compared to the 6.7% of the 2015/2016 season, that of yellow maize was slightly lower, 4.7% compared to 6.0% previously.
Please refer to Tables 3 to 7 on pages 30 to 38. USA Grading
Of the 1 000 maize samples graded according to USA grading regulations, 70.5% were graded US1, 20.1% US2, 4.5% US3, 1.6% US4, 1.5% US5, while sample grade and class mixed corn represented 1.0% and 0.8% respectively. The percentage samples graded as US1 varies substantially over seasons, comparing 71% to 58%, 64%, 42% and 79% over the previous four seasons. The percentage samples graded as US2 was similar to the 22% and 23% of the previous two seasons respectively. The main reason for downgrading the samples was the percentage total damaged kernels exceeding the maximum limit per grade, followed by broken corn and foreign material. Please see Tables 8 and 9 on pages 40 to 44.
Physical Quality factors
Bushel weight/Test weight is applied as a grading factor in the USA grading regulations, but is also routinely done at most intake points locally. White maize had an average test weight of 77.7 kg/hl compared to the 76.9 kg/hl of yellow maize. White maize’s average test weight was 0.3 kg/hl lower than the previous season and that of yellow maize
0.2 kg/hl higher. The test weight in total varied from 67.6 kg/hl to 82.4 kg/hl. Only 25 samples reported Bushel weight values below the minimum requirement (56.0 lbs or 72.1 kg/hl) for USA grade 1 maize, 14 of these samples were from Mpumalanga, five from the Free State, three from Gauteng, two from North West and one from KwaZulu-Natal.
The 100 kernel mass (“as is” basis) of white maize (35.0 g) averaged higher than yellow maize (33.5 g) as in previous seasons. The kernel size of white maize was larger and that of yellow maize smaller than the previous season. The percentage yellow maize kernels above the 10 mm sieve were on average 10.7% lower than white kernels and the percentage kernels below the 8 mm sieve 9.3% higher than that of white maize. White maize kernels were larger than in the previous two seasons, while the yellow maize kernels were still some of the smallest the past ten seasons.
Both white and yellow maize were slightly more susceptible to breakage than during the previous season. The percentage stress cracks observed varied overall from 0 to 50%, and averaged 8% for both white and yellow maize, 3% higher than in the previous season.
Please refer to Tables 12 to 16 on pages 46 to 54.
The milling index obtained from the SAGL Milling Index 2017 model, varied from an average of 80.2 for white maize to 76.8 for yellow maize. Grit Yield All (GYA) values averaged 64.8 for white maize and 64.0 for yellow maize. Please see page 95 under the Methods Section for more information on this new parameter which is reported for the first time this season.
Roff milling and whiteness index (WI)
The average % extraction of total meal in white maize obtained with the Roff mill averaged 78.6% (0.2% higher than the previous season) and varied from 69.7% to 81.7%.
The whiteness index averaged 25.4 for unsifted and 17.4 for sifted maize meal. Sieving the sample eliminates differences in the readings as a result of particle size. The whiteness index of the previous season averaged 26.1 and 17.5 for unsifted and sifted maize meal respectively. The higher the WI value obtained, the whiter the meal sample. The main contributing factors causing differences in WI values are the presence of other

South African Maize Crop Quality Report 2016/2017 Season
21
colour maize like yellow maize, the presence of defective kernels, the type of cultivar as well as the soil composition. The sample with the lowest sifted whiteness index value of -17.5 this season, also had the highest percentage other colour maize namely 7.0%. Please see Tables 17 and 18 on pages 56 to 59.
Nutritional Values
The fat, starch and protein nutritional components are reported as % (g/100 g) on a dry base.
In general, white maize tends to have a higher fat content than yellow maize, but a lower starch content (except for the two latest seasons). No clear trend can be observed with regards to the protein content.
The average fat content of white maize was 0.1% higher than the 4.1% of both the previous season as well as the average fat content of yellow maize this season. The protein content of yellow maize averaged 8.9%, which was 0.2% higher than that of white maize. The protein content of yellow maize was on average 0.8% lower than in the previous season and that of white maize 1.0% lower than in the 2015/2016 season. The protein contents however compare very well with the 10-year averages.
The average starch content of white maize (74.1%) was 1.5% higher than in the previous season and yellow maize (73.7%) 1.4% higher. Both are also higher than the 10-year averages.
Please refer to Tables 19 to 22 on pages 60 to 65.
Genetic Modification (GM)
The SAGL screened 100 of the crop samples to test for the presence of the Cry1Ab, Cry2Ab and/or CP4 EPSPS traits. Important to remember is that the crop quality samples received by the SAGL are composite samples per class and grade, made up of individual deliveries to grain silos.
SAGL used the EnviroLogix QuickComb kit for bulk grain to quantitatively determine the presence of genetically modified maize.
The detection range for the Cry1Ab trait is 0.4% to 5%. 98% of the samples tested positive for Cry1Ab with values larger than 0.4% (Limit of quantification (LOQ)).
The detection range for the Cry2Ab trait is 0.5% to 5%. 84% of the samples gave values larger than the LOQ of 0.5% (positive results).
The detection range for the CP4 EPSPS trait is 0.25% to 5%. All of the samples (100%) tested positive for CP4 EPSPS with values larger than 0.25% (LOQ).
Values higher than 5%, the highest value of the detection range for all three traits, are reported as > 5%. This methodology has a precision coefficient of variation of 20%.
Please see Table 23 on page 67 for the results obtained as well as page 96 for a summary of the Events and Trade names/Brands represented by these three traits.
Mycotoxins
None of the 350 samples tested positive for Aflatoxin, Ochratoxin A, HT-2 or T-2 toxin residues.
The average Fumonisin level (Sum of B1, B2 and B3) on all 350 samples tested, was 191 µg/kg (ppb) and ranged from not detected (ND) to 6 059 µg/kg. This average is lower than the previous season’s 325 µg/kg. Of the 350 samples tested, 155 samples (44%) tested positive for fumonisin levels and the average of these positive results was 431 µg/kg. The previous season, 57% of the samples tested positive, with an average of 569 µg/kg.
The highest Deoxynivalenol (DON) level detected was 7 698 µg/kg, compared to the 1 585 µg/kg of last season. The average level of all samples tested this season was 339 µg/kg, 56 µg/kg the previous season. 21% of the samples tested positive for DON last season compared to 37% this season. The average of the positive results increased from 259 µg/kg in 2015/2016 to 919 µg/kg in 2016/2017.
16% of the samples tested positive for 15-acetyl-deoxynivalenol (15-ADON) residues. The average of the positive results was 254 µg/kg compared to 163 µg/kg in the previous season.
Zearalenone residues were found in 8% of the samples and values ranged from ND to 399 µg/kg. The average of the positive samples was 89 µg/kg compared to the 49 µg/kg of the previous season when 5% of the samples tested positive.
Mycotoxin levels lower than the limit of quantitation (< LOQ) as well as limit of detection (< LOD) were seen as having tested negative for calculation purposes. Please see mycotoxin results in Table 24 on pages 79 to 90.

South African Maize Crop Quality Report 2016/2017 Season
22
C
lass a
nd
gra
de o
f m
aiz
eW
M1
WM
2W
M3
WC
OM
YM
1Y
M2
YM
3Y
CO
MW
eig
hte
d A
ve
.
R
SA
Gra
din
g
D
efe
ctive k
ern
els
abo
ve 6
.35 m
m s
ieve, %
2.4
4.9
10.4
7.5
2.1
4.6
13
.56
.82
.6
D
efe
ctive k
ern
els
belo
w 6
.35 m
m s
ieve, %
1.6
2.9
4.4
3.9
1.8
4.1
1.9
10
.71
.9
Tota
l defe
ctive k
ern
els
, %
3.9
7.8
14.8
11.4
3.9
8.7
15
.31
7.5
4.5
O
ther
colo
ur
maiz
e k
ern
els
, %
0.2
0.5
0.5
1.0
0.1
0.7
1.7
1.9
0.2
F
ore
ign m
atter, %
0.1
0.2
0.3
2.3
0.1
0.2
0.4
1.2
0.1
C
om
bin
ed d
evia
tion, %
4.3
8.6
15.6
14.7
4.1
9.6
17
.42
0.6
4.9
P
inked m
aiz
e k
ern
els
, %
0.2
0.3
0.1
0.0
0.0
0.0
0.0
0.0
0.1
P
hysic
al F
acto
rs
Test w
eig
ht, k
g/h
l77.9
76.7
76.9
75.6
77.0
75
.17
4.4
73
.37
7.3
100 K
ern
el m
ass, g
35.1
34.4
36.7
34.7
33.8
30
.73
0.7
26
.43
4.3
S
tress c
racks, %
711
23
12
71
01
41
58
M
illin
g Index
80.5
78.1
79.8
83.8
77.0
75
.56
6.8
66
.17
8.7
K
ern
el S
ize
%
on top 1
0 m
m22.0
23.1
21.0
25.0
11.7
6.9
16
.26
.91
7.3
%
on top 8
mm
64.3
62.3
66.0
63.1
65.6
63
.56
4.0
73
.96
4.8
%
thro
ugh 8
mm
13.7
14.6
13.0
11.9
22.6
29
.71
9.8
19
.21
7.9
B
reakag
e s
uscep
tib
ilit
y
%
Belo
w 6
.35 m
m s
ieve
1.1
1.6
1.3
2.1
1.0
1.9
2.3
3.8
1.2
%
Belo
w 4.7
5 m
m s
ieve
0.8
1.1
1.0
1.5
0.7
1.3
1.6
2.2
0.8
N
utr
itio
nal V
alu
es
P
rote
in, %
(db)
8.7
8.6
8.7
9.3
8.9
8.8
9.1
8.6
8.8
F
at, %
(db)
4.2
4.2
4.2
4.4
4.1
4.0
4.0
4.2
4.1
S
tarc
h, %
(db)
74.1
74.1
73.7
73.3
73.7
73
.67
3.4
73
.57
3.9
N
um
ber
of
sam
ple
s469
62
99
417
28
24
1 0
00
M
yco
toxin
s
Tot
al A
flato
xin,
µg/
kg (p
pb) [
max
. val
ue]
0 [0
]0
[0]
0 [0
]0
[0]
0 [0
]0
[0]
0 [0
]0
[0]
0 [0
] T
otal
Fum
onis
in, µ
g/kg
(ppb
) [m
ax. v
alue
]11
4 [3
913
]27
5 [2
135
]68
[247
]11
1 [4
06]
189
[4 0
25]
722
[6 0
59]
275
[547
]37
5 [1
125
]19
1 [6
059
] D
eoxy
niva
leno
l, µg
/kg
(ppb
) [m
ax. v
alue
]31
6 [4
758
]1
620
[7 6
98]
1 98
1 [7
671
]43
6 [1
742
]93
[1 5
52]
19 [1
89]
114
[228
]0
[<10
0]33
9 [7
698
] 1
5-AD
ON
, µg/
kg (p
pb) [
max
. val
ue]
36 [6
57]
193
[964
]20
1 [8
02]
53 [2
10]
14 [3
81]
7 [1
13]
0 [<
100]
0 [0
]41
[964
] O
chra
toxi
n A,
µg/
kg (p
pb) [
max
. val
ue]
0 [0
]0
[0]
0 [0
]0
[0]
0 [0
]0
[0]
0 [0
]0
[0]
0 [0
] Z
eara
leno
ne, µ
g/kg
(ppb
) [m
ax. v
alue
]5
[181
]39
[399
]73
[292
]6
[23]
1 [1
13]
0 [<
20]
0 [0
]0
[0]
7 [3
99]
HT-
2 To
xin,
µg/
kg (p
pb) [
max
.val
ue]
0 [0
]0
[0]
0 [0
]0
[0]
0 [0
]0
[0]
0 [0
]0
[0]
0 [0
] T
- 2
Toxi
n, µ
g/kg
(ppb
) [m
ax. v
alue
]0
[0]
0 [0
]0
[0]
0 [0
]0
[0]
0 [0
]0
[0]
0 [0
]0
[0]
N
um
ber
of
sam
ple
s140
31
44
150
16
23
35
0
G
MO
Cry
1A
b, %
Sam
ple
s p
ositiv
e (
>LO
Q o
f 0.4
%)
100
100
100
100
95
10
01
00
10
09
8
Cry
2A
b, %
Sam
ple
s p
ositiv
e (
>LO
Q o
f 0.5
%)
89
73
100
100
83
60
10
01
00
84
CP
4 E
PS
PS
, %
Sam
ple
s p
ositiv
e (
>LO
Q o
f 0.2
5%
)100
100
100
100
100
10
01
00
10
01
00
N
um
ber
of
sam
ple
s37
11
22
41
51
11
00
Note
: N
ot dete
cte
d m
ycoto
xin
results a
re r
eport
ed a
s 0
, see L
OQ
in T
able
24 p
age 7
9.
TA
BL
E 2
: S
OU
TH
AF
RIC
AN
MA
IZE
CR
OP
QU
AL
ITY
2016/2
017 (
Weig
hte
d A
vera
ges)

South African Maize Crop Quality Report 2016/2017 Season
23
RSA Production Regions
The Republic of South Africa is divided into 9 provinces as illustrated in Figure 1.
The 9 provinces are divided into 36 grain production regions.
The regions are distributed as follows:Region 1: Namakwaland Regions 12 to 20: North WestRegions 2 and 3: Swartland Regions 21 to 28: Free State Regions 4 to 6: Rûens Regions 29 to 33: MpumalangaRegions 7 and 8: Eastern Cape Region 34: GautengRegion 9: Karoo Region 35: LimpopoRegion 10: Griqualand West Region 36: KwaZulu-NatalRegion 11: Vaalharts
Please see the Crop Production Regions map on the next page.
The production regions from which maize samples have been received for the crop quality survey of the 2016/2017 production season, are named and described on pages 25 to 28. The silo/intake stands as well as the type of storage structure are provided.
The mostly rain-fed maize production area is divided into four major maize production regions according to climatological characteristics:• The Warm Western Region (western parts of the Free State and most of the North West)• The Temperate Eastern Region (Gauteng and the central parts of the Free State)• The Cold Eastern Region (Mpumalanga Highveld and eastern Free State)• The KwaZulu-Natal Region (the western/upland and central/midland parts of KZN)
! !
!
!
!
!
!
!
!
!
!
Maputo
Durban
Maseru
Mbabane
Gaborone
Pretoria
Cape Town
Johannesburg
Bloemfontein
Port Elizabeth
Pietermaritzburg
Namibia
Botswana Mozambique
Lesotho
Zimbabwe
Swaziland
Northern Cape
Limpopo
Eastern Cape
Free State
Western Cape
North West
KwaZulu-Natal
Mpumalanga
Gauteng
µ
Legend
Provincial Boundaries
Figure 1: RSA Provinces
Provincial map with gratitude to SiQ.

South African Maize Crop Quality Report 2016/2017 Season
24
Regio
nal m
ap w
ith g
ratitu
de to A
gbiz
Gra
in a
nd S
iQ.
Fig
ure
2:
RS
A C
rop
Pro
du
ctio
n R
egio
ns
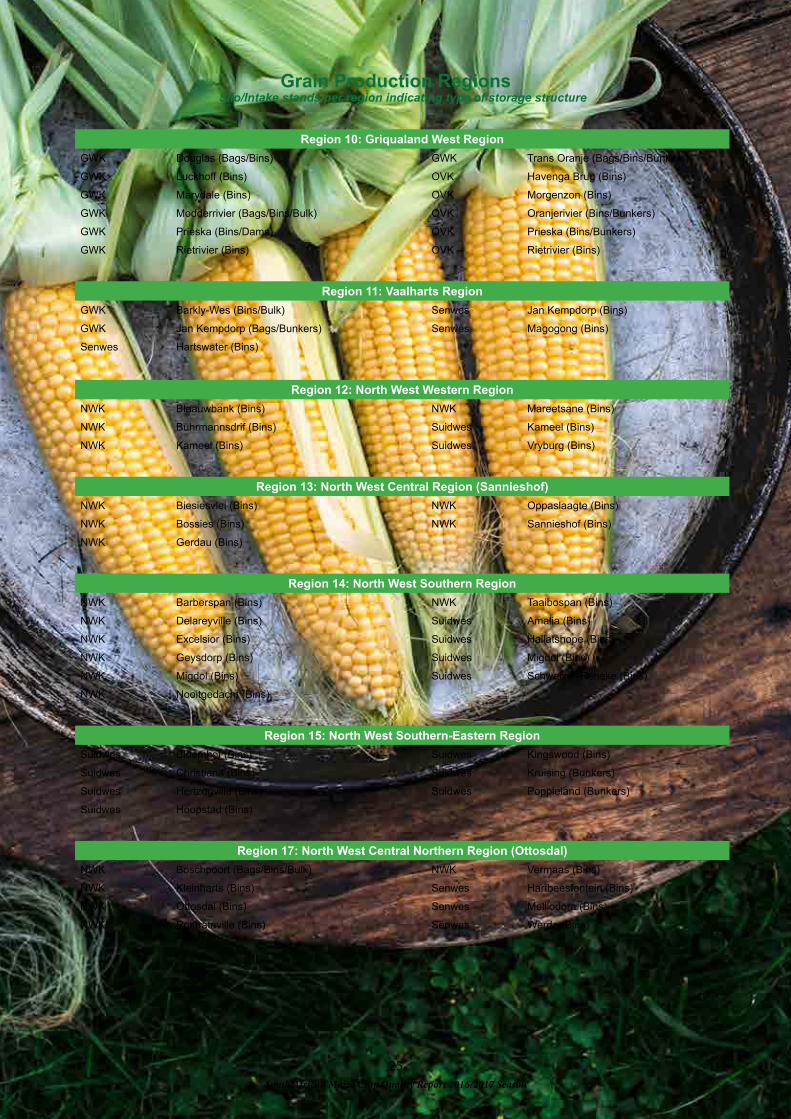
South African Maize Crop Quality Report 2016/2017 Season
25
Grain Production Regions Silo/Intake stands per region indicating type of storage structure
Region 10: Griqualand West Region
GWK Douglas (Bags/Bins) GWK Trans Oranje (Bags/Bins/Bunkers)
GWK Luckhoff (Bins) OVK Havenga Brug (Bins)
GWK Marydale (Bins) OVK Morgenzon (Bins)
GWK Modderrivier (Bags/Bins/Bulk) OVK Oranjerivier (Bins/Bunkers)
GWK Prieska (Bins/Dams) OVK Prieska (Bins/Bunkers)
GWK Rietrivier (Bins) OVK Rietrivier (Bins)
Region 11: Vaalharts Region
GWK Barkly-Wes (Bins/Bulk) Senwes Jan Kempdorp (Bins)
GWK Jan Kempdorp (Bags/Bunkers) Senwes Magogong (Bins)
Senwes Hartswater (Bins)
Region 12: North West Western Region
NWK Blaauwbank (Bins) NWK Mareetsane (Bins)
NWK Bührmannsdrif (Bins) Suidwes Kameel (Bins)
NWK Kameel (Bins) Suidwes Vryburg (Bins)
Region 13: North West Central Region (Sannieshof)
NWK Biesiesvlei (Bins) NWK Oppaslaagte (Bins)
NWK Bossies (Bins) NWK Sannieshof (Bins)
NWK Gerdau (Bins)
Region 14: North West Southern Region
NWK Barberspan (Bins) NWK Taaibospan (Bins)
NWK Delareyville (Bins) Suidwes Amalia (Bins)
NWK Excelsior (Bins) Suidwes Hallatshope (Bins)
NWK Geysdorp (Bins) Suidwes Migdol (Bins)
NWK Migdol (Bins) Suidwes Schweizer-Reneke (Bins)
NWK Nooitgedacht (Bins)
Region 15: North West Southern-Eastern Region
Suidwes Bloemhof (Bins) Suidwes Kingswood (Bins)
Suidwes Christiana (Bins) Suidwes Kruising (Bunkers)
Suidwes Hertzogville (Bins) Suidwes Poppieland (Bunkers)
Suidwes Hoopstad (Bins)
Region 17: North West Central Northern Region (Ottosdal)
NWK Boschpoort (Bags/Bins/Bulk) NWK Vermaas (Bins)
NWK Kleinharts (Bins) Senwes Hartbeesfontein (Bins)
NWK Ottosdal (Bins) Senwes Melliodora (Bins)
NWK Rostrataville (Bins) Senwes Werda (Bins)
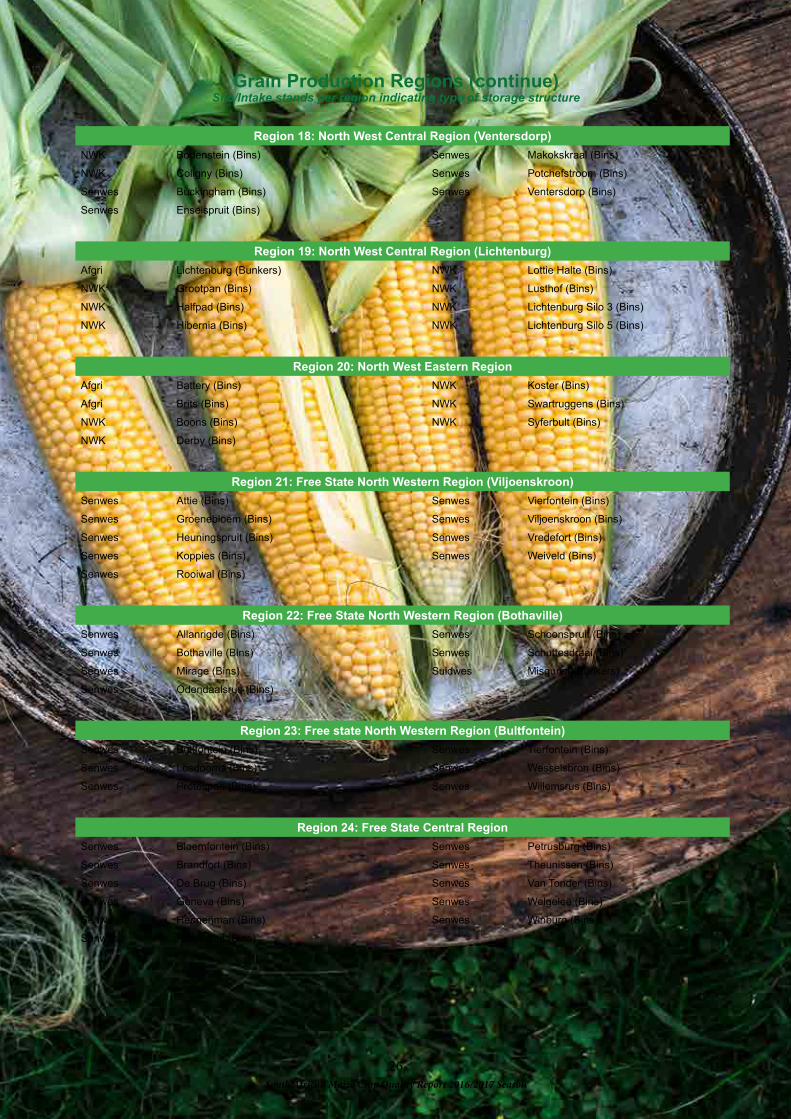
South African Maize Crop Quality Report 2016/2017 Season
26
Grain Production Regions (continue)Silo/Intake stands per region indicating type of storage structure
Region 18: North West Central Region (Ventersdorp)
NWK Bodenstein (Bins) Senwes Makokskraal (Bins)
NWK Coligny (Bins) Senwes Potchefstroom (Bins)
Senwes Buckingham (Bins) Senwes Ventersdorp (Bins)
Senwes Enselspruit (Bins)
Region 19: North West Central Region (Lichtenburg)
Afgri Lichtenburg (Bunkers) NWK Lottie Halte (Bins)
NWK Grootpan (Bins) NWK Lusthof (Bins)
NWK Halfpad (Bins) NWK Lichtenburg Silo 3 (Bins)
NWK Hibernia (Bins) NWK Lichtenburg Silo 5 (Bins)
Region 20: North West Eastern Region
Afgri Battery (Bins) NWK Koster (Bins)
Afgri Brits (Bins) NWK Swartruggens (Bins)
NWK Boons (Bins) NWK Syferbult (Bins)
NWK Derby (Bins)
Region 21: Free State North Western Region (Viljoenskroon)
Senwes Attie (Bins) Senwes Vierfontein (Bins)
Senwes Groenebloem (Bins) Senwes Viljoenskroon (Bins)
Senwes Heuningspruit (Bins) Senwes Vredefort (Bins)
Senwes Koppies (Bins) Senwes Weiveld (Bins)
Senwes Rooiwal (Bins)
Region 22: Free State North Western Region (Bothaville)
Senwes Allanrigde (Bins) Senwes Schoonspruit (Bins)
Senwes Bothaville (Bins) Senwes Schuttesdraai (Bins)
Senwes Mirage (Bins) Suidwes Misgunst (Bunkers)
Senwes Odendaalsrus (Bins)
Region 23: Free state North Western Region (Bultfontein)
Senwes Bultfontein (Bins) Senwes Tierfontein (Bins)
Senwes Losdoorns (Bins) Senwes Wesselsbron (Bins)
Senwes Protespan (Bins) Senwes Willemsrus (Bins)
Region 24: Free State Central Region
Senwes Bloemfontein (Bins) Senwes Petrusburg (Bins)
Senwes Brandfort (Bins) Senwes Theunissen (Bins)
Senwes De Brug (Bins) Senwes Van Tonder (Bins)
Senwes Geneva (Bins) Senwes Welgeleë (Bins)
Senwes Hennenman (Bins) Senwes Winburg (Bins)
Senwes Kroonstad (Bins)

South African Maize Crop Quality Report 2016/2017 Season
27
Grain Production Regions (continue)Silo/Intake stands per region indicating type of storage structure
Region 25: Free State South Western Region
Afgri Bethlehem (Bins) OVK Marseilles (Bins)
Afgri Slabberts (Bins) OVK Modderpoort (Bins)
OVK Clocolan (Bins) OVK Tweespruit (Bins)
OVK Ficksburg (Bins) OVK Westminster (Bins)
OVK Fouriesburg (Bins)
Region 26: Free State South Eastern Region
Afgri Kaallaagte (Bins) Afgri Monte Video (Bins)
Afgri Libertas (Bins) Afgri Senekal (Bins)
Afgri Marquard (Bins) Senwes Arlington (Bins)
Afgri Meets (Bins) Senwes Steynsrus (Bins)
Region 28: Free State Eastern Region
Afgri Afrikaskop (Bins/Bunkers) VKB Jim Fouché (Bins)
Afgri Eeram (Bins) VKB Memel (Bins)
Afgri Harrismith (Bins) VKB Reitz (Bins)
Afgri Kransfontein (Bins/Bunkers) VKB Tweeling (Bins)
VKB Ascent (Bins) VKB Villiers (Bins/Bulk)
VKB Cornelia (Bins) VKB Vrede (Bins)
VKB Daniëlsrus (Bins) VKB Warden (Bins)
VKB Frankfort (Bins) VKB Windfield (Bins)
Region 29: Mpumalanga Southern Region
Afgri Balfour (Bins) Afgri Leeuspruit (Bins)
Afgri Greylingstad (Bins) Afgri Platrand (Bins)
Afgri Grootvlei (Bins) Afgri Standerton (Bins)
Afgri Harvard (Bins) Afgri Val (Bins)
Afgri Holmdene (Bins)
Region 30: Mpumalanga Eastern Region
Afgri Amersfoort (Bins) Afgri Lothair (Bins)
Afgri Carolina (Bins) Afgri Maizefield (Bins)
Afgri Davel (Bins) Afgri Morgenzon (Bins)
Afgri Eerstelingsfontein (Bunkers) Afgri Overvaal (Bins)
Afgri Ermelo (Bins) Afgri Sandspruit (Bunkers)
Afgri Estancia (Bins) TWK Mkondo (Bins)
Afgri Hendriksvallei (Bunkers) TWK Panbult (Bins)
Region 31: Mpumalanga Central Region
Afgri Bakenlaagte (Bunkers) Afgri Klipfontein (Bunkers)
Afgri Bethal (Bins) Afgri Leslie (Bins)
Afgri Brakfontein (Bunkers) Afgri Palmietfontein (Bunkers)
Afgri Devon (Bins) Afgri Trichardt (Bins)
Afgri Kinross (Bins/Bunkers) Afgri Vaalkrantz (Bunkers)

South African Maize Crop Quality Report 2016/2017 Season
28
Grain Production Regions (continue)Silo/Intake stands per region indicating type of storage structure
Region 32: Mpumalanga Western Region
Afgri Argent (Bins/Bunkers) Afgri Hawerklip (Bins)
Afgri Dryden (Bins) Afgri Kendal (Bins)
Afgri Eloff (Bins) Afgri Ogies (Bins)
Afgri Endicott (Bins)
Region 33: Mpumalanga Northern Region
Afgri Arnot (Bins) Afgri Middelburg (Bins)
Afgri Driefontein (Bins) Afgri Pan (Bins)
Afgri Lydenburg (Bins) Afgri Stoffberg (Bins)
Afgri Marble Hall (Bins) Afgri Wonderfontein (Bins)
Region 34: Gauteng Region
Afgri Bloekomspruit (Bins) Afgri Nigel (Bins)
Afgri Bronkhorstspruit (Bins) Afgri Pretoria Wes (Bins)
Afgri Glenroy (Bins) Afgri Vogelvallei (Bunkers)
Afgri Goeie Hoek (Bins) Senwes Middelvlei (Bins)
Afgri Kaalfontein (Bins) Senwes Oberholzer (Bins)
Afgri Kliprivier (Bunkers) Senwes Raathsvlei (Bins)
Afgri Meyerton (Bunkers)
Region 35: Limpopo Region
Afgri Northam (Bins) NTK (VKB) Nylstroom (Modimolle) (Bins)
NTK (VKB) Alma (Bins) NTK (VKB) Potgietersrus (Mokopane) (Bins)
NTK (VKB) Lehau (Bins) NTK (VKB) Roedtan (Bins)
NTK (VKB) Naboomspruit (Mookgophong) (Bins) NTK (VKB) Settlers (Bins)
NTK (VKB) Nutfield (Bins) NTK (VKB) Warmbad Bela-Bela (Bins)
Region 36: KwaZulu-Natal Region
Afgri Bergville (Bins/Bunkers) Afgri Paulpietersburg (Bins)
Afgri Bloedrivier (Bins) Afgri Pietermaritzburg (Bins)
Afgri Dannhauser (Bins) Afgri Vryheid (Bins)
Afgri Dundee (Bins) Afgri Winterton Silo (Bins/Bunkers)
Afgri Mizpah (Bins)

South African Maize Crop Quality Report 2016/2017 Season
29
Main maize producing provinces – comparison of results
The quality of the maize produced in the three main maize production provinces, namely the Free State (regions 21 to 28), Mpumalanga (regions 29 to 33) and North West (regions 12 to 20) are compared below, the figures provided are all weighted averages.
Average test weights expressed in kilogram per hectoliter for white maize, varied from 76.8 in North West to 78.2 in the Free State. Yellow maize ranged between 76.3 kg/hl in Mpumalanga to 77.1 kg/hl in North West. The white maize 100 kernel mass values ranged from 32.8 g in North West to 35.9 g in Mpumalanga, the Free State averaged 35.4 g. The yellow maize kernels followed the same trend with 31.1 g in North West, 32.5 g in the Free State and 34.3 g in Mpumalanga.
Kernel sizes are indicated by the percentage of sample above a 10 mm sieve as well as the percentages above and below a 8 mm sieve. The largest white kernel size with regards to percentage of kernels above the 10 mm sieve, was found in the Free State (27.2%), as in the previous season. North West had the smallest kernel sizes namely 18.5%, Mpumalanga averaged 20.6%. Yellow maize kernels in Mpumalanga was found to be the largest on average 13.4%, followed by the Free State with 11.4% and North West with 10.3%.
Little variation was observed with regards to breakage susceptibility and especially stress cracks between the provinces. North West, with 1.4% had the highest percentage of white maize passing through the 6.35 mm sieve, followed by the Free State and Mpumalanga with 1.2% and 0.8% respectively. Yellow maize again followed the same trend with 1.6% in North West and the Free State and Mpumalanga following with 1.2% and 1.1%. This indicates that the maize in the North West was slightly more susceptible to breakage. The percentage stress cracks on white maize varied from 9% in North West, to 7% in the Free State and 6% in Mpumalanga. Stress cracks on yellow maize ranged from 7% in Mpumalanga to 9% in North West. These percentages again showed the same trend as on white maize. These percentages are slightly higher than in the previous season.
The percentage total defective kernels is the sum total of the defective kernels that remained above the 6.35 mm sieve and the defective kernels which passed through the 6.35 mm sieve. Defective kernels include amongst others, mouldy, discoloured, insect damaged and small kernels that can pass through the 6.35 mm round hole sieve. White maize averages ranged from a low of 3.8% in the Free State to a high of 5.4% in North West. Mpumalanga averaged 4.1%. The highest percentage total defective kernels on yellow maize was found in North West (4.9%), followed by the Free State with 4.3% and Mpumalanga with 2.9%. Please see page 92 for the definition of Defective maize kernels as quoted from the Grading Regulations.
The average milling index on white and yellow maize was as follows: Mpumalanga averaged 81.1 (76.5), the Free State 80.8 (73.8) and North West 76.2 (84.4). The values in brackets are the yellow maize averages. The highest percentage total extraction as determined on the Roff laboratory mill, was found on white maize from North West (78.7%), followed by the Free State with 78.6% and Mpumalanga with 78.3%.
The meal obtained from the white maize in North West gave an average whiteness index of 26.7 (unsifted) and 19.4 (sifted). The Free State had an average of 26.6 (unsifted) and 18.4 (sifted) and Mpumalanga 23.1 (unsifted) and 14.1 (sifted). All averages were lower than last season, indicating slightly less white meal this season. Factors that can influence meal whiteness such as the presence of defective kernels and other colour maize were however comparable to the previous season.
The nutritional component analyses namely fat, protein and starch compared well between the three provinces. North West and Mpumalanga both averaged 4.2% fat on white maize, The Free State averaged 4.1%. The average fat content of yellow maize ranged from 4.0% in North West to 4.2% in Mpumalanga. The lowest average protein content on white maize was found in North West (8.4%), Mpumalanga had the highest average of 8.9%, the Free State averaged 8.7%. North West and the Free State both averaged 8.9% protein on yellow maize, Mpumalanga averaged 9.0%. North West had the highest average starch content on white maize of 74.4%, closely followed by the Free State with 74.2% and Mpumalanga with 73.7%. The yellow maize starch content ranged from a low of 73.4% in Mpumalanga to 73.6% in the Free State and 74.2% in North West. These values are all reported on a dry basis.

South African Maize Crop Quality Report 2016/2017 Season
30
TA
BL
E 3
: R
SA
GR
AD
ING
OF
WH
ITE
MA
IZE
AC
CO
RD
ING
TO
GR
AD
E (
2016/2
017)
Nu
mb
er
of
sam
ple
s
Reg
ion
% D
efe
cti
ve K
ern
els
%
%%
%%
%%
%
Ab
ove 6
.35 m
mB
elo
w 6
.35
mm
To
tal
Fo
reig
nO
the
rC
om
bin
ed
Pin
ked
D
iplo
dia
Fu
sari
um
Co
bro
t
sie
ve
sie
ve
de
fec
tiv
em
att
er
Co
lou
r D
ev
iati
on
s
Kern
els
K
ern
els
Kern
els
Kern
els
ave.
min
. m
ax.
ave.
min
. m
ax
.a
ve
. m
in.
ma
x.
av
e.
min
. m
ax
.a
ve
. m
in.
ma
x.
av
e.
min
. m
ax.
ave.
min
. m
ax.
ave.
min
. m
ax.
ave.
min
. m
ax.
ave.
min
. m
ax.
GR
AD
E:
WM
1
2R
egio
n 1
01.2
1.1
1.2
1.4
1.2
1.5
2.5
2.3
2.7
0.0
0.0
0.0
0.0
0.0
0.0
2.5
2.3
2.7
0.0
0.0
0.0
0.0
0.0
0.0
0.0
0.0
0.0
0.0
0.0
0.0
1R
egio
n 1
11.9
--
2.2
--
4.1
--
0.3
--
0.6
--
4.9
--
0.0
--
0.4
--
0.5
--
0.9
--
13
Regio
n 1
22.1
0.6
4.3
1.2
0.5
2.0
3.3
1.0
6.1
0.1
0.0
0.2
0.0
0.0
0.3
3.4
1.2
6.2
2.2
0.0
7.9
0.2
0.0
0.8
0.2
0.0
0.9
0.4
0.0
1.2
20
Regio
n 1
32.6
0.8
4.7
2.0
1.2
2.8
4.6
2.6
6.2
0.1
0.0
0.3
0.2
0.0
1.4
4.8
2.7
6.3
0.1
0.0
0.6
0.3
0.0
0.8
0.5
0.0
2.0
0.9
0.0
2.8
30
Regio
n 1
42.1
0.6
4.1
1.5
0.2
4.3
3.5
1.1
6.5
0.0
0.0
0.1
0.1
0.0
0.4
3.6
1.1
6.5
0.4
0.0
2.5
0.1
0.0
0.5
0.4
0.0
1.4
0.4
0.0
1.6
4R
egio
n 1
52.4
2.2
2.6
1.3
1.1
1.5
3.7
3.5
3.9
0.1
0.1
0.1
0.0
0.0
0.0
3.8
3.6
4.1
0.7
0.6
0.8
0.5
0.4
0.6
1.2
1.1
1.3
1.7
1.6
1.8
15
Regio
n 1
72.3
0.7
3.5
2.6
1.4
4.2
4.9
2.9
7.0
0.1
0.0
0.2
0.0
0.0
0.3
5.1
2.9
7.2
0.7
0.0
2.0
0.3
0.0
1.1
0.5
0.0
1.3
0.9
0.0
1.9
6R
egio
n 1
82.8
1.3
4.2
2.5
1.4
4.3
5.3
4.1
6.4
0.1
0.0
0.2
0.1
0.0
0.2
5.4
4.4
6.6
0.2
0.0
1.1
0.1
0.0
0.3
0.1
0.0
0.2
0.2
0.0
0.4
11
Regio
n 1
91.9
0.6
3.7
1.4
0.9
2.6
3.3
2.1
5.1
0.1
0.0
0.3
0.0
0.0
0.4
3.4
2.1
5.1
0.3
0.0
1.7
0.2
0.0
0.8
0.6
0.0
1.9
0.7
0.0
2.7
21
Regio
n 2
02.6
1.2
5.7
1.6
0.7
3.2
4.2
2.6
6.7
0.1
0.0
0.2
0.3
0.0
2.4
4.6
3.0
6.7
0.4
0.0
3.6
0.2
0.0
0.9
0.6
0.0
1.4
0.8
0.0
2.1
56
Regio
n 2
12.2
0.8
4.1
1.4
0.2
3.0
3.6
2.0
5.3
0.2
0.0
0.3
0.2
0.0
1.0
3.9
2.0
5.7
0.0
0.0
0.6
0.3
0.0
1.0
0.8
0.0
2.5
1.2
0.0
3.0
31
Regio
n 2
22.3
1.3
4.5
1.2
0.4
1.8
3.6
2.1
5.6
0.1
0.0
0.2
0.1
0.0
0.6
3.8
2.1
5.6
0.2
0.0
1.4
0.3
0.0
0.5
0.9
0.0
1.3
1.2
0.0
1.7
16
Regio
n 2
32.4
1.4
3.2
1.9
1.0
3.0
4.3
2.4
5.7
0.1
0.0
0.3
0.1
0.0
0.5
4.6
2.6
6.4
0.1
0.0
1.0
0.3
0.0
0.6
0.7
0.0
1.5
1.1
0.0
2.0
16
Regio
n 2
42.5
1.0
4.6
1.9
1.3
3.6
4.4
2.8
6.1
0.1
0.0
0.3
0.1
0.0
0.5
4.6
3.4
6.7
0.0
0.0
0.3
0.3
0.0
0.7
1.1
0.0
2.4
1.4
0.0
3.2
4R
egio
n 2
52.4
0.9
4.4
1.4
1.0
2.1
3.8
1.9
6.5
0.2
0.1
0.2
0.3
0.0
0.5
4.2
2.1
7.2
0.0
0.0
0.0
0.4
0.0
0.8
1.1
0.4
2.1
1.5
0.4
2.9
19
Regio
n 2
61.9
0.9
3.3
1.6
0.6
3.1
3.5
1.7
5.4
0.2
0.1
0.3
0.3
0.0
1.0
4.0
1.8
6.1
0.1
0.0
0.6
0.2
0.0
0.6
0.7
0.0
1.7
1.0
0.0
2.2
21
Regio
n 2
81.9
0.6
4.0
1.0
0.1
2.6
2.9
1.4
5.7
0.1
0.0
0.3
0.2
0.0
0.8
3.2
1.7
6.3
0.2
0.0
1.0
0.3
0.0
0.7
0.7
0.0
2.0
1.0
0.0
2.7
26
Regio
n 2
92.5
0.8
4.5
1.5
0.4
4.7
3.9
1.4
7.0
0.1
0.0
0.3
0.3
0.0
1.0
4.4
2.3
7.9
0.2
0.0
0.7
0.5
0.0
1.0
1.1
0.0
2.0
1.6
0.0
3.1
17
Regio
n 3
03.1
1.9
5.7
1.8
0.7
2.7
4.9
3.1
7.0
0.2
0.0
0.3
0.3
0.0
0.8
5.4
3.4
7.7
0.0
0.0
0.1
0.6
0.1
1.8
1.3
0.1
2.7
1.9
0.6
3.8
15
Regio
n 3
12.4
1.6
4.0
1.6
0.8
2.2
4.0
2.8
5.1
0.2
0.1
0.3
0.3
0.0
0.7
4.4
3.4
5.8
0.0
0.0
0.0
0.4
0.0
0.8
1.1
0.5
1.6
1.5
0.8
2.4
19
Regio
n 3
22.7
1.6
4.3
1.6
0.8
2.8
4.3
2.6
6.0
0.2
0.1
0.3
0.2
0.0
1.0
4.6
3.1
6.8
0.2
0.0
1.2
0.4
0.0
1.0
1.1
0.5
2.1
1.5
0.5
2.8
38
Regio
n 3
32.6
1.5
5.1
1.7
0.8
3.4
4.3
3.0
6.9
0.2
0.1
0.3
0.2
0.0
1.2
4.7
3.2
7.1
0.1
0.0
1.0
0.5
0.0
1.5
1.1
0.0
3.0
1.6
0.0
4.5
38
Regio
n 3
42.7
1.3
4.7
1.6
0.6
3.3
4.3
2.8
6.0
0.2
0.1
0.3
0.3
0.0
1.2
4.8
3.0
6.4
0.0
0.0
0.6
0.6
0.0
1.2
1.2
0.0
2.5
1.8
0.0
3.6
5R
egio
n 3
51.1
0.5
3.2
1.7
0.4
2.9
2.8
1.3
4.1
0.1
0.0
0.2
0.1
0.0
0.5
3.0
1.4
4.1
0.7
0.0
3.1
0.1
0.0
0.3
0.0
0.0
0.0
0.1
0.0
0.3
25
Regio
n 3
62.2
0.7
3.8
1.6
0.3
2.8
3.8
2.4
5.5
0.1
0.0
0.2
0.2
0.0
0.6
4.1
2.6
5.7
0.2
0.0
1.7
0.4
0.0
0.9
0.8
0.2
1.8
1.1
0.2
2.3
469
Ave.
WM
12.4
1.6
3.9
0.1
0.2
4.3
0.2
0.3
0.8
1.2
Min
. W
M1
0.5
0.1
1.0
0.0
0.0
1.1
0.0
0.0
0.0
0.0
Max.
WM
15.7
4.7
7.0
0.3
2.4
7.9
7.9
1.8
3.0
4.5

South African Maize Crop Quality Report 2016/2017 Season
31
TA
BL
E 3
: R
SA
GR
AD
ING
OF
WH
ITE
MA
IZE
AC
CO
RD
ING
TO
GR
AD
E (
2016/2
017)
(co
nti
nu
e)
Nu
mb
er
of
sam
ple
s
Reg
ion
% D
efe
cti
ve K
ern
els
%
%%
%%
%%
%
Ab
ove 6
.35 m
mB
elo
w 6
.35
mm
To
tal
Fo
reig
nO
the
rC
om
bin
ed
Pin
ked
D
iplo
dia
Fu
sari
um
Co
bro
t
sie
ve
sie
ve
de
fec
tiv
em
att
er
Co
lou
r D
ev
iati
on
s
Kern
els
K
ern
els
Kern
els
Kern
els
ave.
min
. m
ax.
ave.
min
. m
ax
.a
ve
. m
in.
ma
x.
av
e.
min
. m
ax
.a
ve
. m
in.
ma
x.
av
e.
min
. m
ax.
ave.
min
. m
ax.
ave.
min
. m
ax.
ave.
min
. m
ax.
ave.
min
. m
ax.
GR
AD
E:
WM
2
4R
egio
n 1
24.6
2.4
5.8
2.0
1.5
2.7
6.6
3.8
7.8
0.2
0.0
0.4
0.1
0.0
0.2
6.9
4.2
8.2
0.6
0.0
1.8
0.4
0.0
1.2
1.0
0.6
1.5
1.4
0.9
2.1
8R
egio
n 1
34.4
0.3
8.5
3.9
1.6
6.9
8.3
7.2
12
.00
.20
.10
.40
.10
.00
.38
.57
.612.1
0.5
0.0
2.3
0.5
0.0
1.2
0.9
0.0
3.5
1.4
0.0
4.7
1R
egio
n 1
46.4
--
1.3
--
7.7
--
0.0
--
0.0
--
7.7
--
0.0
--
0.9
--
1.7
--
2.6
--
5R
egio
n 1
75.5
1.6
12.1
3.1
0.9
5.9
8.7
6.8
13
.00
.20
.00
.40
.70
.41
.29
.57
.614.2
0.2
0.0
0.8
0.7
0.5
1.1
2.1
0.5
5.1
2.8
1.1
5.8
1R
egio
n 1
83.6
--
3.8
--
7.4
--
0.1
--
0.2
--
7.7
--
0.5
--
0.5
--
0.5
--
1.0
--
9R
egio
n 1
93.1
1.3
5.3
4.5
0.8
10
.67
.62
.911
.80
.10
.00
.41
.20
.03
.88
.94
.012.0
0.3
0.0
1.9
0.4
0.0
1.7
0.9
0.3
2.0
1.3
0.3
3.5
1R
egio
n 2
08.3
--
0.9
--
9.2
--
0.1
--
2.7
--
12
.0-
-0.0
--
2.2
--
3.3
--
5.6
--
1R
egio
n 2
17.2
--
0.3
--
7.5
--
0.0
--
0.0
--
7.5
--
0.6
--
1.9
--
1.1
--
3.0
--
1R
egio
n 2
34.4
--
5.7
--
10
.2-
-0
.3-
-0
.0-
-1
0.4
--
0.0
--
1.0
--
1.5
--
2.5
--
3R
egio
n 2
62.6
2.0
3.5
4.8
2.5
6.9
7.4
6.0
9.3
0.4
0.3
0.5
0.4
0.0
0.8
8.3
7.2
10.1
0.0
0.0
0.0
0.3
0.0
0.6
1.1
0.4
1.6
1.4
0.4
2.3
4R
egio
n 2
95.7
2.2
9.6
1.7
1.0
2.1
7.4
3.2
11
.80
.30
.30
.50
.40
.00
.68
.24
.012.3
0.1
0.0
0.6
1.0
0.5
1.5
2.8
0.7
6.2
3.8
1.2
7.3
3R
egio
n 3
04.7
1.8
6.8
2.3
1.5
3.3
7.0
3.8
8.8
0.3
0.2
0.4
0.7
0.0
2.1
8.0
4.1
11.1
0.0
0.0
0.0
0.8
0.4
1.2
2.7
0.7
4.2
3.5
1.1
5.1
2R
egio
n 3
15.9
5.3
6.6
1.3
0.7
2.0
7.2
7.2
7.3
0.2
0.2
0.3
0.8
0.7
0.9
8.3
8.1
8.4
0.0
0.0
0.0
1.1
0.9
1.3
2.8
2.8
2.8
3.9
3.6
4.1
8R
egio
n 3
26.0
3.6
11.7
2.2
0.6
3.7
8.2
7.1
12
.50
.30
.20
.40
.50
.01
.39
.07
.414.1
0.2
0.0
1.0
0.9
0.5
1.3
3.3
1.2
7.8
4.2
2.2
9.1
5R
egio
n 3
35.6
2.1
11.0
1.6
0.6
4.0
7.2
3.3
11
.60
.30
.20
.40
.30
.00
.57
.83
.912.3
0.3
0.0
0.9
0.8
0.0
1.4
2.2
0.0
4.0
3.0
0.0
5.4
1R
egio
n 3
45.9
--
4.1
--
10
.0-
-0
.4-
-0
.7-
-11
.1-
-0.0
--
1.5
--
3.3
--
4.8
--
2R
egio
n 3
56.0
5.2
6.8
2.5
2.3
2.7
8.5
7.5
9.6
0.2
0.2
0.3
0.3
0.0
0.6
9.0
7.7
10.4
0.0
0.0
0.0
2.7
2.1
3.4
1.4
1.0
1.7
4.1
3.1
5.1
3R
egio
n 3
65.9
2.1
11.2
1.7
0.7
3.3
7.6
3.1
11
.90
.30
.10
.50
.00
.00
.07
.93
.612.0
0.0
0.0
0.1
0.7
0.0
1.4
3.1
0.7
6.9
3.8
0.7
8.3
62
A
ve.
WM
2
4.9
2.9
7.8
0.2
0.5
8.6
0.3
0.8
1.9
2.7
Min
. W
M2
0.3
0.3
2.9
0.0
0.0
3.6
0.0
0.0
0.0
0.0
M
ax.
WM
212.1
10
.61
3.0
0.5
3.8
14.2
2.3
3.4
7.8
9.1
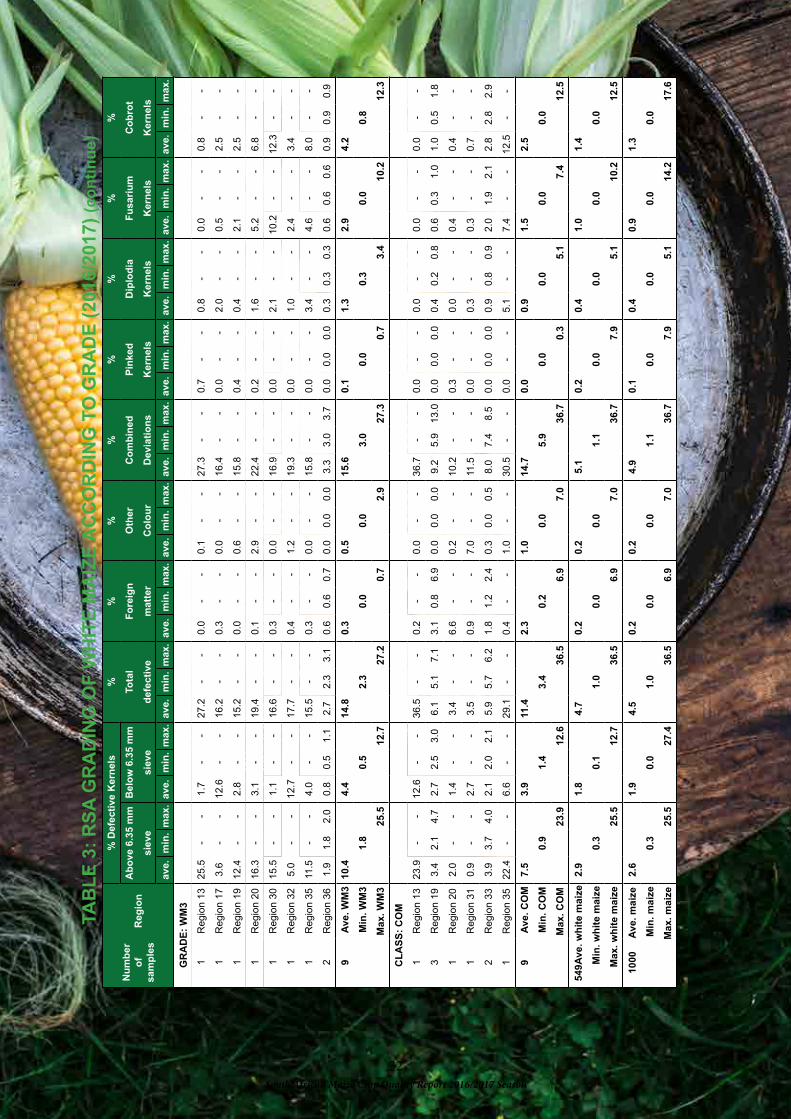
South African Maize Crop Quality Report 2016/2017 Season
32
TA
BL
E 3
: R
SA
GR
AD
ING
OF
WH
ITE
MA
IZE
AC
CO
RD
ING
TO
GR
AD
E (
2016/2
017)
(co
nti
nu
e)
Nu
mb
er
of
sam
ple
s
Reg
ion
% D
efe
cti
ve K
ern
els
%
%%
%%
%%
%
Ab
ove 6
.35 m
mB
elo
w 6
.35
mm
To
tal
Fo
reig
nO
the
rC
om
bin
ed
P
inked
D
iplo
dia
Fu
sari
um
Co
bro
t
sie
ve
sie
ve
de
fec
tiv
em
att
er
Co
lou
r D
ev
iati
on
s
Kern
els
K
ern
els
Kern
els
Kern
els
ave.
min
. m
ax.
ave.
min
. m
ax
.a
ve
. m
in.
ma
x.
av
e.
min
. m
ax
.a
ve
. m
in.
ma
x.
av
e.
min
. m
ax.
ave.
min
. m
ax.
ave.
min
. m
ax.
ave.
min
. m
ax.
ave.
min
. m
ax.
GR
AD
E:
WM
3
1R
egio
n 1
325.5
--
1.7
--
27
.2-
-0
.0-
-0
.1-
-2
7.3
--
0.7
--
0.8
--
0.0
--
0.8
--
1R
egio
n 1
73.6
--
12.6
--
16
.2-
-0
.3-
-0
.0-
-1
6.4
--
0.0
--
2.0
--
0.5
--
2.5
--
1R
egio
n 1
912.4
--
2.8
--
15
.2-
-0
.0-
-0
.6-
-1
5.8
--
0.4
--
0.4
--
2.1
--
2.5
--
1R
egio
n 2
016.3
--
3.1
--
19
.4-
-0
.1-
-2
.9-
-2
2.4
--
0.2
--
1.6
--
5.2
--
6.8
--
1R
egio
n 3
015.5
--
1.1
--
16
.6-
-0
.3-
-0
.0-
-1
6.9
--
0.0
--
2.1
--
10.2
--
12.3
--
1R
egio
n 3
25.0
--
12.7
--
17
.7-
-0
.4-
-1
.2-
-1
9.3
--
0.0
--
1.0
--
2.4
--
3.4
--
1R
egio
n 3
511.5
--
4.0
--
15
.5-
-0
.3-
-0
.0-
-1
5.8
--
0.0
--
3.4
--
4.6
--
8.0
--
2R
egio
n 3
61.9
1.8
2.0
0.8
0.5
1.1
2.7
2.3
3.1
0.6
0.6
0.7
0.0
0.0
0.0
3.3
3.0
3.7
0.0
0.0
0.0
0.3
0.3
0.3
0.6
0.6
0.6
0.9
0.9
0.9
9 A
ve.
WM
3
10.4
4.4
14
.80
.30
.51
5.6
0.1
1.3
2.9
4.2
M
in.
WM
31.8
0.5
2.3
0.0
0.0
3.0
0.0
0.3
0.0
0.8
Max.
WM
325.5
12
.72
7.2
0.7
2.9
27.3
0.7
3.4
10.2
12.3
CL
AS
S:
CO
M
1R
egio
n 1
323.9
--
12.6
--
36
.5-
-0
.2-
-0
.0-
-3
6.7
--
0.0
--
0.0
--
0.0
--
0.0
--
3R
egio
n 1
93.4
2.1
4.7
2.7
2.5
3.0
6.1
5.1
7.1
3.1
0.8
6.9
0.0
0.0
0.0
9.2
5.9
13.0
0.0
0.0
0.0
0.4
0.2
0.8
0.6
0.3
1.0
1.0
0.5
1.8
1R
egio
n 2
02.0
--
1.4
--
3.4
--
6.6
--
0.2
--
10
.2-
-0.3
--
0.0
--
0.4
--
0.4
--
1R
egio
n 3
10.9
--
2.7
--
3.5
--
0.9
--
7.0
--
11
.5-
-0.0
--
0.3
--
0.3
--
0.7
--
2R
egio
n 3
33.9
3.7
4.0
2.1
2.0
2.1
5.9
5.7
6.2
1.8
1.2
2.4
0.3
0.0
0.5
8.0
7.4
8.5
0.0
0.0
0.0
0.9
0.8
0.9
2.0
1.9
2.1
2.8
2.8
2.9
1R
egio
n 3
522.4
--
6.6
--
29
.1-
-0
.4-
-1
.0-
-3
0.5
--
0.0
--
5.1
--
7.4
--
12.5
--
9 A
ve.
CO
M7.5
3.9
11
.42
.31
.01
4.7
0.0
0.9
1.5
2.5
M
in.
CO
M0.9
1.4
3.4
0.2
0.0
5.9
0.0
0.0
0.0
0.0
Max.
CO
M23.9
12
.63
6.5
6.9
7.0
36.7
0.3
5.1
7.4
12.5
549A
ve.
wh
ite m
aiz
e
2.9
1.8
4.7
0.2
0.2
5.1
0.2
0.4
1.0
1.4
M
in.
wh
ite m
aiz
e0.3
0.1
1.0
0.0
0.0
1.1
0.0
0.0
0.0
0.0
M
ax.
wh
ite m
aiz
e25.5
12
.73
6.5
6.9
7.0
36.7
7.9
5.1
10.2
12.5
1000
Ave.
maiz
e2.6
1.9
4.5
0.2
0.2
4.9
0.1
0.4
0.9
1.3
M
in.
maiz
e0.3
0.0
1.0
0.0
0.0
1.1
0.0
0.0
0.0
0.0
Max.
maiz
e25.5
27
.43
6.5
6.9
7.0
36.7
7.9
5.1
14.2
17.6
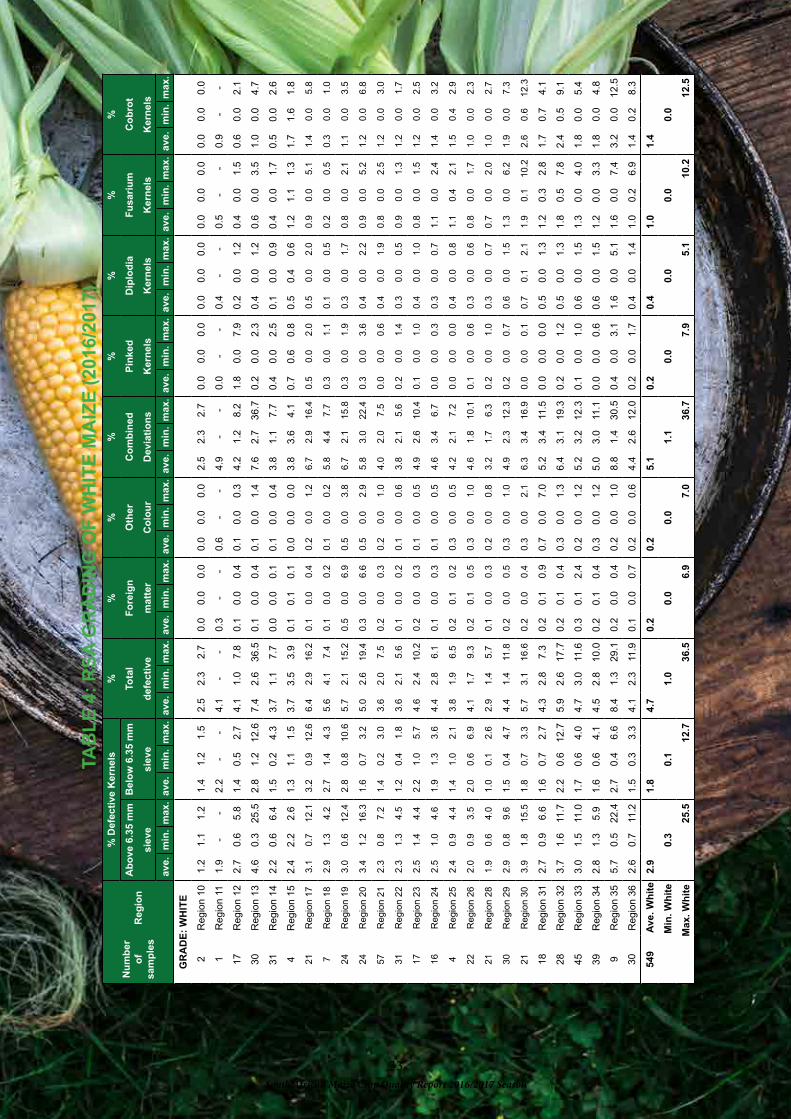
South African Maize Crop Quality Report 2016/2017 Season
33
TA
BL
E 4
: R
SA
GR
AD
ING
OF
WH
ITE
MA
IZE
(2016/2
017)
Nu
mb
er
of
sam
ple
s
Reg
ion
% D
efe
cti
ve K
ern
els
%
%%
%%
%%
%
Ab
ove 6
.35 m
mB
elo
w 6
.35
mm
To
tal
Fo
reig
nO
the
rC
om
bin
ed
Pin
ked
D
iplo
dia
Fu
sari
um
Co
bro
t
sie
ve
sie
ve
de
fec
tiv
em
att
er
Co
lou
r D
ev
iati
on
s
Kern
els
K
ern
els
Kern
els
Kern
els
ave.
min
. m
ax.
ave.
min
. m
ax
.a
ve
. m
in.
ma
x.
av
e.
min
. m
ax
.a
ve
. m
in.
ma
x.
av
e.
min
. m
ax.
ave.
min
. m
ax.
ave.
min
. m
ax.
ave.
min
. m
ax.
ave.
min
. m
ax.
GR
AD
E:
WH
ITE
2R
egio
n 1
01.2
1.1
1.2
1.4
1.2
1.5
2.5
2.3
2.7
0.0
0.0
0.0
0.0
0.0
0.0
2.5
2.3
2.7
0.0
0.0
0.0
0.0
0.0
0.0
0.0
0.0
0.0
0.0
0.0
0.0
1R
egio
n 1
11.9
--
2.2
--
4.1
--
0.3
--
0.6
--
4.9
--
0.0
--
0.4
--
0.5
--
0.9
--
17
Regio
n 1
22.7
0.6
5.8
1.4
0.5
2.7
4.1
1.0
7.8
0.1
0.0
0.4
0.1
0.0
0.3
4.2
1.2
8.2
1.8
0.0
7.9
0.2
0.0
1.2
0.4
0.0
1.5
0.6
0.0
2.1
30
Regio
n 1
34.6
0.3
25.5
2.8
1.2
12
.67
.42
.63
6.5
0.1
0.0
0.4
0.1
0.0
1.4
7.6
2.7
36.7
0.2
0.0
2.3
0.4
0.0
1.2
0.6
0.0
3.5
1.0
0.0
4.7
31
Regio
n 1
42.2
0.6
6.4
1.5
0.2
4.3
3.7
1.1
7.7
0.0
0.0
0.1
0.1
0.0
0.4
3.8
1.1
7.7
0.4
0.0
2.5
0.1
0.0
0.9
0.4
0.0
1.7
0.5
0.0
2.6
4R
egio
n 1
52.4
2.2
2.6
1.3
1.1
1.5
3.7
3.5
3.9
0.1
0.1
0.1
0.0
0.0
0.0
3.8
3.6
4.1
0.7
0.6
0.8
0.5
0.4
0.6
1.2
1.1
1.3
1.7
1.6
1.8
21
Regio
n 1
73.1
0.7
12.1
3.2
0.9
12.6
6.4
2.9
16.2
0.1
0.0
0.4
0.2
0.0
1.2
6.7
2.9
16
.40
.50
.02
.00
.50
.02
.00
.90
.05
.11
.40
.05
.8
7R
egio
n 1
82.9
1.3
4.2
2.7
1.4
4.3
5.6
4.1
7.4
0.1
0.0
0.2
0.1
0.0
0.2
5.8
4.4
7.7
0.3
0.0
1.1
0.1
0.0
0.5
0.2
0.0
0.5
0.3
0.0
1.0
24
Regio
n 1
93.0
0.6
12.4
2.8
0.8
10.6
5.7
2.1
15.2
0.5
0.0
6.9
0.5
0.0
3.8
6.7
2.1
15
.80
.30
.01
.90
.30
.01
.70
.80
.02
.11
.10
.03
.5
24
Regio
n 2
03.4
1.2
16.3
1.6
0.7
3.2
5.0
2.6
19.4
0.3
0.0
6.6
0.5
0.0
2.9
5.8
3.0
22
.40
.30
.03
.60
.40
.02
.20
.90
.05
.21
.20
.06
.8
57
Regio
n 2
12.3
0.8
7.2
1.4
0.2
3.0
3.6
2.0
7.5
0.2
0.0
0.3
0.2
0.0
1.0
4.0
2.0
7.5
0.0
0.0
0.6
0.4
0.0
1.9
0.8
0.0
2.5
1.2
0.0
3.0
31
Regio
n 2
22.3
1.3
4.5
1.2
0.4
1.8
3.6
2.1
5.6
0.1
0.0
0.2
0.1
0.0
0.6
3.8
2.1
5.6
0.2
0.0
1.4
0.3
0.0
0.5
0.9
0.0
1.3
1.2
0.0
1.7
17
Regio
n 2
32.5
1.4
4.4
2.2
1.0
5.7
4.6
2.4
10.2
0.2
0.0
0.3
0.1
0.0
0.5
4.9
2.6
10
.40
.10
.01
.00
.40
.01
.00
.80
.01
.51
.20
.02
.5
16
Regio
n 2
42.5
1.0
4.6
1.9
1.3
3.6
4.4
2.8
6.1
0.1
0.0
0.3
0.1
0.0
0.5
4.6
3.4
6.7
0.0
0.0
0.3
0.3
0.0
0.7
1.1
0.0
2.4
1.4
0.0
3.2
4R
egio
n 2
52.4
0.9
4.4
1.4
1.0
2.1
3.8
1.9
6.5
0.2
0.1
0.2
0.3
0.0
0.5
4.2
2.1
7.2
0.0
0.0
0.0
0.4
0.0
0.8
1.1
0.4
2.1
1.5
0.4
2.9
22
Regio
n 2
62.0
0.9
3.5
2.0
0.6
6.9
4.1
1.7
9.3
0.2
0.1
0.5
0.3
0.0
1.0
4.6
1.8
10
.10
.10
.00
.60
.30
.00
.60
.80
.01
.71
.00
.02
.3
21
Regio
n 2
81.9
0.6
4.0
1.0
0.1
2.6
2.9
1.4
5.7
0.1
0.0
0.3
0.2
0.0
0.8
3.2
1.7
6.3
0.2
0.0
1.0
0.3
0.0
0.7
0.7
0.0
2.0
1.0
0.0
2.7
30
Regio
n 2
92.9
0.8
9.6
1.5
0.4
4.7
4.4
1.4
11.8
0.2
0.0
0.5
0.3
0.0
1.0
4.9
2.3
12
.30
.20
.00
.70
.60
.01
.51
.30
.06
.21
.90
.07
.3
21
Regio
n 3
03.9
1.8
15.5
1.8
0.7
3.3
5.7
3.1
16.6
0.2
0.0
0.4
0.3
0.0
2.1
6.3
3.4
16
.90
.00
.00
.10
.70
.12
.11
.90
.11
0.2
2.6
0.6
12
.3
18
Regio
n 3
12.7
0.9
6.6
1.6
0.7
2.7
4.3
2.8
7.3
0.2
0.1
0.9
0.7
0.0
7.0
5.2
3.4
11.5
0.0
0.0
0.0
0.5
0.0
1.3
1.2
0.3
2.8
1.7
0.7
4.1
28
Regio
n 3
23.7
1.6
11.7
2.2
0.6
12
.75
.92
.61
7.7
0.2
0.1
0.4
0.3
0.0
1.3
6.4
3.1
19.3
0.2
0.0
1.2
0.5
0.0
1.3
1.8
0.5
7.8
2.4
0.5
9.1
45
Regio
n 3
33.0
1.5
11.0
1.7
0.6
4.0
4.7
3.0
11
.60
.30
.12
.40
.20
.01
.25
.23
.212.3
0.1
0.0
1.0
0.6
0.0
1.5
1.3
0.0
4.0
1.8
0.0
5.4
39
Regio
n 3
42.8
1.3
5.9
1.6
0.6
4.1
4.5
2.8
10
.00
.20
.10
.40
.30
.01
.25
.03
.011.1
0.0
0.0
0.6
0.6
0.0
1.5
1.2
0.0
3.3
1.8
0.0
4.8
9R
egio
n 3
55.7
0.5
22.4
2.7
0.4
6.6
8.4
1.3
29
.10
.20
.00
.40
.20
.01
.08
.81
.430.5
0.4
0.0
3.1
1.6
0.0
5.1
1.6
0.0
7.4
3.2
0.0
12.5
30
Regio
n 3
62.6
0.7
11.2
1.5
0.3
3.3
4.1
2.3
11
.90
.10
.00
.70
.20
.00
.64
.42
.612.0
0.2
0.0
1.7
0.4
0.0
1.4
1.0
0.2
6.9
1.4
0.2
8.3
549
Ave.
Wh
ite
2.9
1.8
4.7
0.2
0.2
5.1
0.2
0.4
1.0
1.4
Min
. W
hit
e0.3
0.1
1.0
0.0
0.0
1.1
0.0
0.0
0.0
0.0
M
ax.
Wh
ite
25.5
12
.73
6.5
6.9
7.0
36.7
7.9
5.1
10.2
12.5
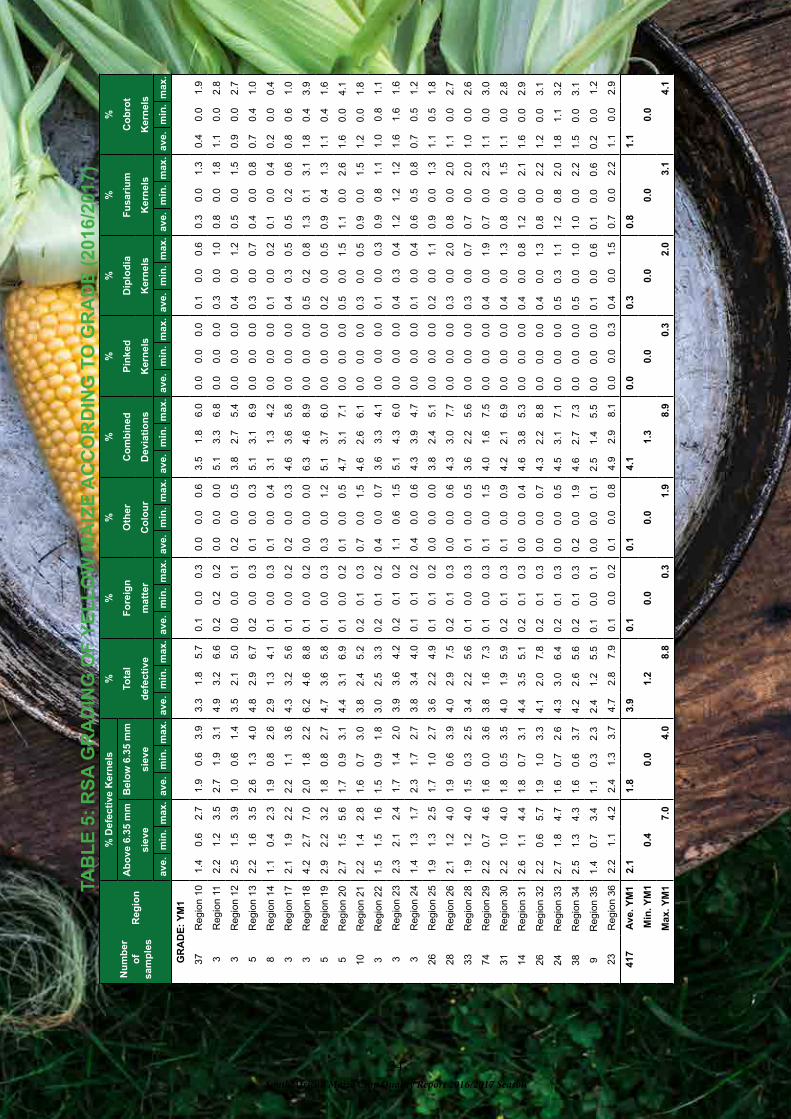
South African Maize Crop Quality Report 2016/2017 Season
34
TA
BL
E 5
: R
SA
GR
AD
ING
OF
YE
LL
OW
MA
IZE
AC
CO
RD
ING
TO
GR
AD
E (
2016/2
017)
Nu
mb
er
of
sam
ple
s
Reg
ion
% D
efe
cti
ve K
ern
els
%
%%
%%
%%
%
Ab
ove 6
.35 m
mB
elo
w 6
.35
mm
To
tal
Fo
reig
nO
the
rC
om
bin
ed
P
inked
D
iplo
dia
Fu
sari
um
Co
bro
t
sie
ve
sie
ve
de
fec
tiv
em
att
er
Co
lou
r D
ev
iati
on
s
Kern
els
K
ern
els
Kern
els
Kern
els
ave.
min
. m
ax.
ave.
min
. m
ax
.a
ve
. m
in.
ma
x.
av
e.
min
. m
ax
.a
ve
. m
in.
ma
x.
av
e.
min
. m
ax.
ave.
min
. m
ax.
ave.
min
. m
ax.
ave.
min
. m
ax.
ave.
min
. m
ax.
GR
AD
E:
YM
1
37
Regio
n 1
01.4
0.6
2.7
1.9
0.6
3.9
3.3
1.8
5.7
0.1
0.0
0.3
0.0
0.0
0.6
3.5
1.8
6.0
0.0
0.0
0.0
0.1
0.0
0.6
0.3
0.0
1.3
0.4
0.0
1.9
3R
egio
n 1
12.2
1.2
3.5
2.7
1.9
3.1
4.9
3.2
6.6
0.2
0.2
0.2
0.0
0.0
0.0
5.1
3.3
6.8
0.0
0.0
0.0
0.3
0.0
1.0
0.8
0.0
1.8
1.1
0.0
2.8
3R
egio
n 1
22.5
1.5
3.9
1.0
0.6
1.4
3.5
2.1
5.0
0.0
0.0
0.1
0.2
0.0
0.5
3.8
2.7
5.4
0.0
0.0
0.0
0.4
0.0
1.2
0.5
0.0
1.5
0.9
0.0
2.7
5R
egio
n 1
32.2
1.6
3.5
2.6
1.3
4.0
4.8
2.9
6.7
0.2
0.0
0.3
0.1
0.0
0.3
5.1
3.1
6.9
0.0
0.0
0.0
0.3
0.0
0.7
0.4
0.0
0.8
0.7
0.4
1.0
8R
egio
n 1
41.1
0.4
2.3
1.9
0.8
2.6
2.9
1.3
4.1
0.1
0.0
0.3
0.1
0.0
0.4
3.1
1.3
4.2
0.0
0.0
0.0
0.1
0.0
0.2
0.1
0.0
0.4
0.2
0.0
0.4
3R
egio
n 1
72.1
1.9
2.2
2.2
1.1
3.6
4.3
3.2
5.6
0.1
0.0
0.2
0.2
0.0
0.3
4.6
3.6
5.8
0.0
0.0
0.0
0.4
0.3
0.5
0.5
0.2
0.6
0.8
0.6
1.0
3R
egio
n 1
84.2
2.7
7.0
2.0
1.8
2.2
6.2
4.6
8.8
0.1
0.0
0.2
0.0
0.0
0.0
6.3
4.6
8.9
0.0
0.0
0.0
0.5
0.2
0.8
1.3
0.1
3.1
1.8
0.4
3.9
5R
egio
n 1
92.9
2.2
3.2
1.8
0.8
2.7
4.7
3.6
5.8
0.1
0.0
0.3
0.3
0.0
1.2
5.1
3.7
6.0
0.0
0.0
0.0
0.2
0.0
0.5
0.9
0.4
1.3
1.1
0.4
1.6
5R
egio
n 2
02.7
1.5
5.6
1.7
0.9
3.1
4.4
3.1
6.9
0.1
0.0
0.2
0.1
0.0
0.5
4.7
3.1
7.1
0.0
0.0
0.0
0.5
0.0
1.5
1.1
0.0
2.6
1.6
0.0
4.1
10
Regio
n 2
12.2
1.4
2.8
1.6
0.7
3.0
3.8
2.4
5.2
0.2
0.1
0.3
0.7
0.0
1.5
4.6
2.6
6.1
0.0
0.0
0.0
0.3
0.0
0.5
0.9
0.0
1.5
1.2
0.0
1.8
3R
egio
n 2
21.5
1.5
1.6
1.5
0.9
1.8
3.0
2.5
3.3
0.2
0.1
0.2
0.4
0.0
0.7
3.6
3.3
4.1
0.0
0.0
0.0
0.1
0.0
0.3
0.9
0.8
1.1
1.0
0.8
1.1
3R
egio
n 2
32.3
2.1
2.4
1.7
1.4
2.0
3.9
3.6
4.2
0.2
0.1
0.2
1.1
0.6
1.5
5.1
4.3
6.0
0.0
0.0
0.0
0.4
0.3
0.4
1.2
1.2
1.2
1.6
1.6
1.6
3R
egio
n 2
41.4
1.3
1.7
2.3
1.7
2.7
3.8
3.4
4.0
0.1
0.1
0.2
0.4
0.0
0.6
4.3
3.9
4.7
0.0
0.0
0.0
0.1
0.0
0.4
0.6
0.5
0.8
0.7
0.5
1.2
26
Regio
n 2
51.9
1.3
2.5
1.7
1.0
2.7
3.6
2.2
4.9
0.1
0.1
0.2
0.0
0.0
0.0
3.8
2.4
5.1
0.0
0.0
0.0
0.2
0.0
1.1
0.9
0.0
1.3
1.1
0.5
1.8
28
Regio
n 2
62.1
1.2
4.0
1.9
0.6
3.9
4.0
2.9
7.5
0.2
0.1
0.3
0.0
0.0
0.6
4.3
3.0
7.7
0.0
0.0
0.0
0.3
0.0
2.0
0.8
0.0
2.0
1.1
0.0
2.7
33
Regio
n 2
81.9
1.2
4.0
1.5
0.3
2.5
3.4
2.2
5.6
0.1
0.0
0.3
0.1
0.0
0.5
3.6
2.2
5.6
0.0
0.0
0.0
0.3
0.0
0.7
0.7
0.0
2.0
1.0
0.0
2.6
74
Regio
n 2
92.2
0.7
4.6
1.6
0.0
3.6
3.8
1.6
7.3
0.1
0.0
0.3
0.1
0.0
1.5
4.0
1.6
7.5
0.0
0.0
0.0
0.4
0.0
1.9
0.7
0.0
2.3
1.1
0.0
3.0
31
Regio
n 3
02.2
1.0
4.0
1.8
0.5
3.5
4.0
1.9
5.9
0.2
0.1
0.3
0.1
0.0
0.9
4.2
2.1
6.9
0.0
0.0
0.0
0.4
0.0
1.3
0.8
0.0
1.5
1.1
0.0
2.8
14
Regio
n 3
12.6
1.1
4.4
1.8
0.7
3.1
4.4
3.5
5.1
0.2
0.1
0.3
0.0
0.0
0.4
4.6
3.8
5.3
0.0
0.0
0.0
0.4
0.0
0.8
1.2
0.0
2.1
1.6
0.0
2.9
26
Regio
n 3
22.2
0.6
5.7
1.9
1.0
3.3
4.1
2.0
7.8
0.2
0.1
0.3
0.0
0.0
0.7
4.3
2.2
8.8
0.0
0.0
0.0
0.4
0.0
1.3
0.8
0.0
2.2
1.2
0.0
3.1
24
Regio
n 3
32.7
1.8
4.7
1.6
0.7
2.6
4.3
3.0
6.4
0.2
0.1
0.3
0.0
0.0
0.5
4.5
3.1
7.1
0.0
0.0
0.0
0.5
0.3
1.1
1.2
0.8
2.0
1.8
1.1
3.2
38
Regio
n 3
42.5
1.3
4.3
1.6
0.6
3.7
4.2
2.6
5.6
0.2
0.1
0.3
0.2
0.0
1.9
4.6
2.7
7.3
0.0
0.0
0.0
0.5
0.0
1.0
1.0
0.0
2.2
1.5
0.0
3.1
9R
egio
n 3
51.4
0.7
3.4
1.1
0.3
2.3
2.4
1.2
5.5
0.1
0.0
0.1
0.0
0.0
0.1
2.5
1.4
5.5
0.0
0.0
0.0
0.1
0.0
0.6
0.1
0.0
0.6
0.2
0.0
1.2
23
Regio
n 3
62.2
1.1
4.2
2.4
1.3
3.7
4.7
2.8
7.9
0.1
0.0
0.2
0.1
0.0
0.8
4.9
2.9
8.1
0.0
0.0
0.3
0.4
0.0
1.5
0.7
0.0
2.2
1.1
0.0
2.9
417
Ave. Y
M1
2.1
1.8
3.9
0.1
0.1
4.1
0.0
0.3
0.8
1.1
M
in. Y
M1
0.4
0.0
1.2
0.0
0.0
1.3
0.0
0.0
0.0
0.0
Max. Y
M1
7.0
4.0
8.8
0.3
1.9
8.9
0.3
2.0
3.1
4.1

South African Maize Crop Quality Report 2016/2017 Season
35
TA
BL
E 5
: R
SA
GR
AD
ING
OF
YE
LL
OW
MA
IZE
AC
CO
RD
ING
TO
GR
AD
E (
2016/2
017)
(co
nti
nu
e)
Nu
mb
er
of
sam
ple
s
Reg
ion
% D
efe
cti
ve K
ern
els
%
%%
%%
%%
%
Ab
ove 6
.35 m
mB
elo
w 6
.35
mm
To
tal
Fo
reig
nO
the
rC
om
bin
ed
Pin
ked
D
iplo
dia
Fu
sari
um
Co
bro
t
sie
ve
sie
ve
de
fec
tiv
em
att
er
Co
lou
r D
ev
iati
on
s
Kern
els
K
ern
els
Kern
els
Kern
els
ave.
min
. m
ax.
ave.
min
. m
ax
.a
ve
. m
in.
ma
x.
av
e.
min
. m
ax
.a
ve
. m
in.
ma
x.
av
e.
min
. m
ax.
ave.
min
. m
ax.
ave.
min
. m
ax.
ave.
min
. m
ax.
ave.
min
. m
ax.
GR
AD
E:
YM
2
1R
egio
n 1
18.3
--
2.8
--
11
.1-
-0
.2-
-0
.0-
-11
.3-
-0.0
--
2.5
--
3.4
--
5.9
--
1R
egio
n 1
312.3
--
3.0
--
15
.3-
-0
.0-
-0
.0-
-1
5.3
--
0.0
--
0.0
--
0.1
--
0.1
--
1R
egio
n 1
72.5
--
1.6
--
4.2
--
0.4
--
0.5
--
5.1
--
0.0
--
0.4
--
1.1
--
1.6
--
1R
egio
n 1
99.5
--
2.0
--
11
.4-
-0
.0-
-0
.3-
-11
.7-
-0.0
--
0.6
--
3.2
--
3.8
--
3R
egio
n 2
03.6
1.2
5.9
2.9
1.5
4.1
6.5
2.7
9.0
0.1
0.0
0.2
1.0
0.0
2.3
7.6
5.0
9.2
0.0
0.0
0.0
0.9
0.0
1.9
1.0
0.2
1.8
1.9
0.2
2.9
1R
egio
n 2
10.7
--
4.6
--
5.3
--
0.1
--
0.0
--
5.4
--
0.0
--
0.0
--
0.0
--
0.0
--
1R
egio
n 2
32.5
--
6.7
--
9.2
--
0.2
--
0.0
--
9.4
--
0.0
--
0.3
--
0.9
--
1.1
--
6R
egio
n 2
64.9
1.2
8.9
4.9
4.1
5.9
9.8
6.4
14
.80
.30
.10
.40
.60
.01
.31
0.7
6.6
15.1
0.0
0.0
0.0
0.4
0.0
0.8
1.3
0.5
2.3
1.7
0.5
3.1
1R
egio
n 2
96.9
--
2.4
--
9.3
--
0.3
--
0.0
--
9.6
--
0.0
--
0.7
--
1.2
--
1.9
--
2R
egio
n 3
06.4
5.2
7.6
2.7
2.6
2.7
9.0
7.8
10
.30
.30
.30
.30
.60
.01
.19
.99
.210.6
0.0
0.0
0.0
1.6
0.7
2.5
2.3
1.7
3.0
4.0
3.7
4.2
2R
egio
n 3
37.5
3.7
11.2
6.9
4.2
9.6
14
.31
3.3
15
.40
.30
.20
.51
.20
.51
.91
5.8
14.3
17.4
0.0
0.0
0.0
1.7
0.9
2.5
4.0
1.9
6.2
5.8
2.8
8.7
2R
egio
n 3
43.0
2.8
3.3
3.2
2.4
4.1
6.3
5.2
7.3
0.2
0.2
0.3
3.1
2.9
3.3
9.6
8.4
10.9
0.0
0.0
0.0
0.6
0.6
0.7
1.6
1.4
1.7
2.2
2.1
2.3
1R
egio
n 3
52.5
--
5.1
--
7.6
--
0.3
--
0.6
--
8.5
--
0.0
--
0.0
--
0.0
--
0.0
--
5R
egio
n 3
62.0
0.9
4.8
4.3
3.0
5.0
6.3
3.9
9.8
0.2
0.1
0.3
0.6
0.0
3.2
7.1
5.3
10.0
0.0
0.0
0.0
0.2
0.0
0.6
0.8
0.1
2.8
0.9
0.1
3.5
28
A
ve. Y
M2
4.6
4.1
8.7
0.2
0.7
9.6
0.0
0.7
1.4
2.1
M
in. Y
M2
0.7
1.5
2.7
0.0
0.0
5.0
0.0
0.0
0.0
0.0
M
ax. Y
M2
12.3
9.6
15
.40
.53
.317.4
0.0
2.5
6.2
8.7
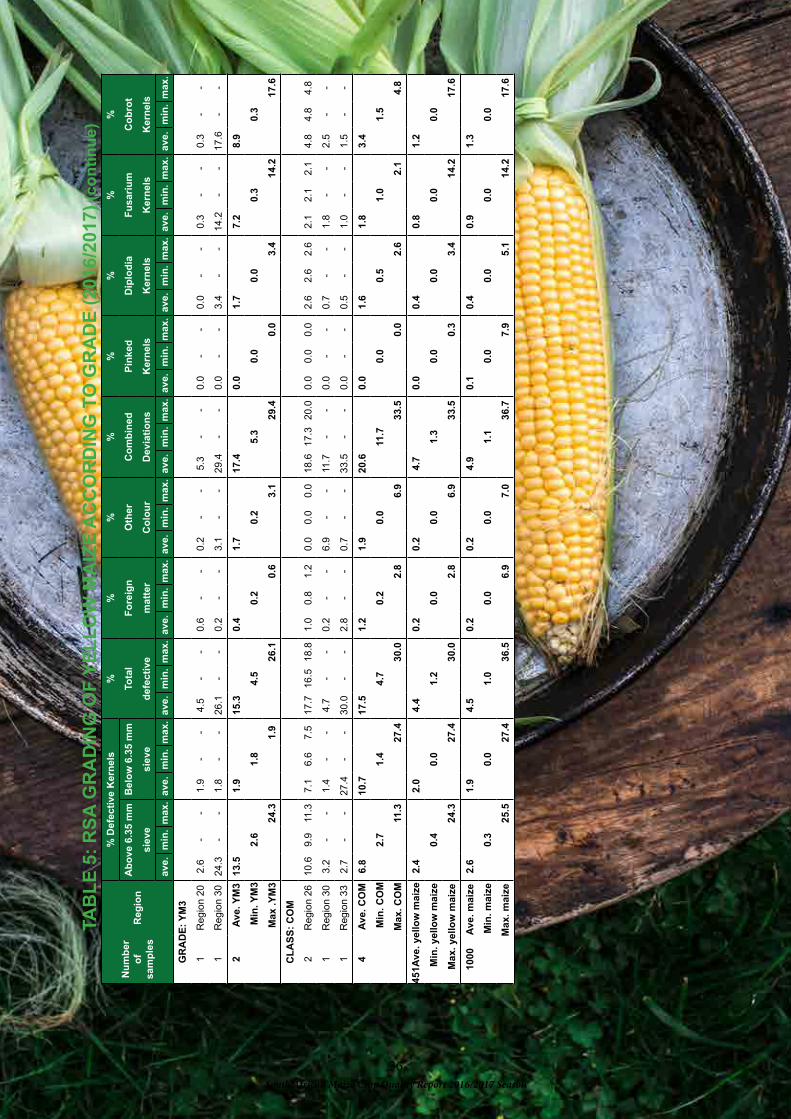
South African Maize Crop Quality Report 2016/2017 Season
36
TA
BL
E 5
: R
SA
GR
AD
ING
OF
YE
LL
OW
MA
IZE
AC
CO
RD
ING
TO
GR
AD
E (
2016/2
017)
(co
nti
nu
e)
Nu
mb
er
of
sam
ple
s
Reg
ion
% D
efe
cti
ve K
ern
els
%
%%
%%
%%
%
Ab
ove 6
.35 m
mB
elo
w 6
.35
mm
To
tal
Fo
reig
nO
the
rC
om
bin
ed
P
inked
D
iplo
dia
Fu
sari
um
Co
bro
t
sie
ve
sie
ve
de
fec
tiv
em
att
er
Co
lou
r D
ev
iati
on
s
Kern
els
K
ern
els
Kern
els
Kern
els
ave.
min
. m
ax.
ave.
min
. m
ax
.a
ve
. m
in.
ma
x.
av
e.
min
. m
ax
.a
ve
. m
in.
ma
x.
av
e.
min
. m
ax.
ave.
min
. m
ax.
ave.
min
. m
ax.
ave.
min
. m
ax.
ave.
min
. m
ax.
GR
AD
E:
YM
3
1R
egio
n 2
02.6
--
1.9
--
4.5
--
0.6
--
0.2
--
5.3
--
0.0
--
0.0
--
0.3
--
0.3
--
1R
egio
n 3
024.3
--
1.8
--
26
.1-
-0
.2-
-3
.1-
-2
9.4
--
0.0
--
3.4
--
14.2
--
17.6
--
2
Ave. Y
M3
13.5
1.9
15
.30
.41
.71
7.4
0.0
1.7
7.2
8.9
M
in. Y
M3
2.6
1.8
4.5
0.2
0.2
5.3
0.0
0.0
0.3
0.3
M
ax .
YM
324.3
1.9
26
.10
.63
.129.4
0.0
3.4
14.2
17.6
CL
AS
S:
CO
M
2R
egio
n 2
610.6
9.9
11.3
7.1
6.6
7.5
17
.71
6.5
18
.81
.00
.81
.20
.00
.00
.01
8.6
17
.320.0
0.0
0.0
0.0
2.6
2.6
2.6
2.1
2.1
2.1
4.8
4.8
4.8
1R
egio
n 3
03.2
--
1.4
--
4.7
--
0.2
--
6.9
--
11
.7-
-0.0
--
0.7
--
1.8
--
2.5
--
1R
egio
n 3
32.7
--
27.4
--
30
.0-
-2
.8-
-0
.7-
-3
3.5
--
0.0
--
0.5
--
1.0
--
1.5
--
4 A
ve.
CO
M6.8
10.7
17
.51
.21
.92
0.6
0.0
1.6
1.8
3.4
M
in.
CO
M2.7
1.4
4.7
0.2
0.0
11.7
0.0
0.5
1.0
1.5
Max.
CO
M11.3
27
.43
0.0
2.8
6.9
33.5
0.0
2.6
2.1
4.8
451A
ve.
yell
ow
maiz
e2.4
2.0
4.4
0.2
0.2
4.7
0.0
0.4
0.8
1.2
M
in.
yell
ow
maiz
e0.4
0.0
1.2
0.0
0.0
1.3
0.0
0.0
0.0
0.0
M
ax.
yell
ow
maiz
e24.3
27
.43
0.0
2.8
6.9
33.5
0.3
3.4
14.2
17.6
1000
Ave.
maiz
e2.6
1.9
4.5
0.2
0.2
4.9
0.1
0.4
0.9
1.3
Min
. m
aiz
e0.3
0.0
1.0
0.0
0.0
1.1
0.0
0.0
0.0
0.0
M
ax.
maiz
e25.5
27
.43
6.5
6.9
7.0
36.7
7.9
5.1
14.2
17.6

South African Maize Crop Quality Report 2016/2017 Season
37
TA
BL
E 6
: R
SA
GR
AD
ING
OF
YE
LL
OW
MA
IZE
(2016/2
017)
Nu
mb
er
of
sam
ple
s
Reg
ion
% D
efe
cti
ve K
ern
els
%
%%
%%
%%
%
Ab
ove 6
.35 m
mB
elo
w 6
.35
mm
To
tal
Fo
reig
nO
the
rC
om
bin
ed
P
inked
D
iplo
dia
Fu
sari
um
Co
bro
t
sie
ve
sie
ve
de
fec
tiv
em
att
er
Co
lou
r D
ev
iati
on
s
Kern
els
K
ern
els
Kern
els
Kern
els
ave.
min
. m
ax.
ave.
min
. m
ax
.a
ve
. m
in.
ma
x.
av
e.
min
. m
ax
.a
ve
. m
in.
ma
x.
av
e.
min
. m
ax.
ave.
min
. m
ax.
ave.
min
. m
ax.
ave.
min
. m
ax.
ave.
min
. m
ax.
GR
AD
E:
YE
LL
OW
37
Regio
n 1
01.4
0.6
2.7
1.9
0.6
3.9
3.3
1.8
5.7
0.1
0.0
0.3
0.0
0.0
0.6
3.5
1.8
6.0
0.0
0.0
0.0
0.1
0.0
0.6
0.3
0.0
1.3
0.4
0.0
1.9
4R
egio
n 1
13.7
1.2
8.3
2.7
1.9
3.1
6.4
3.2
11.1
0.2
0.2
0.2
0.0
0.0
0.0
6.6
3.3
11
.30
.00
.00
.00
.90
.02
.51
.40
.03
.42
.30
.05
.9
3R
egio
n 1
22.5
1.5
3.9
1.0
0.6
1.4
3.5
2.1
5.0
0.0
0.0
0.1
0.2
0.0
0.5
3.8
2.7
5.4
0.0
0.0
0.0
0.4
0.0
1.2
0.5
0.0
1.5
0.9
0.0
2.7
6R
egio
n 1
33.9
1.6
12.3
2.7
1.3
4.0
6.5
2.9
15.3
0.1
0.0
0.3
0.1
0.0
0.3
6.8
3.1
15
.30
.00
.00
.00
.30
.00
.70
.30
.00
.80
.60
.11
.0
8R
egio
n 1
41.1
0.4
2.3
1.9
0.8
2.6
2.9
1.3
4.1
0.1
0.0
0.3
0.1
0.0
0.4
3.1
1.3
4.2
0.0
0.0
0.0
0.1
0.0
0.2
0.1
0.0
0.4
0.2
0.0
0.4
4R
egio
n 1
72.2
1.9
2.5
2.1
1.1
3.6
4.3
3.2
5.6
0.2
0.0
0.4
0.2
0.0
0.5
4.7
3.6
5.8
0.0
0.0
0.0
0.4
0.3
0.5
0.6
0.2
1.1
1.0
0.6
1.6
3R
egio
n 1
84.2
2.7
7.0
2.0
1.8
2.2
6.2
4.6
8.8
0.1
0.0
0.2
0.0
0.0
0.0
6.3
4.6
8.9
0.0
0.0
0.0
0.5
0.2
0.8
1.3
0.1
3.1
1.8
0.4
3.9
6R
egio
n 1
94.0
2.2
9.5
1.8
0.8
2.7
5.8
3.6
11.4
0.1
0.0
0.3
0.3
0.0
1.2
6.2
3.7
11
.70
.00
.00
.00
.30
.00
.61
.30
.43
.21
.50
.43
.8
9R
egio
n 2
03.0
1.2
5.9
2.1
0.9
4.1
5.1
2.7
9.0
0.2
0.0
0.6
0.4
0.0
2.3
5.7
3.1
9.2
0.0
0.0
0.0
0.6
0.0
1.9
1.0
0.0
2.6
1.5
0.0
4.1
11
Regio
n 2
12.1
0.7
2.8
1.9
0.7
4.6
3.9
2.4
5.3
0.2
0.1
0.3
0.6
0.0
1.5
4.7
2.6
6.1
0.0
0.0
0.0
0.3
0.0
0.5
0.8
0.0
1.5
1.1
0.0
1.8
3R
egio
n 2
21.5
1.5
1.6
1.5
0.9
1.8
3.0
2.5
3.3
0.2
0.1
0.2
0.4
0.0
0.7
3.6
3.3
4.1
0.0
0.0
0.0
0.1
0.0
0.3
0.9
0.8
1.1
1.0
0.8
1.1
4R
egio
n 2
32.3
2.1
2.5
2.9
1.4
6.7
5.2
3.6
9.2
0.2
0.1
0.2
0.8
0.0
1.5
6.2
4.3
9.4
0.0
0.0
0.0
0.3
0.3
0.4
1.1
0.9
1.2
1.5
1.1
1.6
3R
egio
n 2
41.4
1.3
1.7
2.3
1.7
2.7
3.8
3.4
4.0
0.1
0.1
0.2
0.4
0.0
0.6
4.3
3.9
4.7
0.0
0.0
0.0
0.1
0.0
0.4
0.6
0.5
0.8
0.7
0.5
1.2
26
Regio
n 2
51.9
1.3
2.5
1.7
1.0
2.7
3.6
2.2
4.9
0.1
0.1
0.2
0.0
0.0
0.0
3.8
2.4
5.1
0.0
0.0
0.0
0.2
0.0
1.1
0.9
0.0
1.3
1.1
0.5
1.8
36
Regio
n 2
63.1
1.2
11.3
2.7
0.6
7.5
5.8
2.9
18.8
0.3
0.1
1.2
0.1
0.0
1.3
6.1
3.0
20
.00
.00
.00
.00
.50
.02
.61
.00
.02
.31
.40
.04
.8
33
Regio
n 2
81.9
1.2
4.0
1.5
0.3
2.5
3.4
2.2
5.6
0.1
0.0
0.3
0.1
0.0
0.5
3.6
2.2
5.6
0.0
0.0
0.0
0.3
0.0
0.7
0.7
0.0
2.0
1.0
0.0
2.6
75
Regio
n 2
92.3
0.7
6.9
1.6
0.0
3.6
3.9
1.6
9.3
0.1
0.0
0.3
0.1
0.0
1.5
4.1
1.6
9.6
0.0
0.0
0.0
0.4
0.0
1.9
0.7
0.0
2.3
1.1
0.0
3.0
35
Regio
n 3
03.1
1.0
24.3
1.8
0.5
3.5
4.9
1.9
26.1
0.2
0.1
0.3
0.4
0.0
6.9
5.5
2.1
29
.40
.00
.00
.00
.50
.03
.41
.30
.01
4.2
1.8
0.0
17
.6
14
Regio
n 3
12.6
1.1
4.4
1.8
0.7
3.1
4.4
3.5
5.1
0.2
0.1
0.3
0.0
0.0
0.4
4.6
3.8
5.3
0.0
0.0
0.0
0.4
0.0
0.8
1.2
0.0
2.1
1.6
0.0
2.9
26
Regio
n 3
22.2
0.6
5.7
1.9
1.0
3.3
4.1
2.0
7.8
0.2
0.1
0.3
0.0
0.0
0.7
4.3
2.2
8.8
0.0
0.0
0.0
0.4
0.0
1.3
0.8
0.0
2.2
1.2
0.0
3.1
27
Regio
n 3
33.1
1.8
11.2
2.9
0.7
27.4
6.0
3.0
30.0
0.3
0.1
2.8
0.1
0.0
1.9
6.4
3.1
33
.50
.00
.00
.00
.60
.32
.51
.40
.86
.22
.01
.18
.7
40
Regio
n 3
42.5
1.3
4.3
1.7
0.6
4.1
4.3
2.6
7.3
0.2
0.1
0.3
0.4
0.0
3.3
4.8
2.7
10
.90
.00
.00
.00
.50
.01
.01
.10
.02
.21
.50
.03
.1
10
Regio
n 3
51.5
0.7
3.4
1.5
0.3
5.1
2.9
1.2
7.6
0.1
0.0
0.3
0.1
0.0
0.6
3.1
1.4
8.5
0.0
0.0
0.0
0.1
0.0
0.6
0.1
0.0
0.6
0.2
0.0
1.2
28
Regio
n 3
62.2
0.9
4.8
2.8
1.3
5.0
4.9
2.8
9.8
0.1
0.0
0.3
0.2
0.0
3.2
5.3
2.9
10
.00
.00
.00
.30
.30
.01
.50
.70
.02
.81
.10
.03
.5
451
Ave. Y
ell
ow
2.4
2.0
4.4
0.2
0.2
4.7
0.0
0.4
0.8
1.2
M
in. Y
ell
ow
0.4
0.0
1.2
0.0
0.0
1.3
0.0
0.0
0.0
0.0
M
ax. Y
ell
ow
24.3
27.4
30.0
2.8
6.9
33
.50
.33
.41
4.2
17
.6

South African Maize Crop Quality Report 2016/2017 Season
38
TABLE 7: GRADING QUALITY OF SOUTH AFRICAN
WHITE AND YELLOW MAIZE 2007/2008 - 2016/2017Number % Defective kernels % Defective kernels % % %
Season of above 6.35 mm sieve below 6.35 mm sieve Foreign matter Other colour Combined deviations
samples ave. min. max. ave. min. max. ave. min. max. ave. min. max. ave. min. max.
White Maize
2007/08 483 2.0 0.3 13.6 1.6 0.0 10.3 0.2 0.0 0.7 0.2 0.0 5.2 3.9 0.5 18.5
2008/09 483 2.6 0.4 16.9 1.6 0.0 5.5 0.2 0.0 4.0 0.2 0.0 5.0 4.5 1.0 20.2
2009/10 458 5.1 1.0 40.1 1.5 0.2 14.0 0.1 0.0 0.4 0.2 0.0 6.5 6.9 1.4 41.4
2010/11 413 5.2 0.5 67.1 1.8 0.1 13.3 0.2 0.0 0.8 0.4 0.0 23.2 7.5 0.9 95.1
2011/12 577 2.5 0.3 21.6 2.0 0.0 8.1 0.1 0.0 1.1 0.3 0.0 43.7 5.0 0.7 51.2
2012/13 508 2.6 0.0 20.8 2.0 0.2 11.4 0.1 0.0 1.5 0.3 0.0 6.5 4.9 1.0 22.4
2013/14 451 4.6 0.6 24.7 1.7 0.1 9.8 0.1 0.0 4.5 0.4 0.0 9.2 6.8 1.9 29.2
2014/15 485 3.1 0.0 30.0 2.2 0.0 25.5 0.1 0.0 1.2 0.4 0.0 9.6 5.8 0.0 35.3
2015/16 415 3.8 0.7 79.9 2.4 0.0 14.5 0.2 0.0 2.2 0.4 0.0 8.0 6.7 1.9 91.5
2016/17 549 2.9 0.3 25.5 1.8 0.1 12.7 0.2 0.0 6.9 0.2 0.0 7.0 5.1 1.1 36.7
Weighted Average 3.4 1.9 0.1 0.3 5.6
Minimum 0.0 0.0 0.0 0.0 0.0
Maximum 79.9 25.5 6.9 43.7 95.1
Yellow Maize
2007/08 417 1.6 0.3 8.4 2.0 0.2 7.3 0.1 0.0 0.4 0.1 0.0 4.3 3.9 0.6 11.0
2008/09 327 2.3 0.5 15.1 2.0 0.0 10.6 0.2 0.0 3.1 0.2 0.0 13.3 4.7 0.9 29.6
2009/10 342 5.1 0.3 23.8 1.9 0.1 12.9 0.2 0.0 4.1 0.1 0.0 4.2 7.2 0.6 25.0
2010/11 280 4.7 0.8 30.9 2.1 0.1 9.6 0.2 0.0 0.4 0.2 0.0 6.2 7.2 1.3 36.9
2011/12 423 2.5 0.4 66.3 2.5 0.2 22.9 0.1 0.0 3.6 0.2 0.0 5.6 5.2 1.0 90.4
2012/13 492 2.0 0.2 23.1 2.5 0.1 14.0 0.1 0.0 1.8 0.2 0.0 8.4 4.8 0.8 25.0
2013/14 479 4.0 0.5 32.3 2.1 0.1 10.5 0.1 0.0 1.9 0.2 0.0 7.8 6.4 1.7 33.7
2014/15 515 3.1 0.6 23.0 2.7 0.0 19.0 0.1 0.0 2.5 0.3 0.0 13.6 6.2 0.6 34.4
2015/16 505 3.1 0.5 24.4 2.6 0.0 18.1 0.2 0.0 1.7 0.2 0.0 4.5 6.0 0.6 32.4
2016/17 451 2.4 0.4 24.3 2.0 0.0 27.4 0.2 0.0 2.8 0.2 0.0 6.9 4.7 1.3 33.5
Weighted Average 3.0 2.3 0.1 0.2 5.6
Minimum 0.2 0.0 0.0 0.0 0.6
Maximum 66.3 27.4 4.1 13.6 90.4
White and Yellow Maize
2007/08 900 1.8 0.3 13.6 1.8 0.0 10.3 0.1 0.0 0.7 0.1 0.0 5.2 3.9 0.5 18.5
2008/09 810 2.5 0.4 16.9 1.8 0.0 10.6 0.2 0.0 4.0 0.2 0.0 13.3 4.6 0.9 29.6
2009/10 800 5.1 0.3 40.1 1.7 0.1 14.0 0.1 0.0 4.1 0.2 0.0 6.5 7.1 0.6 41.4
2010/11 693 5.0 0.5 67.1 1.9 0.1 13.3 0.2 0.0 0.8 0.3 0.0 23.2 7.4 0.9 95.1
2011/12 1000 2.5 0.3 66.3 2.2 0.0 22.9 0.1 0.0 3.6 0.3 0.0 43.7 5.1 0.7 90.4
2012/13 1000 2.0 0.0 23.1 2.3 0.1 14.0 0.1 0.0 1.8 0.3 0.0 8.4 4.9 0.8 25.0
2013/14 930 4.3 0.5 32.3 1.9 0.1 10.5 0.1 0.0 4.5 0.3 0.0 9.2 6.6 1.7 33.7
2014/15 1000 3.1 0.0 30.0 2.5 0.0 25.5 0.1 0.0 2.5 0.3 0.0 13.6 6.0 0.0 35.3
2015/16 920 3.4 0.5 79.9 2.5 0.0 18.1 0.2 0.0 2.2 0.3 0.0 8.0 6.3 0.6 91.5
2016/17 1000 2.6 0.3 25.5 1.9 0.0 27.4 0.2 0.0 6.9 0.2 0.0 7.0 4.9 1.1 36.7
Weighted Average 3.2 2.1 0.1 0.3 5.6
Minimum 0.0 0.0 0.0 0.0 0.0
Maximum 79.9 27.4 6.9 43.7 95.1

South African Maize Crop Quality Report 2016/2017 Season
39
Graph 34: Percentage Defective Kernels above the 6.35 mm sieve over 10 seasons
Graph 35: Percentage Defective Kernels below the 6.35 mm sieve over 10 seasons
Graph 36: Percentage Combined deviations over 10 seasons
2007/08 2008/09 2009/10 2010/11 2011/12 2012/13 2013/14 2014/15 2015/16 2016/17White Maize 2.0 2.6 5.1 5.2 2.5 2.6 4.6 3.1 3.8 2.9Yellow Maize 1.6 2.3 5.1 4.7 2.5 2.0 4.0 3.1 3.1 2.4
0.0
1.0
2.0
3.0
4.0
5.0
6.0%
2007/08 2008/09 2009/10 2010/11 2011/12 2012/13 2013/14 2014/15 2015/16 2016/17White Maize 1.6 1.6 1.5 1.8 2.0 2.0 1.7 2.2 2.4 1.8Yellow Maize 2.0 2.0 1.9 2.1 2.5 2.5 2.1 2.7 2.6 2.0
1.2
1.4
1.6
1.8
2.0
2.2
2.4
2.6
2.8
%
2007/08 2008/09 2009/10 2010/11 2011/12 2012/13 2013/14 2014/15 2015/16 2016/17White Maize 3.9 4.5 6.9 7.5 5.0 4.9 6.8 5.8 6.7 5.1Yellow Maize 3.9 4.7 7.2 7.2 5.2 4.8 6.4 6.2 6.0 4.7
1.2
2.2
3.2
4.2
5.2
6.2
7.2
8.2
%

South African Maize Crop Quality Report 2016/2017 Season
40
TABLE 8: USA GRADING OF WHITE MAIZE (2016/2017)
Number of
samplesRegion
Damaged kernels %Bushel weight
(lbs)
%
Other colour % % Broken corn and
Heat damaged Total damaged foreign material
ave. min. max. ave. min. max. ave. min. max. ave. min. max. ave. min. max.
GRADE: US No.1
2 Region 10 0.0 0.0 0.0 1.2 1.1 1.2 0.2 0.2 0.3 61.8 61.7 61.9 0.0 0.0 0.0
1 Region 11 0.0 - - 1.9 - - 0.9 - - 61.8 - - 0.6 - -
13 Region 12 0.0 0.0 0.0 2.1 0.6 2.9 0.4 0.0 0.7 60.2 58.6 61.9 0.0 0.0 0.3
13 Region 13 0.0 0.0 0.0 2.0 1.1 2.5 0.7 0.2 2.0 59.0 57.4 60.5 0.2 0.0 1.4
21 Region 14 0.0 0.0 0.0 1.8 0.8 2.7 0.3 0.0 1.0 60.2 59.4 61.0 0.0 0.0 0.2
4 Region 15 0.0 0.0 0.0 2.5 2.3 2.6 0.5 0.5 0.6 60.6 60.2 61.0 0.0 0.0 0.0
14 Region 17 0.0 0.0 0.0 2.4 0.9 2.9 1.1 0.2 1.9 59.6 56.5 60.6 0.1 0.0 0.5
3 Region 18 0.0 0.0 0.0 2.4 1.9 3.0 1.3 1.1 1.6 60.4 59.1 62.0 0.2 0.1 0.2
9 Region 19 0.0 0.0 0.0 1.8 0.9 3.0 0.4 0.2 0.8 59.7 58.3 60.8 0.0 0.0 0.0
11 Region 20 0.0 0.0 0.0 1.9 1.3 3.0 0.5 0.2 0.9 60.4 59.6 61.8 0.3 0.0 1.3
45 Region 21 0.0 0.0 0.0 2.0 1.2 2.9 0.5 0.1 1.2 61.1 59.4 63.5 0.1 0.0 0.6
27 Region 22 0.0 0.0 0.0 2.2 1.4 2.6 0.5 0.1 0.7 60.5 59.4 61.5 0.1 0.0 0.6
15 Region 23 0.0 0.0 0.0 2.4 1.6 2.9 0.6 0.1 1.2 60.6 60.0 61.3 0.1 0.0 0.5
9 Region 24 0.0 0.0 0.0 1.7 1.0 2.8 0.9 0.2 1.6 60.2 58.7 62.2 0.1 0.0 0.5
3 Region 25 0.0 0.0 0.0 1.7 0.9 2.6 0.4 0.3 0.5 60.3 59.8 60.8 0.2 0.0 0.5
18 Region 26 0.0 0.0 0.0 1.8 0.8 2.5 0.6 0.1 1.9 59.4 56.9 62.8 0.3 0.0 1.1
17 Region 28 0.0 0.0 0.0 1.7 0.7 2.9 0.2 0.0 0.4 61.4 59.4 63.2 0.2 0.0 0.6
18 Region 29 0.0 0.0 0.0 2.0 0.8 2.9 0.5 0.1 0.8 60.8 60.0 61.5 0.3 0.0 1.0
12 Region 30 0.0 0.0 0.0 2.6 1.8 3.0 0.7 0.3 1.3 60.3 56.3 61.5 0.3 0.0 0.8
10 Region 31 0.0 0.0 0.0 2.0 1.4 2.9 0.5 0.3 0.8 60.9 58.9 62.0 0.3 0.0 0.6
12 Region 32 0.0 0.0 0.0 2.3 1.6 2.7 0.5 0.3 0.8 60.2 58.2 62.3 0.2 0.0 1.1
27 Region 33 0.0 0.0 0.0 2.3 1.5 2.9 0.6 0.3 1.0 61.1 60.1 62.7 0.2 0.0 0.8
20 Region 34 0.0 0.0 0.0 2.3 1.3 3.0 0.6 0.1 1.3 59.8 56.7 62.2 0.3 0.0 1.2
4 Region 35 0.0 0.0 0.0 0.6 0.5 0.9 0.7 0.1 1.1 60.4 59.1 61.4 0.1 0.0 0.5
23 Region 36 0.0 0.0 0.0 2.0 0.8 2.9 0.5 0.1 1.0 61.0 57.9 63.0 0.2 0.0 0.6
351 Ave. US No.1 0.0 2.1 0.5 60.5 0.2
Min. US No.1 0.0 0.5 0.0 56.3 0.0
Max. US No.1 0.0 3.0 2.0 63.5 1.4
GRADE: US No.2
1 Region 12 0.0 - - 4.7 - - 0.7 - - 58.6 - - 0.0 - -
10 Region 13 0.0 0.0 0.0 3.6 0.5 5.0 0.9 0.2 2.9 58.4 56.7 61.0 0.1 0.0 0.3
5 Region 14 0.1 0.0 0.2 3.6 2.9 4.2 0.3 0.1 0.7 60.3 59.4 61.0 0.1 0.0 0.4
3 Region 17 0.0 0.0 0.0 2.9 1.7 3.7 1.3 0.3 2.6 57.7 55.0 60.1 0.2 0.0 0.5
4 Region 18 0.0 0.0 0.0 4.3 3.8 4.6 0.5 0.2 1.1 60.1 59.9 60.3 0.0 0.0 0.2
4 Region 19 0.1 0.0 0.2 3.1 2.5 3.8 0.9 0.2 2.2 57.8 55.5 60.4 0.1 0.0 0.4
7 Region 20 0.0 0.0 0.0 3.7 3.2 4.6 0.5 0.2 1.0 60.1 59.1 62.0 0.2 0.0 0.5
10 Region 21 0.0 0.0 0.0 3.5 3.1 4.1 0.4 0.2 0.8 61.0 60.3 61.6 0.3 0.0 1.0
4 Region 22 0.0 0.0 0.0 4.0 3.2 4.8 0.1 0.1 0.2 60.3 59.5 61.5 0.0 0.0 0.0
2 Region 23 0.0 0.0 0.0 4.0 3.4 4.7 1.4 0.6 2.2 60.6 60.1 61.0 0.0 0.0 0.0
7 Region 24 0.0 0.0 0.0 3.7 3.2 4.7 0.5 0.4 0.6 61.4 60.9 62.3 0.1 0.0 0.5
1 Region 25 0.0 0.0 0.0 4.6 4.6 4.6 0.7 0.7 0.7 61.0 61.0 61.0 0.5 0.5 0.5
4 Region 26 0.0 0.0 0.0 3.2 2.6 3.7 1.0 0.1 2.6 59.5 59.0 60.0 0.6 0.5 0.8
4 Region 28 0.1 0.0 0.2 2.8 1.7 4.0 0.4 0.1 1.1 61.6 60.8 62.4 0.3 0.0 0.8
9 Region 29 0.0 0.0 0.0 3.5 1.8 4.6 0.8 0.1 2.3 60.6 57.4 62.7 0.3 0.0 0.6
4 Region 30 0.0 0.0 0.0 3.6 3.3 4.2 0.4 0.3 0.6 61.5 60.3 62.5 0.2 0.0 0.5
5 Region 31 0.0 0.0 0.0 3.3 2.7 4.1 0.5 0.3 0.7 59.9 55.8 61.3 0.3 0.0 0.6
11 Region 32 0.0 0.0 0.0 3.8 3.1 4.5 1.0 0.5 1.8 59.9 57.2 61.1 0.3 0.0 0.6
15 Region 33 0.0 0.0 0.0 3.6 2.7 4.5 1.0 0.3 2.9 60.4 54.4 61.8 0.2 0.0 1.2
18 Region 34 0.0 0.0 0.0 3.5 3.1 4.8 0.6 0.3 1.0 60.5 57.5 62.2 0.3 0.0 0.7
5 Region 36 0.0 0.0 0.2 3.5 2.8 4.5 0.8 0.2 2.2 60.4 58.2 61.6 0.0 0.0 0.0

South African Maize Crop Quality Report 2016/2017 Season
41
TABLE 8: USA GRADING OF WHITE MAIZE (2016/2017) (continue)
Number of
samplesRegion
Damaged kernels %Bushel weight
(lbs)
%
Other colour % % Broken corn and
Heat damaged Total damaged foreign material
ave. min. max. ave. min. max. ave. min. max. ave. min. max. ave. min. max.
133 Ave. US No.2 0.0 3.6 0.7 60.2 0.2
Min. US No.2 0.0 0.5 0.1 54.4 0.0
Max. US No.2 0.2 5.0 2.9 62.7 1.2
GRADE: US No.3
3 Region 12 0.1 0.0 0.3 5.8 5.6 6.1 0.6 0.1 1.3 59.7 59.0 60.3 0.1 0.0 0.2
2 Region 13 0.2 0.0 0.4 5.0 4.2 5.7 1.7 1.3 2.0 59.7 59.3 60.0 0.0 0.0 0.0
5 Region 14 0.3 0.0 0.5 3.9 2.5 6.8 0.7 0.0 1.9 59.9 59.6 60.2 0.1 0.0 0.2
1 Region 17 0.4 0.4 0.4 4.5 4.5 4.5 1.0 1.0 1.0 58.8 58.8 58.8 0.3 0.3 0.3
4 Region 19 0.2 0.0 0.3 4.7 2.8 5.7 2.0 0.6 3.4 59.6 56.4 61.0 0.1 0.0 0.2
1 Region 20 0.4 0.4 0.4 3.1 3.1 3.1 0.2 0.2 0.2 60.2 60.2 60.2 0.0 0.0 0.0
1 Region 21 0.3 - - 4.9 - - 0.2 - - 62.1 - - 0.0 - -
2 Region 29 0.0 0.0 0.0 5.8 5.7 5.8 0.7 0.6 0.8 60.9 60.8 61.0 0.6 0.6 0.6
3 Region 30 0.0 0.0 0.0 6.0 5.2 7.0 0.6 0.3 0.8 60.9 60.3 61.3 0.3 0.0 0.5
2 Region 31 0.0 0.0 0.0 6.1 5.6 6.6 0.5 0.2 0.8 59.4 58.8 60.0 0.8 0.7 0.8
2 Region 32 0.0 0.0 0.0 6.3 5.7 7.0 0.5 0.3 0.6 60.3 60.3 60.3 0.4 0.0 0.8
1 Region 33 0.0 - - 5.1 - - 0.3 - - 60.2 - - 0.4 - -
1 Region 34 0.0 - - 6.1 - - 1.8 - - 61.3 - - 0.7 - -
2 Region 35 0.5 0.5 0.5 6.2 5.4 7.0 0.9 0.9 0.9 62.2 61.9 62.5 0.3 0.0 0.6
1 Region 36 0.3 - - 3.7 - - 0.1 - - 62.5 - - 0.4 - -
31 Ave. US No.3 0.2 5.1 0.9 60.3 0.3
Min. US No.3 0.0 2.5 0.0 56.4 0.0
Max. US No.3 0.5 7.0 3.4 62.5 0.8
GRADE: US No.4
2 Region 13 0.5 0.3 0.7 8.1 7.2 9.0 1.2 0.7 1.7 59.0 58.6 59.4 0.0 0.0 0.0
1 Region 17 0.0 - - 7.5 - - 0.2 - - 61.0 - - 0.9 - -
1 Region 19 0.0 - - 1.4 - - 4.7 - - 57.0 - - 0.0 - -
1 Region 20 0.7 - - 5.9 - - 0.2 - - 60.3 - - 0.0 - -
1 Region 21 0.0 - - 7.3 - - 0.1 - - 61.3 - - 0.0 - -
1 Region 29 0.0 - - 9.6 - - 1.3 - - 60.6 - - 0.0 - -
2 Region 32 0.0 0.0 0.0 6.7 5.5 7.9 2.7 0.8 4.6 58.7 56.4 61.0 0.6 0.0 1.2
1 Region 33 0.0 - - 7.1 - - 0.5 - - 61.7 - - 0.5 - -
1 Region 35 0.8 - - 3.3 - - 0.0 - - 62.3 - - 0.0 - -
11 Ave. US No.4 0.2 6.5 1.3 60.0 0.2
Min. US No.4 0.0 1.4 0.0 56.4 0.0
Max. US No.4 0.8 9.6 4.7 62.3 1.2
GRADE: US No.5
1 Region 13 1.6 - - 6.0 - - 0.6 - - 60.5 - - 0.0 - -
2 Region 17 0.0 0.0 0.0 12.5 12.3 12.7 2.5 0.2 4.9 59.6 59.5 59.6 0.6 0.0 1.2
1 Region 19 0.0 - - 1.9 - - 5.9 - - 59.5 - - 0.0 - -
1 Region 20 0.0 - - 2.4 - - 6.9 - - 59.1 - - 0.2 - -
1 Region 32 0.0 - - 11.7 - - 0.3 - - 60.0 - - 1.3 - -
1 Region 33 2.4 - - 11.0 - - 0.2 - - 60.1 - - 0.5 - -
1 Region 35 1.2 - - 11.9 - - 2.3 - - 58.6 - - 0.0 - -
1 Region 36 0.0 - - 11.2 - - 0.3 - - 60.8 - - 0.0 - -
9 Ave. US No.5 0.6 9.0 2.4 59.7 0.4
Min. US No.5 0.0 1.9 0.2 58.6 0.0
Max.US No.5 2.4 12.7 6.9 60.8 1.3

South African Maize Crop Quality Report 2016/2017 Season
42
TABLE 8: USA GRADING OF WHITE MAIZE (2016/2017) (continue)
Number of
samplesRegion
Damaged kernels %Bushel weight
(lbs)
%
Other colour % % Broken corn and
Heat damaged Total damaged foreign material
ave. min. max. ave. min. max. ave. min. max. ave. min. max. ave. min. max.
GRADE: Sample Grade
2 Region 13 16.3 10.6 22.0 25.1 24.3 25.9 4.3 0.3 8.4 58.1 57.0 59.2 0.1 0.0 0.3
2 Region 19 2.8 0.3 5.3 8.4 4.0 12.8 4.1 0.9 7.4 60.0 59.2 60.7 0.3 0.0 0.6
1 Region 20 0.7 - - 16.6 - - 1.7 - - 60.3 - - 2.9 - -
1 Region 30 0.0 - - 15.5 - - 0.5 - - 60.3 - - 0.0 - -
1 Region 35 0.6 - - 24.1 - - 3.7 - - 58.8 - - 1.0 - -
7 Ave. Sample Grade 5.6 17.6 3.3 59.4 0.7
Min. Sample Grade 0.0 4.0 0.3 57.0 0.0
Max. Sample Grade 22.0 25.9 8.4 60.7 2.9
CLASS: Mixed corn
3 Region 19 0.0 0.0 0.0 3.4 2.0 4.9 0.5 0.3 0.7 59.6 59.2 59.9 3.5 3.4 3.8
2 Region 20 0.0 0.0 0.0 5.8 3.0 8.6 0.3 0.2 0.4 59.5 59.0 59.9 2.5 2.4 2.7
1 Region 30 0.0 - - 5.8 - - 1.5 - - 59.9 - - 2.1 - -
1 Region 31 0.0 - - 1.0 - - 1.8 - - 56.5 - - 7.1 - -
7 Ave. Mixed corn 0.0 4.1 0.8 59.2 3.6
Min. Mixed corn 0.0 1.0 0.2 56.5 2.1
Max. Mixed corn 0.0 8.6 1.8 59.9 7.1
549 Ave. white maize 0.1 3.0 0.7 60.3 0.2
Min. white maize 0.0 0.5 0.0 54.4 0.0
Max. white maize 22.0 25.9 8.4 63.5 7.1
1000 Ave. maize 0.1 2.8 0.7 60.1 0.2
Min. maize 0.0 0.5 0.0 52.5 0.0
Max. maize 22.0 25.9 9.6 66.6 7.1

South African Maize Crop Quality Report 2016/2017 Season
43
TABLE 9: USA GRADING OF YELLOW MAIZE (2016/2017)
Number of
samplesRegion
Damaged kernels %Bushel weight
(lbs)
%
Other colour % % Broken corn and
Heat damaged Total damaged foreign material
ave. min. max. ave. min. max. ave. min. max. ave. min. max. ave. min. max.
GRADE: US No.1
37 Region 10 0.0 0.0 0.0 1.5 0.7 2.7 0.6 0.0 1.6 61.8 60.2 62.8 0.0 0.0 0.6
2 Region 11 0.0 0.0 0.0 1.7 1.4 2.1 0.9 0.6 1.3 61.1 60.3 61.8 0.0 0.0 0.0
2 Region 12 0.0 0.0 0.0 1.9 1.6 2.3 0.1 0.1 0.1 61.5 61.0 62.0 0.3 0.0 0.5
4 Region 13 0.0 0.0 0.0 1.9 1.6 2.2 0.9 0.3 1.4 60.6 59.7 61.4 0.2 0.0 0.3
8 Region 14 0.0 0.0 0.0 1.2 0.6 2.5 0.5 0.1 1.0 60.4 59.4 61.7 0.1 0.0 0.4
4 Region 17 0.0 0.0 0.0 2.3 2.1 2.7 0.7 0.3 1.4 60.0 58.3 61.1 0.2 0.0 0.5
2 Region 18 0.0 0.0 0.0 2.9 2.9 2.9 0.8 0.5 1.1 59.9 59.8 59.9 0.0 0.0 0.0
1 Region 19 0.0 - - 2.6 - - 0.3 - - 60.9 - - 0.2 - -
5 Region 20 0.0 0.0 0.0 2.2 1.3 2.7 0.6 0.2 1.1 60.3 59.2 61.5 0.6 0.0 2.3
10 Region 21 0.0 0.0 0.0 2.2 1.4 2.9 0.6 0.2 1.3 60.7 59.1 61.8 0.7 0.0 1.5
3 Region 22 0.0 0.0 0.0 1.6 1.5 1.6 0.5 0.3 0.8 59.8 58.1 60.7 0.4 0.0 0.7
3 Region 23 0.0 0.0 0.0 2.4 2.2 2.5 0.6 0.5 0.9 59.9 59.6 60.3 1.1 0.6 1.5
3 Region 24 0.0 0.0 0.0 1.5 1.4 1.9 0.9 0.6 1.1 60.2 59.3 60.8 0.4 0.0 0.6
26 Region 25 0.0 0.0 0.0 2.0 1.3 2.6 0.5 0.3 1.1 60.1 58.8 61.9 0.0 0.0 0.0
26 Region 26 0.0 0.0 0.0 2.0 1.3 2.9 0.7 0.2 1.8 59.7 57.9 61.3 0.0 0.0 0.6
31 Region 28 0.0 0.0 0.0 1.9 1.2 2.8 0.5 0.0 1.1 59.7 58.0 61.2 0.1 0.0 0.5
59 Region 29 0.0 0.0 0.0 2.0 0.7 2.9 0.6 0.0 1.5 60.1 56.1 66.6 0.1 0.0 1.5
23 Region 30 0.0 0.0 0.0 1.9 1.1 3.0 0.6 0.1 1.1 58.9 56.3 61.5 0.0 0.0 0.0
11 Region 31 0.0 0.0 0.0 2.4 1.2 3.0 0.7 0.3 1.5 59.9 58.1 61.5 0.0 0.0 0.4
23 Region 32 0.0 0.0 0.0 2.0 0.6 2.8 0.7 0.3 1.6 60.2 57.0 62.8 0.0 0.0 0.0
19 Region 33 0.0 0.0 0.0 2.5 1.9 2.9 0.5 0.1 0.8 59.1 56.0 60.6 0.0 0.0 0.0
24 Region 34 0.0 0.0 0.0 2.1 1.3 2.9 0.6 0.2 1.5 59.5 56.8 64.0 0.2 0.0 2.9
8 Region 35 0.0 0.0 0.0 1.1 0.7 2.2 0.2 0.1 0.3 59.9 58.6 61.1 0.0 0.0 0.1
20 Region 36 0.0 0.0 0.0 1.8 1.0 2.9 0.6 0.1 1.2 60.1 57.8 62.0 0.3 0.0 3.2
354 Ave. US No.1 0.0 1.9 0.6 60.1 0.1
Min. US No.1 0.0 0.6 0.0 56.0 0.0
Max. US No.1 0.0 3.0 1.8 66.6 3.2
GRADE: US No.2
1 Region 11 0.0 - - 3.8 - - 1.3 - - 60.9 - - 0.0 - -
1 Region 12 0.0 - - 4.2 - - 0.2 - - 58.9 - - 0.2 - -
1 Region 13 0.0 - - 3.7 - - 0.8 - - 59.6 - - 0.0 - -
3 Region 19 0.0 0.0 0.0 3.4 3.1 3.8 0.8 0.5 1.2 59.5 59.2 59.8 0.4 0.0 1.2
1 Region 20 0.0 - - 3.8 - - 1.8 - - 58.6 - - 0.7 - -
1 Region 21 0.0 - - 0.8 - - 2.2 - - 61.6 - - 0.0 - -
1 Region 23 0.0 - - 2.6 - - 2.6 - - 58.9 - - 0.0 - -
3 Region 26 0.0 0.0 0.0 3.8 3.5 4.1 1.3 0.9 1.6 58.0 55.0 60.1 0.0 0.0 0.0
2 Region 28 0.0 0.0 0.0 4.1 4.0 4.3 0.4 0.3 0.5 59.7 59.3 60.1 0.0 0.0 0.0
14 Region 29 0.0 0.0 0.2 3.5 1.8 4.6 0.5 0.1 1.1 58.8 54.1 61.7 0.2 0.0 1.3
7 Region 30 0.0 0.0 0.0 3.3 2.2 4.1 0.5 0.1 0.9 57.7 54.1 61.1 0.3 0.0 0.8
3 Region 31 0.0 0.0 0.0 3.8 3.1 4.4 0.4 0.2 0.9 59.5 58.9 60.7 0.0 0.0 0.0
1 Region 32 0.0 - - 3.1 - - 0.8 - - 58.6 - - 0.0 - -
5 Region 33 0.0 0.0 0.0 4.0 3.1 4.8 0.7 0.5 1.0 58.8 55.5 60.2 0.1 0.0 0.5
16 Region 34 0.0 0.0 0.0 3.4 2.8 4.4 0.6 0.2 1.9 58.9 54.3 62.0 0.6 0.0 3.3
8 Region 36 0.0 0.0 0.0 3.6 1.5 4.9 1.5 0.5 2.9 59.7 55.8 62.2 0.0 0.0 0.0
68 Ave. US No.2 0.0 3.5 0.8 59.0 0.3
Min. US No.2 0.0 0.8 0.1 54.1 0.0
Max. US No.2 0.2 4.9 2.9 62.2 3.3

South African Maize Crop Quality Report 2016/2017 Season
44
TABLE 9: USA GRADING OF YELLOW MAIZE (2016/2017) (continue)
Number of
samplesRegion
Damaged kernels %Bushel weight
(lbs)
%
Other colour % % Broken corn and
Heat damaged Total damaged foreign material
ave. min. max. ave. min. max. ave. min. max. ave. min. max. ave. min. max.
GRADE: US No.3
1 Region 19 0.3 - - 3.2 - - 0.1 - - 60.7 - - 0.0 - -
2 Region 20 0.3 0.0 0.5 3.7 1.6 5.8 0.4 0.3 0.6 59.4 59.2 59.5 0.0 0.0 0.0
4 Region 26 0.0 0.0 0.0 4.7 1.2 6.4 2.2 1.4 3.2 57.4 55.3 59.8 0.9 0.0 1.3
1 Region 29 0.0 0.0 0.0 2.0 2.0 2.0 0.3 0.3 0.3 53.7 53.7 53.7 0.0 0.0 0.0
2 Region 30 0.0 0.0 0.0 3.9 2.6 5.3 0.8 0.6 1.0 55.2 52.5 57.9 0.6 0.0 1.1
1 Region 32 0.0 - - 5.2 - - 0.7 - - 53.4 - - 0.0 - -
1 Region 33 0.0 - - 3.9 - - 3.3 - - 55.8 - - 0.5 - -
2 Region 35 0.1 0.0 0.3 3.3 2.8 3.8 1.8 0.2 3.4 58.4 57.0 59.8 0.3 0.0 0.6
14 Ave. US No.3 0.1 3.9 1.4 57.1 0.4
Min. US No.3 0.0 1.2 0.1 52.5 0.0
Max. US No.3 0.5 6.4 3.4 60.7 1.3
GRADE: US No.4
1 Region 11 0.0 - - 8.5 - - 1.7 - - 61.0 - - 0.0 - -
1 Region 18 0.0 - - 7.3 - - 0.2 - - 61.3 - - 0.0 - -
1 Region 26 0.0 - - 9.1 - - 2.3 - - 54.7 - - 0.0 - -
1 Region 29 0.0 - - 7.1 - - 0.9 - - 55.2 - - 0.0 - -
1 Region 30 0.0 - - 7.7 - - 1.1 - - 58.6 - - 0.0 - -
5 Ave. US No.4 0.0 7.9 1.2 58.2 0.0
Min. US No.4 0.0 7.1 0.2 54.7 0.0
Max. US No.4 0.0 9.1 2.3 61.3 0.0
GRADE: US No.5
1 Region 13 1.0 - - 12.7 - - 1.7 - - 56.7 - - 0.3 - -
1 Region 19 0.0 - - 10.4 - - 0.6 - - 56.2 - - 0.3 - -
1 Region 20 1.4 - - 6.1 - - 1.3 - - 58.2 - - 0.0 - -
2 Region 26 0.9 0.8 1.0 11.2 10.6 11.9 3.3 3.0 3.7 54.7 54.5 54.8 0.0 0.0 0.0
1 Region 32 1.4 - - 5.8 - - 1.0 - - 56.5 - - 0.7 - -
6 Ave. US No.5 0.9 9.6 1.9 56.2 0.2
Min. US No.5 0.0 5.8 0.6 54.5 0.0
Max. US No.5 1.4 12.7 3.7 58.2 0.7
GRADE: Sample Grade
1 Region 30 0.0 - - 24.4 - - 0.7 - - 55.9 - - 3.1 - -
2 Region 33 1.8 0.5 3.1 7.5 3.3 11.8 5.5 1.3 9.6 59.7 58.1 61.3 1.3 0.7 1.8
3 Ave. Sample Grade 1.2 13.2 3.9 58.4 1.9
Min. Sample Grade 0.0 3.3 0.7 55.9 0.7
Max. Sample Grade 3.1 24.4 9.6 61.3 3.1
CLASS: Mixed corn
1 Region 30 0.0 - - 3.3 - - 0.5 - - 57.2 - - 6.9 - -
1 Ave. Mixed corn 0.0 3.3 0.5 57.2 6.9
Min. Mixed corn 0.0 3.3 0.5 57.2 6.9
Max. Mixed corn 0.0 3.3 0.5 57.2 6.9
451 Ave. yellow maize 0.0 2.5 0.7 59.7 0.2
Min. yellow maize 0.0 0.6 0.0 52.5 0.0
Max. yellow maize 3.1 24.4 9.6 66.6 6.9
1000 Ave. maize 0.1 2.8 0.7 60.1 0.2
Min. maize 0.0 0.5 0.0 52.5 0.0
Max. maize 22.0 25.9 9.6 66.6 7.1

South African Maize Crop Quality Report 2016/2017 Season
45
TABLE 10: STANDARDS FOR GRADES OF CLASS WHITE MAIZE AND
CLASS YELLOW MAIZE
Maximum permissible deviation
Deviation White maize Yellow maize
WM1 WM2 WM3 YM1 YM2 YM3
1 Foreign matter 0.3% 0.5% 0.75% 0.3% 0.5% 0.75%
2 Defective maize kernels, above and
below the 6.35 mm round-hole sieve7% 13% 30% * * *
3 Defective maize kernels that can pass
through the 6.35 mm round-hole sieve* * * 4% 10% 30%
4 Defective maize kernels that can not
pass through the 6.35 mm round-hole
sieve
* * * 9% 20% 30%
5 Other colour maize kernels 3% 6% 10% 2% 5% 5%
6 Deviations referred to in items 1, 2, 3,
4 and 5 collectively: Provided that the
deviations are individually within the
specified limits
8% 16% 30% 9% 20% 30%
7 Pinked maize kernels 12% 12% 12% * * *
A consignment of maize shall be classified as Class Other Maize if the consignment does not comply with the standards for Class White Maize or Class Yellow Maize.
* Not spesifiedRegulations relating to the Grading, Packing and Marking of Maize intended for sale in the Republic of South Africa as published in the
Government Gazette No. 32190, Regulation No. R. 473 of 8 May 2009.
TABLE 11: GRADES AND GRADE REQUIREMENTS FOR CLASS WHITE
AND YELLOW MAIZE ACCORDING TO USA GRADING REGULATIONS
Maximum limits of -
Damaged kernels
Grades Minimum test weight
per bushel (pounds)
Heat damaged
kernels (percent)Total (percent)
Broken corn and
foreign meaterial
(percent)
U.S. No. 1 56.0 72.1 kg/hl 0.1 3.0 2.0
U.S. No. 2 54.0 69.5 kg/hl 0.2 5.0 3.0
U.S. No. 3 52.0 66.9 kg/hl 0.5 7.0 4.0
U.S. No. 4 49.0 63.1 kg/hl 1.0 10.0 5.0
U.S. No. 5 46.0 59.2 kg/hl 3.0 15.0 7.0
U.S. Sample Grade < 46.0 <59.2 kg/hl >3.0 >15.0 >7.0
U.S. Sample grade is corn that:
a) Does not meet the requirements for the grades U.S. Nos. 1, 2, 3, 4 or 5; or
b) Contains stones which have an aggregate weight in excess of 0.1 percent of the sample weight, 2 or more pieces of
glass, 3 or more crotalaria seeds (Crotalaria spp.), 2 or more castor beans (Ricinus communis L.), 4 or more particles
of an unknown foreign substance(s) or a commonly recognized harmful or toxic substance(s), 8 or more cockleburs
(Xanthium spp.) or similar seeds singly or in combination, or animal filth in excess of 0.20 percent in 1,000 grams; or c) Has a musty, sour, or commercially objectionable foreign odor; or
d) Is heating or otherwise of distinctly low quality.
Mixed corn class When % other colour in yellow maize samples >5 % and white maize samples >2 %
Source: Offical United States Standard of Grain (excluding metric conversions).

South African Maize Crop Quality Report 2016/2017 Season
46
TA
BL
E 1
2:
PH
YS
ICA
L Q
UA
LIT
Y F
AC
TO
RS
OF
WH
ITE
MA
IZE
AC
CO
RD
ING
TO
GR
AD
E (
2016/2
017)
Nu
mb
er
Test
weig
ht
100
Kern
el siz
e (
%)
Bre
akag
e s
uscep
tib
ilit
y (
%)
Str
ess c
racks (
%)
SA
GL
Mil
lin
g i
nd
ex
2017
GY
Ao
f R
eg
ion
(kg
/hl)
kern
el m
ass (
g)
Ab
ove 1
0 m
m s
ieve
Ab
ove 8
mm
sie
ve
Belo
w 8
mm
sie
ve
< 6
.35 m
m s
iev
e<
4.7
5 m
m s
ieve
sam
ple
save.
min
. m
ax.
ave.
min
. m
ax.
ave.
min
. m
ax.
ave.
min
. m
ax.
ave.
min
. m
ax.
ave.
min
. m
ax.
ave.
min
. m
ax.
ave.
min
. m
ax.
ave.
min
.m
ax.
ave.
min
.m
ax.
GR
AD
E:
WM
1
2R
egio
n 1
079.6
79.4
79.7
41.5
41.0
41.9
7.9
7.1
8.6
77.1
75.8
78.4
15.1
14.5
15.6
0.4
0.4
0.4
0.2
0.1
0.2
65
71
00
.29
9.2
10
1.1
69
.76
9.5
69
.9
1R
egio
n 1
179.5
--
35.6
--
2.1
--
62.9
--
35.0
--
1.5
--
1.1
--
7-
-8
8.0
--
66
.7-
-
13
Regio
n 1
277.5
75.5
79.7
33.2
29.4
36.1
20.9
8.7
32.1
67.4
60.3
77.5
11.7
6.0
21.3
1.0
0.7
1.5
0.8
0.2
1.1
91
18
77
.46
8.7
82
.06
4.2
62
.16
5.3
20
Regio
n 1
375.7
73.6
78.5
32.1
27.9
40.0
12.6
3.0
48.9
65.9
48.8
72.8
21.5
2.3
35.5
1.6
0.3
4.0
1.2
0.3
2.8
81
17
72
.45
0.5
96
.06
2.9
57
.76
8.7
30
Regio
n 1
477.5
76.5
78.5
32.3
28.6
36.2
20.6
6.7
34.9
64.6
58.3
74.3
14.8
6.8
27.8
1.2
0.2
4.3
0.9
0.1
2.5
61
14
78
.57
1.4
87
.06
4.4
62
.76
6.5
4R
egio
n 1
578.1
77.5
78.6
33.3
31.8
35.8
25.2
19.8
32.8
65.2
58.8
70.6
9.6
8.4
11.4
1.0
0.5
1.2
0.8
0.3
1.2
32
58
0.1
77
.78
4.3
64
.86
4.2
65
.8
15
Regio
n 1
776.9
73.4
77.9
33.4
24.3
38.3
17.7
2.9
42.6
65.1
46.9
73.9
17.2
7.3
47.2
1.5
0.2
2.3
1.1
0.0
1.9
13
12
57
5.3
62
.78
3.0
63
.76
0.6
65
.5
6R
egio
n 1
877.6
76.0
79.9
32.2
28.3
35.6
18.9
4.7
26.8
65.4
60.4
69.4
15.7
7.7
25.9
1.1
0.5
1.8
0.8
0.3
1.3
81
14
72
.16
8.1
80
.86
2.9
61
.96
5.0
11
Regio
n 1
976.7
75.0
78.2
31.2
28.1
34.2
14.9
6.0
22.4
66.3
61.2
72.8
18.8
6.5
28.5
0.9
0.2
2.4
0.7
0.1
1.8
82
18
74
.05
7.7
79
.96
3.3
59
.46
4.7
21
Regio
n 2
077.6
76.0
79.9
34.0
29.1
37.6
18.8
6.3
31.9
65.5
57.1
76.6
15.7
9.6
30.5
1.0
0.1
2.5
0.8
0.1
1.9
61
13
77
.96
8.0
91
.36
4.3
61
.96
7.5
56
Regio
n 2
178.7
76.5
81.8
36.4
32.0
40.5
29.7
7.8
61.9
60.5
13.6
73.7
9.8
1.7
36.9
1.1
0.1
4.7
0.8
0.0
3.1
60
25
82
.36
6.8
94
.66
5.3
61
.66
8.3
31
Regio
n 2
277.8
76.4
79.2
36.3
31.1
42.3
36.2
23.5
64.2
56.4
26.0
68.7
7.4
2.4
18.8
1.3
0.6
2.7
1.0
0.5
1.7
70
20
82
.46
9.2
89
.16
5.3
62
.26
7.0
16
Regio
n 2
378.0
77.2
78.9
34.7
28.0
38.3
29.0
18.1
40.2
62.7
54.4
74.1
8.3
3.9
13.0
1.4
0.5
2.2
1.0
0.3
1.9
40
97
7.6
64
.88
5.3
64
.26
1.1
66
.0
16
Regio
n 2
478.2
75.6
80.2
34.1
29.8
39.5
21.7
7.3
31.2
64.4
57.9
71.7
13.8
8.2
27.3
1.1
0.4
2.4
0.8
0.2
1.9
63
10
77
.06
5.5
86
.96
4.1
61
.36
6.4
4R
egio
n 2
577.9
76.9
78.6
34.9
31.2
36.8
12.5
2.7
23.2
67.0
64.8
70.1
20.5
11.4
29.5
0.7
0.3
1.3
0.6
0.3
1.0
52
97
5.7
64
.29
3.8
63
.76
1.0
68
.1
19
Regio
n 2
676.6
73.2
80.9
32.5
27.8
37.5
17.5
3.0
39.7
64.3
52.4
78.0
18.2
5.5
35.2
1.7
0.5
6.5
1.1
0.0
3.6
12
13
37
9.2
63
.49
7.9
64
.66
0.8
69
.1
21
Regio
n 2
879.1
76.4
81.3
35.6
31.0
41.4
20.2
3.1
42.9
65.4
53.0
76.1
14.4
3.5
37.1
0.7
0.0
2.9
0.5
0.0
1.3
70
23
83
.16
9.3
90
.46
5.5
62
.26
7.3
26
Regio
n 2
978.3
73.9
80.7
38.0
33.1
43.8
26.9
7.6
44.0
62.9
33.0
78.0
10.1
3.6
26.6
0.8
0.1
3.9
0.6
0.0
2.6
51
12
84
.37
2.6
96
.56
5.8
63
.06
8.8
17
Regio
n 3
078.1
72.5
80.4
34.9
32.2
38.0
22.8
2.5
40.7
64.3
51.0
72.0
13.0
6.6
26.2
0.8
0.2
2.2
0.6
0.1
1.4
51
10
82
.27
7.4
88
.66
5.3
64
.16
6.9
15
Regio
n 3
177.9
71.9
79.8
36.4
26.0
42.8
13.4
5.3
24.6
71.5
65.2
80.0
15.0
8.0
24.0
0.6
0.0
2.1
0.4
0.0
1.3
30
13
78
.16
7.8
87
.56
4.3
61
.86
6.6
19
Regio
n 3
277.7
74.9
80.2
36.1
30.8
40.3
19.4
7.8
36.7
66.9
54.1
79.2
13.7
4.5
22.8
1.0
0.2
3.2
0.7
0.1
2.1
91
42
79
.17
1.2
88
.66
4.6
62
.76
6.9
38
Regio
n 3
378.3
70.0
80.8
34.4
29.3
40.0
14.2
5.1
50.1
68.6
44.7
81.0
17.3
5.2
28.2
0.7
0.1
1.9
0.5
0.1
1.5
40
18
80
.97
2.7
92
.36
5.0
63
.06
7.8
38
Regio
n 3
477.5
72.9
80.1
37.4
33.8
43.6
26.2
5.6
52.5
62.3
28.5
78.9
11.6
2.7
62.6
0.9
0.1
1.9
0.6
0.0
1.5
11
13
38
2.4
66
.69
3.8
65
.46
1.6
68
.1
5R
egio
n 3
578.2
76.1
80.2
34.8
29.1
39.3
25.1
4.2
43.0
63.6
55.4
70.0
11.4
1.6
29.9
1.0
0.3
1.8
0.8
0.3
1.3
91
21
89
.17
0.8
10
3.2
67
.06
2.5
70
.4
25
Regio
n 3
678.5
74.5
81.1
36.5
31.0
42.2
15.9
2.1
50.8
67.4
48.0
81.6
16.6
1.2
34.8
1.7
0.4
9.9
1.2
0.1
9.0
13
04
08
8.0
81
.19
5.5
66
.76
5.1
68
.6
469
A
ve. W
M1
77.9
35.1
22.0
64.3
13.7
1.1
0.8
78
0.5
64
.9
M
in. W
M1
70.0
24.3
2.1
13.6
1.2
0.0
0.0
05
0.5
57
.7
M
ax. W
M1
81.8
43.8
64.2
81.6
62.6
9.9
9.0
42
10
3.2
70
.4

South African Maize Crop Quality Report 2016/2017 Season
47
TA
BL
E 1
2:
PH
YS
ICA
L Q
UA
LIT
Y F
AC
TO
RS
OF
WH
ITE
MA
IZE
AC
CO
RD
ING
TO
GR
AD
E (
2016/2
017)
(co
nti
nu
e)
Nu
mb
er
Test
weig
ht
100
Kern
el siz
e (
%)
Bre
akag
e s
uscep
tib
ilit
y (
%)
Str
ess c
racks (
%)
SA
GL
Mil
lin
g i
nd
ex
2017
GY
A
of
Reg
ion
(kg
/hl)
kern
el m
ass (
g)
Ab
ove 1
0 m
m s
ieve
Ab
ove 8
mm
sie
ve
Belo
w 8
mm
sie
ve
< 6
.35 m
m s
iev
e<
4.7
5 m
m s
ieve
sam
ple
save.
min
. m
ax.
ave.
min
. m
ax.
ave.
min
. m
ax.
ave.
min
. m
ax.
ave.
min
. m
ax.
ave.
min
. m
ax.
ave.
min
. m
ax.
ave.
min
. m
ax.
ave.
min
.m
ax.
ave.
min
.m
ax.
GR
AD
E:
WM
2
4R
egio
n 1
276.5
75.4
77.7
33.8
28.7
38.2
18.0
10.5
30.2
68.1
65.2
71.3
13.9
4.6
21.4
1.6
0.9
2.1
1.2
0.8
1.6
10
31
87
8.0
67
.29
2.5
64
.36
1.7
67
.9
8R
egio
n 1
376.0
73.0
77.9
31.6
22.8
36.3
20.0
2.3
37.9
63.2
56.4
71.0
16.9
5.7
37.6
2.6
1.4
4.6
1.8
1.1
3.0
18
33
58
0.0
72
.69
1.9
64
.86
3.0
67
.7
1R
egio
n 1
477.5
--
37.1
--
30.7
--
60.4
--
8.9
--
0.5
--
0.5
--
5-
-7
3.2
--
63
.1-
-
5R
egio
n 1
774.9
70.8
78.6
32.6
29.5
36.1
17.8
3.7
26.6
66.8
62.4
74.4
15.4
9.9
23.8
1.6
1.1
2.3
0.9
0.1
1.5
15
72
76
7.2
41
.98
4.3
61
.75
5.6
65
.8
1R
egio
n 1
877.1
--
30.6
--
21.3
--
64.7
--
14.0
--
0.6
--
0.6
--
4-
-7
4.1
--
63
.4-
-
9R
egio
n 1
976.4
73.2
78.6
32.9
27.8
39.5
17.8
1.8
41.7
63.0
53.9
77.5
19.2
3.4
30.6
2.2
0.7
6.7
1.6
0.5
4.5
14
13
77
5.3
52
.59
0.4
63
.75
8.2
67
.3
1R
egio
n 2
075.9
--
34.2
--
23.4
--
66.0
--
10.6
--
0.9
--
0.6
--
10
--
81
.9-
-6
5.2
--
1R
egio
n 2
178.9
--
43.4
--
63.3
--
36.0
--
0.7
--
0.2
--
0.1
--
7-
-8
5.4
--
66
.0-
-
1R
egio
n 2
377.3
--
32.4
--
26.8
--
61.0
--
12.2
--
1.1
--
0.8
--
6-
-8
2.0
--
65
.2-
-
3R
egio
n 2
675.5
74.0
76.7
32.0
31.2
32.4
25.3
21.4
29.7
63.5
61.2
65.8
11.2
9.1
15.1
3.6
1.4
5.3
2.4
1.0
3.8
10
22
07
4.1
69
.08
3.0
63
.46
2.1
65
.5
4R
egio
n 2
978.5
77.9
79.2
35.8
34.7
37.5
30.6
24.4
37.4
59.8
55.7
66.5
9.6
6.9
17.5
1.5
0.9
2.9
1.0
0.6
2.0
12
71
98
4.6
77
.38
9.1
65
.96
4.1
67
.0
3R
egio
n 3
077.7
77.1
78.7
36.4
35.2
38.8
23.3
10.8
38.1
63.6
57.8
73.5
13.1
4.1
29.6
1.7
1.5
1.9
1.0
0.9
1.2
53
88
1.3
79
.48
4.4
65
.16
4.7
65
.8
2R
egio
n 3
176.5
75.7
77.2
39.2
36.1
42.3
13.9
9.7
18.1
75.7
68.9
82.4
10.5
7.9
13.0
0.3
0.2
0.3
0.1
0.1
0.1
80
15
80
.07
7.9
82
.16
4.8
64
.36
5.3
8R
egio
n 3
275.8
72.6
77.6
35.4
30.8
40.5
29.3
6.5
57.8
55.1
30.6
79.5
15.6
2.2
53.1
1.4
0.7
3.0
0.9
0.4
2.1
60
13
73
.46
7.6
85
.46
3.1
61
.76
6.1
5R
egio
n 3
378.6
77.4
79.5
34.6
31.7
36.7
23.4
9.8
41.8
59.9
52.4
65.5
16.7
5.8
28.1
0.6
0.0
1.6
0.5
0.0
1.2
60
14
84
.27
7.0
90
.46
5.8
64
.06
7.3
1R
egio
n 3
471.8
--
35.9
--
33.8
--
59.0
--
7.2
--
0.6
--
0.6
--
22
--
74
.9-
-6
3.5
--
2R
egio
n 3
580.1
79.7
80.4
35.6
33.8
37.3
12.8
10.7
14.8
66.5
63.5
69.4
20.8
19.9
21.7
1.2
0.6
1.7
0.9
0.6
1.2
13
91
78
8.7
87
.39
0.1
66
.96
6.5
67
.2
3R
egio
n 3
678.2
77.9
78.4
38.9
37.7
40.5
26.8
25.4
27.7
64.4
62.6
66.4
8.7
8.2
9.7
0.8
0.4
1.7
0.7
0.3
1.5
11
71
78
6.2
81
.09
0.8
66
.36
5.1
67
.4
62
A
ve. W
M2
76.7
34.4
23.1
62.3
14.6
1.6
1.1
11
78
.16
4.3
M
in. W
M2
70.8
22.8
1.8
30.6
0.7
0.0
0.0
04
1.9
55
.6
M
ax. W
M2
80.4
43.4
63.3
82.4
53.1
6.7
4.5
37
92
.56
7.9

South African Maize Crop Quality Report 2016/2017 Season
48
TA
BL
E 1
2:
PH
YS
ICA
L Q
UA
LIT
Y F
AC
TO
RS
OF
WH
ITE
MA
IZE
AC
CO
RD
ING
TO
GR
AD
E (
2016/2
017)
(co
nti
nu
e)
Nu
mb
er
Test
weig
ht
100
Kern
el siz
e (
%)
Bre
akag
e s
uscep
tib
ilit
y (
%)
Str
ess c
racks (
%)
SA
GL
Mil
lin
g i
nd
ex
2017
GY
A
of
Reg
ion
(kg
/hl)
kern
el m
ass (
g)
Ab
ove 1
0 m
m s
ieve
Ab
ove 8
mm
sie
ve
Belo
w 8
mm
sie
ve
< 6
.35 m
m s
iev
e<
4.7
5 m
m s
ieve
sam
ple
save.
min
. m
ax.
ave.
min
. m
ax.
ave.
min
. m
ax.
ave.
min
. m
ax.
ave.
min
. m
ax.
ave.
min
. m
ax.
ave.
min
. m
ax.
ave.
min
. m
ax.
ave.
min
.m
ax.
ave.
min
.m
ax.
GR
AD
E:
WM
3
1R
egio
n 1
373.4
--
37.8
--
29.2
--
60.7
--
10.1
--
2.4
--
1.9
--
24
--
41
.2-
-5
5.4
--
1R
egio
n 1
776.6
--
36.6
--
29.7
--
62.4
--
7.9
--
1.2
--
0.9
--
30
--
73
.6-
-6
3.2
--
1R
egio
n 1
976.2
--
33.2
--
22.6
--
65.6
--
11.8
--
1.3
--
0.8
--
30
--
86
.3-
-6
6.3
--
1R
egio
n 2
077.6
--
37.0
--
5.7
--
77.5
--
16.8
--
2.2
--
1.8
--
27
--
81
.9-
-6
5.2
--
1R
egio
n 3
077.7
--
37.0
--
31.0
--
63.1
--
5.9
--
0.4
--
0.3
--
3-
-8
1.7
--
65
.2-
-
1R
egio
n 3
278.6
--
35.4
--
13
.0-
-6
6.9
--
20
.1-
-0
.7-
-0.5
--
14
--
91.3
--
67
.5-
-
1R
egio
n 3
575.5
--
32.5
--
6.4
--
69.0
--
24.6
--
2.4
--
2.2
--
33
--
82
.9-
-6
5.5
--
2R
egio
n 3
678.1
78.0
78.2
40.3
40.3
40.3
25.7
25.5
25.8
64.6
63.9
65.3
9.8
9.2
10.3
0.4
0.1
0.8
0.1
0.0
0.3
23
21
25
89
.68
9.3
89
.96
7.1
67
.06
7.2
9 A
ve. W
M3
76.9
36.7
21.0
66.0
13.0
1.3
1.0
23
79
.86
4.7
M
in. W
M3
73.4
32.5
5.7
60.7
5.9
0.1
0.0
34
1.2
55
.4
M
ax. W
M3
78.6
40.3
31.0
77.5
24.6
2.4
2.2
33
91
.36
7.5
CL
AS
S:
CO
M
1R
egio
n 1
376.2
--
33.0
--
6.8
--
71.7
--
21.5
--
1.5
--
0.7
--
9-
-9
1.6
--
67
.6-
-
3R
egio
n 1
974.0
71.4
78.1
33.5
30.6
38.2
23.1
7.7
40.1
62.7
52.8
68.7
14.2
7.1
23.6
2.1
1.7
2.3
1.6
1.5
1.8
12
81
68
0.3
70
.28
9.0
64
.86
2.4
66
.9
1R
egio
n 2
076.0
--
29.9
--
23.9
--
67.1
--
9-
-1.3
--
1.1
--
24
--
82
.6-
-6
5.4
--
1R
egio
n 3
172.7
--
34.6
--
20.9
--
71.8
--
7.3
--
0.3
--
0.1
--
3-
-9
0.9
--
67
.4-
-
2R
egio
n 3
378.8
78.4
79.1
39.5
38.3
40.6
48.5
48.1
48.8
48.2
47.4
49.0
3.4
2.9
3.8
0.6
0.4
0.7
0.5
0.4
0.5
65
78
4.1
82
.28
6.1
65
.86
5.3
66
.2
1R
egio
n 3
575.7
--
35.2
--
6.9
--
72.8
--
20.3
--
8.3
--
6.1
--
22
--
79
.5-
-6
4.7
--
9 A
ve. C
OM
75.6
34.7
25.0
63.1
11.9
2.1
1.5
12
83
.86
5.7
M
in. C
OM
71.4
29.9
6.8
47.4
2.9
0.3
0.1
37
0.2
62
.4
M
ax. C
OM
79.1
40.6
48.8
72.8
23.6
8.3
6.1
24
91
.66
7.6
549 A
ve. w
hit
e m
aiz
e77.7
35.0
22.1
64.1
13.7
1.2
0.8
88
0.2
64
.8
M
in. w
hit
e m
aiz
e70.0
22.8
1.8
13.6
0.7
0.0
0.0
04
1.2
55
.4
M
ax. w
hit
e m
aiz
e81.8
43.8
64.2
82.4
62.6
9.9
9.0
42
10
3.2
70
.4
1
000 A
ve. m
aiz
e77.3
34.3
17.3
64.8
17.9
1.2
0.8
87
8.7
64
.5
M
in. m
aiz
e67.6
18.4
0.0
13.0
0.7
0.0
0.0
03
6.9
54
.2
M
ax. m
aiz
e82.4
43.8
71.9
90.9
69.7
9.9
9.0
50
10
5.4
70
.9

South African Maize Crop Quality Report 2016/2017 Season
49
TA
BL
E 1
3:
PH
YS
ICA
L Q
UA
LIT
Y F
AC
TO
RS
OF
WH
ITE
MA
IZE
(2016/2
017)
Nu
mb
er
Test
weig
ht
100
Kern
el siz
e (
%)
Bre
akag
e s
uscep
tib
ilit
y (
%)
Str
ess c
racks (
%)
SA
GL
Mil
lin
g i
nd
ex
2017
GY
A
of
Reg
ion
(kg
/hl)
kern
el m
ass (
g)
Ab
ove 1
0 m
m s
ieve
Ab
ove 8
mm
sie
ve
Belo
w 8
mm
sie
ve
< 6
.35 m
m s
iev
e<
4.7
5 m
m s
ieve
sam
ple
save.
min
. m
ax.
ave.
min
. m
ax.
ave.
min
. m
ax.
ave.
min
. m
ax.
ave.
min
. m
ax.
ave.
min
. m
ax.
ave.
min
. m
ax.
ave.
min
. m
ax.
ave.
min
.m
ax.
ave.
min
.m
ax.
WH
ITE
2R
egio
n 1
079.6
79.4
79.7
41.5
41.0
41.9
7.9
7.1
8.6
77.1
75.8
78.4
15.1
14.5
15.6
0.4
0.4
0.4
0.2
0.1
0.2
6.0
5.0
7.0
10
0.2
99
.21
01
.16
9.7
69
.56
9.9
1R
egio
n 1
179.5
--
35.6
--
2.1
--
62.9
--
35.0
--
1.5
--
1.1
--
7-
-8
8.0
--
66
.7-
-
17
Regio
n 1
277.2
75.4
79.7
33.3
28.7
38.2
20.2
8.7
32.1
67.6
60.3
77.5
12.2
4.6
21.4
1.2
0.7
2.1
0.9
0.2
1.6
91
18
77
.56
7.2
92
.56
4.2
61
.76
7.9
30
Regio
n 1
375.7
73.0
78.5
32.2
22.8
40.0
14.9
2.3
48.9
65.2
48.8
72.8
19.9
2.3
37.6
1.9
0.3
4.6
1.4
0.3
3.0
11
13
57
4.0
41
.29
6.0
63
.35
5.4
68
.7
31
Regio
n 1
477.5
76.5
78.5
32.5
28.6
37.1
20.9
6.7
34.9
64.5
58.3
74.3
14.6
6.8
27.8
1.2
0.2
4.3
0.9
0.1
2.5
51
14
78
.37
1.4
87
.06
4.4
62
.76
6.5
4R
egio
n 1
578.1
77.5
78.6
33.3
31.8
35.8
25.2
19.8
32.8
65.2
58.8
70.6
9.6
8.4
11.4
1.0
0.5
1.2
0.8
0.3
1.2
32
58
0.1
77
.78
4.3
64
.86
4.2
65
.8
21
Regio
n 1
776.4
70.8
78.6
33.3
24.3
38.3
18.3
2.9
42.6
65.4
46.9
74.4
16.4
7.3
47.2
1.5
0.2
2.3
1.0
0.0
1.9
15
13
07
3.3
41
.98
4.3
63
.25
5.6
65
.8
7R
egio
n 1
877.5
76.0
79.9
31.9
28.3
35.6
19.2
4.7
26.8
65.3
60.4
69.4
15.5
7.7
25.9
1.0
0.5
1.8
0.7
0.3
1.3
71
14
72
.46
8.1
80
.86
2.9
61
.96
5.0
24
Regio
n 1
976.3
71.4
78.6
32.2
27.8
39.5
17.3
1.8
41.7
64.6
52.8
77.5
18.1
3.4
30.6
1.6
0.2
6.7
1.1
0.1
4.5
12
13
77
5.8
52
.59
0.4
63
.85
8.2
67
.3
24
Regio
n 2
077.5
75.9
79.9
34.0
29.1
37.6
18.6
5.7
31.9
66.1
57.1
77.5
15.2
9.0
30.5
1.1
0.1
2.5
0.8
0.1
1.9
81
27
78
.46
8.0
91
.36
4.4
61
.96
7.5
57
Regio
n 2
178.7
76.5
81.8
36.6
32.0
43.4
30.3
7.8
63.3
60.1
13.6
73.7
9.6
0.7
36.9
1.1
0.1
4.7
0.7
0.0
3.1
60
25
82
.36
6.8
94
.66
5.3
61
.66
8.3
31
Regio
n 2
277.8
76.4
79.2
36.3
31.1
42.3
36.2
23.5
64.2
56.4
26.0
68.7
7.4
2.4
18.8
1.3
0.6
2.7
1.0
0.5
1.7
70
20
82
.46
9.2
89
.16
5.3
62
.26
7.0
17
Regio
n 2
378.0
77.2
78.9
34.6
28.0
38.3
28.8
18.1
40.2
62.6
54.4
74.1
8.6
3.9
13.0
1.4
0.5
2.2
1.0
0.3
1.9
40
97
7.9
64
.88
5.3
64
.26
1.1
66
.0
16
Regio
n 2
478.2
75.6
80.2
34.1
29.8
39.5
21.7
7.3
31.2
64.4
57.9
71.7
13.8
8.2
27.3
1.1
0.4
2.4
0.8
0.2
1.9
63
10
77
.06
5.5
86
.96
4.1
61
.36
6.4
4R
egio
n 2
577.9
76.9
78.6
34.9
31.2
36.8
12.5
2.7
23.2
67.0
64.8
70.1
20.5
11.4
29.5
0.7
0.3
1.3
0.6
0.3
1.0
52
97
5.7
64
.29
3.8
63
.76
1.0
68
.1
22
Regio
n 2
676.5
73.2
80.9
32.4
27.8
37.5
18.6
3.0
39.7
64.2
52.4
78.0
17.3
5.5
35.2
1.9
0.5
6.5
1.3
0.0
3.8
12
13
37
8.5
63
.49
7.9
64
.46
0.8
69
.1
21
Regio
n 2
879.1
76.4
81.3
35.6
31.0
41.4
20.2
3.1
42.9
65.4
53.0
76.1
14.4
3.5
37.1
0.7
0.0
2.9
0.5
0.0
1.3
70
23
83
.16
9.3
90
.46
5.5
62
.26
7.3
30
Regio
n 2
978.3
73.9
80.7
37.7
33.1
43.8
27.4
7.6
44.0
62.5
33.0
78.0
10.1
3.6
26.6
0.9
0.1
3.9
0.6
0.0
2.6
61
19
84
.37
2.6
96
.56
5.8
63
.06
8.8
21
Regio
n 3
078.0
72.5
80.4
35.2
32.2
38.8
23.2
2.5
40.7
64.1
51.0
73.5
12.6
4.1
29.6
0.9
0.2
2.2
0.6
0.1
1.4
51
10
82
.07
7.4
88
.66
5.3
64
.16
6.9
18
Regio
n 3
177.5
71.9
79.8
36.6
26.0
42.8
13.9
5.3
24.6
72.0
65.2
82.4
14.1
7.3
24.0
0.6
0.0
2.1
0.4
0.0
1.3
30
15
79
.16
7.8
90
.96
4.6
61
.86
7.4
28
Regio
n 3
277.2
72.6
80.2
35.9
30.8
40.5
22.0
6.5
57.8
63.5
30.6
79.5
14.5
2.2
53.1
1.1
0.2
3.2
0.8
0.1
2.1
80
42
77
.96
7.6
91
.36
4.3
61
.76
7.5
45
Regio
n 3
378.3
70.0
80.8
34.7
29.3
40.6
16.7
5.1
50.1
66.7
44.7
81.0
16.6
2.9
28.2
0.7
0.0
1.9
0.5
0.0
1.5
50
18
81
.47
2.7
92
.36
5.1
63
.06
7.8
39
Regio
n 3
477.3
71.8
80.1
37.4
33.8
43.6
26.4
5.6
52.5
62.2
28.5
78.9
11.4
2.7
62.6
0.9
0.1
1.9
0.6
0.0
1.5
11
13
38
2.2
66
.69
3.8
65
.36
1.6
68
.1
9R
egio
n 3
578.0
75.5
80.4
34.7
29.1
39.3
18.2
4.2
43.0
65.8
55.4
72.8
15.9
1.6
29.9
2.0
0.3
8.3
1.6
0.3
6.1
14
13
38
7.3
70
.81
03
.26
6.5
62
.57
0.4
30
Regio
n 3
678.4
74.5
81.1
37.0
31.0
42.2
17.7
2.1
50.8
66.9
48.0
81.6
15.4
1.2
34.8
1.5
0.1
9.9
1.1
0.0
9.0
13
04
08
7.9
81
.09
5.5
66
.76
5.1
68
.6
549 A
ve. w
hit
e77.7
35.0
22.1
64.1
13.7
1.2
0.8
88
0.2
64
.8
M
in. w
hit
e70.0
22.8
1.8
13.6
0.7
0.0
0.0
04
1.2
55
.4
M
ax. w
hit
e81.8
43.8
64.2
82.4
62.6
9.9
9.0
42
10
3.2
70
.4

South African Maize Crop Quality Report 2016/2017 Season
50
TA
BL
E 1
4:
PH
YS
ICA
L Q
UA
LIT
Y F
AC
TO
RS
OF
YE
LL
OW
MA
IZE
AC
CO
RD
ING
TO
GR
AD
E (
2016/2
017)
Nu
mb
er
Test
weig
ht
100
Kern
el siz
e (
%)
Bre
akag
e s
uscep
tib
ilit
y (
%)
Str
ess c
racks (
%)
SA
GL
Mil
lin
g i
nd
ex
2017
GY
A
of
Reg
ion
(kg
/hl)
kern
el m
ass (
g)
Ab
ove 1
0 m
m s
ieve
Ab
ove 8
mm
sie
ve
Belo
w 8
mm
sie
ve
< 6
.35 m
m s
ieve
< 4
.75 m
m s
ieve
sam
ple
save.
min
. m
ax.
ave.
min
. m
ax.
ave.
min
. m
ax.
ave.
min
. m
ax.
ave.
min
. m
ax.
ave.
min
. m
ax.
ave.
min
. m
ax.
ave.
min
. m
ax.
ave.
min
.m
ax.
ave.
min
.m
ax.
GR
AD
E:
YM
1
37
Regio
n 1
079.6
77.5
80.9
36.5
30.2
42.2
5.2
0.0
14.2
65.3
30.8
80.8
29.5
8.9
69.2
0.8
0.2
2.4
0.6
0.0
2.2
70
21
77
.56
3.6
90
.96
4.2
60
.86
7.4
3R
egio
n 1
178.6
77.7
79.6
33.6
31.3
35.9
4.2
3.3
5.4
60.7
50.2
69.0
35.1
27.0
46.5
0.8
0.2
1.6
0.4
0.0
0.8
63
97
4.9
70
.77
7.3
63
.56
2.5
64
.1
3R
egio
n 1
278.1
75.8
79.8
30.1
28.6
33.0
10.1
4.1
15.1
70.4
67.7
74.1
19.5
14.8
28.2
1.8
1.3
2.3
1.3
1.0
1.8
53
88
8.9
86
.69
3.0
66
.96
6.4
67
.9
5R
egio
n 1
377.8
76.7
79.0
29.4
25.1
34.4
8.1
2.4
21.8
65.6
55.9
71.2
26.3
9.4
41.7
2.3
1.1
4.4
1.3
1.0
1.9
13
52
18
9.5
85
.49
2.3
67
.16
6.0
67
.8
8R
egio
n 1
477.6
76.4
79.4
32.1
29.3
38.6
10.0
4.2
35.9
65.9
57.7
69.4
24.1
6.4
29.3
1.0
0.2
1.9
0.7
0.1
1.3
92
14
84
.28
0.1
93
.36
5.8
64
.86
8.0
3R
egio
n 1
777.3
75.0
78.7
29.5
27.0
31.0
8.6
3.9
11.5
60.8
59.7
61.8
30.6
26.7
36.4
1.9
0.8
3.9
1.3
0.6
2.8
84
12
84
.17
8.2
88
.96
5.7
64
.36
6.9
3R
egio
n 1
877.7
77.0
78.9
29.6
29.3
29.8
5.8
4.9
6.8
69.8
67.7
72.9
24.4
22.2
25.6
1.7
1.4
1.8
1.2
1.2
1.3
96
11
85
.28
3.5
88
.56
6.0
65
.66
6.8
5R
egio
n 1
977.3
76.2
78.4
32.1
27.9
35.7
12.9
6.4
18.8
67.1
60.9
71.2
20.0
15.2
24.6
1.0
0.8
1.5
0.7
0.4
1.0
75
12
82
.16
9.0
88
.16
5.3
62
.16
6.7
5R
egio
n 2
077.2
76.2
79.1
31.8
29.3
35.7
10.7
5.3
25.9
63.8
61.8
70.8
25.5
11.4
32.9
1.3
0.9
2.5
1.1
0.7
2.2
81
18
78
.96
9.3
86
.96
4.5
62
.26
6.4
10
Regio
n 2
178.1
76.1
79.6
35.0
30.6
37.7
19.4
6.9
71.9
65.1
17.9
77.2
15.5
5.9
24.6
0.9
0.3
1.6
0.7
0.2
1.3
93
16
83
.57
3.6
91
.96
5.6
63
.26
7.7
3R
egio
n 2
277.0
74.8
78.1
32.6
27.0
39.2
11.1
3.3
25.8
61.9
56.5
64.8
27.0
9.9
40.2
1.6
1.2
1.8
1.0
0.6
1.6
16
10
22
83
.68
0.0
88
.36
5.6
64
.86
6.8
3R
egio
n 2
377.1
76.8
77.7
33.8
28.9
36.7
6.6
4.8
9.4
70.1
66.2
73.3
23.3
19.9
29.0
1.3
1.2
1.3
0.9
0.6
1.1
12
91
68
6.6
83
.68
9.7
66
.36
5.6
67
.1
3R
egio
n 2
477.5
76.3
78.3
26.2
25.3
27.6
5.0
3.6
5.9
62.2
57.0
67.6
32.8
26.8
39.4
1.1
0.5
1.4
0.8
0.1
1.2
10
811
88
.57
9.9
95
.56
6.8
64
.76
8.5
26
Regio
n 2
577.4
75.7
79.7
31.9
26.5
39.7
9.9
3.6
27.6
63.3
39.3
71.3
26.8
9.6
56.5
1.0
0.2
2.2
0.6
0.2
1.5
70
17
67
.75
6.3
79
.86
1.8
59
.06
4.7
28
Regio
n 2
676.6
70.8
78.9
32.0
27.1
37.5
11.4
2.5
54.6
63.4
40.0
72.2
25.2
5.4
46.2
1.6
0.2
5.1
1.0
0.0
3.1
81
25
74
.05
5.8
90
.26
3.3
58
.96
7.3
33
Regio
n 2
876.8
74.7
78.8
33.9
28.0
39.9
12.5
5.1
23.0
64.4
13.0
74.4
23.1
7.0
68.5
0.9
0.3
2.5
0.6
0.0
1.6
60
18
74
.16
4.5
90
.76
3.3
61
.06
7.4
74
Regio
n 2
976.8
69.1
80.7
35.2
28.1
43.3
13.8
2.5
50.9
66.7
31.0
90.9
19.5
6.2
60.8
1.0
0.1
5.3
0.7
0.0
5.3
60
17
77
.86
0.1
97
.76
4.2
59
.96
9.0
31
Regio
n 3
075.2
67.6
79.2
34.2
28.7
40.1
13.7
0.9
32.1
68.2
56.9
77.0
18.1
4.7
41.5
0.9
0.2
2.9
0.7
0.0
2.2
61
23
75
.76
2.1
88
.86
3.7
60
.46
6.9
14
Regio
n 3
177.0
74.8
79.1
33.4
31.4
38.2
15.2
10.3
28.9
67.7
61.0
77.0
17.1
10.1
25.6
0.6
0.3
1.0
0.4
0.1
0.8
50
19
75
.06
6.9
82
.46
3.5
61
.66
5.3
26
Regio
n 3
276.9
68.8
80.9
34.6
25.8
40.2
14.2
3.3
23.8
66.9
36.3
74.6
18.9
1.6
56.7
1.1
0.2
2.5
0.8
0.0
2.1
11
33
27
8.8
67
.29
6.5
64
.56
1.6
68
.8
24
Regio
n 3
376.1
71.4
78.0
34.0
29.4
39.4
12.4
0.6
23.7
70.2
59.1
84.4
17.3
6.9
32.6
1.1
0.2
3.2
0.8
0.0
2.1
50
19
75
.25
6.5
89
.36
3.6
59
.16
6.9
38
Regio
n 3
476.3
69.9
82.4
33.6
23.5
39.2
14.3
1.5
42.1
65.8
18.1
77.5
19.8
4.2
69.7
0.9
0.2
2.2
0.6
0.0
1.7
91
34
78
.75
4.4
10
3.7
64
.45
8.6
70
.5
9R
egio
n 3
576.6
73.3
78.7
31.7
26.4
35.7
9.4
1.3
17.4
64.6
52.4
74.2
26.0
15.3
46.3
0.9
0.2
4.3
0.7
0.2
3.2
74
12
74
.96
6.9
94
.86
3.5
61
.66
8.4
23
Regio
n 3
677.5
74.2
80.1
33.8
30.6
37.9
7.4
1.7
21.7
59.7
34.9
75.4
32.9
10.6
58.6
1.4
0.4
4.4
1.0
0.3
3.5
91
29
76
.56
1.6
10
5.4
63
.96
0.3
70
.9
4
17 A
ve. Y
M1
77.0
33.8
11.7
65.6
22.6
1.0
0.7
77
7.0
64
.0
M
in. Y
M1
67.6
23.5
0.0
13.0
1.6
0.1
0.0
05
4.4
58
.6
M
ax. Y
M1
82.4
43.3
71.9
90.9
69.7
5.3
5.3
34
10
5.4
70
.9
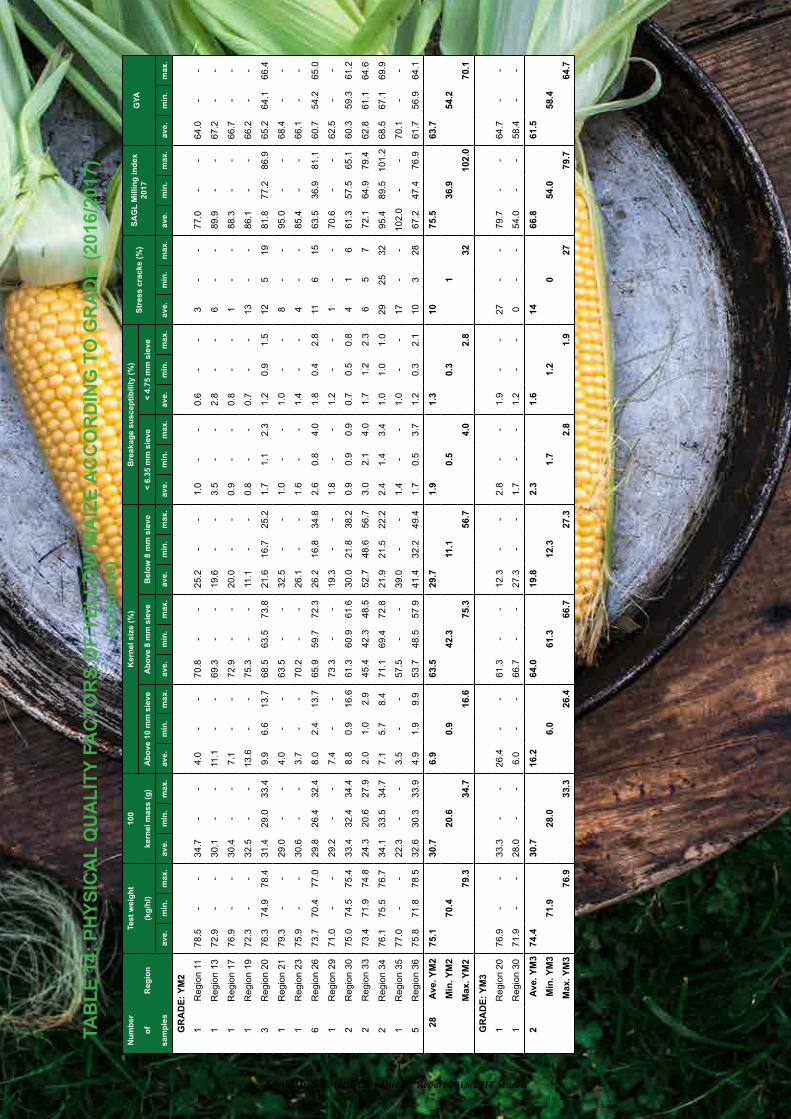
South African Maize Crop Quality Report 2016/2017 Season
51
TA
BL
E 1
4:
PH
YS
ICA
L Q
UA
LIT
Y F
AC
TO
RS
OF
YE
LL
OW
MA
IZE
AC
CO
RD
ING
TO
GR
AD
E (
2016/2
017)
(co
nti
nu
e)
Nu
mb
er
Test
weig
ht
100
Kern
el siz
e (
%)
Bre
akag
e s
uscep
tib
ilit
y (
%)
Str
ess c
racks (
%)
SA
GL
Mil
lin
g i
nd
ex
2017
GY
A
of
Reg
ion
(kg
/hl)
kern
el m
ass (
g)
Ab
ove 1
0 m
m s
ieve
Ab
ove 8
mm
sie
ve
Belo
w 8
mm
sie
ve
< 6
.35 m
m s
ieve
< 4
.75 m
m s
ieve
sam
ple
save.
min
. m
ax.
ave.
min
. m
ax.
ave.
min
. m
ax.
ave.
min
. m
ax.
ave.
min
. m
ax.
ave.
min
. m
ax.
ave.
min
. m
ax.
ave.
min
. m
ax.
ave.
min
.m
ax.
ave.
min
.m
ax.
GR
AD
E:
YM
2
1R
egio
n 1
178.5
--
34.7
--
4.0
--
70.8
--
25.2
--
1.0
--
0.6
--
3-
-7
7.0
--
64
.0-
-
1R
egio
n 1
372.9
--
30.1
--
11.1
--
69.3
--
19.6
--
3.5
--
2.8
--
6-
-8
9.9
--
67
.2-
-
1R
egio
n 1
776.9
--
30.4
--
7.1
--
72.9
--
20.0
--
0.9
--
0.8
--
1-
-8
8.3
--
66
.7-
-
1R
egio
n 1
972.3
--
32.5
--
13.6
--
75.3
--
11.1
--
0.8
--
0.7
--
13
--
86
.1-
-6
6.2
--
3R
egio
n 2
076.3
74.9
78.4
31.4
29.0
33.4
9.9
6.6
13.7
68.5
63.5
73.8
21.6
16.7
25.2
1.7
1.1
2.3
1.2
0.9
1.5
12
51
98
1.8
77
.28
6.9
65
.26
4.1
66
.4
1R
egio
n 2
179.3
--
29.0
--
4.0
--
63.5
--
32.5
--
1.0
--
1.0
--
8-
-9
5.0
--
68
.4-
-
1R
egio
n 2
375.9
--
30.6
--
3.7
--
70.2
--
26.1
--
1.6
--
1.4
--
4-
-8
5.4
--
66
.1-
-
6R
egio
n 2
673.7
70.4
77.0
29.8
26.4
32.4
8.0
2.4
13.7
65.9
59.7
72.3
26.2
16.8
34.8
2.6
0.8
4.0
1.8
0.4
2.8
11
61
56
3.5
36
.98
1.1
60
.75
4.2
65
.0
1R
egio
n 2
971.0
--
29.2
--
7.4
--
73.3
--
19.3
--
1.8
--
1.2
--
1-
-7
0.6
--
62
.5-
-
2R
egio
n 3
075.0
74.5
75.4
33.4
32.4
34.4
8.8
0.9
16.6
61.3
60.9
61.6
30.0
21.8
38.2
0.9
0.9
0.9
0.7
0.5
0.8
41
66
1.3
57
.56
5.1
60
.35
9.3
61
.2
2R
egio
n 3
373.4
71.9
74.8
24.3
20.6
27.9
2.0
1.0
2.9
45.4
42.3
48.5
52.7
48.6
56.7
3.0
2.1
4.0
1.7
1.2
2.3
65
77
2.1
64
.97
9.4
62
.86
1.1
64
.6
2R
egio
n 3
476.1
75.5
76.7
34.1
33.5
34.7
7.1
5.7
8.4
71.1
69.4
72.8
21.9
21.5
22.2
2.4
1.4
3.4
1.0
1.0
1.0
29
25
32
95
.48
9.5
10
1.2
68
.56
7.1
69
.9
1R
egio
n 3
577.0
--
22.3
--
3.5
--
57.5
--
39.0
--
1.4
--
1.0
--
17
--
10
2.0
--
70
.1-
-
5R
egio
n 3
675.8
71.8
78.5
32.6
30.3
33.9
4.9
1.9
9.9
53.7
48.5
57.9
41.4
32.2
49.4
1.7
0.5
3.7
1.2
0.3
2.1
10
32
86
7.2
47
.47
6.9
61
.75
6.9
64
.1
28 A
ve. Y
M2
75.1
30.7
6.9
63.5
29.7
1.9
1.3
10
75
.56
3.7
M
in. Y
M2
70.4
20.6
0.9
42.3
11.1
0.5
0.3
13
6.9
54
.2
M
ax. Y
M2
79.3
34.7
16.6
75.3
56.7
4.0
2.8
32
10
2.0
70
.1
GR
AD
E:
YM
3
1R
egio
n 2
076.9
--
33.3
--
26.4
--
61.3
--
12.3
--
2.8
--
1.9
--
27
--
79
.7-
-6
4.7
--
1R
egio
n 3
071.9
--
28.0
--
6.0
--
66.7
--
27.3
--
1.7
--
1.2
--
0-
-5
4.0
--
58
.4-
-
2 A
ve. Y
M3
74.4
30.7
16.2
64.0
19.8
2.3
1.6
14
66
.86
1.5
M
in. Y
M3
71.9
28.0
6.0
61.3
12.3
1.7
1.2
05
4.0
58
.4
M
ax. Y
M3
76.9
33.3
26.4
66.7
27.3
2.8
1.9
27
79
.76
4.7

South African Maize Crop Quality Report 2016/2017 Season
52
TA
BL
E 1
4:
PH
YS
ICA
L Q
UA
LIT
Y F
AC
TO
RS
OF
YE
LL
OW
MA
IZE
AC
CO
RD
ING
TO
GR
AD
E (
2016/2
017)
(co
nti
nu
e)
Nu
mb
er
Test
weig
ht
100
Kern
el siz
e (
%)
Bre
akag
e s
uscep
tib
ilit
y (
%)
Str
ess c
racks (
%)
SA
GL
Mil
lin
g i
nd
ex
2017
GY
A
of
Reg
ion
(kg
/hl)
kern
el m
ass (
g)
Ab
ove 1
0 m
m s
ieve
Ab
ove 8
mm
sie
ve
Belo
w 8
mm
sie
ve
< 6
.35 m
m s
ieve
< 4
.75 m
m s
ieve
sam
ple
save.
min
. m
ax.
ave.
min
. m
ax.
ave.
min
. m
ax.
ave.
min
. m
ax.
ave.
min
. m
ax.
ave.
min
. m
ax.
ave.
min
. m
ax.
ave.
min
. m
ax.
ave.
min
.m
ax.
ave.
min
.m
ax.
CL
AS
S:
CO
M
2R
egio
n 2
670.4
70.1
70.6
28.5
27.9
29.0
7.7
5.2
10.1
71.2
69.4
73.0
21.2
16.9
25.4
2.5
1.9
3.0
1.9
1.2
2.5
42
55
7.2
55
55
.48
59
.03
59
.25
8.7
59
.6
1R
egio
n 3
073.6
--
30.1
--
10.8
--
66.4
--
22.8
--
1.6
--
1.3
--
2-
-6
2.7
--
60
.6-
-
1R
egio
n 3
378.9
--
18.4
--
1.5
--
86.8
--
11.7
--
8.6
--
3.7
--
50
--
87
.1-
-6
6.5
--
4 A
ve. C
OM
73.3
26.4
6.9
73.9
19.2
3.8
2.2
15
66
.16
1.4
M
in. C
OM
70.1
18.4
1.5
66.4
11.7
1.6
1.2
25
5.5
58
.7
M
ax. C
OM
78.9
30.1
10.8
86.8
25.4
8.6
3.7
50
87
.16
6.5
451 A
ve. yello
w m
aiz
e76.9
33.5
11.4
65.6
23.0
1.1
0.8
87
6.8
64
.0
M
in. yello
w m
aiz
e67.6
18.4
0.0
13.0
1.6
0.1
0.0
03
6.9
54
.2
M
ax. yello
w m
aiz
e82.4
43.3
71.9
90.9
69.7
8.6
5.3
50
10
5.4
70
.9
1
000 A
ve. m
aiz
e77.3
34.3
17.3
64.8
17.9
1.2
0.8
87
8.7
64
.5
M
in. m
aiz
e67.6
18.4
0.0
13.0
0.7
0.0
0.0
03
6.9
54
.2
M
ax. m
aiz
e82.4
43.8
71.9
90.9
69.7
9.9
9.0
50
10
5.4
70
.9

South African Maize Crop Quality Report 2016/2017 Season
53
TA
BL
E 1
5:
PH
YS
ICA
L Q
UA
LIT
Y F
AC
TO
RS
OF
YE
LL
OW
MA
IZE
(2016/2
017)
Nu
mb
er
Test
weig
ht
100
Kern
el siz
e (
%)
Bre
akag
e s
uscep
tib
ilit
y (
%)
Str
ess c
racks (
%)
SA
GL
Mil
lin
g i
nd
ex
2017
GY
A
of
Reg
ion
(kg
/hl)
kern
el m
ass (
g)
Ab
ove 1
0 m
m s
ieve
Ab
ove 8
mm
sie
ve
Belo
w 8
mm
sie
ve
< 6
.35 m
m s
ieve
< 4
.75 m
m s
ieve
sam
ple
save.
min
. m
ax.
ave.
min
. m
ax.
ave.
min
. m
ax.
ave.
min
. m
ax.
ave.
min
. m
ax.
ave.
min
. m
ax.
ave.
min
. m
ax.
ave.
min
. m
ax.
ave.
min
.m
ax.
ave.
min
.m
ax.
YE
LL
OW
37
Regio
n 1
079.6
77.5
80.9
36.5
30.2
42.2
5.2
0.0
14.2
65.3
30.8
80.8
29.5
8.9
69.2
0.8
0.2
2.4
0.6
0.0
2.2
70
21
77
.56
3.6
90
.96
4.2
60
.86
7.4
4R
egio
n 1
178.6
77.7
79.6
33.9
31.3
35.9
4.2
3.3
5.4
63.2
50.2
70.8
32.6
25.2
46.5
0.8
0.2
1.6
0.4
0.0
0.8
53
97
5.4
70
.77
7.3
63
.76
2.5
64
.1
3R
egio
n 1
278.1
75.8
79.8
30.1
28.6
33.0
10.1
4.1
15.1
70.4
67.7
74.1
19.5
14.8
28.2
1.8
1.3
2.3
1.3
1.0
1.8
53
88
8.9
86
.69
3.0
66
.96
6.4
67
.9
6R
egio
n 1
377.0
72.9
79.0
29.6
25.1
34.4
8.6
2.4
21.8
66.2
55.9
71.2
25.2
9.4
41.7
2.5
1.1
4.4
1.5
1.0
2.8
12
52
18
9.6
85
.49
2.3
67
.16
6.0
67
.8
8R
egio
n 1
477.6
76.4
79.4
32.1
29.3
38.6
10.0
4.2
35.9
65.9
57.7
69.4
24.1
6.4
29.3
1.0
0.2
1.9
0.7
0.1
1.3
92
14
84
.28
0.1
93
.36
5.8
64
.86
8.0
4R
egio
n 1
777.2
75.0
78.7
29.7
27.0
31.0
8.2
3.9
11.5
63.9
59.7
72.9
27.9
20.0
36.4
1.7
0.8
3.9
1.2
0.6
2.8
61
12
85
.27
8.2
88
.96
6.0
64
.36
6.9
3R
egio
n 1
877.7
77.0
78.9
29.6
29.3
29.8
5.8
4.9
6.8
69.8
67.7
72.9
24.4
22.2
25.6
1.7
1.4
1.8
1.2
1.2
1.3
96
11
85
.28
3.5
88
.56
6.0
65
.66
6.8
6R
egio
n 1
976.4
72.3
78.4
32.2
27.9
35.7
13.0
6.4
18.8
68.5
60.9
75.3
18.5
11.1
24.6
1.0
0.8
1.5
0.7
0.4
1.0
85
13
82
.86
9.0
88
.16
5.4
62
.16
6.7
9R
egio
n 2
076.8
74.9
79.1
31.8
29.0
35.7
12.2
5.3
26.4
65.1
61.3
73.8
22.7
11.4
32.9
1.6
0.9
2.8
1.2
0.7
2.2
12
12
78
0.0
69
.38
6.9
64
.86
2.2
66
.4
11
Regio
n 2
178.2
76.1
79.6
34.5
29.0
37.7
18.0
4.0
71.9
65.0
17.9
77.2
17.0
5.9
32.5
0.9
0.3
1.6
0.7
0.2
1.3
93
16
84
.67
3.6
95
.06
5.9
63
.26
8.4
3R
egio
n 2
277.0
74.8
78.1
32.6
27.0
39.2
11.1
3.3
25.8
61.9
56.5
64.8
27.0
9.9
40.2
1.6
1.2
1.8
1.0
0.6
1.6
16
10
22
83
.68
0.0
88
.36
5.6
64
.86
6.8
4R
egio
n 2
376.8
75.9
77.7
33.0
28.9
36.7
5.9
3.7
9.4
70.1
66.2
73.3
24.0
19.9
29.0
1.4
1.2
1.6
1.0
0.6
1.4
10
41
68
6.3
83
.68
9.7
66
.36
5.6
67
.1
3R
egio
n 2
477.5
76.3
78.3
26.2
25.3
27.6
5.0
3.6
5.9
62.2
57.0
67.6
32.8
26.8
39.4
1.1
0.5
1.4
0.8
0.1
1.2
10
811
88
.57
9.9
95
.56
6.8
64
.76
8.5
26
Regio
n 2
577.4
75.7
79.7
31.9
26.5
39.7
9.9
3.6
27.6
63.3
39.3
71.3
26.8
9.6
56.5
1.0
0.2
2.2
0.6
0.2
1.5
70
17
67
.75
6.3
79
.86
1.8
59
.06
4.7
36
Regio
n 2
675.8
70.1
78.9
31.4
26.4
37.5
10.6
2.4
54.6
64.2
40.0
73.0
25.2
5.4
46.2
1.8
0.2
5.1
1.2
0.0
3.1
81
25
71
.33
6.9
90
.26
2.6
54
.26
7.3
33
Regio
n 2
876.8
74.7
78.8
33.9
28.0
39.9
12.5
5.1
23.0
64.4
13.0
74.4
23.1
7.0
68.5
0.9
0.3
2.5
0.6
0.0
1.6
60
18
74
.16
4.5
90
.76
3.3
61
.06
7.4
75
Regio
n 2
976.7
69.1
80.7
35.1
28.1
43.3
13.7
2.5
50.9
66.8
31.0
90.9
19.5
6.2
60.8
1.0
0.1
5.3
0.7
0.0
5.3
60
17
77
.76
0.1
97
.76
4.2
59
.96
9.0
35
Regio
n 3
075.1
67.6
79.2
33.9
28.0
40.1
13.1
0.9
32.1
67.7
56.9
77.0
19.2
4.7
41.5
1.0
0.2
2.9
0.7
0.0
2.2
60
23
73
.95
4.0
88
.86
3.3
58
.46
6.9
14
Regio
n 3
177.0
74.8
79.1
33.4
31.4
38.2
15.2
10.3
28.9
67.7
61.0
77.0
17.1
10.1
25.6
0.6
0.3
1.0
0.4
0.1
0.8
50
19
75
.06
6.9
82
.46
3.5
61
.66
5.3
26
Regio
n 3
276.9
68.8
80.9
34.6
25.8
40.2
14.2
3.3
23.8
66.9
36.3
74.6
18.9
1.6
56.7
1.1
0.2
2.5
0.8
0.0
2.1
11
33
27
8.8
67
.29
6.5
64
.56
1.6
68
.8
27
Regio
n 3
376.0
71.4
78.9
32.7
18.4
39.4
11.2
0.6
23.7
69.0
42.3
86.8
19.7
6.9
56.7
1.5
0.2
8.6
1.0
0.0
3.7
70
50
75
.45
6.5
89
.36
3.6
59
.16
6.9
40
Regio
n 3
476.3
69.9
82.4
33.6
23.5
39.2
14.0
1.5
42.1
66.1
18.1
77.5
19.9
4.2
69.7
0.9
0.2
3.4
0.6
0.0
1.7
10
13
47
9.5
54
.41
03
.76
4.6
58
.67
0.5
10
Regio
n 3
576.7
73.3
78.7
30.8
22.3
35.7
8.8
1.3
17.4
63.9
52.4
74.2
27.3
15.3
46.3
1.0
0.2
4.3
0.7
0.2
3.2
84
17
77
.66
6.9
10
2.0
64
.26
1.6
70
.1
28
Regio
n 3
677.2
71.8
80.1
33.6
30.3
37.9
7.0
1.7
21.7
58.6
34.9
75.4
34.4
10.6
58.6
1.4
0.4
4.4
1.1
0.3
3.5
91
29
74
.94
7.4
10
5.4
63
.55
6.9
70
.9
451
Ave.
yello
w76.9
33.5
11.4
65.6
23.0
1.1
0.8
87
6.8
64
.0
M
in. yello
w67.6
18.4
0.0
13.0
1.6
0.1
0.0
03
6.9
54
.2
M
ax. yello
w82.4
43.3
71.9
90.9
69.7
8.6
5.3
50
10
5.4
70
.9

South African Maize Crop Quality Report 2016/2017 Season
54
TABLE 16: PHYSICAL QUALITY FACTORS OF WHITE AND YELLOW MAIZE
2007/2008 - 2016/2017Number Test weight 100 Kernel size (%) Breakage susceptibility (%) Stress cracks
Season of (kg/hl) kernel mass (g) Above 10 mm sieve Above 8 mm sieve Below 8 mm sieve < 6.35 mm sieve < 4.75 mm sieve (%)
samples ave. min. max. ave. min. max. ave. min. max. ave. min. max. ave. min. max. ave. min. max. ave. min. max. ave. min. max.
White Maize
2007/08 483 78.2 65.3 81.6 34.5 17.0 45.6 24.5 0.4 69.7 63.8 23.3 84.2 11.7 1.0 76.2 1.2 0.1 9.7 0.9 0.0 7.3 4 0 44
2008/09 483 77.6 61.6 82.8 35.1 27.1 44.0 26.2 0.5 46.4 63.3 43.1 84.0 10.5 2.1 51.0 1.5 0.2 11.7 1.1 0.1 8.7 5 0 50
2009/10 458 77.9 60.2 84.4 36.0 24.1 59.1 26.3 1.2 90.7 62.6 9.2 82.0 11.2 0.1 53.5 1.5 0.2 24.3 1.2 0.1 23.1 4 0 36
2010/11 413 77.7 71.3 81.8 34.5 25.0 44.0 24.9 1.4 55.8 63.5 33.5 83.9 11.6 1.7 65.1 1.6 0.0 8.4 1.2 0.0 5.9 5 0 31
2011/12 577 78.2 71.8 82.0 31.2 17.4 44.4 18.8 0.8 63.3 64.9 26.2 79.7 16.3 2.8 72.4 0.8 0.0 8.6 0.6 0.0 4.9 5 0 25
2012/13 508 78.2 69.7 82.9 29.6 17.7 46.0 15.1 0.0 59.9 65.0 16.2 80.5 20.0 3.1 83.5 1.0 0.0 6.6 0.7 0.0 4.6 4 0 37
2013/14 451 77.6 68.7 81.9 34.0 26.0 46.5 24.7 0.7 71.3 64.7 23.4 82.7 10.6 1.1 37.7 1.3 0.0 7.2 1.0 0.0 4.2 7 0 37
2014/15 485 78.3 70.2 83.1 31.1 20.3 48.3 15.4 0.3 86.7 66.1 13.1 81.8 18.4 0.0 51.5 1.1 0.0 12.1 0.8 0.0 5.6 6 0 61
2015/16 415 78.1 68.5 83.9 32.4 20.8 40.8 15.2 0.3 99.4 66.7 0.1 89.5 18.2 0.0 63.8 0.9 0.0 7.2 0.4 0.0 4.3 5 0 30
2016/17 549 77.7 70.0 81.8 35.0 22.8 43.8 22.1 1.8 64.2 64.1 13.6 82.4 13.7 0.7 62.6 1.2 0.0 9.9 0.8 0.0 9.0 8 0 42
Weighted Average 78.0 33.3 21.2 64.5 14.3 1.2 0.9 5
Minimum 60.2 17.0 0.0 0.1 0.0 0.0 0.0 0
Maximum 84.4 59.1 99.4 89.5 83.5 24.3 23.1 61
Yellow Maize
2007/08 417 76.7 69.3 79.9 32.4 24.4 42.9 15.2 0.3 50.9 66.0 39.6 78.6 18.8 2.8 60.1 1.9 0.3 15.2 1.3 0.1 8.3 5 0 58
2008/09 327 76.6 69.9 81.2 32.8 24.2 45.4 15.7 1.3 52.8 66.5 44.3 79.9 17.8 1.6 44.6 1.8 0.1 10.3 1.3 0.0 9.9 6 0 32
2009/10 342 76.6 69.0 81.6 33.0 23.3 42.5 14.3 0.0 41.7 68.5 50.9 79.9 17.2 4.0 47.7 2.1 0.4 10.3 1.6 0.3 8.4 5 0 27
2010/11 280 76.2 69.0 81.5 31.9 22.0 40.4 14.4 1.1 43.7 68.6 39.5 79.6 16.9 1.9 58.7 2.1 0.5 8.1 1.6 0.0 5.0 5 0 24
2011/12 423 76.1 68.1 81.0 29.4 14.5 40.9 11.3 0.0 38.3 63.9 13.7 79.4 24.8 6.5 86.3 1.3 0.2 15.6 1.0 0.0 8.3 6 0 27
2012/13 492 76.6 67.8 81.6 28.4 15.2 41.3 9.8 0.0 42.6 61.7 10.1 80.9 28.5 3.4 89.9 1.7 0.1 8.2 1.1 0.0 5.4 5 0 31
2013/14 479 76.0 56.6 80.9 31.8 18.6 43.1 14.9 0.3 52.7 67.1 21.4 79.7 18.0 2.6 64.8 1.9 0.1 14.5 1.4 0.0 9.9 7 0 53
2014/15 515 76.3 67.3 83.1 28.6 17.8 38.2 8.8 0.0 30.2 63.4 9.2 78.9 27.8 4.2 90.4 1.3 0.1 6.8 0.9 0.0 4.8 5 0 56
2015/16 505 76.7 59.8 81.7 31.8 17.1 43.1 11.8 0.3 34.1 66.6 15.6 93.6 21.6 0.2 77.9 1.0 0.0 4.5 0.5 0.0 4.1 5 0 31
2016/17 451 76.9 67.6 82.4 33.5 18.4 43.3 11.4 0.0 71.9 65.6 13.0 90.9 23.0 1.6 69.7 1.1 0.1 8.6 0.8 0.0 5.3 8 0 50
Weighted Average 76.5 31.2 12.5 65.5 22.0 1.6 1.1 5.7
Minimum 56.6 14.5 0.0 9.2 0.2 0.0 0.0 0
Maximum 83.1 45.4 71.9 93.6 90.4 15.6 9.9 58
White & Yellow Maize
2007/08 900 77.5 65.3 81.6 33.5 17.0 45.6 20.2 0.3 69.7 64.8 23.3 84.2 15.0 1.0 76.2 1.5 0.1 15.2 1.1 0.0 8.3 4 0 58
2008/09 810 77.2 61.6 82.8 34.2 24.2 45.4 21.9 0.5 52.8 64.6 43.1 84.0 13.4 1.6 51.0 1.6 0.1 11.7 1.2 0.0 9.9 5 0 50
2009/10 800 77.4 60.2 84.4 34.7 23.3 59.1 21.1 0.0 90.7 65.1 9.2 82.0 13.7 0.1 53.5 1.8 0.2 24.3 1.4 0.1 23.1 4 0 36
2010/11 693 77.1 69.0 81.8 33.5 22.0 44.0 20.7 1.1 55.8 65.6 33.5 83.9 13.8 1.7 65.1 1.8 0.0 8.4 1.3 0.0 5.9 5 0 31
2011/12 1000 77.3 68.1 82.0 30.4 14.5 44.4 15.6 0.0 63.3 64.5 13.7 79.7 19.9 2.8 86.3 1.0 0.0 15.6 0.7 0.0 8.3 6 0 27
2012/13 1000 77.4 67.8 82.9 29.0 15.2 46.0 12.5 0.0 59.9 63.4 10.1 80.9 24.2 3.1 89.9 1.4 0.0 8.2 0.9 0.0 5.4 5 0 37
2013/14 930 76.8 56.6 81.9 32.9 18.6 46.5 19.6 0.3 71.3 65.9 23.4 82.7 14.4 1.1 64.8 1.6 0.0 14.5 1.2 0.0 9.9 7 0 53
2014/15 1000 77.3 67.3 83.1 29.8 17.8 48.3 12.0 0.0 86.7 64.7 9.2 81.8 23.2 0.0 90.4 1.2 0.0 12.1 0.8 0.0 5.6 6 0 61
2015/16 920 77.3 59.8 83.9 32.1 17.1 43.1 13.3 0.3 99.4 66.7 0.1 93.6 20.0 0.0 77.9 1.0 0.0 7.2 0.5 0.0 4.3 5 0 31
2016/17 1000 77.3 67.6 82.4 34.3 18.4 43.8 17.3 0.0 71.9 64.8 13.0 90.9 17.9 0.7 69.7 1.2 0.0 9.9 0.8 0.0 9.0 8 0 50
Weighted Average 77.3 32.3 17.1 65.0 17.9 1.4 1.0 6
Minimum 56.6 14.5 0.0 0.1 0.0 0.0 0.0 0
Maximum 84.4 59.1 99.4 93.6 90.4 24.3 23.1 61
Weighted average
Graph 37: Test weight of white and yellow maize over 10 seasons
76.076.276.476.676.877.077.277.477.677.878.0
2007
/08
2008
/09
2009
/10
2010
/11
2011
/12
2012
/13
2013
/14
2014
/15
2015
/16
2016
/17
kg/hl
77.3

South African Maize Crop Quality Report 2016/2017 Season
55
2007/08 2008/09 2009/10 2010/11 2011/12 2012/13 2013/14 2014/15 2015/16 2016/17White Maize 34.5 35.1 36.0 34.5 31.2 29.6 34.0 31.1 32.4 35.0Yellow Maize 32.4 32.8 33.0 31.9 29.4 28.4 31.8 28.6 31.8 33.5
25.0
27.0
29.0
31.0
33.0
35.0
37.0g
2007/08 2008/09 2009/10 2010/11 2011/12 2012/13 2013/14 2014/15 2015/16 2016/17White Maize 24.5 26.2 26.3 24.9 18.8 15.1 24.7 15.4 15.2 22.1Yellow Maize 15.2 15.7 14.3 14.4 11.3 9.8 14.9 8.8 11.8 11.4
0.0
5.0
10.0
15.0
20.0
25.0
30.0
%
2007/08 2008/09 2009/10 2010/11 2011/12 2012/13 2013/14 2014/15 2015/16 2016/17White Maize 11.7 10.5 11.2 11.6 16.3 20.0 10.6 18.4 18.2 13.7Yellow Maize 18.8 17.8 17.2 16.9 24.8 28.5 18.0 27.8 21.6 23.0
0.0
5.0
10.0
15.0
20.0
25.0
30.0
%
Graph 38: 100 Kernel mass over 10 seasons
Graph 39: Kernel size above 10 mm sieve over 10 seasons
Graph 40: Kernel size below 8 mm sieve over 10 seasons

South African Maize Crop Quality Report 2016/2017 Season
56
TA
BL
E 1
7:
RO
FF
MIL
LIN
G A
ND
WH
ITE
NE
SS
IN
DE
X O
F W
HIT
E M
AIZ
E A
CC
OR
DIN
G
TO
GR
AD
E (
2016/2
017)
Nu
mb
er
of
sam
ple
s
Reg
ion
Roff
Mill
ing
Wh
iten
ess i
nd
ex
Bre
ak 1
, %
Bre
ak
2, %
Bre
ak
3, %
Gri
ts, %
Ch
op
, %
Extr
acti
on
, %
(To
tal
meal)
Wh
iten
ess i
nd
ex
Wh
iten
ess i
nd
ex
un
sif
ted
sif
ted
87:1
3
ave.
min
.m
ax
.a
ve
.m
in.
ma
x.
av
e.
min
.m
ax
.a
ve
.m
in.
ma
x.
av
e.
min
.m
ax.
ave.
min
.m
ax.
ave.
min
.m
ax.
ave.
min
.m
ax.
GR
AD
E:
WM
1
2R
egio
n 1
012.7
12.4
13.0
10.7
10.4
11.0
23.0
22.1
23.9
33.2
32.5
33.9
20.3
20
.22
0.5
79
.77
9.5
79
.82
8.0
26
.92
9.2
24
.72
0.6
28
.8
1R
egio
n 1
114.6
--
10.4
--
22.3
--
33.1
--
19.6
--
80
.4-
-2
5.4
--
15
.9-
-
13
Regio
n 1
215.2
14.3
17.6
10.3
9.6
11.8
20.8
19.1
22.1
32.2
29.0
34.1
21.5
19
.52
3.4
78
.57
6.6
80
.52
7.7
21
.73
1.8
21
.91
6.8
27
.1
20
Regio
n 1
315.7
13.3
18.8
10.2
8.9
11.4
20.8
19.5
23.6
31.4
27.4
35.7
21.9
19
.62
3.2
78
.17
6.8
80
.42
6.9
20
.73
5.0
19
.11
2.2
25
.2
30
Regio
n 1
415.3
14.0
16.4
10.2
8.4
11.2
21.6
19.4
24.0
32.2
30.6
33.9
20.7
19
.22
2.5
79
.37
7.5
80
.82
7.7
22
.33
8.4
20
.21
5.0
26
.4
4R
egio
n 1
514.9
13.5
16.8
10.6
10.0
11.3
21.1
19.9
22.0
32.0
30.2
33.1
21.4
20
.52
2.6
78
.67
7.4
79
.52
8.5
27
.92
9.9
21
.61
9.0
23
.7
15
Regio
n 1
715.7
14.3
17.9
10.5
9.8
11.1
21.2
20.1
22.9
31.1
27.9
32.7
21.5
19
.42
4.0
78
.57
6.0
80
.62
8.3
25
.63
2.8
19
.91
4.4
26
.6
6R
egio
n 1
816.0
14.4
17.1
10.5
9.6
11.3
20.4
18.6
21.7
31.6
29.7
34.4
21.5
20
.82
2.3
78
.57
7.7
79
.22
8.0
25
.43
1.6
21
.71
7.9
25
.1
11
Regio
n 1
915.9
14.8
18.4
10.2
9.3
11.1
20.7
19.3
22.2
31.8
29.9
33.8
21.3
19
.92
2.3
78
.77
7.7
80
.12
6.8
22
.13
1.3
21
.41
5.4
28
.0
21
Regio
n 2
015.5
13.8
17.2
10.4
9.3
11.3
21.2
19.1
24.2
31.9
29.4
35.6
21.1
19
.42
2.8
78
.97
7.2
80
.62
5.1
17
.33
1.2
17
.81
0.5
27
.0
56
Regio
n 2
113.9
11.3
17.1
10.6
9.2
11.9
21.7
19.0
24.1
32.2
22.8
37.1
21.6
18
.83
0.3
78
.46
9.7
81
.22
6.2
19
.93
1.1
17
.61
2.5
22
.1
31
Regio
n 2
214.6
12.7
17.0
10.7
9.0
11.4
22.4
20.2
24.1
31.7
28.5
34.5
20.5
18
.32
2.6
79
.57
7.4
81
.72
6.6
20
.93
3.8
18
.311
.42
7.6
16
Regio
n 2
315.3
13.9
16.9
10.9
10.2
11.9
21.5
19.5
24.4
31.3
29.0
33.4
21.0
19
.22
3.2
79
.07
6.8
80
.82
9.1
25
.33
3.4
22
.11
6.8
32
.9
16
Regio
n 2
414.8
13.5
16.5
10.7
9.9
12.8
21.8
20.4
24.2
31.5
29.3
33.1
21.2
19
.32
3.0
78
.87
7.0
80
.72
7.3
23
.03
0.1
19
.71
3.6
25
.2
4R
egio
n 2
515.2
14.7
15.8
10.4
10.3
10.6
22.3
21.3
24.8
29.8
28.6
31.0
22.3
19
.32
3.6
77
.77
6.4
80
.72
3.6
19
.52
6.1
15
.71
2.7
19
.7
19
Regio
n 2
614.6
10.5
17.0
10.3
8.4
11.4
20.9
17.9
23.2
31.8
28.2
36.5
22.4
19
.32
4.2
77
.67
5.8
80
.72
5.7
16
.23
4.6
16
.96
.73
4.2
21
Regio
n 2
813.2
9.5
15.5
10.4
9.3
12.5
21.7
20.2
23.0
32.9
29.4
36.2
21.7
19
.82
3.4
78
.37
6.6
80
.22
5.9
21
.33
0.4
18
.61
4.5
28
.6
26
Regio
n 2
913.2
10.1
15.7
10.5
9.6
11.5
22.2
19.8
30.0
33.0
28.2
36.3
21.1
19
.12
3.3
78
.97
6.7
80
.92
3.8
17
.62
7.7
14
.08
.01
8.4
17
Regio
n 3
013.7
12.0
16.4
10.7
9.2
12.0
22.9
20.7
32.9
31.5
22.3
34.2
21.3
19
.42
2.9
78
.77
7.1
80
.62
2.9
17
.53
4.5
14
.77
.42
1.8
15
Regio
n 3
113.4
11.5
15.9
10.4
9.2
11.1
21.8
19.7
26.0
32.0
28.0
34.4
22.5
19
.12
4.4
77
.57
5.6
80
.92
3.6
15
.02
7.6
14
.43
.11
8.4
19
Regio
n 3
213.5
10.9
15.0
10.5
9.6
11.4
21.6
20.5
23.1
32.5
29.8
35.3
21.9
19
.82
3.5
78
.17
6.5
80
.22
4.1
11
.93
1.7
14
.9-0
.52
2.3
38
Regio
n 3
313.4
11.1
15.3
10.3
9.3
11.6
21.8
19.8
23.7
32.7
29.5
35.2
21.7
20
.02
3.5
78
.37
6.5
80
.02
2.9
-5.4
29
.01
3.9
-14
.32
0.7
38
Regio
n 3
413.7
10.9
16.8
10.6
9.7
11.8
21.5
19.0
23.4
32.7
30.2
35.5
21.5
19
.22
3.8
78
.57
6.2
80
.82
4.9
20
.02
9.7
15
.811
.62
0.9
5R
egio
n 3
513.4
10.4
15.4
10.6
8.8
11.6
21.6
21.0
22.5
32.9
30.4
37.5
21.6
19
.62
2.2
78
.47
7.8
80
.42
8.8
25
.03
5.6
21
.61
7.0
26
.5
25
Regio
n 3
613.4
11.4
15.7
10.2
9.2
11.3
21.7
19.8
23.5
33.5
30.2
36.3
21.3
19
.42
2.9
78
.77
7.1
80
.62
3.5
17
.12
9.0
17
.81
0.6
27
.3
469 A
ve. W
M1
14.3
10.5
21.6
32.2
21.4
78
.62
5.7
17
.6
M
in. W
M1
9.5
8.4
17.9
22.3
18
.36
9.7
-5.4
-14
.3
M
ax. W
M1
18.8
12.8
32.9
37.5
30
.38
1.7
38
.43
4.2
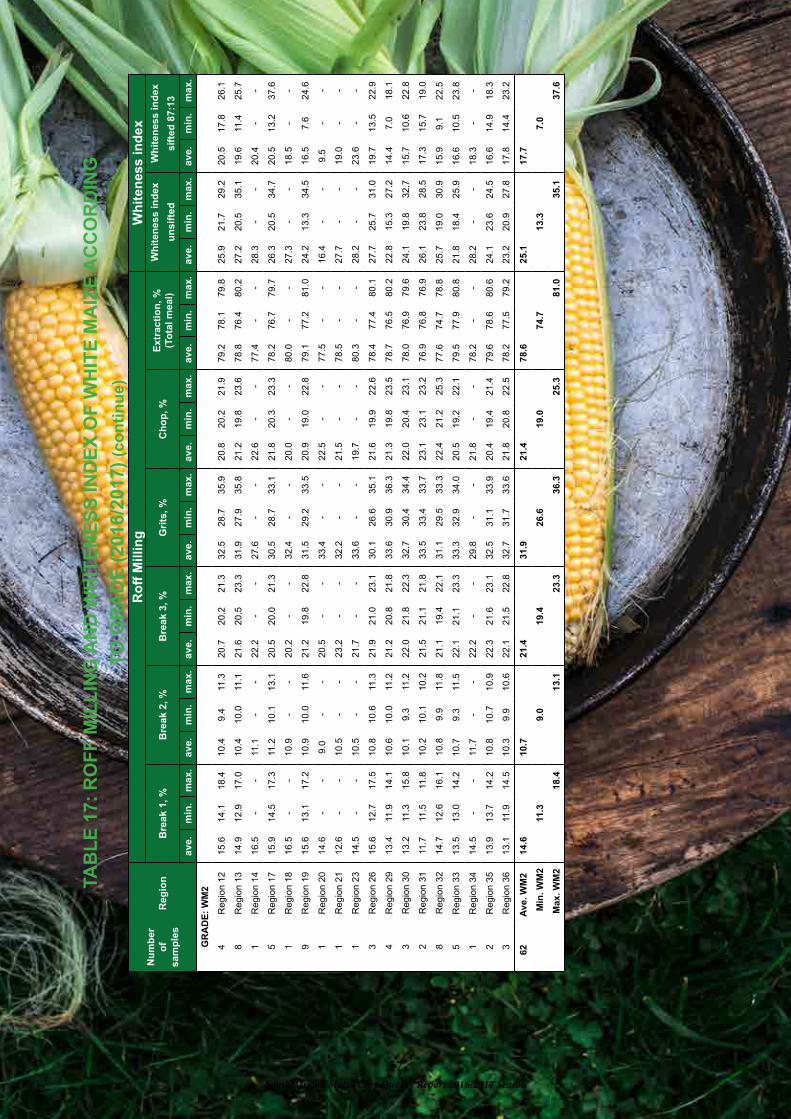
South African Maize Crop Quality Report 2016/2017 Season
57
TA
BL
E 1
7:
RO
FF
MIL
LIN
G A
ND
WH
ITE
NE
SS
IN
DE
X O
F W
HIT
E M
AIZ
E A
CC
OR
DIN
G
TO
GR
AD
E (
2016/2
017)
(co
nti
nu
e)
Nu
mb
er
of
sam
ple
s
Reg
ion
Roff
Mill
ing
Wh
iten
ess i
nd
ex
Bre
ak 1
, %
Bre
ak
2, %
Bre
ak
3, %
Gri
ts, %
Ch
op
, %
Extr
acti
on
, %
(To
tal
meal)
Wh
iten
ess i
nd
ex
Wh
iten
ess i
nd
ex
un
sif
ted
sif
ted
87:1
3
ave.
min
.m
ax
.a
ve
.m
in.
ma
x.
av
e.
min
.m
ax
.a
ve
.m
in.
ma
x.
av
e.
min
.m
ax.
ave.
min
.m
ax.
ave.
min
.m
ax.
ave.
min
.m
ax.
GR
AD
E:
WM
2
4R
egio
n 1
215.6
14.1
18.4
10.4
9.4
11.3
20.7
20.2
21.3
32.5
28.7
35.9
20.8
20
.22
1.9
79
.27
8.1
79
.82
5.9
21
.72
9.2
20
.51
7.8
26
.1
8R
egio
n 1
314.9
12.9
17.0
10.4
10.0
11.1
21.6
20.5
23.3
31.9
27.9
35.8
21.2
19
.82
3.6
78
.87
6.4
80
.22
7.2
20
.53
5.1
19
.611
.42
5.7
1R
egio
n 1
416.5
--
11.1
--
22.2
--
27.6
--
22.6
--
77
.4-
-2
8.3
--
20
.4-
-
5R
egio
n 1
715.9
14.5
17.3
11.2
10.1
13.1
20.5
20.0
21.3
30.5
28.7
33.1
21.8
20
.32
3.3
78
.27
6.7
79
.72
6.3
20
.53
4.7
20
.51
3.2
37
.6
1R
egio
n 1
816.5
--
10.9
--
20.2
--
32.4
--
20.0
--
80
.0-
-2
7.3
--
18
.5-
-
9R
egio
n 1
915.6
13.1
17.2
10.9
10.0
11.6
21.2
19.8
22.8
31.5
29.2
33.5
20.9
19
.02
2.8
79
.17
7.2
81
.02
4.2
13
.33
4.5
16
.57
.62
4.6
1R
egio
n 2
014.6
--
9.0
--
20.5
--
33.4
--
22.5
--
77
.5-
-1
6.4
--
9.5
--
1R
egio
n 2
112.6
--
10.5
--
23.2
--
32.2
--
21.5
--
78
.5-
-2
7.7
--
19
.0-
-
1R
egio
n 2
314.5
--
10.5
--
21.7
--
33.6
--
19.7
--
80
.3-
-2
8.2
--
23
.6-
-
3R
egio
n 2
615.6
12.7
17.5
10.8
10.6
11.3
21.9
21.0
23.1
30.1
26.6
35.1
21.6
19
.92
2.6
78
.47
7.4
80
.12
7.7
25
.73
1.0
19
.71
3.5
22
.9
4R
egio
n 2
913.4
11.9
14.1
10.6
10.0
11.2
21.2
20.8
21.8
33.6
30.9
36.3
21.3
19
.82
3.5
78
.77
6.5
80
.22
2.8
15
.32
7.2
14
.47
.01
8.1
3R
egio
n 3
013.2
11.3
15.8
10.1
9.3
11.2
22.0
21.8
22.3
32.7
30.4
34.4
22.0
20
.42
3.1
78
.07
6.9
79
.62
4.1
19
.83
2.7
15
.71
0.6
22
.8
2R
egio
n 3
111.7
11.5
11.8
10.2
10.1
10.2
21.5
21.1
21.8
33.5
33.4
33.7
23.1
23
.12
3.2
76
.97
6.8
76
.92
6.1
23
.82
8.5
17
.31
5.7
19
.0
8R
egio
n 3
214.7
12.6
16.1
10.8
9.9
11.8
21.1
19.4
22.1
31.1
29.5
33.3
22.4
21
.22
5.3
77
.67
4.7
78
.82
5.7
19
.03
0.9
15
.99
.12
2.5
5R
egio
n 3
313.5
13.0
14.2
10.7
9.3
11.5
22.1
21.1
23.3
33.3
32.9
34.0
20.5
19
.22
2.1
79
.57
7.9
80
.82
1.8
18
.42
5.9
16
.61
0.5
23
.8
1R
egio
n 3
414.5
--
11.7
--
22.2
--
29.8
--
21.8
--
78
.2-
-2
8.2
--
18
.3-
-
2R
egio
n 3
513.9
13.7
14.2
10.8
10.7
10.9
22.3
21.6
23.1
32.5
31.1
33.9
20.4
19
.42
1.4
79
.67
8.6
80
.62
4.1
23
.62
4.5
16
.61
4.9
18
.3
3R
egio
n 3
613.1
11.9
14.5
10.3
9.9
10.6
22.1
21.5
22.8
32.7
31.7
33.6
21.8
20
.82
2.5
78
.27
7.5
79
.22
3.2
20
.92
7.8
17
.81
4.4
23
.2
62 A
ve. W
M2
14.6
10.7
21.4
31.9
21.4
78
.62
5.1
17
.7
M
in. W
M2
11.3
9.0
19.4
26.6
19
.07
4.7
13
.37
.0
M
ax. W
M2
18.4
13.1
23.3
36.3
25
.38
1.0
35
.13
7.6

South African Maize Crop Quality Report 2016/2017 Season
58
TA
BL
E 1
7:
RO
FF
MIL
LIN
G A
ND
WH
ITE
NE
SS
IN
DE
X O
F W
HIT
E M
AIZ
E A
CC
OR
DIN
G
TO
GR
AD
E (
2016/2
017)
(co
nti
nu
e)
Nu
mb
er
of
sam
ple
s
Reg
ion
Roff
Mill
ing
Wh
iten
ess i
nd
ex
Bre
ak 1
, %
Bre
ak
2, %
Bre
ak
3, %
Gri
ts, %
Ch
op
, %
Extr
acti
on
, %
(To
tal
meal)
Wh
iten
ess i
nd
ex
Wh
iten
ess i
nd
ex
un
sif
ted
sif
ted
87:1
3
ave.
min
.m
ax
.a
ve
.m
in.
ma
x.
av
e.
min
.m
ax
.a
ve
.m
in.
ma
x.
av
e.
min
.m
ax.
ave.
min
.m
ax.
ave.
min
.m
ax.
ave.
min
.m
ax.
GR
AD
E:
WM
3
1R
egio
n 1
314.5
--
10.4
--
21.6
--
31.0
--
22.6
--
77
.4-
-2
0.7
--
9.1
--
1R
egio
n 1
718.0
--
11.4
--
22.4
--
27.1
--
21.1
--
78
.9-
-3
1.5
--
20
.8-
-
1R
egio
n 1
913.9
--
9.9
--
21.4
--
31.9
--
22.9
--
77
.1-
-1
9.3
--
15
.5-
-
1R
egio
n 2
016.6
--
10.2
--
22.9
--
29.7
--
20.6
--
79
.4-
-2
0.2
--
7.4
--
1R
egio
n 3
014.1
--
9.9
--
22.1
--
32.8
--
21.1
--
78
.9-
-1
8.4
--
10
.1-
-
1R
egio
n 3
211.4
--
9.8
--
21.0
--
36.2
--
21.5
--
78
.5-
-1
8.1
--
10
.6-
-
1R
egio
n 3
515.6
--
11.1
--
21.3
--
30.1
--
21.9
--
78
.1-
-2
5.3
--
14
.0-
-
2R
egio
n 3
612.8
12.8
12.8
10.0
9.7
10.3
23.4
23.2
23.5
33.6
33.4
33.9
20.2
20
.02
0.4
79
.87
9.6
80
.02
5.5
25
.32
5.8
19
.41
7.5
21
.3
9 A
ve. W
M3
14.4
10.3
22.2
31.8
21.3
78
.72
2.7
14
.0
M
in. W
M3
11.4
9.7
21.0
27.1
20
.07
7.1
18
.17
.4
M
ax. W
M3
18.0
11.4
23.5
36.2
22
.98
0.0
31
.52
1.3
CL
AS
S:
CO
M
1R
egio
n 1
314.0
--
10.3
--
22.4
--
31.9
--
21.4
--
78
.6-
-1
3.9
--
4.1
--
3R
egio
n 1
915.4
13.0
17.1
10.4
10.0
10.9
22.2
20.9
22.9
31.3
30.0
33.5
20.7
19
.72
1.7
79
.37
8.3
80
.32
5.6
22
.42
8.3
15
.51
2.8
17
.4
1R
egio
n 2
014.5
--
10.3
--
20.4
--
33.2
--
21.7
--
78
.3-
-2
7.7
--
22
.2-
-
1R
egio
n 3
113.2
--
10.0
--
20.4
--
33.7
--
22.7
--
77
.3-
--4
.3-
--1
7.5
--
2R
egio
n 3
311.5
11.2
11.8
10.2
9.5
10.9
21.6
21.0
22.3
33.8
33.1
34.5
22.9
22
.02
3.8
77
.17
6.2
78
.011
.05
.71
6.4
2.3
-4.0
8.5
1R
egio
n 3
514.9
--
10.2
--
21.5
--
30.7
--
22.7
--
77
.3-
-2
8.4
--
19
.0-
-
9 A
ve. C
OM
14.0
10.3
21.6
32.3
21.8
78
.21
8.3
8.8
M
in. C
OM
11.2
9.5
20.4
30.0
19
.77
6.2
-4.3
-17
.5
M
ax. C
OM
17.1
10.9
22.9
34.5
23
.88
0.3
28
.42
2.2
5
49 A
ve. w
hit
e m
aiz
e14.3
10.5
21.6
32.2
21.4
78
.62
5.4
17
.4
M
in. w
hit
e m
aiz
e9.5
8.4
17.9
22.3
18
.36
9.7
-5.4
-17
.5
M
ax. w
hit
e m
aiz
e18.8
13.1
32.9
37.5
30
.38
1.7
38
.47
0.4

South African Maize Crop Quality Report 2016/2017 Season
59
TA
BL
E 1
8:
RO
FF
MIL
LIN
G A
ND
WH
ITE
NE
SS
IN
DE
X O
F W
HIT
E M
AIZ
E (
2016/2
017)
Nu
mb
er
of
sam
ple
s
Reg
ion
Roff
Mill
ing
Wh
iten
ess i
nd
ex
Bre
ak 1
, %
Bre
ak
2, %
Bre
ak
3, %
Gri
ts, %
Ch
op
, %
Extr
acti
on
, %
W
hit
en
ess i
nd
ex
Wh
iten
ess i
nd
ex
(To
tal
meal)
un
sif
ted
sif
ted
87:1
3
ave.
min
.m
ax
.a
ve
.m
in.
ma
x.
av
e.
min
.m
ax
.a
ve
.m
in.
ma
x.
av
e.
min
.m
ax.
ave.
min
.m
ax.
ave.
min
.m
ax.
ave.
min
.m
ax.
WH
ITE
2R
egio
n 1
012.7
12.4
13.0
10.7
10.4
11.0
23.0
22.1
23.9
33.2
32.5
33.9
20.3
20
.22
0.5
79
.77
9.5
79
.82
8.0
26
.92
9.2
24
.72
0.6
28
.8
1R
egio
n 1
114.6
--
10.4
--
22.3
--
33.1
--
19.6
--
80
.4-
-2
5.4
--
15
.9-
-
17
Regio
n 1
215.3
14.1
18.4
10.3
9.4
11.8
20.8
19.1
22.1
32.3
28.7
35.9
21.4
19
.52
3.4
78
.67
6.6
80
.52
7.3
21
.73
1.8
21
.61
6.8
27
.1
30
Regio
n 1
315.4
12.9
18.8
10.3
8.9
11.4
21.1
19.5
23.6
31.5
27.4
35.8
21.7
19
.62
3.6
78
.37
6.4
80
.42
6.3
13
.93
5.1
18
.44
.12
5.7
31
Regio
n 1
415.4
14.0
16.5
10.2
8.4
11.2
21.6
19.4
24.0
32.0
27.6
33.9
20.8
19
.22
2.6
79
.27
7.4
80
.82
7.7
22
.33
8.4
20
.21
5.0
26
.4
4R
egio
n 1
514.9
13.5
16.8
10.6
10.0
11.3
21.1
19.9
22.0
32.0
30.2
33.1
21.4
20
.52
2.6
78
.67
7.4
79
.52
8.5
27
.92
9.9
21
.61
9.0
23
.7
21
Regio
n 1
715.8
14.3
18.0
10.7
9.8
13.1
21.1
20.0
22.9
30.7
27.1
33.1
21.6
19
.42
4.0
78
.47
6.0
80
.62
8.0
20
.53
4.7
20
.11
3.2
37
.6
7R
egio
n 1
816.1
14.4
17.1
10.6
9.6
11.3
20.3
18.6
21.7
31.7
29.7
34.4
21.3
20
.02
2.3
78
.77
7.7
80
.02
7.9
25
.43
1.6
21
.21
7.9
25
.1
24
Regio
n 1
915.6
13.0
18.4
10.5
9.3
11.6
21.1
19.3
22.9
31.6
29.2
33.8
21.2
19
.02
2.9
78
.87
7.1
81
.02
5.4
13
.33
4.5
18
.67
.62
8.0
24
Regio
n 2
015.5
13.8
17.2
10.3
9.0
11.3
21.2
19.1
24.2
31.9
29.4
35.6
21.1
19
.42
2.8
78
.97
7.2
80
.62
4.7
16
.43
1.2
17
.27
.42
7.0
57
Regio
n 2
113.9
11.3
17.1
10.6
9.2
11.9
21.7
19.0
24.1
32.2
22.8
37.1
21.6
18
.83
0.3
78
.46
9.7
81
.22
6.3
19
.93
1.1
17
.61
2.5
22
.1
31
Regio
n 2
214.6
12.7
17.0
10.7
9.0
11.4
22.4
20.2
24.1
31.7
28.5
34.5
20.5
18
.32
2.6
79
.57
7.4
81
.72
6.6
20
.93
3.8
18
.311
.42
7.6
17
Regio
n 2
315.2
13.9
16.9
10.9
10.2
11.9
21.5
19.5
24.4
31.4
29.0
33.6
20.9
19
.22
3.2
79
.17
6.8
80
.82
9.0
25
.33
3.4
22
.21
6.8
32
.9
16
Regio
n 2
414.8
13.5
16.5
10.7
9.9
12.8
21.8
20.4
24.2
31.5
29.3
33.1
21.2
19
.32
3.0
78
.87
7.0
80
.72
7.3
23
.03
0.1
19
.71
3.6
25
.2
4R
egio
n 2
515.2
14.7
15.8
10.4
10.3
10.6
22.3
21.3
24.8
29.8
28.6
31.0
22.3
19
.32
3.6
77
.77
6.4
80
.72
3.6
19
.52
6.1
15
.71
2.7
19
.7
22
Regio
n 2
614.8
10.5
17.5
10.4
8.4
11.4
21.0
17.9
23.2
31.6
26.6
36.5
22.3
19
.32
4.2
77
.77
5.8
80
.72
6.0
16
.23
4.6
17
.36
.73
4.2
21
Regio
n 2
813.2
9.5
15.5
10.4
9.3
12.5
21.7
20.2
23.0
32.9
29.4
36.2
21.7
19
.82
3.4
78
.37
6.6
80
.22
5.9
21
.33
0.4
18
.61
4.5
28
.6
30
Regio
n 2
913.2
10.1
15.7
10.5
9.6
11.5
22.0
19.8
30.0
33.1
28.2
36.3
21.1
19
.12
3.5
78
.97
6.5
80
.92
3.6
15
.32
7.7
14
.17
.01
8.4
21
Regio
n 3
013.6
11.3
16.4
10.6
9.2
12.0
22.7
20.7
32.9
31.7
22.3
34.4
21.3
19
.42
3.1
78
.77
6.9
80
.62
2.9
17
.53
4.5
14
.67
.42
2.8
18
Regio
n 3
113.2
11.5
15.9
10.3
9.2
11.1
21.7
19.7
26.0
32.2
28.0
34.4
22.6
19
.12
4.4
77
.47
5.6
80
.92
2.3
-4.3
28
.51
3.0
-17
.51
9.0
28
Regio
n 3
213.7
10.9
16.1
10.6
9.6
11.8
21.4
19.4
23.1
32.2
29.5
36.2
22.0
19
.82
5.3
78
.07
4.7
80
.22
4.3
11
.93
1.7
15
.0-0
.52
2.5
45
Regio
n 3
313.4
11.1
15.3
10.4
9.3
11.6
21.8
19.8
23.7
32.8
29.5
35.2
21.6
19
.22
3.8
78
.47
6.2
80
.82
2.3
-5.4
29
.01
3.7
-14
.32
3.8
39
Regio
n 3
413.7
10.9
16.8
10.6
9.7
11.8
21.5
19.0
23.4
32.6
29.8
35.5
21.5
19
.22
3.8
78
.57
6.2
80
.82
5.0
20
.02
9.7
15
.811
.62
0.9
9R
egio
n 3
513.9
10.4
15.6
10.6
8.8
11.6
21.7
21.0
23.1
32.2
30.1
37.5
21.5
19
.42
2.7
78
.57
7.3
80
.62
7.3
23
.63
5.6
19
.31
4.0
26
.5
30
Regio
n 3
613.3
11.4
15.7
10.2
9.2
11.3
21.8
19.8
23.5
33.4
30.2
36.3
21.3
19
.42
2.9
78
.77
7.1
80
.62
3.6
17
.12
9.0
17
.91
0.6
27
.3
54
9 A
ve. w
hit
e14.3
10.5
21.6
32.2
21.4
78
.62
5.4
17
.4
M
in. w
hit
e9.5
8.4
17.9
22.3
18
.36
9.7
-5.4
-17
.5
M
ax. w
hit
e18.8
13.1
32.9
37.5
30
.38
1.7
38
.43
7.6

South African Maize Crop Quality Report 2016/2017 Season
60
TA
BL
E 1
9:
NU
TR
ITIO
NA
L V
AL
UE
S O
F W
HIT
ETA
BL
E 2
0:
NU
TR
ITIO
NA
L V
AL
UE
S O
F Y
EL
LO
W
MA
IZE
AC
CO
RD
ING
TO
GR
AD
E (
2016/2
017)
MA
IZE
AC
CO
RD
ING
TO
GR
AD
E (
2016/2
017)
Nu
mb
er
Fat
Pro
tein
Sta
rch
N
um
ber
Fat
Pro
tein
S
tarc
h
of
Reg
ion
% (
db
)%
(d
b)
% (
db
)o
f R
eg
ion
% (
db
)%
(d
b)
% (
db
)
sam
ple
save.
min
.m
ax.
ave.
min
.m
ax.
ave.
min
.m
ax.
sam
ple
save.
min
.m
ax.
ave.
min
.m
ax.
ave.
min
.m
ax.
GR
AD
E:
WM
1G
RA
DE
: Y
M1
2R
egio
n 1
03.9
3.9
3.9
9.0
9.0
9.1
74.1
974.1
874.2
37
Regio
n 1
03
.53
.34
.28
.58
.01
0.1
74
.57
3.4
75
.3
1R
egio
n 1
14.0
--
9.1
--
73.7
--
3R
egio
n 1
13
.53
.43
.58
.48
.38
.57
4.7
74
.57
5.0
14
Regio
n 1
24.2
3.9
4.9
8.5
7.6
9.2
74.5
73.5
75.4
3R
egio
n 1
24
.03
.94
.28
.47
.98
.97
5.3
74
.77
6.2
20
Regio
n 1
34.2
4.0
4.6
8.3
7.0
9.8
74.5
73.4
75.3
5R
egio
n 1
34
.03
.84
.49
.28
.89
.77
4.4
72
.87
5.5
29
Regio
n 1
44.1
3.8
4.4
8.5
7.3
9.0
74.5
73.5
75.0
8R
egio
n 1
44
.13
.94
.58
.88
.59
.97
4.1
72
.27
5.1
4R
egio
n 1
53.8
3.7
4.0
8.6
8.3
8.9
74.2
73.6
74.9
-R
egio
n 1
5-
--
--
--
--
15
Regio
n 1
74.2
3.8
4.6
8.5
7.5
8.8
74.6
73.8
75.8
3R
egio
n 1
74
.03
.74
.28
.68
.19
.07
5.0
73
.97
6.0
6R
egio
n 1
84.2
4.0
4.4
8.1
7.8
8.7
74.6
73.9
75.2
3R
egio
n 1
84
.14
.14
.28
.78
.29
.17
4.4
74
.27
4.8
11
Regio
n 1
94.1
3.9
4.4
8.4
7.8
8.8
74.4
73.7
74.9
5R
egio
n 1
94
.13
.94
.58
.88
.29
.97
3.8
72
.67
4.9
21
Regio
n 2
04.1
3.9
4.5
8.4
7.8
9.1
74.6
73.8
75.9
5R
egio
n 2
04
.03
.64
.28
.98
.59
.87
3.9
72
.57
5.2
56
Regio
n 2
14.2
3.8
4.8
8.7
8.0
9.5
74.1
72.7
75.4
10
Regio
n 2
14
.34
.04
.79
.28
.71
0.2
73
.37
2.0
74
.4
31
Regio
n 2
24.0
3.6
4.4
8.8
8.1
9.7
74.0
72.3
75.3
3R
egio
n 2
24
.44
.14
.89
.28
.11
0.1
73
.57
1.7
75
.7
16
Regio
n 2
34.0
3.7
4.2
8.5
7.9
9.0
74.3
73.2
75.7
3R
egio
n 2
34
.54
.14
.99
.79
.11
0.0
72
.77
1.5
74
.2
16
Regio
n 2
44.1
3.9
4.5
8.4
7.5
9.0
74.4
73.4
75.5
3R
egio
n 2
44
.24
.14
.29
.38
.69
.87
3.9
73
.57
4.8
4R
egio
n 2
54.2
3.9
4.3
8.8
7.8
9.7
74.0
73.6
74.9
26
Regio
n 2
54
.03
.84
.48
.68
.19
.57
3.9
72
.97
4.7
19
Regio
n 2
64.3
3.7
4.9
8.5
7.9
10.2
74.4
72.2
75.6
28
Regio
n 2
64
.33
.94
.88
.77
.11
0.2
73
.67
2.2
74
.6
21
Regio
n 2
84.3
3.8
4.6
8.8
7.5
9.6
74.0
73.1
75.6
33
Regio
n 2
84
.13
.74
.69
.18
.11
0.3
73
.47
1.5
74
.6
26
Regio
n 2
94.2
3.8
5.0
9.1
8.0
11.5
73.6
70.8
74.8
74
Regio
n 2
94
.23
.74
.99
.17
.71
0.2
73
.37
1.6
74
.4
17
Regio
n 3
04.2
3.9
4.4
8.9
7.9
9.8
73.8
72.1
75.2
31
Regio
n 3
04
.23
.54
.88
.87
.59
.87
3.6
71
.57
5.2
15
Regio
n 3
14.1
3.8
4.6
9.0
8.4
10.2
73.9
72.9
74.4
14
Regio
n 3
14
.03
.74
.48
.78
.29
.47
3.9
73
.37
4.6
19
Regio
n 3
24.1
3.9
4.7
8.7
8.0
9.7
73.9
72.2
74.7
26
Regio
n 3
24
.13
.74
.68
.97
.91
0.1
73
.77
2.2
74
.8
38
Regio
n 3
34.3
4.0
4.9
8.9
7.9
10.4
73.8
71.5
74.7
24
Regio
n 3
34
.13
.34
.69
.47
.81
0.4
73
.07
1.7
74
.7
38
Regio
n 3
44.2
3.8
5.3
8.7
7.8
9.9
74.1
72.6
75.6
38
Regio
n 3
44
.23
.54
.88
.87
.51
0.8
73
.67
1.3
74
.9
5R
egio
n 3
54.1
3.7
4.5
8.8
8.2
9.7
73.9
72.5
74.9
9R
egio
n 3
54
.34
.05
.18
.58
.09
.27
3.9
73
.27
4.4
25
Regio
n 3
64.2
3.9
4.8
8.9
7.8
10.2
73.8
72.3
75.0
23
Regio
n 3
64
.03
.64
.78
.77
.61
0.0
73
.87
2.2
74
.9
469
A
ve.
WM
14.2
8.7
74.1
41
7 A
ve
. Y
M1
4.1
8.9
73
.7
M
in.
WM
13.6
7.0
70.8
M
in. Y
M1
3.3
7.1
71
.3
Max.
WM
15.3
11.5
75.9
Ma
x .
YM
15
.11
0.8
76
.2

South African Maize Crop Quality Report 2016/2017 Season
61
TA
BL
E 1
9:
NU
TR
ITIO
NA
L V
AL
UE
S O
F W
HIT
E
TA
BL
E 2
0:
NU
TR
ITIO
NA
L V
AL
UE
S O
F Y
EL
LO
WM
AIZ
E A
CC
OR
DIN
G T
O G
RA
DE
(2016/2
017)
(co
nti
nu
e)
MA
IZE
AC
CO
RD
ING
TO
GR
AD
E (
2016/2
017)
(co
nti
nu
e)
Nu
mb
er
Fat
Pro
tein
Sta
rch
N
um
ber
Fat
Pro
tein
S
tarc
h
of
Reg
ion
% (
db
)%
(d
b)
% (
db
)o
f R
eg
ion
% (
db
)%
(d
b)
% (
db
)
sam
ple
save.
min
.m
ax.
ave.
min
.m
ax.
ave.
min
.m
ax.
sam
ple
save.
min
.m
ax.
ave.
min
.m
ax.
ave.
min
.m
ax.
GR
AD
E:
WM
2G
RA
DE
: Y
M2
-R
egio
n 1
1-
--
--
--
--
1R
egio
n 1
13
.3-
-8
.9-
-7
4.5
--
3R
egio
n 1
24.5
4.1
5.1
8.9
8.4
9.8
73.8
72.6
74.5
-R
egio
n 1
2-
--
--
--
--
8R
egio
n 1
34.0
3.4
4.4
8.8
8.1
10.0
74.0
72.7
74.8
1R
egio
n 1
34
.0-
-1
0.3
--
73
.1-
-
2R
egio
n 1
44.1
4.0
4.1
8.3
8.2
8.4
74.6
74.2
75.0
Regio
n 1
4
5R
egio
n 1
74.2
3.9
4.6
8.0
6.8
8.6
74.5
73.5
75.0
1R
egio
n 1
73
.8-
-8
.9-
-7
3.5
--
1R
egio
n 1
83.9
--
8.2
--
75.1
--
-R
egio
n 1
8-
--
--
--
--
9R
egio
n 1
94.2
4.0
4.6
8.2
7.2
9.0
74.4
73.4
75.3
1R
egio
n 1
93
.9-
-8
.2-
-7
4.6
--
1R
egio
n 2
04.2
--
8.6
--
74.5
--
3R
egio
n 2
04
.14
.04
.29
.08
.29
.87
3.7
73
.07
4.5
1R
egio
n 2
14.0
--
8.8
--
74.3
--
1R
egio
n 2
14
.1-
-9
.3-
-7
4.0
--
-R
egio
n 2
2-
--
--
--
--
-R
egio
n 2
2-
--
--
--
--
1R
egio
n 2
34.0
--
8.9
--
74.6
--
1R
egio
n 2
34
.2-
-9
.9-
-7
2.9
--
3R
egio
n 2
64.2
4.1
4.5
8.4
7.8
9.5
74.7
73.8
75.5
6R
egio
n 2
64
.13
.94
.38
.37
.39
.37
3.4
72
.37
4.7
4R
egio
n 2
94.3
4.2
4.4
8.8
8.6
9.0
73.7
73.2
74.0
1R
egio
n 2
94
.3-
-9
.4-
-7
3.2
--
3R
egio
n 3
04.1
4.1
4.2
8.6
7.5
9.7
74.3
73.5
75.5
2R
egio
n 3
04
.23
.64
.78
.38
.08
.57
3.7
73
.17
4.3
2R
egio
n 3
13.9
3.8
4.0
9.2
8.9
9.4
74.0
73.8
74.2
-R
egio
n 3
1-
--
--
--
--
8R
egio
n 3
24.0
3.9
4.2
8.6
8.2
9.1
73.8
72.1
75.2
-R
egio
n 3
2-
--
--
--
--
5R
egio
n 3
34.3
4.1
4.4
9.0
8.8
9.5
73.6
73.2
74.0
2R
egio
n 3
33
.73
.73
.89
.99
.31
0.5
72
.27
1.8
72
.6
1R
egio
n 3
43.9
--
8.0
--
74.3
--
2R
egio
n 3
44
.34
.14
.58
.68
.28
.97
4.5
74
.17
5.0
2R
egio
n 3
54.2
4.1
4.3
8.9
8.5
9.2
73.7
73.3
74.0
1R
egio
n 3
54
.1-
-1
0.8
--
72
.2-
-
3R
egio
n 3
64.2
3.8
4.5
9.0
8.7
9.4
74.0
72.8
74.9
5R
egio
n 3
63
.93
.74
.18
.37
.48
.77
4.2
73
.87
4.6
62
A
ve.
WM
24.2
8.6
74.1
28
A
ve
. Y
M2
4.0
8.8
73
.6
M
in.
WM
23.4
6.8
72.1
M
in. Y
M2
3.3
7.3
71
.8
Max.
WM
25.1
10.0
75.5
Ma
x .
YM
24
.71
0.8
75
.0

South African Maize Crop Quality Report 2016/2017 Season
62
TA
BL
E 1
9:
NU
TR
ITIO
NA
L V
AL
UE
S O
F W
HIT
E
TA
BL
E 2
0:
NU
TR
ITIO
NA
L V
AL
UE
S O
F Y
EL
LO
WM
AIZ
E A
CC
OR
DIN
G T
O G
RA
DE
(2016/2
017)
(co
nti
nu
e)
MA
IZE
AC
CO
RD
ING
TO
GR
AD
E (
2016/2
017)
(co
nti
nu
e)
Nu
mb
er
Fat
Pro
tein
Sta
rch
N
um
ber
Fat
Pro
tein
S
tarc
h
of
Reg
ion
% (
db
)%
(d
b)
% (
db
)o
f R
eg
ion
% (
db
)%
(d
b)
% (
db
)
sam
ple
save.
min
.m
ax.
ave.
min
.m
ax.
ave.
min
.m
ax.
sam
ple
save.
min
.m
ax.
ave.
min
.m
ax.
ave.
min
.m
ax.
GR
AD
E:
WM
3G
RA
DE
: Y
M3
1R
egio
n 1
35.1
--
9.5
--
71.5
--
-R
egio
n 1
3-
--
--
--
--
1R
egio
n 1
74.2
--
7.5
--
75.3
--
-R
egio
n 1
7-
--
--
--
--
1R
egio
n 1
94.2
--
9.0
--
73.6
--
-R
egio
n 1
9-
--
--
--
--
1R
egio
n 2
03.8
--
8.3
--
74.6
--
1R
egio
n 2
04
.1-
-8
.9-
-7
4.8
--
1R
egio
n 3
04.2
--
8.8
--
73.8
--
1R
egio
n 3
04
.0-
-9
.2-
-7
1.9
--
1R
egio
n 3
24.3
--
9.5
--
73.4
--
Regio
n 3
2-
--
--
--
--
1R
egio
n 3
54.0
--
8.5
--
72.7
--
-R
egio
n 3
5-
--
--
--
--
2R
egio
n 3
63.9
3.8
4.0
8.7
8.5
8.8
74.1
73.7
74.5
-R
egio
n 3
6-
--
--
--
--
9 A
ve.
WM
34.2
8.7
73.7
2 A
ve. Y
M3
4.0
9.1
73
.4
M
in.
WM
33.8
7.5
71.5
M
in. Y
M3
4.0
8.9
71
.9
Max.
WM
35.1
9.5
75.3
Max .Y
M3
4.1
9.2
74
.8
CL
AS
S:
CO
MC
LA
SS
: C
OM
1R
egio
n 1
34.2
--
9.3
--
74.3
--
-R
eg
ion 1
3-
--
--
--
--
3R
egio
n 1
94.3
4.2
4.3
8.6
8.4
8.8
73.7
73.6
73.9
-R
eg
ion
19
--
--
--
--
-
1R
egio
n 2
04.1
--
9.1
--
75.7
--
-R
eg
ion
20
--
--
--
--
-
-R
egio
n 2
6-
--
--
--
--
2R
eg
ion
26
4.1
4.1
4.1
8.2
7.6
8.9
74
.17
3.4
74
.9
-R
egio
n 3
0-
--
--
--
--
1R
eg
ion
30
4.1
--
8.4
--
74
.6-
-
1R
egio
n 3
14.8
--
9.6
--
72.5
--
-R
eg
ion 3
1-
--
--
--
--
2R
egio
n 3
34.9
4.6
5.2
10.6
10.3
11.0
71.0
69.8
72.3
1R
eg
ion
33
4.5
--
9.5
--
71
.3-
-
1R
egio
n 3
53.9
--
8.5
--
73.8
--
-R
eg
ion 3
5-
--
--
--
--
9 A
ve.
CO
M4.4
9.3
73.3
4 A
ve
. C
OM
4.2
8.6
73
.5
M
in.
CO
M3.9
8.4
69.8
M
in. C
OM
4.1
7.6
71
.3
Max.
CO
M5.2
11.0
75.7
Ma
x.
CO
M4
.59
.57
4.9
549
Ave.
Wh
ite
4.2
8.7
74.1
45
1M
in. Y
ell
ow
4.1
8.9
73
.7
Min
. W
hit
e3.4
6.8
69.8
Min
. Y
ell
ow
3.3
7.1
71
.3
Max.
Wh
ite
5.3
11.5
75.9
Ma
x. Y
ell
ow
5.1
10
.87
6.2
1000
Ave.
Maiz
e4.1
8.8
73.9
10
00
Av
e.
Maiz
e4
.18
.87
3.9
Min
. M
aiz
e3.3
6.8
69.8
Min
.M
aiz
e3
.36
.86
9.8
Max.
Maiz
e5.3
11.5
76.2
Ma
x. M
aiz
e5
.311
.57
6.2

South African Maize Crop Quality Report 2016/2017 Season
63
TABLE 21: NUTRITIONAL VALUES OF WHITE AND YELLOW
MAIZE (2016/2017)
Number Fat Protein Starch
of Region % (db) % (db) % (db)
samples ave. min. max. ave. min. max. ave. min. max.
WHITE
2 Region 10 3.9 3.9 3.9 9.0 9.0 9.1 74.2 74.2 74.2
1 Region 11 4.0 - - 9.1 - - 73.7 - -
17 Region 12 4.3 3.9 5.1 8.5 7.6 9.8 74.4 72.6 75.4
30 Region 13 4.2 3.4 5.1 8.5 7.0 10.0 74.2 71.5 75.3
31 Region 14 4.1 3.8 4.4 8.5 7.3 9.0 74.5 73.5 75.0
4 Region 15 3.8 3.7 4.0 8.6 8.3 8.9 74.2 73.6 74.9
21 Region 17 4.2 3.8 4.6 8.3 6.8 8.8 74.6 73.5 75.8
7 Region 18 4.1 3.9 4.4 8.1 7.8 8.7 74.6 73.9 75.2
24 Region 19 4.2 3.9 4.6 8.4 7.2 9.0 74.3 73.4 75.3
24 Region 20 4.1 3.8 4.5 8.4 7.8 9.1 74.6 73.8 75.9
57 Region 21 4.2 3.8 4.8 8.7 8.0 9.5 74.1 72.7 75.4
31 Region 22 4.0 3.6 4.4 8.8 8.1 9.7 74.0 72.3 75.3
17 Region 23 4.0 3.7 4.2 8.6 7.9 9.0 74.3 73.2 75.7
16 Region 24 4.1 3.9 4.5 8.4 7.5 9.0 74.4 73.4 75.5
4 Region 25 4.2 3.9 4.3 8.8 7.8 9.7 74.0 73.6 74.9
22 Region 26 4.2 3.7 4.9 8.5 7.8 10.2 74.4 72.2 75.6
21 Region 28 4.3 3.8 4.6 8.8 7.5 9.6 74.0 73.1 75.6
30 Region 29 4.2 3.8 5.0 9.1 8.0 11.5 73.6 70.8 74.8
21 Region 30 4.2 3.9 4.4 8.8 7.5 9.8 73.9 72.1 75.5
18 Region 31 4.2 3.8 4.8 9.0 8.4 10.2 73.8 72.5 74.4
28 Region 32 4.1 3.9 4.7 8.7 8.0 9.7 73.9 72.1 75.2
45 Region 33 4.3 4.0 5.2 9.0 7.9 11.0 73.6 69.8 74.7
39 Region 34 4.2 3.8 5.3 8.7 7.8 9.9 74.1 72.6 75.6
9 Region 35 4.1 3.7 4.5 8.8 8.2 9.7 73.7 72.5 74.9
30 Region 36 4.2 3.8 4.8 8.9 7.8 10.2 73.8 72.3 75.0
549 Ave. white 4.2 8.7 74.1
Min. white 3.4 6.8 69.8
Max. white 5.3 11.5 75.9
YELLOW
3 Region 12 4.0 3.9 4.2 8.4 7.9 8.9 75.3 74.7 76.2
6 Region 13 4.0 3.8 4.4 9.4 8.8 10.3 74.2 72.8 75.5
8 Region 14 4.1 3.9 4.5 8.8 8.5 9.9 74.1 72.2 75.1
Region 15 - - - - - - - - -
4 Region 17 4.0 3.7 4.2 8.7 8.1 9.0 74.6 73.5 76.0
3 Region 18 4.1 4.1 4.2 8.7 8.2 9.1 74.4 74.2 74.8
6 Region 19 4.1 3.9 4.5 8.7 8.2 9.9 73.9 72.6 74.9
9 Region 20 4.0 3.6 4.2 9.0 8.2 9.8 73.9 72.5 75.2
11 Region 21 4.3 4.0 4.7 9.2 8.7 10.2 73.4 72.0 74.4
3 Region 22 4.4 4.1 4.8 9.2 8.1 10.1 73.5 71.7 75.7
4 Region 23 4.4 4.1 4.9 9.7 9.1 10.0 72.7 71.5 74.2
3 Region 24 4.2 4.1 4.2 9.3 8.6 9.8 73.9 73.5 74.8
26 Region 25 4.0 3.8 4.4 8.6 8.1 9.5 73.9 72.9 74.7
36 Region 26 4.2 3.9 4.8 8.6 7.1 10.2 73.6 72.2 74.9
33 Region 28 4.1 3.7 4.6 9.1 8.1 10.3 73.4 71.5 74.6
35 Region 30 4.2 3.5 4.8 8.7 7.5 9.8 73.6 71.5 75.2

South African Maize Crop Quality Report 2016/2017 Season
64
TABLE 21: NUTRITIONAL VALUES OF WHITE AND YELLOW
MAIZE (2016/2017) (continue)
Number Fat Protein Starch
of Region % (db) % (db) % (db)
samples ave. min. max. ave. min. max. ave. min. max.
YELLOW
14 Region 31 4.0 3.7 4.4 8.7 8.2 9.4 73.9 73.3 74.6
26 Region 32 4.1 3.7 4.6 8.9 7.9 10.1 73.7 72.2 74.8
27 Region 33 4.1 3.3 4.6 9.4 7.8 10.5 72.9 71.3 74.7
40 Region 34 4.2 3.5 4.8 8.8 7.5 10.8 73.7 71.3 75.0
10 Region 35 4.3 4.0 5.1 8.8 8.0 10.8 73.7 72.2 74.4
28 Region 36 4.0 3.6 4.7 8.6 7.4 10.0 73.9 72.2 74.9
451 Ave. yellow 4.1 8.9 73.7
Min. yellow 3.3 7.1 71.3
Max. yellow 5.1 10.8 76.2
WHITE AND YELLOW
39 Region 10 3.6 3.3 4.2 8.5 8.0 10.1 74.5 73.4 75.3
5 Region 11 3.5 3.3 4.0 8.7 8.3 9.1 74.5 73.7 75.0
20 Region 12 4.2 3.9 5.1 8.5 7.6 9.8 74.5 72.6 76.2
36 Region 13 4.2 3.4 5.1 8.7 7.0 10.3 74.2 71.5 75.5
39 Region 14 4.1 3.8 4.5 8.6 7.3 9.9 74.4 72.2 75.1
4 Region 15 3.8 3.7 4.0 8.6 8.3 8.9 74.2 73.6 74.9
25 Region 17 4.2 3.7 4.6 8.4 6.8 9.0 74.6 73.5 76.0
10 Region 18 4.1 3.9 4.4 8.3 7.8 9.1 74.6 73.9 75.2
30 Region 19 4.2 3.9 4.6 8.5 7.2 9.9 74.2 72.6 75.3
33 Region 20 4.1 3.6 4.5 8.6 7.8 9.8 74.4 72.5 75.9
68 Region 21 4.2 3.8 4.8 8.8 8.0 10.2 74.0 72.0 75.4
34 Region 22 4.1 3.6 4.8 8.8 8.1 10.1 73.9 71.7 75.7
21 Region 23 4.1 3.7 4.9 8.8 7.9 10.0 74.0 71.5 75.7
19 Region 24 4.1 3.9 4.5 8.5 7.5 9.8 74.3 73.4 75.5
30 Region 25 4.0 3.8 4.4 8.6 7.8 9.7 73.9 72.9 74.9
58 Region 26 4.2 3.7 4.9 8.6 7.1 10.2 73.9 72.2 75.6
54 Region 28 4.2 3.7 4.6 9.0 7.5 10.3 73.6 71.5 75.6
105 Region 29 4.2 3.7 5.0 9.1 7.7 11.5 73.4 70.8 74.8
56 Region 30 4.2 3.5 4.8 8.8 7.5 9.8 73.7 71.5 75.5
32 Region 31 4.1 3.7 4.8 8.9 8.2 10.2 73.9 72.5 74.6
54 Region 32 4.1 3.7 4.7 8.8 7.9 10.1 73.8 72.1 75.2
72 Region 33 4.2 3.3 5.2 9.2 7.8 11.0 73.4 69.8 74.7
79 Region 34 4.2 3.5 5.3 8.7 7.5 10.8 73.9 71.3 75.6
19 Region 35 4.2 3.7 5.1 8.8 8.0 10.8 73.7 72.2 74.9
58 Region 36 4.1 3.6 4.8 8.8 7.4 10.2 73.8 72.2 75.0
1000 Ave. white & yellow 4.1 8.8 73.9
Min. white & yellow 3.3 6.8 69.8
Max. white & yellow 5.3 11.5 76.2

South African Maize Crop Quality Report 2016/2017 Season
65
Number Fat Protein Starch
Season of % (db) % (db) % (db)
samples ave. min. max. ave. min. max. ave. min. max.
White Maize
2007/08 483 4.0 3.2 4.7 8.6 6.6 10.9 71.9 69.9 74.0
2008/09 483 4.0 3.5 5.1 8.3 6.4 10.4 72.4 70.7 74.2
2009/10 458 4.2 3.5 5.8 8.4 6.6 10.0 72.6 70.6 74.6
2010/11 413 4.1 2.8 4.6 7.9 6.1 9.5 73.6 71.9 77.0
2011/12 577 4.1 3.3 4.7 8.6 6.3 11.2 72.6 70.6 74.3
2012/13 508 4.1 3.3 5.3 9.2 6.4 11.5 71.4 68.5 73.6
2013/14 451 4.0 3.4 5.0 8.6 6.7 10.1 72.9 70.9 75.1
2014/15 485 4.2 3.3 5.8 9.4 6.3 11.2 72.6 69.8 74.9
2015/16 415 4.1 3.5 5.2 9.7 7.5 12.2 72.6 69.8 76.3
2016/17 549 4.2 3.4 5.3 8.7 6.8 11.5 74.1 69.8 75.9
Weighted Average 4.1 8.7 72.7
Minimum 2.8 6.1 68.5
Maximum 5.8 12.2 77.0
Yellow Maize
2007/08 417 3.6 2.9 4.8 8.4 6.9 10.4 72.3 70.0 75.0
2008/09 327 3.6 2.9 4.7 8.2 6.2 10.6 73.2 71.1 74.8
2009/10 342 3.8 3.3 4.7 8.1 6.5 10.1 73.4 71.0 75.4
2010/11 280 3.6 2.8 4.4 7.8 6.3 9.8 74.2 72.2 76.0
2011/12 423 3.8 3.0 4.6 8.9 7.0 11.3 73.0 71.0 75.0
2012/13 492 3.9 2.9 4.7 9.2 7.1 12.8 71.9 69.4 73.9
2013/14 479 3.8 3.0 4.8 8.6 6.0 11.3 73.1 70.8 75.7
2014/15 515 4.0 3.1 5.1 9.5 7.1 11.9 72.9 70.8 75.2
2015/16 505 4.0 3.3 5.1 9.7 7.7 12.6 72.3 70.0 75.3
2016/17 451 4.1 3.3 5.1 8.9 7.1 10.8 73.7 71.3 76.2
Weighted Average 3.8 8.8 72.9
Minimum 2.8 6.0 69.4
Maximum 5.1 12.8 76.2
White and Yellow Maize
2007/08 900 3.8 2.9 4.8 8.5 6.6 10.9 72.1 69.9 75.0
2008/09 810 3.8 2.9 5.1 8.3 6.2 10.6 72.7 70.7 74.8
2009/10 800 4.0 3.3 5.8 8.3 6.5 10.1 72.9 70.6 75.4
2010/11 693 3.9 2.8 4.6 7.9 6.1 9.8 73.8 71.9 77.0
2011/12 1000 4.0 3.0 4.7 8.7 6.3 11.3 72.8 70.6 75.0
2012/13 1000 4.0 2.9 5.3 9.2 6.4 12.8 71.6 68.5 73.9
2013/14 930 3.9 3.0 5.0 8.6 6.0 11.3 73.0 70.8 75.7
2014/15 1000 4.1 3.1 5.8 9.4 6.3 11.9 72.8 69.8 75.2
2015/16 920 4.1 3.3 5.2 9.7 7.5 12.6 72.4 69.8 76.3
2016/17 1000 4.1 3.3 5.3 8.8 6.8 11.5 73.9 69.8 76.2
Weighted Average 4.0 8.8 72.8
Minimum 2.8 6.0 68.5
Maximum 5.8 12.8 77.0
TABLE 22: NUTRITIONAL VALUES OF SOUTH AFRICAN WHITE AND
YELLOW MAIZE 2007/2008 - 2016/2017

South African Maize Crop Quality Report 2016/2017 Season
66
Graph 41: Fat content of white and yellow maize over 10 seasons
Graph 42: Protein content of white and yellow maize over 10 seasons
Graph 43: Starch content of white and yellow maize over 10 seasons
2007/08 2008/09 2009/10 2010/11 2011/12 2012/13 2013/14 2014/15 2015/16 2016/17White Maize 4.0 4.0 4.2 4.1 4.1 4.1 4.0 4.2 4.1 4.2Yellow Maize 3.6 3.6 3.8 3.6 3.8 3.9 3.8 4.0 4.0 4.1
3.4
3.5
3.6
3.7
3.8
3.9
4.0
4.1
4.2
4.3%
2007/08 2008/09 2009/10 2010/11 2011/12 2012/13 2013/14 2014/15 2015/16 2016/17White Maize 8.6 8.3 8.4 7.9 8.6 9.2 8.6 9.4 9.7 8.7Yellow Maize 8.4 8.2 8.1 7.8 8.9 9.2 8.6 9.5 9.7 8.9
7.5
8.0
8.5
9.0
9.5
10.0
%
2007/08 2008/09 2009/10 2010/11 2011/12 2012/13 2013/13 2014/15 2015/16 2016/17White Maize 71.9 72.4 72.6 73.6 72.6 71.4 72.9 72.6 72.6 74.1Yellow Maize 72.3 73.2 73.4 74.2 73.0 71.9 73.1 72.9 72.3 73.7
70.5
71.0
71.5
72.0
72.5
73.0
73.5
74.0
74.5
%

South African Maize Crop Quality Report 2016/2017 Season
67
TA
BL
E 2
3:
PR
ES
EN
CE
OF
GE
NE
TIC
AL
LY
MO
DIF
IED
MA
IZE
(2016/2
017)
RE
GIO
NW
/YC
ry1A
b %
(LO
Q:
0.4
%)
Cry
2A
b %
(LO
Q:
0.5
%)
CP
4 E
PS
PS
%
(LO
Q:
0.2
5%
)R
EG
ION
W/Y
Cry
1A
b %
(LO
Q:
0.4
%)
Cry
2A
b %
(LO
Q:
0.5
%)
CP
4 E
PS
PS
%
(LO
Q:
0.2
5%
)R
EG
ION
W/Y
Cry
1A
b %
(LO
Q:
0.4
%)
Cry
2A
b %
(LO
Q:
0.5
%)
CP
4 E
PS
PS
%
(LO
Q:
0.2
5%
)
10
Y>
5.0
>5.0
>5.0
23
W>
5.0
>5.0
>5.0
30
W>
5.0
0.6
1>
5.0
10
W>
5.0
1.1
>5.0
23
Y>
5.0
>5.0
>5.0
31
Y>
5.0
>5.0
>5.0
10
Y<0
.4<0
.51.1
24
Y>
5.0
>5.0
>5.0
31
W>
5.0
>5.0
>5.0
11
W>
5.0
<0.5
>5.0
24
W>
5.0
>5.0
>5
.031
W>
5.0
>5.0
>5.0
12
Y>
5.0
>5.0
>5.0
25
Y>
5.0
<0.5
>5.0
32
Y>
5.0
>5.0
>5.0
12
W>
5.0
>5.0
>5.0
25
Y>
5.0
>5.0
>5.0
32
W>
5.0
>5.0
>5.0
13
Y>
5.0
2.7
>5.0
25
W>
5.0
>5.0
>5
.032
W2.0
<0.5
1.2
13
W>
5.0
>5.0
>5.0
26
Y>
5.0
>5.0
>5.0
32
Y0.7
8<0
.51.7
13
W>
5.0
>5.0
>5.0
26
W2.8
1.3
>5
.032
W>
5.0
>5.0
>5.0
13
W>
5.0
>5.0
>5.0
26
Y>
5.0
>5.0
>5.0
33
W>
5.0
>5.0
>5.0
14
W>
5.0
>5.0
>5.0
26
W>
5.0
>5.0
>5.0
33
Y0.9
3<0
.51.5
14
Y<0
.4<0
.5>
5.0
26
Y>
5.0
>5.0
>5.0
33
Y>
5.0
<0.5
>5.0
14
Y>
5.0
>5.0
>5.0
26
W>
5.0
<0.5
>5
.033
W>
5.0
<0.5
>5.0
14
W>
5.0
>5.0
>5.0
28
Y>
5.0
>5.0
>5.0
33
Y>
5.0
>5.0
>5.0
17
W>
5.0
3.5
>5.0
28
Y>
5.0
>5.0
>5.0
33
W>
5.0
>5.0
>5.0
17
Y>
5.0
>5.0
>5.0
28
Y>
5.0
>5.0
>5.0
33
W>
5.0
>5.0
>5.0
18
W>
5.0
>5.0
>5.0
28
W>
5.0
>5.0
>5
.034
W2.3
<0.5
1.7
19
W>
5.0
>5.0
>5.0
28
W>
5.0
>5.0
>5.0
34
Y>
5.0
>5.0
>5.0
19
Y>
5.0
>5.0
>5.0
29
Y>
5.0
>5.0
>5.0
34
Y>
5.0
>5.0
>5.0
19
W>
5.0
>5.0
>5.0
29
Y>
5.0
0.5
9>
5.0
34
W>
5.0
>5.0
>5.0
20
W>
5.0
>5.0
>5.0
29
Y>
5.0
>5.0
>5.0
34
W>
5.0
>5.0
>5.0
20
Y>
5.0
>5.0
>5.0
29
Y>
5.0
>5.0
>5.0
34
Y0.7
4<0
.51.9
20
W>
5.0
>5.0
>5.0
29
Y0.8
9<0
.50.9
534
Y>
5.0
>5.0
1.1
21
W>
5.0
>5.0
>5.0
29
Y>
5.0
>5.0
>5.0
34
W>
5.0
>5.0
>5.0
21
Y>
5.0
1.2
>5.0
29
W>
5.0
>5.0
>5.0
35
W>
5.0
>5.0
>5.0
21
W>
5.0
>5.0
>5.0
29
W>
5.0
1.1
>5
.035
Y>
5.0
>5.0
>5.0
21
W>
5.0
>5.0
>5.0
29
Y>
5.0
>5.0
>5.0
36
Y3.2
3.9
>5.0
21
Y>
5.0
>5.0
>5.0
29
W>
5.0
>5.0
>5.0
36
Y>
5.0
1.2
>5.0
21
W>
5.0
>5.0
>5.0
29
W>
5.0
>5.0
>5
.036
W>
5.0
<0.5
1.6
21
Y>
5.0
<0.5
>5.0
30
W>
5.0
0.6
6>
5.0
36
W>
5.0
>5.0
>5.0
22
W>
5.0
>5.0
>5.0
30
Y>
5.0
>5.0
>5.0
36
W>
5.0
>5.0
>5.0
22
Y>
5.0
>5.0
>5.0
30
Y1.4
2.3
3.8
36
Y>
5.0
>5.0
>5.0
22
Y>
5.0
>5.0
>5.0
30
W2.6
<0.5
>5
.0
22
W>
5.0
>5.0
>5.0
30
Y>
5.0
>5.0
>5.0
nS
easo
n%
Sam
ple
s p
osit
ive f
or
Cry
1A
b
nS
easo
n%
Sam
ple
s p
osit
ive f
or
Cry
2A
b
nS
easo
n%
Sam
ple
s p
osit
ive f
or
CP
4 E
PS
PS
100
2016/1
798
100
2016/1
784
100
2016/1
7100
100
2015/1
694
100
2015/1
678
100
2015/1
699
100
2014/1
594
100
2014/1
581
100
2014/1
598
100
2013/1
496
100
2013/1
490
100
2013/1
494
100
2012/1
397
100
2012/1
373
100
2012/1
395
LOQ
: Lim
it of
Qua
ntifi
catio
n

South African Maize Crop Quality Report 2016/2017 Season
68
MYCOTOXINS
The multi-mycotoxin assessments included in the annual maize crop quality survey for the past seven seasons provide the most comprehensive overview of the multi-mycotoxin risk in commercial maize produced in South Africa. Approximately 35% of the maize crop samples were selected every season for multi-mycotoxin analyses to proportionally represent all the production regions, as well as both white and yellow maize.
The mycotoxins with maximum allowable levels on maize regulated in SA are Aflatoxin B1 and Aflatoxin total, Fumonisin (FUM) B1 + B2 and Deoxynivalenol (DON). These mycotoxins as well as nine other mycotoxins of most concern globally are included in the LCMSMS analysis, as listed in the Methods Section on page 96.
In total 62% of the 2016/2017 season’s tested maize samples contained one or more mycotoxin, similar to the previous season when 63% of the samples tested positive for one or more mycotoxin. However, the trends in occurrence confirmed that mycotoxin risk varies significantly between production regions and years. The percentage of samples that tested positive for mycotoxins from the samples selected per season, differ in the different production regions of South Africa and a summary of percentage occurrence per region is provided in graph 44.
Northern Cape (Region 10 -11) North West (Region 12 - 20) Free State (Region 21 - 28) Mpumalanga (Region 29 -
33) Gauteng (Region 34) Limpopo (Region 35) KwaZulu Natal (Region 36)
2010/2011 75 62 47 30 44 0 262011/2012 75 47 39 27 29 33 272012/2013 71 71 53 33 36 60 652013/2014 100 88 70 90 88 100 752014/2015 80 83 89 75 70 75 882015/2016 94 82 48 48 58 81 752016/2017 100 74 44 68 50 43 70
0
10
20
30
40
50
60
70
80
90
100
% S
ampl
es w
ith
myc
otox
ins
Graph 44: Mycotoxin occurrence per province of selected samples over seven seasons
The absence of Aflatoxin B1, B2, G1, G2, Ochratoxin A, T2-toxin and HT-2 toxin in the commercial maize samples over the past six seasons were confirmed in the 2016/2017 season. The fact that Aflatoxin B1 a mycotoxin classified as cancer-causing hazard, does not occur in commercial maize produced in South Africa (except for three white maize samples in the 2014/2015 production season), is a huge food and feed safety advantage for the maize producers in South Africa.
Zearalenone (ZON) was detected in only 13% of the white maize samples and in 1% of the yellow maize samples, with a maximum of 399 ug/kg found in one white maize sample.
The most predominant mycotoxins observed in all the seasons in most regions on both white and yellow maize are FUM B1, B2, B3 and DON.
The number of samples that contained DON increased with 14% this season; from 23% in 2015/2016 to 37% in the 2016/2017 season. The highest increase in % samples containing DON was observed in the white maize samples; from 26% in the previous season to 54% of the samples this season.
With the amendment of South African Regulations in 2016 with maximum allowable levels for human consumption, it is important to focus on the % samples with FUM and DON concentrations just below and above the maximum allowable levels; 4 000 µg/kg FUM B1 + B2 and 2 000 µg/kg DON in unprocessed maize.

South African Maize Crop Quality Report 2016/2017 Season
69
46.4%
28.5%7.3%
8.9%
8.9%
% samples with no deoxynivalenol
% samples with DON 100 - <500 µg/kg
% samples DON 500 - 1 000 µg/kg
% samples DON > 1 000 - 2 000 µg/kg
% samples DON > 2 000 µg/kg
Max value 7 698 µg/kg
80.7%
13.5%
3.5%
2.3%
% samples with no deoxynivalenol
% samples with DON 100 - <500 µg/kg
% samples DON 500 - 1 000 µg/kg
% samples DON > 1 000 - 2 000 µg/kg
% samples DON > 2 000 µg/kg
Max value 1 552 µg/kg
Graph 46: 2016/2017 White Maize crop - DON occurance
Graphs 47: 2016/2017 Yellow Maize crop - DON occurance
The % samples with DON at different concentration levels in the 2016/2017 season, are summarised for all maize (white and yellow maize), white maize only and yellow maize only in graphs 45 to 47. Although DON was not detected in 63% of the maize samples, only 46.4% white maize samples contained no DON. It should also be noted that in 8.9% of white maize samples and 2.3% of yellow maize samples, DON concentrations above the regulated maximum allowable level of 2 000 µg/kg were measured, with 7 698 µg/kg the highest concentration observed on one white maize sample.
Graph 45: 2016/2017 SA Maize crop - DON occurance
63.1%
21.1%
5.4%
5.7%
4.6%
% samples with no deoxynivalenol
% samples with DON 100 - <500 µg/kg
% samples DON 500 - 1 000 µg/kg
% samples DON > 1 000 - 2 000 µg/kg
% samples DON > 2 000 µg/kg
Max value 7 698 µg/kg

South African Maize Crop Quality Report 2016/2017 Season
70
Graph 48: 2016/2017 SA Maize crop - Fumonisin occurance
Graph 49: 2016/2017 SA White maize crop - Fumonisin occurance
Graph 50: 2016/2017 SA Yellow maize crop - Fumonisin occurance
Less samples contained FUM this past season, with occurrences decreasing from 57% to 44% of the samples. Graphs 48 to 50 are summaries of the % samples with different FUM concentration levels in the 2016/2017 season for all maize, white maize and yellow maize. None of the white maize samples contained FUM above 4 000 µg/kg, however more than 4 000 µg/kg were measured in 1.2% of the yellow maize samples; one yellow maize sample had 6 059 µg/kg FUM.
55.7%
38.6%
4.0%
1.1%0.6%
% samples with no fumonisins
% samples with FUM 20 - <750 µg/kg
% samples FUM 750 - 2 000 µg/kg
% samples FUM > 2 000 - 4 000 µg/kg
% samples FUM > 4 000 µg/kg
Max value 6 059 µg/kg
55.3%
40.8%
2.8%
1.1%
% samples with no fumonisins
% samples with FUM 20 - <750 µg/kg
% samples FUM 750 - 2 000 µg/kg
% samples FUM > 2 000 - 4 000 µg/kg
% samples FUM > 4 000 µg/kg
Max value: 3 913 µg/kg
56.1%
36.3%
5.3%
1.2%
1.2%
% samples with no fumonisins
% samples with FUM 20 - <750 µg/kg
% samples FUM 750 - 2 000 µg/kg
% samples FUM > 2 000 - 4 000 µg/kg
% samples FUM > 4 000 µg/kg
Max Value: 6 059 µg/kg

South African Maize Crop Quality Report 2016/2017 Season
71
Northern Cape North West Free State Mpumalanga Gauteng Limpopo KwaZulu Natal2010/2011 378 209 317 249 0 1232011/2012 435 143 212 171 129 2322012/2013 0 633 216 150 177 0 2512013/2014 435 259 596 964 444 4882014/2015 358 415 1383 504 404 0 7222015/2016 110 315 505 290 169 0 1972016/2017 0 849 445 1595 1355 0 929
0
200
400
600
800
1000
1200
1400
1600
1800
2000
µg/kg
Max DON = 1868 µg/kg
Max DON = 7671 µg/kg
Max DON = 3157 µg/kg
DON = ND Max DON = 3836 µg/kg
DON = ND
2016-2017 Max DON = highest concentration found in an individual maize sample analysed in a specific province
Max DON = 7698 µg/kg
Northern Cape North West Free State Mpumalanga Gauteng Limpopo KwaZulu Natal2010/2011 288 187 252 153 159 02011/2012 0 163 278 131 0 0 02012/2013 290 206 230 370 154 0 1162013/2014 273 375 255 396 292 252 1802014/2015 435 210 242 346 199 0 1832015/2016 114 137 507 164 100 0 1632016/2017 575 537 146 398 227 0 130
0
200
400
600
800
µg/kg
DON = NDMax DON = 795 µg/kg
Max DON = 1488 µg/kg
Max DON = 148 µg/kg
Max DON = 1552 µg/kg
Max DON = 321 µg/kg
Max DON = 130 µg/kg
2016-2017 Max DON = highest concentration found in an individual maize sample analysed in a specific province
Graph 51: White maize DON mean concentration (µg/kg) per province over seven seasons
Graph 52: Yellow maize DON mean concentration (µg/kg) per province over seven seasons
The different patterns of the mean concentrations FUM, DON and ZON over the seven seasons in the different regions, confirmed again the well-known fact that the mycotoxin risk in maize produced, differ from season to season in the same region, and differ from region to region because the occurrence and concentration levels are related to certain climatic factors during the pre-harvest production period. These concentration patterns are summarised in graph 51 for white maize and graph 52 for yellow maize for DON mean concentrations per province over seven seasons, as well as graphs 53 and 54 for FUM and graphs 55 and 6 for ZON.
In five of the provinces, the mean DON values of the white maize were higher than the yellow maize mean values.
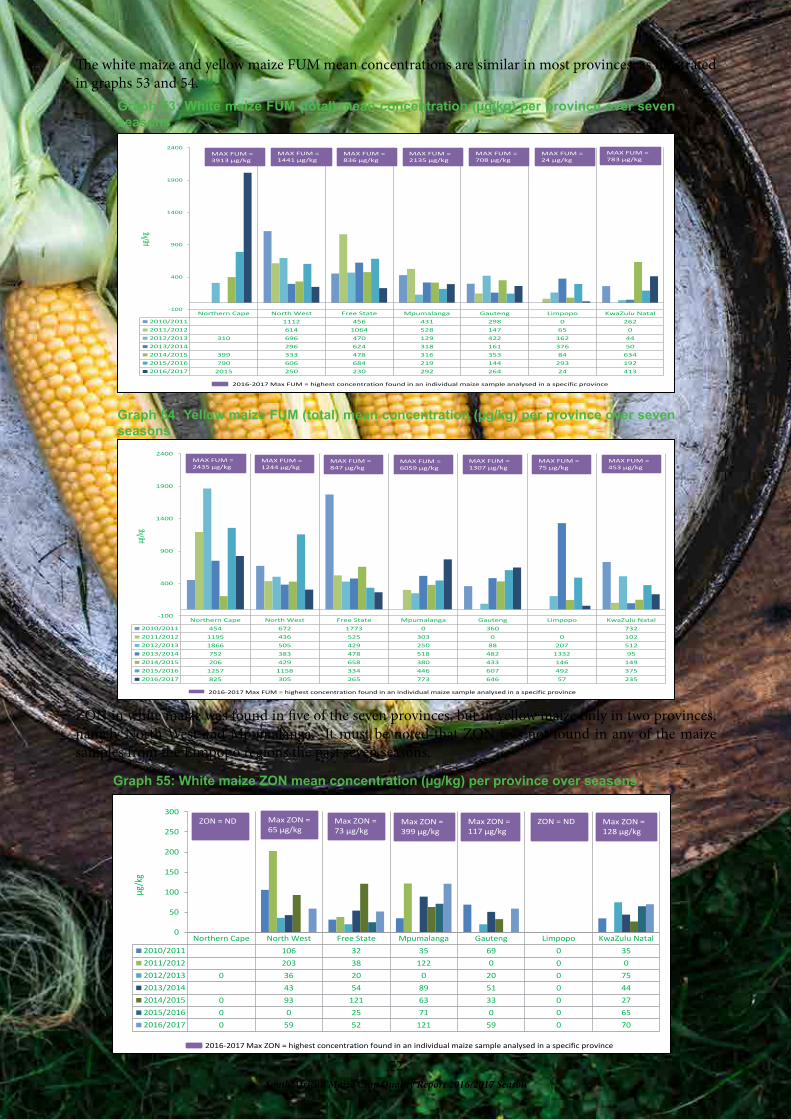
South African Maize Crop Quality Report 2016/2017 Season
72
Northern Cape North West Free State Mpumalanga Gauteng Limpopo KwaZulu Natal
2010/2011 1112 456 431 298 0 262
2011/2012 614 1064 528 147 65 0
2012/2013 310 696 470 129 422 162 44
2013/2014 296 624 318 161 376 50
2014/2015 399 333 478 316 353 84 634
2015/2016 790 606 684 219 144 293 192
2016/2017 2015 250 230 292 264 24 413
-100
400
900
1400
1900
2400µg
/kg
2016-2017 Max FUM = highest concentration found in an individual maize sample analysed in a specific province
MAX FUM =
3913 µg/kg
MAX FUM =
1441 µg/kg
MAX FUM =
836 µg/kg
MAX FUM =
708 µg/kg
MAX FUM =
2135 µg/kg
MAX FUM =
783 µg/kgMAX FUM =
24 µg/kg
Graph 53: White maize FUM (total) mean concentration (µg/kg) per province over seven
seasons
The white maize and yellow maize FUM mean concentrations are similar in most provinces, as illustrated in graphs 53 and 54.
Northern Cape North West Free State Mpumalanga Gauteng Limpopo KwaZulu Natal
2010/2011 454 672 1773 0 360 732
2011/2012 1195 436 525 303 0 0 102
2012/2013 1866 505 429 250 88 207 512
2013/2014 752 383 478 518 482 1332 95
2014/2015 206 429 658 380 433 146 149
2015/2016 1257 1158 334 446 607 492 375
2016/2017 825 305 265 773 646 57 235
-100
400
900
1400
1900
2400
µg/k
g
2016-2017 Max FUM = highest concentration found in an individual maize sample analysed in a specific province
MAX FUM =
453 µg/kg
MAX FUM =
75 µg/kg
MAX FUM =
1307 µg/kg
MAX FUM =
6059 µg/kg
MAX FUM =
847 µg/kg
MAX FUM =
1244 µg/kg
MAX FUM =
2435 µg/kg
Graph 54: Yellow maize FUM (total) mean concentration (µg/kg) per province over seven
seasons
ZON in white maize was found in five of the seven provinces, but in yellow maize only in two provinces, namely North West and Mpumalanga. It must be noted that ZON was not found in any of the maize samples from the Limpopo regions the past seven seasons.
Northern Cape North West Free State Mpumalanga Gauteng Limpopo KwaZulu Natal2010/2011 106 32 35 69 0 352011/2012 203 38 122 0 0 02012/2013 0 36 20 0 20 0 752013/2014 43 54 89 51 0 442014/2015 0 93 121 63 33 0 272015/2016 0 0 25 71 0 0 652016/2017 0 59 52 121 59 0 70
0
50
100
150
200
250
300
µg/k
g
Max ZON = 65 µg/kg
Max ZON = 73 µg/kg
Max ZON = 399 µg/kg
Max ZON = 117 µg/kg
Max ZON = 128 µg/kg
ZON = ND
2016-2017 Max ZON = highest concentration found in an individual maize sample analysed in a specific province
ZON = ND
Graph 55: White maize ZON mean concentration (µg/kg) per province over seasons

South African Maize Crop Quality Report 2016/2017 Season
73
Northern Cape North West Free State Mpumalanga Gauteng Limpopo KwaZulu Natal2010/2011 0 63 41 24 65 02011/2012 0 0 0 40 28 0 02012/2013 231 0 0 68 0 0 02013/2014 0 35 0 103 27 0 802014/2015 0 43 23 42 0 0 652015/2016 44 0 0 35 0 0 232016/2017 0 113 0 24 0 0 0
-20
30
80
130
180
230
280
µg/kg
ZON = NDMax ZON = 113 µg/kg
Max ZON = 24 µg/kg
ZON = NDZON = NDZON = NDZON = ND
2016-2017 Max ZON = highest concentration found in an individual maize sample analysed in a specific province
Graph 56: Yellow maize FUM (total) mean concentration (µg/kg) per province over seven
seasons
When comparing these trends with the mycotoxin overview of the USA Corn 2017 published by Olmix, the % maize samples containing DON with levels less than 500 µg/kg, was similar, but the maximum DON value in South African maize was higher in the 2016/2017 season than reported in USA corn. 95% of the South African maize samples contained FUM < 750 ug/kg, in comparison with 78% of the USA maize, while the maximum FUM concentrations reported in the two countries were similar. The South African maize contained far less ZON than that of the USA 2017 harvest. (Reference: www.olmix.com/myco-news).

South African Maize Crop Quality Report 2016/2017 Season
74
Substance,
ProductsFarm Feeds
MAXIMUM CONTENT IN
mg/kg (ppm) relative to a
farm feed with a moisture
content of 120 g/kg
MAXIMUM CONTENT IN
µg/kg (ppb) relative to a
farm feed with a moisture
content of 120 g/kg
Aflatoxin B1
Feed ingredients with the exception of: 0.05 50
groundnut, copra, palm-kernel cotton seed, maize and products
derived from the processing thereof 0.02 20
Complete farm feeds for cattle, sheep and goats with the exeption
of: 0.05 50
dairy cattle 0.005 5
calves and lambs 0.01 10
complete feeds for pigs and poultry (except young animals) 0.02 20
other complete farm feeds (including pets) 0.01 10
maize products intended for feedlot 0.3 300
supplement/cncentrates for cattle, sheep and goats (except for dairy
animals, calves and lambs)0.05 50
Deoxynivalenol
(DON)
Feeding stuffs on a full ration basis for:
Pigs 1 1 000
cattle 5 5 000
calves up tp 4 months 2 2 000
dairy cattle 3 3 000
poultry 4 4 000
pets 1 1 000
Fumonisin B1
Horses and pets 5 5 000
Pigs 10 10 000
Beef and poultry 50 50 000
Fish 10 10 000
Ochratoxin A
Feeding stuffs on full ration basis for:
Pigs 0.05 50
poultry 0.2 200
Zearalenone
Feeding stuffs on full ration basis for:
sows and pigs 5 5 000
piglets 3 3 000
calves and dairy cattle 0.5 500
National Mycotoxin Regulations
According to the Foodstuffs, Cosmetics and Disinfectants Act (Act 54 of 1972) and regulations published in Government Notice No. R. 1145, dated 8 October 2004, all foodstuffs, ready for human consumption, may not contain more than 10 µg/kg of aflatoxin, of which aflatoxin B1 may not exceed 5 µg/kg.
Amendments to Government Notice No. R. 1145, dated 8 October 2004, published in Government Notice No. 987 of 05 September 2016, specify that • Cereal grains (wheat, maize and barley) intended for further processing, may not contain more than
2000 µg/kg of Deoxinyvalenol.• Flour, meal, semolina and flakes derived from wheat, maize or barley, ready for human consumption,
may not contain more than 1000 µg/kg of Deoxinyvalenol.• Raw maize grain, intended for further processing, may not contain more than 4000 µg/kg of Fumonisins
(B1 + B
2), the whole commodity.
• Maize flour and maize meal, ready for human consumption, may not contain more than 2000 µg/kg of Fumonisins (B
1 + B
2), the whole commodity.
• Further processing means any other treatment or processing method that has been proven to reduce levels of fungus produced toxins in foodstuffs intended for human consumption.
According to the Fertilizers, Farm Feeds, Agricultural Remedies and Stock Remedies Act (Act 36 of 1947) as well as amendments published in Government Notices No. R. 70 of 12 February 2010 and R. 789 of 10 September 2010, the maximum allowable levels of mycotoxins in animal feeds, are as follows:

South African Maize Crop Quality Report 2016/2017 Season
75
International Mycotoxin Regulations
The Maximum, advisory and guidance levels for mycotoxins on maize, maize products and cereals from the European Union, USA and China are provided below for comparison purposes.
The European Union specifies the following maximum levels for mycotoxins on maize in foodstuffs:
Aflatoxin
• Maize and rice to be subjected to sorting or other physical treatment before human consumption or used as an ingredient in foodstuffs, 5.0 µg/kg (B1) and 10.0 µg/kg (Sum of B1, B2, G1 and G2).
Fumonisin
• Unprocessed maize with the exception of unprocessed maize intended to be processed by wet milling, 4 000 µg/kg.
• Maize intended for direct human consumption, maize-based foods for direct consumption, with certain exceptions, 1 000 µg/kg.
• Maize-based breakfast cereals and maize-based snacks, 800 µg/kg. • Processed maize-based foods and baby foods for infants and young children, 200 µg/kg. • Milling fractions and other milling products with particle size > 500 µm not used for direct human
consumption, 1 400 µg/kg. • Milling fractions and other milling products with particle size < 500 µm not used for direct human
consumption, 2 000 µg/kg.
Deoxynivalenol (DON)
• Unprocessed maize, with the exception of unprocessed maize intended to be processed by wet milling, 1 750 µg/kg.
• Cereals intended for direct human consumption, cereal flour, bran and germ as end product marketed for direct human consumption, 750 µg/kg.
• Processed cereal based baby and baby foods for infants and young children, 200 µg/kg.• Milling fractions of maize and other milling products with particle size > 500 µm not used for direct
human consumption, 750 µg/kg. • Milling fractions of maize and other milling products with particle size < 500 µm not used for direct
human consumption, 1 250 µg/kg.
Zearalenone
• Unprocessed maize with the exception of unprocessed maize intended to be processed by wet milling, 350 µg/kg.
• Cereals intended for direct human consumption, cereal flour, bran and germ as end product marketed for direct human consumption, 75 µg/kg.
• Maize intended for direct human consumption, maize-based snacks and maize-based breakfast cereals, 100 µg/kg.
• Processed maize-based foods for infants and young children, 20 µg/kg. • Milling fractions and other milling products with particle size > 500 µm not used for direct human
consumption, 200 µg/kg. • Milling fractions and other milling products with particle size < 500 µm not used for direct human
consumption, 300 µg/kg.
Ochratoxin A
• Unprocessed cereals, 5 µg/kg.• All products derived from unprocessed cereals, including processed cereal products and cereals
intended for direct human consumption with the exception of food for infants and young children, 3 µg/kg. (1)
The European Union recommends the following maximum levels for Aflatoxin B1 on products intended
for animal feeds with a moisture content of 12%:

South African Maize Crop Quality Report 2016/2017 Season
76
Complementary and complete feedingstuffs depending on the class and age of the animal, 5 – 20 µg/kg.
The European Union recommends the following guidance levels for mycotoxins on products intended for animal feeds with a moisture content of 12%:
Fumonisin B1 + B2
• Maize and maize products, 60 000 µg/kg.• Complementary and complete feedingstuffs depending on the class and age of animal,
5 000 – 50 000 µg/kg.
Deoxynivalenol (DON)
• Cereals and cereal products with the exception of maize by-products, 8 000 µg/kg. • Maize by-products, 12 000 µg/kg.• Complementary and complete feedingstuffs depending on the class and age of animal,
900 – 5 000 µg/kg.
Zearalenone
• Cereals and cereal products with the exception of maize by-products, 2 000 µg/kg. • Maize by-products, 3 000 µg/kg.• Complementary and complete feedingstuffs depending on the class of animal, 100 – 500 µg/kg.
Ochratoxin A
• Cereals and cereal products, 250 µg/kg.• Complementary and complete feedingstuffs depending on the class of animal, 50 – 5000 µg/kg.(2)
In the USA, the Food and Drug Administration (FDA) actions levels for Aflatoxin in animal feeds vary between 20 µg/kg and 300 µg/kg, depending on the intended use (species of animal). The action level for all commodities intended for human consumption is 20 µg/kg (excluding Aflatoxin M1 (milk) where the maximum level is 0.5 µg/kg).
Advisory maximum levels for DON in animal feed varies between 5 000 and 10 000 µg/kg in grains and grain by-products and 1 000 to 10 000 µg/kg in the complete diet, depending on the species of animal as well as the percentage portion of the diet represented by the grain. Distillers grains, brewers grains, gluten feeds and gluten meals should not exceed 30 000 µg/kg. (3)
Recommended maximum levels for Total Fumonisins (FB1 + FB2 + FB3) in maize and maize by-products used in animal feeds varies between 5 000 µg/kg and 100 000 µg/kg based on the class of animal and proportion of the diet (dry weight basis).
Recommended maximum levels for Total Fumonisins (FB1 + FB2 + FB3) in human foods are as follows: Degermed dry milled maize products (e.g. flaking grits, maize grits, maize meal, maize flour with fat content of < 2.25%, dry weight basis), 2 000 µg/kg. Whole or partially degermed dry milled maize products (e.g. flaking grits, maize grits, maize meal, maize flour with fat content of > 2.25%, dry weight basis), 4 000 µg/kg. Dry milled maize bran, 4 000 µg/kg. Cleaned maize intended for popcorn and masa production, 3 000 and 4 000 µg/kg respectively. (4)
In China, the maximum level for Aflatoxin in maize is 20 µg/kg, maize flour and maize products, is 20 µg/kg. The maximum levels for DON and Zearalenone in maize and maize flour is 1 000 µg/kg and 60 µg/kg respectively. In grains and milled grain products, the maximum level of Ochratoxin A allowed is 5 µg/kg. (5)
The following information was obtained from the Mycotoxins.info webpage supported by Biomin: (6)

South African Maize Crop Quality Report 2016/2017 Season
77
Country CommoditySum of
mycotoxins
Limit
(µg/
kg)
China
Corn, peanut meal, cottonseed meal, rapeseed meal
Aflatoxin
<50Soybean meal <30Complementary, complete and concentrated feeding stuffs for piglets <10Complementary, complete and concentrated feeding stuffs for fattening pigs
<20
Complementary, complete and concentrated feeding stuffs for young broilers, chicks
<10
Complementary, complete and concentrated feeding stuffs for broilers, layers
<20
Complementary, complete and concentrated feeding stuffs for young ducks, ducklings
<10
Complementary, complete and concentrated feeding stuffs for ducks, layers
<15
Complementary, complete and concentrated feeding stuffs for quails <20Supplementary feeding stuffs for dairy cattle <10Supplementary feeding stuffs for beef cattle <50Complementary and complete feeding stuffs, corn Ochratoxin A <100Complementary and complete feeding stuffs, corn Zearalenone <500Complementary and complete feeding stuffs for swine
T-2 Toxin<1 000
Complementary and complete feeding stuffs for poultry <1 000Complementary and complete feeding stuffs for swine
Deoxynivalenol
<1 000Complementary and complete feeding stuffs for calves <1 000Complementary and complete feeding stuffs for lactating animals <1 000Complementary and complete feeding stuffs for cattle <5 000Complementary and complete feeding stuffs for poultry <5 000
Republic of
Korea
Feeds for young calves, dairy, piglet, grower, layer/broiler breeders,
milk replacer, fiber source for ruminants and all other diets for young animals. Aflatoxin
B1, B2, G1, G2
10
All other compound feeds except premix products 20
All plant originated materials 50
All compound feedsOchratoxin A
200
All plant originated materials 250
All swine diets
Deoxynivalenol
900
All young ruminant diets 2 000
All other compound feeds except premix products 5 000
All plant originated 10 000
Swine diets for piglet, grower, gilt, gestation, lactation
Zearalenone
100
All other swine diets 250
Ruminant diets 500
All other feeds 1 000
All plant originated materials 3 000
Diets for swine, horse and rabbit, milk replacer, pet
Fumonisins
5 000
Aquaculture 10 000
Ruminant diets except young calves, fiber diets 50 000
All other compound feeds except premix products 30 000
All compound diets
T-2/HT-2
250
Oat, oat processed materials 2 000
All other plant originated materials except oat 500
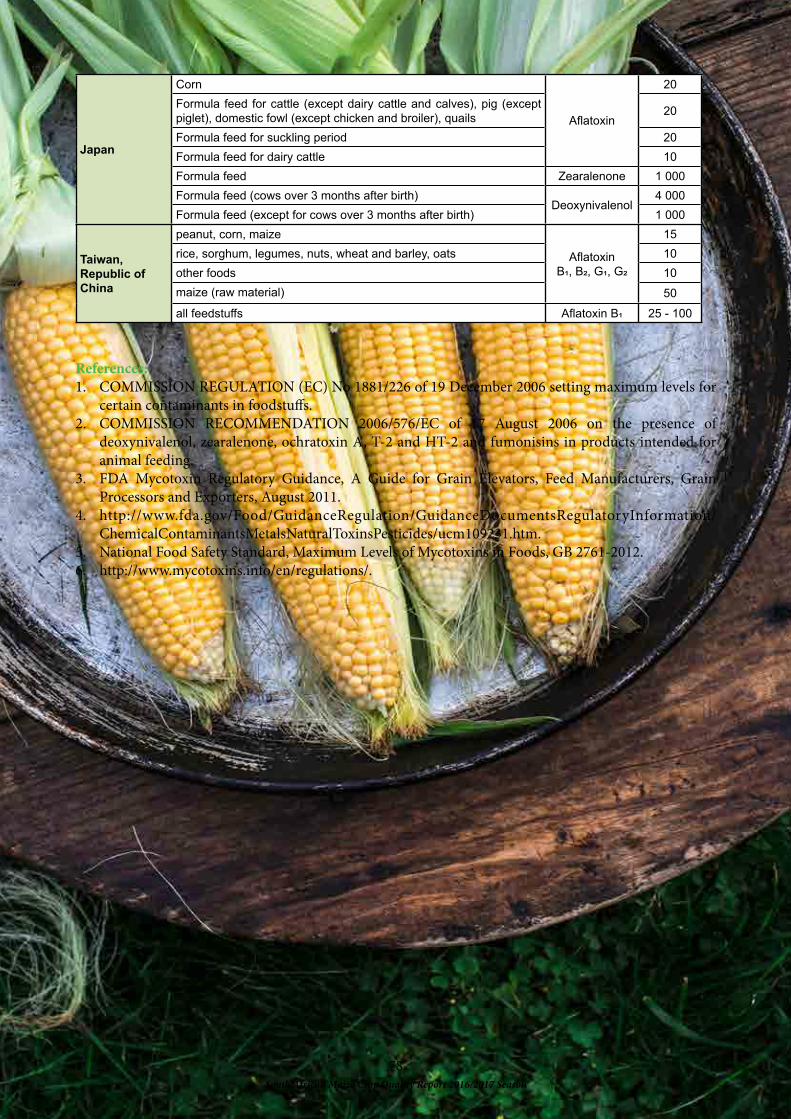
South African Maize Crop Quality Report 2016/2017 Season
78
Japan
Corn
Aflatoxin
20
Formula feed for cattle (except dairy cattle and calves), pig (except
piglet), domestic fowl (except chicken and broiler), quails20
Formula feed for suckling period 20
Formula feed for dairy cattle 10
Formula feed Zearalenone 1 000
Formula feed (cows over 3 months after birth)Deoxynivalenol
4 000
Formula feed (except for cows over 3 months after birth) 1 000
Taiwan,
Republic of
China
peanut, corn, maize
Aflatoxin B1, B2, G1, G2
15
rice, sorghum, legumes, nuts, wheat and barley, oats 10
other foods 10
maize (raw material) 50
all feedstuffs Aflatoxin B1 25 - 100
References:
1. COMMISSION REGULATION (EC) No 1881/226 of 19 December 2006 setting maximum levels for certain contaminants in foodstuffs.
2. COMMISSION RECOMMENDATION 2006/576/EC of 17 August 2006 on the presence of deoxynivalenol, zearalenone, ochratoxin A, T-2 and HT-2 and fumonisins in products intended for animal feeding.
3. FDA Mycotoxin Regulatory Guidance, A Guide for Grain Elevators, Feed Manufacturers, Grain Processors and Exporters, August 2011.
4. http://www.fda.gov/Food/GuidanceRegulation/GuidanceDocumentsRegulatoryInformation/ChemicalContaminantsMetalsNaturalToxinsPesticides/ucm109231.htm.
5. National Food Safety Standard, Maximum Levels of Mycotoxins in Foods, GB 2761-2012.6. http://www.mycotoxins.info/en/regulations/.

South African Maize Crop Quality Report 2016/2017 Season
79
TA
BL
E 2
4:
MY
CO
TO
XIN
RE
SU
LT
S -
MA
IZE
CR
OP
QU
AL
ITY
2016/2
017
Reg
ion
Gra
de
Afla
toxi
n µg
/kg
F
um
on
isin
µg
/kg
D
ON
µg
/kg
15-A
DO
N
µg
/kg
Och
rato
xin
A
µg
/kg
Zeara
len
on
e
µg
/kg
HT-2
µg
/kg
T-2
µg
/kg
G1
B1
G2
B2
To
tal
B1
B2
B3
To
tal
LO
Q:
5 µ
g/k
g
LO
Q:
5 µ
g/k
g
LO
Q:
5 µ
g/k
g
LO
Q:
5 µ
g/k
g
LO
Q:
20 µ
g/k
g
LO
Q:
20 µ
g/k
g
LO
Q:
20 µ
g/k
g
LO
Q:
100 µ
g/k
g
LO
Q:
100 µ
g/k
g
LO
Q:
5 µ
g/k
g
LO
Q:
20 µ
g/k
g
LO
D:
20 µ
g/k
g
LO
Q:
20 µ
g/k
g
10
YM
1N
DN
DN
DN
DN
D179
62
ND
241
ND
ND
ND
ND
ND
ND
10
YM
1N
DN
DN
DN
DN
D1 1
48
202
135
1 4
85
122
ND
ND
ND
ND
ND
10
YM
1N
DN
DN
DN
DN
D177
32
ND
209
596
11
6N
DN
DN
DN
D
10
YM
1N
DN
DN
DN
DN
D830
162
87
1 0
79
ND
ND
ND
ND
ND
ND
10
YM
1N
DN
DN
DN
DN
D389
76
35
500
728
104
ND
ND
ND
ND
10
YM
1N
DN
DN
DN
DN
D1 3
94
207
107
1 7
08
ND
ND
ND
ND
ND
ND
10
YM
1N
DN
DN
DN
DN
D351
76
24
451
ND
ND
ND
ND
ND
ND
10
YM
1N
DN
DN
DN
DN
D280
52
32
364
ND
ND
ND
ND
ND
ND
10
YM
1N
DN
DN
DN
DN
D931
278
50
1 2
59
462
ND
ND
ND
ND
ND
10
YM
1N
DN
DN
DN
DN
D297
42
ND
339
746
153
ND
ND
ND
ND
10
WM
1N
DN
DN
DN
DN
D11
6N
DN
D11
6N
DN
DN
DN
DN
DN
D
10
YM
1N
DN
DN
DN
DN
D1 9
50
332
153
2 4
35
ND
ND
ND
ND
ND
ND
10
YM
1N
DN
DN
DN
DN
D521
101
35
657
ND
ND
ND
ND
ND
ND
10
YM
1N
DN
DN
DN
DN
D48
ND
ND
48
795
11
2N
DN
DN
DN
D
11
YM
1N
DN
DN
DN
DN
D574
147
55
776
ND
ND
ND
ND
ND
ND
11
WM
1N
DN
DN
DN
DN
D2 9
00
600
413
3 9
13
ND
ND
ND
ND
ND
ND
12
WM
2N
DN
DN
DN
DN
D153
27
ND
180
ND
ND
ND
ND
ND
ND
12
YM
1N
DN
DN
DN
DN
DN
DN
DN
DN
DN
DN
DN
DN
DN
DN
D
12
WM
1N
DN
DN
DN
DN
DN
DN
DN
DN
DN
DN
DN
DN
DN
DN
D
12
YM
1N
DN
DN
DN
DN
DN
DN
DN
DN
DN
DN
DN
DN
DN
DN
D
12
WM
1N
DN
DN
DN
DN
D31
ND
ND
31
ND
ND
ND
ND
ND
ND
12
WM
1N
DN
DN
DN
DN
D93
21
ND
11
4N
DN
DN
DN
DN
DN
D
12
YM
1N
DN
DN
DN
DN
D550
126
38
714
387
103
ND
ND
ND
ND
13
WM
1N
DN
DN
DN
DN
D337
75
37
449
ND
ND
ND
ND
ND
ND
13
YM
1N
DN
DN
DN
DN
DN
DN
DN
DN
DN
DN
DN
DN
DN
DN
D
13
CO
MN
DN
DN
DN
DN
DN
DN
DN
DN
DN
DN
DN
DN
DN
DN
D
13
WM
2N
DN
DN
DN
DN
D29
ND
ND
29
672
ND
ND
ND
ND
ND
13
WM
1N
DN
DN
DN
DN
D96
24
ND
120
ND
ND
ND
ND
ND
ND
13
YM
1N
DN
DN
DN
DN
D157
37
ND
194
1 1
82
381
ND
ND
ND
ND
13
WM
1N
DN
DN
DN
DN
DN
DN
DN
DN
D375
ND
ND
ND
ND
ND

South African Maize Crop Quality Report 2016/2017 Season
80
TA
BL
E 2
4:
MY
CO
TO
XIN
RE
SU
LT
S -
MA
IZE
CR
OP
QU
AL
ITY
2016/2
017 (
co
nti
nu
e)
Reg
ion
Gra
de
Afla
toxi
n µg
/kg
F
um
on
isin
µg
/kg
D
ON
µg
/kg
15-A
DO
N
µg
/kg
Och
rato
xin
A
µg
/kg
Zeara
len
on
e
µg
/kg
HT-2
µg
/kg
T-2
µg
/kg
G1
B1
G2
B2
To
tal
B1
B2
B3
To
tal
LO
Q:
5 µ
g/k
g
LO
Q:
5 µ
g/k
g
LO
Q:
5 µ
g/k
g
LO
Q:
5 µ
g/k
g
LO
Q:
20 µ
g/k
g
LO
Q:
20 µ
g/k
g
LO
Q:
20 µ
g/k
g
LO
Q:
100 µ
g/k
g
LO
Q:
100 µ
g/k
g
LO
Q:
5 µ
g/k
g
LO
Q:
20 µ
g/k
g
LO
D:
20 µ
g/k
g
LO
Q:
20 µ
g/k
g
13
YM
2N
DN
DN
DN
DN
D938
205
101
1 2
44
ND
ND
ND
ND
ND
ND
13
WM
2N
DN
DN
DN
DN
D320
168
27
515
ND
ND
ND
ND
ND
ND
13
YM
1N
DN
DN
DN
DN
D400
95
23
518
ND
ND
ND
ND
ND
ND
13
WM
1N
DN
DN
DN
DN
D128
39
ND
167
638
136
ND
ND
ND
ND
13
WM
1N
DN
DN
DN
DN
D168
33
21
222
526
11
5N
DN
DN
DN
D
13
WM
1N
DN
DN
DN
DN
D208
46
ND
254
333
ND
ND
ND
ND
ND
14
WM
1N
DN
DN
DN
DN
D137
32
ND
169
612
137
ND
ND
ND
ND
14
YM
1N
DN
DN
DN
DN
DN
DN
DN
DN
DN
DN
DN
DN
DN
DN
D
14
YM
1N
DN
DN
DN
DN
DN
DN
DN
DN
DN
DN
DN
DN
DN
DN
D
14
WM
1N
DN
DN
DN
DN
D155
32
23
210
ND
ND
ND
ND
ND
ND
14
YM
1N
DN
DN
DN
DN
D166
42
ND
208
ND
ND
ND
ND
ND
ND
14
WM
1N
DN
DN
DN
DN
DN
DN
DN
DN
DN
DN
DN
DN
DN
DN
D
14
YM
1N
DN
DN
DN
DN
D309
121
26
456
ND
ND
ND
ND
ND
ND
14
WM
1N
DN
DN
DN
DN
DN
DN
DN
DN
DN
DN
DN
DN
DN
DN
D
14
WM
1N
DN
DN
DN
DN
D51
ND
ND
51
309
ND
ND
ND
ND
ND
14
YM
1N
DN
DN
DN
DN
DN
DN
DN
DN
DN
DN
DN
DN
DN
DN
D
14
WM
1N
DN
DN
DN
DN
D278
51
23
352
149
ND
ND
ND
ND
ND
14
WM
2N
DN
DN
DN
DN
D431
99
38
568
872
156
ND
ND
ND
ND
14
WM
1N
DN
DN
DN
DN
D87
20
ND
107
372
ND
ND
ND
ND
ND
14
WM
1N
DN
DN
DN
DN
DN
DN
DN
DN
D348
ND
ND
ND
ND
ND
15
WM
1N
DN
DN
DN
DN
DN
DN
DN
DN
DN
DN
DN
DN
DN
DN
D
17
WM
1N
DN
DN
DN
DN
DN
DN
DN
DN
DN
DN
DN
DN
DN
DN
D
17
WM
1N
DN
DN
DN
DN
D82
ND
ND
82
ND
ND
ND
ND
ND
ND
17
YM
1N
DN
DN
DN
DN
DN
DN
DN
DN
DN
DN
DN
DN
DN
DN
D
17
WM
1N
DN
DN
DN
DN
D65
ND
ND
65
ND
ND
ND
ND
ND
ND
17
YM
1N
DN
DN
DN
DN
D34
ND
ND
34
ND
ND
ND
ND
ND
ND
17
WM
2N
DN
DN
DN
DN
DN
DN
DN
DN
D7 6
98
964
ND
52
ND
ND
17
YM
1N
DN
DN
DN
DN
D38
ND
ND
38
583
147
ND
ND
ND
ND
17
WM
2N
DN
DN
DN
DN
D101
22
ND
123
ND
ND
ND
ND
ND
ND
17
YM
2N
DN
DN
DN
DN
DN
DN
DN
DN
D11
811
3N
DN
DN
DN
D

South African Maize Crop Quality Report 2016/2017 Season
81
TA
BL
E 2
4:
MY
CO
TO
XIN
RE
SU
LT
S -
MA
IZE
CR
OP
QU
AL
ITY
2016/2
017 (
co
nti
nu
e)
Reg
ion
Gra
de
Afla
toxi
n µg
/kg
F
um
on
isin
µg
/kg
D
ON
µg
/kg
15-A
DO
N
µg
/kg
Och
rato
xin
A
µg
/kg
Zeara
len
on
e
µg
/kg
HT-2
µg
/kg
T-2
µg
/kg
G1
B1
G2
B2
To
tal
B1
B2
B3
To
tal
LO
Q:
5 µ
g/k
g
LO
Q:
5 µ
g/k
g
LO
Q:
5 µ
g/k
g
LO
Q:
5 µ
g/k
g
LO
Q:
20 µ
g/k
g
LO
Q:
20 µ
g/k
g
LO
Q:
20 µ
g/k
g
LO
Q:
100 µ
g/k
g
LO
Q:
100 µ
g/k
g
LO
Q:
5 µ
g/k
g
LO
Q:
20 µ
g/k
g
LO
D:
20 µ
g/k
g
LO
Q:
20 µ
g/k
g
18
WM
1N
DN
DN
DN
DN
DN
DN
DN
DN
DN
DN
DN
DN
DN
DN
D
18
YM
1N
DN
DN
DN
DN
DN
DN
DN
DN
D156
ND
ND
ND
ND
ND
18
WM
1N
DN
DN
DN
DN
D32
ND
ND
32
145
ND
ND
ND
ND
ND
18
YM
1N
DN
DN
DN
DN
D318
74
21
413
103
ND
ND
ND
ND
ND
19
WM
2N
DN
DN
DN
DN
D332
92
32
456
ND
ND
ND
ND
ND
ND
19
WM
1N
DN
DN
DN
DN
DN
DN
DN
DN
DN
DN
DN
DN
DN
DN
D
19
YM
1N
DN
DN
DN
DN
D29
ND
ND
29
ND
ND
ND
ND
ND
ND
19
YM
1N
DN
DN
DN
DN
D37
ND
ND
37
ND
ND
ND
ND
ND
ND
19
CO
MN
DN
DN
DN
DN
D301
82
23
406
ND
ND
ND
ND
ND
ND
19
WM
1N
DN
DN
DN
DN
D248
101
24
373
ND
ND
ND
ND
ND
ND
19
YM
2N
DN
DN
DN
DN
D20
ND
ND
20
ND
ND
ND
ND
ND
ND
19
WM
1N
DN
DN
DN
DN
DN
DN
DN
DN
DN
DN
DN
DN
DN
DN
D
19
WM
2N
DN
DN
DN
DN
D1 0
38
278
125
1 4
41
1 3
72
215
ND
65
ND
ND
19
YM
1N
DN
DN
DN
DN
DN
DN
DN
DN
D701
134
ND
11
3N
DN
D
20
WM
1N
DN
DN
DN
DN
DN
DN
DN
DN
DN
DN
DN
DN
DN
DN
D
20
YM
2N
DN
DN
DN
DN
D56
ND
ND
56
ND
ND
ND
ND
ND
ND
20
WM
1N
DN
DN
DN
DN
D103
20
ND
123
ND
ND
ND
ND
ND
ND
20
YM
2N
DN
DN
DN
DN
D237
33
23
293
ND
ND
ND
ND
ND
ND
20
WM
1N
DN
DN
DN
DN
D78
21
ND
99
102
ND
ND
ND
ND
ND
20
YM
1N
DN
DN
DN
DN
D74
ND
ND
74
1 4
88
341
ND
ND
ND
ND
20
WM
1N
DN
DN
DN
DN
DN
DN
DN
DN
D137
ND
ND
ND
ND
ND
20
WM
1N
DN
DN
DN
DN
D21
ND
ND
21
213
ND
ND
ND
ND
ND
20
YM
3N
DN
DN
DN
DN
D419
107
21
547
228
ND
ND
ND
ND
ND
20
WM
1N
DN
DN
DN
DN
DN
DN
DN
DN
D401
ND
ND
ND
ND
ND
20
YM
1N
DN
DN
DN
DN
DN
DN
DN
DN
D426
ND
ND
ND
ND
ND
21
WM
1N
DN
DN
DN
DN
D51
ND
ND
51
671
ND
ND
ND
ND
ND
21
WM
1N
DN
DN
DN
DN
DN
DN
DN
DN
DN
DN
DN
DN
DN
DN
D
21
YM
1N
DN
DN
DN
DN
DN
DN
DN
DN
DN
DN
DN
DN
DN
DN
D
21
YM
1N
DN
DN
DN
DN
D423
141
42
606
ND
ND
ND
ND
ND
ND
21
WM
1N
DN
DN
DN
DN
D302
50
ND
352
522
111
ND
ND
ND
ND

South African Maize Crop Quality Report 2016/2017 Season
82
TA
BL
E 2
4:
MY
CO
TO
XIN
RE
SU
LT
S -
MA
IZE
CR
OP
QU
AL
ITY
2016/2
017 (
co
nti
nu
e)
Reg
ion
Gra
de
Afla
toxi
n µg
/kg
F
um
on
isin
µg
/kg
D
ON
µg
/kg
15-A
DO
N
µg
/kg
Och
rato
xin
A
µg
/kg
Zeara
len
on
e
µg
/kg
HT-2
µg
/kg
T-2
µg
/kg
G1
B1
G2
B2
To
tal
B1
B2
B3
To
tal
LO
Q:
5 µ
g/k
g
LO
Q:
5 µ
g/k
g
LO
Q:
5 µ
g/k
g
LO
Q:
5 µ
g/k
g
LO
Q:
20 µ
g/k
g
LO
Q:
20 µ
g/k
g
LO
Q:
20 µ
g/k
g
LO
Q:
100 µ
g/k
g
LO
Q:
100 µ
g/k
g
LO
Q:
5 µ
g/k
g
LO
Q:
20 µ
g/k
g
LO
D:
20 µ
g/k
g
LO
Q:
20 µ
g/k
g
21
YM
1N
DN
DN
DN
DN
DN
DN
DN
DN
DN
DN
DN
DN
DN
DN
D
21
WM
1N
DN
DN
DN
DN
DN
DN
DN
DN
DN
DN
DN
DN
DN
DN
D
21
WM
1N
DN
DN
DN
DN
DN
DN
DN
DN
DN
DN
DN
DN
DN
DN
D
21
YM
1N
DN
DN
DN
DN
D63
ND
ND
63
ND
ND
ND
ND
ND
ND
21
WM
1N
DN
DN
DN
DN
DN
DN
DN
DN
DN
DN
DN
DN
DN
DN
D
21
WM
1N
DN
DN
DN
DN
DN
DN
DN
DN
DN
DN
DN
DN
DN
DN
D
21
WM
1N
DN
DN
DN
DN
D46
ND
ND
46
147
ND
ND
ND
ND
ND
21
WM
1N
DN
DN
DN
DN
DN
DN
DN
DN
D199
ND
ND
ND
ND
ND
21
WM
1N
DN
DN
DN
DN
DN
DN
DN
DN
D814
130
ND
ND
ND
ND
21
YM
1N
DN
DN
DN
DN
DN
DN
DN
DN
D143
ND
ND
ND
ND
ND
21
WM
1N
DN
DN
DN
DN
DN
DN
DN
DN
D194
ND
ND
ND
ND
ND
21
WM
1N
DN
DN
DN
DN
D65
ND
ND
65
ND
ND
ND
ND
ND
ND
21
YM
1N
DN
DN
DN
DN
DN
DN
DN
DN
DN
DN
DN
DN
DN
DN
D
21
WM
1N
DN
DN
DN
DN
D357
83
40
480
172
ND
ND
ND
ND
ND
21
WM
1N
DN
DN
DN
DN
DN
DN
DN
DN
DN
DN
DN
DN
DN
DN
D
21
YM
1N
DN
DN
DN
DN
DN
DN
DN
DN
DN
DN
DN
DN
DN
DN
D
21
WM
2N
DN
DN
DN
DN
DN
DN
DN
DN
D1 8
68
365
ND
73
ND
ND
21
WM
1N
DN
DN
DN
DN
DN
DN
DN
DN
DN
DN
DN
DN
DN
DN
D
21
YM
2N
DN
DN
DN
DN
DN
DN
DN
DN
DN
DN
DN
DN
DN
DN
D
22
WM
1N
DN
DN
DN
DN
D148
58
ND
206
146
ND
ND
ND
ND
ND
22
WM
1N
DN
DN
DN
DN
DN
DN
DN
DN
D141
ND
ND
ND
ND
ND
22
WM
1N
DN
DN
DN
DN
D22
ND
ND
22
ND
ND
ND
ND
ND
ND
22
YM
1N
DN
DN
DN
DN
D270
65
23
358
ND
ND
ND
ND
ND
ND
22
WM
1N
DN
DN
DN
DN
DN
DN
DN
DN
DN
DN
DN
DN
DN
DN
D
22
WM
1N
DN
DN
DN
DN
DN
DN
DN
DN
DN
DN
DN
DN
DN
DN
D
22
WM
1N
DN
DN
DN
DN
D53
ND
ND
53
133
ND
ND
ND
ND
ND
22
YM
1N
DN
DN
DN
DN
D153
33
ND
186
ND
ND
ND
ND
ND
ND
22
WM
1N
DN
DN
DN
DN
D199
30
21
250
ND
ND
ND
ND
ND
ND
22
YM
1N
DN
DN
DN
DN
DN
DN
DN
DN
DN
DN
DN
DN
DN
DN
D
22
WM
1N
DN
DN
DN
DN
DN
DN
DN
DN
D172
ND
ND
ND
ND
ND
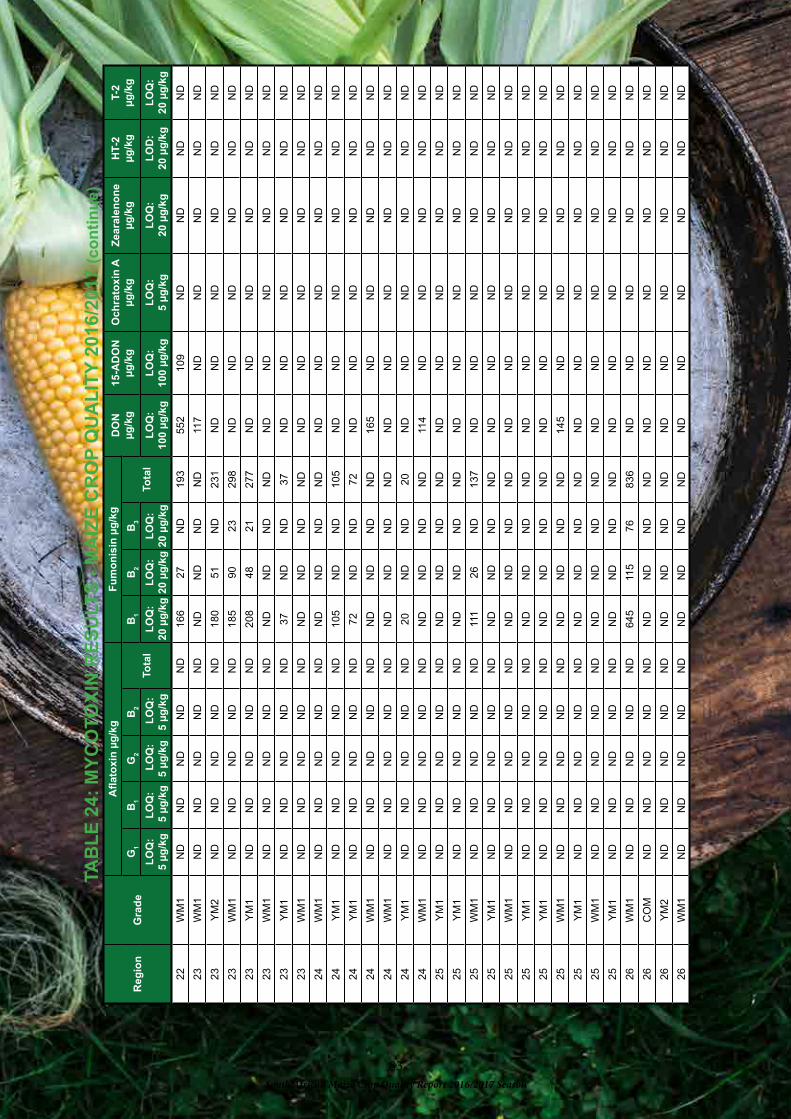
South African Maize Crop Quality Report 2016/2017 Season
83
TA
BL
E 2
4:
MY
CO
TO
XIN
RE
SU
LT
S -
MA
IZE
CR
OP
QU
AL
ITY
2016/2
017 (
co
nti
nu
e)
Reg
ion
Gra
de
Afla
toxi
n µg
/kg
F
um
on
isin
µg
/kg
D
ON
µg
/kg
15-A
DO
N
µg
/kg
Och
rato
xin
A
µg
/kg
Zeara
len
on
e
µg
/kg
HT-2
µg
/kg
T-2
µg
/kg
G1
B1
G2
B2
To
tal
B1
B2
B3
To
tal
LO
Q:
5 µ
g/k
g
LO
Q:
5 µ
g/k
g
LO
Q:
5 µ
g/k
g
LO
Q:
5 µ
g/k
g
LO
Q:
20 µ
g/k
g
LO
Q:
20 µ
g/k
g
LO
Q:
20 µ
g/k
g
LO
Q:
100 µ
g/k
g
LO
Q:
100 µ
g/k
g
LO
Q:
5 µ
g/k
g
LO
Q:
20 µ
g/k
g
LO
D:
20 µ
g/k
g
LO
Q:
20 µ
g/k
g
22
WM
1N
DN
DN
DN
DN
D166
27
ND
193
552
109
ND
ND
ND
ND
23
WM
1N
DN
DN
DN
DN
DN
DN
DN
DN
D11
7N
DN
DN
DN
DN
D
23
YM
2N
DN
DN
DN
DN
D180
51
ND
231
ND
ND
ND
ND
ND
ND
23
WM
1N
DN
DN
DN
DN
D185
90
23
298
ND
ND
ND
ND
ND
ND
23
YM
1N
DN
DN
DN
DN
D208
48
21
277
ND
ND
ND
ND
ND
ND
23
WM
1N
DN
DN
DN
DN
DN
DN
DN
DN
DN
DN
DN
DN
DN
DN
D
23
YM
1N
DN
DN
DN
DN
D37
ND
ND
37
ND
ND
ND
ND
ND
ND
23
WM
1N
DN
DN
DN
DN
DN
DN
DN
DN
DN
DN
DN
DN
DN
DN
D
24
WM
1N
DN
DN
DN
DN
DN
DN
DN
DN
DN
DN
DN
DN
DN
DN
D
24
YM
1N
DN
DN
DN
DN
D105
ND
ND
105
ND
ND
ND
ND
ND
ND
24
YM
1N
DN
DN
DN
DN
D72
ND
ND
72
ND
ND
ND
ND
ND
ND
24
WM
1N
DN
DN
DN
DN
DN
DN
DN
DN
D165
ND
ND
ND
ND
ND
24
WM
1N
DN
DN
DN
DN
DN
DN
DN
DN
DN
DN
DN
DN
DN
DN
D
24
YM
1N
DN
DN
DN
DN
D20
ND
ND
20
ND
ND
ND
ND
ND
ND
24
WM
1N
DN
DN
DN
DN
DN
DN
DN
DN
D11
4N
DN
DN
DN
DN
D
25
YM
1N
DN
DN
DN
DN
DN
DN
DN
DN
DN
DN
DN
DN
DN
DN
D
25
YM
1N
DN
DN
DN
DN
DN
DN
DN
DN
DN
DN
DN
DN
DN
DN
D
25
WM
1N
DN
DN
DN
DN
D111
26
ND
137
ND
ND
ND
ND
ND
ND
25
YM
1N
DN
DN
DN
DN
DN
DN
DN
DN
DN
DN
DN
DN
DN
DN
D
25
WM
1N
DN
DN
DN
DN
DN
DN
DN
DN
DN
DN
DN
DN
DN
DN
D
25
YM
1N
DN
DN
DN
DN
DN
DN
DN
DN
DN
DN
DN
DN
DN
DN
D
25
YM
1N
DN
DN
DN
DN
DN
DN
DN
DN
DN
DN
DN
DN
DN
DN
D
25
WM
1N
DN
DN
DN
DN
DN
DN
DN
DN
D145
ND
ND
ND
ND
ND
25
YM
1N
DN
DN
DN
DN
DN
DN
DN
DN
DN
DN
DN
DN
DN
DN
D
25
WM
1N
DN
DN
DN
DN
DN
DN
DN
DN
DN
DN
DN
DN
DN
DN
D
25
YM
1N
DN
DN
DN
DN
DN
DN
DN
DN
DN
DN
DN
DN
DN
DN
D
26
WM
1N
DN
DN
DN
DN
D645
11
576
836
ND
ND
ND
ND
ND
ND
26
CO
MN
DN
DN
DN
DN
DN
DN
DN
DN
DN
DN
DN
DN
DN
DN
D
26
YM
2N
DN
DN
DN
DN
DN
DN
DN
DN
DN
DN
DN
DN
DN
DN
D
26
WM
1N
DN
DN
DN
DN
DN
DN
DN
DN
DN
DN
DN
DN
DN
DN
D

South African Maize Crop Quality Report 2016/2017 Season
84
TA
BL
E 2
4:
MY
CO
TO
XIN
RE
SU
LT
S -
MA
IZE
CR
OP
QU
AL
ITY
2016/2
017 (
co
nti
nu
e)
Reg
ion
Gra
de
Afla
toxi
n µg
/kg
F
um
on
isin
µg
/kg
D
ON
µg
/kg
15-A
DO
N
µg
/kg
Och
rato
xin
A
µg
/kg
Zeara
len
on
e
µg
/kg
HT-2
µg
/kg
T-2
µg
/kg
G1
B1
G2
B2
To
tal
B1
B2
B3
To
tal
LO
Q:
5 µ
g/k
g
LO
Q:
5 µ
g/k
g
LO
Q:
5 µ
g/k
g
LO
Q:
5 µ
g/k
g
LO
Q:
20 µ
g/k
g
LO
Q:
20 µ
g/k
g
LO
Q:
20 µ
g/k
g
LO
Q:
100 µ
g/k
g
LO
Q:
100 µ
g/k
g
LO
Q:
5 µ
g/k
g
LO
Q:
20 µ
g/k
g
LO
D:
20 µ
g/k
g
LO
Q:
20 µ
g/k
g
26
WM
1N
DN
DN
DN
DN
DN
DN
DN
DN
DN
DN
DN
DN
DN
DN
D
26
YM
1N
DN
DN
DN
DN
DN
DN
DN
DN
DN
DN
DN
DN
DN
DN
D
26
YM
1N
DN
DN
DN
DN
DN
DN
DN
DN
DN
DN
DN
DN
DN
DN
D
26
YM
1N
DN
DN
DN
DN
DN
DN
DN
DN
DN
DN
DN
DN
DN
DN
D
26
WM
1N
DN
DN
DN
DN
DN
DN
DN
DN
DN
DN
DN
DN
DN
DN
D
26
YM
1N
DN
DN
DN
DN
D659
149
39
847
148
ND
ND
ND
ND
ND
26
WM
1N
DN
DN
DN
DN
DN
DN
DN
DN
DN
DN
DN
DN
DN
DN
D
26
YM
1N
DN
DN
DN
DN
DN
DN
DN
DN
DN
DN
DN
DN
DN
DN
D
26
YM
1N
DN
DN
DN
DN
DN
DN
DN
DN
DN
DN
DN
DN
DN
DN
D
26
WM
2N
DN
DN
DN
DN
DN
DN
DN
DN
D133
ND
ND
ND
ND
ND
26
YM
1N
DN
DN
DN
DN
D299
54
25
378
ND
ND
ND
ND
ND
ND
26
WM
1N
DN
DN
DN
DN
DN
DN
DN
DN
D1
300
227
ND
ND
ND
ND
26
YM
1N
DN
DN
DN
DN
DN
DN
DN
DN
DN
DN
DN
DN
DN
DN
D
26
YM
1N
DN
DN
DN
DN
DN
DN
DN
DN
DN
DN
DN
DN
DN
DN
D
26
WM
1N
DN
DN
DN
DN
DN
DN
DN
DN
DN
DN
DN
DN
DN
DN
D
26
YM
2N
DN
DN
DN
DN
DN
DN
DN
DN
DN
DN
DN
DN
DN
DN
D
28
YM
1N
DN
DN
DN
DN
DN
DN
DN
DN
DN
DN
DN
DN
DN
DN
D
28
YM
1N
DN
DN
DN
DN
DN
DN
DN
DN
DN
DN
DN
DN
DN
DN
D
28
YM
1N
DN
DN
DN
DN
DN
DN
DN
DN
DN
DN
DN
DN
DN
DN
D
28
YM
1N
DN
DN
DN
DN
DN
DN
DN
DN
DN
DN
DN
DN
DN
DN
D
28
YM
1N
DN
DN
DN
DN
DN
DN
DN
DN
DN
DN
DN
DN
DN
DN
D
28
YM
1N
DN
DN
DN
DN
DN
DN
DN
DN
DN
DN
DN
DN
DN
DN
D
28
WM
1N
DN
DN
DN
DN
DN
DN
DN
DN
D100
ND
ND
ND
ND
ND
28
WM
1N
DN
DN
DN
DN
DN
DN
DN
DN
D1
381
252
ND
ND
ND
ND
28
WM
1N
DN
DN
DN
DN
DN
DN
DN
DN
DN
DN
DN
DN
DN
DN
D
28
WM
1N
DN
DN
DN
DN
DN
DN
DN
DN
D243
ND
ND
ND
ND
ND
28
YM
1N
DN
DN
DN
DN
DN
DN
DN
DN
DN
DN
DN
DN
DN
DN
D
28
WM
1N
DN
DN
DN
DN
DN
DN
DN
DN
D125
ND
ND
ND
ND
ND
28
YM
1N
DN
DN
DN
DN
DN
DN
DN
DN
DN
DN
DN
DN
DN
DN
D
28
WM
1N
DN
DN
DN
DN
DN
DN
DN
DN
D1 4
76
316
ND
30
ND
ND

South African Maize Crop Quality Report 2016/2017 Season
85
TA
BL
E 2
4:
MY
CO
TO
XIN
RE
SU
LT
S -
MA
IZE
CR
OP
QU
AL
ITY
2016/2
017 (
co
nti
nu
e)
Reg
ion
Gra
de
Afla
toxi
n µg
/kg
F
um
on
isin
µg
/kg
D
ON
µg
/kg
15-A
DO
N
µg
/kg
Och
rato
xin
A
µg
/kg
Zeara
len
on
e
µg
/kg
HT-2
µg
/kg
T-2
µg
/kg
G1
B1
G2
B2
To
tal
B1
B2
B3
To
tal
LO
Q:
5 µ
g/k
g
LO
Q:
5 µ
g/k
g
LO
Q:
5 µ
g/k
g
LO
Q:
5 µ
g/k
g
LO
Q:
20 µ
g/k
g
LO
Q:
20 µ
g/k
g
LO
Q:
20 µ
g/k
g
LO
Q:
100 µ
g/k
g
LO
Q:
100 µ
g/k
g
LO
Q:
5 µ
g/k
g
LO
Q:
20 µ
g/k
g
LO
D:
20 µ
g/k
g
LO
Q:
20 µ
g/k
g
28
WM
1N
DN
DN
DN
DN
DN
DN
DN
DN
DN
DN
DN
DN
DN
DN
D
28
WM
1N
DN
DN
DN
DN
DN
DN
DN
DN
DN
DN
DN
DN
DN
DN
D
28
WM
1N
DN
DN
DN
DN
DN
DN
DN
DN
D105
ND
ND
ND
ND
ND
28
YM
1N
DN
DN
DN
DN
DN
DN
DN
DN
DN
DN
DN
DN
DN
DN
D
29
YM
1N
DN
DN
DN
DN
DN
DN
DN
DN
DN
DN
DN
DN
DN
DN
D
29
YM
1N
DN
DN
DN
DN
DN
DN
DN
DN
DN
DN
DN
DN
DN
DN
D
29
YM
1N
DN
DN
DN
DN
DN
DN
DN
DN
DN
DN
DN
DN
DN
DN
D
29
YM
1N
DN
DN
DN
DN
DN
DN
DN
DN
DN
DN
DN
DN
DN
DN
D
29
YM
1N
DN
DN
DN
DN
DN
DN
DN
DN
DN
DN
DN
DN
DN
DN
D
29
WM
1N
DN
DN
DN
DN
DN
DN
DN
DN
DN
DN
DN
DN
DN
DN
D
29
YM
1N
DN
DN
DN
DN
DN
DN
DN
DN
D490
179
ND
ND
ND
ND
29
YM
2N
DN
DN
DN
DN
D186
50
27
263
ND
ND
ND
ND
ND
ND
29
WM
1N
DN
DN
DN
DN
DN
DN
DN
DN
D901
153
ND
ND
ND
ND
29
YM
1N
DN
DN
DN
DN
DN
DN
DN
DN
DN
DN
DN
DN
DN
DN
D
29
YM
1N
DN
DN
DN
DN
DN
DN
DN
DN
DN
DN
DN
DN
DN
DN
D
29
WM
1N
DN
DN
DN
DN
DN
DN
DN
DN
D200
ND
ND
ND
ND
ND
29
YM
1N
DN
DN
DN
DN
D214
54
ND
268
ND
ND
ND
ND
ND
ND
29
YM
1N
DN
DN
DN
DN
D37
ND
ND
37
ND
ND
ND
ND
ND
ND
29
WM
2N
DN
DN
DN
DN
D53
ND
ND
53
293
ND
ND
ND
ND
ND
29
WM
1N
DN
DN
DN
DN
DN
DN
DN
DN
D104
ND
ND
ND
ND
ND
29
YM
1N
DN
DN
DN
DN
DN
DN
DN
DN
DN
DN
DN
DN
DN
DN
D
29
YM
1N
DN
DN
DN
DN
DN
DN
DN
DN
DN
DN
DN
DN
DN
DN
D
29
YM
1N
DN
DN
DN
DN
DN
DN
DN
DN
D122
ND
ND
ND
ND
ND
29
WM
1N
DN
DN
DN
DN
D223
88
24
335
ND
ND
ND
ND
ND
ND
29
WM
2N
DN
DN
DN
DN
D207
25
38
270
2 8
86
350
ND
399
ND
ND
29
YM
1N
DN
DN
DN
DN
DN
DN
DN
DN
DN
DN
DN
DN
DN
DN
D
29
YM
1N
DN
DN
DN
DN
DN
DN
DN
DN
DN
DN
DN
DN
DN
DN
D
29
YM
1N
DN
DN
DN
DN
DN
DN
DN
DN
DN
DN
DN
DN
DN
DN
D
29
WM
1N
DN
DN
DN
DN
DN
DN
DN
DN
DN
DN
DN
DN
DN
DN
D
29
WM
2N
DN
DN
DN
DN
D931
150
78
1 1
59
3 3
18
418
ND
106
ND
ND

South African Maize Crop Quality Report 2016/2017 Season
86
TA
BL
E 2
4:
MY
CO
TO
XIN
RE
SU
LT
S -
MA
IZE
CR
OP
QU
AL
ITY
2016/2
017 (
co
nti
nu
e)
Reg
ion
Gra
de
Afla
toxi
n µg
/kg
F
um
on
isin
µg
/kg
D
ON
µg
/kg
15-A
DO
N
µg
/kg
Och
rato
xin
A
µg
/kg
Zeara
len
on
e
µg
/kg
HT-2
µg
/kg
T-2
µg
/kg
G1
B1
G2
B2
To
tal
B1
B2
B3
To
tal
LO
Q:
5 µ
g/k
g
LO
Q:
5 µ
g/k
g
LO
Q:
5 µ
g/k
g
LO
Q:
5 µ
g/k
g
LO
Q:
20 µ
g/k
g
LO
Q:
20 µ
g/k
g
LO
Q:
20 µ
g/k
g
LO
Q:
100 µ
g/k
g
LO
Q:
100 µ
g/k
g
LO
Q:
5 µ
g/k
g
LO
Q:
20 µ
g/k
g
LO
D:
20 µ
g/k
g
LO
Q:
20 µ
g/k
g
29
WM
1N
DN
DN
DN
DN
D27
ND
ND
27
ND
ND
ND
ND
ND
ND
29
YM
1N
DN
DN
DN
DN
D80
21
ND
101
ND
ND
ND
ND
ND
ND
29
YM
1N
DN
DN
DN
DN
DN
DN
DN
DN
DN
DN
DN
DN
DN
DN
D
29
YM
1N
DN
DN
DN
DN
DN
DN
DN
DN
DN
DN
DN
DN
DN
DN
D
29
YM
1N
DN
DN
DN
DN
D22
ND
ND
22
ND
ND
ND
ND
ND
ND
29
YM
1N
DN
DN
DN
DN
DN
DN
DN
DN
DN
DN
DN
DN
DN
DN
D
29
WM
1N
DN
DN
DN
DN
D162
47
ND
209
124
ND
ND
ND
ND
ND
29
YM
1N
DN
DN
DN
DN
DN
DN
DN
DN
D154
ND
ND
ND
ND
ND
29
YM
1N
DN
DN
DN
DN
DN
DN
DN
DN
DN
DN
DN
DN
DN
DN
D
29
WM
2N
DN
DN
DN
DN
D69
ND
ND
69
ND
ND
ND
ND
ND
ND
30
YM
1N
DN
DN
DN
DN
D46
ND
ND
46
ND
ND
ND
ND
ND
ND
30
WM
1N
DN
DN
DN
DN
DN
DN
DN
DN
D1 0
59
169
ND
ND
ND
ND
30
WM
2N
DN
DN
DN
DN
D96
22
ND
11
82
366
212
ND
34
ND
ND
30
WM
1N
DN
DN
DN
DN
D131
24
ND
155
1717
240
ND
ND
ND
ND
30
YM
3N
DN
DN
DN
DN
DN
DN
DN
DN
DN
DN
DN
DN
DN
DN
D
30
CO
MN
DN
DN
DN
DN
DN
DN
DN
DN
DN
DN
DN
DN
DN
DN
D
30
WM
2N
DN
DN
DN
DN
DN
DN
DN
DN
DN
DN
DN
DN
DN
DN
D
30
YM
1N
DN
DN
DN
DN
DN
DN
DN
DN
DN
DN
DN
DN
DN
DN
D
30
YM
1N
DN
DN
DN
DN
DN
DN
DN
DN
D1 0
85
124
ND
24
ND
ND
30
WM
1N
DN
DN
DN
DN
DN
DN
DN
DN
D236
ND
ND
ND
ND
ND
30
YM
1N
DN
DN
DN
DN
DN
DN
DN
DN
D179
ND
ND
ND
ND
ND
30
WM
2N
DN
DN
DN
DN
DN
DN
DN
DN
D1 8
38
134
ND
26
ND
ND
30
YM
2N
DN
DN
DN
DN
DN
DN
DN
DN
DN
DN
DN
DN
DN
DN
D
30
YM
1N
DN
DN
DN
DN
DN
DN
DN
DN
DN
DN
DN
DN
DN
DN
D
30
YM
2N
DN
DN
DN
DN
D2 3
96
745
173
3 3
14
189
ND
ND
ND
ND
ND
30
WM
3N
DN
DN
DN
DN
DN
DN
DN
DN
D7
671
802
ND
292
ND
ND
30
YM
1N
DN
DN
DN
DN
DN
DN
DN
DN
D1 5
52
212
ND
ND
ND
ND
30
WM
1N
DN
DN
DN
DN
D71
ND
ND
71
281
ND
ND
ND
ND
ND
30
YM
1N
DN
DN
DN
DN
DN
DN
DN
DN
D278
ND
ND
ND
ND
ND
30
WM
1N
DN
DN
DN
DN
DN
DN
DN
DN
D435
ND
ND
ND
ND
ND

South African Maize Crop Quality Report 2016/2017 Season
87
TA
BL
E 2
4:
MY
CO
TO
XIN
RE
SU
LT
S -
MA
IZE
CR
OP
QU
AL
ITY
2016/2
017 (
co
nti
nu
e)
Reg
ion
Gra
de
Afla
toxi
n µg
/kg
F
um
on
isin
µg
/kg
D
ON
µg
/kg
15-A
DO
N
µg
/kg
Och
rato
xin
A
µg
/kg
Zeara
len
on
e
µg
/kg
HT-2
µg
/kg
T-2
µg
/kg
G1
B1
G2
B2
To
tal
B1
B2
B3
To
tal
LO
Q:
5 µ
g/k
g
LO
Q:
5 µ
g/k
g
LO
Q:
5 µ
g/k
g
LO
Q:
5 µ
g/k
g
LO
Q:
20 µ
g/k
g
LO
Q:
20 µ
g/k
g
LO
Q:
20 µ
g/k
g
LO
Q:
100 µ
g/k
g
LO
Q:
100 µ
g/k
g
LO
Q:
5 µ
g/k
g
LO
Q:
20 µ
g/k
g
LO
D:
20 µ
g/k
g
LO
Q:
20 µ
g/k
g
31
YM
1N
DN
DN
DN
DN
DN
DN
DN
DN
DN
DN
DN
DN
DN
DN
D
31
WM
2N
DN
DN
DN
DN
D209
45
ND
254
3 2
54
400
ND
21
ND
ND
31
YM
1N
DN
DN
DN
DN
DN
DN
DN
DN
D11
5N
DN
DN
DN
DN
D
31
CO
MN
DN
DN
DN
DN
DN
DN
DN
DN
DN
DN
DN
DN
DN
DN
D
31
WM
1N
DN
DN
DN
DN
DN
DN
DN
DN
D2 4
56
332
ND
49
ND
ND
31
YM
1N
DN
DN
DN
DN
D201
33
ND
234
ND
ND
ND
ND
ND
ND
31
YM
1N
DN
DN
DN
DN
D68
ND
ND
68
ND
ND
ND
ND
ND
ND
31
WM
2N
DN
DN
DN
DN
D1 5
27
431
177
2 1
35
3 2
73
332
ND
32
ND
ND
31
YM
1N
DN
DN
DN
DN
D141
27
ND
168
151
ND
ND
ND
ND
ND
31
WM
1N
DN
DN
DN
DN
DN
DN
DN
DN
D998
156
ND
ND
ND
ND
31
WM
1N
DN
DN
DN
DN
D46
ND
ND
46
ND
ND
ND
ND
ND
ND
32
WM
2N
DN
DN
DN
DN
DN
DN
DN
DN
D626
ND
ND
ND
ND
ND
32
WM
1N
DN
DN
DN
DN
D47
ND
ND
47
681
108
ND
ND
ND
ND
32
YM
1N
DN
DN
DN
DN
D2 9
43
753
329
4 0
25
272
ND
ND
ND
ND
ND
32
WM
3N
DN
DN
DN
DN
D205
42
ND
247
138
ND
ND
ND
ND
ND
32
YM
1N
DN
DN
DN
DN
D25
ND
ND
25
188
ND
ND
ND
ND
ND
32
YM
1N
DN
DN
DN
DN
D93
ND
ND
93
ND
ND
ND
ND
ND
ND
32
WM
1N
DN
DN
DN
DN
DN
DN
DN
DN
D195
106
ND
ND
ND
ND
32
YM
1N
DN
DN
DN
DN
D287
55
37
379
ND
ND
ND
ND
ND
ND
32
WM
2N
DN
DN
DN
DN
D171
42
ND
213
1 7
77
171
ND
ND
ND
ND
32
YM
1N
DN
DN
DN
DN
DN
DN
DN
DN
DN
DN
DN
DN
DN
DN
D
32
WM
2N
DN
DN
DN
DN
DN
DN
DN
DN
D2
11
ND
ND
ND
ND
ND
32
YM
1N
DN
DN
DN
DN
D126
ND
ND
126
ND
ND
ND
ND
ND
ND
32
WM
2N
DN
DN
DN
DN
D42
ND
ND
42
5 2
65
655
ND
142
ND
ND
32
YM
1N
DN
DN
DN
DN
D171
56
ND
227
ND
ND
ND
ND
ND
ND
32
WM
1N
DN
DN
DN
DN
DN
DN
DN
DN
D1 1
50
11
4N
DN
DN
DN
D
32
YM
1N
DN
DN
DN
DN
D100
ND
ND
100
ND
ND
ND
ND
ND
ND
32
WM
1N
DN
DN
DN
DN
D448
132
31
611
ND
ND
ND
ND
ND
ND
32
WM
2N
DN
DN
DN
DN
DN
DN
DN
DN
D2 3
18
266
ND
46
ND
ND
32
YM
1N
DN
DN
DN
DN
DN
DN
DN
DN
DN
DN
DN
DN
DN
DN
D

South African Maize Crop Quality Report 2016/2017 Season
88
TA
BL
E 2
4:
MY
CO
TO
XIN
RE
SU
LT
S -
MA
IZE
CR
OP
QU
AL
ITY
2016/2
017 (
co
nti
nu
e)
Reg
ion
Gra
de
Afla
toxi
n µg
/kg
F
um
on
isin
µg
/kg
D
ON
µg
/kg
15-A
DO
N
µg
/kg
Och
rato
xin
A
µg
/kg
Zeara
len
on
e
µg
/kg
HT-2
µg
/kg
T-2
µg
/kg
G1
B1
G2
B2
To
tal
B1
B2
B3
To
tal
LO
Q:
5 µ
g/k
g
LO
Q:
5 µ
g/k
g
LO
Q:
5 µ
g/k
g
LO
Q:
5 µ
g/k
g
LO
Q:
20 µ
g/k
g
LO
Q:
20 µ
g/k
g
LO
Q:
20 µ
g/k
g
LO
Q:
100 µ
g/k
g
LO
Q:
100 µ
g/k
g
LO
Q:
5 µ
g/k
g
LO
Q:
20 µ
g/k
g
LO
D:
20 µ
g/k
g
LO
Q:
20 µ
g/k
g
33
WM
1N
DN
DN
DN
DN
D44
ND
ND
44
ND
ND
ND
ND
ND
ND
33
WM
2N
DN
DN
DN
DN
D203
51
ND
254
ND
ND
ND
ND
ND
ND
33
YM
1N
DN
DN
DN
DN
D585
108
45
738
ND
ND
ND
ND
ND
ND
33
WM
2N
DN
DN
DN
DN
DN
DN
DN
DN
D2 9
08
494
ND
11
2N
DN
D
33
WM
1N
DN
DN
DN
DN
D102
26
ND
128
4 7
58
657
ND
181
ND
ND
33
YM
1N
DN
DN
DN
DN
DN
DN
DN
DN
DN
DN
DN
DN
DN
DN
D
33
YM
1N
DN
DN
DN
DN
D121
38
ND
159
ND
ND
ND
ND
ND
ND
33
CO
MN
DN
DN
DN
DN
D33
ND
ND
33
1 7
42
210
ND
23
ND
ND
33
WM
1N
DN
DN
DN
DN
DN
DN
DN
DN
D233
ND
ND
ND
ND
ND
33
YM
1N
DN
DN
DN
DN
D63
22
ND
85
ND
ND
ND
ND
ND
ND
33
YM
2N
DN
DN
DN
DN
DN
DN
DN
DN
DN
DN
DN
DN
DN
DN
D
33
WM
1N
DN
DN
DN
DN
D23
ND
ND
23
ND
ND
ND
ND
ND
ND
33
WM
1N
DN
DN
DN
DN
DN
DN
DN
DN
D220
ND
ND
ND
ND
ND
33
YM
1N
DN
DN
DN
DN
D109
27
38
174
ND
ND
ND
ND
ND
ND
33
YM
1N
DN
DN
DN
DN
D512
161
53
726
ND
ND
ND
ND
ND
ND
33
WM
2N
DN
DN
DN
DN
D45
ND
ND
45
ND
ND
ND
ND
ND
ND
33
WM
1N
DN
DN
DN
DN
D43
ND
ND
43
ND
ND
ND
ND
ND
ND
33
YM
2N
DN
DN
DN
DN
D4 4
63
1 0
88
508
6 0
59
ND
ND
ND
ND
ND
ND
33
CO
MN
DN
DN
DN
DN
D875
172
78
1 1
25
ND
ND
ND
ND
ND
ND
33
WM
1N
DN
DN
DN
DN
D681
11
490
885
107
ND
ND
ND
ND
ND
33
WM
1N
DN
DN
DN
DN
D42
ND
ND
42
ND
ND
ND
ND
ND
ND
33
YM
1N
DN
DN
DN
DN
DN
DN
DN
DN
DN
DN
DN
DN
DN
DN
D
33
WM
1N
DN
DN
DN
DN
DN
DN
DN
DN
D1
228
210
ND
ND
ND
ND
33
WM
1N
DN
DN
DN
DN
DN
DN
DN
DN
D1
792
171
ND
125
ND
ND
33
WM
2N
DN
DN
DN
DN
D467
102
36
605
266
ND
ND
ND
ND
ND
34
WM
1N
DN
DN
DN
DN
D41
ND
ND
41
ND
ND
ND
ND
ND
ND
34
WM
1N
DN
DN
DN
DN
DN
DN
DN
DN
D1 7
44
328
ND
47
ND
ND
34
WM
2N
DN
DN
DN
DN
DN
DN
DN
DN
D2 9
10
364
ND
51
ND
ND
34
YM
1N
DN
DN
DN
DN
DN
DN
DN
DN
DN
DN
DN
DN
DN
DN
D
34
WM
1N
DN
DN
DN
DN
DN
DN
DN
DN
DN
DN
DN
DN
DN
DN
D

South African Maize Crop Quality Report 2016/2017 Season
89
TA
BL
E 2
4:
MY
CO
TO
XIN
RE
SU
LT
S -
MA
IZE
CR
OP
QU
AL
ITY
2016/2
017 (
co
nti
nu
e)
Reg
ion
Gra
de
Afla
toxi
n µg
/kg
F
um
on
isin
µg
/kg
D
ON
µg
/kg
15-A
DO
N
µg
/kg
Och
rato
xin
A
µg
/kg
Zeara
len
on
e
µg
/kg
HT-2
µg
/kg
T-2
µg
/kg
G1
B1
G2
B2
To
tal
B1
B2
B3
To
tal
LO
Q:
5 µ
g/k
g
LO
Q:
5 µ
g/k
g
LO
Q:
5 µ
g/k
g
LO
Q:
5 µ
g/k
g
LO
Q:
20 µ
g/k
g
LO
Q:
20 µ
g/k
g
LO
Q:
20 µ
g/k
g
LO
Q:
100 µ
g/k
g
LO
Q:
100 µ
g/k
g
LO
Q:
5 µ
g/k
g
LO
Q:
20 µ
g/k
g
LO
D:
20 µ
g/k
g
LO
Q:
20 µ
g/k
g
34
WM
1N
DN
DN
DN
DN
DN
DN
DN
DN
D120
ND
ND
ND
ND
ND
34
YM
1N
DN
DN
DN
DN
DN
DN
DN
DN
DN
DN
DN
DN
DN
DN
D
34
YM
1N
DN
DN
DN
DN
D508
122
33
663
321
ND
ND
ND
ND
ND
34
WM
1N
DN
DN
DN
DN
DN
DN
DN
DN
DN
DN
DN
DN
DN
DN
D
34
YM
1N
DN
DN
DN
DN
DN
DN
DN
DN
DN
DN
DN
DN
DN
DN
D
34
YM
1N
DN
DN
DN
DN
D20
ND
ND
20
133
ND
ND
ND
ND
ND
34
WM
1N
DN
DN
DN
DN
D533
140
35
708
187
ND
ND
ND
ND
ND
34
WM
1N
DN
DN
DN
DN
D43
ND
ND
43
245
ND
ND
ND
ND
ND
34
YM
2N
DN
DN
DN
DN
DN
DN
DN
DN
DN
DN
DN
DN
DN
DN
D
34
YM
1N
DN
DN
DN
DN
DN
DN
DN
DN
DN
DN
DN
DN
DN
DN
D
34
WM
1N
DN
DN
DN
DN
DN
DN
DN
DN
D2
283
355
ND
ND
ND
ND
34
WM
1N
DN
DN
DN
DN
DN
DN
DN
DN
D256
ND
ND
ND
ND
ND
34
YM
1N
DN
DN
DN
DN
DN
DN
DN
DN
DN
DN
DN
DN
DN
DN
D
34
WM
1N
DN
DN
DN
DN
DN
DN
DN
DN
D1 2
96
133
ND
22
ND
ND
34
YM
1N
DN
DN
DN
DN
DN
DN
DN
DN
DN
DN
DN
DN
DN
DN
D
34
YM
1N
DN
DN
DN
DN
DN
DN
DN
DN
DN
DN
DN
DN
DN
DN
D
34
WM
1N
DN
DN
DN
DN
DN
DN
DN
DN
D3 1
57
258
ND
11
7N
DN
D
34
YM
1N
DN
DN
DN
DN
D4
11
135
49
595
ND
ND
ND
ND
ND
ND
34
YM
1N
DN
DN
DN
DN
DN
DN
DN
DN
DN
DN
DN
DN
DN
DN
D
34
YM
1N
DN
DN
DN
DN
DN
DN
DN
DN
DN
DN
DN
DN
DN
DN
D
34
WM
1N
DN
DN
DN
DN
DN
DN
DN
DN
DN
DN
DN
DN
DN
DN
D
34
WM
1N
DN
DN
DN
DN
DN
DN
DN
DN
DN
DN
DN
DN
DN
DN
D
34
YM
1N
DN
DN
DN
DN
D981
231
95
1 3
07
ND
ND
ND
ND
ND
ND
35
WM
3N
DN
DN
DN
DN
D24
ND
ND
24
ND
ND
ND
ND
ND
ND
35
YM
2N
DN
DN
DN
DN
D75
ND
ND
75
ND
ND
ND
ND
ND
ND
35
WM
1N
DN
DN
DN
DN
DN
DN
DN
DN
DN
DN
DN
DN
DN
DN
D
35
YM
1N
DN
DN
DN
DN
DN
DN
DN
DN
DN
DN
DN
DN
DN
DN
D
35
WM
1N
DN
DN
DN
DN
DN
DN
DN
DN
DN
DN
DN
DN
DN
DN
D
35
WM
1N
DN
DN
DN
DN
DN
DN
DN
DN
DN
DN
DN
DN
DN
DN
D
35
YM
1N
DN
DN
DN
DN
D38
ND
ND
38
ND
ND
ND
ND
ND
ND

South African Maize Crop Quality Report 2016/2017 Season
90
TA
BL
E 2
4:
MY
CO
TO
XIN
RE
SU
LT
S -
MA
IZE
CR
OP
QU
AL
ITY
2016/2
017 (
co
nti
nu
e)
Reg
ion
Gra
de
Afla
toxi
n µg
/kg
F
um
on
isin
µg
/kg
D
ON
µg
/kg
15-A
DO
N
µg
/kg
Och
rato
xin
A
µg
/kg
Zeara
len
on
e
µg
/kg
HT-2
µg
/kg
T-2
µg
/kg
G1
B1
G2
B2
To
tal
B1
B2
B3
To
tal
LO
Q:
5 µ
g/k
g
LO
Q:
5 µ
g/k
g
LO
Q:
5 µ
g/k
g
LO
Q:
5 µ
g/k
g
LO
Q:
20 µ
g/k
g
LO
Q:
20 µ
g/k
g
LO
Q:
20 µ
g/k
g
LO
Q:
100 µ
g/k
g
LO
Q:
100 µ
g/k
g
LO
Q:
5 µ
g/k
g
LO
Q:
20 µ
g/k
g
LO
D:
20 µ
g/k
g
LO
Q:
20 µ
g/k
g
36
YM
1N
DN
DN
DN
DN
D335
83
35
453
ND
ND
ND
ND
ND
ND
36
WM
1N
DN
DN
DN
DN
DN
DN
DN
DN
D448
ND
ND
ND
ND
ND
36
WM
1N
DN
DN
DN
DN
D374
104
29
507
ND
ND
ND
ND
ND
ND
36
YM
1N
DN
DN
DN
DN
DN
DN
DN
DN
DN
DN
DN
DN
DN
DN
D
36
WM
3N
DN
DN
DN
DN
DN
DN
DN
DN
D11
6N
DN
DN
DN
DN
D
36
WM
2N
DN
DN
DN
DN
DN
DN
DN
DN
D255
105
ND
ND
ND
ND
36
YM
1N
DN
DN
DN
DN
DN
DN
DN
DN
DN
DN
DN
DN
DN
DN
D
36
WM
2N
DN
DN
DN
DN
DN
DN
DN
DN
D3 8
36
387
ND
61
ND
ND
36
YM
1N
DN
DN
DN
DN
DN
DN
DN
DN
DN
DN
DN
DN
DN
DN
D
36
YM
1N
DN
DN
DN
DN
D182
48
ND
230
ND
ND
ND
ND
ND
ND
36
WM
1N
DN
DN
DN
DN
D278
71
ND
349
ND
ND
ND
ND
ND
ND
36
WM
1N
DN
DN
DN
DN
D521
130
41
692
286
ND
ND
ND
ND
ND
36
WM
1N
DN
DN
DN
DN
D97
22
ND
11
927
8N
DN
D21
ND
ND
36
YM
1N
DN
DN
DN
DN
DN
DN
DN
DN
DN
DN
DN
DN
DN
DN
D
36
WM
1N
DN
DN
DN
DN
D30
ND
ND
30
1 2
86
ND
ND
128
ND
ND
36
YM
1N
DN
DN
DN
DN
DN
DN
DN
DN
DN
DN
DN
DN
DN
DN
D
36
WM
1N
DN
DN
DN
DN
D562
152
69
783
ND
ND
ND
ND
ND
ND
36
YM
1N
DN
DN
DN
DN
D22
ND
ND
22
ND
ND
ND
ND
ND
ND
36
WM
1N
DN
DN
DN
DN
DN
DN
DN
DN
DN
DN
DN
DN
DN
DN
D
36
YM
1N
DN
DN
DN
DN
DN
DN
DN
DN
D130
ND
ND
ND
ND
ND
To
tal n
um
ber
of
sam
ple
s350
350
350
350
350
350
350
350
350
35
03
50
35
03
50
35
03
50
Avera
ge o
f to
tal n
um
be
r o
f sam
ple
s0
00
00
146
33
12
191
339
41
07
00
Nu
mb
er
of
po
sit
ive r
esu
lts
00
00
0155
100
61
155
129
56
02
70
0
Avera
ge o
f p
osit
ive r
esu
lts
--
--
-330
11
569
431
919
25
4-
89
--
Maxim
um
of
po
sit
ive r
esu
lts
--
--
-4 4
63
1 0
88
508
6 0
59
7 6
98
96
4-
39
9-
-
No
te:
Lim
it o
f q
uan
tita
tio
n (
LO
Q)
mea
ns
the
low
est
con
cen
trat
ion
leve
l th
at c
an b
e q
uan
tifi
ed w
ith
acc
epta
ble
pre
cisi
on
an
d a
ccu
racy
by
the
LC
-MS/
MS.
A c
on
cen
trat
ion
mea
sure
d b
elo
w t
he
LO
Q i
s re
po
rted
as
<L
OQ
.
L
imit
of
det
ecti
on
(L
OD
) is
th
e lo
wes
t co
nce
ntr
atio
n le
vel t
hat
can
be
det
ecte
d b
ut
no
t q
uan
tifi
ed a
nd
is
50%
of
the
LO
Q o
f ea
ch m
yco
toxi
n.
A c
on
cen
trat
ion
mea
sure
d b
elo
w t
he
LO
D i
s re
po
rted
as
no
t d
etec
ted
(N
D).
µg/
kg
= p
pb
(p
arts
per
bil
lio
n)

South African Maize Crop Quality Report 2016/2017 Season
91
TA
BL
E 2
5:
MY
CO
TO
XIN
RE
SU
LT
S -
SU
MM
AR
Y O
F S
EA
SO
NS
2005/2
006 T
O 2
016/2
017
Seaso
n
To
tal
Nu
mb
er
of
sam
ple
s
receiv
ed
Nu
mb
er
of
sam
ple
s
teste
d f
or
myco
toxin
s
Afla
toxi
n
µg
/kg
Fu
mo
nis
in
µg
/kg
Deo
xyn
ivale
no
l
µg
/kg
Zeara
len
on
e
µg
/kg
Och
rato
xin
A
µg
/kg
T-2
To
xin
µg
/kg
ave.
min
.m
ax.
ave.
min
.m
ax.
ave.
min
.m
ax.
ave.
min
.m
ax.
ave.
min
.m
ax.
ave.
min
.m
ax.
2005/2
006
900
90
00
0970
013 0
00
2 7
40
06 2
00
30
03
90
<2.0
02
.9N
ot te
ste
d
2006/2
007
900
90
<10
9640
04 5
00
530
03 1
00
00
0 <
2.0
06
.5N
ot te
ste
d
2007/2
008
900
100
00
2470
05 5
00
240
01 7
00
00
10
0<1
.00
2N
ot te
ste
d
2008/2
009
810
90
00
0490
03 3
00
430
02 9
00
<25
01
60
<1.0
01
No
t te
ste
d
*2009/2
010
800
90
00
0251
04 0
35
206
01 8
45
00
00
00
0
*2010/2
011
693
325
00
0468
07 0
48
165
01835
33
02
70
00
00
**2011/2
012
1 0
00
350
00
0383
011 2
97
146
09
11
33
02
97
00
00
00
**2012/2
013
1 0
00
350
00
0530
011 2
43
186
01 1
75
30
04
26
00
02
02
32
**2013/2
014
930
350
00
0451
05 3
57
243
06 1
34
38
04
45
00
00
00
**2014/2
015
1 0
00
350
20
48
357
03 3
82
397
09 7
36
36
03
37
00
00
00
**2015/2
016
920
350
00
0444
011 3
47
175
01 5
85
16
01
27
00
00
00
**2016/2
017
1 0
00
350
00
0471
06 0
59
513
07 6
98
36
03
99
00
00
00
To
tal
10 8
53
2 8
85
Min
.0
00
00
0
Max.
48
13 0
00
9 7
36
44
57
23
2
* Sum
of A
flato
xin
(G1;
B1;
G2;
B2)
an
d s
um
of
Fu
mo
nis
in (
B1;
B2)
** S
um o
f Afla
toxi
n (G
1;
B1;
G2;
B2)
an
d s
um
of
Fu
mo
nis
in (
B1;
B2; B
3)
Myco
toxin
meth
od
olo
gy
Tech
niq
ue u
sed
fo
r seaso
n 2
005/2
006 -
2006/2
007
Tech
niq
ue u
sed
fo
r seaso
n 2
007/2
008 -
2008/2
00
9Te
ch
niq
ue
us
ed
fo
r s
ea
so
n 2
00
9/2
01
0 -
20
16
/20
17
Th
e m
ycoto
xin
analy
ses w
ere
carr
ied o
ut
in a
ccord
ance w
ith t
he
Vica
m Im
mun
oaffi
nity
Col
umn
Chr
omat
ogra
phy
met
hod
usin
g th
e di
ffere
nt V
icam
Inst
ruct
ion
Man
uals
for
the
diffe
rent
myc
otox
ins.
D
ete
ction o
f th
e t
oxin
s w
as d
one o
n a
Flu
oro
mete
r. T
he f
ollo
win
g
range a
nd lim
it o
f dete
ction a
pply
for
each t
oxin
:
Th
e S
AG
L u
se
d t
he
RO
SA
(R
ap
id O
ne
Ste
p A
ssa
y)
Quantita
tive
test
, whi
ch is
a la
tera
l flow
imm
uno
assa
y te
st, t
oget
her
with
the
RO
SA
-M
Re
ad
er
for
me
asu
rin
g
the
m
yco
toxin
co
nte
nt.
The
follo
win
g r
an
ge
an
d lim
it o
f d
ete
ctio
n a
pp
ly fo
r e
ach
to
xin
:
During 2
010 S
AG
L im
ple
mente
d a
multi-m
ycoto
xin
scre
enin
g
meth
od u
sin
g U
PLC
-MS
/MS
. T
he f
ollo
win
g lim
it o
f dete
ction
applie
s f
or
each t
oxin
:
Myco
toxin
Assay r
an
ge
µg
/kg
LO
D f
or
maiz
e
µg
/kg
Myco
toxin
Assay r
an
ge
µg
/kg
LO
D f
or
maiz
e
µg
/kg
Myco
toxin
LO
Q f
or
maiz
e
µg
/kg
LO
D f
or
maiz
e
µg
/kg
Aflat
oxin
0 -
300
1Afl
atox
in0 -
100
2Afl
atox
in G
15
2.5
Fum
onis
in0 -
10 0
00
250
Fum
onis
in0 -
60 0
00
100
Aflat
oxin
B1
52.5
Deoxyniv
ale
nol
500 -
50 0
00
500
Deoxyniv
ale
nol
0 -
5 0
00
250
Aflat
oxin
G2
52.5
Zeara
lenone
0 -
5 0
00
100
Zeara
lenone
0 -
1 0
00
25
Aflat
oxin
B2
52.5
Ochra
toxin
A0 -
50
2O
chra
toxin
A0 -
150
1F
um
onis
in B
120
10
T -
2 T
oxin
150 -
2 0
00
150
Fum
onis
in B
220
10
No
tes:
Fum
onis
in B
320
10
Lim
it o
f dete
ction (
LO
D)
means t
he low
est
level th
at
can b
e d
ete
cte
d a
ccu
rate
ly b
y th
e te
ch
niq
ue
. D
eoxyniv
ale
nol
100
50
Lim
it of
qua
ntita
tion
(LO
Q) m
eans
the
low
est l
evel
that
can
be
quan
tified
acc
urat
ely
by th
e te
chni
que.
Zeara
lenone
20
10
A re
sult
abov
e ze
ro b
ut lo
wer
than
the
limit
of d
etec
tion/
quan
titat
ion,
is re
porte
d as
<LO
D/<
LOQ
. O
chra
toxin
A5
2.5
µg/k
g =
ppb
(par
ts p
er b
illion
)T
- 2
Toxin
20
10
RS
A a
vera
ges c
alc
ula
ted
fro
m a
vera
ges
per
pro
vin
ce.
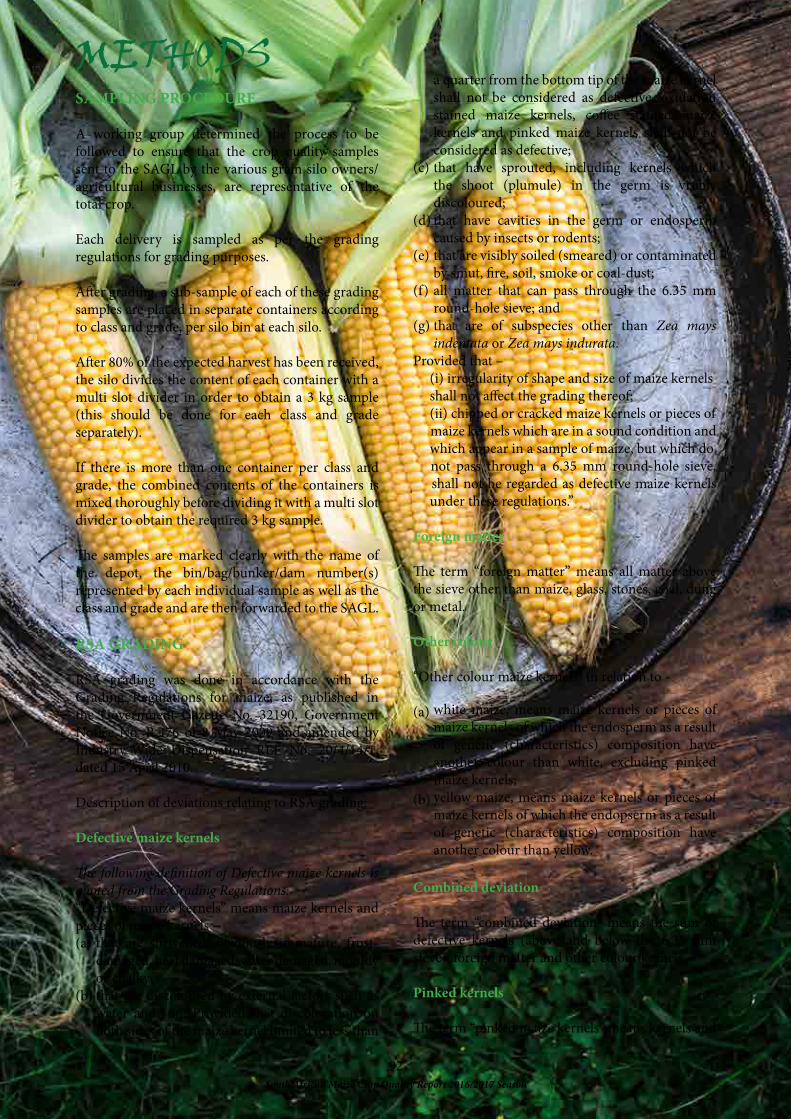
South African Maize Crop Quality Report 2016/2017 Season
92
METHODSSAMPLING PROCEDURE
A working group determined the process to be followed to ensure that the crop quality samples sent to the SAGL by the various grain silo owners/agricultural businesses, are representative of the total crop.
Each delivery is sampled as per the grading regulations for grading purposes.
After grading, a sub-sample of each of these grading samples are placed in separate containers according to class and grade, per silo bin at each silo.
After 80% of the expected harvest has been received, the silo divides the content of each container with a multi slot divider in order to obtain a 3 kg sample (this should be done for each class and grade separately).
If there is more than one container per class and grade, the combined contents of the containers is mixed thoroughly before dividing it with a multi slot divider to obtain the required 3 kg sample.
The samples are marked clearly with the name of the depot, the bin/bag/bunker/dam number(s) represented by each individual sample as well as the class and grade and are then forwarded to the SAGL.
RSA GRADING
RSA grading was done in accordance with the Grading Regulations for maize, as published in the Government Gazette No. 32190, Government Notice No. R.476 of 8 May 2009 and amended by Industry-Wide Dispensation REF No: 20/4/14/1, dated 15 April 2010.
Description of deviations relating to RSA grading:
Defective maize kernels
The following definition of Defective maize kernels is quoted from the Grading Regulations:“Defective maize kernels” means maize kernels and pieces of maize kernels – (a)
(b)
(c)
(d)
(e)
(f)
(g)
Provided that – (i) irregularity of shape and size of maize kernels shall not affect the grading thereof; (ii) chipped or cracked maize kernels or pieces of maize kernels which are in a sound condition and which appear in a sample of maize, but which do not pass through a 6.35 mm round-hole sieve, shall not be regarded as defective maize kernels under these regulations.”
Foreign matter
The term “foreign matter” means all matter above the sieve other than maize, glass, stones, coal, dung or metal.
Other colour
“Other colour maize kernels” in relation to -
(a)
(b)
Combined deviation
The term “combined deviation” means the sum of defective kernels (above and below the 6.35 mm sieve), foreign matter and other colour kernels.
Pinked kernels
The term “pinked maize kernels” means kernels and
that are shrivelled, obviously immature, frost-damaged, heat damaged, water damaged, mouldy or chalky; that are discoloured by external factors such as water and sun: Provided that discoloration onboth sides of the maize kernel limited to less than
a quarter from the bottom tip of the maize kernel shall not be considered as defective, oxidation stained maize kernels, coffee stained maize kernels and pinked maize kernels shall not be considered as defective; that have sprouted, including kernels which the shoot (plumule) in the germ is visibly discoloured;that have cavities in the germ or endosperm caused by insects or rodents;that are visibly soiled (smeared) or contaminated by smut, fire, soil, smoke or coal-dust;all matter that can pass through the 6.35 mm round-hole sieve; andthat are of subspecies other than Zea mays indentata or Zea mays indurata.
white maize, means maize kernels or pieces of maize kernels of which the endosperm as a result of genetic (characteristics) composition have another colour than white, excluding pinked maize kernels; yellow maize, means maize kernels or pieces of maize kernels of which the endopserm as a result of genetic (characteristics) composition have another colour than yellow.

South African Maize Crop Quality Report 2016/2017 Season
93
pieces of kernels of white maize of which the pericarp or part thereof is shaded red or pink in colour.
The specification, according to the Grading Regulations for classes 1 to 3 of white maize is a maximum of 12%. No specification for yellow maize according to the Grading Regulations.
Fungal infection
Kernels which are mouldy (fungi infected) are reported as defective kernels according to the grading regulations.
“Mouldy” means kernels and pieces of kernels that –(a)
(b)
For this survey all samples were also inspected for the visual symptoms of Diplodia and Fusarium infection and reported separately.
Fusarium spp infections are localized on the cob with discoloured maize kernels, which become reddish (light pink to lilac).
Diplodia maydis normally rots the entire maize cob and infected maize kernels are recognized by a light ash colour to black colour that appears at the germ and can infest the whole kernel.
% Cobrot reported is the percentage maize kernels that are both Fusarium and Diplodia infected.
USA GRADING
USA grading was determined in accordance with the American Grading Regulations (United States Department of Agriculture).
The US grading system makes provision for three classes of maize/corn based on colour, namely Class White corn, Class Yellow corn and Class Mixed corn. Each class is divided into five U.S. numerical grades (Nos. 1 to 5) and U.S. Sample Grade. US No.1 is the most desirable grade followed by No. 2 down to sample grade.
Description of deviations relating to USA grading:
Damaged kernels
Kernels and pieces of corn kernels that are badly ground-damaged, badly weather-damaged, diseased, frost-damaged, germ-damaged, heat-damaged, insect-bored, mould-damaged, sprout-damaged or otherwise materially damaged.
Heat damaged kernels
Kernels and pieces of kernels which are materially discolored by excessive respiration, with the dark discoloration extending out of the germ through the sides and into the back of the kernel as well as kernels and pieces of kernels which are puffed or swollen and materially discolored by external heat caused by artificial drying methods.
Broken corn and foreign material
Broken corn is all matter that passes readily through a 12/64-inch (4.76 mm) round-hole sieve and over a 6/64-inch (2.38 mm) round-hole sieve.
Foreign material is all matter that passes readily through a 2.38 mm round-hole sieve and all matter other than corn that remains on top of the 4.76 mm round-hole sieve after sieving.
Broken corn and foreign material is all matter that passes readily through a 4.76 mm round-hole sieve and all matter other than corn that remains in the sieved sample after sieving.
Bushel weight
The specific mass (or grain density) of maize (expressed as test weight or bushel weight) is a quality characteristic which is important to some maize consumers and is applied as a grading factor in the USA grading regulations.
The Test weight per bushel apparatus is used to determine the approximate weight of a bushel of a particular lot of grain.
Bushel weight in pounds (lbs), was determined on the maize crop samples and the results converted to test weight, reported in kilogram/hectoliter (kg/hl), by multiplication with a factor of 1.2872.
Other colour
Maize samples are deemed to be Class mixed corn when maize kernels of another colour exceeds 2% for white maize and 5% for yellow maize.
are visibly infected by fungi and are characterised by black, blue, green, yellow or white fungi growth anywhere on the kernel, or are characterised by fungi growth underneath the bran layer of the kernel;are infected by ear-rot and are characterised by red, pink or brown discolorations. The kernel are partially to completely infected.

South African Maize Crop Quality Report 2016/2017 Season
94
NUTRITIONAL VALUES
The fat, protein and starch contents are measured with an Infratec 1241 - Generation 3 Standard Version Whole Grain Analyser. The measurements are based on the fact that the constituents to be measured in the grain, absorb electromagnetic radiation in the near-infrared region of the spectrum. Since the Infratec 1241 Grain Analyser uses transmission absorption, the test is done on intact maize kernels.
The calibration loaded on the Infratec 1241 Grain Analyser (NIT) at the SAGL, is updated annually by Foss using NIT spectra and international primary chemical method results of maize crop quality samples from the specific season under discussion, provided by SAGL.
The chemical methods used to check the calibration were:a)
b)
c)
The results obtained by the Infratec 1241 Grain Analyser (NIT) on the 2016/2017 season’s samples, were checked by analysing every tenth sample by means of the primary methods.
PHYSICAL CHARACTERISTICS
Test weight
Test weight is reported in kilogram per hectolitre. The specific mass (or grain density) of maize expressed as test weight is influenced by amongst other, factors like cultivar, moisture content, foreign matter, other grain and damaged kernels like insect damaged and immature kernels.
Bushel weight in pounds (lbs) was determined on the maize crop samples and the results converted to test weight, reported in kilogram/hectoliter (kg/hl), by multiplication with a factor of 1.2872.
Hundred (100) kernel mass - Industry accepted
method 001
100 kernel mass is the weight in grams of one hundred whole maize kernels and provides a measure of grain size and density. The results are reported on an “as is” basis.
Kernel size - Industry accepted method 017
Kernel size is important to the sophisticated starch manufacturing industry. Kernels that are too small hamper the separation of kernel fractions in the wet milling process. The result is a lower starch yield. A mixture of small and large kernels causes additional problems, as homogeneous steeping cannot be achieved. On the other hand, very large kernels can also cause problems since the ratio between volume and mass is unfavourable to proper steeping.
The dry milling industry also prefers fairly larger maize kernels. However, uniform kernel size is of particular importance to this industry, since too large kernels create problems especially when mixed with smaller kernels.
Kernel size is less important to the animal feed manufacturing industry. Larger kernels are nevertheless preferred, as small kernels are easily lost during the screening stage of processing. The determination of kernel size comprises the sieving of a 100 g representative whole maize sample through both 8 mm and 10 mm round-hole grading sieves, normally used in the seed industry.
Breakage susceptibility - Industry accepted
method 007
Maize is normally cleaned before processing. In the cleaning process, broken kernels are removed together with other impurities, causing losses. Broken kernels are further broken during handling, resulting in excessive grain dust being generated. This creates the potential for dust explosions, health hazards, hygiene problems, etc. Maize containing a high percentage of broken kernels is more prone to insect infestation and is subject to general deterioration.
In the modern dry milling industry, maize is cleaned first and then conditioned by dampening before the germ is removed. Broken kernels cause many problems during these stages of processing. Broken kernels can also lead to a lower extraction of the so-called high-quality products, like samp and maize grits. The presence of many broken kernels causes problems with the fibre and fat content of maize products, for example the various grades of maize meal, because the quantity of germ required to be returned to the milled endosperm cannot be determined accurately.
In the wet milling process broken kernels steep
Crude fat: Petroleum ether extraction (Soxhlet) method (In house method 024) Crude protein: Dumas (Leco) method (AACCI 46-30.01)Starch: Hydrochloric Acid dissolution method (Polarimeter) (In house method 019)

South African Maize Crop Quality Report 2016/2017 Season
95
more rapidly than whole kernels and by the time the whole kernels have been sufficiently steeped, the broken kernels have been over-steeped, causing an ineffective separation of protein and starch.
In the livestock feed industry breakability is not an important quality characteristic, except for dust and hygiene reasons.
All samples were subjected to a breakage susceptibility test. After the sample of whole maize kernels was propelled in a Stein Breakage tester for 4 minutes, the fraction below the 6.35 mm and 4.75 mm sieves was collected and the percentage broken kernels < 6.35 mm and < 4.75 mm was determined.
Stress cracks - Industry accepted method 006
Stress cracks are determined by visual inspection of a certain amount of whole maize kernels examined on top of a light box for small internal cracks in the endosperm. Some kernels may even have two or more internal cracks. Any form of stress may cause internal cracks, for example rapid moisture loss in the field, during harvest or during drying.
MILLING INDEX - Industry accepted method 015
Milling Index is an indication of the milling abilities and milling quality of maize kernels where a higher milling index means a higher extraction of the high-grade and most profitable products like samp, maize rice and maize grits (degermed products) that are manufactured from the corneous part of the endosperm.
The milling index is a model developed on the Foss NIT Infratec 1241- Generation 3 Standard Version Grain Analyser where the NIT spectra were modelled against the Roff milling fractions. In the previous seasons (until 2015/2016) the Milling index of the samples were determined with the calibration model developed by the Grain Crops Institute of the ARC. With this model, the average milling index of a sample with good milling characteristics is about 95 with a variation of about 55 (low milling quality) to about 115 (very good milling quality).
The SAGL was tasked by the Maize Trust to develop a new model for Milling Index using samples from maize cultivar trials supplied by the ARC-GCI and by commercial seed breeders over four seasons (from 2012/2013 onward). The trials included a range of hardness levels. The New Milling Index
(NMI) that was developed is similar to the original ARC formula but on a 14% moisture basis, and with the constants removed. The NMI model has improved precision compared to the older version, due to the almost tenfold increase in the number of samples used to build the calibration model.
During the fifth year, samples of commercial hybrids, selected imported maize samples and outlier samples from the 2014/2015 and 2015/2016 seasons were included to develop a robust model with the assistance of FOSS to produce accurate results. The improved new model, SAGL Milling Index 2017, now includes two parameters, SAGL Milling Index (SAGL MI) as well as a new parameter namely Grit Yield All (GYA).
SAGL MI indicates the relative ratio of total hard endosperm products (B2 grits, B3 fine grits and B3 coarse grits) to offal products (B1 fine flour and total chop/bran) as determined on a Roff mill and used for calibration of the NIT. It is expressed as a dimensionless index value according to the following scale:
SAGL MI <40 40-60 60-80 80-100 >100
DescriptionSoft Medium
Moderately
hardHard Very hard
GYA is defined as the sum of the mass fractions of the Roff B2 grits, B3 fine grits and B3 coarse grits fractions expressed as a mass percentage of the total mass of the whole maize before milling. GYA is linearly correlated with the SAGL MI and indicates the true amount of total hard endosperm that can be extracted from the maize during Roff milling. The NIT calibration value for GYA provides this estimate directly from the whole maize without need for further milling tests. GYA is also reported on a 14% moisture base. The 2016/2017 season maize samples were measured with the NIT on the SAGL Milling Index 2017 model.
MILLING OF MAIZE ON ROFF MAIZE MILL -
Industry accepted method 013
The Roff 150 Series maize mill is used to mill representative samples of 500 g. The mill is pre-set to the following specifications: Break 1 roll nip - 0.3 mm, Break 2 roll nip - 0.18 mm and Break 3 roll nip - 0.08 mm. These settings are according to the specifications in the method developed by the ARC Grain Crops Institute. Every mill has three separations, namely chop, grits and maize meal. The

South African Maize Crop Quality Report 2016/2017 Season
96
grits from Break 1 are transferred to the Break 2 rolls and the grits from Break 2 are transferred to Break 3 rolls.
The following fractions are weighed and determined as percentages: Break 1 meal, Break 2 meal, Break 3 meal and Break 3 grits. Break 1, 2 and 3 chop are combined and then weighed for determination of % Chop. Break 3 grits are weighed for determination of % Grits. The percentage extraction total meal is determined as the sum of the percentages Break 1, 2 and 3 meal as well as the % Grits.
WHITENESS INDEX - Industry accepted method
004
Whiteness index of white maize meal was determined with the HunterLab ColorFlex 45°/0°. Whiteness is associated with a region or volume in colour space in which objects are recognized as white. The degree of whiteness is measured by the degree of departure of the object from a perfect white. The higher the whiteness index value, the whiter the sample.
Whiteness index was done on unsifted and sifted maize meal obtained from Break 2 and 3 of the Roff mill. The sifted samples were obtained by sieving the unsifted samples through a 300 µm sieve. The fractions on top and below the sieve were then combined to result in sifted samples that contain 87% of maize meal > 300 µm and 13% of maize meal < 300 µm.
MYCOTOXIN ANALYSES
Mycotoxins are fungal metabolites, toxic to animals and humans, that are produced by moulds commonly found in almost all types of grain.
GMO Protein/Trait Event Trade name / Brand
Cry1Ab MON810
MON89034
Bt11
YieldGard®
Cry2Ab MON89034 in GenuityTM
VT Triple PROTM
SmartStaxTM
CP4 EPSPS NK603 Roundup Ready ®
350 of the 1 000 maize crop samples were tested for Aflatoxin G1, B1, G2, B2, Fumonisin B1, B2 and B3, Deoxynivalenol, 15-ADON, HT-2 Toxin, T-2 Toxin, Zearalenone and Ochratoxin A by means of a multi-mycotoxin screening method using UPLC - MS/MS.
Limit of quantitation (LOQ) means the lowest concentration level that can be quantified with acceptable precision and accuracy by the mass spectrometer. A concentration measured below the LOQ is reported as <LOQ.
Limit of detection (LOD) is the lowest concentration level that can be detected but not quantified and is 50% of the LOQ of each mycotoxin. A concentration measured below the LOD is reported as not detected (ND).
GMO (Genetically Modified Organisms)
The EnviroLogix QuickComb kit for bulk grain was used to quantitatively determine the presence of genetically modified maize. The kit is designed to extract and detect the presence of certain proteins at the levels typically expressed in genetically modified bulk maize grain. The procedure prescribed in the EnviroLogix - QuickScan Instruction Manual, Rev. 01-07-16 was followed. Results were scanned and interpreted quantitatively with the EnviroLogix QuickScan system.
100 crop samples were tested for Cry1Ab, Cry2Ab and CP4 EPSPS modified maize. Cry1Ab protein in maize is produced from a gene derived from Bacillus thuringiensis (Bt).

South African Maize Crop Quality Report 2016/2017 Season
97

South African Maize Crop Quality Report 2016/2017 Season
98

South African Maize Crop Quality Report 2016/2017 Season
99
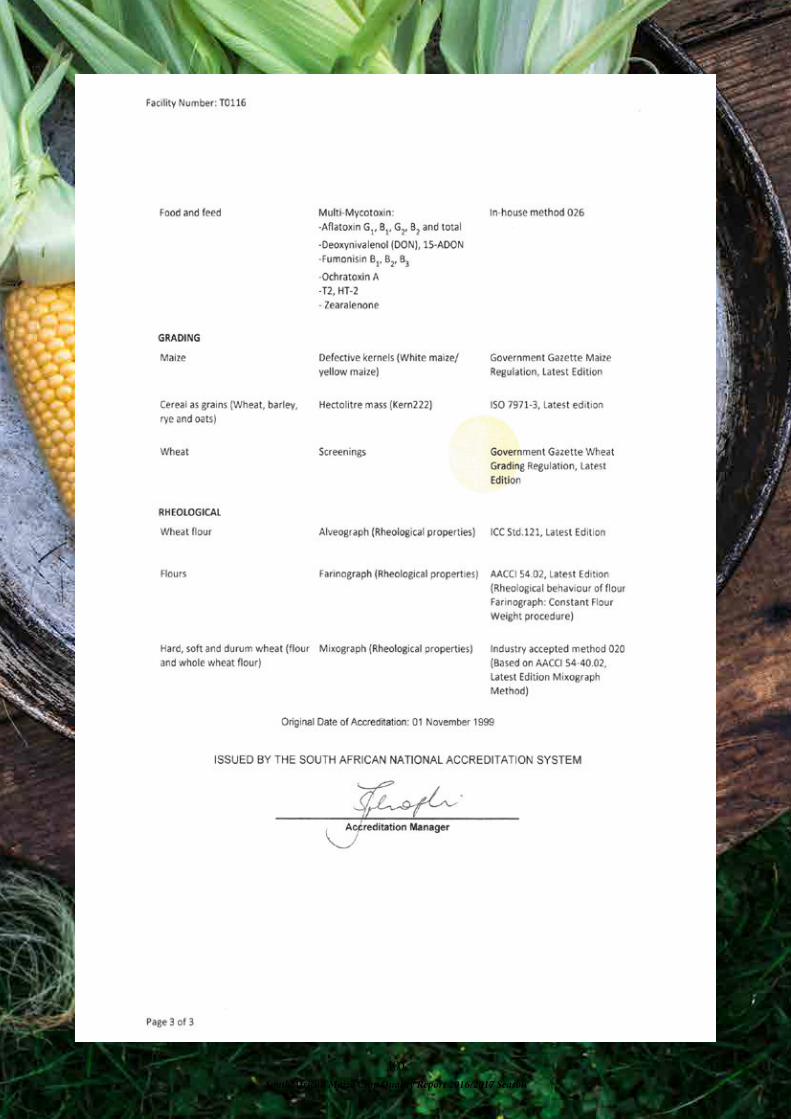
South African Maize Crop Quality Report 2016/2017 Season
100

South African Maize Crop Quality Report 2016/2017 Season
101
CERTIFICATE
SERTIFIKAAT IT IS HEREBY CERTIFIED THAT
HIERMEE WORD GESERTIFISEER DAT
Southern African Grain Lab
FEEDS / VOERE
FOR THE PERIOD OF 01/07/2017 TO 31/01/2018
VIR DIE TYDPERK VAN TOT
PARTICIPATED IN THE QUALITY ASSURANCE SCHEME AND CONFORMED TO THE REQUIREMENTS
IN RESPECT OF THE FOLLOWING DETERMINATIONS
AAN DIE KWALITEITS MONITERINGS SKEMA EN AAN DIE VEREIESTES MET BETREKKING TOT DIE
VOLGENDE BEPALINGS VOLDOEN HET
Ash Crude Fibre Fat
Moisture Nx6.25-Protein Starch
EVALUASION CRITERIA EVALUASIE KRITERIA
Z – VALUE BETWEEN -2 AND 2 PARTICIPATION ≥ 83% Z-WAARDE TUSSEN -2 EN 2 DEELNAME ≥ 83%
_________________________________
PRESIDENT

South African Maize Crop Quality Report 2016/2017 Season
102
1
Seasonal Climate Watch May to September 2018
Date issued: May 04, 2018
1. Overview
The El Niño-Southern Oscillation (ENSO) is expected to weaken from a moderate La Niña
phase to a neutral phase through to early spring (Aug-Sep-Oct). Forecasts currently suggest
that there is a high likelihood of an El Niño developing for early summer (Nov-Dec-Jan),
however these forecasts tend to be less accurate during periods leading up to summer and it
is advised that no drastic planning be made for the summer rainfall areas until such a time as
there is more certainty in the forecast (usually during Sep/Oct).
There are still indications for above-normal rainfall during early winter (May-Jun-Jul) through
to late winter (Jul-Aug-Sep), however late winter does not indicate sufficient confidence in
the forecasting system and thus remains very uncertain.
Number of rainfall days are expected to be higher than normal for the winter rainfall areas.
This increase in rainfall days are only expected to be more frequent rather than extremely
high rainfall amounts. It should be noted however that there is not sufficient confidence in the
forecasting system for these forecasts, thus there is very high uncertainty in the rainfall
intensity for the winter rainfall areas.
Temperatures generally still indicate lower temperatures during early-, mid- and late-winter
for the north-eastern parts of the country, and higher temperatures for the south-western
parts of the country during the same period.
The South African Weather Service will continue to monitor and provide updates of any
future assessments that may provide more clarity on the current expectations for the coming
seasons.

South African Maize Crop Quality Report 2016/2017 Season
103
2
2. South African Weather Service Prediction Systems
2.1. Ocean-Atmosphere Global Climate Model
The South African Weather Service (SAWS) is currently recognised by the World Meteorological
Organization (WMO) as the Global Producing Centre (GPC) for Long-Range Forecasts (LRF). This is
owing to its local numerical modelling efforts which involve coupling of both the atmosphere and
ocean components to form a fully-interactive coupled modelling system, named the SAWS Coupled
Model (SCM), the first of its kind in both South Africa and the region. Below are the first season (Mar-
Apr-May) predictions for rainfall (Figure 1) and average temperature (Figure 2).
Figure 1: May-June-July global prediction for total rainfall probabilities.

South African Maize Crop Quality Report 2016/2017 Season
104
3
Figure 2: May-June-July global prediction for average temperature probabilities.
It is worth mentioning that the SCM levels of skill for the Nino 3.4 region (where ENSO information
is sourced) are very much comparable to other state-of-the-art coupled models which are
administered by other international centres. Therefore the following Sea-Surface Temperature (SST)
forecast (Figure 3) emanates from the SST Prediction System which is purely based on the SCM.

South African Maize Crop Quality Report 2016/2017 Season
105
4
Figure 3: Niño3.4 SST anomaly forecasts produced by the SST forecast system administered by the
SAWS. It comprises 40 ensemble members (marked in grey colour). The mean of the ensemble
is marked in black.
2.2. Multi-Model Statistical Downscaling System
2.2.1. Seasonal Totals and Averages
In an effort to improve the predictions made by the SCM, which struggles to produce reliable rainfall
and temperatures forecasts at a local scale, the Multi-Model System (MMS) has been implemented to
statistically downscale various global forecasts, including the SCM and the Climate Forecasting System
version 2 (CFSv2) administered by the National Oceanographic and Atmospheric Administration
(NOAA).
Below are the current three season forecasts issued in Feb 2018. Three maps are shown for each
season which includes the raw probabilistic prediction from the MMS (left), the probabilistic prediction
with skill masked out (middle) and the climatological average (right) for the specific season. The user is
advised to consider the skill masked map (middle) as the official SAWS forecast, however the two additional
maps may be used as tools in such a case where skill for a specific area is deemed insufficient.

South African Maize Crop Quality Report 2016/2017 Season
106
5
Figu
re 4
: M
ay-Jun
e-Ju
ly (
MJJ)
2018 s
easo
nal pre
cipita
tion
pre
dict
ion
with
out
skill t
aken
int
o ac
coun
t (le
ft), a
s w
ell as
ski
ll m
aske
d ou
t (m
iddl
e). Also
incl
uded
is
the
clim
atol
ogic
al
aver
age
for
MJJ
(rig
ht, i
n m
m)
calc
ulat
ed o
ver
the
per
iod
1979-2
009.

South African Maize Crop Quality Report 2016/2017 Season
107
6
Figu
re 5
: Ju
ne-Jul
y-Aug
ust
(JJA
) 2018 s
easo
nal p
reci
pita
tion
pre
dict
ion
with
out
skill t
aken
into
acc
ount
(le
ft), a
s w
ell a
s sk
ill m
aske
d ou
t (m
iddl
e). Also
incl
uded
is t
he c
limat
olog
ical
aver
age
for
JJA (
righ
t, in
mm
) ca
lcul
ated
ove
r th
e per
iod
1979-2
009.

South African Maize Crop Quality Report 2016/2017 Season
108
7
Figu
re 6
: Ju
ly-A
ugus
t-Se
ptem
ber
(JAS)
2018 s
easo
nal
pre
cipita
tion
pre
dict
ion
with
out
skill t
aken
int
o ac
coun
t (le
ft), a
s w
ell
as s
kill
mas
ked
out
(mid
dle)
. Also
incl
uded
is
the
clim
atol
ogic
al a
vera
ge for
JAS
(rig
ht, i
n m
m)
calc
ulat
ed o
ver
the
per
iod
1979-2
009.

South African Maize Crop Quality Report 2016/2017 Season
109
8
Figu
re 7
: M
ay-Jun
e-Ju
ne (
MJJ)
2018 s
easo
nal
min
imum
tem
pera
ture
pre
dict
ion
with
out
skill t
aken
int
o ac
coun
t (le
ft), a
s w
ell as
ski
ll m
aske
d ou
t (m
iddl
e).
Also
incl
uded
is
the
clim
atol
ogic
al a
vera
ge for
MJJ
(rig
ht)
calc
ulat
ed o
ver
the
per
iod
1979-2
009.

South African Maize Crop Quality Report 2016/2017 Season
110
9
Figu
re 8
: Ju
ne-Jul
y-Aug
ust
(JJA
) 2018 s
easo
nal m
inim
um t
empe
ratu
re p
redi
ctio
n w
ithou
t sk
ill t
aken
int
o ac
coun
t (le
ft), a
s w
ell as
ski
ll m
aske
d ou
t (m
iddl
e). Also
incl
uded
is
the
clim
atol
ogic
al a
vera
ge for
JJA
(righ
t) c
alcu
late
d ov
er t
he p
erio
d 1979-2
009.

South African Maize Crop Quality Report 2016/2017 Season
111
10
Figu
re 9
: Ju
ly-A
ugus
t-Se
ptem
ber
(JAS)
2018 s
easo
nal m
inim
um t
emper
atur
e pre
dict
ion
with
out
skill t
aken
into
acc
ount
(le
ft),
as w
ell a
s sk
ill m
aske
d ou
t (m
iddl
e). Also
incl
uded
is
the
clim
atol
ogic
al a
vera
ge for
JAS
(rig
ht)
calc
ulat
ed o
ver
the
per
iod
1979-2
009.

South African Maize Crop Quality Report 2016/2017 Season
112
11
Figu
re 1
0:
May
-Jun
e-Ju
ly (
MJJ)
2018 s
easo
nal
max
imum
tem
pera
ture
pre
dict
ion
with
out
skill t
aken
int
o ac
coun
t (le
ft), a
s w
ell as
ski
ll m
aske
d ou
t (m
iddl
e).
Also
incl
uded
is
the
clim
atol
ogic
al a
vera
ge for
MJJ
(rig
ht)
calc
ulat
ed o
ver
the
per
iod
1979-2
009.

South African Maize Crop Quality Report 2016/2017 Season
113
12
Figu
re 1
1:
June
-Jul
y-Aug
ust
(JJA
) 2018 s
easo
nal m
axim
um t
empe
ratu
re p
redi
ctio
n w
ithou
t sk
ill t
aken
int
o ac
coun
t (le
ft),
as w
ell as
ski
ll m
aske
d ou
t (m
iddl
e). Also
incl
uded
is
the
clim
atol
ogic
al a
vera
ge for
JJA
(righ
t) c
alcu
late
d ov
er t
he p
erio
d 1979-2
009.
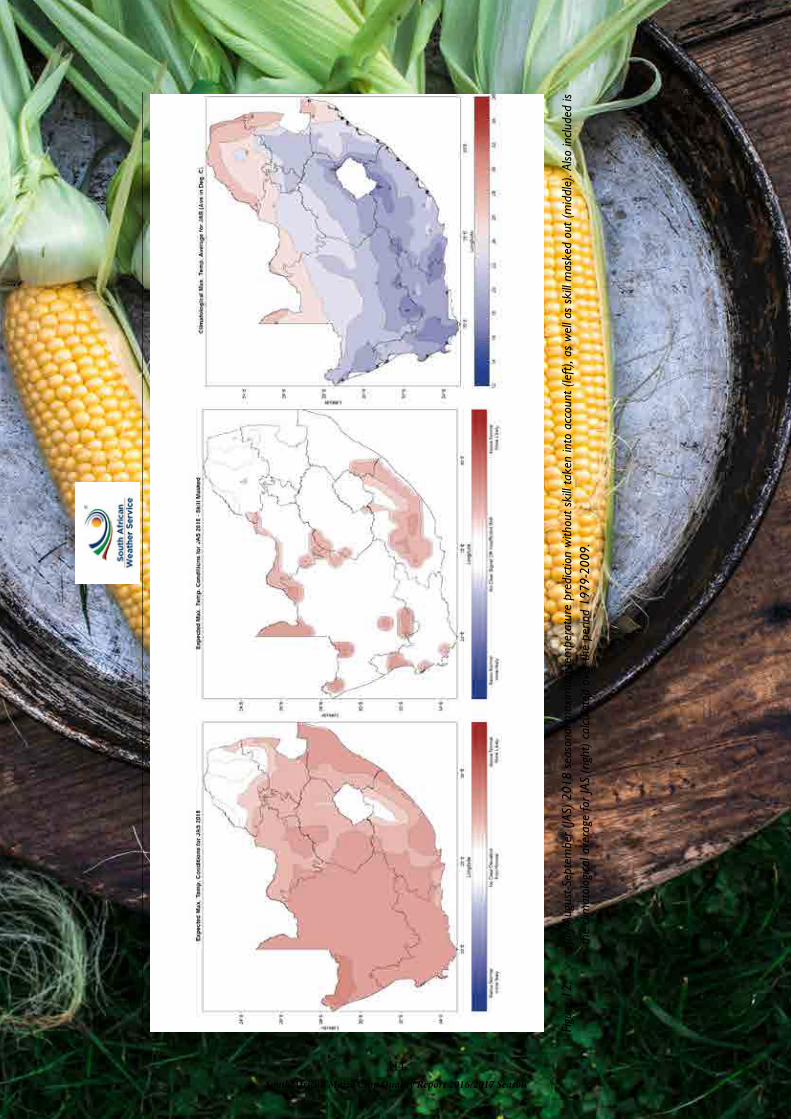
South African Maize Crop Quality Report 2016/2017 Season
114
13
Figu
re 1
2:
July
-Aug
ust-Se
ptem
ber
(JAS)
2018 s
easo
nal m
axim
um t
empe
ratu
re p
redi
ctio
n w
ithou
t sk
ill t
aken
into
acc
ount
(le
ft),
as w
ell a
s sk
ill m
aske
d ou
t (m
iddl
e). Also
incl
uded
is
the
clim
atol
ogic
al a
vera
ge for
JAS
(rig
ht)
calc
ulat
ed o
ver
the
per
iod
1979-2
009.

South African Maize Crop Quality Report 2016/2017 Season
115
14
2.2.2. Rainfall Frequency Predictions
This product is a result of the SAWS operational multi-model system (MMS) where the 850hPa geopotential heights
hindcast outputs are first statistically recalibrated and downscaled to observed number of rainfall days exceeding
desired thresholds (derived from high resolution 0.1 X 0.1 degree (ARCv2) African Rainfall Climatology version 2
rainfall dataset) within seasons of interest over southern Africa by using model output statistics. The 850hPa
geopotential heights are used here because they are found to be the best predictor of rainfall over southern Africa.
These forecasts can be used together with the traditional seasonal rainfall total forecasts in that it can indicate the
frequency of rainfall days where seasonal rainfall forecast areas expects below- or above-normal conditions.

South African Maize Crop Quality Report 2016/2017 Season
116
15
Figu
re 1
3:
May
-Jun
e-Ju
ly 2
018 r
ainf
all d
ays
fore
cast
. Fo
reca
st f
or h
igh
and
low
num
ber
of r
ainf
all d
ays
exce
edin
g 5 a
nd 1
5m
m w
ithou
t sk
ill t
aken
int
o ac
coun
t (le
ft)
and
with
ski
ll
take
n in
to a
ccou
nt (
mid
dle)
. Also
incl
uded
is the
clim
atol
ogy
for
high
and
low
num
ber
of r
ainf
all d
ays
exce
edin
g 5 a
nd 1
5m
m c
alcu
late
d ov
er t
he p
erio
d 1983-2
009.

South African Maize Crop Quality Report 2016/2017 Season
117
16
Figu
re 1
4:
June
-Jul
y-Aug
ust 2018 r
ainf
all d
ays
fore
cast
. For
ecas
t fo
r hi
gh a
nd lo
w n
umbe
r of
rai
nfal
l day
s ex
ceed
ing
5 a
nd 1
5m
m w
ithou
t sk
ill tak
en in
to a
ccou
nt (
left)
and
with
ski
ll
take
n in
to a
ccou
nt (
mid
dle)
. Also
incl
uded
is the
clim
atol
ogy
for
high
and
low
num
ber
of r
ainf
all d
ays
exce
edin
g 5 a
nd 1
5m
m c
alcu
late
d ov
er t
he p
erio
d 1983-2
009.

South African Maize Crop Quality Report 2016/2017 Season
118
17
Figu
re 1
5:
July
-Aug
ust-Se
ptem
ber
2018 r
ainf
all da
ys f
orec
ast.
Fore
cast
for
hig
h an
d lo
w n
umbe
r of
rai
nfal
l da
ys e
xcee
ding
5 a
nd 1
5m
m w
ithou
t sk
ill t
aken
int
o ac
coun
t (le
ft)
and
with
ski
ll ta
ken
into
acc
ount
(m
iddl
e). Also
incl
uded
is t
he c
limat
olog
y fo
r hi
gh a
nd lo
w n
umbe
r of
rai
nfal
l day
s ex
ceed
ing
5 a
nd 1
5m
m c
alcu
late
d ov
er t
he p
erio
d 1983-
2009.

South African Maize Crop Quality Report 2016/2017 Season
119
18
3. Contributing Institutions and Useful links
All the forecasts are a result of an objective multi-model prediction system developed at the South African
Weather Service. This system consists of long-range forecasts produced by the following institutions:
http://www.weathersa.co.za/home/seasonal (Latest predictions including maps for the whole of SADC)
https://iri.columbia.edu/our-expertise/climate/forecasts/enso/current/ (ENSO predictions from various
centres)

South African Maize Crop Quality Report 2016/2017 Season
120
Ge
ne
ral
Info
rma
tio
n
Av
era
ge
Mo
nth
ly R
ain
fall
Pu
bli
c D
ocu
me
nt
Pa
ge
1 o
f 4
C
LS
-CI-
GE
N-I
NF
O-1
73
.2
0
20
40
60
80
10
0
12
0
14
0
16
0
18
0
Se
p-1
6O
ct-
16
No
v-1
6D
ec-1
6Ja
n-1
7F
eb
-17
Ma
r-1
7A
pr-
17
Ma
y-1
7Ju
n-1
7Ju
l-1
7A
ug
-17
Se
p-1
7O
ct-
17
No
v-1
7D
ec-1
7Ja
n-1
8F
eb
-18
Ma
r-1
8
Rainfall (mm)
Fre
e S
tate
-A
ve
rag
e M
on
thly
Ra
infa
ll (
mm
)

South African Maize Crop Quality Report 2016/2017 Season
121
Ge
ne
ral
Info
rma
tio
n
Av
era
ge
Mo
nth
ly R
ain
fall
Pu
bli
c D
ocu
me
nt
Pa
ge
2 o
f 4
C
LS
-CI-
GE
N-I
NF
O-1
73
.2
0
50
10
0
15
0
20
0
25
0
Se
p-1
6O
ct-
16
No
v-1
6D
ec-1
6Ja
n-1
7F
eb
-17
Ma
r-1
7A
pr-
17
Ma
y-1
7Ju
n-1
7Ju
l-1
7A
ug
-17
Se
p-1
7O
ct-
17
No
v-1
7D
ec-1
7Ja
n-1
8F
eb
-18
Ma
r-1
8
Rainfall (mm)
Mp
um
ala
ng
a -
Ave
rag
e M
on
thly
Ra
infa
ll (
mm
)

South African Maize Crop Quality Report 2016/2017 Season
122
Ge
ne
ral
Info
rma
tio
n
Av
era
ge
Mo
nth
ly R
ain
fall
Pu
bli
c D
ocu
me
nt
Pa
ge
3 o
f 4
C
LS
-CI-
GE
N-I
NF
O-1
73
.2
0
50
10
0
15
0
20
0
25
0
Se
p-1
6O
ct-
16
No
v-1
6D
ec-1
6Ja
n-1
7F
eb
-17
Ma
r-1
7A
pr-
17
Ma
y-1
7Ju
n-1
7Ju
l-1
7A
ug
-17
Se
p-1
7O
ct-
17
No
v-1
7D
ec-1
7Ja
n-1
8F
eb
-18
Ma
r-1
8
Rainfall (mm)
No
rth
-We
st
-A
ve
rag
e M
on
thly
Ra
infa
ll (
mm
)

South African Maize Crop Quality Report 2016/2017 Season
123
Ge
ne
ral
Info
rma
tio
n
Av
era
ge
Mo
nth
ly R
ain
fall
Pu
bli
c D
ocu
me
nt
Pa
ge
4 o
f 4
C
LS
-CI-
GE
N-I
NF
O-1
73
.2
Co
mp
ile
d b
y:
Els
a d
e J
ag
er
Ma
na
ge
r: N
ati
on
al C
lim
ate
Ce
nte
r
Da
te:
18
Ma
y 2
01
8

South African Maize Crop Quality Report 2016/2017 Season
124

South African Maize Crop Quality Report 2016/2017 Season
125

South African Maize Crop Quality Report 2016/2017 Season
126

South African Maize Crop Quality Report 2016/2017 Season
127

South African Maize Crop Quality Report 2016/2017 Season
128

South African Maize Crop Quality Report 2016/2017 Season
129

South African Maize Crop Quality Report 2016/2017 Season
130

South African Maize Crop Quality Report 2016/2017 Season
131

South African Maize Crop Quality Report 2016/2017 Season
132
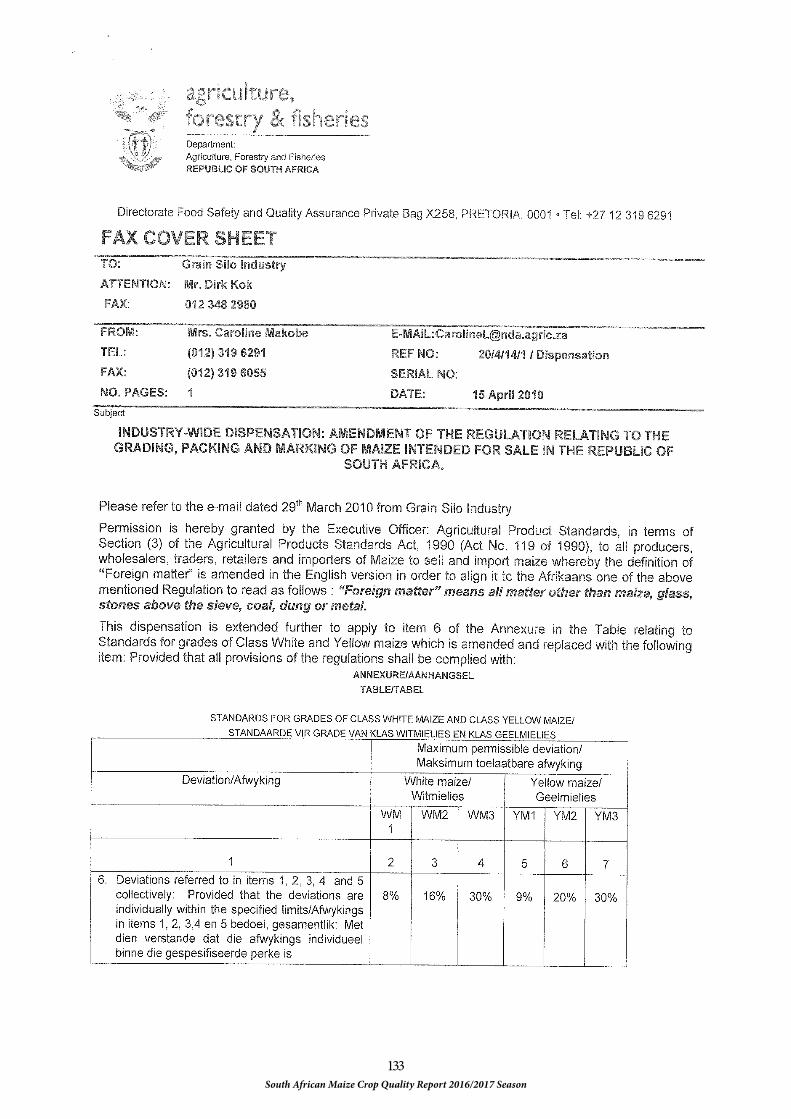
South African Maize Crop Quality Report 2016/2017 Season
133

South African Maize Crop Quality Report 2016/2017 Season
134