Crop architecture and crop tolerance to fungal diseases and insect herbivory. Mechanisms to limit...
20
SPECIAL ISSUE 'ARCHITECTURE AND EPIDEMIOLOGY' Crop architecture and crop tolerance to fungal diseases and insect herbivory. Mechanisms to limit crop losses B. Ney & M. O. Bancal & P. Bancal & I. J. Bingham & J. Foulkes & D. Gouache & N. Paveley & J. Smith Accepted: 5 November 2012 / Published online: 17 November 2012 # KNPV 2012 Abstract Plant tolerance to biotic stresses (mostly limited here to fungal pathogens and insects) is the ability of a plant to maintain performance in the pres- ence of expressed disease or insect herbivory. It differs from resistance (the capacity to eliminate or limit pests and pathogens by genetic and molecular mechanisms) and avoidance (the ability to escape infection by epi- demics). The ways to tolerance of pests and diseases are multiple and expressed at different scales. The contribution of organs to the capture and use of resour- ces depends on canopy and root architecture, so the respective locations of disease and plant organs will have a strong effect on the crop’ s response. Similarly, tolerance is increased when the period of crop sensi- tivity lies outside the period within which the pest or pathogen is present. The ability of the plant to com- pensate for the reduced acquisition of resources by the production of new organs or by remobilization of reserves may also mitigate biotic stress effects. Numerous examples exist in the literature and are described in this article. Quantification of tolerance remains difficult because of: (i) the large number of potential mechanisms involved; (ii) different rates of development of plants, pests and pathogens; and (iii) various compensatory mechanisms. Modelling is, therefore, a valuable tool to quantify losses, but also to prioritize the processes involved. Keywords Diseases . Insects . Tolerance . Crop architecture . Modelling Definitions The term “tolerance” has been widely used in ecology, pathology and agronomy in order to define the strategy by which plants, populations or communities are able to limit damage when directly exposed to abiotic and biotic stresses (Beattie and Lindow 1995). The term “damage” Eur J Plant Pathol (2013) 135:561–580 DOI 10.1007/s10658-012-0125-z B. Ney (*) : M. O. Bancal AgroParisTech, UMR 1091 INRA-AgroParisTech Environnement et Grandes cultures, 78850 Thiverval-Grignon, France e-mail: [email protected] P. Bancal INRA, UMR 1091 INRA-AgroParisTech Environnement et Grandes cultures, 78850 Thiverval-Grignon, France I. J. Bingham Crop & Soil Systems Research Group, SRUC, West Mains Rd., Edinburgh, UK J. Foulkes Division of Plant and Crop Sciences, School of Biosciences, University of Nottingham, Sutton Bonington campus, Loughborough, UK LE12 5RD D. Gouache ARVALIS - Institut du Végétal, Service Génétique Physiologie et Protection des Plantes, IBP - Université Paris Sud, Rue de Noetzlin - Bât. 630, 91405 Orsay Cedex, France N. Paveley : J. Smith ADAS UK Ltd, Sustainable Crop Management, Rosemaund, Preston Wynne, Hereford, UK HR1 3PG
Transcript of Crop architecture and crop tolerance to fungal diseases and insect herbivory. Mechanisms to limit...

SPECIAL ISSUE 'ARCHITECTURE AND EPIDEMIOLOGY'
Crop architecture and crop tolerance to fungal diseasesand insect herbivory. Mechanisms to limit crop losses
B. Ney & M. O. Bancal & P. Bancal & I. J. Bingham &
J. Foulkes & D. Gouache & N. Paveley & J. Smith
Accepted: 5 November 2012 /Published online: 17 November 2012# KNPV 2012
Abstract Plant tolerance to biotic stresses (mostlylimited here to fungal pathogens and insects) is theability of a plant to maintain performance in the pres-ence of expressed disease or insect herbivory. It differsfrom resistance (the capacity to eliminate or limit pestsand pathogens by genetic and molecular mechanisms)
and avoidance (the ability to escape infection by epi-demics). The ways to tolerance of pests and diseasesare multiple and expressed at different scales. Thecontribution of organs to the capture and use of resour-ces depends on canopy and root architecture, so therespective locations of disease and plant organs willhave a strong effect on the crop’s response. Similarly,tolerance is increased when the period of crop sensi-tivity lies outside the period within which the pest orpathogen is present. The ability of the plant to com-pensate for the reduced acquisition of resources by theproduction of new organs or by remobilization ofreserves may also mitigate biotic stress effects.Numerous examples exist in the literature and aredescribed in this article. Quantification of toleranceremains difficult because of: (i) the large number ofpotential mechanisms involved; (ii) different rates ofdevelopment of plants, pests and pathogens; and (iii)various compensatory mechanisms. Modelling is,therefore, a valuable tool to quantify losses, but alsoto prioritize the processes involved.
Keywords Diseases . Insects . Tolerance . Croparchitecture . Modelling
Definitions
The term “tolerance” has been widely used in ecology,pathology and agronomy in order to define the strategyby which plants, populations or communities are able tolimit damagewhen directly exposed to abiotic and bioticstresses (Beattie and Lindow 1995). The term “damage”
Eur J Plant Pathol (2013) 135:561–580DOI 10.1007/s10658-012-0125-z
B. Ney (*) :M. O. BancalAgroParisTech, UMR 1091 INRA-AgroParisTechEnvironnement et Grandes cultures,78850 Thiverval-Grignon, Francee-mail: [email protected]
P. BancalINRA, UMR 1091 INRA-AgroParisTech Environnement etGrandes cultures,78850 Thiverval-Grignon, France
I. J. BinghamCrop & Soil Systems Research Group, SRUC,West Mains Rd.,Edinburgh, UK
J. FoulkesDivision of Plant and Crop Sciences, School of Biosciences,University of Nottingham,Sutton Bonington campus,Loughborough, UK LE12 5RD
D. GouacheARVALIS - Institut du Végétal, Service Génétique Physiologieet Protection des Plantes, IBP - Université Paris Sud,Rue de Noetzlin - Bât. 630,91405 Orsay Cedex, France
N. Paveley : J. SmithADAS UK Ltd, Sustainable Crop Management,Rosemaund, Preston Wynne,Hereford, UK HR1 3PG

means “injury” for many herbivory researchers but“yield loss” for others (Savary et al. 2006). Actually,tolerance is human- rather than plant-directed, and there-fore damage can refer to any plant, population or com-munity characteristic of interest. In many cases, thedamage against which tolerance is measured is loss ingrain yield, but tolerance in reference to ecologicalfitness or harvest quality could be emphasized as well,whatever measure of quality is used. Precise knowledgeabout what characteristic is damaged by stresses is nec-essary to identify the ways to tolerance.
However, the term “tolerance” has been used broadlyand this has resulted in many meanings (Schafer 1971).Maintaining multiple interpretations of the definition ofthe term has led to confusion in the literature and there isa need to clarify the situation, particularly in the case ofbiotic stresses. Within the plant pathology field, the termtolerance has often been used to mean resistance (Kluthand Varrelmann 2010; Aguado et al. 2010), reduction inrate of pathogen development (Gao et al. 1995; Musselland Malone 1979) and pathogen tolerance (Clarke1984). Foulkes et al. (2006) restricted the definition to“the ability to maintain yield performance despite thepresence of disease symptoms”, while more generaldefinitions were given by Oliver et al. (2009) statingthat “tolerance traits minimize fitness loss of the actorbut without reducing encounter rate” and Caldwell et al.(1958) who considered tolerance as a means by whichplants endure severe disease without severe losses inyield or quality.
The frontiers of tolerance with resistance andavoidance, both of which serve to reduce the incidenceor severity of attacks (Roy and Kirchner 2000), mightbe challenged. Indeed the ability of the host to accom-modate a pathogen with reduced symptoms is close toa form of resistance (the capacity of plants to eliminateor limit pests and pathogen infection by genetic andmolecular mechanisms). Similarly, a trait that limitsthe spread of a pest or pathogen within the canopy isregarded as an avoidance mechanism, but at the sametime it may confer tolerance of a given severity ofdisease or herbivory if the location of the pathogen orpest is confined to non-essential organs. Such restric-tions are in agreement with the definition that Schafer(1971) gave for tolerance as “the capacity of a cultivarresulting in less yield or quality loss relative to diseaseseverity or pathogen development when comparedwith other cultivars or crops”. This definition high-lights two important points: (i) in order to quantify
tolerance, a reference point must first be establishedagainst which other comparable plants or crops can bemeasured; and (ii) as restated by Clarke (1986) andRobb (2007), in the case of pathogens a distinctionmust be made between the tolerance of a host to thepathogen (i.e. the ability of the host to limit symptomexpression under similar levels of infection) and thetolerance of a host to the symptoms caused by thepathogen (i.e. the ability of a host to limit physiolog-ical disruption under similar levels of disease expres-sion). Both may coexist at the plant or the crop level.This distinction is critical especially when consideringbiotic injury which may not be expressed as visiblesymptoms, as in the case of certain viral infections(Robb 2007).
The definition of disease tolerance was further re-fined by Parker et al. (2004) who described it as “theheritable capacity of a crop to maintain productivitydespite the presence of disease”. These authors sug-gest that traits, which confer disease tolerance, areseparate from those which confer resistance and thusmay be manipulated independently (Roux et al. 2010).The literature also points out that environmental fac-tors and fitness costs associated with tolerance mayplay a role in tolerance expression in pathogen-plantinteractions, but this has been largely overlooked(Tiffin and Rausher 1999; Fornoni et al. 2004).
For herbivory, tolerance is defined as the ability aplant has to sustain a fixed amount of injury without acorresponding reduction in fitness (Mauricio et al.1997); it is classed as a compensatory capacity be-cause plant losses, rather than injury, are prevented.For viruses, Cooper and Jones (1983) defined toler-ance as the absence of symptoms or the occurrence ofonly small symptoms, and a little or no loss in vigouror yield of infected plants. Symptoms are not neces-sarily correlated with virus concentration. The authorsclearly separate resistance which involves decreasingvirus concentration by lowering multiplication and/orinvasion from tolerance which involves decreasingsymptoms at a given concentration of virus.
In this paper we define tolerance to biotic stresses(confined here mainly to fungal diseases and insectherbivory) as the ability of a plant or a crop to main-tain performance, fitness or a high quality characteris-tic in the presence of expressed symptoms (orsignificant concentration of virus), i.e. actual injuryor disease. Thus the determinants of its variabilitywithin a species may be considered as a means with
562 Eur J Plant Pathol (2013) 135:561–580

which to manage the effects of diseases and pests oncrop growth, yield and quality (Kover and Schaal2002). It is anticipated that tolerance will complement,rather than replace, resistance and avoidance traits.
The ways to tolerance are diverse. In some cases,the disease or pest may be located on plant organs thatare little involved in essential plant functions such asphotosynthesis. In other cases, compensations mayoccur by the production of new healthy organs orenhancement of plant functions (photosynthesis,nutrients or water uptake). Tolerance in that casemay relate to the capacity (or not) of the plant tomodify its architecture (the spatial arrangement of itsorgans). Tolerance may also arise from variation in thetime when disease or herbivory occurs. Some periodsof the crop growth cycle are not sensitive to attacks,because sensitive organs have not yet appeared.Remobilization of plant reserves may also buffer theplant against the effects of a decrease in nutrientacquisition and photo-assimilate production.Therefore, in many cases plant architecture, as theorganization of plant components in space, whichcan change with time (Godin et al. 1999), is involvedin tolerance. In this paper, we show, with some exam-ples, how plant architectural traits may be ways totolerance, and how modelling can be used to linkarchitectural traits to crop physiology and yield for-mation and thus help understand and quantifytolerance.
Overview of tolerance pathways to diseasesand other pests
Yield determination and disease occurrence
The physiological processes of yield formation mustbe briefly considered in order to determine at whichdevelopmental stages the crop is likely to tolerate theeffects of pathogens and pests. The decomposition ofthe yield into components has been successfully usedto examine the processes involved in abiotic and bioticstress. Many works (Gallagher et al. 1975; Gambı´n etal. 2006) have decomposed grain crop yield into twomain components: seed number m−2 (SN) and meanseed weight (MSW). Crop growth is related to theamount of intercepted photosynthetically active radia-tion (IPAR) and the efficiency (radiation use efficiencyRUE) with which the solar energy is converted into
dry matter (Reynolds et al. 2005; Bingham et al.2007a). Pathogens may reduce yield by limiting theformation of any of the yield components and themajority of crops fall short of achieving their yieldpotential (Spink et al. 2000; Sylvester-Bradley andWiseman 2005). Infected crops can become eithersource-limited (i.e. dry matter or nitrogen acquisitionis the limiting factor) or sink-limited (i.e. the storagecapacity of reproductive organs is less than the supplyof assimilate to fill them), depending on the environ-mental conditions (edaphic and/or agronomic). Formany crop species the storage capacity of the repro-ductive organs is a function of the number of seedsand their potential size. SN is generally closely corre-lated to the dry matter accumulated between emer-gence and flowering. It can be reduced either bydirect pest attacks or by photosynthate shortage duringsome critical periods that may lead to a dramaticdecrease of SN, because of uncompensated floretabortion (Fischer and Stockman 1980). In many pro-duction systems diseases and pests are then not onlyproblematic during rapid grain filling, but also duringthe critical period when SN is determined. MSW, onthe other hand, is often related to the rate of grainfilling as governed by post-flowering assimilate avail-ability. But here too there is evidence of sink-limitation as the carpel size and seed cell number,which may be genetically and environmentally depen-dant, set the storage capacity and thus potential seedsize (Munier-Jolain and Ney 1998; Bingham et al.2007b). Thus MSW may be reduced by disease orinsect pests not only through their effects on the avail-ability of assimilate for grain filling, but also earlierthrough the effects of reduced assimilate availabilityon carpel growth and seed number. In either case, theimpact of pathogens and pests on MSW may be ne-gated by the remobilization of previously accumulatedstorage reserves which can buffer a temporal lack ofassimilates.
In conclusion, candidate traits determining toler-ance will differ between pathosystems and will beinfluenced by whether the crop is source or sink lim-ited and the extent to which pests and diseases con-strain yield through crop dry matter source or sinkcomponents. Different crops will have different toler-ances to similar pests and improved disease and pestmanagement would be supported by a better knowl-edge of host × pest interactions at the crop level. Theprevious yield decomposition is helpful to estimate the
Eur J Plant Pathol (2013) 135:561–580 563
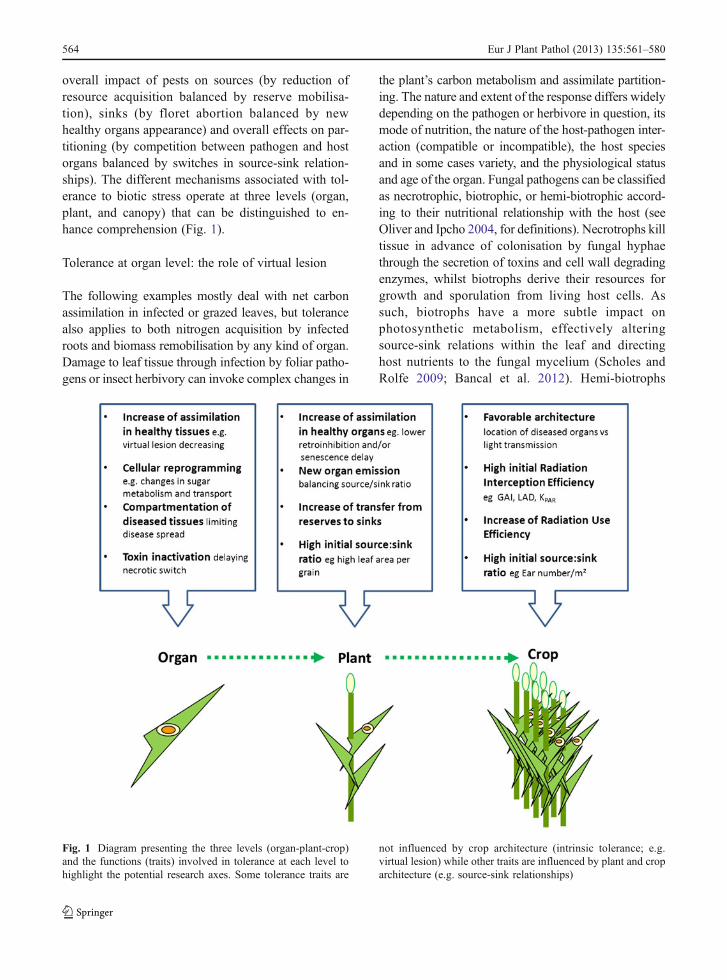
overall impact of pests on sources (by reduction ofresource acquisition balanced by reserve mobilisa-tion), sinks (by floret abortion balanced by newhealthy organs appearance) and overall effects on par-titioning (by competition between pathogen and hostorgans balanced by switches in source-sink relation-ships). The different mechanisms associated with tol-erance to biotic stress operate at three levels (organ,plant, and canopy) that can be distinguished to en-hance comprehension (Fig. 1).
Tolerance at organ level: the role of virtual lesion
The following examples mostly deal with net carbonassimilation in infected or grazed leaves, but tolerancealso applies to both nitrogen acquisition by infectedroots and biomass remobilisation by any kind of organ.Damage to leaf tissue through infection by foliar patho-gens or insect herbivory can invoke complex changes in
the plant’s carbon metabolism and assimilate partition-ing. The nature and extent of the response differs widelydepending on the pathogen or herbivore in question, itsmode of nutrition, the nature of the host-pathogen inter-action (compatible or incompatible), the host speciesand in some cases variety, and the physiological statusand age of the organ. Fungal pathogens can be classifiedas necrotrophic, biotrophic, or hemi-biotrophic accord-ing to their nutritional relationship with the host (seeOliver and Ipcho 2004, for definitions). Necrotrophs killtissue in advance of colonisation by fungal hyphaethrough the secretion of toxins and cell wall degradingenzymes, whilst biotrophs derive their resources forgrowth and sporulation from living host cells. Assuch, biotrophs have a more subtle impact onphotosynthetic metabolism, effectively alteringsource-sink relations within the leaf and directinghost nutrients to the fungal mycelium (Scholes andRolfe 2009; Bancal et al. 2012). Hemi-biotrophs
Fig. 1 Diagram presenting the three levels (organ-plant-crop)and the functions (traits) involved in tolerance at each level tohighlight the potential research axes. Some tolerance traits are
not influenced by crop architecture (intrinsic tolerance; e.g.virtual lesion) while other traits are influenced by plant and croparchitecture (e.g. source-sink relationships)
564 Eur J Plant Pathol (2013) 135:561–580

behave initially as biotrophs, but then subsequentlyswitch to a necrotrophic mode of nutrition.
When examined on a whole leaf basis, biotrophicand necrotrophic infection often leads to a reduction innet photosynthesis associated, to varying extents, withalterations in stomatal behaviour, chlorophyll concen-trations, perturbations in the light reactions of photo-synthesis and reductions in the amounts and activitiesof Benson-Calvin cycle enzymes. However, suchwhole leaf measurements mask considerable spatialand temporal heterogeneity in host response to infec-tion, which could influence the host’s apparent diseasetolerance when tolerance is defined as the ability tosustain growth in the presence of visible disease. Inprinciple low tolerance (relative intolerance) mightoccur where photosynthetic metabolism is disruptedor respiration increased before the appearance of vis-ible symptoms, or where these effects extend intoregions of green tissue beyond the visible lesion aftersymptoms develop. Conversely, increases in rates ofphotosynthesis in non-infected regions of infectedleaves in response to the loss of photosynthetic activ-ity elsewhere could result in the apparent tolerance ofdisease (Bingham et al. 2009).
It has been recognised for some years that the reduc-tion in rate of net photosynthesis in infected leavescannot always be explained quantitatively in terms ofthe area of visible lesions and the consequent loss ofgreen tissue (Martin 1986; Shtienberg 1992). Bastiaans(1991) developed the concept of the virtual lesion toaccount for the effects of disease in asymptomaticregions of infected leaves and the concept has beenwidely used for modelling the effects of foliar diseaseon canopy photosynthesis and crop growth (Bastiaansand Kropff 1993; Garry et al. 1998; Robert et al. 2004;Bingham and Topp 2009). A virtual lesion is the area ofthe leaf within which the photosynthetic rate is negligi-ble. A ratio of virtual lesion area to visible lesion area (βin Bastiaans’ model, Bastiaans 1993b) greater than 1.0implies that photosynthesis is inhibited in green tissuebeyond the visible lesion. Values of β ranging from 1.3to 12 have been reported for rust and powdery mildewinfected cereals (Rossing et al. 1992; Robert et al. 2005;2006), anthracnose infected bean (Phaseolus vulgaris)(Lopes and Berger 2001) or Ascochyta blight (causedby Mycosphaerella pinodes) infected pea (Pisum sati-vumL.) (Garry et al. 1998). For a given pathosystem, theβ value can also differ depending on either host age orlesion development. Altogether, it suggests wide
variation in the severity of inhibition within symptom-less regions. However, the literature is complicated asthe β value changes with the nature of the symptomassessed. Thus values were greatest when only the spor-ulating area of rust-infected wheat (Triticum aestivumL.) was included in the visible lesion and least whensporulating (Robert et al. 2005; 2006).
Chlorophyll fluorescence imaging allows the hetero-geneous effects of pathogen infection on photosyntheticmetabolism to be studied at a greater spatial resolutionthan is possible with gas exchange techniques (Scholesand Rolfe 2009; Rolfe and Scholes 2010). This ap-proach has provided direct confirmation that photosyn-thesis can be modified in symptomless regions distantfrom the visible lesion, but that the nature and temporaldynamics of the response can differ markedly betweenpathosystems. For example, in oat (Avena sativa) leavesinfected by the biotrophic pathogen Puccinia coronatathe causal agent of crown rust, there was a small-localised reduction in photochemical efficiency (ΦII)5 days after inoculation in regions associated with fun-gal mycelium and the development of visible symptoms(Scholes and Rol fe 1996) . However, non-photochemical energy dissipation (qN) was greatly re-duced across the symptomless regions compared to non-inoculated controls suggesting an increase in demandfor ATP within the leaf as a whole. Eight days afterinoculation, coinciding with sporulation of the patho-gen, ΦII was reduced and qN increased in symptomlessregions consistent with an inhibition of photosynthesisdistant from the visible lesion. In other examples, suchas Arabidopsis thaliana infected by the white blister rust(Albugo candida, a biotroph), effects on photosynthesiswere confined to invaded tissue (Chou et al. 2000).Similar contrasts in response have been reported fornecrotrophic and hemi-biotrophic pathosystems.Colletotrichum lindemuthianum (anthracnose) inhibitedphotosynthesis in regions between visible lesions inbeans (Meyer et al. 2001), whilst increases in photosyn-thesis have been observed in symptomless regions oftomato (Solanum lycopersicum) leaves infected byBotrytis cinerea (grey mould) and wheat leaves infectedby Mycospharerella graminicola (Septoria leaf blotch)(Berger et al. 2004; Scholes and Rolfe 2009).
Rolfe and Scholes (2010) also pointed out that inaddition to the lack of general rules regardingresponses within the same fungal nutritional group,no consistent response has been found with pathogentype (virus, bacteria or fungi). However in the case of
Eur J Plant Pathol (2013) 135:561–580 565

viral- and bacterial-plant interactions, an increased rateof photosynthesis at the transition between symptomsand green parts has often been shown, and attributedto an increased demand for energy reflecting a highmetabolic activity.
Leaf responses to insect herbivory are, in manyrespects, similar to those induced by fungal pathogens.Photosynthesis is often reduced to a greater extentthan would be predicted by the loss of green leaftissue, with rates in some regions of remaining healthytissue being impaired (Zangerl et al. 2002; Nabity etal. 2009; Tang et al. 2009). A number of mechanismsmay contribute to this depending on the type of feed-ing and nature and extent of damage incurred.Mechanisms include damage to vascular tissue andindirect effects on photosynthesis via alterations inleaf hydraulic properties, stomatal aperture, phloemloading and sucrose transport (Nabity et al. 2009). Inaddition, herbivory injury, or the perception of injury,can induce defence reactions which may include local-ised cell death from the release of autotoxic defencecompounds and a more general down-regulation ofphotosynthesis related gene expression (Nabity et al.2009; Tang et al. 2009). It has been suggested thatthere is a trade-off between photosynthetic metabolismand defence, with a down-regulation of photosynthesisfreeing up resources for use in defence reactions(Baldwin 2001; Tang et al. 2009). However, estimatesof the carbon requirement for synthesis of defencecompounds suggests that the demand is small, andthat the down-regulation of photosynthesis is a moregeneral programmed response to biotic stress (Foyer etal. 2007). The negative relationship between defenceand photosynthesis is consistent with observations onlocalised changes in photosynthetic metabolism inincompatible plant pathogen interactions. Duringrace-specific (Mla12) and broad spectrum (mlo) resis-tance of barley (Hordeum vulgare) to powdery mildew(Blumeria graminis), photosynthesis was reduced, notonly in cells subject to attempted penetration by thefungus, but also in surrounding cells (Swarbrick et al.2006). The reduction was associated with both local-ised cell death and altered source-sink relations andcarbon metabolism at the sites of resistance. There wasalso a down-regulation of Rubisco and chlorophyll a/bbinding protein genes. These adjustments support theview that there is a fitness “cost” associated with hostresistance to pathogens (Smedegaard-Petersen andTolstrup 1985; Swarbrick et al. 2006).
Modelling canopy photosynthesis of spring barley inresponse to foliar disease has highlighted the potentialimpact variation in the effects of infection on photosyn-thesis in symptomless regions of infected leaves mayhave on overall disease tolerance (Bingham and Topp2009). Within the range of parameter values selected,disease tolerance was more sensitive to variation in thevirtual lesion size than to changes in canopy architectureand area, suggesting that reducing the virtual lesion sizecould be a worthwhile target for improving diseasetolerance. However, in order to improve disease toler-ance through plant breeding, variation in the target traitsmust exist within the breeding population and breedersmust have the means to select for the traits either phe-notypically or genetically. To date few studies havequantified within-species variation in responses to path-ogen infection that could impact on the size of the virtuallesion. Nevertheless there are indications that some po-tentially useful intra-specific variation might exist.Zuckerman et al. (1997) reported a 3.5-fold increase inthe rate of photosynthesis in remaining green tissue ofspring wheat variety Miriam compared to variety Barkaifollowing infection by M. graminicola. This was asso-ciated with an apparently greater disease tolerance inMiriam and a smaller reduction in mean seed weight.Although winter wheat genotypes infected with rust(Puccinia recondita) did not differ in the rate of photo-synthesis expressed per unit of remaining green area, therate of disease-induced leaf senescence did vary whichcould conceivably influence disease tolerance (Spitterset al. 1990). Recently Ben Slimane et al. (2012) distin-guished in wheat leaves inoculated by four strains ofMycosphaerella graminicola, (i) the local senescencearound inoculation and (ii) the remote apical senescencelinked to the natural processes of nitrogen mobilisationduring grain filling. Apical senescence was not affectedin that case, but no investigation was made on othertissues. More generally, a systematic evaluation of thescale of intra-specific variation in leaf responses topathogen infection and herbivory is required to deter-mine whether these responses can be modified to im-prove disease and pest tolerance. This must include aconsideration not only of the rate of photosynthesis inthe remaining healthy tissue in damaged leaves, but alsoof the fate of the carbon assimilates produced. Plantfitness will only be sustained if export of assimilatescan be maintained from the damaged leaves tosupport the growth and reproductive yield of theplant as a whole.
566 Eur J Plant Pathol (2013) 135:561–580

Furthermore, the effect of disease on photosynthe-sis or yield is likely to also depend on environmentalor abiotic factors such as light and nitrogen nutrition(Scholes and Rolfe 2009; Robb 2007). Neither Robertet al. (2004) nor Carretero et al. (2011) have foundmuch variation in photosynthetic response of wheatleaves to rust with differing leaf nitrogen. In all casesthe estimated values of β were significantly greaterthan 1.0 indicating that photosynthesis was inhibitedbeyond the visible lesion, but there was no significanteffect of N treatment. Nevertheless Robert et al.(2004) showed that sporulation per unit of sporulatingarea was decreased in wheat leaves of plants managedat low N levels, suggesting that this aspect of damagemay depend on leaf nutrition.
Tolerance at plant level: compensation as a wayto tolerance
“Functional” compensation
With functional compensation the reduction in physi-ological function caused by disease or pests at onelocation in the plant is compensated for by an increaseof the same function at another location. A number ofstudies have considered adjustments in photosyntheticmetabolism in parts of the plant other than the infectedor damaged leaves. Increased rates of photosynthesisin healthy leaves of infected plants have been ob-served in several pathosystems (Ayres 1981;Williams and Ayres 1981; Roberts and Walters 1986;Rooney and Hoad 1989; Murray and Walters 1992).Similar effects have also been reported in response toinsect herbivory and mechanical defoliation (Tiffin2000; Macedo et al. 2006; Nabity et al. 2009). Theincreases are considered to compensate, at least inpart, for the loss of photosynthetic activity in infectedor wounded leaves and are often interpreted in termsof responses to changes in source-sink relations(Thomson et al. 2003). The magnitude of the responsediffers between studies and tends to be larger fordicotyledonous species than monocots (Bingham etal. 2009). It may also depend on the growth stage ofthe plant. Wheat plants inoculated with Septoria nodo-rum at the three leaves stage showed increased rates ofphotosynthesis in non-inoculated leaves, whereas asimilar treatment imposed when plants had six leavesdid not result in an increase (Rooney and Hoad 1989).The mechanisms underlying these differences are not
understood. It has been speculated that it may relate tovariation in the source-sink balance of the plant atdifferent growth stages and between monocots anddicots (Bingham et al. 2009). Plants whose rate ofphotosynthesis is restricted by feedback inhibitionfrom a low sink demand for carbon assimilates maybe able to up-regulate the rate rapidly in healthy leaveswhen photosynthetic activity elsewhere is reduced bypathogen infection or herbivory. There may be lessscope for making these adjustments if photosynthesisis already operating close to full capacity. Improvingtolerance by increasing the ability of plants to com-pensate through physiological adjustments in healthyleaves may be a more realistic target than seekingreductions in virtual lesion size in infected leaves.Modelling of canopy photosynthesis suggests that dis-ease tolerance of barley is sensitive to this trait(Bingham and Topp 2009). However, as was the casefor responses occurring within damaged leaves, atpresent very little is known about the extent ofwithin-species variation in the capacity for makingcompensatory adjustments in healthy leaves.
As a general trend, N-uptake is reduced in plantsinfected either in leaves or in roots. Root diseases havebeen studied far less intensively than foliar disease,but here too there is some evidence of compensatoryadjustments in host physiology. 15N labelling experi-ments have shown that in wheat plants infected withtake-all (Gaeumannomyces graminis) N-uptake perunit of root increased, although compensation wasnot complete and the same level of nutrition as healthyplants was not achieved (Schoeny et al. 2003).However, variation in the extent of this compensationwith either the genotype or the environment needsfurther investigation.
“Morphogenetic” compensation
Over the longer term, compensation in response to bioticstress has often been found to occur through variation inmorphogenesis, as is also the case for abiotic stresses.The response can sometimes result in an increase insource capacity because either shoot:root ratio or leafarea ratio increases. Moreover, the new leaves formedunder the biotic stress may also show a transient in-crease in photosynthetic capacity (Ayres 1991), in thesame way as adult leaves.
The emergence of new tillers or branches that over-come the carbon loss from disease or herbivory has also
Eur J Plant Pathol (2013) 135:561–580 567

been described as a compensatory response to foliar,stem or spike diseases and pests in natural (Strauss andAggrawal 1999) or cultivated species (Bastiaans andRoumen 1993; Rosenthal and Welter 1995). It is worth-while emphasising that the degree of compensationgreatly depends on the ability of the crop for morpho-genesis; that is to say, its developmental stage at the timethe disease or pest attack occurs (Ayres 1991; Bastiaans1993a). There are only a few documented cases ofmorphological adjustments in response to root diseases.In wheat infected by take-all, a disease-induced rootproduction was found to be dependant on the genotype,with a marked interaction with the inoculum load(Bailey et al. 2006). In a natural invasive plant species,Newingham et al. (2007) found, for the first time, a rapidnitrogen reallocation from attacked roots to shoots andconsidered this to be an efficient way to overcome rootherbivory and allow better regrowth. New roots with agreater uptake capacity for nitrogen or water have some-times been found in response to root diseases (Bailey etal. 2005; 2006) and may partly offset the rapid increaseshoot: root ratio caused by root parasites (Ayres et al.1996). This morphological adjustment is in contrast tothe increase in shoot: root ratio with foliar diseases(Ayres 1991).
In the case of attacks on reproductive organs byherbivores and pathogens, the loss of floral buds maybe compensated in a number of species by the growthof previously set meristems or dormant buds resultingin the emergence of new reproductive sinks (for re-view see Strauss and Aggrawal 1999; Ayres et al.1996). The mechanisms involved are associated withbroken apical dominance (Sadras 2000) and an alter-ation in source-sink ratio (Ayres et al. 1996). Theireffectiveness in compensating for damage caused bypests or pathogens will depend on whether competentmeristems are still available in plants for regrowth andwhether they have time to complete development andcontribute to yield (Ayres et al. 1996; Tiffin 2002).This capacity has been studied less in cultivated cropsthan in native vegetation although knowledge of ge-notypic or environmental variation in the capacity forcompensation in cultivated crop species would be of agreat use for selection of tolerance of stressful con-ditions (Pinet 2010). Based on the biology of cultivat-ed species, we may therefore hypothesize thatindeterminate crops will have a greater potential forcompensating for losses of reproductive organs thandeterminate ones.
Tolerance may be increased also when the period ofcrop sensitivity lies outside the period within which thepest is present. In potato (Solanum tuberosum) crops,early cultivars are able to partially avoid the negativeimpacts of disease on yield by completing a greaterfraction of the tuber filling period before the epidemicinduces premature canopy senescence. Tubers are initi-ated earlier and leaf growth continues for longer andthus, the period of tuber filling is extended. Therefore,early cultivars suffer less yield loss than late cultivarsunder similar disease pressure (Neth 1992).
The role of the reserves to buffer the loss of assimilates
Utilization of temporary storage reserves has also beenadvocated as a way of compensating for losses of carbonor nitrogen in plants attacked by pests and pathogens(Ayres et al. 1996; Gaunt and Wright 1992). However,Ben Slimane et al. (2009), mimicking the effect ofdisease/herbivory by cutting or masking leaf blades ofwheat during grain filling, found no indication for en-hancement of N-mobilisation in unaffected organs. Bycontrast, Serrago et al. (2011) have found that the kinet-ics of stem soluble carbohydrate (i.e. carbon reserve)utilization in wheat varied with fungicide treatment.Genetic variation in stem soluble carbohydrate reserveshas been reported in cereals which could influence theability of the variety to compensate for reductions inphotosynthesis during grain filling (Bingham et al.2009). Ayres et al. (1996) as well as Parker et al.(2004) also hypothesized that larger plant storagereserves could favour tolerance mostly when diseasedevelops late during grain filling. However Foulkes etal. (2006), comparing numerous genotypes, found anegative correlation between tolerance to Septoria leafblotch and stem reserves in wheat. This might haveoccurred because breeding for high-yield has led toshort-stem varieties with high numbers of grains togeth-er with high stem carbohydrate contents (Parker et al.2004). Interestingly these results point out that the con-tribution of stem reserves to tolerance can not be ana-lysed independently from information on the source-sink ratio, and particularly an understanding of how farthe availability of assimilate exceeds the assimilate re-quirement to grow the existing sinks to their potential.The extent and the rate at which compensatory adjust-ments occur depends largely on the specific interactionthe pest and pathogen develops with the host plant.Depending on the relative location and age of healthy
568 Eur J Plant Pathol (2013) 135:561–580
and diseased source leaves or roots, nutrients couldeither be redirected promptly towards existing organswith high activity or used more slowly to build newsource capacities. A reprogramming of primary metab-olism is often observed at the cellular scale to achievethese changes, and even if the precise metabolic changesdepend on the type of interaction, they often result inchanges in source-sink equilibrium and modifications tosugar metabolism and transport (Schwachtje andBaldwin 2008; Walters and McRoberts 2006). Assource-sink interplay is highly dependent on resourceavailability, it is to be expected that the extent to whichcompensation occurs will also be highly dependent onmultiple resource levels (Wise and Abrahamson 2005),although this has not been properly demonstrated as yet.However, it provides an analytical framework to revisitcompensatory adjustments in physiology and morphol-ogy for crops under fluctuating climatic and manage-ment conditions. As both organ nutrition and source-sink interplay are sensitive to plant architecture, theextent of compensation is likely to be in part driven bymodifications to plant and crop architecture.
Tolerance at canopy level
For many crops, the effects of aerial disease on yield areconsistent if accounted for via the effects on green areaindex (GAI, m2 green area m−2 ground), accumulatedlight interception, and the resulting dry matter accumu-lation and partitioning (Waggoner and Berger 1987;Bryson et al. 1997). In accordance with Beer’s law, theproportion of incident radiation intercepted by the can-opy is a function of both its size and architecture. A GAIof approximately 6 for wheat is required to intercept95% of the solar radiation, depending on the extinctioncoefficient k, which is largely determined by the postureof the leaves within the canopy. The intercepted solarradiation IPAR is related to the GAI by the Beer-Lambert law: IPAR 0 PARi (1-e–k GAI), with PARi asincident radiation. In modern wheat cultivars the distri-bution of green area results in 80% of the photosyntheticcapacity of the crop being attributed to the upper portionof the canopy (Sylvester-Bradley et al. 2012). As leavesdo not contribute equally to canopy photosynthesis,because they differ in area and do not receive the sameradiation, the vertical distribution of the disease betweenleaf layers (or injury for herbivory) has a major impacton crop growth for a given architecture. Conversely, forthe same vertical distribution of disease or herbivory,
variation in canopy architecture may confer relativelymore or less tolerance. Bancal et al. (2007) points outthat the impact of variation in canopy size depends onthe vertical distribution of disease on wheat. For peainfected by Mycosphaerella pinodes, Beasse et al.(2000) showed that both combined vertical distributionsof leaf area and of disease determine the impact ofdisease on growth. These authors developed a modelthat combines the decrease in rate of photosynthesis inthe leaves according to the vertical gradient of diseaseseverity and the differences in photosynthetic functionof the various layers of the canopy. They showed thatthe disease spread up the plant from the bottom to thetop of the canopy, eventually reaching the layers thatcontribute significantly to light absorption. Before thisparticular stage, the impact of disease on growthremained low, but it increased dramatically as diseasespread to the upper canopy. Thus, the same necrotic areahas a variable effect on crop growth depending on thelocation of disease within the canopy. In that case,canopy architecture, as governed by vertical leaf areadistribution, plays a determinant role in tolerance. Leafangle and shape may also have an influence. In cerealsfor instance, large, prostrate upper leaves equate tohigher extinction coefficient values because they blockpenetration of light to the basal leaves. Canopies whichhave a high extinction coefficient for PAR may confertolerance if disease is located low in the canopy becausea crop with this profile would be less sensitive to loss ofleaf tissue to disease or pests low in the canopy(Bingham and Newton 2009). Thickness of leaf alsoinfluences the transmission of radiation within the can-opy (Kramer et al. 1980) and will affect the extinctioncoefficient value.
For oilseed rape (Brassica napus), as in many cropspecies, yield is largely driven by the SN, which isdetermined by the survival of branches, flowers andyoung pods (Diepenbrock 2000). Pod survival is re-lated to the amount of intercepted PAR, during theflowering period (Leterme 1988). In this planophyllcrop, a GAI of 3–4 is sufficient to intercept the re-quired amount of solar radiation. Canopies which arelarger may paradoxically reduce the amount of inter-cepted light reaching green leaf and stem tissue be-cause the dense flower layer reflects a proportion oflight away from the canopy, and thus reduces thenumber of seeds set per pod. Therefore, damage toflowers caused by pests such as the pollen beetlegenerally has little impact on yield at the beginning
Eur J Plant Pathol (2013) 135:561–580 569

of flowering because light is reaching leaves andbranching can compensate losses. As the number ofseeds that are growing increases with time, less assim-ilate is available to new branches or flowers. Thus thecompensation capacity of the plant diminishes duringthe reproductive period. Yield losses depend on boththe intensity and the time of the attack. More determi-nate varieties (or higher sowing density) are theoreti-cally less tolerant of beetles, because of their poorercompensation capacity.
In the context of west European agriculture, severalmajor genetic changes in wheat plants over the lastthree decades have led to visible changes in canopyarchitecture, brought about by phenotypic selection.Flag leaves have become significantly smaller andculm leaves have become more erect. Foulkes et al.(2006) showed that a large flag leaf size was associat-ed with greater disease tolerance if the spread of foliardisease to the flag leaf could be avoided because, forfoliar diseases of wheat, the dominant effect appears tobe a reduction in post-anthesis radiation interception(Robert et al. 2004).
Quantification of tolerance
Techniques to measure tolerance
This section considers the challenges associated withmeasuring tolerance, in order to identify tolerantgermplasm and associate particular physiological traitswith tolerance. The key issues, their implications andpotential methods to address them are considered be-low in reference to fungal disease. Similar consider-ations must also be taken into account whenquantifying tolerance to insect pests.
Tolerance can be measured in both controlled envi-ronment and field experiments depending on theobjectives of the study. Controlled environment con-ditions would be especially useful to establish knowl-edge or test hypotheses concerning the mechanisms oftolerance and the potential contribution of selectedtraits, for instance a reduction in the virtual lesion sizeor increased capacity for compensation. Yet toleranceis likely to be the sum of multiple processes, whichinteract highly depending on the growth conditions;interactions and conditions that will be difficult toreproduce in controlled conditions. Many of the po-tential tolerance mechanisms discussed above operate
at the canopy/crop scale, rather than at the level of theindividual plant or organ. Hence, tolerance will usual-ly need to be quantified in field experiments, ratherthan in controlled environments. In controlled envi-ronments and to even greater extent in field experi-ments, it is almost impossible to obtain similar levelsof disease severity across a range of contrasting culti-vars or breeding lines, to allow a direct comparison oftolerance. Hence, it is necessary to quantify toleranceas the rate of change of yield (or other measure ofgrowth) per unit disease severity (or a surrogate forseverity). This requires a range of severities to beobtained on each cultivar or line, within an experi-ment. This could be obtained using various levels ofinoculation in controlled environment conditions, butin field trials, it is most reliably obtained by usingcontrasting doses of fungicide treatment. In the fieldit is difficult to generate the required gradient of dis-ease severity via inoculation because many factorsinfluence the development of disease. Realistically, itis often only possible to set up ‘high disease’ and ‘lowdisease’ treatments. Low disease may come from thebackground level at a relatively low disease-risk siteand high disease from additional inoculation. There isgreater flexibility for setting up a gradient of severitywhen the pathogen can be applied as a spore suspen-sion, but this often requires large quantities of inocu-lum and frequent applications and is, therefore,expensive and time-consuming. A much greater con-trast in severity can usually be achieved reliably bygrowing a crop at a high disease risk site and thencontrolling the epidemic by the application offungicides.
Avoiding bias with fungicide use
The use of fungicides, however, raises the issue ofwhether the fungicide treatment used might bias theresults, through direct effects of the active substanceon the physiology of the crop. For example in somebarley genotypes there is evidence of significant yieldresponses to fungicide application in the relative ab-sence of visible disease (Bingham et al. 2012). The useof non-systemic protectant fungicides largely over-comes the concern about direct physiological effects,but may not provide sufficiently effective disease con-trol. Where the use of systemic fungicides is required,the use of quinone outside inhibitors (QoI) and “newgeneration” succinate dehydrogenase inhibitors (SDHI)
570 Eur J Plant Pathol (2013) 135:561–580

with known physiological effects should be avoided.Some possibility of bias remains, but may not be ofpractical concern because the fungicide requirement ofa cultivar is primarily driven by the size of the differencebetween fungicide treated and untreated yields (Paveleyet al. 2008). Hence, if selection of breeding material isbased on measures of tolerance from comparisons oftreated/untreated yields, then the practical aim (reducedfungicide dependence) will be achieved.
Minimising genotype and environment interactions
Environmental variation can result in substantial ge-notype by environment interactions. If these interac-tions are of too large magnitude, this may indicate thatthe particular form of tolerance being tested may betoo unreliable to be of overall value, except perhapswithin genotypes adapted to a narrow range of envi-ronments. However, if the interactions are of interme-diate scale, the heritable variation within a set ofgermplasm may be sufficiently large to be of value,but difficult to identify through the “noise” created bythe interactions with environment.
Measurement of tolerance using percentage severityvalues (or integrals thereof) as the independent variable,is particularly prone to environmental variation, due tosite and seasonal variation in canopy size. AsWaggonerand Berger (1987) pointed out: “…neither the rate ofchange of x [dimensionless severity] nor the integral of xtell the size of the foliar factory, how long it operates orhow much insolation it absorbs.” Quantifying toleranceusing a surrogate for severity which is more closelyrelated to resource capture (e.g. post-anthesis healthyarea duration for wheat), reduces the environmental“noise” but precludes detection of some tolerance traits(e.g. if healthy area duration is used, tolerance operatingby reduced green area loss per unit symptom severitywould not be detected). Hence, the choice of the variableused to quantify tolerance is an important decision,which is discussed further by Bingham et al. (2009).
Efficient use of experimental resources
Because the range of variation found in a trait isrelated to the size of the population measured, it maybe necessary to quantify tolerance in large numbers ofcultivars or breeding lines in order to identify lineswhich express tolerance to a high degree. Also, if theaim is to enable genotypic selection, by identifying
QTL associated with tolerance (or the sub-traits whichdetermine tolerance), then more than 100 lines willneed to be phenotyped to enable QTL analysis.However, precise and accurate quantification of toler-ance is resource intensive, which limits the number ofcultivars/lines which can be screened.
A simple estimation of tolerance is obtained byregression analysis as the slope of a relationship ofyield on disease severity (or a surrogate for severity);but the relationship of disease to yield may be notlinear, and thus needing more coefficients that a singleslope. Nevertheless the following rationales still apply.The validity of the regression and the confidenceintervals on the coefficient will depend to a largeextent on the distribution and range of variation alongthe independent variable. A large range of variationcan be obtained by fungicide treated/untreated con-trasts, but unless the variation between replicate valuesis substantial, the independent variable will tend to beclustered at either end of the regression, making theanalysis less valid. Nevertheless, this approach hasbeen used successfully (Parker et al. 2004; Foulkeset al. 2006). Including intermediate fungicide dosesimproves the validity of the analysis and the confi-dence in the slope coefficient, but increases the num-ber of plots required to test each cultivar or line.Similarly, estimates of the slope coefficient will beincreased by taking more sequential assessments ofthe severity measure during the yield-forming period,to improve the calculation of the integral (for exampleof healthy area duration). However, the resources re-quired for assessments increase in proportion to thenumber of measurement dates, thus decreasing thegermplasm which can be assessed. Automation mayultimately resolve this issue, but current methods forassessing GAI by light interception or reflectance areinsensitive at GAI values above approximately five.Most crop species have GAI values higher than thisduring the yield forming period, in order to interceptmost of the available incident radiation. Finally, wherelarge numbers of treatments or genotypes are tested infield experiments, consideration needs to be given toaccounting for spatial variation by appropriate exper-imental designs, such as the inclusion of multiplereference cultivars within each replicate block, andaccounting for gradients in variables across the trialarea during analysis of variance.
One approach to reconcile the need to screen largenumbers of lines and the need for intensive
Eur J Plant Pathol (2013) 135:561–580 571
measurements could be to: (i) start by screening a widerange of germplasm, using minimal treatments andassessments, e.g. in controlled conditions; (ii) identifya small number of cultivars/mapping population lineswhich contrast most strongly for tolerance; (iii) usedetailed physiological measurements on the contrast-ing lines to identify key sub-traits associated tolerance;(iv) phenotype the key traits in experiments on 100+mapping population lines.
Models of diseased and pest-damaged crops
How modelling is useful to quantify damageand prioritize tolerance traits
Since correlations between traits on the one hand andtolerance on the other hand in experimental data setsmay be due to mechanistic links or autocorrelation(e.g. due to genetic linkage), more rapid progresscould be made by a combination of experimentationand mathematical modelling, to identify beneficialtrait combinations. Modelling appears to be a usefulapproach to quantify tolerance and compare varieties,and to virtually define ideotypes in different environ-mental conditions.
Overall, attempts to simulate tolerance have fo-cused mainly on carbon-based growth modelling, thusneglecting multiple stress interactions, either betweendifferent biotic stresses or between biotic and abioticstresses. As the impact of multiple stresses has longbeen shown to be non-additive (Johnson 1992; seereview of Atkinson and Urwin 2012), evaluating tol-erance by using models under a large range of con-ditions is required to avoid under- or over- estimatinglosses, and thus the contribution of particular traits totolerance. Several attempts to use models to investi-gate tolerance traits have been made (Beasse et al.2000; Parker et al. 2004; Bingham and Topp 2009;Carretero et al. 2010). The growth model of Beasse etal. (2000) for pea infected by Mycosphaerella pinodespreviously described has been used to compare sixcultivars with contrasting vertical distribution of leafarea (Le May et al. 2005). Growth and yield werefound to be very different among varieties and yearsdespite no significant differences for the relationshipbetween disease severity and photosynthesis (i.e. vir-tual lesion size) at the leaf scale. Growth was wellsimulated by the Beasse’s model for all genotypes andyears showing that the differences were only due to
the interplay between vertical distribution of leaf areaand of disease. These results suggest that for the samevertical distribution of disease, taller cultivars shouldbe more tolerant per se. It would have been interestingto couple this with the relation between vertical epi-demic distribution and canopy structure to optimisethe architecture (Le May et al. 2009).
Using a growth model, Bingham and Topp (2009)performed a sensitivity analysis to hierarchize thetraits most involved in disease tolerance of barley.Interestingly, little variation in tolerance was predictedwith disease severity, which suggests that traits iden-tified in one situation will still apply elsewhere. Thecapacity to increase the photosynthetic potential(Pmax) of healthy leaves in response to disease else-where on the plant and the size of the virtual lesion(inactivated area around disease symptoms, as definedin Bastiaans, (1993b)) in infected leaves had the great-est impact on tolerance. The size of the virtual lesion iswell known to vary among pathosystems; unfortunate-ly, there is little evidence in the literature for suchvariation under different environments within a givenpathosystem (see previous sections). On the otherhand, the interaction of virtual lesion size with diseasedistribution (uniform, intermediate or concentrated onthe lower leaf layers) impacted on tolerance, becauseof the non-linear relationship between photosynthesisand incoming radiation. The direct effect of canopyarchitecture on tolerance was balanced: high values ofboth GAI and the extinction coefficient k might in-crease disease tolerance, but might also lead to adecline in yield potential or excessive maintenancerespiration in the absence of disease. Indeed the strongimpact on tolerance of disease distribution may resultfrom architecture variations. Furthermore, erectophyllcanopies combined with top-distributed diseases, aswell as planophyll canopies combined with bottom-distributed diseases were identified as the best way toinsure increased tolerance (Bingham and Topp 2009;Carretero et al. 2010).
Many of the preceding models however did notconsider whole plant nutrition even though as notedabove the source-sink balance has often been shown tointerfere with tolerance. Others have used constantpartitioning coefficients for every sink, thus discardingby the way the compensatory potential of reserves.Recently Bancal et al. (2012) quantified the fungalsink competitiveness of Puccinia triticina with wheatgrain filling. In this case where a biotrophic foliar
572 Eur J Plant Pathol (2013) 135:561–580

pathogen does not invade vessels, the pathogen wasregarded as an additional sink transplanted into aplant. The authors thus enhanced an existing source-sink model (Bancal and Soltani 2002) with two sour-ces (photosynthesis and reserve hydrolysis) and twosinks (grain growth and reserve polymerization) byadding the fungal sink (spore production). This studypointed out that not only photosynthesis, but also sinkactivities and compensation for reductions in photo-synthesis by the reserve pool depended non-linearlyon the incoming radiation level. It suggests that dis-ease nutrition effects and tolerance are both modulatedby climate. In the case of tree-pest interactions or forpathogens invading vessels, models accounting forresistances to carbon fluxes should be used as pro-posed by Minchin and Lacointe (2005). They couldsimulate for example, the strong interactions that wereexperimentally found between tree architecture andsink strength in galling efficiency of cottonwoodaphids (Larson and Whitham 1997). Lastly, even theeffect of necrotrophic pathogens or herbivores, whichdecrease source capacity, but could not be consideredas additional sinks to plants, might be accounted forby such a modelling framework because of the non-linear interplay between the reduced sources and exist-ing plant sinks. Interestingly, growth and repartitionprocesses are affected by climatic conditions; there-fore any given crop suffering the same epidemic willdevelop differential damage depending on the weatherconditions. Combining long-term climatic recordswith simple wheat canopy models during grain filling,Bancal et al. (2010) suggested that up to 50% of thevariation in damage caused by late foliar pathogens islinked to weather. This will complicate any climate-free quantification of tolerance, e.g. for the geneticimprovement of tolerance. Conversely, one couldimagine a combination of cultivar choice and cropmanagement designed to escape the most sensitiveperiod in a given climatic area to maximize tolerance.
Short and long term reallocations of carbon have longbeen highlighted as a key process in tolerance to foliaror root herbivory. Models designed for evolutionarygoals, may well be adapted to crops and could openthe way to a better understanding of tolerance traits,providing they can be further linked to resource-basedcropmodels. Modifications of shoot:root ratios are oftenmentioned to predict plant compensation of damagecaused by foliar or root pests and pathogens (Matysseket al. 2005; Schwachtje et al. 2006; Newingham et al.
2007). The availability of dormant buds set by architec-ture also plays a key role in tolerance to herbivoryStrauss and Aggrawal (1999), Jullien et al. (2010) andLehtilä (2000) modelled compensatory regrowth bygradual activation of dormant buds following single orrepeated injury events. Seed production may compen-sate, or even over-compensate, for damage dependingon both the timing and the intensity of herbivory and onplant phenology. In the case of mutualism with myco-rhizal fungi, that develop relationships with plants thatmay derive from tolerance strategies (Oliver et al. 2009),Vannette and Hunter (2011) described the transitionbetween mutualism and parasitism as non-linearly relat-ed to nutrient limitations. Gayler et al. (2008) developeda dynamic model of carbon and nitrogen repartitionbetween growth and defence compounds. An importantoutput of their study was that growth has the priorityover defence in carbon allocation, but, is more sensitiveto nitrogen depletion, resulting in varying defence allo-cation patterns depending on age and environment.Finally, Atkinson and Urwin (2012) advisedly pointout examples where selecting for tolerance to one stressresulted in increased or decreased susceptibility to otherstresses, thus highlighting the need for modelling toler-ance to multiple stresses.
How modelling is useful to improve crop tolerance
Pursuing the objective of improving crop tolerancethrough the large diversity of crop functions discussedabove demands that two practical questions be an-swered. First of all, what crop functions will providethe highest and/or most consistent gain in tolerance?And secondly, what traits need to be observed to prop-erly select appropriate genotypes or cropping practices?This can be exemplified by work carried out by cropphysiologists and breeders concerning adaptation todrought stress, which we will briefly illustrate to intro-duce the equivalent approach that can be carried out fortolerance to wheat foliar diseases. Starting with a con-ceptual model of desirable crop functions in a givenstress context (Reynolds et al. 2007), the two questionsasked above were answered as follows. First of all, bothempirical data (Condon et al. 2004, Fig 3) and model-ling work (Condon et al. 2004, Fig 5) allowed for keytraits (namely transpiration) to be targeted to those envi-ronments where they will provide the appropriate re-sponse. Secondly, phenotyping for the desired cropfunctions was adapted to the different constraints
Eur J Plant Pathol (2013) 135:561–580 573

imposed by experimentation at different stages of re-search and breeding programmes (Reynolds et al. 2009).In the case of wheat foliar diseases, a simple conceptualapproach of tolerance is illustrated Fig. 2: it extends the‘Steps model’ proposed by Paveley et al. (2001) to linkfungicide dose to yield. This model design might still beimproved to describe the effects of diseases affectingsink as well as source and thereby enlarge its applica-bility to different situations. According to Fig. 2, at eachstep, genotypic variations around either a mean responsecurve or a curve from a reference genotype should offera way to quantify components of tolerance.Mechanismsconcerning steps 3 to 5, from green area to interceptedradiation (IPAR) to crop growth and finally to yield havebeen discussed extensively above. The first two stepsare relatively less well characterized, but existing rela-tions between fungal biomass and symptoms (Fraaije etal. 2001; Gouache et al. 2011) and symptom area andgreen area (Robert et al. 2004) have been reported. The‘Steps model’ can also be used to integrate the differenttolerance mechanisms making it possible to properlydeploy them. This is illustrated with steps 3 to 5. Ashas been stated many times above, yield loss can belinked to symptoms through effects on reducing the lifetime of green area, which can be accounted for using the
inflexion point of GAI (Gooding et al. 2000) or theintegral of green LAI during grain filling (usuallydesigned as LAD (leaf area duration), Bancal et al.2009). Integrating over steps 3 to 5, it is possible tocompare varieties that exhibit different LAD to yieldrelations (Gate et al. 2006). As the “Steps model” illus-trates however, the first step for yield building, linkingGAI to radiation interception, is curvilinear. Hence, it isconceptually simple to state that the slope of GAI toyield is greater at low GAI. The consequence is thattolerance will be greater at high GAI (or LAD) valuesthan at low values of disease-free crops. Ranking oftolerance between cultivars may thus vary as a functionof the magnitude of LAD. Figure 3 indicates how gen-otypes may show a varying level of tolerance, depend-ing on the LAD that can be reached in a specificenvironment. Obviously the genotypes exhibit the sametolerance level once the plateau value for LAD isreached, regardless of differences in both LAD and yieldpotential among them. Yet there is no reason that everygenotype, (i) reaches the yield plateau at the same LADlevel and (ii) declines its yield according to LAD fol-lowing the same slope. In the example given, the geno-type 1 needs a greater LAD than genotype 2 to reach itsyield potential. Thus, at intermediate LAD, genotype 2
Fig. 2 Different steps to ac-count for tolerance compo-nents modified from Paveleyet al. (2001). Yield in a dis-eased plant is achievedthrough five successivesteps, each of them exhibit-ing tolerant or intolerantbehaviors
574 Eur J Plant Pathol (2013) 135:561–580

exhibits a lower slope, i.e. a higher tolerance (andin the example a higher yield), whereas genotype1 shows the highest yield potential at high LAD.Variations in the slope may represent a simple wayto characterize tolerance of genotypes to bioticstresses at a given level of LAD.
When evaluating the impact on tolerance of ob-served genotypic variability at a given step, the ‘Stepmodel’ can thus account for the expected GAI/LADrange in non-diseased crops, and allow the impact ofthe trait to be properly evaluated. This may provide afirst approach to rapidly screen cultivars. However, asit integrates many steps, a limit of the approach maybe to miss out on underlying genotypic variation atone step that is compensated at another. Another in-teresting point in using the overall LAD to yieldresponse of cultivars is that the effects of otherstresses, such as nitrogen or drought, on yield are alsomediated (at least partly) through GAI. Consequently,tolerance mechanisms identified in this manner maybe of wider use than sole tolerance to foliar pathogens.
Selecting traits as targets for improving tolerancealso needs to account for correlations between traits.For example, Arraiano et al. (2009) showed that leaflength, canopy height and leaf prostrateness exhibitedcorrelations in a set of 226 cultivars and breedinglines. Modelling may help to characterize the effectsof individual traits, all other parameters being equal,and thus aid in prioritizing targets. Empirical data and
modelling are in this case highly complementary.Finally, targeted traits may also have a strong influ-ence on other crop functions: for example, traits influ-encing canopy light interception discussed above arealso targeted to improve yields of healthy crops (Longet al. 2006; Parry et al. 2011), and may also influencedisease progress (Lovell et al. 1997). Again, model-ling may be used to analyze trait modifications onmultiple criteria (Robert et al. 2010) and analyze po-tential trade-offs or synergies.
Conclusion
Tolerance is a particularly desirable characteristic whenpreventive measures against disease and pests are inac-cessible or inefficient, which is increasingly the case.European pesticide legislation is continuing to reducethe possibilities of using fungicides and insecticides.Host plant resistance, although a key solution, is not asadaptable as the use of pesticides: once a variety issown, the pest populations and disease epidemics towhich the crop will be sensitive is set. For example,when choosing a disease resistant variety, the mostfrequently damaging disease is generally targeted.However, this may not be the actual disease(s) thatdevelops during the growing season. Pathogen popula-tion shifts may be responsible (Goyeau et al. 2011; deVallavieille-Pope et al. 2012), as well as climate vari-ability (for instance the dramatic and unexpected brownrust epidemic in northwest Europe in 2007 as reportedby West et al. 2012). Thus, tolerance provides a usefuland complementary approach to resistance, especiallyto deal with the variability inherent to disease epi-demics and pest populations. This may be all themore important under a changing climate (Shaw andOsborne 2011). Moreover, Espinosa and Fornoni(2006) have also shown that host tolerance has noeffect on the performance of enemies, and could thusavoid coadaptation of pests to hosts; however theseauthors also pointed out that the expression of toler-ance may depend either on the inoculum load or thegenotype × environment.
Simulation models that attempt to predict theeffects of damage on crop growth provide a powerfultool to evaluate potential tolerance traits. Advances inthe understanding of plant pest and pathogen interac-tions are required to combine the main processes in-volved in tolerance expression.
Fig. 3 Yield as a function of LAD after ear emergence for 2hypothetical cereal genotypes: tolerance is greater when theslope of the LAD-yield is flatter, thus tolerance depends on therange of attainable LAD in various environments
Eur J Plant Pathol (2013) 135:561–580 575
Acknowledgments Work on tolerance carried out by MOBancal, P Bancal and D Gouache is supported by the FrenchMinistry of Agriculture through a “Contrat de Branche” grant. IJBingham thanks Dale Walters (SRUC) for valuable discussions.SRUC receives financial support from the Scottish Govern-ment’s Rural Environment Science & Analytical Services Divi-sion (RESAS).
References
Aguado, A., De Los Santos, B., Gamane, D., Garcıá del Moral,L. F., & Romero, F. (2010). Gene effects for cotton-fibertraits in cotton plant (Gossypium hirsutum L.) underVerticillium conditions. Field Crops Research, 116, 209–217.
Arraiano, L. S., Balaamb, N., Fenwickc, P. M., Chapman, C.,Feuerhelm, D., Howell, P., et al. (2009). Contributions ofdisease resistance and escape to the control of Septoriatritici blotch of wheat. Plant Pathology, 58, 910–922.
Atkinson, N. J., & Urwin, P. E. (2012). The interaction of plantbiotic and abiotic stresses: from genes to the field. Journalof Experimental Botany Darwin Review. doi:10.1093/jxb/ers100.
Ayres, P. G. (1981). Powdery mildew stimulates photosynthesisin uninfected leaves of pea plants. PhytopathologischeZeitschrift, 100, 312–318.
Ayres, P G. (1991). Growth responses induced by pathogens andother stresses. In Mooney, H.A., Winner, W.E. & Pell E.J.(Eds.), Response of plants to multiple stresses (pp. 227–248). Academic Press Inc.
Ayres, P. G., Press, C. M., & Spencer-Phillips, P. T. N. (1996).Effects of Pathogens and parasitic plants on source-sinkrelationships. In E. Zamski & A. A. Schaffer (Eds.),Photoassimilate distribution in plants and crops: Source-sink relationships (pp. 479–499). New York: M. DekkerInc.
Bailey, D. J., Paveley, N., Pillinger, C., Foulkes, M. J., Spink, J.,& Gilligan, C. A. (2005). Epidemiology and chemicalcontrol of take-all on seminal and adventitious roots ofwheat. Phytopathology, 95, 62–68.
Bailey, D. J., Kleczkowski, A., & Gilligan, C. A. (2006). Anepidemiological analysis of the role of diseased-inducedroot growth in differential response of two cultivars ofwinter wheat to infection by Gaeumannomyces graminisvar. tritici. Phytopathology, 96, 510–516.
Baldwin, I. T. (2001). An ecologically motivated analysis ofplant-herbivore interactions in native tobacco. PlantPhysiology, 127, 1449–1458.
Bancal, P., & Soltani, F. (2002). Source-sink partitioning. Do weneed Munch? Journal of Experimental Botany, 53, 1919–1928.
Bancal, M.-O., Robert, C., & Ney, B. (2007). Modelling wheatgrowth and yield losses from late epidemics of foliar dis-eases using loss of green leaf area per layer and pre-anthesis reserves. Annals of Botany, 100, 777–789.
Bancal, M.-O., Bancal, P., Ben Slimane, R., Gate, P., &Gouache, D. (2009). Tolérance du Blé à la septoriose. In9ème Conférence Internationale sur les Maladies desPlantes (pp. 339–346). Tours: AFPP.
Bancal, P., Gouache, D., Soulard, T. & Bancal, M-O. (2010). Ageneral cultivar tolerance to stresses and its modeling in thecase of wheat affected by STB (Septoria tritici). In Wery,J., Shili-Touzi, I. & Perrin, A. (Eds.), Proceedings ofAgro2010 - the XIth ESA Congress (pp. 101–102).Agropolis International Editions, Montpellier, France.
Bancal, M.-O., Hansart, A., Sache, I., & Bancal, P. (2012).Modeling fungal sink competitiveness with grains forassimilates in wheat infected by a biotrophic pathogen.Annals of Botany, 110, 113–123.
Bastiaans, L. (1991). The ratio between virtual and visual lesionsize as a measure to describe reduction in leaf photosynthesisof rice due to leaf blast. Phytopathology, 81, 611–615.
Bastiaans, L. (1993a). Effects of leaf blast on growth and pro-duction of a rice crop. 1. Determining the mechanism ofyield reduction. Netherlands Journal of Plant Pathology,99, 323–334.
Bastiaans, L. (1993b). Effects of leaf blast on photosynthesis ofrice. 1. Leaf photosynthesis. European Journal of PlantPathology, 99, 197–203.
Bastiaans, L., & Kropff, M. J. (1993). Effects of leaf blast onphotosynthesis of rice. 2. Canopy photosynthesis.Netherlands Journal of Plant Pathology, 99, 205–217.
Bastiaans, L., & Roumen, E. C. (1993). Effect on leaf photo-synthetic rate by leaf blast for rice cultivars with differenttypes and levels of resistance. Euphytica, 66, 81–87.
Beasse, C., Ney, B., & Tivoli, B. (2000). A simple model of pea(Pisum sativum L.) growth affected by Mycosphaerellapinodes. Plant Pathology, 49, 187–200.
Beattie, G., & Lindow, S. E. (1995). The secret life of foliarbacterial pathogens on leaves. Annual Review ofPhytopathology, 33, 145–172.
Ben Slimane, R., Bancal, P., & Bancal, M.-O. (2009).Regulation of grain N accumulation in wheat. In F.Feldman, D. V. Alford, & C. Furk (Eds.), Crop plantresistance to biotic and abiotic factors (pp 198–208).Braunschweig: Deutsche Phytomedezinische Gesellschaft.
Ben Slimane, R., Bancal, P., Suffert, F., & Bancal, M.-O.(2012). Localized septoria leaf blotch lesions in winterwheat flag leaf do not accelerate apical senescence duringthe necrotrophic stage. Journal of Plant Pathology, 1.doi:10.4454/JPP.FA.2012.055.
Berger, S., Papadopoulos, M., Schreiber, U., Kaiser, W., &Roitsch, T. (2004). Complex regulation of gene expression,photosynthesis and sugar levels by pathogen infection intomato. Physiologia Plantarum, 122, 419–428.
Bingham, I. J., & Newton, A. C. (2009). Crop tolerance of foliarpathogens: possible mechanisms and potential for exploi-tation. In D. R. Walters (Ed.), Disease Control in Crops.Biological and Environmentally Friendly Approaches (pp.142–161). Oxford: Wiley-Blackwell.
Bingham, I. J., & Topp, C. F. E. (2009). Potential contribution ofselected canopy traits to the tolerance of foliar disease byspring barley. Plant Pathology, 58, 1010–1020.
Bingham, I. J., Blake, J., Foulkes, M. J., & Spink, J. (2007a). Isbarley yield in the UK sink limited? I. Post-anthesis radi-ation interception, radiation use efficiency and source-sinkbalance. Field Crops Research, 101, 198–211.
Bingham, I. J., Blake, J., Foulkes, M. J., & Spink, J. (2007b). Isbarley yield in the UK sink limited? II. Factors affectingpotential grain size. Field Crops Research, 101, 212–220.
576 Eur J Plant Pathol (2013) 135:561–580

Bingham, I. J., Walters, D. R., Foulkes, M. J., & Paveley, N. D.(2009). Crop traits and the tolerance of wheat and barley tofoliar disease. Annals of Applied Biology, 154, 159–173.
Bingham, I.J., Hoad, S.P, Thomas W.T.B. & Newton A.C.(2012). Yield response to fungicide of spring barley geno-types differing in disease susceptibility and canopy struc-ture. Field Crops Research (in press).
Bryson, R. J., Paveley, N. D., Clark, W. S., Sylvester-Bradley,R., & Scott, R. K. (1997). Use of in-field measurements ofgreen leaf area and incident radiation to estimate the effectsof yellow rust epidemics on the yield of winter wheat.European Journal of Agronomy, 7, 53–62.
Caldwell, R. M., Schafer, J. F., Compton, L. E., & Patterson, F. L.(1958). Tolerance to cereal leaf rusts. Science, 128, 714–715.
Carretero, R., Serrago, R., Bancal, M.-O., Perello, A. E., &Miralles, D. J. (2010). Absorbed radiation and radiationuse efficiency as affected by foliar diseases in relation totheir vertical position into the canopy in wheat. Field CropsResearch, 116, 184–195.
Carretero, R., Bancal, M.-O., & Miralles, D. J. (2011). Effect ofleaf rust (Puccinia triticina) on photosynthesis and relatedprocesses of leaves in wheat crops grown at two contrast-ing sites and with different nitrogen levels. EuropeanJournal of Agronomy, 35, 237–246.
Chou, H. M., Bundock, N., Rolfe, S. A., & Scholes, J. D.(2000). Infection of Arabidopsis thaliana leaves withAlbugo candida (white blister rust) causes a reprogram-ming of host metabolism. Molecular Plant Pathology, 1,99–113.
Clarke, D. D. (1984). Tolerance of parasitic infection in plants.In R. K. S. Wood & G. J. Jellis (Eds.), Plant diseases:infection damage and loss. Oxford, UK: BlackwellScientific.
Clarke, D. D. (1986). Tolerance of parasites and disease inplants and its significance in host-parasite interactions.Advances in Plant Pathology, 5, 161–197.
Condon, A., Richards, R., Rebetzke, G., & Farquhar, G. (2004).Breeding for high water-use efficiency. Journal ofExperimental Botany, 55, 2447–2460.
Cooper, J. I., & Jones, A. T. (1983). Responses of plants toviruses: proposals for the use of terms. Phytopathology, 73,127–128.
De Vallavieille-Pope, C., Ali, S., Leconte, M., Enjalbert, J., Delos,M., & Rouzet, J. (2012). Virulence dynamics and regionalstructuring of Puccinia striiformis f. sp. tritici in Francebetween 1984 and 2009. Plant Disease, 96, 131–140.
Diepenbrock, W. (2000). Yield analysis of winter oilseed rape(Brassica napus L.): a review. Field Crops Research, 67,35–49.
Espinosa, E. G., & Fornoni, J. (2006). Host tolerance does notimpose selection on natural enemies. New Phytologist, 170,609–614.
Fischer, R. A., & Stockman, Y. M. (1980). Kernel number perspike in wheat (Triticum aestivum L.): Responses to prean-thesis shading. Australian Journal of Plant Physiology, 7,169–180.
Fornoni, J., Nunez-Farfan, J., Luis Valverde, P., & Rauscher,M.D.(2004). Evolution of mixed strategies of plant defense allo-cation against natural enemies. Evolution, 58, 1685–1995.
Foulkes, M. J., Paveley, N. D., Worland, A., Welham, S. J.,Thomas, J., & Snape, J. W. (2006). Major genetic changes
in wheat with potential to affect disease tolerance.Phytopathology, 96, 680–688.
Foyer, C. H., Noctor, G., & van Emden, H. F. (2007). Anevaluation of the costs of making specific secondarymetabolites: does that yield penalty incurred by host plantresistance to insects result from competition for resources?International Journal of Pest Management, 53, 175–182.
Fraaije, B. A., Lovell, D. J., Coelho, J. M., Baldwin, S., &Hollomon, D. W. (2001). PCR-based assays to assesswheat varietal resistance to blotch (Septoria tritici andStagonospora nodorum) and rust (Puccinia striiformisand Puccinia recondita) diseases. European Journal ofPlant Pathology, 107, 905–917.
Gallagher, J. N., Briscoe, P. V., & Hunter, B. (1975). Effects ofdrought on grain growth. Nature, 264, 541–542.
Gambín, B. L., Borrás, L., & Otegui, M. E. (2006). Source-sinkrelations and kernel weight differences in maize temperatehybrids. Field Crops Research, 95, 316–326.
Gao, H., Beckman, C. H., & Mueller, W. C. (1995). The nature oftolerance to Fusarium oxysporum f. sp. lycopersici in poly-genically field-resistant marglobe tomato plants.Physiological and Molecular Plant Pathology, 46, 401–412.
Garry, G., Jeuffroy, M.-H., Ney, B., & Tivoli, B. (1998).Photosynthesis of leaves of pea (Pisum sativum L.) infectedbyMycosphaerella pinodes. Plant Pathology, 47, 473–479.
Gate, P., Gouache, D., Robert, C., Bancal, M.-O., Lannou, C., &Ney, B. (2006).What plant variable to account for loss dueto septoria leaf blotch in winter wheat? In 8èmeConférence Internationale sur les Maladies des Plantes(pp. 348–358). Tours, France: AFPP.
Gaunt, R. E., & Wright, A. C. (1992). Disease yield relation-ships in barley. II. Continuation of stored stem reserves tograin filling. Plant Pathology, 41, 688–701.
Gayler, S., Grams, T. E. E., Heller, W., Treutter, D., & Priesack,E. (2008). A dynamical model of environmental effects onallocation to carbon-based secondary compounds in juve-nile trees. Annals of Botany, 101, 1089–1098.
Godin, C., Costes, E., & Sinoquet, H. (1999). A method fordescribing plant architecture which integrates topology andgeometry. Annals of Botany, 84, 343–357.
Gooding, M. J., Dimmock, J. P. R. E., France, J., & Jones, S. A.(2000). Green leaf area decline of wheat flag leaves: theinfluence of fungicides and relationships with mean grainweight and grain yield. Annals of Applied Biology, 136,77–84.
Gouache, R., Thepot, S., Roisin-Fichter, C., & Selim, S. (2011).Exploring quantitative relationships between mycelialgrowth and visual symptoms of Septoria tritici. In E.Duveiller & P. K. Singh (Eds.), 8th InternationalSymposium on Mycosphaerella and Stagonospora diseasesof cereals (p. 77). Mexico City: CIMMYT.
Goyeau, H., Berder, J., Czerepak, C., Gautier, A., Lanen, C., &Lannou, C. (2011). Low diversity and fast evolution in thepopulation of Puccinia triticina causing durum wheat leafrust in France from 1999 to 2009, as revealed by anadapted differential set. Plant Pathology, 61, 761–772.
Johnson, K. B. (1992). Evaluation of a mechanistic model thatdescribes potato crop losses caused by multiple pests.Phytopathology, 82, 363–369.
Jullien, A., Mathieu, A., Allirand, J.-M., Pinet, A., de Reffye, P.,Cournede, P.-H., et al. (2010). Characterization of the
Eur J Plant Pathol (2013) 135:561–580 577

interactions between architecture and source-sink relation-ships in winter oilseed rape (Brassica napus) using theGreenLab model. Annals of Botany, 107, 765–779.
Kluth, C., & Varrelmann, M. (2010). Maize genotype suscepti-bility to Rhizoctonia solani and its effect on sugar beet croprotations. Crop Protection, 29, 230–238.
Kover, P. X., & Schaal, B. (2002). Genetic variation for diseaseresistance and tolerance among Arabidopsis thaliana acces-sions. Proceedings of the National Academy of Sciences ofthe United States of America, 99, 11270–11274.
Kramer, T., Gildemacher, B. H., van der Ster, M., & Parlevliet,J. E. (1980). Tolerance of spring barley cultivars to leafrust. Euphytica, 29, 209–216.
Larson, K. C., & Whitham, T. G. (1997). Competition betweengall aphids and natural plant sinks: plant architectureaffects resistance to galling. Oecologia, 109, 575–582.
Le May, C., Schoeny, A., Tivoli, B., & Ney, B. (2005).Improvement and validation of a pea crop growth modelto simulate the growth of cultivars infected with Ascochytablight (Mycosphaerella pinodes). European Journal ofPlant Pathology, 112, 1–12.
Le May, C., Ney, B., Lemarchand, E., Schoeny, A., & Tivoli, B.(2009). Effect of pea plant architecture on spatiotemporalepidemic development of ascochyta blight (Mycosphaerellapinodes) in the field. Plant Pathology, 58, 332–343.
Lehtilä, K. (2000). Modelling compensatory regrowth with buddormancy and gradual activation of buds. EvolutionaryEcology, 14, 315–330.
Leterme, P. (1988). Modélisation du fonctionnement du peuple-ment de colza d’hiver en fin de cycle: Elaboration descomposantes finales du rendement. In Colza: Physiologieet Elaboration du Rendement (pp. 124–129). Paris: INRA/CETIOM.
Long, S. P., Zhu, X.-G., Naidu, S. L., & Ort, D. R. (2006). Canimprovement in photosynthesis increase crop yields?Plant, Cell & Environment, 29, 315–330.
Lopes, D. B., & Berger, R. D. (2001). The effects of rust andanthracnose on the photosynthetic competence of diseasedbean leaves. Phytopathology, 91, 212–220.
Lovell, D., Parker, J. S. R., Hunter, T., Royle, D. J., & Cooker, R.R. (1997). Influence of crop growth and structure on the riskof epidemics by Mycosphaerella graminicola (Septoria tri-tici) in winter wheat. Plant Pathology, 46, 126–138.
Macedo, T. B., Peterson, R. K. D., & Weaver, D. K. (2006).Photosynthetic responses of wheat, Tritcum aestivum L.,plants to simulated insect defoliation during vegetativegrowth and at grain fill. Environmental Entomology, 35,1702–1709.
Martin, P. J. (1986). Gaseous exchange studies of barley leavesinfected with Rhynchosporium secalis (Oudem) J.J. Davis.Physiological and Molecular Plant Pathology, 28, 3–14.
Matyssek, R., Agerer, R., Ernst, D., Munch, J.-C., Oßwald, W.,Pretzsch, H., et al. (2005). The plant’s capacity in regulat-ing resource demand. Plant Biology, 7, 560–580.
Mauricio, R., Rauscher, M. D., & Burdick, D. S. (1997). Variationin the defense strategies of plants: Are resistance and toler-ance mutually exclusive? Ecology, 78, 1301–1311.
Meyer, S., Saccardt, A. K., Rizza, F., & Gentry, B. (2001).Inhibition of photosynthesis by Colletotrichum lindemu-thianum in bean determined by chlorophyll fluorescenceimaging. Plant, Cell & Environment, 24, 947–955.
Minchin, P. E. H., & Lacointe, A. (2005). New understanding onphloem physiology and possible consequences for model-ling long-distance carbon transport. New Phytologist, 116,771–779.
Munier-Jolain, N. G., & Ney, B. (1998). Analysis of seedgrowth rate for different species of grain legumes. II -Cotyledon cell number and seed growth rate in Pea(Pisum sativum L.). Journal of Experimental Botany, 49,1971–1976.
Murray, D., & Walters, D. R. (1992). Increased photosynthesisand resistance to rust infection in upper, uninfected leavesof rusted broad bean (Vicia faba L.). New Phytologist, 120,235–242.
Mussell, H. W., & Malone, M. J. (1979). Disease tolerance:reducing the impact of disease-induced stress on cropyields. In H. Mussel, R. C. Staples, & B. Thompson(Eds.), Stress physiology in crop plants (pp. 15–23). NewYork: John Wiley & Sons.
Nabity, P. D., Zavala, J. A., & DeLucia, E. H. (2009). Indirectsuppression of photosynthesis on individual leaves by ar-thropod herbivory. Annals of Botany, 103, 655–663.
Neth, J. (1992). Evaluation of breeding strategies for resistanceand tolerance to late blight in potato by means of simula-tion. Plant Pathology, 98, 3–11.
Newingham, B. A., Callaway, R. M., & BassiriRad, H. (2007).Allocating nitrogen away from a herbivore: a novel com-pensatory response to root herbivory. Oecologia, 153, 913–920.
Oliver, P. R., & Ipcho, S. V. S. (2004). Arabidopsis pathologybreathes new life into the necrotrophs-vs.-biotrophs classi-fication of fungal pathogens. Molecular Plant Pathology,5, 347–352.
Oliver, T. H., Leather, S. R., & Cook, J. M. (2009). Tolerancetraits and the stability of mutualism. Oikos, 118, 346–352.
Parker, S. R., Welham, S., Paveley, N. D., Foulkes, J., & Scott,R. K. (2004). Tolerance of septoria leaf blotch in winterwheat. Plant Pathology, 53, 1–10.
Parry, M., Reynolds, M., Salvucci, M., Raines, C. A., Andralojc,P. J., Zhu, X. G., et al. (2011). Raising yield potential ofwheat. II. Increasing photosynthetic capacity and efficien-cy. Journal of Experimental Botany, 62, 453–467.
Paveley, N. D., Sylvester-Bradley, R., Scott, R. K., Craigon, J.,& Day, W. (2001). Steps in predicting the relationship ofyield on fungicide dose. Phytopathology, 91, 708–716.
Paveley, N. D., Smith, J. S., & Foulkes, J. (2008). Traits forreduced fungicide dependence. In Cereal Pathosystems(pp. 35–47). London: BSPP.
Pinet, A. (2010). Analyse de la plasticité du puits reproducteurdu colza suite à une suppression de boutons floraux :conséquences sur le rapport source: puits et le rendement.PhD dissertation. University of Paris. AgroParisTech.141p.
Reynolds, M. P., Pellegrineschi, A., & Skovmand, B. (2005).Sink-limitation to yield and biomass: a summary of someinvestigations in spring wheat. Annals of Applied Biology,146, 39–49.
Reynolds, M. P., Calderini, D., Ciondon, A., & Vargas, M.(2007). Evaluating potential genetic gains in wheat associ-ated with stress-adaptive trait expression in elite geneticresources under drought and heat stress. Crop Science, 47,172–178.
578 Eur J Plant Pathol (2013) 135:561–580

Reynolds, M., Manes, Y., Izanloo, A., & Langridge, P. (2009).Phenotyping approaches for physiological breeding andgene discovery in wheat. Annals of Applied Biology, 155,309–320.
Robb, J. (2007). Verticillium tolerance: resistance, susceptibilityor mutualism? Canadian Journal of Botany, 85, 903–910.
Robert, C., Bancal, M.-O., Nicolas, P., Lannou, C., & Ney, B.(2004). Analysis and modelling of effects of leaf rust andSeptoria tritici blotch on wheat growth. Journal ofExperimental Botany, 55, 1079–1094.
Robert, C., Bancal, M.-O., Ney, B., & Lannou, C. (2005).Wheat leaf photosynthesis loss due to leaf rust, with re-spect to lesion development and leaf nitrogen status. NewPhytologist, 165, 227–241.
Robert, C., Bancal, M.-O., Lannou, C., & Ney, B. (2006).Quantification of the effects of Septoria tritici blotch onwheat leaf gas exchange with respect to lesion age, leafnumber, and leaf nitrogen status. Journal of ExperimentalBotany, 57, 225–234.
Robert, C., Fournier, C., Dornbusch, T., Andrieu, B. &Gouache, D. (2010). Using a functional-structural plantmodel to design wheat ideotypes and assess their perfor-mance regarding potentials of biomass production, weedsuppression and disease escape. 6th International workshopon Functional - Structural Plant Model. Davis, USA.
Roberts, A. M., & Walters, D. R. (1986). Stimulation of photo-synthesis in uninfected leaves of rust-infected leeks. Annalsof Botany, 56, 893–896.
Rolfe, S. A., & Scholes, J. D. (2010). Chlorophyll fluorescenceimaging of plant-pathogen interactions. Protoplasma, 247,163–175.
Rooney, J. M., & Hoad, G. V. (1989). Compensation in growthand photosynthesis of wheat (Tritcum aestivum L.) follow-ing early inoculations with Septoria nodurum (Berk.). NewPhytologist, 113, 513–521.
Rosenthal, J. P., & Welter, S. C. (1995). Tolerance to herbivoryby a stemboring caterpillar in architecturally distinctmaizes and wild relatives. Oecologia, 102, 146–155.
Rossing, W. A. H., van Oijen, M., van der Werf, W., Bastiaans,L., & Rabbinge, R. (1992). Modelling the effects of foliarpests and pathogens on light interception, photosynthesis,growth rate and yield of field crops. In P. G. Ayres (Ed.),Pests and Pathogens. Plant responses to foliar attack (pp.161–180). Oxford: Bios Scientific Publishers.
Roux, F., Gao, L., & Bergelson, J. (2010). Impact of initialpathogen density on resistance and tolerance in a poly-morphic disease resistance gene system in Arabidopsisthaliana. Genetics, 185, 283–291.
Roy, B. A., & Kirchner, J. W. (2000). Evolutionary dynam-ics of pathogen resistance and tolerance. Evolution, 54,51–63.
Sadras, V. O. (2000). Variation in apical dominance and itsimplications for herbivory resistance, competitive ability,and biomasspartitioning. In M. E. Otegui & G. A. Slafer(Eds.), Physiology Bases for Maize Improvement (p. 217).Chesterfield: Food Products Press.
Savary, S., Teng, P. S., Willocquet, L., & Nutter, F. W. J. (2006).Quantification and modeling of crop losses: a review ofpurposes. Annual Review of Phytopathology, 44, 89–112.
Schafer, J. F. (1971). Tolerance to plant disease. Annual Reviewof Phytopathology, 9, 235–252.
Schoeny, A., Jeuffroy, M.-H., & Lucas, P. (2003). Influence oftake-all epidemics on winter wheat yield formation andyield loss. Phytopathology, 91, 694–701.
Scholes, J. D., & Rolfe, S. A. (1996). Photosynthesis in local-ised regions of oat leaves infected with crown rust(Puccinia coronata): quantitative imaging of chlorophyllfluorescence. Planta, 199, 573–582.
Scholes, J. D., & Rolfe, S. A. (2009). Chlorophyll fluorescenceimaging as a tool for understanding the impact of fungal;diseases on plant performance: a phenomics perspective.Functional Plant Biology, 36, 880–892.
Schwachtje, J., & Baldwin, I. T. (2008). Why does herbivoreattack reconure primary metabolism? Plant Physiology,146, 845–851.
Schwachtje, J., Minchin, P. E. H., Jahnke, S., van Dongen, J.T., Schittko, U., & Baldwin, I. T. (2006). SNF1-relatedkinases allow plants to tolerate herbivory by allocatingcarbon to roots. Proceedings of the National Academyof Sciences of the United States of America, 103,12935–12940.
Serrago, R., Carretero, R., Bancal, M.-O., & Miralles, D. J.(2011). Grain weight response to foliar diseases control inwheat (Triticum aestivum L.). Field Crops Research, 120,352–359.
Shaw, M. W., & Osborne, T. M. (2011). Geographic distributionof plant pathogens in response to climate change. PlantPathology, 60, 31–43.
Shtienberg, D. (1992). Effects of foliar diseases on gas exchangeprocesses: a comparative study.Phytopathology, 82, 760–765.
Smedegaard-Petersen, V., & Tolstrup, K. (1985). The limitingeffect of disease resistance on yield. Annual Review ofPhytopathology, 23, 475–490.
Spink, J. H., Semere, T., Sparkes, D. L., Whaley, J. M., Foulkes,M. J., Clare, R. W., et al. (2000). Effect of sowing date onthe optimum plant density of winter wheat. Annals ofApplied Biology, 137, 179–188.
Spitters, C. J., van Roermund, H. J. W., van Nassau, H. G. M.G., Scheper, J., & Mesdag, J. (1990). Genetic variation inpartial resistance to leaf rust in winter wheat: disease prog-ress, foliage senescence and yield reduction. NetherlandsJournal of Plant Pathology, 96, 3–15.
Strauss, S., & Aggrawal, A. (1999). The ecology and evolutionof plant tolerance to herbivory. Trends in Ecology &Evolution, 14, 179–185.
Swarbrick, P. J., Schulze-Lefert, P., & Scholes, J. D. (2006).Metabolic consequences of susceptibility and resistance(race-specific and broad-spectrum) in barley leaves chal-lenged with powdery mildew. Plant, Cell & Environment,29, 1061–1076.
Sylvester-Bradley, R., & Wiseman, J. (2005). Yields of FarmedSpecies. In Proceedings of the 61st Easter School inAgricultural Sciences. UK: Nottingham University Press.
Sylvester-Bradley, R., Riffkin, P., & O’Leary, G. (2012).Designing resource-efficient ideotypes for new croppingconditions: Wheat (Triticum aestivum L.) in the high rain-fall zone of South Australia. Field Crops Research, 125,69–82.
Tang, J., Zielinski, R., Aldea, M., & DeLucia, E. (2009). Spatialassociation of photosynthesis and chemical defense inArabidopsis thaliana following herbivory by Trichoplusiani. Physiologia Plantarum, 1347, 115–124.
Eur J Plant Pathol (2013) 135:561–580 579

Thomson, V. P., Cunningham, S. A., Ball, M. C., & Nicotra, A.B. (2003). Compensation for herbivory by Cucumis sativusthrough increased photosynthetic capacity and efficiency.Oecologia, 134, 167–175.
Tiffin, P. (2000). Mechanisms of tolerance to herbivore damage:what do we know? Evolutionary Ecology, 14, 523–536.
Tiffin, P. (2002). Competition and time of damage affect thepattern of selection acting on plant defense against herbi-vores. Ecology, 83, 1981–1990.
Tiffin, P., & Rausher, M. D. (1999). Genetic constraints andselection acting on tolerance to herbivory in the commonmorning glory Ipomoea purpurea. American Naturalist,154, 700–716.
Vannette, R. L., & Hunter, M. D. (2011). Plant defense theory re-examined: nonlinear expectations based on the costs and ben-efits of resource mutualisms. Journal of Ecology, 99, 66–76.
Waggoner, P. E., & Berger, R. D. (1987). Defoliation, diseaseand growth. Phytopathology, 77, 393–398.
Walters, D. R., & McRoberts, N. (2006). Plants and biotrophs: apivotal role for cytokinins? Trends in Plant Science, 11,581–586.
West, S. J., Townsend, J. A., Stevens, M., & Fitt, B. D. L.(2012). Comparative biology of different plant pathogensto estimate effects of climate change on crop diseases inEurope. European Journal of Plant Pathology, 133, 315–331.
Williams, G. M., & Ayres, P. G. (1981). Effects of powderymildew and water stress on CO2 exchanges in unin-fected leaves of barley plants. Plant Physiology, 68,527–530.
Wise, M. J., & Abrahamson, W. G. (2005). Beyond compensa-tory continuum: environmental and plant tolerance herbiv-ory. Oikos, 109, 417–428.
Zangerl, A. R., Hamilton, J. G., Miller, T. J., Crofts, A. R.,Oxborough, K., Berenbaum, M. R., et al. (2002).Impact of folivory on photosynthesis is greater thanthe sum of its holes. Proceedings of the NationalAcademy of Sciences of the United States of America,99, 1088–1091.
Zuckerman, E., Eshal, A., & Eyal, Z. (1997). Physiologicalaspects related to tolerance of spring wheat cultivars toSeptoria tritici blotch. Phytopathology, 87, 60–65.
580 Eur J Plant Pathol (2013) 135:561–580