Impact of tillage and crop rotation on light fraction and intra-aggregate soil organic matter in two...
11
Author's personal copy Impact of tillage and crop rotation on light fraction and intra-aggregate soil organic matter in two Oxisols L. Zotarelli a,b,1 , B.J.R. Alves c , S. Urquiaga c , R.M. Boddey c , J. Six b,d, * a Natural Resource Ecology Laboratory, Colorado State University, Fort Collins, CO 80523, USA b Department of Soils, Universidade Federal Rural do Rio de Janeiro, FAPERJ, Serope ´dica 23890-000, RJ, Brazil c Embrapa Agrobiologia, Caixa Postal 74.505, Serope ´dica 23890-000, RJ, Brazil d Department of Plant Sciences, University of California, Davis, CA 95616, USA Received 25 February 2006; received in revised form 23 December 2006; accepted 5 January 2007 Abstract It is well known that no-tillage (NT) practices can promote greater stocks of soil organic matter (SOM) in the soil surface layer compared to conventional tillage (CT) by enhancing the physical protection of aggregate-associated C in temperate soils. However, this link between tillage, aggregation and SOM is less well established for tropical soils, such as Oxisols. The objective of this study was to investigate the underlying mechanisms of SOM stabilization in Oxisols as affected by different crop rotations and tillage regimes at two sites in southern Brazil. Soils were sampled from two agricultural experiment sites (Passo Fundo and Londrina) in southern Brazil, with treatments comparing different crop rotations under NT and CT management, and a reference soil under native vegetation (NV). Free light fraction (LF) and intra-aggregate particulate organic matter (iPOM) were isolated from slaking-resistant aggregates. Of the total C associated with aggregates, 79–90% was found in the mineral fraction, but there were no differences between NT and CT. In contrast, tillage drastically decreased LF-C concentrations in the 0–5 cm depth layer at both sites. In the same depth layer of NT systems at Londrina, the concentrations of iPOM-C were greater when a legume cover crop was included in the rotation. At Londrina, the order of total iPOM-C levels was generally NV > NT > CT in the 0–5 cm depth interval, but the difference between NT and CT was much less than in Passo Fundo. At Passo Fundo, the greatest concentrations and differences in concentrations across tillage treatments were found in the fine (53–250 mm) iPOM fractions occluded within microaggregates. In conclusion, even though no aggregate hierarchy exists in these Oxisols, our results corroborate the concept of a stabilization of POM-C within microaggregates in no-tillage systems, especially when green manures are included in the rotation. # 2007 Elsevier B.V. All rights reserved. Keywords: No-tillage; Crop rotation; Soil aggregates; Soil organic matter; Oxisols 1. Introduction Soil organic matter (SOM) tends to decline when native ecosystems are converted to cropping systems for several reasons. The top soil may be subject to erosion and tillage, which leads to breakdown of soil aggregates and oxidation of organic matter. This loss of SOM reduces the availability of plant nutrients and also detrimentally affects soil physical properties. In the Cerrado (savanna) region of western Bahia in Brazil, the www.elsevier.com/locate/still Soil & Tillage Research 95 (2007) 196–206 * Corresponding author at: Department of Plant Sciences, Univer- sity of California, One Shields Avenue, Davis, CA 95616, USA. Tel.: +1 530 752 1212; fax: +1 530 752 4361. E-mail address: [email protected] (J. Six). 1 Current address: Agronomy Department, Environmental Quality, University of Florida, Gainesville, FL 32611-0965, USA. 0167-1987/$ – see front matter # 2007 Elsevier B.V. All rights reserved. doi:10.1016/j.still.2007.01.002
Transcript of Impact of tillage and crop rotation on light fraction and intra-aggregate soil organic matter in two...
Author's personal copy
Impact of tillage and crop rotation on light fraction and
intra-aggregate soil organic matter in two Oxisols
L. Zotarelli a,b,1, B.J.R. Alves c, S. Urquiaga c, R.M. Boddey c, J. Six b,d,*a Natural Resource Ecology Laboratory, Colorado State University, Fort Collins, CO 80523, USA
b Department of Soils, Universidade Federal Rural do Rio de Janeiro, FAPERJ, Seropedica 23890-000, RJ, Brazilc Embrapa Agrobiologia, Caixa Postal 74.505, Seropedica 23890-000, RJ, Brazild Department of Plant Sciences, University of California, Davis, CA 95616, USA
Received 25 February 2006; received in revised form 23 December 2006; accepted 5 January 2007
Abstract
It is well known that no-tillage (NT) practices can promote greater stocks of soil organic matter (SOM) in the soil surface layer
compared to conventional tillage (CT) by enhancing the physical protection of aggregate-associated C in temperate soils. However,
this link between tillage, aggregation and SOM is less well established for tropical soils, such as Oxisols. The objective of this study
was to investigate the underlying mechanisms of SOM stabilization in Oxisols as affected by different crop rotations and tillage
regimes at two sites in southern Brazil. Soils were sampled from two agricultural experiment sites (Passo Fundo and Londrina) in
southern Brazil, with treatments comparing different crop rotations under NTand CT management, and a reference soil under native
vegetation (NV). Free light fraction (LF) and intra-aggregate particulate organic matter (iPOM) were isolated from slaking-resistant
aggregates. Of the total C associated with aggregates, 79–90% was found in the mineral fraction, but there were no differences
between NT and CT. In contrast, tillage drastically decreased LF-C concentrations in the 0–5 cm depth layer at both sites. In the
same depth layer of NT systems at Londrina, the concentrations of iPOM-C were greater when a legume cover crop was included in
the rotation. At Londrina, the order of total iPOM-C levels was generally NV > NT > CT in the 0–5 cm depth interval, but the
difference between NT and CT was much less than in Passo Fundo. At Passo Fundo, the greatest concentrations and differences in
concentrations across tillage treatments were found in the fine (53–250 mm) iPOM fractions occluded within microaggregates. In
conclusion, even though no aggregate hierarchy exists in these Oxisols, our results corroborate the concept of a stabilization of
POM-C within microaggregates in no-tillage systems, especially when green manures are included in the rotation.
# 2007 Elsevier B.V. All rights reserved.
Keywords: No-tillage; Crop rotation; Soil aggregates; Soil organic matter; Oxisols
1. Introduction
Soil organic matter (SOM) tends to decline when
native ecosystems are converted to cropping systems for
several reasons. The top soil may be subject to erosion
and tillage, which leads to breakdown of soil aggregates
and oxidation of organic matter. This loss of SOM
reduces the availability of plant nutrients and also
detrimentally affects soil physical properties. In the
Cerrado (savanna) region of western Bahia in Brazil, the
www.elsevier.com/locate/still
Soil & Tillage Research 95 (2007) 196–206
* Corresponding author at: Department of Plant Sciences, Univer-
sity of California, One Shields Avenue, Davis, CA 95616, USA.
Tel.: +1 530 752 1212; fax: +1 530 752 4361.
E-mail address: [email protected] (J. Six).1 Current address: Agronomy Department, Environmental Quality,
University of Florida, Gainesville, FL 32611-0965, USA.
0167-1987/$ – see front matter # 2007 Elsevier B.V. All rights reserved.
doi:10.1016/j.still.2007.01.002
Author's personal copy
conversion of native vegetation to conventional soybean
[Glycine max (L.) Merr.] cropping decreased the SOM
in the 0–15 cm depth by 41–80% across different soil
textures after only 5 years of conversion (Da Silva et al.,
1994). Conventional tillage (CT) practices result in the
mixing of crop residues into the soil profile and
disruption of soil aggregates (especially macroaggre-
gates (>250 mm)), which enhance residue decomposi-
tion rates and SOM transformations (Beare et al., 1994;
Six et al., 2002). However, the adoption of no-tillage
(NT), may enhance SOM stabilization in comparison to
CT (Havlin et al., 1990; Beare et al., 1994; Bayer et al.,
2000a; Sisti et al., 2004; Diekow et al., 2005). A greater
C accumulation in NT than CT in temperate regions has
been related to the preservation of aggregates due to the
lack of soil disturbance in NT (Beare et al., 1994; Six
et al., 2002).
In temperate soils, it has been found that the
formation rate of new macro- and microaggregates is
directly related to the dynamics of particulate organic
matter (POM). According to Golchin et al. (1994,
1998), macroaggregates are formed around fresh coarse
residues (POM > 250 mm), which become colonized by
microorganisms and encrusted with mineral materials.
The continuous decomposition of coarse intra-aggregate
POM (iPOM) into smaller fragments promotes the
formation of microaggregates (<250 mm) within macro-
aggregates (Six et al., 2000b). Under CT, with frequent
disruption of aggregates and input of new residues in the
plough layer, macroaggregate turnover is enhanced,
resulting in decreased time for microaggregate formation
and consequently a diminished stabilization of C within
microaggregates (Six et al., 2000b). In other words, under
NT, the amount of water-stable macroaggregates is
generally greater and the rate of turnover of macro-
aggregates is estimated to be half the rate of that under CT
(Six et al., 1999, 2000b), resulting in greater mean
residence times and accumulation of soil C in the surface
layer of NT compared to CT systems (Six et al., 2002).
Several factors may contribute to soil aggregation,
SOM accumulation and/or C stabilization in Oxisols.
Since Oxisols are very weathered soils, there is a
predominance of 1:1 clay minerals and oxides, while
temperate soils are dominated by 2:1 clay minerals.
These different characteristics may play a dominant role
in the stabilization mechanisms of C (Denef et al., 2004;
Oades and Waters, 1991; Six et al., 2000a). Fe and Al
oxy-hydroxides associated with 1:1 clay minerals are
strong binding agents and Oxisols dominated by this
mineralogy form a very strong fine granular structure
after long periods of time (Resende et al., 1997). In this
process, free POM can become incorporated into this
granular structure and be transformed into occluded
POM (Roscoe et al., 2004), but SOM is generally less
important as an aggregation agent (Six et al., 2000a;
Zotarelli et al., 2005). Therefore, it has been suggested
that the formation and stabilization of microaggregates
within macroaggregates in soils with greater amounts of
1:1 clay mineral and oxides is less dependent on SOM
(Denef et al., 2004; Six et al., 1999).
Unprotected SOM pools, such as the light fraction
(LF) and free POM, are strongly influenced by the
quality and quantity of crop residues and by soil
management practices, such as NT versus CT, and crop
rotation (Alvarez et al., 1998; Janzen et al., 1992). Even
though the total C inputs within the same cropping
sequence are usually quite similar for NT and CT (Paul
et al., 1997; Sisti et al., 2004; Zotarelli et al., 2005), a
greater C stabilization is observed in most long-term NT
systems, in part due to greater aggregation which
promotes physical protection of soil C (e.g. Six et al.,
2000a,b). Soil texture also has an important influence on
C accumulation in aggregates; i.e. with increasing clay
content, the amount of occluded organic C stored in
aggregates increases (Kolbl and Kogel-Knabner, 2004).
The lower disturbance in NT systems can promote the
interaction between clays and slower decomposing C
inputs to form soil aggregates. However, faunal
populations and microbial biomass (especially fungal
biomass) are also greater under NT (Cattelan et al.,
1997; Frey et al., 1999) and these organisms play an
important role in soil aggregation (Doran, 1987; Tisdall,
1991; Jungerius et al., 1999; Rillig and Mummey,
2006). Furthermore, the root system has been con-
sidered an effective agent for stabilization of macro-
aggregates in NT systems, whereas new C inputs from
surface residues seem to not contribute as much to
macroaggregate-associated C pools (Gale et al., 2000).
In our previous study (Zotarelli et al., 2005) on
Oxisols, it was shown that aggregate size was greater
under NT than under CT but in contrast to studies on
high activity (2:1) clay soils there was no increase in C
concentration with aggregate size class, or according to
Tisdall and Oades (1982) there was no clear ‘‘aggregate
hierarchy’’. The objective of this study was to deepen
our understanding of the underlying mechanisms of
SOM stabilization at the same sites studied by Zotarelli
et al. (2005) by (1) determining the C distribution in
different mineral-associated C, occluded POM-C, and
free POM-C fractions and (2) testing in Oxisols the
model of aggregate formation and accumulation of soil
organic matter proposed by Six et al. (2000b) for
temperate soils. Our overall hypotheses were that the
conceptual model of macroaggregate turnover (sensu
L. Zotarelli et al. / Soil & Tillage Research 95 (2007) 196–206 197
Author's personal copy
Six et al., 2000b) would be valid for Oxisols and that NT
management and the inclusion of green manures in the
crop rotation would be synergistic in increasing SOC
accumulation.
2. Materials and methods
2.1. Site descriptions
2.1.1. Experiment 1: Passo Fundo
The first study was performed at the Experimental
Station of the Embrapa Wheat Research Center in Passo
Fundo, located 288150S and 528240W, 687 m altitude.
The experiment was installed in 1986 in an area of
native vegetation (tropical semi-deciduous forest open
Araucaria woodland. In November of 1985, the soil was
ploughed and limed with 7 Mg ha�1 of dolomitic lime,
but no further lime additions were made thereafter. The
tillage treatments were: no-tillage (NT) and conven-
tional tillage (CT). The CT plots were disk ploughed
(20 cm) followed by a disk harrow twice a year, before
every sowing. Two crop rotations were tested): PFR1
was characterized by presence of two-grain crops per
year, a summer soybean (Glycine max L.) and a winter
wheat (Triticum aestivum L.). PFR2 was characterized
by two summer grain crops, soybean and maize (Zea
mays L.), which were planted in alternate years, two
winter crops, oat (Avena sativa L.) and wheat also
planted in alternate years. In PFR2, hairy vetch (Vicia
villosa L.) was included as green manure that was cut
down at the flowering stage and the residues were
maintained on the soil surface. In PFR2, the crop
sequence wheat-soybean, hairy vetch-maize, and oats-
soybean was repeated every 3 years.
2.1.2. Experiment 2: Londrina
The second site was at the Experimental Station of
the Embrapa Soybean Research Center in Londrina,
located 238230S and 518110W, 566 m altitude. The
native vegetation was tropical semi-deciduous forest,
and previous to the installation of the experiment, the
area was under conventional agriculture since the
1980s, with a rotation of soybean and wheat. Between
1995 and 1997, the whole area was converted to NTwith
a sequence of soybean/lupin (Lupinus sp.)–maize/oat–
soybean/oat. In November 1997, the experiment was
installed with two soil management systems: NT and
CT, and three crop rotations. The crop sequence
between 1997 and 2001 for LAR1 was maize, oat,
soybean, wheat, soybean, lupin, maize, oat, for the
LAR2 was soybean, lupin, maize, oat, soybean, wheat,
soybean, lupin, and LAR3 was soybean, wheat, soybean,
lupin, maize, oat, maize. The management used for
hairy vetch in Passo Fundo was adopted for lupin in
Londrina.
The CT plots were disk ploughed (20 cm deep)
followed by disk harrow before each of the two
cropping seasons per year. The general soil character-
istics of the agricultural sites are shown in Table 1.
2.2. Soil sampling and physical fractionation
At both sites, the soils were kaolinitic Oxisols with a
clayey texture (Haplorthox–Ferralsol). Both sites had
L. Zotarelli et al. / Soil & Tillage Research 95 (2007) 196–206198
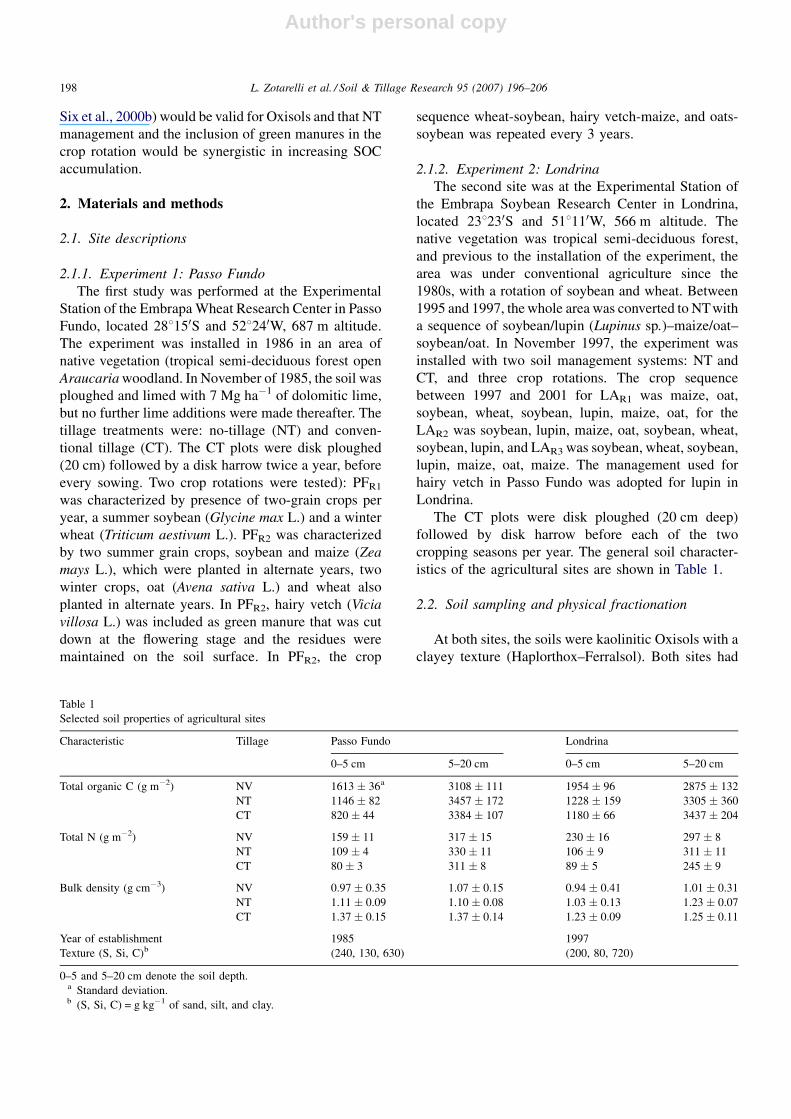
Table 1
Selected soil properties of agricultural sites
Characteristic Tillage Passo Fundo Londrina
0–5 cm 5–20 cm 0–5 cm 5–20 cm
Total organic C (g m�2) NV 1613 � 36a 3108 � 111 1954 � 96 2875 � 132
NT 1146 � 82 3457 � 172 1228 � 159 3305 � 360
CT 820 � 44 3384 � 107 1180 � 66 3437 � 204
Total N (g m�2) NV 159 � 11 317 � 15 230 � 16 297 � 8
NT 109 � 4 330 � 11 106 � 9 311 � 11
CT 80 � 3 311 � 8 89 � 5 245 � 9
Bulk density (g cm�3) NV 0.97 � 0.35 1.07 � 0.15 0.94 � 0.41 1.01 � 0.31
NT 1.11 � 0.09 1.10 � 0.08 1.03 � 0.13 1.23 � 0.07
CT 1.37 � 0.15 1.37 � 0.14 1.23 � 0.09 1.25 � 0.11
Year of establishment 1985 1997
Texture (S, Si, C)b (240, 130, 630) (200, 80, 720)
0–5 and 5–20 cm denote the soil depth.a Standard deviation.b (S, Si, C) = g kg�1 of sand, silt, and clay.

Author's personal copy
native vegetation (NV), CT, and NT treatments.
However, the NV plots were located in adjacent areas
near the plots of the field experiment and not included
within the experimental area.
In July 2001, soils from each treatment were sampled
at two depths (0–5 cm and 5–20 cm). Before the
samples were taken, the litter layer was removed. Once
in the laboratory, the moist soil was passed through an
8 mm sieve by gently breaking apart the soil and the
samples were then air dried and stored at room
temperature. The method of aggregate separation was
adapted from Elliott (1986). Briefly, aggregates were
separated by wet sieving air-dried soil through a series
of three sieves (2000, 250 and 53 mm). The air-dried
soil was quickly submerged in deionized water on top of
the 2000-mm sieve, resulting in slaking of the soil. The
isolated aggregates were oven dried (50 8C). The
method of separation of free LF and intra-aggregate
POM was described by Six et al. (1998). A 5 g
subsample was suspended in 35 mL of 1.85 g cm�3
sodium polytungstate in a 50 mL graduated conical
centrifuge tube. The suspended subsample was mixed
without breaking the aggregates by slowly reciprocal
shaking by hand (10 strokes). The sample was put under
vacuum (138 kPa) for 10 min to evacuate air entrapped
within the aggregates. After 20 min equilibration, the
sample was centrifuged (1250 g) at 20 8C for 60 min.
The floating material (LF) was aspirated onto a 20-mm
nylon filter, rinsed thoroughly with deionized water to
remove sodium polytungstate, transferred to a small
aluminum pan, and dried at 50 8C. The heavy fraction
was rinsed twice with 50 mL of deionized water and
dispersed by shaking in 15 ml of 0.5% of hexametapho-
sphate with 12 glass beads (5 mm diameter each) per
sample for 18 h on a reciprocal shaker. The dispersed
heavy fraction was passed through 250 and 53 mm
sieves and different POM size classes were distin-
guished: fine iPOM (<250 mm) and coarse iPOM
(>250 mm). The material remaining on the sieve,
iPOM + sand was dried (50 8C) and weighed.
Aggregate-associated C and mineral-associated C
were calculated by difference:
aggregate-associated C
¼ total aggregate C� free LF C (1)
mineral-associated C
¼ aggregate-associated C� iPOM-C (2)
where total aggregate C was the total C measured in
aggregates prior to the LF flotation.
2.3. Carbon analysis
Carbon concentrations were measured with a LECO
CHN-100 analyser (Leco Corp., St. Joseph, MI) for the
aggregate, LF, and iPOM size fractions. For appropriate
comparisons between treatments and sites it was
necessary to correct for the sand content in each
aggregate size class (Elliott et al., 1991).
2.4. Statistical analysis
In Londrina, the field experiment (two tillage
treatments � three rotations) was arranged in a rando-
mized complete block design with four replicates. The
Passo Fundo field experiment (two tillage treat-
ments � four rotations) was arranged in a randomized
split plot design with three replicates and the tillage
treatments in the main plots and the rotations in the sub-
plots. At both sites, the areas of NV were outside of the
experimental design and therefore the NV was not
included in the statistical analyses. The data were
initially analyzed using the MSTAT-C software (Michi-
gan State University, USA) for analysis of variance to
determine the effects of the main variables (tillage and
rotation) on the measured parameters at a P value of
0.05.
For the experiment at Londrina, which was a
factorial design with all treatments in main plots, it
was necessary to examine the effect of the different crop
rotation on any parameter within the same tillage
treatment (or vice versa), the variance associated with
the difference between the individual means was
compared to that of the residual and the F test was
applied.
For the split plot design of the experiment at Passo
Fundo, this was achieved using the procedure described
by Little and Jackson-Hills (1978): The calculation of
the least significant difference between means (LSD,
Student) was applied where
LSD0:05 ¼ tab
ffiffiffiffiffiffiffiffiffiffiffiffiffiffiffiffiffiffiffiffiffiffiffiffiffiffiffiffiffiffiffiffiffiffiffiffiffiffiffiffiffiffiffiffiffiffiffi�2� ðb� 1ÞEb þ Ea
rb
�s(3)
where b is the number of subplot treatments, r the
number of replicates, Ea and Eb are the mean squares
of the sub-plot and main plot errors, respectively, and tab
is the weighted t value for main plots and subplots
calculated as described by Little and Jackson-Hills
(1978).
These procedures were performed in the software
SISVAR, produced by the Federal University of Lavras,
Minas Gerais.
L. Zotarelli et al. / Soil & Tillage Research 95 (2007) 196–206 199
Author's personal copy
3. Results and discussion
3.1. Mineral associated carbon
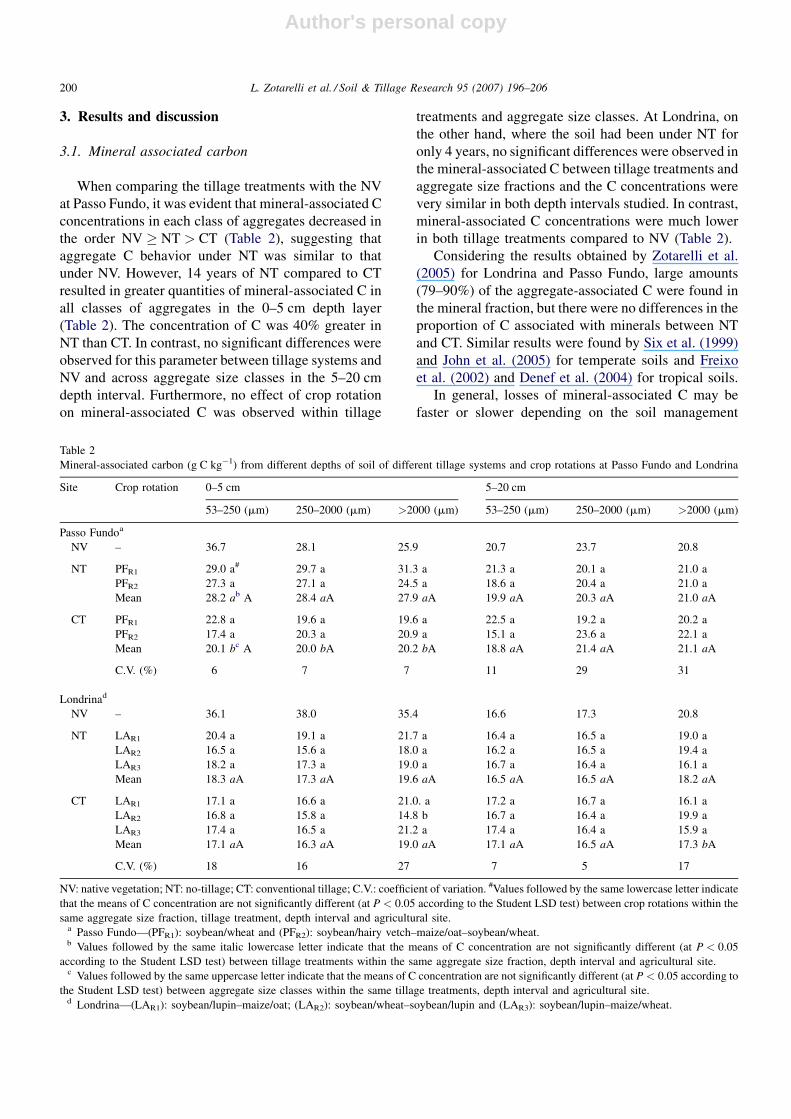
When comparing the tillage treatments with the NV
at Passo Fundo, it was evident that mineral-associated C
concentrations in each class of aggregates decreased in
the order NV � NT > CT (Table 2), suggesting that
aggregate C behavior under NT was similar to that
under NV. However, 14 years of NT compared to CT
resulted in greater quantities of mineral-associated C in
all classes of aggregates in the 0–5 cm depth layer
(Table 2). The concentration of C was 40% greater in
NT than CT. In contrast, no significant differences were
observed for this parameter between tillage systems and
NV and across aggregate size classes in the 5–20 cm
depth interval. Furthermore, no effect of crop rotation
on mineral-associated C was observed within tillage
treatments and aggregate size classes. At Londrina, on
the other hand, where the soil had been under NT for
only 4 years, no significant differences were observed in
the mineral-associated C between tillage treatments and
aggregate size fractions and the C concentrations were
very similar in both depth intervals studied. In contrast,
mineral-associated C concentrations were much lower
in both tillage treatments compared to NV (Table 2).
Considering the results obtained by Zotarelli et al.
(2005) for Londrina and Passo Fundo, large amounts
(79–90%) of the aggregate-associated C were found in
the mineral fraction, but there were no differences in the
proportion of C associated with minerals between NT
and CT. Similar results were found by Six et al. (1999)
and John et al. (2005) for temperate soils and Freixo
et al. (2002) and Denef et al. (2004) for tropical soils.
In general, losses of mineral-associated C may be
faster or slower depending on the soil management
L. Zotarelli et al. / Soil & Tillage Research 95 (2007) 196–206200
Table 2
Mineral-associated carbon (g C kg�1) from different depths of soil of different tillage systems and crop rotations at Passo Fundo and Londrina
Site Crop rotation 0–5 cm 5–20 cm
53–250 (mm) 250–2000 (mm) >2000 (mm) 53–250 (mm) 250–2000 (mm) >2000 (mm)
Passo Fundoa
NV – 36.7 28.1 25.9 20.7 23.7 20.8
NT PFR1 29.0 a# 29.7 a 31.3 a 21.3 a 20.1 a 21.0 a
PFR2 27.3 a 27.1 a 24.5 a 18.6 a 20.4 a 21.0 a
Mean 28.2 ab A 28.4 aA 27.9 aA 19.9 aA 20.3 aA 21.0 aA
CT PFR1 22.8 a 19.6 a 19.6 a 22.5 a 19.2 a 20.2 a
PFR2 17.4 a 20.3 a 20.9 a 15.1 a 23.6 a 22.1 a
Mean 20.1 bc A 20.0 bA 20.2 bA 18.8 aA 21.4 aA 21.1 aA
C.V. (%) 6 7 7 11 29 31
Londrinad
NV – 36.1 38.0 35.4 16.6 17.3 20.8
NT LAR1 20.4 a 19.1 a 21.7 a 16.4 a 16.5 a 19.0 a
LAR2 16.5 a 15.6 a 18.0 a 16.2 a 16.5 a 19.4 a
LAR3 18.2 a 17.3 a 19.0 a 16.7 a 16.4 a 16.1 a
Mean 18.3 aA 17.3 aA 19.6 aA 16.5 aA 16.5 aA 18.2 aA
CT LAR1 17.1 a 16.6 a 21.0. a 17.2 a 16.7 a 16.1 a
LAR2 16.8 a 15.8 a 14.8 b 16.7 a 16.4 a 19.9 a
LAR3 17.4 a 16.5 a 21.2 a 17.4 a 16.4 a 15.9 a
Mean 17.1 aA 16.3 aA 19.0 aA 17.1 aA 16.5 aA 17.3 bA
C.V. (%) 18 16 27 7 5 17
NV: native vegetation; NT: no-tillage; CT: conventional tillage; C.V.: coefficient of variation. #Values followed by the same lowercase letter indicate
that the means of C concentration are not significantly different (at P < 0.05 according to the Student LSD test) between crop rotations within the
same aggregate size fraction, tillage treatment, depth interval and agricultural site.a Passo Fundo—(PFR1): soybean/wheat and (PFR2): soybean/hairy vetch–maize/oat–soybean/wheat.b Values followed by the same italic lowercase letter indicate that the means of C concentration are not significantly different (at P < 0.05
according to the Student LSD test) between tillage treatments within the same aggregate size fraction, depth interval and agricultural site.c Values followed by the same uppercase letter indicate that the means of C concentration are not significantly different (at P < 0.05 according to
the Student LSD test) between aggregate size classes within the same tillage treatments, depth interval and agricultural site.d Londrina—(LAR1): soybean/lupin–maize/oat; (LAR2): soybean/wheat–soybean/lupin and (LAR3): soybean/lupin–maize/wheat.
Author's personal copy
adopted. Conventional tillage increases aggregate
disruption compared to NT, but this increase is mostly
promoted in the surface layer and leads to increased
decomposition of SOM due to the exposure of surface
soil to erosion, faster oxidation of SOM, and increased
macroaggregate turnover (Paustian et al., 1997; Six
et al., 1998, 1999, 2000b). The history of management
at both sites is also important in order to explain the
observed differences in SOC losses. For all aggregate
size classes, the magnitude of the differences of
mineral-associated C concentration between NV and
NT at Londrina were greater than those observed at
Passo Fundo. At Londrina, the whole area was
cultivated under CT for more than 20 years after the
conversion from NV, which already depleted the SOC
stocks present in the area. In contrast, at Passo Fundo,
the natural ecosystem was directly converted to NT and
CT tillage treatments, and in this case, the decline in the
mineral-associated C concentration was more intense
under CT than NT.
3.2. Free light fraction
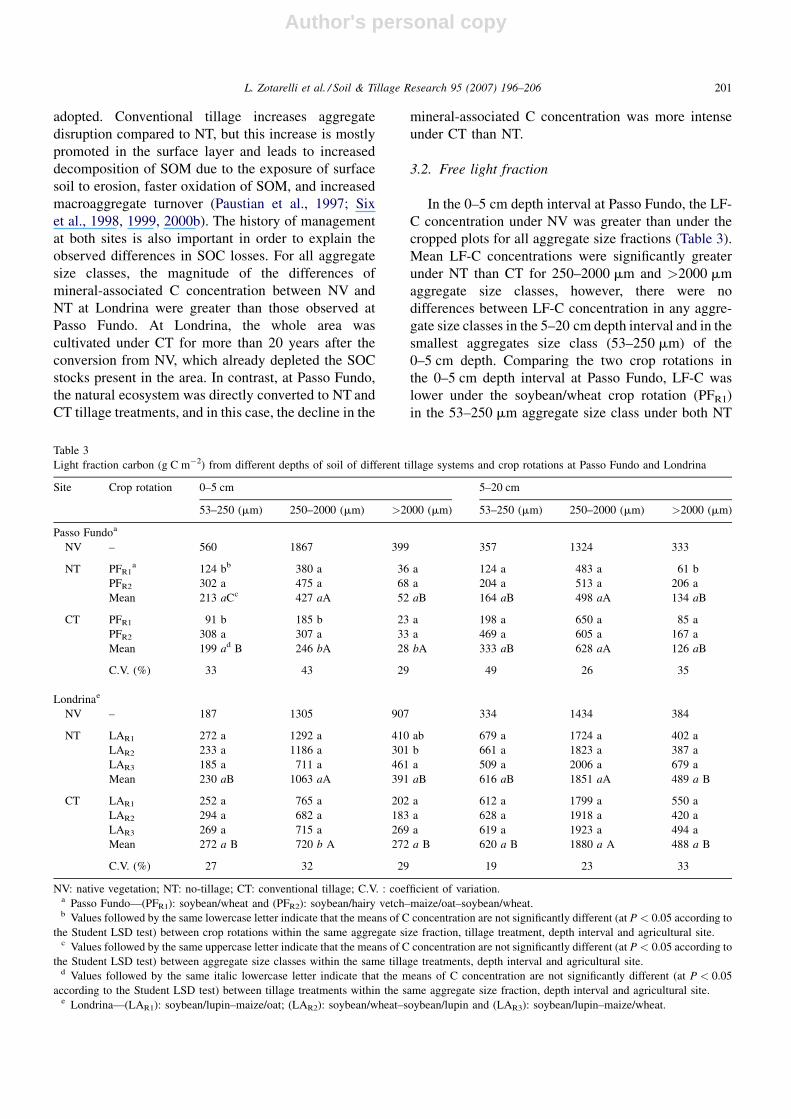
In the 0–5 cm depth interval at Passo Fundo, the LF-
C concentration under NV was greater than under the
cropped plots for all aggregate size fractions (Table 3).
Mean LF-C concentrations were significantly greater
under NT than CT for 250–2000 mm and >2000 mm
aggregate size classes, however, there were no
differences between LF-C concentration in any aggre-
gate size classes in the 5–20 cm depth interval and in the
smallest aggregates size class (53–250 mm) of the
0–5 cm depth. Comparing the two crop rotations in
the 0–5 cm depth interval at Passo Fundo, LF-C was
lower under the soybean/wheat crop rotation (PFR1)
in the 53–250 mm aggregate size class under both NT
L. Zotarelli et al. / Soil & Tillage Research 95 (2007) 196–206 201
Table 3
Light fraction carbon (g C m�2) from different depths of soil of different tillage systems and crop rotations at Passo Fundo and Londrina
Site Crop rotation 0–5 cm 5–20 cm
53–250 (mm) 250–2000 (mm) >2000 (mm) 53–250 (mm) 250–2000 (mm) >2000 (mm)
Passo Fundoa
NV – 560 1867 399 357 1324 333
NT PFR1a 124 bb 380 a 36 a 124 a 483 a 61 b
PFR2 302 a 475 a 68 a 204 a 513 a 206 a
Mean 213 aCc 427 aA 52 aB 164 aB 498 aA 134 aB
CT PFR1 91 b 185 b 23 a 198 a 650 a 85 a
PFR2 308 a 307 a 33 a 469 a 605 a 167 a
Mean 199 ad B 246 bA 28 bA 333 aB 628 aA 126 aB
C.V. (%) 33 43 29 49 26 35
Londrinae
NV – 187 1305 907 334 1434 384
NT LAR1 272 a 1292 a 410 ab 679 a 1724 a 402 a
LAR2 233 a 1186 a 301 b 661 a 1823 a 387 a
LAR3 185 a 711 a 461 a 509 a 2006 a 679 a
Mean 230 aB 1063 aA 391 aB 616 aB 1851 aA 489 a B
CT LAR1 252 a 765 a 202 a 612 a 1799 a 550 a
LAR2 294 a 682 a 183 a 628 a 1918 a 420 a
LAR3 269 a 715 a 269 a 619 a 1923 a 494 a
Mean 272 a B 720 b A 272 a B 620 a B 1880 a A 488 a B
C.V. (%) 27 32 29 19 23 33
NV: native vegetation; NT: no-tillage; CT: conventional tillage; C.V. : coefficient of variation.a Passo Fundo—(PFR1): soybean/wheat and (PFR2): soybean/hairy vetch–maize/oat–soybean/wheat.b Values followed by the same lowercase letter indicate that the means of C concentration are not significantly different (at P < 0.05 according to
the Student LSD test) between crop rotations within the same aggregate size fraction, tillage treatment, depth interval and agricultural site.c Values followed by the same uppercase letter indicate that the means of C concentration are not significantly different (at P < 0.05 according to
the Student LSD test) between aggregate size classes within the same tillage treatments, depth interval and agricultural site.d Values followed by the same italic lowercase letter indicate that the means of C concentration are not significantly different (at P < 0.05
according to the Student LSD test) between tillage treatments within the same aggregate size fraction, depth interval and agricultural site.e Londrina—(LAR1): soybean/lupin–maize/oat; (LAR2): soybean/wheat–soybean/lupin and (LAR3): soybean/lupin–maize/wheat.
Author's personal copy
and CT management, and in the 250–2000 mm size
class under CT.
At Londrina, the LF-C concentration under NV was
higher than under NTand CT in the largest aggregate size
classes of the 0–5 cm depth interval. However, for the
smallest aggregate size class (53–250 mm) in the 0–5 cm
depth interval and all aggregate sizes in the 5–20 cm
depth interval, the cultivated soils showed greater values
of LF-C. The LF-C was similar between NT and CT
across aggregate size classes except for the 250–2000 mm
aggregate size class, for which the C concentration was
significant higher under NT. No effect of crop rotation on
LF-C concentrations was observed at Londrina. For both
sites, the 250–2000 mm aggregate size class was
significantly higher in LF-C concentration than other
size classes except for the largest size fraction (>2000
mm) of the 0–5 cm depth interval. Furthermore, the LF-C
associated with >2000 mm aggregate size class was
greater in the LAR2 rotation versus LAR3 rotation under
NT. This probably reflects the fact that the last two crops
before sampling in the LAR2 were legumes (soybean and
lupin) with residues that decompose rapidly, whereas in
the LAR3 rotation, the last two crops were maize and
wheat with residues that decompose slower.
As the LF is considered to be mostly influenced by C
input levels (Six et al., 1999; Janzen et al., 1992),
differences in LF-C were expected to be greater between
NV and cultivated systems than between the two tillage
treatments. This was illustrated by the drastic negative
impacts of cultivation on LF-C concentrations in the 0–
5 cm depth layer at Passo Fundo. In the 0–5 cm soil layer
of the NV, approximately 16% of the stock of C was
found in the LF, while for NTand CT the LF-C accounted
for only 6 and 4% of the total C, respectively.
Interestingly, at Londrina, the quantity of C found in
the LF was around 10% and did not differ between NT,
CT or NV. Nevertheless, in a similar Rhodic Ferralsol,
Freixo et al. (2002) observed a decrease in whole soil LF-
C of 40% for NT and 60% for CT compared to NV.
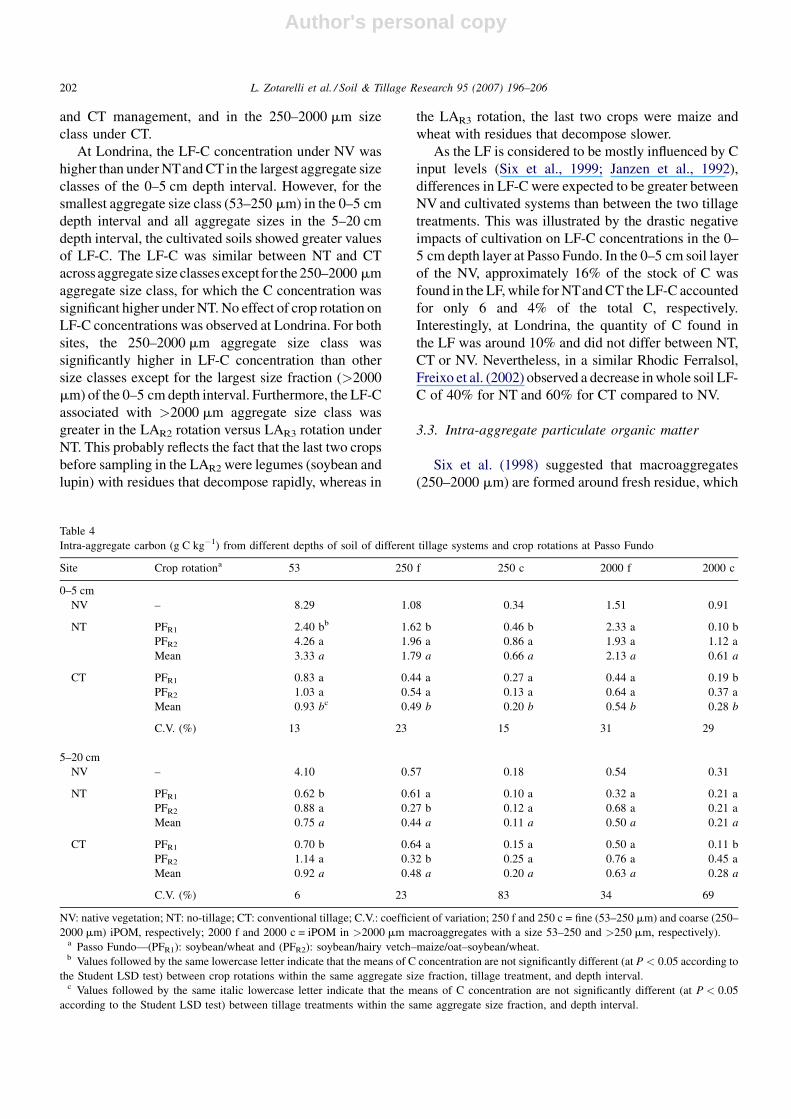
3.3. Intra-aggregate particulate organic matter
Six et al. (1998) suggested that macroaggregates
(250–2000 mm) are formed around fresh residue, which
L. Zotarelli et al. / Soil & Tillage Research 95 (2007) 196–206202
Table 4
Intra-aggregate carbon (g C kg�1) from different depths of soil of different tillage systems and crop rotations at Passo Fundo
Site Crop rotationa 53 250 f 250 c 2000 f 2000 c
0–5 cm
NV – 8.29 1.08 0.34 1.51 0.91
NT PFR1 2.40 bb 1.62 b 0.46 b 2.33 a 0.10 b
PFR2 4.26 a 1.96 a 0.86 a 1.93 a 1.12 a
Mean 3.33 a 1.79 a 0.66 a 2.13 a 0.61 a
CT PFR1 0.83 a 0.44 a 0.27 a 0.44 a 0.19 b
PFR2 1.03 a 0.54 a 0.13 a 0.64 a 0.37 a
Mean 0.93 bc 0.49 b 0.20 b 0.54 b 0.28 b
C.V. (%) 13 23 15 31 29
5–20 cm
NV – 4.10 0.57 0.18 0.54 0.31
NT PFR1 0.62 b 0.61 a 0.10 a 0.32 a 0.21 a
PFR2 0.88 a 0.27 b 0.12 a 0.68 a 0.21 a
Mean 0.75 a 0.44 a 0.11 a 0.50 a 0.21 a
CT PFR1 0.70 b 0.64 a 0.15 a 0.50 a 0.11 b
PFR2 1.14 a 0.32 b 0.25 a 0.76 a 0.45 a
Mean 0.92 a 0.48 a 0.20 a 0.63 a 0.28 a
C.V. (%) 6 23 83 34 69
NV: native vegetation; NT: no-tillage; CT: conventional tillage; C.V.: coefficient of variation; 250 f and 250 c = fine (53–250 mm) and coarse (250–
2000 mm) iPOM, respectively; 2000 f and 2000 c = iPOM in >2000 mm macroaggregates with a size 53–250 and >250 mm, respectively).a Passo Fundo—(PFR1): soybean/wheat and (PFR2): soybean/hairy vetch–maize/oat–soybean/wheat.b Values followed by the same lowercase letter indicate that the means of C concentration are not significantly different (at P < 0.05 according to
the Student LSD test) between crop rotations within the same aggregate size fraction, tillage treatment, and depth interval.c Values followed by the same italic lowercase letter indicate that the means of C concentration are not significantly different (at P < 0.05
according to the Student LSD test) between tillage treatments within the same aggregate size fraction, and depth interval.

Author's personal copy
becomes coarse iPOM. As the input of residues is
practically the same for NT and CT (Paul et al., 1997;
Zotarelli et al., 2005), the model of aggregate formation
(Six et al., 1998) assumes that macroaggregate
formation will be similar between NT and CT. Fine
iPOM inside macroaggregates is derived from decom-
position and fragmentation of coarse iPOM. Conse-
quently, fine iPOM inside macroaggregates is older than
coarse iPOM (Six et al., 2000b). In addition, Six et al.
(2001) found that fine iPOM contained a greater
proportion of functional C groups indicative of
recalcitrant or microbial-C than coarse iPOM.
At Passo Fundo, the iPOM-C concentration for all
aggregate size classes was strongly influenced by tillage
treatments in the 0–5 cm depth interval. On average,
iPOM-C concentration was approximately three times
higher under NT than CT (Table 4). In the largest
aggregate size class (>2000 mm) of NT, fine iPOM-C
was 3.5 times greater than coarse iPOM-C, while under
CT, fine iPOM-C was only two times greater than coarse
iPOM-C. The highest concentration of iPOM-C was
found in the 53–250 mm water stable aggregate size class
(microaggregates). In the 5–20 cm depth interval at Passo
Fundo, there were no significant differences in the iPOM-
C concentration between NT and CT (Table 4). The
concentration of iPOM was similar between agricultural
systems and NVin the 5–20 cm depth interval, except for
the 53–250 mm aggregate size class.
At Londrina, the order of total iPOM-C levels in the
0–5 cm depth interval was generally NV > NT > CT
(Table 5), but the difference between NT and CT was
much less than the difference observed in Passo Fundo.
Nevertheless, in all aggregate size classes, iPOM-C was
greater in NT than CT. At Londrina, the fine iPOM-C in
> aggregates 2000 mm was greater under NT than
under CT in the 0–5 cm depth layer. In the 5–20 cm
depth layer, there were no differences in any of the
iPOM-C concentrations between aggregates under
either tillage system. Six et al. (1999) found similar
results in temperate soils.
L. Zotarelli et al. / Soil & Tillage Research 95 (2007) 196–206 203
Table 5
Intra-aggregate carbon (g C kg�1) from different depths of soil of different tillage systems and crop rotations at Londrina
Site Crop rotationa 53 250 f 250 c 2000 f 2000 c
0–5 cm
NV – 3.54 0.71 1.07 0.88 0.59
NT LAR1 2.92 bb 0.44 b 0.77 a 0.94 a 0.32 b
LAR2 3.87 a 0.73 a 0.62 a 1.12 a 1.20 a
LAR3 2.26 c 0.41 b 0.35 b 0.56 b 0.60 b
Mean 3.02 a 0.53 a 0.58 a 0.88 a 0.71 a
CT LAR1 2.32 a 0.59 a 0.36 a 0.60 a 0.53 a
LAR2 2.24 a 0.57 a 0.34 a 0.44 a 0.65 a
LAR3 2.16 a 0.40 b 0.47 a 0.57 a 0.41 a
Mean 2.24 bc 0.51 a 0.40 b 0.53 b 0.53 a
C.V. (%) 15 17 25 30 43
5–20 cm
NV – 0.85 0.13 0.18 0.24 0.21
NT LAR1 1.45 a 0.27 b 0.25 a 0.36 a 0.40 a
LAR2 1.91 a 0.30 b 0.33 a 0.61 a 0.42 a
LAR3 1.95 a 0.47 a 0.27 a 0.53 a 0.49 a
Mean 1.77 b 0.35 b 0.28 a 0.50 a 0.44 b
CT LAR1 2.11 a 0.44 a 0.27 b 0.52 a 0.71 a
LAR2 2.33 a 0.50 a 0.32 ab 0.64 a 0.66 a
LAR3 2.60 a 0.48 a 0.45 a 0.51 a 0.93 a
Mean 2.34 a 0.48 a 0.34 a 0.56 a 0.77 a
C.V. (%) 18 19 31 40 37
NV: native vegetation; NT: no-tillage; CT: conventional tillage; C.V.: coefficient of variation; 250 f and 250 c = fine (53–250 mm) and coarse (250–
2000 mm) iPOM, respectively; 2000 f and 2000 c = iPOM in >2000 mm macroaggregates with a size 53–250 and >250 mm, respectively).a Londrina—(LAR1): soybean/lupin–maize/oat; (LAR2): soybean/wheat–soybean/lupin and (LAR3): soybean/lupin–maize/wheat.b Values followed by the same lowercase letter indicate that the means of C concentration are not significantly different (at P < 0.05 according to
the Student LSD test) between crop rotations within the same aggregate size fraction, tillage treatment, and depth interval.c Values followed by the same italic lowercase letter indicate that the means of C concentration are not significantly different (at P < 0.05
according to the Student LSD test) between tillage treatments within the same aggregate size fraction, and depth interval.
Author's personal copy
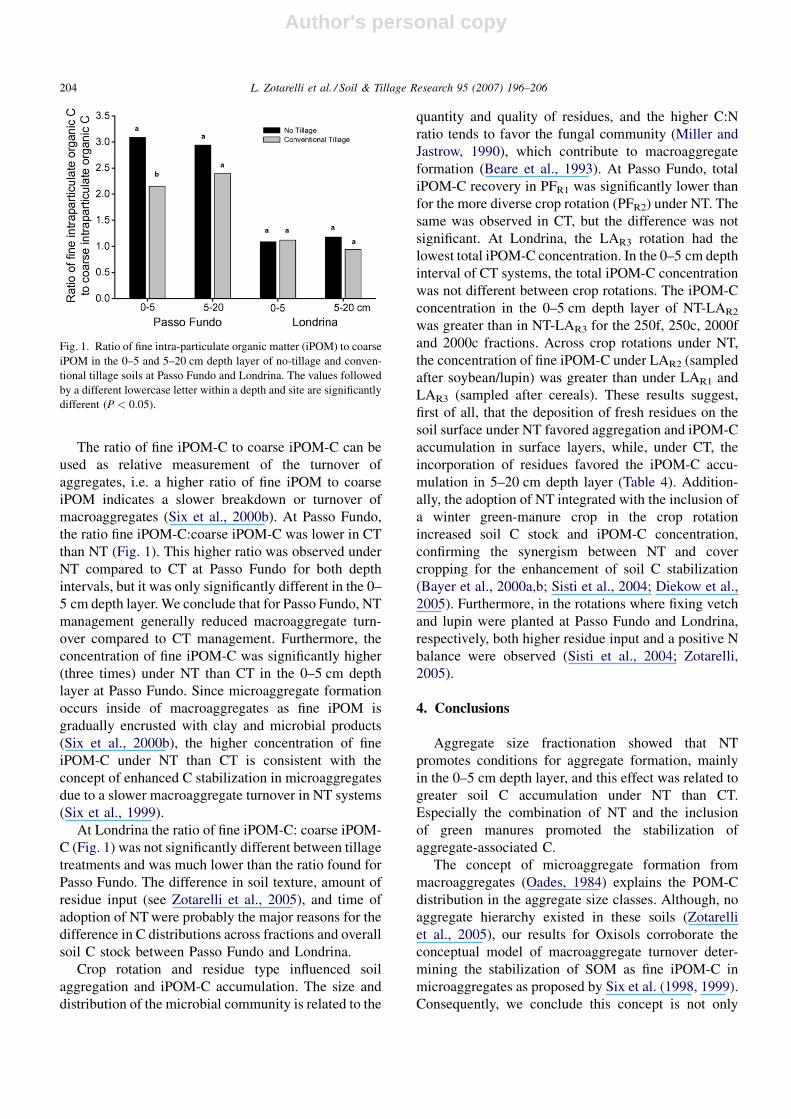
The ratio of fine iPOM-C to coarse iPOM-C can be
used as relative measurement of the turnover of
aggregates, i.e. a higher ratio of fine iPOM to coarse
iPOM indicates a slower breakdown or turnover of
macroaggregates (Six et al., 2000b). At Passo Fundo,
the ratio fine iPOM-C:coarse iPOM-C was lower in CT
than NT (Fig. 1). This higher ratio was observed under
NT compared to CT at Passo Fundo for both depth
intervals, but it was only significantly different in the 0–
5 cm depth layer. We conclude that for Passo Fundo, NT
management generally reduced macroaggregate turn-
over compared to CT management. Furthermore, the
concentration of fine iPOM-C was significantly higher
(three times) under NT than CT in the 0–5 cm depth
layer at Passo Fundo. Since microaggregate formation
occurs inside of macroaggregates as fine iPOM is
gradually encrusted with clay and microbial products
(Six et al., 2000b), the higher concentration of fine
iPOM-C under NT than CT is consistent with the
concept of enhanced C stabilization in microaggregates
due to a slower macroaggregate turnover in NT systems
(Six et al., 1999).
At Londrina the ratio of fine iPOM-C: coarse iPOM-
C (Fig. 1) was not significantly different between tillage
treatments and was much lower than the ratio found for
Passo Fundo. The difference in soil texture, amount of
residue input (see Zotarelli et al., 2005), and time of
adoption of NT were probably the major reasons for the
difference in C distributions across fractions and overall
soil C stock between Passo Fundo and Londrina.
Crop rotation and residue type influenced soil
aggregation and iPOM-C accumulation. The size and
distribution of the microbial community is related to the
quantity and quality of residues, and the higher C:N
ratio tends to favor the fungal community (Miller and
Jastrow, 1990), which contribute to macroaggregate
formation (Beare et al., 1993). At Passo Fundo, total
iPOM-C recovery in PFR1 was significantly lower than
for the more diverse crop rotation (PFR2) under NT. The
same was observed in CT, but the difference was not
significant. At Londrina, the LAR3 rotation had the
lowest total iPOM-C concentration. In the 0–5 cm depth
interval of CT systems, the total iPOM-C concentration
was not different between crop rotations. The iPOM-C
concentration in the 0–5 cm depth layer of NT-LAR2
was greater than in NT-LAR3 for the 250f, 250c, 2000f
and 2000c fractions. Across crop rotations under NT,
the concentration of fine iPOM-C under LAR2 (sampled
after soybean/lupin) was greater than under LAR1 and
LAR3 (sampled after cereals). These results suggest,
first of all, that the deposition of fresh residues on the
soil surface under NT favored aggregation and iPOM-C
accumulation in surface layers, while, under CT, the
incorporation of residues favored the iPOM-C accu-
mulation in 5–20 cm depth layer (Table 4). Addition-
ally, the adoption of NT integrated with the inclusion of
a winter green-manure crop in the crop rotation
increased soil C stock and iPOM-C concentration,
confirming the synergism between NT and cover
cropping for the enhancement of soil C stabilization
(Bayer et al., 2000a,b; Sisti et al., 2004; Diekow et al.,
2005). Furthermore, in the rotations where fixing vetch
and lupin were planted at Passo Fundo and Londrina,
respectively, both higher residue input and a positive N
balance were observed (Sisti et al., 2004; Zotarelli,
2005).
4. Conclusions
Aggregate size fractionation showed that NT
promotes conditions for aggregate formation, mainly
in the 0–5 cm depth layer, and this effect was related to
greater soil C accumulation under NT than CT.
Especially the combination of NT and the inclusion
of green manures promoted the stabilization of
aggregate-associated C.
The concept of microaggregate formation from
macroaggregates (Oades, 1984) explains the POM-C
distribution in the aggregate size classes. Although, no
aggregate hierarchy existed in these soils (Zotarelli
et al., 2005), our results for Oxisols corroborate the
conceptual model of macroaggregate turnover deter-
mining the stabilization of SOM as fine iPOM-C in
microaggregates as proposed by Six et al. (1998, 1999).
Consequently, we conclude this concept is not only
L. Zotarelli et al. / Soil & Tillage Research 95 (2007) 196–206204
Fig. 1. Ratio of fine intra-particulate organic matter (iPOM) to coarse
iPOM in the 0–5 and 5–20 cm depth layer of no-tillage and conven-
tional tillage soils at Passo Fundo and Londrina. The values followed
by a different lowercase letter within a depth and site are significantly
different (P < 0.05).
Author's personal copy
valid for temperate soils dominated by 2:1 clay
minerals, but also for tropical soils dominated by 1:1
clay minerals and oxides.
Acknowledgements
This work was supported by the National Science
Foundation (DEB 0344971). We thank E. Torres
(Embrapa Soja) and H.P. Santos (Embrapa Trigo)
who maintained the long-term experiment at Londrina
and Passo Fundo, respectively, used in this study. The
contribution of D.A. Loni, E.G. Cardoso and M.S. Pires
in soil sampling at Londrina is acknowledged.
References
Alvarez, R., Alvarez, C.R., Daniel, P.E., Richter, V., Blotta, L., 1998.
Nitrogen distribution in soil density fractions and its relation to
nitrogen mineralisation under different tillage systems. Aust. J.
Soil Res. 36, 247–256.
Bayer, C., Mielniczuck, J., Amado, T.J.C., Martin-Neto, L., Fer-
nandes, S.V., 2000a. Organic matter storage in a sandy clay loam
Acrisol affected by tillage and cropping systems in southern
Brazil. Soil Till. Res. 54, 101–109.
Bayer, C., Martin-Neto, J.L., Mielniczuck, T.J.C., Ceretta, C.A.,
2000b. Effect of no-tillage cropping systems on soil organic matter
in a sandy clay loam Acrisol from Southern Brazil monitored by
electron spin resonance and nuclear magnetic resonance. Soil Till.
Res. 53, 95–104.
Beare, M.H., Pohland, B.R., Wright, D.H., Coleman, D.C., 1993.
Residue placement and fungicide effects on fungal communities in
conventional and no-tillage soils. Soil Sci. Soc. Am. J. 57, 392–
399.
Beare, M.H., Cabrera, M.L., Hendrix, P.F., Coleman, D.C., 1994.
Aggregate-protected and unprotected organic matter pools in
conventional- and no-tillage soils. Soil Sci. Soc. Am. J. 58,
787–795.
Cattelan, A.J., Gaudencio, C.A., Silva, T.A., 1997. Sistema de rotacao
de culturas em plantio direto e os microrganismo do solo, na
cultura da soja, em Londrina. Rev. Bras. Ci. Solo 21, 293–301.
Da Silva, J.E., Lemainski, J., Resck, D.V.S., 1994. Perdas de materia
organica e suas relacoes com a capacidade de troca cationica em
solos da reigao de cerrados do oeste baiano. Rev. Bras. Ci. Solo 18,
541–547.
Denef, K., Six, J., Merckx, R., Paustian, K., 2004. Carbon sequestra-
tion in microaggregates of no-tillage soils with different clay
mineralogy. Soil Sci. Soc. Am. J. 68, 1935–1944.
Diekow, J., Mielniczuck, J., Knicker, H., Bayer, C., Dick, D.P., Kogel-
Knabner, I., 2005. Soil C and N stocks as affected by cropping
systems and nitrogen fertilisation in a southern Brazil Acrisol
managed under no-tillage for 17 years. Soil Till. Res. 81, 87–95.
Doran, J.W., 1987. Microbial biomass and mineralizable nitrogen
distribution into-tillage and plowed soils. Biol. Fert. Soils 5, 68–
75.
Elliott, E.T., 1986. Aggregate structure and carbon, nitrogen and
phosphorus in native and cultivated soils. Soil Sci. Soc. Am. J.
50, 627–633.
Elliott, E.T., Palm, C.A., Reuss, D.E., Monz, C.A., 1991. Organic
matter contained in soil aggregates from a tropical chronose-
quence, correction for sand and light fraction. Agric. Eco. Env.
34, 443–451.
Freixo, A.A., Machado, P.L.O., Santos, H.P., Silva, C.A., Fadigas,
F.S., 2002. Soil organic carbon and fractions of a Rhodic Ferralsol
under the influence of tillage and crop rotation in southern Brazil.
Soil Till. Res. 64, 221–230.
Frey, S.D., Elliott, E.T., Paustian, K., 1999. Bacterial and fungal
abundance and biomass in conventional and no-tillage agroeco-
systems along two climatic gradients. Soil Biol. Biochem. 31,
573–585.
Gale, W.J., Cambardella, C.A., Bailey, T.B., 2000. Surface residue and
root-derived carbon in stable and unstable aggregates. Soil Sci.
Soc. Am. J. 64, 196–201.
Golchin, A., Oades, J.M., Skjemstad, J.O., Clarke, P., 1994. Soil
structure and carbon cycling. Aust. J. Soil Res. 32, 1043–1068.
Golchin, A., Baldock, J.A., Oades, J.M., 1998. A model linking organic
matter, pp. 15–49, decomposition, chemistry, and aggregate
dynamics. In: R. Lal, et al. (Eds.), Soil Processes and the Carbon
Cycle. Lewis Publ., CRC Press, Boca Raton, FL. pp. 245–266.
Havlin, J.L., Kissel, D.E., Maddux, L.D., Claasen, M.M., Long, J.H.,
1990. Crop rotation and tillage effects on soil organic carbon and
nitrogen. Soil Sci. Soc. Am. J. 54, 448–452.
Janzen, H.H., Campbell, C.A., Brandt, S.A., Lafond, G.P., Townley-
Smith, L., 1992. Light fraction in soils from long-term crop
rotations. Soil Sci. Soc. Am. J. 56, 1799–1806.
John, B., Yamashita, T., Ludwig, B., Flessa, H., 2005. Storage of
organic carbon in aggregate and density fractions of silty soils
under different types of land use. Geoderma 128, 63–79.
Jungerius, P.D., van den Ancker, J.A.M., Mucher, H.J., 1999. The
contribution of termites to the microgranular structure of soils on
the Uasin Gishu Plateau, Kenya. Catena 34, 349–363.
Kolbl, A., Kogel-Knabner, I., 2004. Content and composition of free
and occluded particulate organic matter in a differently textured
arable Cambisol as revealed by solid-state 13C NMR spectroscopy.
J. Plant Nutr. Soil Sci. 167, 45–53.
Little, T.M., Jackson-Hills, F., 1978. Agricultural Experimentation.
John Willey, New York.
Miller, R.M., Jastrow, J.D., 1990. Hierarchy of roots and mycorrhizal
fungal interactions with soil aggregation. Soil Biol. Biochem. 22,
579–584.
Oades, J.M., 1984. Soil organic matter and structural stability:
mechanisms and implication for management. Plant Soil 76,
319–337.
Oades, J.M., Waters, A.G., 1991. Aggregate hierarchy in soils. Aust. J.
Soil Res. 29, 815–828.
Paul, E.A., Paustian, K., Elliott, E.T., Cole, C.V., 1997. Soil Organic
Matter in Temperate Agroecosystems Long Term Experiments in
North America. CRC Press, Boca Raton, FL.
Paustian, K., Collins, H.P., Paul, E.A., 1997. Management controls on
soil carbon. In: Paul, E.A., Paustian, K., Elliott, E.T., Cole, C.V.
(Eds.), Soil Organic Matter in Temperated Agroecosystems. CRC
Press, Boca Raton, FL, pp. 15–49.
Resende, M., Curi, N., Resende, S.B., Correa, G.F., 1997. Pedologia:
base para distincao de ambientes, Vicosa: UFV, 367 p.
Rillig, M.C., Mummey, D.L., 2006. Mycorrhizas and soil structure.
New Phytol. 171, 41–53.
Roscoe, R., Buurman, P., Van Lagen, B., Velthorst, E., 2004. Trans-
formations in occluded light fraction organic matter in a clayey
oxisol; evidence from 13C-CPMAS-NRM and d13C signature. Rev.
Bras. Ci. Solo 28, 811–818.
Sisti, C.P.J., Santos, H.P., Kohhan, R., Alves, B.J.R., Urquiaga, S.,
Boddey, R.M., 2004. Change in carbon and nitrogen stocks in soil
L. Zotarelli et al. / Soil & Tillage Research 95 (2007) 196–206 205
Author's personal copy
under 13 years of conventional or zero tillage in southern Brazil.
Soil Till. Res. 76, 39–58.
Six, J., Elliott, E.T., Paustian, K., Doran, J.W., 1998. Aggregation and
soil organic matter accumulation in cultivated and native grassland
soils. Soil Sci. Soc. Am. J. 62, 1367–1377.
Six, J., Elliott, E.T., Paustian, K., 1999. Aggregate and soil organic
matter dynamics under conventional and no-tillage systems. Soil
Sci. Soc. Am. J. 63, 1350–1358.
Six, J., Elliott, E.T., Paustian, K., Combrink, C., 2000a. Soil structure
and organic matter. I. Distribution of aggregate-size classes and
aggregate-associated carbon. Soil Sci. Soc. Am. J. 64, 681–689.
Six, J., Elliott, E.T., Paustian, K., 2000b. Soil macroaggregate turnover
and microaggregate formation: a mechanism for C sequestration
under no-tillage agriculture. Soil Biol. Biochem. 32, 2099–2103.
Six, J., Guggenberger, G., Paustian, K., Haumaier, L., Elliott, E.T.,
Zech, W., 2001. Sources and composition of physically defined
soil organic matter fractions. Eur. J. Soil Sci. 52, 607–618.
Six, J., Feller, C., Denef, K., Ogle, S.M., Sa, J.C.M., Albecht, A.,
2002. Soil organic matter, biota and aggregation in temperate
and tropical soils—effect of no-tillage. Agronomie 22, 755–
775.
Tisdall, J.M., 1991. Fungal hyphae and structural stability of soils.
Aust. J. Soil Res. 29, 729–743.
Tisdall, J.M., Oades, J.M., 1982. Organic matter and water stable
aggregation in soils. J. Soil Sci. 33, 141–163.
Zotarelli, L. 2005. Influence of No-tillage and Conventional Tillage
and Crop Rotation on Soil Aggregation, Soil Carbon Accumula-
tion and Nitrous Oxide Emissions in a Rhodic Ferralsol. Ph.D.
Thesis, Universidade Federal Rural do Rio de Janeiro, Seropedica,
117 pp. (in Portuguese).
Zotarelli, L., Alves, B.J.R., Urquiaga, S., Torres, E., Santos, H.P.,
Paustian, K., Boddey, R.M., Six, J., 2005. Impact of tillage and
crop rotation on aggregate-associated carbon in two oxisols. Soil
Sci. Soc. Am. J. 69, 482–491.
L. Zotarelli et al. / Soil & Tillage Research 95 (2007) 196–206206