Reducing Tillage In Small-Scale Permanent Bed Organic ...
99
e University of Maine DigitalCommons@UMaine Electronic eses and Dissertations Fogler Library Spring 5-2018 Reducing Tillage In Small-Scale Permanent Bed Organic Vegetable Production Systems Jeremiah D. Valloon University of Maine, [email protected] Follow this and additional works at: hps://digitalcommons.library.umaine.edu/etd Part of the Agricultural Science Commons , Agriculture Commons , Agronomy and Crop Sciences Commons , Environmental Microbiology and Microbial Ecology Commons , Environmental Sciences Commons , Horticulture Commons , Soil Science Commons , and the Weed Science Commons is Open-Access esis is brought to you for free and open access by DigitalCommons@UMaine. It has been accepted for inclusion in Electronic eses and Dissertations by an authorized administrator of DigitalCommons@UMaine. For more information, please contact [email protected]. Recommended Citation Valloon, Jeremiah D., "Reducing Tillage In Small-Scale Permanent Bed Organic Vegetable Production Systems" (2018). Electronic eses and Dissertations. 2869. hps://digitalcommons.library.umaine.edu/etd/2869
-
Upload
khangminh22 -
Category
Documents
-
view
0 -
download
0
Transcript of Reducing Tillage In Small-Scale Permanent Bed Organic ...
The University of MaineDigitalCommons@UMaine
Electronic Theses and Dissertations Fogler Library
Spring 5-2018
Reducing Tillage In Small-Scale Permanent BedOrganic Vegetable Production SystemsJeremiah D. VallottonUniversity of Maine, [email protected]
Follow this and additional works at: https://digitalcommons.library.umaine.edu/etd
Part of the Agricultural Science Commons, Agriculture Commons, Agronomy and CropSciences Commons, Environmental Microbiology and Microbial Ecology Commons,Environmental Sciences Commons, Horticulture Commons, Soil Science Commons, and the WeedScience Commons
This Open-Access Thesis is brought to you for free and open access by DigitalCommons@UMaine. It has been accepted for inclusion in ElectronicTheses and Dissertations by an authorized administrator of DigitalCommons@UMaine. For more information, please [email protected].
Recommended CitationVallotton, Jeremiah D., "Reducing Tillage In Small-Scale Permanent Bed Organic Vegetable Production Systems" (2018). ElectronicTheses and Dissertations. 2869.https://digitalcommons.library.umaine.edu/etd/2869
REDUCING TILLAGE IN SMALL-SCALE PERMANENT BED
ORGANIC VEGETABLE PRODUCTION
SYSTEMS
By
Jeremiah D. Vallotton
B.A. Eastern Mennonite University, 2010
A THESIS
Submitted in Partial Fulfillment of the
Requirements for the Degree of
Master of Science
(in Plant, Soil, and Environmental Science)
The Graduate School
The University of Maine
May 2018
Advisory Committee:
Mark Hutton, Associate Professor of Vegetable Crops and Extension Vegetable Specialist,
Advisor
Mark Hutchinson, Extension Professor
Susan Erich, Professor of Soil Chemistry
REDUCING TILLAGE IN SMALL-SCALE PERMANENT BED
ORGANIC VEGETABLE PRODUCTION
SYSTEMS
By Jeremiah D. Vallotton
Thesis Advisor: Dr. Mark Hutton
An Abstract of the Thesis Presented in Partial Fulfillment of the Requirements for the
Degree of Master of Science (in Plant, Soil, and Environmental Science)
May 2018
The response of field-grown vegetable crops to reduced tillage and mulching in permanent beds
was evaluated through measuring crop yields, weed pressure, earthworm counts, and soil basal
respiration. Two vegetable crops (“Bush Delicata” squash and “Farao” cabbage) were started in April
and May of 2016 and 2017 respectively, transplanted in late June, and harvested on 15-Sep-2016 and
25-Aug-2017. Fruit number and weight of squash, and head weight and feeding damage of cabbage
were measured. These results suggest that intensive tillage (8” rototill every year) can be successfully
reduced to alternating years of shallow (2”) rototilling and a less intensive form of tillage (e.g. biotill or
DZT) without loss of yields. No-till as practiced in this experiment experienced major yield losses, while
no-till accompanied by pre-season tarping was capable of yields that equaled or exceeded any tilled
treatment. Mulching crops has a positive effect on crop yields, with a 3” compost mulch yielding the
highest of any tillage/mulch combination regardless of tillage type, and with straw-mulched treatments
usually yielding higher than unmulched plots but lower than compost-mulched plots.
Weed populations were also sampled once each year in the same plots, with number of weeds,
percent leaf area, and number of species in a 0.25 m2 quadrant collected for each plot. Tilled

treatments had similar weed pressure regardless of tillage intensity, with the exception of 2” Rototill.
Weed populations were highest in No-till plots in both seasons, and lowest in Tarped plots. Compost-
mulched plots had the best weed control, followed by Straw and Unmulched plots. Straw-mulched plots
were inconsistent in their weed control and had major insect problems in 2017. Most plots had similar
weed species, with the exception of Tarped plots, which had no perennial weeds and significantly lower
weed diversity. No-till plots appeared to be shifting towards aggressive or perennial weeds, while
tarping combined with compost mulch almost completely eliminated weed populations.
Soil health was measured through earthworm counts and basal soil respiration on three of the
tillage treatments. Earthworm counts were performed by hand sorting at the start of the 2017 growing
season, and revealed that earthworms favored plots that had high quantities of plant residue (straw-
mulch). Soil respiration was measured during the growing season of 2017, utilizing the 24-hour Solvita™
basal respiration test, which was performed on minimally disturbed field-moist soil. Respiration during
the growing season was not limited by temperature, but was influenced by low moisture. No-till plots
had higher respiration than tilled or Tarped plots, perhaps due to diverse early-season root mass in the
No-till plots.
We concluded that reducing tillage is possible from the perspective of both yields and weed
pressure, especially when combined with mulches, while no-till is impractical without pre-season weed
control. The best yield and weed results were found in Tarped and Compost-mulched plots.
Earthworms showed clear preferences for crop residues and less disturbance, while soil respiration was
controlled by moisture and may have been influenced by root presence/absence.
ii
ACKNOWLEDGEMENTS
Jeremiah wishes to express thanks to the multitudinous people who made this thesis possible,
including: all student workers at Highmoor Farm 2016-2018, Nick Rowley, Renae Moran, Mark Hutton,
Mark Hutchinson, Susan Erich, Audrey Laffeley, Sonja Birthisel, Eric Gallandt, Tsutomu Ohno, Jianjun
Hao, Anu Rangerajan, Ryan Maher, Brian Caldwell, and the School of Food and Agriculture at the
University of Maine. Jeremiah is particularly grateful to William Brinton, whose willingness to be a
mentor and collaborate greatly enhanced this thesis, and William Halteman, whose statistical
knowledge and mentoring was invaluable. An especial thanks is given to Jeremiah’s family, especially
his parents Daniel and Amber, and his longsuffering wife Katherine, who patiently bore close to a year
with a mentally and often physically absent husband like a saint. This thesis would not have been
possible without her support, and is dedicated to her.
iii
TABLE OF CONTENTS
ACKNOWLEDGEMENTS ................................................................................................................................. ii
LIST OF TABLES .............................................................................................................................................. v
LIST OF FIGURES ........................................................................................................................................... vi
CHAPTER 1: LITERATURE REVIEW ................................................................................................................. 1
Introduction ..................................................................................................................................... 1
Soil Health ........................................................................................................................................ 3
Organic Agriculture .......................................................................................................................... 6
Reducing Tillage In Agricultural Systems ......................................................................................... 8
Challenges Of Reducing/Eliminating Tillage In Organic Agriculture .............................................. 12
Mulching And Permanent Beds: A Potential Path For Organic Reduced Till ................................. 16
Research Statement ....................................................................................................................... 19
CHAPTER 2: TILLAGE AND MULCH EFFECTS ON CROP YIELD WITHIN AN ORGANIC SMALL-SCALE
PERMANENT BED VEGETABLE SYSTEM ....................................................................................................... 21
Introduction ................................................................................................................................... 21
Methods ......................................................................................................................................... 22
Results ............................................................................................................................................ 27
Site Temperature And Moisture ....................................................................................... 27
Pest Issues ......................................................................................................................... 29
Yields ................................................................................................................................. 30
Discussion ...................................................................................................................................... 34
CHAPTER 3: USING MULCH AND TILLAGE TO REDUCE WEED PRESSURE IN CONSERVATION TILLAGE
SYSTEMS ...................................................................................................................................................... 41
Introduction ................................................................................................................................... 41
iv
Methods ......................................................................................................................................... 42
Results ............................................................................................................................................ 44
Discussion ...................................................................................................................................... 52
CHAPTER 4: EVALUATING SOIL HEALTH IN REDUCED TILLAGE SYSTEMS ................................................... 60
Introduction ................................................................................................................................... 60
Methods ......................................................................................................................................... 61
Earthworm Counts ............................................................................................................ 61
Soil Respiration ................................................................................................................. 61
Results ............................................................................................................................................ 63
Earthworm Counts ............................................................................................................ 63
Soil Respiration ................................................................................................................. 65
Discussion ...................................................................................................................................... 68
Earthworm Counts ............................................................................................................ 68
Soil Respiration ................................................................................................................. 71
CHAPTER 5: CONCLUSIONS ......................................................................................................................... 74
BIBLIOGRAPHY ............................................................................................................................................ 76
APPENDICES ................................................................................................................................................ 86
Appendix A: Experimental Design .................................................................................................. 86
Appendix B: Orthogonal Contrast Design ...................................................................................... 87
Appendix C: Statistical Addendum for Chapter 2 .......................................................................... 88
Appendix D: Weed Counts by Block ............................................................................................... 89
BIOGRAPHY OF THE AUTHOR...................................................................................................................... 90
v
LIST OF TABLES
Table 2.1: List of treatments for experimental plots ..................................................................... 24
Table 2.2: Squash fruit number and weights by tillage (2016) ...................................................... 31
Table 2.3: Squash fruit number and weights by mulch (2016) ...................................................... 31
Table 2.4: Cabbage head weight and feeding damage by tillage (2017) ....................................... 32
Table 2.5: Cabbage head weight and feeding damage by mulch (2017) ....................................... 33
Table 3.1: Weed count and percent cover by tillage (2016 and 2017) .......................................... 45
Table 3.2: Weed count and percent cover by mulch (2016 and 2017) ......................................... 45
Table 3.3: F-values for main effect contrasts of weed data (2016 and 2017) ............................... 45
Table 3.4: F-values for interaction contrasts of weed data (2016 and 2017) ................................ 46
Table 3.5: Means for species richness of weeds (2016 and 2017) ................................................ 48
Table 3.6: Top three weed species by tillage and mulch type (2016 and 2017) ........................... 48
Table A.1: P-values for orthogonal contrasts (2016 and 2017) ..................................................... 89

vi
LIST OF FIGURES
Figure 2.1: Average daily soil temperature for 8” Rototill, No-till, and Tarped plots (2017) ........ 28
Figure 2.2: Maximum and minimum daily air temperature (2017) ............................................... 28
Figure 2.3: Rainfall and soil moisture for 8” Rototill, No-till, and Tarped plots (2017) ................. 29
Figure 2.4: Feeding damage on cabbage by tillage and mulch (2017) .......................................... 33
Figure 2.5: Cabbage head weight by tillage and mulch (2017) ...................................................... 34
Figure 3.1: Percent of weeds in total count measured in tillage by mulch plots (2017) ............... 49
Figure 3.2: Weed counts by tillage and mulch (2016) ................................................................... 50
Figure 3.3: Weed counts by tillage and mulch (2017) ................................................................... 51
Figure 3.4: Percent cover by tillage and mulch (2016) .................................................................. 51
Figure 3.5: Percent cover by tillage and mulch (2017) .................................................................. 52
Figure 3.6: Species richness by tillage and mulch (2017) .............................................................. 52
Figure 4.1: Earthworm counts by tillage (2017) ............................................................................ 64
Figure 4.2: Earthworm counts by mulch (2017) ............................................................................ 64
Figure 4.3: Average soil temperature vs. average soil respiration by date (2017) ........................ 66
Figure 4.4: Average soil moisture vs. average soil respiration by date (2017) .............................. 67
Figure 4.5: Seasonal trends for soil respiration by treatment (2017) ............................................ 68
Figure A.1: Map of experimental plots at Highmoor Farm in Monmouth, ME ............................. 86
Figure A.2: Residual vs. Predicted values for squash weight (2016) ............................................. 88
Figure A.3: Comparison of weed counts in Tarped plots by block (2017) ..................................... 89
1
CHAPTER 1: LITERATURE REVIEW
INTRODUCTION
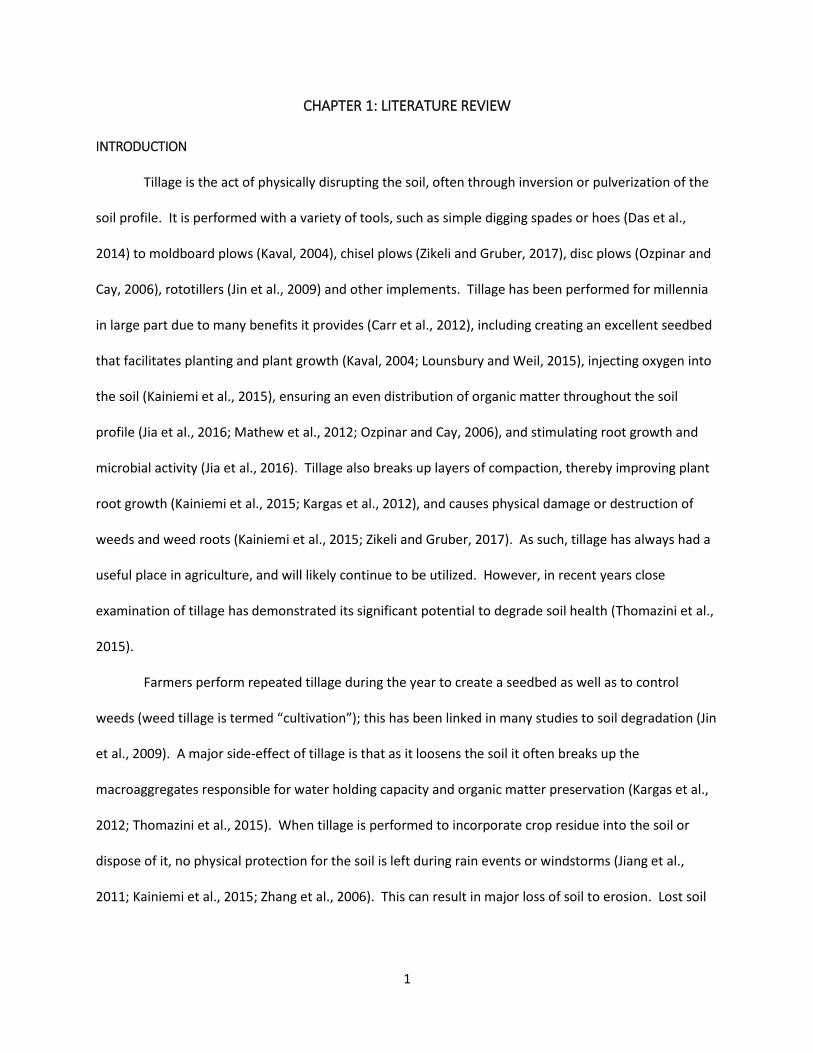
Tillage is the act of physically disrupting the soil, often through inversion or pulverization of the
soil profile. It is performed with a variety of tools, such as simple digging spades or hoes (Das et al.,
2014) to moldboard plows (Kaval, 2004), chisel plows (Zikeli and Gruber, 2017), disc plows (Ozpinar and
Cay, 2006), rototillers (Jin et al., 2009) and other implements. Tillage has been performed for millennia
in large part due to many benefits it provides (Carr et al., 2012), including creating an excellent seedbed
that facilitates planting and plant growth (Kaval, 2004; Lounsbury and Weil, 2015), injecting oxygen into
the soil (Kainiemi et al., 2015), ensuring an even distribution of organic matter throughout the soil
profile (Jia et al., 2016; Mathew et al., 2012; Ozpinar and Cay, 2006), and stimulating root growth and
microbial activity (Jia et al., 2016). Tillage also breaks up layers of compaction, thereby improving plant
root growth (Kainiemi et al., 2015; Kargas et al., 2012), and causes physical damage or destruction of
weeds and weed roots (Kainiemi et al., 2015; Zikeli and Gruber, 2017). As such, tillage has always had a
useful place in agriculture, and will likely continue to be utilized. However, in recent years close
examination of tillage has demonstrated its significant potential to degrade soil health (Thomazini et al.,
2015).
Farmers perform repeated tillage during the year to create a seedbed as well as to control
weeds (weed tillage is termed “cultivation”); this has been linked in many studies to soil degradation (Jin
et al., 2009). A major side-effect of tillage is that as it loosens the soil it often breaks up the
macroaggregates responsible for water holding capacity and organic matter preservation (Kargas et al.,
2012; Thomazini et al., 2015). When tillage is performed to incorporate crop residue into the soil or
dispose of it, no physical protection for the soil is left during rain events or windstorms (Jiang et al.,
2011; Kainiemi et al., 2015; Zhang et al., 2006). This can result in major loss of soil to erosion. Lost soil
2
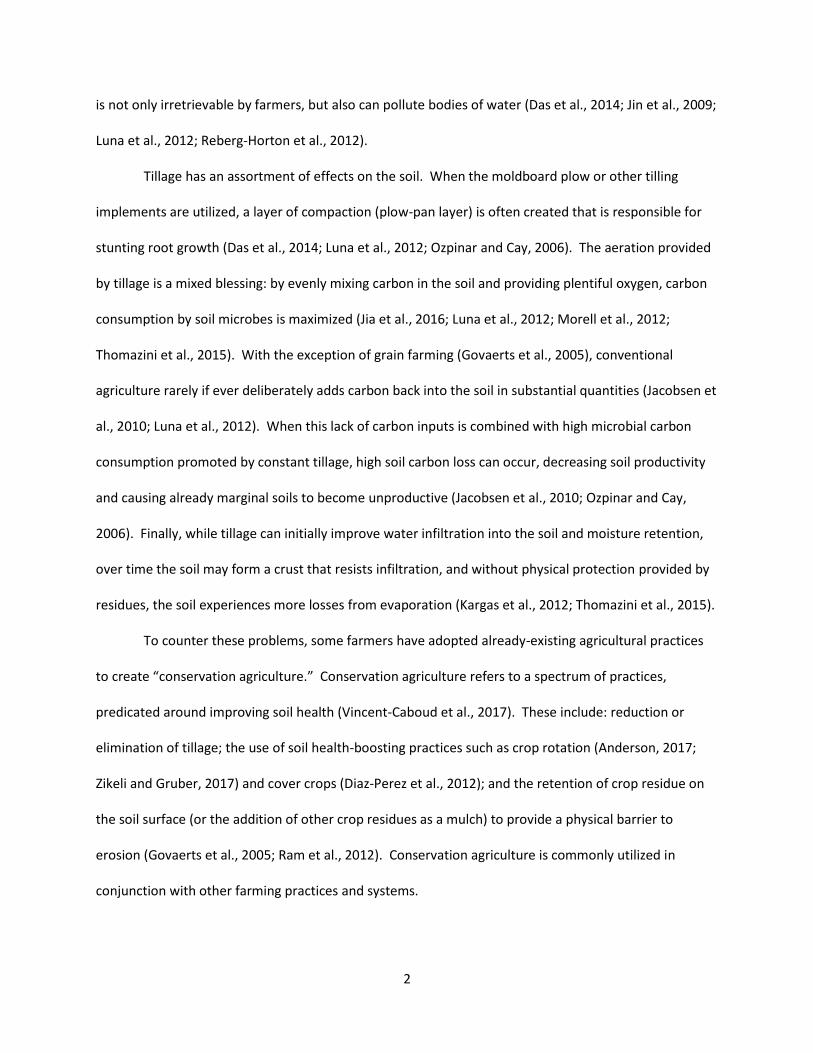
is not only irretrievable by farmers, but also can pollute bodies of water (Das et al., 2014; Jin et al., 2009;
Luna et al., 2012; Reberg-Horton et al., 2012).
Tillage has an assortment of effects on the soil. When the moldboard plow or other tilling
implements are utilized, a layer of compaction (plow-pan layer) is often created that is responsible for
stunting root growth (Das et al., 2014; Luna et al., 2012; Ozpinar and Cay, 2006). The aeration provided
by tillage is a mixed blessing: by evenly mixing carbon in the soil and providing plentiful oxygen, carbon
consumption by soil microbes is maximized (Jia et al., 2016; Luna et al., 2012; Morell et al., 2012;
Thomazini et al., 2015). With the exception of grain farming (Govaerts et al., 2005), conventional
agriculture rarely if ever deliberately adds carbon back into the soil in substantial quantities (Jacobsen et
al., 2010; Luna et al., 2012). When this lack of carbon inputs is combined with high microbial carbon
consumption promoted by constant tillage, high soil carbon loss can occur, decreasing soil productivity
and causing already marginal soils to become unproductive (Jacobsen et al., 2010; Ozpinar and Cay,
2006). Finally, while tillage can initially improve water infiltration into the soil and moisture retention,
over time the soil may form a crust that resists infiltration, and without physical protection provided by
residues, the soil experiences more losses from evaporation (Kargas et al., 2012; Thomazini et al., 2015).
To counter these problems, some farmers have adopted already-existing agricultural practices
to create “conservation agriculture.” Conservation agriculture refers to a spectrum of practices,
predicated around improving soil health (Vincent-Caboud et al., 2017). These include: reduction or
elimination of tillage; the use of soil health-boosting practices such as crop rotation (Anderson, 2017;
Zikeli and Gruber, 2017) and cover crops (Diaz-Perez et al., 2012); and the retention of crop residue on
the soil surface (or the addition of other crop residues as a mulch) to provide a physical barrier to
erosion (Govaerts et al., 2005; Ram et al., 2012). Conservation agriculture is commonly utilized in
conjunction with other farming practices and systems.

3
SOIL HEALTH
Good soil health is indicated by a mixture of physical, chemical, and biological measurements.
These include good nutrient supply, sufficient drainage, soil depth and looseness, low amounts of
parasites, a lack of harmful chemicals, high populations of plant-growth promoting organisms, lowered
weed pressure, soil resilience, and resistance to degradation (Magdoff, 2001). Other soil scientists
emphasize the biological components of soil health (e.g. plants, microbes) to describe soil’s living
attributes and their interplay with physical and chemical properties (Doran and Jones, 1996; Herrick,
2000). Soil health can be measured both by specific parameters (such as compaction and nutrient
status), as well as by the response of organisms within the soil to these parameters (e.g. microbial
biomass and respiration) (Doran and Zeiss, 2000).
Practicing conservation tillage and/or organic agriculture can lead to better soil health by
improving aggregation, lowering bulk density, and increasing microbial activity and diversity. As noted
by Lori et al. (2017) and others, this improved soil health is strongly associated with cover cropping and
other conservation agriculture practices. Kallenbach et al. (2015) even suggests that despite lower
inputs of C via residue in tilled organic systems, they can accumulate more carbon over time due to
greater microbial activity fostered by cover crops. Microbial populations respond to conservation
agriculture with increased activity, diversity, biomass, and alteration of soil C and N flow, which can lead
to healthier and more resilient plants (Anderson, 2017; Mäder et al., 2002). Monitoring soil conditions
(moisture and temperature) that may affect organisms over the course of a season is valuable
information that can be used to understand soil health and its relation to the environment (Doran and
Jones, 1996; Fließbach et al., 2007; Haney et al., 2008b).
One soil health indicator is earthworm counts. Earthworms are viewed as a critical species
within most agricultural soils. They are “soil engineers” who improve soil quality through their tunneling
actions, and can promote aggregation, break up compaction, and distribute organic matter throughout

4
the soil profile (Chan, 2001; Brown and Gallandt, 2018; Čoja et al., 2008; Pelosi et al., 2009). Earthworm
populations are influenced by moisture and temperature, which can have a major impact on location
and numbers in the soil profile on a daily basis (Chan, 2001; Lawrence and Bowers, 2002). Earthworms
are positively correlated with high carbon input organic agriculture (Ge et al., 2011; Halde et al., 2017;
Mäder et al., 2002), and are stimulated by the presence of organic matter (such as mulch or compost)
and crop residue (their primary food sources) (Chan, 2001; Halde et al., 2017; Law et al., 2006; Li et al.,
2014; Rogers et al., 2004; Vincent-Caboud et al., 2017).
Intensive tillage (e.g. rototilling) is negatively correlated with earthworm presence, while
inversion tillage (e.g. moldboard plow) or shallow tillage (e.g. discing) has less effect (Chan, 2001).
Though earthworm populations (especially deep-dwelling) often decrease from migration or death
following tillage, surface-dwelling earthworm species can increase in numbers following tillage due to
mixing of carbon into the soil (Chan, 2001; Halde et al., 2017). Reducing or eliminating tillage increases
earthworm populations; no-till plots often have 2-9 times more earthworms (Chan, 2001; Duboc et al.,
2011) and greater biomass than tilled plots (Zikeli and Gruber, 2017). Chan (2001) notes that decreases
in earthworm populations following tillage are more predicated on timing and unfavorable
environmental conditions created by tillage rather than by the physical action of tillage itself, and that
loss of habitat, food, and cover is often what diminishes earthworm populations.
Earthworms can be counted by a variety of methods, such as chemical irritants (e.g. mustard
powder) or hand sorting (manually sampling a volume of soil) but no single method is efficacious in
providing an accurate representation of the dynamics of earthworm populations (Čoja et al., 2008;
Eisenhauer et al., 2008; Lawrence and Bowers, 2002; Pelosi et al., 2009). Though hand-sorting is time-
consuming and can underestimate deep-burrowing earthworms, it tends to capture a high proportion of
earthworm population, especially when combined with other methods (e.g. chemical irritants) (Čoja et
al., 2008; Lawrence and Bowers, 2002; Pelosi et al., 2009).

5
Another important indicator of soil health is soil respiration. Soil respiration measures the
quantity of carbon dioxide emitted from the soil in a given period of time, and is directly correlated with
biological activity in soil (Fließbach et al., 2007; Haney et al., 2008b). It is calculated as “ppm CO2-C,”
which is a measure of the amount of carbon being respired from the soil in the form of carbon dioxide.
Though soil respiration cannot measure what species are present in the soil, it is a measure of how
much life is present in the soil (Kainiemi et al., 2015; Morell et al., 2012; Sharma et al., 2011; Shi et al.,
2012; Thomazini et al., 2015). Soil respiration is often closely correlated with other measures of
microbial health and activity, such as microbial biomass, enzyme activity, and microbial diversity, all of
which interplay with other factors in the soil (Kallenbach et al., 2015; Lori et al., 2017).
Soil respiration rates depend on a complex, dynamic interaction between temperature,
moisture, texture, and soil disturbance, among other things (Fließbach et al., 2007; Jia et al., 2016;
Kainiemi et al., 2016). Greater respiration indicates higher microbial activity, either due to stimulation
by biological parameters such as root exudates, by environmental factors such as temperatures, or by
physical disturbance like tillage (Eisenhaur et al., 2010; Kainiemi et al., 2015; Nawaz et al., 2017). Higher
respiration is correlated with high temperatures, substantial moisture, plenty of oxygen, and readily
available food (carbon and nitrogen) (Fließbach et al., 2007; Kainiemi et al., 2016; Robinson et al., 2017).
While it is disputed whether higher respiration is always desirable, many scientists agree that it is an
indicator of soil health, though too much is problematic since it represents carbon loss from the soil
(Castro Bustamante and Hartz, 2016; Fließbach et al., 2007; Haney et al., 2008a; Jia et al., 2016). One
issue with measuring respiration is that soil preparation for laboratory tests will often pulverize soil
structure and alter its natural field distribution, which may mean that the results of these tests do not
accurately reflect field conditions. Thus, utilizing a respiration test that gathers data from field soil that
is minimally disturbed may best reflect the natural heterogeneity of the soil (Castro Bustamante and
Hartz, 2016; Haney et al., 2008a; Herrick, 2000; Tu, 2016).
6
Earthworms and soil respiration have varying degrees of usefulness as methods for measuring
soil health. While earthworms have important roles within soil, exact counts of earthworms in any given
soil should be considered a qualitative, not quantitative, estimate (Lawrence and Bowers, 2002). The
spatial variability of earthworms is affected by changes in plant residues, tillage, soil moisture levels, or
even distance from the edge of a field. As such, earthworm counts are not always the best indicators of
soil health, especially since counts only measure local effects at a particular point in time (Jiménez et al.,
2014; van Schaik et al., 2016). Soil respiration is more useful since it measures the overall biological
activity of all organisms in the soil (not just one species). It is versatile and can be used to measure
changes in microbial activity for both local effects and the global carbon cycle (Lori et al., 2017; Ryan,
2010; Yonemura et al., 2014). However, soil respiration can be altered rapidly from changes in
environmental factors (such as moisture levels), and this can make respiration inconsistent over time
and space (Boone et al., 1998; Robinson et al., 2017). Both of these measures are perhaps best
understood in the context of other measures of soil health, such as microbial biomass or microbial
diversity, that paint a broader picture of soil health (Kallenbach et al., 2015; Lori et al., 2017).
ORGANIC AGRICULTURE
Organic agriculture is based on a commitment to soil health, diversity, and fertility, as well as
the enhancement of carbon in the soil (Delate et al., 2012; Duboc et al., 2011; Luna et al., 2012; Zikeli
and Gruber, 2017). It utilizes tillage to both prepare the soil and mix in amendments as well as to
control weeds, similar to conventional agriculture (Luna et al., 2012). Organic agriculture aims to
enhance soil carbon through introducing organic matter to the soil via organically derived additives such
as animal manures or compost, which are utilized in place of synthetic agricultural products such as
fertilizers (Delate et al., 2012; Ge et al., 2011; Ryan, 2010). It is governed by a set of government

7
regulations that determine what agricultural practices and substances can and cannot be used by the
farmer (Zikeli and Gruber, 2017).
Some of the benefits of organic agriculture include minimal pesticide residue in the
environment, less nutrient run-off due to the stability of organic amendments in the soil (Mäder et al.,
2002; Ryan, 2010), and improved soil health (Ge et al., 2011; Halde et al., 2015). Organic agriculture
uses diverse mixtures of soil amendments and often makes use of conservation agriculture practices
such as crop rotation and cover cropping. Because of this, microbial and non-microbial animal
populations (e.g. earthworms) tend to be larger and more diverse, and utilize carbon more efficiently in
organic agriculture compared to conventional agriculture (Fleibach; Ge et al., 2011; Halde et al., 2017;
Mäder et al., 2002). Soil physical properties, such as water infiltration and aggregation, can be improved
under organic management (Mäder et al., 2002; Ryan, 2010). Though yields in organic agriculture can
be lower, they sell at a premium price, and organic agriculture often integrates diverse crop rotations
and/or animals. This marketplace advantage and diversity of products increases profitability and
security for organic farmers, especially on a smaller-scale (Jacobsen et al., 2010; Morse, 2000;
Panneerselvam et al., 2011).
Some problems with organic agriculture include pest problems, potential soil degradation from
intensive tillage (Delate et al., 2012), and issues with management. Organic farmers require knowledge-
based skills to manage fertility and pest challenges often solved with more fertilizer or pesticides in
conventional agriculture (Zikeli and Gruber, 2017). Because conventional pesticides cannot be used to
control weeds and pests, organic agriculture tends to utilize more tillage and a variety of labor-intensive
hand methods such as hoeing and flame-weeding (Delate et al., 2012; Halde et al., 2015; Luna et al.,
2012). Organic agriculture also utilizes beneficial insects for pest control, along with naturally-derived
pesticides that control pest populations with varied levels of success (Delate et al., 2012).

8
Well-managed organic agriculture has the potential, tilled or not, to have the highest soil health
parameters, such as superior aggregation and higher soil microbial biomass/diversity, because of the
way that carbon-rich organic amendments and complex crop rotation strategies are integrated into the
system (Delate et al., 2012; Ge et al., 2011; Mirsky et al., 2012; Sharma et al., 2011; Zikeli and Gruber,
2017). This improved soil health in organic agriculture appears to be consistent regardless of the use or
absence of tillage (Berner et al., 2008; Carr et al., 2012; Delate et al., 2012; Halde et al., 2015; Mirsky et
al., 2013; Sharma et al., 2011; Thomazini et al., 2015; Vincent-Caboud et al., 2017; Zikeli and Gruber,
2017).
REDUCING TILLAGE IN AGRICULTURAL SYSTEMS
Conservation tillage can be defined as leaving at least 30% of crop residue on the surface of the
soil (Carr et al., 2012; He et al., 2006; Mathew et al., 2012). This leaves room for a wide variety of
practices ranging from reduced tillage (leaving 30%+ residue) to no-till (eliminating tillage and leaving
100% residue). Conservation tillage focuses on the problems inherent to excessive tillage and the
removal of crop residue: erosion and soil degradation (Bedano and Dominguez, 2016). Crop residues
provide physical shielding of the soil from wind and water, and their removal from the soil surface has
been linked to major problems with erosion (Das et al., 2014; Govaerts et al., 2005; Jin et al., 2009; Singh
and Malhi, 2006). To avoid confusion, conservation tillage is the practice of deliberately
reducing/eliminating tillage to reduce potential for erosion and concurrent lost soil health, while
conservation agriculture is a philosophy centered around sustainability and improved soil health that
utilizes a broad spectrum of practices to achieve these ends regardless of tillage practice. Conservation
tillage can be separated into a vast spectrum of practices, but functionally involves two main groups:
those who believe that practically all tillage must be eliminated for superior soil health and productivity
(hereafter termed “no-till” per Govaerts et al., 2005; Kaval, 2004), and those who aim for a strategic and

9
beneficial reduction of tillage while still maintaining it as a necessary management tool in the farmer’s
arsenal (hereafter termed “reduced tillage” per He et al., 2006; Mäder and Berner, 2012; Zikeli and
Gruber, 2017).
Whether “reduced” or “no-till”, conservation tillage has many potential benefits to its utilization
(Thomazini et al., 2015; Weber et al., 2017), with results differing dependent on soil type, location, and
management (Govaerts et al., 2005; Gürsoy, 2012; Ozpinar and Cay, 2006). Conservation tillage often
improves soil structure through the formation of macroaggregates (Govaerts et al., 2005; He et al.,
2006; Singh and Malhi, 2006; Vincent-Caboud et al., 2017). It can improve soil health by increasing or
stabilizing levels of organic matter in the soil (He et al., 2006; Mathew et al., 2012; Mulumba and Lal,
2008; Vincent-Caboud et al., 2017), and can stimulate earthworm populations (Halde et al., 2017;
Vincent-Caboud et al., 2017). Conservation tillage often improves the quantity and diversity of microbial
populations active in the soil (Anderson, 2017; Carr et al., 2012; Mathew et al., 2012).
Profitability in conservation tillage may not be consistent (Gürsoy, 2012; Lu et al., 1999; Weber
et al., 2017). Although conservation tillage often results in a reduction in fuel and labor costs due to the
absence of tillage operations (Anderson, 2017; Das et al., 2014; Jin et al., 2009; Mirsky et al., 2013; Silva
and Delate, 2017), crop losses from weed pressures, potential lower yields, and substantially greater
herbicide usage can sometimes outweigh these cost reductions (Delate et al., 2012; Ibragimov et al.,
2011; Vincent-Caboud et al., 2017). Geographical location and personal skill of the farmer are critical in
determining profitability (Delate et al., 2012; Ibragimov et al., 2011; Jin et al., 2009 Luna et al., 2012),
and often multiple seasons must be invested in conservation tillage before yields become acceptable
(Ibragimov et al., 2011).
Many farmers are slow to adopt conservation tillage due to perceived issues with yields, weeds,
pest, and pathogen pressures (Delate et al., 2012; Duboc et al., 2011). A primary issue with
conservation tillage is related to how crop residues insulate the soil, retaining moisture (Mulumba and

10
Lal, 2008) and resisting temperature changes, which can be a mixed blessing dependent on the time of
the year and the weather (Boulal and Gomez-Macpherson, 2010; Halde et al., 2017; Jin et al., 2009;
Kainiemi et al., 2016; Mäder and Berner, 2012; Silva and Delate, 2017). During the summer, crop
residues can be a significant advantage in preventing water stress, but in the spring, they can delay
warm-up of soil, potentially reducing crop growth and vigor (Gürsoy, 2012; Mulvaney et al., 2011). The
presence of crop residues and the higher moisture content of the soil profile in conservation tillage can
also promote populations of pests, notably slugs, which can devastate a crop (Boulal and Gomez-
Macpherson, 2010; Luna et al., 2012). Due to increased weed pressure and soil compaction, more
fertilizer and pesticides are needed for yields comparable to tilled agriculture (Berner et al., 2008; Lu et
al., 1999).
Weed pressures can be especially problematic (Zikeli and Gruber, 2017), as conservation tillage
tends to shift weed populations towards perennial weeds such as dandelions and grasses, which are
much more persistent and difficult to eradicate (Mirsky et al., 2012; Mulvaney et al., 2011; Vincent-
Caboud et al., 2017; Weber et al., 2017). Lack of tillage also means that weed seeds can accumulate in
the topsoil (Légère et al., 2013; Weber et al., 2017), though this problem can also occur in rototilled
situations (Brown and Gallandt, 2018). Weed populations are stimulated by inorganic fertilizers (like
crop plants), but without the control of tillage, no-till systems often have higher weed populations,
necessitating substantially more herbicide usage (Adesina et al., 2014; Carr et al., 2012). This overuse of
herbicides can contribute to the selection of herbicide-resistant super-weeds in no-till systems (Brainard
et al., 2013; Chaudhary and Iqbal, 2013).
One notable problem with conservation tillage is significant compaction with subsequent
waterlogging, especially in the practice of no-till (Powlson et al., 2014; Singh and Malhi, 2006; Yonemura
et al., 2014). In no-till, tillage is never utilized to break up compaction and aerate the soil, even as heavy
machinery is still being moved over it to plant, spray, and harvest. Because of this, soils can become
11
very compacted, waterlogged, and anaerobic, or water may not infiltrate the soil due to compaction
(Kargas et al., 2012; Luna et al., 2012; Ram et al., 2012; Vincent-Caboud et al., 2017). This is especially a
problem in heavy clay soils, such as Vertisols, where anaerobic conditions can persist and may cause
significant detriments to soil health and plant yield (Boulal and Gomez-Macpherson, 2010; Das et al.,
2014; Ibragimov et al., 2011; Sharma et al., 2011; Vincent-Caboud et al., 2017). Finally, anaerobic
conditions may foster the production and release of both methane and nitrous oxide (Linn and Doran,
1984; Mäder and Berner, 2012; Powlson et al., 2014; Yonemura et al., 2014), which are far more potent
climate change gases than CO2 (Nawaz et al., 2017; Powlson et al., 2014).
Farming with tillage (including reduced tillage) has been called inherently unsustainable because
of its environmental impacts. Tillage can promote carbon loss, disrupt aggregation, and degrade soil
health (Carr et al. 2012; Luna et al., 2012; Vincent-Caboud et al., 2017). It can also contribute to climate
change, since tillage typically stimulates microbial respiration (producing CO2) (Halde et al., 2015; Luna
et al., 2012; Yonemura et al., 2014). Because of these problems with tillage, no-till has been promoted
as the best agricultural method to reduce greenhouse gas production and sequester carbon, but this is
disputed by those who assert that lack of tillage does not equal sustainability (Kainiemi et al., 2016;
Nawaz et al., 2017; Powlson et al., 2014; Silva and Delate, 2017; Yonemura et al., 2014; Zikeli and
Gruber, 2017). As reported in Argentina, when no-till is utilized as a system and the residue is either
removed, eaten, or burned, rapid soil degradation occurs similar to conventionally managed farms
(Bedano and Dominguez, 2016).
Though it is clear that no-till can preserve carbon in soils, this carbon is accumulated in the least
stable, uppermost 5 cm of the soil profile, where it is easily lost from any significant soil disturbance,
such as an intense rainstorm (Boulal and Gomez-Macpherson, 2010; Dalal et al., 1991; Kainiemi et al.,
2016; Jia et al., 2016; Mäder and Berner, 2012; Powlson et al., 2014; Zikeli and Gruber, 2017). Studies
are inconclusive on the respiration rate of no-till soils, where higher moisture content and high residue
12
availability at the surface can promote respiration (Jia et al., 2016; Shi et al., 2012; Thomazini et al.,
2015), with some studies showing accelerated rates (Kainiemi et al., 2015; Morell et al., 2012; Sharma et
al., 2011; Shi et al., 2012) and others lowered rates (Kainiemi et al., 2016; Nawaz et al., 2017; Yonemura
et al., 2014). It may take between 25-100 years of any type of conservation tillage to reach a new stable
equilibrium level of soil carbon, and this rate is dependent on soil type, crop type, and location, with
some crops (e.g. vegetable) not having sufficient residues to reliably increase carbon (Berner et al.,
2008; Duboc et al., 2011; Govaerts et al., 2005; Powlson et al., 2014).
As such, it cannot be concluded that no-till has an inherent advantage over other agricultural
practices simply because it eliminates tillage (Canali et al., 2015; Carr et al., 2012; Gürsoy, 2012; Halde et
al., 2015; Law et al., 2006; Zikeli and Gruber, 2017). Tillage is one potential degrader of soil health, but it
can also have benefits, and other factors besides tillage contribute to the destruction of productive soils.
Any agricultural systems or practices (e.g. organic or conservation till) that are poorly managed can lose
any potential benefits otherwise derived from that system or practice (e.g. Bedano and Dominguez,
2016). Therefore, the true pathway to sustainability in agroecosystems is conscientious and intelligent
management of agricultural practices to maximize soil health and minimize soil degradation (Baker and
Mohler, 2015; Henneron et al., 2015; Ryan, 2010; Zikeli and Gruber, 2017).
CHALLENGES OF REDUCING/ELIMINATING TILLAGE IN ORGANIC AGRICULTURE
Though successful combination of conservation tillage and organic farming often depends on
the farmer’s specific management practices (Gürsoy, 2012; Ozpinar and Cay, 2006; Sharma et al., 2011),
the greatest challenge in combining conservation till and organic agriculture lies with weed
management (Delate et al., 2012; Lowry, 2015; Price and Norsworthy, 2013; Reberg-Horton et al., 2012;
Vincent-Caboud et al., 2017). Weed control is a persistent problem facing farmers regardless of the
tillage system used (Chaudhary and Iqbal, 2013; Law et al., 2006). A weed is simply an unwanted plant

13
in an agricultural setting, and they can cost a farmer significantly in profit when not properly managed
(Halde et al., 2017; Quintanilla-Tornel et al., 2016; Anonymous, 2016). Weeds reduce crop growth and
yield, competing with crops for resources such as nutrients, sunlight, space, and water, and, because of
their biology and ecology, often remain persistent and difficult to control (Burkhard et al., 2009). Two
popular ways to handle weeds are herbicides and tillage (“mechanical cultivation”) (Law et al., 2006).
Herbicides are an essential method in modern times for weed control (Chaudhary and Iqbal,
2013; Mäder and Berner, 2012; Mirsky et al., 2012;), but organic regulations only allow organic farmers
to use biologically or naturally-derived herbicides such as acetic acid (Carr et al., 2012; Halde et al.,
2017; Strik et al., 2012). Since these herbicides may have highly varying degrees of effectiveness
compared to synthetic herbicides like glyphosate (Morse, 2000; Reberg-Horton et al., 2012; Weber et
al., 2017), lack of herbicides is a barrier to adoption of combined no-till/organic practices (Halde et al.,
2017; Halde and Entz, 2014; Lounsbury and Weil, 2015; Lowry, 2015; Morse, 2000). Organic farmers are
instead reliant on other methods of weed control, such as mechanical cultivation, hand weeding, and
mulching (Halde et al., 2017; Mulvaney et al., 2011). Mechanical cultivation physically disrupts the weed
crop, either uprooting it or damaging its tissues enough that it is killed or greatly reduced in vigor (Silva
and Delate, 2017). However, mechanical cultivation may increase weed infestation by dispersing and
stimulating perennial weeds (i.e. roots, tubers, bulbs, and rhizomes) (Anonymous, 2016). Hand weeding
is often performed with tools such as hoes by laborers (Delate et al., 2012), but can be cost-prohibitive
as it necessitates high investments of management and labor (Diaz-Perez et al., 2012; Reberg-Horton et
al., 2012; Strik et al., 2012). Hand weeding is often only used for high-value crops such as vegetables
(Baker and Mohler, 2015).
Conservation tillage, regardless of its form, tends to favor perennial weeds (Halde et al., 2015;
Légère et al., 2013; Silva and Delate, 2017) and difficult to control monocot weeds (Mäder and Berner,
2012). An example of this is recounted by Janzen (2001), who noted that organic conservation tillage
14
was functionally practiced by farmers in Manitoba, Canada in the late 1800s, prior to the emergence of
any sort of synthetic pesticides or fertilizers. Historical experience showed that farming with “organic”
conservation till was possible only for a period of four years, at which point the perennial weeds would
grow so vigorous that further crops would fail, necessitating a tillage event before another four-year
period of no-till. Halde et al. (2015) corroborated this historical experience through a six-year study in
Manitoba, testing to see how organic no-till with roller-crimped cover crops performed over time in
relation to weeds. What they found was that “four years” is indeed an important number, as in the fifth
year the weed pressure from perennials grew so strong that it completely outcompeted the cash crop,
forcing the experiment to conclude. This suggested that there may be a point of “no return” within
organic no-till, after which tillage may become necessary to continue cropping. Some organic no-till
experiments have been abandoned due to extreme weed build-up over time in the absence of
herbicides (Berner et al., 2008; Halde et al., 2015; Légère et al., 2013; Powlson et al., 2014).
Rather than attempting to achieve zero-tillage with its concurrent weed problems, European
farmers have instead aimed for a compromise by reducing tillage and coupling it with organic
conservation agriculture practices (Zikeli and Gruber, 2017). They concentrate on tilling strategically in
order to gain maximum benefit from limited mechanical cultivation (Carr et al., 2012; Mäder and Berner,
2012; Vincent-Caboud et al., 2017), and have focused on creating alternative forms of tillage to the
moldboard plow and rototilling. These tillage implements are designed to loosen, not invert or pulverize
the soil structure (Mäder and Berner, 2012; Weber et al., 2017; Zikeli and Gruber, 2017), such as the
rotary hoe (Légère et al., 2013; Ozpinar and Cay, 2006), and zone tillage, which focuses on tilling a
narrow zone of the row by running a shank through it (Luna et al., 2012). Though European methods of
organic conservation till have not garnered much interest in North America outside of Canada (Halde et
al., 2017), they have shown positive results. Their research points to another method of weed control
15
through tillage by using low-impact tilling methods with unique equipment to avoid the deleterious
effects to soil health of intensive tillage (Brainard et al., 2013; Luna et al., 2012; Weber et al., 2017).
One proposed method of weed control in organic no-till systems being explored in North
America is cover crop mulching (Baker and Mohler, 2015; Delate et al., 2012; Price and Norsworthy,
2013; Quintanilla-Tornel et al., 2016). Cover crop mulching is performed by growing and terminating a
cover crop right before the primary crop is planted (Ryan, 2010). The cash crop is planted into the thick,
weed suppressing mulch created by the residue of the cover crop, which can be highly effective under
strict no-till situations (Halde et al., 2017; Mirsky et al., 2013; Vincent-Caboud et al., 2017; Weber et al.,
2017). This method grew in prominence after the introduction of the roller-crimper to North America
from Brazil, which streamlined the process by making it possible for farmers to more effectively kill a
cover crop without herbicides (Mirsky et al., 2013; Silva and Delate, 2017). By rolling the crop and
crimping (breaking the mainstem of the plant), farmers can kill some cover crops and then plant their
cash crop directly into the residue, which prevents germination of weed seeds, shades weed seedlings,
and provides suppressive allelopathic effects (Canali et al., 2015; Chaudhary and Iqbal, 2013; Halde et
al., 2014; Vincent-Caboud et al., 2017). If the biomass of the cover crop is sufficient (usually between 6-
8 Mg/ha) and closes canopy quickly, it may suppress weeds well enough to prevent cash crop yield
losses from weed growth, with very little weeding necessary (Halde and Entz, 2014).
The roller-crimp method is currently the most popular method of organic conservation till in the
United States and Canada (Luna et al., 2012), but its efficacy is dependent on multiple factors, including
the local climate and the type of cover crop (Mirsky et al., 2013; Morse, 2000; Silva and Delate, 2017).
The challenge with roller-crimp cover crops is twofold. They require a certain “critical level” of biomass
produced by the cover crop in order for weed suppression to be effective (Halde and Entz, 2014;
Lounsbury and Weil, 2015; Quintanilla-Tornel et al., 2016), and perennial weeds selected by organic
conservation till are often able to survive the debilitating effects of cover crops (Baker and Mohler,
16
2015; Carr et al., 2012; Halde et al., 2015; Mirsky et al., 2012; Weber et al., 2017). If the wrong
combination of cover crops are grown, or if the cover crop is not completely terminated and continues
to grow, then this method is ineffective, and severe crop yield reduction is the result (Halde et al., 2017;
Luna et al., 2012). The cover crop can also interfere with plant water use efficiency in drier regions by
taking up too much water during its growth, causing stress to the following cash crop (Carr et al., 2012;
Halde et al., 2014). In regions with longer, more severe winters and shorter summers, such as Maine,
achieving sufficient cover crop biomass to cause weed suppression may be difficult, and cover crops may
be impractical for smaller farmers who lack the necessary equipment (Brainard et al., 2013; Halde et al.,
2017). Overall, cover crop mulches are one strategy that should be utilized in concert with other
practices (such as crop rotation, approved herbicides, non-till mechanical weed control, etc.) to control
weeds effectively in organic conservation tilled systems (Carr et al., 2012; Mirsky et al., 2013; Powlson et
al., 2014; Ryan, 2010).
MULCHING AND PERMANENT BEDS: A POTENTIAL PATH FOR ORGANIC REDUCED TILL
Studies of organic conservation till vegetable cash crop production have been conducted in
recent years across the northern hemisphere, such as Canada and New York (Baker and Mohler, 2015;
Halde et al., 2017), and have investigated production of tomatoes, collards (Mulvaney et al., 2011),
winter squash (Jacobsen et al., 2010) broccoli (Diaz-Perez et al., 2012), blueberries (Cox et al., 2014),
wheat and corn (Govaerts et al., 2005; Halde et al., 2017; Jacobsen et al., 2010), soybean (Delate et al.,
2012), okra (Jacobsen et al., 2010), and bell peppers (Law et al., 2006). However, only a few studies (e.g.
Jacobsen et al., 2010) focused on the economic side of organic conservation till systems and on crops
commonly grown in the northeast United States. In addition, most reported the utilization of roller-
crimping technology to create a mulch (e.g. Delate et al., 2012), while very few explored other mulching
methods. Baker and Mohler (2015) conducted a survey of farmers in New York State, USA, and noted
17
keen interest by farmers in research being conducted on organic conservation till in cooler, short-season
regions.
A method that utilizes the same principle of weed suppression as the roller-crimper method but
is more suitable for the shorter seasons of the Northeastern North America is the utilization of mulch
such as grain straw (e.g. wheat or oat) or compost, applied immediately following crop transplanting
(Adesina et al., 2014; Baker and Mohler, 2015; Burkhard et al., 2009; Delate et al., 2012; Price and
Norsworthy, 2013). This method can either reduce or control weed populations (Adesina et al. 2014;
Burkhard et al., 2009; Chaudhary and Iqbal, 2013), as well as give the cash crop time to gain enough
growth to avoid crop losses (Diaz-Perez et al., 2012). For example, in collard production (Mulvaney et
al., 2011), mulching with straw or plant trimmings within two weeks following transplanting improved
plant vigor and provided weed suppression, in some cases equivalent to hand weeding, but only for
broadleaf annual weeds.
Mulching with plant-derived mulches has many benefits, even though they can cause pest or
yield issues (Baker and Mohler, 2015; Law et al., 2006), and may cool the soil (Price and Norsworthy,
2013). Plant mulches can intercept solar energy, which enables soil to resist temperature fluctuations
that may stress plants (Cox et al., 2014; Li et al., 2014; Lounsbury and Weil, 2015; Mirsky et al., 2012;
Ram et al., 2012; Rogers et al., 2004). They can also help retain soil moisture and prevent erosion by
shielding the soil from the destructive effects of wind, rain, and the sun (Diaz-Perez et al., 2012; Law et
al., 2006; Li et al., 2014; Lounsbury and Weil, 2015; Price and Norsworthy, 2013; Rogers et al., 2004).
Due to their regulation of soil moisture and temperature, as well as by providing additional food
sources, organic mulches stimulate soil microbial and earthworm populations (Law et al., 2006; Li et al.,
2014; Price and Norsworthy, 2013; Rogers et al., 2004). Finally, mulches have been shown to improve
crop yields, likely due to a combination of the above factors, and is combined with transplanting in
organic agriculture to give crops a size advantage (Chaudhary and Iqbal, 2013; Li et al., 2014).

18
Generally, organic mulch needs to be thick (Ozores-Hampton et al., 2001), and works best when
coarser in size (Burkhard et al., 2009; Chaudhary and Iqbal, 2013; Eulenberg, 2012), with quantity more
important than quality (Chaudhary and Iqbal, 2013; Law et al., 2006; Mirsky et al., 2012). Mulched
organic conservation till systems may have poor economic returns compared to tilled organic due to the
costs of mulches (Delate et al., 2012), though they also can result in substantial reduction in labor costs
from weeding operations (Jacobsen et al., 2010). Though mulching can still be overcome by perennial
weeds (Burkhard et al., 2009; Silva and Delate, 2017), and may still require hand weeding (Strik et al.,
2012), it can nonetheless suppress the majority of weed growth relative to the crop. Mulching can often
improve crop yields in organic conservation till systems, even in relation to non-organic conservation till
agriculture (Delate et al., 2012).
Mulches can also be applied before the main crop is planted to create a “stale seedbed” with
minimum weed populations, applying and removing the “mulch” prior to the growing season. Two pre-
season forms of mulching are solarization and tarping. Solarization utilizes clear plastic sheets to super-
heat the soil surface and kill weed seeds and plant parasites. Tarping is performed with light-
impermeable silage tarps, which prevents weeds from photosynthesizing or germinating. Though both
methods can be utilized to kill weeds prior to the growing season, neither is a substitute for an in-season
mulch. Solarization is less useful in cooler climates because it requires substantial time to heat the soil
effectively, which may prevent a cash crop if the growing season is short (Horowitz et al., 1983;
Quintanilla-Tornel et al., 2016; Standifer et al., 1984).
Mulching is sometimes combined with permanent beds, which are rows of crops that are in the
same location from year to year (Ram et al., 2012). By restricting mechanized traffic, permanent beds
have the potential to drastically reduce soil compaction, as well as reduce the necessity of frequent
tillage to deal with this compaction (Stirling, 2008; Tullberg, 2010; Vermeulen and Mosquera, 2009).
Though driver error can cause major impacts, the emergence of GPS-guided tractors has improved the
19
performance of permanent bed systems (Stirling, 2008; Vermeulen and Mosquera, 2009). Soil
compaction has been linked to increased emission of greenhouse gases such as methane and nitrous
oxide, and permanent bed systems have been shown to have the potential to limit or eliminate sources
of these gases (Vermeulen and Mosquera, 2009). Although yield reductions caused by compaction from
mechanized sources have been a barrier to adoption of conservation tillage, utilizing permanent beds
can prevent this problem (Tullberg, 2010).
Permanent beds also help retain moisture, improve aggregation, facilitate weeding, improve
drainage, increase earthworm populations, reduce labor and fuel costs, raise soil temperature, make
farm operations more efficient in wet conditions, improve yields, and when combined with conservation
till, can be effective in controlling weed populations over time and improving organic matter levels
(Baker and Mohler, 2015; Boulal and Gomez-Macpherson, 2010; Govaerts et al., 2005; Ibragimov et al.,
2011; Lichter et al., 2008; Ram et al., 2012; Rogers et al., 2008; Stirling, 2008; Tullberg, 2010; Vermeulen
and Mosquera, 2009). Especially when contrasted with the plasticulture that many vegetable crops are
produced under, permanent beds offer all of the above benefits as well as drastically improved soil
health with fewer inputs (Rogers et al., 2008; Stirling, 2008). However, when permanent beds are
practiced without the retention of crop residue, they can still lead to significant soil degradation (Lichter
et al., 2008). Tullberg (2010) states that adopting permanent beds has the potential to improve almost
every measure of conservation agriculture’s sustainability through the elimination of soil compaction.
RESEARCH STATEMENT
This thesis explores reduced and no-till permanent bed systems in organic vegetable production
by conducting experiments testing different methods of tilling and mulching across two seasons. Yield
data (Chapter II) and weed data (Chapter III) will be examined to measure the effects of treatment
combinations (tillage and mulch) on the growth and health of two summer vegetable crops: “Bush

20
Delicata” squash, and “Farao” cabbage, as well as weed pressures on these crops. Soil health (Chapter
IV) will be measured by taking a subset of the tillage/mulch combinations and measuring two common
indicators of soil health, soil respiration (weekly) and earthworm counts (once per season).
The primary question explored is: “Can tillage be reduced in intensity or eliminated entirely
without adversely affecting yields or increasing weed pressures?” A secondary question is, “Does the
presence and type of mulch provide better weed control or improve yields?” Finally, “Are there
measurable differences in two parameters of soil health between untilled and intensely tilled plots?”
We expected no-till without herbicides to decrease yields, and so we also examined pre-season tarping
as a method of decreasing the weed problems inherent to no-till. We expected organic mulches to both
improve yields and reduce weed pressures. We expected earthworm populations to be higher in
mulched, untilled plots. Finally, we theorized that soil respiration would be higher in tilled plots. This
research will furnish useful information on conservation till that may enable Northeastern US farmers to
practice reduced tillage and possibly create a more sustainable agriculture for the future.
21
CHAPTER 2: TILLAGE AND MULCH EFFECTS ON CROP YIELD WITHIN AN ORGANIC SMALL-SCALE
PERMANENT BED VEGETABLE SYSTEM
INTRODUCTION
Frequent tillage in intensive vegetable production has a deleterious effect on soil (Das et al.,
2014; Jin et al., 2009; Kargas et al., 2012; Luna et al., 2012; Reberg-Horton et al., 2012; Thomazini et al.,
2015), but reducing tillage may improve soil health without reducing yield (Jacobsen et al., 2010; Mäder
and Berner, 2012; Weber et al., 2017; Zikeli and Gruber, 2017). Mulching can help crop growth by
improving moisture retention and controlling weeds, and in combination with permanent beds may
improve organic matter and yields (Adesina et al., 2014; Baker and Mohler, 2015; Boulal and Gomez-
Macpherson, 2010; Chaudhary and Iqbal, 2013; Delate et al., 2012; Govaerts et al., 2005; Ibragimov et
al., 2011; Ram et al., 2012). Researchers and farmers have questioned whether low tillage organic
agriculture can be successful, how reduced tillage and mulching affect crop yields directly, and how
farmers can successfully practice low tillage organic vegetable cash crop production (Lowry, 2015). To
assist farmers with decision making and address some of these questions, we performed experiments
with different tillage and mulching combinations using tools, practices, and climatic conditions found in
Maine and utilized by its farmers. The experimental data presented in this thesis reflects the second
(2016) and third (2017) years of a four-year experiment, and this chapter explores the consequences to
crop yield of tillage and mulch combinations.
We hypothesized that reduced tillage will provide crop yields equal to or greater than intensive
tillage, and that elimination of tillage will improve crop yield. Further, mulch was expected to improve
crop yield, likely from weed suppression. Finally, we anticipated significant differences between the
“pure” no-till plots and those tarped for at least one month prior to the growing season, with tarped
plots yielding higher due to the pre-season weed suppression provided by the tarp that gives transplants
a size advantage over weeds. Though it is expected that the treatment effects will be seen in weed data

22
(Chapter III), especially for mulch treatments, it is expected that they will also have a measurable effect
on yield.
METHODS
This field experiment took place at Highmoor Research Farm, a Maine Agricultural and Forest
Experiment Station facility located in Monmouth, ME (43.232° N, 70.072° W). The experimental site has
a fine sandy-loam texture (“Woodbridge”), with 8-15% slopes. It has an average annual temperature of
45.79 °F and an average annual precipitation of 42.36 in. (Augusta Airport, NOAA Station ID ME170275,
44.321 °N, 69.797 °W). Soil temperature and soil moisture were measured at the experimental site in
2017. Soil temperature was measured between 12 May 2017 and 22 September 2017 on an hourly
basis using the Hobo U12 datalogger with thermistor probes (Onset Computer Corp., Bourne, MA).
Thermistor probes were buried to a depth of 6 inches, and were located in the middle of the data rows
of the 8” Rototill, No-till, and Tarped Unmulched plots across all replicates. Gravimetric soil moisture
was measured once a week between 28 June 2017 and 16 August 2017, utilizing a modification of the
sampling methods described by Michigan State University (https://lter.kbs.msu.edu/protocols/24).
Sampling was performed by making a composite soil sample of at least eight subsamples from each plot
taken to a depth of 4-6 in., measuring its wet weight, and then oven drying it for 24-48 hours at 60 °C,
and reweighing this as the “dry weight.” The difference between the two weights represents the loss of
soil moisture from the soil and was calculated as a percentage (% soil moisture by mass (dw) = 100 *
((fresh weight – dry weight)/dry weight)). Additionally, an Onset weather station was also set up
adjacent to the plots to measure rainfall, wind speed/direction, photosynthetically active radiation, and
air temperature.
23
Our experimental design utilized a 6x3 full factorial randomized complete block design (RCBD),
with factors of tillage and mulch, and utilized a priori tests (pre-planned comparisons) to retain power
and avoid bias. Six levels of tillage treatment, three levels of mulch treatment, and four replications
resulted in a total of seventy-two tillage/mulch combination plots in the experiment. Treatments were
selected based on a preliminary survey of farmers in the Northeast. The experiment was set up as
permanent beds in a block design (Figure A.1, Appendix A) in plots 25 ft. by 21 ft. Each plot consisted of
three beds 72” on center and 25 feet long, separated by wheel tracks. Of these beds, the outer two
within each plot and their plants were “guard plants,” with data being collected but not used in final
statistical analysis, while the middle bed and its plants were considered the “data plants.” Plots were
created in fall of 2014 and planted with their first cash crop in summer 2015. Data presented in this
thesis reflects the second (2016) and third (2017) growing seasons.
All tilled plots (8” Rototill, 2” Rototill, DZT, and Biotill) were tilled with a roto-tiller as noted in
Table 2.1. DZT plots utilized the Yeoman plow every other year (prior to squash) as an alternative to
rototilling. The Yeoman is a single-shank plow that carves a lone furrow down the center of the plot to
loosen soil (at depth) for planting (“deep zone tilling”). The furrow is 22 inches deep, but involves no
inverting of the soil profile, as the shank is merely run through the soil in a straight line, providing
aeration in a limited band but no other alterations to the soil profile. Biotill plots utilized winter-killed
tillage radishes (Raphanus sativus L. var. niger J. Kern), planted in the fall every other year following the
cabbage crop. The radishes grow deep and break up plow-pan, but usually have completely
decomposed by the following summer. Finally, in tarped plots, no tillage was performed--the plots had
a silage tarp placed on them in the spring from roughly 15 April through 15 June both years, at which
time the tarps were removed for transplanting. The tarps were 6 mil black silage bunker covers
impermeable to sunlight and moisture, and were secured on the beds by piling sandbags or shoveling
soil onto the edges of the tarp.
24
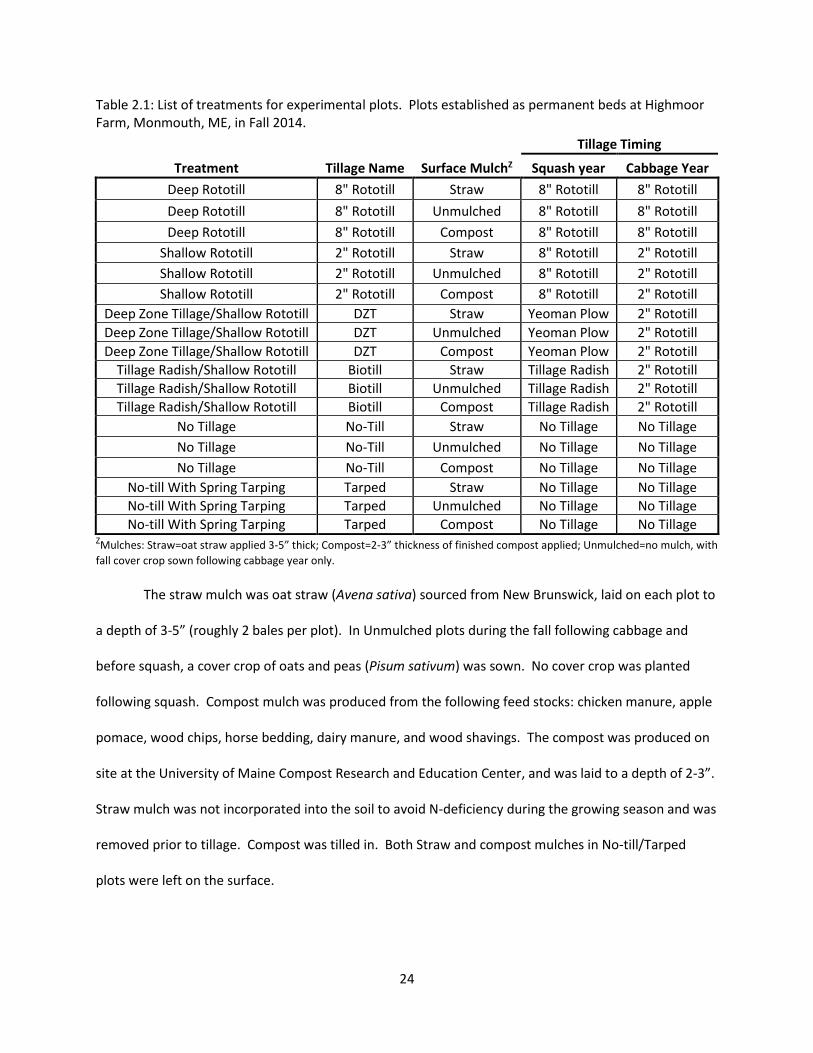
Table 2.1: List of treatments for experimental plots. Plots established as permanent beds at Highmoor Farm, Monmouth, ME, in Fall 2014.
Tillage Timing
Treatment Tillage Name Surface MulchZ Squash year Cabbage Year
Deep Rototill 8" Rototill Straw 8" Rototill 8" Rototill
Deep Rototill 8" Rototill Unmulched 8" Rototill 8" Rototill
Deep Rototill 8" Rototill Compost 8" Rototill 8" Rototill
Shallow Rototill 2" Rototill Straw 8" Rototill 2" Rototill
Shallow Rototill 2" Rototill Unmulched 8" Rototill 2" Rototill
Shallow Rototill 2" Rototill Compost 8" Rototill 2" Rototill
Deep Zone Tillage/Shallow Rototill DZT Straw Yeoman Plow 2" Rototill
Deep Zone Tillage/Shallow Rototill DZT Unmulched Yeoman Plow 2" Rototill
Deep Zone Tillage/Shallow Rototill DZT Compost Yeoman Plow 2" Rototill
Tillage Radish/Shallow Rototill Biotill Straw Tillage Radish 2" Rototill
Tillage Radish/Shallow Rototill Biotill Unmulched Tillage Radish 2" Rototill
Tillage Radish/Shallow Rototill Biotill Compost Tillage Radish 2" Rototill
No Tillage No-Till Straw No Tillage No Tillage
No Tillage No-Till Unmulched No Tillage No Tillage
No Tillage No-Till Compost No Tillage No Tillage
No-till With Spring Tarping Tarped Straw No Tillage No Tillage
No-till With Spring Tarping Tarped Unmulched No Tillage No Tillage
No-till With Spring Tarping Tarped Compost No Tillage No Tillage ZMulches: Straw=oat straw applied 3-5” thick; Compost=2-3” thickness of finished compost applied; Unmulched=no mulch, with
fall cover crop sown following cabbage year only.
The straw mulch was oat straw (Avena sativa) sourced from New Brunswick, laid on each plot to
a depth of 3-5” (roughly 2 bales per plot). In Unmulched plots during the fall following cabbage and
before squash, a cover crop of oats and peas (Pisum sativum) was sown. No cover crop was planted
following squash. Compost mulch was produced from the following feed stocks: chicken manure, apple
pomace, wood chips, horse bedding, dairy manure, and wood shavings. The compost was produced on
site at the University of Maine Compost Research and Education Center, and was laid to a depth of 2-3”.
Straw mulch was not incorporated into the soil to avoid N-deficiency during the growing season and was
removed prior to tillage. Compost was tilled in. Both Straw and compost mulches in No-till/Tarped
plots were left on the surface.
25
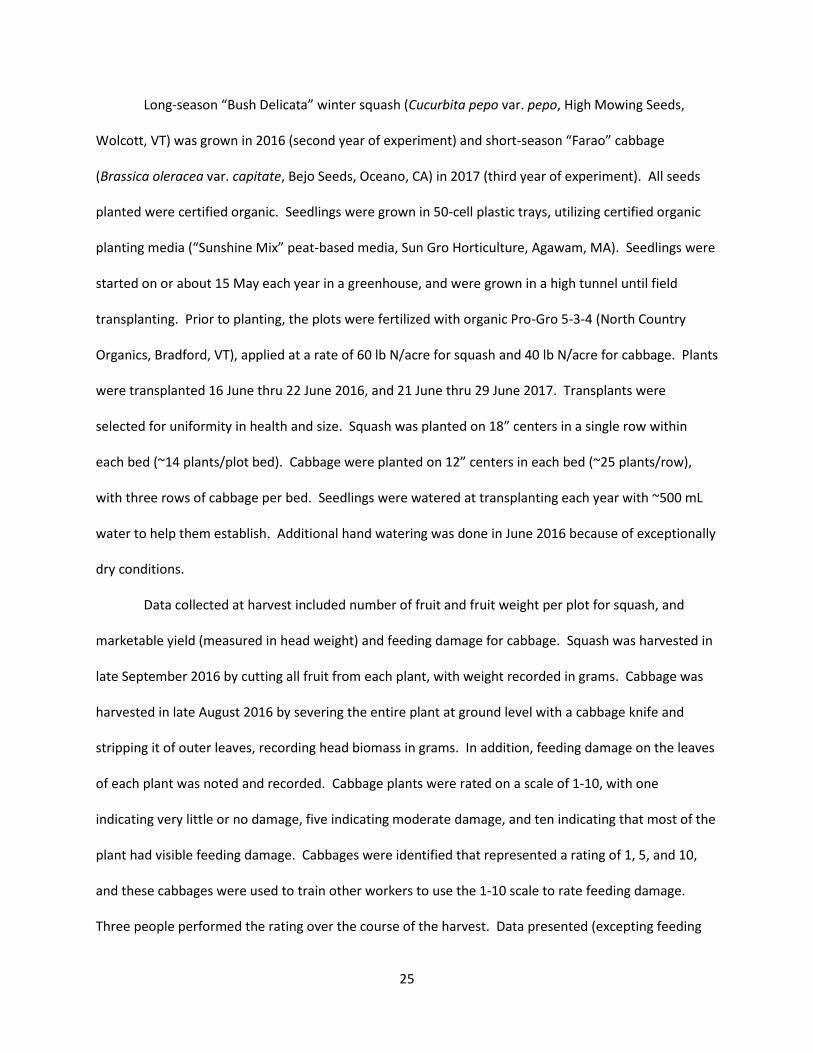
Long-season “Bush Delicata” winter squash (Cucurbita pepo var. pepo, High Mowing Seeds,
Wolcott, VT) was grown in 2016 (second year of experiment) and short-season “Farao” cabbage
(Brassica oleracea var. capitate, Bejo Seeds, Oceano, CA) in 2017 (third year of experiment). All seeds
planted were certified organic. Seedlings were grown in 50-cell plastic trays, utilizing certified organic
planting media (“Sunshine Mix” peat-based media, Sun Gro Horticulture, Agawam, MA). Seedlings were
started on or about 15 May each year in a greenhouse, and were grown in a high tunnel until field
transplanting. Prior to planting, the plots were fertilized with organic Pro-Gro 5-3-4 (North Country
Organics, Bradford, VT), applied at a rate of 60 lb N/acre for squash and 40 lb N/acre for cabbage. Plants
were transplanted 16 June thru 22 June 2016, and 21 June thru 29 June 2017. Transplants were
selected for uniformity in health and size. Squash was planted on 18” centers in a single row within
each bed (~14 plants/plot bed). Cabbage were planted on 12” centers in each bed (~25 plants/row),
with three rows of cabbage per bed. Seedlings were watered at transplanting each year with ~500 mL
water to help them establish. Additional hand watering was done in June 2016 because of exceptionally
dry conditions.
Data collected at harvest included number of fruit and fruit weight per plot for squash, and
marketable yield (measured in head weight) and feeding damage for cabbage. Squash was harvested in
late September 2016 by cutting all fruit from each plant, with weight recorded in grams. Cabbage was
harvested in late August 2016 by severing the entire plant at ground level with a cabbage knife and
stripping it of outer leaves, recording head biomass in grams. In addition, feeding damage on the leaves
of each plant was noted and recorded. Cabbage plants were rated on a scale of 1-10, with one
indicating very little or no damage, five indicating moderate damage, and ten indicating that most of the
plant had visible feeding damage. Cabbages were identified that represented a rating of 1, 5, and 10,
and these cabbages were used to train other workers to use the 1-10 scale to rate feeding damage.
Three people performed the rating over the course of the harvest. Data presented (excepting feeding
26
damage, which was averaged per plot) were calculated as summed weight (or fruit number) per plot,
which was then converted to kg/acre (or fruit number/acre) for statistical analysis. Other disease or
pest pressures were documented as they occurred, but not measured. “Cultivator blight” occurred
during 2017, which refers to damage caused by cultivation. While no cultivation was performed on the
beds themselves, it was performed on the pathways on 17 July, and resulted in loss of some cabbage
heads, in some cases up to one third of the cabbage heads found in the data bed of the plot. Statistical
resampling was utilized to correct for this.
Statistical analysis was conducted with SAS Studio University Edition (December 2017). One-
way Analysis of Variance for a full factorial RCBD was run in conjunction with Orthogonal Contrasts
(Appendix B lists the individual comparisons). Tests (normality and equality of variance) were
performed to analyze the assumptions of ANOVA. Fruit number for the squash data and all variables for
the cabbage data met assumptions of normality and equal variances. Fruit weight for squash met the
assumption of normality but failed to meet the assumption for equal variance (p=0.036) despite good
predicted vs. residual “cloud” spread, and subsequent transformations failed to correct the issue.
Bootstrapping would further distort the data and drastically reduce power, so a suggestion by a
statistician was followed to examine the data for a “preponderance of evidence” (Halteman, 2018).
After looking at the residual*predicted value graphs (Figure A.2, Appendix C), which showed a relatively
normal and unskewed dataset, he felt that there was an option to proceed with the data "as is" without
meeting the assumption of equal variance. In order to do this, the p-values from the individual ANOVA
tests and contrasts would need to be compared between the original data and all transformations. If
the results stayed roughly similar in terms of significance, then it is more likely that a "true" significant
or non-significant difference was found. On the other hand, if the p-value was very close to significance
or changes between significant and not significant were dependent on a particular transformation, then
significance would be disregarded. This meant that unless significance was consistently <0.01, it was
27
considered non-significant (e.g. if it hovered around 0.05, it was disregarded). This approach was
followed, and due to the more stringent requirements of significance necessary, was relatively
conservative as regards Type I errors. All values for means listed for squash fruit weight data reflect the
untransformed data, while the p-values reflect the “preponderance of evidence.”
Thus, a number of transformations were performed on squash fruit weight data to compare p-
values. In addition to the untransformed data, the transformations included rank, log, log(n+1), square
root (^1/2), ^1/2(n+1), ^1/2(n+0.75), ^3/4(n+0.75), ^3/4, and the removal of the most variable
treatment (Tarped) with untransformed data. As can be seen in the p-values shown in Table A.1, this
issue was minor, as the only datapoints that were significant (for contrasts) were all p<0.0001 and never
varied. Thus, despite the issue with variance equivalency, there was little to no change in the trends
regardless of transformation applied, making it likely that only true significant differences were noted.
RESULTS
SITE TEMPERATURE AND MOISTURE
Soil temperature increased as the season progressed, rising from ~55 F to ~65 F, then slowly
decreased at the end of the season (Figure 2.1). Tarped plots had higher temperatures earlier in the
season, and temperatures in 8” Rototill plots rose in response to tillage. By July, all treatment
temperatures equalized in relation to each other for much of the rest of the season. In contrast, air
temperature showed more diurnal swing, sometimes of 20-30 °F (Figure 2.2), though trends stayed
relatively consistent throughout the season. The highest range of soil moisture (Figure 2.3) across all
plots was 35-45% (late June), while the lowest range was 15-20% (early August). The 2017 season was
characterized by a long drought during July that did not end until early August. Minor differences
between treatments were apparent early in the season, with Tarped highest and 8” Rototill lowest, but
by August, there were negligible differences between treatments.

28
Figure 2.1: Average daily soil temperature for 8” Rototill, No-till, and Tarped plots (2017). Data measured between 12 May 2017 and 22 September 2017 in permanent bed plots established Fall 2014 at Highmoor Farm in Monmouth, ME. Onset Hobo U2 thermistor probes were placed at a depth of 6 in., measurements were logged every hour.
Figure 2.2: Maximum and minimum daily air temperature (2017). Air temperature measured every hour by Onset Weather Station placed adjacent to plots at Highmoor Farm in Monmouth, ME.
5/24 6/7 6/21 7/5 7/19 8/2 8/16 8/30 9/13
40
50
60
70
80
Date (2017)
Soil
Tem
per
atu
re (
F)8" Rototill No-Till Tarped
0
10
20
30
40
50
60
70
80
90
100
5/24 6/7 6/21 7/5 7/19 8/2 8/16 8/30 9/13
Air
Tem
per
atu
re (
°F)
Date (2017)
Max Air Temp. Min Air Temp.

29
Figure 2.3: Rainfall and soil moisture for 8” Rototill, No-till, and Tarped plots (2017). Measured between 16 June 2017 and 16 August 2017 in permanent bed plots established Fall 2014 at Highmoor Farm in Monmouth, ME. Rainfall (in.) measured by Onset Weather Station placed adjacent to plots. Samples were composites of eight subsamples per plot; Gravimetric moisture was calculated based on the difference between wet and oven dry weight of samples at 60 °C.
PEST ISSUES
There were three important pest pressures experienced by squash in 2016. Cucumber beetles
(Acalymma vittatum) were an issue early in the season, but were controlled by two pyrethrin (Pyganic®)
spray events, at a rate of 17 oz/acre. There was an aphid infestation mid-season that was not sprayed.
Ladybugs (Coccinellidae spp.) were noted to be in residence within two weeks of the aphid infestation.
In the two weeks following their emergence, the ladybugs had completely eradicated the aphid problem
with little lasting injury to the plants. The third and final pest issue was powdery mildew late in the
season, which was to be expected for a drier season as was observed in 2016 (McGrath, 1997).
However, the cultivar used was resistant to powdery mildew, and the plants were not fully colonized
0
0.1
0.2
0.3
0.4
0.5
0.6
0.7
0.8
0.9
1
0
10
20
30
40
50
60
6/14 6/21 6/28 7/5 7/12 7/19 7/26 8/2 8/9 8/16
Rai
nfa
ll (i
n.)
Mo
istu
re (
%)
Date (2017)
Rainfall 8" Rototill No-Till Tarped
30
until the end of August, at which point they had already set fruit and were entering senescence. All
three of these pests are common to winter squash production in Maine (Dicklow and McKeag, 2018).
Finally, one minor bacterial infection was observed (bacterial wilt transmitted by cucumber beetles), but
it killed very few plants.
Observed pests on cabbage during 2017 included imported cabbage worm (Pieris rapae L.) and
slugs (likely Deroceras reticulatum or similar spp.). Slugs were found throughout the season, and were
most prevalent in the Straw plots, where the moist, protected conditions and the plethora of plant
residue provide ideal habitat for slugs (Boulal and Gomez-Macpherson, 2010; Dicklow and McKeag,
2018; Luna et al., 2012). Imported cabbage worms were observed throughout the plots, but seemed to
be more prevalent on tilled plot cabbages. Damage done by both slugs and imported cabbage worms
was to the leaves and heads of the cabbage, but rarely affected the head quality, with the notable
exception of Straw-mulched plots within the No-till and Tarped plots (see Figure 2.1). Some bacterial rot
was also observed on cabbage, but it affected very few plants.
YIELDS
Averages for squash plots showed identical trends for both fruit weight and number (Table 2.2).
Significant differences in squash fruit number were found within tillage (p=0.0005) and mulch
treatments (p<0.0001), but there were no significant interactions (p>0.05). Squash fruit weight had
significant differences for both tillage and mulch (p=0.0003 and p<0.0001), but no significant
interactions. No differences were found for fruit number or weight between the averaged tilled and
untilled treatments (both p>0.05), but significant differences were found between No-till and Tarped
treatments (both p<0.0001). No significant differences were found for fruit number or weight between
any of the tilled plots (both p>0.05). Significant differences were found for both fruit number and
weight between Unmulched and the averaged mulched treatments (both p<0.0001), as well as between
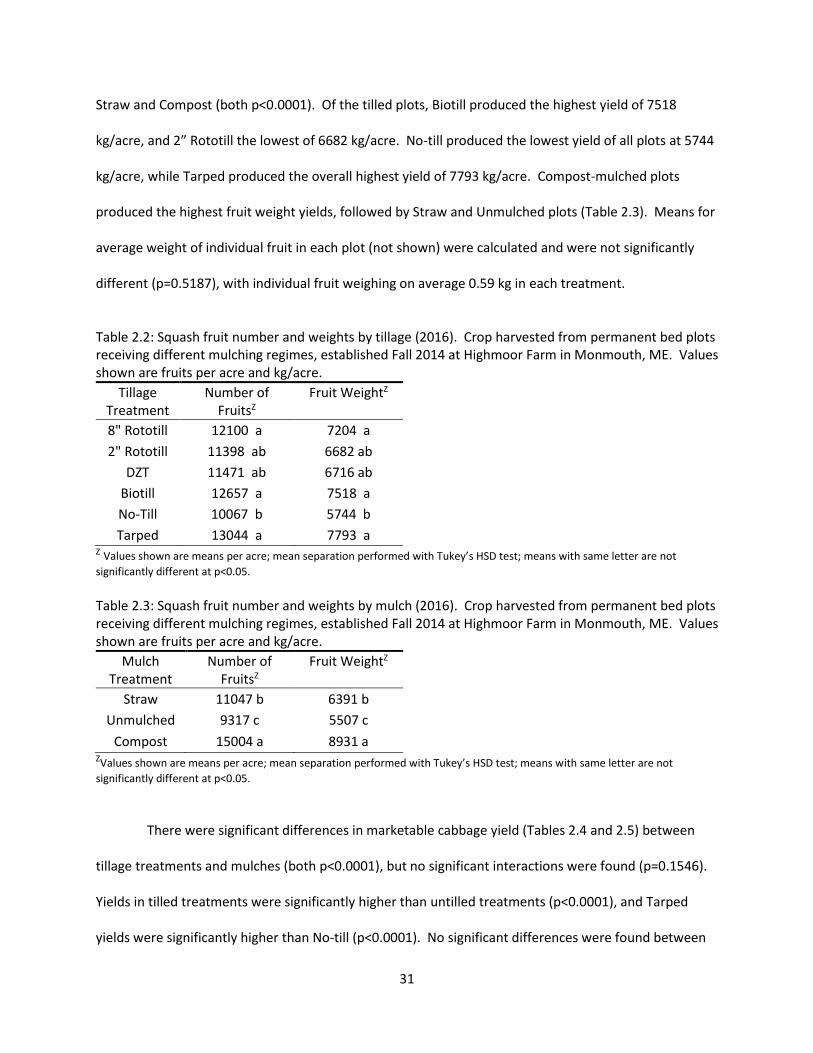
31
Straw and Compost (both p<0.0001). Of the tilled plots, Biotill produced the highest yield of 7518
kg/acre, and 2” Rototill the lowest of 6682 kg/acre. No-till produced the lowest yield of all plots at 5744
kg/acre, while Tarped produced the overall highest yield of 7793 kg/acre. Compost-mulched plots
produced the highest fruit weight yields, followed by Straw and Unmulched plots (Table 2.3). Means for
average weight of individual fruit in each plot (not shown) were calculated and were not significantly
different (p=0.5187), with individual fruit weighing on average 0.59 kg in each treatment.
Table 2.2: Squash fruit number and weights by tillage (2016). Crop harvested from permanent bed plots receiving different mulching regimes, established Fall 2014 at Highmoor Farm in Monmouth, ME. Values shown are fruits per acre and kg/acre.
Tillage Treatment
Number of FruitsZ
Fruit WeightZ
8" Rototill 12100 a 7204 a
2" Rototill 11398 ab 6682 ab
DZT 11471 ab 6716 ab
Biotill 12657 a 7518 a
No-Till 10067 b 5744 b
Tarped 13044 a 7793 a Z Values shown are means per acre; mean separation performed with Tukey’s HSD test; means with same letter are not
significantly different at p<0.05. Table 2.3: Squash fruit number and weights by mulch (2016). Crop harvested from permanent bed plots receiving different mulching regimes, established Fall 2014 at Highmoor Farm in Monmouth, ME. Values shown are fruits per acre and kg/acre.
Mulch Treatment
Number of FruitsZ
Fruit WeightZ
Straw 11047 b 6391 b
Unmulched 9317 c 5507 c
Compost 15004 a 8931 a ZValues shown are means per acre; mean separation performed with Tukey’s HSD test; means with same letter are not
significantly different at p<0.05.
There were significant differences in marketable cabbage yield (Tables 2.4 and 2.5) between
tillage treatments and mulches (both p<0.0001), but no significant interactions were found (p=0.1546).
Yields in tilled treatments were significantly higher than untilled treatments (p<0.0001), and Tarped
yields were significantly higher than No-till (p<0.0001). No significant differences were found between

32
any of the tilled plots (p>0.05). Significant differences were found between the Unmulched and
averaged mulched treatments (p=0.0035), as well as between Straw and Compost (p=0.0002). Overall,
the three reduced tillage treatments yielded approximately 1000 kg/acre more than 8” Rototill (all three
around 16000 kg/acre). Tarped plots (16067 kg/acre) yielded more than No-till (711 kg/acre). Like
squash, Compost-mulched plots had highest yields, followed by Straw and Unmulched plots (Table 2.5).
There were significant differences in feeding damage (Tables 2.4 and 2.5) within tillage and
mulch treatments (both p<0.0001); only one significant interaction was found (p=0.0149). There was
significantly less damage in tilled treatments than untilled treatments (p<0.0001), but no significant
differences were found between No-till and Tarped plots, or within tilled treatments (p>0.05).
Unmulched and mulched treatments had significant differences (p=0.0461), as did Straw and Compost
(p<0.0001). Damage from feeding was highest in Tarped and No-till plots, especially in straw-mulched
plots. Tilled vs. untilled by Straw vs. Compost had a significant interaction (p<0.0001). Straw-mulched
plots showed higher damage when untilled (4.98) than when tilled (2.66), as seen in Figure 2.4.
Table 2.4: Cabbage head weight and feeding damage by tillage (2017). Crop harvested from permanent bed plots receiving different mulching regimes, established Fall 2014 at Highmoor Farm in Monmouth, ME. Values shown are kg/acre head weight and unitless scale of 1-10 for feeding damage (where 1 is no damage and 10 is maximum damage).
Tillage Type
Head WeightZ
Feeding DamageZ
8" Rototill 15146 a 2.45 b
2" Rototill 16127 a 2.59 b
DZT 16024 a 2.21 b
Biotill 16011 a 2.40 b
No-Till 711 b 4.04 a
Tarped 16067 a 3.59 a ZValues shown are means per acre and mean feeding damage per plot; mean separation performed with Tukey’s HSD test;
means with same letter are not significantly different at p<0.05.

33
Table 2.5: Cabbage head weight and feeding damage by mulch (2017). Crop harvested from permanent bed plots receiving different mulching regimes, established Fall 2014 at Highmoor Farm in Monmouth, ME. Values shown are kg/acre head weight and unitless scale of 1-10 for feeding damage (where 1 is no damage and 10 is maximum damage).
Mulch Type
Head WeightZ
Feeding DamageZ
Straw 12333 b 3.43 a
Unmulched 11732 b 2.68 b
Compost 15978 a 2.53 b ZValues shown are means per acre and mean feeding damage per plot; mean separation performed with Tukey’s HSD test;
means with same letter are not significantly different at p<0.05.
Figure 2.4: Feeding damage on cabbage by tillage and mulch (2017). Crop grown in permanent bed plots receiving different mulching regimes and tillage intensities, established Fall 2014 at Highmoor Farm in Monmouth, ME. Values shown are plot mean ±95% C.I., in unitless scale of 1-10 (where 1 is no damage and 10 is maximum damage).
0
1
2
3
4
5
6
8" Rototill 2" Rototill DZT Biotill No-Till Tarped
Pla
nt
dam
age
(Sca
le 1
-10
)
Tillage Treatment Combinations
Straw Unmulched Compost

34
Figure 2.5: Cabbage head weight by tillage and mulch (2017). Crop grown in permanent bed plots receiving different mulching regimes and tillage intensities, established Fall 2014 at Highmoor Farm in Monmouth, ME, and. Values shown are plot mean ±95% C.I., in kg/acre.
Excluding the No-till plots, the lowest yields for cabbage were in 8” Rototill Unmulched plots
(12033 kg/acre), followed by DZT and Tarped Straw plots (12791 and 12511 kg/acre) (Figure 2.5).
Highest yield values were found in Tarped plots with compost mulch (20564 kg/acre), which was slightly
higher than Compost-mulched reduced tillage yields, which ranged between 17725 and 18741 kg/acre.
Though the straw-mulched plots tended to have better yields than the Unmulched plots, there was an
exception in the DZT and Tarped plots, as seen in Figure 2.5. Overall, for both crops, yield was similar in
tilled plots and Tarped, while No-till was always lowest. Across all tillage treatments, compost-mulched
plots had the greatest yields, with the straw-mulched intermediate and the unmulched lowest in yield.
DISCUSSION
This experiment demonstrated how reducing tillage can allow farmers to decrease soil
disturbance without suffering a reduction in yields, as reduced tillage did indeed produce yields equal to
intensive rototilling. Clear differences emerged between the No-till plots and other treatments, i.e. No-
0
5000
10000
15000
20000
25000
8" Rototill 2" Rototill DZT Biotill No-Till Tarped
Hea
d W
eigh
t (K
g/A
cre)
Tillage Treatments
Straw Unmulched Compost
35
till was significantly lower in yield than Tarped or tilled plots, and this difference existed both seasons.
Though there was a significant difference between tilled and untilled plots in 2017, it was because of
low yields in No-till, not Tarped, plots. Clearly, the results indicate that complete elimination of tillage,
with no other treatment, reduces yields. In contrast, Tarped plots are roughly equivalent in yield to the
tilled plots and were far higher than No-till. This effect is likely due to a number of factors.
The Tarped treatment is unique in that it is a no-till plot that has had a pre-season method of
weed control applied to it. Tarping’s primary effect was preventing early emergence of weeds and thus
creating a good seedbed where transplants had the advantage over emerging weeds. Yields of Tarped
plots were consistently as high as or slightly higher than the tilled plots, and were significantly higher
than the No-till plots. This practice enables farmers to substitute the labor of putting on and removing a
tarp pre-season for tillage operations. Combined with compost mulch, the Tarped plots had the highest
yield of all treatments in both seasons, reaching 10550 kg/acre of squash and 20564 kg/acre marketable
heads of cabbage.
However, while Tarped plots had significantly higher cabbage yields than the No-till plots, both
experienced high feeding damage in 2017. Additionally, Tarped plots had an interaction with Straw
mulch for feeding damage, likely from slug pressures, and Straw-mulched Tarped plots had lower yields
than the Unmulched Tarped plots. One possible explanation for this is related to the Straw plots of both
untilled plots. For the tilled plots, straw was left on the soil surface over the winter and was removed in
the late spring immediately prior to tilling in order to avoid nitrogen deficiency within the soil by tilling in
high C:N ratio material. This meant that whatever slug and insect habitat that existed within those plots
was eradicated by tillage. The straw was not put back onto the plots until after transplanting, and slugs
were not present at all in the tilled plots. In No-till/Tarped plots, in contrast, straw was never removed,
and slugs were present in untilled plots throughout the growing season.

36
It is likely that leaving the straw on the surface provided an ideal climate for slugs: moist
conditions, plenty of decaying plant residue, and undisturbed conditions. As noted in previous research
(Dicklow and McKeag, 2018; Vallotton, 2010), slugs are known to thrive in the moister conditions of the
spring and are considered a notable pest in some areas that practice no-till, as the lack of tillage and the
presence of plant residue provides ideal conditions for them to prey on emerging crop plants. This
appears to be a major drawback to no tillage regardless of the presence of a tarp for susceptible crops.
Removing the straw for some weeks prior to planting to disrupt the microclimate could provide control
of the problem, and would be a useful future experimental modification.
As is discussed in more detail in Chapter III, weed pressure appeared to play an important role in
this experiment, especially in the cabbage No-till plots. Weed pressure in 2017 was highest in No-till
plots, possibly due to a combination of moisture in the spring with a “point of no return” in perennial
weed pressure (as postulated by Halde et al., 2015). This pressure is seen clearly when the yield values
of the No-till Unmulched plots are compared to those of the mulched plots. Unmulched plots had no
head yield and extremely low results for total weight, reflective of plants that grew very little. The weed
census data for this season (Chapter III) shows that the No-till plots had the greatest weed pressure by
far, with most of the ground covered with weeds. Indeed, the observed size of the plants at harvest
date was no larger than it had been at transplanting. However, given that most of these plants were still
alive and healthy, this implies that some critical resource for growth was entirely lacking in these plots,
which might be explained by the presence of weeds competing for limited resources (Gallandt and
Weiner, 2015). Mulched plots of the No-till treatment had greater head yields (568 and 1556 kg/acre
for Straw and Compost respectively) similar to results found by Mulvaney et al. (2011), but these were
still greatly depressed compared to the head and total yields in all other tillage treatments, regardless of
mulch.
37
These observations are in keeping with the literature, which indicates that some organic no-till
experiments are abandoned after a few years due to overwhelming weed pressure in the absence of
tillage or herbicides (Halde et al., 2015), and that some tillage may be necessary to make no-till work in
an organic setting (Légère et al., 2013). Though the mulch did improve the yields compared to no
mulch, mulched plots in No-till still suffered a major yield drop, and were not in any way comparable to
the Tarped or tilled plots in total yield. It therefore seems that there might be another underlying issue
interacting with weed pressure and causing yield drops. It could be related to field compaction, though
the sandy loam texture of this site would not compact as badly as a heavier soil. Though permanent
beds are designed to prevent compaction except in wheel-tracks, driver error can cause compaction
within beds (Stirling, 2008; Tullberg, 2010; Vermeulen and Mosquera, 2009). Driver error was observed
occasionally in this experiment at the start of the season in the No-till plots, where it was very difficult to
distinguish between the permanent bed and the wheel-tracks. These plots had visible wheel marks
observed in the permanent beds, did not have tillage to counter-act the effect, and had reduced plant
growth. Additionally, workers in the field were not likely to distinguish the No-till beds and the
pathways due to weed overgrowth and may have trampled on them inadvertently, which would have
increased compaction. Without bulk density measurements, however, it is impossible to verify this
theory.
Besides weed pressure, another possible explanation for why No-till cabbage failed to yield,
while squash did not, could be related to the different growth patterns of cabbage and squash. Bush
squash has rapid vegetative growth, producing a tall (~2.5-3.5 ft.) plant with large leaves and a closed
canopy, reducing the amount of sunlight available for weed growth (Loy, 2004). In contrast, cabbage
has a slower growth rate that closes canopy gradually over the course of the growing season, but which
puts more energy into head growth than canopy growth, and which is very close to the ground (Dixon,
2007). Further, it has been shown that cabbage has a critical period during which it is very vulnerable to
38
yield losses if weeds are not controlled quickly (Dixon, 2007; Weaver, 1984). This appears to have
happened in this experiment, as No-till cabbage plants cleared of weeds in late July failed to increase
biomass over 1.5 months. Thus, while a farmer may be able to practice no-till with a minor reduction in
yields for squash, this cannot be replicated with a crop with the growth habits of cabbage without
substantial investment in labor to control weeds.
In this experiment, higher yields were consistently found in the mulched plots compared to the
Unmulched plots, particularly the composted plots (Figure 2.2). While Straw plots had pest issues,
Compost plots outperformed Unmulched plots in yield, and had less feeding damage. This supports the
usage of compost mulch as a way of producing a more vigorous plant with better yields due to beneficial
effects of compost. These benefits include nutrient retention, higher organic matter, more diverse
microbial communities, reduced evaporation, improved yields, more beneficial/predatory insects, and
cooling of soil (Adesina et al., 2014). DZT had an unusual issue with a single replication which had an
infestation of quackgrass (Elytrigia repens), giving it a higher weed pressure that overcame mulch
suppression. From this, we can conclude that while mulch often improves weed suppression and crop
yields, it is not fool-proof with weed control.
Overall yield trends show that marketable cabbage and squash yields for most of the treatments
(the tilled and the Tarped treatments) had very similar patterns. Cabbage’s yields were between “good”
(13608 kg/acre) and “high” (18144 kg/acre) when compared to regional yields (Dicklow and McKeag,
2018). The yield of 8” Rototill plots was 15146 kg/acre, and the other reduced tillage plots and Tarped
plots had ~16000 kg/acre. Compost similarly had ~16000 kg/acre, while Unmulched and Straw mulch
had lower average yields of 11732 and 12332 kg/acre respectively. When the individual tillage/mulch
combinations are examined (Figure 2.15), the yields remain excellent for tilled and tarped plots,
especially for tillage combined with compost, which had yields ~18700 kg/acre for the various reduced
till plots (excepting 2” Rototill, which was 17725 kg/acre), while Tarped produced the highest overall

39
yield of 20564 kg/acre. Based on this, it is clear that for cabbage, organic reduced tillage is capable of
excellent yields comparable or superior to conventional systems.
Squash had yield averages ranging between 5744 and 7792 kg/acre for tillage treatments, and
between 5506 and 8931 kg/acre for mulch treatments. These compare favorably to regional squash
yields reported by Hill, 1999 (Connecticut) between 997 and 7620 kg/acre; by Silva and Bruce, 2016
(Wisconsin, organic) of 10434 kg/acre; and by Chan et al., 2010 (New York) between 3587 and 5815
kg/acre. In particular, the highest tillage/mulch combination (Tarped Compost-mulched) was 10550
kg/acre, which closely follows the organic squash yields reported by Silva and Bruce, 2016. Therefore,
we conclude that this year produced normal squash yields for the region, and further, that given the lack
of significant differences between 8” Rototill and the reduced tillage treatments (excepting No-till), it is
possible to successfully reduce tillage without yield losses for Delicata squash.
Squash yields may have been limited by low rainfall and pest pressures. Unlike 2017, 2016 was
characterized by lower moisture due to lessened snowfall in the winter, and at the time of transplanting
in June, the soil was observed visually to be extremely dry and powdery, so much so that the plants
necessitated significant watering-in to avoid transplant death. This may have caused some stress early
on in the season to the plant. The aphid infestation that occurred midway through the season (mid-July
to mid-August) was uniformly thick throughout the field, with no plants avoiding it, so thick that it was
impossible to touch the plants without rubbing off aphids. Though this was controlled within a few
weeks by predators, this also likely stressed the plant. Finally, the powdery mildew infestation followed
immediately after the aphid infestation caused “premature senescence” by the third week of August.
Powdery mildew has the potential to spread easily in hot, dry weather, as in August 2016, and has the
potential to drastically reduce yields in cucurbits (McGrath, 1997). We believe therefore that these
various environmental factors could have combined to stress the squash plants and had the potential to
reduce their yields or affect the quality of the fruits. However, this particular cultivar is powdery mildew
40
resistant, and despite complete infestation of the field, no plants were killed by the disease before
harvest. It is important to note that the yields were uniform for all treatments and the patterns
observed were very similar to those observed in the cabbage harvest. Thus, it seems reasonable to
conclude that any potential yield reduction was not related to treatment effects within the experiment,
and that disease had a minor effect on the harvest given the similarities to other regional Delicata yields.
In future years or iterations of this experiment, more tillage treatments could be explored. All
our tilled treatments included rototilling in at least one year. Future studies should consider exploring
reduced tillage systems without the soil structure-destroying effects of rototilling if possible. Specialized
tillage implements like yeoman plows may be more difficult to obtain than a rototiller, but tillage radish
by itself might be a cheap and simple option for a farmer.
Overall, the patterns for squash and cabbage were very similar for the two growing seasons
observed, with almost no interactions between tillage and mulch found. Significant differences were
found between the No-till and Tarped treatments, while no significant differences were found between
tilled treatments in any measure of yield. Yields for both cabbage and squash were normal to high
compared to regional averages. This has excellent implications for farmers wishing to reduce tillage in
northeastern North America, and validates research that suggests that strategic, infrequent tillage can
be beneficial. The combination of tarping with no tillage is promising for farmers wishing to eliminate
tillage given its high yields. Perhaps even more important, the lack of significant differences between
tillage treatments suggests that farmers consider replacing or decreasing rototilling and explore tillage
methods that preserve soil structure such as the DZT or Biotill treatments. Mulching has clear promise
not simply as a method of weed control, but as a way to improve yields. Both Compost and Straw
provide better yields than unmulched plots, but compost provides the best yields and lacks the insect
issues of straw mulching, and when combined with pre-season tarping, provided the best yields found in
this experiment.
41
CHAPTER 3: USING MULCH AND TILLAGE TO REDUCE WEED PRESSURE IN CONSERVATION TILLAGE
SYSTEMS
INTRODUCTION
Weed management is a significant challenge for organic growers (Delate et al., 2012; Halde et
al., 2017; Reberg-Horton et al., 2012; Strik et al., 2012; Vincent-Caboud et al., 2017). Farmers often
resort to methods of weed control such as cultivation (Delate et al., 2012; Law et al., 2006; Légère et al.,
2013), flaming (Baker and Mohler, 2015; Luna et al., 2012; Strik et al., 2012), or hand weeding (Baker
and Mohler, 2015; Delate et al., 2012; Diaz-Perez et al., 2012; Reberg-Horton et al., 2012; Strik et al.,
2012). However, these methods can involve considerable inputs of time, money, and labor (Delate et
al., 2012; Diaz-Perez et al., 2012; Reberg-Horton et al., 2012; Silva and Delate, 2017), and moreover, can
sometimes compromise soil health (Jiang et al., 2011; Kainiemi et al., 2015; Zhang et al., 2006). A
solution to this conundrum is the utilization of mulches. Mulches can provide a physical barrier to weed
germination and growth, allowing crops to achieve marketable yields with a minimum investment of
labor (Adesina et al., 2014; Baker and Mohler, 2015; Burkhard et al., 2009; Delate et al., 2012; Diaz-
Perez et al., 2012; Mulvaney et al., 2011). Different forms of primary tillage can have measurable effects
on weeds, and eliminating tillage entirely can have a profound effect on nascent weed populations in
agricultural systems (Halde et al., 2015; Légère et al., 2013; Mäder and Berner, 2012; Silva and Delate,
2017). Weed pressure is considered a major barrier to adoption of reduced tillage for farmers, and
finding methods of reduced tillage that do not have more weed pressure than regular tillage would be a
useful set of data to encourage farmer adoption of low-tillage practices (Lowry, 2015).
Weed counts were performed to determine the effects of different tillage/mulch combinations
on weed populations during the growing seasons of 2016 and 2017. This research may assist farmers in
making management decisions, as weed management is a perpetual issue within organic agriculture
(Delate et al., 2012; Reberg-Horton et al., 2012; Vincent-Caboud et al., 2017). The presence of mulch

42
should provide better weed control than bare ground, and it is reasonable to expect compost to provide
better weed control than straw due to its thicker, more consistent ground cover (Brown and Gallandt,
2018; Law et al., 2006). Tarped plots should have lower weed pressure since, unlike all other
treatments, they essentially have a pre-season mulch that prevents weed growth for at least 1.5 months
before the start of the growing season in June. We expected that Tarped plots would have the best
weed control, followed by tilled plots, with No-till having the worst weed control.
METHODS
The experiment was set up as related in Chapter II: a 6x3 full factorial RCBD with four
replications. Six tillage treatments and three mulch types were utilized, as in Table 2.1 and Figure A.1
(Appendix A). This experiment allowed for an examination of how different types of tillage and mulch
affected control of weeds as well as crop productivity. The Tarped plots had a tarp applied pre-season
on 21 April to prevent initial weed germination and growth. This was removed at the same time as
tillage and bed preparation (~15 June). Mulch treatments were applied in-season immediately following
transplanting.
All plots were hand weeded prior to transplanting both seasons, with an emphasis on removing
perennial weeds such as quackgrass (Elytrigia repens), since these are not killed by tillage. This may
have biased the weed data, with quackgrass numbers lower than they may have otherwise been.
However, pre-season cultivation or herbicide events are commonly used to control perennial weeds
(Gallandt, 2018), and this hand weeding was applied evenly across all plots, which we feel reduced bias.
Weeds in No-till Unmulched plots were cut to ground level with string-trimmers immediately prior to
planting. Following planting and the summer weed censuses, all data rows were thoroughly weeded
once (between 15 July and 15 August), with the partial exception of No-till Unmulched plots in 2017,
which were not thoroughly weeded due to lack of labor, which may introduce bias into subsequent
43
years of the experiment. All weeding was performed by hand. No mechanical cultivation was
performed on the permanent beds at any point.
Crops were planted as in Chapter II, with squash in 2016 and cabbage in 2017. Data was
gathered by plot as with yield, with only the data row considered for statistical analysis. Two weed
censuses were performed on 19 July 2016 and 11 July 2017. Weed counts were made by sampling
within a 0.25 m2 quadrant (Brown and Gallandt, 2018). The quadrant was placed across the width of the
data row of each plot starting 6 feet down the length of the row from the end. The quadrant was then
moved 6 feet down the row for a second sampling, and again for a third sample, with three quadrant
samples obtained per plot. One person gathered this data.
Within each quadrant, three parameters of weed population were measured: percentage weed
cover, total weed count, and species richness. Percent area covered by weed leaves within the
quadrant was visually estimated to the nearest 5%. The weeds were removed from the quadrant and
separated into individual species; if a weed was not identifiable to the species level, then it was noted as
either “monocot (other)” or “dicot (other)” and placed into a separate pile, as per Gallandt (2018). A
weed count was made by species, and the total number of species was recorded (“species richness”).
Three samples were then averaged by plot for each parameter. In a few rare cases (always the
Unmulched No-till plots) during summers of 2016 and 2017, precise weed counts were difficult to obtain
due to the very thick canopy of weeds present in these plots. Their more advanced growth stages, as
well as weed growth habits of pseudo-colonies of plants, made them difficult to separate into
individuals (e.g. Cudweed, Gnaphalium purpureum), and the weed count numbers in these plots were
less accurate. Similarly, because some monocots and dicots were not able to be identified to the species
level due to their small size, species richness should be regarded as a qualitative measure of prominent
weed species in the plots; actual diversity was likely higher in all plots than is reflected in the recorded
means (Gallandt, 2018).
44
Statistical analysis was conducted utilizing SAS Studio University Edition (December 2017). One-
way Analysis of Variance for a full factorial RCBD was run in conjunction with the same Orthogonal
Contrasts utilized for the harvest data. Different transformations were performed as needed to meet
ANOVA assumptions (normality and equal variances) for both census dates (log[n+1], and ^1/2
respectively). P-values reflect these transformations, but means and standard errors presented are
from the original untransformed data. Interactions are presented transformed so as to preserve the
parallel distinctions which are unclear otherwise. It is often necessary to apply transformations to weed
census data due to failure to meet ANOVA assumptions (Gallandt, 2018). Assumptions of normality and
equal variance were not met in 2016 regardless of transformation applied. Multiple transformations
were applied to this data, and they suggest that true significant differences were found in those values
that did not change across transformations, indicating actual differences (Halteman, 2018). Thus, only
2016 values that consistently had a p value <0.01 were considered significant.
RESULTS
Significant ANOVA results were found for all three variables (weed count, species richness, and
percent cover) for both censuses. Both tillage (p=0.0059 and p=0.0013 for count and richness) and
mulch (p=<0.0001 for all three variables) were significantly different during 2016. Both tillage (p<0.0001
for all) and mulch (p<0.0001 for all) were significantly different in 2017 for all three variables. Significant
interactions between tillage and mulch were found within weed count and percent cover in both 2016
and 2017, while no significant interactions were found either year for species richness (p>0.05). Weed
count and percent cover data for tillage and mulch are displayed in Tables 3.1 and 3.2, and a list of
contrast results for main effects and interactions can be seen in Tables 3.3 and 3.4.

45
Table 3.1: Weed count and percent cover by tillage (2016 and 2017). Data measured in permanent bed plots receiving different intensities of tillage, established Fall 2014 at Highmoor Farm in Monmouth, ME. Values shown are plot means.
Year/Variable Tillage Treatments
8" Rototill
2" Rototill
DZT Biotill No-Till Tarped
2016 Weed Count 17.51 21.14 25.35 14.92 27.61 23.08
2017 Weed Count 42.58 79.58 49.48 44.38 89.23 17.56
2016 % Cover 23.99 21.60 23.96 18.06 23.26 20.35
2017 % Cover 13.46 27.89 13.92 13.44 61.95 4.90
Table 3.2: Weed count and percent cover by mulch (2016 and 2017). Data measured in permanent bed plots receiving different mulching regimes, established Fall 2014 at Highmoor Farm in Monmouth, ME. Values shown are plot means.
Year/Variable Mulch Treatments
Straw Unmulched Compost
2016 Weed Count 18.48 42.30 4.02
2017 Weed Count 51.58 89.20 20.62
2016 % Cover 18.44 37.17 10.00 2017 % Cover 24.11 30.53 13.14
Table 3.3: F-values for main effect contrasts of weed data (2016 and 2017). Data measured in permanent bed plots receiving different intensities of tillage or mulching regimes, established Fall 2014 at Highmoor Farm in Monmouth, ME.
Contrast analysisZ
Year Till vs.
Untilled NT vs. Tarped
8" vs. Other
Till 2" vs.
DZT/Biotill DZT vs. Biotill
Unmulched vs. Mulched
Straw vs.
Compost
2016 Count 1.89 12.56** 0.01 1.05 3.14 100.38** 96.74**
2017 Count 7.85** 56.34** 3.36 11.48** 0.49 64.49** 25.95**
2016 %Cover 3.71 7.73 0.38 0.02 2.05 42.69** 18.39**
2017 %Cover 10.65** 161.87** 1.43 11.10** 0.24 15.92** 18.97**
2016 Richness 11.09** 8.29** 0.35 0.69 3.09 58.34** 30.70**
2017 Richness 35.63** 63.03** 0.02 0.03 1 60.53** 12.63** Z Values are single degree of freedom F-test results; * and ** indicate significance at <0.05 and <0.01 respectively. Data was transformed (Log[N+1] for 2016 and square root for 2017) prior to contrast analysis.

46
Table 3.4: F-values for interaction contrasts of weed data (2016 and 2017). Data gathered in permanent bed plots receiving different intensities of tillage or mulching regimes, established Fall 2014 at Highmoor Farm in Monmouth, ME.
Contrast analysisZ
Till vs. Untilled Till vs. Untilled NT vs. Tarp NT vs. Tarp
Year by Unmulched
vs. Mulched by Straw vs.
Compost by Unmulched
vs. Mulched by Straw vs.
Compost
2016 Count 3.02 4.91* 0.66 8.58**
2017 Count 29.79** 7.91** 13.05** 0.1
2016 %Cover 3.24 6.39* 2.04 10.90**
2017 %Cover 11.07** 8.75** 1.81 0.01
2016 Richness 0.08 1.25 2.88 4.64*
2017 Richness 1.92 7.43** 1.44 0.24 Z Values are single degree of freedom F-test results; * and ** indicate significance at <0.05 and <0.01 respectively. Data was transformed (Log[N+1] for 2016 and square root for 2017) prior to contrast analysis.
No significant differences were found between any of the tilled treatments for weed count and
percent cover in 2016 (p>0.05 for both). No significant differences were found in 2017 between 8”
Rototill and other reduced till treatments (p>0.05), or between DZT and Biotill (p>0.05). However, 2”
Rototill had the highest weed counts (p=0.0014) and percent cover (p=0.0016) of the tilled plots, and
though not significantly different in species richness, had an unusual combination of weed species
compared to other tilled plots (Figure 3.1). Significant differences were found between No-till and
Tarped plots in both 2016 (p=0.0009 and p=0.0076) and 2017 (both p<0.0001). No-till plots had the
highest weed counts both seasons, and the highest percent cover in 2017. Tarped plots were lowest in
weed count and percent cover in 2017. A graph of Tarped plots in 2017 by block and mulch (Figure A.3,
Appendix D) reveals that the Tarped plot controlled weeds better than any other treatment. However,
the Unmulched plot in a single block had a disproportionate influence on the overall averages due to an
infestation of lambsquarter. In both years, Unmulched plots had the highest weed counts and cover
(p<0.0001 for both variables), followed by Straw (p<0.0001 for both), with Compost having the least.
Species richness data is displayed in Tables 3.5 and 3.6. Significant differences were found in
2016 and 2017 (p<0.0001 and p<0.0001) due to significantly lower species richness in Tarped plots. No

47
significant differences were found between tilled treatments for 2016 and 2017 (p>0.05), and No-till
appeared to not be significantly different than tilled plots. Unmulched plots were significantly greater in
species richness than mulched plots both years (p<0.0001 for both), and Straw plots were significantly
greater than Compost plots both years (p<0.0001 and p=0.0008). Witchgrass and oats were the
dominant species regardless of tillage in 2016, while a major shift in dominant species towards higher
diversity appeared to be occurring in 2017 (Table 3.5). Figure 3.1 shows the distribution of major weed
species in 2017 found within tilled plots. Of particular interest, it displays how 2” Rototill was
dominated by unusual weed species compared to other tilled plots, and demonstrates some of the high
variability that occurred in weed counts in this experiment. It also shows how compost in the reduced
till plots could select for perennial weeds (e.g. quackgrass).
One significant interaction was found in 2016 for both weed count (p=0.0051) and percent cover
(p=0.0018) in No-till vs. Tarped by Straw vs. Compost plots. Mulching with compost in tarped plots
reduced weed count and percent cover, as seen in Figures 3.2 and 3.4. Significant interactions were
found in 2017 for both variables in Tilled vs. Untilled by Unmulched vs. Mulched plots (p<0.0001 and
p=0.0016) as well as Tilled vs. Untilled by Straw vs. Compost (p=0.007 and p=0.0047), as well as an
interaction in No-till vs. Tarped by Unmulched vs. Mulched for weed count only (p=0.0007). Species
Richness only had one interaction, in 2017: Tilled vs. Untilled by Straw vs. Compost (p=0.0088). Straw
mulch in untilled plots (Figure 3.6) seemed to cause a drastic drop in species richness equivalent to
Compost.
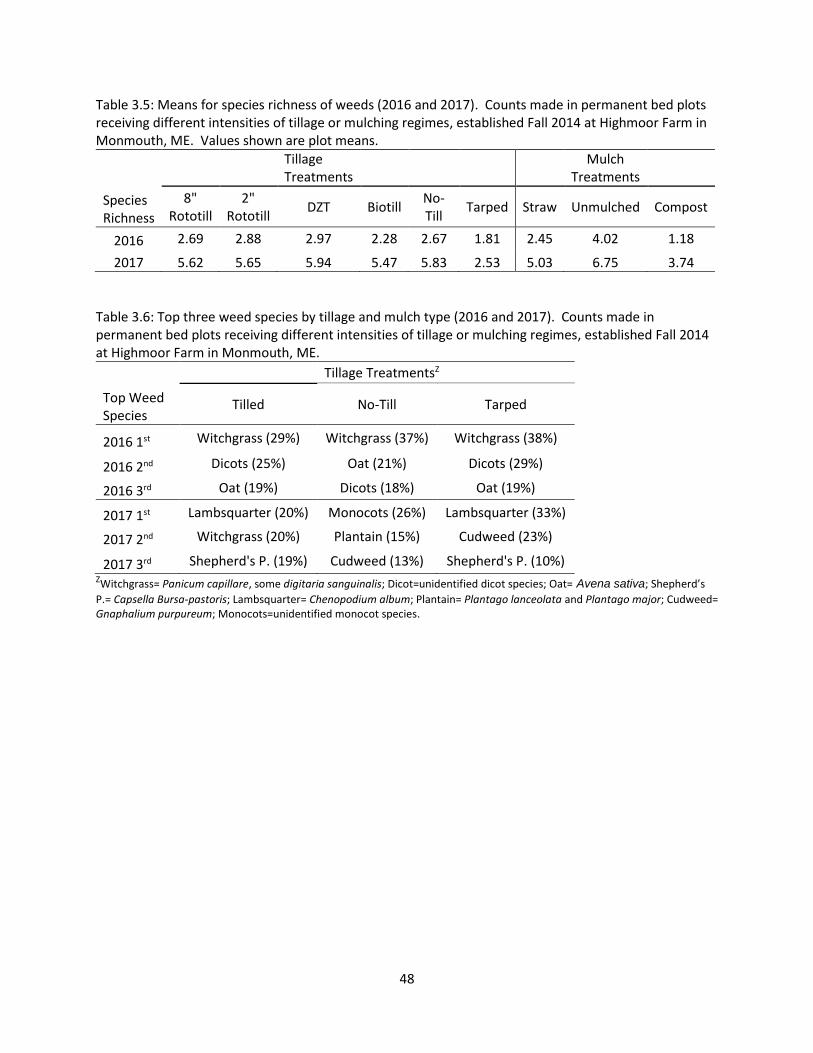
48
Table 3.5: Means for species richness of weeds (2016 and 2017). Counts made in permanent bed plots receiving different intensities of tillage or mulching regimes, established Fall 2014 at Highmoor Farm in Monmouth, ME. Values shown are plot means.
Tillage Treatments
Mulch Treatments
Species Richness
8" Rototill
2" Rototill
DZT Biotill No-Till
Tarped Straw Unmulched Compost
2016 2.69 2.88 2.97 2.28 2.67 1.81 2.45 4.02 1.18
2017 5.62 5.65 5.94 5.47 5.83 2.53 5.03 6.75 3.74
Table 3.6: Top three weed species by tillage and mulch type (2016 and 2017). Counts made in permanent bed plots receiving different intensities of tillage or mulching regimes, established Fall 2014 at Highmoor Farm in Monmouth, ME.
Tillage TreatmentsZ
Top Weed Species
Tilled No-Till Tarped
2016 1st Witchgrass (29%) Witchgrass (37%) Witchgrass (38%)
2016 2nd Dicots (25%) Oat (21%) Dicots (29%)
2016 3rd Oat (19%) Dicots (18%) Oat (19%)
2017 1st Lambsquarter (20%) Monocots (26%) Lambsquarter (33%)
2017 2nd Witchgrass (20%) Plantain (15%) Cudweed (23%)
2017 3rd Shepherd's P. (19%) Cudweed (13%) Shepherd's P. (10%) ZWitchgrass= Panicum capillare, some digitaria sanguinalis; Dicot=unidentified dicot species; Oat= Avena sativa; Shepherd’s
P.= Capsella Bursa-pastoris; Lambsquarter= Chenopodium album; Plantain= Plantago lanceolata and Plantago major; Cudweed= Gnaphalium purpureum; Monocots=unidentified monocot species.
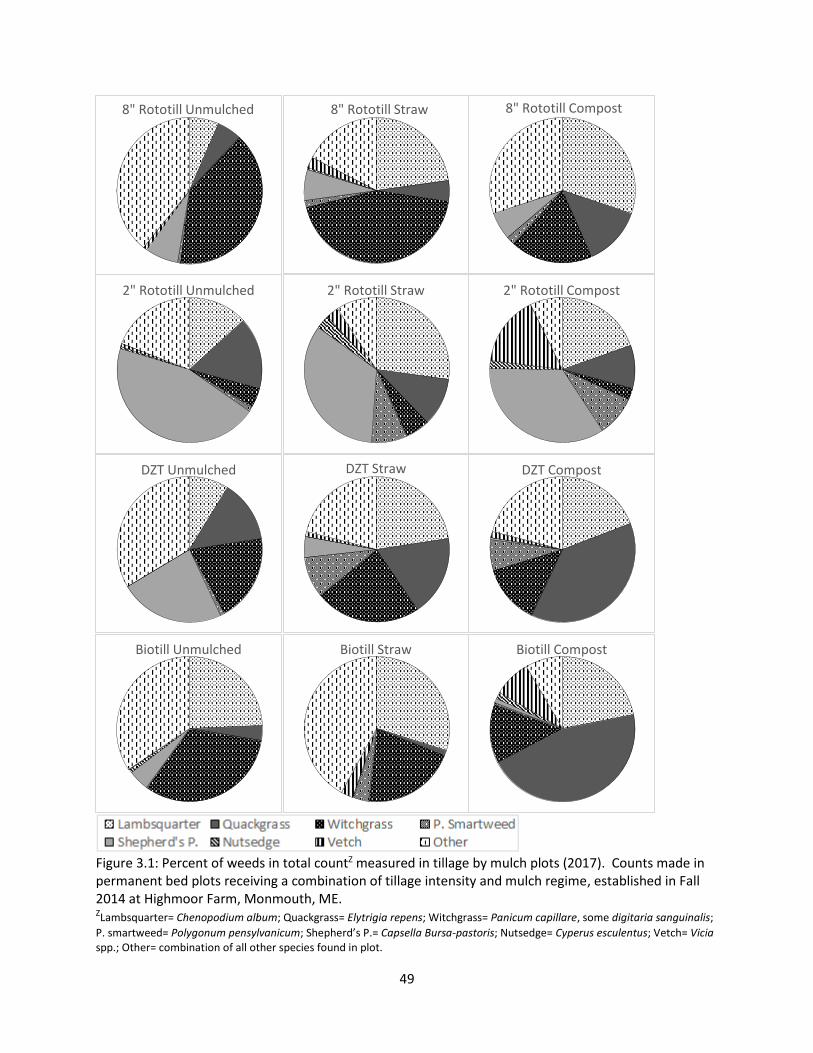
49
Figure 3.1: Percent of weeds in total countZ measured in tillage by mulch plots (2017). Counts made in permanent bed plots receiving a combination of tillage intensity and mulch regime, established in Fall 2014 at Highmoor Farm, Monmouth, ME. ZLambsquarter= Chenopodium album; Quackgrass= Elytrigia repens; Witchgrass= Panicum capillare, some digitaria sanguinalis;
P. smartweed= Polygonum pensylvanicum; Shepherd’s P.= Capsella Bursa-pastoris; Nutsedge= Cyperus esculentus; Vetch= Vicia spp.; Other= combination of all other species found in plot.
8" Rototill Unmulched 8" Rototill Straw 8" Rototill Compost
2" Rototill Unmulched 2" Rototill Straw 2" Rototill Compost
DZT Unmulched DZT Straw DZT Compost
Biotill Unmulched Biotill Straw Biotill Compost
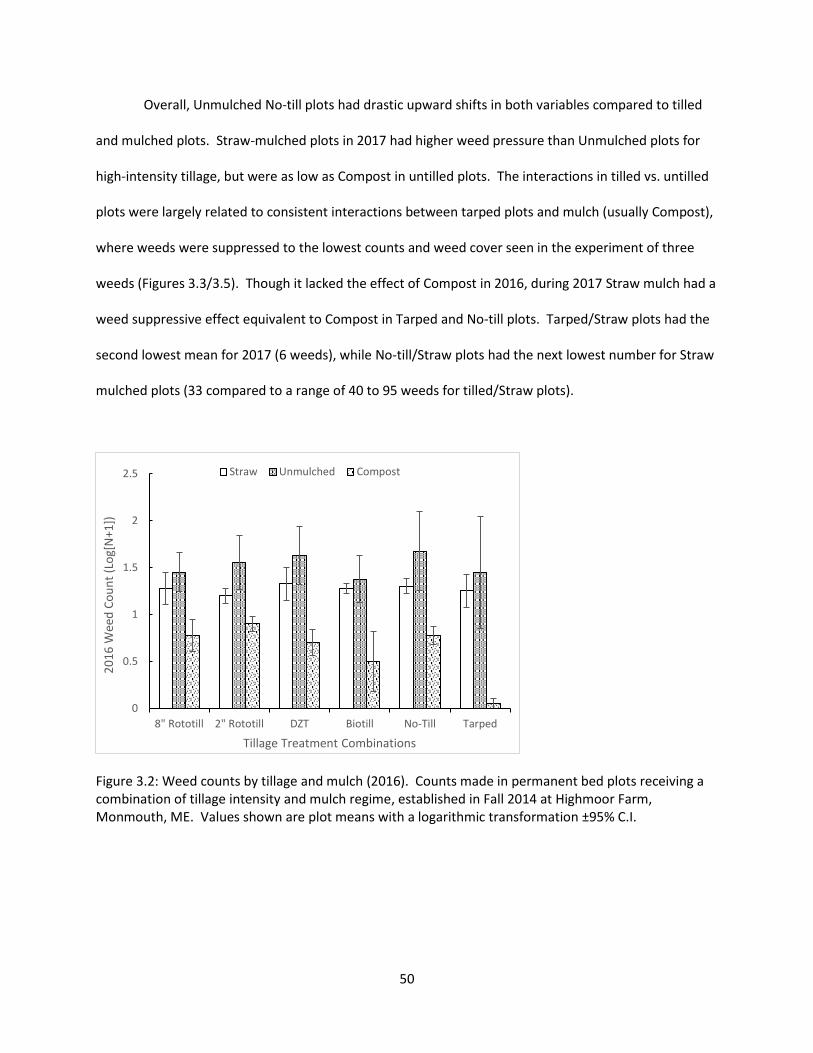
50
Overall, Unmulched No-till plots had drastic upward shifts in both variables compared to tilled
and mulched plots. Straw-mulched plots in 2017 had higher weed pressure than Unmulched plots for
high-intensity tillage, but were as low as Compost in untilled plots. The interactions in tilled vs. untilled
plots were largely related to consistent interactions between tarped plots and mulch (usually Compost),
where weeds were suppressed to the lowest counts and weed cover seen in the experiment of three
weeds (Figures 3.3/3.5). Though it lacked the effect of Compost in 2016, during 2017 Straw mulch had a
weed suppressive effect equivalent to Compost in Tarped and No-till plots. Tarped/Straw plots had the
second lowest mean for 2017 (6 weeds), while No-till/Straw plots had the next lowest number for Straw
mulched plots (33 compared to a range of 40 to 95 weeds for tilled/Straw plots).
Figure 3.2: Weed counts by tillage and mulch (2016). Counts made in permanent bed plots receiving a combination of tillage intensity and mulch regime, established in Fall 2014 at Highmoor Farm, Monmouth, ME. Values shown are plot means with a logarithmic transformation ±95% C.I.
0
0.5
1
1.5
2
2.5
8" Rototill 2" Rototill DZT Biotill No-Till Tarped
20
16
Wee
d C
ou
nt
(Lo
g[N
+1])
Tillage Treatment Combinations
Straw Unmulched Compost

51
Figure 3.3: Weed counts by tillage and mulch (2017). Counts made in permanent bed plots receiving a combination of tillage intensity and mulch regime, established in Fall 2014 at Highmoor Farm, Monmouth, ME. Data shown are plot means with a square root transformation ±95% C.I.
Figure 3.4: Percent cover by tillage and mulch (2016). Data measured in permanent bed plots receiving a combination of tillage intensity and mulch regime, established in Fall 2014 at Highmoor Farm, Monmouth, ME. Values shown are plot means with a logarithmic transformation ±95% C.I.
0
2
4
6
8
10
12
14
16
18
8" Rototill 2" Rototill DZT Biotill No-Till Tarped
20
17
Wee
d C
ou
nt
(N^1
/2)
Tillage Treatment Combinations
Straw Unmulched Compost
0
0.4
0.8
1.2
1.6
2
8" Rototill 2" Rototill DZT Biotill No-Till Tarped
Per
cen
t C
ove
r (L
og[
N+1
])
Tillage Treatment Combinations
Straw Unmulched Compost
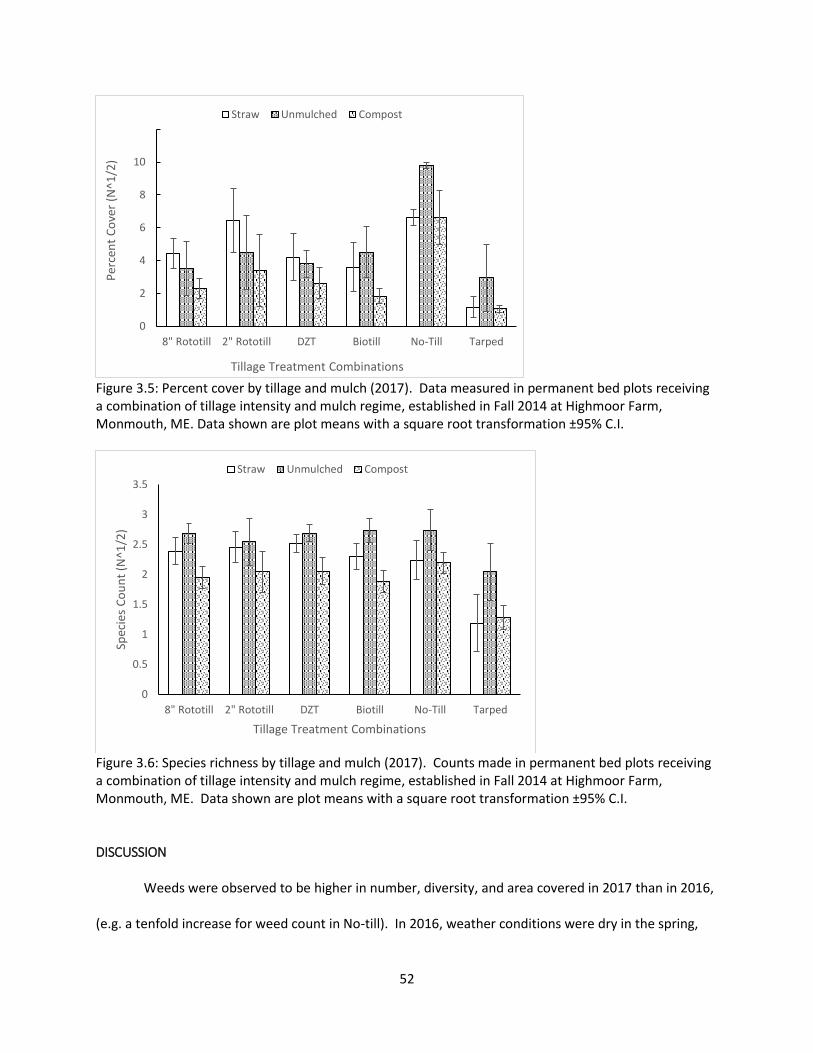
52
Figure 3.5: Percent cover by tillage and mulch (2017). Data measured in permanent bed plots receiving a combination of tillage intensity and mulch regime, established in Fall 2014 at Highmoor Farm, Monmouth, ME. Data shown are plot means with a square root transformation ±95% C.I.
Figure 3.6: Species richness by tillage and mulch (2017). Counts made in permanent bed plots receiving a combination of tillage intensity and mulch regime, established in Fall 2014 at Highmoor Farm, Monmouth, ME. Data shown are plot means with a square root transformation ±95% C.I.
DISCUSSION
Weeds were observed to be higher in number, diversity, and area covered in 2017 than in 2016,
(e.g. a tenfold increase for weed count in No-till). In 2016, weather conditions were dry in the spring,
0
2
4
6
8
10
8" Rototill 2" Rototill DZT Biotill No-Till Tarped
Per
cen
t C
ove
r (N
^1/2
)
Tillage Treatment Combinations
Straw Unmulched Compost
0
0.5
1
1.5
2
2.5
3
3.5
8" Rototill 2" Rototill DZT Biotill No-Till Tarped
Spec
ies
Co
un
t (N
^1/2
)
Tillage Treatment Combinations
Straw Unmulched Compost

53
while 2017 had higher spring rainfall. Since weed seeds are dependent on water for germination,
survival, and vigorous growth (Davis et al., 2017), it is possible that low soil moisture may have inhibited
weed growth. A second explanation could be the different growth habits of squash and cabbage
allowed more weeds to emerge in 2017, as squash rapidly closes canopy compared to cabbage.
Percent cover and total weed counts are closely related, a sort of combined measure of weed
pressure, and this makes it important to examine them together. For example, 2” Rototill plots had a
high number of weeds (80), but a lower percent cover (27.89%), compared to a similar number of weeds
in No-till (89), with a much higher percent cover (61.95%). Many of the weeds found in plots with higher
counts and lower cover were a mixture of either very small broadleaf weeds that were numerically high
but when sampled were not large in biomass, or were perennial weed structures, primarily dandelion
(Taraxacum officinale) or quackgrass (E. repens).
Observed effects in this experiment of reduced tillage on weed populations seemed to agree
with Armengot et al. (2015), who found that reducing tillage increases weed abundance (weed counts
and percent cover), but not species richness. This was confirmed by comparing the results from DZT and
Biotill plots to 8” Rototill. It appears that reducing tillage to one shallow (2”) rototill event every other
year, coupled with non-intensive tillage (tillage conducted without the soil structure-pulverizing action
of a rototiller), has the potential to either maintain or reduce weed pressure compared to 8” rototilling.
The treatment within reduced tillage treatments that did not follow this pattern was 2” Rototill,
which had rototilling to a depth of 8” in 2016 and 2” in 2017. This treatment had significantly higher
weed pressure than any other tilled treatment (Table 3.1), with counts almost as high as the No-till
treatment. The Straw-mulched plots in this treatment, along with 8” Rototill, had an interaction
between tillage and mulch that gave higher weed counts than unmulched plots for either tillage type.
2” Rototill had more ground covered by weeds than any other plot--28% instead of 13% for other tilled
plots. It also had an unusual weed assortment when compared to the summed weed counts of the tilled

54
treatments (Table 3.6), having approximately three-quarters of the shepherd’s purse (Capsella Bursa-
pastoris), two-thirds of the vetch (Vicia spp.), four-fifths of the yellow nutsedge (Cyperus esculentus) and
over half of the Pennsylvania smartweed (Polygonum pensylvanicum), as well as only one-tenth of the
witchgrass (Panicum capillare, some digitaria sanguinalis). Since this pattern did not exist in 2016,
additional research would be needed so as to ascertain if increasing weed pressure and unusual weeds
is a feature of this particular treatment.
Unlike conventional moldboard plowing, which is often dominated by aggressive annual weeds
(e.g. lambsquarter), weed diversity often increases in conditions of reduced tillage. In this experiment,
species richness was not significantly different in either season between the tilled treatments, and only
tarped and mulched plots had lowered numbers (Table 3.1). In 2016, Tarped plots had an average of 1.8
species compared to the other tillage treatments, which averaged 2.7 species. Similarly, in 2017, Tarped
plots averaged 2.5 species while other treatments averaged 5.7 species. In 2016, Unmulched plots had
4.02 species compared to 2.45 and 1.18 for Straw and Compost respectively, while in 2017, Unmulched
plots had 6.75 species and Straw and Compost had 2.03 and 3.74 respectively. Melander et al. (2013)
found that over time, annual grasses become the major weed in reduced tillage systems, and this was
confirmed in this experiment, as witchgrass and other grass species were generally dominant in both
seasons (Table 3.2). The main exception were the 2017 Tarped plots (Table 3.5), where lambsquarter
dominated, but this was largely due to an infestation in a single block. A shift towards a more even
distribution of weed diversity was observed in No-till plots in 2017 (Table 3.5).
Rototilling has the potential to contribute to perennial weed pressure. Perennial weeds such as
quackgrass are chopped into many pieces during rototilling, but may still have sufficient reserves in their
structures to enable regrowth from each piece, potentially multiplying one plant into an infestation
(Anonymous, 2016). This is an argument for the utilization of non-rototill or no-till practices. We

55
observed that even heavy mulches such as compost could not control the regrowth of rhizomal tubers,
as was seen in 2016’s DZT/Compost plots.
Chauhan et al. (2012) notes that mulching and permanent beds may be the key farming
practices necessary in reduced tillage to overcome weed problems, and this postulation seems borne
out by the experimental results. Unmulched plots had major weed problems and were significantly
higher in weed pressure than mulched plots, as might be expected (Adesina et al. 2014; Burkhard et al.,
2009; Chaudhary and Iqbal, 2013; Diaz-Perez et al., 2012; Law et al., 2006). Within the Straw plots, one
of the most common weeds in 2016 was volunteer oats (279 across all plots censused), which originated
from contaminated grain straw applied as mulch. It appeared to be an effect limited to particular bales
however, as there were very few oat volunteers in 2017 (18 across all plots censused) despite the bales
coming from the same batch. Though straw did suppress weeds, its effectiveness was variable and
inconsistent across two growing seasons. Straw mulch often failed to suppress perennials such as
quackgrass and dandelion, as well as taller annuals such as lambsquarter. Furthermore, Straw had an
inconsistent effect on yield compared to the reliability of Compost (Chapter 2), making its utility
questionable.
Compost seemed to select for fewer but more aggressive weeds. In these plots, most
broadleafs (besides occasional lambsquarter) did not thrive in the thick and often dry compost, while
aggressive weeds, often perennial weeds, overcame the mulch (e.g. quackgrass and vetch). Non-
perennial weeds (including vetch) almost exclusively sprouted near the base of the plants (where
compost was thinnest), while perennials (especially quackgrass) sprouted randomly due to tuber
growth. In 2017, some plots (especially in the no-till treatment) did not have compost applied to an
appropriate depth for weed suppression (2-3”), and weeds grew through the mulch. Mirsky et al. (2013)
relates that perennial weeds often are unaffected by mulches, and may even be stimulated by them. In
this experiment, compost often selected for perennial weeds against annual weeds (e.g. Compost-
56
mulched DZT in 2016). Despite these issues, of the three mulch treatments Compost still provided the
best weed control and yields, but may not properly suppress aggressive perennial weeds. Overall, the
evidence suggests that tarping or mulching can shift weed populations toward substantially lower
species richness. This could be problematic if pre-season or in-season mulches cause weed species
composition to shift from less aggressive weeds (e.g. plantain) towards aggressive species such as
pigweed or lambsquarter (Tarping), or selects for perennial weeds like quackgrass (Compost).
No-till plots had major weed problems, especially in 2017, either because of poor weed
management the previous year or wetter conditions. The weeds established a closed canopy by the
time of transplanting (when they were clipped), and reestablished this canopy within two weeks, before
the transplants could grow. There were 0.25 m2 patches of the Unmulched No-till plots that were
weeded (for weed counts) on 15 July, which enabled select cabbage plants to experience full sunlight
and presumably less competition for resources, yet these plants did not visibly grow throughout the rest
of the season (1.5 months). The weeds dried the soil in Unmulched No-till plots, which had the greatest
moisture depletion across the season (Chapter 4), and the lowest soil moisture value (9%). Competition
for water with weeds may have slowed or stopped cabbage growth (Gallandt and Weiner, 2015).
The increasing weed pressures found in no-till in this experiment is not unusual. Halde et al.
(2015), Janzen (2001), and Melander et al. (2013) suggest that no-till agriculture without herbicides or
effective mulches is impossible to practice without occasional tillage. Though their results are for the
Canadian Great Plains, a very different ecosystem than Maine, it is still a reasonable theory to consider.
The weed species composition in No-till was different from other plots, with aggressive, canopy-creating
weeds such as cudweed, various grasses, and plantain being predominant, despite similar species
richness compared to tilled or tarped plots (where annual weeds predominated). If each region has its
own individual population of perennial weeds that will grow increasingly aggressive in a no-till situation
where no cultivation is practiced for weed control (Buhler et al., 1994; Mirsky et al., 2013; Melander et
57
al., 2013), then the results of 2017 might indicate that this system in Maine had reached its “breaking
point,” and some tillage might be necessary to continue the plots as no-till.
An important factor that may have contributed to poor yields in No-till is related to crop growth
habit. Cabbage is a slow-growing plant with minimal leaf cover, limited height, and a month-long period
after transplanting where susceptibility to weed pressure can cause yield reductions (Dixon, 2007;
Weaver, 1984). Squash, in contrast, has rapid vegetative growth, producing many leaves that shade the
entirety of the permanent beds and the pathways (Loy, 2004). In conservation till, it has been noted
that many weed seeds reside near the soil surface and are light-dependent for germination, which
would give squash the advantage by shading its competitors (Chauhan et al., 2012). This suggests that in
conditions of organic no-till, it may be valuable to pick a rotation that only includes crops/cultivars that
are capable of rapid canopy closure, such as the bush squash in this experiment, to prevent excessive
weed pressures.
In contrast to No-till, the Tarped plots had almost no weed pressure in both years, since tarping
plots after spring snowmelt has the potential to prevent the first flush of weed growth. Given that
perennial plants rely on their starch reserves to survive the winter and then further deplete them by
growing photosynthetic plant matter in the spring (Hakansson, 2003), it follows that by blocking the sun,
tarping ensures that these perennial structures deplete themselves until death, eliminating this problem
at its source (Brown and Gallandt, 2018; Davis et al., 2017; Hakansson, 2003). Annual weeds however,
especially those triggered by sunlight, have a different cycle (Brown and Gallandt, 2018; Davis et al.,
2017; Hakansson, 2003). Some will undoubtedly trigger germination with adequate moisture, warmth,
and potential sunlight prior to tarp application, but the physical barrier of the tarp will kill these weeds,
and prevent others from germinating until mid-June.
This pre-season aspect differentiates the Tarped treatment from mulching. Because they are
not placed until June, mulches in this experiment are not able to either disrupt the first flush of weed

58
growth or cause substantial damage to perennial weeds, since these structures will have had 1-2 months
of growth prior to mulching to regain starch reserves after winter (Hakansson, 2003; Mirsky et al., 2013).
Tarped plots therefore are a tillage treatment with a built-in “mulch,” since unlike other tillage
treatments, they include this pre-season “mulching” option which has no other use than weed control
(Horowitz et al., 1983; Quintanilla-Tornel et al., 2016; Standifer et al., 1984). It is very clear when
examining the weed data from this experiment that this practice has potential beyond any other
treatment (mulch or tillage) to alter the soil’s weed population and yields.
However, while tarped plots with mulch have almost no weed pressure, without an in-season
mulch, pre-existing annual weed populations in the soil may pose a problem, as in this experiment. If a
graph of Tarped weed count by replicate is examined for Summer 2017 (Figure A.3, Appendix D), it
becomes clear that the third replicate had a disproportionate influence on the weed count averages for
the tarped plots. In this replicate there was a persistent issue with lambsquarter, which dominated the
seedbank and germinated in substantial quantities. This indicates that while tarping is indeed a very
effectual method of weed control, especially for perennials, it is not foolproof and may still require
substantial weeding or mulching to bring a pre-existing broadleaf weed problem under control.
Two issues with weed sampling and labor distribution occurred in this experiment. Weed
emergence (as measured by a weed census) is not a static event, as weeds emerge in “cohorts,”
temporally separated germination events of different groups of weed seeds (Baskin and Baskin, 2006;
Harper, 1977). It follows that weed censuses are best conducted in the shortest amount of time
possible, so as to prevent the census overlapping with new weed emergence that might give a false
picture of the actual weed pressure (Gallandt, 2018). Due to limited labor, the weed censusing for both
samplings took place over 1-2 weeks, rather than 1-2 days. Similarly, because of limited labor,
Unmulched No-till plots were not weeded in late July at the same intensity as other plots. Thus, residual
effects may occur in Unmulched No-till plots in subsequent seasons. Though these are major problems

59
with the experimental methodology, particularly the delay in censusing, we argue that it likely did not
significantly affect the data. In both 2016 and 2017, there was a long period during the summer (during
July, when both censuses took place) when rainfall was minimal or non-existent. Though the weed
censuses took place over the span of 1-2 weeks, weed emergence and growth were likely minimal
during this extended period of low soil moisture.
A critical measure of weed populations that was not taken in this experiment was weed
biomass. Weed biomass is helpful for understanding weed pressure, since a high weed count could still
mean low biomass, or a low count could have high biomass (Gallandt, 2018). Visually, while plants in
No-till grew minimally, the plots had a lush, tall canopy of weeds, especially in mulched plots. While
percent cover does indicate leaf area occupied by weeds, having a measure of biomass would have
enabled calculations of plant productivity within the beds as a cumulative total of crop and weed plants.
Possibly, net productivity of the plots on a biomass basis might have been similar, or other differences
between treatments might have emerged by measuring this data.
In conclusion, when making a recommendation to farmers in the State of Maine who are
interested in methods of reduced tillage or mulch that would assist with their weed control, a whole-
hearted endorsement of the Tarped method can be made, as well as some of the reduced tillage options
(DZT and Biotill). However, if the farmer wishes to truly eliminate all hand weeding costs, it would be
best to combine this method with either straw or compost (preferably the latter) that is spread thickly at
a depth of at least 2-3”. Based on the data, a combination of a pre-season mulch (tarping) and a
growing season mulch (straw or compost) provides maximum control of the most pernicious weeds with
a minimum investment of labor.
60
CHAPTER 4: EVALUATING SOIL HEALTH IN REDUCED TILLAGE SYSTEMS
INTRODUCTION
Soil health is a complex concept that involves measures of physical, chemical, and biological
parameters (Franzluebbers, 1999; Magdoff, 2001). Measuring the biological parameters is difficult given
how many different stimuli they respond to and influence, such as moisture, tillage, or soil carbon
(Chan, 2001; Fließbach et al., 2007). Two measurements of soil health that provide insight into soil
biological processes are earthworm counts and soil respiration. Chan (2001) states that earthworms in
sandy loam soils can respond positively to tillage and may often be dominated by surface-dwelling
earthworms (epigeic). The primary factor in determining earthworm numbers is likely the presence of
organic matter, which can be provided by mulches (Chan, 2001; Halde et al., 2017). Soil respiration is
another method of measuring soil health, and is dependent on temperature, moisture, and the presence
of carbon in the soil (Fließbach et al., 2007; Jia et al., 2016; Kainiemi et al., 2016). Tillage often
stimulates respiration and no-till can decrease it. Although higher respiration is generally a desirable
trait, too much can indicate loss of soil organic matter if no carbon inputs (such as residues) are being
added back into the soil (Castro Bustamante and Hartz, 2016; Fließbach et al., 2007; Haney et al., 2008a;
Jia et al., 2016).
We measured earthworm counts and soil respiration in a subset of the overall experimental
plots in order to explore how different tillage and mulches affect soil health. We postulated that
earthworm counts would be lower in tilled plots, and higher in the presence of plant residue (e.g. straw-
mulched plots). We also hypothesized that soil respiration will rise with temperature over the course of
the season and decrease into the fall. Further, respiration will be highest in the 8” Rototill tilled plots,
and lowest in either the No-till or Tarped plots.
61
METHODS
EARTHWORM COUNTS
The only tillage treatments sampled were 8” Rototill, No-till, and Tarped plots (three replicates),
with all tillage/mulch combinations sampled equally (nine combinations total). Earthworm (phylum
Annelida) counts were made at one discrete time in the season, prior to tilling/planting, between 12
June and 16 June 2017. To gain an accurate description of earthworm populations in soil, hand-sorting
is necessary when sampling, though it is noted that this often underestimates larger, deep burrowing
earthworms (Pelosi et al., 2008). A 35 cm by 71.5 cm by 30 cm soil pit was excavated with a spade from
each guard row at random (two samples per plot). The soil was then hand sorted on a tarp in the field
to prevent earthworm escape, as per Edwards and Lofty (1977). All clods were broken up and
thoroughly explored to gather every earthworm. After counts had been made, the earthworms and soil
were replaced in the sampled area. Anecdotal notes on earthworm size and possible species were
made. Following a transformation (square root) to meet ANOVA assumptions of equality and variance,
one-way ANOVA was run on the earthworm counts with a Student-Newman-Keuls mean separation,
(alpha of 0.05).
SOIL RESPIRATION
Soil respiration was measured using the Solvita® method during the cabbage growing season in
2017. The Solvita® respiration test (Woods End Laboratories, Mt. Vernon, ME) measures the production
of CO2-C (carbon fraction of CO2) that is emanated from a known quantity of soil over a set amount of
time (Tu, 2016), in this case twenty-four hours. It is measured with a calorimetric absorptive paddle in
an enclosed environment, where color changes indicate the presence of CO2-C. The Solvita® test used
was “Basal Respiration,” which refers to in-field soil respiration, measured from freshly sampled soil as
close to field conditions of moisture and temperature as possible.
62
Without resources to measure all tillage plots, only unmulched plots of the 8” Rototill, No-till,
and Tarped treatments were selected for measurement to examine the widest variety of possible soil
conditions. The unmulched plots were selected in order to avoid any sort of possible interaction of soil
respiration with either of the other mulch types. Measurements were taken every week and correlated
with soil moisture and temperature measurements. Composite samples were made for each plot by
taking 8-10 small soil subsamples at a depth of 4-8 in. Samples were sieved, mixed, and bagged in-field,
with no further processing. These samples were immediately taken into a lab space, and 90 g was
weighed out and placed into an airtight sample vessel (250 cc Solvita jar). Then, a plastic Solvita paddle
was placed into each container, the room air temperature was recorded, and the container was
promptly sealed. After 24 hours, the paddles were read using the Solvita Digital Color Reader Meter
(Model S100) for both CO2-C (ppm) and the calorimetric level. Twelve samples were read each week (3
treatments with 4 replications). Readings were taken every week during the growing season, 12 June
through 22 August 2017. These weekly Solvita values made it possible to track changes in respiration
over time during the growing season.
Measurement of soil CO2 flux is considered one of the most statistically complex procedures in
soil biogeochemistry (Kravchenko and Robertson, 2015). Since the plots were repeatedly sampled over
time (only three tillage treatments, no mulch), they might produce correlated results, and therefore it
was more appropriate to analyze the data as a repeated set of measures. Thus, ANOVA repeated
measures was run on the data to determine any differences between treatments (R studio, 2018),
following the advice of a statistician. A natural logarithm transformation allowed the data to meet the
assumptions of normality and equal variance.
The model statement, log(PPM) =TRT+BLOCK.2*TRT+Jdate.f+TRT*Jdate.f + TRT*Jdate.f*BLOCK.2
was constructed, where “BLOCK.2” is a unique numbering of the replicate by treatment combinations
and JDate.2 identifies each unique measurement date. A repeated measures ANOVA test utilizing the
63
above model was performed that enabled the interpretation of significance for each term of the model
(treatment and date). However, given the visual relationship between moisture and respiration (Ln
(ppm) CO2-C), moisture data and respiration were analyzed and had high correlation. But when
respiration was adjusted for time, treatment, and blocks, the correlation disappeared, implying that
changes in moisture over time might be contributing to respiration levels (Halteman, 2018). Residuals
were calculated using the model statement Ln(ppm)=Moisture. These residuals were then run with this
model statement: residuals = TRT+BLOCK.2*TRT+Jdate.f+TRT*Jdate.f + TRT*Jdate.f*BLOCK.2, where
“BLOCK.2” is a unique numbering of the replicate by treatment combinations and JDate.2 identifies each
unique measurement date. This removed any linear association between Ln(ppm) and moisture, and
allowed for a final analysis of the data utilizing the second model of Ln(ppm) with moisture factored out.
RESULTS
EARTHWORM COUNTS
The ANOVA test on earthworm counts was significant (p=0.0019). Tarped and No-till plots were
very similar, with 17 and 18 worms respectively, while 8” Rototill plots had the lowest counts of 9
worms (Figure 4.1). It is suggestive that the means for the No-till and Tarped plots are very close to each
other, while that of the tilled plots is half of either, but despite a p-value close to significance
(p=0.0845), no significant difference was found. Straw-mulched plots had the highest counts of 22
worms, followed by Compost (15 worms) and Unmulched plots (7 worms), as seen in Figure 4.2.
Significant differences were found between Mulch treatments (p=0.0004), and the mean separation
indicated significant differences between the mulched and Unmulched treatments, though Compost
was not significantly different from Straw. No significant interactions were found between tillage and
mulch (p=0.1285). Earthworm middens were only visible in the Tarped plots, perhaps due to less
predation and environmental disturbance under tarps.

64
Figure 4.1: Earthworm counts by tillage (2017). Means measured between 12 June 2017 and 16 June 2017 in permanent bed plots differing in tillage intensity, established Fall 2014 at Highmoor Farm in Monmouth, ME. Values shown are plot means ±95% C.I.
Figure 4.2: Earthworm counts by mulch (2017). Means measured between 12 June 2017 and 16 June 2017 in permanent bed plots receiving different mulching regimes, established Fall 2014 at Highmoor Farm in Monmouth, ME. Values shown are plot means; different letters indicate significant differences between groups at p<0.05.
0
5
10
15
20
25
30
8" Rototill No-Till Tarped
Tota
l Ear
thw
orm
s
A
B
A
0
5
10
15
20
25
30
35
Straw Unmulched Compost
Tota
l Ear
thw
orm
s

65
SOIL RESPIRATION
Temperature appeared to have no correlation to the respiration data, as respiration peaked
during cooler times in June and early July and fell off thereafter despite increasing temperature (Figure
4.3). Instead, respiration rates appeared to follow moisture trends. As the soil dried from June through
July, respiration rates decreased accordingly, but a rain event on ~8 August 2017 caused a slight increase
in both soil moisture and respiration rate (Figure 4.4). The initial repeated measures tests showed
significant differences between treatments (p=0.0038), and dates (p<0.0001), but no interaction for
treatment by date (p>0.05). The significant change in respiration over time indicated that respiration
rate was being influenced by a factor other than just tillage treatment. Given the relationship between
moisture and respiration observed in Figure 4.4, it was postulated that moisture was responsible for this
effect on respiration over time. Incorporating moisture into the model showed significant differences
between treatments (p=0.0011), but there were no longer significant differences over time (p>0.05) or
any interactions (p>0.05). Moisture was therefore a controlling variable for respiration, and significant
differences found in the “date” variable were likely related to moisture levels as they changed through
time.
Mean separations (Tukey HSD) run with the repeated measurements test on treatments showed
significant differences between No-till and both 8” Rototill (p=0.0001) and Tarped (<0.0001), but not
between 8” Rototill and Tarped (p=0.995), as can be seen in Figure 4.5. Over the entire season, 8”
Rototill and Tarped plots averaged 58 and 57 ppm respectively, while No-till averaged 66 ppm per
measurement. Thus, the hypothesis that there was significantly more respiration in 8” Rototill than in
No-till and Tarped was rejected.
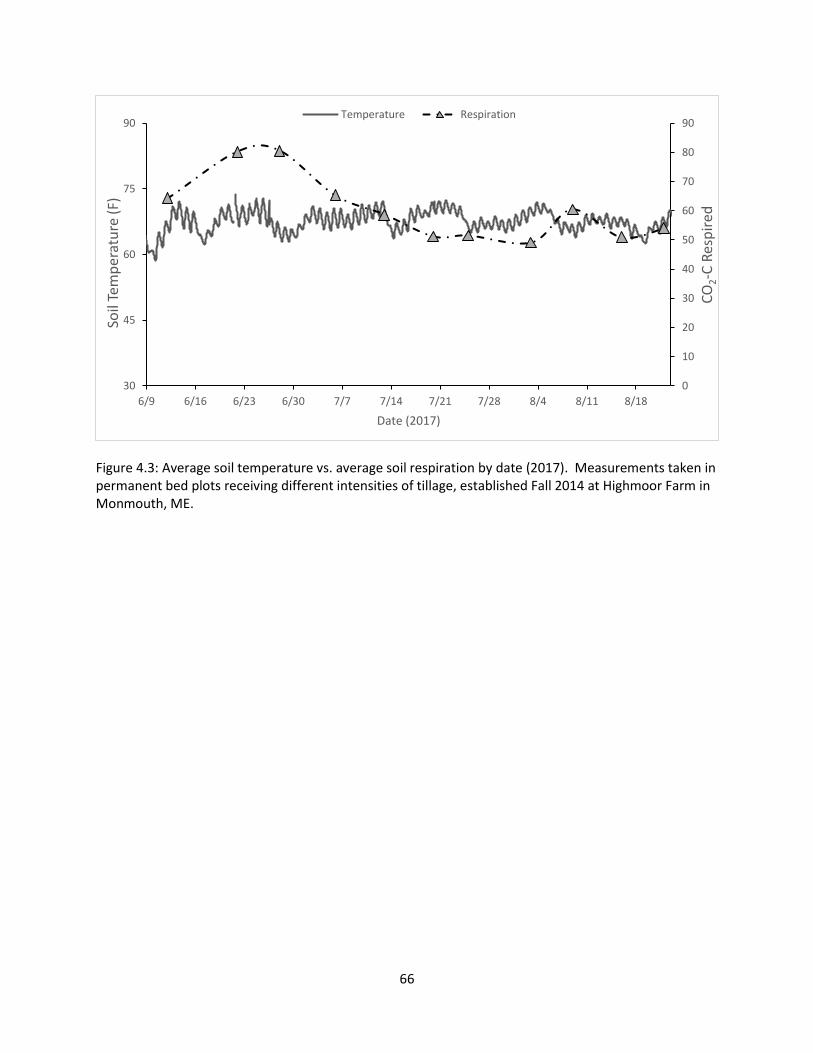
66
Figure 4.3: Average soil temperature vs. average soil respiration by date (2017). Measurements taken in permanent bed plots receiving different intensities of tillage, established Fall 2014 at Highmoor Farm in Monmouth, ME.
0
10
20
30
40
50
60
70
80
90
6/9 6/16 6/23 6/30 7/7 7/14 7/21 7/28 8/4 8/11 8/18
30
45
60
75
90
CO
2-C
Res
pir
ed
Date (2017)
Soil
Tem
per
atu
re (
F)Temperature Respiration
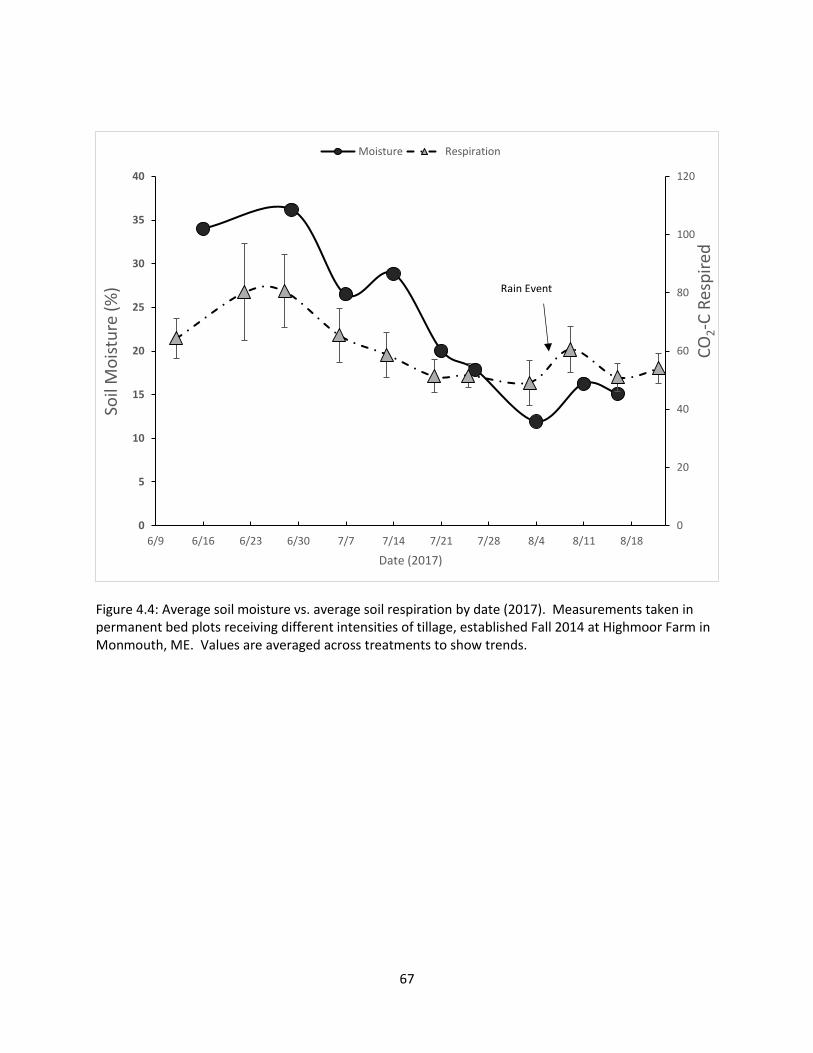
67
Figure 4.4: Average soil moisture vs. average soil respiration by date (2017). Measurements taken in permanent bed plots receiving different intensities of tillage, established Fall 2014 at Highmoor Farm in Monmouth, ME. Values are averaged across treatments to show trends.
0
20
40
60
80
100
120
0
5
10
15
20
25
30
35
40
6/9 6/16 6/23 6/30 7/7 7/14 7/21 7/28 8/4 8/11 8/18
Soil
Mo
istu
re (
%)
CO
2-C
Res
pir
ed
Date (2017)
Moisture Respiration
Rain Event

68
Figure 4.5: Seasonal trends for soil respiration by treatment (2017). Measurements taken in permanent bed plots receiving different intensities of tillage, established Fall 2014 at Highmoor Farm in Monmouth, ME. Values are plot means ±95% C.I.
DISCUSSION
EARTHWORM COUNTS
Epigeic (surface-dwelling) earthworms were the predominate type found, along with some
subsoil-dwelling (endogeic) earthworms. Deep-dwelling (anecic) earthworms were occasionally noted
and were unexpected given the relatively shallow sampling performed. Many of the earthworms found
in the Straw plots were small epigeic earthworms residing in the straw mulch litter. Chan (2001) noted a
study in which sandy loam soils (as in this experiment) experienced no population crash of earthworms
following tillage and were dominated by epigeic species, as in this experiment. Earthworms were also
found in clods and macroaggregates, which agrees with findings in the literature that earthworms have
highest populations where soil peds are least disturbed (Chan, 2001). Further, earthworm middens
35
40
45
50
55
60
65
70
75
80
85
90
95
100
6/9 6/16 6/23 6/30 7/7 7/14 7/21 7/28 8/4 8/11 8/18
CO
2-C
Res
pir
ed
Date (2017)
8" Rototill No-Till Tarped
69
were observed in both the Tarped and Straw-mulched plots (almost exclusively in the former), perhaps
reflecting their more insulated and food-rich environments. Tarps promoted soil warming early in the
season (Figure 2.1), and also provided a humid, moisture-rich environment free of many predators.
Though tillage often destroys earthworm habitat and food sources, it has different effects based
on the type of tillage implement, for example, roto-tilling a soil may have a very different effect than
utilizing a moldboard plow (Chan, 2001). Since earthworm population declines are usually linked to
intensive forms of tillage such as rototilling (Chan, 2001; Halde et al., 2017), it was surprising that
earthworm populations were not significantly different between the rototilled and no-till plots.
Inconsistencies between studies on the effects of tillage on earthworms may be explained by natural
variation, as van Schaik et al. (2016) found that spatial variability of earthworms is so high that it is very
difficult to link their numbers to the type of tillage used, even in conservation agriculture. The results
for earthworm counts by tillage type did match those of Chan (2001), who reported that no-till had on
average between two to nine times more earthworms than tilled land (in this experiment, 18 vs. 8.5 on
average).
Additionally, because of the method utilized for planting (tillage followed by immediate
transplanting), as well as the necessity of sorting through permanent bed soil for hand sorting, it should
be noted that these counts may not accurately reflect the full effect of tillage operations. This is
because the earthworm populations in the 8” Rototill tilled portions of the experiment had an entire
year since the last tillage event to recover from any sort of population crash that may have resulted as a
consequence of tilling, and according to Chan (2001), twelve months is enough time for populations to
recover to pre-tillage numbers. These numbers should therefore be taken as a reflection of earthworm
populations far removed from a tillage event.
Another potential issue with the sampling had to do with weather conditions. Ideal
temperatures for earthworms are between 10-15 °C (Lawrence and Bowers, 2002), but by the time
70
sampling was performed in early to mid-June, the average soil temperature at a depth of 6 inches was
15 °C or higher, as seen in Figure 2.1. In addition, while some days started out cool, they rapidly became
hot, which may have encouraged surface-dwelling earthworms to migrate beneath the depth of
sampling. Also, given that the sampling took place over a one-week period, this may have caused some
temporal variation difficult to explain. Earthworm populations would also be affected by moisture
content of the soil, as a plentiful moisture regime would promote earthworm populations and resist
change in temperature, but if over-saturated, would drive out these aerobic creatures (Chan, 2001). As
was seen in 2016 (data not reported), earthworm sampling conducted during a long dry period may
yield no earthworms. In 2017, 8” Rototill plots had lower moisture than No-till/Tarped plots (Figure
2.3), which might help explain the difference.
The presence or lack of sufficient food sources (crop residue, straw, compost, etc.) also plays an
important role in determining earthworm populations. Since earthworm populations are closely tied to
sources of organic matter and plant residue, their populations were higher in mulched plots. However,
the low-carbon vegetable crops grown in this experiment had minimal crop residue, which failed to
cover the soil in unmulched plots and may not have provided ample food for local organisms, at least
compared to a carbon-rich and high-residue crop such as wheat or corn. As such, the only reliable food
sources available to organisms dwelling near the soil surface would be the 2-3” thick mulches or limited
weed residue. Neither crop residue or weed residue was present in quantity following the winter and
spring, only mulches. Thus, our results suggest that residue/food presence or absence is a good
predictor of earthworm numbers. Since the compost and straw mulches tended to promote the
retention of significant moisture within the mineral soil during the early season, they created wetter,
cooler conditions favoring the presence of earthworms.
Lawrence and Bowers (2002) cautioned that the scientific ability to sample earthworms as a
measure of true population dynamics is extremely limited and imprecise. Spatial variability was
71
extremely high in our plots, with one plot having total counts of 26 and 1 earthworms from the two
sampling quadrants, and this matches the observations of Jiménez et al. (2014), who cautioned that high
spatial variability renders it difficult to link any single agricultural practice to earthworm populations.
These results did not seem to improve our understanding of soil health, besides confirming high spatial
variability and the attraction of earthworms to residues, as noted in other studies. Thus, while the
counts may indicate some underlying trends, it should not be used as the sole measure of soil health.
SOIL RESPIRATION
Soil respiration is stated to be positively correlated with temperature (Boone et al., 1998; Lloyd
and Taylor, 1994; Robinson et al., 2017). This was not observed in this experiment, as no obvious
relationship existed between temperature and respiration rate (Figure 4.3). However, a clear
relationship existed between moisture and respiration rate (Figure 4.4), which became clear after
moisture was factored into the regression model. Robinson et al. (2017) found that temperature only
exerted an effect on respiration when moisture was maintained at high enough levels to not interfere
with microbial activity. Though microbial populations may shift their metabolisms in response to
changing soil temperatures, without sufficient moisture, respiration patterns do not follow temperature.
Similarly, Kainiemi et al. (2016) found in Sweden that moisture was the primary factor that determined
soil respiration rate.
Significant differences between treatments were found, but not as expected. Respiration rate in
the 8” Rototill plots was not higher than other treatments. Instead, No-till had the highest respiration
rates (Figure 4.5). This is very different from many studies that assert tillage causes significantly
increased soil respiration over time compared to no-till (Kainiemi et al., 2015; Nawaz et al., 2017;
Yonemura et al., 2014). Surprisingly, both Tarped and 8” Rototill plots had respiration rates that were
not statistically different from each other, despite their very different tillage regimes. This could be

72
caused by a variety of factors, such as depression of microbial activity by tarping or tillage. However,
this still does not explain why the two treatments were so similar throughout the growing season,
especially given that the Tarped plots were otherwise untilled.
Roots of living plants in the soil contribute to the overall soil respiration through their own
respiration as well as through providing root exudates that stimulate the microbial populations in the
soil (Blagodatskaya et al., 2014; Boone et al., 1998; Kuzyakov, 2002). The commonality shared between
the 8” Rototill and Tarped plots is that they had a lack of plant root matter due to their management
prior to planting. For 8” Rototill plots, any plant root matter was either pulled out in pre-transplant
weeding or was rototilled and shredded prior to planting, which would have encouraged the rapid
decomposition of any remaining root labile resources (Kainiemi et al., 2015; Nawaz et al., 2017;
Yonemura et al., 2014). In Tarped plots, initial weed growth in the spring was prevented until the
middle of June, ensuring a sort of “stale seedbed” with no other living plant matter present. Both 8”
Rototill and Tarped plots had smaller populations of less vigorous weeds throughout the season
compared to No-till, while cabbage did not put out root mass visible in sampling until late July, and
never had the quantity observed in No-till plots.
In contrast, No-till plots had completely closed canopy prior to planting, with a diverse mixture
of weed species of both annual and perennial types. Perhaps most importantly, though these plots had
two weeding events prior to planting, the weeds recovered quickly from these events. While this weed
thinning destroyed above-ground biomass, it seemed to promote a new flush of growth, for by the time
weed counts began two weeks later, the weeds had fully closed canopy over the crop plants. The weeds
had vast root systems, which was evident in the presence of root matter observed with the earliest No-
till samples, as well as from the lower moisture values displayed in these plots throughout the season
(including the lowest season value of 9% moisture) which was likely due to the presence of so many
plants from the start of the season.
73
Given all of these pieces of evidence, it seems reasonable to propose that the significant
difference in respiration between the treatments stems from the abundance of plant root matter and
subsequent stimulation of the microbial population found in No-till plots compared to 8” Rototill or
Tarped plots. Kuzyakov (2002) even notes that the response of microbial populations over time is a
function of how long they have been interacting with root matter, and that time and respiration in the
rhizosphere are positively correlated. Kallenbach et al. (2015) suggests that organic systems with more
diverse root systems (from legume cover crops) stimulates microbial activity and biomass. While weeds
do not have the same root dynamics as a leguminous cover crop (excepting weeds such as clover), the
high number and diversity of weed roots might have positively affected microbial activity, and some
research indicates that each weed species has the capacity to exert a unique effect on microbial
populations (Eisenhaur et al., 2010).
This theory has some interesting implications, the foremost of which is the possibility that it may
be beneficial, from a soil health perspective, to leave weed roots in the soil, or at the least to attempt
methods of weed control that do not involve uprooting the weed, such as slicing weeds off at ground
level, though this can be ineffectual or risky with perennial weeds. Indeed, some studies suggest that
weed diversity in cropping systems can allow for more diverse populations of beneficial and predatory
insects, which may in turn improve the health of the crops (Mäder et al., 2002; Mäder and Berner, 2012;
Zikeli and Gruber, 2017) The data also implies that despite the other benefits of tarping, it did not
improve soil health from the perspective of respiration when compared to tillage, and as seen in
Chapter III, it dropped the diversity of weeds, which could imply a loss of microbial diversity due to lack
of diverse root exudates.

74
CHAPTER 5: CONCLUSIONS
Yield data for this thesis demonstrated clearly, for both squash and cabbage, that farmers can
successfully reduce or eliminate tillage in the State of Maine without yield or quality reductions,
especially in combination with a mulch. Utilizing alternating years of 2” rototilling with either DZT or
Biotill produced the same yields as 8” rototilling, with slightly less weed pressure. Alternating 8” and 2”
rototilling, however, while not reducing yields, seemed to increase weed pressure. No-till with no pre-
season method of weed control to substitute for the action of tillage against weeds is not practicable
and may result in crop failure when crops/cultivars are grown that are not aggressive in canopy growth.
However, pre-season methods of weed control (such as tarping) when combined with no-till show great
promise, as this experiment showed that they offer equivalent or greater yields as reduced or full tillage
along with greatly lowered weed pressure, especially when combined with a mulch.
This thesis also demonstrated that weeds can be successfully controlled and good yields
maintained through a combination of mulch and tillage practices without sacrificing yields. Mulching
allows for both improved yields (as was seen in cabbage) and weed suppression. Yield improvement
and weed control with Compost was often drastically higher than that of Straw, which in turn was
generally higher than unmulched plots. Despite the utility of straw in improving yields, there was higher
feeding damage for cabbage in Straw plots compared to Unmulched and Compost plots, as well as
significant weed pressure from introduced seeds in the straw. Rototilling had a risk of multiplying
perennial weed pressures. No-till shifted the population towards grasses, aggressive annuals, and
perennials. Tarping shifted weed populations from perennial towards annual weeds, and provided
excellent weed control except in plots where a pre-existing weed seedbank was found.
The experiments involving earthworm counts and soil respiration in the summer of 2017
provided an interesting, but incomplete, picture into the dynamics of soil health that can be observed
within a reduced/no-till organic vegetable production system. Earthworm counts from one year

75
demonstrated that soil cover and the presence of plant residue from mulch was a better predictor of
earthworm presence than tillage treatment. Since earthworms have uneven spatial distribution, no
single counting method gives a fully accurate picture of earthworm populations, and only a single year
of data was collected, so no firm conclusions can be stated. Soil respiration data indicates that soil
moisture was a limiting factor in 2017, and respiration may also be limited or influenced by other factors
such as plant presence or absence. A hypothesis arising from this experiment is that respiration may be
stimulated by the presence of plant roots. If true, this suggests that the healthiest cropping systems are
those that maintain constant or near-constant live plant growth in them, a salient feature of most
natural systems (e.g. forests), and that the role and place of the weed might have potential for re-
evaluation for farmers interested in sustainability.
In conclusion, this thesis showed that rototilling may be successfully reduced to every other year
in the State of Maine without yield loss or increased weed pressure when coupled with a low-impact
method such as deep zone tillage or tillage radish. No-till can also be adopted without yield loss if it is
combined with pre-season tarping. Mulching improves crop yields and aids in suppressing weeds,
though compost performs this function better than straw. Earthworms population levels appear more
dependent on the presence or absence of cover and food than on tillage. Finally, soil respiration is
higher in no-till plots, and this may be due to the season-long presence of plant roots. It is therefore
possible to reduce tillage and see agronomic results equal or better than standard tillage practices in the
State of Maine.
76
BIBLIOGRAPHY
Adesina, G.O., O.A. Olaniyan, M.A. Ojo, and W.B. Akanbi. 2014. Comparison of different composts for weed suppression ability and tomato production in Ogbomoso, Nigeria. Intl. J. Agr. Crop Sci. 7(9):569-577.
Anderson, R.L. 2017. Improving resource-use-efficiency with no-till and crop diversity. Renewable Agr. Food Systems. 32(2):105-8.
Anonymous Author. 2016. WSSA fact sheet. Weed Science Society of America. 18 September 2017. <http://wssa.net/wp-content/uploads/WSSA-Weed-Science-Definitions.pdf>.
Armengot, L., A. Berner, J.M. Blanco-Moreno, P. Mäder, and F.X. Sans. 2015. Long-term feasibility of reduced tillage in organic farming. Agron. Sustainable Dev. 35(1):339-46.
Baker, B.P. and C.L. Mohler. 2015. Weed management by upstate New York organic farmers: strategies, techniques and research priorities. Renewable Agr. Food Systems 30(5):418-27.
Baskin, C.C. and J.M. Baskin. 2006. The natural history of soil seed banks of arable land. Weed Sci. 54(3):549-557.
Bedano, J. and A. Domínguez. 2016. Large-scale agricultural management and soil meso- and macrofauna conservation in the Argentine pampas. Sustainability. 8(7):653.
Berner, A., I. Hildermann, A. Fließbach, L. Pfiffner, U. Niggli, and P. Mäder. 2008. Crop yield and soil fertility response to reduced tillage under organic management. Soil & Tillage Res. 101(1):89-96.
Blagodatskaya, E., S. Blagodatsky, T. Anderson, and Y. Kuzyakov. 2014. Microbial growth and carbon use efficiency in the rhizosphere and root-free soil. PloS one. 9(4):e93282.
Boone, R.D., K.J. Nadelhoffer, J.D. Canaary, and J.P. Kaye. 1998. Roots exert a strong influence on the temperature sensitivity of soil respiration. Nature. 396(6711):570.
Boulal, H and H. Gómez-Macpherson. 2010. Dynamics of soil organic carbon in an innovative irrigated permanent bed system on sloping land in southern Spain. Agr. Ecosystems and Environ. 139(1):284-92.
Brainard, D.C., E. Haramoto, M. Martin, I.I. Williams, and S. Mirsky. 2013. Towards a no-till no-spray future? Introduction to a symposium on nonchemical weed management for reduced-tillage cropping systems. Weed Technol. 27(1):190-2.
Brown, B. and E.R. Gallandt. 2018. A systems comparison of contrasting organic weed management strategies. Weed Sci. 66(1):109-20.
Brown, M.W. and T. Tworkoski. 2004. Pest management benefits of compost mulch in apple orchards. Agr. Ecosystems Environ. 103(3):465-72.
77
Buhler, D.D., D.E. Stoltenberg, R.L. Becker, and J.L. Gunsolus. 1994. Perennial weed populations after 14 Years of variable tillage and cropping practices. Weed Sci. 42(2):205-9.
Burkhard, N., D. Lynch, D. Percival, and M. Sharifi. 2009. Organic mulch impact on vegetation dynamics and productivity of highbush blueberry under organic production. Hort. Sci. 44(3):688.
Canali, S., M. Diacono, G. Campanelli, and F. Montemurro. 2015. Organic no-till with roller crimpers: agro-ecosystem services and applications in organic Mediterranean vegetable productions. Sustainable Agr. Res. 4(3): 70.
Carr, P.M., R.L. Anderson, Y.E. Lawley, P.R. Miller, and S.F. Zwinger. 2012. Organic zero-till in the northern US Great Plains region: opportunities and obstacles. Renewable Agr. Food Systems. 27(1):12-20.
Castro Bustamante, S.J. and T.K. Hartz. 2016. Carbon mineralization and water-extractable organic carbon and nitrogen as predictors of soil health and nitrogen mineralization potential. Commun. Soil Sci. Plant Analysis. 47(sup1):46-53.
Chan, K.Y. 2001. An overview of some tillage impacts on earthworm population abundance and diversity — implications for functioning in soils. Soil & Tillage Res. 57(4):179-91.
Chan, S., B. Caldwell, and B. Rickard. 2010. An economic examination of alternative cropping systems in New York State. Cornell Univ. Ext. Bul. EB 2010-14.
Chaudhary, S. and J. Iqbal. 2013. Weed control and nutrient promotion in zero-tillage wheat through rice straw mulch. Pakistan J. Weed Sci. Res. 19(4).
Chauhan, B.S., R.G. Singh, and G. Mahajan. 2012. Ecology and management of weeds under conservation agriculture: A review. Crop Protection. 38:57.
Čoja, T., K. Zehetner, A. Bruckner, A. Watzinger, and E. Meyer. 2008. Efficacy and side effects of five sampling methods for soil earthworms (Annelida, Lumbricidae). Ecotoxicology Environ. Safety. 71(2):552-65.
Cox, J.A., S. Morris, and T. Dalby. 2014. Woodchip or weedmat? A comparative study on the effects of mulch on soil properties and blueberry yield. Acta hort. (1018):369-74.
Dalal, R.C., P.A. Henderson, and J.M. Glasby. 1991. Organic matter and microbial biomass in a vertisol after 20 yr of zero-tillage. Soil Biol. Biochem. 23(5):435-41.
Das, A., R. Lal, D.P. Patel, R.G. Idapuganti, J. Layek, S.V. Ngachan, et al. 2014. Effects of tillage and biomass on soil quality and productivity of lowland rice cultivation by small scale farmers in north eastern India. Soil and Tillage Res. 143:50-8.
Davis, A., R.L. Zimdahl, B. Maxwell, C. Swanton, A. Dille, S.A. Clay, C. Preston, I. Heap, K. Reddy, and M. Liebman. 2017. Integrated Weed Management for Sustainable Agriculture. Burleigh Dodds Science Publishing Limited, Cambridge, UK.

78
Delate, K., D. Cwach, and C. Chase. 2012. Organic no-tillage system effects on soybean, corn and irrigated tomato production and economic performance in Iowa, USA. Renewable Agr. and Food Systems. 27(1):49-59.
Diaz-Perez, J.C., S.C. Phatak, J. Ruberson, and R. Morse. 2012. Mulches increase yield and improve weed control in no-till organic broccoli (Brassica oleracea var. botrytis). Acta hort. (933):337-342.
Dicklow, M.B. and L. McKeag, editors. 2018. 2018-2019 New England Region Vegetable Management Guide. Univ. Mass. Ext., Amhurst, US.
Dixon, G.R. 2007. Vegetable brassicas and related crucifers. CABI Pub, Wallingford, UK; Cambridge, MA.
Doran, J.W., and A. Jones. 1996. Methods for assessing soil quality. Soil Sci. Soc. Amer., Madison, Wis., USA.
Doran, J.W. and M.R. Zeiss. 2000. Soil health and sustainability: managing the biotic component of soil quality. Appl. Soil Ecol. 15(1):3-11.
Duboc, O., F. Zehetner, and M.H. Gerzabek. 2011. Recent developments of no-till and organic farming in India: is a combination of these approaches viable? J. Sustainable Agr. 35(6):576-612.
Edwards, C.A. and J.R. Lofty. 1972. Biology of earthworms. Chapman and Hall, London, UK.
Eisenhauer, N., H. Beßler, C. Engels, G. Gleixner, M. Habekost, A. Milcu, et al. 2010. Plant diversity effects on soil microorganisms support the singular hypothesis. Ecol. 91(2):485-96.
Eisenhauer, N., D. Straube, and S. Scheu. 2008. Efficiency of two widespread non-destructive extraction methods under dry soil conditions for different ecological earthworm groups. European J. Soil Biol. 44(1):141-5.
Eulenberg, E.R.O. 2012. Effects of wood chip mulches on weed suppression and woody plant establishment. Wash. State Univ., Pullman, PhD Diss. 3517394.
Feldman, R. S., C.E. Holmes, and T.A. Blomgren. 2000. Use of fabric and compost mulches for vegetable production in a low tillage, permanent bed system: Effects on crop yield and labor. Amer. J. Alternative Agr. 15(4):146-153.
Fließbach, A., H. Oberholzer, L. Gunst, and P. Mäder. 2007. Soil organic matter and biological soil quality indicators after 21 years of organic and conventional farming. Agr. Ecosystems Environ. 118(1):273-84.
Franzluebbers, A.J. 1999. Potential C and N mineralization and microbial biomass from intact and increasingly disturbed soils of varying texture. Soil Biol. and Biochem. 31(8):1083-90.
Gallandt, E.R. 2018. Personal Communication. University of Maine.
79
Gallandt, E.R. and Weiner, J. 2015. Crop-Weed competition, in: eLS. John Wiley & Sons Ltd, Chichester, UK. http://www.els.net.
Ge, T., S. Nie, J. Wu, J. Shen, H. Xiao, C. Tong, et al. 2011. Chemical properties, microbial biomass, and activity differ between soils of organic and conventional horticultural systems under greenhouse and open field management: a case study. J. Soils Sediments. 11(1):25-36.
Govaerts, B., K.D. Sayre, and J. Deckers. 2005. Stable high yields with zero tillage and permanent bed planting? Field Crops Res. 94(1):33-42.
Gürsoy, S. 2012. Evaluation of the no-till demonstration studies in south east Anatolia region of Turkey. AGRIS On-line Papers Econ. Informatics. 4(3):21.
Hakansson, S. 2003. Weeds and weed management on arable land: an ecological approach. CABI Pub, Wallingford, Oxon, UK; New York.
Halde, C., K.C. Bamford, and M.H. Entz. 2015. Crop agronomic performance under a six-year continuous organic no-till system and other tilled and conventionally-managed systems in the northern Great Plains of Canada. Agr., Ecosystems Environ. 213:121-30.
Halde, C. and M.H. Entz. 2014. Flax production system performance under organic rotational no-till and two organic tilled systems in a cool subhumid continental climate. Soil Tillage Res. 143:145-154.
Halde, C., S. Gagne, A. Charles, and Y. Lawley. 2017. Organic no-till systems in eastern Canada: a review. Agr. 7(4):36.
Halde, C., R.H. Gulden, and M.H. Entz. 2014. Selecting cover crop mulches for organic rotational no-till systems in Manitoba, Canada. Agron. J. 106(4):1193.
Halteman, W. 2018. Personal Communication. University of Maine.
Haney, R.L., W.F. Brinton, and E. Evans. 2008. Soil CO2 respiration: comparison of chemical titration, CO2 IRGA analysis and the Solvita gel system. Renewable Agr. Food Systems. 23(2):171-176.
Haney, R.L., W.H. Brinton, and E. Evans. 2008. Estimating soil carbon, nitrogen, and phosphorus mineralization from short-term carbon dioxide respiration. Comm. Soil Sci. Plant Analysis. 39(17-18):2706-20.
Harper, J.L. 1977. Population biology of plants. Academic Press, London; New York.
He, J., N.J. Kuhn, X.M. Zhang, X.R. Zhang, and H.W. Li. 2009. Effects of 10 years of conservation tillage on soil properties and productivity in the farming-pastoral ecotone of Inner Mongolia, China. Soil Use and Mgt. 25(2):201-9.
Henneron, L., L. Bernard, M. Hedde, C. Pelosi, C. Villenave, C. Chenu, et al. 2015. Fourteen years of evidence for positive effects of conservation agriculture and organic farming on soil life. Agron. Sustainable Dev. 35(1):169-81.
80
Herrick, J.E. 2000. Soil quality: an indicator of sustainable land management? Appl. Soil Ecol. 15(1):75-83.
Hill, D.E. 1999. Winter Squash Trials 1997-1998. New Haven Ag. Exp. Station, Connecticut Coop. Ext. Bul. 960.
Horowitz, M., Y. Regev, and G. Herzlinger. 1983. Solarization for weed control. Weed Sci. 31(2):170-179.
Ibragimov, N., S. Evett, Y. Esenbekov, F. Khasanova, I. Karabaev, L. Mirzaev, et al. 2011. Permanent beds vs. conventional tillage in irrigated arid central Asia. Agron. J. 103(4):1002.
Jacobsen, K.L., C.L. Escalante, and C.F. Jordan. 2010. Economic analysis of experimental organic agricultural systems on a highly eroded soil of the Georgia Piedmont, USA. Renewable Agr. Food Systems. 25(4):296-308.
Janzen, H.H. 2001. Soil science on the Canadian prairies - peering into the future from a century ago. Can. J. Soil Sci. 81(4):489-503.
Jia, S., X. Zhang, X. Chen, N.B. McLaughlin, S. Zhang, S. Wei, et al. 2016. Long-term conservation tillage influences the soil microbial community and its contribution to soil CO2 emissions in a Mollisol in Northeast China. J. Soils Sediments. 16(1):1-12.
Jiang, X., A.L. Wright, J. Wang, and Z. Li. 2011. Long-term tillage effects on the distribution patterns of microbial biomass and activities within soil aggregates. Catena. 87(2):276.
Jiménez, J.J., T. Decaëns, P. Lavelle, and J. Rossi. 2014. Dissecting the multi-scale spatial relationship of earthworm assemblages with soil environmental variability. BMC Ecol. 14(1):26.
Jin, H., W. Qingjie, L. Hongwen, L. Lijin, and G. Huanwen. 2009. Effect of alternative tillage and residue cover on yield and water use efficiency in annual double cropping system in North China Plain. Soil Tillage Res. 104(1):198-205.
Kainiemi, V., J. Arvidsson, and T. Kätterer. 2015. Effects of autumn tillage and residue management on soil respiration in a long‐term field experiment in Sweden. J. Plant Nutr. Soil Sci. 178(2):189-98.
Kainiemi, V., H. Kirchmann, and T. Kätterer. 2016. Structural disruption of arable soils under laboratory conditions causes minor respiration increases. J. Plant Nutr. Soil Sci. 179(1):88-93.
Kallenbach, C.M., A.S. Grandy, S.D. Frey, and A.F. Diefendorf. 2015. Microbial physiology and necromass regulate agricultural soil carbon accumulation. Soil Bio. Biochem. 91:279-90.
Kargas, G., P. Kerkides, and A. Poulovassilis. 2012. Infiltration of rain water in semi-arid areas under three land surface treatments. Soil Tillage Res. 120:15-24.
Kaval, P. 2004. The profitability of alternative cropping systems: a review of the literature. J. Sustainable Agr. 23(3):47-65.

81
Kravchenko, A.N. and G.P. Robertson. 2015. Statistical challenges in analyses of chamber-based soil CO and NO emissions data. Soil Sci. Soc. Amer. J. 79(1):200.
Kuzyakov, Y. 2002. Separating microbial respiration of exudates from root respiration in non-sterile soils: a comparison of four methods. Soil Biol. Biochem. 34(11):1621-31.
Law, D.M., A.B. Rowell, J.C. Snyder, and M.A. Williams. 2006. Weed control efficacy of organic mulches in two organically managed bell pepper production systems. Hort. Technol. 16(2):225.
Lawrence, A.P. and M.A. Bowers. 2002. A test of the ‘hot’ mustard extraction method of sampling earthworms. Soil Biol. Biochem. 34(4):549-52.
Légère, A., S.J. Shirtliffe, A. Vanasse, R.H. Gulden. 2013. Extreme grain-based cropping systems: when herbicide-free weed management meets conservation tillage in northern climates. Weed Technol. 27(1):204-11.
Li, H., Q.J. Wang, J. He, H.W. Li, Z.Y. Lu, R.G. Rasaily, et al. 2014. Permanent raised beds improved soil physical properties in an annual double-cropping system. Agron. 106(1):7.
Lichter, K., B. Govaerts, J. Six, K.D. Sayre, J. Deckers, and L. Dendooven. 2008. Aggregation and C and N contents of soil organic matter fractions in a permanent raised-bed planting system in the highlands of central Mexico. Plant Soil. 305(1/2):237-52.
Linn, D.M. and J.W. Doran. 1984. Aerobic and anaerobic microbial populations in no-till and plowed soils. Soil Sci. Soc. Amer. 48(4):794-799.
Lloyd, J. and J.A. Taylor. 1994. On the temperature dependence of soil respiration. Functional Ecol. 8(3):315-23.
Lori, M., S. Symnaczik, P. Mäder, G. De Deyn, and A. Gattinger. 2017. Organic farming enhances soil microbial abundance and activity—A meta-analysis and meta-Regression. PLoS One. 12(7):e0180442.
Lounsbury, N.P. and R.R. Weil. 2015. No-till seeded spinach after winterkilled cover crops in an organic production system. Renewable Agr. Food Systems. 30(5):473-85.
Lowry, C.J. 2015. Adapting reduced tillage systems for organic production: Utilizing strip-tillage and alternative cover crop spatial arrangements to address farmers' perceived barriers to adoption. Michigan State Univ., East Lansing, PhD Diss., 3734432.
Loy, J.B. 2004. Morpho-Physiological aspects of productivity and quality in squash and pumpkins (Cucurbita spp.). Critical Rev. Plant Sci. 23(4):337-363.
Lu, Y., B. Watkins, and J. Teasdale. 1999. Economic analysis of sustainable agricultural cropping systems for mid-Atlantic states. J. Sustainable Agr. 15(2-3):77-93.
82
Luna, J.M., J.P. Mitchell, and A. Shrestha. 2012. Conservation tillage for organic agriculture: evolution toward hybrid systems in the western USA. Renewable Agr. Food Systems. 27(1):21-30.
Mäder, P., A. Fließbach, D. Dubois, L. Gunst, P. Fried, and U. Niggli. 2002. Soil fertility and biodiversity in organic farming. Sci. 296(5573):1694-7.
Mäder, P. and A. Berner. 2012. Development of reduced tillage systems in organic farming in Europe. Renewable Agr. Food Systems. 27(1):7-11.
Magdoff, F. 2001. Concept, components, and strategies of soil health in agroecosystems. J. Nematology. 33(4):169-172.
Mathew, R.P., Y. Feng, L. Githinji, R. Ankumah, and K.S. Balkcom. 2012. Impact of no-tillage and conventional tillage systems on soil microbial communities. Appl. Environ. Soil Sci. 2012:1-10.
McGrath, M.T. 1997 (updated 2017). Powdery mildew of cucurbits. Cornell Univ., New York Coop. Ext., Fact Sheet 732.30.
Melander, B., N. Munier-Jolain, R. Charles, J. Wirth, J. Schwarz, Rommie van der Weide, et al. 2013. European perspectives on the adoption of nonchemical weed management in reduced-tillage systems for arable crops. Weed Technol. 27(1):231-40.
Mirsky, S.B., M.R. Ryan, W.S. Curran, J.R. Teasdale, J. Maul, J.T. Spargo, et al. 2012. Conservation tillage issues: cover crop-based organic rotational no-till grain production in the mid-Atlantic region, USA. Renewable Agr. Food Systems. 27(1):31-40.
Mirsky, S.B., M.R. Ryan, J.R. Teasdale, W.S. Curran, C.S. Reberg-Horton, J.T. Spargo, et al. 2013. Overcoming weed management challenges in cover crop–based organic rotational no-till soybean production in the eastern United States. Weed Technol. 27(1):193-203.
Morell, F.J., A.P. Whitmore, J. Álvaro-Fuentes, J. Lampurlanés, C. Cantero-Martínez. 2012. Root respiration of barley in a semiarid Mediterranean agroecosystem: field and modelling approaches. Plant Soil. 351(1):135-47.
Morse, R. 2000. High-residue, no-till systems for production of organic broccoli. Dept. Hort. Virginia Tech. In: Proc. Southern Conservation Tillage Conference for Sustainable Agriculture, pp. 48–51. Bollich, P. A., Ed., Rice Res. Sta., Louisiana, Agr. Exp. Sta., LSU, Crowley, LA, Monroe, LA.
Mulumba, L.N. and R. Lal. 2008. Mulching effects on selected soil physical properties. Soil Tillage Res. 98(1):106-11.
Mulvaney, M.J., A.J. Price, and C.W. Wood. 2011. Cover crop residue and organic mulches provide weed control during limited-Input no-till collard production. J. Sustainable Agr. 35(3):312-28.
Murphy, S.D., D.R. Clements, S. Belaoussoff, P.G. Kevan, and C.J. Swanton. 2006. Promotion of weed species diversity and reduction of weed seedbanks with conservation tillage and crop rotation. Weed Sci. 54(1):69-77.

83
Nawaz, A., R. Lal, R.K. Shrestha, and M. Farooq. 2017. Mulching affects soil properties and greenhouse gas emissions under long‐term no‐till and plough‐till systems in Alfisol of central Ohio. Land Degradation Dev. 28(2):673-81.
Ozores-Hampton, M., T.A. Obreza, and P.J. Stoffella. 2001. Mulching with composted MSW for biological control of weeds in vegetable crops. Compost Sci. Utilization. 9(4):352-60.
Ozpinar, S. and A. Cay. 2006. Effect of different tillage systems on the quality and crop productivity of a clay–loam soil in semi-arid north-western Turkey. Soil Tillage Res. 88(1):95-106.
Panneerselvam, P., J.E. Hermansen, and N. Halberg. 2010. Food security of small holding farmers: comparing organic and conventional systems in India. J. Sustainable Agr. 35(1):48-68.
Pelosi, C., M. Bertrand, Y. Capowiez, H. Boizard, and J. Roger-Estrade. 2009. Earthworm collection from agricultural fields: comparisons of selected expellants in presence/absence of hand-sorting. European J. Soil Biol. 45(2):176-83.
Powlson, D.S., C.M. Stirling, M.L. Jat, B.G. Gerard, C.A. Palm, P.A. Sanchez, et al. 2014. Limited potential of no-till agriculture for climate change mitigation. Nature Climate Change. 4(8):678.
Price, A.J. and J.K. Norsworthy. 2013. Cover crops for weed management in southern reduced-tillage vegetable cropping systems. Weed Technol. 27(1):212-7.
Quintanilla-Tornel, M.A., K. Wang, J. Tavares, and C.R.R. Hooks. 2016. Effects of mulching on above and below ground pests and beneficials in a green onion agroecosystem. Agr. Ecosystems Environ. 224:75-85.
Ram, H., Y. Singh, K.S. Saini, D.S. Kler, J. Timsina, and E.J. Humphreys. 2012. Agronomic and economic evaluation of permanent raised beds, no tillage and straw mulching for an irrigated maize-wheat system in northwest India. Expt. Agr. 48(1):21-38.
Reberg-Horton, S.C., J.M. Grossman, T.S. Kornecki, A.D. Meijer, A.J. Price, G.T. Place, et al. 2012. Utilizing cover crop mulches to reduce tillage in organic systems in the southeastern USA. Renewable Agr. Food Systems. 27(1):41-8.
Robinson, J.M., T.A. O'Neill, J. Ryburn, L.L. Liang, V.L. Arcus, and L.A. Schipper. 2017. Rapid laboratory measurement of the temperature dependence of soil respiration and application to changes in three diverse soils through the year. Biogeochemistry. 133(1):101.
Rogers, G.S., S.A. Little, S.J. Silcock, and L.F. Williams. 2004. No-till vegetable production using organic mulches. Acta Hort. (638):215-23.
Rogers, G.S., S.A. Little, and L.F. Williams. 2008. Development of a sustainable integrated permanent bed system for vegetable crop production including sub-surface irrigation extension. Applied Horticultural Research, HRDC Project no. VG98050.

84
Ryan, M.R. 2010. Energy usage, greenhouse gases, and multi-tactical weed management in organic rotational no-till cropping systems. Penn. State Univ., College Station, PhD Diss., 3436188.
Sharma, P., G. Singh, and R.P. Singh. 2011. Conservation tillage, optimal water and organic nutrient supply enhance soil microbial activities during wheat (Triticum Aestivum L.) cultivation. Brazilian J. microbiology. 42(2):531-42.
Shi, X., X. Zhang, X. Yang, C.F. Drury, N.B. McLaughlin, A. Liang, et al. 2012. Contribution of winter soil respiration to annual soil CO2 emission in a Mollisol under different tillage practices in northeast China. Global Biogeochemical Cycles. 26(2).
Silva, E.M. and D. Bruce. 2016. Northern vegetable improvement collaborative winter squash trial results. UW-Madison Organic Res. Ext.
Silva, E.M. and K. Delate. 2017. A decade of progress in organic cover crop-based reduced tillage practices in the upper midwestern USA. Agr. 7(5):44.
Singh, B. and S.S. Malhi. 2006. Response of soil physical properties to tillage and residue management on two soils in a cool temperate environment. Soil Tillage Res. 85(1):143-53.
Standifer, L.C., P.W. Wilson, and R. Porche-Sorbet. 1984. Effects of solarization on soil weed seed populations. Weed Sci. 32(5):569-573.
Stirling, G.R. 2008. The impact of farming systems on soil biology and soilborne diseases: examples from the Australian sugar and vegetable industries — the case for better integration of sugarcane and vegetable production and implications for future research. Australasian Plant Pathol. 37(1):1-18.
Strik, B., D. Bryla, H. Larco, and J. Julian. 2012. Organic highbush blueberry production systems research - management of plant nutrition, irrigation requirements, weeds and economic sustainability. Acta hort. (933):215-220.
Thomazini, A., E.S. Mendonça, J.L. Souza, I.M. Cardoso, and M.L. Garbin. 2015. Impact of organic no-till vegetables systems on soil organic matter in the Atlantic Forest biome. Scientia Hort. 182:145-55.
Tu, X. 2016. Solvita and Other Measures as Indicators of Soil N Availability in Minnesota Soils. Univ. Minnesota, Minneapolis, Masters Thesis, 10253513.
Tullberg, J. 2010. Tillage, traffic and sustainability—A challenge for ISTRO. Soil Tillage Res. 111(1):26-32.
van Schaik, L., J. Palm, J. Klaus, E. Zehe, and B. Schröder. 2016. Potential effects of tillage and field borders on within-field spatial distribution patterns of earthworms. Agri. Ecosystems Environ. 228:82-90.
Vallotton, J.D. 2010. The effect of no-tillage cropping systems on slug populations. Eastern Mennonite University, unpublished.
85
Vermeulen, G.D. and J. Mosquera. 2009. Soil, crop and emission responses to seasonal-controlled traffic in organic vegetable farming on loam soil. Soil Tillage Res. 102(1):126-34.
Vincent-Caboud, L., J. Peigne, M. Casagrande, and E.M. Silva. 2017. Overview of organic cover crop-based no-tillage technique in Europe: farmers’ practices and research challenges. Agr. 7(5):42.
Weaver, S.E. 1984. Critical period of weed competition in three vegetable crops in relation to management practices. Weed Res. 24(5):317-325.
Weber, J.F., C. Kunz, G.G. Peteinatos, S. Zikeli, R. Gerhards. 2017. Weed control using conventional tillage, reduced tillage, no-tillage, and cover crops in organic soybean. Agr. 7(5):43.
Yonemura, S., I. Nouchi, S. Nishimura, G. Sakurai, K. Togami, and K. Yagi. 2014. Soil respiration, N2O, and CH4 emissions from an Andisol under conventional-tillage and no-tillage cultivation for 4 years. Biol. Fertility Soils. 50(1):63-74.
Zhang, P., L. Li, G. Pan, and J. Ren. 2006. Soil quality changes in land degradation as indicated by soil chemical, biochemical and microbiological properties in a karst area of southwest Guizhou, China. Environ. Geology. 51(4):609-19.
Zikeli, S. and S. Gruber. 2017. Reduced tillage and no-till in organic farming systems, Germany-status quo, potentials and challenges. Agr. 7(4):35.

86
APPENDICES
APPENDIX A: EXPERIMENTAL DESIGN
DZT 2”Rototill No-Till Straw Compost
Biotill 8”Rototill Tarped Unmulched
1 4 7 10 13 16
2 5 8 11 14 17 Block 1
3 6 9 12 15 18
Drive row
19 22 25 28 31 34
20 23 26 29 32 35 Block 2
21 24 27 30 33 36
Drive row
37 40 43 46 49 52
38 41 44 47 50 53 Block 3
39 42 45 48 51 54
Drive row
55 58 61 64 67 70
56 59 62 65 68 71 Block 4
57 60 63 66 69 72
Figure A.1: Map of experimental plots at Highmoor Farm in Monmouth, ME. Permanent beds were
established Fall 2014, and received different tillage intensities and mulching regimes.
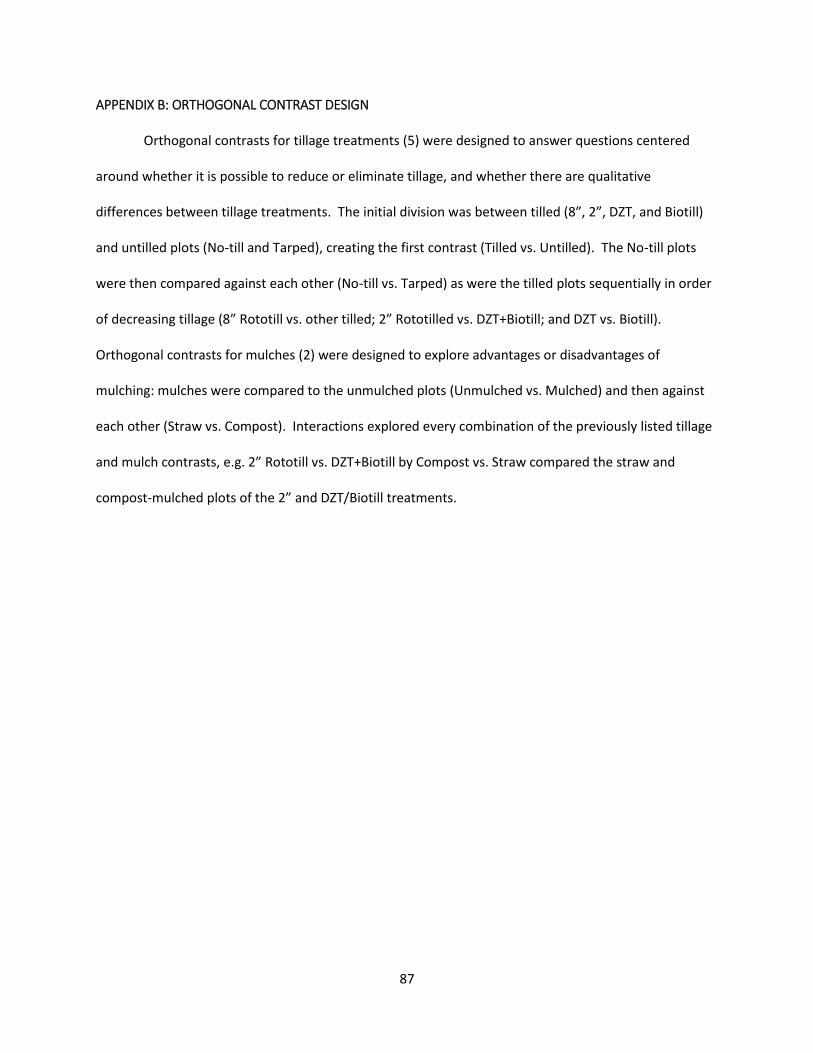
87
APPENDIX B: ORTHOGONAL CONTRAST DESIGN
Orthogonal contrasts for tillage treatments (5) were designed to answer questions centered
around whether it is possible to reduce or eliminate tillage, and whether there are qualitative
differences between tillage treatments. The initial division was between tilled (8”, 2”, DZT, and Biotill)
and untilled plots (No-till and Tarped), creating the first contrast (Tilled vs. Untilled). The No-till plots
were then compared against each other (No-till vs. Tarped) as were the tilled plots sequentially in order
of decreasing tillage (8” Rototill vs. other tilled; 2” Rototilled vs. DZT+Biotill; and DZT vs. Biotill).
Orthogonal contrasts for mulches (2) were designed to explore advantages or disadvantages of
mulching: mulches were compared to the unmulched plots (Unmulched vs. Mulched) and then against
each other (Straw vs. Compost). Interactions explored every combination of the previously listed tillage
and mulch contrasts, e.g. 2” Rototill vs. DZT+Biotill by Compost vs. Straw compared the straw and
compost-mulched plots of the 2” and DZT/Biotill treatments.
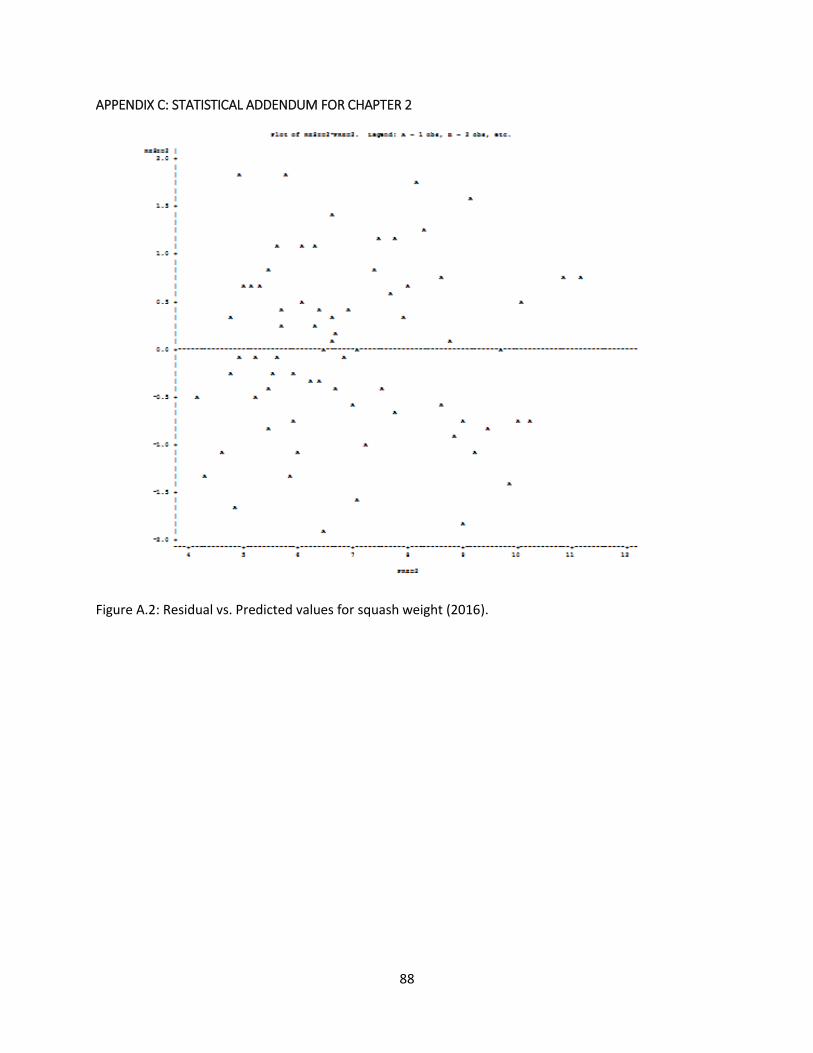
88
APPENDIX C: STATISTICAL ADDENDUM FOR CHAPTER 2
Figure A.2: Residual vs. Predicted values for squash weight (2016).

89
Table A.1: P-values for orthogonal contrasts (2016 and 2017). All interactions were non-significant (p>0.05) unless otherwise noted. Grey shading indicates significance at p<0.05.
APPENDIX D: WEED COUNTS BY BLOCK (2017)
Figure A.3: Comparison of weed counts in Tarped plots by block (2017). Counts made in permanent bed
plots established Fall 2014 at Highmoor Farm in Monmouth, ME, and receiving different mulching
regimes. Values shown are plot sums.
Year
Ti l l vs .
Unti l led
NT vs .
Tarp
8" vs .
Other
Ti l l
2" vs .
DZT/Bio
ti l l
DZT vs .
Bioti l l
Unmulched
vs .
Mulched
Straw vs .
Compost
Interaction
Contrasts
NT vs .
Tarp
Straw vs .
Compost
Ti l l vs .
Unti l led
Straw vs .
Compost
Squash Fruit
Number0.3824 <.0001 0.629 0.2428 0.0741 <.0001 <.0001 >0.05 >0.05 >0.05
Squash Fruit
Weight0.333 <.0001 0.519 0.2554 0.0722 <.0001 <.0001 >0.05 >0.05 >0.05
Cabbage
Head Weight<.0001 <.0001 0.393 0.9221 0.9921 0.0035 0.0002 >0.05 0.0298 >0.05
Cabbage
Insect
Damage<.0001 0.0707 0.815 0.1857 0.4264 0.0461 <.0001 >0.05 >0.05 <.0001
Contrast analys is
0
20
40
60
80
100
120
140
Straw Unmulched Compost
Tota
l Wee
ds
Mulch Treatment
Block 1 Block 2 Block 3 Block 4

90
BIOGRAPHY OF THE AUTHOR
Jeremiah D. Vallotton was born in Baltimore, Maryland in 1987. He was raised and
homeschooled in New Mexico and graduated high school through Kolbe Academy in 2006. He first
attended St. John’s College in Annapolis, MD, but later transferred to Eastern Mennonite University to
pursue an agricultural degree. He graduated Summa cum Laude in 2010 with a B.A. in Environmental
Science and Liberal Arts. He worked for a soils laboratory at James Madison University in Harrisonburg,
VA and then was a consultant and data curator for Innisfree Farm in Crozet, VA before coming to the
University of Maine. He began his graduate degree in 2016 at Highmoor Farm in Monmouth, ME where
he conducted his research for two summers. He is a member of the Soil Science Society of America, as
well as the Pi Alpha Xi and Phi Kappa Phi honors societies.
After receiving his degree, Jeremiah will be a Research Technician at Woods End Laboratories in
Mt. Vernon, ME. He is a candidate for the Master of Science degree in Plant, Soil, and Environmental
Science from the University of Maine in May 2018.