Estimating carbon dioxide emissions for aggregate use
10
Proceedings of the Institution of Civil Engineers Engineering Sustainability 162 September 2009 Issue ES3 Pages 135–144 doi: 10.1680/ensu.2009.162 .3.135 Paper 800013 Received 13/07/2008 Accepted 21/04/2009 Keywords: environment/recycling & reuse of materials/urban regeneration Andrew Thomas Research Fellow, School of Engineering, University of Birmingham, Edgbaston, UK D. Rachel Lombardi Senior Research Fellow, School of Engineering, University of Birmingham, Edgbaston, UK Dexter Hunt Research Fellow, School of Engineering, University of Birmingham, Edgbaston, UK Mark Gaterell Senior Lecturer, School of Engineering, University of Birmingham, Edgbaston, UK Estimating carbon dioxide emissions for aggregate use A. Thomas MICE, MSc, D. R. Lombardi PhD, D. Hunt MICE, PhD and M. Gaterell MCIWEM, CEnv, PhD Tools such as the carbon dioxide estimator tool from the UK Waste and Resources Action Programme (WRAP) and Aggregain have been developed to allow engineers to quantify and optimise carbon dioxide emissions asso- ciated with aggregate use. An extended WRAP tool methodology has been developed and is illustrated through assessing the relative carbon dioxide perfor- mance of different aggregate sourcing options for the large redevelopment project known as Masshouse, in the centre of Birmingham, UK. Previously unconsidered factors such as aggregate quality and highway congestion have been included. It is shown that significant reductions in carbon dioxide emissions can be achieved where site- derived demolition waste is reprocessed for use on site as a recycled aggregate and that relative haulage distances are of particular importance to overall carbon dioxide emissions. As these outcomes depend upon the distances to materials sources and sinks in Birmingham, it is concluded that the carbon dioxide emissions associated with aggregate sourcing are not just a function of material type but also of local conditions. Therefore, the devel- oped methodology provides a useful decision-making framework for assessing aggregate sourcing that accounts for factors such as distribution of materials sources and sinks, aggregate grade, and the effects of road speed and congestion. 1. INTRODUCTION AND BACKGROUND 1.1. Introduction This paper provides an insight into the sustainability-related consequences of decision-making scenarios associated with redevelopment projects involving both demolition and use of high-quality unbound aggregates (a term used to denote an aggregate not mixed with other materials such as cement or bitumen). This is achieved through development of an appraisal methodology and illustration of its use in the analysis of a redevelopment in the heart of Birmingham, UK, known as Masshouse, which is considered to have optimised aggregate sustainability in its construction. For Birmingham, the sustain- ability of Masshouse is important as it reflects the interest being shown in the sustainability of the surrounding Eastside area. 1 The appraisal methodology is based on embodied energy and emissions data (using reduced carbon dioxide emissions as a proxy for improved sustainability) from the carbon dioxide emissions estimator tool 2 produced by the UK Waste and Resources Action Programme (WRAP) 3 and Aggregain 4 and from a data source upon which it relied. 5 This tool, referred to here as the WRAP tool, has provided a significant step forward in the ability of engineers to quantify carbon dioxide emissions associated with aggregate sourcing. For the purposes of this study, the calculation was extended to include estimated emissions as a result of haulage vehicle speeds (which are in turn a function of highway congestion) and variations in emissions associated with the production of different aggregate grades. This provided a means to determine the extent to which these context-specific factors impact on emissions arising from aggregate use. As well as the actual scenario of in situ recycling adopted for the Masshouse project, a number of other scenarios were analysed in order that their relative impact on carbon dioxide emissions could be considered on a like-for-like basis. In this manner, not only was the relative sustainability of aggregate use in the Masshouse project critically examined but the examination was also extended to potentially less sustainable decision-making sce- narios. Furthermore, through detailing specific activities within each scenario – that is, material production and transportation – the resulting emissions summaries provide an insight into how sustainable aggregate sourcing can currently be. The methodol- ogy presented thus allows developers to assess the carbon dioxide emissions associated with their designs, essentially using the design as a functional unit embodying a certain tonnage of aggregates, and to compare it with a range of alternative scenarios in order to develop the lowest emissions option. 1.2. A brief history of Birmingham ring road and Masshouse Circus The Masshouse area was most likely named during the 17th century following the construction of a local Catholic mass- house. 6 During Victorian times the area was well populated with residents and thriving local industries (e.g. tanneries); this was due in no small part to its connectivity with Birmingham’s city centre and the canal and railway infrastructure, including Moor Street and Curzon Street Stations (the latter being Birmingham’s first railway station). In 1864, Curzon Street Station was replaced by a new railway station. New Street Station, as it was named, was situated almost 1 km to the western side of the two main roads that served the Masshouse area, Masshouse Lane and Jennens Road (aptly named after a local landowner). Curzon Street was left empty and the popularity of the area and its industry began to decline in part due to the declining use of Engineering Sustainability 162 Issue ES3 Estimating carbon dioxide emissions for aggregate use Thomas et al. 135
-
Upload
independent -
Category
Documents
-
view
5 -
download
0
Transcript of Estimating carbon dioxide emissions for aggregate use

Proceedings of the Institution of
Civil Engineers
Engineering Sustainability 162September 2009 Issue ES3
Pages 135–144
doi: 10.1680/ensu.2009.162 .3.135
Paper 800013Received 13/07/2008
Accepted 21/04/2009
Keywords:environment/recycling & reuse of
materials/urban regeneration
Andrew ThomasResearch Fellow,
School of Engineering,
University of
Birmingham,
Edgbaston, UK
D. Rachel LombardiSenior Research Fellow,
School of Engineering,
University of
Birmingham,
Edgbaston, UK
Dexter HuntResearch Fellow,
School of Engineering,
University of
Birmingham,
Edgbaston, UK
Mark GaterellSenior Lecturer, School
of Engineering,
University of
Birmingham,
Edgbaston, UK
Estimating carbon dioxide emissions for aggregate use
A. Thomas MICE, MSc, D. R. Lombardi PhD, D. Hunt MICE, PhD and M. Gaterell MCIWEM, CEnv, PhD
Tools such as the carbon dioxide estimator tool from the
UK Waste and Resources Action Programme (WRAP)
and Aggregain have been developed to allow engineers to
quantify and optimise carbon dioxide emissions asso-
ciated with aggregate use. An extended WRAP tool
methodology has been developed and is illustrated
through assessing the relative carbon dioxide perfor-
mance of different aggregate sourcing options for the
large redevelopment project known as Masshouse, in the
centre of Birmingham, UK. Previously unconsidered
factors such as aggregate quality and highway congestion
have been included. It is shown that significant reductions
in carbon dioxide emissions can be achieved where site-
derived demolition waste is reprocessed for use on site as
a recycled aggregate and that relative haulage distances
are of particular importance to overall carbon dioxide
emissions. As these outcomes depend upon the distances
to materials sources and sinks in Birmingham, it is
concluded that the carbon dioxide emissions associated
with aggregate sourcing are not just a function of material
type but also of local conditions. Therefore, the devel-
oped methodology provides a useful decision-making
framework for assessing aggregate sourcing that accounts
for factors such as distribution of materials sources and
sinks, aggregate grade, and the effects of road speed and
congestion.
1. INTRODUCTION AND BACKGROUND
1.1. Introduction
This paper provides an insight into the sustainability-related
consequences of decision-making scenarios associated with
redevelopment projects involving both demolition and use of
high-quality unbound aggregates (a term used to denote an
aggregate not mixed with other materials such as cement or
bitumen). This is achieved through development of an appraisal
methodology and illustration of its use in the analysis of a
redevelopment in the heart of Birmingham, UK, known as
Masshouse, which is considered to have optimised aggregate
sustainability in its construction. For Birmingham, the sustain-
ability of Masshouse is important as it reflects the interest being
shown in the sustainability of the surrounding Eastside area.1
The appraisal methodology is based on embodied energy and
emissions data (using reduced carbon dioxide emissions as a
proxy for improved sustainability) from the carbon dioxide
emissions estimator tool2 produced by the UK Waste and
Resources Action Programme (WRAP)3 and Aggregain4 and
from a data source upon which it relied.5 This tool, referred to
here as the WRAP tool, has provided a significant step forward
in the ability of engineers to quantify carbon dioxide emissions
associated with aggregate sourcing. For the purposes of this
study, the calculation was extended to include estimated
emissions as a result of haulage vehicle speeds (which are in
turn a function of highway congestion) and variations in
emissions associated with the production of different aggregate
grades. This provided a means to determine the extent to which
these context-specific factors impact on emissions arising from
aggregate use.
As well as the actual scenario of in situ recycling adopted for the
Masshouse project, a number of other scenarios were analysed in
order that their relative impact on carbon dioxide emissions could
be considered on a like-for-like basis. In this manner, not only
was the relative sustainability of aggregate use in the Masshouse
project critically examined but the examination was also
extended to potentially less sustainable decision-making sce-
narios. Furthermore, through detailing specific activities within
each scenario – that is, material production and transportation –
the resulting emissions summaries provide an insight into how
sustainable aggregate sourcing can currently be. The methodol-
ogy presented thus allows developers to assess the carbon dioxide
emissions associated with their designs, essentially using the
design as a functional unit embodying a certain tonnage of
aggregates, and to compare it with a range of alternative
scenarios in order to develop the lowest emissions option.
1.2. A brief history of Birmingham ring road and
Masshouse Circus
The Masshouse area was most likely named during the 17th
century following the construction of a local Catholic mass-
house.6 During Victorian times the area was well populated with
residents and thriving local industries (e.g. tanneries); this was
due in no small part to its connectivity with Birmingham’s city
centre and the canal and railway infrastructure, including Moor
Street and Curzon Street Stations (the latter being Birmingham’s
first railway station). In 1864, Curzon Street Station was
replaced by a new railway station. New Street Station, as it was
named, was situated almost 1 km to the western side of the two
main roads that served the Masshouse area, Masshouse Lane and
Jennens Road (aptly named after a local landowner). Curzon
Street was left empty and the popularity of the area and its
industry began to decline in part due to the declining use of
Engineering Sustainability 162 Issue ES3 Estimating carbon dioxide emissions for aggregate use Thomas et al. 135

canal transport of goods (although some canal transport did
remain in use until the late 1950s).
In the first decades of the 20th century, the presence of motor cars
on the inner city roads was increasing; subsequently, pressures for
upgrading began to mount on the public works committee. This
continued in the periods between the world wars as traffic on the
roads became increasingly heavy and congested. By the 1950s,
Birmingham had become well established as a motor city and the
city council realised that a significant upgrading programme was
unavoidable. With two clear objectives in mind – enlarge business
and shopping areas of the city centre and provide a solution to
traffic problems – pockets of land were bought and cleared. In
1967, construction began on an inner ring road, which included
7?7 km of dual carriageway, two flyovers (Masshouse Circus and
Holloway Circus), five bridges, four footbridges, four underpasses,
one twin tunnel, 52 pedestrian subways, 1067 m of elevated
carriageway, two mains tunnels (one almost 17 m deep), 20 public
conveniences, 45 shops and four car parks.7 It was completed in
1971, and five years later the ring road was hailed as a success
story having completed its objectives satisfactorily.8 The sup-
porting structure for the Masshouse Circus flyover included
single- and double-span portal frames below the carriageways and
cantilevered walkways; the 7?6 m height allowed for provision of
car parking and pedestrian underpasses below.
By reducing congestion and improving public transport net-
works in the city centre, it could be argued that construction of
Masshouse Circus provided some sustainability benefits at the
time. Cowles and Piggott8 described Birmingham as a progres-
sive city that was getting on with the job of redevelopment:
construction of the inner ring road sparked off a decade (1965–
1975) of rebuilding work within many parts of the city centre.
However, the length of time required to implement such huge
projects is often accompanied by changes in society; road
systems then become outmoded, which in turn leads to knock-
on effects, as with Masshouse Circus. This section of road
quickly became known as the ‘concrete collar’ because it in fact
restricted expansion of the city centre. This caused the cost of
office space within the inner city centre to rise substantially – to
levels that deterred potential occupiers. In addition, the areas
outside the collar became isolated and impoverished. The
pedestrian underpasses in the form of tunnels often became
occupied by homeless people or were used for illegal or illicit
activities. Importantly, the appearance of the elevated concrete
roadways began to lose favour with local workers and residents.
In 1999, Birmingham City Council launched a new regeneration
project, commonly referred to as Eastside. At this time, the
Masshouse Circus roadway ran along the north-west boundary
of the 170 ha development area and the ‘breaking of this
concrete collar’ was seen as the necessary first step in opening
up a new gateway to Eastside. In the early days of strategic
thinking about the future of Eastside, sustainability was neither
a central, nor ancillary, feature.9 However, the costs for
removing the concrete collar and refashioning the inner ring
road were covered through funding gained from the objective 2
programme of the 2000–2006 European Regional
Redevelopment Fund (ERDF).10 This funding required that
certain sustainability objectives be met (e.g. land remediation,
promotion of energy- and water-efficient design, energy
consumption strategy, carbon-free development, use of waste
materials, waste reduction and recycling schemes.10 For
Masshouse, this required that concrete rubble from demolition
of the flyover be recycled (i.e. crushed and reused) within the
new construction works.
In March 2002, the £24?2 million demolition of Masshouse
Circus began. Large pockets of land were cleared, allowing for a
new ground-level transport system (including bus routes and
pedestrian crossings). During the demolition 20 000 m3 of
concrete were recycled and used within the refashioned inner
ring road that now connects the newly regenerated Bullring
shopping centre with Jennens Road. Opened in August 2003,
this 18-month project was completed on time and within
budget. A view of the area during redevelopment is shown in
Figure 1. Two development sites were created from what once
formed Masshouse Circus and these were subsequently pur-
chased by David McLean Developments in 2003. By 2010, some
35 years after the ring road was hailed a success, Masshouse
Circus will have been replaced with new apartments, offices and
areas of retail. The longevity of this new development can only
be assessed when looking back in future years. It could be
argued that a constant cycle of redevelopment is unavoidable
for a city like Birmingham. However, by recycling materials,
some of the harmful environmental effects of regeneration can
be reduced. How far this reduction can go is the topic of this
paper.
2. METHODOLOGY
2.1. System boundary
Figure 2 depicts the sequence of events leading to the
redevelopment of Masshouse, starting with its original con-
struction in 1967. The system boundary of this analysis is shown
by the dashed box: events prior to and including the demolition
are not included. The analysis focuses on the recycling (labelled
(R) in Figure 2), landfill (L) and primary aggregate (P) materials
streams relevant to the construction process; thus neither the
embodied carbon dioxide associated with the original con-
struction of the Masshouse site nor the emissions associated
with demolition are included in the system boundary. Lack of
consideration of these emissions can be justified on the basis
that the construction and later demolition of the obsolete
structure is not a variable in the current redevelopment – it will
not change from scenario to scenario.
It should also be noted that only the relevant technical systems
Figure 1. The Masshouse area during demolition (looking west)
136 Engineering Sustainability 162 Issue ES3 Estimating carbon dioxide emissions for aggregate use Thomas et al.
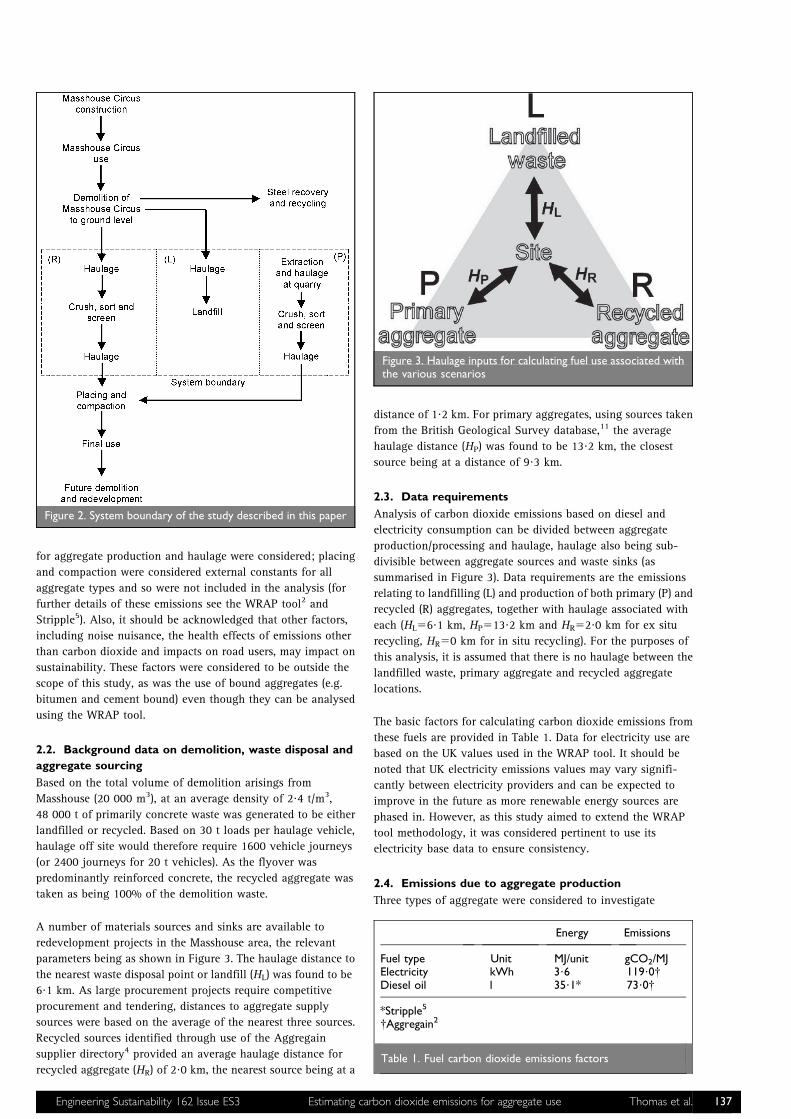
for aggregate production and haulage were considered; placing
and compaction were considered external constants for all
aggregate types and so were not included in the analysis (for
further details of these emissions see the WRAP tool2 and
Stripple5). Also, it should be acknowledged that other factors,
including noise nuisance, the health effects of emissions other
than carbon dioxide and impacts on road users, may impact on
sustainability. These factors were considered to be outside the
scope of this study, as was the use of bound aggregates (e.g.
bitumen and cement bound) even though they can be analysed
using the WRAP tool.
2.2. Background data on demolition, waste disposal and
aggregate sourcing
Based on the total volume of demolition arisings from
Masshouse (20 000 m3), at an average density of 2?4 t/m3,
48 000 t of primarily concrete waste was generated to be either
landfilled or recycled. Based on 30 t loads per haulage vehicle,
haulage off site would therefore require 1600 vehicle journeys
(or 2400 journeys for 20 t vehicles). As the flyover was
predominantly reinforced concrete, the recycled aggregate was
taken as being 100% of the demolition waste.
A number of materials sources and sinks are available to
redevelopment projects in the Masshouse area, the relevant
parameters being as shown in Figure 3. The haulage distance to
the nearest waste disposal point or landfill (HL) was found to be
6?1 km. As large procurement projects require competitive
procurement and tendering, distances to aggregate supply
sources were based on the average of the nearest three sources.
Recycled sources identified through use of the Aggregain
supplier directory4 provided an average haulage distance for
recycled aggregate (HR) of 2?0 km, the nearest source being at a
distance of 1?2 km. For primary aggregates, using sources taken
from the British Geological Survey database,11 the average
haulage distance (HP) was found to be 13?2 km, the closest
source being at a distance of 9?3 km.
2.3. Data requirements
Analysis of carbon dioxide emissions based on diesel and
electricity consumption can be divided between aggregate
production/processing and haulage, haulage also being sub-
divisible between aggregate sources and waste sinks (as
summarised in Figure 3). Data requirements are the emissions
relating to landfilling (L) and production of both primary (P) and
recycled (R) aggregates, together with haulage associated with
each (HL56?1 km, HP513?2 km and HR52?0 km for ex situ
recycling, HR50 km for in situ recycling). For the purposes of
this analysis, it is assumed that there is no haulage between the
landfilled waste, primary aggregate and recycled aggregate
locations.
The basic factors for calculating carbon dioxide emissions from
these fuels are provided in Table 1. Data for electricity use are
based on the UK values used in the WRAP tool. It should be
noted that UK electricity emissions values may vary signifi-
cantly between electricity providers and can be expected to
improve in the future as more renewable energy sources are
phased in. However, as this study aimed to extend the WRAP
tool methodology, it was considered pertinent to use its
electricity base data to ensure consistency.
2.4. Emissions due to aggregate production
Three types of aggregate were considered to investigate
Figure 2. System boundary of the study described in this paper
Figure 3. Haulage inputs for calculating fuel use associated withthe various scenarios
Energy Emissions
Fuel type Unit MJ/unit gCO2/MJElectricity kWh 3?6 119?0{Diesel oil l 35?1* 73?0{
*Stripple5
{Aggregain2
Table 1. Fuel carbon dioxide emissions factors
Engineering Sustainability 162 Issue ES3 Estimating carbon dioxide emissions for aggregate use Thomas et al. 137

differences in carbon dioxide emissions that would result from
decisions involving reduced aggregate grades: low-grade
aggregates for fill purposes; and medium- and high-grade
aggregates (denoted eng 1 and eng 2) suitable for engineering
uses such as sub-bases. Low-grade aggregates require less
crushing and screening than well-graded high-quality aggre-
gates and so it is important to recognise that decisions relating
to grade also have impacts in terms of emissions. However, as
has been noted by others,12 information on the embodied energy
and carbon dioxide emissions associated with different aggre-
gate grades is scarce. Therefore, published data on embodied
energy values for a road aggregate5 were taken as being
representative of the eng 2 grade as primary and recycled
aggregates both involve the same manufacturing processes,
emissions being calculated using the data of Table 1. Values
were then calculated for the fill and eng 1 aggregates based on a
pro rata using data from a study of recycled aggregates that
considered energy requirements for equipment used in the
production of comparable grades.13 Aggregate emissions were
calculated in this way because, as mentioned earlier, very
limited emissions data relating to different grades are available
and the data available13 are not based on a full life-cycle
analysis (being financial data covering only the most significant
items of plant used). Therefore, while it is acknowledged that
further research is required in this area, the method used allowed
the WRAP tool to be extended, in the absence of exact data, to
consider how aggregate grade impacts on emissions. The results
are summarised in Table 2, excluding haulage to the final-use
destination.
In considering carbon dioxide emissions associated with
aggregate production, it should be noted that the crushing of
concrete to produce recycled aggregate can be expected to
increase its surface area and so increase the potential for carbon
dioxide to be reabsorbed in the process of carbonation. The
degree to which this will occur is a complex function of the
remaining carbonation potential after the concrete’s original
service, the size of the aggregate particles produced and the
underground highway environment within which it is buried.14
While carbonation could be considered to offset the carbon
dioxide associated with recycled aggregate production, com-
plications arise in this regard as these savings could be
considered more related to the sustainability of the original
Masshouse construction. Therefore, its sustainability credentials
would be increased due to the potential for the concrete used
eventually to approach carbon neutral. Also, because the exact
type of concrete used in Masshouse, the extent to which it was
carbonated at demolition and the resulting aggregate grading
are unknown, it is difficult to assess the significance of
carbonation. For these reasons, adjustments have not been made
to the emissions calculations in this study.
A further consideration in assessing emissions due to aggregates
is that, particularly for the case of Masshouse, waste concrete
often contains significant amounts of steel in the form of
reinforcement. In order to produce crushed concrete it is
necessary to remove this reinforcement, using magnetic
separation for example. This causes significant difficulties in
analysing emissions, as waste concrete can essentially be
considered to be a raw material for the production of two
recycled materials (steel and aggregate) whereas quarry rock
would only be used to produce aggregates. For the purposes of
this study, magnetic separation (which in the USA is associated
with around 4% of the recycling cost and yields around
US$100/t of scrap metal15) and haulage of steel for recycling
were therefore not considered part of the system boundary (as
shown in Figure 2). However, it should also be noted that the
difficulty inherent in trying to separate these two recycling
processes and the lack of data on which to assess emissions
implications means that there may be hidden emissions benefits
in recycled aggregate production that cannot be incorporated
into the methodology described here without further research.
2.5. Emissions due to haulage vehicles
Carbon dioxide emissions associated with waste and aggregates
haulage were considered solely in terms of those associated with
fuel use. Calculation of fuel use per kilometre was based on the
UK Highways Agency Design Manual for Roads and Bridges.16
Although a number of vehicle types can be modelled using this
method, this study considered OGV2, which comprises all goods
vehicles with four axles or more, including articulated vehicles.
Fuel consumption was calculated from16
1 L~azbvzcv2zdv
3
where L is fuel consumption (l/km), v is average speed (km/h)
and a (1?0244315577), b (–0?0302181229), c (0?0004428547)
and d (–0?0000020059) are vehicle-specific parameters, the
values in parentheses being those appropriate for OGV2.
Due to the significant quantities of waste and aggregates
involved in the Masshouse project, haulage vehicles were
assumed to carry 30 t for the purposes of this study. This is
considered appropriate as haulage fleet operators can be
expected to favour the greater efficiency of larger vehicles
where possible.17 However, for smaller projects, or where gross
vehicle weight restrictions on available highways prevent the
use of larger haulage vehicles, smaller vehicles may be
employed and the calculations in this paper will require
appropriate adjustment.
From Equation 1 and Table 1, speed–emissions relationships for
haulage vehicles can be plotted. Figure 4 shows the greater
Grade Energy: MJ (diesel/electricity) Baseline, a: gCO2/t Factor, b a6b: gCO2/t
Eng 2 16?99*/21?19* 3762 1?00{ 3762Eng 1 – 3762 0?64{ 2408Fill – 3762 0?36{ 1354
*Stripple5
{Based on Gaterell13
Table 2. Derivation of carbon dioxide emissions for recycled and primary aggregate production
138 Engineering Sustainability 162 Issue ES3 Estimating carbon dioxide emissions for aggregate use Thomas et al.

emissions efficiency achievable at an optimum speed of
approximately 50 km/h (31 mph). However, in congested urban
environments, goods vehicles can be limited to lower speeds, or
even stop–start conditions, resulting in much reduced fuel
efficiency. For instance, at 10 km/h (6 mph) the fuel use is
approximately twice that for the optimum driving speed. In this
circumstance, the carbon dioxide emissions associated with
haulage can also be expected to approximately double, solely
due to the effects of congestion. It is clearly evident that road
speed is an important aspect of assessing sustainability where
haulage is required.
2.6. Road speeds and congestion in urban areas
Due to the city centre location of the Masshouse redevelopment,
consideration of variations in traffic speed was achieved
through use of the 2006 UK Transport Statistics Bulletin,18
which tracks road usage for three road types (rural, urban and
motorways) as a function of time of day for every day in the
period 2000–2006 inclusive. This allowed estimation of the
impact of road speed and congestion on fuel use and, therefore,
carbon dioxide emissions. While traffic on motorways and rural
roads is shown to exhibit significant seasonal trends centred
around a summer peak, urban road traffic on average shows less
variation.18 Only minor reductions in average daily traffic flows
around Christmas and mid-summer holiday periods were
identified. Average traffic flows for goods vehicles, for all three
road types, appear to follow the urban road trend, with only
relatively minor variations associated with reduced numbers of
working days during major holidays.
The day of the week was also cited as a significant variable in
traffic flows. Weekday flows (i.e. Monday to Friday) are shown
on average to be largely constant, with a slight peak on Fridays.
Weekend traffic was found to be considerably less than on
weekdays, particularly for goods vehicles. However, the most
significant variation in traffic flows that impact on aggregate
haulage in urban areas is that due to time of day on weekdays.
There are two distinct peaks in traffic flow associated with rush
hour traffic which, for the purposes of this study, were taken as
being 08:00 to 10:00 and 16:00 to 18:00. Short-distance waste
and aggregate haulage was assumed to occur mostly between
08:00 and 18:00. Taking average peak and off-peak speeds from
the bulletin18 can therefore provide average journey speeds for
haulage vehicles, based on 4 hours’ travel in peak conditions
and 6 hours in off-peak conditions. Applying this approach to
various English urban areas for which data were available18
resulted in Figure 5, which shows significant geographical
variation in average speed; the majority of urban areas,
including the West Midlands (which includes Birmingham), are
unable to support average speeds close to the optimum 50 km/h.
In order to include variations in average haulage vehicle road
speeds, three journey speed classes were considered for this
study (Table 3)
(a) the ‘optimum’ speed of 50 km/h
(b) based on 10 h day ‘average’ speeds for the West Midlands
(but excluding data for the 2006 reporting due to
significantly reduced average speeds during that period
associated with major improvement works on the M5 and
M6 motorways)
(c) ‘congested’ class, developed using the same rationale as for
average speeds; the data used were those only for 2006 to
give an indication of speeds that may apply during periods
of greater-than-average congestion.
2.7. Potential scenarios for redevelopment at Masshouse
Recycling of wastes is, of course, not entirely a recent
development. Even before the landfill tax and aggregates levy
(introduced in the UK in 1996 and 2002 respectively), up to two-
thirds of UK construction/demolition wastes were known to be
38.1
80
60
40
20
0
Ten-h
our
speed: km
/h
48.1
39.747.2
35.231.4
34.731.7 29.0
34.8
58.1
34.2 36.1
44.736.8
32.5 30.9
48.1
West
Mid
lands
Leeds/
Bra
dfo
rdTy
nesi
de
Mers
eys
ide
Sheffie
ld
Brist
ol
Nottin
gham
Leic
est
er
Sto
ke/N
ew
cast
le-U
-LTe
esi
de
Hull
Bourn
em
outh
/Poole
Brighto
n/H
ove
Ply
mouth
South
am
pto
nB
lack
pool
Portsm
outh
Gre
ate
r M
anch
est
er
Figure 5. Ten-hour average speeds in various UK urban areas 2000–2006 (based on DfT data18)
Figure 4. The effect of road speed on haulage carbondioxide emissions
Engineering Sustainability 162 Issue ES3 Estimating carbon dioxide emissions for aggregate use Thomas et al. 139
recycled, although only 4% was used for recycled aggregate
production, the remainder being split equally between low-
grade use close to site and for landfill engineering.19 Use of low-
grade waste close to its source may indicate that the cost
advantages of limiting waste haulage were equally as effective
as financial drivers a decade ago as they are at present. The
limited demand for recycled aggregates at that time can be
considered, at least partly, to have originated in the need for
caution in using materials with potentially unknown prove-
nance. In 1995, Sherwood19 explained there was a perceived
need to ‘play safe’ and, referring to primary aggregates, stated
‘… even if such materials do cost more; criticism of needless
expenditure is muted compared with the criticism that occurs if
a costly failure should arise through the use of a material that
subsequently proves to be unsuitable’.
For these reasons, potential scenarios for analysis are mostly
limited to those associated with materials sources and sinks and
attempts to minimise haulage (such as through recycling in situ
where space and materials quantity permits). Therefore, as well
as the actual scenario used in the redevelopment of Masshouse,
four alternative scenarios were considered for comparison.
These scenarios are intended to reflect real decisions that could
have been made during implementation of the project (had the
ERDF guidelines not been in place) and, while other scenarios
could have been considered, those selected were chosen to
reflect a wide range of potential carbon dioxide emissions. The
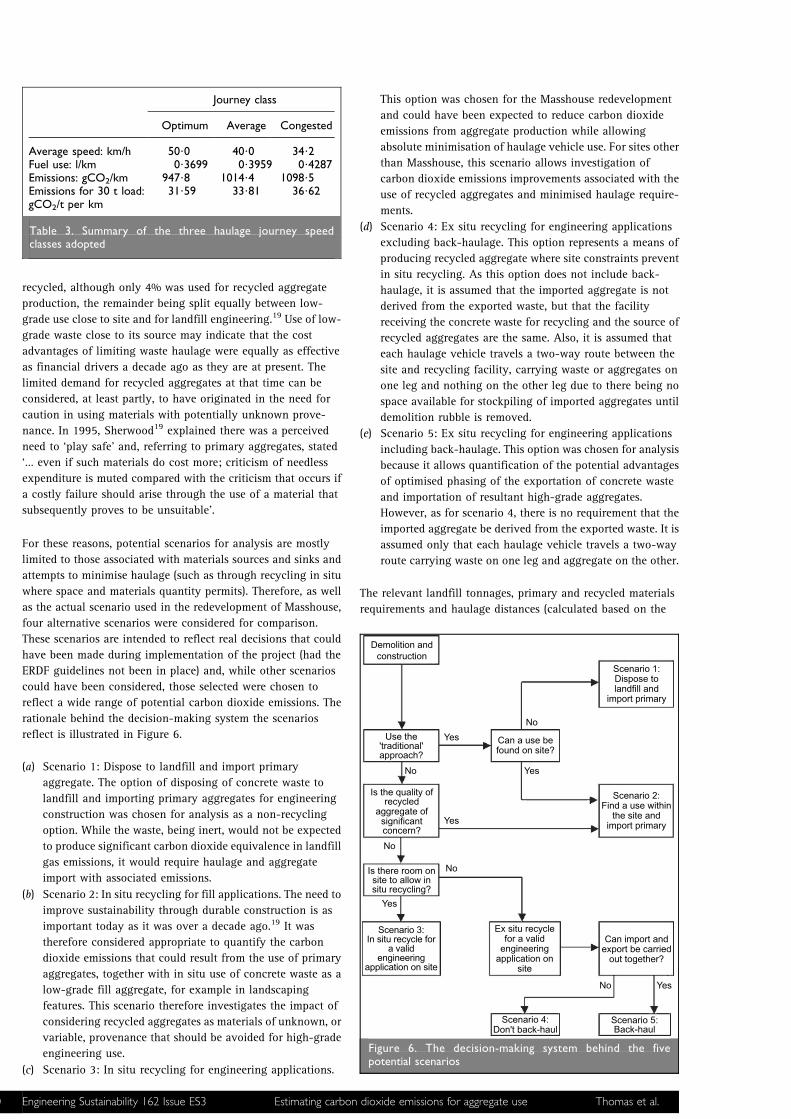
rationale behind the decision-making system the scenarios
reflect is illustrated in Figure 6.
(a) Scenario 1: Dispose to landfill and import primary
aggregate. The option of disposing of concrete waste to
landfill and importing primary aggregates for engineering
construction was chosen for analysis as a non-recycling
option. While the waste, being inert, would not be expected
to produce significant carbon dioxide equivalence in landfill
gas emissions, it would require haulage and aggregate
import with associated emissions.
(b) Scenario 2: In situ recycling for fill applications. The need to
improve sustainability through durable construction is as
important today as it was over a decade ago.19 It was
therefore considered appropriate to quantify the carbon
dioxide emissions that could result from the use of primary
aggregates, together with in situ use of concrete waste as a
low-grade fill aggregate, for example in landscaping
features. This scenario therefore investigates the impact of
considering recycled aggregates as materials of unknown, or
variable, provenance that should be avoided for high-grade
engineering use.
(c) Scenario 3: In situ recycling for engineering applications.
This option was chosen for the Masshouse redevelopment
and could have been expected to reduce carbon dioxide
emissions from aggregate production while allowing
absolute minimisation of haulage vehicle use. For sites other
than Masshouse, this scenario allows investigation of
carbon dioxide emissions improvements associated with the
use of recycled aggregates and minimised haulage require-
ments.
(d) Scenario 4: Ex situ recycling for engineering applications
excluding back-haulage. This option represents a means of
producing recycled aggregate where site constraints prevent
in situ recycling. As this option does not include back-
haulage, it is assumed that the imported aggregate is not
derived from the exported waste, but that the facility
receiving the concrete waste for recycling and the source of
recycled aggregates are the same. Also, it is assumed that
each haulage vehicle travels a two-way route between the
site and recycling facility, carrying waste or aggregates on
one leg and nothing on the other leg due to there being no
space available for stockpiling of imported aggregates until
demolition rubble is removed.
(e) Scenario 5: Ex situ recycling for engineering applications
including back-haulage. This option was chosen for analysis
because it allows quantification of the potential advantages
of optimised phasing of the exportation of concrete waste
and importation of resultant high-grade aggregates.
However, as for scenario 4, there is no requirement that the
imported aggregate be derived from the exported waste. It is
assumed only that each haulage vehicle travels a two-way
route carrying waste on one leg and aggregate on the other.
The relevant landfill tonnages, primary and recycled materials
requirements and haulage distances (calculated based on the
Journey class
Optimum Average Congested
Average speed: km/h 50?0 40?0 34?2Fuel use: l/km 0?3699 0?3959 0?4287Emissions: gCO2/km 947?8 1014?4 1098?5Emissions for 30 t load:gCO2/t per km
31?59 33?81 36?62
Table 3. Summary of the three haulage journey speedclasses adopted
Demolition and
construction
Use the'traditional'approach?
Yes
Yes
No
No
No
Is the quality ofrecycled
aggregate ofsignificantconcern?
Is there room onsite to allow insitu recycling?
Ex situ recyclefor a valid
engineeringapplication on
site
Can import andexport be carried
out together?
Scenario 5:Back-haul
Scenario 4:Don't back-haul
Scenario 3:In situ recycle for
a validengineering
application on site
Scenario 2:Find a use within
the site andimport primary
Scenario 1:Dispose tolandfill and
import primary
Can a use befound on site?
No
Yes
No Yes
Yes
Figure 6. The decision-making system behind the fivepotential scenarios
140 Engineering Sustainability 162 Issue ES3 Estimating carbon dioxide emissions for aggregate use Thomas et al.
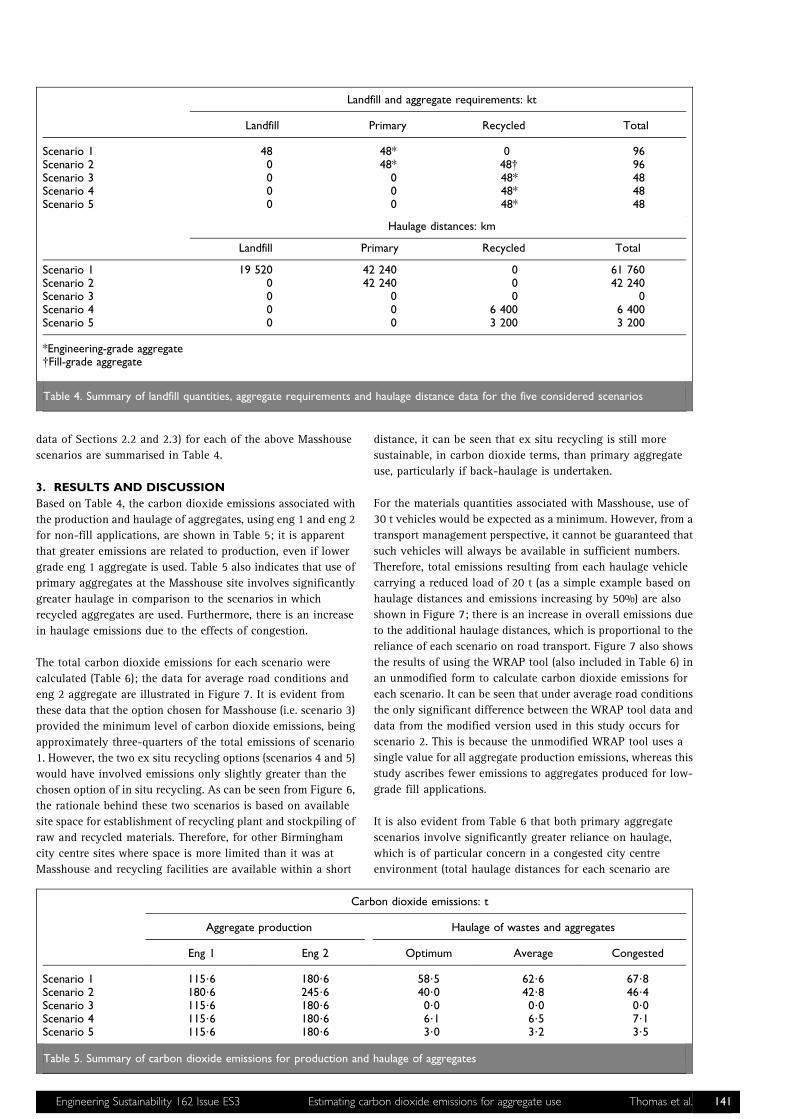
data of Sections 2.2 and 2.3) for each of the above Masshouse
scenarios are summarised in Table 4.
3. RESULTS AND DISCUSSION
Based on Table 4, the carbon dioxide emissions associated with
the production and haulage of aggregates, using eng 1 and eng 2
for non-fill applications, are shown in Table 5; it is apparent
that greater emissions are related to production, even if lower
grade eng 1 aggregate is used. Table 5 also indicates that use of
primary aggregates at the Masshouse site involves significantly
greater haulage in comparison to the scenarios in which
recycled aggregates are used. Furthermore, there is an increase
in haulage emissions due to the effects of congestion.
The total carbon dioxide emissions for each scenario were
calculated (Table 6); the data for average road conditions and
eng 2 aggregate are illustrated in Figure 7. It is evident from
these data that the option chosen for Masshouse (i.e. scenario 3)
provided the minimum level of carbon dioxide emissions, being
approximately three-quarters of the total emissions of scenario
1. However, the two ex situ recycling options (scenarios 4 and 5)
would have involved emissions only slightly greater than the
chosen option of in situ recycling. As can be seen from Figure 6,
the rationale behind these two scenarios is based on available
site space for establishment of recycling plant and stockpiling of
raw and recycled materials. Therefore, for other Birmingham
city centre sites where space is more limited than it was at
Masshouse and recycling facilities are available within a short
distance, it can be seen that ex situ recycling is still more
sustainable, in carbon dioxide terms, than primary aggregate
use, particularly if back-haulage is undertaken.
For the materials quantities associated with Masshouse, use of
30 t vehicles would be expected as a minimum. However, from a
transport management perspective, it cannot be guaranteed that
such vehicles will always be available in sufficient numbers.
Therefore, total emissions resulting from each haulage vehicle
carrying a reduced load of 20 t (as a simple example based on
haulage distances and emissions increasing by 50%) are also
shown in Figure 7; there is an increase in overall emissions due
to the additional haulage distances, which is proportional to the
reliance of each scenario on road transport. Figure 7 also shows
the results of using the WRAP tool (also included in Table 6) in
an unmodified form to calculate carbon dioxide emissions for
each scenario. It can be seen that under average road conditions
the only significant difference between the WRAP tool data and
data from the modified version used in this study occurs for
scenario 2. This is because the unmodified WRAP tool uses a
single value for all aggregate production emissions, whereas this
study ascribes fewer emissions to aggregates produced for low-
grade fill applications.
It is also evident from Table 6 that both primary aggregate
scenarios involve significantly greater reliance on haulage,
which is of particular concern in a congested city centre
environment (total haulage distances for each scenario are
Landfill and aggregate requirements: kt
Landfill Primary Recycled Total
Scenario 1 48 48* 0 96Scenario 2 0 48* 48{ 96Scenario 3 0 0 48* 48Scenario 4 0 0 48* 48Scenario 5 0 0 48* 48
Haulage distances: km
Landfill Primary Recycled Total
Scenario 1 19 520 42 240 0 61 760Scenario 2 0 42 240 0 42 240Scenario 3 0 0 0 0Scenario 4 0 0 6 400 6 400Scenario 5 0 0 3 200 3 200
*Engineering-grade aggregate{Fill-grade aggregate
Table 4. Summary of landfill quantities, aggregate requirements and haulage distance data for the five considered scenarios
Carbon dioxide emissions: t
Aggregate production Haulage of wastes and aggregates
Eng 1 Eng 2 Optimum Average Congested
Scenario 1 115?6 180?6 58?5 62?6 67?8Scenario 2 180?6 245?6 40?0 42?8 46?4Scenario 3 115?6 180?6 0?0 0?0 0?0Scenario 4 115?6 180?6 6?1 6?5 7?1Scenario 5 115?6 180?6 3?0 3?2 3?5
Table 5. Summary of carbon dioxide emissions for production and haulage of aggregates
Engineering Sustainability 162 Issue ES3 Estimating carbon dioxide emissions for aggregate use Thomas et al. 141

illustrated in Figure 8). However, it should be noted that this is
due to the closer proximity of recycling facilities in comparison
to quarries. Therefore, this outcome can be considered
geographically variant – redevelopment sites outside
Birmingham city centre may be closer to quarries and further
from recycling facilities. As a simple example, if the total
haulage distances associated with scenarios 1 and 4 were
swapped, the total carbon dioxide emissions would be,
respectively, 186?7 and 239?1 t, assuming optimum road
conditions and eng 2 aggregate grade. Therefore, under such
circumstances, carbon dioxide emissions for the primary
aggregate scenario would be less than for the recycled aggregate
scenario, which illustrates that haulage requirements can have a
significant impact on the relative sustainability of recycled
aggregates.
The importance of back-haulage as a mitigation of environ-
mental impacts can be illustrated for scenario 1 as, even though
it would still be less sustainable than the other scenarios, back-
haulage on 100% of journeys could allow a reduction in
emissions of approximately 18?5 t if the most efficient haulage
strategy were achieved. For compatibility with Figure 7,
Figure 8 also illustrates the increased haulage distances for each
scenario due to each vehicle carrying a reduced load of 20 t. Of
further note is the large decrease in emissions shown in Tables 5
and 6 associated with use of eng 1 aggregates in place of eng 2;
this is further illustrated in Figure 9. Aggregate quality is an
important decision requiring careful consideration on the part of
decision makers and in itself has the potential to degrade
sustainability if reduced grade adversely affects the lifetime of
the construction. This is largely outside the scope of this paper,
but it can be inferred that specifying a higher grade of aggregate
than is truly required for the desired performance, whether
primary or recycled, can have a significant impact on carbon
dioxide emissions, even if the volume of aggregate used has to
be increased slightly in compensation for differences in the
material grade.
Finally, it is apparent that the effects of congestion on haulage
vehicle speeds impact carbon dioxide emissions. This is
particularly the case for scenarios where haulage distances are
longer, in this case those based on primary aggregates. For
example, the increase in carbon dioxide emissions between
optimum and congested conditions for scenario 1 is greater than
the total haulage emissions for scenarios 4 and 5. Therefore, the
planning of haulage to optimise speeds can be considered an
important aspect of ensuring the sustainability of aggregate
sourcing. This is illustrated in Figure 10, which shows, for
scenarios 1 and 4, emissions for optimum, average and
congested journey classes. The magnitude of variations in
emissions due to road speed can be seen to be of greater
significance for longer total haulage distances.
4. CONCLUSIONS
There is great complexity inherent in assessing carbon dioxide
Total carbon dioxide emissions: t
Optimum Average Congested Wrap tool
Scenario 1 239?1 (174?1) 243?2 (178?2) 248?4 (183?4) 237?4Scenario 2 285?6 (220?6) 288?4 (223?4) 292?0 (227?0) 395?7Scenario 3 180?6 (115?6) 180?6 (115?6) 180?6 (115?6) 177?3Scenario 4 186?7 (121?7) 187?1 (122?1) 187?7 (122?7) 183?5Scenario 5 183?6 (118?6) 183?8 (118?8) 184?1 (119?1) 180?4
Proportion of emissions associated with haulage: %
Optimum Average Congested Wrap tool
Scenario 1 24?5 (33?6) 25?7 (35?1) 27?3 (37?0) 25?3Scenario 2 14?0 (18?1) 14?8 (19?2) 15?9 (20?4) 10?4Scenario 3 0?0 (0?0) 0?0 (0?0) 0?0 (0?0) 0?0Scenario 4 3?3 (5?0) 3?5 (5?3) 3?8 (5?8) 3?4Scenario 5 1?6 (2?5) 1?7 (2?7) 1?9 (2?9) 1?7
Table 6. Summary of carbon dioxide emissions for each scenario for different road conditions, assuming use of eng 2 aggregates(figures for eng 1 use in parentheses)
Scenario 1
0
50
100
150
200
250
300
350
400
450
Tota
l C
O2 e
mis
sio
ns: t
Scenario 2 Scenario 3 Scenario 4 Scenario 5
30 t vehicle 20 t vehicle Wrap tool (32 t vehicle)
Figure 7. Total carbon dioxide emissions under averageroad conditions
Scenario 1
100 000
90 000
80 000
70 000
60 000
50 000
40 000
30 000
20 000
10 000
0
Tota
l haula
ge: km
Scenario 2 Scenario 3 Scenario 4 Scenario 5
20 t vehicle30 t vehicle
Figure 8. Total haulage distances for each scenario
142 Engineering Sustainability 162 Issue ES3 Estimating carbon dioxide emissions for aggregate use Thomas et al.

emissions associated with aggregate use in redevelopment
projects and the WRAP tool provides a very valuable first step in
such estimations. However, it can be concluded that parameters
not hitherto incorporated into the WRAP tool, such as highway
congestion and aggregate grade, are an important part of an
emissions assessment and should not be ignored. The following,
more detailed, conclusions can be drawn from this study.
(a) The sustainable use of aggregates (as measured using the
proxy of reduced carbon dioxide emissions) can be
improved through consideration of geographical location,
aggregate grade, haulage management, vehicle selection,
highway congestion and distances.
(b) The ‘traditional’ option of disposing of waste to landfill and
importing primary aggregate (scenario 1) was shown to
involve carbon dioxide emissions approximately one-third
greater than the chosen Masshouse option (in situ recy-
cling).
(c) Avoidance of landfilling (scenario 2) significantly increased
carbon dioxide production relative to scenario 1 due to the
need for crushing of waste to be used as fill material and the
relative proximity of landfill facilities.
(d) The in situ recycling option chosen for Masshouse (scenario
3) was the lowest emissions option, but cannot be held up as
a model for all redevelopments as not all sites will have
sufficient ground area available to stockpile and process
demolition waste and store the resulting aggregate.
(e) Scenarios 4 and 5 were characterised by only marginally
higher emissions than the chosen Masshouse option,
particularly due to the close proximity of a number of
recycling facilities.
(f) In the Birmingham case considered in this paper, use of
recycled aggregate produced substantially less carbon
dioxide emissions than primary aggregate use. However,
under other circumstances, it may potentially cause greater
carbon dioxide emissions.
(g) Significant differences were noted in carbon dioxide
emissions between eng 1 and eng 2 aggregates due to
different production energy requirements.
(h) The relationship between quality, durability and emissions
associated with aggregate production requires further
research and relevant system boundaries should be further
defined.
ACKNOWLEDGEMENT
The authors gratefully acknowledge financial and other support
from the UK Engineering and Physical Sciences Research
Council (EPSRC) under grant reference EP/E021603/1.
REFERENCES
1. HUNT D. V. L. and ROGERS C. D. F. Barriers to sustainable
infrastructure in urban regeneration. Proceedings of the
Institution of Civil Engineers, Engineering Sustainability,
2005, 158, No. 2, 67–81.
2. AGGREGAIN. CO2 Emissions Estimator Tool, 2007. See www.
aggregain.org.uk/sustainability/try_a_sustainability_tool/
co2_emissions.html for further details. Accessed 04/05/
2008.
3. See www.wrap.org.uk
4. See www.aggregain.org.uk
5. STRIPPLE H. Life Cycle Assessment of Roads: A Pilot Study for
Inventory Analysis. IVL Swedish Environmental Research
Institute, Stockholm, 2001.
6. GVA GRIMLEY. Masshouse Design Statement. GVA Grimley,
Birmingham, 2002.
7. COWLES B. R. and PIGGOTT S. G. Birmingham Inner Ring Road.
Proceedings of the Institution of Civil Engineers, 1974, 56,
Part 1, 513–535.
8. COWLES B. R. and PIGGOTT S. G. Birmingham Inner Ring Road:
discussion. Proceedings of the Institution of Civil Engineers,
1975, 58, Part 1, 453–456.
9. PORTER L. J. and HUNT D. V. L. Birmingham’s Eastside story:
making steps towards sustainability? Local Environment,
2005, 10, No. 5, 525–542.
10. EUROPEAN REGIONAL REDEVELOPMENT FUND
11. CAMERON D. G., BARTLETT E. L., HIGHLEY D. E., LOTT G. K. and
HILL A. J. Directory of Mines and Quarries, 7th edn. British
Geological Survey, Keyworth, Nottingham, 2005.
12. FLOWER D. J. M. and SANJAYAN J. G. Green house gas
emissions due to concrete manufacture. International
Journal of Life Cycle Analysis, 2007, 12, No. 5, 282–288.
13. GATERELL M. Business Data for Recycling: Business Planning
Guidance for Aggregates Recycling Companies. CIRIA,
London, 2005, Report C647.
14. ENGELSEN C. J., SÆTHER D. H., MEHUS J. and PADE C. CO2
Uptake During the Concrete Life Cycle: Carbon Dioxide
Uptake in Demolished and Crushed Concrete. Nordic
Innovation Centre, Oslo, 2005.
15. TAM V. W. Y. Economic comparison of concrete recycling: a
case study approach. Resources, Conservation and Recycling,
2008, 52, No. 5, 821–828.
16. HIGHWAYS AGENCY. Design Manual for Roads and Bridges: Air
Quality. Highways Agency, London, 2007, HA 207/07,
volume ii, section 3, part 1, B/1–31.
Scenario 1
0
50
100
150
200
250
300
Pro
duction C
O2 e
mis
sio
ns: t
Scenario 2 Scenario 3 Scenario 4 Scenario 5
Eng 1 Eng 2
Figure 9. Carbon dioxide emissions from aggregate production
Optimum Average Congested
0
10
20
30
40
50
60
70
80
Haula
ge C
O2 e
mis
sio
ns: t
Scenario 1 Scenario 4
Figure 10. Effect of journey class on haulage emissions
Engineering Sustainability 162 Issue ES3 Estimating carbon dioxide emissions for aggregate use Thomas et al. 143

17. MCKINNON A. C. The economic and environmental benefits of
increasing maximum truck weight: the British
experience. Transportation Research Part D, 2005, 10, No. 1,
77–95.
18. DEPARTMENT FOR TRANSPORT. Road statistics 2006: traffic,
speeds and congestion. DfT, London, 2007, Transport
statistics bulletin SB(07)20.
19. SHERWOOD P. T. Alternative Materials in Road
Construction: A Guide to the Use of Waste, Recycled
Materials and By-products. Thomas Telford, London, 1995.
What do you think?To comment on this paper, please email up to 500 words to the editor at [email protected]
Proceedings journals rely entirely on contributions sent in by civil engineers and related professionals, academics and students. Papersshould be 2000–5000 words long, with adequate illustrations and references. Please visit www.thomastelford.com/journals for authorguidelines and further details.
144 Engineering Sustainability 162 Issue ES3 Estimating carbon dioxide emissions for aggregate use Thomas et al.