Redox chemistry over CeO2-based catalysts: SO2 reduction by CO or CH4
Upload
khangminh22Category
view
0download
0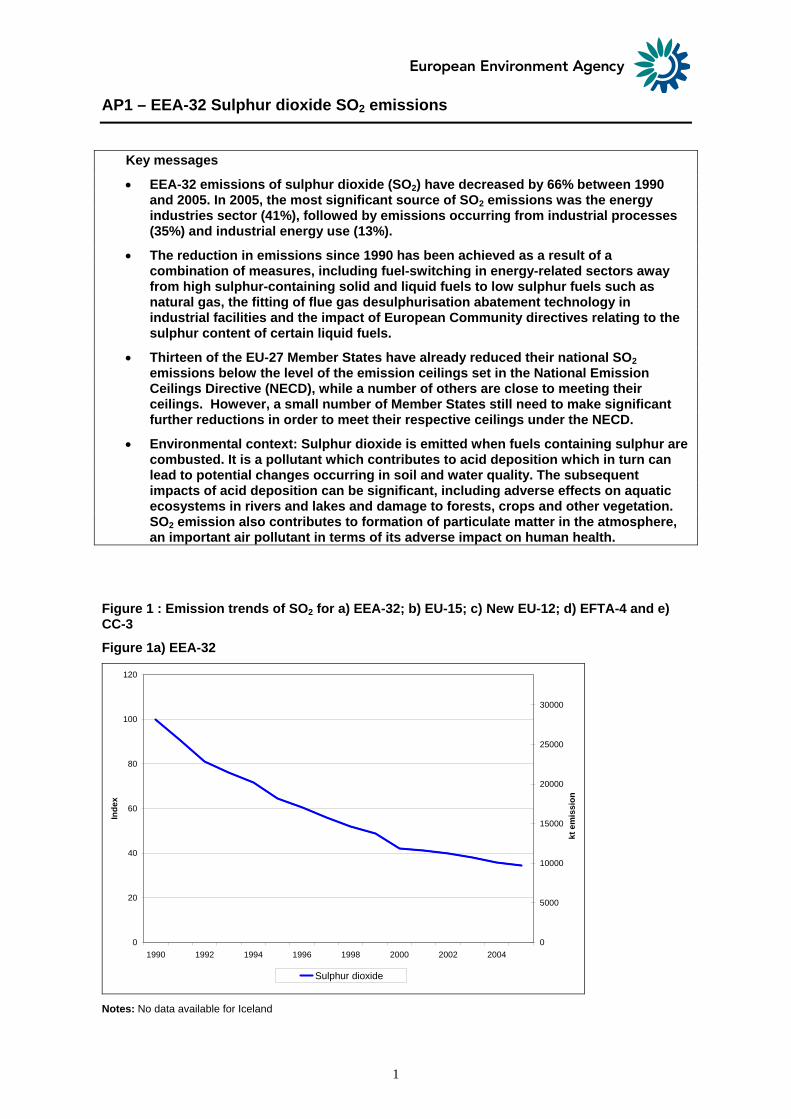
1
AP1 – EEA-32 Sulphur dioxide SO2 emissions
Key messages
• EEA-32 emissions of sulphur dioxide (SO2) have decreased by 66% between 1990 and 2005. In 2005, the most significant source of SO2 emissions was the energy industries sector (41%), followed by emissions occurring from industrial processes (35%) and industrial energy use (13%).
• The reduction in emissions since 1990 has been achieved as a result of a combination of measures, including fuel-switching in energy-related sectors away from high sulphur-containing solid and liquid fuels to low sulphur fuels such as natural gas, the fitting of flue gas desulphurisation abatement technology in industrial facilities and the impact of European Community directives relating to the sulphur content of certain liquid fuels.
• Thirteen of the EU-27 Member States have already reduced their national SO2 emissions below the level of the emission ceilings set in the National Emission Ceilings Directive (NECD), while a number of others are close to meeting their ceilings. However, a small number of Member States still need to make significant further reductions in order to meet their respective ceilings under the NECD.
• Environmental context: Sulphur dioxide is emitted when fuels containing sulphur are combusted. It is a pollutant which contributes to acid deposition which in turn can lead to potential changes occurring in soil and water quality. The subsequent impacts of acid deposition can be significant, including adverse effects on aquatic ecosystems in rivers and lakes and damage to forests, crops and other vegetation. SO2 emission also contributes to formation of particulate matter in the atmosphere, an important air pollutant in terms of its adverse impact on human health.
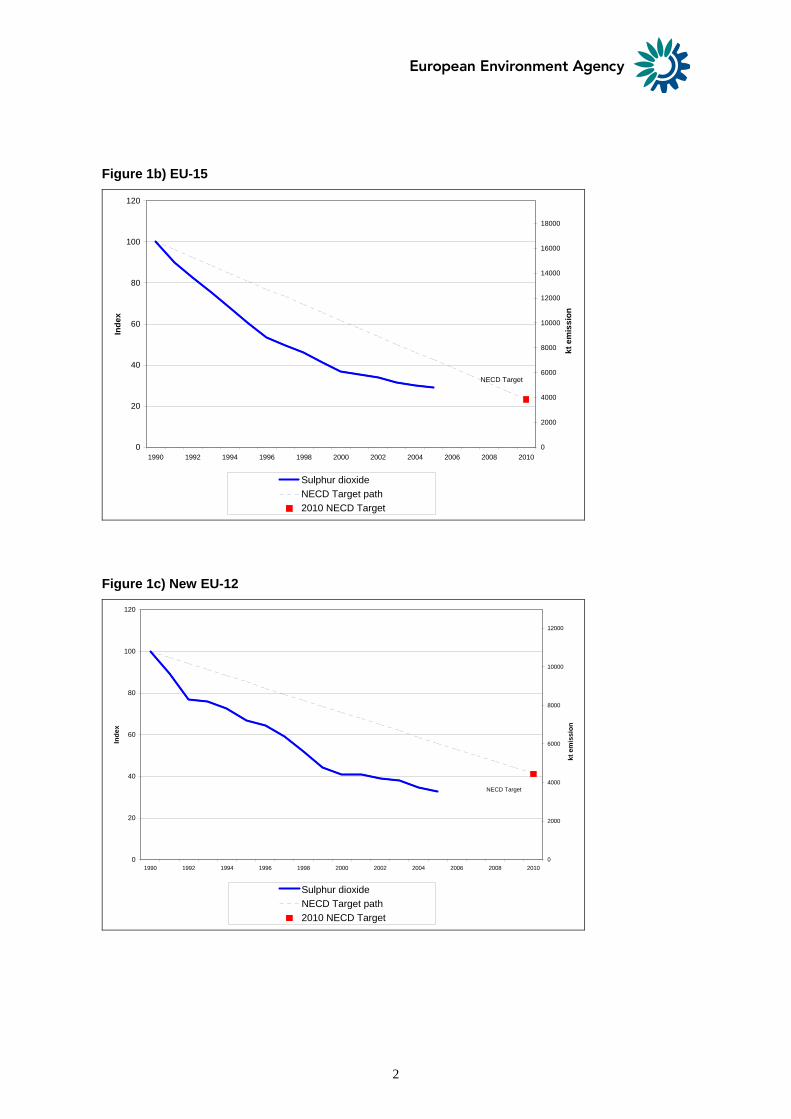
Figure 1 : Emission trends of SO2 for a) EEA-32; b) EU-15; c) New EU-12; d) EFTA-4 and e) CC-3
Figure 1a) EEA-32
0
20
40
60
80
100
120
1990 1992 1994 1996 1998 2000 2002 2004
Inde
x
0
5000
10000
15000
20000
25000
30000
kt e
mis
sion
Sulphur dioxide
Notes: No data available for Iceland
2
Figure 1b) EU-15
0
20
40
60
80
100
120
1990 1992 1994 1996 1998 2000 2002 2004 2006 2008 2010
Inde
x
0
2000
4000
6000
8000
10000
12000
14000
16000
18000
kt e
mis
sion
Sulphur dioxideNECD Target path2010 NECD Target
NECD Target
Figure 1c) New EU-12
0
20
40
60
80
100
120
1990 1992 1994 1996 1998 2000 2002 2004 2006 2008 2010
Inde
x
0
2000
4000
6000
8000
10000
12000
kt e
mis
sion
Sulphur dioxideNECD Target path2010 NECD Target
NECD Target
3
Figure 1d) EFTA-4
0
20
40
60
80
100
120
1990 1992 1994 1996 1998 2000 2002 2004
Inde
x
0
20
40
60
80
100
kt e
mis
sion
Sulphur dioxide
Notes: No data available for Iceland
Figure 1e) CC-3
0
20
40
60
80
100
120
140
160
180
200
220
240
260
1990 1992 1994 1996 1998 2000 2002 2004
Inde
x
0
500
1000
1500
2000
kt e
mis
sion
Sulphur dioxide
Note: The increase in emissions for 1999 is caused by a significant increase in the SO2 national total reported by Turkey for this year.
4
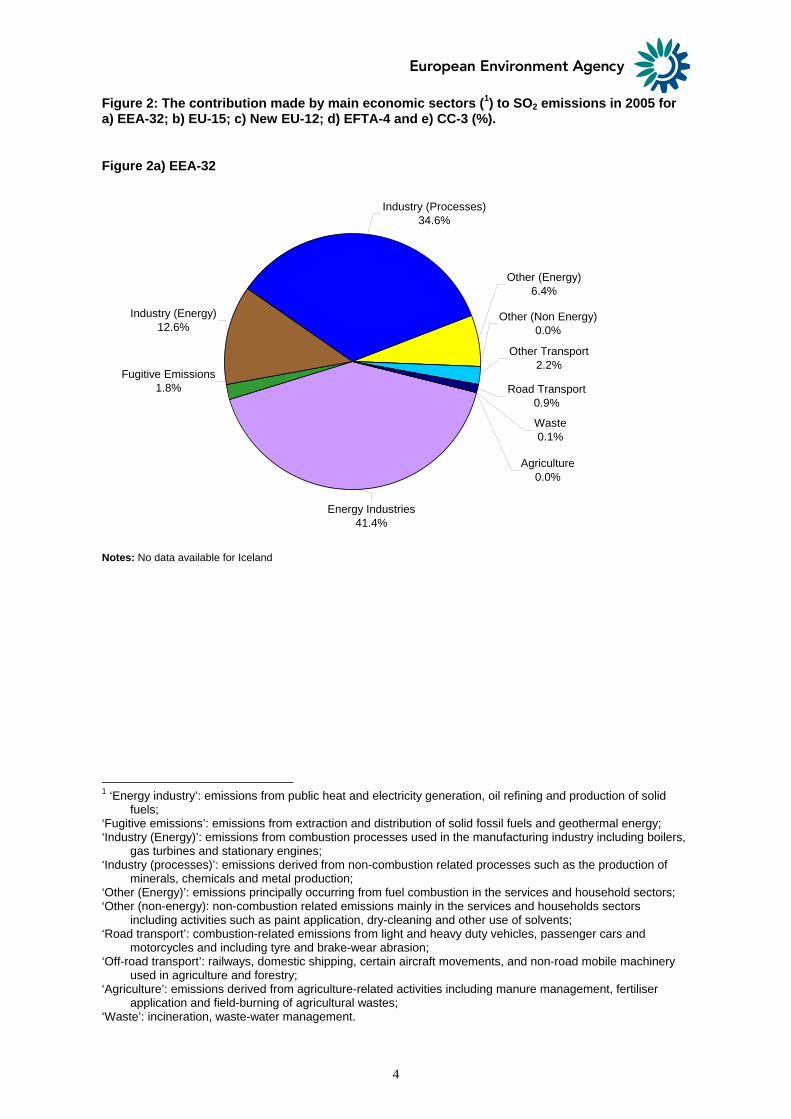
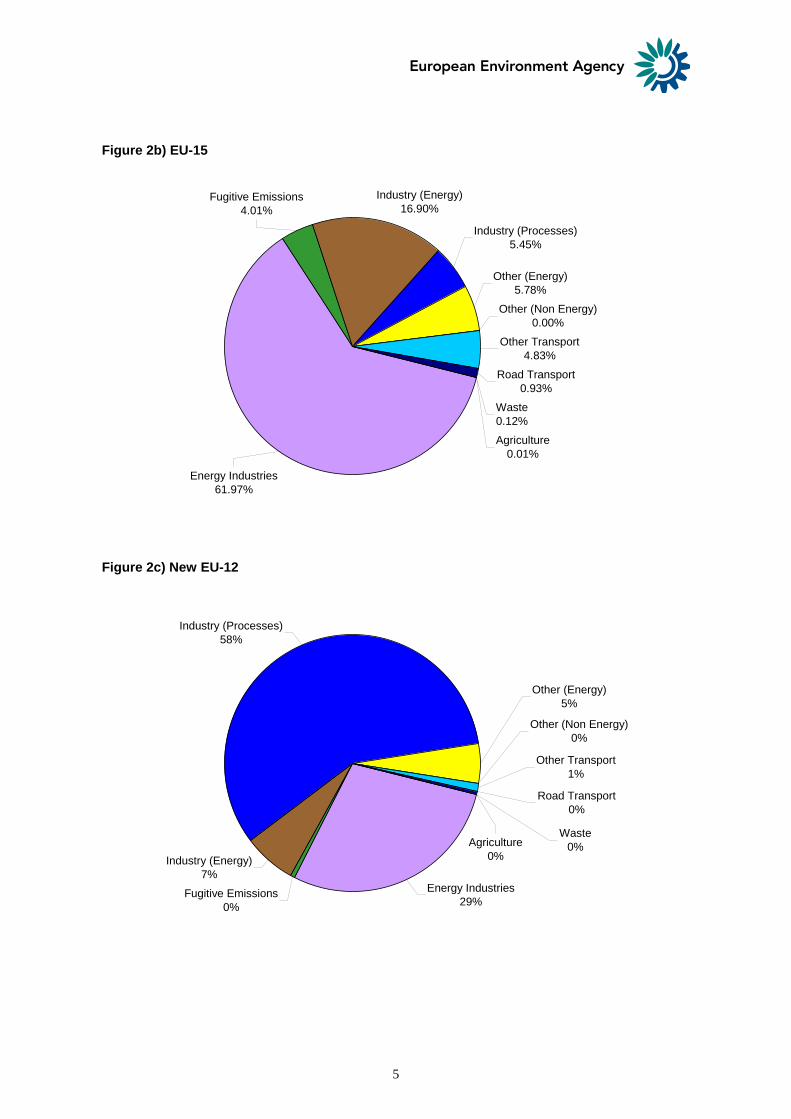
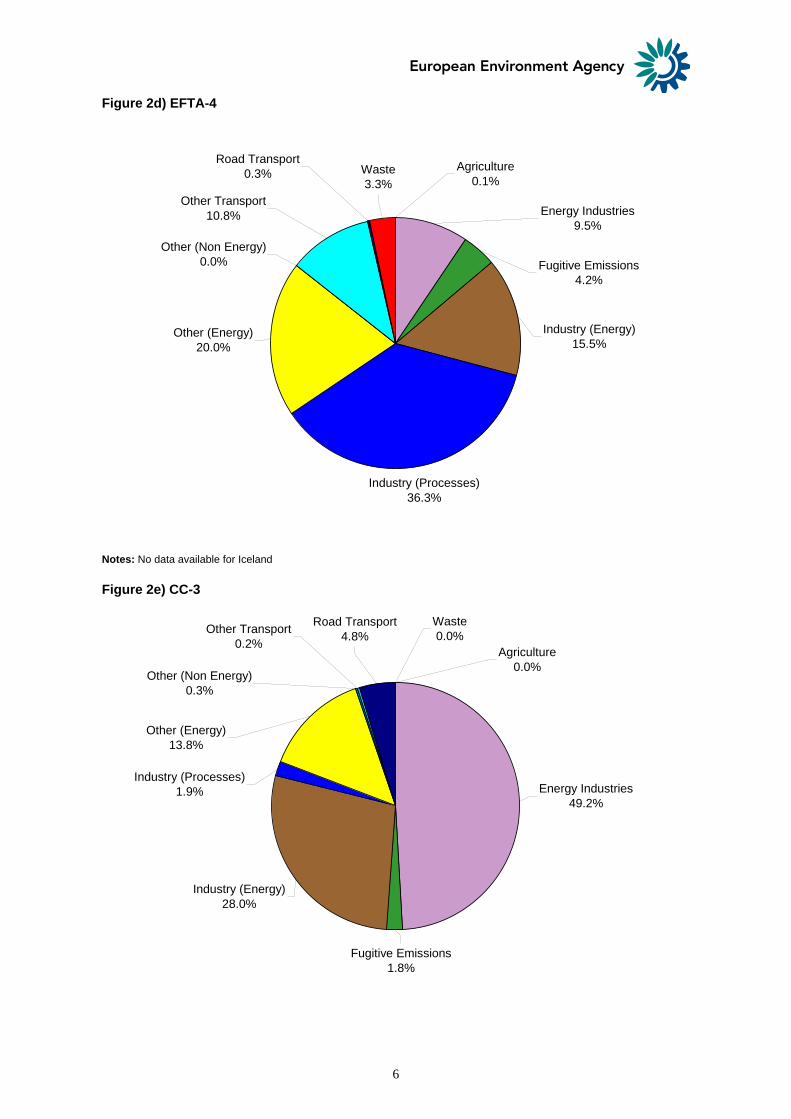
Figure 2: The contribution made by main economic sectors (1) to SO2 emissions in 2005 for a) EEA-32; b) EU-15; c) New EU-12; d) EFTA-4 and e) CC-3 (%).
Figure 2a) EEA-32
Industry (Processes)34.6%
Industry (Energy)12.6%
Fugitive Emissions1.8%
Agriculture0.0%
Other (Non Energy)0.0%
Waste0.1%
Other Transport2.2%
Road Transport0.9%
Energy Industries41.4%
Other (Energy)6.4%
Notes: No data available for Iceland
1 ‘Energy industry’: emissions from public heat and electricity generation, oil refining and production of solid
fuels; ‘Fugitive emissions’: emissions from extraction and distribution of solid fossil fuels and geothermal energy; ‘Industry (Energy)’: emissions from combustion processes used in the manufacturing industry including boilers,
gas turbines and stationary engines; ‘Industry (processes)’: emissions derived from non-combustion related processes such as the production of
minerals, chemicals and metal production; ‘Other (Energy)’: emissions principally occurring from fuel combustion in the services and household sectors; ‘Other (non-energy): non-combustion related emissions mainly in the services and households sectors
including activities such as paint application, dry-cleaning and other use of solvents; ‘Road transport’: combustion-related emissions from light and heavy duty vehicles, passenger cars and
motorcycles and including tyre and brake-wear abrasion; ‘Off-road transport’: railways, domestic shipping, certain aircraft movements, and non-road mobile machinery
used in agriculture and forestry; ‘Agriculture’: emissions derived from agriculture-related activities including manure management, fertiliser
application and field-burning of agricultural wastes; ‘Waste’: incineration, waste-water management.
5
Figure 2b) EU-15
Industry (Processes)5.45%
Other (Non Energy)0.00%
Agriculture0.01%
Industry (Energy)16.90%
Fugitive Emissions4.01%
Waste0.12%
Other Transport4.83%
Road Transport0.93%
Energy Industries61.97%
Other (Energy)5.78%
Figure 2c) New EU-12
Other (Energy)5%
Energy Industries29%
Road Transport0%
Other Transport1%
Waste0%
Fugitive Emissions0%
Industry (Energy)7%
Agriculture0%
Other (Non Energy)0%
Industry (Processes)58%
6
Figure 2d) EFTA-4
Industry (Processes)36.3%
Waste3.3%
Energy Industries9.5%
Fugitive Emissions4.2%
Industry (Energy)15.5%
Agriculture0.1%
Road Transport0.3%
Other Transport10.8%
Other (Non Energy)0.0%
Other (Energy)20.0%
Notes: No data available for Iceland
Figure 2e) CC-3
Energy Industries49.2%
Road Transport4.8%Other Transport
0.2%
Other (Non Energy)0.3%
Agriculture0.0%
Waste0.0%
Other (Energy)13.8%
Industry (Processes)1.9%
Fugitive Emissions1.8%
Industry (Energy)28.0%
7
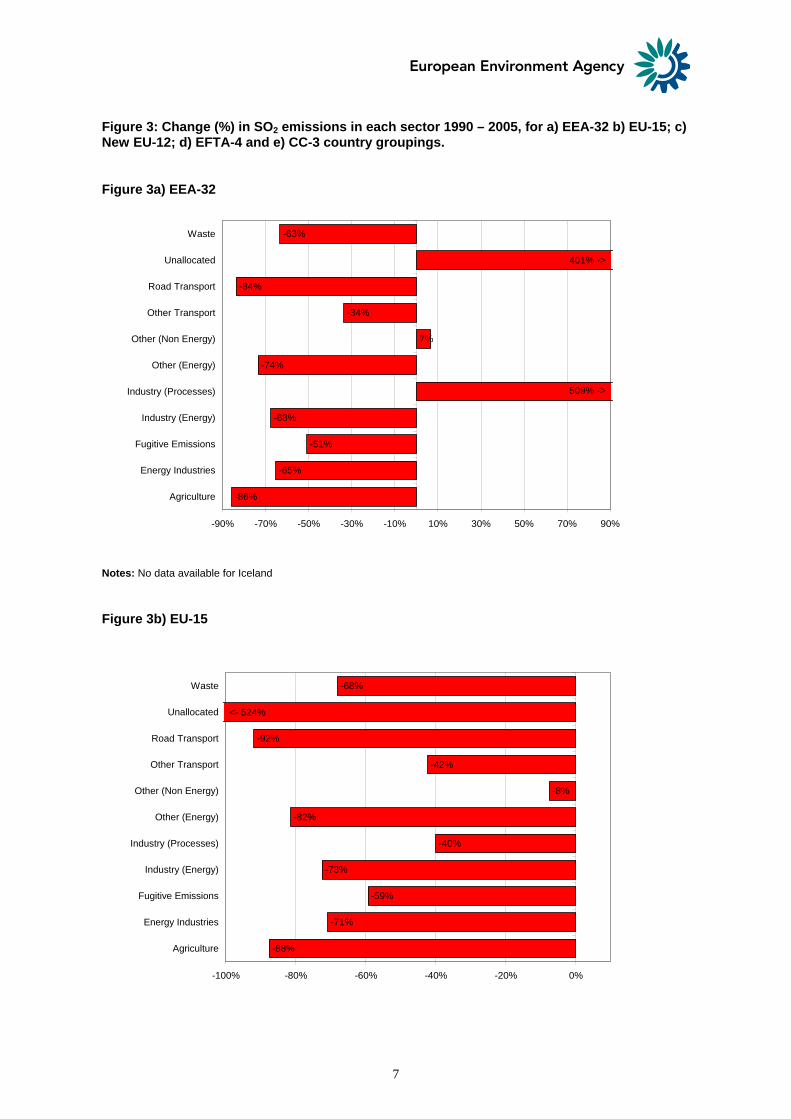
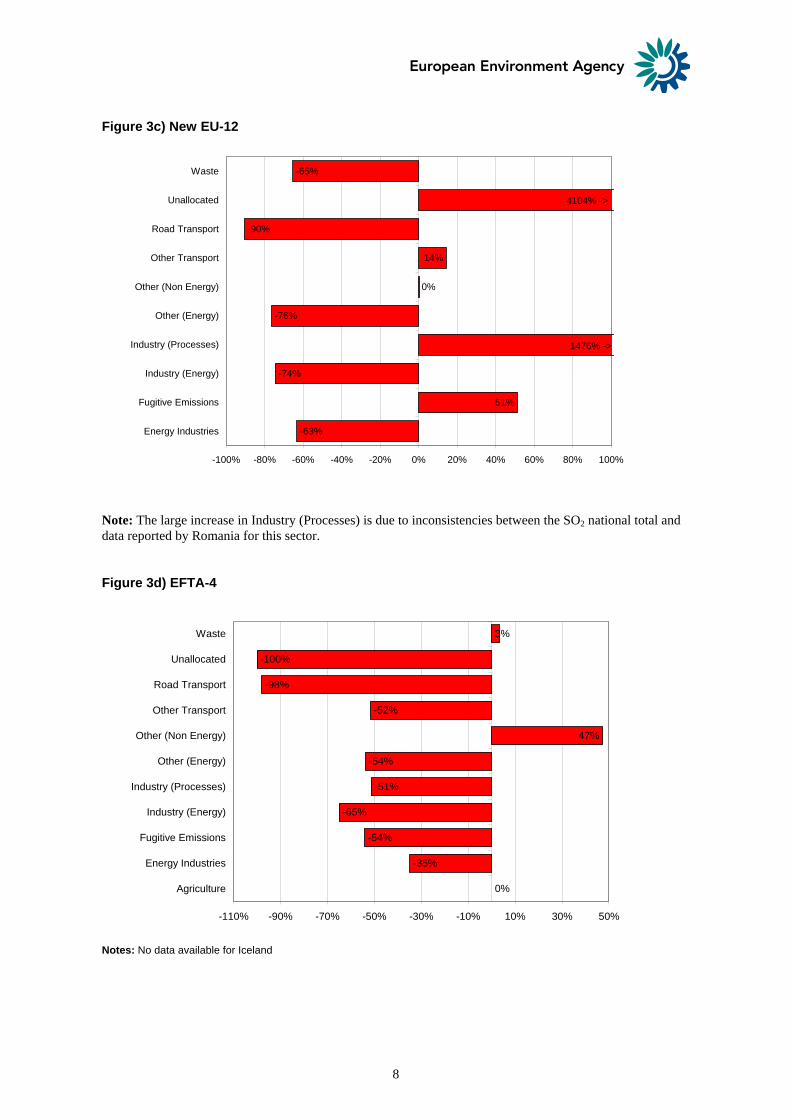
Figure 3: Change (%) in SO2 emissions in each sector 1990 – 2005, for a) EEA-32 b) EU-15; c) New EU-12; d) EFTA-4 and e) CC-3 country groupings.
Figure 3a) EEA-32
-86%
-65%
-51%
-68%
-74%
7%
-63%
-84%
-34%
-90% -70% -50% -30% -10% 10% 30% 50% 70% 90%
Agriculture
Energy Industries
Fugitive Emissions
Industry (Energy)
Industry (Processes)
Other (Energy)
Other (Non Energy)
Other Transport
Road Transport
Unallocated
Waste
401% ->
509% ->
Notes: No data available for Iceland
Figure 3b) EU-15
-88%
-71%
-59%
-73%
-40%
-82%
-8%
-68%
-92%
-42%
-100% -80% -60% -40% -20% 0%
Agriculture
Energy Industries
Fugitive Emissions
Industry (Energy)
Industry (Processes)
Other (Energy)
Other (Non Energy)
Other Transport
Road Transport
Unallocated
Waste
<- 524%
8
Figure 3c) New EU-12
-63%
51%
-74%
-76%
0%
14%
-65%
-90%
-100% -80% -60% -40% -20% 0% 20% 40% 60% 80% 100%
Energy Industries
Fugitive Emissions
Industry (Energy)
Industry (Processes)
Other (Energy)
Other (Non Energy)
Other Transport
Road Transport
Unallocated
Waste
4104% ->
1476% ->
Note: The large increase in Industry (Processes) is due to inconsistencies between the SO2 national total and data reported by Romania for this sector.
Figure 3d) EFTA-4
0%
-35%
-54%
-65%
-51%
-54%
47%
-100%
3%
-98%
-52%
-110% -90% -70% -50% -30% -10% 10% 30% 50%
Agriculture
Energy Industries
Fugitive Emissions
Industry (Energy)
Industry (Processes)
Other (Energy)
Other (Non Energy)
Other Transport
Road Transport
Unallocated
Waste
Notes: No data available for Iceland
9
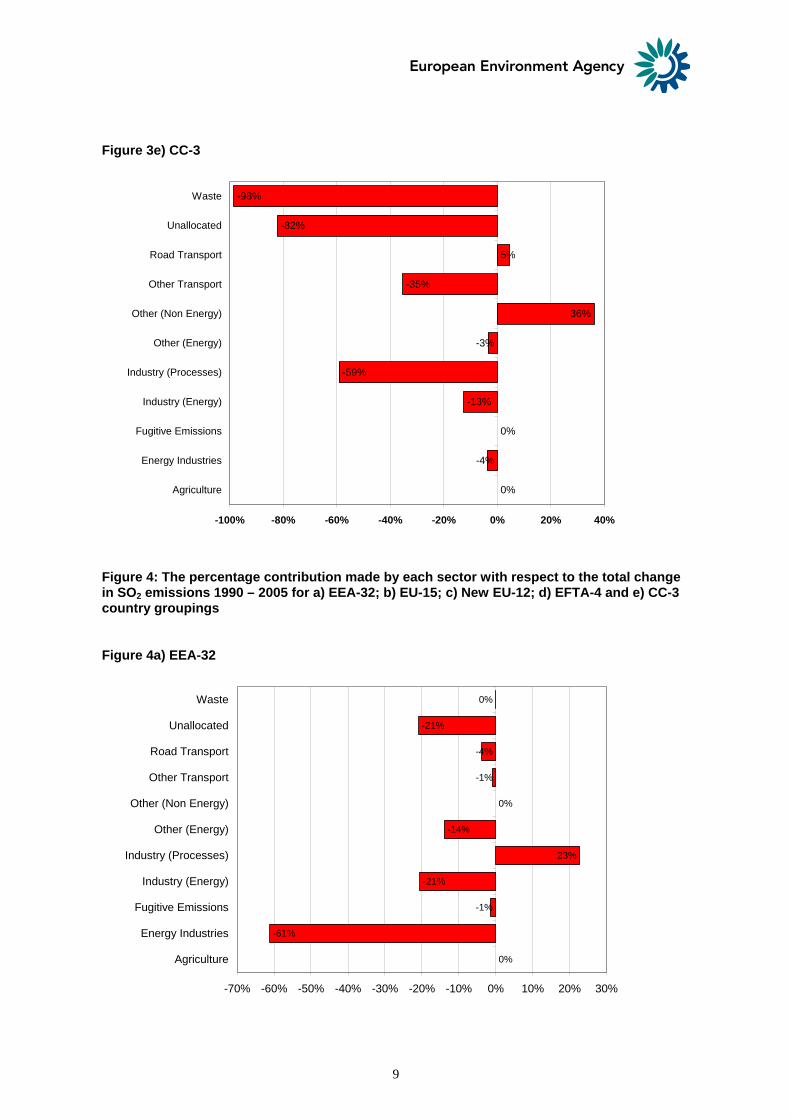
Figure 3e) CC-3
0%
-4%
0%
-13%
-59%
-3%
36%
-82%
-98%
5%
-35%
-100% -80% -60% -40% -20% 0% 20% 40%
Agriculture
Energy Industries
Fugitive Emissions
Industry (Energy)
Industry (Processes)
Other (Energy)
Other (Non Energy)
Other Transport
Road Transport
Unallocated
Waste
Figure 4: The percentage contribution made by each sector with respect to the total change in SO2 emissions 1990 – 2005 for a) EEA-32; b) EU-15; c) New EU-12; d) EFTA-4 and e) CC-3 country groupings
Figure 4a) EEA-32
0%
-61%
-1%
-21%
23%
-14%
0%
-21%
0%
-4%
-1%
-70% -60% -50% -40% -30% -20% -10% 0% 10% 20% 30%
Agriculture
Energy Industries
Fugitive Emissions
Industry (Energy)
Industry (Processes)
Other (Energy)
Other (Non Energy)
Other Transport
Road Transport
Unallocated
Waste
10
Notes: No data available for Iceland
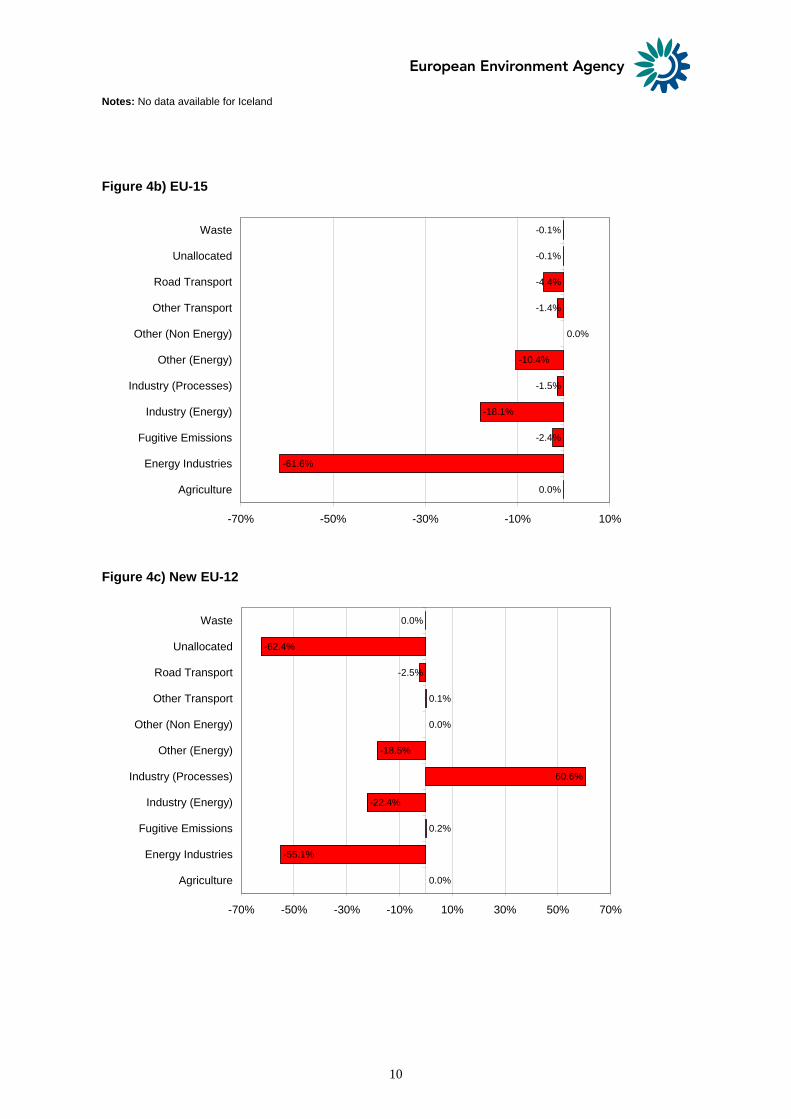
Figure 4b) EU-15
0.0%
-61.6%
-2.4%
-18.1%
-1.5%
-10.4%
0.0%
-0.1%
-0.1%
-4.4%
-1.4%
-70% -50% -30% -10% 10%
Agriculture
Energy Industries
Fugitive Emissions
Industry (Energy)
Industry (Processes)
Other (Energy)
Other (Non Energy)
Other Transport
Road Transport
Unallocated
Waste
Figure 4c) New EU-12
0.0%
-55.1%
0.2%
-22.4%
60.6%
-18.5%
0.0%
-62.4%
0.0%
0.1%
-2.5%
-70% -50% -30% -10% 10% 30% 50% 70%
Agriculture
Energy Industries
Fugitive Emissions
Industry (Energy)
Industry (Processes)
Other (Energy)
Other (Non Energy)
Other Transport
Road Transport
Unallocated
Waste
11
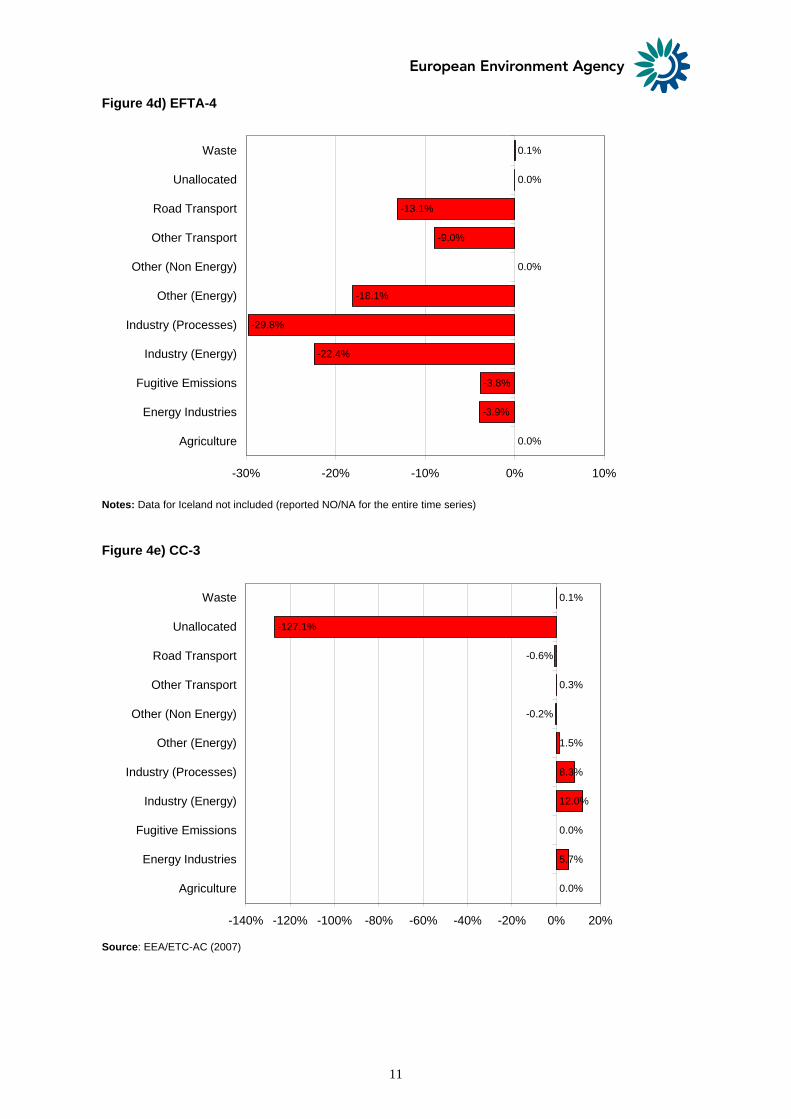
Figure 4d) EFTA-4
0.0%
-3.9%
-3.8%
-22.4%
-29.8%
-18.1%
0.0%
0.0%
0.1%
-13.1%
-9.0%
-30% -20% -10% 0% 10%
Agriculture
Energy Industries
Fugitive Emissions
Industry (Energy)
Industry (Processes)
Other (Energy)
Other (Non Energy)
Other Transport
Road Transport
Unallocated
Waste
Notes: Data for Iceland not included (reported NO/NA for the entire time series)
Figure 4e) CC-3
0.0%
5.7%
0.0%
12.0%
8.3%
1.5%
-0.2%
-127.1%
0.1%
0.3%
-0.6%
-140% -120% -100% -80% -60% -40% -20% 0% 20%
Agriculture
Energy Industries
Fugitive Emissions
Industry (Energy)
Industry (Processes)
Other (Energy)
Other (Non Energy)
Other Transport
Road Transport
Unallocated
Waste
Source: EEA/ETC-AC (2007)
12
Environmental Context
Sulphur dioxide (SO2) is emitted when fuels containing sulphur are combusted. Sulphur dioxide is a pollutant which contributes to acid deposition which in turn can lead to potential changes occurring in soil and water quality. The subsequent impacts of acid deposition can be significant, including adverse effects on aquatic ecosystems in rivers and lakes and damage to forests, crops and other vegetation. In many cases, the deposition of acidifying substances still exceeds the critical loads of the ecosystems (see EEA indicator CSI 005 ‘Exposure of ecosystems to acidification, eutrophication and ozone’). Acidification can also damage buildings and cultural monuments. Further details concerning emissions of acidifying pollutants are provided in EEA’s Core Set Indicator CSI 001 ‘Emissions of acidifying substances’.
As a secondary particulate precursor, SO2 also contributes to the formation of particulate aerosols in the atmosphere. Particulate matter is an important air pollutant due to their adverse impacts on human health, and SO2 is therefore also indirectly linked to effects on human health (see EEA’s Core Set Indicator CSI 003 ‘Emissions of primary particles and secondary particulate precursors ’ for further details concerning emissions of particulate matter.
Policy objectives and measures
A number of policies have been implemented within Europe that either directly or indirectly act to reduce emissions of SO2. These include:
• The National Emission Ceilings Directive 2001/81/EC (NECD) which entered into force in the European Community in 2001. The NECD sets emission ceilings for four important air pollutants (SO2, nitrogen oxides (NOx), ammonia (NH3) and non-methane volatile organic compounds (NMVOCs)) to be achieved from 2010 onwards for each Member State. The ceilings are designed to improve the protection in the Community of the environment and human health against risks of adverse effects arising from acidification, eutrophication and ground level ozone. The NECD is presently under review, the European Commission anticipates adopting a proposal for a revised Directive mid-2008.
• The Gothenburg Protocol (1999) to the United Nations Economic Commission for Europe’s (UNECE) Convention on Long-Range Transboundary Air Pollution (LRTAP Convention) to abate acidification, eutrophication and ground-level ozone. A key objective of the protocol is to regulate emissions on a regional basis within Europe and to protect eco-systems from transboundary pollution by setting emission reduction ceilings to be reached by 2010 for the same 4 pollutants as addressed in the NECD (i.e. SO2, NOx, NH3 and NMVOCs). Overall for the EU Member States, the ceilings set within the Gothenburg protocol are generally either slightly less strict or the same as the emission ceilings specified in the NECD.
• The Directive for the Sulphur content of Certain Fuels (93/12/EC). This requires Member States to cease the use of heavy fuel oil with a sulphur content greater than 1% by mass from 2001, and the use of gas oil with a sulphur content greater than 0.2% from 2001 and greater than 0.1% from 2008;
• The Large Combustion Plant Directive 2001/80/EC (LCPD) is important in reducing emissions of SO2, NOx and dust from combustion plants having a thermal input capacity equal to or greater than 50 MW. Installations within the scope of this Directive include power stations, petroleum refineries, steelworks and other industrial processes running on solid, liquid and gaseous fuels. “New” plant must meet the emission limit values (ELVs) given in the LCPD. However Member States can choose to meet obligations for existing plant (i.e. those in operation per-1987) by either complying with the ELVs or they can operate within a national emission reduction plan (NERP) that sets a ceiling for each pollutant. The interaction of the LCPD and the IPPC Directive (see below) is currently being examined as part of a review of the IPPC Directive.
• The Directive on Integrated Pollution Prevention and Control (96/61/EC) entered into force in
1999. It aims to prevent or minimise pollution to air, water or land from various industrial sources throughout the European Union. Those installations covered by Annex I of the IPPC Directive are required to obtain authorisation from the authorities to operate. New installations and existing installations, which are subject to ‘substantial changes’ have been required to meet
13
the requirements of the IPPC Directive since 30th October 1999. Other existing installations must have been brought into compliance by the 30th October 2007. The emission limit values outlined in the permit conditions must be based on best available techniques (BAT). The Commission has been undertaking a review of the IPPC Directive and related legislation on industrial emissions and on the 21st December 2007 adopted a proposal for a Directive on industrial emissions. The proposal recasts seven existing Directives relating to industrial emissions (including IPPC and the LCPD) into a single legislative instrument.
• The aim of the Directive 96/62/EC on ambient air quality assessment and management (the ‘Air Quality Framework Directive’) is to maintain and improve air quality within the European Community by establishing objectives for ambient air, drawing up common methods and criteria for assessing air quality and obtaining and disseminating information. The “Daughter” Directive 99/30/EC of the Air Quality Framework Directive entered into force in 1999 and sets limit values for concentrations of several pollutants including sulphur dioxide.
• The European Sulphur Content of Marine Fuels Directive (SCMFD) (2005/33/EC) requires “Member States to ensure that marine gas oils are not placed on the market in their territory if the sulphur content exceeds 0.1% by mass” amongst other requirements.
• The Marpol Convention covers the prevention of pollution of the marine environment by ships from operational or accidental causes. It is a combination of two treaties adopted in 1973 and 1978 and updated by amendments over the years since. Annex VI covers the prevention of air pollution from ships and it sets limits on sulphur dioxide emissions from ship exhausts. This came into force in May 2005.
• Current market grade petrol and diesel fuels do not have a sulphur level exceeding 50 ppm. This is the maximum level of sulphur permitted for road fuels in EU Member States from 2005 under the fuel quality Directive 98/70/EC. The introduction of “sulphur-free fuels”, with sulphur levels <10 ppm, is required by 1st January 2009 under Directive 2003/17/EC.
Assessment
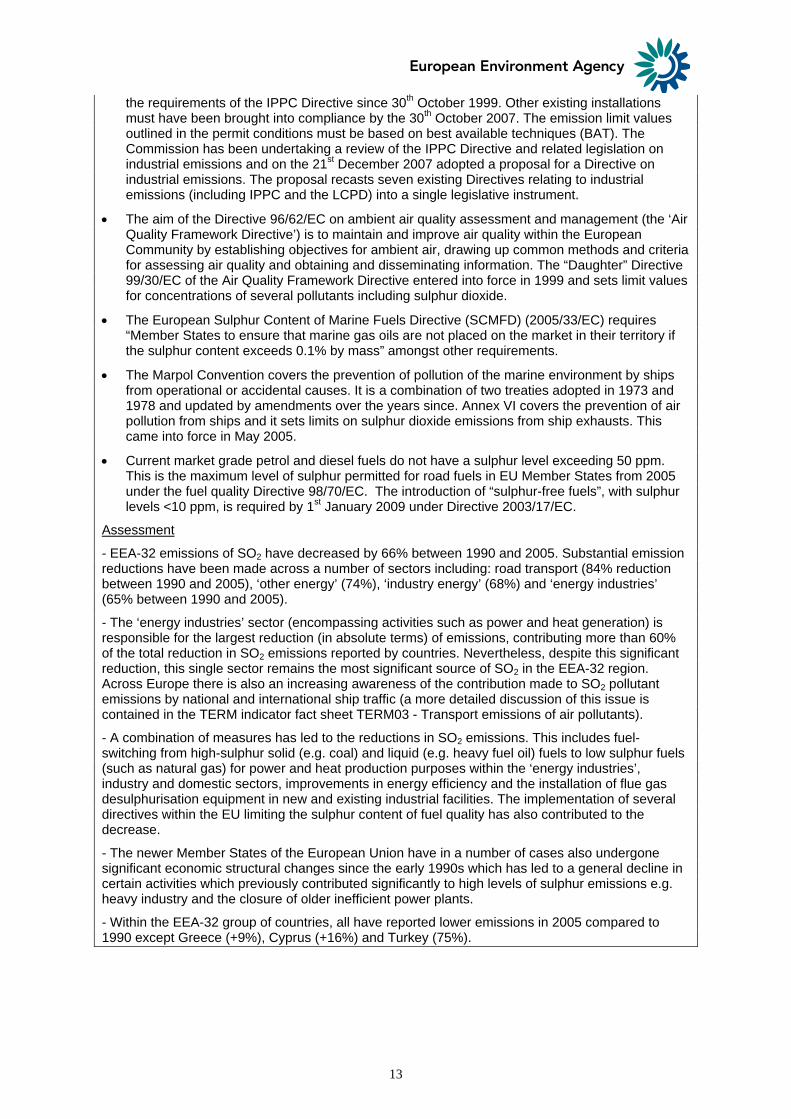
- EEA-32 emissions of SO2 have decreased by 66% between 1990 and 2005. Substantial emission reductions have been made across a number of sectors including: road transport (84% reduction between 1990 and 2005), ‘other energy’ (74%), ‘industry energy’ (68%) and ‘energy industries’ (65% between 1990 and 2005).
- The ‘energy industries’ sector (encompassing activities such as power and heat generation) is responsible for the largest reduction (in absolute terms) of emissions, contributing more than 60% of the total reduction in SO2 emissions reported by countries. Nevertheless, despite this significant reduction, this single sector remains the most significant source of SO2 in the EEA-32 region. Across Europe there is also an increasing awareness of the contribution made to SO2 pollutant emissions by national and international ship traffic (a more detailed discussion of this issue is contained in the TERM indicator fact sheet TERM03 - Transport emissions of air pollutants).
- A combination of measures has led to the reductions in SO2 emissions. This includes fuel-switching from high-sulphur solid (e.g. coal) and liquid (e.g. heavy fuel oil) fuels to low sulphur fuels (such as natural gas) for power and heat production purposes within the ‘energy industries’, industry and domestic sectors, improvements in energy efficiency and the installation of flue gas desulphurisation equipment in new and existing industrial facilities. The implementation of several directives within the EU limiting the sulphur content of fuel quality has also contributed to the decrease.
- The newer Member States of the European Union have in a number of cases also undergone significant economic structural changes since the early 1990s which has led to a general decline in certain activities which previously contributed significantly to high levels of sulphur emissions e.g. heavy industry and the closure of older inefficient power plants.
- Within the EEA-32 group of countries, all have reported lower emissions in 2005 compared to 1990 except Greece (+9%), Cyprus (+16%) and Turkey (75%).
14
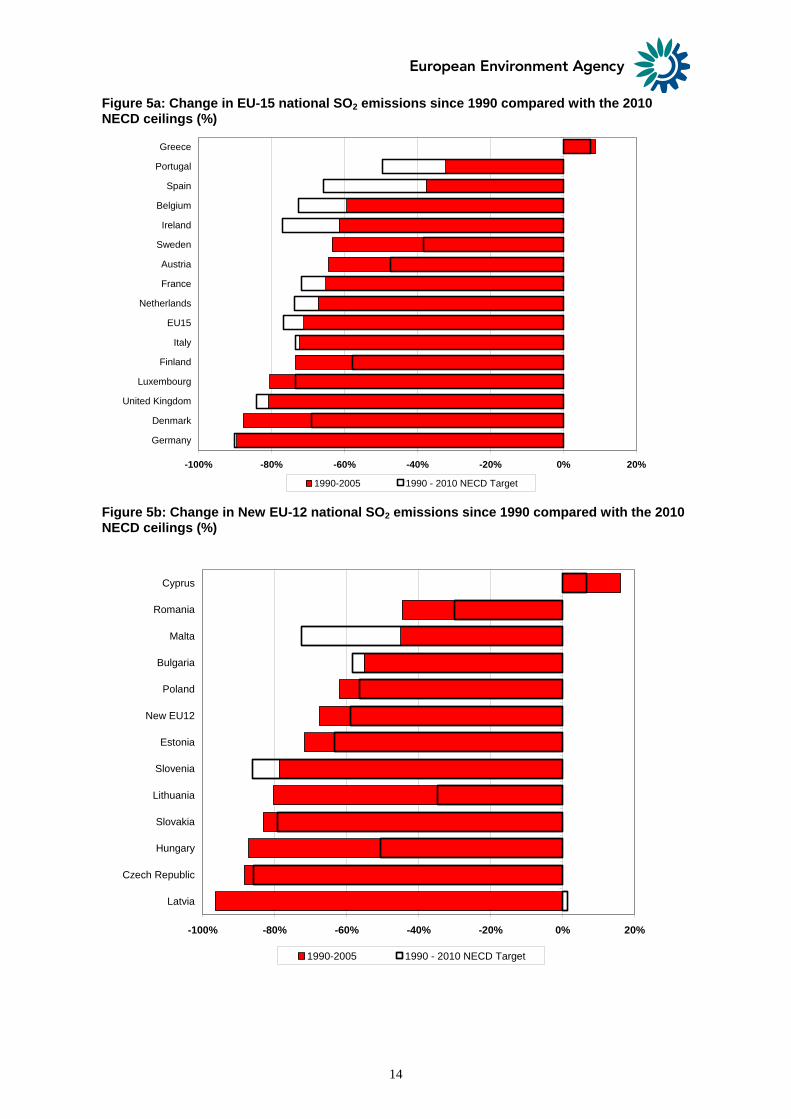
Figure 5a: Change in EU-15 national SO2 emissions since 1990 compared with the 2010 NECD ceilings (%)
-100% -80% -60% -40% -20% 0% 20%
Germany
Denmark
United Kingdom
Luxembourg
Finland
Italy
EU15
Netherlands
France
Austria
Sweden
Ireland
Belgium
Spain
Portugal
Greece
1990-2005 1990 - 2010 NECD Target
Figure 5b: Change in New EU-12 national SO2 emissions since 1990 compared with the 2010 NECD ceilings (%)
-100% -80% -60% -40% -20% 0% 20%
Latvia
Czech Republic
Hungary
Slovakia
Lithuania
Slovenia
Estonia
New EU12
Poland
Bulgaria
Malta
Romania
Cyprus
1990-2005 1990 - 2010 NECD Target

15
Figure 5c: Change in national SO2 emissions since 1990 compared with the 2010 Gothenburg ceilings CC-3 and EFTA-4 (%)
-70% -50% -30% -10% 10% 30% 50% 70%
Croatia
Switzerland
Liechtenstein
Norway
CC3
Turkey
FYR of Macedonia
1990-2005 1990 - 2010: CLRTAP Gothenburg Protocol
492% ->
Notes: Data for Iceland not available. Turkey and FYR of Macedonia have not signed the Gothenburg Protocol and hence do not have ceilings assigned.
Figure 6a: Distance-to-target indicators (in index points) for the 2010 ceilings of the NECD, EU-15
12
5
3
-4
-5
-11
-12
-14
-17
-18
-22
-25
-36
-29
-30
-35
-40 -30 -20 -10 0 10 20
Spain
Portugal
Greece
Ireland
Belgium
France
Netherlands
EU15
Italy
United Kingdom
Germany
Luxembourg
Austria
Finland
Sweden
Denmark
16
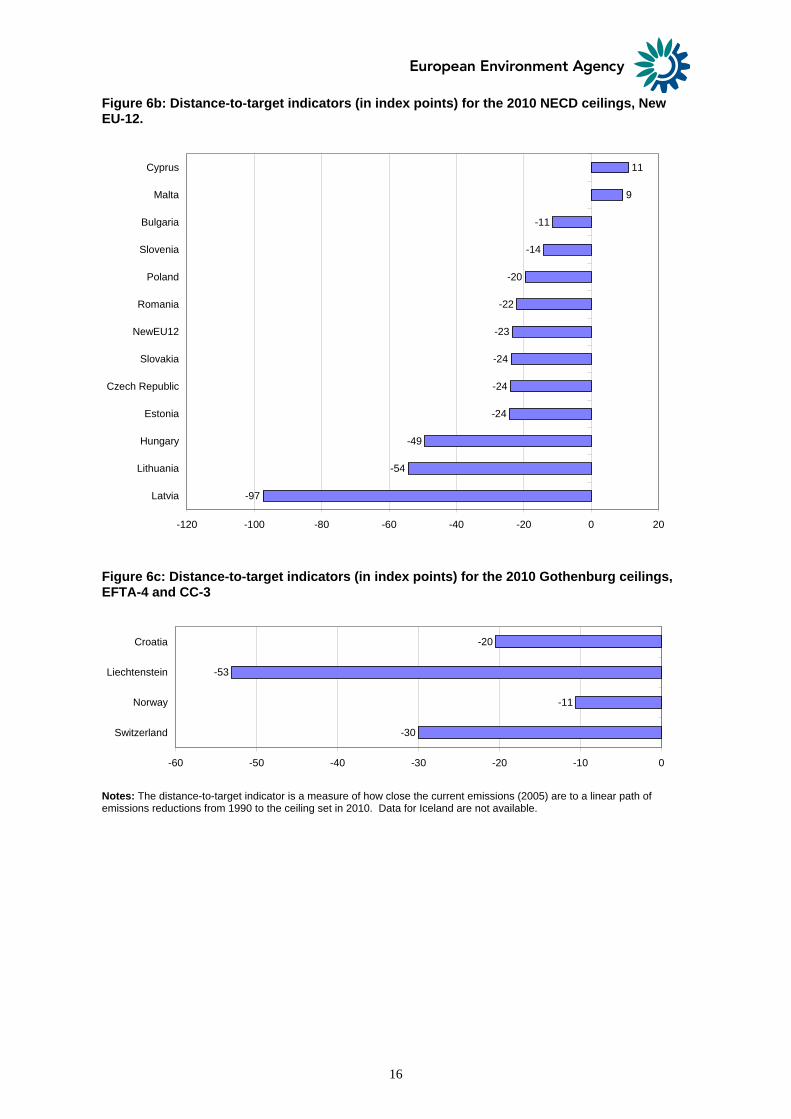
Figure 6b: Distance-to-target indicators (in index points) for the 2010 NECD ceilings, New EU-12.
11
9
-11
-14
-20
-22
-23
-24
-24
-24
-49
-54
-97
-120 -100 -80 -60 -40 -20 0 20
Cyprus
Malta
Bulgaria
Slovenia
Poland
Romania
NewEU12
Slovakia
Czech Republic
Estonia
Hungary
Lithuania
Latvia
Figure 6c: Distance-to-target indicators (in index points) for the 2010 Gothenburg ceilings, EFTA-4 and CC-3
-20
-53
-11
-30
-60 -50 -40 -30 -20 -10 0
Croatia
Liechtenstein
Norway
Switzerland
Notes: The distance-to-target indicator is a measure of how close the current emissions (2005) are to a linear path of emissions reductions from 1990 to the ceiling set in 2010. Data for Iceland are not available.
17
Assessment
- In general strong progress in reducing SO2 emissions has been made by countries. Thirteen of the EU-27 Member States have already reduced their national SO2 emissions below the level of the emission ceilings set in the National Emission Ceilings Directive (NECD). The Member States which have already achieved their ceilings are: Austria, the Czech Republic, Denmark, Estonia, Finland, Hungary, Latvia, Lithuania, Luxembourg, Poland, Romania and Sweden.
- A number of other Member States reported SO2 emissions for the year 2005 that were close to their respective ceilings under the NECD. These countries are considered well on track towards meeting their emission ceilings in 2010.
- However, a small number of Member States still require relatively significant reductions in SO2 emissions to be made if they are to meet their 2010 ceilings under the NECD. These Member States include Cyprus, Malta, Portugal and Spain.
- The EFTA-4 and CC-3 countries are not members of the European Union and hence have no emission ceilings set under the NECD. However, Switzerland and Norway have ratified the Gothenburg Protocol, requiring them to reduce their emissions to the agreed ceiling specified in the protocol by 2010. Switzerland has already met its Gothenburg Protocol ceiling, whilst Norway, which has not yet met its national ceiling, is on track to do so.
References
EEA 2007. EMEP / CORINAIR Atmospheric Emission Inventory Guidebook - 2007. European Environment Agency, 2007. http://reports.eea.europa.eu/EMEPCORINAIR5/
EMEP (1998). "Transboundary Acidifying Air Pollution in Europe", Part 1: Estimated dispersion of acidifying and eutrophying compounds and comparison with observations. EMEP/MSC-W Report 1/98, July 1998. http://www.emep.int/publ/reports/1998/EMEP_1998_R1_p1.pdf
19
Data
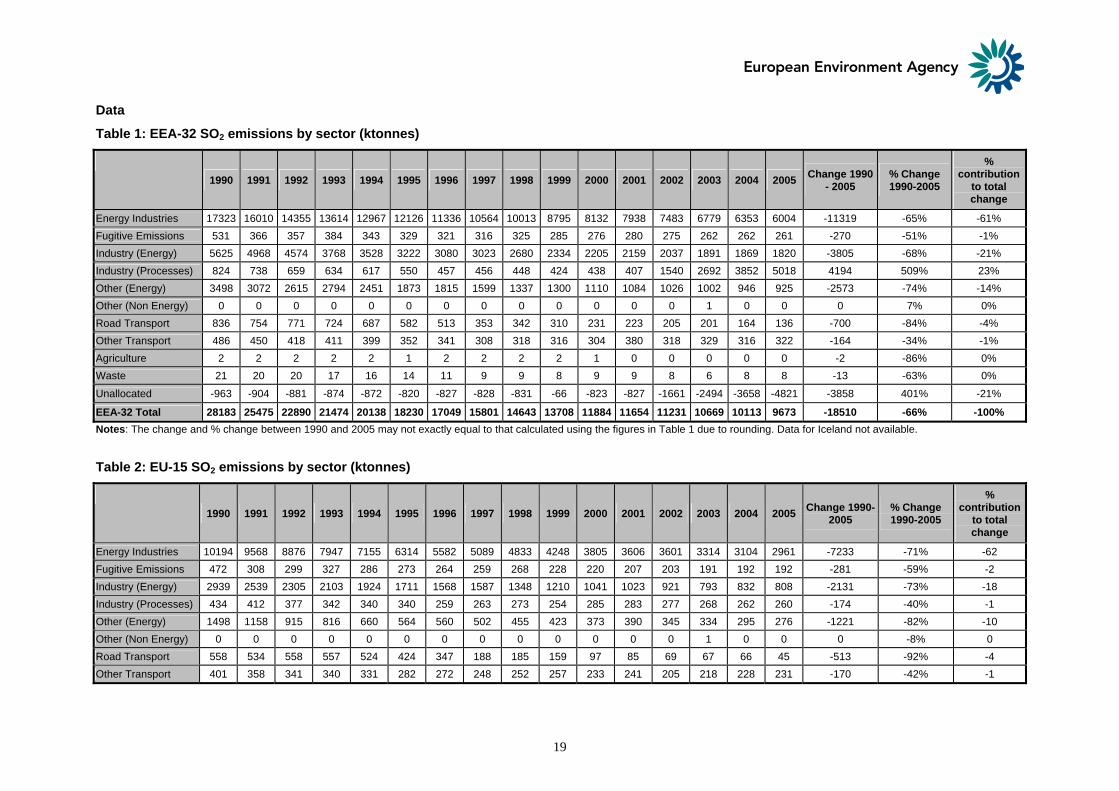
Table 1: EEA-32 SO2 emissions by sector (ktonnes)
1990 1991 1992 1993 1994 1995 1996 1997 1998 1999 2000 2001 2002 2003 2004 2005 Change 1990 - 2005
% Change 1990-2005
% contribution
to total change
Energy Industries 17323 16010 14355 13614 12967 12126 11336 10564 10013 8795 8132 7938 7483 6779 6353 6004 -11319 -65% -61% Fugitive Emissions 531 366 357 384 343 329 321 316 325 285 276 280 275 262 262 261 -270 -51% -1% Industry (Energy) 5625 4968 4574 3768 3528 3222 3080 3023 2680 2334 2205 2159 2037 1891 1869 1820 -3805 -68% -21% Industry (Processes) 824 738 659 634 617 550 457 456 448 424 438 407 1540 2692 3852 5018 4194 509% 23% Other (Energy) 3498 3072 2615 2794 2451 1873 1815 1599 1337 1300 1110 1084 1026 1002 946 925 -2573 -74% -14% Other (Non Energy) 0 0 0 0 0 0 0 0 0 0 0 0 0 1 0 0 0 7% 0% Road Transport 836 754 771 724 687 582 513 353 342 310 231 223 205 201 164 136 -700 -84% -4% Other Transport 486 450 418 411 399 352 341 308 318 316 304 380 318 329 316 322 -164 -34% -1% Agriculture 2 2 2 2 2 1 2 2 2 2 1 0 0 0 0 0 -2 -86% 0% Waste 21 20 20 17 16 14 11 9 9 8 9 9 8 6 8 8 -13 -63% 0%
Unallocated -963 -904 -881 -874 -872 -820 -827 -828 -831 -66 -823 -827 -1661 -2494 -3658 -4821 -3858 401% -21%
EEA-32 Total 28183 25475 22890 21474 20138 18230 17049 15801 14643 13708 11884 11654 11231 10669 10113 9673 -18510 -66% -100% Notes: The change and % change between 1990 and 2005 may not exactly equal to that calculated using the figures in Table 1 due to rounding. Data for Iceland not available.
Table 2: EU-15 SO2 emissions by sector (ktonnes)
1990 1991 1992 1993 1994 1995 1996 1997 1998 1999 2000 2001 2002 2003 2004 2005 Change 1990-2005
% Change 1990-2005
% contribution
to total change
Energy Industries 10194 9568 8876 7947 7155 6314 5582 5089 4833 4248 3805 3606 3601 3314 3104 2961 -7233 -71% -62 Fugitive Emissions 472 308 299 327 286 273 264 259 268 228 220 207 203 191 192 192 -281 -59% -2 Industry (Energy) 2939 2539 2305 2103 1924 1711 1568 1587 1348 1210 1041 1023 921 793 832 808 -2131 -73% -18 Industry (Processes) 434 412 377 342 340 340 259 263 273 254 285 283 277 268 262 260 -174 -40% -1 Other (Energy) 1498 1158 915 816 660 564 560 502 455 423 373 390 345 334 295 276 -1221 -82% -10 Other (Non Energy) 0 0 0 0 0 0 0 0 0 0 0 0 0 1 0 0 0 -8% 0 Road Transport 558 534 558 557 524 424 347 188 185 159 97 85 69 67 66 45 -513 -92% -4 Other Transport 401 358 341 340 331 282 272 248 252 257 233 241 205 218 228 231 -170 -42% -1
20
Agriculture 2 2 2 2 2 1 2 2 2 2 1 0 0 0 0 0 -2 -88% 0 Waste 18 18 18 15 13 12 10 7 7 6 6 7 6 4 6 6 -12 -68% 0
Unallocated 2 0 1 1 0 2 0 0 1 0 0 0 -1 -9 -8 -8 -9 -524% 0
Total 16518 14898 13690 12449 11234 9923 8863 8145 7624 6787 6062 5843 5626 5181 4977 4771 -11746 -71% -100
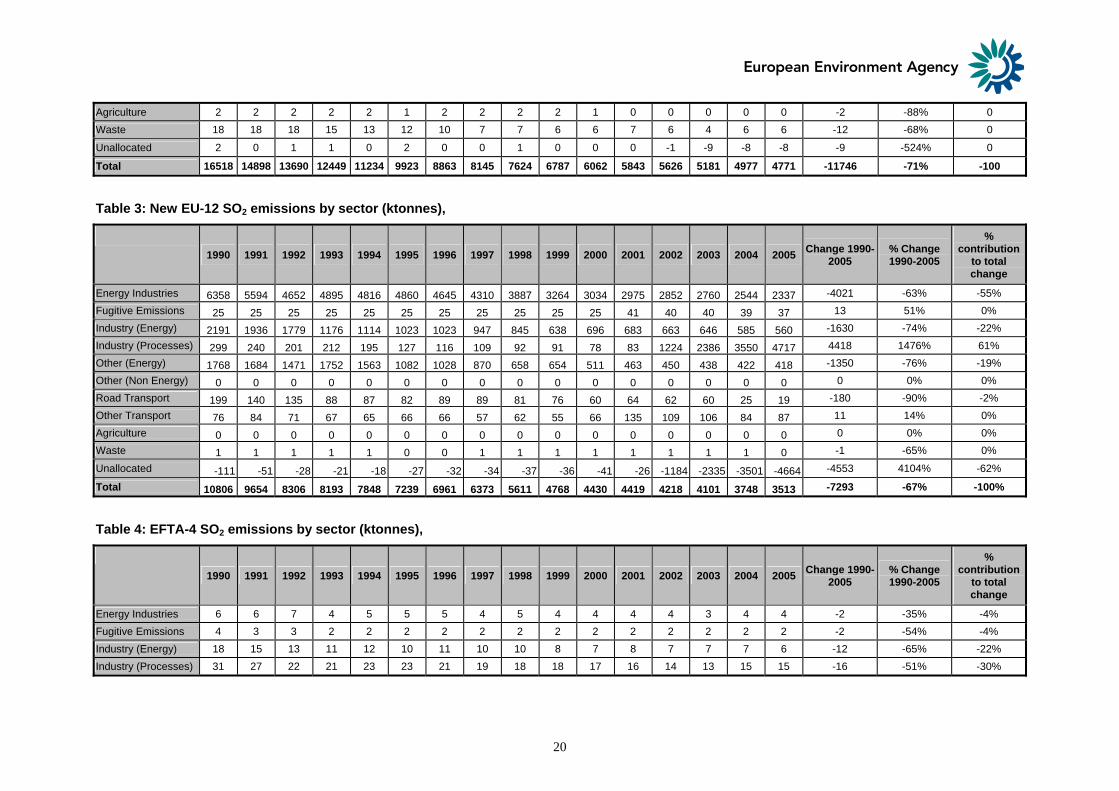
Table 3: New EU-12 SO2 emissions by sector (ktonnes),
1990 1991 1992 1993 1994 1995 1996 1997 1998 1999 2000 2001 2002 2003 2004 2005 Change 1990-2005
% Change 1990-2005
% contribution
to total change
Energy Industries 6358 5594 4652 4895 4816 4860 4645 4310 3887 3264 3034 2975 2852 2760 2544 2337 -4021 -63% -55% Fugitive Emissions 25 25 25 25 25 25 25 25 25 25 25 41 40 40 39 37 13 51% 0% Industry (Energy) 2191 1936 1779 1176 1114 1023 1023 947 845 638 696 683 663 646 585 560 -1630 -74% -22% Industry (Processes) 299 240 201 212 195 127 116 109 92 91 78 83 1224 2386 3550 4717 4418 1476% 61% Other (Energy) 1768 1684 1471 1752 1563 1082 1028 870 658 654 511 463 450 438 422 418 -1350 -76% -19% Other (Non Energy) 0 0 0 0 0 0 0 0 0 0 0 0 0 0 0 0 0 0% 0% Road Transport 199 140 135 88 87 82 89 89 81 76 60 64 62 60 25 19 -180 -90% -2% Other Transport 76 84 71 67 65 66 66 57 62 55 66 135 109 106 84 87 11 14% 0% Agriculture 0 0 0 0 0 0 0 0 0 0 0 0 0 0 0 0 0 0% 0% Waste 1 1 1 1 1 0 0 1 1 1 1 1 1 1 1 0 -1 -65% 0%
Unallocated -111 -51 -28 -21 -18 -27 -32 -34 -37 -36 -41 -26 -1184 -2335 -3501 -4664 -4553 4104% -62%
Total 10806 9654 8306 8193 7848 7239 6961 6373 5611 4768 4430 4419 4218 4101 3748 3513 -7293 -67% -100%
Table 4: EFTA-4 SO2 emissions by sector (ktonnes),
1990 1991 1992 1993 1994 1995 1996 1997 1998 1999 2000 2001 2002 2003 2004 2005 Change 1990-2005
% Change 1990-2005
% contribution
to total change
Energy Industries 6 6 7 4 5 5 5 4 5 4 4 4 4 3 4 4 -2 -35% -4% Fugitive Emissions 4 3 3 2 2 2 2 2 2 2 2 2 2 2 2 2 -2 -54% -4% Industry (Energy) 18 15 13 11 12 10 11 10 10 8 7 8 7 7 7 6 -12 -65% -22% Industry (Processes) 31 27 22 21 23 23 21 19 18 18 17 16 14 13 15 15 -16 -51% -30%
21
Other (Energy) 18 16 14 11 14 13 13 13 10 8 7 9 8 8 8 8 -10 -54% -18% Other (Non Energy) 0 0 0 0 0 0 0 0 0 0 0 0 0 0 0 0 0 47% 0% Road Transport 7 7 7 6 4 4 4 4 3 3 2 2 2 1 0 0 -7 -98% -13% Other Transport 9 8 6 5 4 4 3 4 4 4 4 4 3 5 4 4 -5 -52% -9% Agriculture 0 0 0 0 0 0 0 0 0 0 0 0 0 0 0 0 0 0% 0% Waste 1 1 1 1 1 1 1 1 1 1 1 1 1 1 1 1 0 3% 0%
Unallocated 0 0 0 0 0 0 0 0 0 0 0 0 0 0 0 0 0 -100% 0%
Total 95 82 72 64 64 61 60 57 54 48 45 45 41 40 42 42 -53 -56% -100% Notes: Data for Iceland not available.
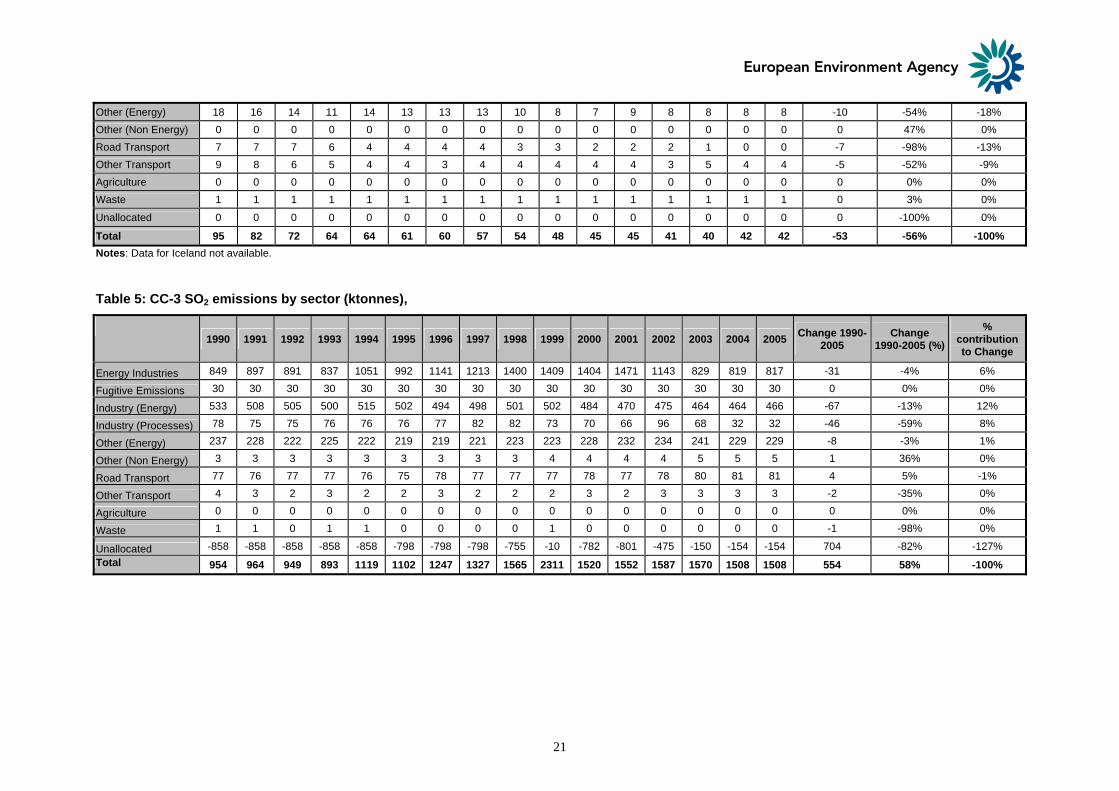
Table 5: CC-3 SO2 emissions by sector (ktonnes),
1990 1991 1992 1993 1994 1995 1996 1997 1998 1999 2000 2001 2002 2003 2004 2005 Change 1990-2005
Change 1990-2005 (%)
% contribution to Change
Energy Industries 849 897 891 837 1051 992 1141 1213 1400 1409 1404 1471 1143 829 819 817 -31 -4% 6%
Fugitive Emissions 30 30 30 30 30 30 30 30 30 30 30 30 30 30 30 30 0 0% 0%
Industry (Energy) 533 508 505 500 515 502 494 498 501 502 484 470 475 464 464 466 -67 -13% 12%
Industry (Processes) 78 75 75 76 76 76 77 82 82 73 70 66 96 68 32 32 -46 -59% 8%
Other (Energy) 237 228 222 225 222 219 219 221 223 223 228 232 234 241 229 229 -8 -3% 1%
Other (Non Energy) 3 3 3 3 3 3 3 3 3 4 4 4 4 5 5 5 1 36% 0%
Road Transport 77 76 77 77 76 75 78 77 77 77 78 77 78 80 81 81 4 5% -1%
Other Transport 4 3 2 3 2 2 3 2 2 2 3 2 3 3 3 3 -2 -35% 0%
Agriculture 0 0 0 0 0 0 0 0 0 0 0 0 0 0 0 0 0 0% 0%
Waste 1 1 0 1 1 0 0 0 0 1 0 0 0 0 0 0 -1 -98% 0%
Unallocated -858 -858 -858 -858 -858 -798 -798 -798 -755 -10 -782 -801 -475 -150 -154 -154 704 -82% -127% Total 954 964 949 893 1119 1102 1247 1327 1565 2311 1520 1552 1587 1570 1508 1508 554 58% -100%
22
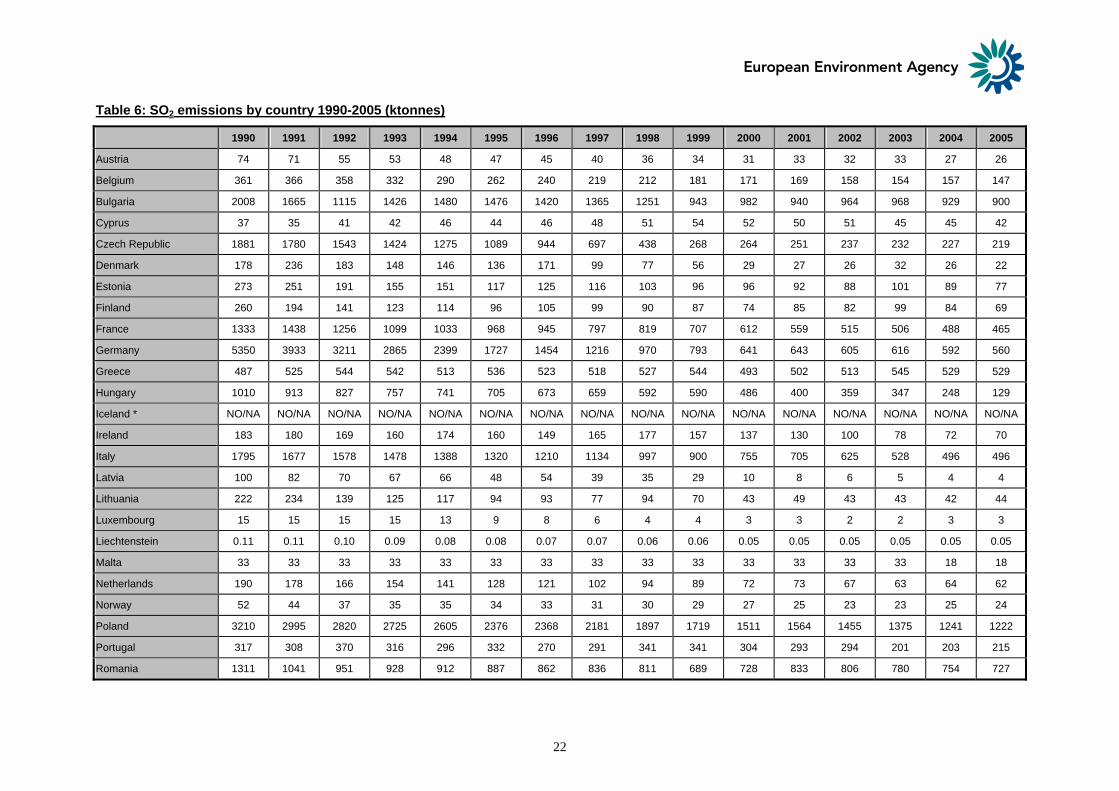
Table 6: SO2 emissions by country 1990-2005 (ktonnes)
1990 1991 1992 1993 1994 1995 1996 1997 1998 1999 2000 2001 2002 2003 2004 2005
Austria 74 71 55 53 48 47 45 40 36 34 31 33 32 33 27 26
Belgium 361 366 358 332 290 262 240 219 212 181 171 169 158 154 157 147
Bulgaria 2008 1665 1115 1426 1480 1476 1420 1365 1251 943 982 940 964 968 929 900
Cyprus 37 35 41 42 46 44 46 48 51 54 52 50 51 45 45 42
Czech Republic 1881 1780 1543 1424 1275 1089 944 697 438 268 264 251 237 232 227 219
Denmark 178 236 183 148 146 136 171 99 77 56 29 27 26 32 26 22
Estonia 273 251 191 155 151 117 125 116 103 96 96 92 88 101 89 77
Finland 260 194 141 123 114 96 105 99 90 87 74 85 82 99 84 69
France 1333 1438 1256 1099 1033 968 945 797 819 707 612 559 515 506 488 465
Germany 5350 3933 3211 2865 2399 1727 1454 1216 970 793 641 643 605 616 592 560
Greece 487 525 544 542 513 536 523 518 527 544 493 502 513 545 529 529
Hungary 1010 913 827 757 741 705 673 659 592 590 486 400 359 347 248 129
Iceland * NO/NA NO/NA NO/NA NO/NA NO/NA NO/NA NO/NA NO/NA NO/NA NO/NA NO/NA NO/NA NO/NA NO/NA NO/NA NO/NA
Ireland 183 180 169 160 174 160 149 165 177 157 137 130 100 78 72 70
Italy 1795 1677 1578 1478 1388 1320 1210 1134 997 900 755 705 625 528 496 496
Latvia 100 82 70 67 66 48 54 39 35 29 10 8 6 5 4 4
Lithuania 222 234 139 125 117 94 93 77 94 70 43 49 43 43 42 44
Luxembourg 15 15 15 15 13 9 8 6 4 4 3 3 2 2 3 3
Liechtenstein 0.11 0.11 0.10 0.09 0.08 0.08 0.07 0.07 0.06 0.06 0.05 0.05 0.05 0.05 0.05 0.05
Malta 33 33 33 33 33 33 33 33 33 33 33 33 33 33 18 18
Netherlands 190 178 166 154 141 128 121 102 94 89 72 73 67 63 64 62
Norway 52 44 37 35 35 34 33 31 30 29 27 25 23 23 25 24
Poland 3210 2995 2820 2725 2605 2376 2368 2181 1897 1719 1511 1564 1455 1375 1241 1222
Portugal 317 308 370 316 296 332 270 291 341 341 304 293 294 201 203 215
Romania 1311 1041 951 928 912 887 862 836 811 689 728 833 806 780 754 727
23
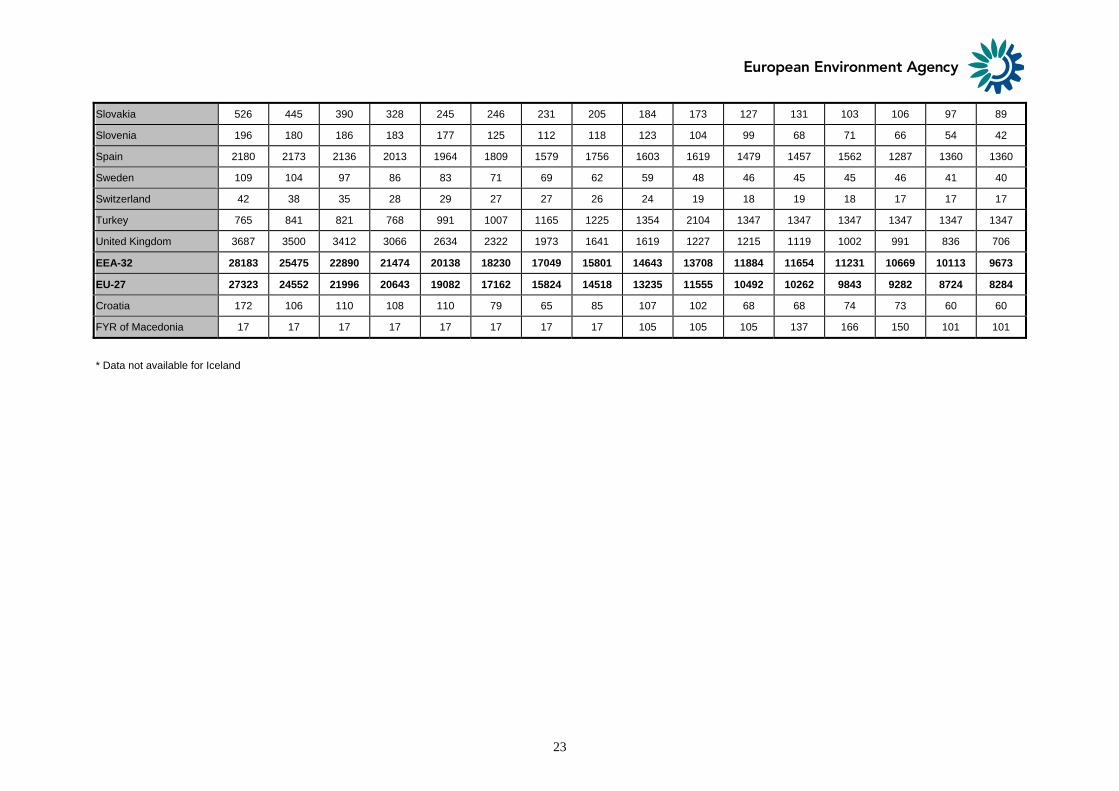
Slovakia 526 445 390 328 245 246 231 205 184 173 127 131 103 106 97 89
Slovenia 196 180 186 183 177 125 112 118 123 104 99 68 71 66 54 42
Spain 2180 2173 2136 2013 1964 1809 1579 1756 1603 1619 1479 1457 1562 1287 1360 1360
Sweden 109 104 97 86 83 71 69 62 59 48 46 45 45 46 41 40
Switzerland 42 38 35 28 29 27 27 26 24 19 18 19 18 17 17 17
Turkey 765 841 821 768 991 1007 1165 1225 1354 2104 1347 1347 1347 1347 1347 1347
United Kingdom 3687 3500 3412 3066 2634 2322 1973 1641 1619 1227 1215 1119 1002 991 836 706
EEA-32 28183 25475 22890 21474 20138 18230 17049 15801 14643 13708 11884 11654 11231 10669 10113 9673
EU-27 27323 24552 21996 20643 19082 17162 15824 14518 13235 11555 10492 10262 9843 9282 8724 8284
Croatia 172 106 110 108 110 79 65 85 107 102 68 68 74 73 60 60
FYR of Macedonia 17 17 17 17 17 17 17 17 105 105 105 137 166 150 101 101
* Data not available for Iceland
25
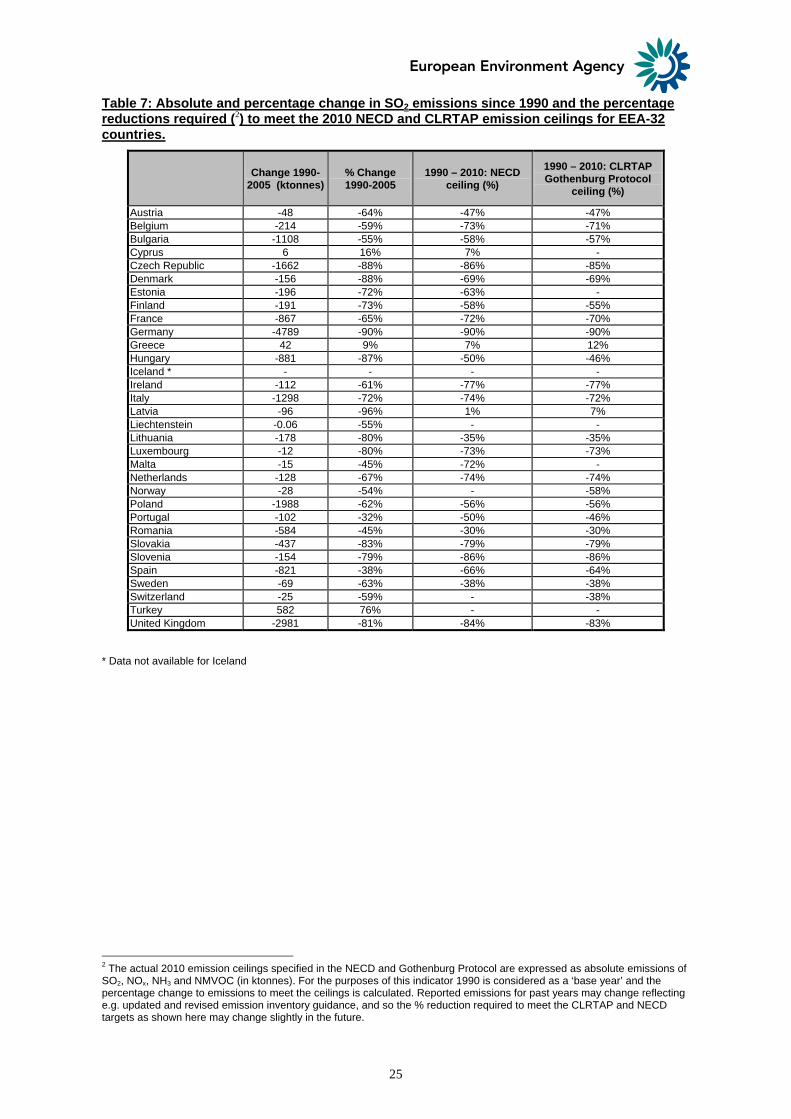
Table 7: Absolute and percentage change in SO2 emissions since 1990 and the percentage reductions required (2) to meet the 2010 NECD and CLRTAP emission ceilings for EEA-32 countries.
Change 1990-2005 (ktonnes)
% Change 1990-2005
1990 – 2010: NECD ceiling (%)
1990 – 2010: CLRTAP Gothenburg Protocol
ceiling (%)
Austria -48 -64% -47% -47% Belgium -214 -59% -73% -71% Bulgaria -1108 -55% -58% -57% Cyprus 6 16% 7% - Czech Republic -1662 -88% -86% -85% Denmark -156 -88% -69% -69% Estonia -196 -72% -63% - Finland -191 -73% -58% -55% France -867 -65% -72% -70% Germany -4789 -90% -90% -90% Greece 42 9% 7% 12% Hungary -881 -87% -50% -46% Iceland * - - - - Ireland -112 -61% -77% -77% Italy -1298 -72% -74% -72% Latvia -96 -96% 1% 7% Liechtenstein -0.06 -55% - - Lithuania -178 -80% -35% -35% Luxembourg -12 -80% -73% -73% Malta -15 -45% -72% - Netherlands -128 -67% -74% -74% Norway -28 -54% - -58% Poland -1988 -62% -56% -56% Portugal -102 -32% -50% -46% Romania -584 -45% -30% -30% Slovakia -437 -83% -79% -79% Slovenia -154 -79% -86% -86% Spain -821 -38% -66% -64% Sweden -69 -63% -38% -38% Switzerland -25 -59% - -38% Turkey 582 76% - - United Kingdom -2981 -81% -84% -83%
* Data not available for Iceland
2 The actual 2010 emission ceilings specified in the NECD and Gothenburg Protocol are expressed as absolute emissions of SO2, NOx, NH3 and NMVOC (in ktonnes). For the purposes of this indicator 1990 is considered as a ‘base year’ and the percentage change to emissions to meet the ceilings is calculated. Reported emissions for past years may change reflecting e.g. updated and revised emission inventory guidance, and so the % reduction required to meet the CLRTAP and NECD targets as shown here may change slightly in the future.

26
Meta Data Technical Information 1. Data source: Based on officially reported national total and sectoral emissions to UNECE/EMEP (United
Nations Economic Commission for Europe/Co-operative programme for monitoring and evaluation of the long-range transmission of air pollutants in Europe) Convention on Long-range Transboundary Air Pollution (LRTAP Convention), submission 2007. Base data are available from the EEA Data Service (http://dataservice.eea.europa.eu/dataservice/metadetails.asp?id=1013) and the EMEP web site (http://webdab.emep.int/). Where necessary, gaps in reported data are filled by ETC/ACC using simple interpolation techniques (see 6). The final gap-filled data used in this indicator is available from the EEA Data Service (http://dataservice.eea.europa.eu/dataservice/metadetails.asp?id=1006)
2. Description of the data: Emissions (national totals and sectoral data) of SO2 in 1000 tonnes (ktonnes). 3. Geographical coverage: EEA-32. The EEA-32 country grouping includes countries of the EU-27 (Austria,
Belgium, Bulgaria, Cyprus, Czech Republic, Denmark, Estonia, Finland, France, Germany, Greece, Hungary, Ireland, Italy, Latvia, Lithuania, Luxembourg, Malta, the Netherlands, Poland, Portugal, Romania, Slovakia, Slovenia, Spain, Sweden, and the United Kingdom) EFTA-4 (Iceland, Liechtenstein, Switzerland and Norway) and Turkey. Certain analyses also include data for the FYR of Macedonia and Croatia.
4. Temporal coverage: 1990-2005 5. Methodology and frequency of data collection: Annual country emission inventory submissions to
UNECE/LRTAP Convention/EMEP. Recommended methodologies for emission inventory estimation are compiled in the EMEP/CORINAIR Atmospheric Emission Inventory Guidebook 3rd edition, EEA, Copenhagen EEA (2007).
6. Methodology of data manipulation: EEA/ETC-ACC gap-filling methodology. To allow trend analysis where countries have not reported data for one or several years, data has been interpolated to derive annual emissions. If the reported data is missing either at the beginning or at the end of the time series period, the emission value has been considered to equal the first (or last) reported emission value. It is recognised that the use of gap-filling can potentially lead to artificial trends, but it is considered unavoidable if a comprehensive and comparable set of emissions data for European countries is required for policy analysis purposes. Base data, reported in SNAP, draft NFR or NFR are aggregated into the following EEA sector codes to obtain a common reporting format across all countries and pollutants:
- ‘Energy industries’: emissions from public heat and electricity generation, oil refining and production of
solid fuels; - ‘Fugitive emissions’: Emissions from extraction and distribution of solid fossil fuels and geothermal
energy; - ‘Industry (Energy)’: emissions from combustion processes used in the manufacturing industry including
boilers, gas turbines and stationary engines; - ‘Industry (Processes)’: emissions derived from non-combustion related processes such as the production
of minerals, chemicals and metal production; - ‘Road transport’: light and heavy duty vehicles, passenger cars and motorcycles; - ‘Off-road transport’: railways, domestic shipping, certain aircraft movements, and non-road mobile
machinery used in agriculture & forestry; - ‘Other (energy-related)’ emissions principally occurring from fuel combustion in the services and
household sectors; - ‘Other (Non Energy)’: non-combustion related emissions mainly in the services and households sectors
including activities such as paint application, dry-cleaning and other use of solvents; - ‘Agriculture’: manure management, fertiliser application, field-burning of agricultural wastes - ‘Waste’: incineration, waste-water management; - ‘Unallocated’: The difference between the reported national total and the sum of the sectors reported by a
country.
The ‘unallocated’ sector corresponds to the difference between the reported national total and the sum of the reported sectors for a given pollutant / country / year combination. It can be either negative or positive. Inclusion of this additional sector means that the officially reported national totals do not require adjustment to ensure that they are consistent with the sum of the individual sectors reported by countries.
The following table shows the conversion of Nomenclature for Reporting (NFR) sector codes used for reporting by countries into EEA sector codes:
EEA classification NFR Emission Source Category 0 National totals National total 1 Energy Industries 1A1 3 Industry (energy) 1A2
27
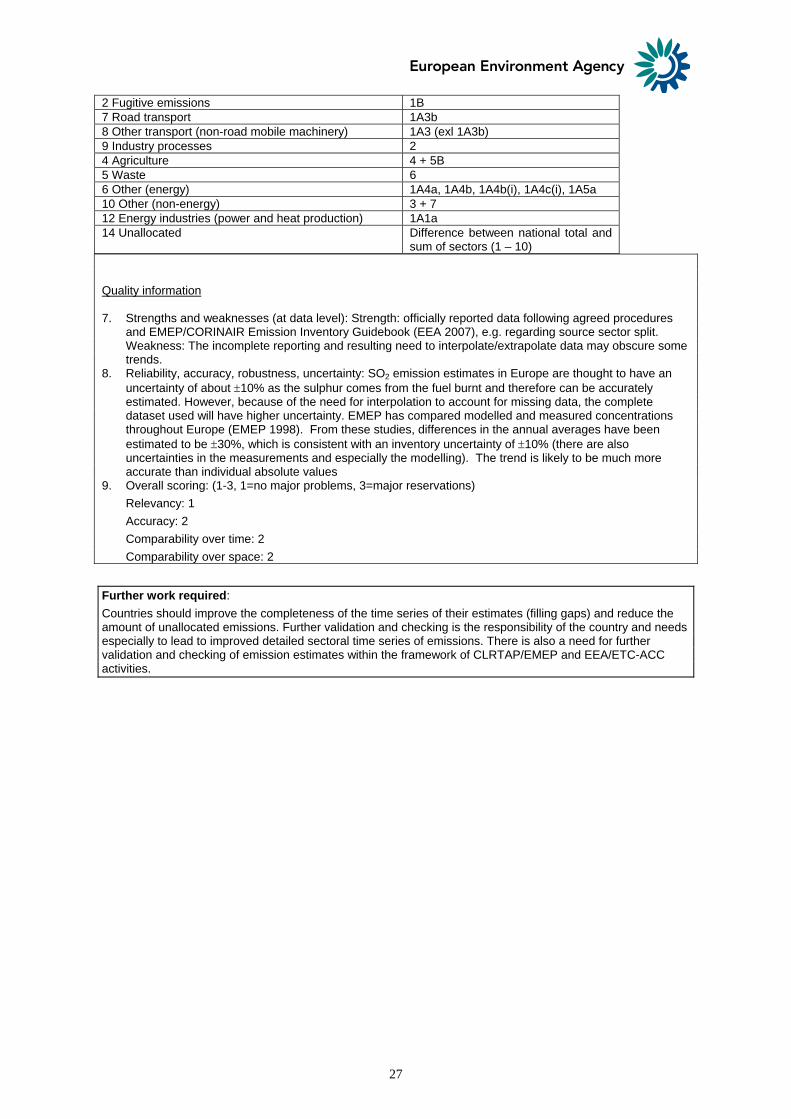
2 Fugitive emissions 1B 7 Road transport 1A3b 8 Other transport (non-road mobile machinery) 1A3 (exl 1A3b) 9 Industry processes 2 4 Agriculture 4 + 5B 5 Waste 6 6 Other (energy) 1A4a, 1A4b, 1A4b(i), 1A4c(i), 1A5a 10 Other (non-energy) 3 + 7 12 Energy industries (power and heat production) 1A1a 14 Unallocated Difference between national total and
sum of sectors (1 – 10) Quality information 7. Strengths and weaknesses (at data level): Strength: officially reported data following agreed procedures
and EMEP/CORINAIR Emission Inventory Guidebook (EEA 2007), e.g. regarding source sector split. Weakness: The incomplete reporting and resulting need to interpolate/extrapolate data may obscure some trends.
8. Reliability, accuracy, robustness, uncertainty: SO2 emission estimates in Europe are thought to have an uncertainty of about ±10% as the sulphur comes from the fuel burnt and therefore can be accurately estimated. However, because of the need for interpolation to account for missing data, the complete dataset used will have higher uncertainty. EMEP has compared modelled and measured concentrations throughout Europe (EMEP 1998). From these studies, differences in the annual averages have been estimated to be ±30%, which is consistent with an inventory uncertainty of ±10% (there are also uncertainties in the measurements and especially the modelling). The trend is likely to be much more accurate than individual absolute values
9. Overall scoring: (1-3, 1=no major problems, 3=major reservations) Relevancy: 1 Accuracy: 2 Comparability over time: 2 Comparability over space: 2
Further work required: Countries should improve the completeness of the time series of their estimates (filling gaps) and reduce the amount of unallocated emissions. Further validation and checking is the responsibility of the country and needs especially to lead to improved detailed sectoral time series of emissions. There is also a need for further validation and checking of emission estimates within the framework of CLRTAP/EMEP and EEA/ETC-ACC activities.
Copyright © 2022 FDOKUMEN