Smallholder Tea Producer Experiences of Voluntary Private ...
Upload
khangminh22Category
view
0download
0
AN ASSESSMENT OF FACTORS INFLUENCING SMALLHOLDER
FARMERS’ WILLINGNESS TO ADOPT MUSHROOM PRODUCTION
FOR LIVELIHOOD DIVERSIFICATION IN VIHIGA COUNTY, KENYA
Ongoche Christine Irene
A56/82292/2012
A Thesis Submitted in Partial Fulfilment of the Requirements for the Award
of the Degree of Master of Science in Agricultural and Applied Economics
Department of Agricultural Economics
Faculty of Agriculture
University of Nairobi
2019

DECLARATION
This thesis is my original work and has not been presented for the award of any degree.
Ongoche Christine Irene
Reg No. A56/82292/2012
Signature: Date:
……………………………… ……………………………
This thesis has been submitted for examination with our approval as university supervisors.
1. Dr. David Jakinda Otieno
Department of Agricultural Economics, University of Nairobi
Signature Date
……………………………………….. ……………………………………..
2. Prof. Willis Oluoch - Kosura
Department of Agricultural Economics, University of Nairobi
Signature Date
……………………………………….. ……………………………………..

ii
DEDICATION
This thesis is dedicated to my son Gadiel Jeylani and parents Mr. Samwel Amakoye and Mrs.
Alice Akwela for their support and encouragement throughout my study.

iii
ACKNOWLEDGEMENT
I am very grateful to God for the gift of life, enabling me to get to such a level academically, for
physical and spiritual strength during the entire period as a masters’ degree student.
I am grateful to my parents for financial assistance and continuous support during the entire
period. To my son Gadiel Jeylani, thank you for being a pillar of strength in my life and also
being a reason for my hard work.
I acknowledge the AFRINT III project for funding my fieldwork for it would have been difficult
without this financial assistance. My supervisors Dr. David Jakinda Otieno and Prof. Willis
Oluoch-Kosura for their guidance and continuous support during this entire period, putting in
extra hours to assist me. The 2012/2013 CMAAE class for assistance when I needed it and also
continuous assistance during the entire period in my masters’degree programme.

iv
TABLE OF CONTENTS
DECLARATION ........................................................................................................................................... i
DEDICATION .............................................................................................................................................. ii
ACKNOWLEDGEMENT ........................................................................................................................... iii
LIST OF TABLES ....................................................................................................................................... vi
LIST OF FIGURES .................................................................................................................................... vii
LIST OF ACRONYMS ............................................................................................................................. viii
ABSTRACT .................................................................................................................................................. x
CHAPTER ONE: INTRODUCTION ........................................................................................................... 1
1.1 Background Information ............................................................................................................... 1
1.2 Statement of the Research Problem .............................................................................................. 8
1.3 Objectives of the Study ............................................................................................................... 10
1.4 Hypotheses ................................................................................................................................. 10
1.5 Justification ................................................................................................................................. 11
1.6 Organization of the thesis .......................................................................................................... 13
CHAPTER TWO: LITERATURE REVIEW ............................................................................................ 14
2.1 Livelihood Diversification .......................................................................................................... 14
2.2 Review of Adoption Models ...................................................................................................... 22
2.3 Mushroom Market Characterization ........................................................................................... 25
2.4 Theoretical Framework ............................................................................................................... 29
2.5 Conceptualization of Mushroom as a Livelihood Diversification Strategy ................................ 34
CHAPTER THREE: METHODOLOGY ................................................................................................... 37
3.1 Study Area .................................................................................................................................. 37
3.2 Sampling Procedure and Data Collection ................................................................................... 39
3.3 Empirical Analysis ...................................................................................................................... 40
3.3.1 Descriptive Analysis ........................................................................................................... 40
3.3.2 Empirical Model ................................................................................................................. 41
CHAPTER FOUR: RESULTS AND DISCUSSION ................................................................................. 44
4.1 Socio-Economic Characterization of the Respondents ............................................................... 44
4.1.1 Demographic Characteristics .............................................................................................. 44

v
4.1.2 Social and Human Capital ................................................................................................... 47
4.1.3 Mushroom Production......................................................................................................... 48
4.1.4 Livestock Ownership .......................................................................................................... 50
4.1.5 Crop Production Trend ........................................................................................................ 51
4.2 Assessment of the factors that influence smallholder farmers’ willingness to diversify into
mushroom production as a livelihood diversification option. ................................................................. 55
CHAPTER FIVE: SUMMARY, CONCLUSIONS AND RECOMMENDATIONS ................................. 60
5.1 Summary ..................................................................................................................................... 60
5.2 Conclusions ................................................................................................................................. 60
5.3 Recommendations ....................................................................................................................... 61
5.4 Limitation of the Study ............................................................................................................... 62
5.5 Suggestion for Further Research ................................................................................................. 63
REFERENCES ........................................................................................................................................... 64
APPENDICES ............................................................................................................................................ 73
Appendix 1: Focus Group Discussion Questions. ............................................................................... 73
Appendix 2: Household Survey Questionnaire ................................................................................... 74
Appendix 3: Binomial Logit Commands ............................................................................................ 85

vi
LIST OF TABLES
Table 1: Distribution of the Socio-Economic Characteristics .................................................... 46
Table 2: Livestock Ownership ..................................................................................................... 51
Table 3: Determinants of Farmers’ Willingness to Diversify into Mushroom Production .......... 56

vii
LIST OF FIGURES
Figure 1: A picture of the traditional mushroom variety ................................................................ 6
Figure 2: A farmer from the Vihiga Mushroom farmers’ co-operative displaying his Oyster
mushroom produce.......................................................................................................................... 7
Figure 3: A picture showing rocky terrain in Vihiga County ..................................................... 122
Figure 4: Adoption pathways model illustration ....................................................................... 244
Figure 5: Mushroom Production and Market Characterization .................................................... 28
Figure 6: Conceptual Framework ............................................................................................... 355
Figure 7: A map of Vihiga County ............................................................................................. 388
Figure 8: Mushroom information access channel ......................................................................... 49
Figure 9: Crops grown against land acreage per year ................................................................... 52
Figure 10: Crops grown against the yield per year ....................................................................... 53

viii
LIST OF ACRONYMS
APM Adoption Pathways Model
ASDSP Agriculture Sector Development Support Programme
CMAAE Collaborative Masters in Agricultural and Applied Economics
ETAM Extended Technology Acceptance Model
FAO Food and Agriculture Organization of the United Nations
FGDs Focus Group Discussions
FNSP Food and Nutrition Security Policy
GDP Gross Domestic Product
HAMUSAVI Hamisi Mushroom Savings Cooperative (Kenya)
HMS Hedonic-Motivation Systems
HMSAM Hedonic-Motivation System Adoption Model
IFAD International Fund for Agricultural Development
KALRO Kenya Agricultural and Livestock Research Organization
KSHS Kenyan Shillings
KNBS Kenya National Bureau of Statistics
MPTM Matching Person and Technology Model

ix
NALEP National Agriculture and Livestock Extension Programme (Kenya)
PLWHIV People Living With HIV
SAPs Structural Adjustment Programmes
SDGs Sustainable Development Goals
TAM Technology Acceptance Model
UNCTAD United Nations Conference on Trade and Development
USD United States Dollar
VAB Vihiga Agriculture Board (Kenya)
VIMPRO Vihiga Mushroom Producers Group (Kenya)
WFP World Food Programme

x
ABSTRACT
Poverty is a critical problem in many parts of the world, especially in the developing countries.
This has necessitated policy makers to have a keen interest in seeking ways of improving
livelihoods and alleviating poverty. Agriculture remains a key sector for spurring growth,
overcoming poverty, and creating employment opportunities in sub-Saharan Africa. However, in
areas where land acreage is small, it has become difficult to carry out any profitable agricultural
production as a means of livelihood sustenance. There is need to identify enterprises that can be
incorporated into the farmers’ production processes that are economically viable. There is
limited research on the drivers and the extent of willingness of smallholder farmers’ to adopt
mushroom production for livelihood diversification in Vihiga County in Western Kenya.
Using primary survey data from a sample of 240 smallholder farmers, this study assessed the
factors that influence smallholder farmers’ willingness to adopt mushroom production as a
livelihood diversification option in Vihiga County. Systematic sampling was used to select the
respondents, where every 3rd
and 5th
household was interviewed in sparsely and densely
populated areas, respectively to ensure that each household had an equal opportunity at being
interviewed. Densely populated areas were mostly found around shopping centres and near
tarmac roads. Descriptive statistics used in data analysis included frequencies, percentages and
means and they were presented in graphs and tables. These were employed in the
characterization of farmers’ socio-economic profiles. A binomial logit model was applied to
assess the factors that influence awareness of mushroom production by the farmers in the study
area and their willingness to adopt mushroom production as a livelihood diversification option.

xi
Results show that 68.8% of the farmers in the study area were aware of mushroom production
and 82.5% of the total respondents were willing to engage in mushroom production as a
livelihood diversification option. From the logit analysis, the main factors that were found to
have a significant positive influence on farmers’ willingness to engage in mushroom production
were age, gender, consumption of mushroom and total land size in acres per household.
Based on the results, it is recommended that the stakeholders in the agricultural sector in the
study area begin awareness campaigns of mushroom production as a livelihood diversification
option for smallholder farmers in the region. It is also recommended that mushroom production
be included in the County’s agricultural strategy. A training strategy on mushroom production
could be enhanced by encouraging the farmers to be members of development groups. This is
because the development groups are the main channel for information access on new agricultural
production practices in the study area. The Agricultural Sector Development Support Programme
(ASDSP) in the study area should allocate more funds for awareness campaigns and trainings to
ensure that the farmers in the area have knowledge on mushroom production as a livelihood
diversification option.
Key words: Poverty, Land, Livelihood Diversification

CHAPTER ONE: INTRODUCTION
1.1 Background Information
Agriculture can be used to deliver an annual economic growth rate of 10% if the right policies
and frameworks are put in place (United Nations, 2000). In addition to its traditional contribution
to improving food security and nutrition, agriculture remains a key sector for spurring growth,
overcoming poverty, and creating employment opportunities in sub-Saharan Africa (Amare et
al., 2017). To spur growth, agriculture requires diversification to high value crops and
transformation of the smallholder agricultural sector from subsistence to an innovative and
commercially oriented sector. Jack (2013) asserts that agriculture remains the main source of
income and employment in the sub-Saharan Africa region, accounting for 34% and 64% of these,
respectively. The World Bank (2007) identifies three key areas where improvements are critical
if strong economic performance is to be sustained, namely infrastructure, agricultural
productivity, and the investment climate.
Governments throughout the developing world have for many years had a keen and sustained
interest in diversifying their rural economies and the economic activities of rural residents
(Delgado et al., 1997). Diversification of rural livelihoods is the subject of scientific research
because income from farming has come under pressure due to population explosion (Barrett et
al., 2001). Rapid population growth and subdivision of land have resulted in small land acreage
per household, thus leading to a concern that contribution to household incomes from
agricultural activities may no longer be meaningful (Marenya et al., 2003).

2
Households combine and explore diverse strategies to act, cope and adapt to the ever changing
economy (Valbuena et al., 2014). Ellis (1997) defines livelihood diversification as the process by
which rural families engage in different activities and social support capabilities in order to
improve their standards of living. This is the phenomenon where rural households engage in
multiple activities that are either on-farm or off-farm and agricultural or non-agricultural
activities in order to survive and to improve their standard of living. On-farm diversification
includes the introduction of new crops into the farming systems or farmers investing in livestock,
hunting, and fisheries. This is distinguished from ‘off-farm’ activities, which generally refer to
activities undertaken away from the household’s own farm, such as wage employment (casual
labour) on other farms (Ellis et al., 2004). Livelihood diversification is thus characterized by
shifting activities away from customary farming to other sectors, and it offers flexibility and
well-being to households by widening their subsistence options (Gautam et al., 2016).
Subsistence producers and small farm wage labourers in the rural areas of low-income countries
constitute over two thirds of the global poor and food insecure populations (International Fund
for Agricultural Development, 2010; Food and Agriculture Organization of the United Nations
et al., 2014).A lot of evidence from the literature suggests that it is relatively better-off
smallholders with sufficient assets who achieve successful livelihood diversification, mainly by
exploiting opportunities and synergies between farm and nonfarm activities (Loison, 2015).
Generally, from the perspective of managing risk and associated vulnerability of rural
households, and in some cases from a desire to increase incomes, farm diversification makes
sense as a policy goal (Kimenju et al., 2008, Shiferawet al., 2015). For instance, better-off rural

3
households may diversify their farming practices and their non-agricultural employment to
balance risks of possible market failure where the economy lacks adequate insurance
mechanisms (Braun et al., 1991; Ellis, 1998). Such households may also diversify into off-farm
employment to increase household income when the economy is improving. Poor farmers who
cannot rely solely on agriculture normally use off-farm income diversification as a form of self-
insurance (Barrett et al., 2001). Lack of skills and knowledge and significant barriers to entry for
limited high-return opportunities tend to leave the poor with less diversified income portfolios
and lower, more variable earnings (Liyama et al., 2008). In some geographic areas, especially
areas where the payoff from agriculture is very low, off-farm diversification is practiced by
farmers as a supplement to farming (Smith et al., 2001).
Diversification is associated with a rise in income and accumulation of assets and thus improves
the livelihood of the household and moves the household from poverty (Abdul-Hakim et al.,
2011). Livelihood diversification also reduces risks associated with traditional agriculture. This
is because of the different opportunities for engagement. Factors such as experience, family size,
educational attainment and physical assets of households can affect diversification activities
(Khatun et al., 2012). Diversification not only expands the number of potential crop types for
market, but it also improves agro ecosystem functioning by allowing for innovation in areas that
exhibit impacts of climate variability (McCord et al., 2015). Kenya is yet to achieve a rapid
growth in incomes in the rural economy and/or in the economy as a whole, but this can be done
by first embracing agricultural transformation. In this transformation, individual farms need to

4
shift from subsistence-oriented production towards more specialized production that is oriented
towards the market or other systems of exchange.
Mushroom is one of the high value crops that can be grown alongside other crops as a
diversification option for both smallholder and large scale farmers in Kenya. Mushrooms are
packed with nutritional value. They’re low in calories, are great sources of fiber and protein, and
are considered good for plant-based diets. They also provide many important nutrients, including
B vitamins, selenium, potassium, copper, and vitamin D. And even though they’re commonly
white, they’re packed with as many antioxidants as more colorful fruits and vegetables. Eating
mushrooms may also help to prevent respiratory infections. Plus, mushrooms may be able to
alter gut bacteria for the better, which could also help treat obesity.
Mushroom production is less demanding on land and other resources. For example, a three
square meter plot of land can produce up to 1,000 mushroom sets in small polythene bags, with
production all year round (the first harvest being 28-35 days after planting the crop). Use of idle
structures and agricultural waste as substrate and its ability to bio-degrade offers opportunity for
mushroom production, and this provides a more economical and environmentally friendly
disposal system for such waste (Isikhuemhen et al., 2000). Harvesting can be done fortnightly,
with a kilo of mushroom going for as much as Kshs. 800 (1USD was equivalent to KSHS100 at
the time of survey). Mushroom production can also be used as a better source of income
compared to maize in the study site. This is more so important in regions like western Kenya
where the farmers tend to specialize in the production of maize which may not be economical

5
given the land constraints in the region. This possibility is based on the fact that markets for
staple food crops tend to develop more slowly than those for cash crops (Kimenju et al., 2008).
Mushroom market therefore could possibly develop faster than the maize market in Western
Kenya, especially for the smallholder farmers.
Mushroom is an important cash crop in Kenya, even though it is still produced at small-scale
level in the country. Button (Agaricus bisporus) and Oyster (Pleurotus spp) are the two main
commercially produced mushroom varieties in Kenya. The industry has a well-established
private sector investment, with large scale commercial farms like Agridutt Ltd, Rift Valley
mushrooms, Online mushrooms, Devani and Kanchan mushrooms being the key exporting
companies that do not require out growers. Mushroom is also produced by small-scale farmers in
the Western and Coastal regions of Kenya for the local markets which are households, hospitals,
supermarkets and the open air markets. In order to access the export markets, some small-scale
farmers have formed cooperatives, for example the Hamisi Mushroom Growers and Saving
Cooperative, which markets their produce as a group. The major constraints affecting these
small-scale mushroom farmers are inadequate supply of quality spawn, inadequate research and
failure to identify best agricultural practices, and development of standards along the mushroom
value chain (Odendo et al., 2012).
Vihiga County in western Kenya is an area with relatively small land parcels per household that
are characterized by a rocky and rugged terrain. The Ministry of Agriculture county strategy’s
main focus in the study area is on dairy production (cow and goats), banana, pawpaw, French
6
beans, mushrooms, sunflower and local chicken production. The emphasis on these enterprises is
on a commercial basis for income generation, though there are production challenges facing the
farmers in the County. These challenges include unpredictable climate, lack of crop rotation that
leads to soil exhaustion (with maize as the crop that is mostly grown) and decreasing soil
fertility, rocky and rugged terrain, crop pests and diseases.
Figure 1 shows the traditional mushroom variety that was previously being consumed by the
local community in Vihiga County but its production has been declining over time.
Figure 1: A picture of the traditional mushroom variety

7
Figure 2 shows the cultivated mushroom variety that is currently being produced by farmers in
the study area. Its production has been necessitated by the fact that the traditional variety that
grew wildly is no longer enough to sustain the local community in the study area.
Figure 2: A farmer from the Vihiga Mushroom farmers’ co-operative displaying his
Oyster mushroom produce

8
1.2 Statement of the Research Problem
The ever increasing population in Kenya has put more pressure on the available land for
agricultural production. The agricultural and forestry growth rate declined from 5.2% in 2013 to
3.5% in 2014 (KNBS, 2015). This has necessitated research into new technologies that require
less land for profitable agricultural production, especially in areas where the existing farming
practices have led to increasingly low production.
Livelihood diversification should be practiced by farmers as a way of risk aversion, yet not many
farmers in Kenya are engaging in the most appropriate enterprises mix for maximum profitability
in their respective regions. Severe land scarcity and population pressure tend to make households
to engage in and pursue diverse activities as livelihood strategies (Gecho et al. 2014) and
mushroom production offers a high value niche product with great potential to contribute to
enterprise diversification and poverty alleviation, by utilizing agricultural wastes. However,
mushroom production has not been fully exploited by farmers in Kenya. Farmers with small land
parcels continue to languish in poverty due to lack of information on enterprises like mushroom
production that require small land acreage for profitable production.
The main reasons why individuals and households pursue diversification as livelihood strategies
are often divided into two overarching considerations, which are necessity and choice (Ellis,
2000). In the case of the farmers in Western Kenya, and especially Vihiga County,
diversification into mushroom production would be a necessity because of the high population
pressure, extreme poverty and poor state of land for profitable production of most of the other

9
agricultural products that are produced in that area. Thus, mushroom production as a livelihood
diversification option has the highest potential compared to other enterprises in Western Kenya,
given the current land constraints and production uncertainty, especially in areas with increasing
population pressure that leaves the available land too small to be able to carry out any sustainable
agricultural activity. Farmers in the study area engage mainly in maize production but employ
poor agricultural practices that over time have led to a decline in production. Therefore, there is
the need to identify new strategies that will assist the farmers in the study area to improve their
livelihoods through diversification. The poor terrain in the study area has also made it almost
impossible for most other agricultural activities to be carried out sustainably, and hence the need
to come up with diversification strategies that would put this terrain constraint into consideration
while achieving the goals of poverty reduction and improving livelihoods.
While the production of mushroom for both commercial and subsistence use in western Kenya is
a lucrative economic activity, it has not been fully exploited by the smallholder farmers in Vihiga
County. It is well suited to deal with the current land constraints in Western Kenya, yet its
current production and local supply of 484.5 tonnes is way below its demand of 1,200 tonnes per
annum thus necessitating importation.
Given that there exists little background information on mushroom production as a livelihood
diversification option for farmers in areas facing land scarcity and that the drivers and the extent
of smallholder farmers’ willingness to adopt mushroom for livelihood diversification in Western

10
Kenya are also yet to be studied, this study aimed at determining smallholder farmers’
willingness to adopt mushroom production and the importance of mushroom production as a
livelihood diversification option for farmers in Western Kenya’s Vihiga County.
1.3 Objectives of the Study
The main objective of this study was to assess the factors influencing smallholder farmers’
willingness to adopt mushroom production for livelihood diversification in Vihiga County.
The specific objectives were:
1. To assess the awareness of mushroom production among smallholder farmers in Vihiga
County.
2. To analyse the determinants of smallholder farmers’ willingness to adopt mushroom
production as a livelihood diversification strategy in Vihiga County.
1.4 Hypotheses
1. H0: Smallholder farmers in Vihiga County are not aware of mushroom production.
2. H0: Socioeconomic and institutional factors do not influence smallholder farmers’
willingness to adopt mushroom production as a livelihood diversification option.

11
1.5 Justification
Mushroom production in Kenya has the potential to steer the country towards achieving the
Sustainable Development Goals (SDGs) of poverty and hunger eradication, improved health
(they are low in calories, great sources of vitamins, fiber and protein), improved environment
and potential to boost the overall national economy (Gateri, 2012). Mushroom production could
be one of the potential livelihood diversification options in Kenya, given the high demand for
mushrooms, though little research has been done to establish the causes of low adoption of
mushroom production as a livelihood diversification strategy. This study aimed at analysing the
factors that influence smallholder farmers’ willingness to adopt mushroom production for
livelihood diversification in Vihiga County. Therefore, the study also sought to establish if
mushroom production can be adopted as a livelihood diversification option for the farmers in
areas with small land parcels since mushroom is a high value product with great potential to
contribute to enterprise diversification and poverty alleviation as established by Isikhuemhen et
al. (2000).
Assessing the factors that influence the smallholder willingness for adoption of mushroom as a
livelihood diversification option assisted in identifying the factors that should be targeted by
policy makers when designing policies that assist farmers who adopt mushroom production as
one of their livelihood diversification options.

12
This research provided information to show what would influence the farmers venture into
production of mushroom in Vihiga County as a livelihood diversification option. Given that
livelihood diversification has been a topic of keen interest for most developing countries, the
findings of this study may be expected to assist policy makers in structuring policies that favor
livelihood diversification enterprises. Policies targeting food security can also be addressed,
given that mushroom production will ensure that the people in the study area are able to get some
income that would facilitate their access to sufficient, safe and nutritious food to meet their
dietary needs and food preferences for an active and healthy life.
Figure 3 shows the rugged terrain in Vihiga County that makes it almost impossible to carry out
most of the traditional agricultural practices that have been previously practised in the study area.
Figure 3: A picture showing the rocky terrain in Vihiga County

13
1.6 Organization of the thesis
Chapter one focuses on the background of the study, statement of the research problem and the
objectives of the study. It also focuses on issues surrounding the justification of the study and the
study area. Chapter two highlights a review of studies on livelihood diversification and how
mushroom production is emerging as a livelihood diversification strategy. Chapter three presents
the methodology, including a discussion of the theoretical framework. Chapter four provides a
detailed discussion of the results, while conclusions and policy implications are summarized in
chapter five.

14
CHAPTER TWO: LITERATURE REVIEW
2.1 Livelihood Diversification
Studies have been done in many countries to identify the constraints to livelihood diversification.
The main constraints to diversification have been found to be poor policy formation, seasonality,
lack of flexibility, lack of skills, time, institutions, lack of access to common property resources
and lack of access to some means of diversification (Karim et al. 2012). The current study aimed
at assessing these and other factors to try and establish the main factors that influence
smallholder farmers’ willingness to adopt mushroom production for livelihood diversification in
Western Kenya.
Diversification is influenced by on-farm returns to labour time compared to off-farm earning
opportunities (Singh et al. 1986). With a given piece of land plus farm infrastructure and
equipment, and a given total amount of labour time, the household makes comparisons between
the returns to using more of that time on the farm and those from deploying it in non-farm wage
or other income-generating activities. Singh argues that the factors that increase the returns to
time spent on farm activities would tend to reduce the motivation to diversify. Two such
important factors are an increase in the prices of farm outputs or a rise in farm productivity,
obtained, for example, by cultivating a higher yielding crop variety. Conversely, a rise in off-
farm or non-farm wage rates, or greater opportunities to undertake remunerative non-farm self-
employment, would increase the motive to diversify (Ellis, 2000). Although livelihood
diversification is an important strategy that rural people may use to achieve sustainable

15
livelihoods, it is one that generally operates in conjunction with other strategies which also
contribute to the formation of sustainable livelihoods. Two of the strategies which complement
livelihood diversification are migration and agricultural intensification. Intensification is where
there are increased average inputs of labour or capital on a smallholding, either cultivated land
alone, or on cultivated and grazing land, for the purpose of increasing the value of output per
hectare.
The best options for livelihood diversification generally relate to further development of existing
activities. Occasionally, there may be opportunities to significantly improve an existing but small
activity in response to a sudden change in circumstances. Developing more generic livelihood
skills (such as improved education, business development skills) coupled with the provision of
generic business services (such as information centres, micro-finance) will improve individual
abilities to identify and seize new livelihood opportunities in a range of sectors (Gordon et al.
2010). Household level diversification has implications for rural poverty reduction policies
because the conventional approaches aimed at increasing employment, incomes and productivity
in single occupations, like farming, may be missing their targets. Household members especially
from peasant families often refrain from adopting seemingly beneficial technologies and engage
in production of low value crops that require extensive labour, or divert labour resources from
agricultural production by sending household members away for seasonal jobs. This often results
to them having to sacrifice quick monetary profits in favour of achieving long term sustainability
of their livelihood systems (Stakhanov, 2010). Traditionally, it was believed that rural economy
was purely agriculture. However, in the recent years, there has been a shift away from this belief

16
to its role in rural off farm contribution to economic growth, rural development and poverty
reduction, as well as promoting growth and welfare by slowing rural urban migration (Lanjouw,
2013).
In low income countries in Asia, Latin America and Africa, across socioeconomic groups, people
purposefully attempt to diversify their productive activities, sources of income, and household
resources to secure their wellbeing and/or to respond to a crisis (Ellis, 2000). For instance, better
off rural households may diversify their farming practices and their non-agricultural employment
to balance risks of possible market failure where the economy lacks adequate insurance
mechanisms (Ellis, 1998). They also may diversify sources of off-farm employment to increase
household income when the economy is improving. Poor farmers who cannot rely solely on
agriculture normally use off-farm income diversification as a form of self-insurance (Barrett et
al. 2001). Chambers (1997) argued that poor people have to diversify sources of livelihood in
order to survive in a risk-prone and uncertain world.
The governments in the developing world have gained interest in rural livelihood diversification
to try and improve their economies (Delgado et al. 1997). In Sub-Saharan Africa, this interest
has been made noticeable by the wave of liberalization which has driven concerns that heavy
reliance on a few crops for cash income can, in an open market economy with widely fluctuating
prices, lead to instability in income that threatens rural livelihoods. Most households that
produce primarily for their own consumption, with small surpluses for sale, diversifying by

17
adding cash crops while continuing to produce for their own consumption, thereby increasing
their income; diversification into salaried wage labour and remunerative non-farm businesses can
also greatly increase total household incomes (Kimenju et al. 2008).
Past surveys on diversification provide data on the different sources of household income, and
the motivations for undertaking diversification. One such survey conducted in Burkina Faso
found that land constraints did not drive income diversification, but shortfalls in cropping income
did. Changing terms of trade tended to pull farmers towards diversification strategies, but cash
cropping activities did not substitute for non-farm diversification activities and income
diversification was associated with those in higher income groups. The role and root of
livelihood diversification were also found to vary according to the type of agro-ecological zone
(Reardon et al. 1992).
Structural adjustment programs (SAPs) were introduced in some countries to try and reduce
poverty while achieving economic growth. The SAPs were introduced to try and improve the
economies of developing countries through funding by the World Bank and the International
Monetary Fund but these had a negative experience. The negative experience prompted
development practitioners to look for alternative development paradigms based on principles of
privatization and deregulation of economic activities. However, these programs failed to achieve
sustainable growth and poverty reduction in low income countries (Stakhanov, 2010). This
necessitated the developing countries to come up with new approaches to help address poverty

18
and enhance economic growth. Since the early 1990s, development agencies have explored
people centred ’bottom-up’ approach. In this approach, the agencies concentrate on encouraging
farmers to improve their livelihoods. This would in turn improve the economy instead of trying
to change the economy in order to improve the farmers’ livelihood. Guided by this paradigm,
research has revealed that households with more diverse activities tend to exhibit lower
vulnerability to food insecurity, greater resilience and adaptability to environmental and
economic shocks. Such households also possess a greater repertoire of resources to use in their
strategies to escape poverty, and achieve greater overall sustainability (Ellis, 2004).
The diversity of rural livelihoods in low income developing countries has been receiving
increased attention in discussions about rural poverty reduction strategies. This is more so
because rural economies carry a bulk of the population in most developing countries compared to
the developed countries. It is further observed that livelihood diversification is a serious long
term issue for policies concerned with reducing poverty in low income developing countries.
However, farmers in rural areas in the developing countries are most vulnerable because of their
lack of access to education, longer distances from markets and their low wealth status. They may
also have the fewest opportunities to diversify in spite of the acknowledged importance of
diversification as a strategy to accumulate income for consumption and/or investment and to
spread risk. Although diversification is an important strategy through which rural people may
work to achieve sustainable livelihoods, it is one that generally operates in conjunction with
other strategies which also contribute to the formation of sustainable livelihoods. This is because

19
primary activities for some producers may become livelihood diversification strategies for others
(Ellis, 2000).
Rural people in Africa and Asia do not normally diversify in livestock, crop or fish production to
the total exclusion of other income generating activities. Rather, a majority of rural producers
have historically diversified their productive activities to encompass a range of other productive
areas (Karim, et al. 2012) which included both on-farm and off-farm strategies. He defined
Livelihood diversification as attempts by individuals and households to find new ways to raise
incomes and reduce environmental risk, which differ sharply by the degree of freedom of choice,
and the reversibility of the outcome. It includes both on-farm and off-farm activities which are
undertaken to generate income in addition to that from the main household agricultural activities,
via the production of other agricultural and non-agricultural goods and services.
Crop diversification is one strategy that smallholder farmers may employ to reduce their
vulnerability in the face of global environmental change (McCord, et al. 2015). Kimenju (2008)
argued that rural households need to diversify to cash crops like cotton, tea, coffee and fresh
produce which include horticultural products like flowers, vegetables and high value crops like
mushroom. This diversification should be done while still producing for their own consumption
with small surpluses for sale, and through these strategies incomes will be greatly increased
leading to stabilization of total household incomes. High value crops such as mushroom ensure

20
that farmers get more income from commercialization of their produce. Mushroom fetches high
prices at the market because of its high nutritional value, especially the protein content.
Previous studies such as Karugia et al. (2006), Marenya et al. (2003) and Oluoch-Kosura et al.
(2004) show that in areas with low per capita land holdings, such as Vihiga, farm production
may not offer an adequate opportunity as the basis for securing livelihoods even with
intensification. The poor may face barriers to sustainable livelihoods in the off-farm sector
because of low levels of physical and financial assets, thus leading to a downward vicious cycle
that entraps them in poverty. This study is contrary to the findings of these three studies since
mushroom is one of the crops that do not require huge tracts of land for profitable production.
Habib et al. (2009) in their value chain analysis of the mushroom enterprise in Rwanda, which
included value chain mapping and assessment of mushroom market, found it to be a viable rural
income generating activity. It has a high potential to generate revenue, thus serving as a
supplemental or major source of income. Their findings support the finding of this study that
mushroom has a high potential to improve the welfare of small holder farmers and can also help
address the issue of poverty. In their study of mushroom production in Haryana, Ram et al.
(2010) described all the mushroom marketing channels and did a cost benefit analysis for each
and determined the best channels to be used by the different farmers under each production
system. This was essential in determining the channels that needed to be invested in to improve
productivity. The approach was good because it was able to determine the channels that would

21
get the farmers the maximum benefit for their produce, given the costs incurred. This study only
focused on the willingness to adopt mushroom as a livelihood diversification option by the small
holder farmers and not the marketing channels. However, marketing channel information is
important for the farmers if they are engaging in this enterprise for marketing purposes.
Kimenju et al. (2008) suggested that when a country has reached a certain point in its
development, increasing numbers of rural households gradually abandon a self-provisioning
attitude to dedicate their time to a limited number of activities in which they can develop
expertise and economies of scale. In this way, households begin to diversify in enterprises that
sustain them. Therefore, rural households should focus on enterprises that are highly productive
and that will improve and sustain their welfare. This calls for research that will enable
stakeholders in different areas to identify the most viable enterprise mixes in different areas,
because different regions face different production challenges. Given the current land and
production constraints facing Kenya, engagement in mushroom production as a livelihood
diversification option can assist the country to achieve both food and income security.
Odendo et al. (2010) acknowledged mushroom as an emerging crop in Western, Central and
Coastal Kenya, yet they failed to carry out an assessment of the market potential, and
identification of constraints and opportunities in the value chains. They also failed in the
identification of business services that can address these constraints and opportunities. Logit
analysis was used to evaluate the factors that determine the probability of entry into mushroom

22
production. The study found that the key issues that promote mushroom farming were training of
farmers on mushroom production, regulation of production of quality spawn, provision of
affordable credit to small-scale farmers and linking producers to market. Odendo et al. (2010)
acknowledged that because mushroom is an emerging crop, limited research has been undertaken
to provide clear information about its production and marketing. There is need for joint
participation of all stakeholders to generate the missing information on mushroom production
and marketing (Gateri et al. 2012). This study tries to address mushroom production challenges
that were identified by previous research of mushroom by assessing the willingness of
smallholder farmers in adopting mushroom production as a livelihood diversification.
2.2 Review of Adoption Models
The adoption process involves the five stages. First, adopters must learn about the innovation
(knowledge); then, they must be persuaded of the value of the innovation (persuasion). After that
they can decide to adopt it or not (decision); if they decide to adopt it, the innovation must then
be implemented (implementation); and finally, the decision must then be reaffirmed or rejected
(confirmation). There are several models that are used in explaining adoption.
The Matching Person and Technology Model (MPTM) (Scherer, et al. 2002). This model has
accompanying assessment measures used in technology selection and decision-making, as well
as outcomes research on differences among technology users, non-users, avoiders, and reluctant
users. Research shows that although a technology may appear perfect for a given need, it may be

23
used inappropriately or even go unused when critical personality preferences, psychosocial
characteristics or needed environmental support are not considered. The use and non-use of
technology as conceptualized in the Matching person and technology model has been validated
by many researchers in the medical field. This study sought to use a model that is more
appropriate in the statistical field.
The Hedonic-Motivation System Adoption Model (HMSAM) (Lowry, et al. 2012). It is
designed to improve the understanding of Hedonic-Motivation Systems (HMS) adoption. HMS
systems are primarily used to fulfil users' intrinsic motivations. Instead of a minor Technology
Acceptance Model (TAM) extension, HMSAM is an HMS-specific system acceptance model
based on an alternative theoretical perspective, which is in turn grounded in flow-based cognitive
absorption. In this model, we assume that the user’s motivation is perceived by the satisfaction
that is measured by the user’s enjoyment of a given technology. In our case the smallholder
farmers are pushed by the need to move away from poverty hence the model is considered as not
appropriate for this study.
The Extended Technology Acceptance Model (ETAM) (Shih, 2004). It is done by adding
external variables to the Technology Acceptance Model with an aim of exploring the effects of
external factors on users' attitude, behavioural intention and actual use of technology. It has been
applied in the acceptance of some healthcare technologies. In our study we focused only on the

24
household characteristics, both on farm and off-farm and did not consider any external
characteristics hence rendering this model inappropriate for use in this study.
The Adoption Pathways Model (APM) is best suited to explain the adoption of new technologies
(Lamb, et al. 2008). Adoption starts with the recognition of a need that seeks solutions through a
technology and ends with the implementation of the solutions. The diffusion of the technology
occurs in certain stages till saturation is achieved (Jabbar et al. 1998). Our study focuses on a
technology that was introduced in Vihiga County and we are looking at the diffusion of this
technology hence making this model the best for this study. The innovators that make up 3% of
the population are the first ones to engage in a new technology, followed by early adopters
(13%), early majority (34%), late majority (34%) and the laggards (16%) who are the last to
engage in the new technologies. This is illustrated in Figure 4.
Innovators
3%
Early
Majority
(34%)
Early
adopters
13%
Late Majority
(34%) Laggards (16%)
Figure 4: Adoption pathways model illustration

25
The laggards are risk averse and would not engage in a new technology till they have enough
proof that they would benefit from the technology. Innovators are risk loving and are mostly
targeted when new technologies are introduced because from them, the rest of the population
will adopt the technology. Technological innovation and diffusion are essential for increasing
agricultural productivity and intensification and for stimulating rural economic growth and
poverty reduction (Shiferaw et al., 2015). This means that extension services are really vital in
the diffusion of technology.
Risk and uncertainty are inherent in production. Therefore, farmers diversify into different types
of enterprises to minimize the risk involved in engaging in production of a single enterprise.
Some farmers opt for diversification into one or two enterprises while others engage in more
than two enterprises to spread the risk. This study looked at the various enterprise mixes for the
farmers in Vihiga County. The study also sought to establish where the respondents were likely
to be found in the adoption pathways model based on their different characteristics.
2.3 Mushroom Market Characterization
Odendo et al. (2010) found that three broad channels are used by established mushroom
producers in Kenya when marketing of their produce. Channel 1 for smallholder farmers,
channel 2 for farmer groups and channel 3 for integrated farmer groups.

26
Channel 1: This is the channel for smallholder farmers who produce mushroom in small
quantities. The smallholder farmers purchase spawn from private organizations and receive
training on production from such organizations for example the HAMUSAVI cooperative. Once
the mushroom is ready, it is either sold to the local populace from the farms or it is transported to
the market where it is sold in small quantities to the local people or it is supplied to hotels and
hospitals in the region that do not require the mushroom in large quantities.
Channel 2: This is the channel for mushroom producing cooperatives and associations who
obtain spawn from private organizations or produce their own spawn. Once the mushroom is
ready for the market, they sell to the local population, local market, hospitals and hotels. The
difference between this channel and channel 1 lies in the quantity produced. In this channel, the
production is higher than that in the first channel but lower than the producers in channel 3.
Channel 3: This channel is used by integrated farmer groups. Their production is more
specialized and some groups even engage in value addition. They sell their produce both at the
local and the international market. Production in this channel is on large scale.
Figure 5 shows how mushroom farmers can be categorized into the 3 groups based on their
production strategies. Farmers in the study area producing mushrooms use the first channel for

27
marketing their mushroom. However, farmers who are members of the HAMUSAVI cooperative
use the second channel for marketing their mushroom produce.

28
Mushroom farmers producing associations and
cooperatives.
Individual Mushroom
Producers
Private firms assist in spawn
production and the training
required (1)
Private firms assist in
spawn production and the
training required (2)
The national government
assists in spawn
production and the
training required (3)
Channel 1 for
smallholder farmers
Channel 2 for farmer
groups
Channel 3 for integrated
farmer groups
Mushrooms sales both locally and internationally
Tourists Office workers Special diet customers
Hotels / Restaurants on a
weekly basis
Other Domestic
Markets
Export Market
Figure 5: Mushroom Production and Market Characterization

29
2.4 Theoretical Framework
The theoretical foundation for the adoption analysis is drawn from the agricultural household
model by Singh et al (1986). The model was chosen in this study because it focuses on utility
maximization, given the resources at one’s disposal. In this case, it focused on utility
maximization by the farmers in Western Kenya, based on their subjective decision made to adopt
mushroom production subject to the amount of available family labour to be committed to farm
production in order to satisfy their consumption needs. This model is fundamentally based on
farm operator’s preferences and decisions to maximize utility, based on available cash,
production techniques and time constraints. It is assumed that the farm operator’s utility and
production function depend on personal, farm and community characteristics that affect the
production decisions. The decisions facing the farm operator involve deciding on the amount of
labour to supply to the farm and off the farm, and the amount of other inputs to use or purchase
so as to maximize utility, given prices, off-farm wages, and any other exogenous factors which
shift the production function. Smallholder farmers have a dual character in that they are both
producers and consumers, and the interaction of consumption and production within the
household causes a unique form of decision making which distinguishes smallholder farmers
from any other kind of production unit.
Mas-Colell et al (1995) and McElroy et al (1981) explain how to solve the utility maximization
problem subject to the resources available. The agricultural household model considers 3
commodities that are available to a household: an agricultural staple (Xa), a market purchased

30
good (Xm) and leisure (Xl). We assume that the household is a maximizer of the utility function,
so that:
U= U (Xa, Xm, Xl), (1)
subject to a cash constraint: PmXm = Pa (Q-Xa) – W (L-F)
where,
U = Utility
Pm = Price of the market-purchased commodity and Pa = Price of a staple.
Q = Household production of the staple (Q-Xa is the market surplus)
W = Market wage rate
L = Total labour input in production of Q
F = Family labour input in production of Q (so that if L-F>0, Household hires labour; if L-F<0,
Household supplies off farm labour)
Equation (1) may be restated as:
U = f(Xa, Xm, Xl) (1)
Based on equation 1, a household’s utility is determined by the utility derived from the
agricultural staple which they produce, the utility derived from purchased commodities and the
utility derived from leisure, but it is subject to some constraints: cash constraint, time constraint

31
and production constraint. Cash constraint influences the quantity of the purchased commodity,
thereby influencing the utility derived from the purchased commodity. The higher the market
price of the purchased commodity, the less the quantity to be purchased and thus the utility
derived from it decreases and vice versa.
Consider the time constraint: the household cannot allocate more time to leisure, or farm
production or off-farm employment than the total time available to the household, so that:
Xl + F = T (2)
where,
T = Total stock of household labour time
Xl = Time allocated to leisure
F = Family labour input in production of Q
Time constraint determines production. If a household allocates more time to leisure, then there
will be less time allocated for production so that the quantity produced will decrease, hence
decreasing their utility. A household should allocate their time between leisure, on-farm and off-
farm employment in such a way that the utility derived after this allocation is the maximum
possible given the resources at their disposal.

32
Consider the production constraint: this is the production technology that depicts the relation
between inputs and output, so that:
Q = Q(L,A,K) (3)
where,
A = Households’ fixed quantity of land
K = Capital used in production of Q
L = Total labour input in production of Q
Production constraint is determined by the land and the labour available to the household.
The 3 constraints can be collapsed into one single constraint by substituting the production
constraint into the cash income constraint for Q and substituting the time constraint into the cash
constraint;
PmXm + PaXa + wXl = ∏ + wT (4)
where,
∏= PaQ (L,A,K) – wL
The household’s utility function can be written as a single equation,
Max U=U (Xa,Xm,Xl) s.t. PmXm + PaXa + wXl – PaQ(L,A,K) + wL – wT = 0 (5)
where,

33
PmXm = Value of purchased commodity consumed
PaXa = Value of ‘own’ commodity consumed
wXl = Value of leisure
PaQ(L,A,K) = Market value of Q
wL = Value of total stock of labour in production of Q
wT = Value of total stock of family labour
A household should ensure that they plan their production in such a way as to maximize on their
utility while minimizing as much as possible on the constraints (Inderjit et al. 1986).
Model Assumptions
Assumption 1 specifies that a household can either choose to hire out its labour or use it to carry
out its production activities.
Assumption 2 indicates that there are many risks involved in production and whenever a
household engages in production they should be ready for the risks involved. The household
model was the basis for this study.
Assumption 3 specifies that the household is a price taker, i.e. its activities do not affect the 3
prices in the model, that is Pa, Pm, and w

34
2.5 Conceptualization of Mushroom as a Livelihood Diversification Strategy
This study focused on smallholder farmers in Vihiga County who are assumed to be maximizing
their utility from agricultural production based on the available resources. This conceptualization
is based on the theoretical rationale of the Agricultural Household Model (Karttunen, 2009). The
assumption is that the farmers in the study area want to maximize their utility from what they
produce on their farms, what they purchase and their leisure subject to the money at their
disposal. Livelihood diversification through mushroom production is assumed to ensure that the
farmers increase the utility they derive from the same piece of land through increased incomes.
Figure 6 provides a conceptualization of mushroom production as a livelihood diversification
option for the smallholder farmers in Western Kenya. The figure is adapted from Frankenberger,
et al. (2002) who used it to conceptualize household livelihood security assessments which is
similar to this study’s livelihood diversification option as a way of managing risk.

35
k
Source: Adopted from Frankenberger, et al. (2002)
Institutional Structures and
Processes
Structures
Level of government
Private sector
Civil society
Processes
Laws
Policies
Culture
Social institutions
Vulnerability Context
Shocks and stresses
Economic
Natural
Health
Social
Political
Level of vulnerability
Risk exposure
Resilience
Sensitivity
Livelihood Strategies
Income generating
activities
Risk reduction
strategies
Loss coping strategies
Livelihood Outcomes
Food security
Education security
Health security
Habitat security
Social network security
Environmental security
Personal security
Life skills capacity
Natural assets
Political assets
Financial assets
Social assets
Human assets
Physical assets
Figure 6: Conceptual Framework

36
This study conceptualized livelihood diversification strategies as the process by which
households construct a diverse portfolio of activities to help improve their living standards (Ellis,
2000). Livelihood activities in the study area were mainly agricultural activities, though, some
farmers engaged in other off-farm and non-farm activities. The framework in Figure 6 describes
an approach for understanding the context in which a household pursues its livelihood. The
conceptual framework adopts the sustainable livelihood approach. In practice, livelihood security
and food security are linked. Food production constitutes one of the most basic livelihood
activities, and is a critical source of food access for rural households. The household’s ability to
purchase food in the marketplace is another determinant of food access, but it depends on
household’s ability to generate income. The primary cause of food insecurity is the continued
lack of production of adequate amounts of food or to obtain sufficient income to purchase
adequate amounts of food. A household’s livelihood activities, moreover, enable it to manage
risks, cope with stresses and shocks, and build or replenish assets. The household’s livelihood
security in turn is affected by its food security. Households with poor food access suffer more
from illness or other physical disabilities thereby reducing their productivity. Mushroom
production by a household in this case will ensure that the household has food for consumption
and the extra money obtained from the sale of mushroom will enable the household to access
more food. Therefore, adoption of mushroom production in this case will ensure that a household
is food secure.

37
CHAPTER THREE: METHODOLOGY
3.1 Study Area
Vihiga County was chosen for this study. Respondents were from all the five constituencies
namely; Hamisi, Vihiga, Sabatia, Luanda and Emuhaya.
The county was determined purposively. This was because mushroom cultivation is being
introduced to farmers in the study area both for subsistence and commercial purposes so as to
address the issue of poverty and improved nutrition among the locals. The high population
density in Vihiga County at 1,045 persons per square kilometre and relatively small land size per
household make it difficult to carry out most traditional agricultural practices that have been in
the study area in the past sustainably. The high poverty rate of 41.8%, coupled with 31.5% of the
population being in hard-core poverty compared to a country average of 19.5%, also makes
Vihiga County a good area for research on alternative ways of improving people’s livelihoods
through livelihood diversification (KEBS, 2009).
Vihiga County is an administrative region in the former Western Province of Kenya whose
headquarters are in Mbale, the largest town in the county. The county has a population of
554,622 (2009 census) and an area of 563 km². Vihiga County was split from Kakamega County
in 1990. Vihiga has five constituencies namely: Hamisi, Vihiga, Sabatia, Luanda and Emuhaya.
Vihiga County boarders Nandi County to the East, Kisumu County to the South, Siaya County to
the West and Kakamega County to the North. It is one of the four Counties in the former

38
Western Province. The county lies within an altitude of 1,250-2000m above the sea level. The
average temperature in the county is 22.50 C most of the year.
Figure 7 shows a map of Vihiga County and the Sub Counties where the respondents for the
study were statistically obtained.
Figure 7: A map of Vihiga County

39
3.2 Sampling Procedure and Data Collection
A household in this study was considered to be a person or group of persons, related or
unrelated, who live together and are answerable to the same head and share food. Vihiga County
was purposefully selected for the study. This was because mushroom cultivation is being
introduced in the study area to address the issue of poverty and improved nutrition. The small
land parcels, extreme poverty and poor nutrition also made this area favourable for this study.
Ion the second stage of the sampling, sub counties within Vihiga County were considered in the
survey. In the third stage, a sample of the wards was randomly selected and the respondents were
subsequently selected randomly from these wards.
The respondents were selected through systematic sampling. In areas where the homesteads were
very close together, especially the study areas close to shopping centres and close to the main
road, every 5th
household was interviewed. In areas where the households were sparse, every 3rd
household was interviewed. The main road or a shopping centre was often used as the starting
point. A total of 240 households were interviewed. This sample size provided sufficient
statistical degrees of freedom for policy inferences (Battachanya et al. 1977). Cochran’s formula
was used to calculate the sample size. We assumed that since the technology was in the
introductory stage in the area only 10% of the population had adopted it.
N0 = (-2.53)2 (
0.1)(0.9)/(0.05)2 = 230.4
N0 = Sample size

40
Using Cochran’s formula the sample size was 230, however, a total of 240 households were
interviewed.
The study used both qualitative and quantitative data that were collected in the survey. Part of
the qualitative data was obtained through the focus group discussions (FGDs) with farmers and
an extension officer from the Ministry of Agriculture. Household data was also collected using
semi-structured questionnaires which were administered by trained enumerators. Interviewing
was done at their respective homes to validate some of the responses obtained from the farmers
through the FGD. The data collected included household characteristics, farm characteristics,
farm enterprise investments and non-farm enterprise investments.
3.3 Empirical Analysis
3.3.1 Descriptive Analysis
Descriptive analysis was used to address the first objective. Different socio-economic
characteristics were described using percentages and means while graphs were used to present
the distribution of the various household factors.

41
3.3.2 Empirical Model
Each household was considered to be a utility maximizing unit subject to land, labour and capital
constraints by either choosing to adopt mushroom production or otherwise. The decision made
by the household was considered to be binary; decision to adopt mushroom production or
otherwise. The binary Logit model was chosen because the properties of estimation procedures
are more desirable than those associated with the choice of a uniform distribution (Pindyck and
Rubinfeld, 1991). Utility was determined by a farmer’s decision to engage in mushroom
production or not.
Following Cox (1958), the functional form of logit model was empirically specified as follows:
Ln [Px/(1-Px)]= β0+ β1X1+ β2X2+…………….+ βkXki
where,
i = the ith
observation in the sample
Px = the probability that a household is willing to engage in mushroom production
(1-Px) = the probability of lack of willingness
β0 = the intercept term
β1, β2, ……βk = the coefficients of the independent variables X1, X2,...….......Xk.

42
In this model the dependent variable assumes binary values 0 and 1 wherein adoption of
improved mushroom cultivation has the value of 1 or 0 otherwise. Binary choices are modelled
in terms of probability distribution defined over the set of outcomes (Madalla, 2000).
Yi= {
Yi refers to the binary random variable
where willing to adopt Mushroom production, i refers to “the probability of the ith
farmer
adopting mushroom production” as a livelihood diversification option (1=farmer adopts,
0=otherwise). X represents the vector of factors which were hypothesized to influence farmer’s
probability of willingness to adopt mushroom as a livelihood diversification option. These
factors were hypothesized to include age, gender, marital status, education level, access to
extension services, group membership, group meeting attendance, work status, awareness of
mushroom production, consumption of mushroom, total livestock unit, cropping land total, total
land size, amount spent on farming per month, average acreage under maize production and
average acreage under bean production. The Binomial Logit Model was estimated using
NLOGIT version 4.0 software (Green, 2007).The descriptive results were generated using SPSS
version 16.0 software.
This model has previously been used in some other studies such as by Gislaine et al. (2012) who
were able to establish the factors that influence the adoption of formal and informal mechanisms
using the Binomial Logit analysis. From the results of the study, it was easy to point out the

43
factors that influenced the adoption of both the formal and informal mechanisms in the Minas
Gerais state in Italy.
Odendo et al. (2010) also used Logit analysis to evaluate the factors that determined the
probability of farmers engaging in mushrooms production. The dependent variable was binary,
that is, engaging in mushrooms production or not, and Binary Logit was the model of choice for
the study. This study borrows from Odendo et al’s study in that in both cases the decision made
by the farmer was binary, to engage in production or not. Therefore, this study borrowed the
model used for analysis from Odendo’s et al (2010) studyThe results from this study will inform
policy makers about the factors to target in the study area to encourage the farmers to engage in
mushroom production as a livelihood diversification option.

44
CHAPTER FOUR: RESULTS AND DISCUSSION
4.1 Socio-Economic Characterization of the Respondents
Farmers’ characteristics influence their farming decisions and are an important factor in
understanding decisions related to a household‘s livelihood activities.
4.1.1 Demographic Characteristics
The study defined a household as people living and eating in the same house at the time of the
survey. As shown in Table 1, about two-thirds of the sampled households in the study area were
male headed, with the average age of the household head being 31 years. The sampled
households in the study area had an average of 5 members. The largest sampled household in the
survey had 11 members. The households with only one household member consisted of either
unmarried men or senior citizens who were living alone because the rest of their families were
living either in urban centres or further away from their current location in search of jobs or
education. In all the households, the proportion of women in the household composition was
lower than that of men. For the interviews conducted, most of the respondents were the heads of
the households. About two-thirds of the household heads in the survey were widowed, separated
or divorced. As a result, a big percentage of the children in the study area were being brought up
by single parents or by old relatives who are mostly their grandparents.
Comparisons between farm size and cultivated area indicated that more than half of the land in
the study area was under maize, beans and bananas. This was according to the farmers who

45
attended the FGD. Other crops grown in the study area included sorghum, cassava and sugarcane
which are considered less remunerative than mushroom production. The high potential
agricultural areas in the study area were found to be densely populated with relatively small land
sizes per household. The land sizes were found to have a direct effect on livelihood decisions by
the households in the study area. The regions within the study area where the terrain was not
very rugged and not too rocky were found to be more populated. In Vihiga County, the average
land acreage was 0.7 acres per household which is relatively small. A third of the respondents
were not aware of mushroom production in the study area. However, four-fifths of the
respondents were willing to adopt mushroom production for livelihood diversification purposes,
but less than 3% of the respondents were actively involved in mushroom production. The
majority were thus not involved in mushroom production due to a number of issues that were
raised during the FGD and these included inability to access quality spawn, lack of knowledge
and skills on production and lack of capital. Table 1 shows the distribution of the various
socioeconomic characteristics of the farmers in the study area.

46
Table 1: Distribution of the Socio-Economic Characteristics
Variables % of respondents (n=240)
Gender: Male 52.2
Marital status (married)* 37.6
Famer group membership 21.4
Main Occupation (farming) 40.0
Willing to start production 82.5
Consumption of mushroom 97.9
Awareness of mushroom production in the study area 68.8
Currently grow mushroom 2.5
Previously produced mushroom 9.2
Variables Average (n=240)
Age (years) 30.7
Years of formal learning completed in school 6.9
Number of agricultural meetings attended in the last 12 months 4.0
Total land under crop production (acres) 0.7
Total farm size (acres) 1.0
Livestock equivalent 1.9
Expenditure per household per week (Kshs) 166.7
Farming cost per household per season (Kshs) 4,296.2
Source: Survey Data, 2014
Calculations to generate livestock equivalents were based on FAO (2005) Conversion Factors.
Each of the livestock’s average weight was compared to an average bull weighing 150kg. The
Conversion Factors obtained were: Beef (1.0), dairy cattle (0.68), sheep (0.3), goat (0.3), chicken

47
(0.05), ducks (0.15) and turkeys (0.19). The calculations made it possible for each farmer to get a
single Figure to represent the number of livestock owned.
4.1.2 Social and Human Capital
Livelihood activities in the study area mainly focused on agricultural activities although some
farmers also engaged in other off-farm and non-farm activities. As shown in Table 1, less than a
quarter of the respondents belonged to farmer groups. This factor has a great effect on projects
that have been initiated in the study area that mostly target people who are in development
groups and leave out people not in groups. These projects mostly end up unsuccessful because
they target only a small percentage of the population. The average number of agricultural
meetings attended per year was 4. As noted, only 21% of the respondents were in farmer groups.
Since the channel that was mostly used for dissemination of information was farmer group
meetings, only the people in groups obtained information directly from the source. Therefore, the
majority of the farmers received information from the farmers in these groups, and as such
information could be distorted, thus making it difficult for people not in groups to embrace the
new projects for lack of proper information on new technologies in the study area.
Education has always been found to have an impact on economic growth. Lack of education has
a detrimental effect on the society at large. From the study, the average years of formal education
was 7 years. This means that most of the people had access to primary school education, but only
few made it past this stage. For projects to be successful in the study area, it necessitates

48
undertaking of awareness campaigns on the importance of being members of development
groups. This is because of the benefits that come as a result of group membership that include
timely dissemination of information, provision of loans to improve agricultural production,
participation in both government and non-governmental projects and participation in field days
which enables the farmers to get practical skills on production. The farmers in Vihiga County
mostly relied on government extension services. However, from the findings of this study,
farmers complained of lack of adequate access to these services to the level they would have
wanted. This is consistent with Muyanga et al (2006) findings that cited poor extension services
in Kenya, indicating that the extension service sector in Kenya was underperforming. This study
shows that most of the people in Vihiga County depended on agricultural production for their
livelihood. On average, the total amount of land owned by each household was 1 acre which is
quite small for farming, since, the homestead and pasture land were included in that acreage.
4.1.3 Mushroom Production
Majority of the respondents (68.8%) were aware of mushroom production in the study area, but
only 2.5% of them produced mushroom, as shown in Table 1. Mushroom was being consumed
by nearly all of the interviewed households; this means that there is a demand for the commodity
in the study area. There is a mushroom deficit brought about by the decline in the availability of
the traditional mushroom variety. All the people engaging in mushroom production in the study
area were producing the Oyster variety, because it is the one that was introduced in the study
area by the ministry of agriculture. In other parts of Kenya the Button variety is mostly produced.
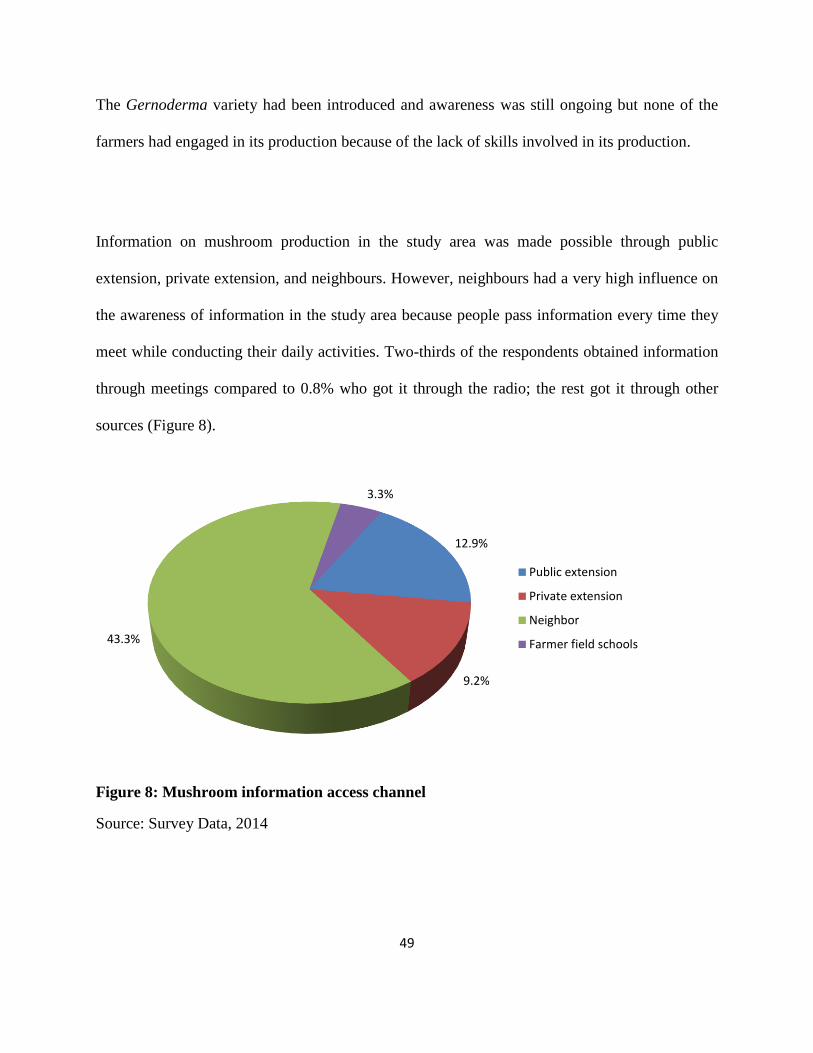
49
The Gernoderma variety had been introduced and awareness was still ongoing but none of the
farmers had engaged in its production because of the lack of skills involved in its production.
Information on mushroom production in the study area was made possible through public
extension, private extension, and neighbours. However, neighbours had a very high influence on
the awareness of information in the study area because people pass information every time they
meet while conducting their daily activities. Two-thirds of the respondents obtained information
through meetings compared to 0.8% who got it through the radio; the rest got it through other
sources (Figure 8).
Figure 8: Mushroom information access channel
Source: Survey Data, 2014
12.9%
9.2%
43.3%
3.3%
Public extension
Private extension
Neighbor
Farmer field schools

50
Meetings were the most common channel used to pass information; these included group
meetings, chief’s barazas and informal meetings that involved neighbours meetings to share
information on production matters or friends meeting to discuss matters that they perceived
important for agricultural production. Less than 10% of the people currently not producing
mushrooms have previously been involved in production. Those that stopped did so mainly
because of poor access to inputs and lack of credit. The study shows that people who have not
been involved in production were willing to start production mainly for home consumption and
as a way to diversify their sources of income. Such people were of the opinion that mushroom
production in the study area would be an alternative income source which would improve their
welfare and livelihoods. In the study area, most farmers cited poor extension services as one of
the challenges to mushroom production.
Most of the farmers in the study area cited challenges related to production and institutional
factors that affect their current livelihood activities. Such challenges led to the decline in
mushroom production, with some farmers completely abandoning mushroom production. This
finding is consistent with the challenges cited by KNBS (2012). The above results show that
there are livelihood challenges in the study area that call for policies that support alternative and
effective livelihoods to assist the farmers exit the poverty web.
4.1.4 Livestock Ownership
Table 2 shows the average livestock numbers that were kept by each respondent. It shows that
farmers in the study area were engaging in different livestock production options to try and

51
increase their income, spread risks and improve their livelihoods. This shows that the farmers in
the study area understand the concept of livelihood diversification.
Table 2: Livestock Ownership (n = Number of respondents keeping them)
Types of Livestock Lowest Mean Highest
Local dairy cow (n=171) 0 2 7
Exotic dairy cow (n=46) 0 2 5
Local bull (n=28) 0 1 3
Exotic bull (n=7) 0 1 2
Local dairy goat (n=43) 0 2 4
Exotic dairy goat (n=2) 0 2 3
Chicken (n=221) 0 10 32
Source: Survey Data, 2014
4.1.5 Crop Production Trend
Figure 9 outlines the land acreage versus the crops grown for maize, beans, bananas and sweet
potatoes which were the main crops grown in the study area from 2012 to 2014. However, there
were some other crops grown in the study area which included sorghum, sugarcane and cassava.
Given an average land holding of 0.7 acres in the study area, the crops grown require more land
for profitable production and hence were not yielding much returns. Most of the farmers in the
study area did not follow the recommended agronomic practices especially with regard to
spacing. They planted more crops than the recommended as they tried to maximize on the
available spaces. Most farmers also depended on animal dung and mulch as a source of

52
fertilization for their farms. This meant that the soil did not have much of the required nutrients
for maximum productivity. Despite the fact that the acreage allocated for maize increased (as
shown in Figure 9) in the three years under study, the yield (as shown in Figure 10) continued
dropping. Given that 40% of the households depended on farming as their main source of
income, many households were adversely affected by the decrease in maize production because
it is the enterprise that is depended on mostly by people in the study area.
Figure 9: Crops grown against land acreage per year
Source: Survey Data, 2014
Figure 9 above shows how the land allocated for maize production dropped slightly to 0.28 acres
in 2013 from 0.30 acres in 2012 but rose significantly to 0.48 acres in 2014, possibly to cater for
the needs of the increasing population. A project that was found to be ongoing during the period
of this study was the banana project. Farmers were being encouraged by agricultural officers
from the County office to grow bananas instead of maize because of the expected high return

53
from bananas compared to that from maize per unit piece of land. Bean acreage went down to
0.25 acres in 2013 compared to 0.55 acres in 2012, but went up to 0.28 acres in 2014.
Figure 10 shows the average yield in kilograms for maize, beans, bananas and sweet potatoes
from 2012 to 2014. Within the period under review, the yield of these four staples in the study
area has consistently been dropping despite the increasing population.
Figure 10: Crops grown against the yield per year
Source: Survey Data, 2014
Banana production and yield also went significantly down over the 3 years as shown in Figures 9
and 10. Most respondents attributed this to the fact that banana requires quite some time before
maturity. Most of them preferred crops that mature faster to assist them provide food for their
families within short periods of time. Sweet potato production has been increasing because most

54
farmers view the crop as a viable enterprise because it can be grown on the rugged terrain. It
thrives well in that ecological region.
The above results show that there are livelihood challenges that call for policies that support
alternative and effective livelihoods to assist the farmers exit the poverty web. These findings are
consistent with Ochieng (2014) findings which show that there is need for the farmers to add
other livelihood diversification options to their portfolio so as to reduce the shocks created by
economic challenges facing their current livelihood activities.
Challenges such as unpredictable climate, lack of crop rotation that leads to soil exhaustion
(maize is the crop mostly grown), decreasing soil fertility, rocky and rugged terrain, crop pests
and diseases were identified from the FGD (focus group discussion) as the most binding
constraints to livelihood diversification. Few extension workers in the study area, the inability of
farmers to access production information due to the fact that ICT use in this area is very
insignificant, small land acreage, agriculture being mostly for subsistence and not commercial
purposes, overdependence on donor funding, delayed planting, theft, lack of irrigation systems in
the study area, poor dissemination of agricultural technologies, too many enterprises on small
pieces of land and use of traditional methods of farming were also identified as challenges to
agricultural performance in the study area.

55
4.2 Assessment of the factors that influence smallholder farmers’ willingness to
diversify into mushroom production as a livelihood diversification option.
Table 3 shows the variables that were used in the binomial logit model for analysing the farmers’
willingness to adopt mushroom production as a livelihood diversification option and also the
results of the analysis.
The factors that were found to have a significant effect on farmers’ willingness to adopt
mushroom production as a livelihood diversification option were age, gender, marital status,
work status, availability of a mushroom market in the study area, total cropping land and the total
amount of money spent on farming per season.

56
Table 3: Determinants of Farmers’ Willingness to Diversify into Mushroom Production
Coeff. Std. Err. Z P>|z|
Age 0.09** 0.04 2.01 0.05
Gender 2.10** 1.05 2.01 0.05
Marital status -2.47* 1.40 -1.77 0.08
Work status -2.09* 1.17 -1.79 0.07
Log of group meetings 0.15 0.38 0.39 0.69
Highest school grade 1.19 0.91 1.31 0.19
Awareness of mushroom production 0.06 0.92 0.07 0.94
Mushroom consumption 0.37 1.80 0.20 0.84
Availability of mushroom market 2.20*** 0.87 2.55 0.01
Land under crop production -2.92* 1.60 -1.82 0.07
Total land owned (acres) 1.53 1.33 1.15 0.25
Total livestock unit -0.19 0.28 -0.70 0.49
Total amount spent on food per week -0.00 0.00 -1.02 0.31
Total amount spent on farming 0.00* 0.00 1.70 0.09
Average acreage under beans 3.77 2.80 1.35 0.18
Constant -7.34*** 2.90 -2.53 0.01
Note: *** Significant at 1%, ** Significant at 5%, * Significant at 10%
Pseudo R2 = 0.3789
Source: Survey Data, 2014
Using the binomial logit analysis on the survey data, the study found a strong positive
relationship between smallholder farmers’ willingness to adopt mushroom production as a

57
livelihood diversification option and age, gender, log of group meetings, highest grade of
education, awareness of production, consumption of mushroom, total land owned in acres, total
amount of money spent on farming per season and average land acreage. The study also found
that smallholder farmers’ willingness to adopt mushroom as a livelihood diversification option is
negatively affected by marital status, work status, total land under cropping, total livestock unit
owned and total amount of money spent by a household on food per week.
Age was found to have a positive effect on willingness to start mushroom production. The older
people were willing to start mushroom production mainly because it was not considered as an
enterprise that requires a lot of energy. In fact there was lobbying in the study area for people
with disabilities to engage in mushroom production because it is the enterprise is considered not
to be labour intensive. The old people are mostly placed in this category because of the lack of
energy to engage in labour intensive activities. This result supports the findings by Olale et al.
(2010) and Wanyama et al. (2010) who found that the households’ experience of livelihood
diversification options and the desire to diversify increase with age. A group of people living
with disabilities in Hamisi was found to be engaging in mushroom production as a group
venture. Gender was also a positive factor in the willingness of farmers to engage in mushroom
production. More men were willing to start mushroom production compared to women. Being
the bread winners in most families, men were more willing to engage in enterprises that would
be considered as income sources so as to supplement their income. Marital status had a negative
effect; the household heads that were not married were more willing to engage in mushroom

58
production because they are considered as the sole bread winners in their families and were thus
more willing to engage in enterprises that can give a higher pay-off.
Households with farming as the main source of income were more willing to engage in
mushroom production than the households that had other alternative sources of income, for
example, the households engaging in business and those with members having off-farm
employment. The more educated respondents were willing to engage in mushroom production.
Perhaps this was because it is often assumed that the more educated people are more risk loving.
Most educated people, for example the teachers and the people working in the county office,
were willing to engage in risky ventures whose pay-off is high. The educated people were found
to have several diversification options in their portfolio. This finding supports the findings of
positive influence of education on livelihood strategy diversification from other studies, such as
Olale et al. 2010.
Consumption of mushroom had a positive effect. This is the case because of the awareness of the
mushroom market in the study area, in which the current supply does not meet the demand.
Cropping area had a negative effect. The larger the acreage under cropping, the less likely the
farmer was willing to engage in mushroom production. This is mostly because most farmers with
large pieces of land already have their mind set to production of a given type of crop mainly
maize, beans, sweet potatoes and bananas, and they will have specialized in these crops.
Therefore, they will not be willing to engage in other enterprises. Total amount of money spent

59
on purchasing food per week had a negative effect. The higher the amount of money spent on
food per week, the less likely the farmer was willing to engage in mushroom production.
Families that spend less money on food per week were willing to engage in the production of
mushroom. This is because such families mostly depend on consuming what they produce on
their own farms. Since mushroom is grown for both subsistence and commercial purposes,
poorer families would engage in it so as to get food for consumption and also make some money
to purchase what they lack.

60
CHAPTER FIVE: SUMMARY, CONCLUSIONS AND RECOMMENDATIONS
5.1 Summary
The study focused on the assessment of the willingness of smallholder farmers in Vihiga County
to adopt mushroom production as a livelihood diversification option. Its purpose was to analyze
the factors that influence the farmers’ willingness to adopt mushroom production as a livelihood
diversification option using the binomial logit model. Data was collected from 240 farmers.
Empirical results indicated that age, gender, log of group meetings, highest grade of education,
awareness of production, consumption of mushroom, total land owned in acres, total amount of
money spent on farming per season and average land acreage under crop production had a
positive effect on farmers’ willingness to adopt mushroom production as a livelihood
diversification option. Marital status of the household head, work status, total land under
cropping, total livestock units owned and total amount of money spent by a household on food
per week had a negative effect.
5.2 Conclusions
From this study, it was concluded that diversification is vital for the well-being of the small-scale
farmers in Western Kenya, and that mushroom production as a livelihood diversification option
should be promoted for adoption by the farmers in Vihiga County given the land and topographic
challenges in the region. Factors such as age, gender, work status and availability of a mushroom
market should be considered when designing policies to promote adoption of mushroom as a
livelihood diversification option for smallholder farmers in Vihiga County. Some farmers in the

61
study area were not actively engaged in groups, such as being members of a development group,
thus enhancing their social capital. This factor negatively affected their access to important
production information.
This study supports the findings by Asfaw et al. (2018) on the diversification drivers which
include promotion of local crops, like mushroom in this case, which enhance household welfare.
Therefore, smallholder farmers in the study area should be encouraged to diversify and engage in
enterprises such as mushroom production, which help in improving their welfare.
5.3 Recommendations
Age and gender as attributes that are usually used by stakeholders in getting target population
during the campaigns for the awareness of new production techniques should be given much
focus in the study area. Development programs being introduced in the study area should mostly
target the youth because most of the people currently living in the study area are aged between
19 and 35 years. Women in the study area should be targeted in mushroom awareness and
production campaigns.
Awareness campaigns need to be done by the stakeholders in the agricultural sector in Vihiga
County of Western Kenya region to educate the farmers on the importance of diversification to
reduce the risks associated with agricultural production. Currently, most farmers in Vihiga

62
County are aware of mushroom production and market in the study area, but they are not actively
engaged in its production.
The Ministry of Agriculture and the development partners in Vihiga County should promote
policies and projects that will substitute maize production in favour of other viable commercial
enterprises such as mushroom production that will enable the farmers to earn more income which
they can in turn use to purchase the maize they require for food from other regions where maize
production is favourable.
Mushroom production could be used to achieve the Food and Nutrition Security Policy (FNSP)
objectives which are: achievement of good nutrition for optimum health, increasing the quantity
and quality of food available and protecting the vulnerable populations. This would be achieved
through coming up with mushroom awareness and promotion campaigns in areas with land as a
constraint to production like Vihiga County
5.4 Limitation of the Study
Farmers in the study area kept very little or no records on their farm and non-farm enterprise
activities. This meant that most of the data collected for the study was mainly based on farmer’s
memory recall. However, this limitation was overcome by engaging the farmers in lengthy
discussions on their production over time in order to improve on memory recall and come up

63
with reasonable figures for their production over the period under study. Farmers should be
encouraged to keep proper production records so as to assist in future research on production.
5.5 Suggestion for Further Research
This study focused on the assessment of the farmers’ willingness to engage in mushroom
production as a livelihood diversification option for farmers. Future research could be done on
different production mixes for farmers in different areas with different land challenges in order to
come up with the most profitable mix for the different farmers in Western Kenya and elsewhere.
As an extension of the study, and given the decreasing land sizes that necessitate diversification
in the country, more research should be done on livelihood diversification for farmers in
different areas so as to come up with the best production mix that would help address nutrition
and poverty for farmers in different areas.

64
REFERENCES
Abdul-Hakim, R. and Che-Mat, S. (2011). Does farmer’s diversification into Non-farm
employment reduce their likelihood of Poor? Evidence from Malaysia. Journal of
Business and Policy Research. 16 (1):Pp145-155.
Amare, M. and Bekele, S. (2017). Nonfarm employment, agricultural intensification, and
Productivity change: empirical findings from Uganda. Agricultural Economics. 48:
Pp 59-72.
Asfaw, S. Pallante, G. and Pala, A. (2018). Diversification Strategies and Adaptation Deficit:
Evidence from Rural Communities in Niger. World Development. 101: Pp 219 – 234.
Battacharya, G. and Johnson, R. (1977). Statistical Concepts and Methods. New York: J. Wiley
and Sons https://doi.org/10.1002/bimj.4710220411
Barrett, C. Bezuneh, M. and Aboud, A. (2001). Income Diversification, Poverty traps And Policy
Shocks in Cote d’Ivoire and Kenya. Food Policy, 26(4):367–384.
Chambers, R. (1997). Whose Reality Counts: Putting the First Last, London. Pp (162-187).
Cox, D. (1958). The Regression Analysis of Binary Sequences (With Discussion). J Roy
Statistics Society B. 20: Pp215-242.
Delgado, C. and Siamwalla, A. (1997). Rural Economy and Farm Income Diversification In
Developing Countries. MSSD Discussion paper no. 20, International Food Policy
Research Institute, Washington, D.C.
https://ageconsearch.umn.edu/bitstream/91855/2/pubs_divs_mtid_dp_papers_dp20.pdf
Ellis, F. (1997). Household Strategies and Rural Livelihood Diversification. Journal of
Development Studies. 40 (4). Pp 1-38.

65
Ellis, F. (1998). Household Strategies and Rural Livelihood Diversification. Journal of
Development Studies, 35 (1):1–38.
Ellis, F. (2000). The Determinants of rural Livelihood Diversification in Developing Countries.
Journal of Agricultural Economics, 51(2):289 – 302.
Ellis, F. and Allison, E. (2004). Livelihood Diversification and Natural Resource Access. LSP
Working Paper 9, UN Food and Agriculture Organization (FAO), Livelihood Support
Programme (LSP). http://www.fao.org/3/a-ad689e.pdf
Ellis, F. and Freeman, H. (2005). Rural Livelihoods and Poverty Reduction Policies. London:
Routledge.
https://www.researchgate.net/publication/44834223_Rural_Livelihoods_and_Poverty_Reduc
tion_Policies
Everett M. (2003). Diffusion of Technologies, Fifth Edition.
FAO, IFAD and WFP (2014). The State of Food Insecurity in the World. FAO, Rome (2014)
http://www.fao.org/3/a-i4030e.pdf
Frankenberger, R., Luther, K., Bacht, J. and McCaston, M. (2002). Household Livelihood
Security Assessments: A Toolkit for Practitioners, Prepared for the PHLS Unit by: TANGO
International Inc., Tucson, Arizona 2002.
https://www.alnap.org/help-library/household-livelihood-security-assessments-a-toolkit-for-
practitioners
Gateri, M. (2012). The untapped mushroom potential; Hortfresh Journal. May-June 2012. Pp 16-
17.

66
Gautam, Y. and Anderson, P. (2016). Rural livelihood diversification and household well-being:
Insights from Humla, Nepal. Journal of Rural Studies. 44:Pp 239-249.
Gecho, Y., Ayele, G., Lemma, T. and Alemu, D. (2014). Rural Household Livelihood Strategies:
Options and Determinants in the Case of Walaita Zone, Southern Ethiopia. 3: Pp 91-104.
Gislain, G. Cristina, L. and Luiz, M. (2012). Adoption of Regulation Mechanisms in the
Productive Chain of Milk: An Analysis Based on Internal Factors of Companies.
Organizações Rurais & Agroindustriais, Lavras. 14 (2): Pp. 286-295.
Gordon, A. and Pulis, A. (2010). Livelihood Diversification and Fishing Communities in
Ghana’s Western Region. USAID Integrated Coastal and Fisheries Governance Initiative
for the Western Region, Ghana. Pp 68.
GoK. (2007). Kenya Vision 2030. Nairobi: Ministry of Finance and Planning. Nairobi:
Government Printer.
https://theredddesk.org/sites/default/files/vision_2030_brochure__july_2007.pdf
Green W. (2007). LIMDEP version 9.0/NLOGIT version 4.0 Econometric Modelling Guide,
Econometric software. New York: Plainview.
Hussein, K. and Nelson, J. (1998). 'Sustainable Livelihoods and Livelihood Diversification', IDS
Working Paper 69. https://www.ids.ac.uk/files/Wp69.pdf
IFAD ( 2010). IFAD Rural Poverty Report. https://www.odi.org/projects/1434-ifad-rural-
poverty-report-2010
Iiyama, M., Kariuki, P., Kaitibie, S., Kristjanson, P. and Maitima, J. (2008). Livelihood
Diversification Strategies, Incomes and Soil Management Strategies: A Case Study From

67
Kerio Valley, Kenya Journal of International Development Published online 21
November 2007 in Wiley Inter Science. Pp 380-397.
Inderjit, S. Squire, L. and Strauss, J. (1986). Agricultural Household Models: Extensions,
Applications and Policy. The John Hopkins Univ. Press, 335pp.
Isikhuemhen, O. Nerud, F. and Vilgalys, R. (2000). Cultivation studies on wild and hybrid
strains of Pleurotus spp on wheat substrate. World Journal of Microbiology and
Biotechnology; 16: Pp 431 – 435.
Jabbar, M., Bayene, H. Mohamed-Saleen, S. and Gabreselassie, S. (1998). Adoption Pathways
for New Agricultural Technologies: An Approach and an Application to Versitol
Management Technology in Ethiopia. Livestock Policy Analysis, Brief no. 16.
Karttunen, K. (2009). Rural income generation and diversification. A case study in Eastern
Zambia.
https://www.researchgate.net/publication/47932460_Rural_Income_Generation_and_Div
ersification_A_Case_Study_in_Eastern_Zambia
Karugia, T., Oluoch-Kosura W., Nyikal R., Odumbe M. and Marenya P. (2006). Access to Land,
Income Diversification and Poverty Reduction in Rural Kenya.
http://erepository.uonbi.ac.ke/bitstream/handle/11295/16753/Access%20to%20land.pdf?s
equence=1
Kenya National Bureau of Statistics. (2009). Kenya Population and Housing Census Results,
Nairobi, Kenya: Kenya National Bureau of Statistics.
Kenya National Bureau of Statistics, (2010). Kenya Population and Housing Census Results,
Nairobi, Kenya: Kenya National Bureau of Statistics.

68
Kenya National Bureau of Statistics, (2012). Kenya Population and Housing Census Volume A:
Population by Administrative Units, Nairobi, Kenya: Kenya National Bureau of
Statistics.
Kenya National Bureau of Statistics, (2015). Kenya Population and Housing Census Results,
Nairobi, Kenya: Kenya National Bureau of Statistics.
Kelsey, J. B. (2013). “Constraints on the adoption of agricultural technologies in developing
countries.” Literature review, Agricultural Technology Adoption Initiative, J-PAL (MIT)
and CEGA (UC Berkeley).
https://www.povertyactionlab.org/sites/default/files/publications/ATAI%20Review%20P
aper%20May%202013.pdf
Khatun, D. and Roy, B. (2012). Rural Livelihood Diversification In West Bengal: Determinants
and Constraints. Agric. Econ. Res. Rev. 25(1):115-124.
Kimenju S. and Tschirley D. (2008). Agriculture and Livelihood Diversification in Kenyan Rural
Households.
https://www.researchgate.net/publication/268298097_Agriculture_And_Livelihood_Dive
rsification_In_Kenyan_Rural_Households
Kirimi, L., Sitko, N., Karin, F., Muyanga, M., Sheahan, M., Flock, J., and Bor, G.B. (2011). A
Farm Gate-To-Consumer Value Chain Analysis of Kenya’s Maize Marketing System. Pp
1-2.
Lamb, W. D. McCord, F. and Adams, P. (2008). Improving Pathways to Adoption: Putting the
right P’s in Precision agriculture. Computers and electronics in agriculture. 61. Pp 4–9.
69
Lanjouw, P. (2013). Non-Farm Diversification, Poverty, Economic Mobility and Income
Inequality: A Case Study in Village India. World Bank Policy Research Working Paper
No. 6451.
Loison, S. (2015). Rural Livelihood Diversification in Sub-saharan Africa: A Literature Review.
The Journal of Development Studies. Pp 1125-1138.
Lowry, P.B Gaskin, J. Twyman, N. Hammer, B. Roberts, T. (2012). Taking ‘Fun and Games’
Seriously: Proposing the Hedonic-Motivation System Adoption Model (HMSAM).
Journal of the Association for Information Systems. 14 (11): 617-671.
Maddala, G. (2000). Introduction to econometrics (3rd
Edition) New Jersey: Prentice–Hall Inc.
Marenya, P., Oluoch-Kosura, W., Place, F. and Barrett, C. (2003). Education, Non-farm income
and farm investments in land scarce Western Kenya.
http://erepository.uonbi.ac.ke/handle/11295/49925?show=full
Mas-Colell, A., Whinston, M. and Green, J. (1995). Microeconomic Theory. Oxford: Oxford
University Press. ISBN 0-19-507340-1.
Muyanga, M. and Jayne, T. (2006). Agricultural Extension in Kenya: Practice and Policy
Lessons. Tegemeo Working paper 26/2006. Tegemeo Institute of Agricultural Policy and
Development, Egerton University, Kenya.
www.oerafrica.org/ResourceDownload.aspx?assetid=2325
Ochieng’, J. (2014). Analysis of Smallholder Farmers’ Awareness Preferences for Biofuel
Investments for Livelihood Diversification in Kenya. Masters’ Thesis.
Odendo, M., Kirigua, V., Kimenju, J., Wasilwa, L., Musieba, F. and Orina, M. (2010). Analysis
of Mushroom Value Chain in Kenya. Nairobi: Kenya Agricultural Research Institute.

70
Olale, E. Henson, S. and Cranfield, J. (2010). Determinants of Income Diversification among
Fishing Communities in Western Kenya. Selected Paper prepared for Presentation at the
Agricultural and Applied Economics Association 2010 AAEA, CAES, and WAEA Joint
Annual Meeting, Denver, Colorado, July 25-27, 2010.
Oleg, V. (2010). Diversification and Livelihood Activities in Ghana’s Households: Effects of
HIV, Stress and Selected Socioeconomic Factors.
Oluoch-Kosura, W., Marenya, P., Place, F. and Barrett, C. (2004). Indices and Manifestations of
Poverty: Informing Anti-Poverty Policy Choices. A paper for bridging Qualitative and
Quantitative methods of poverty analysis workshop, hosted by KIPPRA, Nairobi, Kenya,
March 11, 2004.
McCord, P. Cox, M. Schmitt-Harsh, M. and Evans, T. (2015) Crop Diversification As A
Smallholder Livelihood Strategy Within Semi-Arid Agricultural Systems Near Mount
Kenya. Land Use Policy. 42 : Pp738-750.
McElroy, B. and Horney, M. (1981). International Economic Review. 22 (2): Pp 333-349.
Pindyck, R. and Rubinfeld, D. (1991). Econometric Models and Economic Forecasts.
https://trove.nla.gov.au/work/2169631?q&sort=holdings+desc&_=1551881300022
Ram, S. Bishnoi, D. and Singh, A. (2010). Cost Benefit Analysis and Marketing of Mushrooms
in Haryana. Agricultural Economics Research Review. 23(1). Pp 165-171.
Reardon, T. Delgado, C. and Matlon, P. (1992). ‘Determinants and Effects of Income
Diversification Among Farm Households in Burkina Faso’, The Journal of Development
Studies. 28 (2): Pp 264-296.

71
Rider, S. Gordon, A. Meadows, K. and Zwick, K. (2001). Livelihood Diversification in Uganda:
Patterns and Determinants of Change Across Two Rural Districts. Food Policy,
26(4):421–435.
Scherer, M. J. and Craddock, G. (2002). The Assessment of Assistive Technology Outcomes,
Effects and Costs. Technology and Disability. 14 (3): Pp. 125-131.
Shiferaw, B., Kebede, T., Kassie, M. And Fisher, M. (2015). Market Imperfections, Access To
Information And Technology Adoption In Uganda: Challenges Of Overcoming Multiple
Constraints. Agricultural Economics. 46: Pp 475–488.
Shih, H. P. (2004). Extended Technology Acceptance Model of Internet Utilization Behavior.
Information Management. 41(6): Pp 719-729.
Singh, I. Squire, L. and Strauss, J. (1986). Agricultural Household Models: Extensions,
Applications and Policy, Baltimore: John Hopkins University Press.
Tibrichu, H. and Buykusenge, M.R. (2014). Enterprise Network Mapping Study in Rwanda. The
Journal of Peasant Studies. 41( 3) : Pp 365-384
UNCTAD. (2000). World Investment Report. Cross-border Mergers and Acquisitions and
Development. United Nations Conference on Trade and Development, New York and
Geneva.
Valbuena, D. Groot, J. and Mukalama, J. (2014). Improving Rural Livelihoods as a “Moving
Target”: Trajectories of Change in Smallholder Farming Systems of Western Kenya.
Regional Environmental Change. 15(7): Pp 1395–1407
Von, B. and Pandya-Lorch, R. (1991). Income sources of malnourished people in rural areas: a
synthesis of case studies and implications for policy. Washington D. C.

72
International Food Policy Research Institute (IFPRI). Working papers on commercialization of
agriculture and Nutrition. 5: Pp 1-46.
Wanyama, M., Mose, L. O., Odendo, M., Okuro, J. O., Owuor, G. and Lutta, M. (2010).
Determinants of income diversification strategies amongst rural households in maize
based farming systems of Kenya. African Journal of Food Science. 4 (12), Pp. 754-763
World Bank, (2007). Ghana: Meeting the Challenge of Accelerated and Shared Growth. Country
Economic Memorandum Report No. 4093-GH. Presented at the June 18–19, 2007
Consultative Group meeting.
Yazan, E. Nyariki, D. Wasonga, V. and Ekaya, W. (2012). Factors Influencing Transient
Poverty among Agro-Pastoralists in Semi-Arid Areas of Kenya. African Crop
Science Journal. 20 (s1): Pp. 113 – 122.

73
APPENDICES
Appendix 1: Focus Group Discussion Questions.
University Of Nairobi
An Assessment of Factors Influencing Smallholder Farmers’ Adoption of Mushroom for
Livelihood Diversification in Vihiga County, Kenya
Focus Group Discussion Questionnaire
July, 2014
The purpose of this focus group discussion is to obtain preliminary insights on livelihood
strategies and how mushroom could possibly serve as an alternative livelihood option.
Checklist for discussion
1. What are the general livelihood activities in this area and what are the main challenges faced.
2. Are you aware of mushroom production in the study area?
3. If mushroom production is introduced in this area, are you willing to adopt it as a livelihood
diversification option?
4. What are the main challenges facing mushroom farmers in the study area?

74
Appendix 2: Household Survey Questionnaire
University Of Nairobi
Faculty Of Agriculture
Department Of Agricultural Economics
July, 2014
An Assessment of Factors Influencing Smallholder Farmers’ Adoption of Mushroom for
Livelihood Diversification in Vihiga County, Kenya
Introduction
Dear Sir/ Madam,
The University of Nairobi, Department of Agricultural Economics is conducting a research on
livelihood diversification in Vihiga County, Kenya. The District Agricultural officer has granted
us permission to conduct this survey on farmers. The objective of this study is to analyze the
factors influencing the adoption of mushrooms for income diversification in Vihiga County .
The findings will offer important insights to assist farmers identify the most cost effective
channels for production and marketing of mushroom. It may also assist the government and
policy makers in structuring policies that will favor mushroom production in Vihiga County and
help inform policies that will lead to the improvements in the livelihoods of the people of this
area. This study targets farmers who are 18 years and above in these county. A total of 240

75
farmers will be interviewed randomly. The information gathered here will strictly be confidential
and used for purposes of policy making.
I would like you to be one of the respondents of this survey. Can I interview you?

76
Questionnaire number ……….. Date of interview………………………………
Name of enumerator …………………………………………………………….
Start time……………………… End time………………………………………
Division …………………………. Location …………………………………………
Sub location ……………………… Village……………………………………………
Name of respondent……………………………………………………………………
Mushroom production
1. Are you aware of mushroom production in this location? (a) Yes (b) No
2. How did you become aware of mushroom production in the study area?
a) Public Extension
b) Private extension
c) Neighbours
d) Farmer field schools
e) Others
3. What was the channel used to get the information?
a) Television e) Newspaper
b) Radio f) Notice board
c) Phone g) Billboard

77
d) Internet h) Others
4. Do you consume mushrooms? (a) Yes (b) No
5. Do you grow mushrooms (a) yes (b) No
6. If yes, which type?
a) Shitake
b) Oyster
c) Button
d) Local variety (specify)
e) Others
7. a) What are the production challenges?
Production
challenge
Very
important
Important Not
important
Poor access
to inputs
Lack of
markets
Crop pest
and
diseases
Lack of
credit
Lack of
skills
Others
b) Who are the main buyers?

78
Main buyer Kgs sold
Local market (specify)
Open air, Kiosk etc
Middlemen
Processors
Exporters
Group
Restaurant
Neighbours
Others(specify)
c) Do you plan to continue growing mushrooms? (a) Yes (b) No
If yes, why?
a) Profitability
b) Income diversification
c) Home consumption
d) Others
If no, why?
a) Lack of skills
b) Lack of markets
c) Lack of access to credit
d) Lack of access to buyers

79
8. Do you carry out value addition on the mushrooms after harvesting?
a) Yes
b) No
9. If yes, what type of value addition do you practice?
a) Drying
b) Refrigeration
c) Making powder
d) Packaging
10. How do you reach the buyers?
a) The pick the produce at the farm
b) Personal means (specify)
c) Public transport (specify)
d) Others
11. Do you think there is a market for mushrooms in the study area?
(a) Yes (b) No (c ) Don’t know
12. If No, have you been previously involved in mushroom production? (a) Yes (b) No
a) If yes, why did you stop?
Production
challenge
Open answer
Poor access to
inputs

80
Lack of markets
Crop pest and
diseases
Lack of credit
Lack of skills
Others
b) If No, why?
Production
challenge
Open answer
Poor access to
inputs
Lack of markets
Crop pest and
diseases
Lack of credit
Lack of skills
Others
c) Are you willing to start growing mushrooms in the near future? (a) Yes (b) No
If yes why?
a) Profitability
b) Income diversification
c) Home consumption
d) Others
13. Have you ever accessed credit for mushroom production?
a) Yes
b) No

81
14. What was the source of the credit?
a) SACCO d) Farmer group
b) Bank e) Friend
c) Microfinance institution f) Others
15. What was the use for the credit?
a) Input acquisition
b) Value addition
c) Others
Land Ownership and Use
Category Total
land
size
Owned Rented Borrowed
Crop
production
Livestock
production
Residential
land
Idle land
Total farm
size
Livestock (Currently owned)
Livestock Quantity
owned
Sold
(last 12
months)
Price
of
each
Total
amount
1. Local
dairy cow

82
2. Exotic
dairy cow
3. Local
bull
4. Exotic
bull
5. Local
dairy goat
6. Exotic
dairy goat
7. Local
buck
8. Exotic
buck
9. Local
sheep
10. Exotic
sheep
11.
Donkey
12.
Chicken
13. Ducks
14.
Turkeys
14.
Others
(specify)

83
Weekly expenditure and Consumption
Commodity Amount produced from
farm
Amount sourced outside
farm
Grains (specify)
Vegetables
Fruits
Meat(fish,beef,
chicken etc)
Root tubers
Others (specify)
Expenditure Amount
Airtime
Education
Farming
Utilities(water,
electricity)
Remittances
Others (specify)
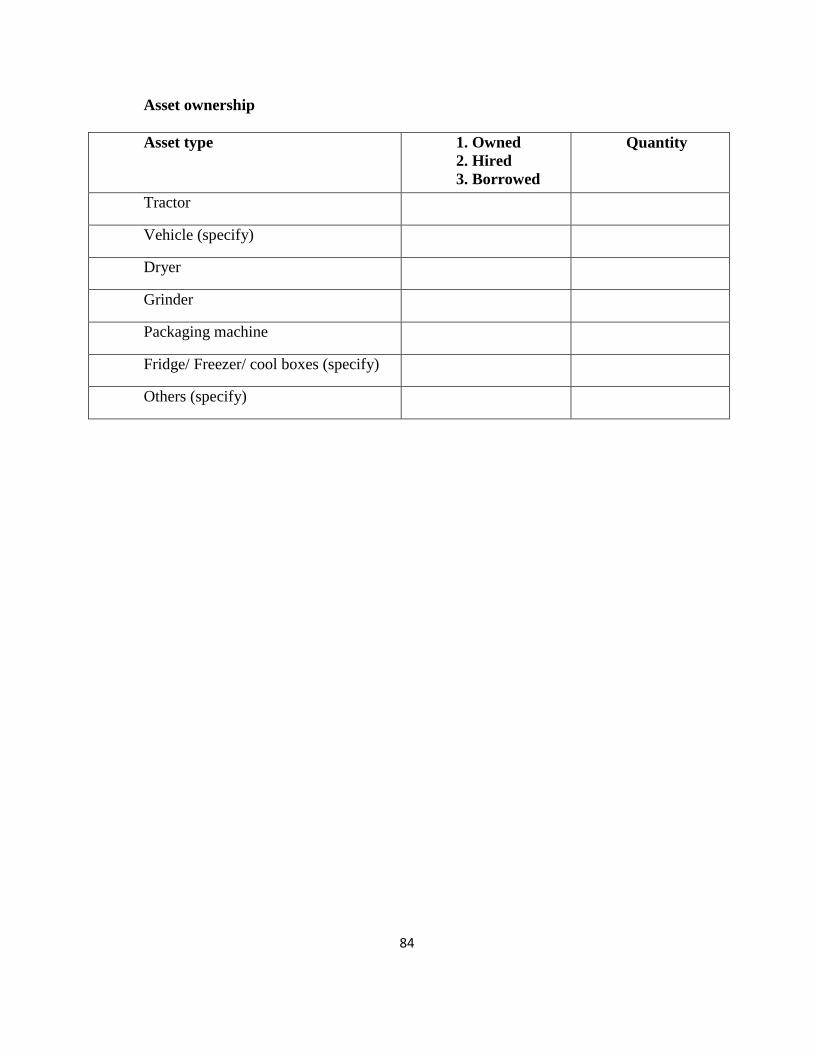
84
Asset ownership
Asset type 1. Owned
2. Hired
3. Borrowed
Quantity
Tractor
Vehicle (specify)
Dryer
Grinder
Packaging machine
Fridge/ Freezer/ cool boxes (specify)
Others (specify)

85
Appendix 3: Binomial Logit Commands
LOGIT; Lhs=WILLINGNESS TO ADOPT
;Rhs= AGE, GENDER, LN MEETINGS, HIGHEST GRADE, TOTAL LAND,
MARITALSTATUS, WORK STATUS….…….
;Marginal effect$
Copyright © 2022 FDOKUMEN