Factors influencing pupils' academic perfomance in k.C.P.E ...
Upload
khangminh22Category
view
4download
0
FACTORS INFLUENCING PHYSICS PERFORMANCE AMONG
STUDENTS IN TIlE SELECTED SECONDARY SCHOOLS
A CASE STUDY OF BUVENGO SUE-COUNTY.
BY
MUKAMA NOAH.
1163-07184-08075.
‘UE~PI.ORING THE HEIGHTS
A RESEARCH REPOR ED TO TIlE COLLEGE
OF EDUCATION IN PARTIAL FULFILLMENT OF THE
REQUIREMENT FOR TIlE AWARD OF BACHELOR
OF EDUCATION DEGREE OF KAMPALA
INTERNATIONAL UMVERSITY.
SEPTEMBER 2019.

Declaration.
I hereby declare that this material submitted has been compiled by me and produced to the best
of my knowledge as a prerequisite to pertain a bachelor of science with education.
Name :Muk~ No~ ~
Signature ~
Date October, 21x~ 2019.

DedicationTo the person of my dear uncle Kayongo Daniel, who is the very reason for my success in 0
Level, to my Precious Mummy who by whose efforts,
I have grown to what I am. To my sisters, Teddy, Babirye, Jennipher and Resty, my brothers
James, Juma and John and En. To my pastor Moses Napandu who has exceedingly enabled my
spirit to grow and granted me with the best of his heart.
In
AcknowIedgmen~.
My great thanks to my God Almighty who has not forsaken me but has continuously granted me
with knowledge to complete this research report.
I thank Dr Living Ounyesiga for the comments, criticism and suggestion on this research report.
My special thanks to my dear loving mother who has stood with me through this journey which
has not been easy but she has struggled to see that it is a success, that constant love, care and
support and above all, the prayers towards my victory.
I also wish to thank my lectures not limited to Dr Olaniyan Olatide Ademola, Prof Levi
Nwankwo, Mr Laaki Samson, Madam Edith and Madam Taligoola of Kampala International
university for the advice granted to me.
I express my sincere and heartfelt gratitude to whoever has assisted in the completion of this
research in one way or the other.
iv

Approval
I hereby truly recommend this research report of factors influence physics performance among
students in the selected secondary school, a case study of Buyengo Sub County for approval at
Kampala international university in partial fulfillment for the requirement of the award of a
bachelor’s degree in education.
Name : Dr. Ounyesiga Living.
Designation: Research supervisor.
Signature
Date : October 2nd 2019.
V
Table of ContentsABSTRACT.
Declaration
Dedication
Acknowledgments iv
Approval
Table of Contents vi
CHAPTERONE 1
Introduction i
CHAPTERTWO 8
LITERATURE REVIEW 8
2.2. Parents’ Level ofEducation, influence on Students’Academic Performance 8
2,3, Parents’ economic status and Students’Academic Performance 9
2.5. Students’Academic Performance in Buyengo sub county 11
CHAPTER THREE 14
Methodology 14
CHAPTER FOUR 17
DATA ANALYSIS, INTERPRETATION AND PRESENTATION 17
4.1. Introduction 17
4.2. Questionnaires Return Rate 17
4.3. Background Characteristics of the Respondents 17
4.3.1. Respondents Distribution by Gender 17
4.3.2. Distribution of Students by Age 18
4.3.4 Teachers’ Professional Qualification 19
4.3.5 Teachers’ Working Experience 19
vi

4.4. School Type .20
4.5.3. Parents’ Level of Education and Students’ Academic Performance 25
CHAPTER FIVE 28
SUMMARY, CONCLUSIONS AND RECOMMENDATIONS 28
5.1, Introduction 28
5.2. Summary of thefindings 28
5.3 Conclusions of the study 29
5.5. Recommendation forfurther research 31
References
Appendix
Appendix
Appendix
Budget
Time flame 39
vii

CHAPTER ONE
Introduction,This chapter discusses the problem to be studied in the research by looking at the following
areas; the background of the study, the statement of the research problem, the purpose of the
study, the objectives of the study, the research questions, significance of the study, scope and
limitations of the study, the assumptions of the study and the operational definitions of the terms.
1.1. Background of the study.
Physics education is an important part of the foundation for many occupations (Van Godden and
Slater, 1998) but consequently, the issue of enrolment and performance of students in physics
have been a subject of discussion and research has been globally done on this (Farmer, 1993).
According to Kayiga (2013) science subjects remain a burden of Uganda’s education even as
more efforts are put into promotion of the academic field. Results for 2012 Uganda certificate of
education (UCE) exposed the continued poor performance of science subjects compared to arts
subjects. In the study of Mabula (2012), it was shown that there is a continuation of failure, and
poor performance in science subjects in secondary schools national examinations, and there is a
continuous dropout from science subjects, the dropout is more serious in physics and chemistry
subjects as compared to mathematics and biology which are compulsory to all students in O~
level. And also, before thinking of doing this particular research, I made many inquiries of the
hardest subjects to many senior four students and the answer I got was always physics first and
some added mathematics.
Hallack (1990), states that education has been identified worldwide as an important component
that determines character and social economic development of any nation. And secondary
education is the foundation of the scientific and technological advancement that Africa needs to
develop industrialized economies; it is also the gateway to higher education and to employment
(Ndoye, 2003).
According to science education in Europe (2011) international student assessment surveys
carried put under agreed conceptual and methodological frameworks with a view to providing
1
policy-oriented indicators, in Europe indicates that there is decrease of relative standing in the
performance of science subjects among European members.
The Uganda Education commission was mandated with charting a new education policy for the
country. One of its main tasks was to solve the issue of education inequality across the races and
regions in the country. Despite all incentives and efforts by the Government and NGOs to
enhance quality and participations in education, this sub county still doesn’t perform well as it’s
hard to find a first grade in it, this is more worse in science subjects especially physics.
Developed nations including United States of America, china and Japan have a large number of
highly skilled human labour in scientific areas. This has enabled them to not only exploit local
natural resources but also to identify and negotiate for other nations resources. Science and
technology are keys to social economic development in an increasingly interconnected world.
And hence, secondary school education is fundamental ingredient for creating this economic
development.
The current secondary school curriculum in Uganda puts emphasis on science
Subjects and this is evident with the making of science subjects including physics, biology and
chemistry compulsory in the ordinary level (0-level). But yet students’ performance in the
science subject’s compulsory in national examinations (Uganda Certificate of Education) has
been consistently poor over the years. Despite the fact that the importance of physics as a basis
for technology is obvious, the number of students taking physics and their performance in
secondary school is really poor and only declining, as the case is in the whole of East Africa and
Africa as a continent as well as the globe at large (Jidamwa, 2012).
The increased poor performance and failure in science subjects in secondary schools may lead to
a big loss for both individual students whose aim was to continue with higher education and
pursue a carrier, but all of that may be compromised a result of poor performance in science
subjects. This may affect the nation, whose aim is to have professionals in various science fields
like medicine, communication, industries and constrnction in order to achieve its technological
development goals (Rogers and Ford 2007).
This study sought to determine the factors influencing the performance of physics in secondary
schools in Buyengo Sub-county, Jinja District.
2

1~2. Statement of the Research problem.
Irrespective of the effort of the government of Uganda funding education of secondary schools
and also encouraging the study of science subjects including physics, biology, chemistry,
agriculture and mathematics. There has been continuous poor performance observed in physics
at the Uganda national examinations at the ordinary level that is; UCE with more students
scoring above the grade of C.6 and more in pass grades. Also, before thinking of doing this
particular research, I made many inquiries of the hardest subject to many students and the answer
I got was always physics first and some added mathematics. This poor performance has raised
concern to the Government, parents and other educational stakeholders. Despite the many
researches done on the education performances in the country, little research has been evident on
factors that influence performance in physics in the national examinations; UCE in Buyengo sub-
county and yet, performance has been still a concern in the area.
Due to the alarming performances exhibited, this has indulged the Mukama Noah to find out the
various factors leading to such poor performance in the sub-county of Buyengo in Jinja District.
L3, Purpose of the study.
The low grade in the Uganda National examinations that is in UCE mostly in physics in the
Eastern Region has been alarming due to its repetitive occurrence. There is a big gap between the
performance in the arts subjects and the science subjects that in reality has affected students in
Buyengo sub-county. The purpose of this study therefore is to determine the factors that
influence the academic performance of secondary school students in the physics subject in the
Buyengo sub-county, Jinja district. An attempt is made to identify and critically look into the
extent to which factors like students’ attitude, availability of qualified science teachers, school
learning environment, parent’s level of education, family’s economic status among others in
secondary schools in Buyengo Sub-county, Jinja district.
3
1.4. Objectives of the study.
1.4.1, General objective.
The study will determine the factors that influence the academic performance of the students in
physics.
1.4.2. Specific objectives.
a) To determine how the availability of qualified science teachers affect the physics performance
in the secondary schools in Buyengo sub-county.
b) To measure the extent at which the family’s economic status affect the physics performance
in Buyengo sub-county.
c) To investigate the extent by which parent’s level of education affected the academic
performance in physics for secondary school students in Buyengo Sub county.
1.5. Research Questions.
a) How does the availability of qualified science teachers affect the physics performance in the
secondary schools in Buyengo sub-county.
b) How does the parent’s economic status influence the academic performance of secondary
school students in physics at Uganda national examination (UCE).
c) How does the parent’s level of education affect the performance in physics in the National
examinations that is to say UCE in Buyengo Sub-county, Jinja District.
1,6. Significance of the study.
The study will be of significance to the teachers, students, parents and educational researchers
due to the fact that the information collected by the researcher will surely enable them to know
and understand the factors that contribute to the poor performance of students in the National
examinations of secondary schools. The ministry of education and the policy makers in the
education sector can as well use the findings as a basis for them to address the problem of poor
performances in the subject of physics in the area of Buyengo sub-county and the region of
eastern Uganda at large, where there has been rampant low performances in the same subject like
Mbale, kamuli, Bukwo, Kweeni and Bulambuli, among others. To the school owners, managers,
administrators and teachers, the research findings will be useful to them since they are to provide
highlights on what are the factors that lead to the persistent poor performances in the physics
subject in secondary schools. Also the findings of this research will help or be of use to
4

individuals, learners, and researchers and in various organizations and institutions since it will
provide the information on what are the possible solutions or recommendations for the problem
should be.
L7, Scope and delimitations of the study.
1.7,L Geographical scope of the study.
The study will be carried out within the confined secondary schools in Buyengo Sub County.
Buyengo sub county found in kagoma constituency in Jinja district, Eastern Uganda. Both public
and private secondary schools inclusive, because there are few secondary schools in the sub-
county.
L7.2. Time scope of the study.
The study will be carried out within a period of four months, starting in June to September of the
year 2019.
L7~3. Delimitations of the study~
The researcher is not certain whether the private schools will share the confidential information
freely. However every effort will be made to ensure that the correct sampling method can be
used during the collection of the information or data to be used when drawing the conclusions.
The following groups of people are preferred by the research as his main respondents since they
are directly involved in the researchers area of concern; the head teachers of the schools, the
science teachers, and senior four (S.4) students.
The findings of this study will rely much on the information given out by the respondents; hence
the validity of the information will depend on them. But then due to certain circumstances or
some reasons like ignorance, perception, and attitudes and so on, respondents may hide the
information or give false! wrong information or refuse to respond to the researcher’s questions.
5
1.8. Basic Assumption ofthe Study.
The target respondents will be expected to participate in giving the desired information for the
study and that they should be truthful, honest and objective to the questionnaires especially after
being assured that the information would only be used for academic purpose and is highly
confidential.
1.9. Operational definition of terms used,
1.9.1. Academic performance.
According to Gibson, & Rankin (2015) define as the attainment of learning objectives. However,
as per the study; Academic performance refers to the achievement in standardized tests or
examinations by the student. In other words, it is the outcome of the student’s assessments. This
study will measure the academic performance basing on the average grades scored by students in
exams (whether Distinction, Credit or Pass,).
1.9.2. Factors.
According to Webster’s New World College Dictionary, 4th Edition. Copyright © 2010 by
Houghton Mifflin Harcourt. A factor is any of the circumstances, conditions, etc. that bring about
a result; element or constituent that makes a thing what it is. In other words, a phenomenon that
affects the nature, the magnitude, or the timing of a consequence. That is to say the root cause of
something.
1.9.3. Physics:
According to Tighana (2018); physics is the science that studies measurable magnitude and
phenomena that transforms them without changing their natures. According to the digital
encyclopedia Microsoft Encarta, Physics is defined as a major science dealing with the
fundamental constituents of the universe, the forces they exert on one another, and the results
produced by these forces.
6

1,9.4. Performance.
According to Kane (1988); performance is defined at the level of each individual within the
organization or at organization level. It is perceived as an understanding of the achieved results.
7
CHAPTER Two
LITERATURE REVIEW2.1, Introduction.
In order to conceive the research in a way that permits a clear fonnulation of the problem, some
background information will be necessary. This will be obtained mainly by reading whatever has
been published that seems to be relevant to the research topic. The process is also referred to as
Literature review. Review of the literature bears significance on providing the researcher with
deeper insight into the topic of research.
2.2. Parents’ Level ofEducation, influence on Students’Academic
Performance.
Generally traditional research has revealed that more highly educated parents and
especially mothers have greater success in providing their children with cognitive and
language skills that contribute to success in school (Stich and McDonald, 1990). Parents’
level of education is important to schooling as parents want their children to maintain the
status quo (Mallan, 2009). It’s also believed that parents with higher educational levels
have stronger confidence in their children’s academic abilities and they also have higher
expectations of their children. They expect that their child will earn good grades behave
well in school and attend college. These expectations and confidence in their children
motivate them to do well at school. The confidence parents have in their children also
helped them to build their own confidence and self-concept which is important in their
education (Mallan, 2009). However, parents’ over expectations might also cause stress to
their children which translates to poor educational attainments.
Eccies (2005) pointed out that children learn by example often through observations at
home, If a child’s parents are reading books, attending ongoing educational classes and
taking them along to the museums, libraries- all activities educated parents are more apt to
do- they are engaging the child in a number of direct learning experiences that will help
him or her to achieve the best in education.
8

Rana (2015) carried out a study on the relationship between the parents’ level of education
and academic performance of their children in South Punjab town, Pakistan.
The result showed that there was a significant positive relationship between parents’ level
of education and students’ academic performance.
Jamila (2009) conducted a study on the effect of parental level of education on students’
academic performance in Norway. The results of the study indicated that there was a positive
correlation between parental level of education and their children’s academic achievement.
2,3, Parents’ economic status and Students’Academic Performance.
Zhang (2012) examined students and their families’ income in China. He studied in their
early years (lower primary school children). The study measured students reading skills,
verbal interaction and phonological awareness in relation to their families’ level of
income. The results showed that low income children exhibited lower levels of cognitive
linguistic skills, lower verbal interactions and lower phonological awareness and generally
lower academic performance than their counterparts from high and middle income
families. It also showed that children from high income families were more proficient in
reading skills than in low income families although the research only examined early
childhood pupils but this research focused on students in secondary schools.
Sean (2013) presents in his comprehensive study how students from families with high income
are having best performance than those from low income families. His study took place in United
States of America. He posited that the impact of the parents’ income can be shown in the early
timing of the students’ learning. He maintained that parents of higher income take their children
to school earlier than their lower income counterparts. They can afford to take their children
through preschool learning and this have greater impact in their later educational outcomes since
it provides them with the required cognitive and social development. This is unlike their low
income counterparts who do not afford preschool learning for their children and prefer having
their children commence learning from class one (grade one) onwards. However, the researcher
is aware that low income parents are also as eager and desire to take their children to school
earlier as their counterparts in high income families.
9

2.4. The student’s attitude,
This may have an effect on student performance in secondary school physics in ordinary level
physics. Despite the fact that high school students who take physics are generally exceptional as
a group, tending to have high grade point averages, to perform well on standardized tests and
tend to rank high in mathematical ability (Porter & Czujko, 1986), institutional, cultural and
social factors affect a student’s decision to take physics in high school. For instance, at Robeson
High School in Chicago, simply a neighborhood school which all types of students attends; every
student must take four years of science and four years of mathematics which includes physics.
While good students generally will do well in most circumstances, when students of different
learning styles and background are in high school physics, the teaching or the curriculum can
become important in student success.
Many high school students have difficulty learning high school physics and ida and Cranial
(1985) developed a remedial teaching method consisting of immediate and frequent feedback in
a natural classroom setting. This method resulted in significantly higher achievement indicating
that teaching method remains a factor in successful problem solving and therefore, success in
high school physics. Supporting this research is the work ofHalloun and Hesterenes (1987) who
contend that the poor performance typical of most students in secondary school physics suggest
that conventional methods for teaching problem solving are far from optimal. By contrasting the
traditional lecture method to the dialectical large diagnostic test gains of low competence
students and gains in test performance in the course were found. Minstrell (1984) has shown that
the intensive dialectical method has resulted in success in teaching Newtonian mechanics.
Wright and Williams (1986) found that a problem solving strategy (WISE) increased student and
instructor perceptions of accuracy and promoted organization as well as performance. Although
the greatest success of the WISE method was with those who had high math skills, students with
low mathematics skills also showed improved performance. The curricular aspect of a physics
course may determine if a student passes or fails after renewed interest in science courses at all
levels due to Sputnik, two new courses were developed in high schools. PSSC Physics was an
upgrading of the high school course with a view toward training future scientists and emphasized
student observations and conclusions based on experimental evidence. Project Physics was more
humanistically oriented and aimed at increasing physics enrollments at high school. PSSC was
10
primarily laboratory centered course, while Project Physics aimed at p[people interested in
history, languages, music and so on. Later, courses were developed such as the PSI based on
individualized instruction Pal hand & Lid Enfield (1985). While the PSSC and Project physics
have had their impact on contemporary secondary school physics, both courses have not
succeeded in becoming adopted. In a nationwide survey by the Educational Testing Service,
approximately 9% of United States High Schools used PSSC, 30-40% used Project Physics and
the conventional course using Modem Physics as a text, was adopted by about 54%. Since
passing physics course is a test of problem solving in physics, it should be noted that an ETS
survey ofi 981 showedthat there is no great difference between students who had taken different
kinds of courses (Palirand and Lid Enfield, 1985).The basis for this conclusion is the College
Board Physics Achievement Tests. The average for students who had taken the PSSC course was
consistently higher by a small amount, but it is not certain if the difference was due to the course
or to student selection since the PSSC is usually reserved for the better students. A survey taken
by the American Institute of Physics found that25%of those who earned bachelor degrees in
1983-1984, took PSSC physics in high school, and 12%took Project Physics (Pallrand & Linden
field). Since problem solving in physics is a measure of who will pass a physics course, it appears
that the type of course i.e. traditional, PSSC, or Project Physics has little bearing. In conclusion,
factors which may affect success in secondary school physics, typically including cognitive
structure such as formation of problem solving schemata. It appears that Piagetian concepts such
as concrete and abstract reasoning are not as important as the visual-spatial abilities, induced
cognitive structures of sex roles, and external factors such as teaching style and, to some degree,
curriculum. There is evidence that all are important in passing a physics course as measured by
problem solving of physics problems.
2.5. Students’ Academic Performance in Buyengo sub county.Teachers were required to give the overall mean grade of their classes in the previous end
of term two 2019 physics examination. The following data was obtained as recorded in the
table below:
11

Table 4.7 Students’ Academic Performance
Mean Grade Mean Grade. Frequency. Percentage (%)
F9 00 00 00
P8 8.213 02 33
P7 7.461 03 50
C6 00 00 00
C5 5.9487 01 17
C4 00 00 00
C3 00 00 00
D2 00 00 00
DI 00 00 00
Total 7.207 06 100
Source: Primary data, 2019
The above table shows that majority of teachers (50%) stated that their class had mean
grade of C7 in the previous end term examination. Followed by 33% of teachers who had
their classes with a mean grade of P8. The remaining 17% of the teachers stated that their
classes had mean grade of CS. Meaning the other grade had no teacher who would attain
them. This shows that majority of students in the Buyengo sub county have a poor
academic performances in physics.
12

2.2. Conceptual Framework.
Independent Variables. Dependent Variable
Availability of qualifiedohvsics teachers.
School environment.
Student~ academic
performanceParent’s economic status.
Curriculum and Teaching.
13

CHAPTER THREE
Methodology.Research methodology defines the research methods and logic steps, what to do and how to solve
the problem and achieve the proposed objectives. Therefore the methodology of this study has
been chosen in order to acquire information and deduce conclusions about the factors influencing
the academic performance of secondary school students in physics.
3.1. Research design.
According to Lokesh (2007), research design refers to making orderly and systematic decisions
on how to collect infonnation and data to guide generated answers to research questions. The
study will be cross- sectional in nature. The researcher will use qualitative research design
because the research has studied variables in their natural settings and meanings of terms people
attached to them. The researcher will use qualitative research approach in order to gain in- depth
understanding of the concepts variable of the studied subjects.
3.2, Data collection.
For the purpose of the study, and for the researcher to achieve the objectives, data will be
collected from the respondents. And data will be collected from the responds in the area of study
through questionnaires.
3.3. Sampling Design.
According to Black and Champion (1976), a sample is a portion of elements taken from a
population and this considered to be a representative of the population. Ideally one may want to
study the entire population; however, this is usually impossible to do, so one has to settle for a
sample.
In order to collect the primary data, the questionnaire survey is used. For the purpose of this
research, random probability sampling is selected. Roscoe (1975) cites a sample size which is
appropriate to be between 30 and 500 for most research.
14
3.4. The interview survey.
The technique of personal interviewing will help the researcher to reach the objectives as it is the
most versatile and productive method of communication selected. For the purpose of the study,
face to face interview will be conducted involving three interest groups including the head
teachers, physics teachers and the senior four students. But the technique is disadvantageous in
that it’s very costly time consuming and can bring about bias as the respondent try to please the
researcher.
3.5. The questionnaire survey.
Cohen (1989) defines a questionnaire as the self-report instrument used for gathering information
about variables of interest to an investigation. In this research, a closed ended questionnaire is
designed to call for responses.
The questionnaires will help the researcher to analyse the data easily as the responses can be
directly compared and easily.
They are versatile and surveys can be among people of different age and are replicated from one
subject to another (Aaker and Day, 1990; kotler, 1994). Many questions can be answered in a
short time.
3.6. Data Analysis.
According to Pout and Htmgler (1997), data analysis means to organize, provide structure and
elicit meaning. Data is qualitative and will be collected using questionnaires will be analysed
using Statistical Package for Social Sciences and Descriptive statistical techniques that is; means,
frequencies distributions and percentages) will also be employed to analyze field data from
questionnaires to assist in the interpretation of data.
3.7. Location of the study.
The research is planned to be carried out in Buyengo sub-county, Kagoma constituency in Jinja
district. Buyengo sub-county comprises of four parishes and these are Iziru parish, Buyengo
parish, Butamiira parish and Bulugo parish.
15
3.8, Target population.
The population targeted by the researcher in this study will be the respondents in the research
area including the physics teachers and senior four students in the secondary schools of Buyengo
sub-county. In a population of two hundred seventy five, the sample size will be ninety five
respondents where eighty nine students and six teachers of physics.
3.9. Area ofstudy.
The was aimed at studying the situation in the following schools of Buyengo sub county
including Buyengo Senior secondary school, Exodus secondary school and Nsozibiri secondary
school. Given the fact that they very few schools as its evident.
16

CHAPTER FOUR
DATA ANALYSIS, INTERPRETATION AND PRESENTATION.
4,1, Introduction.
This chapter presents the data analysis and discussion of the findings as well as answering
the research questions listed in chapter one of this document. The main rationale of this
chapter is to present the analysed data and its interpretation.
4.2. Questionnaires Return Rate.
A total of ninety five respondents where eighty nine of them were students and six being
teachers participated in the study. The results of questionnaires return rate are as presented
in the table 4.1 below:
Table 4.1. Questionnaires Return Rate
Respondents Returned Not returned
Students 89(100%) 0(0%)
Teachers 06(100%) 0(0%)
Total 95(100%) 0(0%)
Source: Primary data, 2019.
The table 4.1 above shows that all the questionnaires were returned by both the students
and teachers in this study. This shows that data was collected from all the intended sample
of students (89) and teachers (06) therefore was a good representation as proposed by the
researcher. The researcher made a follow up of the distributed questionnaires so as to
ensure that respondents returned them.
4.3. Background Characteristics of the Respondents
4.3.1. Respondents Distribution by Gender
The gender of sampled students and teachers was obtained and presented as shown in the
table 4.2 below:
17

Table 42, Respondents Distribution by GenderRespondents Male Female
Students 47(53%) 42(47%)
Teachers 05(83%) 01(17%)
Total 52(55%) 43(45%)
Source: Primary data, 2019
From the table 4.2 above it is evident that majority of the interviewed students were male
with 53% while female students were 47%. 83% of the teachers were male while 17%
were female.
432. Distribution of Students by Age
Data on the distribution of students by age is shown in table given below:
Table 4~3. Distribution of Students by Age.Age in years Frequency Percentage (%)
Below 16 0 00%
16-18 78 88%
Above 18 11 12%
Total 89 100
Source: Primary data, 2019.
Tables 4.3 above indicates that majority (88%) of the students were 16-18 years of age
while the minority (12%) were above 18 years of age. Those below 16 years were not
found in the total number of students.
18
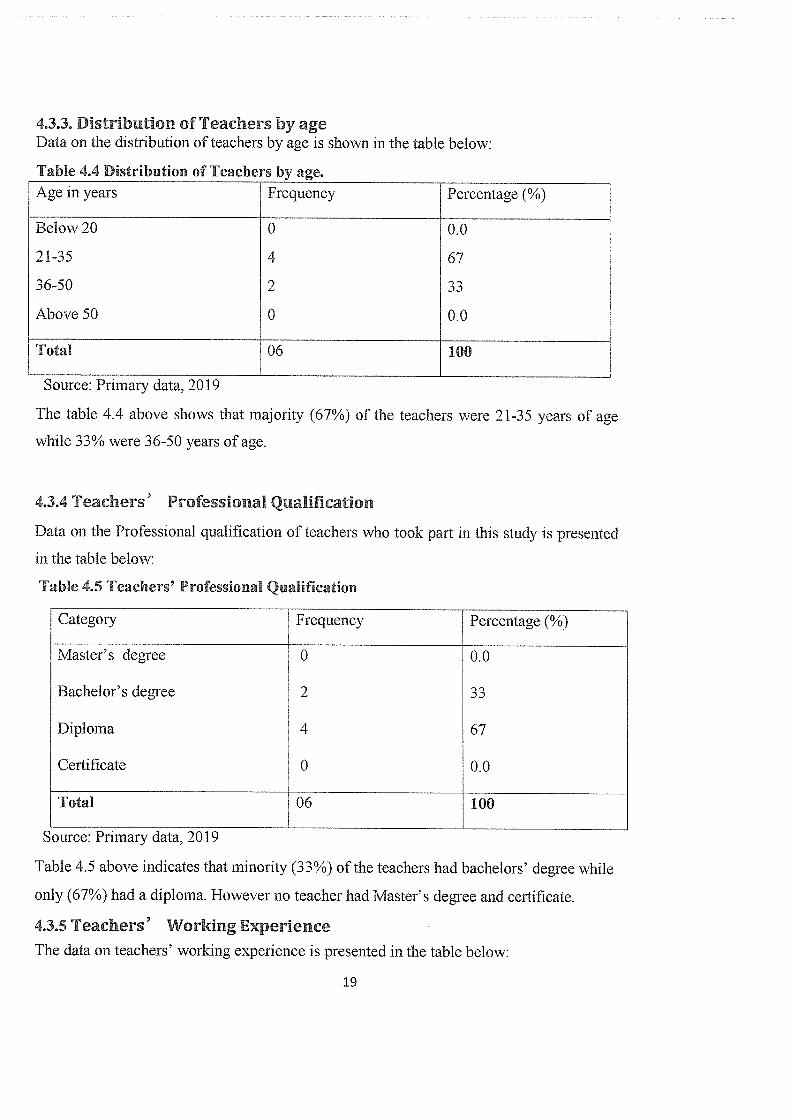
4.3.3. Distribution of Teachers by ageData on the distribution of teachers by age is shown in the table below:
Table 4.4 Distribution of Teachers by age.Age in years Frequency Percentage (%)
Below 20 0 0.0
21-35 4 67
36-50 2 33
Above 50 0 0.0
Total 06 100
Source: Primary data, 2019
The table 4.4 above shows that majority (67%) of the teachers were 21-35 years of age
while 33% were 36-50 years of age.
4.3.4 Teachers’ Professional Qualification
Data on the Professional qualification of teachers who took part in this study is presented
in the table below:
Table 4.5 Teachers’ Professional Qualification
Category Frequency Percentage (%)
Master’s degree 0 0.0
Bachelor’s degree 2 33
Diploma 4 67
Certificate 0 0.0
Total 06 100
Source: Primary data, 2019
Table 4.5 above indicates that minority (33%) of the teachers had bachelors’ degree while
only (67%) had a diploma. However no teacher had Master’s degree and certificate.
4,3.5 Teachers’ Working ExperienceThe data on teachers’ working experience is presented in the table below:
19

Table 4.6 Teachers’ Working Experience in YearsCategory in years - Frequency Percentage
Less than 5 3 50
6-10 2 33
11-15 1 17
16-20 0 0.0
2landabove 0 0.0
Total 06 100
Source: Primary data, 2019
Table 4.6 above shows that majority (50%) of the teachers that participated in this study
had a working experience of less than five years while (33%) had a working experience of
6-10 years and 17% of the teachers had an experience of 1 1-l5years.
4.4. School Type
All the schools (100%) that were selected to participate in this study were mixed day and
boarding schools. However the boarding section mostly concentrates in candidate class.
4.5. Discussion ofResearch Objectives.
The research objectives in this study were discussed in relation to other studies in the
literature review.
4.5.1. Availability of qualified physics teachers and students academic
performance.
The first objective of the study was determining the influence of availability of qualified
physics teachers on the academic performance in physics. In order to achieve this
objective, 89 students and 6 teachers were required to state their views on the given
questions. Students were required to fill a 5- liker scale with strongly agree (SA)=5, agree
(A)= 4, neutral (N)=3, disagree (D)=2, strongly disagree (SD) =1 and the results were
presented in the table below.
20
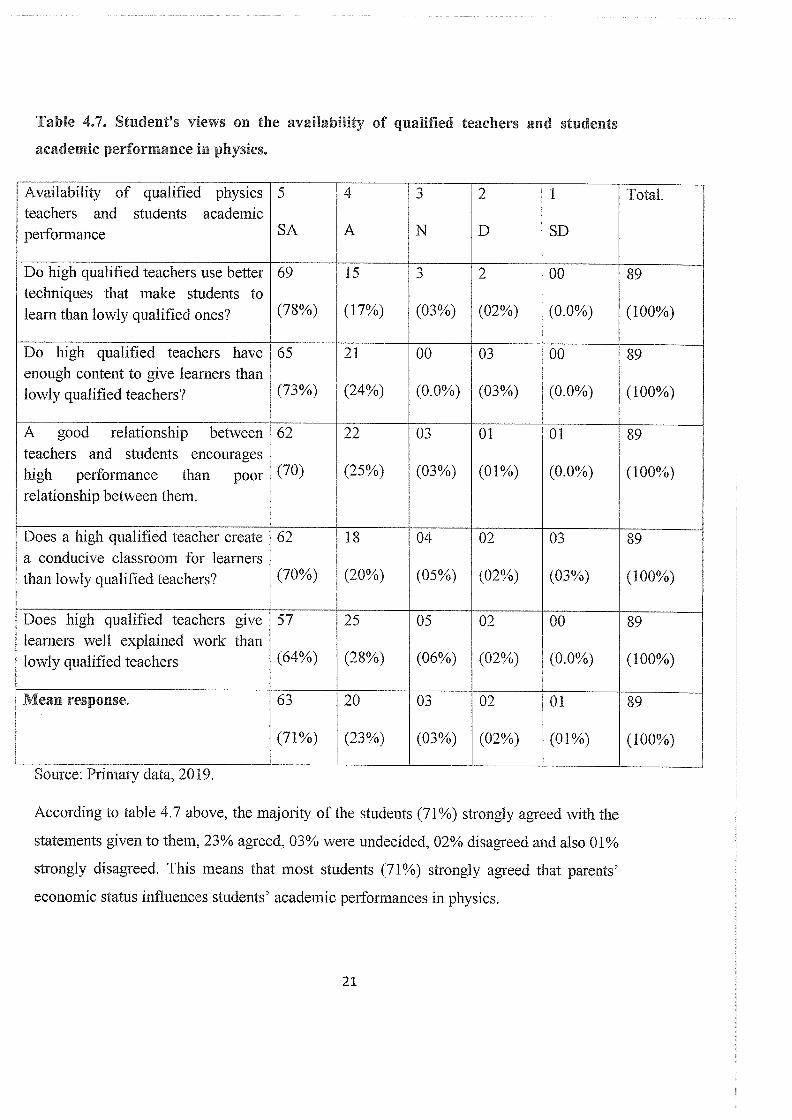
Table 4,7. Student?s views on the availability of qualified teachers and students
academic performance in physics.
Mean response.
Source: Primary data, 2019.
According to table 4.7 above, the majority of the students (71%) strongly agreed with the
statements given to them, 23% agreed, 03% were undecided, 02% disagreed and also 01%
strongly disagreed. This means that most students (71%) strongly agreed that parents’
economic status influences students’ academic performances in physics.
Availability of qualified physics 5 4 3 2 1 Total.teachers and students academicperformance SA A N D SD
Do high qualified teachers use better 69 15 3 2 00 89techniques that make students tolearn than lowly qualified ones? (78%) (17%) (03%) (02%) (0.0%) (100%)
Do high qualified teachers have 65 21 00 03 00 89enough content to give learners thanlowly qualified teachers? (73%) (24%) (0.0%) (03%) (0.0%) (100%)
A good relationship between 62 22 03 01 01 89teachers and students encourageshigh performance than poor (70) (25%) (03%) (01%) (0.0%) (100%)relationship between them.
Does a high qualified teacher create 62 18 04 02 03 89a conducive classroom for learnersthan lowly qualified teachers? (70%) (20%) (05%) (02%) (03%) (100%)
Does high qualified teachers give 57 25 05 02 00 89learners well explained work thanlowly qualified teachers (64%) (28%) (06%) (02%) (0.0%) (100%)
63 20 03 02 01 89
(71%) (23%) (03%) (02%) (01%) (100%)
21
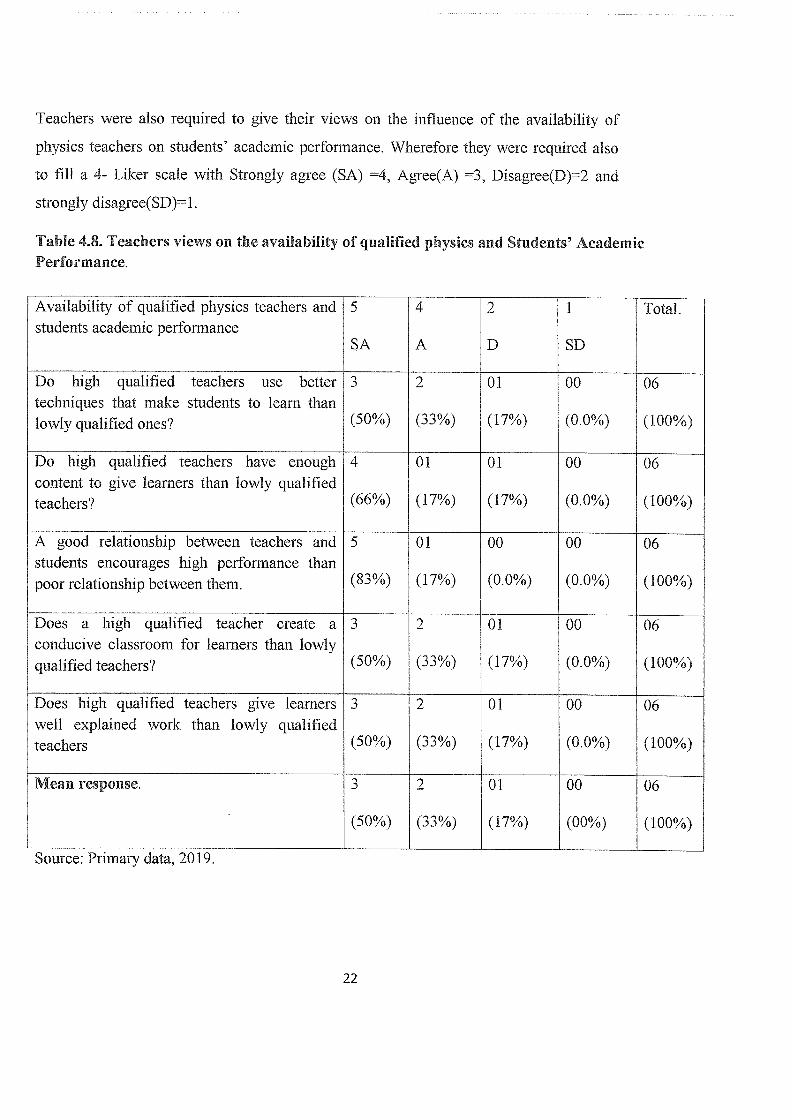
Teachers were also required to give their views on the influence of the availability of
physics teachers on students’ academic performance. Wherefore they were required also
to fill a 4- Liker scale with Strongly agree (SA) =4, Agree(A) 3, Disagree(D)=2 and
strongly disagree(SD)’l
Table 4.8. Teachers views on the availability of qualified physics and Students’ AcademicPerformance.
Availability of qualified physics teachers and 5 - 4 2 1 Total.students academic performance
SA A D SD
Do high qualified teachers use better 3 2 01 00 06techniques that make students to learn thanlowly qualified ones? (50°~) (33%) (17%) (0.0%) (100%)
Do high qualified teachers have enough 4 01 01 00 06content to give learners than lowly qualifiedteachers? (66%) (17%) (17%) (0.0%) (100%)
A good relationship between teachers and 5 01 00 00 06students encourages high performance thanpoor relationship between them. (83%) (17%) (0.0%) (0.0%) (100%)
Does a high qualified teacher create a 3 2 01 00 06conducive classroom for learners than lowlyqualified teachers? (50%) (33%) (17%) (0.0%) (100%)
Does high qualified teachers give learners 3 2 01 00 06well explained work than lowly qualifiedteachers (50%) (33%) (17%) (0.0%) (100%)
Mean response. 3 2 01 00 06
. (50%) (33%) (17%) (00%) (100%)
Source: Primary data, 2019.
22
According to table 4.8 above, majority of the teachers say (50%) strongly agreed with the given
statements, 33% agreed, 17% disagreed and none strongly disagreed. This means that half of the
teachers (5 0%) strongly agreed that availability of qualified teachers influences their students’
academic performances in physics.
4.5.2. Parents’ economic status and Students’ Academic Performance
The second objective of this study was to determine the influence of parents’ economic status on
students’ academic performance in public secondary schools. In order to achieve this objective,
89 students were also required to state the approximate level of their parents’ income and their
corresponding academic performance (mean grade) in the previous end of term two 2019
examination. Cross tabulation was done and the data is presented in the table below:
Students were also asked to give their views on the influence of parents’ economic status on
students’ academic performances in physics. And, they were required to fill a 5- Likert scale
with Strongly agree (SA) 5, Agree(A) 4, Neutral (N)”3,Disagree(D)=2 and Strongly
disagree(SD)=1. The responses are presented in the table below:
23
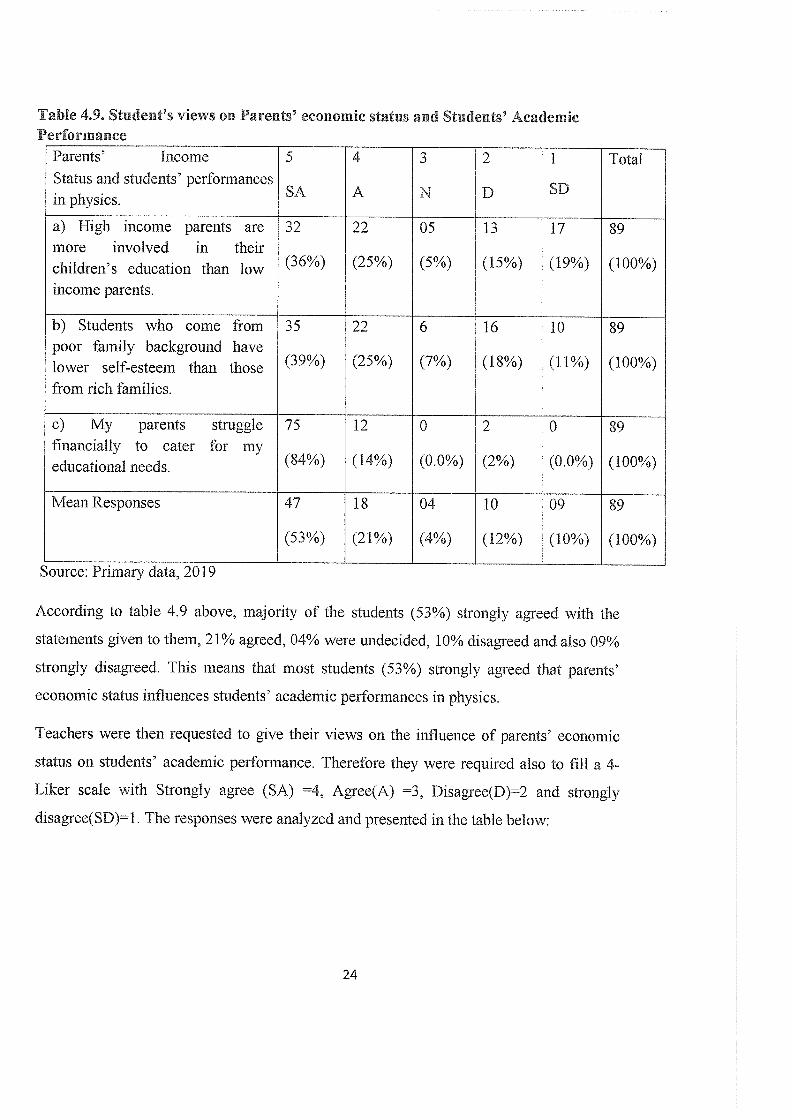
Table 4.9, Student’s views on Parents’ economic status and Students’ AcademicPerformance
Parents’ Income 5 4 3 2 1 TotalStatus and students’ performances
SA A N D SDin physics.
a) High income parents are 32 22 05 13 17 89more involved in theirchildren’s education than low (36%) (25%) (5%) (15%) (19%) (100%)income parents.
b) Students who come from 35 22 6 16 10 89poor family background havelower self-esteem than those (39%) (25%) (7%) (18%) (11%) (100%)from rich families.
c) My parents struggle 75 12 0 2 0 89financially to cater for myeducational needs. (84%) (14%) (0.0%) (2%) (0.0%) (100%)
Mean Responses 47 18 04 10 09 89
(53%) (21%) (4%) (12%) (10%) (100%)
Source: Primary data, 2019
According to table 4.9 above, majority of the students (53%) strongly agreed with the
statements given to them, 21% agreed, 04% were undecided, 10% disagreed and also 09%
strongly disagreed. This means that most students (53%) strongly agreed that parents’
economic status influences students’ academic performances in physics.
Teachers were then requested to give their views on the influence of parents’ economic
status on students’ academic performance. Therefore they were required also to fill a 4-
Liker scale with Strongly agree (SA) 4, Agree(A) =3, Disagree(D)=2 and strongly
disagree(SD)=1. The responses were analyzed and presented in the table below:
24

Table 5,0, Teachers views on Parents’ economic status and Students’ AcademicPerformance.
Parents’ economic status 4 3 2 1 Totalsand students’ performance.
SA A D SD
a)High income parents are 2 2 2 0 06more involved in theirchildren’s education than (34%) (33%) (33%) (0.0%) (100%)low income parents
b) Students who come 3 2 1 0 06from poor familybackground have lower (50%) (33%) (17%) (0.0%) (100%)self-esteem than thosefrom rich families.
c) My students’ parents 4 2 0 0 06struggle financially tocater for their educational (67%) (33%) (0.0%) (0.0%) (100%)needs.
Mean Response 03 02 01 00 06
(50%) (33%) (17%) (0.0%) (100%)
Source: Primary data, 2019According to the table 5.0. Above, majority of the teachers (50%) strongly agreed with the
given statements about parents’ economic status and students’ academic, performance.
33% agreed, 17% disagreed and none of the teachers strongly disagreed with the
statements given. This means that most teachers (50%) strongly agreed that parents’
income influences students’ academic performance.
4.5.3. Parents’ Level of Education and Students’ Academic Performance
The second objective was to determine the relationship between parents’ level of
education and students’ academic performance in the Secondary Schools in Buyengo Sub
County. In order to achieve this objective;
25
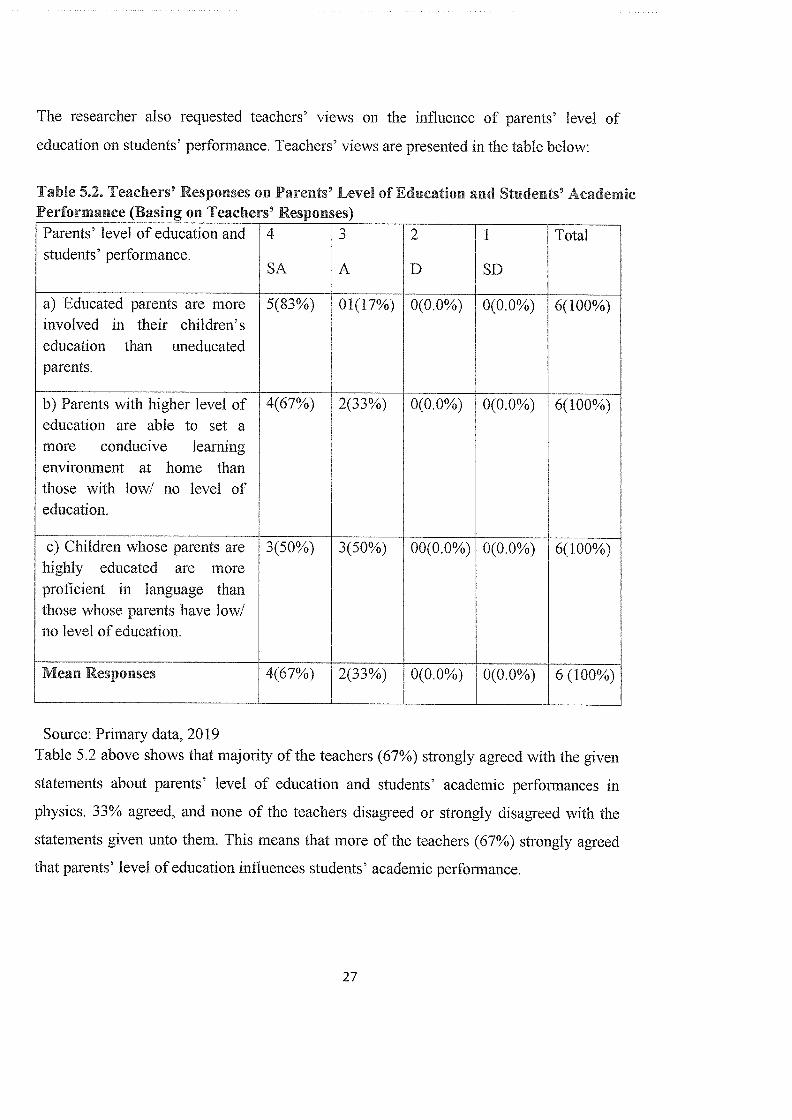
The researcher also requested teachers’ views on the influence of parents’ level of
education on students’ performance. Teachers’ views are presented in the table below:
Table 5.2, Teachers’ Responses on Parents’ Level of Education and Students’ AcademicPerformance (Basing on Teachers’ Responses)Parents’ level of education and 4 3 2 1 Totalstudents’ performance.
SA A D SD
a) Educated parents are more 5(83%) 01(17%) 0(0.0%) 0(0.0%) 6(100%)involved in their children’seducation than uneducatedparents.
b) Parents with higher level of 4(67%) 2(33%) 0(0.0%) 0(0.0%) 6(100%)education are able to set amore conducive learningenvironment at home thanthose with low! no level ofeducation.
c) Children whose parents are 3(50%) 3(50%) 00(0.0%) 0(0.0%) 6(100%)highly educated are moreproficient in language thanthose whose parents have low!no level of education.
Mean Responses 4(67%) 2(33%) 0(0.0%) 0(0.0%) 6 (100%)
Source: Primary data, 2019Table 5.2 above shows that majority of the teachers (67%) strongly agreed with the given
statements about parents’ level of education and students’ academic performances in
physics. 33% agreed, and none of the teachers disagreed or strongly disagreed with the
statements given unto them. This means that more of the teachers (67%) strongly agreed
that parents’ level of education influences students’ academic performance.
27

CHAPTER FIVE
SUMMARY, CONCLUSIONS AND RECOMMENDATIONS
Sd. IntroductionThis chapter discusses summary of the findings, conclusions, recommendations and
suggestions for further research following research objectives.
5.2. Summary of thefindings.
The purpose of this study was to investigate the factors that influence the student’s
academic performances in physics in secondary schools in Buyengo Sub-County, Jinja.
Data were collected using questionnaires. Teachers and students filled the questionnaires.
The data collected was coded and analyzed using Statistical Package of percentages and
frequencies. The summary of the findings is discussed below:
a) Availability of qualified teachers influences students’ academic performance in Buyengo
Sub County.
The first objective for this study was to assess the extent to which the availability of
qualified physics teachers influences students’ academic performance in the secondary
schools in Buengo Sub-County. The results from this study shows that 71% of the
students and 50% of the teachers strongly agreed with the statements in the questionnaires.
Therefore, there is a high influence of availability of qualified physics teachers on
students’ academic performance.
b) Parent’s economic status Influences Students’ Academic Performance in Buyengo Subcounty.
The first objective for this study was to determine the extent to which parents’ income
influences students’ academic performance in public secondary schools in Buyengo Sub
County. The 53% of the students and 50% of the teachers strongly agreed meaning that
there is an influence of parents’ economic status on students’ academic performance in
Buyengo Sub-County. In other words increase in parent’s economic status enhances
student’s’ academic success.
28
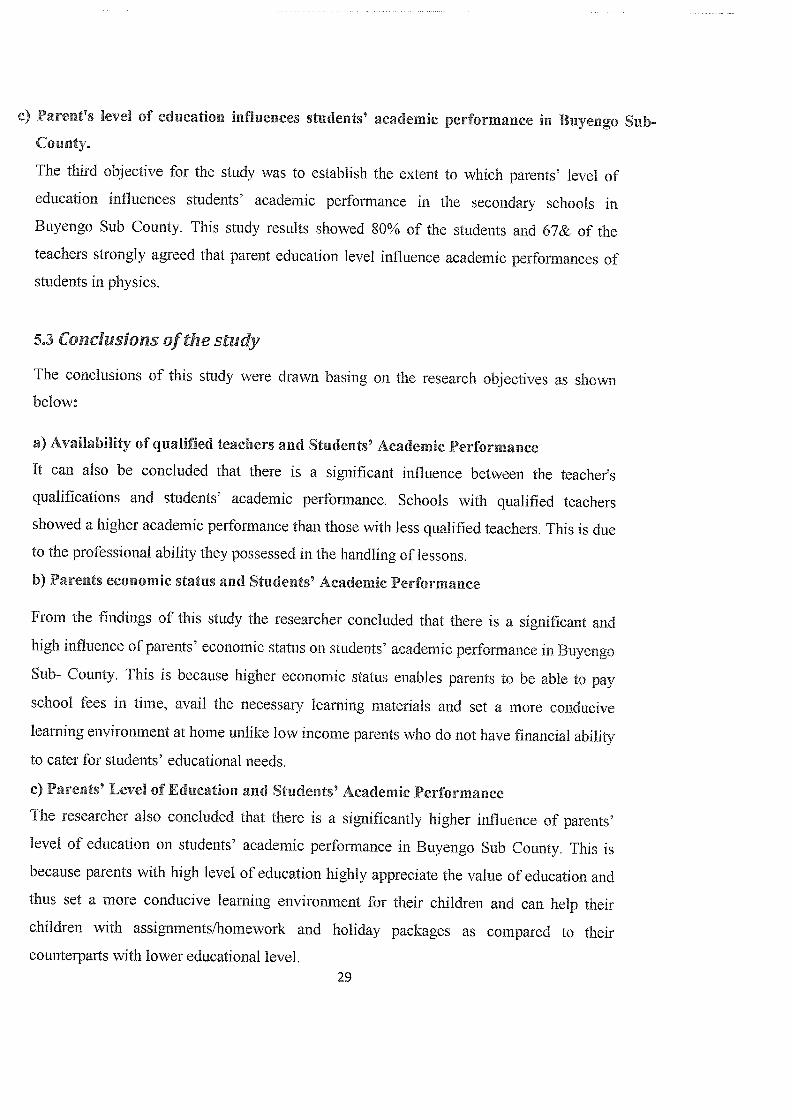
c) Parent’s level of education influences students’ academic performance in Buyengo Sub-
County.
The third objective for the study was to establish the extent to which parents’ level of
education influences students’ academic performance in the secondary schools in
Buyengo Sub County. This study results showed 80% of the students and 67& of the
teachers strongly agreed that parent education level influence academic performances of
students in physics.
5.3 Conclusions of the study
The conclusions of this study were drawn basing on the research objectives as shown
below:
a) Availability of qualified teachers and Students’ Academic Performance
It can also be concluded that there is a significant influence between the teacherts
qualifications and students’ academic performance. Schools with qualified teachers
showed a higher academic perfonnance than those with less qualified teachers. This is due
to the professional ability they possessed in the handling of lessons.
b) Parents economic status and Students’ Academic Performance
From the findings of this study the researcher concluded that there is a significant and
high influence of parents’ economic status on students’ academic performance in Buyengo
Sub- County. This is because higher economic status enables parents to be able to pay
school fees in time, avail the necessary learning materials and set a more conducive
learning environment at home unlike low income parents who do not have financial ability
to cater for students’ educational needs.
c) Parents’ Level of Education and Students’ Academic Performance
The researcher also concluded that there is a significantly higher influence of parents’
level of education on students’ academic performance in Buyengo Sub County. This is
because parents with high level of education highly appreciate the value of education and
thus set a more conducive learning enviromnent for their children and can help their
children with assignments/homework and holiday packages as compared to their
counterparts with lower educational level.29

5.4. Recommendations ofthe studyThe recommendations of this study were formulated basing on the research objectives as
shown below:
a) Availability of qualified science teachers and students’ academic performance.
The researcher found out that most teachers in Buyengo Sub-County were diploma
holders who need support for further studies. The study also found that teachers
influenced the students’ performance in Physics through their missing of classes, poor
relationship with students, and poor methods of teaching. From this point of view, it was
recommended that the government and the head teachers should encourage their teachers
to upgrade their academic status through providing them with ample time for studying so
as to get the skills needed in handling learners and conducting lessons.
b) Parents’ economic status and students’ academic performance.
Due to low parent~s economic status in Buyengo Sub-County as established in this study
the researcher recommended that the government should at least construct another
secondary school in the sub county so as to accommodate the high number of learners
from poor families within the locality, retain them in school and enhance their academic
performance.
c) Parents’ level of education and students’ academic performance
It was established in this study that most of the parents in Buyengo Sub-County are
uneducated and that their low level of education limits their involvement in students’
academic performance. In light of this fact it was recommended that schools in Buyengo
Sub County should put in place appropriate systems to enhance parental involvement in
education.
30

5.5, Recommendation forfurther research
In relation to this study, further research should be done on the following areas of interestthat were not a concern in this study.
i) Influence of Parent~s economic status on students’ academic performance in public
secondary schools in Buyengo Sub-County.
) How School environmental factors influence students’ academic performance in public
secondary schools in Buyengo Sub-County.
~) How parent’s participation in academics influence student’s performance in secondary
schools in Buyengo Sub-County.
1) To determine how the student’s attitude influence their academic performance in Physics
in Buyengo Sub-county.
31

ReferencesPARK, Y., (2004): Teaching and learning of physics in cultural contexts, New Jersey: WorldScientifi c.
Van Heuvelen, A. (1991), —Learning to think like a physicist: A review of research-basedinstructional strategies,JI Am. J. Phys., 59 (10), 89 1-897.
VanGorden, T., and Slater, T.S., (1998). Factors Influencing Kansas High School PhysicsEnrolment. Kansas Science Teacher, 139(1), Pp 25-28.
KIE. Secondary Education Syllabus (2002). Mathematics, Chemistry, Physics, Biology andAgriculture. Volume Two. Nairobi, Kenya. Kenya Literature Bureau.
Griffith, W. T., (1985) Factors Affecting Perfomance in introductory Physics Courses. AmericanJournal of Physics, 53.(9), 839-842
M. A. (1998). Supervision for teacher development: A proposal for Pakistan. Paris:UNESCOIIEP.
Barton, R. & Stepanek, J. (2012). The impact of professional learning communities. Principal’sResearch Review, 7 (4), 1-7.
Baruch, Y. & Holtom, B. C. (2008). Survey response rate levels and trends in organizationalresearch. Human Relations, 61(8), 1139-1160.
Brown, M., Rutherford, D. & Boyle, B. (2000). Leadership for school improvement: The roleofheads of departments in UK secondary schools. School Effectiveness and SchoolImprovement.
Robinson, M. (1991). Raise Your Enrolment. The Science Teacher, 58(Feb. 1991) pp 24-27.
Shaw, R. (1995). Principles of teaching. An Independent Study Textbook. Texas, U.S.A. ICIUniversity Press.
32
Selden, J., Selden, A. and Mason, A. (1994), —Even Good Calculus Students Can’t SolveNonroutine Problems,ll in J.J. Kaput and E. Dubinsky (eds.), Research Issues in UndergraduateMathematics Learning: Preliminary Analyses and Results, Mathematical Association ofAmerica, Washington.
Thompson, P.W. and Thompson, A.G. (1994), “Talking about rates conceptually, Part I: Ateacher’s struggle,” Journal for Research in Mathematics Education, 25 (3), 279-303.
Kwesiga, C.J. (2002). Women’s access to higher education in Africa: Uganda’s experience.Kampala: Fountain Publishers Ltd.
Kyoshaba, M. (2009). Factors affecting academic performance of undergraduate students atUganda Christian University.
NCCE (2008). Minimum Standards for NCE Teachers — Vocational and Technical . Abuja:National Commission for College of Education.
Grote, M.(1995). Sure You Care, But Do Students Know It? The Physics Teacher, 33(Feb.1995), pp 92-95.
Grote, M (1994). Recruiting Students for High-School Physics Classes. The Physics Teacher,32(Septernber 1994), pp 350-35 1.
Hakirn, T.(2007). High School Physics Enrolment Hits RecordHigh. Science Daily. January 11th.
Elimu News. (2007), A Newsletter of the Ministry ofEducation. Issue No. 1.
Elliot, W.E. (2000). Prospects: the quarterly review of comparative education. Paris, Vol 30 no.3, UNESCO.
33

Eisner, E.W. (2000). Benjamin Bloom 1913-99. A Paper by Prof Elliot
W. Eisner UNESCO Bureau of Education. Enger, E. D and Ross, F. C. (2000). Concepts inBiology. Boston, USA, The McGraw-Hill Companies.
Farmer, M.H.(1993). Preparedness Assessment of First Year Physical Science Students in a Two— Year College. Journal of College Science Teaching. Pp. 346 350.
Ross K.A.(1998), —Doing and Proving: The Place ofAlgorithms and Proofs in School
Mathematics, American Mathematical Monthly, 105 (3), 252-255.
Schoenfeld, A.H. (1992), —Learning to Think Mathematically: Problem Solving, Metacognition
and Sense Making in Mathematics,ll in D.A. Grouws (ed.), Handbook of Research on
MathematicsTeaching and Learning, Macmillan, New York, 334-370.
Selden, J., Selden, A. and Mason, A. (1994), —Even Good Calculus Students Can’t Solve No
routine Problems,I~ in J.J. Kaput and E. Dubinsky (eds.), Research Issues in Undergraduate
Mathematics Learning: Preliminary Analyses and Results, Mathematical Association of
America, Washington.
Singh, C. (2001), —Student understanding of quantum rnechanics,II American Journal of Physics,
69(8), 885-895.
Smith, D.A. and Moore, L.C. (1996), Calculus: Modeling and Application, D.C. Heath and Co.
Massachusetts.
34

AppendixStudent’s questionnaire.
Nanie of the school:,,,,
Class;.
Sex; Female Male
Age ; Mark in your age blacked.
Below 16 16-18 Above 18
‘IIn the table below, you’re required to answer by ticking your best choice among thefollowing options as stated besides every question given.
Strongly Agree (SA), Agree (A), Disagree (D) and Strongly Disagree (SD).
2 Do high qualified teachers have enough content to give learners
than lowly qualified teachers
A good relationship between teachers and students encourages
high performance than poor relationship between them.
3 Does high qualified teachers create a conducive classroom for
learners than lowly qualified teachers
Do high qualified teachers use better techniques that make
students to learn than lowly qualified ones
35

4 Does high qualified teachers give learners well explained work
than lowly qualified teachers
B Parent’s economic status, SA A } N D SD
1 High income parents are more involved in their children’s
education than low income parents
2 Students who come from poor family background have lower
self-esteem than those from rich families
3 My parents struggle financially to cater for my educational
needs
C ParenVs level of education. SA A N D SD
1 Highly educated parents are more involved in their children’s
education than lowly! uneducated parents.
2 ~ts wfth hig~ rievelo ducation are able to set conducive
learning environment at home than those with lower level of
education
3 Children whose parents are highly educated are more proficient
in language (English) than those whose parents have low level
of education
36

AppendixTeachers Questionnaire.
Subject of the teacher
Sex; Female Male
Age; Below 20 21-35 36-50 Above 50
Qualification: mark appropriately in the table below.
~~ster’s Degree Bachelor’s Degree Certificate. 1Number of years taught:
Less than 5 6-10 1i~15 16-2G~~andabove
In the table below, you’re required to answer by tickingfollowing options as stated besides every question given.
Strongly Agree (SA), Agree (A), Disagree (D) and Strongly Disagree (SD).
Do high qualified teachers use better techniques that make
students to learn than lowly qualified ones?
your best choice among the
2 Do high qualified teachers have enough content to give learners
than lowly qualified teachers
A good relationship between teachers and students encourages
high performance than poor relationship between them.
3 Does high qualified teachers create a conducive classroom for
Name of the school
37

learners than lowly qualified teachers
4 Does high qualified teachers give learners well explained work
than lowly qualified teachers
1 High income parents are more involved in their children’s
education than low income parents
2 Students who come from poor family background have lower
self-esteem than those from rich families
3 My parents struggle financially to cater for my educational
needs
1 Highly educated parents are more involved in their children’s
education than lowly! uneducated parents.
2 Parents with higher level of education are able to set conducive
learning environment at home than those with lower level of
education
3 Children whose parents are highly educated are more proficient
in language (English) than those whose parents have low level
of education
38
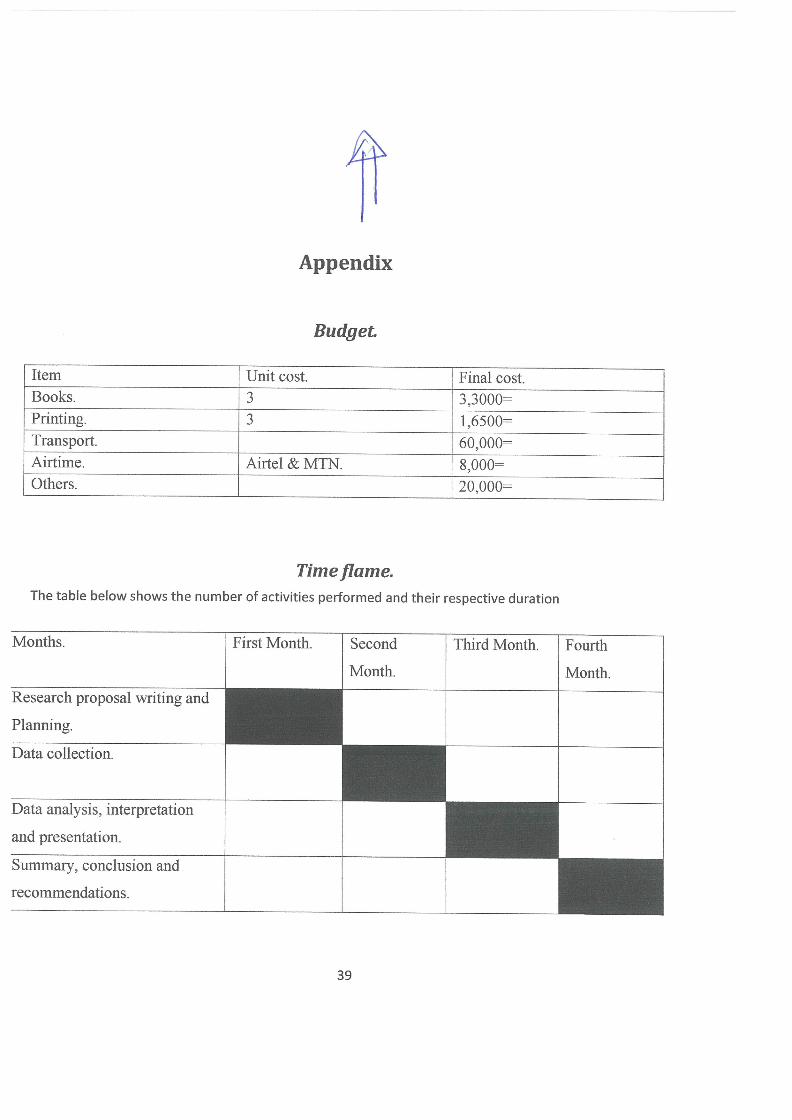
Appendix
Budget
Item Unit cost. Final cost.Books. 3 3,3000Printing. 3 1,6500=Transport. 60,000=Airtime. Airtel & MTN. 8,000=Others. 20,000=
Timeflame.The table below shows the number of activities performed and their respective duration
Months. First Month. Second Third Month. Fourth
Month. Month.
Research proposal writing and
Planning.
Data collection.
Data analysis, interpretation
and presentation.
Summary, conclusion and
recommendations.
39
Copyright © 2022 FDOKUMEN