Geotechnical engineering Geology Unit for pupils from 9-12 ...
Upload
khangminh22Category
view
4download
0
FACTORS INFLUENCING PUPILS’ ACADEMIC PERFOM ANCE IN
K.C.P.E EXAMINATION IN MUTONGUNI DIVISION IN KITUI
DISTRICT
UNIVERSITY OF NAIROBI EAST AFRICANA COLLECTION
* >* U S E ,N ™ R U B r **Y ONL5-
By
ANGELINA SABINA MULWA
A research project submitted in partial fulfillment of requirements for the degree of Masters of Education in
Educational Administration and Planning of the University ofNairobi.
August 2004
University of NAIROBI Library
0501472 5

DECLARATION
This Research Project is my original work and has not been presented for award in any
other university.
r _________ 4 - ^
ANGELINA SABINA MULWA Date
This Research Project has been submitted for examination with my approval as a
University Supervisor.
&
DR. STEPHEN I. AKARANGA
Senior Lecturer and Chairman,
Department of Philosophy and
Religious Studies, University of
Nairobi.
yDate

DEDICATION
To my dear husband Justus Munyoki and my children, Victoria, Kennedy, Stephen and
Valentine, for their encouragement, patience and support, which kept energizing me till I
completed this project work; and to my parents Alice Syindu and Dominic Mwandikwa
for the good academic foundation they laid on me.
UNIVERSITY OF NAIROBI CAST AFRICANA COLLECTION
V

ACKNOWLEDGEMENTS
First and foremost, my thanks go to the Almighty God for enabling me go through the
complex process of researching and writing this project.
Second, my gratitude goes to Dr. I.S. Akaranga - Senior Lecturer, Department of
Philosophy and Religious Studies - University of Nairobi, for supervising my work by
critically examining it and offering useful ideas and suggestions, without whose
assistance it would have been very difficult to accomplish the study.
Third, special thanks to the head teachers, teachers and Class Eight pupils of the schools
that participated in this study for their co-operation and provision of the necessary
information.
Fourth. 1 wish to acknowledge the efforts of my aunt-Susan Mwikali, brother-Joseph
Mwandikwa and cousin-Ronald Munyithya, for their assistance during the tedious
process o f data collection.
Finally, I thank all my family members for their moral and financial support.
And above all their patience and understanding while I undertook this very involving
ycourse.
iii

ABSTRACT
This study set out to investigate the factors influencing pupils' academic performance in
the K.C.P.E Examination in Mutonguni Division in Kitui District. It involved all public
primary day schools that had done K.C.P.E. examination for the years 2000-2003.
The study sought to:
i) Establish whether a pupil’s school time utilization affects his or her performance
in the K.C.P.E Examination.
ii) Investigate the effects of availability of human and material resources on pupil’s
performance in the K.C.P.E Examination.
iii) Establish whether community involvement in school matters influences a pupil’s
performance.
Stratified random sampling was used to obtain eleven (11) schools from the four zones in
the division. The respondents included all the head teachers from the sampled schools, 20
class eight teachers and 99 class eight pupils, who were randomly selected.
The necessary information was obtained through self-administered questionnaires and
informal interviews. The data obtained was analyzed using quantitative and qualitative
methods as well descriptive statistics. The findings of this study indicated that pupils’
academic performance in K.C.P.E Examination was mainly influenced by; 'y
i. Poor economic background/poverty, which made it difficult for the parents to provide
the schools with adequate physical facilities and learning resources.
ii. Heavy teachers’ workload, which did not allow them enough time for adequate lesson
preparations and revision before the examination.
iii. Poor time utilization as a result of absenteeism and lack of seriousness among the
pupils and some teachers as well as interruption of the learning process.
iv. Low educational achievement by parents, which made them, uncooperative and
ignorant o f what went on in schools.
In order to improve pupils’ academic performance the study recommended;
iv

i) improvement and upgrading of the economic status o f the rural folk through rural
electrification and provision of clean water which would promote self-
employment.
ii) Employment of more teachers, timely provision of teaching/learning resources and
famine relief food to the stricken areas.
iii) Schools’ adoption of policies that would foster hard work, teamwork and cohesion
among teachers, pupils and parents.
iv) Launching of a campaign to enlighten on the expected contribution towards
meaningful implementation of the ‘free’ primary education scheme so as to avoid
controversy.
The study identified the following areas for further research:
i. Research on performance in specific subjects;
ii. Research on K.CPE performance in other ASAL parts of the country;
iii. Research on KCPE performance in an urban setting.
V
v

TABLE OF CONTENTSPAGE
Declaration............................................................................................................................i
Dedication............................................................................................................................ii
Acknowledgements............................................................................................................ iii
Abstract.......................................................................................................................................... iv
Table of contents............ .............................................................................................................. vi
List of tables and figures...............................................................................................................x
Abbreviations.............................................................................................................................xiii
1.1.
1.2.
1.3.
1.4.
1.5.
1.6.
1.7.
1.8.
1.9.
2.0.
2.1.
CHAPTER ONE
GENERAL INTRODUCTION
Background of the study.................................................................................................. 1
Statement of the problem.................................................................................................6
Objectives of the study..................................................................................................... 8
Research Questions...........................................................................................................8
Hypotheses.........................................................................................................................8
Significance of the study..................................................................................................9
Scope and limitations of the study..................................................................................9
Definition of significant term s...................................................................^ ................10
Organization of the study............................................................................................... 11
CHAPTER TWO
LITERATURE REVIEW
Introduction............................................................................
School-based factors.............................................................
2.1.1 Teaching fo rce ..........................................................
2.1.2 School facilities, teaching and learning resources
2.1.3 School and class sizes..............................................
12
13
13
15
19
vi

2.1.4 School administration....................................................................................... 19
2.1.5 School climate.................................................................................................... 20
2.1.6 Time utilization..................................................................................................22
2.2. Household and community-based factors................................................................... 24
2.2.1 Socio-economic background............................................................................ 24
2.2.2 Parental-Community involvement in school matters..................................... 27
2.3. Summary of Literature Review.....................................................................................29
CHAPTER THREE
RESEARCH METHODOLOGY
3.0. Research Design..............................................................................................................30
3.1. Target population............................................................................................................30
.2. Sample and Sampling procedure................................................................................... 31
3.3. Research instruments....................................................................................... 33
3.4. Data collection procedures............................................................................................ 33
3.5. Pre-testing o f the instruments....................................................................................... 34
3.6. Data analysis techniques................................................................................................34
CHAPTER FOUR
DATA ANALYSIS AND INTERPRETATION'V
4.0. Introduction..................................................................................................................... 36
4.1. Questionnaire return rate................................................................................................. 36
4.2. Demographic information..............................................................................................37
4.3. Factors influencing pupils’ academic performance in KCPE....................................43
4.3.1 Availability of human and material resources...............................................43
4.3.2 Time utilization..................................................................................................56
4.3.3 Community/Parental involvement in school matters..................................... 62
4.4. Testing of
hypotheses..................................................................................................... 66
Vll

a) Time Utilization..........................................................................................................67
b) Availability of human and material resources....................................................... 68
c) Community involvement.......................................................................................... 69
4.5. Other factors that influenced pupils’ academic performance in KCPE in
Mutonguni Division....................................................................................................... 69
a) Factors believed to affect pupils’ performance negatively.................................. 69
b) Factors believed to promote academic performance..............................................70
c) Factors viewed by pupils as interfering with their academic performance.......70
CHAPTER FIVE
SUMMARY, CONCLUSIONS AND RECOMMENDATIONS
5.0. Summary..........................................................................................................................72
5.1. Conclusions........................................................................................... 72
5.2 Recommendations............................................................... .........................•••'•.............74
5.2.1 Parents............................................................................ 74A y
5.2.2 Local community................................................. 74
................................................................................................................ .745.2.3 Pupils.
5.2.4 Teachers..............................................................................................................75
5.2.5 Headteachers..................................................................................................... 75
5.2.6 Examiners (KNEC)........................................................................................... 76'V
5.2.1 Government (M OEST).................................................................................... 76
5.2.8 Recommendations for further research.......................................................... 77
REFERENCES 78
APPENDICES.................. 85
Appendix I - A list of schools researched on and their performance for the years 2000-
2003................................................................................................................................................85
Appendix II - Letter to the respondents................................. 86
Vlll

Appendix III - Questionnaire for Head teachers................................................................... 87
Appendix IV - Questionnaire for class Eight Teachers........................................................ 94
Appendix V -Questionnaire for class Eight pupils...............................................................100
IX

LIST OF TABLES AND FIGURES
Table 1 - National KCPE Subjects’ Mean Scores (2001-2003)..................................................4
Table 2 - Mutonguni Division KCPE Mean Scores (2000-2002)...............................................6
Table 3 - Zones and Schools in Mutonguni Division................................................................. 32
Table 4 - Zonal Distribution of Respondents.............................................................................. 37
Table 5 - Distribution of Respondents by Gender.......................................................................37
Table 6 - Distribution of Head teachers and class Eight teachers by academic
qualification..................................................................................................................................... 38
Table 7 - Distribution of Head teachers and Class Eight Teachers by professional
qualification.................................................................................................................... 39
Table 8 - Distribution of Head teachers by their administrative experience.......................... 39
Table 9 - Distribution of Head and Class Eight teachers by the number of years they had
served in their current schools......................................................................................40
Table 10 - Distribution of pupils by a g e .................................................................... 40
Table 11 - Distribution of pupils by number of children in their families.............................. 41
Table 12 - Parents’ education level as reported by pupils......................................................... 41
Table 13 - Parents’ Occupation..................................................................................................... 42
Table 14 - The distance covered by head teachers and teachers one way from their
residences to school.................................................................................................... 43
Table 15 - Head teachers’ and teachers’ means of transport in Mutonguni Division...........43
fable 16 - The population of primary schools in Mutonguni D ivision................................44
Table 17 - The population of Standard Eight classes in Mutonguni Division..................... 44
Table 18 - The population of teaching staff in primary schools in Mutonguni Division...45
Table 19 - The average number of lessons per teacher in a week.............................................. 45
Table 20 - The distribution of teachers in primary schools in Mutonguni Division by
category.........................................................................................................................46
Table 21 - Head teachers’ comments on the extent to which various practices are part
of their school policy ...................................................................................................47
Table 22 - Head teachers’ comments on whether teachers in their schools are required to
prepare various official documents as a matter of policy.......................................47
x

Table 23 - Class Eight teachers’ workload.................................................................................. 48
Table 24 - Subjects currently taught by C-lass Eight teachers................................................. 48
Table 25 - Number of teachers in Mutonguni who observed school policies (Practices as
reported by class Eight teachers)...............................................................................49
Table 26 - Teachers’ responses on practices depicting commitment to teaching.................. 49
Table 27 - Preparation of official documents.............................................................................. 50
Table 28 - Availability of teachers for class Eight subjects as reported by the pupils.......... 51
Table 29 - Pupils’ responses on the practices that indicated teachers’ commitment to
teaching.......................................................................................................................... 51
Table 30 - Head teachers’ comments on the availability of various teaching and learning
resources in their schools.............................................................................................52
Table 31 - Teachers’ comments on the availability of teaching and learning resources in
their schools.................................................................................................................. 53
Table 32 - Availability of basic teaching and learning resources in school as reported by
pupils........................................................................................................ 53
Table 33 - Head teachers’ comments on the availability of various physical facilities in
their schools................................................................................................................. 54
Table 34 - Teachers’ comments on the availability of various basic facilities in their
schools............................................................................................................................ 55
Table 35 - Availability of various basic facilities in school as reported by pupils................55
Table 36 - Head teachers’ opinion on the effect of distance covered by teachers and
pupils between their home and school on pupils’ performance in School............56
Table 37 - The effect of distance covered by teachers and pupils from home to school on
pupils’ performance..................................................................................................... 56
Table 38 - Distance covered by pupils daily from home to school.......................................... 57
Table 39 - Actions taken by teachers against pupil absenteeism..............................................58
Table 40 - Means by which pupils got their lunch meals in Mutonguni Division.................59
Table 41 - Pupils’ study habits...................................................................................................... 59
Table 42 - Pupils’ repetition rate................................................................................................... 60
Table 43 - The amount of pupils’ learning time consumed by various activities.................. 60
xi

Table 44 - Factors that negatively affect pupils’ academic performance as rated by Head
teachers and class Eight teachers............................................................................... 61
Table 45 - The distribution of schools in terms of whether or not they have a rewarding
system for good performance as reported by head teachers.................................. 62
Table 46 - The absence or presence of the rewarding system for teachers and pupils as
reported by the teachers...............................................................................................62
Table 47 - The schools’ policies on parents/community involvement in school
activities/matters...........................................................................................................63
Table 48 - The extent to which the schools practically involved parents/community in
school activities/matters as reported by teachers..................................................... 63
Table 49 - The level of participation by parents/community in school activities as
reported by the pupils................................................................................................... 64
fable 50 - Class Eight pupils Term I (Current) level of performance and (expected) level
of performance in KCPE 2004....................................................................................65
Table 51 - The values assumed by the variables in each school........................... :................. 66
Table 52 - A summary of the relationship between independent and dependent variables..67
Figure I- Conceptual framework................................................................................................... 28
V
xii

ABBREVIATIONS
AIDS Acquired Immune Deficiency Syndrome
A.S.A.L Arid and Semi-Arid Lands
E.F.A Education for All
HIV Human Immune Virus
K.N.E.C Kenya National Examination Council
MOEST Ministry of Education Science and Technology
SACMEQ Southern African Consortium for Monitoring Education Quality
T.S.C Teachers Service Commission
UNESCO United Nations Educational Scientific and Cultural Organization
C.P.E Certificate of Primary Education
E.A.A.C.E East Africa Advanced Certificate of Education
E.A.C.E East Africa Certificate of Education
K.A.C.E Kenya Advanced Certificate o f Education
K.C.E Kenya Certificate of Education
K.C.P.E Kenya Certificate of Primary Education
K.C.S.E Kenya Certificate o f Secondary Education
K.J.S.E Kenya Junior Secondary Examination
A.T.S Approved Teachers Status
SI Secondary Teacher 1
PIV
Primary Teacher 1
P2 Primary Teacher 2
P3 Primary Teacher 3
X l l l

CHAPTER ONE
GENERAL INTRODUCTION
1.0. BACKGROUND OF THE STUDY
The Kenya government has given priority to education in its National Development
plans since her political independence. The government, parents and other stakeholders
have over the years invested significant resources to expand and improve education at all
levels. Since education is a fundamental strategy for human resource development, it has
been viewed as an important input in the development process through the human capital
that is embodied in and embedded on its beneficiaries. Thus explanation by (Smith,
1937) as quoted by Blaug (1969) states that;
"... the acquired and useful abilities o f all the inhabitants or members o f the
society (who undergo education). The acquisition o f such talents, skills and
abilities is a capital fix e d and realized, as it were in his person. Those talents
as they make a part o f his/her fortune so do they likewise o f that o f the society
to which he/she belongs. The improved dexterity o f a workman may be
considered in the same light as a machine or instrument o f trade which
facilita tes and abridges labour, and which though it costs a certain expense,
repays the expense with profit. ” .
Schultz (1961), Blaug (1967, 1969) and Psacharopoulos (1973) have identified and
documented the benefits of education as ranging from its role, in promoting economic
growth, enhancing productivity, reducing poverty, increasing individual earnings, the
spill over of benefits to the society, resulting from educated individuals and enhancing
democracy and good governance among others.
It is therefore agreeable that education is a worthwhile investment. For example,
investment at the primary school level earns the government more social returns than all
other levels of education. Psacharopoulos (1985) has discovered that the private returns
1

to education increase with the level of education. And, the university has the highest
private returns.
According to Reilly (1995);
“Elementary schools serve as children’s first introduction to the world o f education; a
world which will dominate and shape their lives for the next 12 or 13 years. A child’s
economic and social success is, to a significant extent determined by how well he or she
performs in school during these first critical years. The evaluation and prediction o f a
child's future, based on his/her performance occurs through both formal and informal
educational efforts. ”
In Kenya, primary education currently lasts Eight years and is offered to children ranging
from 6 to 14 years of age (except for special cases). The goal of primary education is to
provide access to quality education to all children of primary school-going age on an
equitable basis thus ensuring education for all at this level. (Ministry of Education,
Science and Technology, 2001: 15)
Primary education as noted by (Macharia 1992) in Asuga (2002). Plays a crucial role in a
pupils’ life. In the current 8-4-4 system of education, the academic achievement of the
primary school pupils is assessed through the Kenya Certificate of Primary Education
(KCPE) Examination. 'This examination which offered by the Kenya National
Examination Council (K.N.E.C - an organ of the Ministry of Education) is administered
to primary school pupils at the end of their Eight-year course. The KCPE is the first
National Examination to be taken in the child’s life in Kenya. It is also the most sensitive
examination because the results obtained by candidates are used as the yardstick for
selection and placement in various institutions of post primary education such as
National, Provincial and District secondary schools.
Bogonko, (1992) notes that KCPE has been reduced to a mere selection device for
secondary education entrance, thus ignoring the needs of pupils for whom the primary
school education is terminal. However, Psacharopoulos (1985) observes that:
2

“Examinations that determine pupils’ chances o f proceeding with education from
primary to secondary have a decisive effect on measures o f output from primary schools,
and often cause high rates o f wastage and repetition in the developing countries. "
Psacharopoulos further warns that examinations may be an inefficient criteria for
selection. They may fail to measure skills, knowledge and ability accurately. They could
fail to predict future levels of achievement, and may disrupt the curriculum and teaching
methods as both teachers and pupils become dominated by examinations lose sight of
the wider educational objectives, an attitude referred to as “Diploma disease” which is
very common in developing countries.
Eshiwani (1983), states that poor performance not only leads to undesirable wastage
through dropouts and repeaters but also denies a pupil the continuation of schooling
through the formal system of education. He further concludes that, “if any region of the
country lags behind either in the number of pupils who attend school or in the number of
pupils who pass important national examinations, that region cannot efficiently
participate in the democratization of education.”
In Kenya, the quality of education including its relevance to the country's needs has been
questioned by the parents, employers and other stakeholders in education. Overloaded
curricula, lack of teaching materials, poor teaching approaches, poor or lack of adequate
supervision and low morale of teachers are among the factors cited for th^poor quality
of education (MOEST, 2003). Although the government, parents and other stakeholders
have invested a substantial amount of resources in education, the Technical Working
Group (MOEST 2003) argues that, “investing resources in poor quality education is like
not investing at all.”
Although the primary school education is dominated by the desire of parents, teachers
and pupils to excel in the KCPE Examinations, pupils performance in KCPE has been
unsatisfactory nationwide. Prof. George Saitoti, the Minister of Education, science and
3
technology on receiving the 2003 KCPE results from the chairman of the Kenya National
Examination Council (Prof. Raphael Munavu) made the following observations:
• English, Mathematics and Science were still a big headache to primary school pupils
• A downward trend was a threat to the national goal of Industrial and economic
development
• The analysis of candidates’ performance indicated English as the most poorly done
with the mean score of 38.54% followed by Science at 42.72 % and Mathematics at
44.22 %.
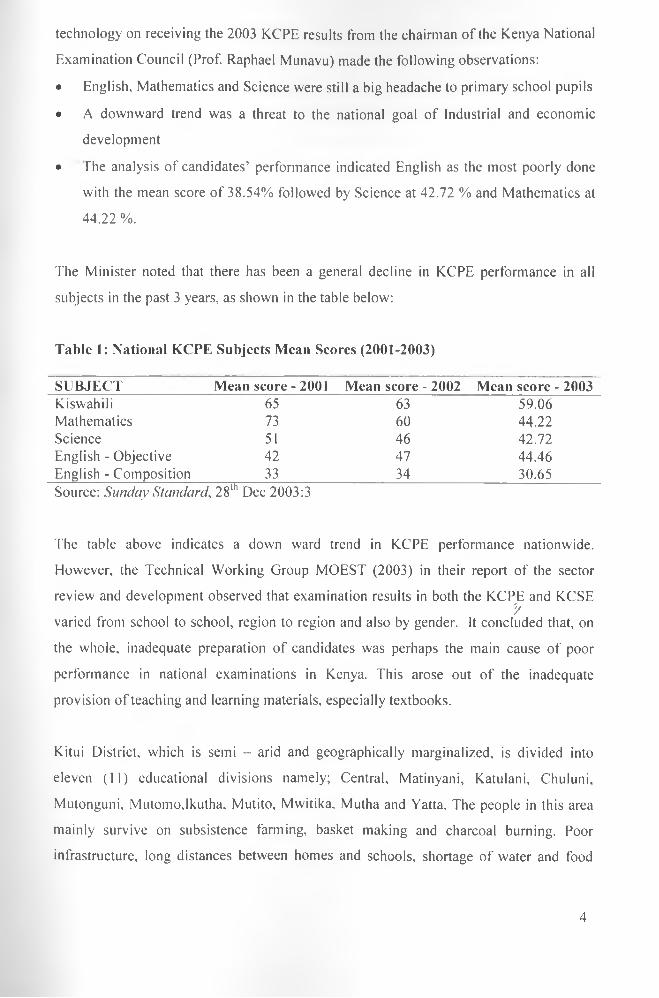
The Minister noted that there has been a general decline in KCPE performance in all
subjects in the past 3 years, as shown in the table below:
Table 1: National KCPE Subjects Mean Scores (2001-2003)
SUBJECT Mean score - 2001 Mean score - 2002 Mean score - 2003Kiswahili 65 63 59.06Mathematics 73 60 44.22Science 51 46 42.72English - Objective 42 47 44 .46English - Composition 33
7 nth r\34 30.65
Source: Sunday Standard, 28th Dec 2003:3
The table above indicates a down ward trend in KCPE performance nationwide.
However, the Technical Working Group MOEST (2003) in their report of the sector
review and development observed that examination results in both the KCPE and KCSEy
varied from school to school, region to region and also by gender. It concluded that, on
the whole, inadequate preparation of candidates was perhaps the main cause of poor
performance in national examinations in Kenya. This arose out of the inadequate
provision of teaching and learning materials, especially textbooks.
Kitui District, which is semi - arid and geographically marginalized, is divided into
eleven (11) educational divisions namely; Central, Matinyani, Katulani, Chuluni,
Mutonguni, Mutomo,lkutha, Mutito, Mwitika, Mutha and Yatta. The people in this area
mainly survive on subsistence farming, basket making and charcoal burning. Poor
infrastructure, long distances between homes and schools, shortage of water and food
4

characterize the area. The region also experiences frequent drought accompanied by
famine. The geographical challenges of this area have a historical dimension arising from
the colonial experience, which marginalized the Arid and Semi Arid Lands (ASAL).
This includes infrastructure and other developments, which were concentrated along the
highlands and agriculturally productive areas resulting into geographical disadvantages
that persist to date.
Due to lack of reliable sources of income for many households in the area, many school
going children spend most of their “out of school” time in economic activities, such as
charcoal burning and selling, rope making, water selling (to give only few examples).
Others who miss school for a whole day either go to the market or just take care of their
younger siblings, while their parents go looking for food and other basic needs for their
families.UNIVERSITY OF NAIROBI EAST AFRICANA COLLECTION
The fact that children participate in home based production tasks and other income
generating activities, this makes the opportunity cost of schooling extremely high. This
further makes the pupils’ attention to be always divided between school and home
activities. For example, a good number of pupils who enroll in class one drop out before
the end of the Eight years primary school course, while majority of those who survive to
the end of the course perform dismally in the KCPE Examination. Poor performance
denies them chances of joining National and Provincial Secondary Schools, which to
some extent could guarantee them entry to institutions of higher learning.
y
Mutonguni Division being one of the eleven Educational Divisions in Kitui Districts is
characterized by the same features mentioned above. The division is divided into four
zones, namely Kauwi, Tulia, Katutu and Musengo. Mutonguni Division performs as
dismally as the district in the KCPE Examinations.
The table below shows the Division’s and the District’s performance in KCPE for the
years 2000, 2001, and 2002.
5

Table 2: Mutonguni Division KCPE Mean Scores (2000-2002)
Year Mean Scores Expected Scores2000 347.10(336.84) 7002001 241.76 (228.84) 5002002 235.97 (233.06) 500Source: District Education Office Kitui District
The above data indicates that both the Division and the District have been performing
below average (district mean scores are shown in brackets). This means that the majority
of pupils who sit for the KCPE Examination score below the expected standard. And
since the KCPE results are used for Form One selection and placement in various
categories of Secondary Schools, majority of them miss places in such schools, due to
poor performance in their examinations.
For example, out of the total population of the pupils enrolled for KCPE in the years
2000 and 2001 in Kitui District, only 36% and 35% respectively managed to get places
in both private and public schools in the country. The rest either considered repeating
class Eight or terminated their formal education at that level. This is wastage of resources
to the pupils, parents and the government.
This situation is very worrisome to people who value and care about education.
Noteworthy is the fact that, no research has been carried out to establish factors leading
to the poor performance of candidates in KCPE Examination in Kitui Disfpct. There is
therefore need for research to be carried out to establish and document the factors
influencing pupils' poor performance in the KCPE Examination in the district.
1.1. STATEMENT OF THE PROBLEM
In general terms, the most important manifestations of schooling quality include;
literacy, greater cognitive abilities and better student performance in examinations
(Deolalikar, 1999). Internationally, pupils’ examination scores have been accepted and
used as a proxy of achievement (Psacharopoulos, 1985).
6

Despite the government policy of promoting social equality through provision of
education (Ominde Report, 1964), KCPE is used to stratify pupils into classes as those
who attend the National and good Provincial Secondary Schools take the lion’s share of
the limited University places available in the country and thus end up in better paying
professions.
Eshiwani (1983) points out that poor performance leads to undesirable wastage through
dropout and repeaters. It also denies a pupil the continuation of schooling through the
formal system of education and affects the transition rate from the Primary to Secondary
school level, posing a threat to the government effort to achieve Education For All (EFA)
by 2015 UNESCO, (2002). Further more, Eshiwani cautions the government by noting
that, if a region of the country lags behind either in the number of pupils who attend
school or the number of pupils who pass important National Examinations, that region
cannot efficiently participate in the democratization of education.
Elimu Yetu Coalition (2003) having realized that Arid and Semi-Arid Lands (ASAL)
have lagged behind in enrollment, participation and performance in National
Examinations recommended that efforts need to be made to implement policies that will
stimulate enrollment, survival and better achievement by students in these areas.
However, it would have been unrealistic to try to provide solutions to or solve problems
whose causes had not been established or ascertained. It was therefore imperative to
carry out research and establish the root causes of the problems mentioned'above. This
study therefore investigated factors that influence pupils’ academic performance in
KCPE Examination in Kitui District. The study further underscored Mutonguni Division
in Kitui District, which is one such area where pupils performed dismally in KCPE.
Examinations.
7

1.2. O BJECTIVES OF THE STUDY
The study sought to:
i) Establish whether a pupil’s school time utilization affects his or her performance in
the KCPE Examination.
ii) Investigate the effects of availability of human and material resources on pupils'
performance in the KCPE Examination.
iii) Establish whether community involvement in school matters influences pupils’
performance in the KCPE Examination.
1.3. RESEARCH QUESTIONS
The following research questions were developed to facilitate the study:
i) Does a pupil's school time utilization affect his/her performance in the KCPE
examination?
ii) Does the availability of human and material resources in Schools affect Pupils’
performance in the KCPE Examination?
iii) Does community involvement in school matters influence pupils’ Performance in
the KCPE Examination?
1.4. HYPOTHESES
The study was guided by the following hypotheses;
HI There is a relationship between a pupil's school time utilization and his/her
performance in the KCPE Examination
H2 Availability of human and material resources in schools affects pupils’
performance in the KCPE Examinations
H3 Community involvement in school matters influences pupils’ performance in the
KCPE Examination.
8

1.5. SIGNIFICANCE OF THE STUDY
This study underscores the fact that, poor performance in KCPE leads to undesirable
wastage through dropouts and repeaters; denies a pupil the continuation of schooling
which is a basic human right. This in turn affects the transition rate from primary to
secondary school levels, and poses a threat to the governments’ policy of achieving
Education for All (EFA) by 2015, UNESCO (2002).
Identification of the factors influencing KCPE performance would be very useful in
improving performance in Mutonguni Division, Kitui District and in the country at large.
The findings of the study would be useful to planners and policy makers in resource
allocation. Students, teachers and parents are also made aware of the crucial role that
they should play to ensure good performance in KCPE. And once KCPE results are
improved, wastage through repeaters and dropouts will be reduced. Many pupils will
then be able to continue with schooling and enhance the transition rates from primary to
secondary, thus fulfilling the government policy of striving to achieve Education for All
by 2015.
1.6. SCOPE AND LIMITATIONS OF THE STUDY
This study was carried out in Kitui District. However, due to the big number of Schools
(over 400) and the distance between one school and another, it was very difficult to cover
the whole District. Hence, the study was based in Mutonguni Division. jt focused on
public primary schools that had done KCPE Examinations for the last four years namely;
2000, 2001, 2002 and 2003. The hilly terrain and poor infrastructure were a major
handicap to the researcher. Another limitation was that the introduction of the free
primary education in the year 2003 had brought major changes in the operations and
condition of the schools as primary schools had been provided with teaching/iearning
materials and were not allowed to charge any levies from the parents.
9

1.7. DEFINITION OF SIGNIFICANT TERMS
KCPE Examination: The National Examination taken by Primary School pupils at the
end of the eight-year primary school course. It is referred to as the Kenya Certificate of
Primary Education.
KCSE. Examination: The National Examination taken by Secondary school students at
the end of the 4-year secondary school course. It is referred to as the Kenya Certificate of
Secondary Education.
Kenya National Examination Council: An organ of the Ministry of Education that
deals with examinations. It administers National Examinations to all primary and
Secondary schools, and other post-Secondary public institutions of learning except
Universities.
Enrolment: The number of pupils who register as members of the different classes at the
beginning of every year.
Mean score: An average point showing individual or group achievement in examination
performance.
Primary Education: The level of formal education, which precedes secondary cycle. In
Kenya, it takes eight (8) years at the end of which the pupils sit for the KCPE
Examination. This examination is used to determine whether the pupils can qualify to
join secondary education.
Pupil’s academic performance: The grades a standard Eight pupil has attained in the
KCPE as indicated by his/her mean score.
8.4.4 System of Education: The system of education, which is currently'followed in
Kenya. It was recommended by the Mackay report and encompasses eight (8) years of
primary education, 4 years of secondary and at least 4 years of University education
Repetition: A year spent by a pupil doing the same work in the same grade as his or her
previous year in school.
Zone: An area smaller than a division, which comprises a number of schools where the
zonal inspector of schools is in-charge.
Human Resources: The teaching staff.
Material Resources: Physical facilities and teaching and learning resources.
10

1.8. ORGANISATION OF THE STUDY
The study is organized into five chapters.
Chapter One contains some background information to the study, the research problem,
objectives of the study, research questions, hypotheses, significance of the study, scope
and limitation of the study, definitions of terms as used in the study and organization of
the study.
Chapter Two presents a literature review relevant to this study on, “Factors affecting
pupils academic performance in KCPE Examinations,” (school based, and household and
community-based factors), the conceptual framework and a summary.
Chapter Three consists a detailed description of the research methodology used in the
study. Chapter Four consists of data analysis and interpretations; while Chapter Five
presents the main findings, conclusions, recommendations and suggestions for future
research.
11

CHAPTER TWO
LITERATURE REVIEW
2.0. INTRODUCTION
Provision of educational opportunities especially basic education has been an objective
of investment many countries all over the world, Kenya included. Basic education has
been considered as a right which nations have an indisputable responsibility to guarantee
their citizens (Abagi, 1998).
Primary school education is dominated by the desire of parents, teachers and pupils to
excel in the Kenya Certificate of Primary Education (KCPE) Examination, which is
taken at the end of the primary cycle. This examination is mainly used for selection and
certification purposes.
Many researches have been conducted to establish factors that affect pupils’ academic
performance so as to improve the quality and relevance of education. However, Elimu
Yetu Coalition (2003) has documented five observations regarding examination
performance in Kenya as being the:
i) general decline in performance.
ii) consistent better performance by boys against girls.
iii) over better performance by private schools and elite public sch^pls that are
invariably patronised by children of the elite.
iv) reality that this trend is consistent in both primary and secondary schools.
v) fact that science subjects tend to register lower scores than the non-science
subjects.
These observations show that a lot remains to be done to improve examination
Performance. Below is a review of the researches that have already been done in this
field. In these studies, factors that affect pupils’ academic performance have been
divided into two main categories; a) School-based factors and b) Household and
community-based factors.
12

2.1. SCHOOL-BASED FACTORS
2.2.1. Teaching force
Teachers' qualifications have been identified as a crucial factor influencing performance.
The findings of Bett (1986) on the factors influencing performance in Kericho District
revealed the fact that unequal distribution of graduate teachers and the ineffective role
played by the teachers and headteacher, were major factors influencing performance in
the District. He also established that the quality of teaching staff in a school was often a
main determinant in the achievement of students in the examination.
Eshiwani (1982) and (1983) also reported a correlation between students’ performance
and teacher characteristics, which include his or her qualification. He revealed the fact
that many schools perforin poorly in National Examinations for the reason that 40% of
teachers in primary schools are untrained. Therefore, quality of teachers played an
important role in a school’s performance.
Osman (1989), in his study on poor performance in KCPE in North Eastern province
attributed such poor performance to the following prevailing conditions:
• Inequitable distribution of teachers,
• Very few in-service courses given to untrained teachers,
• Most schools were understaffed,
• Shortage of classrooms, desks chairs and textbooks, /
• Unsupportive parents,
• Poor means of transport which made it impossible for the teachers and pupils to
report to school on time.
Maundu (1980) carried out a study on the relationship between Kenyan secondary school
pupils’ needs to achieve and their performance in school subjects. His findings
underscored the fact that academic qualifications of teachers and the availability of
teaching/learning resources were the most important factors that determined learners'
achievements. The study established that Harambee schools, which relied mainly on
13
untrained teachers, had a failure rate of 37.7% in the National Examinations as compared
to 2% for the government schools which were generally manned by trained teachers.
Although the candidature of the Harambee schools might not have been as good as that
of the government schools, one may conclude that the low quality of teachers contributed
to poor examination performance.
Abagi (1997) points out that, although it is a common belief among both teachers and the
public that low pupil-teacher ratio and teachers' high qualifications result in good
performance in school, studies from other regions have indicated results contrary to this
belief. For example, Wad Haddad’s (1978) study has indicated that, “on the basis of
available data no optimum class size could be scientifically established as a function of
educational benefits”. In Haddad’s (1978) review, it was concluded that, the manner in
which a teacher organises and motivates the class is more important than the class size,
and that, savings made from increased class size might be invested in teacher-training or
educational materials, which have been shown to have stronger effects on learners’
achievement. It is pointed out by Abagi (1997) that high or very low pupil-teacher ratio
is one of the main reasons for the poor quality and low efficiency, which characterize
primary education in Africa. Abagi (1997) in his study on the efficiency of primary
education in Kenya, justified that low or very high pupil-teacher ratio could lead to poor
performance and inefficiency.
Teachers' attitudes towards their work and pupils, class management and interaction
with pupils have a great impact on the academic achievement and the retention in school
of their pupils, particularly girls. Abagi (1997) says that few classroom observations in
Kenya indicated that there are cases where teachers’ negative attitudes “push” pupils out
of school. Such pupils are sometimes neglected, abused, mishandled and sent out of class
during teaching-learning periods. This atmosphere is not conducive to learning and
makes some children especially girls hate to school. Abagi concludes that obvious results
of all this are absenteeism and poor performance, if not non-completion of the education
cycle.
14

According to MOEST (2003) report of the sector review and development, the
characteristics that shape the teacher quality include;
• Formal educational attainment,
• Experience gathered by the teacher,
• Subject mastery and
• Availability of the teacher.
Formal educational and the teacher training attainment are positively correlated with the
teacher's knowledge and with their ability to impact knowledge to students.
The National Primary School Baseline (NPB) survey (1998) in MOEST (2003)
established that, teaching is dominated by transmissional forms of teaching in which
pupils are passive and expected to recall when required to. There were no pupil-initiated
discussions and pupils' responses were therefore limited to recall of information. There
was little use of praise as an incentive to the learning process, and little opportunity for
group work to promote problem-solving activities. Lack of textbooks also meant a lot of
time wastage while teachers wrote notes on the blackboard. There was little evidence that
teachers assessed the understanding of pupils before proceeding to the next topic. This
could have a negative effect on pupils’ performance in examinations.
Cynthia Cuttman (UNESCO, 2002) maintains that, “the quality of education will not
improve without a critical look at teachers' practises, the in-service training workshop,
give teachers a personal and professionals boost, allowing them to use new Materials and
inject more life and participation in their classrooms”.
2.1.2 School facilities, teaching and learning resources
Many scholars agree that a school’s physical facilities such as classrooms, laboratories,
desks and books have a direct bearing on good performance among students in
developing countries. Mwamwenda and Mwamwenda (1987) cited in Ayoo (2002)
carried out a study on the effects of a school’s physical facilities on the performance of
standard seven (7) pupils in examinations, in Botswana. The study established that the
availability of facilities had a direct link with the performance of pupils in examinations.
15t
Heyneman and Loxely (1983) in Mukundi (1999) show that the presence of the school
library related significantly to achievement in Brazil, China, Botswana and Uganda.
Shiefelbein and Simmons (1978), in their review of factors affecting the academic
achievement of school children concluded that the less developed a society is, the
smaller the influence of home background on achievement, and the greater the effect of
school variables. It has been established in a sample of twenty-nine countries that the
proportion of explained test scores variance attributable to the school quality is lowest in
developed countries such as Australia, Japan, Sweden and the United States of America
but it has twice or three times as high in Brazil, Botswana, India or Thailand.
Eshiwani’s(1983)study on the factors influencing performance among primary and
secondary schools in Western province of Kenya established similar findings. He
affirmed that schools which had the best facilities in the province were among the high
achievers and that those with inadequate facilities performed dismally in the Kenya
Certificate of Education (K.C.E) Examination.
Among the facilities that Eshiwani envisaged to be important were; libraries, textbooks,
classrooms, dormitories, visual aids, electricity, water and play grounds. Based on
research findings, he concluded that the presence or absence of school facilities
distinguished high achieving from low achieving schools.
The findings of Wamahiu, Opondo and Nyaga (1992) supported this view. Thesey
scholars carried out a study on the educational situation for the Kenyan girl-child, and
confirmed that poor learning environments in the unaided (harambee) schools, restricted
curriculum, lack of laboratories, and unqualified staff led to poor performance of
majority of students in national examinations in Kenya.
Gakuru (1982) cited in Ndiritu (1999) indicated that the condition of school buildings
was an important aspect in learning. He revealed that teachers in classrooms with
lockable doors and windows could be able to leave their teaching aids in their classes for
as long as they wished without the fear of either damage or theft, while those without
lockable doors and windows experienced storage problems.
16

Mukundi (1999) also identified the lack of facilities as a major contributing factor
towards poor performance in Kiambaa Division. A study by Ayoo (2002) on the factors
affecting students' performance in Kenya Certificate of Secondary Education (KCSE) in
public secondary schools in Maseno division also established that learning facilities also
affected performance of students in the KCSE Examination. The schools that had
adequate learning facilities recorded satisfactory and good performance, while those that
had inadequate learning facilities performed dismally. Based on the findings she
concluded that high level of availability of facilities permitted high degree of learning
achievement, while low level of availability of facilities led to poor performance. Ayoo's
study is different from the current study in that it was meant to establish the factors
affecting academic performance (in KCSE) at the secondary school level in Maseno
division.
The MOEST (2003) Technical Working Group recognizes that “the availability of
Educational materials has a major bearing on educational outcomes. These materials
include textbooks, equipment, furniture, library facilities and student writing materials”.
Surveys carried out in Kenya by the Southern African Consortium for Monitoring
Education Quality (SACMEQ, 1999) as quoted by MOEST (2003) revealed that there
was a critical shortage of textbooks, equipment and physical facilities. There were also
major inter and intra-provincial resources variations in availability, directly contributing
to their performance in national assessments. The Technical Working Group underscored
the fact that the availability of textbooks and other learning materials has perhaps been
the most constraining resource to educational quality in most rural schools in Kenya. The
group established that textbooks, designed for use led by teachers or students offer the
most explicit instructed design formats. Thus, the availability of these materials has
implications for immediate quality improvements in the educational system.
Studies conducted in other countries have also, explored the impact of teaching and other
related material inputs on students learning and achievement in developing countries.
Heyneman et al. (1984) evaluated a textbook program in Philippines, which was
introduced to raise the national level of academic achievement among students in three
17

subjects; Philippino, Mathematics and science, in two grades. The program reduced the
ratio of pupils per book per subject from an average of 10:1 to 2:1 and this marked
improvement in performance. The study concluded that there was a reasonable impact of
the availability of textbooks to pupils’ achievement in schools. The experience in the
Philippines also suggests that learning gains are frequently greatest among the poorest or
most disadvantaged pupils.
The evidence obtained from small-scale studies in other countries - for example Jamison
et al, (1981) in Psacharopoulos (1985) quoted a study, on the teaching of mathematics in
Nicaragua and suggested that investment in books could significantly improve the
efficiency of education, particularly at the primary level. This study established that it is
not enough simply to provide textbooks. Some efforts must be made to ensure that these
textbooks are adequately used. In addition, attention must be paid to quality control and
institution building as objectives of textbooks and publishing projects and not only on the
production and distribution of the books.
With regard to the availability of textbooks in Kenya, the Technical working Group
(MOEST 2003) in their report of the sector review and development revealed that two
major cost issues exist. The first relates to the production and distribution of books,
while the second is on to textbook financing.
The cost of textbooks is determined by the publishing capacity existent in the country,
transportation infrastructure and the administrative capacity for management and
distribution. Parents in Kenya have the sole responsibility of sacrificing their resources,
especially the poor so as to obtain textbooks for their children. The burden is even higher
as they have to meet the extra distribution cost of delivering books to remote and rural
areas.
In the same Report, it is further noted that although text books are being provided under
the Government’s policy of Free Primary Education (EFA), the ratio of 3:1 in lower
primary and 2 :1 in upper primary, is currently inadequate. Teachers’ guides and other
teaching materials are provided but supplementary reading materials are lacking under
18

the free primary education. In situations where there is a large preponderance of under
qualified teachers, textbooks play a significant role in the learning process in addition to
being a resource information where, instructional materials could be a curriculum design
format and training device for the under qualified teachers.
2.1.3 School and class sizes
According to TSC statistics, (MOEST 2003) average school sizes in Kenya ranges from
182 in Tana River to 796 in Nairobi. The average class size ranges from 22 in Tharaka to
43 in Nakuru municipality. It is noted that in both school and class sizes, the highest
enrolment is found in high potential urban areas like Nairobi and Nakuru. The technical
working Group (MOEST 2003) established that large classes have a negative effect on
the teaching and learning process, because teachers can hardly adequately pay attention
to slow learners or effectively carry out proper assessment of their pupils. This in turn
affects pupils’ performance in examinations. It therefore recommends that classes need
to be kept within the optimum size of 50 pupils.
While small classes are believed to be ideal for teaching, Kariri notes in Ndiritu (1999),
that schools with a larger enrolment performed better than the smaller ones. He further
explained that this could have been due to the fact that larger schools attracted better
head-teachers with good administrative skills which created a conducive learning
atmosphere and teaching environment resulting into high academic achievement. He also
explained that larger schools received promptly and effectively adequate equipment and
textbooks for use in their schools. y
2.1.4. School administration
Duignan (1986) cfed in Asuga (2002) identified school leadership as one of the crucial
factors in a schools success. He pointed out that some of the activities that constituted
effective leadership by school principals include; setting an orderly atmosphere, creating
a climate of high expectations for the teachers and students, encouraging collegial and
collaborative relationships and building commitment among students and staff in order to
achieve the set school goals.
19

Griffin (1994) in his book, “School Mastery" argued that the school administration has a
direct bearing on the achievement of the learners because it plays a key role in
coordinating, directing and facilitating the learning process. He further points out that
many schools in Kenya have been brought down by poor management. The study by
Eshiwani (1983) also underscores the fact that schools that showed signs of goodi
performance had sound and efficient leadership. Head teachers of such schools were
actively involved in organizing the learning process of their schools and did not leave it
to mere chance. They were not only readily available in their schools but also
participated actively in the actual teaching process and were familiar with classroom
activities.
2.1.5. School climate
Creemers, (1994) in his educational effectiveness model, has identified the teacher-
related factors as well as student-related factors (school climate) that determine students’
achievement. At the student level, Creemers identified the students ‘background,
motivation and aptitudes as strong determinants of their achievement. At this level, he
identified two variables as being crucial to students’ achievement, namely time on task
and opportunity to learn. He defined “time on task” as the time students are willing to
spend on school learning and on educational tasks, which he considered as being
determined by both students motivation, and factors evident at bothe the school and
classroom level. Time on task was specified as being the time that students are actually
involved in learning. However, he pointed out that this time has to be filled by
opportunities which deal with the supply of learning materials, experiences #nd exercises
through which students can acquire knowledge and skills. He also identified the quality
of instruction as being an important determinant of the outcomes of education. In this
study, he singled out the quality of textbooks and other materials used by the teacher.
Creemers underscored teacher behaviour as an independent contribution to school
effectiveness by pointing out the important role of the teacher as being that of setting the
time framework (for lessons as well as for homework), organizing the instructional
environment, and providing, initiating and continuing the instructional process. He
20

concluded by listing the characteristics of effective teacher behaviours that positively
affect pupils' performance, which include;
• Effective class management/an orderly and quiet atmosphere,
• Use of homework,
• High expectations,
• Clear goal setting,
• Structuring the curriculum content,
• Clarity of presentation,
• Frequent questioning,
• Use of an immediate exercise after presentation of new content,
• Use of evaluation, feedback, and corrective instruction.
The important role of “out of class assignments” and homework in promoting
achievement of learners has also been advanced by other scholars. Shiefelbein and
Simmons (1981) in their review of research on determinants of school achievement
established a close relationship between the out of class academic assignments, and
achievements. Eshiwani (1983) in his study on the factors that influenced performance of
schools in Western Province concurred with the view that homework positively
influenced the academic performance of learners. He established that over 60% of the
schools studied have no serious follow up activities by either the teachers or head
teachers, while students ended up under achieving in national examinations. He thus
attributed the poor performance by Western Province schools partly to the neglect of
homework.
A study done by Lane and Tinto (1987) cited in South Worth et al (1990), revealed a
correlation between school climate characterized by rewards for academic excellence and
good discipline being valued by teachers and students good performance in school.
Studies done by Mortimore as cited in Ndiritu (1999) indicated that effective schools
have a positive ethos. A greater emphasis on praise and rewards was beneficial. Teachers
encouraged self-control on the part of pupils rather than emphasizing the negative impact
of their behaviour.
21

The school organization climate influences performance. Sandy, (1988) cited in Ndiritu
(1999) in his study with 286 academic and technical vocation teachers in the republic of
Trinidad and Tobago, sought to establish factors that made teachers more effective. He
found that teachers' performance was related to school climate, though Dumzio (1989)
found no relationship between school organization climate and academic standards.
2.1.6. Time utilization
The time allocated to teaching and learning has also been shown as being a contributing
factor to a school's performance.
Comber and Keeves (1973) have observed that within limits, the more hours allowed for
instruction in a subject the higher the achievement. A report on performance by the
Kenya National Examination Council as quoted in Mutea (2002) cited lack of adequate
revision time as a major factor in K.P.C.E performance. Eshiwani (1983) noted that most
schools lost many teaching and learning hours at the beginning and end of each term.
This could account for many failures at the national examinations. Simiyu (2002) notes
that a crucial factor consistent with good performance was the students' discipline. This
was reflected in an organized study timetable which individual students draw for proper
management of their private time.
A study done in (1983) by Michieka as cited in Ndiritu (1999) on students’ dropout rates
in Kisii District revealed that frequent absenteeism led to loss of study time and
consequently failure in examinations. Abagi (1997) further noted that therq^was a lot of
wastage of pupils’ learning time in primary schools which led to inadequate syllabus
coverage in preparation for national examinations leading to poor performance.
Motivation of both pupils and teachers has been cited as a factor influencing
performance. Page (1958), cited in Muola (1990) conducted a study using more than
2000 children in 74 high schools in Kenya which showed a positive correlation between
performance and motivation. Students who received personalized comments showed a
marked improvement in their studies. Ndiritu (1999) in her study on factors influencing
performance in public secondary schools in Central and Nairobi provinces showed a
positive relationship between students’ motivation and academic performance. Goodlad
22

(1984) cited in Ndiritu (1999) stated that schools with effective discipline have an
academic emphasis in their curriculum. Their goals are not only clearly stated, but also
certain degree of structure which enhances high expectations academic of performance.
Such schools have assigned and graded homework. These factors motivate learners and
teachers while assuring them to strive for high academic performance in examinations.
Mbithi (2002) in his study on factors contributing to poor performance in Mathematics in
Yatta Secondary School in Machakos District, revealed that the medium of instruction
was an important factor in determining performance. He points out that the usage of
ambiguous statements tend to confuse students hence they loose interest. He established
that the frequency of assessment was not satisfactory in some schools, and concluded
that this practice could have a negative effect on the performance. Costello (1991) has
suggested that regular assessment at each key step in instruction is a powerful
mechanism for following up learners' ability to grasp basic concepts.
Mogen (1973) also highlighted that there are many attributes to assessment vis-a-vis the
nature, type, what is assessed, occasion of assessment and that every assessment should
be marked and discussed. Mbithi's (2002) findings showed that most teachers do not
alert the learners in advance that an assessment date has been scheduled for a certain day.
Instead they give surprise assessments getting some learners off guard. Hence, their poor
performance does not reflect their ability. He also found out that most assignments were
not marked and discussed accordingly. This approach discourages the learner since
he/she is left at abeyance without knowing the correct answer.V
Mogen (1973) maintains that any assessment should be examined within the taught
content, otherwise testing what has not been adversely taught interferes with the
confidence of the learner. For poor performance does not only demoralize the learner but
could also make the learner lose interest.
The head teacher of Anguche primary school in Kakamega District, which emerged top
in the rural public schools category in the 1996 K.CPE examination is quoted by the
Standard Newspaper of January 17th 1997 as having discouraged extra coaching for
pupils. He stated that the school had topped in the KCPE Examination because pupils
23

were effectively taught right from the school’s opening to the closing day without any
single day rest. He cited the following factors as having helped the school to perform
better;
• Proper use of school time,
• Good discipline of pupils and teachers,
• Pupils' use of extra time to study in the library and prep,
• Teachers prepared their lessons in advance and completed their syllabus in time
before pupils sit for examinations,
• Class tests were also taken on a weekly basis to ensure that pupils are conversant
with the syllabus,
• Class teachers have guidance and counselling sessions to help them catch up in other
areas,
• Pupils and teachers are committed to their responsibilities,
• No untrained teachers in the school, and the categories of teachers out of 46 teachers
include 30 PI, 14 SI and 2 ATS teachers.
2.2 HOUSEHOLD AND COMMUNITY-BASED FACTORS
2.2.1. Socio-economic background
The argument that the socio-economic background of students tend to influence their
performance is advanced by supporters of the “good home" theory, Tyler,(1977) in Ayoo
(2002). They maintain that students whose parents are educated tend to be provided withV
an enabling environment that stimulates education. They are also encouraged by their
parents to study and read relevant books and literature. It is assumed that the provision of
good reading materials and intellectual environments motivate students to learn better
and eventually perform well in public examinations.
Studies that have been carried out in developed countries have shown that performance
of boys and girls was significantly related to the socio-economic background of their
parents, Duncan (1989). She established that, one way in which a family’s socio
economic background affected school achievement was through the type of school
attended. Children from deprived homes, despite their mental potential, tended to go to
24

cheaper, low performing schools, whereas their counterparts whose ability could be
average could go to well performing schools because their parents could afford. The
choice of school therefore was found to be a main determinant of educational attainment
and later occupational placement.
The findings of the MOEST (2003) Technical Working Group on the Sector Review and
Development reveals that socio-economic and educational backgrounds of parents have a
direct bearing on educational quality. The group further pointed out that, due to the cost
sharing policy, parents were expected to pay towards the provision of textbooks, building
classrooms and other expenses. With increasing poverty in the majority of households,
most parents cannot afford to pay for these requirements. They concluded that schools
patronised by rich parents tend to be better equipped and subsequently perform better in
national examinations.
The rise in the level of poverty in Kenya (1997 economic survey) indicates that 46.8% of
Kenyans live below the poverty line, which is one of the major factors, that discourage
parents from investing in their children’s education. Abagi (1997) reveals that most
parents and by extension many communities are not in a position to meet the ever-
increasing cost of schooling adequately. He points out that, as the level of poverty rises,
child labour has become crucial for family survival. Child labour is evident in domestic
activities, agriculture and petty trade in rural and urban areas in Kenya. Poor households,
and in some cases children themselves have to carefully analyse the opportunity cost of
education. 'V
Abagi further points out that pupil’s absenteeism is high where child-labour is valued
and inevitable. This affects pupils’ performance in school. According to Ojoro (1990)
quoted in MOEST (2003) children of diplomats, senior civil servants, professionals and
the general elite who live in up-market parts of the urban centres have an unfair
advantage over others. He gives the reason to the fact that these children use English as
their first language of communication and are generally more exposed to educational
activities. They perform better especially in English language examinations than their
25
)

counterparts who start learning in their mother tongue and subsequently learn English
much later.
Mwanzi (1982) cited in Mutea (2002) points out that children in rural areas have
difficulties learning English because only a minority of the rural folk in Kenya speak it
and therefore children don’t hear it often enough. Rural children therefore rely entirely
on their teachers for the expansion of their vocabulary and sentence construction.
Eshiwani (1983) carried out a study on factors affecting performance among primary and
secondary school pupils in western province of Kenya and identified the fact that
environmental factors play a key role in influencing the academic achievement of
students. According to his findings, the environment can either enhance or hinder a
student's learning and educational attainment.
Studies conducted else where in Africa reveal that the home environment contributes
substantially to different academic achievement levels by girls and boys. Swaison (1994)
in Ayoo (2002) in his study on the constraints to education in Malawi, established that
both boys and girls participated in household tasks, but gender differences in their
participation level were substantial with girls performing more chores than boys. He also
established that the situation was more demanding for girls from poor families. He
contented that in poor households there was greater demand for domestic labour by girls,
given the overwhelming economic needs of such households. Consequently, girls
experience loss of concentration levels during lessons due to exhaustion, and attended
school more irregularly and less intensively.
Some studies that have been conducted in Kenya reveal that the distance from home to
school had a direct influence on students’ performance in examinations. For example,
Bunyi and Okkelmo (2000) cited in Ayoo (2002), carried out a research on the influence
of distance on education of girls. The study established that distance had a strong effect
on retention rates and regular attendance of school, ultimately affecting students’
academic achievement. It also revealed that distance from school had a more negative
implication on girls’ safety and security, which was viewed as key in school attendance
and academic achievement.
26

2.2.2. Parental-community involvement in school matters
According to UNESCO (2003), for many years there has been general acceptance that
giving parents and community members a strong voice in school management can
strengthen schools’ accountability to communities, increase teacher and student
attendance, improve the efficiency of resource use, mobilize increased community
support for schools, and improve student learning. Global experience shows that
community involvement in school governance can be a positive force for school
improvement, even where parents are illiterate (UNESCO, 2003).
Parental involvement in the pupils’ work has also been identified as a factor that affects
pupils’ performance. In a study done on 106 standard seven school children in Nairobi
by Kapila (1976) in Ndiritu (1999), it was established that there was a positive
association between parents' participation in the children's schoolwork and academic
performance.
Ndiritu (1999) quotes Okumu’s study of standard seven pupils of Nairobi schools which
reported similar findings. Griffin (1996) has also accorded parental participation great
importance as a factor determining the pupils’ performance in an examination. He
pointed out that parent’s involvement is an important element in the learners’ academic
achievement and that this relationship was observed even when the school-student
population, teacher qualifications and experiences were controlled.
V
Kathuri (1997) cited in Asuga (2002) revealed that children whose parents paid regular
visits to school to find out their progress or attend school functions do better
academically than those whose parents never paid such visits. Ayoo (2002) in her study
on the factors affecting academic performance in KCSE Examination in public
secondary schools in Maseno Division also agreed with the view that parents’
involvement in school functions has a positive effect on performance in examination.
27

FIGURE I: CONCEPTUAL FRAMEWORK
School-based factors
In this study, pupils’ performance is conceptualized in a process perspective. (Input-
process- output).
Students go through the schooling process at the end of which they are examined through
the KCPE Examination. Their scores in KCPE Examination is the outpit),. The home
environment is seen to influence the school-based factors. Both school-based factors and
home environment (inputs) determine what takes place in the school (process of
schooling). In turn what takes place in the school will determine the level of pupils’
performance in KCPE Examination, which will be reflected in the grades attained by the
pupils in KCPE Examination. The KCPE Examination results provide feedback to the
school and the home environment leading to adjustments for improvement. The arrows
show that the process is continuous and bi-directional.
28

2.3. SUMMARY OF LITERATURE REVIEW
In this chapter, various factors that influence pupils’ academic performance have been
discussed. The factors have been discussed under two categories. The first includes
school-based factors such as the availability and quality of teachers, teaching and
learning resources, school administration, school climate and time utilization. The
second category includes household/community-based factors such as economic-
background of the learner, parental/community involvement in school matters, and the
distance covered by the learners between home and school.
Finally, the inter-play of the school-based and household/community factors in the
process of schooling to determine the level of pupils’ academic achievement in
examinations has been illustrated by use of the stated conceptual framework.
V
29

CHAPTER THREE
RESEARCH METHODOLOGY
3.0. RESEARCH DESIGN
The study utilized a descriptive design approach which, according to Churchill (1991), is
appropriate where the study seeks to describe the characteristics of certain groups,
estimate the proportion of people who have certain characteristics, and make predictions.
The secondary design comprised a case study, and adopted the ex-post facto design
which has been defined by Kerlinger as cited by Ndiritu (1998) as a;
UNiyERS ,TY OF NAIROBI EAST AFRICANA COLLECTION
“...Systematic empirical inquiry in which the scientist does not have direct control o f
independent variables because their manifestations have already occurred or because
they are inherently not manipulable. Inferences about relations among variables are
made without direct intervention from concomitant variation o f independent and
dependent variables” Kerlinger, (1967) in Ndiritu, (1998).
The design was used to investigate into the factors influencing KCPE performance in
Mutonguni Division - Kitui District. The design was recommended for this research
because it involved studying conditions or events that had already occurred and the
researcher had no direct control of independent variables. The dependent variable (KCPE
performance) had already occurred while the independent variables v(the factors
influencing performance in KCPE) could not be manipulated.
3.1. TARGET POPULATION
The target population for this study consisted head teachers, the teachers handling
standard Eight, and standard Eight pupils. Head teachers organize and facilitate the
teaching and learning process in their schools, and were in a better position to provide
general information about their schools.
30

Teachers handling class Eight were in constant contact with the pupils on daily basis.
They were also preparing the pupils for the KCPE Examination, and therefore most
likely to have more reliable information about the peoples and the factors influencing
pupils academic performance in KCPE Examination.
Standard Eight pupils had been in school for many years, and were preparing for KCPE
examinations, therefore they were likely to be aware of the factors that influence pupils’
academic performances in KCPE and could therefore provide more reliable information
on the same.
The accessible population in this study comprised head teachers, teachers handling class
Eight, and standard Eight pupils in Mutonguni Division. Records in the District
Education Office in Kitui showed that there were 54 public primary mixed day schools
in Mutonguni Division with 54 head teachers and approximately 1,580 Standard Eight
pupils.
3.2. SAMPLE AND SAMPLING PROCEDURE
A total of eleven (11) schools out of the fifty-four (54) schools in Mutonguni Division
were randomly selected to participate in this study representing approximately 20% of
the total number of schools in the division.
The stratified random sampling procedure was utilized for this study in orcfer to achieve
a proportionate representation of each of the four zones in the division as shown below.
31

Table 3: Zones and Schools in Mutonguni Division
Names of the zone Number of schoolsTulia 20Musengo 13Katutu 14Kauwi 7Total 54
Source: D.E.O’S Office - Kitui District
A simple formula was used to elicit a proportionate zonal representation. The total
number of schools in a zone was divided by the total number of schools in the division
and then multiplied by the required number of schools (sample size).
Zonal representation = No of schools in a zone (Zone size) x total number of schools
Total no. of schools in required (sample size)the division (division size)
Tulia zone -2054
- x 11 = 4 . 0 ( 4 ) schools
Musengo zone - 1354
- x 11 = 2 . 6 ( 3 ) schools
Katutu zone -1454
- x \ \ - 2 . 8 ( 3 ) schools
Kauwi zone - 7- X 1 1 = 1 . 4 ( 1 ) schools
54 ^
Total 11 schools______
From the above calculations, 4 schools from Tulia Zone, 3 schools from Musengo, 3
schools from Katutu and 1 school from Kauwi were selected for the study. Selection of
schools from specific zones was done by simple random sampling.
For each selected school, 25% of class Eight pupils were randomly selected to participate
in the study. The sampling of pupils was done on the spot by the researcher before
administering questionnaires to them. Two teachers were selected from among the
teachers handling the standard Eight class. The standard Eight-class teacher was
32

purposively selected to participate in the study, while the second teacher was randomly
selected. All head teachers of the eleven selected schools participated in the study.
3.3. RESEARCH INSTRUMENTS
Three sets of questionnaires - one for the head teachers, another for the teachers
handling Class Eight and the other one for Standard Eight pupils were utilized in this
study.
This questionnaires which were self-administered by the researcher comprised structured
items that were carefully developed with the help of the research supervisor. The
structured questionnaires comprised mainly closed-ended questions and a few open-
ended questions. The advantages of using closed-ended questionnaires are that, they are
easier to analyze since they are in an immediate usable form. These set of questionnaires
provided uniformity to all the participants given the same questions; and were
economical in terms of time and money (Mugenda and Mugenda 1999).
Each questionnaire comprised sections A and B. Section A contained questions aimed at
obtaining general information about the respondent and the school, while Section B
consisted of specific questions related to the objectives of the study. The resultant
information was used to arrive at the conclusion on factors influencing pupils" academic
performance in KCPE examination.
V
3.4. DATA COLLECTION PROCEDURES
The researcher conducted the study in Mutonguni Division, in the year 2004, aftcr
obtaining permission from the office of the president and the DEO, Kitui District.
The researcher personally visited each school; met the head teacher for introduction, **
then arrangements were made to meet standard Eight teachers and pupils. A. samp*e B
25% of the Class Eight pupils population was randomly selected. They were then i ^ ' Jr
questionnaires, which were filled and returned to the researcher. The head teache' 1

two Class Eight teachers were also given questionnaires prior to the researcher’s
issuance to the standard Eight pupils. The head teacher and the Standard Eight teachers’
questionnaires were then collected the same day at the end of the exercise.
3.5. PRE-TESTING OF THE INSTRUMENTS
The research instruments were piloted in one public primary school in Mutonguni
Division before data collection. The exercise was carried out using standard Eight pupils
belonging to a school other than the ones selected for the study. It was assumed that
schools within the same division had similar experience and therefore responses of
pupils from the pilot school would be reasonably similar to those of the sample schools
for the study.
Respondents contacted during the pre-test phase were deliberately excluded during the
final administration of the research instruments. This helped to control extraneous
influence on the research findings due to their prior knowledge of the information
required by the instruments. The purpose of the pilot study was to establish the validity
and reliability of the instruments of the study. During the pre-testing, a small sample,
consisting 9 pupils, 2 class Eight teachers, and one head teacher was chosen to
participate in the study. The pupils and teachers were randomly selected from class Eight
pupils and among the teachers currently handling the class Eight respectively. Piloting
enhanced reliability, dependability, accuracy and adequacy of the instruments. After
going through the responses of the pilot study, the questionnaires were ̂ modified to
eliminate any issues that were not clear. And enhancing validity, the supervisor reviewed
the instruments accordingly.
3.6. DATA ANALYSIS TECHNIQUES
The responses in the questionnaires were coded, tabulated and analyzed both
qualitatively and quantitatively. Descriptive statistics was also used to analyze the
responses which were presented in tables with proportions expressed in percentage forms
34

for ease of comparison. The results of the study were then compared with related
literature review to establish factors that influence pupils' academic performance in K.CPE examinations.
S'
35

CHAPTER FOUR
DATA ANALYSIS AND INTERPRETATION
4.0. INTRODUCTION
Chapter Four is composed of three sections;
1) Demographic information about head teachers, teachers and pupils.
2) Factors that influence pupils academic performance in KCPE Examination:
• Human resources (Teaching staff),
• Teaching and learning resources,
• Physical facilities,
• Time utilization,
• Community involvement in school matters.
3) Testing of hypotheses - Relates KCPE performance with the independent variables.
4.1. QUESTIONNAIRE RETURN RATE
Three sets of questionnaires were used to collect data. A questionnaire for the head
teachers, which was meant to elicit the school policy, class Eight teachers’ questionnaire
meant to delve into school practice as experienced by the implementers of the school
policy and class Eight pupils’ questionnaire, meant to obtain information on the school
practice as experienced by the pupils who are the recipients of the school policy.
The head teachers’ questionnaires were preffered to eleven (11) head teachers of the
sampled schools which were all returned dully filled. A total of 22 questionnaires were
given out to Class Eight teachers and 20 were returned, while 99 questionnaires were
given out to Class Eight pupils and all of them were returned.
36

4.2. DEMOGRAPHIC INFORMATION
The head teachers and teachers provided demographic information regarding their zone,
gender, academic and professional qualification, administrative experience and years of
service in their current school, while pupils provided information about their zone,
gender, age, number of children in their families, their parents' educational level and
occupation. The demographic information is summarized in tables as follows:
Table 4: Zonal Distribution of Respondents
Zone No. of H/teachers
No. of teachers
No. of pupils Total Percentage
Tulia 4 8 37 49 38Musengo 3 4 23 40 23Katutu 3 6 31 40 31Kauwi 1 2 8 11 8Total 11 20 99 130 100
The above table indicates that Tulia zone contributed the largest number of respondents
(49), which represented 38% of the total number of respondents. It was followed by
Katutu zone with 40 respondents, 31%. Musengo zone 30 respondents, 23%, while
Kauwi zone produced the lowest number of respondents (11) contributing 8% of the total
number of respondents. The reason why some zones produced larger number of
respondents such as Tulia and Katutu while others like Kauwi and Musengo produced
smaller numbers, is explained by the fact that the sample was selected from each of the
four zones proportionate to their sizes in terms of the number of schools in a'zone.
Table 5: Distribution of Respondents by Gender
Gender Head teachers Teachers Pupils Total PercentageF % F % F %
Female 2 18 10 50 48 48 60 46Male 9 82 10 50 51 52 70 54Total 11 100 20 100 99 100 130 100F = Frequency % = Percentage
Table 5 above indicates that generally, male respondents were more than female
respondents. There were 60 female respondents (46%) against 70 male respondents
37

(54%). The highest difference between male and female respondents was found among
the head teachers where only 2 out of 11 were female. Among the ordinary teachers the
number of male respondents was equal to that of females. Among the pupils, the
difference in the number of male and females was insignificant with male pupils being
more than female pupils by 3. The fact that the proportion of females who hold
managerial positions (head teacher position) was too small compared to that of their male
counterparts meant that women teachers were not given equal opportunity at that level.
This could be a source of demoralization to them while at the same time it denied the
female pupils role models from whom they could emulate. This could in turn have a
negative effect on the performance of both lady teachers and pupils.
Table 6: Distribution of Head teachers and class Eight teachers by academic qualification
Academic qualification & education level attained
Head teachers
F %
Class Eight teachers
F %KJSE -Form 2 0 0 1 5EACE/KCE/KCSE -Form 4 9 82 15 75EAACE/KACE -Form6 2 18 3 15DIPLOMA 0 0 1 5Total 11 100 20 100F = Frequency % = Percentage
According to table 6 above, 9 (82%) out of the 11 head teachers who participated in this
study had attained Form 4 level of education as their highest academic qualification,
while 2 (18%) had attained Form 6 level as their highest academic qualification. This
was within the academic achievement for primary school teachers. Hence, all head
teachers were academically qualified.
Table 6 also indicates that 15 (75%) teachers of the total teacher respondents of 20 had
attained Form 4 level of education as their highest academic qualification. 3 (15%)
teachers had attained Form 6 level (KACE), 1 (5%) teacher Form 2 level (KJSE) and 1
(5%) teacher Diploma. Given that 95% of the teachers had attained Form 4 level and
above, it implies that they were academically qualified.
38

Table 7: Distribution of Head Teachers and Class Eight Teachers by professional qualification
Teacher’s Qualification Head teachers F %
Class Eight teachers F %
PI 9 82 19 95SI 2 18 0 0ATS 0 0 1 5Total 11 100 20 100
As indicated in table 7 above, all the head teachers and teachers who participated in this
study fell under three categories according to their professional qualification. Among the
head teachers, 9 (82%) of them had the PI qualification, 2 (18%) SI qualification and
none had attained ATS status. Given that majority of the head teachers had worked at
that capacity for over ten years but still remained in the same PI status indicates the time
lapse that the TSC takes to promote teachers from one grade to the next. This could be a
source of demoralization among head teachers who have stagnated in one grade for a
long time.
The same trend is prevalent among teachers with 19 (95%) of the teacher participants
being PI and 1 (5%) being an ATS, with no SI teacher among them. Sometimes head
teachers may find it difficult to control teachers who have the same or higher
professional qualifications than them. This may interfere with the teaching and learning
process and eventually affect pupils’ academic performance in school.
Table 8: Distribution of Head teachers by their administrative experience
Score interval in years Frequency (F) Percentage (%) Cumulative percentage0-2 2 18 183-5 1 9 276-8 1 9 358- 10 2 18 54Over 10 5 46 100Total 11 100 100
Table 8 above indicates that 73% of the head teachers had an administrative experience
of over 5 years and only 27% had been head teachers for 5 years and below. This means
that majority of them were familiar with their duties and could dispense them effectively.
39

Table 9: Distribution of Head and Class Eight teachers by the number of years theyhad served in their current schools
Years of service Head teachers TeachersF % CP F % CP
Less than 1 year 3 27.3 27.3 1 5 51 -2 2 18.2 45.5 3 15 203 -4 5 45.4 90.9 4 20 405 and above 1 9.1 100 12 60 100Total 11 100 100 20 100 100
F = Frequency % = Percentage CP = Cumulative Percentage
Table 9 above indicates that 54.4% of the head teachers and 80% of teachers had worked
in their current schools for at least 3 years. In fact 60% of the teachers had been in their
current schools for over five years. This means that such teachers were familiar with the
operations, strengths and weaknesses of their schools that could be influencing pupils’
academic performance.
Table 10: Distribution of pupils by age
Age in years Frequency(F) Percentage (%) Cumulative percentage (CP)Below 13 4 4 413-15 69 70 7415-17 24 24 98Over 17 2 2 100Total 99 100 100
From table 10 above, it can be seen that the majority of class Eight pupils 70% fell in the
age brackets of 13-15 years, with 26% being over 15 years and only 4% were below 13
years of age. This means that majority of pupils were within the normal age for pupils at
class Eight level (13-15 years). However, the fact that a good number of the pupils were
above 15 years of age indicates that such pupils could have repeated one or two classes.
40

Tabic 11: Distribution of pupils by number of children in their families
No of children Frequency (F) Percentage(%)
Cumulative percentage (CP)
Less 3 8 8 83-5 42 42 506-10 49 50 100More than 10 0 0 0Total 99 100 100
Table 11 above reveals that 50% of the pupils came from large families of between 6 and
10 children while 42% belonged to families of 3-5 children and only 8% came from
families of less than 3 children. This implies there could be competition for basic needs
in the families of majority of the pupils especially if the parents are not economically
stable.UNIVERSITY OF NAIROBI EAITAFRICANA COLLECTION
Table 12: Parents’ level of education as reported by pupils
Frequency (F) Percentage (%)Level of educ___________F______M_____ G Total F M G Total CPB e lo w c la s s 8 10 10 - 2 0 6 6 - 12 12C la s s 8 25 28 1 54 16 18 1 35 47B e lo w fo rm 4 8 10 - 18 5 6 - 11 58F o rm 4 33 20 1 54 21 13 1 35 93A b o v e fo rm 4 6 6 1 13 3 3 1 7 100
Total 82 74 3 159 51 46 3 100 100
F =Father M = Mother G = Guardian CP = Cumulative Percentage
According to Table 12 above, among the total number of 159 parents shown to have
attended formal schooling 82 (51%) were fathers, 74 (46%) were mothers while 3 of
them were mere guardians. Fifty eight percent had attained formal education of below
Form 4, with 47% attaining Standard Eight level and below. 42% attained Form 4 level
of education and above. The majority of those with the Form 4 level of education and
above were men (fathers) who comprised 24%, while a majority of those with up to
Class Eight level of education were women (mothers).
41

Table 13: Parents’ Occupation
OccupationF
Frequency (F) M G Total F
Percentage (%) M G Total CP
S u b s is te n c e fa rm in g 3 0 48 1 79 20 32 1 53 53B u s in e s s 24 16 1 41 16 10 1 27 80
C iv il s e rv a n t 15 9 0 24 10 6 0 16 9 6
O th e r 6 0 0 6 4 0 0 4 100
Total 75 73 2 150 50 48 2 100 100
F=Father M = Mother G = Guardian CP = Cumulative Percentage
In Table 13 above, 53% of the parents were subsistence farmers while 27% were
business men/women and only 15% were government employees or civil servants, while
6% were involved in other economic activities. This means that most pupils came from
weak economic backgrounds with majority of them depending on subsistence farming.
Given that the locality is semi-arid it may be very difficult for most families to even
afford their daily food, which is the most desired basic need.
This means that fathers (men) who were generally more learned than women were likely
to be working far away from their homes or even work over night. This implies that they
were not likely to help their children in doing home work due to their unavailability at
home in the evenings. The mothers who in most cases would be available at home in the
evenings were similarly not able to help their children do homework due to their low
level of education.
Tables 14 and 15 below summarise the information on distances from and modes of
transport to schools by the teachers
Table 14: Distance covered by head teachers and teachers one way from their residence to school
Distance in km Head teachers TeachersF % CP F % CP
Less than 1 km 3 27.3 27.3 6 30 30l-2km - - 27.3 3 15 452-4 km 5 45.5 72.8 7 35 80
42

- 72.8 1 5 853 27.3 100 3 15 100
4-5 km Over 5 kmTotal H 100 100 20 100 100F = Frequency % = Percentage CP = Cumulative Percentage
Table 15: Head teachers and teachers’ means of transport in Mutonguni Division
Means of transport Head teachers TeachersF % CP F % CP
By foot 5 45.5 45.5 14 70 70By bicycle 5 45.5 91 5 25 95By car - - 91 - 0 95Other 1 9 100 1 5 100Total 11 100 100 20 100 100F = Frequency % = Percentage C P = Cumulative Percentage
Eleven (11) head teachers and twenty (20) teachers conceded that none of them were
accommodated within their school compounds.
Majority o f them went to school by foot, 70% of the teachers and nearly half of the head
teachers (45.5%) while a few of them used bicycles. They further indicated that they
covered a distance of up to 4 kilometres daily one way to school, including 45% of the
head teachers and 80% of the teachers. This implies that teachers had to leave their
houses very early in the morning in order to get to school at the right time (before
8.00am). In the evening, they started their journey home quite early. The teachers also
revealed that the terrain is not only hilly, but it also took them longer to cover a given
distance. v
4.3. FACTORS INFLUENCING PUPILS’ ACADEMIC PERFORMANCE IN
KCPE EXAMINATION
4.3.1 . Availability of human and material resources
T his objective was addressed at two levels:
• Human resources (teaching force),
• M aterial resources (physical facilities and teaching and learning resources).
43

Availability of the teaching force was measured through the following indicators:
• Pupil-Teacher ratio,
• Teachers workload,
• Class sizes,
• Teachers’ commitment to teaching,
• Teachers’ qualifications.
Availability of material resources was measured in terms of their adequacy and quality as
perceived by the teachers and pupils. The head teachers were asked to provide
information regarding the population of their school’s Class Eight pupils, teaching staff,
categories of teachers, teachers’ work load and adequacy of teachers in their schools.
This information is summarised in Tables 16 to 19 by head teachers as follows:
Table 16: Population of primary schools in Mutonguni Division
No. of pupils (population) F % CP200 and below - - -
201-300 5 45.5 45.5301-400 3 27.3 72.8401-500 1 9 91Over 500 1 9 100Total 11 100 100F = Frequency % = Percentage CP = Cumulative Percentage
Table 16 above reveals that 5 schools out of 11 (45.5%) had their population ranging
between 201 and 300 pupils. 3 (27.3%) had between 301-400 pupils. While 2 (18.2) had
between 401-500, pupils, and only 1 (9%) had over 500 pupils. This explains that the
majority of schools were single streamed.
Table 17: Population of Standard Eight classes in Mutonguni Division
No. of pupils (Class population) Frequency (F) Percentage (%) Cumulativepercentage
20 and below 1 9.1 9.121-30 3 27.3 36.431-40 3 27.3 63.7Over 40 4 36.3 100Total 11 100 100
44

From the above table, it is evident that most schools 7 (63.6%) had a standard Eight
student population of Standard Eight being 30 pupils and above. Among them 36.3% and
36.4% had a population of above 40 pupils and less than 30 pupils respectively. This
explains that the classes were fairly big though not too large to handle.
Table 18: Population of teaching staff in primary schools in Mutonguni Division
No. of teachers (F) (%) (CP)8 and below 2 18 189-10 7 64 8211-12 - - 8213-14 - - 8215 and above 2 18 100Total 11 100 100
F = Frequency % = Percentage CP = Cumulative Percentage
The above data shows that 9 (82%) of the schools had up to ten teachers. No schools had
between 11 and 14 teachers and only 2 (18%) of the schools had 15 teachers and above.
This shows that most schools had as many teachers as the classes and perhaps one extra
teacher, who could be the head teacher. Regarding the adequacy of the teaching staff in
the schools, 9 of the head teachers indicated that the teaching staff was adequate and only
2 indicated that their schools had inadequate staff.
Table 19: The average number of lessons per teacher in a week
Number of lessons F MPt (X) FX % CP
30 lessons and beiow 1 28 28 9 931-35 2 33 66 18 2736-40 6 38 228 55 82Over 40 2 43 86 18 100Total 11 142 408 100 100
jc=37
F = Frequency X = Class Midpoint
FX = Product of Frequency and Class Midpoint
% = Percentage CP = Cumulative Percentage
45

Table 19 above reveals that the average number of lessons per teacher in a week was 37.
In the majority of the schools, 8 (73%) teachers taught an average of at least 36 lessons
in a week. On average, 7 lessons or more per day given that the maximum number of
lessons per day is seven in lower classes and eight in upper classes. Such a work load left
the teachers with very little time to prepare in between the lessons or even mark tests. It
was only in 3 schools (27%) where teachers taught an average of 35 lessons per week or
on average 7 lessons or less per day perhaps leaving a teacher with one or two free
lessons.
Table 20: Distribution of teachers in primary schools in Mutonguni Division by category
CATEGORY P3 P2 PI SI Dip ATS Graduate TotalF 6 5 90 3 1 8 114(%) 5 4 79 3 1 8 100CP 5 9 88 91 91 100 100
F = Frequency % = Percentage CP = Cumulative Percentage
Table 20 above shows that among the teachers in Mutonguni division, 5% were P3, 4%
P2, 79% PI, 3% SI, 1% Dip, and 8% Dip. This explains that majority of them hold
grades that they attained through their initial training (P3, P2, PI and Diploma 89%),
79% of them being PI holders. Only a small, percentage (11%) had attained new grades
through promotion.
Among the indicators that were used to measure teachers' commitment to teaching were
punctuality in reporting for work, starting and ending lessons, attendance of lessons,
management of homework and assignments, coverage of syllabus, maintenance of an
orderly and quiet atmosphere, emphasis on internal evaluation and preparation of official
documents. All the head teachers admitted they had valued and incorporated the above as
part of their school policy. It could not however be confirmed at this level whether the
policy was strictly implemented or not. In order to verify the information given by the
head teachers, the teachers and pupils were asked to confirm whether such practices were
taken seriously in their schools. This indicated in table 21 and 22.
46

Table 21: Head teachers’ comments on the extent to which various practices arepart of their school policy
P r a c t i c e s / s c h o o l p o lic yF
SA% F
A% F
D S D T o ta l% F % F %
1. T e a c h e rs sh o u ld re p o rt a t 8 am & leav e th e ir w o rk s ta t io n a t 5p m
5 46 4 3 6 2 18 - 11 100
2 . L e s so n s sh o u ld s ta r t & e n d a t th e r ig h t t im e a s in d ic a te d in th e t im e ta b le
7 64 4 36 “ 1 1 100
3. M iss e d le s so n s sh o u ld b e c o m p e n sa te d a t te a c h e r s ’ o w n tim e
6 55 3 27 2 18 - 11 100
4 . T e a c h e rs sh o u ld g iv e a s s ig n m e n ts an d h o m e w o rk re g u la rly .
6 55 5 45 * 1 1 100
5. T e a c h e rs sh o u ld m a rk a s s ig n m e n ts & h o m e w o rk p ro m p tly
5 45 6 55 - 1 1 100
6 . T e a c h e rs sh o u ld c o v e r sy lla b u s in th e ir s u b je c ts by th e e n d o f e a c h y ear.
6 55 5 45 11 100
7. T e a c h e rs sh o u ld a lw a y s m a in ta in q u ie t & o rd e rly c lim a te a tm o sp h e re .
3 27 8 73 “ - " - 11 100
8. T e a c h e rs sh o u ld : i) G iv e te s ts to p u p ils
6 55 5 45 - 1 1 100
ii) M a rk , th e te s ts 7 64 4 36 - 1 1 100iii) R e tu rn th e m a rk e d p a p e rs to th e p u p ils 6 55 5 45 - 1 1 100iv ) D o c o r re c tio n s w ith th e p u p ils 6 55 5 45 - 11 100
F = Frequency % = Percentage
SA = Strongly Agree A = Agree
D = Disagree SD = Strongly Disagree
Table 22: Head teachers’ comments on whether teachers in their schools are required to prepare various official documents as a matter of policy
Documents A MT ST R VR TotalF % F % F % F % F % F %
1. Schemes of work 8 73 3 27 - - 11 1002. Lesson plans 6 55 5 45 - - - -j, - 11
27 - - - - 11100
3. Record of the work covered 5 46 3 27 3 1004. Pupils progress record - 7 64 3 27 1 9 - - - - 11 100
report forins/cardsF = Frequency
A = Always
S T= Sometimes
VR = Very rarely
% = Percentage
MT = Most times
R = Rarely
47

Table 23: Class Eight teachers’ workload
No. of lesson per week F MPt (x) FX % CP30 lessons and below 3 28 84 15 1531-35 7 33 231 35 5036-40 7 38 266 35 85Over 40 lessons 3 42 126 15 100Total 20 141 706 100 100
x=37
F = Frequency X = Class Midpoint
FX = Product of Frequency and Class Midpoint
% = Percentage CP = Cumulative Percentage
Table 23 above indicates that on average, the workload among Class Eight teachers was
37 lessons per week; half of them (50%) taught 35 lessons and below per week or an
average of 7 lessons per day, while the rest had a workload of over 36 lessons per week,
with 15% handling over 40 lessons which on average is over 8 lessons per day (only
possible when two classes are combined). This level of workload seemed substantially
high for teachers who were preparing candidates for the K.CPE examination. This
information was in agreement with what the head teachers had reported.
Table 24: Subjects currently taught by Class Eight teachers
No. of subjects taught F FX % CP2 subjects 1 2 5 53 subjects 3 9 15 204 subjects 3 12 5 355 subjects 2 10 10 45Over 5 11 66 55 100Total 20 99 100 100
jc =5
F = Frequency FX = Product of Frequency and observation
% = Percentage CP = Cumulative Percentage
The information above indicates that on average, Class Eight teachers currently taught 5
different subjects with 65% of the teachers teaching at least 5 different subjects, and 35%
48

handling between 2 and 4 different subjects. The fact that most teachers were handling a
variety of subjects involving a wide range of knowledge meant they needed adequate
time to prepare for each lesson and subject for that matter. Lack of sufficient
preparedness by the teachers before each lesson /subject could have a negative effect on
the pupils' performance in KCPE examination.
The class eight teachers who were questioned on the teachers’ commitment to teaching
confirmed that most of the practices that were school policies were practiced most of the
time, though not always. This elicited that teachers were committed to their profession.
However, there was need for them to improve on compensating for the missed lessons,
which accounted for 45% of the lessons taught in schools.
Table 25: Number of teachers in Mutonguni who observe school policy (Practices as reported by class Eight teachers)
Practices/policy AT MT AF NT TotalF % F % F % F % F %
Punctuality 9 45 11 55 - - - 20 100Marking promptly 7 35 12 60 1 5 - - 20 100Syllabus coverage 2 10 16 80 2 10 - - 20 100AT =AI1 of them MT= Most of them AF = A few of them NT = None of them
Table 26: Teachers responses on practices depicting commitment to teaching
Practices A MT ST R VR TotalF % F % F % F % F % F %
Strict observation of timetable 7 35 10 50 1 5 2 10 V - - 20 100Attendance to all lessons 10 50 8 40 1 5 1 5 - - 20 100Compensation of missed lessons 4 20 7 35 8 40 1 5 - - 20 100Giving of assignments & 7 35 11 55 2 10 - - - 20 100homework regularly Maintenance of orderly & quite 7 35 11 55 2 10 - - 20 100atmosphereGiving feedback aid corrective 13 65 6 30 1 5 . - - 20 100teaching_________________________________________________________________A = Always MT = Most Times ST = Sometimes R = Rarely VR = Very Rarely
49

The above table indicates that in most cases 55%, 60% and 80% of teachers observed
punctuality, marked promptly and covered syllabus in their subjects respectively while a
good percentage of them 45%, 35% 10% always observed the same routine work
mentioned above. This clearly indicated teachers’ commitment to their work.
Table 27: Preparation of teaching related records documents
Documents A MT ST R VR TotalF % F % F % F % F % F %
Schemes of work 17 85 2 10 1 5 20 100Lesson plans 1 5 15 75 4 20 - - - 20 100Record of the work covered
7 35 8 40 3 15 2 10 - 20 100
Pupils progress or report forms
14 70 5 25 1 5 20 100
A = Always MT = Most times
ST =Sometimes R = Rarely
VR = Very rarely
Among the teaching related records prepared by teachers, schemes of work ranked
highest with 85% of the teachers preparing always. Pupils’ progress records were also
given emphasis (70% always), lesson plans were given least emphasis (5% always),
while the record of work covered attained (35% always). This means that teachers
emphasized preparation of schemes of work and pupils’ progress records which were
usually prepared once in a term, at the beginning and at the end of term respectively.
Although lesson plans and records of work covered were to be prepared on ^daily basis,
teachers seemed to achieve less in this area. This could be explained by the fact that most
of them had little time outside the classroom due to a heavy workload.
The information provided by the pupils indicated that in most schools all class eight
subjects currently had teachers as reported by 93% of the pupils and only 7% reported
shortage in one subject, mathematics.
50

Table 28: Availability of teachers for class Eight subjects as reported by the pupils
SubjectsAvailability English Kiswahili Maths Science GHCRE
F % F % F % F % F %Yes 99 100 99 100 92 93 99 100 99 100No 0 0 0 0 7 7 0 0 0 0Total 99 100 99 100 99 100 99 100 99 100
F = Frequency % = Percentage
Table 29: Pupils’ responses on the practices that indicated teachers’ commitment to teaching
Practice AF %
MTF %
STF %
RF %
VRF %
TotalsF %
A tte n d a n c e to le s so n s 2 2 0 0 65 66 9 9 23 23 9 9 100C o m p e n s a tio n o f m is se d le s so n s 21 21 26 26 37 38 5 5 10 10 9 9 100P u n c tu a li ty -S ta r tin g lesso n s 4 4 8 8 51 52 14 14 22 22 9 9 100
-E n d in g le s so n s 0 0 6 6 31 31 22 22 4 0 41 9 9 100A ss ig n in g h o m e w o rk 53 54 24 24 17 17 5 5 0 0 99 100P ro m p t m a rk in g 58 59 27 27 8 8 4 4 2 2 9 9 100S y lla b u s c o v e ra g e 42 43 28 28 24 24 4 4 1 1 9 9 100In te rn a l te s tin g 28 28 25 25 4 2 43 3 3 1 1 9 9 100M a rk in g te s ts 52 53 24 24 16 16 5 5 2 2 9 9 100G iv in g o f fe e d b a c k 58 59 16 16 19 19 2 2 4 4 9 9 100D o in g c o r re c tio n s 65 65 20 20 12 12 1 1 1 1 9 9 100
A = Always MT = Most times
ST =Sometimes R = Rarely
VR = Very rarely
From the pupils’ responses, it is evident that teachers were committed in performing
most of their duties such as giving homework, marking books and assignmehts, syllabus
coverage, internal testing of pupils, giving feedback and doing corrective teaching.
However, missing lessons was prevalent in most schools with 65% of the pupils
reporting that sometimes some lessons went untaught. It was also evident that missed
lessons (79%) were not always compensated for, while some lessons (51%) were also
shown to start later than was required.
51

Table 30: Head teachers’ comments on the availability o f various teaching and
learning resources in their schools
Facilities VA A UD 1A VI TotalF % F % F % F % F % F %
1. Class 8 textbooks fori) Teachers 5 46 2 18 4 36 1 1 100ii) Pupils 3 27 3 27 5 46 11 100
2. Class 8 Exercise fori) Teachers 5 46 5 46 1 8 11 100ii) Pupils 5 46 4 36 2 18 11 100
3. References books fori) Teachers 2 18 5 46 3 27 11 100ii) Pupils 2 18 3 27 6 55 11 100
4. Chalkboard 6 55 4 36 - 1 9 11 1005. Chalk 5 46 5 46 1 8 11 1006. Teaching aids such 1 8 - 5 46 11 100wall maps, charts_______________________________F = Frequency % = Percentage
VA = Adequate A = Adequate
UD = Undecided IA = Inadequate
VI = Very Inadequate
In Table 30 above, it is evident that teaching and learning resources were found to be
adequate in most of the schools and a few of them were inadequate. Among the
resources that were found to be inadequate in a number of schools were; textbooks for
both teachers and pupils (Class Eight), reference books for teachers, revision books for
pupils and teaching aids: - wall maps, charts. Exercise books, chalkboards and chalks
were found to be quite adequate and of high quality. '/
52

Table 31: Teachers’ comments on the availability o f teaching and learningresources in their schools
Resources ____________ Teachers comments in terms of adequacy_________VA A UD IA VI Total
F % F % F % F % F % F %1. Class 8 textbooks for
i) Teachers 9 45 9 45 2 1020 100
ii) Pupils2. Class 8 note books for
8 40 9 45 - 3 15 - -
20 100i) Teachers 7 35 9 45 1 5 2 10 1 5ii) Pupils 9 45 9 45 - - 2 10 - -
3. Reference books for 3 15 14 70 - - 3 15 20 100teachers4. Revision books for 10 50 -1 5 7 35 2 10 20 100pupils5. Chalks boards 7 35 13 65 20 1006. Chalk 10 50 9 45 - - 1 5 - - 20 1007. Teaching aids e.g. 1 5 10 50 - - 9 45 - - 20 100charts, wall maps andatlases________________________________________F = Frequency % = Percentage
VA = Very Adequate A = Adequate
UD = Undecided IA = Inadequate
VI = Very Inadequate
Table 31 reveals that teachers believed that all the resources under study were adequate
in their schools except revision books for pupils and teaching aids which were
inadequate by 45% each. The resources available were perceived to be of high quality.
//Table 32: Availability of basic teaching and learning resources in schooFas reported by pupils
Frequency (F) Percentage (%)Resources VS S IS VIS Total VS S IS VIS TotalTextbooks 46 44 9 0 99 47 4 9 0 100Revisionbooks
26 25 43 5 99 26 25 44 5 100
Pens 35 34 27 3 99 36 34 27 3 100Charts 20 39 33 7 99 20 40 33 7 100Wall maps 20 30 36 13 99 20 30 37 13 100Atlases 28 34 27 10 99 28 35 27 10 100
VS = Very Sufficient S = Sufficient
IS = Insufficient VIS = Very Insufficient
53
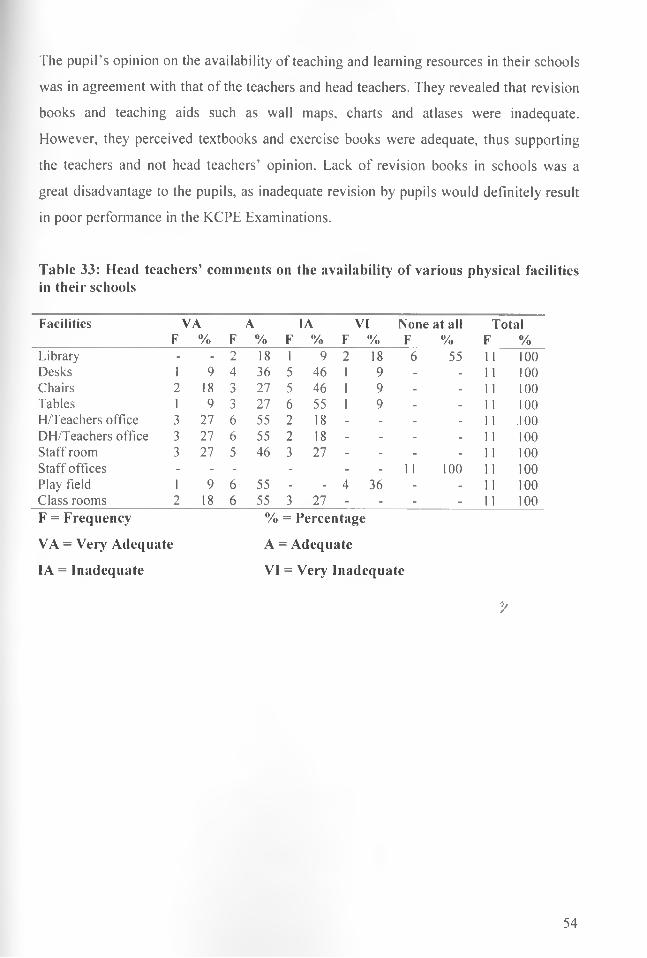
The pupil’s opinion on the availability of teaching and learning resources in their schools
was in agreement with that of the teachers and head teachers. They revealed that revision
books and teaching aids such as wall maps, charts and atlases were inadequate.
However, they perceived textbooks and exercise books were adequate, thus supporting
the teachers and not head teachers’ opinion. Lack of revision books in schools was a
great disadvantage to the pupils, as inadequate revision by pupils would definitely result
in poor performance in the KCPE Examinations.
Table 33: Head teachers’ comments on the availability of various physical facilities in their schools
Facilities VAF % F
A% F
IA% F
VI%
None at all F %
TotalF %
Library - - 2 18 1 9 2 18 6 55 11 100Desks 1 9 4 36 5 46 1 9 - - 11 100Chairs 2 18 3 27 5 46 1 9 - - 11 100Tables 1 9 3 27 6 55 1 9 - - 11 100H/Teachers office 3 27 6 55 2 18 - - - - 11 .100DH/Teachers office 3 27 6 55 2 18 - - - - 11 100Staff room 3 27 5 46 3 27 - - - - 11 100Staff offices - - - - - - 11 100 11 100Play field 1 9 6 55 - - 4 36 - - 11 100Class rooms 2 18 6 55 3 27 - - - - 11 100F = Frequency % = Percentage
VA = Very Adequate A = Adequate
IA = Inadequate VI = Very Inadequate
V
54

Table 34: Teachers’ comments on the availability of various basic facilities in theirschools
Facilities Teachers comments on the availability of facilitiesVA A IA VI None at all Total
F % F % F % F % F % F %Classrooms 4 20 11 55 4 20 1 5 - - 20 100Library - - 2 10 10 50 1 5 7 35 20 100Desks 3 15 8 40 8 40 1 5 - - 20 100Chairs 1 5 11 55 7 35 1 5 - - 20 100Tables 2 10 9 45 6 30 3 15 - - 20 100H/teacher’s office 6 30 13 65 1 5 - - - - 20 100D. H/teachers office
5 25 12 60 3 15 - - 20 100
Staff room 4 20 11 55 5 25 - - - - 20 100Staff houses - - - - - 1 5 19 95 20 100Playfield 13 15 6 30 7 35 4 20 - - 20 100F = Frequency % = Percentage
VA = Very Adequate A == Adequate
IA = Inadequate VI = Very Inadequate
Table 35: Availability of various basic facilities in school as reported by pupils
FacilityVS S
FrequenciesIS VIS Totals VS S
PercentagesIS v/s Totals
Class rooms 42 49 4 4 99 42 50 4 4 100Desks 36 54 8 1 99 36 55 8 1 100H/teacher’s office 39 55 5 0 99 39 56 5 0 100Staff room 40 49 9 1 99 40 50 9 1 100Playground 40 37 16 6 99 41 37 16 6 100VS = Very Sufficient S = Sufficient
IS = Insufficient VIS = Very InsufficientV
Both head teachers and teachers shared the view that while a number of facilities were
adequate, including Head teacher’s office, Deputy Head teacher’s and Staff room, others
were not enough and needed some improvement, while others did not exist at all. Among
the facilities that needed improvement were; classrooms desks, chairs, tables and
playfield. Libraries and staff houses were non-existent in virtually all schools. The few
who claimed to have libraries only referred to either a cupboard or a small room where
textbooks were kept. Similarly, pupils supported the view that classrooms (92%), Head
teachers office (95%), Staff room (90%) were adequate. In addition, they believed that
the desks were enough (91%) and that the playfield (78%) was adequate while the rest
55

(22%) believed it was inadequate. The absence of a library was a great disadvantage to
teachers and pupils. Indeed the quality of the above facilities was perceived by both
teachers and head teachers as being low.
4.3.2. Time Utilization
As a school policy, head teachers remarked that pupils in their schools were expected to
report in school before 7.30am and any latecomers were punished within the school.
Teachers were supposed to report in schools between 7.30am and 8.00am and leave their
work stations at 5.00pm, except for two (2) schools where they left at 4.10pm, time when
the official primary school timetable ended.
Table 36: Head teachers’ opinion on the effect of distance covered by teachers and pupils between their home and school on pupils’ performance in school
Effect on Yes No TotalsF % F % F %
Teachers 8 73 3 27 11 100Pupils 8 73 3 27 11 100
F = Frequency % = Percentage
From the table above, it is evident that 8 (73%) of the head teachers agreed that distances
covered between the homes and school had an effect on both teachers’ and pupils’
performance in school. Only 3 (27%) felt that the distance had no effect on either
teachers or pupils.
Table 37: The effect of distance covered by teachers and pupils from horhe to school on pupils' performance
Extent Teachers performanceF %
Pupils performanceF %
Very great effect - - 2 25Great effect 4 50 3 37.5Moderate effect 3 37.5 1 12.5Low effect 1 12.5 2 25Very low effect - - - -
Total 8 100 8 100F = Frequency % = Percentage
56

Among the 8 head teachers 4 (50%) viewed the distance covered by the teachers between
home and school as having a great effect on the teachers' performance in school, while 3
(37.5%) viewed the effect as moderate and only 1 (12.5%) viewed it as low. The effect
of the distance on pupils' performance was viewed by 2 (25%) of the head teachers as
very great, 3 (37.5%) as great, 1 (12.5%) as moderate and 2 (25%) as low.
This means that the extent to which distance to and from school affected the performance
of both teachers and pupils depended on the location of the school and its catchment
area. Indeed, teachers and pupils who covered longer distances would be affected more
while the schools that were located on hilly terrains were difficult to access. Both
teachers and pupils arrived at school very fatigued, making it difficult for the teaching
and learning process to take effect immediately and effectively, especially in the morning
session.
Investigations on pupils showed that they all went to school early every morning on foot,
except one (1) who rode a bicycle. Majority of them (55%) covered a distance of
between 1 and 2 km, one way to school, 27% covered less than 1km, 17% covered
between 2 and 5 km and 1% covered over 5km. All of them struggled and made sure that
they arrived at school before 7.30am, as those who arrived late were punished within the
school and on rare occasions were sent home till the following day. This implied further
time wastage.
Table 38: Distance covered by pupils daily from home to school
Distance covered F % CPLess than 1 km 27 27 27Between 1 and 2 km 54 55 82Between 2 and 4 km 10 10 92Between 4 and 5 km 7 7 99Over 5 km 1 1 100Total 99 100 100
F = Frequency % = Percentage CP = Cumulative Percentage
The, distance covered by pupils affected them because much time was wasted on
traveling at the expense of their studies, thus impairing their physical and mental
readiness to learn.
57

The pupils also revealed that absenteeism was rampant in the schools. Item number 20
on the pupils’ questionnaire was used to establish whether teachers were strict on the
issue of absenteeism or they left it upon the pupils to decide on when to and not to attend
school. It was also used to establish whether the teachers helped pupils who had been
absent to catch up with the others or instead they perpetuated further time wastage.
Table 39: Actions taken by teachers against pupil absenteeism
Reason for being absent Sent home to come
with parent
Given light punishment
Give reason for being
absent
Helped to catch up
1. S ic k n e s s F 50 37 61 79% 51 37 62 80
2. T a k in g c a re o f th e y o u n g o r s ic k F 85 58 4 7 21% 86 59 4 7 21
3. W o rk in g fo r m o n ey F 87 55 2 9 26% 88 56 2 9 26
4. T o w o rk in fa m ily sham ba F 89 57 35 18% 90 58 35 18
5. S e n t to th e m a rk e t F 82 57 31 17% 83 58 31 17
6. L ac k o f sch o o l u n ifo rm F 73 22 33 57% 74 22 33 58
F = Frequency % = Percentage
From table 39 above, it is evident that teachers were very strict on pupils’ absenteeism.
Whenever a pupil was absent he or she would be punished in form of being sent home to
come with parents, administering some light punishment or simply asking him/her
explain the reasons for absenteeism. Those who missed school due to sickpess were in
most cases helped to catch up after attesting to their evidence of their sickness. Similarly,
those whose reason for being absent was lack of school uniform would come with their
parents (74%) after which they offered remedial classes to catch up (58%). Sending
pupils home to come with parents was the most common action taken by teachers (over
50% in all cases).
It was a rare practice to help pupils to catch up because only less than 30% of the,
absentees were helped, so expect in cases of sickness and lack of school uniform where
80% and 58% respectively were always helped to catch up.
58

This means that, while teachers were very strict on absenteeism, some of their methods
of deterring pupils from such errant behaviour made them lose more learning time
especially when pupils were sent home to come with their parents. The most prevalent
reason pupils missed school seemed was related to their economic background, which
was beyond their control. Teachers should try to assist such pupils catch up maximizing
upon the available time in school for remedial teaching. It is also noted that in many
cases more than one action was taken on an individual student simultaneously,
sometimes combining punishment with remedial learning measures.
Table 40: Means by which pupils got their lunch meals in Mutonguni Division
Source of lunch meal Frequency Percentage (%) Cumulative percentageCarried packed lunch 31 31 31Parents brought 25 25 56School provided 41 42 98Went home for lunch 2 2 100Other - - 100Total 99 100 100
Table 40 reveals that 42% of the pupils were provided lunch at school, while 31%
carried packed lunch, 25% were brought lunch from home while 2% went home for
lunch. This means that only 41% were sure to have lunch as the school was in control.
For the rest, their chances of taking lunch depended on whether food was available at
home or not. In cases where pupils missed their lunch, it would be very difficult for them
to concentrate during the afternoon lessons.
Table 41: Pupils’ study habits
Un i v e r s i t y of n a i r o b *IABT AFRICANA COLLECTION
Habit A MT ST AnT TotalF % F % F % F % F %
Completion of home work 54 55 20 20 25 25 0 0 99 100Private study 38 38 19 19 39 40 3 3 99 100F = Frequency % = Percentage
A = Always MT = Most times
ST = Sometimes AnT = At no time
The table above indicates that over one half (55%) of the pupils completed their
homework always, 20% most times while 25% completed their homework only
59

sometimes. 38% studied privately always, 19% most times, 40% some times and 3% at
no time at all. The fact that only 38% had time to study privately explains why a good
number of pupils (45%) did not complete their homework in time. Although most pupils
claimed to have a private timetable (86 pupils), only 13 confessed that they didn’t have.
Those who had timetables either did not follow them or there was not enough time to
cover the timetable schedule due to interruptions both in school and at home.
Table 42: Pupils’ repetition rate
Number of classes repeated F % CPNone 32 32 321 38 39 712 25 25 963 3 3 99More than 3 1 1 100Total 99 100 100
F = Frequency % = Percentage CP = Cumulative Percentage
From the table above, it is evident that repetition was highly pronounced among most
pupils in Mutonguni Division. 67% of the pupils had repeated at least in one (1) class. In
fact, 28% had repeated two or more classes. Only 32% had not repeated any class. This
is a good indicator of time wastage on the part of the pupils.
Table 43: The amount of pupils’ learning time consumed by various activities
Activity Very little Little Moderately A lot o( Totalstime
F % F % F % F % F %Sports day 31 31.3 28 28.3 11 11.1 29 29.3 99 100Festival days 17 17.2 44 44.4 9 9.1 29 29.3 99 100Punishment 47 47.5 27 27.3 9 9.0 16 16.3 99 100Working in the school shamba
39 39.4 36 36.4 6 6.0 18 18.2 99 100
Being sent by teachers
52 53.0 39 39.0 3 3.0 5 5.0 99 100
F = Frequency % = Percentage
From the table above, there is evidence that pupils learning time was sometimes
interrupted by other activities, outside the class. Most pupils reported that a substantial
60

amount of their learning time was reduced by activities such as sports days, festival days,
punishment, working in the school shamba and sometimes being sent by teachers.
Although this time may not have been significantly high, eventually it could have an
effect on the total time spent on learning activities, ultimately affecting pupils'
performance in the KCPE examination.
Table 44: Factors that negatively affect pupils’ academic performance as rated by Head teachers and class Eight teachers
Factors High-veryhigh
H/t T
Minimal- very minimal H/t T
No effect at all
H/t T
Total
H/t TPupils absenteeism 73 50 27 50 - 100 100Pupils lateness 72.8 35 27.2 65 - 100 100Poor management of homework 73 40 27 60 - 100 100Teachers absenteeism 54.6 35 45.4 45 20 100 100Pupils poor concentration in class
64 65 36 35 - 100 100
Pupils failure to sit for internal tests & exams
73 70 27 30 100 100
Interruption of learning process 36 50 64 50 - 100 100Absence of school feeding programme
91 65 9 35 100 100
H/t = Head teachers T = Teachers
According to the above table, the head teachers viewed the school feeding programme as
being very important in determining pupils’ performance. Other factors that were rated
high were; pupils’ absenteeism, pupils’ lateness, poor homework management, pupils’
poor concentration in class and pupils’ failure to sit for internal tests and examinations.
Among the factors rated low were; teachers’ absenteeism and interruption of pupils’
learning. The teachers concurred with the head teachers that the above factors actually
affected pupils’ performance. However, they disagreed on the fact that teachers’
absenteeism and poor management of homework affected pupils’ performance to a large
extent. Instead, the teachers felt that interruption of pupils’ learning affected pupils’
performance more significantly.
61

4.3.3. Community/parental involvement in school matters
Table 45: The distribution of schools in terms whether or not they have a rewarding system for good performance as reported by head teachers
Groups rewarded Yes No TotalsF % F % F %
Teachers 4 36 7 64 11 100Pupils 7 64 4 36 11 100F = Frequency % = Percentage
Table 46: The absence or presence of rewarding system for teachers and pupils as reported by the teachers
Groups rewarded Yes No TotalsF % F % F %
Teachers 3 15 17 85 20 100Pupils 3 15 17 85 20 100F = Frequency % = Percentage
According to table 45 and 46, the data shown indicates that both head teachers (64%)
and teachers (85%) revealed that most schools did not have a rewarding system for
teachers. Although many head teachers (64%) reported that their schools rewarded pupils
for good performance, most teachers did not affirm this, as only 15% affirmed. The
contradiction may have occurred due to the variation between what was happeningy
before the introduction of free primary education and what could have been happening
after that. Some schools may have rewarded teachers and pupils for good performance
before the introduction of FPE possibly through parents’ contribution, an operation
which was not currently allowed under the provision of FPE.
The pupils also concurred with the view that most schools did not reward pupils for good
performance. However, in the few schools where good performance was rewarded,
parents and school committees organized for the provision of these prizes. This means
that the parents were actively involved and their non-involvement meant absence of
rewards for either the teachers or pupils.
62

Table 47: The schools’ policy on parents/community involvement in schoolactivities/matters
Activities A MT ST R VR TotalsF % F % F % F % F % F %
Discussions on 1 9 7 64 3 27 - 11 100academic progress Management of homework
6 55 5 45 ............................................ 11 100
Giving advice and guidance at school
“ 4 36 7 64 - 11 100
A = Always R = Rarely
MT = Most times VR = Very rarely
ST = Sometimes
Table 47 above indicates that 1 (9%) of the schools involved parents in academic
discussions always, 7 (64%) most times and 3 (27%) only some times. 6 (55%) of the
schools involved parents in the management of homework always, 5 (45%) most times.
No school invited parents/community to give advice, suggestions or general guidance to
pupils always, 4 (36%) did so most times, while 7 (65%) invited community members
only sometimes. This means that school policies themselves were a source of hindrance
to parents and community involvement in school matters.
Table 48: The extent to which the schools practically involved parents/community in school activities/matters (report by teachers) y
Activities A MT ST R VR TotalsF % F % F % F % F % F %
Discussions on pupils 4 20 7 35 6 30 3 15 - 20 100academic progress Encouraging them to 6 30 3 15 7 35 3 15 1 5 20 100ensure pupils do homeworkSuggestions on way of 4 20 11 55 4 20 1 5 20 100improving schools’performance___________________________________A = Always R = Rarely
VR = Very rarelyMT = Most times
ST = Sometimes
63

Table 48 indicates that 4 (20%) of the teachers reported that parents/community were
actually involved in academic discussion always, 7 (35%) most times, 6 (30%)
sometimes while according to 3 (15%) the parents were rarely involved. 6 (30%)
reported that parents were always encouraged to ensure that their children completed
homework, 3 (15%) most times, 7 (35%) sometimes, 3 (15%) rarely and 1 (5%) very
rarely. Involvement of parents or the community through giving suggestions and advice
on how school performance could be improved was seen by 4 (20%) as being done
always, 11 (55%) most times, 4 (20%) sometimes and 1 (5%) rarely. This means that it
was difficult for teachers to enforce or implement what the school policies did not
emphasize. In other words, although the school policies are implemented by the teachers,
sometimes the effectiveness of the implementation would be determined by the firmness
of the policy makers (head teachers).
Table 49: The level of participation by parcnts/commuiiity in school activities as reported by the pupils
ActivitiesF
A% F
MT% F
ST%
AnTF %
TotalsF %
Discussions on pupils academic progress
36 36 21 21 40 41 2 2 99 100
Parents assist pupils do homework
20 20 15 15 58 59 6 6 99 100
Development activities of the school
57 58 18 18 23 23 1 1 99 100
Giving advice and suggestions on academic progress
18 18 22 22 50 51 9 9 99 100'V
A = Always ST = Sometimes
MT = Most times AnT = At no Time
According to the information obtained from the pupils, 36% had their parents always
participate in discussions concerning academic progress, 21% participated most times,
40% sometimes while 2% did not participate at all. 20% had their parents assist them in
doing homework always, 15% most times, 59% were only assisted sometimes while 6%
were never assisted at all. 58% had their parents participate in development activities of
their school always, 18% most times while 1% never participated at all. 18% reported
64
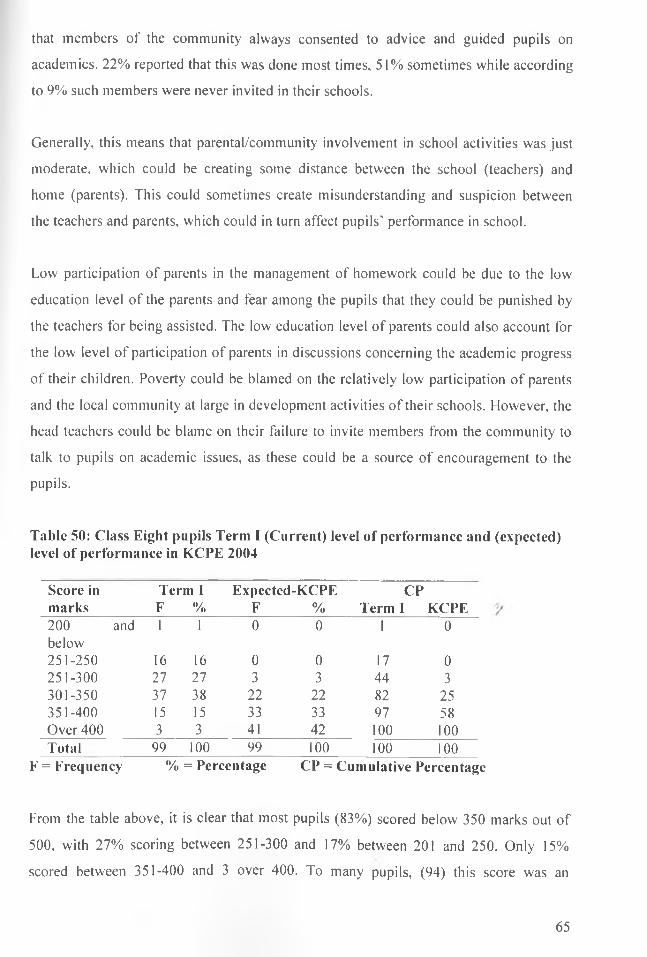
that members of the community always consented to advice and guided pupils on
academics. 22% reported that this was done most times, 51% sometimes while according
to 9% such members were never invited in their schools.
Generally, this means that parental/community involvement in school activities was just
moderate, which could be creating some distance between the school (teachers) and
home (parents). This could sometimes create misunderstanding and suspicion between
the teachers and parents, which could in turn affect pupils' performance in school.
Low participation of parents in the management of homework could be due to the low
education level of the parents and fear among the pupils that they could be punished by
the teachers for being assisted. The low education level of parents could also account for
the low level of participation of parents in discussions concerning the academic progress
of their children. Poverty could be blamed on the relatively low participation of parents
and the local community at large in development activities of their schools. However, the
head teachers could be blame on their failure to invite members from the community to
talk to pupils on academic issues, as these could be a source of encouragement to the
pupils.
Table 50: Class Eight pupils Term I (Current) level of performance and (expected) level of performance in KCPE 2004
Score in marks
Term IF %
Expected-KCPE F %
CPTerm I KCPE
200 and below
1 1 0 0 1 0
251-250 16 16 0 0 17 0251-300 27 27 3 3 44 3301-350 37 38 22 22 82 25351-400 15 15 33 33 97 58Over 400 3 3 41 42 100 100Total 99 100 99 100 100 100
F = Frequency % = Percentage CP = Cumulative Percentage
From the table above, it is clear that most pupils (83%) scored below 350 marks out of
500, with 27% scoring between 251-300 and 17% between 201 and 250. Only 15%
scored between 351-400 and 3 over 400. To many pupils, (94) this score was an
65

improvement to what they had scored in the previous year before they joined class Eight.
Most of them hoped to score higher marks in KCPE in November 2004 with only 3%
expecting to score between 251-300, 22% between 301-350, 33% between 351-400 and
42% expected to score over 400. This means that despite the many obstacles, pupils were
determined to perform better in the KCPE examination.
4.4. TESTING OF HYPOTHESES
The study hypotheses were tested to find out whether there were statistical relationships
between the independent variables and pupils' academic performance in the KCPE
examination. In each case, a numerical value was calculated to indicate the degree of
presence of each variable in the schools.
Table 51: The values assumed by the variables in each school
Independent Variables Dependentvariable
School Pupil-Teacher
ratio
Workload per week
ResourceAvailability
TimeUtilization
Communityinvolvement
Performance /500 marks
S c h o o l 1 42 1 43 3 .3 7 2 .3 8 3 .33 194.7S c h o o l 2 45 1 38 4 .53 3 .75 3 .6 7 2 6 6 .7S c h o o l 3 35 1 33 4 .3 2 1.13 4 .6 7 2 4 6 .0S c h o o l 4 39 I 38 3 .3 2 2 .0 0 4 .0 0 2 2 9 .9S ch o o l 5 28 1 38 4.1 2 .0 0 4 .0 0 151 .6S c h o o l 6 27 1 38 3.21 1.63 3 .6 7 166 .0S c h o o l 7 31 1 38 2 .7 9 1.88 4 .0 0 2 4 2 .9S ch o o l 8 25 1 33 3 .7 4 1.75 4 .3 3 2 4 6 .9S c h o o l 9 35 1 28 3 .7 4 2 .8 8 3 .6 7 2 9 6 .2S c h o o l 10 37 1 33 3 .4 7 3 .63 3 .6 7 , 2 4 5 .2S ch o o l 11 28 1 38 3 .4 2 2 .8 8 4 .3 3 7 2 3 6 .8
For each of the independent variables, the values were first re-arranged from the lowest
to the highest. They were then divided into two, (those which scored high and those
scored low). Their mean performance, variance and t-statistics were calculated, resulting
into the table below.
66

Table 52: A summary of the relationship between independent and dependent variables
Independent Range of N-in Mean (V) (r) t- t- tablevariable indicator sub-group performance Calculated 0.025 0.005S iz e o f c la s s 35 & 7 2 2 6 .7 25 .5p e r te a c h e r b e lo w
0 .3 3 0 .1 6 2 .2 6 2 3 .2 5 03 6 - 5 0 4 2 3 3 .9 9 .2
W o rk lo a d 2 5 - 2 3 4 2 5 8 .6 6 .31.19 2 .2 6 2 3 .2 5 0
3 4 -4 5 7 213.1 18.5M a te r ia l 2 - 3 .4 7 6 2 2 6 19.85re so u rc e 0 .0 7 9 0.11 2 .2 6 2 3 .2 5 0a v a ila b ili ty 3 .8 -5 .0 5 231 2 0 .8 9l im e 1 - 2 . 0 6 2 1 3 .8 18.13u tiliz a tio n
2 .1 -5 .0 5 2 4 7 .8 14.170 .001 0 .8 3 2 .2 6 2 3 .2 5 0
C o m m u n ity 3 - 4 . 0 8 2 2 4 .2 2 4 .7in v o lv e m e n t
4 .1 -5 .0 3 2 .4 3 2 0.310 .4 3 2 .2 6 2 3 .2 5 0
V = Variance r = Correlation coefficient
From the results shown in the above table the following observations can be made;
(a) Time utilization
The indicators of time utilization ranged between I and 5. The schools that utilized time
ranging between 2.0 and below were grouped together, and were 6 in number. Those that
utilized time ranging between 2.1-5.0 were 5, comprising the second group. The second
group was found to have a higher mean performance (247.8) and lower variance (14.17)
than the first group whose mean performance was 213.8 and variance of 18.73. This
means that the scores of schools within each group were varied with some schools
scoring high above the mean and others below the mean. Time utilization therefore was
found to affect performance positively because more time led to better performance.
However, further statistical testing showed only a weak positive relationship between the
two, with r of 0.001. The t-calculated was 0.83 while t-table at 0.025 was 2.262 and at
0.005 was 3.250.
67

(b) Availability of human and material resources
The relationship between the availability of resources and performance was tested by
three indicators, namely; pupil-teacher ratios, teacher’s workload (human resources) and
material resources (physical facilities and teaching and learning resources).
The results indicated that schools with small pupil-teacher ratios (35 and below)
performed dismally (226.7) and had a higher variance (25.5) than the schools that had
bigger pupil-teacher ratios (36-45), which performed at 233.9, and a variance of 9.2. This
means that schools with small pupil-teacher ratio performed quite differently with some
performing well and others poorly. Further statistical tests showed a weak positive
relationship, with a correlation coefficient (r) of 0.33 and t-0.16.
Results on the teachers’ workload, indicated that, teachers who had less workload (25-
35) performed much better (258.6) than those with more workload (213.1). The variance
within the two groups was 6.3 and 18.5 respectively. This means that performance
among teachers with no workload was not at the same level while teachers with less
workload performed more or less at the same level. There was no linear correlation
between teachers’ workload and performance, t-calculated (1.19) was smaller than t-table
at both 0.025 and 0.005, which were 2.262 and 3.250 respectively. This means that the
relationship between teachers’ workload and performance is not statistically significant.
In relation to the availability of the material resources, the results of this study indicate
that schools that had more resources (3.8-5.0) performed at 231 and variance of 20.89
while the schools with fewer resources (2-3.47) performed at 226 and a variance of
19.85. This means that availability or non-availability of resources promoted or hindered
performance. A correlation coefficient of 0.04 and a calculated t value of 0.11 indicated
weak positive relationship between resource and performance.
68

(c) Community involvement
The findings indicate that high level of community involvement in school matters (4.1-
5.0) resulted into better performance (243.2) while low level (3-4.0) resulted into weaker
performance (224.2). The variance among the schools with high community involvement
was 0.31 while among the schools with low community involvement was 24.78. This
implies that there was a remarkable difference in performance among the schools with
low community involvement than there was among the schools with high community
involvement.
There was no linear correlation between community involvement and pupils' academic
performance. The calculated t-value (0.43) was much lower than the t value at both 0.025
(2.262) and 0.005 (3.250). Statistically, the relationship between community
involvement and pupils’ academic performance was insignificant.
4.5. Other factors that influenced pupils’ academic performance in KCPE in
Mutonguni Division
The head teachers, teachers and pupils had been asked to identify factors that in their
view influenced pupils' academic performance in their schools. And, below is a list of
factors that were viewed by the head teachers and class Eight teachers as influencing
pupils' academic performance both negatively and positively.V
a) Factors believed to affect pupils’ performance negatively
• Poverty related problems - Poor facilities at home
- In ability to pay secondary school fees
- Child labour
• Poor syllabus coverage
• Pupils’ absenteeism and poor concentration in class
• Lack of support by parents/community
• Indiscipline of pupils’
• Shortage of learning resources, especially reference and revision materials and
library facilities
69

• Absence of school feeding programme
• Long distances due to scarcity of schools
• Famine related problems due to frequent droughts
• Low motivation among teachers due to low salaries, harassment by some head
teachers and other education officers.
• Shortage of teachers
• Poor language due to mother tongue influence
• Negative attitude towards education
b) Factors believed to promote academic performance
• Teachers' constant encouragement to pupils
• Frequent evaluation
• Adequate and high quality teachers
• Parental encouragement
• Parents’ supportUNIVERSITY OF NAIROBI
• Presence of feeding programme in the schools g;\6T AFRICANA COLLECTION
• Availability of learning resources
• Pupils’ and teachers' commitment to class work.
• Good learning atmosphere
• Good and early coverage of syllabus and adequate revision before examination
c) Factors viewed by pupils as interfering with their academic performance
• Pupils’ absenteeism and lateness
• Indiscipline among pupils
• Inadequate revision before KCPE Examination
• Poor syllabus coverage
• Pupils’ laziness and lack of seriousness in academic work.
Failure to do homework and assignments
Poor concentration in class
Noise making in class
Wastage of time on punishment.
70

• Lack of food at home and absence of school feeding programme.
• Lack of proper guidance from both teachers and parents
• Un conducive atmosphere for studying at home
Assigned a lot of work (household chores) and little time to study
Lack of facilities like tables, study rooms and paraffin.
• Lack of revision materials
• Poor relationship between teachers and parents
• Teachers' absenteeism - shortage of teachers.
The findings suggest that the factors that influenced pupils academic performance were
viewed by both teachers and pupils as being either school based (availability of teachers,
teaching & learning resources, school administration, time utilization and school climate)
or household/community based (economic and academic background of the pupils,
distance covered by both pupils and teachers and community involvement in school
matters).
V
71

CHAPTER FIVE
SUMMARY, CONCLUSIONS AND RECOMMENDATIONS
5.0. SUMMARY
Poor academic performance in the KCPE Examination by pupils in Kitui District
prompted the researcher to investigate factors that contributed to such a trend. The study
was carried out among the public day primary schools in Mutonguni Division that had
done KCPE Examination for the last four years. The respondents included head teachers,
class eight teachers and class eight pupils. Data was collected using self-administered
structured questionnaires and informal interviews.
From the data that was analysed using both quantitative and qualitative involving
descriptive statistics it was evident that pupils' academic performance was mainly
influenced by;
i) Availability of teachers: schools whose teachers had less workload performed better
than those whose teachers had more workload.
ii) Unavailability of important resources and facilities such as; library facilities, staff
houses, revision materials and reference books which hindered pupils’ academic
achievement in schools.
iii) Poor time utilization by both teachers and pupils, which led to non-coverage of the
syllabus and inadequate revision. y
iv) Low community involvement in school matters, which created a gap between the
teachers and parents.
v) Indiscipline among pupils, which made them become unruly and unco-operative.
vi) Absence of the school feeding programme, which increased pupils' absenteeism and
interfered with their concentration in class.
5.1. CONCLUSIONS
The findings of this study revealed that there are various factors which influence pupils’
academic performance in KCPE. Some were school-based, while others were family or
72

community based factors. Both household/community and school-based factors
determined the experiences that pupils went through in the schooling process ultimately
determining what they attained in the KCPE examination. Among the school-based
factors were; teachers, physical facilities, teaching and learning resources and school
administration, while household/community-based factors included, socio-economic
background, parental involvement and distance between home and school.
The community was particularly supposed to provide schools with physical facilities,
teaching and learning resources and above all, support the teachers. However, this study
established that the community was very weak economically with the majority of people
being involved in subsistence farming or operating small businesses. Large families of 6-
10 children also dominated the division. These areas also experience frequent drought
accompanied by severe famine. For this reason, the community could not support the
schools materially and therefore the schools lacked most of the necessities. Thanks to
the introduction of the Free Primary Education programme, which has improved the
situation. The find'ngs also indicated that most parents did not excel in education (58%)
as they dropped out of school before completing their secondary school education. For
this reason, they did not value education and could not co-operate with teachers. Due to
their low level of education, they were not able to assist their children in doing
homework neither did they bother to monitor the academic progress of their children.
This negatively affected pupils’ academic performance in school.
Long distances covered by pupils and teachers through rough roads and theTiilly terrain
interfered with their time utilization in school as they arrived in school fatigued.
Rampant pupils’ absenteeism and indiscipline also contributed to poor performance.
Absence of the school feeding programme was found to affect pupils’ academic
performance in two ways; increasing absenteeism and interfering with pupils’
concentration in class particularly during the famine season.
Finally, failure by teachers to cover the syllabus partly due to heavy workload and (in
some cases) absenteeism had a negative effect on performance. This also meant lack of
adequate revision before the KCPE Examination.
73

5.2. RECOMMENDATIONS
From the foregoing study, the following need to be undertaken by the parties concerned
in order to improve pupils' academic performance in KCPE Examination.
5.2.1. P a r e n ts
The parents should play a more active role in the education of their children by;
• Providing basic needs,
• Ensuring that they attend school always,
• Allowing them time to study at home,
• Assisting them in doing homework,
• Guiding and counseling,
• Co-operating with teachers to ensure discipline is enhanced,
• Being in touch with the academic progress of their children,
• Participating in schools' development activities.
5.2.2. Local CommunityThe local community should endeavour to ensure the success of the schools by;
• Supporting the needy and orphaned children,
• Supporting the school projects,
• Assisting in controlling drug abuse among pupils,
• Motivating excelling teachers and pupils in their respective schools, /
• Holding barazas to create awareness among parents, pupils and teachers of any
embedding dangers such as disease outbreak and water shortage,
• Talking positively about education.
5.2.3 PupilsThe pupils not only constitute a very crucial part of the school but also play a key role of
contributing at least 50% to their success. For this reason, they should;
• Attend school regularly,
74

• Work hard in all subjects,
• Utilize their time wisely both in school and at home,
• Do all assignments and homework,
• Sit for all tests and examinations,
• Always seek assistance incase of difficulties,
• Have positive attitude towards education,
• And above all be disciplined and co-operate with teachers.
5.2.4. T e a c h e r s
Teachers play a key role in the teaching and learning process, and greatly determine the
level at which a school performs. In order to improve pupils’ academic performance, the
researcher recommends that the teachers need to;
• Cover the syllabus in good time,
• Test pupils regularly and do enough revision before the KCPE examination. This
will build confidence in them and reduce anxiety during the KCPE examination.
• Avoid tardiness in lesson attendance,
• Pay attention to the learners who have learning difficulties,
• Avoid unnecessary absenteeism in school,
• Put more emphasis on assignments and homework so as to keep the pupils actively
involved in school,
• Always guide, counsel and encourage the pupils,
• Enroll and study for degree programmes which are available in njost public
universities so as to improve on their academic qualifications, other than relying on
promotion by merit.
5.2.5. H ead te a c h e r s
In order to improve pupils’ academic performance, the head teachers should;
• Adopt school policies that foster hard work by both pupils and teachers,
• Cultivate a positive relationship between teachers, parents and pupils,
• Ensure good discipline among the pupils,
• Encourage team work among the teachers,
75

• Ensure smooth running of the school by holding regular staff meetings at least twice
a term to review the operations of their respective schools,
• Organise for open and prize-giving days, to review the academic progress and
reward the performance both in curricula and co-curricula activities,
• Enlighten parents on their role in education and always update them on what is
taking place in school,
• Empower the Parents-Teachers Association (PTA) to meet frequently, at least once
every term to review the performance of pupils in their relevant classes,
• Buy the recommended textbooks.
5.2.6 Examiners, (KNEC)The Kenya National Examinations Council should;
• Ensure that all the questions are written clearly,
• Consider pupils from poor families (orphans) in the payment of examination
registration fees,
• Introduce a single continuous examination system instead of just one examination,
since such an examination disadvantages pupils who may fall sick or suffer any other
problem during the examination time,
• Avoid setting questions which may favour certain categories of pupils.
5.2.7. G overnm ent, (MOEST)
In order to ensure the smooth running of and good performance in schools, the
government through the Ministry of Education, Science and Technology should;
• Employ more teachers to cater for the increased enrollment due to the introduction
of free primary education,
• Expand the FPE budget to include provision of famine relief food so as to improve
pupils' daily attendance and concentration in class work,
• Provide enough teaching and learning resources including reference and revision
materials,
• Make policy decisions which focus on construction of libraries in primary schools.
• Upgrade one of the good provincial schools in Kitui District to a tertiary institution
that could serve as a role model for further studies,
76

• Boost teachers’ morale by implementing their scheme of service,
• Organise in-service seminars for teachers whereby educational officers and
inspectors can get feedback from the teachers, advice accordingly and update them
on current trends in education,
• Consider allowing re-introduction of joint mock examinations in primary schools so
as to enable pupils to become psychologically prepared for the final KCPE
Examination,
• Give clear guidelines on how to maintain discipline in schools, as punishment
seems time consuming and less effective,
• Allow primary schools to employ bursars/clerks who will handle financial
management so as to relieve the head teachers from this extra burden.
Through the appropriate ministries, the government should also;
• Improve child care and health services in the rural areas by equipping the health
centres and providing health workers,
• Improve infrastructure in order to ease the movement of teachers and pupils to and
from school,
• Provide water and electricity to rural areas in order to promote self-employment
among the locals, thus improving their economic status.
5.3. RECOMMENDATIONS FOR FURTHER RESEARCH
The researcher advises that;
1. Research be conducted focusing on performance in specific subjects so as toy
establish the subjects that are performed poorest,
2. A similar research is conducted in other ASAL regions of the country so as to have a
clear overview of the problems facing these areas. This will enable planners to
address the problems in totality,
3. Another research is conducted in an urban setting to give a balanced overview of the
factors that influence pupils' academic performance in public primary schools.
77
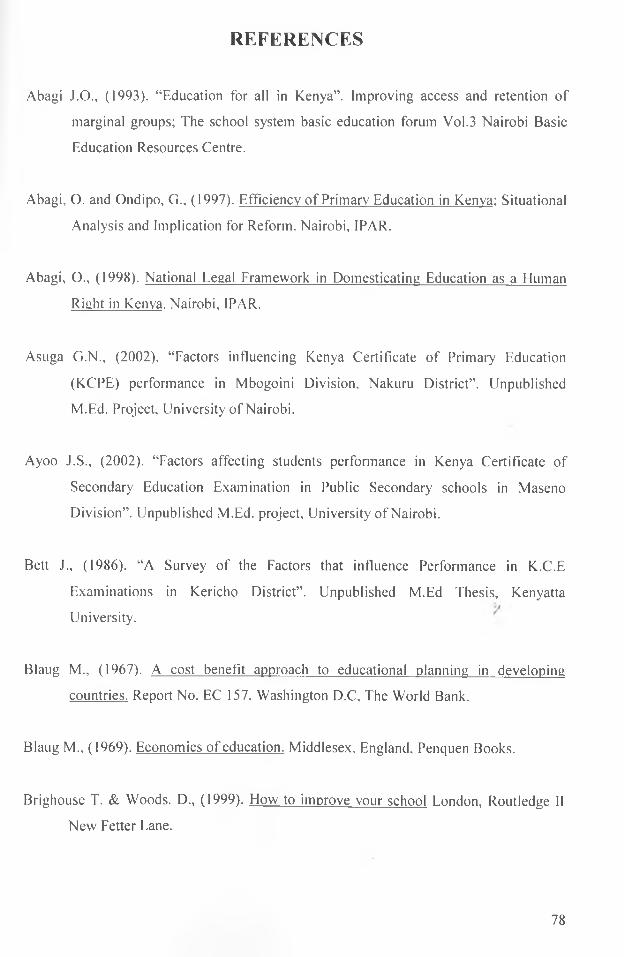
REFERENCES
Abagi J.O., (1993). “Education for all in Kenya”. Improving access and retention of
marginal groups; The school system basic education forum Vol.3 Nairobi Basic
Education Resources Centre.
Abagi, O. and Ondipo, G„ (1997). Efficiency of Primary Education in Kenya: Situational
Analysis and Implication for Reform. Nairobi, IPAR.
Abagi, O., (1998). National Legal Framework in Domesticating Education as a Human
Right in Kenya. Nairobi, IPAR.
Asuga G.N., (2002). “Factors influencing Kenya Certificate of Primary Education
(KCPE) performance in Mbogoini Division, Nakuru District”. Unpublished
M.Ed. Project, University of Nairobi.
Ayoo J.S., (2002). “Factors affecting students performance in Kenya Certificate of
Secondary Education Examination in Public Secondary schools in Maseno
Division”. Unpublished M.Ed. project, University of Nairobi.
Bett J„ (1986). “A Survey of the Factors that influence Performance in K.C.E
Examinations in Kericho District”. Unpublished M.Ed Thesis, Kenyatta
University.
Blaug M., (1967). A cost benefit approach to educational planning in developing
countries. Report No. EC 157. Washington D.C, The World Bank.
Blaug M., (1969). Economics of education. Middlesex, England, Penquen Books.
Brighouse T. & Woods. D., (1999). How to improve vour school London, Routledge II
New Fetter Lane.
78

Brookover, W.B, Et al, (1997). Schools systems and Students Achievement. Schools
Make a difference. New York, Praeger.
Brophy, J. and Good, T. L, (1986). Teacher Behaviour and Student Achievement: (in
N.C. Wittrockled) Handbook of research on Teaching, New York, Macmillan.
Canta I.S., (1975). “The effect of family characteristics, parental influence, language
spoken, school experience on the level of Educational attainment of Mexican,
American”. Dissertation Abstract International 36(6) 3261-A-3262-A.
Church Hill G.A., (1991). Marketing Research: Methodological Foundation. (5th edition).
Chicago, The Dryden Press.
Comber, L.C. and Keeves, J.P., (1973). Science and Education in Nineteen Countries.
Stockholm, Almqvist and Wiksell.
Copper D. R; and Schidler (1999). Business Research Method. (6th edition). New Delhi,
Tata Mcgraw-Hill.
Costello, J., (1991). Teaching and Learning Mathematics. New York, Routledge.
Creemers, B.P.M., (1994). The Effective Classroom. London, Cassell.
y
Deolalikar. A.B., (1999). “Primary and secondary education in Kenya”. A sector review
in Kenya. Unpublished Research Report, Nairobi.
Dumzio S.R., (1989). “School Size, School Climate and Student Achievement in
Secondary Schools in New York State”. Ed.D Columbia University Teachers
College.
Duncan N.W., (1989). “Studies in comparative and international Education”, no. 16
engendering school learning science attitudes and achievements among boys and
girls in Botswana. Stockholm; Nalkas Boken, Forlag.
79

Elimu Yetu Coalition (2003). “Reform Agenda for Education Sector in Kenya”. Setting
Beacons for Policy and Legislative Framework. Nairobi.
Eshiwani G.S., (1982). Education and Development in Western province of Kenya. A
paper presented at the Leaders Conference (Organized by the Chamber of
Commerce).
Eshiwani G.S., (1983). “Factors influencing Performance among Primary and Secondary
Pupils in Western Province: A policy study”. Bureau of Educational Research,
Nairobi Kenyatta University.
Eshiwani G.S., (1993). Education in Kenya Since Independence. Nairobi, East Africa
Education publishers.
Griffin G., (1994). School Mastery. Nairobi. Lectern Publication.
Nguru R.K., (1987). “Analysis of Factors that influences the Achievement of Primary
Education objectives”. Bureau of Education Research Kenyatta University,
Unpublished Research Report.
Haddad, W. (1978). Educational Effects of Class Size. Washington DC, World Bank
Staff Working Paper No. 280. '/
Heyneman, S., Jamison, D. and Montenegro, X., (1984). “Textbooks in the Philippines:
Evaluation of the Pedagogical Impact of a Nationwide Investment”. Educational
Evaluation and Policy Analysis 6 (2): 139-50.
Heyneman, S. and Loxley, W., (1983). “The Effect of Primary School Quality on
Academic Achievement across 29 high and low-income Countries”. American
Journal of Sociology 88. No. 6 (May), 1162-94.
80

Jamison et al., (1981). “Improving Elementary Mathematics in Nicaragua: An
Experimental Study of the Impact of Textbooks and Radio on Achievement”.
Journal of Educational Psychology. 73 (August), 556-67.
Kathuri N.J., (1986). “Some Factors which influence the Performance of Pupils in the
C.P.E. Examination”. Working papers No. 401 Institute of Development studies
University of Nairobi.
Kibui P., (1995). “A Comparative Study of Factors that influence the Examination
Performance of Public and Private Schools in Nairobi”. Unpublished M.Ed.
Thesis, Kenyatta University.
Maundu J.N., (1980). “A study of the Relationship between Kenyan Secondary Schools
Pupils’ needs to Achieve and their Performance in schools subjects”.
Unpublished M.Ed. Thesis, University of Nairobi.
Mbithi, J.M., (2002). “Factors Contributing to Poor Performance in Mathematics in
Yatta Secondary Schools in Machakos District - Kenya”. Unpublished PGDE
Project, University of Nairobi.
MOEST (2001). Education For All (EFA) in Kenya, Nairobi, Government Printer.
MOEST (2003). Report of the sector review and development. Nairobi, Government
Printer.
Mogen, S.N., (1973). Investigations into Assessment in Mathematics in Education.
Nairobi, Kluwer Academic Publishers.
Mugenda O.M. and Mugenda, A.G., (1999). Research Methods: Quantitative and
Qualitative approaches. Nairobi, ACTS Press.
81

Mukundi, C.N., (Sr.) (1999). “The influence of Head Teacher Administrative Behaviour
on Primary Pupils’ Academic Performance in Kiambaa Division, Kiambu
District”. Unpublished M. Ed. Thesis, Kenyatta University.
Muola, J. M., (1990). “The effect of Academic Achievement motivation and Home
environment on Academic achievement among Standard 8 pupils”. Unpublished
M.Ed Thesis, Kenyatta University.
Mutea Z. K., (2002). “An analysis of Performance in English at KCSE Examination”.
Unpublished M.Ed Project, University of Nairobi.
Mutua, L.L.W., (2002). “An investigation of factors affecting Kenya certification of
primary education performance: A case study of Mutito Andei Division Makueni
District”. Unpublished M.Ed. project, University of Nairobi.
Ndiritu, A.W., (1999). “A Study of Factors, which influence Performance in KCSE in
selected public Secondary schools in Nairobi and Central provinces in Kenya”.
Unpublished M.Ed. Thesis, University of Nairobi.
Olembo, J.O, Wanga P.E, and Karagu N.M., (1992). Management in Education. Nairobi,
Educational Research and Publication (ERAP).
Osman, A.O., (1989). “Poor performance in North Eastern: A case study based on some
schools in Wajir and Garissa Districts”. Unpublished PGDE Thesis, Kenyatta
University.
Psacharopoulos, G., (1973). Returns to Education: An international Comparison San
Francisco, Jossey -Bass Inc.
Psacharopoulos, G and Woohall M., (1985). Education for Development: An analysis of
investment cases. New York, Oxford University Press.
82

Reilly D.H., (1995). How to have successful schools! What parents and teachers need to
know to improve children’s learning. New York London, University Press of
America, Iric Lanham.
Republic of Kenya (1964). The Kenya Educational Commission Report (Ominde Report)
Nairobi, Government Printer.
Sallis J., (1990). Schools. Parents & Governors: A new approach to accountability.
London, Routledge II New Fetter Lane.
Shiefelbein E and Simmons J., (1981). “The determinants of school achievement”. A
Review of the Research for Developing Countries.
Shultz T.W., (1961). “Investment in Human Capital”. American Economic Review 51:
1-17.
Sifuna D.N., (1977). Factors determining effectiveness among primary schools teachers.
Nairobi, Kenyatta University Press.
South African Consortium for Monitoring Education Quality (SACMEQ, 1999) in
MOEST (2003). Report of the Sector Review and Development. Nairobi,
Government Printer.
'V
South Worth, G. and Lofthouse B„ (1990). The study of Primary Education. School
Organization and Management. A source Book Vol.2. London, The Falmer Press.
UNESCO (2002). EFA Global monitorimi report: Education for All: Is the world on
Track? Paris, UNESCO.
UNESCO (2003). “Improving performance in primary education. A challenge to the
goals of education for all”. Experts meeting on improving performance in
primary education.
83

Wamai, M., (1991). “Scratching the surface: Results of the first Secondary Examination
under the New curriculum in Kenya”. Unpublished M.Ed. Long Essay, School of
Education, University of Leeds.
Waweru J.M., (1982). “Socio-economic background as an influencing factor in pupils
achievement in primary school in Embu District”. Unpublished M.Ed. Thesis,
University of Nairobi.
World Bank, (1986). “A Report on School Quality and Achievement”. Washington D.C.
Brazil
World Bank, (1987). “Schools & Classrooms Effects on Students Learning in Thailand”. Washington D.C.
S'
84

APPENDICES
APPENDIX I
A list of the schools researched on and their performance for the years 2000-2003.
School Pupils performance in KCPE in mean score2000 2001 2002 2003 Mean
Kakulunga 261.36 - 167.56 230.00 194.7Kakumuti 385.25 275.75 253.75 261.91 266.7Musengo 356.93 254.19 254.06 220.78 246.0Kiatine 353.18 236.88 218.97 211.44 229.9Mutonguni 318.11 212.32 198.67 195.50 151.6Tulia 302.54 240.25 216.59 208.95 166.0Mwangya 376.07 228.20 222.69 242.00 242.9Katheka 207.01 244.24 256.95 267.0 246.9Kyeng’e 412.48 288.87 300.34 301.28 296.2Katutu 358.65 205.95 269.90 249.06 245.2Kasue 309.89 214.50 201.80 219.33 236.8
Expected score 2000 = 7002001-2003 =500
85

APPENDIX II
LETTER TO THE RESPONDENTS
Dear Respondent,
1 am a Post-Graduate student pursuing a Masters degree in Educational Administration and Planning at the University of Nairobi. I am conducting a research for my final year project, which is a requirement of the degree programme.
I am therefore requesting you to kindly spare a few minutes to answer this questionnaire. The information obtained will be used purely for the purpose of this research and will be treated as strictly confidential.
The findings of this study will enlighten the pupils, teachers, parents and the government on the factors influencing pupils’ academic performance in KCPE Examination and possibly put measures in place to improve the performance.
Please do not write either your name or the name of your school anywhere in this questionnaire.
Yours sincerely,
Angejine, S, Muhva. (M.Ed Student UON)
S'
86

APPENDIX III
QUESTIONNAIRE FOR HEADTEACHERS
SECTION A
Please indicate the correct option as honestly as possible by ticking (S) on one of the options. Kindly respond to all the questions.
1. Indicate the zone into which your school belongs.(a ) Tuliazone [ ] (c) Musengo zone [ ](b) Katutu zone [ ] (d) Kauwi zone [ ]
2. Please indicate your gender(a) Female [ ] (b) Male [ ]
3. What is your highest academic qualification?(a) KPE/CPE [ ] (e) DIPLOMA | ](b) KJSE [ ] (f) DEGREE | ](c) EACE/KCE/KCSE [ ] (g) Other - specify(d) EAACE/KACE [ ]
What is your highest professional qualification?(a) P3 [ ] (e) ATS [ ](b) P2 [ ] (f) Diploma [ ](c) PI [ ] (g) Graduate [ ](d) SI [ ] (h) Other - specify
5. For how many years have you been a head teacher?(a) Less than 3 years [ ] (d) 8-10 years [ ](b) 3-5 years [ ] (e) Over 10 years [ ](c) 6-8 years [ ]
6. For how long have you been a head teacher in this school? /(a) Less than 1 year [ ] (c) 2-3 years [ ](b) 1 -2 years [ ] (d) 4 and above years [ ]
7. Are you accommodated at school?(a) Yes [ ] (b) No [ ]
8. If the answer to no 7 above is NO, state the distance from your school to your house/residence.(a) Less than 1 km [ ](b) Between 1 -2 km [ ](c) Between 2 and 4 km [ ](d) Between 4 and 5 km [ ](e) Over 5 km [ ]
87

9. Please indicate the means by which you go to school.(a) By foot [ ](b) By bicycle [ ](c) By car [ ](d) Others - specify______________________________
10. For how many years has this school done KCPE Examination?(a) 5 years and below [ ] (c) 11-15 years [ ](b) 6-10 years [ ] (d) Over 15 years [ ]
SECTION B
For each of the questions in this section, read the responses carefully and put a tick { / ) against the correct response using the appropriate column where necessary.
11. What is the total number of pupils in your school?(a) 200 pupils and below [ ] (d) 401-500 pupils [ ](b) 201-300 pupils [ ] (e) Over 500 pupils [ ](c) 301-400 pupils [ ]
12. What is the total number of pupils in class Eight?(a) 20 pupils and below [ ] (c) 31-40 pupils [ ](b) 21-30 pupils [ ] (d) Over 40 pupils [ ]
13. How many teachers are there in your school?(a) 8 teachers and below [ ] (d) 13-14 teachers [ ](b) 9-10 teachers [ ] (e) 15 and above [ ](c) 11-12 teachers [ ]
14. Which of the following statements best describe the adequacy of teaching staff in your school?.
(a) Very adequate [ ] (d) Very inadequate [ ](b) Adequate [ ] (e) not sure [ ](c) Inadequate [ ] V
15. Indicate in numbers, the categories of teachers in your school?(a) Untrained teachers_________________(b) P3 teachers________________________(c) P2 teachers________________________(d) PI teachers_________________________(e) SI teachers_________________________(f) Diploma teachers____________________(g) ATS teachers________________________(h) Graduate teachers____________________
16. What is the average number of lessons per teacher, per week?(a) 30 lessons and below [ ] (c) 36-40 lessons [ ](b) 31-35 lessons [ ] (d) Over 40 lessons
88

17. Below are some practices commonly found in schools. Please tick (S) the statement that best describes the requirements in your school.
Practice Stronglyagree
Agree Disagree Stronglydisagree
1. Teachers should report at 8.00 am and leave their work station at 5.00pm.
2. Lessons should start and end at the right time as indicated in the time- table.
3. Incase a lesson is not attended to, it must be compensated at the teacher’s own time.
4. Teachers should give assignments and homework regularly.
5. Teachers should mark assignments and homework promptly.
6. Teachers should always maintain an orderly and quiet atmosphere in the school.
7. Teachers should cover syllabus in their subjects by the end of each year.
8. Teachers should regularly give tests to pupils, mark, return the papers, and do corrections with the pupils.
18. Please indicate whether teachers in your school are required to prepare the following documents. ^
Document Always Most times Sometimes Rarely Very rarelySchemes of workLesson plansRecord of work coveredPupils’ progress record/report forms
19. Do you make a follow up to ensure that such documents are prepared as required.(a) Always [ ] (d) Rarely [ ](b) Most times [ ] (e) Very rarely [ ](c) Sometimes [ ]
89

20. Below is a list of the basic teaching and learning resources that are necessary in a school for its effectiveness. Please tick (»0 against the statement that best describes their availability in your school.
Resources Veryadequate
Adequate Undecided Inadequate Veryinadequate
1. Class Eight textbooks for; (i) Teachers(ii) Pupils
2. Class Eight exercise books for;(i) Teachers(ii) Pupils
3. Reference books for teachers4. Revision books for pupils5. Chalkboards6. Chalks7.Teaching aids e.g. charts and wall maps
21. Please make a general comment on the quality of the above resources in your school.(a) Very high quality [ ] (c) Low quality [ ](b) High quality [ ] (d) Very low quality [ ]
22. Please tick (V) against the statement that best describes the availability of the facilities given below in your school according to their adequacy.
Facilities Veryadequate
Adequate Inadequate Veryinadequate
/ ---------Noneat all
1. Classrooms2. Library3. Desks4. Chairs5. Tables6. H/teachers office7. Deputy h/teachers office8. Staff room9. Staff houses10. Playfield
90

23. At what time are the pupils required to arrive at school?(a) Before 7.00am [ ](b) Between 7.00-7.30 am [ ](c) Between 7.30-8.00 am [ ](d) After 8.00 am [ ]
24. In case a pupil arrives at school late, what action does the school take against him or her?
(a) Punished within the school(b) Sent back home to come to school the following day [ ].(c) Allowed to go to class unpunished [ ](d) Other-specify__________________
25. At what time are the teachers expected to arrive at school?(a) Before 7.00am [ ](b) Between 7.00-7.30 am [ ](c) Between 7.30-8.00 am [ ](e) After 8.00 am [ ]
26. At what time do teachers leave their work station?(a) At 5.00 pm [ ] (c) Any time they don’t have a lesson [ ](b) Any time they wish [ ] (d) Other-specify_________________
27. Do you think the distance between the teachers’ and pupils' homes and school has any effect on their performance in school.
i) Teachers Yes [ ] Noii) Pupils Yes [ ] No
If yes, to what extent does it affecti) Teachers performance
a) Very great effect [ ]b) Great effect [ ]c) Moderate effect [ ]d) Low effect [ ]e) Very low effect [ ]
ii) Pupils performancea) Very great effect [ ]b) Great effect [ ]c) Moderate effect [ ]d) Low effect [ ]e) Very low effect [ ]
91

28. Below is a list of factors that negatively affect pupils’ performance in National Examinations. Please tick (»0 against the statement that best describes the extent to which each factor affects pupils’ performance in your school.
Factors Extent to w lich it affects performanceVeryHigheffect
Higheffect
Minimaleffect
Veryminimal
effect
No effect at all
1 .Pupils' absenteeism2. Pupils’ lateness3. Poor management of homework4.Teachers’ absenteeism5.Pupils’ poor concentration in class6. Pupils’ failure to sit for internal tests and examination7. Interruption of pupils’ learning by activities such as sports days, punishments etc.
29. Does your school have a rewarding system for good performance by pupils and teachers?
i. Pupils (a) Yes [ ] (b) No [ ]ii. Teachers (a) Yes [ ] (b) No [ ]
30. If yes, who organizes for the rewards?(a) Head teacher (d) Parents/school committee [ ](b) Teachers [ ](c) Head teachers and teachers [ ]
(e) Parents, head teacher, teachers [ ]
31. Do you organize discussions between teachers, parents and pupils in relation to academic progress of the pupils and the school at large?(a) Always [ ] (d) Rarely [ ](b) Most times [ ] (e) Very rarely [ ](c) Sometimes [ ]
32. Do you encourage parents to assist in ensuring that their children complete homework?(a) Always [ ] (d) Rarely [ ](b) Most times [ ] (e) Very rarely [ ](c) Sometimes [ ]
33. Do you invite members of the community to advice and give general guidance to pupils?(a) Always [ ] (d) Rarely [ ](b) Most times [ ] (e) Very rarely(c) Sometimes [ ]
92

34. Please indicate the trend of your school’s performance in KCPE examination for the last four years (2000, 2001,2002, 2003).
Year Mean score Position in the zone Position in the division2000200120022003
35. In your view, what factors do you think could be attributed to pupils’ performance in KCPE Examination in your school?i.
ii.iii.iv.v.
36. What measures do you think could be undertaken by the following key participants in education to ensure good performance in KCPE Examination?
i. Parents_________________________________________________ii. Teachers________________________________________________iii. Pupils__________________________________________________iv. Local community_________________________________________v. Examiners (KNEC)____________________________________vi. Government (Ministry of Education)_________________________
N.B: Please comment on any other factor not mentioned above.
7
Thank you for your co-operation and participation.
93

APPENDIX IV
QUESTIONNAIRE FOR CLASS EIGHT TEACHERS
SECTION A
Please indicate the correct option by ticking (V) on one of the options given below each question. Be honest and truthful. Kindly respond to all the questions.
I. Indicate the zone into which your school belongs( a ) Tuliazone [ ] (c) Katutu zone [ ](b) Musengo zone [ ] (d) Kauwi zone [ ]
2. Please indicate your gender(a) Female [ ] (b) Male [ ]
3. For how many years have you been a teacher in this particular school?(a) Less than 1 year [ ] (c) 2-4 years [ ](b) 1-2 years [ ] (d) 5 and above [ ]
4. Are you accommodated at the school? (a) Yes [ ] (b) No [ ]
5. If the answer to No. 4 above is no, state the distance from your school to yourhouse/residence.(a) Less than 1km [ ](b) Between 1 - 2 km [ ](c) Between 2 and 4 km [ ](d) Between 4 and 5 km [ ](e) Over 5km
6. Please indicate the means by which you go to school.(a) By foot [ ](b) By bicycle [ ](c) By car [ ](d) Other specify____________________
y
7. What is your highest academic qualification?(a) KPE/CPE [ ] (e) DIPLOMA[ |(b) KJSE [ ] (f) DEGREE [ ](c) EACE/KCE/KCSE [ ] (g) Other - specify(d) EAACE/KACE [ ]
8. What is your highest professional qualification?(a) P3 [ ] (e) ATS [ ](b) P2 [ ] (f) Diploma [ 1(c) PI [ ] (g) Graduate [ ](d)Sl [ ] (h) Other - specify
94

SECTION B
For each of the question in this section, read the instruction and responses carefully and put a tick { / ) against the correct response using the appropriate column where necessary.
9. Please indicate the number of lessons you teach per week.(a) 30 lessons and below [ ] (c) 36-40 lessons [ ](b) 31-35 lessons [ ] (d) Over 40 lessons [ ]
10. How many different subjects are you teaching currently?(a) 2 subjects [ ] (d) 5 subjects [ ](b) 3 subjects [ ] (e) Above 5 subjects [ ](c) 4 subjects [ ]
11. Are teachers in this school punctual in reporting for work?(a) All of them [ ] (c) A few of them [ ](b) Most of them [ ] (d) None of them [ ]
12. Do teachers start and stop teaching a lesson at the official time as indicated in thetimetable?
(a) Always [ ] (d) Rarely [ ](b) Most times [ ] (e) Very rarely [ ](c) Sometimes [ ]
13. Do teachers attend to all lessons as required?(a) Always [ ] (d) Rarely [ ](b) Most times [ ] (e) Very rarely [ ](c) Sometimes [ ]
14. Incase a lesson is not attended to at the right time,(a) Always [ ] (d) Rarely [(b) Most times [ ] (e) Very rarely [(c) Sometimes [ ]
15. Do teachers in this school give assignment and homework regularly?(a) Always [ ] (d) Rarely [ ](b) Most times [ ] (e) Very rarely [ ](c) Sometimes [ ]
16. How many Standard Eight pupils complete assignments and homework on time?(a) All of them [ ] (c) A few of them [ ](b) Most of them [ ] (d) None of them [ ]
17. Do teachers mark the assignments and homework promptly?(a) All of them [ ] (c) A few of them [ ](b) Most of them [ ] (d) None of then) [ ]
is it compensated later? ]] /
95
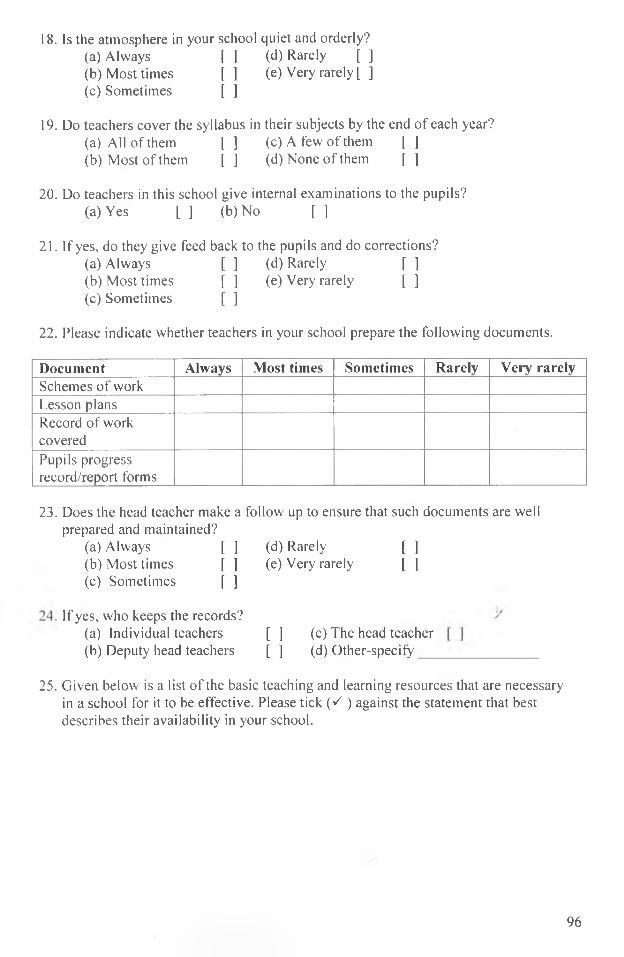
18. Is the atmosphere in your school quiet and orderly?(a) Always [ ] (d) Rarely [ ](b) Most times [ ] (e) Very rarely [ ](c) Sometimes [ ]
19. Do teachers cover the syllabus in their subjects by the end of each year?(a) All of them [ ] (c) A few of them [ ](b) Most of them [ ] (d) None of them [ ]
20. Do teachers in this school give internal examinations to the pupils?(a) Yes [ ] (b) No [ ]
21. If yes, do they give feed back to the pupils and do corrections?(a) Always [ ] (d) Rarely [ ](b) Most times [ ] (e) Very rarely [ ](c) Sometimes [ ]
22. Please indicate whether teachers in your school prepare the following documents.
Document Always Most times Sometimes Rarely Very rarelySchemes of workLesson plansRecord of work coveredPupils progress record/report forms
23. Does the head teacher make a follow up to ensure that such documents are well prepared and maintained?
(a) Always [ ] (d) Rarely [ ](b) Most times [ ] (e) Very rarely [ ](c) Sometimes [ ]
If yes, who keeps the records?(a) Individual teachers [ I (c) The head teacher(b) Deputy head teachers [ ] (d) Other-spec ify
25. Given below is a list of the basic teaching and learning resources that are necessary in a school for it to be effective. Please tick (V ) against the statement that best describes their availability in your school.
96

Resources Veryadequate
Adequate Undecided Inadequate Veryinadequate
1. Class Eight textbooks for;
(i) Teachers(ii) Pupils
2. Class Eight exercise books for;
(i) Teachers(ii) Pupils
3. Reference books for teachers4. Revision books for pupils5. Chalkboards6. Chalks7.Teaching aids e.g. charts and wall maps
26. How do you rate the quality of the teaching and learning resources used in your school?
(a) Very high quality [ ] (c) Low quality [ ](b) High quality [ ] (d) Very low quality [ ]
27. Please tick ) against the statement which best describes the availability of the facilities listed below in your school.
Facilities Veryadequate
Adequate Inadequate Veryinadequate
None at all
1. Classrooms2. Library3. Desks4. Chairs5. Tables6. H/teachers office7. Deputy h/teacher's office8. Staff room9. Staff houses10. Playfield
28. How do you rate the quality of the facilities given in No. 26 above in your school?(a) Very high [ ] (d) Low [ ](b) High [ ] (e) Very low [ ](c) Average [ ]
97

29. Below is a list of factors that may negatively affect pupils’ performance in NationalExaminations. Please tick (V) against the statement that best describes the extent towhich each factor may be affecting pupils' performance in your school.
Factors Extent to which it affects performanceVeryHigheffect
Higheffect
Minimaleffect
Veryminimal
effect
No effect at all
1.Pupils’ absenteeism2. Pupils' lateness3. Poor management of homework4.Teachers' absenteeism5.Pupils’ poor concentration in class6. Pupils’ failure to sit for internal tests and examinations.7. Interruption of pupils' learning by activities such as sports days, punishments etc.8. Absence of school feeding programme (supulo)
30. Does your school give prizes to the teachers and pupils for good performance?i) Teachers (a) Yes [ ] (b) No [ ]ii) Pupils (a) Yes [ ] (b) No [ ]
31. If YES, who organizes for the prizes?(a) Head teacher [ ](b) Teachers [ ](c) Head teacher and teachers [ ](d) Parents/school committee [ ](e) Parents, head teacher and teachers [ ]
32. Do you involve parents in discussions related to the academic progress of their children?
(a) Always [ ] (d) Rarely [ ](b) Most times [ ] (e) Very rarely [ ](c) Sometimes [ ]
33. Do you encourage pupils to seek for assistance from the parents in case of difficulties in doing their homework?
(a) Always [ ] (d) Rarely [ ](b) Most times [ ] (e) Very rarely [ ](c) Sometimes [ ]
34. Are the parents allowed to give suggestions on how the school performance could be improved?
98

(a) Always(b) Most times(c) Sometimes
[ ] (d) Rarely[ ] (e) Very rarely[ ]
[ ] [ ]
35. Please comment on the performance of your school in KCPE Examination for the last four years (2000, 2001, 2002, 2003)
Y ear Very good Good Average Poor Very poor2000200120022003
36. In your view, what factors do you think could be affecting pupils' performance in KCPE Examination in your school?
ii.iii.iv.v.vi.vii.viii.ix.x.xi.xii.
37. Please give suggestions on the actions that could be undertaken by the following participants in education to ensure good performance in KCPE Examination.
i. Parents ______________________________________________________________ii. Teachers_____________________________________________________________iii. Pupils_____________________________________________________ __________iv. Local community______________________________________________________v. Examiners (KNEC)____________________________________________________vi. Government (Ministry of Education)_______________________________________
NB: Please comment on any other issue not mentioned above.
T h an k you for your co-operation and participation .
99

APPENDIX V
Q U ESTIO N N A IR E FO R CLASS E IG H T PU PILS
SECTION A
Please indicate the correct option as honestly as possible by ticking [S ] on the correct option. Kindly respond to all the questions and in case you do not understand any question, ask for clarification.
1. In which zone is your school?A. Musengo zone [ ]B. Kauwi zone [ ]C. Tulia zone [ ]D. Katutu zone [ ]
2. Please indicate your gender (sex)A. Male [ ]B Female [ ]
3. What is your age?A. Below 13 years [ ] C. 15 - 17 years [ ]B. 13-15 years [ ] D. over 17 years [ ]
4. Please indicate the number of children in your familyA. Less than 3 [ ]B. 3-5 [ ]C. 6 - 10 [ ]D. More than 10 [ ]
5. Have your parents/guardians attended any formal schooling?1. Father Yes [ ] No [ ]2. Mother Yes [ ] No [ ]3. Guardian Yes [ ] No [ ] V
6. If the answer to number 5 is Yes, indicate the highest level attained.
P aren t/guard ian Schooling level attainedBelow class 8
Class 8 Below Form 4
Form 4 Above Form 4
FatherMotherGuardian
100

7. Please indicate your parent's/guardian's occupation
P arcn t/guard ian O ccupationSubsistence
farm erBusiness Civil
servantO ther (specify)
FatherMotherGuardian
SEC TIO N B
For each of the questions in this section read the responses carefully and put a tick [S ] against the correct response.
8. Do all subjects for Standard Eight currently have teachers?A. YES [ ] B. NO [ ]
9. If the answer to No. 8 is NO, please indicate the subjects that do not have teachers.A. English [ ]B. Kiswahili [ ]C. Maths [ ]D. Science [ ]E. GH/CRE [ ]
10. Below are some of the practices found in schools. Please indicate the statement which best describes the practices that take place in your school.
Practice Always M osttimes
Sometimes Rarely Veryrarely
1. Some lessons go untaught2. When teachers miss lessons they teach the lessons at their own time3. Some lessons begin later than expected /4. Some lessons end earlier than expected5. Teachers give home work and assignments regularly6. Teachers mark home work and assignments regularly7. Most teachers cover syllabus for their subjects in good time8. Teachers often;
i) Give tests to pupilsii) Marks the testsiii) Return papers to the pupilsiv) Do corrections with the pupils. ''
101

11. Below is a list of basic facilities necessary in a school. Please indicate by ticking, [✓ ] their availability in your school according to level of sufficiency.
Facility Verysufficient
Sufficient Insufficient Veryinsufficient
Class roomsDesksH/teachef s officeStaff roomPlay ground
12. The list below shows the learning resources necessary for effective learning. Please indicate the degree of their availability in your school by ticking [S],
Resource Verysufficient
Sufficient Insufficient Veryinsufficient
TextbooksRevision booksPensChartsWall mapsAtlases
13. How far is your home from school?A. less than 1 kmB. between 1 and 2 km [ ]C. between 2 and 4 km [ ]D. between 4 and 5 km [ ]E. Over 5 km
14. By what means do you go to school?A. By foot [ ]B. By carC. By bicycle [
15. At what time do you usually arrive at school?A. before 7.00am [ ]B. between 7.00 am and 7.30amC. between 7.30am and 8.00 amD. after 8.00 am
16. In case a class Eight pupil arrives at school late, what action is taken against him/her by the teachers?
A. Punished within the school [ ]B. Not punished [ ]C. Sent back home till the following day [ ]D. Other (specify)________________________^__________________
102

17. How do you get your lunch meal?A. I carry packed lunch [ ]B. My parents bring lunch for me [ ]C. The school provides lunch [ ]D. 1 go home for lunch [ ]E. Others, specify _______________________________________________
18. Are there cases of class Eight pupils who are at times absent from school?A. YES [ ] B. NO [ ]
19. If the answer to No. 18 is YES, below is a list of some of the reasons why a pupil may be absent from school and the action taken by teachers against such a pupil. Please tick [S] the statements, which best describe the action taken against each reason for being absent.
Reason for being absent
Sent home to come
with paren t
Asked to give reason
for being absent
Given light punishm ent
Helped to catch up
O ther(specify)
1. Sickness2. Taking care of the young one3. working for money4. To work infamilyshamba5. Sent to the market6. Lack ofschooluniform ^-----------
20. Do you complete homework in time?A. AlwaysB. Most times [ ]C. Sometimes [ ]D. at no time [ ]
21. Do you get time to study privately at home?A. Always [ ]B. Most times [ ]C. Sometimes [ ]D. at no time [ ]
103
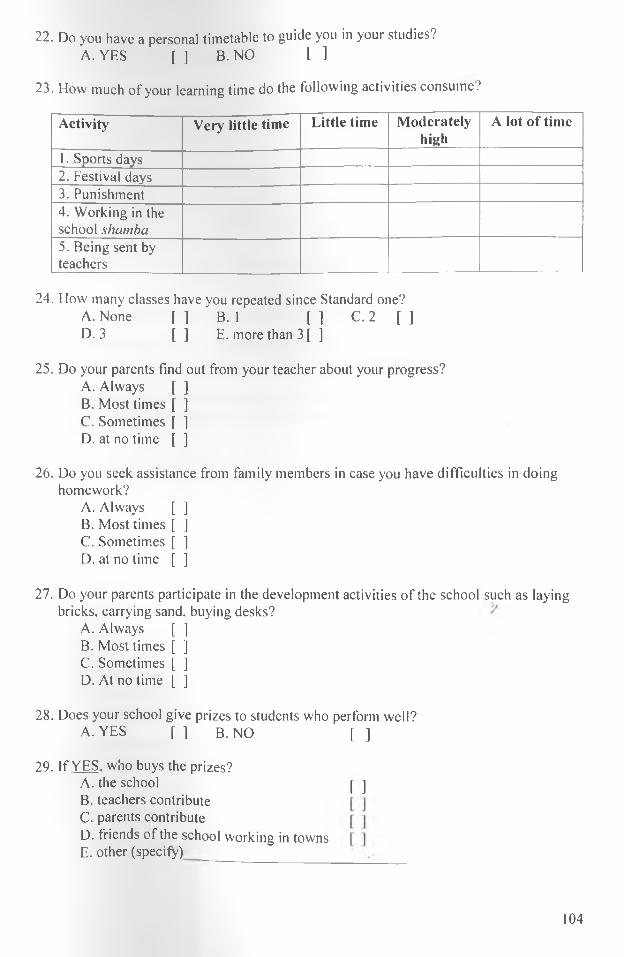
22. Do you have a personal timetable to guide you in your studies?A. YES [ ] B. NO [ ]
23. How much of your learning time do the following activities consume?
Activity Very little time Little time M oderatelyhigh
A lot o f tim e
1. Sports days2. Festival days3. Punishment4. Working in the school shambu5. Being sent by teachers
24. How many classes have you repeated since Standard one?A. None [ ] B. 1 [ ] C. 2 [ ]D. 3 [ ] E. more than 3 [ ]
25. Do your parents find out from your teacher about your progress?A. Always [ ]B. Most times [ ]C. Sometimes [ ]D. at no time [ ]
26. Do you seek assistance from family members in case you have difficulties in doing homework?
A. Always [ ]B. Most times [ ]C. Sometimes [ ]D. at no time [ ]
27. Do your parents participate in the development activities of the school such as laying bricks, carrying sand, buying desks?
A. Always [ ]B. Most times [ ]C. Sometimes [ ]D. At no time [ ]
28. Does your school give prizes to students who perform well?A. YES [ ] B.NO [ ]
29. If YES, who buys the prizes?A. the school [ ]B. teachers contributeC. parents contributeD. friends of the school working in townsE. other (specify)
104

30. Does your school invite people from the community to advise and guide pupils on academic matters?
A. Always [ ]B. Most times [ ]C. Sometimes [ ]D. at no time [ ]
31. How many marks out of 500 did you score at the end of term one examinations thisyear?
A. 200 and below [ ] B. 200 - 250 [ ] C. 251 -300 [ ]D. 301- 350 [ ] E. 351 -400 [ ] F. over 400 [ ]
32. Was this an improvement of what you got at the end of last year (2003) ?A. YES [ ] B. NO [ ]
33. How many marks out of 500 do you expect to score in your KCPE examination thisyear?
A. less than 200 [ ] B. 200 - 250 [ ] C. 251-300 [ ]D. 301-350 [ ] E. 351- 400 [ ] F. over 400 [ ]
34. Having been in school for many years you must have observed some factors that affect pupil's performance in KCPE examinations. Please list some of these factors below.1.____________________________________________________________________2 . ________________________________________________________________________3 . ___________________________________________________________________4 . __________________________________________________________________5 . __________________________________________________________________6. ______________________________________________________________________7 . ___________________________________________________________________________________
35. Please give suggestions on what actions could be undertaken by each of dje groups of people given below to improve pupil's performance in KCPE examinations.
i. Parents__________________________________________________ii. Pupils_____________________________________________ _____iii. Teachers__________________________________________ _______iv. Head teacher__________________________________________v. Examiners (KNEC)_______________________________________vi. Government(Ministry of Education)_______________________ _ _ _
NB: Comment on any other factor affecting pupil’s performance in KCPE Examinations but has not been mentioned above
T hank you for your cooperation and participation
105
Copyright © 2022 FDOKUMEN