Experimental evidence of factors influencing voluntary ...
143
Experimental evidence of factors influencing voluntary contributions to marine conservation By KATHERINE M. NELSON A thesis submitted in partial fulfilment of the requirements for the degree of Doctor of Philosophy In Economics Approved Dissertation Committee Prof. Dr. Achim Schlüter Head of Institutional and Behavioral Economics at Leibniz ZMT, Professor of Social Systems & Ecological Economics, Jacobs University Primary advisor and Chair of Dissertation Committee Prof. Dr. Colin Vance Deputy Head of Environment and Resources Department at Leibniz RWI, Professor of Quantitative Methods, Jacobs University Secondary advisor Prof. Dr. Andreas Löschel Chair of Energy and Resource Economics, University of Münster External Examiner Date of defense: March 15, 2018 Department of Business and Economics
-
Upload
khangminh22 -
Category
Documents
-
view
0 -
download
0
Transcript of Experimental evidence of factors influencing voluntary ...

Experimental evidence of factors influencing voluntary
contributions to marine conservation
By
KATHERINE M. NELSON
A thesis submitted in partial fulfilment
of the requirements for the degree of
Doctor of Philosophy
In Economics
Approved Dissertation Committee
Prof. Dr. Achim Schlüter
Head of Institutional and Behavioral Economics at
Leibniz ZMT, Professor of Social Systems & Ecological
Economics, Jacobs University
Primary advisor and Chair of Dissertation Committee
Prof. Dr. Colin Vance
Deputy Head of Environment and Resources Department
at Leibniz RWI, Professor of Quantitative Methods,
Jacobs University
Secondary advisor
Prof. Dr. Andreas Löschel
Chair of Energy and Resource Economics, University of
Münster
External Examiner
Date of defense: March 15, 2018
Department of Business and Economics

Copyright
Katherine M. Nelson, 2018
All rights reserved.

i
Statutory Declaration
Family name, Given name Nelson, Katherine
Matriculation number 20331347
Type of thesis PhD thesis
English: Declaration of Authorship
I hereby declare that the thesis submitted was created and written solely by myself without any
external support. Any sources, direct or indirect, are marked as such. I am aware of the fact that
the contents of the thesis in digital form may be revised with regard to usage of unauthorized aid
as well as whether the whole or parts of it may be identified as plagiarism. I do agree my work to
be entered into a database for it to be compared with existing sources, where it will remain in
order to enable further comparisons with future theses. This does not grant any rights of
reproduction and usage, however.
This document was neither presented to any other examination board nor has it been published.
German: Erklärung der Autorenschaft (Urheberschaft)
Ich erkläre hiermit, dass die vorliegende Arbeit ohne fremde Hilfe ausschließlich von mir erstellt
und geschrieben worden ist. Jedwede verwendeten Quellen, direkter oder indirekter Art, sind als
solche kenntlich gemacht worden. Mir ist die Tatsache bewusst, dass der Inhalt der Thesis in
digitaler Form geprüft werden kann im Hinblick darauf, ob es sich ganz oder in Teilen um ein
Plagiat handelt. Ich bin damit einverstanden, dass meine Arbeit in einer Datenbank eingegeben
werden kann, um mit bereits bestehenden Quellen verglichen zu werden und dort auch verbleibt,
um mit zukünftigen Arbeiten verglichen werden zu können. Dies berechtigt jedoch nicht zur
Verwendung oder Vervielfältigung.
Diese Arbeit wurde noch keiner anderen Prüfungsbehörde vorgelegt noch wurde sie bisher
veröffentlicht.
………………………………………………………………………………………………………
Date, Signature

ii
List of publications and conference contributions
Manuscript 1:
Publication in peer reviewed journal:
Nelson, K. M., Schlüter, A. and Vance, C. 2017, “Funding Conservation Locally: Insights
from Behavioral Experiments in Indonesia.” Conservation Letters. doi:10.1111/conl.12378
http://onlinelibrary.wiley.com/doi/10.1111/conl.12378/full
Working paper publication:
Nelson, K. M., Schlüter, A. and Vance, C. 2016, “Funding Conservation Locally: Insights
from Behavioral Experiments in Indonesia.” Ruhr Economic Papers 652. Bochum,
Germany. ISSN 1864-4872 (online), http://dx.doi.org/10.4419/86788758
http://www.rwi-essen.de/media/content/pages/publikationen/ruhr-economic-
papers/rep_16_652_neu.pdf
Conference contributions:
Experimental economics evidence for contributions to marine and costal collective goods.
Estuarine and Coastal Sciences Association (ECSA) Conference, September 5, 2016,
Bremen, Germany.
Donations of time and money for the environment. Experimental Economics for the
Environment Conference, February 3, 2017, Bremen, Germany.
Manuscript 2:
Publication in peer reviewed journal:
Nelson, K. M., Schlüter, A., and Vance C. 2017, “Distributional preferences and donation
behavior among marine resource users in Wakatobi, Indonesia.” Ocean & Coastal
Management. ISSN 0964-5691, https://doi.org/10.1016/j.ocecoaman.2017.09.003.
http://www.sciencedirect.com/science/article/pii/S0964569117300984
Working paper publication:
Nelson, K. M., Schlüter, A., and Vance C. 2017, “Distributional preferences and donation
behavior among marine resource users in Wakatobi, Indonesia.” Ruhr Economic Papers
690. Bochum, Germany. ISSN 1864-4872 (online), http://dx.doi.org/10.4419/8678880.
http://www.rwi-essen.de/media/content/pages/publikationen/ruhr-economic-
papers/rep_17_690.pdf

List of publications and conference contributions
iv
Conference contributions:
Distributional preferences and donation behavior. Leibniz Environment and Development
Symposium (LEADS), December 7, 2016, Berlin, Germany.
Distributional preferences and donation behavior. Annual Conference for the International
Association for the Study of the Commons (IASC), July 10-14, 2017, Utrecht, Netherlands.
Manuscript 3:
Submitted to peer reviewed journal:
Nelson, K. M., Partelow, S., Schlüter, A., IN REVIEW, “Extending the scope of voluntary
marine park user fees to terrestrial conservation across coupled land-sea ecosystem
boundaries.” Journal of Environmental Management. Submitted January, 2018.
Conference contributions:
Extending the scope of voluntary marine park user fees. Leibniz Environment and
Development Symposium (LEADS), January 29-30, 2018, Berlin, Germany.

Acknowledgements
v
Acknowledgements First and foremost, I would like to express my sincere gratitude to my thesis advisor, Prof. Dr.
Achim Schlüter, for his continuous support and guidance throughout my PhD. His door was
always open and he welcomed dialogue, debate, and interaction. His patience and trust in his
students allows for personal discovery and the ability to work independently. I would also like to
thank Prof. Dr. Colin Vance for his support, expertise, and feedback from the beginning of this
PhD journey. He was always available to help and provided insightful contributions and
encouragement. Many thanks to my external advisor, Prof. Dr. Andreas Löschel, for his time and
expertise in evaluating my thesis.
My sincere thanks also goes to Dr. Luky Adrianto, Dr. Eva Anggraini, Febrina Desrianti, and
Delphine Robbe who provided assistance and support throughout the research process. Without
their support it would not have been possible to conduct this research and I am deeply grateful
both professionally and personally. I am also grateful to the team of students that helped execute
the research in Wakatobi and Gili Trawangan. Their persistence, understanding, and sense of
humor made the research not only possible, but also immensely enjoyable.
I would also like to acknowledge the great team from Triple C: Contributions to Coral Commons.
Special thanks to Dr. Sebastian Ferse, Dr. Sonia Bejarano, Carlo Gallier, Dr. Jörg Langbein, and
Abdul Halik for the exchange of ideas, mutual encouragement, friendship and always
entertaining company. It has been a pleasure to work together and I hope we continue to
collaborate in the future.
The Institutional and Behavioral Economics research working group at ZMT has been my
research ‘home’ for the last three years and I am appreciative for the friendships and endlessly
interesting discussions and professional and emotional support we provide for each other. I am
thankful for the financial support from the Leibniz Association SAW-2014-ZMT-1 317 and the
Waitt Foundation Rapid Ocean Conservation (ROC) Grants that made this research possible. I
also respectfully acknowledge my privilege in these life accomplishments.
Last, but certainly not least, I owe the success in my life to my family Bob, Joan, and Jenny.
Your unwavering support and encouragement has helped me persevere throughout this challenge
and I honestly could not have done it without you. My parents provide the foundation to lift me
up and provide me with the courage to pursue my dreams. My sister, Jenny, is a constant
inspiration to seek more from life and be the change I wish to see in this world. And finally, I
cannot express enough gratitude for my friends around the world that make this life more fun and
a better world because they exist!

Abstract
vi
Abstract Conserving the Earth’s natural resources is of great importance to the future of all living things.
The science behind conservation is dominated by the natural sciences although it is clear that
human behavior is at the root of most environmental degradation problems as well as the
solutions. The behavioral social sciences offer relevant theory and valuable methodological tools
to understand human behavior. Yet, research on human behavior remains underrepresented in the
conservation sciences. Voluntary contributions are widely accepted mechanisms for promoting
conservation and for measuring individual economic behavior. This thesis aims to address several
aspects of human behavior and how they relate to contributions to marine conservation. This
thesis consists of an introduction followed by three self-contained chapters and a conclusion.
Proximate stressors such as destructive fishing are key drivers damaging coral reef public goods.
Conservation strategies that marshal local action and are tailored to the preferences of the target
group are thus needed to sustain coral resources. Research 1 uses data from field experiments
with a fishing community in Indonesia to test economic theory regarding preferences for giving
time and money to environmental and other charitable causes. Each person is subject to one of
four treatments: monetary donation, monetary donation match, volunteer time donation, and
volunteer time donation match. Contrasting with the existing literature, we find that participants
give significantly more when donating money compared to time. We also find that matching
donations increases the percent of people giving but does not increase the amount donated. This
research furthers our understanding of what motivates resource users in a developing country to
contribute to the provision of public goods.
Using data collected from the same study population, research 2 examines the effect of social and
psychographic characteristics on giving to public goods. Using an incentivized task to elicit
preferences for the distribution of wealth between oneself and an anonymous other, participants
are classified into categories based on preferences for benevolence, egalitarianism, own-money-
maximization, and malevolence. The data show that these intrinsic characteristics, such as
preferences for equality, are a significant predictor of donation behavior. Practical application of
these results would call for conservation marketing practices to develop targeted messages that
emphasize social norms, promote cooperative values, and consider the needs of resource-users in
the design of local conservation campaigns and goals.
Research 3 solicits voluntary user fees from tourists visiting a marine reserve in Indonesia.
Contributions support the local conservation organization to provide public good services such as
keeping the island clean, providing recycling services, and protecting the fragile coral ecosystem.
Real donations were solicited under four treatment conditions: control (write-in amount), default
opt-in, default opt-out, and reference levels. The results from study 3 show that the default opt-
out condition represents the highest rate of donations, but the total donations received under the
reference level treatment were comparable due to a higher average amount given.

vii
Table of Contents Statutory Declaration ...................................................................................................................................... i
List of publications and conference contributions ......................................................................................... ii
Acknowledgements ....................................................................................................................................... v
Abstract ........................................................................................................................................................ vi
Figures .......................................................................................................................................................... ix
Tables ............................................................................................................................................................ x
I. Introduction ............................................................................................................................................ 1
1.1 Background motivation .................................................................................................................... 2
1.2 Studying conservation behavior through a lens of marine conservation .......................................... 4
1.3 Methodology: Field Experiments ..................................................................................................... 7
1.4 Research focus .................................................................................................................................. 9
1.5 Study locations ............................................................................................................................... 15
II. Manuscripts .......................................................................................................................................... 23
Chapter 1: Giving time or money to fund public goods .............................................................................. 24
2.1 Introduction .................................................................................................................................... 24
2.2 Theory: Time is money? ................................................................................................................. 25
2.3 Matching ......................................................................................................................................... 26
2.4 Background..................................................................................................................................... 26
2.5 Methods .......................................................................................................................................... 27
2.6 Results ............................................................................................................................................ 30
2.7 Discussion ...................................................................................................................................... 34
Appendix ..................................................................................................................................................... 37
Chapter 2: Individual characteristics and donation behavior ...................................................................... 42
3.1 Introduction .................................................................................................................................... 42
3.2 Wakatobi National Marine Park ..................................................................................................... 44
3.3 Distributional Preferences and Contributive Behavior ................................................................... 45
3.4 Sample participants ........................................................................................................................ 49
3.5 Study design ................................................................................................................................... 50
3.6 Part One: Real effort task and Donation Decision .......................................................................... 51
3.7 Part Two: Distributional Preferences Elicitation Task ................................................................... 53
3.8 Results ............................................................................................................................................ 55
3.9 Discussion ...................................................................................................................................... 61

viii
3.10 Conclusion ..................................................................................................................................... 64
Chapter 3: Soliciting voluntary user fees .................................................................................................... 65
4.1 Introduction .................................................................................................................................... 65
4.2 Fundraising Literature Review ....................................................................................................... 70
4.3 Materials and methods .................................................................................................................... 72
4.4 Results ............................................................................................................................................ 76
4.5 Discussion and recommendations .................................................................................................. 84
III. Concluding remarks ........................................................................................................................... 88
5.1 Summary of research ...................................................................................................................... 89
5.2 Limitations and future research opportunities ................................................................................ 93
Appendices ................................................................................................................................................. 95
References ................................................................................................................................................ 118

ix
Figures Figure 1: Research objectives ........................................................................................................................ 9
Figure 2: Map of coral triangle region ........................................................................................................ 15
Figure 3: Map of Indonesia ......................................................................................................................... 16
Figure 4: Photos of Bajo Mola village ........................................................................................................ 18
Figure 5: Zonation map of Gili Matra marine reserve ................................................................................. 21
Figure 6: Photos of Gili Trawangan ............................................................................................................ 22
Figure 7: House in the Bajo Mola village. .................................................................................................. 27
Figure 8: Visual depiction of the difference between monetary and time donation treatments. ................. 28
Figure 9: Charity selection and donations by charity type. ......................................................................... 30
Figure 10: Bar graphs of treatment comparisons. ....................................................................................... 31
Figure 11: Total funds received by charities ............................................................................................... 34
Figure 12: Demographic distribution of district and regional population data ........................................... 39
Figure 13: Map of study site ........................................................................................................................ 45
Figure 14: Bajo Mola house. ....................................................................................................................... 50
Figure 15: Choices in the distributional preferences elicitation task ........................................................... 53
Figure 16: Characterization of distributional preference types ................................................................... 55
Figure 17: Percentage of distributional preferences by type and binary donation decision ........................ 55
Figure 18: Analysis of distributional preferences by gender ....................................................................... 57
Figure 19: Choice of charity by preference type ......................................................................................... 61
Figure 20: Maps .......................................................................................................................................... 73
Figure 21: Tourist perceptions .................................................................................................................... 78
Figure 22: Perceptions of environmental management and personal experience ........................................ 79
Figure 23: Percentage of sample that donated by treatment ........................................................................ 80
Figure 24: Mean amounts donated by treatment ......................................................................................... 81
Figure 25: Total donations received by Gili Eco Trust. .............................................................................. 82
Figure 26: Estimated cumulative revenue based on the ratio and magnitude of giving .............................. 86

x
Tables Table 1: Description of between-subject treatments ................................................................................... 27
Table 2: Summary Statistics by treatment ................................................................................................... 32
Table 3: Effect of clustering standard errors: .............................................................................................. 37
Table 4: Regression table ............................................................................................................................ 40
Table 5: Comparison of demographics across treatments ........................................................................... 41
Table 6: Comparison of mean giving across distributional preference types .............................................. 56
Table 7: Probit and Ordinary Least Squares Regression Table ................................................................... 59
Table 8: Field experiment treatment conditions and descriptions ............................................................... 70
Table 9: Hypotheses .................................................................................................................................... 72
Table 10: Descriptive statistics of sample population ................................................................................. 77
Table 11: Probit and Ordinary least squares regression model ................................................................... 83

Introduction
1
I. Introduction

Introduction
2
1 Introduction
1.1 Background motivation
Protecting the Earth’s resources is of vital interest for humankind, and, although most problems
involving environmental degradation can be attributed to human behavior, we know remarkably
little about the behavioral factors that influence nature conservation (Cowling 2014, Wright,
Verissimo, et al. 2015, Schultz 2011). Conservation science has long been dominated by
ecologists recording losses and identifying causes for environmental degradation, largely
ignoring human behavior as the root of the cause. There has been considerable success in
identifying the ecological processes that are affected by human behavior but the focus remains
mostly on scientific documentation of degradation instead of understanding the drivers linked to
human behavior and how change occurs. It is widely recognized within the conservation science
community that a paradigm shift toward understanding human behavior is needed to address the
underlying mechanisms driving ecological losses; however, research on human behavior remains
an underrepresented area of research in the conservation literature (Reddy et al. 2016, Veríssimo
2013, Cowling 2014, Andriamalala et al. 2013, Partelow, Schlüter, Wehrden, et al. 2017, Bennett
et al. 2017, Mascia et al. 2003, Nelson, Schlüter, and Vance 2017b).
The intersect between behavioral and environmental economics is a research area with great
potential to deliver insights into the environmental behavior of humans (Kesternich, Reif, and
Rübbelke 2017). This area of research combines psychological insights and economic principles
to adapt theory and guide environmental policy (Shogren, Parkhurst, and Banerjee 2010). It
deviates from the neoclassical economic model of humans characterized as fully rational and
purely self-interested and is replaced by models involving humans with limited rational
capabilities due to constraints in cognitive ability, time, willpower, and concern for others (Simon
1972, Mullainathan and Thaler 2000, Smith 1998, Shogren and Taylor 2008). Many, if not all, of
these constraints are commonly faced in environmental decision-making (Poff et al. 2003).
Furthermore, decision processes do not happen in a vacuum and are highly dependent on context.
Environmental conditions and the economic, socio-cultural, and political institutions influencing
them (and being influenced by them) differ considerably across contexts. Research also shows
that socio-psychological factors (i.e. values, beliefs, attitudes, preferences) play an important role
in the provision of public goods but it is not well understood how these factors translate to

Introduction
3
contributions to environmental public goods (Shang and Croson 2009). Given that context is an
important factor in environmental decision-making, field research is especially relevant to
provide a detailed view on human behavior in the natural environment (Henrich et al. 2001,
Kessler and Vesterlund 2015).
Biodiversity conservation has the potential to generate substantial global environmental,
economic, and social benefits but many efforts fall short due to lack of sufficient funding
(Pimentel et al. 1997). Non-government organizations (NGOs) are a driving force in the
conservation movement and often rely heavily on individual donations of money and time to fund
and implement conservation programs. Scientific exploration into altruistic behavior draws
heavily from research on charitable giving, but the links to environmental conservation are
ambiguous. Relatively few conservation NGOs focus efforts on understanding donor behavior
and preferences (Wright, Verissimo, et al. 2015, Veríssimo et al. 2018). This is an interesting area
of inquiry for behavioral environmental economics given that it is not well understood if altruistic
behavior extends to concern for nature and the environment (Perkins 2010). In the environmental
sector, there are very few published accounts of research on charitable market behavior as
fundraising has traditionally been considered more of an art than a science (Veríssimo et al. 2018,
Nelson, Schlüter, and Vance 2017b). Few environmental organizations are tapping into the
wealth of market research opportunities in this area and few are applying proven methods from
the charitable giving literature to influence donations or other pro-environmental
behavior. (Bénabou and Tirole 2006, Ariely, Bracha, and Meier 2009, Fischbacher, Gächter, and
Fehr 2001, Fehr and Fischbacher 2003, Andreoni and Miller 2002, Henrich et al. 2001, Nolan
and Schultz 2015).
A main purpose of the research conducted within this thesis is to contribute to conservation
science and behavioral environmental economics by linking and testing theory from the domain
of charitable giving to gain a better understanding of intrinsic and extrinsic factors that influence
contributions to environmental public goods. The ‘factors’ studied through this research include
those that come from within the individual (i.e. preferences and values) and those controlled by
external information (i.e. the value of donation manipulated through third-party matching; and
the design of the ask based on choices presented to the donor). This thesis is divided into several
chapters structured as follows: Chapter 2 focuses on testing economic theory which assumes that
people have no intrinsic preference between giving money or time to charity, and testing the

Introduction
4
effect of matching on donations; Chapter 3 examines the relationship between individual donor
characteristics and contribution behavior; Chapter 4 addresses strategic choice factors provided
with the donation request and their influence on donation decisions; and Chapter 5 presents the
summary, limitations, and implications for conservation practitioners.
1.2 Studying conservation behavior through a lens of marine conservation
I chose to focus the research on fishers and tourists due to their direct interaction and impact on
marine resources. The marine realm provides a fitting example to demonstrate the complexity of
environmental goods. Fishing is an extractable activity that often represents a social dilemma of
over appropriating the common resource due to the fact that the resource is rivalrous but non-
excludable. On the other hand, many marine tourism activities, such as snorkeling, diving,
swimming, and wildlife observation, are considered non-extractable and problems arise from
underinvestment in the public good which is non-rivalrous and non-excludable. Both scenarios
allow for free-riders who benefit from the resources without contributing to them.
These two user groups are interesting to study from a perspective of environmental conservation
given that their decisions directly affect the resource. Information about the behavior of marine
resource users can help guide local NGO conservation efforts. Although the purchasing power of
small-scale fishers to fund conservation may appear insignificant, understanding preferences to
give time or money to conservation has important implications for the design of conservation
intervention programs. Alternatively, tourist user fees represent huge potential to fund the
protection of natural resources. The research conducted herein addresses another important, yet
often overlooked, function in marine protected area (MPA) planning and funding which connects
environmental problems generated on land (i.e. pollution, erosion, land modification) to the
impacts on coastal and marine resources.
The marine realm represents resources of critical concern for conservation. Oceans cover 70
percent of the earth’s surface, and more than one-half of the world’s population lives within 60
kilometers of the coast (IUCN 2017). The oceans have been regarded as global commons whose
resources are highly rivalrous in consumption (often treated as if inexhaustible) and face
difficulties in exclusion. This results in a social dilemma for governance given that no central
international authority exists to be able to enforce regulations. In turn, this means that voluntary
action is crucial.

Introduction
5
Many species of marine life have become depleted or even threatened with extinction due to
proximate and distal anthropogenic stressors. Less than two percent of the world’s marine space
is located within protected areas (IUCN 2017). Nearshore marine zones are claimed by countries
as exclusive economic zones (EEZs) and therefore have legal jurisdiction for managing large
areas of continental shelf. This area is where the world’s most productive fisheries, most
biodiverse coral reefs, and most accessible underwater resources are located, as well as being the
areas of greatest interest for conservation even though protected areas currently cover less than
3% of EEZs (Spergel and Moye 2004, IUCN 2017). In many cases the management of these
zones consists of little more than large-scale foreign fishing rights that are often poorly regulated
(Spergel and Moye 2004). Substantial amounts of money are required to manage and protect
marine areas, and to implement and enforce regulations. Voluntary contributions to NGOs
constitute a sizeable portion of nature conservation funding. Although funding is a major factor,
money alone is not the solution. It is necessary to consider that many of these marine areas are
connected land-sea ecosystems and integrate cross-boundary management into planning and
funding.
Most marine conservation planning ignores the terrestrial coastal system although many of the
threats facing marine areas originate on land (i.e. solid waste pollution, erosion and habitat loss
from land conversion, or eutrophication from agricultural run-off), proceeding largely as if the
ecological systems were unconnected (Stoms et al. 2005). From the perspective of marine
protection, this lack of integration is especially problematic because the marine areas are often
more influenced by land than vice versa (Stoms et al. 2005, Alvarez-Romero et al. 2011).
Nearshore marine natural resources, such as coral reefs, cannot be de-coupled from terrestrial
coastal ecosystems. Considering that the land and sea are connected systems and interchange
materials, energy, and organisms, it is essential to incorporate and address terrestrial-originated
threats into marine conservation planning and funding to ensure successful protection of
resources.
Coral reefs are a perfect example of a global public good that suffer from under provisioning and
the fisheries harbored within these ecosystems represent common resources that often suffer from
over appropriation. Healthy coral reefs provide universal benefits. Coral ecosystems are hotspots
of marine biodiversity; they protect coastlines against storm surges; they provide habitat,
spawning, and nursery grounds for important and diverse fish species (which in turn provide a

Introduction
6
source of food for millions of people); they provide jobs and income to local economies from
fishing, recreation, and tourism; and they are a source for new medicines. The destruction of
coral reefs can be attributed to direct and indirect proximate causes (i.e. pollution, over fishing,
destructive fishing, and coastal development) and distal causes (i.e. climate change resulting in
rising sea temperatures and ocean acidification, increases in the global demand for fish). The
free-rider phenomenon is exacerbated in the case of coral reef ecosystems because free-riders are
not just limited to people within a local community, but extend to people that live far away and
may not even be familiar with coral reefs but who still benefit from their existence and contribute
to their destruction. Currently, coral reef ecosystems around the world are under grave threat
(Hughes et al. 2003, Hughes et al. 2014). The forecast for the next 20 years looks grim unless we
succeed at making major changes. In order for change to occur, both local populations and the
wider global population will need to invest in marine conservation.
According to marine science experts, marine protected areas (MPAs) are currently the best
management tool for conserving coral reefs and natural fish hatcheries (Hamilton, Potuku, and
Montambault 2011, Lubchenco et al. 2003, Hooker et al. 2011). Effectively managed protected
areas can generate significant gains in environmental conservation. However, protected areas face
many barriers to effectiveness including insufficient financial, logistical, and technical support;
heterogeneity of users’ needs; lack of scientific information; and insufficient institutional,
decision-making, and political support (Pomeroy et al. 2005).
Many researchers focus on issues of marine governance while financing conservation remains
less frequently studied (Mascia 2003, Alexander, Andrachuk, and Armitage 2016, Pittman and
Armitage 2016, Christie and White 2007, Glaser et al. 2012, de Morais, Schlüter, and Verweij
2015). MPAs are typically financed through individual fees, international grants, or government
support (or some combination of the above) (Lundquist and Granek 2005, Rife et al. 2013).
NGOs are often involved at some level to provide support. NGOs play a variety of roles in
different MPA contexts, from small local NGOs focused on community issues to big
international NGOs that lobby globally for more protected areas, but one thing that unites most
all NGOs is the reliance on voluntary action.

Introduction
7
The research presented in this thesis aims to advance theory and present practical applications by
addressing gaps in both the research on charitable giving and behavioral environmental
economics through the use of field experiments on voluntary contributions to NGOs.
1.3 Methodology: Field Experiments
Experimental investigation is an appropriate methodological tool when the research is driven by
questioning theoretical assumptions. Typically, a hypothesis is developed through deductive
reasoning based on existing theory and then a research strategy is designed to test the hypothesis.
Using experiments to test hypotheses is an important component in the scientific discovery
process. This process allows researchers to control for specific variables, measure concepts
quantitatively, generalize findings to some extent, and to confirm or reject theory. While lab
experiments have dominated in economics for the past several decades, field experiments have
gained momentum more recently. Economic lab experiments are conducted with university
students in highly controlled environments, and, while these have their place in testing theory,
transferability outside of the lab is not always a given (Roe and Just 2009, Benz and Meier 2008,
Levitt and List 2007). Field experiments in economics occupy a powerful middle ground between
lab experiments and naturally occurring data by allowing control for randomization in an
environment that captures real world characteristics (List 2008). If context matters in
environmental decision-making (as we think it does), then conducting research in the field is an
important determinant of the validity of the results.
In this thesis, field experiments are defined as experiments with non-standard subjects (i.e. not
students), performing familiar or realistic tasks set in a context that is applicable to participants
(Harrison and List 2004). The benefits of using field experiments in this research are to test
theory and also to shed light on the transferability of results from the lab to different field
contexts. Field experiments are often used to capture as much of the local context as possible and
to examine the effects of implementing new or different institutions (Carpenter, Harrison, and
List 2005, Vollan 2008, Harrison and List 2004). To maximize external validity while still
controlling for specific variables, the experiments herein were designed such that participants use
earned money when faced with economic consequences for actual goods and services (as
opposed to making decisions based on abstract situations using windfall endowments)

Introduction
8
(Carpenter, Harrison, and List 2005). The individual experimental designs used in each of the
research papers are explained in more detail in Section 1.4.
The benefits of studying donation behavior in an experimental field setting are that participants
make choices in real-life contexts and these decisions provide insight to practitioners. For
example, the giving behavior of university students in a highly controlled laboratory setting may
not reflect the same choices made by people in a real-world setting with different cultural
backgrounds constraints, needs, or motivations. In fact, previous studies have shown that the
sterility of the lab setting itself may affect behavior. List (2006) found that prosocial behavior in
laboratory settings disappeared when subjects were in a naturally occurring marketplace. Given
that my research focuses on the behavior of marine resource users, field experiments are ideal
even if some level of control found in the lab is traded-off for an increase in external validity.
Many field experiments on charitable giving focus on donors from Western, educated,
industrialized, rich, and democratic countries, and, although highly relevant for the non-profit
sector, these are not necessarily the ideal population for understanding the contribution behavior
of resource users in other types of countries, who also need to finance their public goods (Eckel
and Grossman 2008, Shang and Croson 2009, Meier 2007, Karlan and List 2007, List 2006).
The two stakeholder groups chosen as the focus of research for this thesis were selected because
the fishing and tourism industries are responsible for many of the local threats facing marine
resources. Small-scale fishers and young backpackers in Indonesia may not sound like the typical
donor target group for conservation organizations but they represent key target groups whose
behavior has direct consequences on the resource and can greatly influence the funding and
implementation of local conservation programs. We know very little about the incentives that
drive resource users’ behavior to voluntarily allocate their income and time to conservation.
Behavior in experimental interventions depends on the ecological field context, such as scarcity
and quality of the resource, as well as the societal context including cultural norms that depend
on knowledge, beliefs, and past experiences, hence the importance to conduct this type of study
in the field rather than in a lab setting. In addition, surveys and qualitative data collection
methods are useful tools for understanding and documenting the field context that may have an
effect on behavior, and also for explaining behavior when field observations differ from the lab
and/or theoretical assumptions.

Introduction
9
1.4 Research focus
The research in this thesis is divided across three research papers (see Figure 1). The first two
papers are based on a field experiment and survey with participants from a fishing community in
Wakatobi, Indonesia. The third paper is based on field experimental research soliciting
environmental contributions from tourists on the island of Gili Trawangan, Indonesia.
Figure 1 Research objectives, research questions, and methodologies guiding the three research papers
1.4.1 Research 1: Comparison of monetary and time donations with local resource users
The first objective of my research is to understand local resource users’ preferences for giving
time or money to public goods. Like most NGOs, those working towards the development of

Introduction
10
sustainable MPAs rely on donations of both money and time. Though both types are substantial,
most of the literature on donations addresses aspects of monetary donations. Although
volunteering is less frequently studied, it is a key segment contributing to the NGO industry, and
volunteers are often fundamental to the success of local programs. Volunteering is the act of
performing a service willingly and without pay. Volunteers are actively contributing time towards
the provisioning of a public good. Even if this service is being performed outside of an
individual’s regular working schedule so it does not lead to lost income per se, there are still
opportunity costs associated with trading-off one’s free time to do volunteer work. This type of
behavior may be crucial to the success of MPAs and other environmental goods, especially in the
cases of MPAs that rely on community monitoring efforts which often come at a high personal
cost. However, to my knowledge, there are no experimental studies examining donations of
volunteer time from resource users.
In research paper 1, I engage resource users from a local fishing community to work on a piece
rate task and I vary the conditions between the possibility to give earned income to charity or
work time to charity. Similar experiments have been conducted in a laboratory setting with
university students in the U.S.A and Australia. The design of my experiments sets this research
apart from existing studies in several distinct ways. First, I use a non-standard subject pool by
recruiting residents that are highly dependent on reef fishing for their livelihoods from a village
in Wakatobi, Indonesia. Second, the task I use is a realistic task that is taught by NGOs in
developing country contexts as a means of earnings for alternative livelihoods. Last, I introduce
new treatment conditions that match the value of volunteer time.
Theoretically speaking, when money and time are of equal value, there should be no difference in
the marginal willingness to give (Andreoni et al. 1996). However, using laboratory experiments,
researchers found that participants prefer to give time over money when all else is equal (Lilley
and Slonim 2014, Brown, Meer, and Williams 2013). They attribute the theory of ‘warm glow’
giving as the main driver of this effect. The theory of warm glow is based on the assumption that
people derive satisfaction from the act of giving (Andreoni 1990). Therefore, individual
donations are not completely crowded out when the needs of the public good are met by other
sources (i.e. taxes, grants). The previous studies found that when participants are provided the
opportunity to work so their wages accrue to charity, the value they give to charity is more than

Introduction
11
when they are paid their wages and can donate money to charity (Brown, Meer, and Williams
2013, Lilley and Slonim 2014).
Interestingly, when charitable contributions are subsidized, such as through matching grants,
more people give, but the average amount given tends to be lower (although giving is not
decreased at a 1:1 ratio) (Huck and Rasul 2011, Meier 2007, Eckel and Grossman 2003, 2008).
This generally means that the charity receives a greater amount overall by announcing the
matched funds (Davis and Millner 2005). It is not known if people volunteering time will respond
in the same way when the value of their labor is matched through a monetary donation to charity.
It is common practice among grant-awarding entities to require that funding is matched by the
institution receiving the grant. Announcing matches when soliciting monetary donations is a
widely utilized fundraising tactic in the non-profit sector. Donated labor (volunteer time) often
accounts for a significant portion of the in-kind match used to secure these grants. Much less
common, however, is the practice of disclosing these matches to the volunteer labor base to
validate the value of their volunteer time (worth double when matched) to encourage more total
volunteer hours. If indeed people respond the same to matches of time as they do to matches of
money, this could be a novel and successful method to increase total volunteer hours, but until
now, there is no research to approve or refute this assumption.
The literature on the relationship between volunteerism and monetary donations consists of
theoretical, empirical, and experimental approaches, but even with the various techniques there is
no consensus on whether volunteering is motivated by the same mechanisms as giving monetary
donations. And, to my knowledge, no one has examined the effects of matching on volunteer
labor. Research 1 is shaped on questions that will provide empirical insight to gaps in the
literature on: 1) comparing donations of money and time, and 2) the effects of matching on time
donations.
Following the experiments, participants completed an incentivized task used to elicit
distributional preferences1 and a survey on fishing behavior, market participation, environmental
perceptions, group membership, and demographic information. The analysis of these factors and
their relationship to donation behavior are presented in research paper 2.
1 The term ‘distributional preferences’ coined by experimental economists is used to describe different intrinsic characteristics
based on the decision-makers concern for the (material) welfare of others (Balafoutas, Kerschbamer, and Sutter 2012).

Introduction
12
1.4.2 Research 2: Individual characteristics and giving behavior
The objective of research 2 is to determine which social and psychological characteristics
influence marine resource users to give to public goods. Traditional conservation outreach efforts
have attempted to convince people to share the values of those conducting the outreach through
information and education about a given cause (Bjorkland and Pringle 2001), which, on their
own, have largely been ineffective at fostering sustainable behavior (McKenzie-Mohr and
Schultz 2014, Schmuck and Schultz 2012). In contrast, marketers put the target audience at the
center of the focus by trying to ensure what is being offered meets the needs and preferences of
that target audience (Wright, Verissimo, et al. 2015, Akchin 2001). Some conservation NGOs use
marketing tools to increase the amount of financial support they receive from the public
(Verissimo, MacMillan, and Smith 2011, Di Minin et al. 2013), but few organizations implement
these tools to understand behavior change among resource users (Wright, Verissimo, et al. 2015).
Tapping in to the values and norms of resource users may provide insight into what motivates
them to behave prosocially and this can be used to create successful conservation campaigns
(Butler, Green, and Galvin 2013).
One such determinant that could account for giving to public goods is based on understanding if
personal values and personality characteristics are good predictors of prosocial behavior. Social
scientists tend to see internalized values and norms as an important influence on human behavior
and these are often reflective of the social values and norms of society, thereby, determining the
choices individuals make. Social norms are standards of behavior that are based on widely shared
beliefs how individual group members should behave in a given situation (Fehr and Fischbacher
2004). The group members might obey the norm voluntarily if their individual morals are in line
with the normatively required behavior. Staub (1974) found that a prosocial orientation index
(combining measures of feelings of personal responsibility, social responsibility, moral
reasoning, and prosocial values), was a good predictor of helping behavior. More recently,
measures aimed at understanding how individuals prefer to distribute wealth between themselves
and another individual have been used to predict prosocial behavior (Kamas and Preston 2008). I
use the ‘distributional preferences’ measurement method developed by Kerschbamer (2015) to
categorize participants based on their responses into four distinct types: benevolents, egalitarians,
own-money maximizers, and malevolents. Then I analyze donation behavior dependent upon the

Introduction
13
distributional preference type to determine if these psychological characteristics are good
predictors of pro-environmental behavior (measured through contributions to charity).
Several studies have found that personal preferences for how wealth is distributed between
individuals shapes behavior on a range of issues related to: competition in the labor market
(Balafoutas, Kerschbamer, and Sutter 2012), political party affiliation (Dawes, Loewen, and
Fowler 2011), collective behavior (Fehr and Fischbacher 2004) and productivity (Carpenter and
Seki 2011). Yet few studies focus on how the distributional preferences of resource users relates
to contributions to public goods (Nelson, Schlüter, and Vance 2017a, Kamas and Preston 2008).
It is also not well understood whether concern for the welfare of others extends to the
environment or to benefits that are dispersed among many individuals such as the case with open-
access resources. With this research, I will examine the relationship between distributional
preference types and charitable giving behavior among marine resource users from a fishing
village in Wakatobi, Indonesia.
1.4.3 Research 3: Financing land-sea conservation through voluntary tourist eco-fees
In research paper 3, tourists on the island of Gili Trawangan, Indonesia are asked for voluntary
contributions to support the local conservation NGO. I use an experimental design incorporating
varied choice factors into the donation request to solicit real donations for conservation. Many
studies soliciting willingness to pay use hypothetical scenarios which often result in
overestimations (Ajzen, Brown, and Carvajal 2004). This study is ideally suited for soliciting real
payments because the services are already being provided by the NGO and there is an existing
voluntary payment collected from scuba divers. The objective is two-fold: 1) to understand the
effectiveness of different choice factors in soliciting donations to expand the voluntary user fees
beyond scuba divers; and 2) to understand donor interests of incorporating terrestrial issues into
conservation planning across land-sea ecosystem boundaries.
Many factors constrain the success of marine conservation initiatives. A plethora of scientific
literature exists that describes constraints related to inadequate governance (Marian 2012, Young
et al. 2007, Garcia, Rice, and Charles 2014), conflicts between stakeholders (Pomeroy et al. 2005,
Chollett et al. 2017, Flannery and Ellis), and limited enforcement capacity (Beddington, Agnew,
and Clark 2007, Walmsley and White 2003). Yet the subject of finance is an overarching

Introduction
14
challenge to marine conservation worldwide that has not been adequately addressed in the
literature or in practice (Bos, Pressey, and Stoeckl 2015).
User fees2 paid by tourists who benefit from marine and coastal public good resources (i.e. clean
public beaches and public spaces, clean sea water, healthy marine ecosystem) constitute a
significant potential revenue source to finance conservation. Some popular dive destinations have
government imposed marine park user fees for divers (Thur 2010). Yet there are many
circumstances in which a government imposed fee may not be ideal or possible to implement, or
in which a non-government entity maintains public goods in the absence of government. In these
cases, a system of methodically requesting voluntary user fees can be an effective approach to
generate considerable revenue for conservation. In fact, one study by Arin and Kramer (2002)
found that most tourists preferred NGOs as the most trustworthy organization type to collect and
manage marine park entrance fees. In many cases, user fees collected by an NGO could not be a
mandatory fee (unless government approved) as they do not have the authority to impose a ‘tax’3
on public goods and services, and instead these would necessarily be voluntary payment
collections. Although several studies focus on the willingness to pay user fees, there is a gap in
the literature on the most effective methods to request voluntary donations. The method of
requesting a voluntary donation can have a significant effect on both the amount of people that
choose to donate and the amount given. Getting this right is crucial to the sustainability of a
program dependent on voluntary user fees.
Research 3 focuses on the potential for multiple-use marine areas to be financed by tourists’
voluntary user fees. I focus on both the willingness to pay for user fees and the most effective
methods for collecting this voluntary payment. Additionally, unlike the majority of studies that
focus only on divers’ willingness to pay, I expand the scope of user fees to all tourists regardless
of the use type to explore the potential for financing conservation across users and land-sea
boundaries.
I chose Gili Trawangan (see section 1.5.2 for more information) as the location for research 3
because of the current coastal problems faced here by the unsustainable growth in tourism and the
2 A ‘fee’ is defined as a sum paid or charged for a service (Merriam-Webster 2017a). ‘Voluntary’ is defined as proceeding from
the will or from one’s own choice or consent; acting or done of one’s own free will without legal obligation (Merriam-Webster
2017b). Therefore, what is meant by the term ‘voluntary fee’ is a sum paid for a service from one’s own choice. 3 ‘Tax’ is defined as a compulsory contribution to state revenue, levied by the government on workers' income and business
profits, or added to the cost of some goods, services, and transactions (Oxford 2017).

Introduction
15
existing, but limited, structure of voluntary contributions for conservation. This makes an ideal
location for research 3 to focus on methods of privately funding marine protected areas through
soliciting contributions for conservation across different types of resource users.
1.5 Study locations
The Coral Triangle is an archipelagic region of approximately 5.7 million km2 with 153,000 km
of coastline, which includes the seas of Indonesia (central and eastern), Malaysia (Sabah), the
Philippines, Timor Leste, Papua New Guinea and the Solomon Islands (see Figure 2) (Veron et
al. 2009). The Coral Triangle is recognized as the epicenter of marine biodiversity and a global
priority for conservation (Veron et al. 2009, Hoeksema 2007). This area contains the highest
coral diversity on the planet, where 76% of the world’s 798 coral species can be found
(Hoeksema 2007). Given the chronic nature of local anthropogenic disturbances compounded by
the effects of climate change, the Coral Triangle also has the highest proportion of ‘vulnerable’
and ‘near threatened’ coral species (Carpenter et al. 2008). The Coral Triangle region has a
combined population of over 370 million people with around 120 million who benefit from
marine ecosystem goods and services for fishery production, shoreline protection, and tourism
(Foale et al. 2013). High levels of threat combined with high economic dependence on coral reefs
and associated ecosystems mean that significant numbers of people in the Coral Triangle region
are ecologically, socially, and economically vulnerable to degradation of the marine environment.
Figure 2 Map of coral triangle region with number of coral species highlighted. Source: Veron et al. (2009) and Coral
Triangle Atlas.

Introduction
16
This study will focus on two locations in Indonesia, a nation of 17,000 islands that covers a
significant portion of the Coral Triangle region and represents the greatest diversity of coral
species within the region (see Figure 2) (Veron et al. 2009). Additionally, more people live close
to reefs and depend on marine resources in Indonesia than anywhere else on the planet (Gurney et
al. 2014). The two locations: (1) Wakatobi National Park, and (2) Gili Trawangan (see Figure 3
below) were chosen based on their high marine biodiversity, and fragile, but mostly healthy, coral
reef ecosystems that are at immediate threat from numerous human activities including rapid
development, overfishing, destructive fishing, and pollution. There are also distinct social
economic differences between Wakatobi and Gili Trawangan that make for ideal research
locations.
Figure 3: (a) Map of Indonesia with Wakatobi island chain circled in red and Gili Islands circled in blue; (b) Wakatobi
island chain - Wangi, Kaledupa, Tomia, and Binongko islands. Bajo Mola Village highlighted in red; (c) Gili Islands –
from left Gili Trawangan, Gili Meno, and Gili Air. Source: Google (2017).
(a)
(b) (c)
Wakatobi
Gili Trawangan
Wakatobi Gili Trawangan

Introduction
17
1.5.1 Wakatobi, South East Sulawesi, Indonesia
The Wakatobi National Park (WNP) encompassing 13,900 km2 is located in the province of
Southeast Sulawesi and was classified as a national park in 1996 (Clifton 2013). It is Indonesia’s
third largest marine national park and is an IUCN Category II multiple-use protected area (Green
et al. 2011). Hard coral cover is estimated to be around 35–40% (Clifton 2013) and in 2012, the
park was designated a World Biosphere Reserve recognizing the unparalleled biodiversity found
here and the importance of conservation. The name ‘Wakatobi’ is an acronym based on the four
main islands that make up the region: Wangi Wangi, Kaledupa, Tomia, and Binongko. All
together the four islands are home to around 100,000 people which makes it the most populated
marine national park in Indonesia (Clifton and Majors 2012). Two distinct ethnic groups
comprise the population of the park. The majority of park residents (92%) are of Butonese origin.
The minority Bajo (sometimes spelled Bajau or Badjo) ethnic group number approximately 7000
in six settlements across the islands (Clifton 2013). Nearly all people on these islands depend on
marine resources at some level, but the Bajo are almost exclusively dependent upon the marine
environment for food, income, fuel and building materials. They generally live in the intertidal
zone in houses constructed upon stilts or a foundation of mined coral (see Figure 4a) (Von
Heland and Clifton 2015, Clifton 2013). Southeast Sulawesi is ranked towards the bottom of
most national socio-economic indicators, with a GDP per capita less than half that of the national
average and a workforce predominantly dependent upon agriculture and fishing (Clifton 2013).

Introduction
18
Figure 4: (a) Bajo Mola village showing houses built over the water on stilts; (b) Photo showing fish traps; (c) Spear fisherman in
Wakatobi; (d) Local Bajo villager drying fish from home; (e) Canal through Bajo Mola Village with homes built on reclaimed land from
mined coral; (f) Assortment of small reef fish and juvenile fish sold in the local market. Photo credits: Katie Nelson (2015).
The original zonation plan for WNP neglected the importance of local knowledge and community
participation in designing and defining the national park. The entire 13,900km2 was originally
declared as a no-take zone which resulted in conflict with the local Bajo population that
exclusively depends on fishing. The region is difficult to patrol due to the sheer size of the
national park and fishermen largely ignored the zonation and continued to fish even after the park
was declared a no-take zone (Clifton 2013). Although blast fishing and cyanide poisoning are
forbidden everywhere in the park, there were frequent occurrences in the past that have since
decreased in frequency but still remain a major concern within the park (von Heland, Clifton, and
Olsson 2014).
(a) (b)
(c) (d)
(e) (f)

Introduction
19
To address overfishing and destructive fishing practices in Wakatobi, international NGOs worked
with the Wakatobi National Park Authority and a broad range of stakeholders to implement a
revised management plan. International NGOs, namely the World Wildlife Fund (WWF) and The
Nature Conservancy (TNC), contributed substantial funding and logistical support to this process.
In 2008 the zonation was revised with input from the local community in defining no-take zones,
areas open to fishing only by local residents and licensed fishermen, and dive sites and fish
spawning aggregation sites where fishing is not allowed (Clifton 2013). NGOs have continuously
carried out activities with local communities to increase environmental awareness with the
intention to encourage behavior change through education and participation (Butler, Green, and
Galvin 2013). In 2014, based on the recognition that the management system is ‘mature’, TNC
ended its partnership with Wakatobi National Park and the WWF scaled back. This led to a
significant drop in financing and a changing management structure. At the time, Wakatobi was
considered to be a model MPA for Indonesia. Since the decrease in funding, there has been a
considerable decline in monitoring and enforcing regulations. This raises questions about the
long-term financial sustainability and viability of the national park and its resources (Middelveld,
van der Duim, and Lie 2016).
Interestingly, a private model of conservation also exists within the WNP between the Wakatobi
Dive Resort and the surrounding fishing villages. A 20 km section of reef near the resort is
designated as a no-take zone and direct payments are provided to 17 fishing villages to honor this
agreement. These combinations of approaches to marine conservation management make
Wakatobi an interesting location to study voluntary behavior to finance public goods.
This location site was chosen as an area for research due to its high biodiversity, international
recognition for conservation, large common fishing grounds, minority ethnic group dependent on
fishing, rapidly growing tourism industry, and multiple approaches to conservation management.
Overcoming the commons challenge requires individuals to bear personal costs in order to benefit
the collective group. As the local economy transitions from an economy that is heavily dependent
on fishing to an economy dependent on dive tourism, much of the conservation effectiveness will
depend on the behavior of the local community. Therefore, we chose to focus research 1 and
research 2 on the local Bajo fishing community in WNP.

Introduction
20
1.5.2 Gili Trawangan, Lombok, Indonesia
The Gili Islands consist of three islands off the northwest coast of Lombok: Gili Air, Gili Meno
and Gili Trawangan (see Figure 3c). Gili Trawangan, the most westerly and the largest of the
three islands at 6km2, was uninhabited until the mid-1970’s (Bottema and Bush 2012). Situated
between Bali and Lombok in the ‘Indonesian Through flow’ where the Pacific flows into the
Indian Ocean, the islands are fringed by shallow coral reefs supporting high fish and coral species
biodiversity. Early sources of income on the island were from coconut plantations and fishing
until dive tourism began to develop in the late 1980’s-early 1990’s with three established dive
operators. The tourism industry has proliferated through the 2000’s with currently over 30 dive
shops and 750 hotels and other businesses. Today, Gili Trawangan is one of the most popular
destinations in South East Asia for travelers to become scuba certified. Approximately 1 million
tourists visit Gili Trawangan per year with between 1200-3000 per day visiting these islands
(Halim 2017). The surrounding corals are threatened by destructive fishing practices and other
human activities from the rapid growth in tourism including waste pollution, anchoring from
boats, overcrowding of dive and snorkel sites, erosion from land clearing, and bleaching from
global warming.
The percentage of live coral surrounding the islands is between 5-20% which prompted the
central government to declare the marine area around the islands a conservation area in 1998
(Satria, Matsuda, and Sano 2006). This was re-appointed as the Gili Matra marine reserve in
2009 dedicating 29.54km2 of protected area (see Figure 5) (Kurniawan et al. 2016). There were
conflicts regarding the management of the area between the local government and the Agency for
Natural Resources Conservation which largely resulted in a lack of coordination and thus no
enforced regulation and continued destructive fishing (Kurniawan et al. 2016). There was strong
motivation from the head of the island and business owners to prevent destructive fishing
practices given the economic dependence on coral reef tourism. Therefore, much of the marine
protection has been driven by community efforts and private funding through voluntary diver
contributions (Halim 2017).

Introduction
21
Figure 5 Zonation map of Gili Matra marine reserve. Source: Conservation (2017).
This provides a unique perspective of locally organized and funded marine conservation efforts.
There has never been a government imposed marine park fee but the dive shops have organized
and agreed upon collecting a one-time contribution from each diver of 50.000 Indonesian Rupiah
(IDR) (approximately $3.75USD). Tourism has grown considerably over the last ten years. There
has been a shift from a majority of dive tourists to a majority of beach and party seekers with
everything from luxury beach villa holiday-makers to partying backpackers on the South East
Asia circuit. This growth has brought many economic advantages to the island but it has also led
to devastating effects on the terrestrial and marine ecosystem from the increased pressure
exploiting the minimal natural resources. Considerable efforts are being made by local businesses
and the local environmental NGO but funding remains an issue. The installation of biorock reefs
represent conservation efforts to protect corals that are becoming more degraded from
overcrowded dive sites and illegal anchoring (see Figure 6d). Plastic waste and pollution are a
huge problem on the island with an estimated 8-10 tons of garbage produced daily (Halim 2017).
This causes a build-up of waste on the island resulting in unsightly beaches, roads, and
surrounding waters (Figure 6f). The overall number of visitors to the island has increased
considerably but the conservation funding has remained in the realm of diver contributions. In

Introduction
22
order to tackle the mounting environmental problems, funding for conservation will need to
considerably increase.
This location was selected for research due to the existing NGO that provides many public goods
services, a voluntary payment structure already in place for divers, the mounting environmental
issues spread between the land-sea ecosystems, and the escalating tourism industry. Research 3
focuses on tourist perceptions of environmental threats to the island and their willingness to pay
for conservation.
Figure 6: (a) Aerial view of Gili Trawangan. Photo credit: The Jetlagged (2017); (b) Photo of one of the islands many
turtles which attract marine tourism. Photo credit: The Jetlagged (2017); (c) Hard and soft coral reef teeming with
biodiverse fish life. Photo credit: The Jetlagged (2017); (d) Biorock structure with pieces of live coral connected to form
new reef substrate. Photo credit: Gili Eco Trust (2017); (e) Waste separation and recycling bins. Photo credit: Gili Eco
Trust (2017); (f) The rubbish dump far overcapacity and the ponies and workers that collect the rubbish. Photo credit:
Gili Eco Trust (2017).
(a) (b)
(c) (d)
(e) (f)

23
II. Manuscripts

24
Chapter 1
2 Giving time or money to fund public goods
Funding conservation locally: Insights from behavioral experiments in
Indonesia
Nelson, K. M., Schlüter, A., and Vance, C.
* Published June 29, 2017. Conservation Letters. doi:10.1111/conl.12378
2.1 Introduction
Fishing and pollution are the key proximate stressors that threaten coral reefs ecosystems. In
Indonesia, 95 percent of reefs are threatened, of which 50 percent are in the high or very high
threat category (Burke et al. 2011). Conservation science often applies ecological methods to
document losses and identify causes for such decline (Verissimo, MacMillan, and Smith 2011). A
paradigm shift is needed that addresses the problem from the perspective of local human drivers
so that context appropriate strategies can be implemented (Smith et al. 2009). It is widely
accepted that behavioral economic experiments are useful in understanding human behavior, yet
conservation science has all but ignored this potential (Cowling 2014, Reddy et al. 2016).
The provision of local environmental public goods is essential for socio-economic development,
yet there is limited experimental evidence testing various measures that influence contributions to
these goods in developing countries – where coral reefs are prevalent (Carlsson, Johansson-
Stenman, and Nam 2014, Rode, Gómez-Baggethun, and Krause 2015). And, to our knowledge,
there are no field experiments that compare voluntary contributions of money and time.
Indonesian’s depend heavily on the health of coral ecosystems for the multitude of local
resources provided: they sustain a complex food system, protect people from storm surges, and
support economic growth. Yet the country’s decentralized government and limited public funding
for conservation makes local community initiatives all the more important. Participation in local
conservation activities, such as when an individual donates money, volunteers, or otherwise
expends effort for the purpose of conservation, is of particular research interest.
This paper contributes to the gap in research between the charitable giving literature and
contributions to public goods in developing countries by employing a behavioral economics field

Chapter 1 Giving time or money to fund public goods
25
experiment in a coastal village in Indonesia. We focus on two types of contributions: 1) donating
money, and 2) donating time. In addition, we examine the effects of matching donations of
money and time at a rate of 1:1 (i.e. the value of contributions is doubled). Participants, who are
heavily dependent on marine resources and whose behavior directly influences the health of the
ecosystem, begin by selecting a charity and then performing a task to earn income subject to one
of the four treatments: monetary donation (D), monetary donation match (Dm), volunteer time
donation (V), and volunteer time donation match (Vm).
Contrary to existing lab studies, which have identified higher donations of time than money
(Brown, Meer, and Williams 2013, Lilley and Slonim 2014), we find that members of an
Indonesian fishing community give significantly more when donating money compared to time.
We also find that matching increases the percent of people who give but has a crowding-out
effect on the percent of earnings donated under the monetary treatment. Taken together, these
results highlight the importance of factoring human behavior – and specifically the role of
incentive schemes in influencing preferences for giving – into the design of conservation
strategies (Reddy et al. 2016, Veríssimo 2013) .
2.2 Theory: Time is money?
This research addresses the conventional economic theory that whenever the value of cash
donations equals the value of time donations, people are indifferent between giving monetary
contributions or the value of volunteer labor to the charity (Andreoni et al. 1996). The validity of
this assumption has largely escaped empirical scrutiny, with the majority of studies focusing on
monetary contributions. To our knowledge, only two behavioral studies4 compare monetary and
time donations. Conducted with university students in developed countries, both studies identify
stronger preferences for time donations. Using a lab experiment, Brown, Meer, and Williams
(2013) find that students give substantially more time – voluntarily performing tasks while the
earnings accrue to the charity – rather than donating income they earned. Similarly, in the lab
experiment by Lilley and Slonim (2014), subjects simultaneously choose how much time and
money they want to donate to charity under different wage rates, tax rates, and endowments.
Their results show that students give more time than money, suggesting greater “warm glow”
4 Rai et al. (2015) use choice experiments and Eom and Larson (2006) use contingent valuation methods to identify differences in local demand
for environmental services. Their results show a stronger preference for offering time for local environmental services rather than making a
monetary payment.

Chapter 1 Giving time or money to fund public goods
26
benefits from donating time. We model our experimental design loosely on that of Brown, Meer,
and Williams (2013) and test the hypothesis that the marine resource users in this fishing village
are indifferent between donating time and money.
2.3 Matching
In principle, matching effectively lowers the “price” of a charitable donation. Following standard
economic demand theory, if the price of something falls, consumers should consume more.
Nevertheless, the literature on donation matching is inconclusive. Some studies show increased
propensity to donate and increased donation amounts with matching (Karlan and List 2007,
Karlan, List, and Shafir 2011, Meier 2007, Okunade and Berl 1997), while other studies report
decreased individual giving (Eckel and Grossman 2008, Huck and Rasul 2011).
Even with inconclusive evidence, the ubiquitous prevalence of matching incentives among
philanthropic industry practitioners begs the question of whether this technique works in a
developing country context to increase either money or time donations. We consequently test the
null hypothesis that matching has no impact on the individual gift amounts or on the percentage
who donate.
2.4 Background
302 individuals were recruited5 from Bajo Mola village, a settlement of stilted houses constructed
upon mined coral in the reef flat zone (Sather 1997) and located on Wangi-Wangi Island in South
East Sulawesi, Indonesia (see Figure 7). Being a fishing community that is almost exclusively
dependent upon the marine environment for income, food, fuel and building materials, the Bajo
are significant stakeholders in marine resource management6. They are simultaneously often held
responsible for destruction to the reef ecosystem due to bomb fishing and coral harvesting (Caras
and Pasternak 2009). There are various NGOs and community organizations within and outside
the village that provide public goods, such as community clean-ups, or environmental education.
5 One-third of all houses participated. 6 For in-depth ethnographies of the Bajo sea nomads, see Chou (2005), Sather (1997), and Clifton and Majors (2012).

Chapter 1 Giving time or money to fund public goods
27
Figure 7 House in the Bajo Mola village in Wangi Wangi, Wakatobi, South East Sulawesi. The homes are built on coral
mined from the local reefs by the villagers. Photo credit: Katie Nelson (2015).
Ninety-nine percent of participants in our sample identify as Muslim. The concept Sadaka
(Sadaqah), meaning voluntary charity, is important in Islam and is widely practiced. Self-reported
figures indicate that 93% of the study participants voluntarily gave money to charity and 76%
volunteered time in the last year.
2.5 Methods
Invitation letters with randomly assigned dates and times of sessions were distributed to all
houses in the village. Participants were grouped together for the briefing instructions and then
continued with the task individually7. In all treatments (see Table 1) respondents chose one
charity from a list of six. Then each person performed the same piece rate task for one hour and
made a donation decision. Finally, they completed a survey questionnaire.
Table 1 Description of between-subject treatments
(D) Donate Participants can donate money at the end of the experiment after payment for work.
(DM) Donate Match Participants can donate money at the end of the experiment after payment for work and
donation will be matched 1:1.
(V) Volunteer Participants choose to switch between working for themselves and volunteering.
(VM) Volunteer Match Participants choose to switch between working for themselves and volunteering. The
value of beads produced for charity is matched 1:1 by monetary donations.
7 See Appendix for a detailed description of the experimental set-up and location, the invitation letters, and experimental instructions.

Chapter 1 Giving time or money to fund public goods
28
2.5.1 Charities
Participants received a list of six charities with descriptions of their missions in randomized order
(see Appendix D). They were instructed to confidentially select one charity to which they can
contribute8. Two of the six charities target marine conservation while the remaining four do not
have an explicit environmental focus. We followed the standard protocol of other charitable
giving studies, which provide several options of different charitable causes to create a clear
treatment effect and increase the likelihood that participants will find a cause they feel worthy of
supporting (Brown, Meer, and Williams 2013, Gallier, Reif, and Römer 2014). This design
feature is a methodological necessity, with the added virtue of revealing preferences for marine
protection. We hypothesize there will be no differences in the patterns of giving behavior across
the charity options.
Figure 8 Visual depiction of the difference between monetary and time donation treatments. Top: The monetary donation
treatment involved 1 hour of participants making beads and then collecting their earnings and deciding how much to keep
for themselves and how much to give to the charity they selected at the beginning. Bottom: The time donation treatment
involved one hour of participants making beads and after each bead deciding whether to allocate their effort to earn
money for themselves by placing the bead in the unmarked container or to let those earnings accrue to the charity they
selected at the beginning by placing the bead in the container marked ‘charity’. Note: For both treatments, there was an
identical ‘match’ treatment where any donation to charity was doubled. Photo credit: Katie Nelson (2015).
8 Each participant was informed that all donations would be sent to the charities within 90 days and that signs would be posted publicly in the
village showing the total amounts donated to all of the charities.

Chapter 1 Giving time or money to fund public goods
29
2.5.2 Treatments
Each participant was involved in only one treatment. In the monetary donation (D) treatment
subjects earned money performing a task and then decided whether to donate money to charity.
The volunteer time donation (V) treatment allowed subjects to choose as they work whether each
bead accrued money for themselves or for their chosen charity (see Figure 8).
To examine the effects of matching, the experiment included two additional treatments –
monetary donation match (Dm) and volunteer time donation match (Vm). These are identical to
the previous treatments except that the value of the individual’s contribution to charity in either
case is matched at a rate of 1:1, so that double the amount went to their chosen charity.
2.5.2.1 Real effort task
Participants earned the money they donated to charity rather than receiving it as an endowment –
the more common practice in experiments (Davis and Millner 2005, Eckel and Grossman 2003,
Gallier, Reif, and Römer 2014). This is an important distinction because it is more similar to
behavior in the real world9. Participants were given one hour to roll paper beads (see Appendix
E) and were paid 1000 Indonesian Rupiah (IDR)10
for each bead completed. This type of task was
chosen because it does not require prior knowledge; it is easy to teach to a person of any
education level or age; it does not require any particular skill; and the activity is commonly
taught by NGO’s as an income-generating activity in developing countries (Holt and Littlewood
2015).
Participants were instructed to deposit each bead into the transparent collection receptacle (see
Figure 8). The D and Dm treatments have only one receptacle while the V and Vm treatments have
two, such that any beads placed in the unmarked receptacle will earn private income and any
beads placed in the receptacle marked “charity” will earn money directly for their chosen charity.
After sixty minutes, the beads were counted and the respondent was paid privately in cash in bills
of various denominations. In D and Dm, participants were handed an envelope with their name,
which contained their personal earnings, and an empty charity envelope. There was a separate
9 Reinstein and Riener (2012) find that those subjects who earned their compensation choose to donate less than those who received an
endowment. 10 European Central Bank exchange rate 7 October, 2015 is EUR 1 = IDR 15,492. Therefore, 1000IDR is equivalent to 0.07€.

Chapter 1 Giving time or money to fund public goods
30
private area where they made their donation decision. They were asked to seal both envelopes
before leaving the area so that their decision was confidential. In V and Vm, the value of the
beads from the unmarked receptacle was paid in cash and placed into the envelope labeled with
the participant’s name. The value of the beads from the charity receptacle was paid in cash into
the envelope labeled with the name of the charity the participant selected. In the case of the
match treatments, the donated amount is doubled and placed into an envelope in front of the
participant.
2.6 Results
Summary statistics of the donations by treatment are presented in Table 211
. The table is split into
the averages across all participants plus the averages conditional on donating a nonzero amount.
We report on both absolute amounts donated and percentage of earnings donated. Due to the
wide range in earnings, we focus our discussion on the percentage of earnings donated.
Result 1. There are no significant differences in the pattern of donations between marine
conservation charities versus those dedicated to other objectives.
Figure 9 Charity selection and donations by charity type. Note: None of the differences are significant at p<0.05.
11 Analysis of mean age, income, education, and gender distribution across treatment groups does not show any significant differences. See
appendix for results of analysis of demographics across treatments.
0
5
10
15
Marine conservation Other
Average percent of earnings donated by charity type
Total average Conditional on giving
0
5
10
15
Marine conservation Other
Average amount* donated by charity type
Total average Conditional on giving2c)
9d)
Marine
conservation 36%
Other 64%
Choice of Charity 9a)
0
20
40
60
80
100
Marine conservation Other
Percent of people that gave something by charity type
9b)
9c)
85
5.2
90
11.5 11.7
10.3
5.4 6.1 6.2
9.8

Chapter 1 Giving time or money to fund public goods
31
As seen in Figure 9a, 36% of the sample chooses a marine conservation charity. Figure 9b shows
no significant difference between charity types in the percent of participants that make a donation
based on a Chi-square test (p=0.21). A one-way analysis of variance (ANOVA) test with
Bonferroni correction shows that there are also no significant differences in the percent of
earnings donated (p=0.61), nor in the amount donated (p=0.28) when comparing the marine
conservation charities to the other charity options (see Figures 9c and 9d).
Figure 10 Bar graphs of treatment comparisons.
Note: Refer to Table 2 for values and significant differences between treatments
*Amounts shown in Indonesian Rupiah divided by 1000 (1000IDR = 0.07€)
0
10
20
30
40
50
60
70
80
Donation DonationMatch
Volunteer VolunteerMatch
Average Earnings*
Total N Conditional on giving
0
2
4
6
8
10
Donation DonationMatch
Volunteer VolunteerMatch
Average amount donated*
Total N Conditional on giving
0
20
40
60
80
100
Donation Donationmatch
Volunteer Volunteermatch
Percent of N donating any amount
0
5
10
15
20
Donation Donationmatch
Volunteer Volunteermatch
Average percent of earnings donated
Total N Conditional on giving
10a) 10b)
10c) 10d)

Chapter 1 Giving time or money to fund public goods
32
Table 2 Summary Statistics by treatment
Total Sample Donation Donation
Match
Volunteer Volunteer
Match
N 75 76 75 76
Average percent of earnings
donated
15a
(16.7)
10.6ab
(9.7)
7.5b
(9.8)
7.6b
(7.3)
Percent of N giving something
85.3a
92.1b
82.7a
93.4b
Average earnings* 51.7a
(15.6)
57.2a
(16.8)
58.2a
(16.4)
57a
(14.7)
Average amount donated* 7.0a
(6.0)
5.6ab
(4.2)
4.4b
(6.5)
4.4b
(4.6)
Conditional on giving Donation Donation
Match
Volunteer Volunteer
Match
N 64 70 62 71
Average percent of earnings
donated
17.6a
(16.8)
11.6b
(9.6)
9.1b
(10.1)
8.2b
(7.2)
Average earnings* 52.7a
(16.2)
57.7ab
(16.5)
60.9b
(16.3)
58.0ab
(14.1)
Average amount donated* 8.2a
(5.7)
6.1ab
(4.0)
5.3b
(6.8)
4.7b
(4.6)
(a,b) Different letters between the means indicate significant difference at p<0.05 in One-way ANOVA test with Bonferroni correction, or
Binomial probability test, as appropriate (means that share the same letter, even if it is in combination with another letter, are not significant)
*Amounts shown in Indonesian Rupiah divided by 1000 (1000IDR = 0.07€)
Standard deviations in parentheses
Result 2. The average percent of earnings donated is significantly higher in the monetary
donation (D) compared to the volunteer time donation (V).
The ANOVA test with Bonferroni correction shows a highly significant difference (p=0.00)
between D and V in the average percentage of earnings donated. Participants in D give an
average of 15.03% of their income to charity while those in V give an average of 7.54%. This
holds true whether we include those that donated nothing in the average donation or whether we
analyze the results conditional on giving (p=0.00) (see Figure 10a). This result remains robust
when analyzing the absolute amount donated (see Table 2). We also explored the results when we

Chapter 1 Giving time or money to fund public goods
33
correct the standard errors for clustering at the session level, which has only a negligible bearing
on the precision of the estimates (see Appendix 1). We can therefore reject the hypothesis
suggested by Andreoni et al. (1996) that there should be no differences in the average amounts of
money or time donated when they are of equal value. On the other hand, our results are the
opposite of the findings of Brown, Meer, and Williams (2013) and Lilley and Slonim (2014),
who showed that participants prefer to donate time rather than money.
Result 3. The percent of participants who donate increases significantly with the presence of the
match.
As seen in Figure 10b, the percentage of participants that give to charity increases significantly in
both of the matching treatments. There is a seven percentage point increase in the percent of
people giving, from 85% in D to 92% in Dm (p=0.05) (see Table 2). The difference is even
greater in Vm, with nearly an eleven percentage point increase in frequency of giving (from
82.7% to 93.4%; p=0.001) with the offer of the match.
Result 4. Matching does not increase the percent donated in either the money or time treatments.
Table 2 shows the average percent of earnings donated is 15% for D and 10.6% for Dm (p=0.461).
Conditional on giving some amount, this decrease in percent of earnings donated becomes
significant with D at 17.6% and Dm at 11.6% (p=0.008). There is no significant difference in the
average percent of earnings donated between V and Vm. All results hold true when absolute
donation amounts are analyzed (see Table 2).
Thus, offering a match can be a counterproductive fundraising mechanism. However, in a
dynamic strategy of identifying and developing a new donor sub-population, the significant
increase in the percentage of participants giving something in both match treatments (from Result
3) may be of strategic importance to charity organizations (see Figure 11).

Chapter 1 Giving time or money to fund public goods
34
Figure 11 Total funds received by charities (not including match amounts). *Amounts shown in Indonesian Rupiah
divided by 1000 (1000IDR = 0.07€)
2.7 Discussion
Voluntary contributions to conservation are highly important yet receive little research attention
in the conservation sciences (Scarlett et al. 2013). Here we present the first experimental
methodology designed to evaluate resource users’ preferences for contributing time or money and
their response to matching incentives. This method allows for evidence-based design of
conservation campaigns based on the preferences of the target audience.
Participants from this fishing community display similar preferences for selecting and donating to
marine conservation charities as compared to other charitable causes. Marine conservation
charities represent one-third of the charity choices and slightly more than one-third of participants
select this type of charity. Additionally, participants that choose marine conservation charities
donate an equivalent percent of their earnings as those participants that chose other charities. We
find clear treatment effects regardless of the type of charity selected. These are important findings
for conservation organizations trying to involve communities in engagement and investment in
sustaining their natural resources.
Contrary to previous experimental studies, all of which were done in the lab, we find that
participants donate a higher percentage of earnings as monetary contributions than time to
charities. This result shows the risk in extending insights from university lab experiments in
developed countries to behavior in a field setting in a developing country when designing
523 427
327 335
Donation Donation match Volunteer Volunteer match
Total amount received by charities
Not including match

Chapter 1 Giving time or money to fund public goods
35
conservation campaigns. Several plausible explanations exist to explain why monetary donations
would be larger.
One possibility is that participants may gain more gratification from giving away the relatively
scarcer resource (Macdonnell and White 2015) – cash in the case of a low-income fishing
community in Indonesia. Tentative evidence is seen by a regression interacting the treatments
with income, which indicates that the positive effect of the donation treatment decreases in
magnitude with increases in the income of the participant (Appendix 3).
Second, religious background may also play a role. With 99.7% of the sample self-identifying as
Muslim, it is possible that the effects are based on the deeply ingrained obligation of monetary
charitable giving in Islam, known as ‘Zakat’ (Lambarraa and Riener 2015). Indeed, the sample’s
self-reported frequency of voluntarily donating money to charity (93%) compared to volunteering
(76%) confirms the pattern seen in the data.
A third possible explanation for higher monetary donations may owe to risk aversion, given that
those in the monetary donation treatment (D) are aware of the total amount they earned before
they have to make the donation decision, thus making it easier to calculate how much private
income they will take home after giving. While warranting consideration, we do not believe that
this factor drives our results. Participants were able to monitor the accumulation of beads in the
transparent containers, a highly repetitive process that varies little from bead to bead, making it
straightforward to anticipate the total amount that would be produced. Moreover, anecdotal
evidence from post-experimental surveys indicates that participants in the volunteer treatments
applied different strategies to account for earnings and donations, such as counting beads and
giving one in every 2 or 10 beads, or deciding on a value to donate at the outset.
Some practical insights have emerged that can inform efforts to raise funds and encourage
community engagement in conservation. If the goal is to increase monetary donations, matching
does not appear to be effective, but if the goal is to increase the donor base, matching
significantly increases the percentage of people donating, which can have great value over the
long-term. If the goal is to get people actively involved through participation and volunteering,
announcing that their time will be matched can allow organizations to better recruit new
volunteers, and will lead overall to more individual volunteer hours received by the charity. An
overwhelming majority of conservation organizations are non-profit and depend on grants,

Chapter 1 Giving time or money to fund public goods
36
donations, and volunteer time. Re-framing secured funds as matches does not incur additional
cost to the charity and it significantly increases the number of money- and time donors. This
evidence paves the way for additional studies that focus on whether people are more likely to
participate in meetings and activities if the value of their individual volunteered time is known
and matched with monetary funds.
The experiment further demonstrates that giving behaviors are not universal and are highly
context-dependent (Lambarraa and Riener 2015, Henrich et al. 2004). We recommend that
similar methods be applied across different cultural settings to provide more understanding as to
whether our results are idiosyncratic or whether there is widespread cultural variation in giving
behavior.

Chapter 1 Giving time or money to fund public goods
37
Appendix 1 Experimental Design
Participants were invited through a hand-delivered letter to each house in the village. The
invitation letter (see Appendix A) specified the date and time of the session. The treatments were
randomly assigned on the group level by a random drawing of a piece of paper marked with the
treatment group. The same person always conducted the treatment instructions briefing.
Participants were briefed in small groups and then continued to work individually. There were 63
groups overall. To explore whether this grouping had a bearing on statistical inference, we
analyzed the percent donated and the absolute amount donated as the dependent variables in a
regression with the treatments as the independent variables. The results indicate that the t-
statistics change only marginally when correcting the standard errors for clustering by group (see
table 3).
*p<0.05; ** p<0.01
‘Percent of earnings donated’ and ‘Absolute amounts donated’ represent dependent variables in a regression with
treatments as independent variables. Only marginal change in t-statistics when analyzing clustered standard errors. Note: T-statistics in parenthesis
Sessions were held throughout the day from 10:00am and into the evening until 20:00. Women
preferred to attend sessions with other women and the same was true for men so we separated
sessions by gender. The experimental location was in a neutral place, easily accessible by foot in
a rented building outside of the village so as not to appear as affiliated with any local NGOs or
%
donated
% donated
Clustered SE
Absolute
donation amount
Absolute donation
amount Clustered SE
Donation 0.000 0.000 0.000 0.000
Donation Match -0.044 -0.044 -1,354.912 -1,354.912
(2.37)* (2.12)* (1.55) (1.70)
Volunteer -0.075 -0.075 -2,613.333 -2,613.333
(4.02)** (3.64)** (2.97)** (2.63)*
Volunteer Match -0.074 -0.074 -2,565.439 -2,565.439
(3.98)** (3.66)** (2.93)** (2.87)**
_cons 0.150 0.150 6,973.333 6,973.333
(11.41)** (8.84)** (11.22)** (11.70)**
R2 0.07 0.07 0.04 0.04
N 302 302 302 302
Table 3 Effect of clustering standard errors:

Chapter 1 Giving time or money to fund public goods
38
government offices. There was a large open room where the participants performed the task while
sitting on the floor and shielding their work from others by a cardboard box that was provided
with their supplies. After the briefing, a demonstration was given on how to roll a bead and
participants were given their supplies and had three minutes to practice. The collection containers
where they deposit the beads were transparent so they could see and count their beads throughout
the hour during the task. Participants were allowed to converse during the task but they were
specifically instructed not to discuss their work. They could stop at any time to go to the
bathroom or take a phone call but the timer would not stop. They were informed at regular
intervals of the time remaining (15, 30, 45, 55, 58 minutes). Once the time was finished for the
task, the participants came individually to a separate area in the back of the building where their
beads were counted and they were paid for their work. The payment was placed in an envelope
with their name on it. In the Donation and Donation Match treatment, we handed both the full
envelope with their name and an empty envelope with the charity’s name to the participants.
There was a private room where participants then made their donation decision discreetly. They
were instructed to close and seal both envelopes before exiting the room to ensure privacy. The
participants then took a survey questionnaire and at the end of the survey, they collected the
envelope with their earnings. In the match treatments, we matched by 100% any amount the
participants gave to charity. We put the matched amount into an envelope that was stapled
together with the participants’ charity envelope. In the Volunteer and Volunteer Match
treatments, participants brought the two containers to the separate area in the back where the
beads in the unmarked container were counted and the earnings were deposited into the envelope
with the participant’s name, and then the beads in the container marked “charity” were counted
and the value of the beads was deposited in cash into the envelope with the charity’s name on it.
For consistency, the same person always checked and counted the beads. The team consisted of 5
enumerators from a nearby university that spoke Bahasa and some also spoke the local dialect; a
field manager from Indonesia; and the lead author. All paper strips used in the task were cut by
the enumerators from recycled airline magazines with a width of 1.5cm at the base and tapering
to a point.
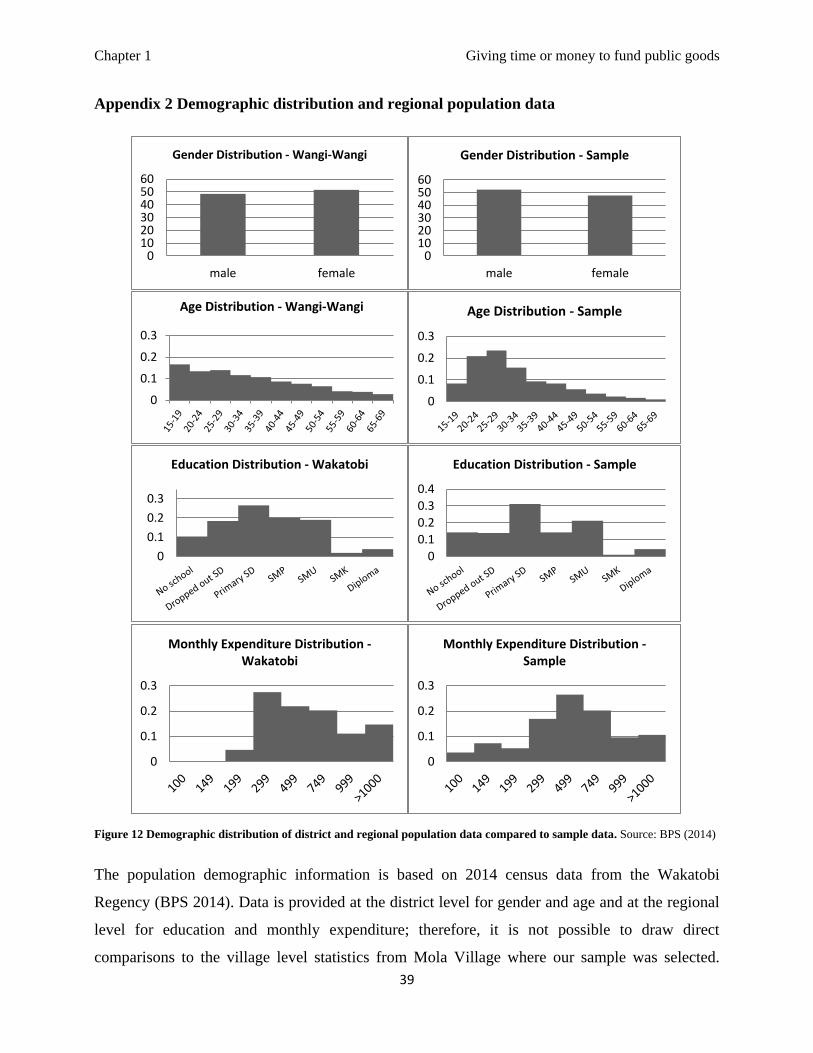
Chapter 1 Giving time or money to fund public goods
39
Appendix 2 Demographic distribution and regional population data
Figure 12 Demographic distribution of district and regional population data compared to sample data. Source: BPS (2014)
The population demographic information is based on 2014 census data from the Wakatobi
Regency (BPS 2014). Data is provided at the district level for gender and age and at the regional
level for education and monthly expenditure; therefore, it is not possible to draw direct
comparisons to the village level statistics from Mola Village where our sample was selected.
0102030405060
male female
Gender Distribution - Wangi-Wangi
0102030405060
male female
Gender Distribution - Sample
0
0.1
0.2
0.3
Age Distribution - Wangi-Wangi
0
0.1
0.2
0.3
Age Distribution - Sample
0
0.1
0.2
0.3
Education Distribution - Wakatobi
0
0.1
0.2
0.3
0.4
Education Distribution - Sample
0
0.1
0.2
0.3
Monthly Expenditure Distribution - Wakatobi
0
0.1
0.2
0.3
Monthly Expenditure Distribution - Sample

Chapter 1 Giving time or money to fund public goods
40
Although our demographic distribution differs somewhat from the district and regional level,
having sampled one-third of the houses in the village provides a balanced perspective of the
village demographics and this is confirmed in the relative similarity to the district and regional
demographics.
Appendix 3 Regression table showing treatment and income interactions
To explore whether the income of the respondent has a mediating effect on contributions to
charity, the below regressions include interactions of income with each treatment, designating the
volunteer treatment (V) as the base case. The estimates confirm the key results presented in the
text: The donation (D) treatment has the strongest effect, but its magnitude is reduced with
matching. Moreover, in the model of absolute donations, income is seen to have a statistically
significant effect.
Table 4 Regression table
* p<0.05; ** p<0.01
Note: T-statistics in parentheses
Absolute amount
donated
% donated
Donation 3,753.875 0.090
(3.55)** (3.99)**
Donation Match 2,445.106 0.054
(2.09)* (2.18)*
Volunteer Match 1,344.087 0.017
(1.25) (0.76)
Income x Volunteer 0.505 0.000
(2.04)* (1.06)
Income x Donation -0.576 -0.000
(2.00)* (1.19)
Income x Donation Match -0.622 -0.000
(1.47) (1.39)
Income x Volunteer Match -0.665 -0.000
(2.09)* (1.23)
_cons 3,381.924 0.065
(4.32)** (3.87)**
R2 0.05 0.08
N 302 302

Chapter 1 Giving time or money to fund public goods
41
With increases in income, people donate more under V, as evidenced by the positive coefficient
of income (representing the base case). This effect, however, becomes negative with matching.
The negative mediating effect of income is also seen under the donation (D) and donation match
treatments (DM), although it is not statistically significant in the latter case.
Appendix 4 Comparison of demographics across treatment groups
There are no significant differences at p<0.10 in the demographics between treatments using a
one-way ANOVA test with Bonferroni correction for multiple comparisons.
Table 5 Comparison of demographics across treatments
Donation Donation Match Volunteer Volunteer Match
Female 51% 51% 45% 43%
Age 31 33 31 32
Education level 4 4.5 4.3 3.7
Fisher 72% 61% 61% 71%
Annual Income 2.32e+07 1.80e+07 1.94e+07 2.00e+07

Chapter 2 Individual characteristics and donation behavior
42
Chapter 2
3 Individual characteristics and donation behavior
Distributional preferences and donation behavior among marine resource
users in Wakatobi, Indonesia
Nelson, K. M., Schlüter, A., and Vance, C.
* Published October 5, 2017. Ocean and Coastal Management. doi:10.1016/j.ocecoaman.2017.09.003
3.1 Introduction
Human behavior is widely accepted as the key driver that threatens biodiversity (Wright,
Veríssimo, et al. 2015). Humans have been dependent on marine resources for thousands of years
and this dependency has altered the oceans through direct and indirect means (Halpern et al.
2008). Coral reefs sustain the livelihoods of millions of people around the world but they are
facing serious decline and elevated levels of extinction (Mascia 2003, Carpenter et al. 2008).
Coral reefs represent both local and global public goods in that they provide a source of food for
millions of people; they are hotspots of marine biodiversity; they protect coastlines against storm
surges; they provide habitat, spawning, and nursery grounds for diverse fish species; they provide
jobs and income to local economies from fishing, recreation, and tourism; and they are a source
for new medicines (Mumby et al. 2008). The destruction of coral reefs can be attributed to human
behaviors such as pollution, overfishing, destructive fishing, coastal development, climate change
resulting in rising sea temperatures, ocean acidification, and increases in the global demand for
fish (Hilmi et al. 2017).
The marine conservation sciences often focus on documenting losses and identifying causes for
declines in biodiversity. In order to move toward identifying the underlying drivers and
implementing solutions, conservation practitioners must shift the focus from fish, reefs, and the
underwater environment to equally focus on communities, people, and human behavior. Research
suggests that management success depends upon social factors more so than biological or
physical variables (Mascia 2003). The compelling logic is that damage is likely to be worse
where natural resources are open-access because some people will be able to enjoy the benefits
without contributing to the costs of provision. Maintaining large-scale cooperation for the

Chapter 2 Individual characteristics and donation behavior
43
provision and management of open-access goods is fraught with this infamous cooperation
dilemma in which people tend to free-ride, both by overusing resources and underinvesting in
their maintenance. Coral reef ecosystems are the archetypal example of a natural resource that
suffers from this cooperation dilemma. In countries that have few resources to support
conservation, the situation is often exacerbated.
Much of the major funding for coral reef conservation comes from individuals and corporate
philanthropy in Europe, North America, and Australia. However, a great deal of coral reef
conservation work is focused in less wealthy countries. Countries in the Coral Triangle (i.e.
Indonesia, Philippines, Malaysia) have been recognized as the global center of marine
biodiversity and a priority for conservation (Allen 2008). In many cases where resources for
regulation and enforcement are lacking, conservation activities require community involvement
in the form of voluntary contributions and behavioral change on behalf of resource users. These
contributions can be in the form of time or money (i.e. attendance at meetings, participation in
training and events, donations, proper disposal of waste, following rules, etc.). The experiments
in this paper are inspired by the need to better understand the contributive behavior of marine
resource users to collectively sustain the conservation of coral reef public goods. McClanahan et
al. (2006) provide evidence that marine management regimes designed to meet community goals
can be more successful than those designed primarily for biodiversity conservation.
Indonesia has the highest diversity of corals and reef fishes and is home to one of the most
biologically diverse and economically valuable marine ecosystems on earth (Allen 2008). Coral
reefs in Indonesia sustain millions of people, providing the majority of protein and income for
many coastal communities (Cinner 2014). Mass mortality events related to coral bleaching are
increasing in frequency which threaten coral reef habitats and the high levels of biodiversity
(Descombes et al. 2015, Pandolfi et al. 2011). The lack of sustainable funding for marine
protected areas, coupled with low community involvement and ownership, contribute to the
somber outlook for reef conservation in Indonesia (Bos, Pressey, and Stoeckl 2015). Therefore,
we selected Wakatobi National Marine Park as our research site within Indonesia, which has
large and vulnerable areas of reef, a relatively dense population (compared to other marine
parks), a history of non-compliance, a strong fishing economy, and a rapidly growing tourism
industry.

Chapter 2 Individual characteristics and donation behavior
44
3.2 Wakatobi National Marine Park
The Wakatobi National Marine Park is the third largest national marine park in Indonesia.
Wakatobi covers 1.3 million hectares. The area was declared a marine national park in 1996 in an
attempt to reduce destructive fishing practices and the threat of overfishing (Caras and Pasternak
2009) (see Figure 13). Wakatobi district is located in the province of Southeast Sulawesi and is
made up of four larger islands: Wangi-Wangi, Kaledupa, Tomia, and Binongko. The marine
environment includes extensive fringing shallow reefs and reef walls and boasts some of the
highest recorded levels of marine biodiversity in any ecosystem in the world. It is ranked as one
of the highest priorities for coral reef conservation in the Coral Triangle due to numerous human
threats to the ecosystem including destructive fishing practices from bomb and cyanide fishing,
overfishing, pollution, tourism development, and coral mining. The decentralization of
government in Indonesia placed financial pressure on district governments which led to increased
external involvement (e.g., non-governmental organizations or NGOs) into marine protected area
plan production (von Heland, Clifton, and Olsson 2014). With input from the World Wildlife
Fund (WWF) and The Nature Conservancy (TNC), the park regulation and zonation was
significantly revised in 2009 due to a lack of community inclusion and participation in the initial
zonation plan resulting in poor compliance and management (Clifton 2003).
With approximately 100,000 people living within the park, Wakatobi is one of the most densely
populated marine national parks in Indonesia. The majority of residents rely on marine resources
for food and income. Ninety-two percent are of local Butonese origin and the remaining eight
percent (about 7,000 people) belong to the Bajo (sometimes spelled Bajau) ethnic group residing
in six settlements across the islands (von Heland, Clifton, and Olsson 2014). The term ‘Bajo’
refers to several Austronesian ethnic groups across South East Asia. Historically, they are a sea-
faring people that live much of their nomadic lives at sea or in huts erected on stilts over reef
flats. They identify strongly with the ocean, calling other ethnicities ‘land people’, and their
culture is strongly intertwined with the sea. They are linguistically and ethnically distinct from
their Butonese neighbors. Even though they are strongly dependent on marine resources, in the
past the Bajo have been systematically left out of participating in marine governance in Wakatobi
because of their minority status. They represent key fisheries knowledge that is fundamental to
the establishment and compliance of marine protected zones.

Chapter 2 Individual characteristics and donation behavior
45
Figure 13 Map of study site - Wakatobi National Marine Park and Bajo Mola Village (Clifton 2013).
3.3 Distributional Preferences and Contributive Behavior
Conventional economic reasoning is typically based on the self-interest hypothesis, i.e. the
assumption that rational people are exclusively motivated by their material self-interest (Fehr and
Fischbacher 2002). However, most economists recognize this assumption of pure selfishness is
made mostly for simplicity. And there is overwhelming experimental evidence refuting the self-
interest hypothesis by showing that people often behave with un-selfish preferences, which can
help explain how and why communities are able to manage collective resources. Yet, the
experiments used to elicit these preferences are typically played in small groups of only a few
players. It is unclear if these preferences are stable when the exchange is between one to two
individuals versus an organization (Schumacher et al. 2016). A core question pertaining to
Wakatobi
Mola village

Chapter 2 Individual characteristics and donation behavior
46
conservation economics is: what are the conditions necessary for encouraging successful
collective action for conservation? Behavioral studies that focus on individual decisions are
crucial because they offer the possibility to understand environmental issues in connection with
economic theory (Cecere, Mancinelli, and Mazzanti 2014).
Social preferences for the distribution of wealth (hereafter referred to as distributional
preferences) shape individual behavior on a range of issues related to: competition in the labor
market (Charness and Rabin 2002, Balafoutas, Kerschbamer, and Sutter 2012), political party
affiliation (Fisman, Jakiela, and Kariv 2014), collective behavior (Fehr and Fischbacher 2002,
Hedegaard, Kerschbamer, and Tyran 2011) and charitable giving (Kamas and Preston 2008,
2015). Relatively little is known about how the distributional preferences of resource users relates
to contributions to public goods. It is unclear how distributional preferences factor in situations
where the costs of an action are large, but the benefits are dispersed among many individuals,
such as in the situation of environmental goods (Schumacher et al. 2014). Additionally, it is not
clear whether concern for the welfare of others extends to the environment and open-access
resources or whether they are linked at all. While there is literature showing that personal values
affect contributions, the majority of research does not distinguish between the heterogeneity in
prosocial motivations, such as differences between benevolence, inequity aversion, and efficiency
or how this information could be useful to practitioners (Kamas and Preston, 2012). We also
contribute to the literature that focuses on the stability of distributional preferences across social
domains (i.e. distribution of funds to individuals vs. charitable organizations) (Schumacher et al.
2014, Schumacher et al. 2016, De Oliveira, Croson, and Eckel 2009).
Fundamental to achieving conservation goals is the ability to understand and manage biodiversity
as a collective good that requires people to change their behavior by modifying, halting, or
replacing detrimental activities (Secretariat 1992). According to Wright, Veríssimo, et al. (2015)
and Harrison et al. (2014), in general, conservationists have failed to influence people’s behavior,
and, as a result, biodiversity and natural environments continue to decline in extent and quality.
Efforts to influence people's behaviors for the benefit of conservation should therefore seek new
approaches from other disciplines such as marketing and charitable giving (Kraft-Todd et al.
2015, Wright, Veríssimo, et al. 2015, Veríssimo 2013). Voluntary approaches, as opposed to
command-and-control regulatory approaches, are considered an important “new tool” for
conservation and environmental management, but little is known about how to motivate

Chapter 2 Individual characteristics and donation behavior
47
voluntary contributions for the environment (Dietz and Stern 2002, Brouhle, Griffiths, and
Wolverton 2005).
Given the proximity and direct impact on the environmental good, understanding resource users’
ability and willingness to contribute to conservation is essential (Thaman et al. 2016).
Environmental protection in many countries is funded from general tax revenues, but poor
countries often have weak governmental financial support for conservation initiatives, meaning
that a large proportion of conservation resources must be provided privately at the local, national
and international level. Much of these funds come from voluntary contributions to NGOs and
informal community groups, in the form of both volunteer services and monetary donations.
Although much of the initial conservation funding may come from international sources, long-
term planning must look beyond the project life to community-managed and sustainably financed
conservation goals. Therefore, engaging in an experimental field setting with members of an
Indonesian fishing community, we explore the relationship between the individual-to-individual
and the individual-to-charitable organization distribution of resources and determine the practical
implications of the results for conservation.
Previous studies indicate that different demographic, socioeconomic and psychographic
characteristics make up market segments that affect the type of charity preferred and level of
donations made to charities (Dolnicar and Randle 2007, Diamantopoulos, Schlegelmilch, and
Love 1993, Nichols 1995, Straughan and Roberts 1999). The development of psychographically
defined segments offers benefits in terms of greater precision when targeting marketing
strategies, particularly promotional or behavior change strategies (Schlegelmilch and Tynan
1989). Dolnicar and Randle (2007) argue that motivation-based data-driven market segmentation
represents a useful way of gaining insight into heterogeneity amongst donors. Such insight is
useful to charity organizations to more effectively target segments with customized messages.
We investigate the demographic and psychographic factors that influence people from a fishing
village in Indonesia to contribute to a charitable organization. We conducted a field experiment
whereby participants earned money through the completion of a task and then had the
opportunity to donate some or all of their earnings to local or national charitable organizations.
Using the terminology from experimental economics, this is a simple ‘dictator game’ where the
individual makes a decision about how to allocate an endowment between herself and a passive

Chapter 2 Individual characteristics and donation behavior
48
recipient (which in this case is a charitable organization). Each participant was presented with
one of the four treatment scenarios: 1) monetary donation, 2) monetary donation match, 3)
volunteer time donation, and 4) volunteer time donation match. Each participant faced two
decisions in sequence: whether to donate, and how much to donate. We incorporate this two-level
decision structure into the analysis12
.
This was followed by a binary-choice task to elicit distributional preferences in the
psychographic dimension. Our analysis focuses on the relationship between distributional
preferences between individuals and donation behavior to a charity organization, as experimental
evidence on this topic is scarce (Kidd, Nicholas, and Rai 2013). The distributional preferences
measurement is also a dictator game in which the decision maker’s choices have consequences
for herself and an anonymous other individual participating in the experiment. We measure
distributional preferences using the Equality Equivalence Test developed by Kerschbamer
(2010). According to individuals’ payoff choices, the measurement test distinguishes between
different categories of distributional preferences. The most prominent ones are benevolence
(where increases in the payoffs to others enter positively into the decision maker’s utility
function) (Andreoni and Miller 2002), egalitarianism (where there is a preference for equal
payoffs, even when decision-maker’s payoffs could be higher) (Dawes et al. 2007, Fehr,
Bernhard, and Rockenbach 2008), own-money-maximization (where the decision maker’s
preference is for higher payoffs for self only and the welfare of the other does not enter into the
utility function) (Kerschbamer 2015), and malevolence (where reductions in the payoffs to others
are preferred) (Levine 1998). If the distributional preference type helps explain charitable giving
behavior among resource users, we can use this information to customize communications
regarding the benefits of conservation to appeal to specific psychographic types in the community
of resource users. Therefore, understanding distributional preferences and the relationship to
charitable giving behavior could be an important indicator in successfully managing collective
resources (Fehr and Fischbacher 2002).
This research contributes to the growing literature on donation behavior by highlighting and
analyzing the impact of an important factor – distributional preferences – on donations.
Specifically, we build on an earlier study (Nelson, Schlüter, and Vance 2016) that exposed
12 Nelson, Schlüter, and Vance (2016) focus on an in-depth analysis of the differences between the treatments in this experiment.

Chapter 2 Individual characteristics and donation behavior
49
participants to a real effort task under four different treatments. The results from this study
address the conventional economic assumption that whenever the value of cash donations equals
the value of time donations, people are indifferent between giving monetary contributions or the
value of volunteer labor to the charity (Andreoni et al. 1996).13
By exposing individuals to
different options to donate money or time, we found that participants gave a higher percentage of
their earnings when donating money compared to time (Nelson, Schlüter, and Vance 2016).
Additionally, matching contributions does not increase the amount given in either case (Nelson,
Schlüter, and Vance 2016).
In the present paper, we report on the findings from the second part of the experiment, where we
first elicit distributional preferences using the measurement test proposed by Kerschbamer
(2010), and subsequently include the preferences revealed in the test as an independent variable
in an econometric analysis of donation behavior. In previous lab experiments, Kamas and Preston
(2008) found that preferences are heterogeneous and linked to particular patterns of giving. Using
a comparable elicitation technique, they found that participants that behave equitably and
altruistically give more to charity than do efficiency maximizers or the self-interested. They show
a significant price response by altruists and self-interested individuals to matched giving.
Similarly, we investigate whether distributional preference categories are reliable indicators for
donation behavior.
3.4 Sample participants
Experiments took place in the township of Wanci, on the island of Wangi Wangi in Wakatobi.
All 302 participants were from the Bajo community of the Mola village, which is home to the
majority of fishermen in the area. Although the Bajo constitute only about 8% of the total
population of Wakatobi, they represent key stakeholders as they rely almost exclusively on
marine resources for food, building materials, trade, livelihood, and cultural identity. Over fifty
percent of the total Bajo Mola population is engaged in fishing as their primary occupation and
almost all households depend directly on fishing as a source of livelihood and subsistence. The
Bajo settled in the area in 1958 and began to construct huts built on top of coral mined from the
13 Although there is very little cross-over between the literature on managing common-pool resources and charitable giving behavior as both
occupy separate niches within economics, they both operate on the same economic theory that people will behave in their own best interest.
However, empirical evidence from both disciplines shows that people often behave unselfishly by cooperating to manage common resources and
donating to charity. It is my intention to draw these together to show how theories and methods from charitable giving research can be applied to
common pool resource problems and potentially increase collective behavior.

Chapter 2 Individual characteristics and donation behavior
50
nearby reef. With a population of 6,336, this is the largest settlement of Bajo people in Indonesia.
At present, with the concrete roads and cement homes in the main area of the village, it is often
times difficult to tell that the village is built upon reclaimed land (see Figure 14).
Figure 14 Bajo Mola house built upon reclaimed land from coral mined from reef flats. Photo credit: Katie Nelson (2015).
3.5 Study design Participants were recruited by a hand delivered invitation letter indicating the date and time of a
session. Every house received an invitation, and approximately one-third of households from the
village participated. Men preferred to participate in sessions with other men and the same was
true for women. Therefore, we divided the sessions by gender and would invite only women or
men to participate at certain times. The socio-demographics of the sample are in line with the
average population socio-demographics for gender, occupation, and education level, suggesting
that the sample is broadly representative of the economically active population.
The study was designed in two parts, where the first part featured four experimental treatments:
Donation, Donation Match, Volunteer, and Volunteer Match and the second part involved a
demographic survey and elicitation of distributional preferences.

Chapter 2 Individual characteristics and donation behavior
51
In all treatments, respondents performed the same effort task over a one-hour period and were
offered the same choices for charities. Participants earned any money they donated to charity
rather than receiving it as an endowment. This design allows for comparison between the
Donation and Volunteer conditions, where participants can choose to work directly for charity,
which would not be possible with an endowment. In addition, working for earnings and deciding
what amount of time or money to allocate to charity more accurately resembles real-life behavior
than a windfall endowment.
Participants were provided with a list of six charities and their missions (see Appendix D). The
order of the charities was randomly determined to avoid any bias from anchoring effects.
Participants were instructed to select one charity from the list and at this time they were informed
that they would have an opportunity to donate some of their earnings to the selected charity. They
were assured that a donation was not a requirement but was their choice and any donations would
be sent to the charity within 90 days. Following the standard protocol of other charitable-giving
studies, we provided participants with several options for charitable causes so as to increase the
likelihood that each participant would find at least one cause they would consider supporting
(Brown, Meer, and Williams 2013, Gallier, Reif, and Römer 2014).
The charities were selected based on interviews with key informants and locals to determine a
selection of local and national charities that most participants would find worthy of supporting.
We specifically chose charities that represented a wide range of causes to encourage charitable
giving. This allowed for the possibility to measure charity choices based on distributional
preference type. There were three local-level charities and three national-level charities
representing marine/environmental conservation, rural potential, and religious activities
respectively.
3.6 Part One: Real effort task and Donation Decision
Participants were given one hour to roll paper beads. This type of task was chosen because it does
not require any prior knowledge; it is simple and easy to teach to a person of any education level
or age; and it does not require any particular skill that would give any person an advantage over
another. For a full description of instructions, please see Appendix C.

Chapter 2 Individual characteristics and donation behavior
52
Participants were informed that they would be paid 1000 Indonesian Rupiah (IDR)14
for each
bead completed. Once the hour was finished, participants stopped the task and set aside their
collection containers of their beads. One-by-one, participants brought their bead containers to a
discreet area where the beads were counted and the respondent was paid privately in cash.
3.6.1 Experimental Treatments
The first part included four treatments to determine the effects of contributions of time versus
money and how matching offers effect these contributions.
3.6.1.1 Donation
The Donation treatment reflects a condition in which agents work to earn money for themselves,
receive their pay, and then decide how much of a donation to make to charity. At the end of the
sixty minutes, participants were paid in cash15
for the completed beads into an envelope with
their name on it. Each participant had another envelope with the name of the charity they selected
and were allowed to make their donation decision discreetly in a private room and seal both
envelopes before returning to complete the second part of the experiment.
3.6.1.2 Donation Match
The only difference in the Donation Match treatment is that participants are informed that any
amount that is donated to their charity will be equally matched so that double the amount will go
to the charity of their choice.
3.6.1.3 Volunteer
The Volunteer treatment represents an agent’s choice between having their effort accrue to their
own earnings or to the charity of their choice. Each person had the choice between depositing
each completed bead into the work-for-self container or the volunteer-for-charity container.
Participants were instructed to place each bead as it was completed into one of the containers.
The containers were visible to participants but were hidden from view of others during the course
of the experiment by a cardboard box. Participants were told that they would be paid in cash for
the value of their work that was allocated to the collection container for themselves and the
14 European Central Bank exchange rate 7 October, 2015 is EUR 1 = IDR 15,492.07. Therefore, 1000IDR is equivalent to 0.07€. 15 The cash payment always included several bills of differing amounts (bills ranged from 1000, 5000, 10,000 and 20,000 depending on the total
payment) so the participant could make any combination of donation they liked.

Chapter 2 Individual characteristics and donation behavior
53
charity they chose would receive the value of their labor for the beads they put into the container
labeled “charity”.
3.6.1.4 Volunteer Match
The only difference in the Volunteer Match treatment is that participants are informed before the
task began that the value of their time (measured in the number of beads made for their charity)
will be equally matched so that double the amount will go to the charity of their choice.
3.7 Part Two: Distributional Preferences Elicitation Task
Following the protocol developed by Kerschbamer (2010), each participant was subjected to a
randomized series of ten binary choices between allocations that both involved a payoff for the
decision maker and a payoff for a randomly matched anonymous second participant (see Figure
15). We used the double-role-assignment protocol, where each subject makes ten decisions. After
the experiment was completed, each subject received two randomly chosen payoffs – one based
on their decision as the active person and one as a passive person based on the results of another
anonymous participant (Kerschbamer 2015). In each of the ten binary choices, one of the two
allocations was symmetric (i.e., both people get equal amounts), while the other decision was
asymmetric – involving unequal payoffs.
Left
Your choice
Right
You get They get You get They get
Disadvantageous inequality block*
1) 8.000
13.000
Left
Right
10.000
10.000
2) 9.000
13.000
Left
Right
10.000
10.000
3) 10.000
13.000
Left
Right
10.000
10.000
4) 11.000
13.000
Left
Right
10.000
10.000
5) 12.000
13.000
Left
Right
10.000
10.000
Advantageous inequality block
1) 8.000
7.000
Left
Right
10.000
10.000
2) 9.000
7.000
Left
Right
10.000
10.000
3) 10.000
7.000
Left
Right
10.000
10.000
4) 11.000
7.000
Left
Right
10.000
10.000
5) 12.000
7.000
Left
Right
10.000
10.000 Figure 15 Choices in the distributional preferences elicitation task *The asymmetric options were not labeled as ‘disadvantageous’ and ‘advantageous’ inequality blocks for participants, nor were they ordered from
smallest to largest as seen in the figure above.

Chapter 2 Individual characteristics and donation behavior
54
As described in Balafoutas, Kerschbamer, and Sutter (2012), on the left-side asymmetric
allocation options, half of the options involve a higher payoff of 13.000IDR for the other person
while the payoff of the decision maker increased from one option to the next in 1.000IDR
increments from 8.000IDR in the first choice to 12.000IDR. The other half of the asymmetric
options involve a lower payoff of 7.000IDR for the other person while the payoff of the decision
maker increases from one option to the next in 1.000IDR increments from 8.000IDR to
12.000IDR. In each of the two blocks, a decision maker is considered rational if their behavior is
consistent with switching at most once from the symmetric (right-side) to the asymmetric (left-
side) allocation (and never from Left to Right) (Balafoutas, Kerschbamer, and Sutter 2012).
Following the characterization rules from Balafoutas, Kerschbamer, and Sutter (2012), a subject
who displays benevolent preferences, will switch to the left-side asymmetric option by no later
than the third choice in the disadvantageous inequality block (see Figure 16). A person who
switches to the asymmetric choice later than the third choice in the disadvantageous block is
inconsistent with benevolence (and therefore counted as malevolence here). In the advantageous
inequality block, a person with benevolent preferences will switch to the asymmetric option for
the first time in the fourth choice or later. And those that switch earlier than the fourth option in
the advantageous block are also inconsistent with benevolence. We use the following names for
the four categories: decision makers who are benevolent in both domains are called benevolents;
decision makers who always choose the symmetric option are called egalitarians; decision
makers who are malevolent in both domains are called malevolents; and decision makers who are
malevolent in the disadvantageous block, but benevolent in the domain of advantageous
inequality, are called own-money-maximizers (see Figure 16 for a visual depiction).
Approximately 10% of our sample makes choices that are not consistent with rational behavior in
the distributional preferences elicitation task. Rather than drop them from the analysis altogether,
we include them under the name of unclassified.

Chapter 2 Individual characteristics and donation behavior
55
Figure 16 Characterization of distributional preference types Note: Strongly benevolent types select left before the third line in the disadvantageous inequality block and strongly malevolent types select the
left option before the third line in the advantageous inequality block and may select all right options in the disadvantageous inequality block.
3.8 Results
As shown in Figure 17, 4.7% of the sample is categorized as benevolents, 35.7% are categorized
as egalitarians, 27.5% are malevolents, and 22.2% are own-money-maximizers. Figure 17 also
shows that a high percentage of participants in our sample donate some amount to charity.
Almost half of the non-donors are in the malevolents category.
Figure 17 Percentage of distributional preferences by type and binary donation decision
0%
5%
10%
15%
20%
25%
30%
35%
40%
Benevolents Egalitarians Malevolents Maximizers Unclassified
Percentage of sample by preference type
No Donation Donation
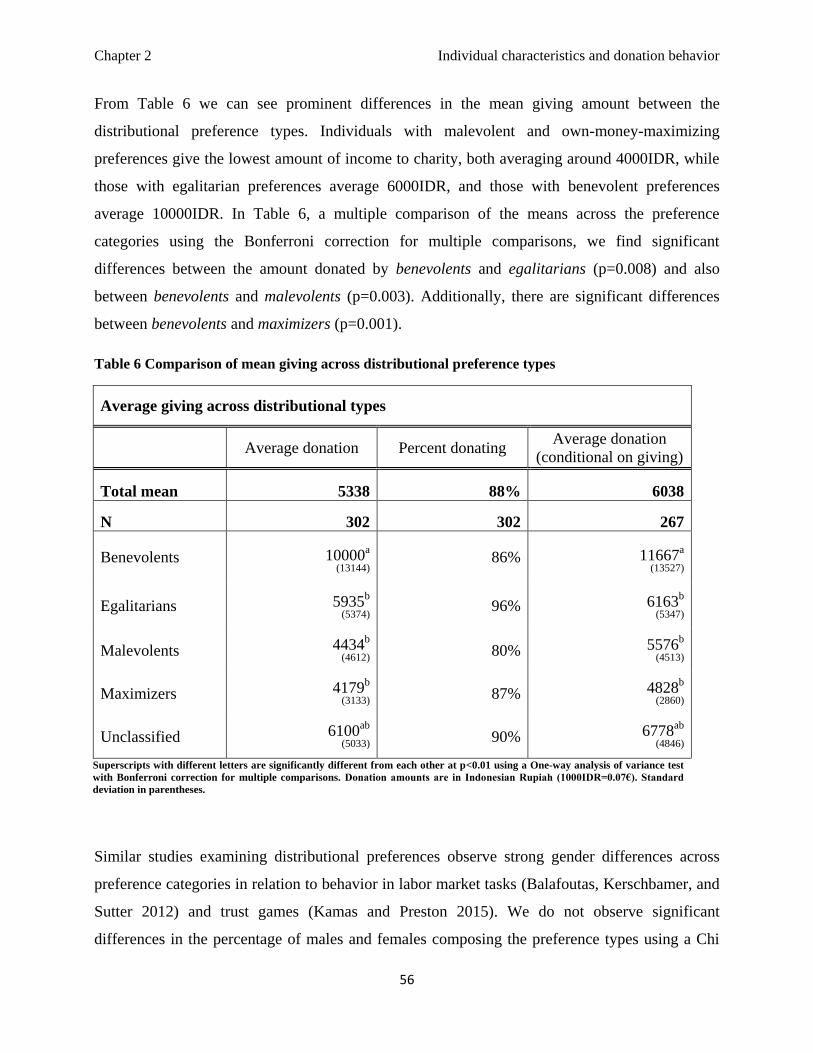
Chapter 2 Individual characteristics and donation behavior
56
From Table 6 we can see prominent differences in the mean giving amount between the
distributional preference types. Individuals with malevolent and own-money-maximizing
preferences give the lowest amount of income to charity, both averaging around 4000IDR, while
those with egalitarian preferences average 6000IDR, and those with benevolent preferences
average 10000IDR. In Table 6, a multiple comparison of the means across the preference
categories using the Bonferroni correction for multiple comparisons, we find significant
differences between the amount donated by benevolents and egalitarians (p=0.008) and also
between benevolents and malevolents (p=0.003). Additionally, there are significant differences
between benevolents and maximizers (p=0.001).
Table 6 Comparison of mean giving across distributional preference types
Average giving across distributional types
Average donation Percent donating Average donation
(conditional on giving)
Total mean 5338 88% 6038
N 302 302 267
Benevolents 10000a
(13144) 86% 11667
a
(13527)
Egalitarians 5935b
(5374) 96% 6163
b
(5347)
Malevolents 4434b
(4612) 80% 5576
b
(4513)
Maximizers 4179b
(3133) 87% 4828
b
(2860)
Unclassified 6100ab
(5033) 90% 6778
ab
(4846)
Superscripts with different letters are significantly different from each other at p<0.01 using a One-way analysis of variance test
with Bonferroni correction for multiple comparisons. Donation amounts are in Indonesian Rupiah (1000IDR=0.07€). Standard
deviation in parentheses.
Similar studies examining distributional preferences observe strong gender differences across
preference categories in relation to behavior in labor market tasks (Balafoutas, Kerschbamer, and
Sutter 2012) and trust games (Kamas and Preston 2015). We do not observe significant
differences in the percentage of males and females composing the preference types using a Chi

Chapter 2 Individual characteristics and donation behavior
57
square test (p = 0.60) (Figure 18a) or in the percent of males and females that make a donation
(Figure 18b). However, there are differences in the mean donations between males and females,
but statistical significance is only seen in the egalitarian (p=0.0021) type category (Figure 18c).
Although the mean giving between male and female benevolents appears to be vastly different,
the variance is large and therefore we do not observe significance.
Figure 18 Analysis of distributional preferences by gender
Note: *denotes statistical significance at p<0.01 using a two-tailed t test. Donation amounts are in Indonesian Rupiah (1000IDR=0.07€).
To assess whether these findings are robust to the inclusion of control variables, we now analyze
these descriptive results econometrically using a two-stage procedure originally developed by
Cragg (1971), sometimes referred to as the two-part model. The first stage employs a probit
0%
10%
20%
30%
40%
50%
60%
Gender representation by type
Male Female
18a)
6c)
0%
20%
40%
60%
80%
100%
Percent of females and males donating
Male Female
18b)
13500
7312
4691
3400
5177 5333
4149 4171 4811
7308
0
2000
4000
6000
8000
10000
12000
14000
16000
Benevolents Egalitarians Malevolents Maximizers Unclassified
Male Female
Average amounts donated by gender
*
18c)

Chapter 2 Individual characteristics and donation behavior
58
model to identify what factors determine why people donate in the first place, while the second
stage employs an ordinary least squares (OLS) regression to identify what factors determine how
much they donate - among those who donated a positive amount. Of particular interest are the
estimates on the dummy variables indicating the treatments as well as the distributional
preference types.
The model additionally includes a suite of socioeconomic variables to control for age, education,
gender, and income. Age and education are measured in years while gender is measured with
dummy variable indicating females. Income is measured with two dummy variables indicating
low and medium income households (high income is the base category). Given the nature of a
subsistence fishing economy that ebbs and flows with the seasons and availability of fish, average
income can be difficult to determine. Therefore, we employed a three-part question that asked for
the lowest household monthly income earned and how many months per year this amount is
expected, the highest monthly income earned and how many months, and the normal monthly
income earned. This allowed us to calculate an estimated annual income. We then divided the
sample into three income categories – low income, middle income, and high income. Those in the
low income category earn less than the equivalent of 695€ per annum or less than 2€ per day. The
middle income earns between 695€ - 3,095€ per year or between 2€ - 8.50€ per day. And the high
income category earns over 3,095€ per year.
Referring to the first column of estimates in Table 7, we start by analyzing a parsimonious probit
model that excludes the distributional preferences to see if any of the other variables explained by
previous literature are relevant. Neither the demographic variables nor the treatments are seen to
be statistically significant determinants of the discrete donation decision. The model in the
second column includes the dummies indicating distributional preference type. With egalitarian
serving as the base category, two of these dummies have negative and statistically significant
coefficients, those indicating malevolents and own-money-maximizers. We thereby find that
individuals that respond with malevolent and own-money-maximizing payoff decisions in the
distributional preferences elicitation task are less likely to donate anything at all to charity than
those with egalitarian preferences. Moreover, a Wald test indicates the four dummies to be jointly
statistically significant, while a likelihood ratio test indicates that they significantly improve the
fit of the model at p=0.01.

Chapter 2 Individual characteristics and donation behavior
59
Table 7 Probit and Ordinary Least Squares Regression Table
Independent Variables
Probit:
Binary donation
decision
Probit:
Binary donation
decision
OLS Regression:
Amount Donated
OLS Regression:
Amount donated
N 302 302 267 267
Age -0.015 -0.014 0.001 0.001
(-1.71) (-1.61) (0.13) (0.21)
Female -0.016 0.024 -0.054 -0.039
(-0.08) (0.11) (-0.59) (-0.43)
Education -0.040 -0.038 0.090 0.078
(-0.60) (-0.54) (3.05)** (2.64)**
Low income 0.311 0.265 -0.014 -0.025
(0.94) (0.80) (-0.08) (-0.15)
Mid income 0.292 0.235 0.025 0.015
(0.89) (0.71) (0.14) (0.09)
o.Hi income 0.000 0.000 0.000 0.000
o. Donation 0.000 0.000 0.000 0.000
Donation match 0.402 0.357 -0.301 -0.292
(1.41) (1.22) (-2.45)* (-2.39)*
Volunteer -0.110 -0.120 -0.630 -0.659
(-0.44) (-0.46) (-4.96)** (-5.23)**
Volunteer match 0.461 0.507 -0.675 -0.710
(1.59) (1.63) (-5.50)** (-5.83)**
Unclassified -0.506 0.072
(-1.25) (0.48)
Benevolents -0.643 0.494
(-1.29) (2.27)*
Malevolents -0.957 -0.071
(-3.38)** (-0.64)
Maximizers -0.718 -0.197
(-2.33)* (-1.68)
o. Egalitarians 0.000 0.000
_cons 1.402 2.007 9.220 9.298
(2.55)* (3.32)** (34.34)** (34.20)**
R2 0.16 0.20
z statistics in parenthesis; * p<0.05; ** p<0.01
The latter two columns of Table 7 present the estimates from the OLS model of the amount
donated, conditional on having donated some positive amount. We accommodate non-normal
errors with a transformation on the dependent variable. Following Yen, Boxall, and Adamowicz
(1997), we use the inverse hyperbolic sine transformation of the dependent variable. The
transformation ensures robustness to non-normality (Brown et al. 2015), is scale invariant, and is

Chapter 2 Individual characteristics and donation behavior
60
known to be well suited for handling extreme outliers of the dependent variable (Burbidge,
Magee, and Robb 1988).
The parsimonious model in the third column reveals that the level of education of an individual
has a significant and positive effect on the donation amount, while the donation match, volunteer,
and volunteer match treatments all have negative effects relative to the base category of donation.
Income, age, and gender do not have any significant effect on the amount that is donated. These
findings are contradictory to other donation studies that show that women are more likely to
donate than men (Lee and Chang 2007, Wiepking and Bekkers 2012, Kamas and Preston 2015,
Simmons and Emanuele 2007), and that higher income has a positive effect on the donation
amount (Bryant et al. 2003, Clotfelter 1997, James and Sharpe 2007, Wiepking and Bekkers
2012, McClelland and Brooks 2004). Including the distributional preference types into the
regression model in column four significantly improves the fit of the model at p=0.03 using the
Likelihood Ratio Test. The inclusion of the dummies indicating preference type in the final
column has little bearing on the estimates on the control variables; their magnitude changes only
marginally. Participants with benevolent distributional preferences donate more than any other
preference category (p<0.05), while those with malevolent and maximizing preferences do not
have a significant effect compared to individuals that respond with egalitarian preferences.
Analyzing the correlates of distributional preference types using a multinomial logistic regression
reveals few differences between the psychographic types. The only demographic variable
determining membership into a distributional preference category is that benevolents have higher
levels of education. We have graphically displayed the choice of charities by distributional
preference type using pie charts (Figure 19). Benevolents most often choose Islamic Relief
Worldwide, a religious aid organization, and TERANGI, the coral reef conservation charity.
Own-money-maximizers show a preference for TERANGI and all local charity organizations
(seemingly regardless of their mission) – Sintesa, Karang Taruna, and Nahdlatul Ulama. The
egalitarians and malevolents appear to have less discretion overall for the type of charity chosen.

Chapter 2 Individual characteristics and donation behavior
61
Figure 19 Choice of charity by preference type
3.9 Discussion
We use a preferences elicitation tool in combination with a donation experiment to disentangle
the impact of distributional preferences from that of other variables on the amount that local
marine users donate to real public goods. The distribution of preference types found in our
sample is rather different from the previous literature. Kerschbamer (2015) observe the most
frequent distributional preference types to be benevolents and own-money-maximizers (displaying
positive or neutral attitude towards others in both domains) and the least frequent to be
egalitarians and malevolents (displaying malevolent preferences in at least one of the domains).
Balafoutas, Kerschbamer, and Sutter (2012) found similar results, with 71% of respondents
Egalitarian
Oxfam
Terangi
Islamic Relief
Karang Taruna
Sintesa
Nahdlatul Ulama
Malevolent
Oxfam
Terangi
Islamic Relief
Karang Taruna
Sintesa
Nahdlatul Ulama
Benevolent
Oxfam
Terangi
Islamic Relief
Karang Taruna
Sintesa
Nahdlatul Ulama
Maximizer
Oxfam
Terangi
Islamic Relief
Karang Taruna
Sintesa
Nahdlatul Ulama
Chapter 2 Individual characteristics and donation behavior
62
displaying benevolent preferences, 16% and 13% displaying egalitarian and malevolent
preferences, respectively. In contrast, we find that a high percentage, 28%, of participants display
at least weakly malevolent preferences in both domains (malevolents) and 36% prefer equal
payoffs even at a loss to themselves (egalitarians). In stark contrast to other studies, we find a
very low percentage (<5%) of participants that display (even weak) benevolent preferences. Just
as a reminder, to be considered “benevolent” the individual decides to move from the equal
payout option (10.000 for both) to the payout option where she makes the same amount (10.000)
but the other participant would earn more (13.000). Although less than 5% of our sample
population chose this option, which has no effect on their own pay out, 88% of the total sample
gave something to charity. It is noteworthy that the assessment of distributional preferences
focuses on allocation of resources between self and another person (rather than a group). This
raises questions as to whether the motivations for behaving altruistically towards similar
individuals are activated by different mechanisms than the motivations that drive giving to
charity. Are these results driven by the difference in giving to individuals versus giving to groups
(organizations) or the difference between giving to people similar to you versus the neediness
represented by charity? Although we cannot answer what drives this difference from our results,
we contribute to the literature on stability of preferences across domains (De Oliveira, Croson,
and Eckel 2009, Luccasen and Grossman 2017) and we believe this is an area worthy of further
research in understanding motivations across domains.
Of particular interest to environmental resource management, the implications of these results
shed light on interpretations regarding giving to public goods based on how individuals behave in
experimental games (Schumacher et al. 2016). The context of most experimental social dilemma
games generally involves decisions about resource allocation between small groups comprised of
anonymous, yet similar or familiar individuals (i.e. university students, or members of the same
community/village). Based on the results of the distributional preference task alone, we would
have a very different impression of the cooperative nature of our sample. Instead, we observe
plenty of people in our sample who behave selfishly, even spitefully, when making choices of
how to distribute resources between themselves and anonymous others in the experiment, but
then generously contribute to real public goods.
There is strong evidence in the charitable giving literature that ‘warm glow’ giving (i.e. giving to
feel good) is a powerful strategy to motivate donors (Andreoni 1990, Brown, Meer, and Williams

Chapter 2 Individual characteristics and donation behavior
63
2013, Crumpler and Grossman 2008) but this discussion does not seem to have garnered much
attention in the environmental conservation literature (Hartmann et al. 2017). This is relevant to
marine management in that strategies directed to appeal to the sense of ‘warm glow’ and similar
motivations can be used to increase conservation participation by local resource-users. This can
be achieved through framing marine conservation communications to appeal to ‘warm glow’ or
to build upon social norms surrounding the personal benefits of participation and involvement.
For encouraging volunteers, identifying the value of an individual’s time contributions to the
community can help validate the activities. The organization ‘Rare’ provides interesting
examples by focusing their conservation efforts using the principles of social marketing. In a case
in Madagascar, they focus on ‘pride in being responsible fisherman’ in much the same way we
are advocating to focus on the moral satisfaction gained from prosocial behavior (Andriamalala et
al. 2013). Following the scientific trend towards integration, just as marine protected areas
require inclusion of local resource-users in management (Oracion, Miller, and Christie 2005,
Christie and White 2007), we suggest putting the resource-users and their needs at the center of
the local conservation campaign messaging and goals.
Controlling for other factors, the behavior of individuals in the distributional preferences
elicitation task is highly indicative of whether an individual will decide to donate any amount. As
intuition would suggest, and as is confirmed by the results, those individuals that display own-
money maximizing and malevolent behavior are less likely to donate any amount at all. However,
once they decide to donate (and many do), there is no significant difference between them and the
egalitarians in the amount they donate. This is an important contribution to the literature on
giving to environmental goods. If self-interested people can be motivated to give, perhaps by
appealing to their interests, they will give generously.
The importance of this study is to shed light on the relationship between distributional preference
types and donation behavior. We find that even though malevolents and own-money maximizers
are less likely to donate than egalitarians, many of them are still giving to charity. There is a
plethora of literature showing that selfish motivations drive free-riding behavior but there is also
considerable evidence to support that selfish motivations, such as moral satisfaction or feeling
good (‘warm glow’), motivate giving to public goods (i.e. charity). We recommend practitioners
apply the ‘warm glow’ theory from charitable giving literature to encourage people to locally
provision public goods by voluntarily contributing to conservation. Moving toward more rigorous

Chapter 2 Individual characteristics and donation behavior
64
experimental field methods to document, measure, and evaluate changes in attitudes and behavior
provides us with a better understanding of individual decision-makers, and ultimately helps
policy makers to design more effective interventions aimed at increasing both the likelihood that
an individual will contribute and the amount they will give.
3.10 Conclusion
Our results suggest that distributional preferences are an important explanatory control variable
for donation behavior. Conservation appeals should take into consideration the psychographic
characteristics of the community addressed when focusing on motivating local resource users.
Specifically, the issue should be explored of whether different kinds of approaches might be more
or less effective at engaging different segments of the population in conservation. Thus further
investigation is needed, not into segmentation for different types of charities but into the scope
for segmentation for different types of engagement techniques (Schlegelmilch and Tynan 1989).
In the community studied in this research, a message reinforcing the personal benefits to
resource-users (i.e. increased moral satisfaction, ‘warm glow’ feeling, pride for sense of
responsibility, etc.) would capture a large percentage of the intended audience. This could be a
useful insight in crafting communications on environmental impacts and benefits for marine
resource users. Additionally, this research helps to bridge the gap between the research on open-
access resource management and charitable giving by using experimental methods that reveal the
factors motivating collective behavior among resource users.

65
Chapter 3
4 Soliciting voluntary user fees
Extending the scope of voluntary marine park user fees to terrestrial
conservation across coupled land-sea ecosystem boundaries
Nelson, K. M., Partelow, S. Schlüter, A.
*Submitted January 20, 2018. Journal of Environmental Management. In review.
4.1 Introduction
Coastal and near shore marine areas are invaluable to humankind. The coastal zone is generally
accepted as the land-sea interface extending from the inland margin of the coastal plain to the
continental slope waters offshore. This region, although it represents less than 10% of the earth’s
surface, is home to over 40% of the world’s human population (CIESIN 2013), is as biologically
diverse and productive as any system on Earth, and supports viable economic activities from
fisheries to mining to tourism (Adger et al. 2005, Kummu et al. 2016, Moberg and Folke 1999).
Despite global recognition of the importance of coastal ecosystems, they are often overexploited
and misused (Cloern et al. 2016, Jackson et al. 2001). The unsustainable use and degradation of
marine and coastal ecosystems threatens human development and well-being. These threats are
driven by proximate local to regional human activity such as overfishing, pollution, and
development. Simultaneously, distal anthropogenic stressors from climate change are threatening
coastal systems with rising ocean levels, increased ocean temperatures, ocean acidification, and
increased severe weather events (Cloern et al. 2016). Holistic and appropriately funded
management of coastal systems that can account for the variety of human activities occurring on
land and at sea is a key determinant in the resilience of an area to withstand stress and recover
from threats (Dutra et al. 2015).
4.1.1 Management across land-sea ecosystem boundaries
Threats across coupled boundaries are pervasive in most coastal ecosystems, making their
consideration essential for successful management. There has been a push for more integrated
conservation management across land-sea ecosystem boundaries in the last decade; however,

Chapter 3 Soliciting voluntary user fees
66
there are few examples of land-sea conservation projects in practice (Alvarez-Romero et al.
2011, Pittman and Armitage 2016, Reuter, Juhn, and Grantham 2016). Tallis, Ferdana, and Gray
(2008) concede that if conservation planning ignores cross-system interactions it may
(unintentionally) leave populations and ecosystems at high risk from external threats. Effective
management can generate significant gains in environmental conservation, however, lack of
funding to enforce regulations is a common issue shared across many protected areas throughout
the world (Lundquist and Granek 2005, Rife et al. 2013). Additionally, the link between
terrestrial-to-marine conservation and regulation is often non-existent (weak at best), even
though many stressors faced by marine ecosystems are generated on land, such as sedimentation
from land erosion, and pollution from waste run-off (Álvarez‐ Romero et al. 2013, Partelow, von
Wehrden, and Horn 2015, Reuter, Juhn, and Grantham 2016, Roberts et al. 2002).
Generally speaking, the most vulnerable coastal systems tend to be in densely populated and
poor countries in the tropics. According to the IUCN (2017), three quarters of the world’s
population living in vulnerable coastal zones call Asia home. Many of these people live on
coastlines of the Coral Triangle, depending on healthy coastal ecosystems for their survival.
Coastal ecosystems within the Coral Triangle such as coral reefs, mangroves and seagrass beds
provide food, building materials, coastal protection, industries such as fishing and tourism, and
many other benefits for millions of people (Hoegh-Guldberg et al. 2009). However, tropical
coastal research does not emphasize its research focus on all ecosystems and human impacts
equally, with considerable gaps on social-ecological interactions and land-sea connectivity
(Glaser et al. 2012, Partelow, Schlüter, von Wehrden, et al. 2017).
Indonesia, situated at the center of the Coral Triangle, represents some of the highest levels of
marine biodiversity and is considered a strategic area for marine conservation efforts by
international organizations such as The Nature Conservancy, Conservation International, and the
World Wildlife Fund. Gross domestic product (GDP) from coastal- and marine-based tourism in
Indonesia is increasing each year, suggesting that the economic incentives for conservation are
becoming progressively more important for the national and local economy. Tourism helps to
diversify local economies away from exploitation of natural resources. Ironically, the
characteristics of pristine nature that attract tourists are also the most impacted by the unchecked
growth in development (Arkema et al. 2015, Hampton and Jeyacheya 2015). The present state of

Chapter 3 Soliciting voluntary user fees
67
coastal ecosystems in Indonesia and the rest of the Coral Triangle is bleak and immediate action
is necessary to halt further degradation (Treml et al. 2015). Mobilizing adequate resources and
capacity is essential for successful management plans that conserve the ecosystem (Sterling et al.
2017, Whitney et al. 2017).
Marine Protected Areas (MPAs) are the dominant management strategy employed for marine
conservation; yet, MPAs rarely incorporate terrestrial-based regulations that have a direct impact
on the marine environment (Adams et al. 2014, Gilby et al. 2016, Thur 2010). Additionally,
many of these parks exist mostly as ‘paper parks’16
due to a lack of proper planning (Halpern
2014) and funding (Gelcich et al. 2013, Terk and Knowlton 2010). Some exceptions exist,
including Komodo National Park where both terrestrial and marine resources are a major
attraction for visitors, but generally terrestrial conservation issues are left out of MPA planning.
Establishing MPAs for coral reef ecosystems brings additional challenges as the majority of the
world’s reefs are situated off coasts that are often characterized by high growth rates, intense
development for tourism, weak state governance institutions, and a lack of sufficient funding for
conservation.
4.1.2 Financing management through user fees
The management of MPAs can be financed through a combination of instruments, including
government support, donor funding, and user fees. Due to insufficient and uncertain long-term
funding for marine conservation, self-financing mechanisms that augment other types of funding
are popular in protected areas (Gelcich et al. 2013, Nelson, Schlüter, and Vance 2017b). For
example, environmental user fees are widespread across terrestrial National Parks to fund
conservation (Bernard, de Groot, and Campos 2009, Dharmaratne, Sang, and Walling 2000).
Marine Protected Areas that are frequented by divers, wildlife enthusiasts, travelers, and
recreational anglers have also generated considerable income through user fees (Edwards 2009).
However, marine park user fees are often imposed on one type of user (i.e. divers, whale
watchers, etc.) and rarely incorporate a universal fee across multiple use types, including passive
use (i.e. people staying in nearby hotels, golfers, beach-goers, and others that may not directly
16 The term "paper park" is defined as, "a legally established protected area where experts believe current protection activities are insufficient to
halt degradation." (Dudley and Stolton 1999)

Chapter 3 Soliciting voluntary user fees
68
enter the marine space). The terrestrial coastal area of marine parks cannot be de-coupled from
the sea area of the marine park. Expanding fees to all users is particularly important on many
small island destinations as they transition from mostly marine-focused tourism to multiple-use
tourism (Partelow and Nelson forthcoming).
Understanding how users value ecosystem services and benefit from ecosystem quality enables
fees to reflect user preferences (Arkema et al. 2015). Few studies, however, have attempted to
measure user preferences across ecosystem boundaries (Dharmaratne, Sang, and Walling 2000,
Gelcich et al. 2013). One exception is a recent publication by Roberts, Hanley, and Cresswell
(2017) which focuses on understanding divers’ willingness to pay a user fee for terrestrial
biodiversity conservation in connection to an MPA and linked marine conservation. However,
focusing solely on diver willingness to pay ignores the large and important population that
frequent coastal travel destinations and impact the ecosystem considerably – all the other users
that travel to the destination but may not dive. An area that hasn’t received much attention in the
literature is the scope for soliciting marine park user fees from all visitors regardless of their use-
type based on the premise that all visitors to the area use and impact the coupled land-sea
ecosystem boundaries and should therefore contribute to its maintenance. The concept of a
designated park area imposing fees on all visitors regardless of use-type is not unique and is used
extensively for terrestrial areas, such is the national park model. However, this is much less
common in marine park areas and is especially important to consider as an area develops and
transitions from mostly marine-focused tourism that can be sustained by single-use fees (i.e.
diver fees) to multiple-use tourism as non-divers far outnumber divers (Partelow and Nelson
forthcoming).
Contingent valuation studies are widespread and well accepted in determining the willingness to
pay for park fees (Asafu-Adjaye and Tapsuwan 2008, Mathieu, Langford, and Kenyon 2003,
Peters and Hawkins 2009, Togridou, Hovardas, and Pantis 2006). However, these studies rarely
focus on the method of asking for payment which can have a strong influence on effectiveness of
payment systems. This is especially important when the user fees are voluntary payments
(Dharmaratne, Sang, and Walling 2000, Rivera-Planter and Muñoz-Piña 2005, Stithou and
Scarpa 2012). Many protected areas function without formal governance wherein community-
based institutions lead conservation efforts and require funding to do so (Alexander, Andrachuk,
and Armitage 2016, Maliao, Pomeroy, and Turingan 2009). This funding can come from

Chapter 3 Soliciting voluntary user fees
69
voluntary donations for use of protected areas (Alpizar, Carlsson, and Johansson-Stenman 2008).
Understanding human behavior in relation to voluntary fund raising or payments for
environmental use is important to determine the most effective way to request a donation and
how much to ask for (i.e. reference amounts) which affects total contribution amounts. There is a
need for more studies that provide empirical evidence of voluntary contributions for
environmental conservation, and from the broader social sciences to better understand human
dimensions of marine and coastal management (Bennett et al. 2017, Chan et al. 2007).
Behavioral field experiments provide a powerful methodological tool to vary the donation
conditions using controlled methods with actual users and real payments to observe the variation
in and degree of participation in fundraising schemes.
The purpose of this research is to gather evidence for the most effective method to solicit
voluntary contributions from tourists to support land-sea conservation in MPAs which struggle to
finance community-based efforts. This study provides practical results for how to increase
conservation financing, with direct implications at a local-level and at a broad scale. Using a case
study in Indonesia, we provide a novel examination of voluntary land-sea conservation financing
through engaging all types of users visiting a small tropical island. A natural field experiment
reveals price preferences under four treatments based on real contributions to a conservation
organization. The treatments have been designed based on the literature that empirically
investigates methods for encouraging pro-social behavior, such as charitable donations and organ
donations (Bekkers and Wiepking 2011, Johnson and Goldstein 2003, Johnson, Bellman, and
Lohse 2002, Johnson and Goldstein 2004, Briers, Pandelaere, and Warlop 2007). To the authors’
knowledge this is the first record of such combination of treatments being used in soliciting
contributions for environmental conservation. Each participant was exposed to one of the four
treatments displayed in Table 8. The results provide evidence for an acceptable donation amount
to inform the implementation of a tourist eco-fee and the best method to introduce this fee to
encourage the highest amount of total contributions. Although the amounts are case specific, the
treatments are generalizable given the variation indicating differences in solicitation success.

Chapter 3 Soliciting voluntary user fees
70
Table 8 Field experiment treatment conditions and descriptions
Treatment Description
Control Open-ended write-in amount
Reference price levels Choice of four suggested contribution amounts or write-in
Default opt-in Check box to contribute set amount
Default opt-out Check box NOT to contribute set amount
4.2 Fundraising Literature Review
When faced with a request for donation, typically two decisions are made. A person must decide
whether to donate at all, followed by the decision about the amount to be donated. The
effectiveness of any campaign to solicit voluntary contributions depends upon the ratio of those
giving as well as the magnitude of the donations (De Bruyn and Prokopec 2013). Many
mechanisms can influence the ratio and magnitude of donations (Bekkers and Wiepking 2011).
We use the assimilation–contrast theory (Sherif, Taub, and Hovland 1958) and heuristic decision
making (Gigerenzer 2008) to establish predictions about the effects of the treatment conditions.
The assimilation-contrast theory states that individuals evaluate a new stimulus using a reference
point that is based on other experiences. An amount that is close to their reference point is then
accepted, whereas an amount that is far from their reference point is rejected. Thus, a donor
decides to donate depending on whether she finds the suggested amounts acceptable or not (De
Bruyn and Prokopec 2013). Similarly, heuristic decision making employs the concept that less
can lead to more and, in this case, less thinking about giving leads to more giving. Providing a
set default donation amount removes the need to decide how much to give and situating the
amount close to a widely accepted reference point will lead to more people accepting the request
(Gigerenzer 2008).
4.2.1 Open-ended condition (Control)
The control condition is an open-ended approach which requires the participant to write-in an
amount they will pay for the eco-fee. Cooperating participants then actually donate their own
money as an eco-fee. Although the open-ended write-in method has been criticized in
hypothetical willingness to pay studies (Donaldson, Thomas, and Torgerson 1997, Arrow et al.
1993), it is a widely used and accepted method in understanding valuation and it has been shown

Chapter 3 Soliciting voluntary user fees
71
to be ‘valid’ in terms of the relationship of WTP to prior preferences and to factors indicative of
ability to pay, such as income (Bateman, Willis, and Garrod 1994, Loomis 1990). Additionally,
open-ended valuation method surveys combined with real contributions reduce strategic bias
overcoming many of the cognitive limitation problems noted in the literature, including
anchoring bias (Prince et al. 1992).
4.2.2 Reference price levels
A standard practice in donation requests is to present a set of suggested amounts, sometimes
referred to as ‘anchors’, ‘reference levels’, or ‘close-ended’ (Briers, Pandelaere, and Warlop
2007, Smith and Berger 1995). Anchoring is a well-known cognitive bias that affects decision
making based on a heavy reliance on the information offered (Van Exel et al. 2006). Affecting
donation amounts through the use of different reference levels is an extremely robust
phenomenon that appears in many contexts (De Bruyn and Prokopec 2013). Tversky and
Kahneman (1975) suggest that people are influenced by the presentation of specific values, or
reference levels, to help make decision judgments. They noted that people make heuristic
judgments relative to specific reference points to reduce decision processing and mental effort.
Brockner et al. (1984) found that when a specific dollar amount was mentioned in telephone and
face-to-face fundraising, subjects were more likely to comply and make a pledge than when no
amount was mentioned. Alpízar and Martinsson (2010) found that exposing potential National
Park donors to donation amounts of other visitors significantly increased the number of donors,
but did not increase the average individual gift compared to the control. Total average donations
increased due to the increase in share of donors. This is consistent with the conceptualization that
suggested reference points serve as decision heuristic anchors that allow donors to quickly infer a
range of reasonable gift amounts. Hence we propose that the presence of reference levels will
yield a greater ratio of donors compared to the control (H1) but there will be no difference in the
average amounts donated between the reference and control treatments (H2) (see table 9).
4.2.3 Default amount and opting-in versus opting-out
Default amounts act as single reference points, compared to the previous option where
participants receive a variety of recommended amounts. In direct marketing fundraising, it is
generally accepted (Brockner et al. 1984) that asking for a specific amount results in increased
cooperation compared to not mentioning an amount.

Chapter 3 Soliciting voluntary user fees
72
If transaction costs are small, standard economic theory would suggest that defaults should have
little impact on economic outcomes. People with well-defined preferences will opt-out of any
default that does not maximize their utility, regardless of the nature of the default. In practice,
however, defaults can have quite sizeable effects on economic outcomes. For example, switching
from a non-participation default (opt-in) to a participation default (opt-out) can increase
retirement saving participation rates by more than 50 percentage points (Choi et al. 2003,
Madrian and Shea 2001). This property of default options has been documented in a wide range
of other settings: organ donation decisions (Abadie and Gay 2006, Johnson and Goldstein 2004),
public goods (Altmann and Falk 2009), car insurance plan choices (Johnson et al. 1993), car
option purchases (Park, Jun, and MacInnis 2000), and consent to receive e-mail marketing
(Johnson, Bellman, and Lohse 2002).
Hence we propose that the ratio of donors will be higher in the opt-in default treatment compared
to the control (H3). And the opt-out default treatment will generate a higher ratio of donors than
the opt-in default (H4) (see table 9).
Table 9 Hypotheses
H1 The proportion of donors will be higher with the presence of reference levels compared to the control.
H2 There will be no difference between the average amount donated in the reference level and control
treatments.
H3 The proportion of donors will be higher in the opt-in default treatment compared to the control.
H4 The proportion of donors will be higher in the opt-out default treatment compared to the opt-in default
treatment.
4.3 Materials and methods
4.3.1 Study location
In choosing a location to study the willingness to pay a user fee for coupled land-sea ecosystem
conservation, we selected a site with high marine biodiversity and multiple-use criteria in a
limited area with clear boundaries and threats (Groves et al. 2000, Margules and Pressey 2000,
Tallis, Ferdana, and Gray 2008). The Gili Matra Marine Park is comprised of three islands lying
just off the Northwest coast of Lombok, Indonesia with Bali to the west (see Figure 20). The
islands are situated in the ‘Indonesian Through flow’ (see Figure 20b). This is an ocean current

Chapter 3 Soliciting voluntary user fees
73
pathway that connects the Pacific to the Indian Ocean and hosts an immense amount of
biodiversity.
Figure 20: (a) Map of Indonesia with Coral Triangle highlighted in blue and Bali and Lombok area circled in black, (b)
Gili Islands circled and Indonesian Throughflow marked, (c) map of Gili Islands and Gili Matra Marine Park
highlighted. Source: Google (2017).
The study took place on Gili Trawangan, the largest and most populated of the three Gili Islands
(Figure 20c). The island receives heavy tourist traffic, up to 2000 new visitors per day and
approximately one million tourists visit annually. Although the island is only six square
kilometers, it has more than 750 businesses and is the most the most developed of the three
islands. The Gili Islands have long been a backpacker destination, and over the last decade the
islands have grown into a major destination for tourists of all budgets and interests. Gili
Trawangan is the second most frequented destination in South East Asia for scuba diving
certification (second only to Koh Tao in Thailand). The increase in tourism is resulting in rapid
development, challenging the infrastructure on the island to keep up with the growth (Partelow
and Nelson forthcoming). All food, drinks, consumable goods, and amenities must be imported
and the daily waste generated by the thousands of tourists, restaurants, hotels, dive shops, and
other businesses remains on the island and ends up in the landfill. The landfill is currently far
over capacity with no current plans by the local government to address waste reduction, develop
collection or recycling infrastructure or to finance its management. Solid waste pollution and air
pollution from burning waste are a major environmental issue for the island and surrounding
marine habitat, creating an impending crisis.
Bali Bali

Chapter 3 Soliciting voluntary user fees
74
The marine park does not currently have a government sanctioned fee for entry. At present, an
eco-fee is imposed only on divers as a collective agreement between dive shops. Each diver pays
a voluntary one-time fee of 50,000IDR (approximately $3.75USD). The fees support the
community-based conservation organization, Gili Eco Trust. The Gili Eco Trust is a non-
governmental organization (NGO) that was created in 2000 by a group of local dive shops to
protect and restore the coral reefs from destructive fishing. At the time it was founded, dynamite
and cyanide fishing proliferated and the funds were used to pay for local patrols and reef
restoration. Over the years, destructive fishing practices decreased as tourism rapidly increased
and environmental threats shifted to terrestrial generated issues such as erosion from coastal
development and solid waste pollution.
Although only divers are currently paying for the eco-fee, which represent about 15% of all
tourists on the island, all visitors contribute to the impact on the ecosystem and benefit from its
quality. Recognizing the waste problem, the Gili Eco Trust expanded their services to land-based
conservation through provision of the only sustainable waste management services available on
the island. They established a ‘rubbish bank’ which provides payment for selected recyclable
waste, thereby creating incentives for properly disposing waste while reducing the environmental
impact of waste. Additional services they provide include: training to local businesses on sorting
garbage for recycling; distributing recycle bins; collecting recyclables and organic compost;
transporting recyclable material off the island; sourcing sustainable materials for local
businesses; organizing weekly island clean-ups; and producing communication materials for eco-
friendly tourism. Recently, in April 2017, they acted as the de facto waste collection service
during a collapse of the local waste company due to allegations of corruption. This much needed
transition into land conservation has not been matched by a transition to a universal eco-fee paid
by all tourists, which reflects the magnitude of services the Eco Trust now provides beyond the
marine realm. Many of the dive shops and hotels are supportive of a universal eco-fee paid by all
tourists but there is disagreement on how to implement the eco-fee and how much to charge.
This issue motivated the research in this paper.

Chapter 3 Soliciting voluntary user fees
75
4.3.2 Methods
4.3.2.1 Sampling
There is no central daily record of tourists visiting Gili Trawangan so a random sampling method
was not possible. Therefore, a convenience sampling method was employed. This method does,
however, capture a representative sample of the tourist population on the island. Tourists gather
in the harbor area on Gili Trawangan as they wait for boats departing the island on an hourly
basis throughout the day. The harbor area provides the best possibility for a natural semi-random
sample. The overwhelming majority of tourists arrive and depart the island from the harbor area
(except the few (<1%) that arrive directly to the resort by private boat) representing a wide
variety of ages, nationalities, budgets, and interests.
592 tourists were surveyed from March 2017 to May 2017. We partnered with the local NGO,
the Gili Eco Trust, to design the survey and recruit research assistants. The trained research
assistants would visit the harbor daily to conduct the donation surveys. They identified
themselves as students interning at Gili Eco Trust and working on a research project. They
notified all people that participation was completely voluntary. If people agreed to participate,
they were provided with a survey printed on the front and back of a half sheet of A4 paper (see
Appendix F). There was a wooden box painted with the logo of Gili Eco Trust with a slit in the
top that the research assistant used to collect the surveys and any donations the participants
wished to give to the Gili Eco Trust. Although respondents were aware they were participating in
a research study, they were unaware that there were randomly assigned treatment groups.
Requests for further information regarding the activities and purpose of the Eco Trust were
responded to by providing a pre-printed one-page guide on efforts of the organization to avoid
bias in explaining more in-depth to some tourists and not others which might have influenced
donations.
4.3.2.2 Survey Design
The survey instrument was refined following exploratory research and open-ended interviews
with several hotel and dive managers as well as the staff of Gili Eco Trust providing feedback on
the fee amounts and survey questions. In addition, fifty-two pilot surveys were conducted
between March 25 and March 30, 2017 enabling further refinement of the questions, survey

Chapter 3 Soliciting voluntary user fees
76
design, and payment amounts. Specifically, we lowered the default amounts from 50,000IDR to
10,000IDR based on feedback from the pilot surveys. To maintain anonymity, no identifying
information was collected from participants. The survey instrument was comprised of a
combination of multiple choice and questions based on a Likert ordinal response scale.
Additionally, basic sociodemographic and travel information was collected.
We employed a between-subjects randomized design meaning that each participant was
subjected to only one randomly-selected treatment. There were four treatments which we refer to
as: control, reference levels, default opt-in, and default opt-out. The control treatment required
the respondent to write-in an amount they wished to contribute to the Gili Eco Trust. Participants
that failed to write anything in the control were automatically appointed as giving zero. The
reference level condition consisted of three suggested contribution amounts: 10,000IDR,
20,000IDR, 50,000IDR and a blank write-in option. The default was set at 10,000IDR
(approximately $0.75USD), informed by our pilot study. The default opt-in required that the
participant check the box that they wished to contribute the set amount of 10,000IDR. The
default opt-out condition required that the participant check the box if they did not want to
contribute the set amount of 10,000IDR.
4.4 Results
4.4.1 Descriptive statistics of sample
The descriptive statistics of the sample population are shown below in Table 10. The sample was
comprised of slightly more females (58%) than males (42%). The majority of participants (62%)
were from the European continent (including UK and Scandinavia). Sixty-nine percent of
respondents were between the ages of twenty-one and thirty-two. The average number of days
spent on Gili Trawangan was 4.4 days with a standard deviation of 6.8 and a minimum of one
day and maximum of one hundred days. Given the wide range of nationalities traveling to Gili
Trawangan, collecting information on monthly or annual income was avoided due to confusion
in recording the data based on different currencies that may have been reported. Rather, we use
the hotel price and type as a proxy for traveling style and income. The majority of respondents
(>65%) stayed in hotels that we have identified as either ‘High-end’ or ‘Luxury’. ‘High-end’ was
defined as hotels that cost between 400,000-700,000IDR per night (approximately $30-
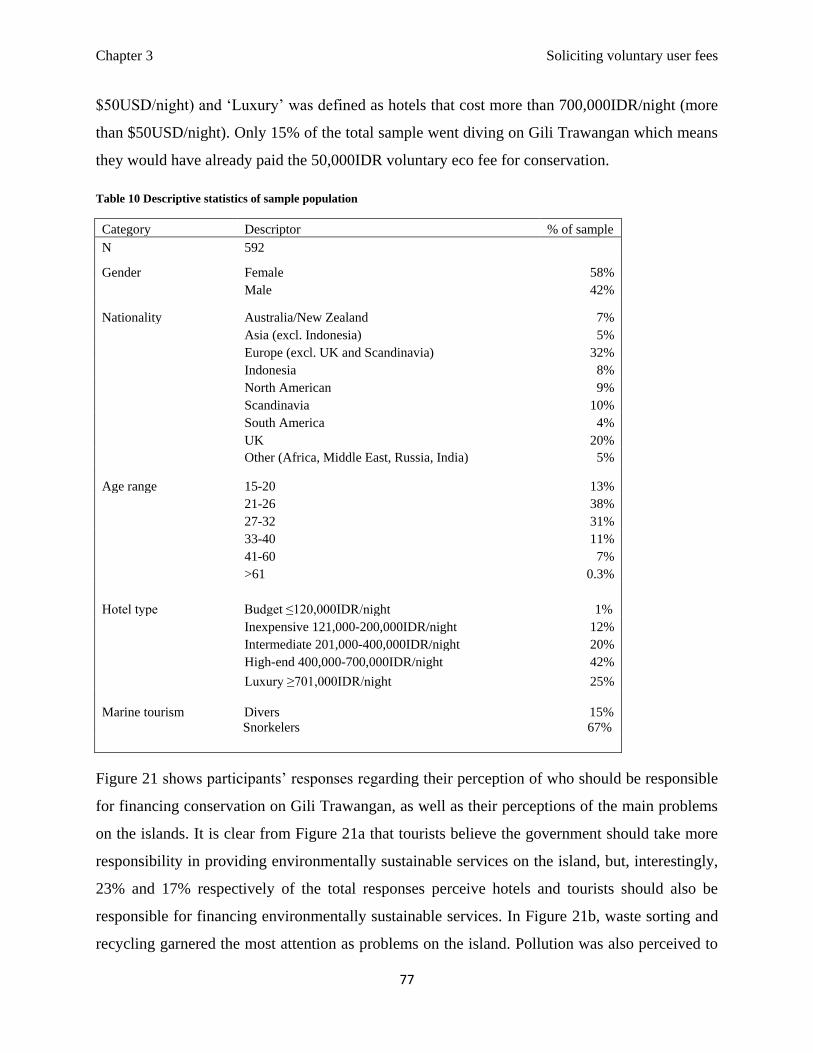
Chapter 3 Soliciting voluntary user fees
77
$50USD/night) and ‘Luxury’ was defined as hotels that cost more than 700,000IDR/night (more
than $50USD/night). Only 15% of the total sample went diving on Gili Trawangan which means
they would have already paid the 50,000IDR voluntary eco fee for conservation.
Table 10 Descriptive statistics of sample population
Category Descriptor % of sample
N 592
Gender Female 58%
Male 42%
Nationality Australia/New Zealand 7%
Asia (excl. Indonesia) 5%
Europe (excl. UK and Scandinavia) 32%
Indonesia 8%
North American 9%
Scandinavia 10%
South America 4%
UK 20%
Other (Africa, Middle East, Russia, India) 5%
Age range 15-20 13%
21-26 38%
27-32 31%
33-40 11%
41-60 7%
>61 0.3%
Hotel type Budget ≤120,000IDR/night 1%
Inexpensive 121,000-200,000IDR/night 12%
Intermediate 201,000-400,000IDR/night 20%
High-end 400,000-700,000IDR/night 42%
Luxury ≥701,000IDR/night 25%
Marine tourism Divers 15%
Snorkelers 67%
Figure 21 shows participants’ responses regarding their perception of who should be responsible
for financing conservation on Gili Trawangan, as well as their perceptions of the main problems
on the islands. It is clear from Figure 21a that tourists believe the government should take more
responsibility in providing environmentally sustainable services on the island, but, interestingly,
23% and 17% respectively of the total responses perceive hotels and tourists should also be
responsible for financing environmentally sustainable services. In Figure 21b, waste sorting and
recycling garnered the most attention as problems on the island. Pollution was also perceived to

Chapter 3 Soliciting voluntary user fees
78
be a problem on the island, and, if these are combined, waste issues make up 39% of the
perceived issues on Gili Trawangan - far more than any other issue. Issues pertaining to
terrestrial conservation (including beach erosion, pollution, and waste build-up due to lack of
recycling services) make-up 46% of the perceived problems on the island while marine
conservation makes up 15% of the perceived problems.
Figure 21 Tourist perceptions of 21(a) of who should pay for environmentally sustainable services, and 21(b) problems on
Gili Trawangan. Note: *Motorized vehicles are prohibited on the island and therefore traditional horse carts provide
transportation and hauling of materials around the island, hence the perception of animal welfare as an issue.
Figure 22 provides descriptive statistics based on tourists’ personal experiences and perceptions
of environmental management on Gili Trawangan. Although the overwhelming majority (89%)
of respondents had a positive overall experience and would recommend the island to a friend
(Figure 22a) most disagreed that the island is environmentally sustainable. Figure 22b shows
that more than half of respondents disagreed that the businesses on the island were
environmentally conscious offering alternatives to single-use plastic. Sixty-nine percent of
respondents disagreed that the current system of waste collection and recycling is functioning
(Figure 22c) and 61% disagreed that the streets, beaches, and public areas are clean and free of
pollution (Figure 22d). Fifty-seven percent of respondents disagreed that the marine ecosystem
and marine pollution are effectively managed compared to the 37% of respondents that agreed
the marine ecosystem is effectively managed (Figure 22e). We observe that 77% of participants
agree there should be a tourist eco-fee to ensure that environmental sustainability is practiced on
Gili Trawangan (22f).
6%
13%
15%
17%
23%
27%
Privatize
Other businesses
Dive shops
Tourists
Hotels
Government
Who should pay for environmentally sustainable services?
2%
4%
4%
5%
6%
7%
15%
17%
18%
22%
Rules not enforced
Corruption
Safety/security
No govt involvement
Infrastructure
Beach erosion
Marine reef restoration
Pollution
Animal Welfare*
Waste sorting/recycling
Tourist Perceptions of Problems 21(a) 21(b)

Chapter 3 Soliciting voluntary user fees
79
Figure 22 Perceptions of environmental management and personal experience on Gili Trawangan
4.4.2 Treatment comparisons
We find that the willingness to contribute to the conservation organization increases significantly
with the treatments (see Figure 23a). Using a two-sided binomial probability test, the data show
that the probability of making a donation is significantly higher at p<0.01 in all treatments
(default opt-in, default opt-out, and reference levels) compared to the control condition. When
comparing the default options to each other, the opt-out treatment results in significantly higher
compliance compared to opt-in (p<0.01). The default opt-in and the default opt-out both have
significantly higher compliance rates than the reference level condition (p<0.01).
0%
10%
20%
30%
40%
50%
60%
Stronglydisagree
Disagree Neither Agree Stronglyagree
Good overall experience/would recommend to a friend
0%
10%
20%
30%
40%
50%
60%
Stronglydisagree
Disagree Neither Agree Stronglyagree
Environmentally conscious businesses
0%10%20%30%40%50%60%
Stronglydisagree
Disagree Neither Agree Stronglyagree
Waste collection/recycling functioning
0%10%20%30%40%50%60%
Stronglydisagree
Disagree Neither Agree Stronglyagree
Streets/beaches/public areas clean from pollution debris
0%
10%
20%
30%
40%
50%
60%
Stronglydisagree
Disagree Neither Agree Stronglyagree
Marine ecosystem and pollution effectively managed
0%
10%
20%
30%
40%
50%
60%
Stronglydisagree
Disagree Neither Agree Stronglyagree
Tourist eco-fee should be required
22(a) 22(b)
22(c) 22(d)
) 3c)
22(e)
) 3c)
22(f)
)
3c)

Chapter 3 Soliciting voluntary user fees
80
Using a Fisher’s exact test, we analyze gender differences in the decision of whether or not to
donate under the treatment conditions (see Figure 23b). The ‘reference level’ treatment is the
only treatment in which we observe significant differences (p<0.01) between men and women in
the decision to donate. Only 24% of females chose to donate under the ‘reference level’
treatment compared to 44% of males that donated. The probability of compliance between
females in the control treatment (21%) and the reference level treatment (24%) are not
significantly different using the binomial probability test.
Figure 23(a) Percentage of sample that donated by treatment, and 23(b) percentage of men and women that donated by
treatment. Note: **p<0.01 difference between percentage of men and women donating in the reference level condition
Using bootstrapped t-tests, we compare the average donation amount (including those that gave
nothing) given under the different treatment conditions (see Figure 24a). The average amount
donated was higher in the default treatments compared to the control but the difference is only
significant in the opt-out treatment (p<0.05). The mean amount donated in the default opt-in and
default opt-out conditions are significantly different from each other (p<0.01). The average
donation amount in the control compared to the reference level treatment is weakly significant at
p<0.10. There are no differences between the mean amounts donated in the default opt-in or opt-
out treatments compared to the reference level condition.
Similarly, we compare the average donation amounts conditional on giving (see Figure 24b).
When we analyze mean amounts based only on those that donated something, we observe higher
average donation amounts in the control and reference level treatments compared to the set
default amount (p<0.01). There are no significant differences in the mean amounts given
19%
32%
48%
68%
Control Referencelevel
DefaultOpt-in
DefaultOpt-out
Percent of people that donate
21% 24%
48%
68%
15%
44% 48%
69%
Control Referencelevel**
DefaultOpt-in
DefaultOpt-out
Percent of donations by gender
Female Male
23(a) 23(b)

Chapter 3 Soliciting voluntary user fees
81
between the control and reference level conditions when analyzed conditionally on giving a
donation. Likewise, there are no differences in the mean default amounts conditional on donating
but this is to be expected considering the default was set at 10,000IDR in both the default opt-in
and default opt-out. Therefore, the differences observed in the total mean donations (24a)
between the default treatments are driven solely by a difference in propensity to donate.
Figure 24(a) Mean amounts donated by treatment, and 24(b) mean amounts donated based on donating a non-zero
amount. Note: a,b
superscript letters denote significance between treatments. Treatments that share the same superscript
letter do not significantly differ from each other at p<0.05.
The total donations received by the Gili Eco Trust were highest in the default opt-out treatment
(see Figure 25). When analyzing only those that donated, even though the average amount
donated in the default treatments was about half of the average amount donated in the control
and reference levels, the total amount received by the Gili Eco Trust was highest in the default
opt-out condition due to the increased propensity to donate in the default opt-out treatment.
Simply put, more people give but they give smaller amounts on average. The smaller average
amounts are explained by the fact that the default amount was set at 10,000IDR so the
respondent only had to make one decision of whether to donate or not. Although the default
methods prove to be more successful in ensuring donation compliance, the set default amount
may be too low based on the higher mean donation amounts observed in the control and
reference level treatment. Although 20% fewer respondents donated, the total amount received in
the reference level treatment is comparable to the default opt-out treatment.
3906a
4863a
6343ab 6822b
Control DefaultOpt-in
Referencelevel
DefaultOpt-out
Mean donation by treament
10000a 10000a
19750b 20667b
DefaultOpt-in
DefaultOpt-out
Referencelevel
Control
Mean conditional on donating 24(a) 24(b)

Chapter 3 Soliciting voluntary user fees
82
Figure 25 Total donations received by Gili Eco Trust.
Note: Amounts reported in Indonesian Rupiah (1000IDR=$0.07USD)
4.4.3 Two-part model: Probit and Ordinary Least Squares Regression
To assess whether the above findings are robust to the inclusion of control variables, we analyze
the data using a two-part model developed by Cragg (1971). The first part of the model employs
a probit analysis to define what factors determine whether a person will donate, while the second
stage of the model uses an ordinary least squares (OLS) regression to identify which factors are
responsible for how much a person donates – once they have made the decision to donate.
The first column in Table 11 excludes the treatment variables so we may observe if any of the
control variables are relevant. We analyzed several models including a variety of demographic
variables as independent variables with the decision to donate as the dependent variable. We
controlled for age, gender, continent of nationality, price of hotel (as a proxy for income),
number of days on the island, and activities. The only control variables that are statistically
significant determinants of the discrete donation decision are the continent of nationality and
activities. Therefore, we dropped insignificant variables and compared the fit of the models with
and without the aforementioned variables. The likelihood ratio test does not indicate a
statistically significant improvement (p=0.08) over the model that includes the entire suite of
control variables, therefore, for simplicity we have left all control variables except the continent
of nationality and activities out of the model in Table 11.
496,000
710,000
869,000 880,000
Control Default Opt-in Reference level Default Opt-out
Total donations to Gili Eco Trust

Chapter 3 Soliciting voluntary user fees
83
Table 11 Probit and Ordinary least squares regression model
Probit
Donation
Decision
Probit
Donation
Decision
OLS
Donation
Amount
OLS
Donation
Amount
N 546 530 230 224
Europe 0.000 0.000 0.000 0.000
North America 0.623 0.632 -1,244.689 -733.096
(3.20)** (3.03)** (0.62) (0.41)
South America -0.119 0.046 -3,474.084 -5,081.511
(0.41) (0.15) (0.89) (1.49)
Asia 0.349 0.456 -1,540.390 -3,931.840
(2.19)* (2.65)** (0.85) (2.28)*
Oceana -0.272 -0.392 2,891.757 4,569.442
(1.21) (1.63) (0.94) (1.71)
Biking 0.241 0.246 1,265.543 791.334
(2.15)* (2.04)* (0.90) (0.63)
Snorkel 0.159 0.220 2,283.165 1,405.407
(1.34) (1.73) (1.53) (1.05)
Dive 0.042 0.089 2,357.205 2,288.281
(0.28) (0.55) (1.27) (1.41)
Control 0.000 0.000
Default opt-in 0.904 -9,971.401
(5.23)** (4.63)**
Default opt-out 1.460 -10,675.376
(8.14)** (4.96)**
Reference levels 0.519 160.709
(2.92)** (0.07)
Constant -0.539 -1.359 10,627.389 18,914.914
(4.24)** (7.18)** (6.10)** (7.39)**
R2
0.03 0.26
z statistics in parentheses, * p<0.05; ** p<0.01
With Europeans serving as the base category, two nationality dummies have positive and
statistically significant coefficients - those respondents from North America and Asia. We
thereby find that respondents from North America and Asia are more likely to donate than
Europeans. Those respondents that went biking on the island were also more likely to donate
than those who did not bike. We do not find any statistical significance effecting the donation
decision if the respondents engaged in snorkeling or diving activities. The model in the second
column includes the treatment dummies with the control serving as the base category.

Chapter 3 Soliciting voluntary user fees
84
Confirming the results of the binomial probability test, all treatments have statistically significant
and positive coefficients compared to the control thereby indicating that there is a strong
treatment effect determining the discrete donation decision.
The third and fourth columns in Table 11 reveal the estimates from the OLS model of the
amount donated, contingent on donating a non-zero amount. None of the demographic control
variables (including the full suite of demographics: gender, age, hotel price, number of days on
island) have a statistically significant effect on the amount donated unless we include the
treatment dummies (fourth column) wherein respondents from Asia are revealed to donate a
significantly lower amount than Europeans. We analyzed the OLS models including all the
control variables and with the limited version using only the continent of nationality and
activities. The likelihood ratio test comparing the OLS regression models does not indicate a
statistically better fit (p=0.3) when the aforementioned suite of control variables are included,
therefore, they have been eliminated from the final models. When we include the treatment
dummies, we observe statistically significant and negative coefficients for both the default opt-in
and default opt-out conditions in comparison to the left out control variable.
4.5 Discussion and recommendations
4.5.1 Fund raising options and potential on Gili Trawangan
The results from this study reveal important information at a crucial time in the development of
Gili Trawangan. As recent as September 2017, the government discussed plans to impose a
tourist fee of 100,000IDR per person per day ($7.40USD). Our results provide evidence that an
appropriately priced and executed tourist eco-fee could have immense positive benefits but the
suggested fee of 100,000IDR per day could deter tourists from visiting the island if faced with
choices of many other islands with no fee. This may additionally undermine fund raising efforts
by local institutions, such as the Gili Eco Trust, who rely on self-organized financing to directly
invest in finding solutions to problems facing the island. Based on the results from our survey,
we find strong evidence that the majority of tourists do not perceive the island to be
environmentally sustainable under current management practices and that they are willing to pay
an eco-fee that is used to manage sustainable practices on Gili Trawangan. Tourists who biked
around the island were more likely to donate and this may be explained by the fact that biking

Chapter 3 Soliciting voluntary user fees
85
around the island exposes them to more of the challenges facing the island beyond comparatively
well-kept main tourist beach area. Thus more exposure to environmental problems may increase
the willingness to donate.
When respondents were given the choice to either write-in a donation amount or select an
amount from choices ranging from 10,000IDR to 50,000IDR, the average donation amount was
approximately 20,000IDR (~$1.50USD). However, a higher percentage of respondents selected
the 10,000IDR level in the reference treatment, such that the total revenue earned for
conservation was the same under the 10,000IDR level and the 20,000IDR level (see Figure 26).
The default donation price was set at 10,000IDR and both the opt-in and opt-out treatments
sustained higher willingness to donate compared to the control and reference level conditions.
However, the opt-out condition generated the highest percentage of donors resulting in the
highest overall revenue across all treatments (Figure 25). With the estimated number of around 1
million tourists visiting Gili Trawangan annually, a properly imposed eco-fee of 10,000IDR-
20,000IDR per person would result in a reliable and significant financing mechanism for both
terrestrial and marine conservation.
Figure 26 shows the potential cumulative annual conservation revenue based on the control and
reference treatments. At 10,000IDR, more people are willing to donate and therefore the revenue
is the same as giving at the 20,000IDR level. Although less people donate as the donation
amount increases, the total potential for fund raising does not drop off drastically until after
50,000IDR. These results could inform government ambitions to impose a fee of 100,000IDR,
which may actually raise less than a fee of 50,000IDR, if these results are interpreted as an upper
threshold for willingness-to-pay, or as an anchor point for decision making on whether to visit
the island if a fee was imposed.

Chapter 3 Soliciting voluntary user fees
86
Figure 26 The bars indicate the percent of tourists willing to donate at the amount indicated on the X axis in Indonesian
Rupiah and the markers indicate the estimated cumulative annual conservation revenue in USD based on the ratio and
magnitude of giving. *Estimate based on 1 million tourists visiting Gili Trawangan annually.
Given that the eco-fee is a voluntary payment and not a government imposed tax (at the present
time), our results indicate the most effective way to implement a voluntary eco-fee would be to
include the payment as a default opt-out condition. This option could be added to the cost of
accommodation or to the transport cost to the island. Given the hundreds of accommodation
options on the island and third-party payment sites (i.e. Booking.com), attaching the payment to
accommodations would introduce complicated logistical and regulatory requirements and the
potential for corruption. There are about ten to fifteen boat transport companies operating on Gili
Trawangan which are already regulated by a centralized transportation organization that requires
the daily manifest for all boats arriving and departing the Gili Islands. We would suggest that
each purchase of a boat transfer to the Gili Islands includes a default opt-out condition of a
10,000IDR eco-fee. This amount would be automatically added to the cost of the trip unless the
traveler specifically opts out of paying the eco-fee.
Interestingly, we observe significant gender differences in willingness to donate but only under
the reference level treatment (Figure 23b). Croson, Handy, and Shang (2010) find similar results
that men are more influenced by suggestion amounts than are women. Croson, Handy, and
Shang (2010) find that men are influenced by temporarily created social norms more so than

Chapter 3 Soliciting voluntary user fees
87
women. This gender difference, however, disappears in the default conditions when only one
reference amount is suggested providing further support of our recommendation to use the
default opt-out method for requesting donations.
4.5.2 Expanding the scope of financing for land-sea conservation
While the results from this study provide critical information for Gili Trawangan, this study can
additionally inform future research and practical approaches for financing land-sea management
by exemplifying the role that social science research can play in advancing conservation. We
show that extending community-based fees to all users of a land-sea area has the potential to
generate substantial revenue to finance conservation while keeping the price at a low enough
level to stay within what users are willing to pay. We also show that tourists are observant of
environmental impacts and are willing to contribute to mitigating them and that tourists are
willing to finance both NGOs and governmental organizations to do the work.
Understanding how tourists, and resources users more broadly, engage with and perceive
environmental problems is key for designing effective mechanisms for conservation, including
financing. The social sciences, which have historically been less influential in informing
conservation research and practice (Chan et al. 2007, Bennett et al. 2017, Partelow, Schlüter, von
Wehrden, et al. 2017) need to play a more substantial role in the future if land-sea conservation
efforts aim to be more effective. Behavioral economics, in combination with other social and
natural sciences, can make a key contribution to advancing conservation by better understanding
human behavior and decision making in relation to multi-use areas, such as the coast, where
preferences for donating and engaging with conservation efforts may vary by activity (Nelson,
Schlüter, and Vance 2017a). Creating more sustainable interactions between people and nature
on the coast will be in part dependent on how well we understand the role of human behavior in
relation to what activities people do, how they perceive potential problems and the solutions they
believe are viable and would be willing to support.

88
III. Concluding remarks

89
5 Concluding Remarks
5.1 Summary of research
The main purpose of this thesis was to examine the influence of specific intrinsic and extrinsic
factors on voluntary contributions to marine conservation. I chose to investigate the voluntary
contribution behavior of two distinct stakeholder groups, members of a fishing community and
tourists. I conducted three different studies to fulfill the objectives set out for this thesis research.
The thesis as a whole offers novel disciplinary and methodological contributions to the literature
on conservation science, charitable giving, and behavioral environmental economics.
The first part of the research focuses on donations of money and time. I used an experimental
setting to simulate a work scenario where participants were able to earn money by performing a
task. This allowed me to examine differences between giving money and time as participants
were divided into treatments where some had the opportunity to donate their time working so
their earnings would accrue to charity and others were able to donate their earned wages to
charity. Additionally, there were two more treatments wherein any donations of money or time
were matched by the same value and donated to the charity they chose. Contrary to the findings
of previous lab studies, participants from the Bajo Mola fishing community in Wakatobi National
Park, Indonesia gave more money on average than the same value in time. Additionally, more
people donated when the donations were matched although the average amount given did not
increase. In fact, in the monetary donation treatment, the average percent of earnings donated
significantly decreased in the match treatment compared to no match. There was no change in the
average percent of earnings donated between the matched time treatment and the unmatched time
treatment.
Some practical behavioral insights emerge from these results that could be useful for
conservation practitioners and the Wakatobi National Park. The results indicate that Bajo fishers
are willing to contribute to conservation and they give on average more money than time. The
overall donor base can be increased through offering matched donations for both money and
time. I cannot assume the long-term effect of monetary matching given that my results only show
a snapshot in time, but it is possible that with the increase in donor base there may be positive
effects over time for monetary donations even if the average individual amount given decreases
with the match. Announcing a match to volunteer time is recommended given there is no

Concluding Remarks
90
decrease in the average individual value of time donated and more people give overall. Therefore,
the total value of volunteer time to the charity is higher in the volunteer match treatment.
These results provide important behavioral evidence for funding local public goods in Wakatobi.
Additionally, this research gives some perspective of local resource users’ preferences for how
they might like to contribute to the provisioning of public goods. The prevalent approach to
conservation work in the field is to organize many community meetings and events to raise
awareness of environmental issues. This research shows that announcing and matching the value
of people’s time encourages more people to give. The data also show that people may prefer to
give money. Now, I am not recommending that NGOs count soliciting donations from fishers
into their major funding strategy but this shows that local resource users are willing to give to
public goods and this is a good start to understanding the relationship between giving behavior
and use of the environment. In doing so, this field experimental research approach contributes to
conservation science and behavioral environmental economics to provide a better understanding
of the voluntary behavior of resource users to provision environmental public goods.
I would also like to note the potential application of these results to a broader charitable giving
context but it is not without reserve given the uncommon population of my research sample.
Therefore, any more general applications should take into consideration the restrictions of such a
non-standard subject pool. Having said that, this research can offer empirical evidence in the
value of matching volunteer time where, otherwise, no scientific evidence exists. Given the
relative scarcity of research on matches to volunteer time, more lab and field experiments
examining the effect of matches on volunteer time are needed. I would now like to draw attention
to a common funding practice and potential missed opportunity in the non-profit sector. There are
two such applications of volunteer matching that would benefit from further scientific analysis: 1)
large funding grants are often contingent on matching from the NGO, and 2) corporate volunteer
matching.
It is common practice with large grants from international institutions, national governments, and
private foundations to require an NGO to leverage other resources to match the value of the
awarded grant (i.e. office space, supplies, equipment, personnel, services, training, fundraising,
volunteer time). These NGOs then rely on donations from an individual support base and depend
heavily on volunteer time to match the value of these grants. In many cases, there are strict

Concluding Remarks
91
reporting regulations for the NGO to the awarding institution. My research shows that
announcing funds as matched donations incentivizes donors to give time which leads to more
value generated for the NGO. Although, as previously mentioned, context is important and it is
unknown if the results from my research will be stable under different conditions. Mainly I want
to emphasize that this area represents a wealth of opportunities for NGOs to engage in behavioral
marketing research which could affect not only voluntary contributions, but also reporting,
evaluation, and future grant funding.
Corporate volunteer matching, also known as ‘Dollars for Doers’, is when a company donates a
fixed amount for every hour an employee volunteers. The company is matching the employees
volunteer time. The charity receives double the value by getting the work for free and a donation
for each hour worked. Anecdotal evidence suggests that corporate volunteer matching programs
can attract better candidates and retain employees as well as increase employee engagement,
thereby leading to more productivity and more profit (Forbes 2012). According to Forbes (2012),
Microsoft gave $5.6 million as a result of the 383,000 volunteer hours logged through the
company's employee volunteer program in 2011. The magnitude of volunteer hours and corporate
matching programs alone is worthy of research attention to better understand donations of time.
Linking donors directly to resource users in the field to match monetary donations to sustainable
resource use and voluntary environmental behavior also holds interesting potential for the
intersect between charitable giving research and behavioral environmental economics. Hopefully
the research in this thesis, and other similar studies, continue the momentum to shift the paradigm
away from trusting mostly anecdotal evidence toward a goal of understanding the science behind
donor behavior.
The second research objective involved exploring the relationship between social and
psychological factors and donations to charity among marine resource users. This study found a
high percentage of participants (35.7%) prefers egalitarian pay-off structures. There was also a
high proportion of participants displaying malevolent pay-off preferences (27.5%). Although I do
observe significant differences in the mean amounts donated between distributional preference
types, it is important to note that there is a high rate of giving across all participants in the study.
Individuals with own-money-maximizing and malevolent preferences give the lowest amount of
income to charity, whereas those with benevolent and egalitarian preferences donate a higher
percentage of their earnings. In analyzing the discrete donation decision, neither the demographic

Concluding Remarks
92
variables nor the treatments are seen to be statistically significant determinants. However, the
distributional preference types are statistically significant indicators of the donation decision.
Malevolent and own-money-maximizers are less likely to donate anything at all than the
egalitarian and benevolent types. Those with benevolent preferences give statistically more on
average to charity compared to the other types. There are no observable differences in the
average amounts given between the egalitarian, own-money-maximizers, and malevolent types.
The results imply that if own-money-maximizers and malevolents can be convinced to donate,
then they will donate generously. The results from research 2 suggest that distributional
preferences are an important explanatory control variable for donation behavior. Given that I
observe own-money maximizers and malevolents giving to charity, I can conclude that social
norms and societal expectations of prosocial behavior can override inherent personality
characteristics. In my sample, this can be attributed to the fact that there is a strong social norm in
Muslim societies to give to charity. It is unclear whether the concept of charity in Islam extends
to environmental protection and this could be an interesting area for future research. Successful
conservation campaigns require understanding and targeting the heterogeneity of the audience by
putting the resource-users and their needs at the center of the local conservation campaign
messaging and goals. In the case of Indonesia, there may be great value in partnering with the
local mosques and religious leaders to actively promote pro-environmental behavior or appealing
to one’s sense of pride and moral satisfaction in doing good.
On a broader scale, this study sheds light on interpretations between behavior in experimental
games and giving to real public goods. Most social dilemma games involve decisions about
resource allocation between anonymous but similar individuals with limited group size. In
research 2, had I only observed the behavior from the distributional preferences elicitation task,
the sample would appear to be much less cooperative than I observe in the real donation task.
This raises questions as to whether the motivations for behaving altruistically towards similar
individuals are activated by different mechanisms than the motivations that drive giving to
charity. This needs further investigation but contributes to the literature on stability of
preferences across domains.
To focus on another important group of stakeholders, in research 3 I examine tourist
contributions to conservation. In this study, I find that the most effective way to solicit voluntary
contributions from tourists is through a set default donation amount requiring individuals to opt-

Concluding Remarks
93
out of donating if they do not wish to give. Setting the default amount to a level that is within the
acceptable reference range results in the highest ratio of donors. Many marine protected areas
rely on voluntary contributions for conservation and the majority of studies examining the
willingness to pay for conservation limit the study population to scuba divers. The results from
my research demonstrate the need, and the potential, to extend funding mechanisms to all types
of resource users in coastal and small island destinations. The additional revenue earned through
expanding the donor base represents further possibilities to focus conservation efforts across
land-sea boundaries.
5.2 Limitations and future research opportunities
Although there are many strengths to a field experimental approach, these methods are limited in
several ways. I address the weaknesses of the individual research methods in the previous
chapters. In this subsection, I will focus on the broader issues and directions for future research.
This thesis examines the giving behavior of small-scale fishers and tourists in Indonesia.
Naturally, the applicability and generalizability of the results is somewhat limited to the context
in which the experiments have been conducted. Many of the same concepts that give strength to
field experiments as a method, are also a weakness in how far the results can be applied to other
contexts. Indeed, one of the main purposes of this research is to draw attention to contextual
factors that may be present in determining the relationship between social and psychological
factors and giving behavior.
An additional limitation to the experimental approach is that while useful to observe behavior in
the field, experimental research is limited to describing the actions people make, not explaining
why people make these choices. In-depth qualitative inquiry is necessary to understand and
explain the nuances about human behavior, emotions, cultural expectations, and religious beliefs
in different contexts. Interdisciplinary collaboration and mixed methods approaches is a practical
way forward to ensure the development of a broader base of knowledge to improve conservation
outcomes.
Broadly speaking, the global perspective of a wider, more diverse audience is missing in this
narrative. We cannot discuss the protection and conservation of marine natural resources without
taking into consideration the global public goods provided by the existence of healthy coral

Concluding Remarks
94
ecosystems and clean ocean waters. Local behavioral changes will be of little concern in the long
run if we cannot manage the overarching global stressors. The literature investigating the
willingness to donate for the existence value of non-use environmental goods is mostly limited to
hypothetical studies. Conservation NGOs using field experiments to solicit real donations for
non-use environmental goods could benefit greatly from understanding the intrinsic and extrinsic
motivations, such as those explored within this research, driving their donor base.
The limitation here is that NGOs have to be open to working with academics and comfortable
with sharing proprietary data that may reveal strategic insights about the impact of their
fundraising strategies. Additionally, academics must be flexible as there may be compromises
regarding adherence to strict academic requirements for treatment randomization given that
NGOs may not understand or may fear the consequences of subjecting clients to different
information.
Promoting the mutual benefits of collaborations between academics and NGOs is one way of
fulfilling the need for more research on human behavior in the conservation NGO sector. From
the perspective of voluntary contributions to conservation, collaborations between large
international NGOs and academics will allow academics access to large volumes of real-world
data and the ability to ensure their research remains applied. Likewise, NGOs would benefit from
working with researchers with advanced analytical skills and an understanding of relevant theory.
Although challenging, such partnerships could play a decisive role in conservation outcomes if
environmental giving behavior is better understood (Veríssimo et. al 2018).

95
Appendices

Appendices
96
Appendix A Invitation Letter
Leibniz Center for Tropical Marine Ecology | Fahrenheitstr 6 | 28359 Bremen | Germany | +49 (0)421-23800-148 Pusat Kajian Sumberdaya Pesisir Dan Lautan | Kampus IPB Baranangsiang | JL Raya Pajajaran No. 1 | Bogor 16127 | +62 (251)837-4816
Universitas Haluoleo | Kampus Hijau Bumi Tridharma | Anduonou | Kendari 93132 | Sulawesi Tenggara | +62 (0401) 319-0105
Dear head of household,
We would like to officially invite you to participate in an educational study. During the study, you will
work for one hour and you will be compensated for your effort. This research project is done in
cooperation between a German university, PKSPL-Institut Pertanian Bogor, and Haluoleo University. The
purpose of the study is to understand more about the livelihood decisions and preferences of people living
in the Wakatobi National Park.
The study will take approximately 2 hours from start to finish. The first part will include a simple work
activity and this will be followed by a survey questionnaire.
If you are interested in participating, please come to the location below at the time listed AND BRING
THIS INVITATION LETTER WITH YOU OR YOU WILL NOT BE ABLE TO PARTICIPATE. Your
participation in this study is completely voluntary. We have a limited number of available spaces and will
accept people on a first come, first served basis. In the case that the study is already full for the day, you
may have an opportunity to return at a later time or on a different day.
To participate in the study, you must present this invitation letter when you arrive. In the case that the
head of household is not available at the time and date requested, the next decision maker in the house
may come. All participants must be at least 18 years of age.
Participant number:
Date:
Time:
Location:
MEN ONLY
We greatly appreciate your time and hope to see you soon!
Best regards,
Katie Nelson
Febrina Desrianti

Appendices
97
Appendix B Survey
RESP
MALE 0
FEMALE 1
INTERVIEWER
We are running a s tudy which a ims to gather more information on how people here make a l iving and
how people have adapted fi shing and l ivel ihood behavior s ince the establ ishment of the national park
zone. This research project i s done in cooperation between a German univers i ty and PKSPL-Insti tut
Hel lo. My name is ____________________, I am an interviewer and s tudent from Haluoleo Univers i ty in
CODE
AGE
Do you agree that we can use your picture in the future when presenting the results of the s tudy?
YES [ ] NO [ ]
I would greatly appreciate your cooperation. We wi l l need approximately 2 hours of your time. You can
ask any questions during the interview and you can refuse to answer questions , or terminate the
interview at any time. If you have any questions or concerns about this s tudy, you may contact Dr. Luky
Adrianto, Director, PKSPL-IPB.
Are there any questions you would l ike to ask at this moment?
Do you declare to have understood the purpose of this s tudy and agree to participate in this survey?
YES [ ] NO [ ]
Your responses wi l l be treated confidentia l ly, and wi l l only be used for the purposes of this s tudy.
Nobody except me and a smal l group of other researchers in this project wi l l know your name and the
answers you give wi l l be processed in such a way that they cannot be l inked to your name. In the
reports we wi l l ensure that participants in this survey cannot be identi fied.
Sociodemographic Survey - 2015
NAME CODE
RESPONDENT IDENTIFIER:
DISTRICT
VILLAGE
ADDRESS
DATE
SUBJECT NAME
CONTACT NUMBER
NAME
VILLAGE NAME

Appendices
98
1 INFORMATION ABOUT HH ONLY
No 0 ► (1.01a)
Yes 1 ► (1.02)
HouseholdSection
(1.01) Are you the head of the household?
1
2
3
4
5
6
7
8
9
10
FATHER/ MOTHER IN LAW 11
12
SON/ DAUGHTER IN LAW
BROTHER / SISTER IN
LAW
GRANDFATHER /
MOTHER
OTHER SPECIFY
(1.01a)
CHILD
ADOPTED CHILD
GRANDCHILD
FATHER / M OTHER
BROTHER / SISTER
What is your relationship to the household head?
WIFE
NIECE / NEPHEW
► 0
1
2
3
4
5
6
7
CODEGOVERNMENT EMPLOYEE
b
FISHERMAN INDEPENDENT
c
d
What jobs earn the steady income
(starting with your job)? a
How many people in your household have a steady
income (including you)?
FARMER (INCL. SEAWEED)
OTHER: write it in
(1.04)
(1.05)
e
SELF-EMPLOYED
PRIVATE SECTOR
FISHERMAN DEPENDENT
(1.02) How many people live in your household (including you)?
f
g
No income
How many people does your income support (including
you, those that live in your household, and those that
live outside your household)?
(1.03)
1 1
2 2BRICK/CEMENT 3 PLANK WOOD 3
4 4
5 5
CORRUGATED IRON FINISHED (tiles, etc)
(1,06) The main building of
your house has walls made of…
(1,07) The floor is made of…
BAMBOO BAMBOO
WOOD SOIL/SAND
OTHEROTHER

Appendices
99
Do you own the house you live in? 0
1
LOCAL CURENCY
a
b
c
d
LOCAL CURENCY
a
b
c
d
Does anyone in your household have…? 0
READ OUT - ONE ANSWER PER LINE 1
a A canoe or boat (no engine)
b A motorbike
c A boat with an engine
d A bank account
e A refrigerator
f A generator
g A television
h A car
0
(2.05) Does your household have…? 1
a
b
0
1
ab
c
d
YES
INFORMATION ABOUT HH ONLY
And approximately how much does your household spend on each of
these items per year?
Gas or wood for cooking
Electrictiy
2Section
Other expenses without rent (DO NOT PROMPT - RECORD HERE ONLY ANY ADDITIONAL
EXPENSES THAT THE RESPONDENT WOULD LIKE TO REPORT)
(2.04)
YES
Food and beverages
Rent or mortgage for house or boat
Transport (petrol or other) and communications (mobile credit)
Health (including medicines and health insurance)
NO
Expenses and
Activities
(2.02) Approximately how much does your household spend on each of these
items per week?
(2.01) NO
e
(2.03)
YES
Education (including tuition, books, kindergarten expenses)
Weddings, funerals, religious ceremonies, and festivals (gifts included)
NO
Electricity
Running water
NO
YES
(2.06) Do you or anyone in the household do any…?
Fishing
Collecting coral rocks
Collecting invertebrates
Collecting mangrove wood

Appendices
100
(2.07) 0
1
(2.08)
(2.09)
a Equipment using your hand (ie. Gleaning, hand held line)
b Handheld gun (ie. speargun)
c Stationary net (traps, gill net, trammel net)
d Mobile net (trawl, purse seine, beach seine)
e Stationary line (long line)
f Mobile line (trolling)
g Compressor diving
h Trap fishing
i Explosives or chemicals (bomb or cyanide)
j Other
(2.10)
a
b
c
(2.11) 0
1
(2.12) 0
1
d
R a nk 1- 3
4 > few times/week
How often did you collect
invertabrates, coral, or
mangrove wood?
Average
catch/trip
Average
price
1 Once or
never
2 Few
times/monthHow often did you go
fishing?
How often did you go
fishing in less productive
season?
Do you alternate between fishing/collecting and doing other jobs?
YES
How often did you go
fishing in more productive
season?
NO
YES
If you could make as much money doing another job as
you make fishing, would you stop fishing for income?
NO
a
b
c
#1 Target fish
(Write it in)
Gear code
from 2,10
#2 Target fish (Write it
in)
What are the top 3 fishing gears you use most often? Rank 1 being most often to 3 less often.
YES
In the last 12 months…3 Few
times/week
Do you often catch and keep juvenile fish? NO
Average
catch/trip
Average
price
What are your target fish species (most preferred) based on the most used fishing gear
from previous question? Rank top 2 species per gear.

Appendices
101
(2.13)
(2.14)
(2.15)
(2.16)
(2.17) Approximately how many months do you experience
this?
What is the normal monthly income for your
household?
What is the lowest monthly income your household has
within a year?
What is the highest monthly income your household has
within a year?
Approximately how many months do you experience
this?
INFORMATION ABOUT INDIVIDUAL ONLY
BUTON
BAJO 2
BUGIS 3
PULO 4
MEDA-MEDA 5
OTHER 6
How long have you lived in this locality?
NO DEGREE / NO EDUCATION 1
DID NOT FINISH ELEMENTARY SCHOOL 2
COMPULSORY SCHOOL EDUCATION 3
BASIC VOCATIONAL EDUCATION 4
SECONDARY TECHNICAL EDUCATION 5
SECONDARY GENERAL EDUCATION 6
HIGHER EDUCATION (BA) 7
UNIVERSITY (MA) OR HIGHER (PH.D) 8
What is your religion? MUSLIM 1
PROTESTANT / OTHER CHRISTIAN 2
CATHOLIC 3
TRADITIONAL BELIEVER 4BUDDHIST 5OTHER 6
SECTION 3 INDIVIDUAL SOCIODEMOGRAPHICS
1(3.01)
(3.02)► (3.04)
What is your ethnicity?
What is the
highest degree
you already
obtained?
(3.03)
IF THE WHOLE LIFE, WRITE 99
(3.05)
YEARS

Appendices
102
1 2 3 4 5
(4.02)
1 2 3 4 5
(4.03)
1
2 Community effort
3 Government
To what extent do you trust the following institutions?
a 1 2 3 4 5b 1 2 3 4 5c 1 2 3 4 5
d 1 2 3 4 5e 1 2 3 4 5
f 1 2 3 4 5
g 1 2 3 4 5h 1 2 3 4 5
i 1 2 3 4 5
j 1 2 3 4 5k 1 2 3 4 5
How is the fishing in Wakatobi?
Waste is a problem in my
(4.01)
Overfished Plenty of fish
No problem
with waste
INFORMATION ABOUT INDIVIDUAL ONLY
International NGOs (ie. British Council, WWF, Swiss Contact)
Section
5
Wakatobi National Park
Co
mp
lete
tru
st
The federal government
microfinance institutions/CooperativesLocal NGOs
1 4
Attitudes & Values
Generally speaking, would you say that most people can be trusted, or that you can't be too
careful in dealing with people? Please answer on a scale of 1 to 5, where 1 means that you
have complete distrust and 5 means that you have complete trust.
Complete
trust
4
2 3
Village head (Kepala desa)
(4.05)
Religious leaders
Banks and the financial system
Community leaders/organizations
Huge problem
with waste
Individual household
(4.04)
Complete
distrust
Whose main responsibility is it to keep the community
clean?
Co
mp
lete
dis
tru
st
District government
The police

Appendices
103
0
1
(4.08)
(4.09) a
b
c
d
e
f Safety
g
h
i
j
k
l
m
n Waste
o Others
(4.10) a
b
c
e Severe weather
(4.11)
Damage to
natural habitat
Disagree
stronlgy
d
f
People would try to
take advantage of
you
People
would try to
be fa i r
Loss of fishing
ground due to
zonation
4
How important is it to you to preserve the environment? Please use this scale, where 1
means "not important at all" and 10 means "the most important"
Coral reefs dying
Loss of natural
habitat
(4.07) If you saw someone you know doing something illegal, would you
report them? YES
Out of the following environmental problems, please
number the three most important problems with 1 being of
most concern and 3 being of less concern:
Climate change
1 2 3
In your opinion, what are the three most important problems
that your village faces?
Overpopulation
Poverty
Health
Rank the top three from most concern (1) to less concern (3)
Strongly agree
5
7 85
NO
10
Do you think most people would try to take advantage of you if they got a chance, or would they
try to be fair? Please use this scale, where 1 means that “people would try to take advantage of
you,” and 10 means that “people would try to be fair”
1 2 3
1 2 3 4
Inequality
Environment
Social conflict
64 9
Alcohol, gambling, and fighting
(4.06) Some say that by helping others you help yourself in
the long run. Do you agree?
Food security
5 6 7 8 9 10
Education
Not enough
fresh water
Sea water quality
Destructive
Not at a l l The most
important

Appendices
104
INFORMATION ABOUT INDIVIDUAL ONLY
a
b
c
d
e
0 f
MEMBER 1 g
0
1
(5.03) 0
1
(5.05) 0
1
(5.07)
1
2
3
4
5
6
7
Social Capital and Marine
Management Questions
1 2 3
Never Sometimes
(5.06) Have you ever been part of a project to organize a new service in your
area (i.e. cleaning the neighborhood together, social project, etc)?
Frequently
Never Sometimes Frequently
3
Here is a list of voluntary
organizations. For each one, please
indicate whether you are a member
or not a member of that type of
organization
What happens to the garbage waste in your village?
(5.04) Do you help out a local group as a volunteer?
Have you attended any village meetings in the past
three months?
NOT MEMBER
YES
(5.02)
YES
NO
1 2
Monthly community clean-up
5Section
Women's group
Other (specify)
Non Governmental Organization
Religious Orgnization(5.01)
Neighborhood group
Microcredit
Fisher cooperative
Have you participated in any education programs
about the environment?
NO
Throw trash in ocean
Burn trash
No service
Daily pick-up service (govt)
Weekly pick-up service (govt)
NO
YES
Did you donate this year to any charities
(including sedekah)? Zakat NOT included.
Weekly community clean-up

Appendices
105
(5.08)
1
2
3
4
5
6
(5.09)
1
2
3
4
5
6
(5.10) 0
1
(5.11) 0
1
(5.12)
1
2
3
4
5
Islamic Relief
Worldwide
Oxfam Indonesia
The charity is international
The charity is local
You know the charity
You trust the charity
Did you give (donate/volunteer) to the charity you selected?
If yes, is it because…
If no, is it because you did not find a charity that you would
like to give to?
NO
YES
You like the focus of the charity
What would you be doing right now if you were not participating in this study?
Working
Housekeeping
NO
YES
Fishing
Studying
Nothing
SINTESA
What charity did you select?
Muslimat Nahdatul
Ulama Karang Taruna
Terangi
Other
▼
a
b
c
d
e
f
g Other: _____________________________ (do not prompt, record information voluntereed by respondent)
▲
5.14
▼
a
b
c
d
e Maintain boundary markers for no take zones
What conservation activities would you agree to do regularly?
CROSS ALL THAT APPLIES
Keep the canals free of trash
Buy reusable bags and stop using plastic bags
Report illegal fishing activity
Monitor the reef fishing grounds to prevent illegal activity
Who, in your opinion, should be responsible for managing your local marine area?
MARK WITH A CROSS THE MOST IMPORTANT
The government (forestry/fisheries department)
Local government or village council
NGOs
Local community institutions and community members
Tourism organizations (hotels, dive shops, etc)
International organizations
READ OUT CROSS ALL THAT APPLIES
(5.13)
The following questions are related to marine management in Wakatobi.

Appendices
106
▼
a
b
c
d
e
f
g
h
i
j
k
▼
a
b
c
d
e
f Bad for communities depending on marine resources
g
h
i
In your opinion, what are the potential disadvantages of a managed marine area?
In your opinion, what are the potential benefits of a managed marine area?
Reduced conflict
More money and benefits from NGO or government in the future
Punishes illegal fishers
Pride/prestige for this village
Other (specify: )
DO NOT PROMPT
DO NOT PROMPT
Less money for my family
No money to support or manage it
Increased conflict
(5.15)
Difficulties to enforce rules
Unclear rules
Outsiders breaking the rules
Unfairness
Protects future generations
Prevents exploitation
Improved coral reef
Increased resources in the long run (more fish, larger fish)
(5.16)
Increased tourism
Other (specify: )
Reduced pollution
CROSS ALL THAT APPLIES
CROSS ALL THAT APPLIES
Are the instructions clear? Do you have any questions?
6 Distributional
Preferences
INFORMATION ABOUT INDIVIDUAL ONLYSection
You will make ten decisions. You will be paid out for one of the ten
choices based on how much you decide 'you get' (the pay out will be in
thousands). example ; Do you prefer that you get 10 and others
mendapatkan13 or , that you and others alike gain 10
You will receive a payment based on your decision and you will receive
a payment based on the choice of another participant.
(6.01)

Appendices
107
1
2
You get
3
You get
4
5
They get
13
They get
They get
They get
10 10
10
You get
You get
10 10
They get
They get
They get
10
You getYou get
7
10 13
12
12
10 7 10 10
You get You get They get
They get
13 108
You get You get
10
They get
Left Right
6
7
8
You get
9
10
They get
They get
They get
11
10 10
Right
They get
You get
You get
You get
11
9
You get
10
10
10
They get
10
You get
13
7
13
7
You getThey get
They get
They get
Left
You get
You get
7
10
10
They get
They get
8
9
You get
10
10

Appendices
108
Appendix C1 Experimental Instructions – Donation
Today, you will be participating in a research study. Your performance in this study and the
choices you make will determine the benefits to both you and a charity of your choice.
We will have a short explanation of how to do the task. Please pay attention to these instructions
so you will understand how the study works.
During this study, it is important that you do not pay attention to other people's work or discuss
your work with others. If you have any questions, or need assistance of any kind, please raise
your hand and we will come to you.
You will be presented a list of charities and their descriptions. You will be asked to select a single
charity. Based on your actions during the study, the charity you select can benefit from your
decisions. Please note that you can choose only one charity from this list.
Once you have selected your charity, we can begin the study. You then will be able to earn
money as you do the task. You will have one hour to work. At the end of the hour, you will be
paid for each piece completed correctly. Then you will have the opportunity to donate any
amount of your earnings to the charity you selected.
This study consists of rolling pieces of paper that can be used to make different types of products,
such as key chains, fishing lures, etc. You have the opportunity to work to earn money for
yourself for every piece you roll correctly and then you can decide how much to donate at the end
to charity.
You have a box of supplies including one long rolling stick and two short rolling sticks, a tube of
glue, an envelope full of pre-cut paper strips (1.5cm at the base), a plastic collection bottle for the
beads, an envelope with your name and an envelope with the name of the charity you chose. The
box will be used as a screen to shield your work from others.
You will have 1 hour to do the task. Each bead should be placed in the plastic bottle upon
completion. Each piece of paper rolled correctly is worth 1,000IDR. At the end of the hour, you
will submit your work and you will be paid for those beads that are done correctly, and, you will
be able to decide if you would like to contribute to charity. After this, you will complete a survey.
Total funds raised for the charities will be posted publicly in the village after the study and all
charities will be presented with the contributions within 90 days.
To summarize:
1. You will roll paper pieces. Each one completed correctly is worth 1,000IDR.
2. Once 60 minutes have passed, the task is finished.
3. You are paid based on the number of correct beads completed in the time of the
experiment.
4. You will then decide how much you would like to donate to the charity of your choice (a
donation is not required) by putting your donation in a separate envelope.
5. Then you will complete a survey questionnaire.

Appendices
109
Appendix C2 Experimental Instructions – Donation match
Today, you will be participating in a research study. Your performance in this study and the
choices you make will determine the benefits to both you and a charity of your choice.
We will have a short explanation of how to do the task. Please pay attention to these instructions
so you will understand how the study works.
During this study, it is important that you do not pay attention to other people's work or discuss
your work with others. If you have any questions, or need assistance of any kind, please raise
your hand and we will come to you.
You will be presented a list of charities and their descriptions. You will be asked to select a single
charity. Based on your actions during the study, the charity you select can benefit from your
decisions. Please note that you can choose only one charity from this list.
Once you have selected your charity, we can begin the study. You then will be able to earn
money as you do the task. You will have one hour to work. At the end of the hour, you will be
paid for each piece completed correctly. Then you will have the opportunity to donate any
amount of your earnings to the charity you selected and we will match any amount that is
donated to the charity of your choice.
This study consists of rolling pieces of paper that can be used to make different types of products,
such as key chains, fishing lures, etc. You have the opportunity to work to earn money for
yourself for every piece you roll correctly and then you can decide how much to donate at the end
to charity and we will match your donation.
You have a box of supplies including one long rolling stick and two short rolling sticks, a tube of
glue, an envelope full of pre-cut paper strips (1.5cm at the base), a plastic collection bottle for the
beads, an envelope with your name and an envelope with the name of the charity you chose. The
box will be used as a screen to shield your work from others.
You will have 1 hour to do the task. Each bead should be placed in the plastic bottle upon
completion. Each piece of paper rolled correctly is worth 1,000IDR. At the end of the hour, you
will submit your work and you will be paid for those beads that are done correctly, and, you will
be able to decide if you would like to contribute to charity. Anything you contribute to charity
will be matched so double the amount will go to your charity. After this, you will complete a
survey.
Total funds raised for the charities will be posted publicly in the village after the study and all
charities will be presented with the contributions within 90 days.
To summarize:
1. You will roll paper pieces. Each one completed correctly is worth 1,000IDR.
2. Once 60 minutes have passed, the task is finished.

Appendices
110
3. You are paid based on the number of correct beads completed in the time of the
experiment.
4. You will then decide how much you would like to donate to the charity of your choice (a
donation is not required) by putting your donation in a separate envelope.
5. We will match your donation to charity.
6. Then you will complete a survey questionnaire.
Appendix C3 Experimental Instructions – Volunteer
Today, you will be participating in a research study. Your performance in this study and the
choices you make will determine the benefits to both you and a charity of your choice.
We will have a short explanation of how to do the task. Please pay attention to these instructions
so you will understand how the study works.
During this study, it is important that you do not pay attention to other people's work or discuss
your work with others. If you have any questions, or need assistance of any kind, please raise
your hand and we will come to you.
You will be presented a list of charities and their descriptions. You will be asked to select a single
charity. Based on your actions during the study, the charity you select can benefit from your
decisions. Please note that you can choose only one charity from this list.
Once you have selected your charity, we can begin the study. You then will be able to decide as
you do the task when you would like to earn money for yourself and when you would like to
contribute that time to the charity you selected. At any point during the study you will be
allowed to switch back and forth as often you like between working for yourself or
volunteering your time for charity.
This study consists of rolling pieces of paper that can be used to make different types of products,
such as key chains, fishing lures, etc. You have the opportunity to work to earn money for
yourself for every piece you roll correctly or to volunteer your effort. There are containers
marked “charity” and unmarked containers that allow you to switch between working for
yourself and the charity selected earlier. As each bead is completed, deposit the bead into
either the unmarked work-for-self or “charity” container.
You have a box of supplies including one long rolling stick and two short rolling sticks, a tube of
glue, an envelope full of pre-cut paper strips (1.5cm at the base), two plastic collection bottles –
one marked “charity” and one unmarked – for the beads, an envelope with your name and an
envelope with the name of the charity you chose. The box will be used as a screen to shield your
work from others.
You will have 1 hour to do the task. Each bead should be placed in the plastic bottle upon
completion. Each piece of paper rolled correctly is worth 1,000IDR. At the end of the hour, you
will submit the two containers and you will be paid for those beads that are done correctly

Appendices
111
in the unmarked container, and, your charity will be paid for those beads done correctly in
the “charity” container. After this, you will complete a survey.
Total funds raised for the charities will be posted publicly in the village after the study and all
charities will be presented with the contributions within 90 days.
To summarize:
1. You will roll paper pieces. Each one completed correctly is worth 1,000IDR.
2. You can decide between working for yourself or volunteering for your charity at any
point in the experiment by putting the paper beads into either container.
3. Once 60 minutes have passed, all allocations are finalized.
4. You are paid based on the number of correct beads completed in the time of the
experiment that you deposit into the unmarked container.
5. Any beads that were deposited in the ‘charity’ container will result in proceeds
going to the charity.
6. Then you will complete a survey questionnaire.
Appendix C4 Experimental Instructions – Volunteer match
Today, you will be participating in a research study. Your performance in this study and the
choices you make will determine the benefits to both you and a charity of your choice.
We will have a short explanation of how to do the task. Please pay attention to these instructions
so you will understand how the study works.
During this study, it is important that you do not pay attention to other people's work or discuss
your work with others. If you have any questions, or need assistance of any kind, please raise
your hand and we will come to you.
You will be presented a list of charities and their descriptions. You will be asked to select a single
charity. Based on your actions during the study, the charity you select can benefit from your
decisions. Please note that you can choose only one charity from this list.
Once you have selected your charity, we can begin the study. You then will be able to decide as
you do the task when you would like to earn money for yourself and when you would like to
contribute that time to the charity you selected. We will match your contribution with an
equal monetary donation to the charity of your choice. At any point during the study you
will be allowed to switch back and forth as often you like between working for yourself or
volunteering your time for charity.
This study consists of rolling pieces of paper that can be used to make different types of products,
such as key chains, fishing lures, etc. You have the opportunity to work to earn money for
yourself for every piece you roll correctly or to volunteer your effort. There are containers
marked “charity” and unmarked containers that allow you to switch between working for
yourself and the charity selected earlier. As each bead is completed, deposit the bead into
either the unmarked work-for-self or “charity” container.

Appendices
112
You have a box of supplies including one long rolling stick and two short rolling sticks, a tube of
glue, an envelope full of pre-cut paper strips (1.5cm at the base), two plastic collection bottles –
one marked “charity” and one unmarked – for the beads, an envelope with your name and an
envelope with the name of the charity you chose. The box will be used as a screen to shield your
work from others.
You will have 1 hour to do the task. Each bead should be placed in the plastic bottle upon
completion. Each piece of paper rolled correctly is worth 1,000IDR. At the end of the hour, you
will submit the two containers and you will be paid for those beads that are done correctly
in the unmarked container, and, your charity will be paid for those beads done correctly in
the “charity” container and we will match your effort with a donation on your behalf to the
charity you selected. After this, you will complete a survey.
Total funds raised for the charities will be posted publicly in the village after the study and all
charities will be presented with the contributions within 90 days.
To summarize:
1. You will roll paper pieces. Each one completed correctly is worth 1,000IDR.
2. You can decide between working for yourself or volunteering for your charity at any
point in the experiment by putting the paper beads into either container.
3. Once 60 minutes have passed, all allocations are finalized.
4. You are paid based on the number of correct beads completed in the time of the
experiment that you deposit into the unmarked container.
5. Any beads that were deposited in the ‘charity’ container will result in proceeds
going to the charity and we will match the amount donated.
6. Then you will complete a survey questionnaire.

Appendices
113
Appendix D Charity choices
Charity Organizations
Charity Focus Description
Terumbu Karang Indonesia
(TERANGI)
Environment
TERANGI is dedicated to coral reef conservation in Indonesia.
They focus on improving marine management and community-
based conservation to reduce threats to local coral reef habitats.
Karang Taruna Environment
Karang Taruna is a village-level organization and support will
go towards community clean-up activities to protect the marine
environment from pollution.
SINTESA Rural Potential
SINTESA focuses on women’s empowerment and provides
training programs on alternative livelihood projects, potable
water resources, and managing finances. They provide savings
and loan services in addition to tourism training.
Oxfam Rural Potential
Oxfam has been operating in Indonesia since 1957 and focuses
on improving rural livelihood and income opportunities, equal
access to resources, food security, and disaster relief.
Islamic Relief Worldwide Religious
organization
Islamic Relief Worldwide has been working in Indonesia since
2000 and focuses on climate change relief, food security,
sustainable livelihoods, sanitation, women’s empowerment, and
access to potable water.
Nahdlatul Ulama Religious
Organization NU is an Islamic organization that focuses on children’s
education, religious learning, and women’s empowerment.

Appendices
114
Appendix E Step-by-step visual guide to rolling paper beads
Photo credit from “Steps to making paper beads” by Teenuja Dahari, 2012, https://veganlovlie.com/how-to-make-
paper-beads/. Copyright 2012 by Teenuja Dahari. Accessed 15 Oct. 2015. Reprinted with permission.

Appendices
115
Appendix F Survey
CONTROL (WRITE-IN) TREATMENT

Appendices
116
REFERENCE LEVELS TREATMENT
DEFAULT OPT-IN TREATMENT

Appendices
117
DEFAULT OPT-OUT TREATMENT

118
ReferencesAbadie, Alberto, and Sebastien Gay. 2006. "The impact of presumed consent legislation on
cadaveric organ donation: a cross-country study." Journal of Health Economics 25
(4):599-620.
Adams, Vanessa M, Jorge G Álvarez‐Romero, Josie Carwardine, Lorenzo Cattarino, Virgilio
Hermoso, Mark J Kennard, Simon Linke, Robert L Pressey, and Natalie Stoeckl. 2014.
"Planning across freshwater and terrestrial realms: cobenefits and tradeoffs between
conservation actions." Conservation Letters 7 (5):425-440.
Adger, W Neil, Terry P Hughes, Carl Folke, Stephen R Carpenter, and Johan Rockström. 2005.
"Social-ecological resilience to coastal disasters." Science 309 (5737):1036-1039.
Ajzen, Icek, Thomas C Brown, and Franklin Carvajal. 2004. "Explaining the discrepancy
between intentions and actions: The case of hypothetical bias in contingent valuation."
Personality and social psychology bulletin 30 (9):1108-1121.
Akchin, Don. 2001. "Nonprofit marketing: Just how far has it come." Nonprofit world 19 (1):33-
35.
Alexander, Steven M, Mark Andrachuk, and Derek Armitage. 2016. "Navigating governance
networks for community‐based conservation." Frontiers in Ecology and the Environment
14 (3):155-164.
Allen, Gerald R. 2008. "Conservation hotspots of biodiversity and endemism for Indo‐Pacific
coral reef fishes." Aquatic Conservation: Marine and Freshwater Ecosystems 18 (5):541-
556.
Alpizar, Francisco, Fredrik Carlsson, and Olof Johansson-Stenman. 2008. "Anonymity,
reciprocity, and conformity: Evidence from voluntary contributions to a national park in
Costa Rica." Journal of Public Economics 92 (5):1047-1060.
Alpízar, Francisco, and Peter Martinsson. 2010. "Don’t Tell Me What to Do, Tell Me Who to
Follow!-Field Experiment Evidence on Voluntary Donations." rapport nr.: Working
Papers in Economics 452.
Altmann, Steffen, and Armin Falk. 2009. "The impact of cooperation defaults on voluntary
contributions to public goods." University of Bonn.
Alvarez-Romero, Jorge G, Robert L Pressey, Natalie C Ban, Ken Vance-Borland, Chuck Willer,
Carissa Joy Klein, and Steven D Gaines. 2011. "Integrated land-sea conservation
planning: the missing links." Annual Review of Ecology, Evolution, and Systematics
42:381-409.
Álvarez‐Romero, Jorge G, Robert L Pressey, Natalie C Ban, Jorge Torre‐Cosío, and Octavio
Aburto‐Oropeza. 2013. "Marine conservation planning in practice: lessons learned from
the Gulf of California." Aquatic Conservation: marine and freshwater ecosystems 23
(4):483-505.
Andreoni, James. 1990. "Impure altruism and donations to public goods: A theory of warm-glow
giving." The Economic Journal 100 (401):464-477.
Andreoni, James, William G Gale, John Karl Scholz, and John Straub. 1996. "Charitable
contributions of time and money." University of Wisconsin–Madison Working Paper.
Andreoni, James, and John Miller. 2002. "Giving according to GARP: An experimental test of
the consistency of preferences for altruism." Econometrica 70 (2):737-753.
Andriamalala, Gildas, Shawn Peabody, Charlie J Gardner, and Kame Westerman. 2013. "Using
social marketing to foster sustainable behaviour in traditional fishing communities of
southwest Madagascar." Conservation Evidence 10:37-41.

References
119
Ariely, Dan, Anat Bracha, and Stephan Meier. 2009. "Doing good or doing well? Image
motivation and monetary incentives in behaving prosocially." American Economic
Review 99 (1):544-55.
Arin, Tijen, and Randall A Kramer. 2002. "Divers’ willingness to pay to visit marine sanctuaries:
an exploratory study." Ocean & Coastal Management 45 (2):171-183.
Arkema, Katie K, Gregory M Verutes, Spencer A Wood, Chantalle Clarke-Samuels, Samir
Rosado, Maritza Canto, Amy Rosenthal, Mary Ruckelshaus, Gregory Guannel, and Jodie
Toft. 2015. "Embedding ecosystem services in coastal planning leads to better outcomes
for people and nature." Proceedings of the National Academy of Sciences 112 (24):7390-
7395.
Arrow, Kenneth, Robert Solow, Paul R Portney, Edward E Leamer, Roy Radner, and Howard
Schuman. 1993. "Report of the NOAA panel on contingent valuation." Federal register
58 (10):4601-4614.
Asafu-Adjaye, John, and Sorada Tapsuwan. 2008. "A contingent valuation study of scuba diving
benefits: Case study in Mu Ko Similan Marine National Park, Thailand." Tourism
Management 29 (6):1122-1130.
Balafoutas, L., R. Kerschbamer, and M. Sutter. 2012. "Distributional preferences and competitive
behavior." Journal of Economic Behavior and Organization 83-334 (1):125-135.
Bateman, Ian, Ken Willis, and Guy Garrod. 1994. "Consistency between contingent valuation
estimates: a comparison of two studies of UK National Parks." Journal of the Regional
Studies Association 28 (5):457-474.
Beddington, John R, David J Agnew, and Colin W Clark. 2007. "Current problems in the
management of marine fisheries." Science 316 (5832):1713-1716.
Bekkers, René, and Pamala Wiepking. 2011. "A literature review of empirical studies of
philanthropy: Eight mechanisms that drive charitable giving." Nonprofit and Voluntary
Sector Quarterly 40 (5):924-973.
Bénabou, Roland, and Jean Tirole. 2006. "Incentives and prosocial behavior." American
Economic Review 96 (5):1652-1678.
Bennett, Nathan J, Robin Roth, Sarah C Klain, Kai Chan, Douglas A Clark, Georgina Cullman,
Graham Epstein, Michael Paul Nelson, Richard Stedman, and Tara L Teel. 2017.
"Mainstreaming the social sciences in conservation." Conservation Biology 31 (1):56-66.
Benz, Matthias, and Stephan Meier. 2008. "Do people behave in experiments as in the field?—
evidence from donations." Experimental Economics 11 (3):268-281.
Bernard, Florence, Rudolf S de Groot, and José Joaquín Campos. 2009. "Valuation of tropical
forest services and mechanisms to finance their conservation and sustainable use: A case
study of Tapantí National Park, Costa Rica." Forest Policy and Economics 11 (3):174-
183.
Bjorkland, Ronald, and Catherine M Pringle. 2001. "Educating our communities and ourselves
about conservation of aquatic resources through environmental outreach." AIBS Bulletin
51 (4):279-282.
Bos, Melissa, Robert L Pressey, and Natalie Stoeckl. 2015. "Marine conservation finance: The
need for and scope of an emerging field." Ocean & Coastal Management 114:116-128.
Bottema, Mariska JM, and Simon R Bush. 2012. "The durability of private sector-led marine
conservation: A case study of two entrepreneurial marine protected areas in Indonesia."
Ocean & Coastal Management 61:38-48.
BPS. 2014. BPS Statistics of Wakatobi Regency.

References
120
Briers, Barbara, Mario Pandelaere, and Luk Warlop. 2007. "Adding exchange to charity: a
reference price explanation." Journal of Economic Psychology 28 (1):15-30.
Brockner, Joel, Beth Guzzi, Julie Kane, Ellen Levine, and Kate Shaplen. 1984. "Organizational
fundraising: Further evidence on the effect of legitimizing small donations." Journal of
Consumer Research 11 (1):611-614.
Brouhle, Keith, Charles Griffiths, and Ann Wolverton. 2005. The use of voluntary approaches for
environmental policymaking in the US: Springer.
Brown, Alexander L, Jonathan Meer, and J Forrest Williams. 2013. Why do people volunteer?
An experimental analysis of preferences for time donations. National Bureau of Economic
Research Working Paper Series.
Brown, Sarah, William H Greene, Mark N Harris, and Karl Taylor. 2015. "An inverse hyperbolic
sine heteroskedastic latent class panel tobit model: An application to modelling charitable
donations." Economic Modelling 50:228-236.
Bryant, W Keith, Haekyung Jeon-Slaughter, Hyojin Kang, and Aaron Tax. 2003. "Participation
in philanthropic activities: Donating money and time." Journal of Consumer Policy 26
(1):43-73.
Burbidge, John B, Lonnie Magee, and A Leslie Robb. 1988. "Alternative transformations to
handle extreme values of the dependent variable." Journal of the American Statistical
Association 83 (401):123-127.
Burke, Lauretta, Kathleen Reytar, Mark Spalding, and A Perry. 2011. "Reefs at risk." World
Resources Institute, Washington, DC 124.
Butler, Paul, Kevin Green, and Dale Galvin. 2013. "The Principles of Pride: The science behind
the mascots." Arlington, VA: Rare. Available online at http://www. rare. org/publications
Caras, Tamir, and Zohar Pasternak. 2009. "Long-term environmental impact of coral mining at
the Wakatobi marine park, Indonesia." Ocean & Coastal Management 52 (10):539-544.
Carlsson, Fredrik, Olof Johansson-Stenman, and Pham Khanh Nam. 2014. "Social preferences
are stable over long periods of time." Journal of Public Economics 117:104-114.
Carpenter, Jeffrey P, Glenn W Harrison, and John A List. 2005. Field experiments in economics:
Elsevier JAI.
Carpenter, Jeffrey, and Erika Seki. 2011. "Do social preferences increase productivity? Field
experimental evidence from fishermen in Toyama Bay." Economic Inquiry 49 (2):612-
630.
Carpenter, Kent E, Muhammad Abrar, Greta Aeby, Richard B Aronson, Stuart Banks, Andrew
Bruckner, Angel Chiriboga, Jorge Cortés, J Charles Delbeek, and Lyndon DeVantier.
2008. "One-third of reef-building corals face elevated extinction risk from climate change
and local impacts." Science 321 (5888):560-563.
Cecere, Grazia, Susanna Mancinelli, and Massimiliano Mazzanti. 2014. "Waste prevention and
social preferences: the role of intrinsic and extrinsic motivations." Ecological Economics
107:163-176.
Chan, Kai, Robert M Pringle, JAI Ranganathan, Carol L Boggs, Yvonne L Chan, Paul R Ehrlich,
Peter K Haff, Nicole E Heller, Karim Al‐khafaji, and Dena P Macmynowski. 2007.
"When agendas collide: Human welfare and biological conservation." Conservation
Biology 21 (1):59-68.
Charness, Gary, and Matthew Rabin. 2002. "Understanding social preferences with simple tests."
Quarterly Journal of Economics:817-869.
Choi, James J, David Laibson, Brigitte C Madrian, and Andrew Metrick. 2003. "Optimal
defaults." The American Economic Review 93 (2):180-185.

References
121
Chollett, Iliana, Lysel Garavelli, Shay O'Farrell, Laurent Cherubin, Thomas R Matthews, Peter J
Mumby, and Stephen J Box. 2017. "A Genuine Win‐Win: Resolving the “Conserve or
Catch” Conflict in Marine Reserve Network Design." Conservation Letters 10 (5):555-
563.
Chou, Cynthia. 2005. Indonesian sea nomads: money, magic and fear of the Orang Suku Laut:
Routledge.
Christie, Patrick, and Alan T White. 2007. "Best practices for improved governance of coral reef
marine protected areas." Coral Reefs 26 (4):1047-1056.
CIESIN. 2013. Low Elevation Coastal Zone: Urban-Rural Population and Land Area Estimates
Version 2. edited by Center for International Earth Science Information Network
(CIESIN) of Columbia University. Palisades, NY: NASA Socioeconomic Data and
Applications Center (SEDAC).
Cinner, Joshua. 2014. "Coral reef livelihoods." Current Opinion in Environmental Sustainability
7:65-71.
Clifton, Julian. 2003. "Prospects for co-management in Indonesia's marine protected areas."
Marine Policy 27 (5):389-395.
Clifton, Julian. 2013. "Refocusing conservation through a cultural lens: Improving governance in
the Wakatobi National Park, Indonesia." Marine Policy 41:80-86.
Clifton, Julian, and Chris Majors. 2012. "Culture, conservation, and conflict: perspectives on
marine protection among the Bajau of Southeast Asia." Society & Natural Resources 25
(7):716-725.
Cloern, James E, Paulo C Abreu, Jacob Carstensen, Laurent Chauvaud, Ragnar Elmgren, Jacques
Grall, Holly Greening, John Olov Roger Johansson, Mati Kahru, and Edward T
Sherwood. 2016. "Human activities and climate variability drive fast‐paced change across
the world's estuarine–coastal ecosystems." Global Change Biology 22 (2):513-529.
Clotfelter, Charles T. 1997. "The economics of giving." Giving better, giving smarter: Working
papers of the national commission on philanthropy and civic renewal:31-55.
Conservation, Gili Shark. 2017. "Gili Matra Marine Reserve." accessed 1/12/2017.
http://gilisharkconservation.com/gili-matra-marine-park/.
Cowling, Richard M. 2014. "Let's get serious about human behavior and conservation."
Conservation Letters 7 (3):147-148.
Cragg, John G. 1971. "Some statistical models for limited dependent variables with application to
the demand for durable goods." Econometrica: Journal of the Econometric Society:829-
844.
Croson, Rachel TA, Femida Handy, and Jen Shang. 2010. "Gendered giving: the influence of
social norms on the donation behavior of men and women." International Journal of
Nonprofit and Voluntary Sector Marketing 15 (2):199-213.
Crumpler, Heidi, and Philip J Grossman. 2008. "An experimental test of warm glow giving."
Journal of Public Economics 92 (5):1011-1021.
Davis, Douglas D, and Edward L Millner. 2005. "Rebates, matches, and consumer behavior."
Southern Economic Journal:410-421.
Dawes, Christopher T, James H Fowler, Tim Johnson, Richard McElreath, and Oleg Smirnov.
2007. "Egalitarian motives in humans." Nature 446 (7137):794-796.
Dawes, Christopher T, Peter John Loewen, and James H Fowler. 2011. "Social preferences and
political participation." The Journal of Politics 73 (3):845-856.

References
122
De Bruyn, Arnaud, and Sonja Prokopec. 2013. "Opening a donor’s wallet: The influence of
appeal scales on likelihood and magnitude of donation." Journal of Consumer
Psychology 23 (4):496-502.
de Morais, Gabriela Weber, Achim Schlüter, and Marco Verweij. 2015. "Can institutional change
theories contribute to the understanding of marine protected areas?" Global
Environmental Change 31:154-162.
De Oliveira, Angela, Rachel TA Croson, and Catherine C Eckel. 2009. "Are preferences stable
across domains? An experimental investigation of social preferences in the field."
Descombes, Patrice, Mary S Wisz, Fabien Leprieur, Valerianio Parravicini, Christian Heine,
Steffen M Olsen, Didier Swingedouw, Michel Kulbicki, David Mouillot, and Loïc
Pellissier. 2015. "Forecasted coral reef decline in marine biodiversity hotspots under
climate change." Global Change Biology 21 (7):2479-2487.
Dharmaratne, Gerard S, Francine Yee Sang, and Leslie J Walling. 2000. "Tourism potentials for
financing protected areas." Annals of Tourism Research 27 (3):590-610.
Di Minin, E, I Fraser, R Slotow, and DC MacMillan. 2013. "Conservation marketing and
education for less charismatic biodiversity and conservation businesses for sustainable
development." Animal Conservation 16 (3):263-264.
Diamantopoulos, A, B Schlegelmilch, and A Love. 1993. "Giving to charity: determinants of
cash donations through prompted giving." Marketing theory and application 4:133-142.
Dietz, Thomas, and Paul C Stern. 2002. New tools for environmental protection: Education,
information, and voluntary measures: National Academies Press.
Dolnicar, Sara, and Melanie Randle. 2007. "What motivates which volunteers? Psychographic
heterogeneity among volunteers in Australia." Voluntas: International Journal of
Voluntary and Nonprofit Organizations 18 (2):135.
Donaldson, Cam, Ruth Thomas, and David J Torgerson. 1997. "Validity of open-ended and
payment scale approaches to eliciting willingness to pay." Applied Economics 29 (1):79-
84.
Dudley, N, and S Stolton. 1999. "Conversion of paper parks to effective management: developing
a target. Report to the WWF-World Bank Alliance from the IUCN/WWF Forest
Innovation Project." The World Conservation Union (IUCN), Gland.
Dutra, Leo XC, Rodrigo H Bustamante, Ilva Sporne, Ingrid van Putten, Catherine M Dichmont,
Emma Ligtermoet, Marcus Sheaves, and Roy A Deng. 2015. "Organizational drivers that
strengthen adaptive capacity in the coastal zone of Australia." Ocean & Coastal
Management 109:64-76.
Eckel, Catherine C, and Philip J Grossman. 2003. "Rebate versus matching: does how we
subsidize charitable contributions matter?" Journal of Public Economics 87 (3):681-701.
Eckel, Catherine C, and Philip J Grossman. 2008. "Subsidizing charitable contributions: a natural
field experiment comparing matching and rebate subsidies." Experimental Economics 11
(3):234-252.
Edwards, Peter ET. 2009. "Sustainable financing for ocean and coastal management in Jamaica:
The potential for revenues from tourist user fees." Marine Policy 33 (2):376-385.
Eom, Young-Sook, and Douglas M Larson. 2006. "Valuing housework time from willingness to
spend time and money for environmental quality improvements." Review of Economics
of the Household 4 (3):205-227.
Fehr, Ernst, Helen Bernhard, and Bettina Rockenbach. 2008. "Egalitarianism in young children."
Nature 454 (7208):1079-1083.

References
123
Fehr, Ernst, and Urs Fischbacher. 2002. "Why social preferences matter–the impact of non‐selfish motives on competition, cooperation and incentives." The Economic Journal 112
(478):C1-C33.
Fehr, Ernst, and Urs Fischbacher. 2003. "The nature of human altruism." Nature 425 (6960):785-
791.
Fehr, Ernst, and Urs Fischbacher. 2004. "Social norms and human cooperation." Trends in
Cognitive Sciences 8 (4):185-190.
Fischbacher, Urs, Simon Gächter, and Ernst Fehr. 2001. "Are people conditionally cooperative?
Evidence from a public goods experiment." Economics Letters 71 (3):397-404.
Fisman, Raymond, Pamela Jakiela, and Shachar Kariv. 2014. The distributional preferences of
Americans. National Bureau of Economic Research Working Paper Series.
Flannery, Wesley, and Geraint Ellis. "Exploring the winners and losers of marine environmental
governance." Planning Theory & Practice 17 (1):121-151.
Foale, Simon, Dedi Adhuri, Porfiro Aliño, Edward H Allison, Neil Andrew, Philippa Cohen,
Louisa Evans, Michael Fabinyi, Pedro Fidelman, and Christopher Gregory. 2013. "Food
security and the Coral Triangle initiative." Marine Policy 38:174-183.
Forbes. 2012. "The best gift you can give your employees." accessed 22/1/2018.
https://www.forbes.com/sites/causeintegration/2012/06/26/the-best-gift-you-can-give-
your-employees/#41dca8275fa2.
Gallier, Carlo, Christiane Reif, and Daniel Römer. 2014. "Consistent or balanced? On the
dynamics of voluntary contributions." On the Dynamics of Voluntary Contributions
(September 1, 2014). ZEW-Centre for European Economic Research Discussion Paper
(14-060).
Garcia, Serge M, Jake Rice, and Anthony Charles. 2014. Governance of marine fisheries and
biodiversity conservation: interaction and co-evolution: John Wiley & Sons.
Gelcich, Stefan, Francisca Amar, Abel Valdebenito, Juan Carlos Castilla, Miriam Fernandez,
Cecilia Godoy, and Duan Biggs. 2013. "Financing marine protected areas through visitor
fees: Insights from tourists willingness to pay in Chile." Ambio 42 (8):975-984.
Gigerenzer, Gerd. 2008. "Moral intuition= fast and frugal heuristics?" In The cognitive science of
morality: intuition and diversity, 1-26. MIT Press.
Gilby, Ben L, Andrew D Olds, Rod M Connolly, Tim Stevens, Christopher J Henderson, Paul S
Maxwell, Ian R Tibbetts, David S Schoeman, David Rissik, and Thomas A Schlacher.
2016. "Optimising land-sea management for inshore coral reefs." PloS One 11
(10):e0164934.
Glaser, Marion, Patrick Christie, Karen Diele, Larissa Dsikowitzky, Sebastian Ferse, Inga
Nordhaus, Achim Schlüter, Kathleen Schwerdtner Mañez, and Christian Wild. 2012.
"Measuring and understanding sustainability-enhancing processes in tropical coastal and
marine social–ecological systems." Current Opinion in Environmental Sustainability 4
(3):300-308.
Google. 2017. [Google Maps of Indonesia]. Retrieved August 2017, from
https://www.google.com/maps/place/Indonesia
Green, Stuart J, Alan T White, Patrick Christie, Stacey Kilarski, Anna Blesilda T Meneses,
Giselle Samonte-Tan, Leah Bunce Karrer, Helen Fox, Stuart Campbell, and John D
Claussen. 2011. "Emerging marine protected area networks in the coral triangle: Lessons
and way forward." Conservation and Society 9 (3):173.

References
124
Groves, Craig, Laura Valutis, Diane Vosick, Betsy Neely, Kimberly Wheaton, Jerry Touval, and
Bruce Runnels. 2000. "Designing a geography of hope: a practitioner’s handbook for
ecoregional conservation planning." The Nature Conservancy, Arlington, VA.
Gurney, Georgina G, Joshua Cinner, Natalie C Ban, Robert L Pressey, Richard Pollnac, Stuart J
Campbell, Sonny Tasidjawa, and Fakhrizal Setiawan. 2014. "Poverty and protected areas:
an evaluation of a marine integrated conservation and development project in Indonesia."
Global Environmental Change 26:98-107.
Halim, Hengky Sumisto. 2017. "Scrutinizing Coastal Ecotourism in Gili Trawangan, Indonesia."
International Journal of Marine Science 7.
Halpern, Benjamin S. 2014. "Conservation: Making marine protected areas work." Nature 506
(7487):167-168.
Halpern, Benjamin S, Shaun Walbridge, Kimberly A Selkoe, Carrie V Kappel, Fiorenza Micheli,
Caterina D'agrosa, John F Bruno, Kenneth S Casey, Colin Ebert, and Helen E Fox. 2008.
"A global map of human impact on marine ecosystems." Science 319 (5865):948-952.
Hamilton, RJ, T Potuku, and JR Montambault. 2011. "Community-based conservation results in
the recovery of reef fish spawning aggregations in the Coral Triangle." Biological
Conservation 144 (6):1850-1858.
Hampton, Mark P, and Julia Jeyacheya. 2015. "Power, ownership and tourism in small islands:
evidence from Indonesia." World Development 70:481-495.
Harrison, Glenn W, and John A List. 2004. "Field experiments." Journal of Economic literature
42 (4):1009-1055.
Harrison, PA, PM Berry, G Simpson, JR Haslett, M Blicharska, M Bucur, R Dunford, B Egoh, M
Garcia-Llorente, and N Geamănă. 2014. "Linkages between biodiversity attributes and
ecosystem services: a systematic review." Ecosystem Services 9:191-203.
Hartmann, Patrick, Martin Eisend, Vanessa Apaolaza, and Clare D'Souza. 2017. "Warm glow vs.
altruistic values: How important is intrinsic emotional reward in proenvironmental
behavior?" Journal of Environmental Psychology.
Hedegaard, M, R Kerschbamer, and JR Tyran. 2011. Correlates and consequences of
distributional preferences: An internet experiment. Mimeo. Department of Economics,
University of Copenhagen.
Henrich, Joseph, Robert Boyd, Samuel Bowles, Colin Camerer, Ernst Fehr, and Herbert Gintis.
2004. Foundations of human sociality: ethnography and experiments in fifteen small-
scale societies. Oxford University Press Oxford.
Henrich, Joseph, Robert Boyd, Samuel Bowles, Colin Camerer, Ernst Fehr, Herbert Gintis, and
Richard McElreath. 2001. "In search of homo economicus: behavioral experiments in 15
small-scale societies." The American Economic Review 91 (2):73-78.
Hilmi, Nathalie, Alain Safa, U. Rashid Sumalia, and Mine Cinar. 2017. "Coral reefs management
and decision making tools." Ocean & Coastal Management 146:60-66. doi:
https://doi.org/10.1016/j.ocecoaman.2017.06.006.
Hoegh-Guldberg, Ove, Hans Hoegh-Guldberg, JEN Veron, Alison Green, Edgardo D Gomez, A
Ambariyanto, and L Hansen. 2009. "The Coral Triangle and climate change: ecosystems,
people and societies at risk." WWF Australia, Brisbane, 276 pp.
Hoeksema, Bert W. 2007. "Delineation of the Indo-Malayan centre of maximum marine
biodiversity: the Coral Triangle." In Biogeography, time, and place: distributions,
barriers, and islands, 117-178. Springer.
Holt, Diane, and David Littlewood. 2015. "Waste Livelihoods Amongst the Poor–Through the
Lens of Bricolage." Business Strategy and the Environment.

References
125
Hooker, Sascha K, Ana Cañadas, K David Hyrenbach, Colleen Corrigan, Jeff J Polovina, and
Randall R Reeves. 2011. "Making protected area networks effective for marine top
predators." Endangered Species Research 13 (3):203-218.
Huck, Steffen, and Imran Rasul. 2011. "Matched fundraising: Evidence from a natural field
experiment." Journal of Public Economics 95 (5):351-362.
Hughes, Terry P, Andrew H Baird, David R Bellwood, Margaret Card, Sean R Connolly, Carl
Folke, Richard Grosberg, Ove Hoegh-Guldberg, Jeremy BC Jackson, and Janice Kleypas.
2003. "Climate change, human impacts, and the resilience of coral reefs." Science 301
(5635):929-933.
Hughes, Terry P, David R Bellwood, Sean R Connolly, Howard V Cornell, and Ronald H
Karlson. 2014. "Double jeopardy and global extinction risk in corals and reef fishes."
Current Biology 24 (24):2946-2951.
IUCN. 2017. "Coastal and marine ecosystems." International Union for Conservation of Nature,
accessed August 29. https://www.iucn.org/regions/asia/our-work/coastal-and-marine-
ecosystems.
Jackson, Jeremy BC, Michael X Kirby, Wolfgang H Berger, Karen A Bjorndal, Louis W
Botsford, Bruce J Bourque, Roger H Bradbury, Richard Cooke, Jon Erlandson, and James
A Estes. 2001. "Historical overfishing and the recent collapse of coastal ecosystems."
Science 293 (5530):629-637.
James, Russell N, and Deanna L Sharpe. 2007. "The nature and causes of the U-shaped charitable
giving profile." Nonprofit and Voluntary Sector Quarterly 36 (2):218-238.
Johnson, Eric J, Steven Bellman, and Gerald L Lohse. 2002. "Defaults, framing and privacy:
Why opting in-opting out." Marketing Letters 13 (1):5-15.
Johnson, Eric J, and Daniel Goldstein. 2003. "Do defaults save lives?" Science 302 (5649):1338-
1340.
Johnson, Eric J, and Daniel G Goldstein. 2004. "Defaults and donation decisions."
Transplantation 78 (12):1713-1716.
Johnson, Eric J, John Hershey, Jacqueline Meszaros, and Howard Kunreuther. 1993. "Framing,
probability distortions, and insurance decisions." Journal of Risk and Uncertainty 7
(1):35-51.
Kamas, Linda, and Anne Preston. 2008. "What can social preferences tell us about charitable
giving? Evidence on responses to price of giving, matching, and rebates." Evidence on
Responses to Price of Giving, Matching, and Rebates (August 1, 2008).
Kamas, Linda, and Anne Preston. 2015. "Can social preferences explain gender differences in
economic behavior?" Journal of Economic Behavior & Organization 116:525-539.
Karlan, Dean, and John A List. 2007. "Does price matter in charitable giving? Evidence from a
large-scale natural field experiment." The American Economic Review 97 (5):1774-1793.
Karlan, Dean, John A List, and Eldar Shafir. 2011. "Small matches and charitable giving:
Evidence from a natural field experiment." Journal of Public Economics 95 (5):344-350.
Kerschbamer, Rudolf. 2010. The geometry of distributional preferences and a non-parametric
identification approach: Citeseer.
Kerschbamer, Rudolf. 2015. "The geometry of distributional preferences and a non-parametric
identification approach: The Equality Equivalence Test." European Economic Review
76:85-103.
Kessler, Judd, and Lise Vesterlund. 2015. "The external validity of laboratory experiments: The
misleading emphasis on quantitative effects." Handbook of Experimental Economic
Methodology, Oxford University Press, Oxford, UK.

References
126
Kesternich, Martin, Christiane Reif, and Dirk Rübbelke. 2017. "Recent Trends in Behavioral
Environmental Economics." Environmental and Resource Economics 67 (3):403-411.
doi: 10.1007/s10640-017-0162-3.
Kidd, Michael, Aaron Nicholas, and Birendra Rai. 2013. "Tournament outcomes and prosocial
behaviour." Journal of Economic Psychology 39:387-401.
Kraft-Todd, Gordon, Erez Yoeli, Syon Bhanot, and David Rand. 2015. "Promoting cooperation
in the field." Current Opinion in Behavioral Sciences 3:96-101.
Kummu, Matti, Hans De Moel, Gianluigi Salvucci, Daniel Viviroli, Philip J Ward, and Olli
Varis. 2016. "Over the hills and further away from coast: global geospatial patterns of
human and environment over the 20th–21st centuries." Environmental Research Letters
11 (3):034010.
Kurniawan, Fery, Luky Adrianto, Dietriech G Bengen, and Lilik Budi Prasetyo. 2016.
"Vulnerability assessment of small islands to tourism: The case of the Marine Tourism
Park of the Gili Matra Islands, Indonesia." Global Ecology and Conservation 6:308-326.
Lambarraa, Fatima, and Gerhard Riener. 2015. "On the norms of charitable giving in Islam: Two
field experiments in Morocco." Journal of Economic Behavior & Organization 118:69-
84.
Lee, Yu-Kang, and Chun-Tuan Chang. 2007. "Who gives what to charity? Characteristics
affecting donation behavior." Social Behavior and Personality: An International Journal
35 (9):1173-1180.
Levine, David K. 1998. "Modeling altruism and spitefulness in experiments." Review of
Economic Dynamics 1 (3):593-622.
Levitt, Steven D, and John A List. 2007. "What do laboratory experiments measuring social
preferences reveal about the real world?" Journal of Economic perspectives 21 (2):153-
174.
Lilley, Andrew, and Robert Slonim. 2014. "The price of warm glow." Journal of Public
Economics 114:58-74.
List, John A. 2006. "The behavioralist meets the market: Measuring social preferences and
reputation effects in actual transactions." Journal of political Economy 114 (1):1-37.
List, John A. 2008. "Introduction to field experiments in economics with applications to the
economics of charity." Experimental Economics 11 (3):203-212.
Loomis, John B. 1990. "Comparative reliability of the dichotomous choice and open-ended
contingent valuation techniques." Journal of Environmental Economics and Management
18 (1):78-85.
Lubchenco, Jane, Stephen R Palumbi, Steven D Gaines, and Sandy Andelman. 2003. "Plugging a
hole in the ocean: the emerging science of marine reserves." Ecological Applications 13
(1):S3-S7.
Luccasen, Andrew, and Philip J Grossman. 2017. "WARM‐GLOW GIVING: EARNED
MONEY AND THE OPTION TO TAKE." Economic Inquiry 55 (2):996-1006.
Lundquist, Carolyn J, and Elise F Granek. 2005. "Strategies for successful marine conservation:
integrating socioeconomic, political, and scientific factors." Conservation Biology 19
(6):1771-1778.
Macdonnell, Rhiannon, and Katherine White. 2015. "How construals of money versus time
impact consumer charitable giving." Journal of Consumer Research 42 (4):551-563.
Madrian, Brigitte C, and Dennis F Shea. 2001. "The power of suggestion: Inertia in 401 (k)
participation and savings behavior." The Quarterly Journal of Economics 116 (4):1149-
1187.

References
127
Maliao, Ronald J, Robert S Pomeroy, and Ralph G Turingan. 2009. "Performance of community-
based coastal resource management (CBCRM) programs in the Philippines: a meta-
analysis." Marine Policy 33 (5):818-825.
Margules, Chris R, and Robert L Pressey. 2000. "Systematic conservation planning." Nature 405
(6783):243.
Marian, Ilie. 2012. "Developing effective ocean governance." Geopolitics, History and
International Relations 4 (1):101.
Mascia, Michael B. 2003. "The human dimension of coral reef marine protected areas: recent
social science research and its policy implications." Conservation Biology 17 (2):630-
632.
Mascia, Michael B, J Peter Brosius, Tracy A Dobson, Bruce C Forbes, Leah Horowitz, Margaret
A McKean, and Nancy J Turner. 2003. "Conservation and the social sciences."
Conservation Biology 17 (3):649-650.
Mathieu, Laurence F, Ian H Langford, and Wendy Kenyon. 2003. "Valuing marine parks in a
developing country: a case study of the Seychelles." Environment and Development
Economics 8 (2):373-390.
McClanahan, Timothy R, Michael J Marnane, Joshua E Cinner, and William E Kiene. 2006. "A
comparison of marine protected areas and alternative approaches to coral-reef
management." Current Biology 16 (14):1408-1413.
McClelland, Robert, and Arthur C Brooks. 2004. "What is the real relationship between income
and charitable giving?" Public Finance Review 32 (5):483-497.
McKenzie-Mohr, Doug, and P Wesley Schultz. 2014. "Choosing effective behavior change
tools." Social Marketing Quarterly 20 (1):35-46.
Meier, Stephan. 2007. "Do subsidies increase charitable giving in the long run? Matching
donations in a field experiment." Journal of the European Economic Association 5
(6):1203-1222.
Merriam-Webster. 2017a. "Fee". In Merriam-Webster Distionary.
Merriam-Webster. 2017b. "Voluntary". In Merriam-Webster.
Middelveld, Senna, René van der Duim, and Rico Lie. 2016. "Reef Controversies: The Case of
Wakatobi National Park, Indonesia." Tourism Encounters and Controversies:
Ontological Politics of Tourism Development:39.
Moberg, Fredrik, and Carl Folke. 1999. "Ecological goods and services of coral reef ecosystems."
Ecological Economics 29 (2):215-233.
Mullainathan, Sendhil, and Richard H Thaler. 2000. Behavioral economics. National Bureau of
Economic Research.
Mumby, Peter J, Kenneth Broad, Daniel R Brumbaugh, Craig Dahlgren, Alastair R Harborne,
Alan Hastings, Katherine E Holmes, Carrie V Kappel, Fiorenza Micheli, and James N
Sanchirico. 2008. "Coral reef habitats as surrogates of species, ecological functions, and
ecosystem services." Conservation Biology 22 (4):941-951.
Nelson, Katherine M., Achim Schlüter, and Colin Vance. 2017a. "Distributional preferences and
donation behavior among marine resource users in Wakatobi, Indonesia." Ocean &
Coastal Management. doi: https://doi.org/10.1016/j.ocecoaman.2017.09.003.
Nelson, Katherine, Achim Schlüter, and Colin Vance. 2017b. "Funding Conservation Locally:
Insights from Behavioral Experiments in Indonesia." Conservation Letters. doi:
https://doi.org/10.1111/conl.12378.
Nichols, JE. 1995. "Growing From Good To Great: By focusing on renewal rather than
acquisition, you don't have to work as hard to replace large numbers of donors and you

References
128
have the opportunity to concentrate on upgrading current donors." Fund Raising
Management 26:24-24.
Nolan, Jessica M, and P Wesley Schultz. 2015. "Prosocial behavior and environmental action." In
The Oxford handbook of prosocial behavior.
Okunade, Albert A, and Robert L Berl. 1997. "Determinants of charitable giving of business
school alumni." Research in Higher Education 38 (2):201-214.
Oracion, Enrique G, Marc L Miller, and Patrick Christie. 2005. "Marine protected areas for
whom? Fisheries, tourism, and solidarity in a Philippine community." Ocean & Coastal
Management 48 (3):393-410.
Oxford. 2017. "Tax". In Oxford Dictionary.
Pandolfi, John M, Sean R Connolly, Dustin J Marshall, and Anne L Cohen. 2011. "Projecting
coral reef futures under global warming and ocean acidification." Science 333
(6041):418-422.
Park, C Whan, Sung Youl Jun, and Deborah J MacInnis. 2000. "Choosing what I want versus
rejecting what I do not want: An application of decision framing to product option choice
decisions." Journal of Marketing Research 37 (2):187-202.
Partelow, Stefan, and Katherine Nelson. forthcoming. "Social networks, collective action and the
evolution of governance for sustainable tourism on the Gili Islands, Indonesia." Marine
Policy.
Partelow, Stefan, Achim Schlüter, Henrik von Wehrden, Manuel Jänig, and Paula Senff. 2017.
"A Sustainability Agenda for Tropical Marine Science." Conservation Letters. doi:
https://doi.org/10.1111/conl.12351.
Partelow, Stefan, Henrik von Wehrden, and Olga Horn. 2015. "Pollution exposure on marine
protected areas: a global assessment." Marine Pollution Bulletin 100 (1):352-358.
Perkins, Helen E. 2010. "Measuring love and care for nature." Journal of Environmental
Psychology 30 (4):455-463.
Peters, Howard, and Julie P Hawkins. 2009. "Access to marine parks: A comparative study in
willingness to pay." Ocean & Coastal Management 52 (3):219-228.
Pimentel, David, Christa Wilson, Christine McCullum, Rachel Huang, Paulette Dwen, Jessica
Flack, Quynh Tran, Tamara Saltman, and Barbara Cliff. 1997. "Economic and
environmental benefits of biodiversity." BioScience 47 (11):747-757.
Pittman, Jeremy, and Derek Armitage. 2016. "Governance across the land-sea interface: A
systematic review." Environmental Science & Policy 64:9-17.
Poff, N LeRoy, J David Allan, Margaret A Palmer, David D Hart, Brian D Richter, Angela H
Arthington, Kevin H Rogers, Judy L Meyer, and Jack A Stanford. 2003. "River flows and
water wars: emerging science for environmental decision making." Frontiers in Ecology
and the Environment 1 (6):298-306.
Pomeroy, Robert S, Lani M Watson, John E Parks, and Gonzalo A Cid. 2005. "How is your MPA
doing? A methodology for evaluating the management effectiveness of marine protected
areas." Ocean & Coastal Management 48 (7):485-502.
Prince, Raymond, Michael McKee, Shaul Ben-David, and Mark Bagnoli. 1992. "Improving the
contingent valuation method: Implementing the contribution game." Journal of
Environmental Economics and Management 23 (1):78-90.
Rai, Rajesh Kumar, Priya Shyamsundar, Mani Nepal, and Laxmi Dutt Bhatta. 2015. "Differences
in demand for watershed services: Understanding preferences through a choice
experiment in the Koshi Basin of Nepal." Ecological Economics 119:274-283.

References
129
Reddy, Sheila MW, Jensen Montambault, Yuta J Masuda, Elizabeth Keenan, William Butler,
Jonathan RB Fisher, Stanley T Asah, and Ayelet Gneezy. 2016. "Advancing Conservation
by Understanding and Influencing Human Behavior." Conservation Letters.
Reinstein, David, and Gerhard Riener. 2012. "Decomposing desert and tangibility effects in a
charitable giving experiment." Experimental Economics 15 (1):229-240.
Reuter, Kim E, Daniel Juhn, and Hedley S Grantham. 2016. "Integrated land-sea management:
recommendations for planning, implementation and management." Environmental
Conservation 43 (2):181-198.
Rife, Alexis N, Brad Erisman, Alexandra Sanchez, and Octavio Aburto‐Oropeza. 2013. "When
good intentions are not enough… Insights on networks of “paper park” marine protected
areas." Conservation Letters 6 (3):200-212.
Rivera-Planter, Marisol, and Carlos Muñoz-Piña. 2005. "Fees for reefs: economic instruments to
protect Mexico’s marine natural areas." Current Issues in Tourism 8 (2-3):195-213.
Roberts, Callum M, Colin J McClean, John EN Veron, Julie P Hawkins, Gerald R Allen, Don E
McAllister, Cristina G Mittermeier, Frederick W Schueler, Mark Spalding, and Fred
Wells. 2002. "Marine biodiversity hotspots and conservation priorities for tropical reefs."
Science 295 (5558):1280-1284.
Roberts, Michaela, Nick Hanley, and Will Cresswell. 2017. "User fees across ecosystem
boundaries: Are SCUBA divers willing to pay for terrestrial biodiversity conservation?"
Journal of Environmental Management 200:53-59.
Rode, Julian, Erik Gómez-Baggethun, and Torsten Krause. 2015. "Motivation crowding by
economic incentives in conservation policy: A review of the empirical evidence."
Ecological Economics 117:270-282.
Roe, Brian E, and David R Just. 2009. "Internal and external validity in economics research:
Tradeoffs between experiments, field experiments, natural experiments, and field data."
American Journal of Agricultural Economics 91 (5):1266-1271.
Sather, Clifford. 1997. The Bajau Laut: Adaptation, history, and fate in a maritime fishing society
of South-eastern Sabah: Oxford University Press, USA.
Satria, Arif, Yoshiaki Matsuda, and Masaaki Sano. 2006. "Questioning community based coral
reef management systems: case study of Awig-Awig in Gili Indah, Indonesia."
Environment, Development and Sustainability 8 (1):99-118.
Scarlett, L, J Boyd, A Brittain, L Shabman, and T Brennan. 2013. "Catalysts for conservation:
Exploring behavioral science insights for natural resource investments." Resources for
the Future, Washington, DC.
Schlegelmilch, Bodo B, and AC Tynan. 1989. "The scope for market segmentation within the
charity market: an empirical analysis." Managerial and Decision Economics 10 (2):127-
134.
Schmuck, Peter, and Wesley P Schultz. 2012. Psychology of Sustainable Development: Springer
Science & Business Media.
Schultz, P. 2011. "Conservation means behavior." Conservation Biology 25 (6):1080-1083.
Schumacher, Heiner, Iris Kesternich, Michael Kosfeld, and Joachim Winter. 2016. "One, Two,
Many–Insensitivity to Group Size in Games with Concentrated Benefits and Dispersed
Costs." The Review of Economic Studies.
Schumacher, Heiner, Iris Kesternich, Michael Kosfeld, and Joachim K Winter. 2014. "Us and
Them: Distributional Preferences in Small and Large Groups."
Secretariat, CBD. 1992. "Convention on biological diversity." Convention on Biological
Diversity.

References
130
Shang, Jen, and Rachel Croson. 2009. "A field experiment in charitable contribution: The impact
of social information on the voluntary provision of public goods." The Economic Journal
119 (540):1422-1439.
Sherif, Muzafer, Daniel Taub, and Carl I Hovland. 1958. "Assimilation and contrast effects of
anchoring stimuli on judgments." Journal of Experimental Psychology 55 (2):150.
Shogren, Jason F, Gregory M Parkhurst, and Prasenjit Banerjee. 2010. "Two cheers and a qualm
for behavioral environmental economics." Environmental and Resource Economics 46
(2):235-247.
Shogren, Jason F, and Laura O Taylor. 2008. "On behavioral-environmental economics." Review
of Environmental Economics and Policy 2 (1):26-44.
Simmons, Walter O, and Rosemarie Emanuele. 2007. "Male-female giving differentials: are
women more altruistic?" Journal of Economic Studies 34 (6):534-550.
Simon, Herbert A. 1972. "Theories of bounded rationality." Decision and Organization 1
(1):161-176.
Smith, Gerald E, and Paul D Berger. 1995. "The Impact of Framing, Anchorpoints, and Frames
of Reference on Direct Mail Char Contributions." Advances in Consumer Research 22
(1).
Smith, Robert J, Diogo Veríssimo, Nigel Leader-Williams, Richard M Cowling, and Andrew T
Knight. 2009. "Let the locals lead." Nature 462 (7271):280-281.
Smith, Vernon L. 1998. "The two faces of Adam Smith." Southern Economic Journal:2-19.
Spergel, Barry, and Melissa Moye. 2004. "Financing Marine Conservation: A menu of options."
Staub, Ervin. 1974. "Helping a distressed person: Social, personality, and stimulus determinants."
Advances in Experimental Social Psychology 7:293-341.
Sterling, Eleanor J, Erin Betley, Amanda Sigouin, Andres Gomez, Anne Toomey, Georgina
Cullman, Cynthia Malone, Adam Pekor, Felicity Arengo, and Mary Blair. 2017.
"Assessing the evidence for stakeholder engagement in biodiversity conservation."
Biological Conservation 209:159-171.
Stithou, Mavra, and Riccardo Scarpa. 2012. "Collective versus voluntary payment in contingent
valuation for the conservation of marine biodiversity: an exploratory study from
Zakynthos, Greece." Ocean & Coastal Management 56:1-9.
Stoms, David M, Frank W Davis, Sandy J Andelman, Mark H Carr, Steven D Gaines, Benjamin
S Halpern, Rainer Hoenicke, Scott G Leibowitz, Al Leydecker, and Elizabeth MP Madin.
2005. "Integrated coastal reserve planning: making the land–sea connection." Frontiers
in Ecology and the Environment 3 (8):429-436.
Straughan, Robert D, and James A Roberts. 1999. "Environmental segmentation alternatives: a
look at green consumer behavior in the new millennium." Journal of Consumer
Marketing 16 (6):558-575.
Tallis, Heather, Zach Ferdana, and Elizabeth Gray. 2008. "Linking terrestrial and marine
conservation planning and threats analysis." Conservation Biology 22 (1):120-130.
Terk, Elizabeth, and Nancy Knowlton. 2010. "The role of SCUBA diver user fees as a source of
sustainable funding for coral reef marine protected areas." Biodiversity 11 (1-2):78-84.
Thaman, Baravi, John D Icely, Bruno DD Fragoso, and Joeli Veitayaki. 2016. "A comparison of
rural community perceptions and involvement in conservation between the Fiji Islands
and Southwestern Portugal." Ocean & Coastal Management 133:43-52.
Thur, Steven M. 2010. "User fees as sustainable financing mechanisms for marine protected
areas: An application to the Bonaire National Marine Park." Marine Policy 34 (1):63-69.

References
131
Togridou, Anatoli, Tasos Hovardas, and John D Pantis. 2006. "Determinants of visitors'
willingness to pay for the National Marine Park of Zakynthos, Greece." Ecological
Economics 60 (1):308-319.
Treml, Eric A, Pedro IJ Fidelman, Stuart Kininmonth, Julia A Ekstrom, and Örjan Bodin. 2015.
"Analyzing the (mis) fit between the institutional and ecological networks of the Indo-
West Pacific." Global Environmental Change 31:263-271.
Tversky, Amos, and Daniel Kahneman. 1975. "Judgment under uncertainty: Heuristics and
biases." In Utility, Probability, and Human Decision Making, 141-162. Springer.
Van Exel, NJA, Werner BF Brouwer, Bernard van den Berg, and Marc A Koopmanschap. 2006.
"With a little help from an anchor: discussion and evidence of anchoring effects in
contingent valuation." The Journal of Socio-economics 35 (5):836-853.
Veríssimo, Diogo. 2013. "Influencing human behaviour: an underutilised tool for biodiversity
management." Conservation Evidence 10:29-31.
Veríssimo, Diogo, Hamish A Campbell, Simon Tollington, Douglas C MacMillan, and Robert J
Smith. 2018. "Why do people donate to conservation? Insights from a ‘real
world’campaign." PloS One 13 (1):e0191888.
Verissimo, Diogo, Douglas C MacMillan, and Robert J Smith. 2011. "Toward a systematic
approach for identifying conservation flagships." Conservation Letters 4 (1):1-8.
Veron, JEN, Lyndon M Devantier, Emre Turak, Alison L Green, Stuart Kininmonth, Mary
Stafford-Smith, and Nate Peterson. 2009. "Delineating the coral triangle." Galaxea,
Journal of Coral Reef Studies 11 (2):91-100.
Vollan, Björn. 2008. "Socio-ecological explanations for crowding-out effects from economic
field experiments in southern Africa." Ecological Economics 67 (4):560-573.
Von Heland, Franciska, and Julian Clifton. 2015. "Whose Threat Counts? Conservation
Narratives in the Wakatobi National Park, Indonesia." Conservation and Society 13
(2):154.
von Heland, Franciska, Julian Clifton, and Per Olsson. 2014. "Improving stewardship of marine
resources: linking strategy to opportunity." Sustainability 6 (7):4470-4496.
Walmsley, SF, and AT White. 2003. "Influence of social, management and enforcement factors
on the long-term ecological effects of marine sanctuaries." Environmental Conservation
30 (4):388-407.
Whitney, Charlotte, Nathan Bennett, Natalie Ban, Edward Allison, Derek Armitage, Jessica
Blythe, Jenn Burt, William Cheung, Elena Finkbeiner, and Maery Kaplan-Hallam. 2017.
"Adaptive capacity: from assessment to action in coastal social-ecological systems."
Ecology and Society 22 (2).
Wiepking, Pamala, and René Bekkers. 2012. "Who gives? A literature review of predictors of
charitable giving. Part Two: Gender, family composition and income." Voluntary Sector
Review 3 (2):217-245.
Wright, A. J., D. Verissimo, K. Pilfold, E. C. M. Parsons, K. Ventre, J. Cousins, R. Jefferson, H.
Koldewey, F. Llewellyn, and E. McKinley. 2015. "Competitive outreach in the 21st
century: Why we need conservation marketing." Ocean & Coastal Management 115:41-
48. doi: 10.1016/j.ocecoaman.2015.06.029.
Wright, Andrew J, Diogo Veríssimo, Kathleen Pilfold, ECM Parsons, Kimberly Ventre, Jenny
Cousins, Rebecca Jefferson, Heather Koldewey, Fiona Llewellyn, and Emma McKinley.
2015. "Competitive outreach in the 21st century: Why we need conservation marketing."
Ocean & Coastal Management 115:41-48.

References
132
Yen, Steven T, Peter C Boxall, and Wiktor L Adamowicz. 1997. "An econometric analysis of
donations for environmental conservation in Canada." Journal of Agricultural and
Resource Economics:246-263.
Young, Oran R, Gail Osherenko, Julia Ekstrom, Larry B Crowder, John Ogden, James A Wilson,
Jon C Day, Fanny Douvere, Charles N Ehler, and Karen L McLeod. 2007. "Solving the
crisis in ocean governance: place-based management of marine ecosystems."
Environment: Science and Policy for Sustainable Development 49 (4):20-32.