Assessment of human and physical factors influencing spatial ...
Upload
khangminh22Category
view
0download
0
13353
ASSESSMENT OF FACTORS INFLUENCING FARMERS’ NUTRITION KNOWLEDGE AND INTAKE OF TRADITIONAL AFRICAN VEGETABLES
IN TANZANIA
Kimambo JJ1, Kavoi MM1*, Macharia J2 and N Nenguwo 2
Kavoi M Muendo
Johnson James Kimambo John Macharia Ngoni Nenguwo
*Corresponding author: [email protected] 1Department of Horticulture, Jomo Kenyatta University of Agriculture and Technology, Nairobi, Kenya 2World Vegetable Center, Eastern and Southern Africa, P.O. Box 10 Duluti, Arusha, Tanzania
13354
ABSTRACT Traditional African Vegetables (TAVs) form a significant component of many families’ diets in Tanzania. Traditional African Vegetables contribute to reduction of malnutrition, stunting and poor health among consumers by providing vitamins and essential minerals in family diets. However, the consumption of vegetables is still below the per capita per day intake level recommended by World Health Organization and Food and Agriculture Organization, causing millions of deaths annually due to nutrient-deficiency related diseases. This study examined the factors that influence the nutrition knowledge, frequency intake and farming households’ attitudes towards consumption of traditional vegetables. The Standard Poison and the Generalized Poison models were used for analysis. Factor analysis was used to assess the attitudes towards TAVs consumption. Data were collected from randomly selected 63 households in Arumeru District of Tanzania in the months of July to November 2015. Generalized Poison model results showed that gender of the respondent, years of schooling, age of the respondent, household size and TAVs farm size influenced farmers’ nutrition knowledge. Frequency intake of TAVs is influenced by the farmers’ age, annual household income, household size, TAVs farm size and market price of TAVs. Factor analysis results indicated that medicinal properties of traditional vegetables positively influenced farmers’ intake of vegetables. The “health factor” accounted for 31.4% of the total variance in the principal components analysis. ‘Personal perception factor’ accounted for 13.79% whereas ‘personal taste factor’ accounted for 12.71% of the total variance. It was concluded that rural farming households consume traditional vegetables majorly because of their health attributes. Thus, there is need to improve medicinal and nutritional knowledge of these crops among households. These findings imply that consumption of TAVs can be enhanced by educating households on nutrition importance and medicinal attributes of TAVs. Besides, farmers need training on simple but user-friendly technologies that could prolong storage and preserve freshness as well as nutritional contents of traditional vegetables. Key words: Traditional vegetables, nutrition knowledge, frequency intake, farmers’
attitude, Arumeru District
13355
INTRODUCTION Most of the vegetables consumed by urban residents in sub-Saharan Africa are grown by small-scale farmers in the rural areas [1]. Vegetables provide farmers with higher income per unit of input compared to staple crops especially for growers with small arable land [2]. Traditional African Vegetables (TAVs) have gained popularity due to their role in providing vitamins and essential minerals in family diets for many years [3]. The increase in production of TAVs has been brought about by lower usage of farm inputs as compared to global vegetables. Of all the TAVs cultivated, almost 50% are sold in local markets and the remaining 50% are either consumed at home or given out as a gift [1]. This shows the importance of TAVs and the need to improve their consumption. Consumers in many parts of the world derive a major portion of their diets from vegetables which has been found to play a significant role in human nutrition, especially as an important source of vitamins, essential minerals, dietary fiber, and various phytochemicals and antioxidants [4, 5]. Thus, TAVs form a significant source of food and nutritional security in rural areas of sub-Saharan African (SSA). However, most SSA countries have not prioritized these TAVs in their policies, crop research, training and development programs [6, 7, 8]. Ultimately, several studies have noted that the frequency of intake of TAVs has been declining over the years [9,10, 11]. Decline in use of TAVs by many rural communities has resulted in poor diets and increased incidence of nutritional deficiency disorders and diseases among the most vulnerable groups – women and children under five years [12]. Low consumption of TAVs could also be due to the negative perception held by some consumers. Some people view TAVs as ‘poverty food’ or ‘food for the backward’, a notion that explains why some consumers are not positively inclined to them [13]. Even though some consumers are aware of the benefits of TAVs, literature suggests that some have both positive and negative attitudes towards them [13]. Ultimately, efforts are needed to increase intake of traditional vegetables due to their nutritive and health values. The objective of this study, therefore, was to determine the factors influencing farmers’ nutrition knowledge and consumption of traditional African vegetables in Arumeru District of Tanzania. Vegetables play a significant role in human nutrition, especially as important sources of vitamins, essential minerals, dietary fiber, and various phytochemicals [4]. However, Traditional vegetables contain more of these nutrients as compared to global vegetables such as cabbages and kales [14]. Daily diet consumption of traditional vegetables has been strongly associated with overall good health, improvement of gastrointestinal function, good vision, and reduced risk of some forms of cancer, and other chronic diseases [15]. Women and children in particular can benefit from a diet with high vegetable content (for example, good vision and improved gastrointestinal), especially during later stages of pregnancy and in lactation period [16]. However, consumption of TAVs is low and varies widely with geographical region, nationality and local customs. In Africa, vegetable consumption per capita has been reported [17] to be below the minimum recommended intake of 400 g per capita per day [18]. Though consumers in Tanzania are still below the recommended intake levels of vegetables, there have been some improvements in recent years. For example, between the year 1993 and 2000, vegetable consumption grew from 107 to 113 g per capita per day [19] while in 2007,
13356
vegetable consumption reached 200 g per capita per day among high income consumers [1]. However, for most medium and low-income consumers, vegetable consumption per capita per day is still below the recommended levels. This situation has led to high prevalence of malnutrition, stunted growth and general poor health in the region [20]. Forecasts [21] have shown that there will be 18% increase in the number of malnourished children in sub-Saharan Africa from the year 2001 to 2020. Hence, understanding the factors that determine household’s knowledge, frequency of TAVs intake and farmers’ attitudes towards TAVs consumption is essential for both promotion and nutrition improvement for rural households. The most consumed TAVs in Tanzania are: African Nightshade (Solanum spp.), Amaranths (Amaranthus spp.), Ethiopian Mustard (Brassica carinata) and African Eggplant (Solanum spp.). MATERIALS AND METHODS Theoretical Framework Models for count data have been prominent in many empirical studies of economic behavior, for example, in health economics (in cases with numbers of visits to health facilities), management (in cases with numbers of patents), and industrial organization (in cases with numbers of entrants to markets). A common foundational building block in this modeling framework is the Poisson regression model. However, it has implicit restrictions on the distribution of observed counts. As a result, researchers routinely employ more general specifications, usually the negative binomial (NB) model which is the standard choice for a basic count data model. However, when data preclude zero responses, negative binomial regression is also inappropriate [22]. Hence, Generalized Poisson Regression (GPR) model is recommended for analytical estimation. Thus, this study determined the factors influencing nutrition knowledge and frequency intake of TAVs by using generalized Poisson model. The probability distribution function of generalized Poisson distribution can be defined [22, 23] as:
!(#; %, ') = '*' + %,-./
-. 01234546.7.8
-.! (1)
Log-likelihood (LL) transformation for the above generalized Poisson probability distribution is given as:
ℒ(;, <; #) = ∑ >#,?@ 3A.
BCDA.8 + (#, − 1)?@(1 + <#,) − G
4A.(BCD-.)
BCDA.H − ?@Γ(#, + 1)JK
,LB (2) Or in terms of MN as
ℒ(N, <; #) = ∑ O#,?@ P012*1.
ˊR/
BCD012*1.ˊ/S + (#, − 1)?@(1 + <#,) − T
012*1.ˊR/(BCD-.)
BCD012*1.ˊR/
U − ?@Γ(#B + 1)VK,LB (3)
Where: #,= random response variable corresponding to the number of nutrition knowledge known to respondent (i)
x =covariate vectors of explanatory variables N= linear predictor of random response variable
13357
This study used this framework to model the factors affecting nutrition knowledge and frequency intake of TAVs by farming households. Model Specification: Factors Affecting Consumers’ Nutrition Knowledge In an effort to assess the level of nutrition knowledge of TAVs by different rural household consumers, this study adopted five scale levels [24]: i) understanding of nutrition terms, ii) awareness of dietary recommendations, iii) knowledge of foods as source of nutrients, iv) ability to apply information on choices; and v) awareness of diet-disease associations. Respondents were then asked whether or not they knew each of the nutrition scales and its implication. Depending on the responses for each case interviewed, the total nutrition knowledge scales were tallied. The dependent variable was the number of nutrition knowledge scales the household was aware of and had an understanding of its implication. The model independent variables were the various socio-economic factors as shown in equation 4. A key null hypothesis was that education and income of the household jointly had no effect on farmers’ nutrition knowledge. The study estimated the following generalized Poisson regression model for household nutrition knowledge: Scales of knowledge in nutrition known (y) = f (lnage, gender, education, lnincome, work status, type of occupation, social capital) + e (4) Model Specification: Factors Influencing Frequency of Intake of TAVs In order to assess the factors influencing the frequency of intake of nutrient-dense vegetables, this study specified the dependent variable as the average number of times TAVs were consumed in the household per week. Hence, the dependent variable for the frequency of intake was a number such as 0 times a week, 3 times a week and so on. This study used generalized Poisson regression model to isolate the determinants of the frequency of intake because the dependent variable is a count data variable. The explanatory variables in the model were the socio-economic factors of the respondents as shown in equation 5. It was hypothesized that age and annual income of the household jointly had no effect on the frequency intake of TAVs. The model estimated was specified as: Frequency of TAV intake (Z) = f (lnage, gender of household head, household size, lnincome, occupation, lnfsize, education, distance to market) + e (5) Farmers’ Attitudes towards Traditional African Vegetables (TAVs) Factor analysis was used to identify latent dimensions underlying the different variables that measured various attributes preferred by rural households. Responses on a five-point Likert scale were subjected to principal component factor analysis (PCA) with Varimax rotation. The component factors were subjected to the Kaiser-Meyer-Olkin and Bartlett’s test (KMO and Bartlett’s test) to determine the sampling adequacy. A KMO measure greater than 0.7 is preferable and is inadequate, if it is less than 0.5 [25]. Kaiser-Meyer-Olkin test tells us whether or not enough items are predicted by each factor. This procedure was adopted to analyze the attributes that farmer households preferred so as to increase the frequency intake of nutrient-dense vegetables.
13358
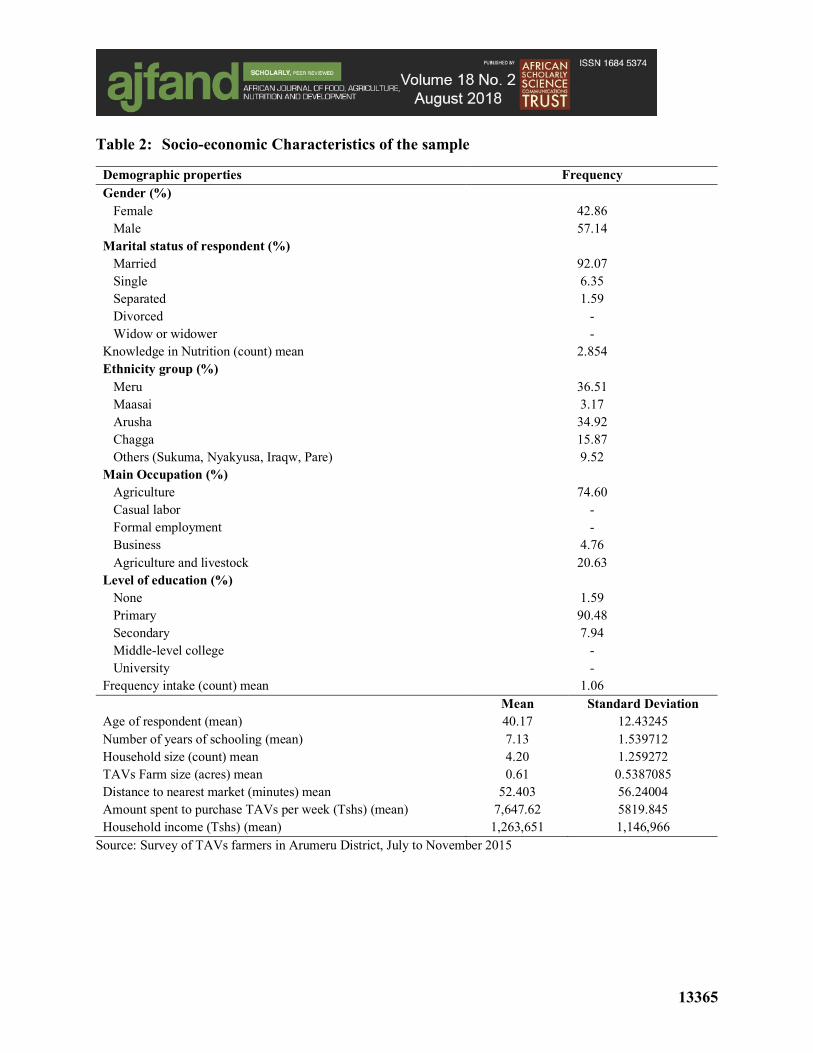
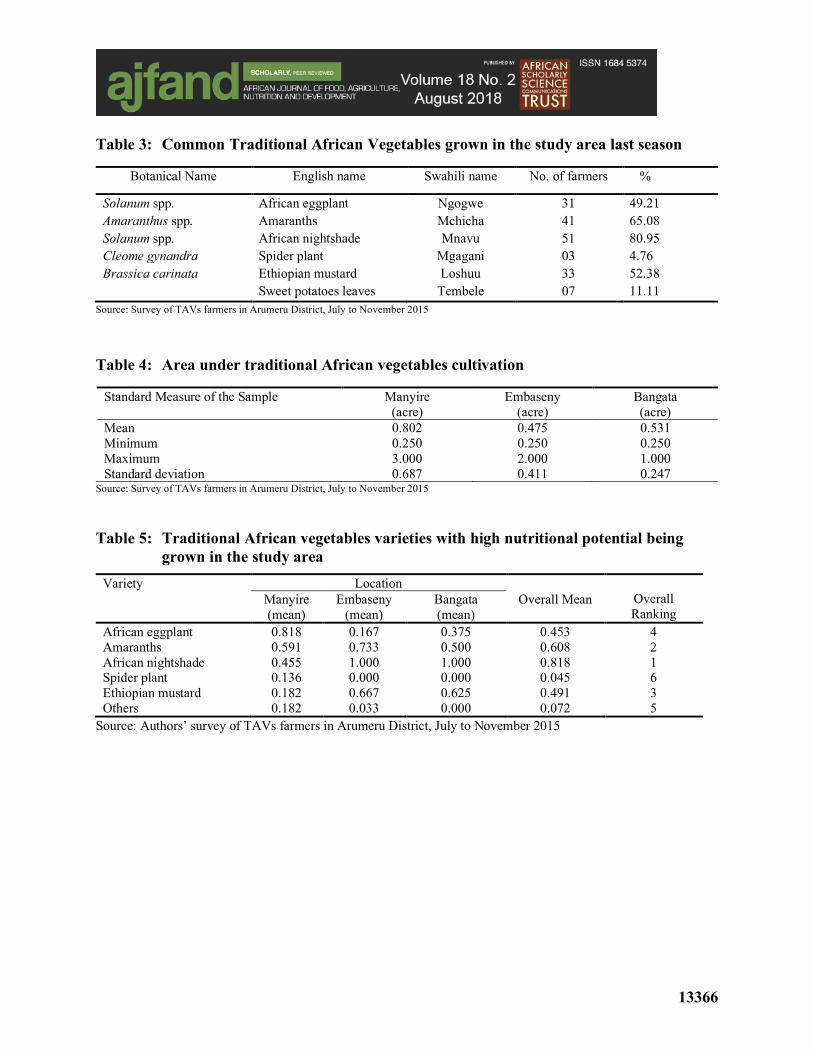
Study Area, Data and Variables Data for this study were collected from farming households in Arumeru District, Tanzania. It is one of the districts where a project called “Improving Income and Nutrition in Eastern and Southern Africa by Enhancing Vegetable-based Farming and Food Systems in Peri-urban Corridors (VINESA) is being implemented. Arumeru is one of the five districts in Arusha Region of Tanzania. It is bordered to the North and West by the Monduli District, to the East by the Kilimanjaro Region and to the South by the Arusha District. The district lies between longitudes 36.5o and 37.5o East and latitudes 3.5o and 3.7o South of the Equator. The economy of the district is almost entirely agricultural, consisting mostly of subsistence farming and livestock raising. The three major ethnic groups in the district are Wameru, Waarusha and the pastoralist Maasai. The study was undertaken for five months from July to November, 2015. Three (3) villages (Manyire, Embaseny and Bangata) were purposively selected for the study because they are the main producers of vegetables in Arusha region. Records of farmers developed by the project were used as the sampling frame. Random sampling technique was used to select study cases from the villages. A total of 63 households who grew TAVs for sale in the local markets were selected. A structured questionnaire was then administered to the sampled cases through face-to-face interviews. Variables used for analysis were then obtained as shown in Table 1. STATA software was then used for statistical analysis of the data. RESULTS AND DISCUSSION Descriptive Statistics Results Table 2 shows the socioeconomic characteristics of the respondents in the study area. These results demonstrated that the majority of farmers interviewed, 57% were males and 43% were females. The majority (90%) of the farmers who produced TAVs had primary school education. Only a few (7.94%) had secondary education and none had middle-level College or university education. The mean age of the farmers was 40 years implying that youthful farmers (35 years or less) were relatively few. Hence, there is need to promote youth involvement in agriculture particularly in growing of TAVs. This trend raises a concern that if the youth group is not involved, there might be food and nutrition insecurity in the near future. It was noted that farming was the main occupation for 75% of the farmers and, therefore, most farmers derived the greatest proportion of their income from farming activities. About 37% and 35% of the farmers were from Meru and Arusha ethnic groups, respectively. The study also found that only 3% of the sampled farmers who produced and consumed traditional vegetables were from the Maasai ethnic community. The mean yearly income for farmers was Tshs 1,263,651 (US$ 577.54).The results further showed that farmers obtained TAVs from their farms, while a few spent Tshs 7,650 (US$ 3.50) per week to buy them from local markets. Table 3 shows the common traditional African vegetables grown in the study area. The results indicated that African nightshade is grown by most farmers (81%) followed by Amaranths (65%), Ethiopian mustard (52%), African eggplant (49% ), sweet potato leaves (11% ) and spiderplant (5% ). Table 4 shows the area (acre) under TAVs in the study area. The results showed that the mean area put under TAVs in each of the villages were Manyire (0.802), Bangata (0.531) and Embaseny (0.475). In general, Manyire
13359
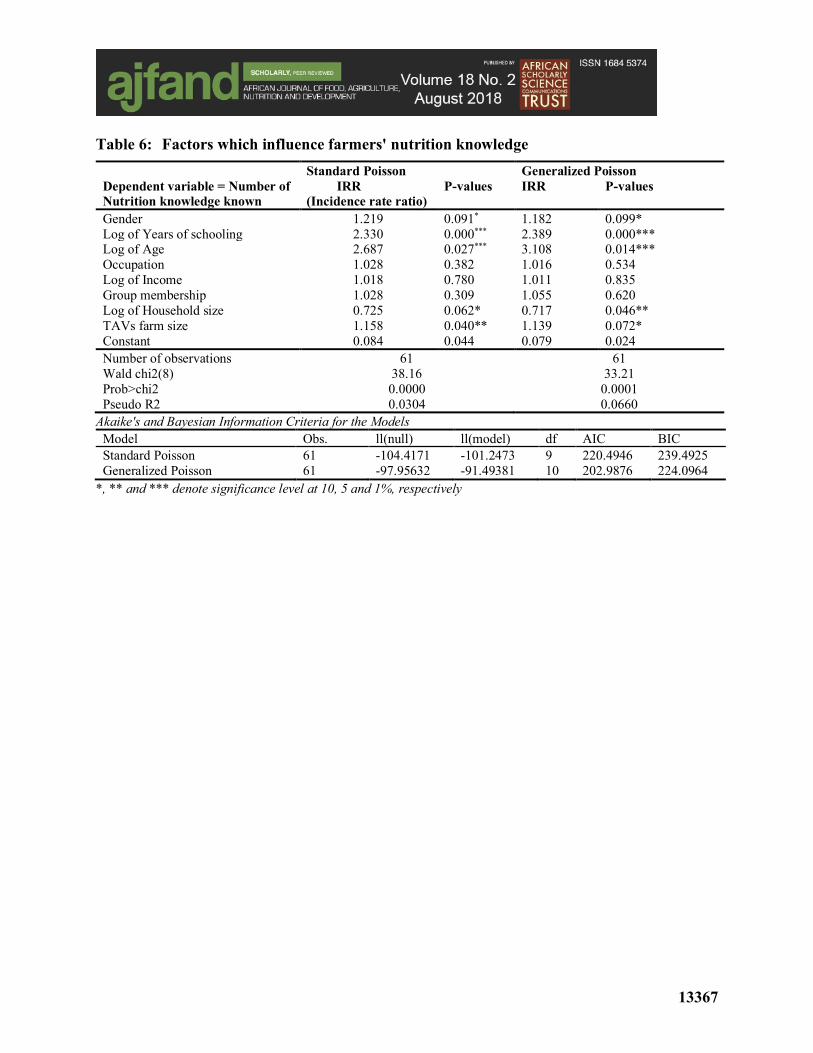
farmers dedicated more area to grow TAVs compared to Embaseny and Bangata farmers. Embaseny and Bangata villages are located at the slopes of Mount Meru where many farmers are still growing coffee. Bangata, farmers grow both TAVs and exotic vegetables such as cabbages, kales etcetera. Many farmers engaged in exotic vegetables usually do not grow TAVs. Table 5 shows the mean rankings of TAVs varieties with high nutritional potential cultivated in the study area based on the opinion of respondents. The results showed that in Manyire village, African eggplant had high nutritional potential (0.818) followed by Amaranth (0.591). In Embaseny village, African nightshade stood out in terms of nutritional potential (1.000) followed by Amaranths (0.733). In Bangata village, African nightshade had the highest nutritional potential (1.000) followed by Ethiopian mustard (0.625). Overall, African nightshade was ranked first followed by Amaranth in terms of nutritional potential among the TAVs cultivated in the study area. When compared to nutrient values obtained from literature [26], farmers’ opinion was valid to some extent. For example, Amaranth had the highest Ca, Mg, and Zn content in comparison to other TAVs genera. African Nightshade had the highest K, Fe and protein content, whereas African eggplant had the highest amount of carotenoids [26]. Factors Affecting TAV Nutrition knowledge Knowledge in nutrition was counted with the range of zero to five. Respondents were asked five questions to assess their knowledge in nutrition and scores from each case were added together. The results showed that the mean nutrition knowledge by was 57.2% (that is 2.86 out of 5). Hence, farmers had moderate awareness of TAV nutrition knowledge. In order to examine the factors influencing nutrition knowledge among TAVs producers, models for count data that take the number of nutrition knowledge scale as a dependent variable was used to fit a standard Poisson regression model and generalized Poisson regression Model. The results of the fitted regression models are shown in Table 6. The Prob-chi2 test statistic shows that both the models fitted the data well (p = 0.0000 and 0.0001, respectively). The mean deviance and the Pearson chi-square ratio (the Pearson chi-square value divided by its degrees of freedom) were used to assess the degree of fit of the standard Poisson model. The estimated deviance and Pearson ratios are shown below: Deviance/df = 30.81093633/52 = 0.592518 Pearson/df = 25.95179108/52 = 0.4990729 These results showed that both ratios are significantly smaller than 1, indicating that there is evidence of under-dispersion. Hence, the standard Poisson model does not fit the data well. The results of Akaike Information Criterion (AIC) and Bayesian Information Criterion (BIC) tests of goodness of fit for the two models were also shown in Table 6. Lower values of either Akaike Information Criterion (AIC) or Bayesian Information Criterion (BIC) indicate a better fit. The results showed that generalized Poisson model was a better fit for the data. Consequently, the discussion below is based on the results of generalized Poisson model.
13360
Gender of the respondent significantly influenced (p <0.1) the number of nutrition knowledge scales known to respondents. This implies that, gender of the respondent increased the expected knowledge in nutrition by some 18%. Thus, the expected number of nutrition knowledge scales known by males was higher relative to that of the females [27]. A similar finding was observed in a study [28] where the expected number of forest benefits knowledge scales known by male respondents was higher relative to the number of benefits known by female respondents. Years of schooling significantly (p<0.001) influenced nutrition knowledge. The more the number of the years spent in school by the respondent the more likely that the farmer will possess higher levels of nutrition knowledge. This showed that education plays an important role in sourcing and accessing nutrition knowledge. The less educated farmers are likely to be associated with less nutrition knowledge. This implies that less educated farmers most likely are not well informed of the benefits they could possibly accrue from possessing nutrition knowledge of traditional vegetables. Nutrition knowledge was positively and significantly (p<0.05) influenced by the age of the respondent. Each additional year would be expected to increase nutrition knowledge by a factor of 10.8%, while holding all other variables in the model constant. This meant that the older one gets, the more nutrition knowledge one accrues. Thus, younger farmers would be expected to have relatively little nutrition knowledge, which ultimately grows overtime with age. Other studies [29, 30, 31] have also observed that farmers in rural areas are more likely to possess adequate cultural knowledge on TAVs as opposed to the youth and urbanized dwellers. Household size positively and significantly (p<0.05) influenced nutrition knowledge. This implied that the larger the household, the greater the likelihood that the household members would access more nutrition knowledge and share it within the household. This finding was also supported by Pearson's Correlation coefficient of 0.0744 between nutrition knowledge and household size. Farm size also significantly (P-value<0.1) influenced the nutrition knowledge of the respondent. These results implied that putting one more acre under TAVs would increase nutrition knowledge by nearly 14%. This study had hypothesized that education and income of the household jointly have no effect on the levels of nutrition knowledge among farmers. The results of Wald test (combined effect of education and income), however, found that education and income have a joint statistically significant effect on the nutrition knowledge. The joint test yielded a p-value of 0.0004. The null hypothesis that education and income jointly do not influence knowledge in nutrition was, therefore, rejected at 0.1 percent level of significance. Overall, the model results showed that nutrition knowledge of farmers was positively influenced by the gender of the respondent, number of years of schooling, age of the respondent, household size and TAVs farm size. Factors Affecting the Frequency of TAV Intake In order to examine the factors influencing the frequency of TAVs intake by farmers, models for count data that take the number of times a household consumes TAVs per
13361
week as a dependent variable was used to fit a standard Poisson regression model and generalized Poisson regression Model. The results of the fitted regression models are shown in Table 7. The Prob-chi2 test statistic showed that both the models fitted the data well (p = 0.0363and 0.0000 respectively). The mean deviance and the Pearson chi-square ratio (the Pearson chi-square value divided by its degrees of freedom) were used to assess the degree of fit of the standard Poisson model. The estimated deviance and Pearson ratios are shown below: Deviance/df = 20.34730709/48 = 0.4239022 Pearson/df = 16.16006631/48 = 0.336668 These results showed that both ratios are significantly smaller than 1, indicating that there is evidence of under-dispersion. Hence, the standard Poisson model does not fit the data well. The tests of goodness of fit measured by Akaike Information Criterion (AIC) and Bayesian Information Criterion (BIC) for the two models were also presented in Table 7. Lower values of either Akaike Information Criterion (AIC) or Bayesian Information Criterion (BIC) [32] indicate a better fit. The results showed that generalized Poisson model was a better fit for the data. Hence, the discussion below is based on the results of generalized Poisson model. Age of the respondent significantly influenced (p <0.05) frequency intake of TAVs. This implies that each additional year of age increases the expected frequency intake by an incidence rate ratio factor of 2.098. This indicates that the older the respondent gets the higher the frequency of TAV intake. Similar findings were made in a study [33] where the intensity of TAVs consumption significantly increased with advancement in age of the household head. Annual household income significantly (p<0.01) influenced the frequency intake of TAVs. Each additional Tshs. 1 of income increases the TAVs frequency intake by an incidence rate ratio of a factor of 0.771, while holding all other variables in the model constant. This shows that household income plays a vital role in frequency intake of TAVs. Household size significantly (p<0.01) influenced frequency intake of TAVs. If the size of the household increases by one individual, the incidence rate ratio for frequency intake of TAVs would be expected to change by a factor of 0.359, while holding all other variables in the model constant. The bigger the household size, the higher the frequency of consuming TAVs. The farm size dedicated to TAVs production significantly (p<0.05) influences the frequency intake of TAVs. Farm size was associated with an estimated 25% increase in the frequency intake. This implies that in the study area, frequency intake of TAVs is positively related to farm size allocated to TAVs. Frequency intake of TAVs was significantly (p<0.0001) influenced by the price of TAVs. Price of TAVs was associated with an estimated 41% increase in the frequency intake. This implied that if the price of TAVs is high, farmers will tend to produce more of it for sale and at the same time, the frequency to consume it at the household increases. The study had hypothesized that age and annual income of the household jointly have no effect on the frequency intake of TAVs. The results of Wald test (combined effect of age of respondent and household income), however, found age of the respondent and
13362
household income have a joint significant (p-value of 0.0035) effect on the frequency intake of TAVs. The null hypothesis that age of the respondent and household income jointly do not influence frequency intake of TAVs was, therefore, rejected at 1 percent level of significance. The model further showed that frequency intake of TAVs by farmers is influenced positively by age, annual household income, household size; TAVs farm size and market price of TAVs. Farmers’ Attitude towards Consumption of Traditional African Vegetables Factor analysis was used to identify latent dimensions underlying the different variables that measured respondents’ attitudes. Responses to the 11 five-point Likert-type scale items were subjected to principal component analysis. Factor analysis was selected to create measurement scales. In order to develop these scales, exploratory factor analysis with Varimax rotation was employed. The objective was to obtain fewer dimensions that reflected the relationships among these inter-related variables. An Eigen-value greater than one rule was applied in identifying the number of factors. The variables that had large loadings on the same factors were grouped together. Factor loadings value of 0.50 and above is normally considered good and significant [34]. The analysis produced a solution with three factors that accounted for 58.95% of the total explained variance as shown in Table 8. The Kaiser's overall measure of sampling adequacy obtained was 0.694, which adequately borders on the recommended threshold of 0.7 suggesting that the data are marginally appropriate for factor analysis. Seven attitude variables concerning importance and conservation of TAVs were loaded on factor 1 with the cross-correlation coefficients of 0.530, 0.574, 0.872, 0.753, 0.572, 0.733 and 0.716, respectively. This factor accounted for 31.4% of the total variance and was termed ‘health benefits’ because these variables involved the importance of consumption as well as conservation by local farmers. Higher scores and positive responses on this factor revealed a general understanding for promoting consumption and safeguarding of these varieties for the next generation. For example, the first three attributes with the highest factor loadings were: “Intake of TAVs variety each day guarantees vitamins and minerals required (0.872)”, “It is important to choose diets accompanied with TAVs (0.753)” and “TAVs are best consumed when fresh (0.733)”. These findings imply that rural households are persuaded that TAVs are important for human health and are best consumed when they are fresh. Factor 2 had cross-correlation coefficients of 0.633. This attribute implied that TAVs varieties appear not to be good to the consumer. This factor was then labeled ‘personal perception’ and accounted for 13.79% of the total variance. One attribute (namely, personal taste) was loaded on Factor 3 with cross-correlation coefficient of 0.895. This attribute focused on taste issues. Hence Factor 3 was termed ‘personal taste’. It accounted for 12.71% of the total variance. The cumulative percent of variance explained by the three factors was approximately 58.95%. Thus, rural farming households in the study area of Arumeru District consume traditional vegetables majorly because of their health attributes.
13363
CONCLUSION
This study established that the factors explaining the nutrition knowledge of farmers include gender of the respondent, number of years spent in school, age of the respondent, household size and TAVs farm size. The null hypothesis that education and income jointly do not influence nutrition knowledge of farmers was rejected. Frequency intake of TAVs by farmers is positively influenced by age, annual household income, household size, TAVs farm size and market price of TAVs. The null hypothesis that the age of the respondent and household income jointly do not influence frequency intake of TAVs was rejected. The study, therefore, concluded that socioeconomic factors have a significant effect on nutrition knowledge and frequency intake of TAVs.
The attitude of the farmers towards consumption of TAVs was mostly positive. This was shown by the finding that the “health factor” had the highest loading in the factor analysis. The medicinal properties significantly influenced consumption of TAVs. Thus, it was concluded that there is need to increase medicinal knowledge of these crops to a larger population. In addition, households indicated that TAVs are best consumed when fresh. There is also need to improve preparation and cooking of these vegetables to maintain their taste and nutrient content. The findings also showed that the perception factor loading was relatively high. This implied that a change of attitude is important because TAVs play an important role in human health. In view of increasing intake of nutrient-dense vegetables (TAVs), innovative ways of mixing various TAVs varieties during preparation could improve taste. Health attributes of TAVs should be incorporated in consumption promotional campaigns. Various promotional approaches such as posters, road shows and cooking demonstrations can be used. There is need to promote storage technologies which would preserve freshness as well as nutrient contents of TAVs.
This study also recommended that further investigations of the indigenous knowledge on the value attached to these vegetables be explored. This could serve as an incentive to motivate the increased consumption of these vegetables by the youth and urban populations. There is also need to ensure the availability and accessibility of these vegetables by consumers because this has been demonstrated by other studies to influence rates or frequency of consumption.
ACKNOWLEDGEMENT We wish to thank the farmers of Arumeru District-Arusha, Tanzania and World Vegetable Center, Eastern and Southern Africa (ESA) for their technical, financial and logistical support towards this study during proposal writing and field work stages. We also wish to thank the Regional Universities Forum for Capacity Building in Agriculture (RUFORUM) for funding part of this study.
LIST OF ABBREVIATIONS
IRR Incidence Rate Ratio TAVs Traditional African Vegetables VINESA Improving Income and Nutrition in Eastern and Southern Africa by
Enhancing Vegetable-based Farming and Food Systems in Peri-urban Corridors
13364
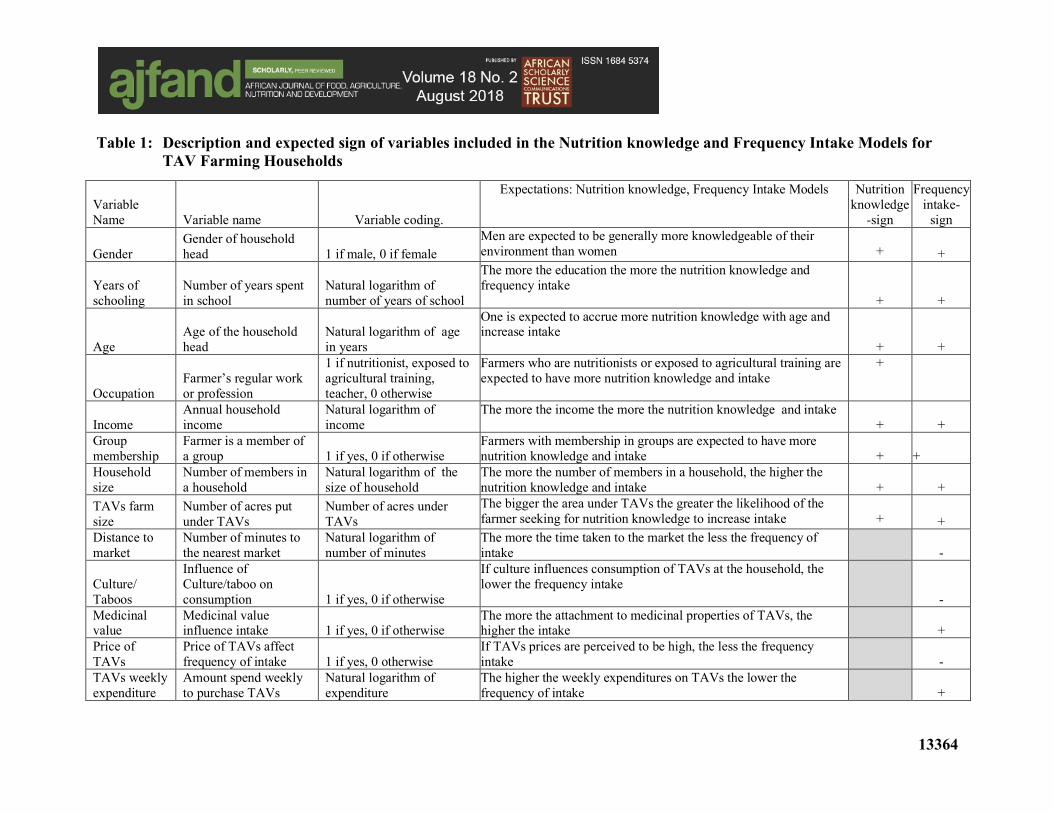
Table 1: Description and expected sign of variables included in the Nutrition knowledge and Frequency Intake Models for TAV Farming Households
Variable Name Variable name Variable coding.
Expectations: Nutrition knowledge, Frequency Intake Models Nutrition knowledge
-sign
Frequency intake-
sign
Gender Gender of household head 1 if male, 0 if female
Men are expected to be generally more knowledgeable of their environment than women
+ +
Years of schooling
Number of years spent in school
Natural logarithm of number of years of school
The more the education the more the nutrition knowledge and frequency intake
+ +
Age Age of the household head
Natural logarithm of age in years
One is expected to accrue more nutrition knowledge with age and increase intake
+ +
Occupation Farmer’s regular work or profession
1 if nutritionist, exposed to agricultural training, teacher, 0 otherwise
Farmers who are nutritionists or exposed to agricultural training are expected to have more nutrition knowledge and intake
+
Income Annual household income
Natural logarithm of income
The more the income the more the nutrition knowledge and intake + +
Group membership
Farmer is a member of a group 1 if yes, 0 if otherwise
Farmers with membership in groups are expected to have more nutrition knowledge and intake
+ +
Household size
Number of members in a household
Natural logarithm of the size of household
The more the number of members in a household, the higher the nutrition knowledge and intake
+ +
TAVs farm size
Number of acres put under TAVs
Number of acres under TAVs
The bigger the area under TAVs the greater the likelihood of the farmer seeking for nutrition knowledge to increase intake
+ +
Distance to market
Number of minutes to the nearest market
Natural logarithm of number of minutes
The more the time taken to the market the less the frequency of intake
-
Culture/ Taboos
Influence of Culture/taboo on consumption 1 if yes, 0 if otherwise
If culture influences consumption of TAVs at the household, the lower the frequency intake
- Medicinal value
Medicinal value influence intake 1 if yes, 0 if otherwise
The more the attachment to medicinal properties of TAVs, the higher the intake
+
Price of TAVs
Price of TAVs affect frequency of intake 1 if yes, 0 otherwise
If TAVs prices are perceived to be high, the less the frequency intake
-
TAVs weekly expenditure
Amount spend weekly to purchase TAVs
Natural logarithm of expenditure
The higher the weekly expenditures on TAVs the lower the frequency of intake
+
13365
Table 2: Socio-economic Characteristics of the sample
Demographic properties Frequency Gender (%)
Female 42.86 Male 57.14
Marital status of respondent (%) Married 92.07 Single 6.35 Separated 1.59 Divorced - Widow or widower -
Knowledge in Nutrition (count) mean 2.854 Ethnicity group (%)
Meru 36.51 Maasai 3.17 Arusha 34.92 Chagga 15.87 Others (Sukuma, Nyakyusa, Iraqw, Pare) 9.52
Main Occupation (%) Agriculture 74.60 Casual labor - Formal employment - Business 4.76 Agriculture and livestock 20.63
Level of education (%) None 1.59 Primary 90.48 Secondary 7.94 Middle-level college - University -
Frequency intake (count) mean 1.06 Mean Standard Deviation Age of respondent (mean) 40.17 12.43245 Number of years of schooling (mean) 7.13 1.539712 Household size (count) mean 4.20 1.259272 TAVs Farm size (acres) mean 0.61 0.5387085 Distance to nearest market (minutes) mean 52.403 56.24004 Amount spent to purchase TAVs per week (Tshs) (mean) 7,647.62 5819.845 Household income (Tshs) (mean) 1,263,651 1,146,966
Source: Survey of TAVs farmers in Arumeru District, July to November 2015
13366
Table 3: Common Traditional African Vegetables grown in the study area last season
Botanical Name English name Swahili name No. of farmers %
Solanum spp. African eggplant Ngogwe 31 49.21 Amaranthus spp. Amaranths Mchicha 41 65.08 Solanum spp. African nightshade Mnavu 51 80.95 Cleome gynandra Spider plant Mgagani 03 4.76 Brassica carinata Ethiopian mustard Loshuu 33 52.38 Sweet potatoes leaves Tembele 07 11.11
Source: Survey of TAVs farmers in Arumeru District, July to November 2015
Table 4: Area under traditional African vegetables cultivation
Standard Measure of the Sample Manyire (acre)
Embaseny (acre)
Bangata (acre)
Mean 0.802 0.475 0.531 Minimum 0.250 0.250 0.250 Maximum 3.000 2.000 1.000 Standard deviation 0.687 0.411 0.247
Source: Survey of TAVs farmers in Arumeru District, July to November 2015
Table 5: Traditional African vegetables varieties with high nutritional potential being grown in the study area
Variety Location Overall Ranking
Manyire (mean)
Embaseny (mean)
Bangata (mean)
Overall Mean
African eggplant 0.818 0.167 0.375 0.453 4 Amaranths 0.591 0.733 0.500 0.608 2 African nightshade 0.455 1.000 1.000 0.818 1 Spider plant 0.136 0.000 0.000 0.045 6 Ethiopian mustard 0.182 0.667 0.625 0.491 3 Others 0.182 0.033 0.000 0.072 5
Source: Authors’ survey of TAVs farmers in Arumeru District, July to November 2015
13367
Table 6: Factors which influence farmers' nutrition knowledge Standard Poisson Generalized Poisson Dependent variable = Number of Nutrition knowledge known
IRR (Incidence rate ratio)
P-values IRR P-values
Gender 1.219 0.091* 1.182 0.099* Log of Years of schooling 2.330 0.000*** 2.389 0.000*** Log of Age 2.687 0.027*** 3.108 0.014*** Occupation 1.028 0.382 1.016 0.534 Log of Income 1.018 0.780 1.011 0.835 Group membership 1.028 0.309 1.055 0.620 Log of Household size 0.725 0.062* 0.717 0.046** TAVs farm size 1.158 0.040** 1.139 0.072* Constant 0.084 0.044 0.079 0.024 Number of observations 61 61 Wald chi2(8) 38.16 33.21 Prob>chi2 0.0000 0.0001 Pseudo R2 0.0304 0.0660
Akaike's and Bayesian Information Criteria for the Models Model Obs. ll(null) ll(model) df AIC BIC Standard Poisson 61 -104.4171 -101.2473 9 220.4946 239.4925 Generalized Poisson 61 -97.95632 -91.49381 10 202.9876 224.0964
*, ** and *** denote significance level at 10, 5 and 1%, respectively

13368
Table 7: Factors which influence farmers' frequency intake
Standard Poisson Generalized Poisson Dependent variable = Frequency intake
IRR
P-values IRR P-values
Gender 0.956 0.713 0.886 0.434 Log of Years in schooling 1.329 0.465 1.221 0.654 Log of Age 1.679 0.046** 2.098 0.035** Occupation 1.023 0.384 0.979 0.568 Log of Income 0.879 0.076* 0.771 0.001*** Log of household size 0.459 0.001*** 0.359 0.001*** Log of farm size 1.077 0.410 1.253 0.034** Log of distance to Mkt 0.950 0.437 0.888 0.123 Culture/taboos 1.010 0.950 1.016 0.935 Medicinal value 1.029 0.875 1.029 0.903 Price of TAVs 1.336 0.027** 1.406 0.016*** Log of TAVs Weekly expenditure 1.063 0.658 1.131 0.248 Constant 0.974 0.986 3.297 0.523 Number of observations 61 61 Wald chi2(11) 22.11 40.95 Prob>chi2 0.0363 0.0000 Pseudo R2 0.0288 0.1739
Akaike's and Bayesian Information Criteria for the Models Model Obs. ll(null) ll(model) Df AIC BIC Standard Poisson 61 -69.30718 -67.31347 13 160.6269 188.0683 Generalized Poisson 61 -61.0714 -50.44855 14 128.8971 158.4493
*, ** and *** denote significance level at 10, 5 and 1%, respectively
Table 8: Results of Exploratory factor analysis Factor and item description Factor
loading % Variance explained
Factor 1: Health benefits 31.44 Consumption of TAVs is important to women, children and men 0.530 Fresh TAVs contain more nutrients than dried ones 0.574 Intake of TAVs variety each day guarantee vitamins and minerals required 0.872 It is important to choose diet accompanied with TAVs 0.753 Consumption of TAVs improve eyesight and boost body immunity 0.572 TAVs are best consumed when fresh 0.733 I am willing to preserve TAVs for the next generation 0.716 Factor 2: Personal perception 13.79 TAVs are not good to me 0.633 Factor 3: Personal taste 13.72 TAVs are tasteless and bitter Total Explained variance (%)
0.895
58.95
Source: Author’ survey of TAVs farmers in Arumeru District, July to November 2015

13369
REFERENCES
1. Keding G, Weinberger K, Swai I and H Mndiga Diversity, traits and use of traditional vegetables in Tanzania. Technical bulletin No. 40. AVRDC-The World Vegetable Center, Shanhua, Taiwan, 2007.
2. Chagomoka T, Afari-Sefa V and R Pitoro Value chain analysis of traditional vegetables from Malawi and Mozambqiue. Int Food Agribus Man. 2014;17: 59-85.
3. Chweya JA and PM Eyzaguirre The biodiversity of traditional leafy vegetables. International Plant Genetic Resources Institute, Rome, Italy, 1999.
4. Liu S, Lee IM, Ajani U, Cole SR, Buring JE and JE Mansoon Intake of vegetables rich in carotenoids and risk of coronary heart disease in men: The Physicians’ Health Study. Int J Epidemiol. 2001; 30:135-135.
5. Uusiku NP, Oelofse A, Duodu KG, Bester MJ and M Faber Nutritional value of leafy vegetables of Sub-Saharan Africa and their potential contribution to human health: A review. J. Food Comp. Anal. 2010; 23: 499-509.
6. Onyango MA and JC Onyango Conservation and seed production of African leafy vegetables at Maseno University botanic garden, Kenya. In:Africa Crop Science Proceedings 2005; l7:1201-1204.
7. Adebooye OC and JT Opabote Status of conservation of the indigenous leaf vegetables and fruits of Africa. Afr. J. Biotechnol. 2004; 3: 700-705.
8. Ngugi IK, Gitau R and JK Nyoro Access to high value Markets by Smallholder Farmers of African Indigenous Vegetables in Kenya. Regoverning Markets Innovative Practice Series, IIED, Landon, 2007.
9. Abukutsa-Onyango MO The diversity of cultivated African Leafy Vegetables in three communities of Western Kenya. Afr. J. Food Agric. Nutr. Dev. 2007; 7 (3) [Online]: Accessed June 24th 2015.
10. Keller GB, Mndiga H and BL Maass Diversity and genetic erosion of traditional vegetables in Tanzania from the farmer’s point of view. Plant Genet Resour-C. 2005; 3(3):400–413.
11. Masayi N and G Netondo Effects of sugarcane farming on diversity of vegetable crops in Mumias Division, Western Kenya. Int J Biodivers Conserv. 2012; 4(13): 515-524.
12. Odhav B, Beekrum S, Akula U and H Baijnath Preliminary assessment of nutritional value of traditional leafy vegetables in KwaZulu-Natal, South Africa. J. Food Comp. Anal. 2007; 20(5): 430–435.
13370
13. Vorster IJ, Van Rensburg J and V Sonja The importance of Traditional leafy vegetables in South Africa. Afr. J. Food Agric. Nutr. Dev. 2007; 7(4) [Online]. Accessed June 24th 2015.
14. Weinberger K and J Msuya Indigenous Vegetables in Tanzania:Significance and Prospects.Technical Bulletin No. 31. AVRDC-The World Vegetable Center, Shanhua, Taiwan, 2004.
15. Goldberg G (Ed.) Plants: diet and health. John Wiley & Sons, 2008.
16. Ryder E World vegetable industry: production, breeding, trends. Hortic Rev. 2011; 38: 299.
17. FAO. United Nations Food and Agriculture Organization, Agriculture: FAOSTAT data. www.fao.org. 2009.
18. WHO. United Nations World Health Organization. Technical Report Series, No. 916. Diet, Nutrition and the Prevention of Chronic Diseases. Report of A Joint FAO/WHO Expert Consultation, Geneva, World Health Organization, 2003.
19. FAO. United Nations Food and Agriculture Organization. Irrigated Horticulture Development Project. Preparation Report No: 126/94, ADB-URT 55, 1994.
20. Ojiewo CO, Tenkouano A, Oluoch M and R Yang The role of AVRDC-The world vegetable centre in vegetable value chains. Afr. J. Hort. Sci. 2010; 3:1-23.
21. IFPRI. Empowering Women to Achieve Food Security: Vision 2020, Focus No. 6. IFPRI, Washington DC. 2001.
22. Hilb JM Negative binomial regression. Cambridge University Press, 2011.
23. Consul P and F Famoye Generalized Poisson regression model. Commun Stat Theory Methods 1992; 21(1): 89–109.
24. Parmenter K and J Wardle Development of a general nutrition knowledge questionnaire for adults. Eur J Clin Nutr. 1999; 53(4): 298–308.
25. Leech NL, Barrett KC and GA Morgan IBM SPSS for intermediate statistics: Use and interpretation. Routledge, 2012.
26. Kamga RT, Kouamé C, Atangana AR, Chagomoka T and R Ndango Nutritional evaluation of five African indigenous vegetables. J. Hortic. Res. 2013; 21(1): 99-106.
27. Kimambo JJ Analysis of factors influencing producers and consumers’ intake of nutrient- dense vegetables: The case study of Arusha region, Tanzania. An unpublished MSc. Thesis, Jomo kenyatta University of Agriculture and Technology, Juja, 2015.

13371
28. Millicent AO Assessment of factors influencing utilization of forest resources in Kipini Division of Tana Delta District, Kenya. A Published MSc. Thesis, University of Nairobi, 2013.
29. Jansen van Rensburg WS, Van Averbeke W, Slabbert R, Faber M, Van Jaarsveld P, Van Heerden I, Wenhold F and A Oelofse African leafy vegetables in South Africa. Water SA. 2007; 33:317-326.
30. Faber M, Oelofse A, van Jaarsveld PJ, Wenhold FAM and WJ van Rensburg African leafy vegetables consumed by households in the Limpopo and KwaZulu-Natal provinces in South Africa. S Afri J Clin Nutri. 2010; 23(1) :30–38.
31. Matenge STP, van der Merwe D, De Beer D, Bosman MJC and A Kruger Consumers’ beliefs on indigenous and traditional foods and acceptance of products made with cow pea leaves. Afr. J. Agric. Res. 2012; 7(14) :2243–2254.
32. Schwarz GE Estimating the dimension of a mode. Ann. of Statist. 1978; 6 (2): 461–464.
33. Gido EO, Ayuya OI, Owuor G and W Bokelmann Consumption intensity of leafy African indigenous vegetables: towards enhancing nutritional security in rural and urban dwellers in Kenya. Agricultural and Food Economics, 2017; 5:14.
34. George D and M Mallery Using SPSS for Windows step by step: a simple guide and reference. Boston, MA, Allyn Y Bacon, 2003.
Copyright © 2022 FDOKUMEN