factors influencing bats assemblage - UoN Repository
193
I FACTORS INFLUENCING BATS ASSEMBLAGE STRUCTURE AND ACTIVITY PATTERNS IN ARABUKO-SOKOKE FOREST AND ADJACENT FARMLAND, GEDE, MALINDI-KENYA BY SIMON NGANDA MUSILA, BSc. (Moi), MSc. (KU) (Reg. No I80/96568/2014) A Thesis Submitted to the University of Nairobi in Fulfilment of Requirements for the Award of the Degree of Doctor of Philosophy in Biology of Conservation School of Biological Sciences UNIVERSITY OF NAIROBI APRIL 2021
-
Upload
khangminh22 -
Category
Documents
-
view
2 -
download
0
Transcript of factors influencing bats assemblage - UoN Repository

I
FACTORS INFLUENCING BATS ASSEMBLAGE
STRUCTURE AND ACTIVITY PATTERNS IN
ARABUKO-SOKOKE FOREST AND ADJACENT
FARMLAND, GEDE, MALINDI-KENYA
BY
SIMON NGANDA MUSILA, BSc. (Moi), MSc. (KU)
(Reg. No I80/96568/2014)
A Thesis Submitted to the University of Nairobi in
Fulfilment of Requirements for the Award of the Degree
of Doctor of Philosophy in Biology of Conservation
School of Biological Sciences
UNIVERSITY OF NAIROBI
APRIL 2021

II
DECLARATION
DECLARATION BY THE CANDIDATE
This thesis is my original work and has not been presented or submitted for award of any
degree in any other university.
SIGN……………………………………………..DATE…………………………………….
SIMON NGANDA MUSILA
(Reg. No I80/96568/2014)
DECLARATION BY THE SUPERVISORS
We confirm that this research work was carried out by the student with our supervision and
submitted with our approvals as university supervisors.
SUPERVISORS
SIGN……………………………………......................DATE………………………………
1). PROF. NATHAN GICHUKI
SCHOOL OF BIOLOGICAL SCIENCES, UNIVERSITY OF NAIROBI
12th August 2021
12th August 2021
12th August 2021

III
DEDICATION I dedicate my work to biology students from Africa, who will dare to choose to study the
diverse and interesting life of bats. It is also dedicated to my wife Elizabeth Kamene, for her
continued support and our children: Victor, Safari and Sonia, for their understanding during
many dad’s nocturnal vigils looking for bats.

IV
ACKNOWLEDGMENTS
To start a journey of PhD study resembles a voyage to unknown, you cannot do it alone and
succeed. From my ideas conception to the day I graduated, I was assisted by numerous people.
The order of mention, is not important but more so the role each played to advance my study.
My studies would have stalled, if I had not been mentored by my two eminent professors:
Nathan Gichuki-Kenya and Ivan Castro-Arellano-USA. They gave me very useful ideas,
which helped me in each step in my academic journey. My fieldwork was funded by the British
Ecological Society (Ecologists in Africa grant No. 4632-5670), Sino-Africa Joint Research
Centre (SAJOREC grant No. SAJC201612) through Prof. Jiang Xuelong of Kunming Institute
of Zoology, Chinese Academy of Sciences; Bat Conservation International-USA courtesy of
Amy Price, who provided 30 mist-nets used throughout to capture bats in my field surveys,
and Dr. Cullen Geilselman for paying my school fees. All glory be to God, for sustenance, and
bounty of blessings throughout my study. I am very grateful to my parents: Erastus M.
Ngunguti and Nzangi Musila, for raising me from childhood and their encouragement to me,
to always to strive to acquire portable wealth.
I am hugely grateful to the late Prof. Jens Rydell-University of Lund-Sweden, for convincing
Lars Petterson, founder and manufacturer of Pettersson bat detectors to donate three
heterodyne detectors to my project. He also came to Kenya and trained me how to use them
in bat activity studies. Prof. Jens Rydell and Dr. Paul Webala-Maasai Mara University
accompanied me during my pilot survey to ASF and helped in prior identification of bats of
the area, before the actual data collection started. During the drafting of manuscripts for
publication Alexandra Howard, South Africa assisted to download research papers from paid
up journals which were inaccessible to me. Dr. Jacob Fahr-Germany, Prof. Thomas Howard-
USA, Prof. Tigga Kingston-USA, Prof. Jürg Schlegel-Switzerland, and Prof. David
Livingstone-USA assisted in reviewing my draft manuscripts. Prof. Pavol Prokop-Slovakia
and Dr. Ana Rainho-Portugal, were marvelous friends who reviewed the manuscripts we
published together many times. To my boss at the National Museums of Kenya, Dr. Esther
Kioko, for always propping me up with motherly and inspirational counsel.
During many dark nights I spend in and around ASF, sometimes either ferociously attacked
by mosquitoes, rained or overwhelmed by sleep, I was accompanied by three very valuable
friends: Simon Kajengo (Msenangu), our village guide, who kept the night alive with beautiful
stories; Robert Syingi my able field assistant who learnt early how to work with bats and could
work independently without my supervision; and Aaron Muanga, who drove and repaired our
indomitable Suzuki Samurai which enabled us to get to field station on time. Rachael Kega, a
good woman at Gede, advised me to focus on my studies without getting lost in the good life
of Gede-Watamu, a tragedy which befalls many people from up country in Kenya and abroad.
I would like to thank more than 394 people who accepted to be interviewed, and others who
allowed us to sample bats in their farms, without asking for any type compensation. All of
you, and many others were great partners, in the God gifted network, that helped in the
advancement of my studies, and to all of you this is what I pray to be your destiny: The Bible
says in Isaiah 58: 10-11. 10. And if thou draw out thy soul to the hungry, and satisfy the
afflicted soul; then shall thy light rise in obscurity and thy darkness be as the noon day. 11.
And the LORD shall guide thee continually, and satisfy thy soul in drought, and make fat thy
bones: and thou shalt be like a watered garden, and like a spring of water, whose waters fail
not.

V
TABLE OF CONTENTS
DECLARATION .................................................................................................................... II
DEDICATION ...................................................................................................................... III
ACKNOWLEDGMENTS ................................................................................................... IV
LIST OF TABLES ............................................................................................................... IX
LIST OF FIGURES ............................................................................................................... X
LIST OF APPINDICES ................................................................................................... XIII
ACRONYMS AND ABBREVIATIONS ......................................................................... XIV
ABSTRACT ............................................................................................................................ II
STRUCTURE OF THESIS ................................................................................................. IV
CHAPTER ONE: INTRODUCTION ................................................................................... 1
1.1 Background of the study ............................................................................................ 1
1.2 Problem statement ........................................................................................................... 3
1.3 Significance of the study ................................................................................................. 4
1.4 Main goal of the study .................................................................................................... 5
1.4.1 Research objectives .................................................................................................. 5
1.4.2 Research questions ................................................................................................... 6
1.4.3 Research hypotheses ................................................................................................ 6
CHAPTER TWO: LITERATURE REVIEW ...................................................................... 7
2.1 Evolution of bats ........................................................................................................ 7
2.2 Classification of bats .................................................................................................. 7
2.3 Ecological importance of bats ............................................................................................. 8
2.3.1 Pollination by bats ........................................................................................................ 8
2.3.2 Seed dispersal by bats .................................................................................................. 9
2.3.3 Bats and insectivory ..................................................................................................... 9
2.4 Bat and diseases transmission ........................................................................................... 10
2.5 Bats socio-cultural importance ......................................................................................... 11
2.6 Distribution and species diversity of bats ......................................................................... 11
2.6.1 Global distribution of bats ......................................................................................... 11
2.6.2 Relationship between bat species and their habitat .................................................... 12
2.6.3 Bat activity in the environment .................................................................................. 13
2.7 Threats to bat species and their habitats ........................................................................... 14
2.7.1 Destruction and or modification of roosting sites ...................................................... 14
2.7.2 Hunting bats for bush-meat ........................................................................................ 15

VI
2.7.3 Habitat degradation and fragmentation ...................................................................... 15
2.7.4 Evictions of bats roosting in man-made structures .................................................... 16
2.8 The importance of coastal forests in Kenya and East Africa ............................................ 16
CHAPTER THREE: STUDY AREA AND GENERAL METHODS .............................. 18
3.1 Introduction ....................................................................................................................... 18
3.2 Description of the study area ............................................................................................ 18
3.2 1 Location and conservation status ............................................................................... 18
3.2.2 Climatic condition of study area ................................................................................ 20
3.3. Characteristics of soils, flora and fauna ........................................................................... 20
3.3.1 Soil characteristics ..................................................................................................... 20
3.3.2 Natural vegetation ...................................................................................................... 21
3.3.3 Animal community .................................................................................................... 26
3.4 Threats to biodiversity in study area ................................................................................. 27
3.4.1 Threat to biodiversity in ASF .................................................................................... 27
3.4.2 Threat to biodiversity in farmland ............................................................................. 27
3.5 General materials and methods ......................................................................................... 28
3.5.1 Research design ......................................................................................................... 28
3.5.2 Bats mist-netting method ........................................................................................... 31
3.5.3 Bat activity surveys methods ..................................................................................... 31
3.5.4 Sampling of invertebrates prey .................................................................................. 32
3.5.5 Assessment of bat habitat structure ............................................................................ 32
3.5.6 Human-bats interactions survey methods .................................................................. 33
CHAPTER FOUR: BATS DIVERSITY IN ARABUKO-SOKOKE FOREST AND
ADJACENT FARMLAND .................................................................................................. 34
ABSTRACT ............................................................................................................................ 34
4.1 Introduction ....................................................................................................................... 34
4.2 Materials and Methods ...................................................................................................... 35
4.2.1. Bat surveys ................................................................................................................ 35
4.2.2 Data analysis .............................................................................................................. 38
4.3 Results ............................................................................................................................... 39
4.3.1 Diversity and species richness of bats ....................................................................... 39
4.3.2 Bats abundance and their seasonal trends .................................................................. 43
4.3.3 Bat roosts in ASF and in the farmland ....................................................................... 45
4.3.4 Seasonal changes in bats abundance .......................................................................... 46
4.3.5 Age sex structure and breeding status of bats ............................................................ 47
4.4 Discussion ......................................................................................................................... 49

VII
CHAPTER FIVE: BAT ACTIVITY IN ARABUKO-SOKOKE FOREST AND
ADJACENT FARMLAND .................................................................................................. 51
ABSTRACT ............................................................................................................................ 51
5.1 Introduction ....................................................................................................................... 51
5.2 Materials and Methods ...................................................................................................... 52
5.2.1 Bat activity surveys .................................................................................................... 52
5.2.2 Data analysis .............................................................................................................. 53
5.3 Results ............................................................................................................................... 55
5.3.1 Activity patterns of mist-netted bats .......................................................................... 55
5.3.2 Insectivorous bat activity in ASF and farmland ........................................................ 56
5.3.3 Fruit bats in ASF and farmland .................................................................................. 57
5.3.4 Seasonal changes in captured bats activity ................................................................ 58
5.3.5 Activity among female and male bats ........................................................................ 58
5.4 Insectivorous bat activity monitored with detector ........................................................... 59
5.4.1 Overall activity of insectivorous bats ........................................................................ 59
5.4.2 Hourly trend in insectivorous bat activity .................................................................. 60
5.5 Discussion ......................................................................................................................... 62
CHAPTER SIX: DIVERSITY OF INVERTEBRATE PREY IN ARABUKO-SOKOKE
FOREST AND ADJACENT FARMLAND ........................................................................ 66
ABSTRACT ............................................................................................................................ 66
6.1 Introduction ....................................................................................................................... 66
6.2 Materials and Methods ...................................................................................................... 67
6.2.1 Invertebrate prey sampling ........................................................................................ 67
6.2.2 Data analysis .............................................................................................................. 71
6.3 Results ............................................................................................................................... 71
6.3.1 Invertebrates diversity ................................................................................................ 71
6.3.2 Invertebrate sizes and hourly activity pattern ............................................................ 73
6.4 Discussion ......................................................................................................................... 75
CHAPTER SEVEN: INFLUENCE OF HABITAT STRUCTURE AND FRUIT TREES
DISTRIBUTION ON BATS ABUNDANCE IN ARABUKO-SOKOKE FOREST AND
ADJACENT FARMLAND .................................................................................................. 78
ABSTRACT ............................................................................................................................ 78
7.1 Introduction ....................................................................................................................... 78
7.2 Materials and Methods ...................................................................................................... 79
7.2.1 Assessments of tree species and their characteristics ................................................ 79
7.2.2 Assessments of understory and canopy vegetation cover .......................................... 81
7.2.3 Data analysis .............................................................................................................. 82

VIII
7.3 Results ............................................................................................................................... 84
7.3.1 Tree species in the farmland and ASF ....................................................................... 84
7.3.2 Fruits trees found in the farmland and at ASF ........................................................... 85
7.3.3 Tree characteristics in the farmland and ASF ............................................................ 86
7.3.4 Habitat structure in the farmland and ASF ................................................................ 87
7.4 Discussion ......................................................................................................................... 94
CHAPTER EIGHT: HUMAN-BAT INTERACTIONS AROUND ARABUKO-
SOKOKE FOREST .............................................................................................................. 98
ABSTRACT ............................................................................................................................ 98
8.1 Introduction ....................................................................................................................... 98
8.2 Materials and Methods ...................................................................................................... 99
8.2.1 Study area ................................................................................................................... 99
........................................................................................................................................... 101
8.2.2 Selection of the respondents and interview procedure ............................................ 101
8.2.3 Measures for attitudes toward bats .......................................................................... 104
8.2.4 Data analysis ............................................................................................................ 105
8.3. Results ............................................................................................................................ 107
8.3.1. Socioeconomic characteristics of respondents ........................................................ 107
8.3.2. General knowledge about bats by local people around ASF .................................. 107
8.3.3. Traditional myths about bats ................................................................................... 108
8.3.4. The value of bats to people around ASF ................................................................. 110
8.3.5 Negative effects of bats to local people ................................................................... 112
8.3.6 Attitudes towards bats among local people around ASF ......................................... 114
8.4 Discussion ....................................................................................................................... 118
CHAPTER NINE: SUMMARY OF FINDINGS, GENERAL DISCUSSION,
CONCLUSION AND RECOMMENDATIONS .............................................................. 122
9.1 Summary of findings ....................................................................................................... 122
9.2 General discussion .......................................................................................................... 124
9.3 Conclusion ...................................................................................................................... 127
9.4 Recommendations ........................................................................................................... 129
10.0 REFERENCES ............................................................................................................ 133
APPINDICES ...................................................................................................................... 153

IX
LIST OF TABLES
Table 1. Bat sampling seasons, dates, time and effort in ASF and farmland. …..………….36
Table 2. Bat species, diversity and their abundance in different habitat types in ASF….….41
Table 3. Bat species, diversity and their abundance in different habitat types in
farmland………………………………………………………………….………………….42
Table 4. Bat roost types in ASF and farmland, estimate of bats population in them, and
different bat species found in each roost ……………….………………………..………….46
Table 5. Kruskal-Wallis test results of the medians of insectivorous and fruits bats; R.
aegyptiacus, E. wahlbergi and C. cor captured each hour in different seasons………….….58
Table 6. Mann-Whitney test results of the median of bats of different sexes captured each
hour in the study area…………………………………………………………………….….59
Table 7. Total bat insectivorous echolocation calls (passes) and insectivorous bats captures
in six different bat sampling expeditions in the interior of ASF and in the farmland…...….68
Table 8. Diversity and abundance of invertebrate prey in three habitat types in the
farmland….…………………………………………………………………………..……..72
Table 9. Diversity and abundance of invertebrate prey in three habitat types in the
ASF….…………………………………………………………………………………..….72
Table 10. A summary of the counts of invertebrates of different sizes sampled in the
farmland and ASF….……………………………………………………….……………….73
Table 11. Comparison of different habitat structure variables between ASF and
farmland….………………………………………………………………………………….94
Table 12. Summary results of respondents’ age, household sizes and distances from near and
away from roosts (caves) ….…………………………………….………………………...107
Table 13. The results of multiple regression on the scientistic domain…………………...114
Table 14. The results of multiple regression on the negativistic domain…………………115
Table 15. Results of multiple regression on the ecologistic domain….…………………..116
Table 16. Results of multiple regression on the myths domain….………………...……..116

X
LIST OF FIGURES
Figure 1. A Map of the study areas showing the different vegetation types in the interior of
ASF and the farmland….…………………………………………………...…………..…...19
Figure 2. Mixed trees forest in the interior of ASF …………………………...……….…...22
Figure 3. Cynometra webberi trees dominated forest in the interior of ASF…………….....22
Figure 4. Brachystegia spiciformis trees dominated woodland in the interior of ASF……..23
Figure 5. Mango trees dominated farms in the farmland in the eastern part of ASF…...…..24
Figure 6. Coconut trees dominated farms in the farmland in the eastern part of ASF……...25
Figure 7. Mixed trees farms in the farmland on the eastern part of ASF….………...……...25
Figure 8. Conceptual framework of the research study………………………..…………...30
Figure 9. Map of the study area showing the different vegetation types and sampling stations
in ASF (red dots) and farmland (green triangles) ………………………..….……………...37
Figure 10. Bat species estimate curve for the farmland indicating species richness expected
values (solid line) and the 95% confidence intervals (dashed lines) …………..…………...40
Figure 11. Bat species estimate curve for the interior of ASF indicating species richness
expected values (solid line) and the 95% confidence intervals (dashed lines) …...………...40
Figure 12. The mean number of individual bats captured in each study site………..……...44
Figure 13. UPGMA dendrogram (Ward’s method with Euclidean distance) ……………...45
Figure 14. Number of individual bats of three bat species captured in different seasons…..48
Figure 15. The percentage number bats captured each two hours and their pattern of activity
in ASF and farmland………………………………………….……………...……………...55
Figure 16. The percentage number of insectivorous bats captured each two hours and their
pattern of activity in ASF and farmland………………………...…………………………...56
Figure 17. The percentage number of fruit bats captured each two hours and their pattern of
activity in ASF and farmland………………….……………......…………………………...57
Figure 18. The mean number of bat passes recorded in each vegetation type in the farmland
and in ASF…………………………………………………………………………………...60
Figure 19. The mean number of bat passes per night in farmland from 1900h to 0500h…..61
Figure 20. The mean number of bat passes per night in ASF from 1900hr to 0500h.……...61
Figure 21. Solar DP Light DP-6005A used to attract nocturnal invertebrate prey……...….68

XI
Figure 22. Set up of solar light trap, with white cloth screen and plastic sheet………….…69
Figure 23. Solar light trap in operation at night attracting invertebrate prey (black dots) …70
Figure 24. The hourly trend in the capture of invertebrate prey (excluding moths) sampled in
ASF and in the farmland……………………………………………...………...…………...74
Figure 25. Point-centred Quarter Method (PCQ) method diagram………….……………...80
Figure 26 A-D. A wooden board of plywood checkerboard painted in red and white patterns
of 25 squares for assessing understorey vegetation cover……………..….………………...81
Figure 27. Total number of individuals of diverse tree species found in 210 PCQ points in
the farmland…………………………………………..…………...………………………...84
Figure 28. Total number of individuals of different tree species found in 210 PCQ points in
the interior of ASF…………………………………………….………………………..…...85
Figure 29: Mean values (±SD) of distance between trees (m) N=280) in ASF vegetation
types (shaded) and farmland (unshaded) ……………………..………...…………………...87
Figure 30. Mean values (±SD) of Diameter at Breast Height (DBH (cm) N=280) in ASF
vegetation types (shaded) and farmland (unshaded)………………………………………...88
Figure 31. Old large and hollowed B. spiciformis and M. sansibarensis trees in ASF……..89
Figure 32. Mean values (±SD) of % canopy cover (N=70) in ASF vegetation types (shaded)
and farmland (unshaded)………………………… …………...………………………..…...90
Figure 33. Mean values (±SD) of % understorey cover (N=70) in ASF vegetation types
(shaded) and farmland (unshaded)…………………………….………………………..…...91
Figure 35. Mean values (±SD) crown diameter (m) N=280) in ASF vegetation types
(shaded) and farmland (unshaded) ………………………………………………………….92
Figure 35. Mango trees in the farmland with large crown diameter which remain evergreen
annually and the dense crown provided suitable roosts for foliage roosting bats…………...93
Figure 36. Individuals of E. wahlbergi roosting in the foliage of mango and cashew nut trees
at Gede market…….………...…………...………………………………………..………...93
Figure 37. Map of ASF showing areas around Gede and Watamu sub-locations where bat-
human interactions studies were undertaken………….………………………...………….101
Figure 38. Bat roosting areas reported by respondents around ASF…………...………….108
Figure 39. Different types of traditional myths associated with bats by local people around
ASF……………………………………..………………………………………………….110
Figure 40. The range of benefits of bats to local people around ASF………………….….111

XII
Figure 41. Dispersal of cashew nut by fruit bats around ASF……..………..…………….112
..
Figure 42. The negative effects of bats to local people around ASF…...………...……….113
Figure 43. Damage to mango fruits by bats on farms around ASF………...………...……113
Figure 44. The number of respondents around ASF who saw a bat at different times……117

XIII
LIST OF APPINDICES
Appendix 1. Voucher specimens of different bat species collected at ASF and in farmland
and deposited with Mammalogy Section lab-National Museums of Kenya (NMK). ........... 153
Appendix 2. Some species bat photos recorded in the farmland and the interior of ASF ... 154
Appendix 3. Location of some bat roosts in ASF and farmland .......................................... 161
Appendix 4. Bat species and their total number of captures each hour in the interior of
ASF ....................................................................................................................................... 162
Appendix 5. Bat species and their total number of captures each hour in farmland ........... 162
Appendix 6. Orders of different invertebrates excluding Order Lepidoptera (moths) trapped
in different vegetation types in ASF and farmland. .............................................................. 163
Appendix 7. Diversity of trees in different vegetation types in the farmland ...................... 164
Appendix 8. Diversity of trees in different vegetation types at ASF ................................... 164
Appendix 9. Number of each tree species per ha in the farmland ....................................... 164
Appendix 10. Number of each tree species per ha in the interior of ASF ........................... 165
Appendix 11. The total tree basal area per hectare (m2/ha) in the farmland. ....................... 165
Appendix 12. The total tree basal area per hectare (m2/ha) at ASF ..................................... 166
Appendix 13. The importance value of each tree species in the farmland .......................... 166
Appendix 14. The importance value of each tree species in ASF ....................................... 167
Appendix 15: Bat attitude questionnaire (BAQ)-English version ....................................... 168
Appendix 16. Bat attitude questionnaire (BAQ)-Swahili version ....................................... 172
Appendix 17. List of publications ........................................................................................ 176

XIV
ACRONYMS AND ABBREVIATIONS
ANOVA Analysis of Variance
ASF Arabuko-Sokoke Forest
BRA Brachystegia Woodland
COC Coconut trees dominated farms in farmland
CYNO Cynometra Forest
CR Critically Endangered
DBH Diameter at Breast Height
DD Data Deficient
EN Endangered
IUCN International Union for Conservation of Nature
KFS Kenya Forest Service
KWS Kenya Wildlife Service
LC Least Concern
MIXFa Mixed trees farms in farmland
MIXFo Mixed Forest
MAN Mango trees dominated farms in farmland
NMK National Museums of Kenya
NT Near Threatened
PCQ Point-Centred Quarter
VU Vulnerable
UPGMA Unweighted Pair Group Method with Arithmetic Means

II
ABSTRACT
Many coastal forests in eastern Africa are highly threatened by human activities, which have
reduced most of them into small fragments that are in continuous disturbance. Arabuko-
Sokoke Forest (ASF) is the only remaining, biggest coastal forest in eastern Africa, which
currently exist as an ‘island’ in the midst of human-dominated landscape. This study was
undertaken in the interior of ASF and agricultural areas east of this forest, here referred to as
‘farmland’ mainly to investigate factors which influenced bats community structure and their
activity in both habitats, as well as understand local people’s perceptions about bats. Bats
composition and their flight activity were sampled with mist-nets. Insectivorous bat activity
was investigated with Pettersson D240x ultrasound detector, always tuned to 33 kHz. Bat
roosts were mapped and bats in them sampled. Insectivorous bats invertebrates prey
abundance was sampled with solar powered lights (DP Light DP-6005A) traps, in 12 different
stations each in ASF and farmland. Point-centred Quarter (PCQ) method was used to sample
woody vegetation in ASF and in the farmland. A semi-structured questionnaire was used to
investigate attitudes toward bats of 394 people living around ASF. A total of 25 bat species
were recorded in both study sites; including 25 in the farmland and 19 in ASF. The ASF had
higher bat diversity than farmland (H’, ASF: 1.48 ± 0.2, Farmland: 1.33 ± 0.1). However the
farmland had higher bat species richness than ASF (Chao1, ASF: 19 [19-25], farmland: 24
[24-32] species [0.95% CI]). In total 5,217 individuals of bats were captured, 82.9% in
farmland and 19.1% in ASF. Thirteen roosts occurred in the farmland and only one in ASF.
The mean flight activity of individual bats captured in mist-netted (fruit and insectivorous bats
combined) in each hour in the farmland was (425.3 ± 95.1, N=10), and in ASF (88.4 ± 11.2,
N=10). There was a significant difference between the medians of captured bats per hour in
both habitats (U=9.5: p <0.0025, Mann-Whitney U-Test). A total of 14,727 insectivorous bats
echolocation calls (passes) were recorded, including 10,552 in the farmland and 4,175 in ASF.
The mean number of bat passes in farmland was (152.9 ± 13.2), while in ASF was (60.5 ±
4.6). There was a significant difference in the activity of insectivorous bats in both study sites
(df = 68, t = -8.671, P <0.05). A total of 6,557 individuals of insectivorous bats invertebrates
prey were captured in both study sites: 52% in the farmland and 48% in ASF. The mean
number of insectivorous bats invertebrates prey captured per night in the farmland was (260.5
± 52.9, N=12), and in ASF (200.3 ± 36.4., N=12). There was no significant difference between
the medians of insectivorous bats invertebrates prey captured in both study sites (U=61: p
>0.544, Mann-Whitney U-Test). The mean Diameter at Breast Height (DBH) of trees were
significantly larger in the farmland than in ASF (t (838) = 6.8934; P = 0.0001). The mean %
understory vegetation thickness of ASF was (38.2 ± 1.9) and that of farmland was (5.8 ± 2.3).
There was a significant difference in the % understory vegetation thickness in both study sites
(df = 209, t = -16.634, P <0.05, N = 210). The farmland had many fruit trees (385) which
produce large fruits eaten by frugivorous bats, as compared to indigenous fruit trees (166) in
ASF producing small fruits. Three main factors explained the higher bat abundance, species
richness and activity in the farmland than ASF. First, the farmland had many bat roosts (13),
some hosting multiple species and in large numbers (one limestone cave had more than a
million individual bats), than in ASF (one). Second, large concentration of cultivated fruit
trees (mango, cashew nut and neem trees), in the farmland produced fruits which when ripe,
attracted many fruit bats (3,397) in the farmland as compared to few fruit bats (733) captured
in ASF. Third, the openness of understory and canopy habitat in farmland facilitated bat flight
as compared to the thick interior of ASF, which constrained foraging as well as bats
movement. For example, although both study sites had the same insectivorous bats
invertebrate prey abundance, still large number of insectivorous bats occurred in the farmland
(930) than in ASF (157). In addition, many individuals of Egyptian Slit-faced Bat (Nycteris
thebaica) a clutter tolerant bat species were captured in the farmland (40) than inside ASF
(14). The findings of this study underscore the importance of the farmland habitat around ASF

III
for bats conservation, and the need for more research in agricultural landscapes, in order to
understand their roles in bats conservation in Africa. Majority of respondents associated bats
with evil and implicated them in destruction of farmer’s fruits. About one-third reported active
killing of bats or destruction of their roosting places; and similar number did not see any
benefits of bats to humans. The elderly and more educated people had more positive attitudes
toward bats than others. Females showed more negative attitudes toward bats and more beliefs
to myths about bats than males, while the males had more hostile behaviour toward bats than
females. To address the prevailing negative attitudes about bats around ASF, there is need to
intensify bat education awareness among youths and females.

IV
STRUCTURE OF THESIS
Chapter one discusses the background of the study, main goal, specific objectives, research
questions and hypotheses. Chapter two reviews the literature about bats, their biology,
distribution, roles in the environment, economic significance of bats to people, habitat
structure and bats distribution as well as threats to bats, and finally perceptions and attitude
about bats. Chapter three provides information on the two study sites: ASF and farmland
(agricultural areas) around this forest, as well as brief descriptions of methods used to collect
data under each objective. Chapter four presents the results of diversity and abundance of bats
in and around ASF. Chapter five presents the results of flight activity of bats captured in mist-
nets as well as insectivorous bats monitored with Pettersson D240x ultrasound detector.
Chapter six presents results on insectivorous bats invertebrate prey abundance and diversity
in ASF and in the farmland. Chapter seven provide results on the vegetation structure and fruit
trees abundance in both study sites. Chapter eight presents results on knowledge, attitudes and
perceptions of bats by the local people living on the eastern part ASF. The last chapter, number
nine summarizes the findings of this study, provide a general discussion, and conclusion as
well as recommendations made from the study about further bat research, conservation and
policy implications.

1
CHAPTER ONE: INTRODUCTION
1.1 Background of the study
About 7% of the world is covered in tropical forests, and supports about 60% of all global
species (Laurance, 1999). The continuous deforestation of tropical forests is among the
greatest threats to global biodiversity (Brooks et al., 2002). Regrettably, forest destructions
will continue in the future, and consequently will lead to extinction of many tropical forest
species (Bradshaw et al., 2009). For example, about 40% of earth’s land area is under crop
cultivation (FAOSTAT, 2011), and five billion hectares of land under crops and livestock
farming exceeds the total area covered by the remaining forests worldwide (Power, 2010).
Although for a long time biodiversity research has been undertaken in protected areas, current
research indicate that agroecosystems, also host sizeable amounts of biodiversity (Foley et al.,
2005), and continue to attract much research interests (Wickramasinghe et al., 2003).
Therefore, understanding the role of agroecosystems in biodiversity conservation is important,
in order to properly manage them, so as they continue to meet human needs as well as
enhancing the long term survival of biodiversity found in them.
The order Chiroptera (bats) is the second largest taxonomic group of mammals (Kunz and
Pierson, 1994) after the order Rodentia. The flight ability of bats enables them to exploit large
areas (both natural and agricultural) in a single night (McCracken et al., 2012). The impact of
forest degradation on bats in Africa, however is poorly understood. However, the number of
people in Africa will increase five-fold in the next century, from 0.6 billion in 1990 to 2.8
billion by 2100 (Bongaarts, 1994). The demand to open more natural areas for crop cultivation,
livestock grazing and expansion of human settlements and infrastructure, which is associated
with human population increase in Africa, will inevitably affect the survival of many forest
bat species. Even though some research has suggested a low dependence of bats on intact

2
forests (Goodman et al., 2005), there is evidence that certain species require undisturbed
forested habitats to forage (Kofoky et al., 2007). Unfortunately, the effects of habitat
degradation on bats in Africa is still unclear (Meyer et al., 2016), hence the need to do more
research in this area.
The coastal forests in eastern Africa are very important for conservation of global biodiversity,
because of the large number of endemic and globally threatened species (Myers et al., 2000).
The forests (160 in total) in Kenya and Tanzania, are recognized as important for biodiversity
conservation globally (Burgess et al., 2003), because of many endemic plants and vertebrate
and invertebrate species found in them (Myers et al., 2000). However, important as these
forests are for conservation of global biodiversity, they are highly threatened by human
activities. The negative anthropogenic activities in these coastal forests have affected the
diversity and distribution of many species. For example, Golden-rumped Giant Sengi
(Rhynchocyon chrysopygus), an endemic species to Kenya and found in ASF, is listed as
globally endangered (IUCN, 2019), due to habitat loss in its original habitat range and wildlife
hunting. Continuous destruction and degradation of coastal forests in Kenya (Burgess et al.,
2003), will continue to affect the distribution and survival of many species, bats included.
One of the biggest (416km2) coastal forest in Kenya and in East Africa is Arabuko-Sokoke
Forest (Bennun and Njoroge, 1999). Despite the importance of ASF for biodiversity
conservation, the forest cover around it has completely disappeared (Kelsey and Langdon,
1984), and ASF is currently surrounded by human settlements and agricultural areas. The
continuous decline of habitat quality in ASF as result of legalized firewood collection; illegal
extraction of timber, charcoal and poles might affect species diversity and abundance.
Although birds (Fanshawe, 1993), plants (Robertson and Luke (1993), invertebrates (Lange,
2003) and mammals (Jackson et al., 2019) studies have been undertaken in ASF, no detailed

3
bat research has been undertaken in ASF. However, sporadic collection expeditions have been
undertaken in ASF in the past, and voucher specimens collected and deposited with
Mammalogy Section-National Museums of Kenya (NMK). Nevertheless, no comprehensive
study has ever compared bat diversity in a coastal forest with that of the surrounding
agricultural landscape in Kenya, to understand the significance of each habitat for bat
conservation. The differences in vegetation structure and other resources such as invertebrate
prey abundance for insectivorous bats, distribution and abundance of fruit trees producing
fruits eaten by fruit bats, as well as roosts distribution might influence the abundance and
distribution of bat assemblages in ASF and farmland around it.
1.2 Problem statement
Although some ecological studies on bats have been undertaken in Kenya (McWilliam, 1987;
Webala et al., 2004; Webala et al., 2006; Webala et al., 2009; Webala et al., 2014; Wechuli
et al., 2016; López-Baucells et al., 2016) none have been undertaken in and around ASF.
Moreover, much of ASF is an ‘island’ in the midst of agricultural and human settlement areas.
However, bats are not restricted to natural areas; their mobility allows them to exploit
agricultural areas and man-made infrastructure as well. It is possible, therefore, that bats found
in ASF may also exploit agricultural areas around this forest, either for foraging or roosting.
However, no study has simultaneously investigated bats in ASF as well as in adjacent human-
modified areas, to understand the role of each habitat in the conservation of the bats.
Indigenous people have interacted with wildlife throughout their lives, which has resulted in
accumulation of immense knowledge, as well as myths and cultural beliefs about many species
of wild animals. In the case of bats, there is much misconception and negative cultural beliefs
perpetuated by print and electronic media, and unsubstantiated tribal folklores all over the
world. Superstitions and ignorance by the general public can lead to direct killing of bats or

4
destruction of their roosts (Altringham, 1996). Therefore, in order to develop appropriate
interventions for conservation of Kenyan bats, there is need to document indigenous
knowledge, and attitudes towards bats. Along the Kenyan coast, such studies are essential
because there are many limestone caves, and man-made structures used by bats (Musila et al.,
2019a). In addition, there are also many negative beliefs and myths about bats, that still persist
among local people (Musila and Mbau, 2010).
1.3 Significance of the study
Bats are important to the environment especially for their roles in invertebrates carnivory and
regeneration of the forests. Thus, knowledge about bat species which occur in ASF and the
adjacent farmland would help us to understand the roles played by these species in forest
regeneration, seed dispersal and crop pest control. The current study was based in ASF and
the farmland around this forest. No data was available on bats species richness in ASF, and
the farmland around it, to determine the presence of species of bats that are habitat specialists,
only restricted to the interior of ASF. If such bat species existed, they would be lost with
continuous degradation of ASF, while others which are habitat generalists persisting in
disturbed areas outside ASF, would be unaffected by anthropogenic activities. This
information would be required to make decision on how best to conserve bats in the both study
sites.
The ability of bats to fly potentially enables them to forage in ASF and nearby farmland. Bats
my also roost inside ASF at day time and forage in the farmland at night and vice versa. In
that case therefore, although current efforts are mainly directed at conservation of ASF
because it is legally protected, this may not fully ensure the survival of some bat species. This
is because some bat species may depend on resources found in private and un-protected lands,

5
where owners could make decisions that may affect the existence of bats. Bats are also known
to use man-made structures for roosting (Lopez-Baucells et al., 2017). The presence of bats in
peoples’ houses and other facilities, increase the interaction between these animals and people,
and development of cultural beliefs about them. This study also investigated attitudes toward
bats among local people in the farmland, to understand what they do when they encounter
bats, because their actions may support or undermine the survival of these species. This
information was important because it would help in formulating the best bat conservation
strategies to employ and to engage local people around ASF.
1.4 Main goal of the study
The broad goal of the study was to investigate factors affecting bat community structure and
activity patterns in ASF and adjacent farmland, as well as human-bats interactions around
the forest.
1.4.1 Research objectives
1. Investigate bat species diversity and abundance in ASF and adjacent farmland.
2. Investigate bat activity patterns in ASF and adjacent farmland.
3. Describe the vegetation structure and abundance of fruit trees resources in ASF and
adjacent farmland.
4. Investigate insectivorous bats invertebrate prey abundance and diversity in ASF and
adjacent farmland.
5. To investigate how gender and age influence perceptions and attitudes towards bats in
the study area.

6
1.4.2 Research questions
1. Does the interior of the natural forest (ASF) and the adjacent farmland have the same
bat species richness and abundance?
2. What is the activity patterns of bats inside the natural forest (ASF) and in the adjacent
farmland?
3. How does vegetation structure and fruit trees abundance affect the distribution of bat
species inside ASF and in the adjacent farmland?
4. Is the abundance of insectivorous bats invertebrate prey in the interior of ASF and in
the adjacent farmland the same?
5. How do attitudes and perceptions of local people about bats change with gender and
age group?
1.4.3 Research hypotheses
1. The interior of ASF and farmland will have the same bat species richness because bats
are highly mobile.
2. The farmland and interior of ASF will have the same patterns of bat activity.
3. Highly cluttered habitats and those with higher abundance of fruit trees resources will
have similar bat species diversity and abundance.
4. There will be no differences in the diversity and abundance of invertebrates in ASF
and in the adjacent farmland.
5. There are will be no differences in the attitudes and perceptions about bats between
gender and age groups of local community in the study area.

7
CHAPTER TWO: LITERATURE REVIEW
2.1 Evolution of bats
Bats (order Chiroptera), are the only mammals group which can fly (Happold and Happold,
2013). To fly they use their flexible wing structure, aided by a special forelimbs characterised
by significantly extended manual digits (Hill and Smith, 1984). Although the evolutionary
history and physical origins of bats is not well known (Gunnell and Simmons, 2005), the first
record of existence of bats is known to have appeared in the early Eocene period (about 51
Mya) in Northern America (Simmons and Geisler, 1998). Bats are closely related to
carnivores, whales, shrews, moles, horses and anteaters, and not flying lemurs as was
previously supposed (Teeling et al., 2000).
2.2 Classification of bats
Bats are divided into two sub orders: Megachiropterans (megabats, fruit bats) comprises the
fruit-nectar-feeding bats, while the microchiropterans (microbats, insectivorous bats) feed on
invertebrates, especially insects. Only three species in the family Desmodontinae, found in
South America, are vampires (feed on blood) Koopman, 1993). Bats are not blind, but have
eyes which see (Taylor, 2000), and the two major groups use different signals to explore the
environment. Insectivorous bats use echolocation, a form of ultrasonic signals emitted into the
environment by an individual bat, which bounces back as an echo and is processed by a bat
brain to locate prey or avoid obstacles in their flight path (Neuweiler, 1989). Fruit bats use
vision and their sense of smell to locate food in the environment (Taylor, 2005).
There are eleven families of bat in Africa, all of them represented in Kenya (Musila et al.,
2019b). These include Pteropodidae (Fruit bats), Rhinolophidae (Horseshoe bats),
Hipposideridae (Leaf-nosed bats), Megadermatidae (False vampire bats), Rhinopomatidae

8
(Mouse-tailed bats), Emballonuridae (Sheath-tailed bats), Nycteridae (Slit-faced bats),
Molossidae (Free-tailed bats) and Vespertilionidae (Vesper bats) (Happold and Happold,
2013). The Family Miniopteridae (Long-fingered bats), which was previously included as a
subfamily of Vespertilionidae (Simmons, 2005) is now recognized as a valid family (Miller-
Butterworth et al., 2007). Kitti's Hog-Nosed Bat (Craseonycteris thonglongyai) weighing less
than 2.0g is the tiniest bat in the world, with most of biggest bats, in the genus Pteropus
weighing up to 1.5 kg (Fenton, 1992). The largest bat species in Kenya is Hammer-Headed
Fruit Bat (Hypsignathus monstrosus), with a forearm measuring 120-139mm, and weighs 290-
419g (Happold and Happold, 2013). The variation in bat sizes, their flight ability, and different
methods of foraging enables them to exploit a wide assortment of habitats, from less disturbed,
to highly modified agricultural and urban areas. However, large bats, especially most of the
fruit bat species have large wingspan, and have limited ability to manoeuvre their way in thick
habitats, and thus tend to forage in more open areas (Fenton 1990; Brigham et al., 1997).
2.3 Ecological importance of bats
2.3.1 Pollination by bats
Fruit bats feed on fruits, pollen, leaves or nectar (Marshall, 1983). During foraging, fruit bats
visit flowers of many plants, move loads of pollen with their bodies, and thus help in plants
pollination (Eguiarte et al., 1987). The African baobab (Adansonia digitata) for instance, is
reported to be pollinated by fruits bats (e.g., African Straw-coloured Fruit Bat (Eidolon
helvum), Gambian Epauletted Fruit Bat (Epomophorus gambianus), Wahlberg’s Epauletted
Fruit Bat (Epomophorus wahlbergi) and Egyptian Rousette (Rousettus aegyptiacus) Djossa et
al., 2015). Flower-visiting phyllostomid bats (New world leaf-nosed bats) comprises about 30
species in South American rainforests (Emmons and Feer, 1990). Pollination aid in fruit

9
formation, which when mature are eaten by many animals, bats included, and their dispersal
assist in the regeneration of plants in the natural areas and agricultural areas.
2.3.2 Seed dispersal by bats
Frugivorous bats have a modified digestive tract (Hansen et al., 2008), which allows rapid
passage of food through its guts (usually less than 30min) Tang et al., 2007). This reduces
large amounts of mechanical and chemical damage to seeds (Lobova et al., 2003), and hence,
increases the viability and germination of ingested seeds when released to the environment.
Fruit bats are the most abundant and diverse vertebrate group in many tropical forests
(Bonaccorso, 1979). In Africa and neotropics forests, fruit bats account for more than 90% of
the seed rain falling on the forest floor (Medellin and Gaona, 1999). Bats are effective seed
dispersers because of their ability to forage far away from their roosts. For instance, fruit bats
can travel as far as 50km in a single night during foraging (Eby, 1991). The distribution and
abundance of fruit bats in the environment has been shown to be influenced by fruiting plants
(Marciente et al., 2015). In additiom, fruit bats consume about 50-250 percent of their body
weight in fruits each night (Thomas, 1984). Thus, large quantities of fruits are eaten each night,
with most of the fruit fragments including seeds, being discarded far and wide in the
environment. Subsequently, the declining population sizes of fruit bats, is likely to affect
forests restoration in the long run, as a result of the reduction in the quantity of plants seeds
dispersed into the environment.
2.3.3 Bats and insectivory
About 70% of all bat species are insectivorous feeding on different types of invertebrate prey
(Jones and Rydell, 2004). Some of the major invertebrates eaten by bats are also crop pests
which destroy many cultivated crops and farmers expend millions of dollars in eradication
(Kunz et al., 2011), often by spraying hazardous chemicals to the environment. Although

10
estimates on insectivorous bats herbivory on agricultural pests are few and anecdotal, some
studies offer some insights. For example, during lactation, small insectivorous bats consume
about hundred percent of their body mass nightly (Kurta et al., 1989). In south-central Texas,
USA for instance, the financial cost of Mexican Free-Tailed Bat (Tadarida brasiliensis) as
insect-pest control agent in cotton farming industry has been estimated to be about $741,000
per year (Cleveland et al., 2006). The African continent has many insectivorous bat species,
which occur in large numbers in the environment, but their roles in pest control in agricultural
crops has not been evaluated, and hence the need for continued conservation of these species.
2.4 Bat and diseases transmission
Bats are known reservoirs and sources of several microorganisms that causes life threatening
zoonotic diseases and other pathogens to humans (Plowright et al., 2017). About 200 viruses
have been associated with bats (Allocati et al., 2016). For instance, of the 12 species of
lyssaviruses; viruses which cause rabies, a deadly disease which causes inflammation of brains
in both animals and people, 11 have been isolated from bats (Banyard et al., 2013). The main
drivers of the emergence of bats zoonotics include agricultural expansion into forests,
deforestation and urbanization (FAO, 2011). These factors increase the contacts between
people and bats, and hence increases opportunities for transmission of these diseases (Daszak
et al., 2001). In addition, some communities in Africa hunt and eat bats (Anti et al., 2015),
which predisposes people to bat related disease transmission. Bats also roosts in man-made
structures such residential houses, schools, temples and bridges (Jung and Threlfall, 2016). As
human population increase in Africa, with consequent destruction of natural bat roosts, it is
expected more bats will continue to colonise man-made infrastructures, and this coexistence
will probably increase potential risks of bat related diseases transmissions to humans.

11
2.5 Bats socio-cultural importance
Since time immemorial, animals have played important roles in the cultures and customs of
human society. They have inspired formation of poems, metaphors and similes (Zandi, 2013),
songs, proverbs and sayings. Some animals are liked while others are detested. The attitude a
person has towards an animal is determined by the information they have about that animal,
how they perceive it, and the nature of the associations they have developed with the particular
animal over time (Drews, 2002). Bats in addition to other animals such as snakes, bugs and
mice are animals which are mostly feared by many people (Robins and Regier, 1991). Bats
have a bad reputation among general public (Allocati et al., 2016). The way people in a given
area perceives the environment is basically influenced by their thought process as well as how
they act towards different animals and plants (Khan et al., 2013). Beliefs to myths, which
permeate fear about animals often result into direct persecutions of animals (Fita et al., 2010).
Thus, the attitude local people have about bats around ASF, can negatively or positively affect
bats survival in the long run.
2.6 Distribution and species diversity of bats
2.6.1 Global distribution of bats
There are more than 1300 species of bats in the world, 221 in Africa and 104 in Kenya
(Happold and Happold, 2013; Voigt and Kingston, 2016; Musila et al., 2019b). Bats are found
in all continents except in Antactica, polar region and few isolated oceanic islands (Koopman,
1984; Kunz and Pierson, 1994). Species richness of most taxa, bats included decreases as one
move away from the equator (Hillebrand, 2004). About 80% of bat species worldwide occur
in the tropics (Willig et al., 2003), with the greatest diversity of insectivorous bats being found
in the tropics (Willig and Selcer, 1989).

12
2.6.2 Relationship between bat species and their habitat
Habitat complexity and heterogeneity are two main habitat characteristics which are thought
to structure bats assemblages. Heterogeneity can be defined as the understorey thickness or
openness of a habitat, while complexity refers to habitat types classified by different height
levels (Fahr and Kalko, 2011). Forest habitats have different layers from the ground to the
forest canopy. Some species of bats only fly high above the ground (Kunz and Kurta 1988),
some below the canopy, while others constantly use the entire vertical forest stratification
(Bernard, 2001). For example, in African tropical forests up to nine species of fruit bats can
coexist together (Wolton et al., 1982), with bat species selecting to roost or forage at different
height levels in the forest habitat (Henry et al., 2004). Therefore, because of the differences in
habitat structure between the interior of ASF and farmland, it is expected each habitat would
be utilized differently by bat species. For example, in the interior of ASF, some bat species
may fly or forage below the forest canopy and be easily captured in mist-nets, while others
may exclusively forage above the forest canopy and be impossible to capture. In addition,
some studies have shown that more open habitats are more used by bats than those overly
closed (Humes et al., 1999). Probably, this would mean that, habitats with more open
undergrowth, as is the case of the agricultural areas around ASF, may be more used by bats
for foraging or general commuting from one place to another.
The diversity and abundance of bats in a place, may also be affected by the availability roosting
sites (Cotterill and Ferguson, 1999). Thus, areas with many suitable bat roosts would have
many individuals of bats, as bats come out to feed at nightfall and as they return again to roost
at dawn. Although it has been suggested that bats are not affected by habitat loss because of
their mobility (Schulze et al., 2000), some species may be affected. For example, Meru
National Park and Bogoria National Reserves in Kenya, were richer in bat species, as
compared to agricultural areas around them (Webala et al. (2004); Wechuli et al., 2016). In

13
addition, habitat structure may influence the abundance of forest resources used by bats, and
thus the changes in bat species richness and diversity. The availability and distribution of food
(soft fruits when ripe, pollen) influences the distribution and abundance of bats in the
environment (Fenton and Rautenbach, 1998). Therefore, the availability of fruiting trees,
which produce fruits targeted by foraging frugivorous bats, between the ASF and adjacent
farmland, my determine the number of frugivorous bats mist-netted in each habitat.
2.6.3 Bat activity in the environment
Most bats are nocturnal, except a few pteropodids (fruit bats) species which are diurnal in
islands without day predators (Cox, 1983). Bats spend the day time in roosts and emerge in
the evening mainly to forage (Eckert, 1982). Bat flight activity can be described as the
movement of an individual bat out of its day’s roost, into the airspace at night to forage or
commute to suitable feeding or drinking areas. Bat flight activity can be documented directly
with mist-nets captures (Kunz and Brock, 1975) and indirectly with ultrasonic detectors
(Fuentes-Montemayor et al., 2012).
Bat activity can be influenced by several factors including food (invertebrates prey, fruits and
pollen), moonlight and habitat structure and predation avoidance. More open habitats have
been shown to be more actively used by bats, as compared to other habitats which are more
cluttered (thick) (Kalko et al., 1996). Because the understorey (undergrowth) cover in ASF is
very thick, it would be probably used less by bats foraging or commuting below the forest
canopy, and thus consequently reduce the number of individuals captured in mist-nets or
signals detected with ultrasonic bat detectors. On the contrary, the farmland has many open
areas which are potential bat flight paths. These open areas would probably facilitate more
individual bats to use this habitat for foraging or commuting, and thus increase the number of
bats captured in mist-nets and signals detected in farmland than those recorded in ASF. The

14
time insectivorous bats become active appears to be a trade-off between the availability of
prey and emergence of their predators (especially owls (Jones and Rydell, 1994). Insectivorous
bat diversity and activity are also associated with the abundance of insects (Rautenbach et al.,
1996). Areas with abundant insect prey, which can easily be tracked and captured by
insectivorous bats, would be more actively used for foraging, than areas where food prey is
scare and difficult to capture. Resource availability (e.g. fruit trees and roosts) within forest
and the matrix can also shape bats composition (Estrada-Villegas et al., 2010).
2.7 Threats to bat species and their habitats
Human beings are the main causes of threats to bats and their habitats. The main threats include
habitat loss, negative perceptions, bush-meat trade, destruction and or modification of roost
sites. Although bats are long lived animals (about 31 years) compared to their small body sizes
(Tuttle and Stevenson, 1982), their reproductive biology makes them highly prone to
population declines. For example, bats have a slow reproductive rate, with often one and rarely
two young being born annually (Racey, 1982). Thus, any rapid population decline of a bat
species, may not easily recove due to the slow rate of reproductive rate of the order.
2.7.1 Destruction and or modification of roosting sites
Bats spend more than half of their lives in roosts (Racey, 1982). Bats are not known to create
their own roosting areas (Kunz and Lumsden, 2003). However, they select an assortment of
suitable areas to roosts including tree foliage, natural caves, hollows in trees, and a variety of
human infrastructure (houses, bridges, culverts (Kunz and Pierson, 1994). Roost availability
affects bat species distribution and associations (Kühnert et al., 2016). Areas with many bat
roosts used by different species, is likely to have high bat diversity as well as activity. Bat
roosts are found everywhere, both in the protected areas and outside, in urban and rural areas.

15
Roosts outside protected areas are highly prone to destruction by humans, through conversion
to other uses that are not compatible to bat conservation. Some bats roosts especially caves are
frequently visited by many people, which causes continuous disturbance to roosting bats. For
instance, Large Slit-faced Bat (Nycteris grandis), abandons preferred roosts after disturbance,
returning there several days later (Fenton et al., 1993). Bat roosting in man-made structures,
or trees near proximity to people are not tolerated but are either killed with catapults (Musila
and Mbau, 2010), sprayed with chemical poisons, or roost trees are cut down or pruned to
chase bats away (Webala et al., 2014).
2.7.2 Hunting bats for bush-meat
Individuals of bats are also hunted for bush-meat by local people worldwide. Bush-meat
hunting has contributed significantly to population declines of fruit bats in Asia (Epstein et
al., 2009; Kamins et al., 2011). Bush-meat hunting of E. helvum in West Africa is causing
population declines of this species (Struebig et al., 2007). Although no bush-meat hunting of
bat has been documented to occurs in Kenya, it is important to note that individuals of E.
helvum also found in Kenya migrate, to West Africa where massive hunting of the species has
been recorded (Kamins et al., 2011).
2.7.3 Habitat degradation and fragmentation
The rapid increase in human population, and its demand for land for crop and livestock
farming, settlement and development of other man-made infrastructure will continue to
increase the size of human-modified ecosystem globally. The disappearance of natural
vegetation which supports fruits and invertebrate communities, which bats depend upon for
their survival might affect some bat species and their abundance. Human population increase
will also result in the destruction or alteration of roosting areas mainly caves and foraging
areas. For tree-roosting bat species, the destruction of forests and woodlands has a negative

16
effects the on distribution and survival of different species of bats in a given area (Fenton and
Rautenbach, 1986).
2.7.4 Evictions of bats roosting in man-made structures
Many bat species roost in man-made structures, such as traditional huts, schools, offices and
bridges (López-Baucells et al., 2017). The main threats to wild animals, especially bats that
lives in close association with people are also humans (Voigt et al., 2016). Some people are
not tolerant to bats living in their houses. People fear bats for the diseases they are likely to
transmit to them, as well as because they are a nuisance for odors and dust from their droppings
(Razafindrakoto et al., 2011). Thus, some people therefore, kill bats directly using various
methods, or try to evict them with application of chemical poisons (Bayat et al., 2014).
Although, no information exists on the number of individuals of bats lost each year globally
from direct killing or implementation of unfriendly eviction procedures, most likely large
numbers and diverse populations of bats are being lost annually.
2.8 The importance of coastal forests in Kenya and East Africa
Most of the forests along the east African coast occur in between 0-500 m above sea level, and
straddle southern Somalia, through Kenya and Tanzania to southern Mozambique (Habel et
al., 2017). A total of the remaining 160 coastal forests patches in Kenya and Tanzania were
recognized as one of the 35 global biodiversity hotspots (Mittermeier et al., 2009). This
hotspot, now known as ‘Coastal Forests of Eastern Africa Biodiversity Hotspot’, has many
endemic species including: at least 1,500 plants, 16 mammals, 22 birds, more than 33
amphibians and 50 endemic reptiles (Lovett and Wasser, 1993; Myers et al., 2000). Although
these forests are important repositories of biodiversity, they are highly fragmented and in
continuous state of encroachment and disturbance (Burgess et al., 2003). The size of the
remaining coastal forests in eastern Africa, as well as their habitat conditions is on a declining

17
trend to the detriment of the common, globally threatened and endemic species. Furthermore,
in many Kenyan coastal forests very limited if any bats research has been undertaken. Because
bats are able to fly from one place to another, they are capable of exploiting resources (fruits,
invertebrate prey, roosts) both in protected forests and adjacent matrix. Some coastal forest
fragments especially in Kenya are very small (Bennun and Njoroge, 1999), and may not on
their own support the survival of some bat species that range widely. Thus, the role of coastal
forests and agricultural areas around them, in sustaining bat biodiversity in Kenya need to be
investigated.

18
CHAPTER THREE: STUDY AREA AND GENERAL METHODS
3.1 Introduction
This chapter provides information on the characteristics of the study area including location,
altitude, soils, weather conditions, vegetation, animals and conservation issues affecting
biodiversity conservation. The methods used to collect various types of data on bats, their
activity; vegetation, invertebrates and people are also briefly described.
3.2 Description of the study area
3.2 1 Location and conservation status
This research was conducted in two study sites located adjacent to each other: the interior of
Arabuko-Sokoke Forest (ASF) and adjoining human-modified habitats in the eastern part of
the forest, here collectively referred to as ‘farmland’ (Fig. 1). The ASF is found in Kilifi
County, about 20km from Malindi, at a latitude of -3.5167S and longitude 39.8167E, and
elevation of less than 200m above sea level (Bennun and Njoroge, 1999; Muchiri et al., 2001).
The ASF is a legally protected area managed by Kenya Forest Service (KFS), in partnership
with Kenya Wildlife Service (KWS), National Museums of Kenya (NMK) and Kenya Forestry
Research Institute (KEFRI) (ASFMP, 2002).
The farmland around ASF is the largest habitat in the area (Fig. 1). It is dominated by areas of
crops cultivation, human settlements, development infrastructure (small towns and village
markets), and social amenities (schools, hospitals, and roads). Study sites in the farmland were
in different villages located in between Matsangoni to Msabaha (Fig. 1 (area in between two

19
arrows in the east). Field work was conducted in the interior of ASF and farmland in between
March 2014 to December 2016.
Figure 1. A Map of the study areas showing the different vegetation types in the interior of
ASF and the farmland.

20
3.2.2 Climatic condition of study area
Due to the close proximity of ASF and farmland, the weather (rainfall, temperature, winds,
humidity) conditions are the same. The mean daily temperature around ASF is 25° C, with
little monthly variations throughout the year. The hottest month was March (28.60C) and
coolest was June (26.70C) (ASFMP, 2002). The mean temperature reading from Msabaha, a
meteorological field station about 10 km from the forest, for the month of February 2015 was
(28.6° C ±0.1, N=28 days), June 2015 (26.7° C ± 0.4, N=28) and November 2015 (27.9° C ±
0.2, N=28).
The areas around ASF experience high relative humidity throughout the year because it
adjoined to the Indian Ocean (ASFMP, 2002 (Fig. 1). The mean relative humidity recorded
from Msabaha meteorological field station, for February 2015 was (69.6 ± 0.2, N=28 days),
June 2015 (39.56 ± 0.3, N=28) and November 2016 (77.0 ± 0.7, N=28).
Rainfall around ASF is bimodal in pattern. Monsoon winds occurring between April and June
bring heavy rains (long rain season), followed by a short rain season in between November to
December each year (ASFMP, 2002). The average annual rainfall ranges from 600m to 1000
mm (Bennun and Njoroge, 1999). January to March (dry season) are the driest months. The
mean rainfall recorded from Msabaha meteorological field station, for February 2015 was
(0.5mm ± 0.1, N=28 days), June 2015 (2.6mm ± 0.8, N=28) and November 2015 (2.9mm ±
0.8, N=28).
3.3. Characteristics of soils, flora and fauna
3.3.1 Soil characteristics
There are two main types of soils (red and grey sand) in the interior of the ASF and in the
farmland. The grey sand soil which is well drained and infertile, occur in the mixed and

21
Brachystegia (miombo) woodland, and at most 5 km from the coastline into the farmland. The
red soils are deep and heavily leached and are found more inland, especially in Cynometra
forest (ASFMP, 2002). The clearance of the natural vegetation in the farmland and continuous
cultivation of crops reduces soil fertility, which may affect growth of wild plants, and
invertebrates which are the main prey items of insectivorous bats.
3.3.2 Natural vegetation
About 600 plant species are found in ASF (ASFMP, 2002). The plant community in ASF is
classified into three broad vegetation types (Fig. 1). Mixed forest (7, 000 ha (Fig. 2), comprises
of relatively dense, tall and undifferentiated trees growing on grey sands. Cynometra forest
(23,500 ha), is a lowland evergreen dry forest, with closed canopy and the undergrowth is
interwoven with numerous saplings and lianas, making it impenetrable to walk through. The
Cynometra forest (Fig. 3) which occurs on red soils and is mainly characterised by evergreen
Cynometra webberi trees, as well as Manilkara sulcata and Oldfieldia somalensis and few
scattered individuals of Brachylaena huillensisis trees. Brachystegia woodland (Fig. 4) (7,700
ha), is a form of ‘miombo’ lowland forest dominated by B. spiciformis (Bennun and Njoroge,
1999; Robertson and Luke, 1993). The canopy and understorey of the Brachystegia woodland
is more open and relatively easy to walk through, than the other two forests types (Fig. 2, 3).
Because of the high density of trees and shrubs in ASF, the inside of this forest was less windy.
In the interior of ASF, bats were sampled in the three different vegetation types (Brachystegia
woodland, Cynometra forest and Mixed forest).

22
Figure 2. Mixed trees forest in the interior of ASF.
Figure 3. Cynometra webberi trees dominated forest in the interior of ASF.

23
Figure 4. Brachystegia spiciformis trees dominated woodland in the interior of ASF.
Almost all indigenous woody plants in ASF have been cleared in the farmland by the local
people, to open land for farming and human settlements. The main exotic fruit trees cultivated
in the individual farms were mango (Mangifera indica), cashew nut (Anacardium
occidentale), neem (Azadirachta indica) and coconut (Cocos nucifera). The actively cultivated
fruits trees were preferred for their fast growing and as sources of household income and
multiple useful products. Other trees occasionally found in the farms were Indian almond
(Terminalia catappa), casuarina (Casaurina equesitifolia), guava (Psidium guajava), sugar-
apple (Annona squamosa) and gamhar (Glmelia arborea). Casuarina was preferred as fast
growing tree for provision of building poles and timber. Few baobab trees found in the farms
were at least about 3-5 km from each other.
The mango, cashew nut, coconut and neem trees remain evergreen annually; hence their leafy
canopies could possibly be used by bats for roosting. Some farms were dominated by either
coconut or mangos trees, while others had a mixture of these trees. The study sites in the

24
farmland, were individual compounds (farm/s), used by households for settlement and crops
or trees cultivation. These farms were selected by visiting individual households, and visually
estimating the % of cultivated trees in each farm. The mango farms (Fig. 5) had at least 50%
dominance by mango trees; coconut farms >50% coconut trees (Fig. 6); while the mixed tree
farms (Fig. 7) had at least 50% coconut trees, 20 % cashew nuts and mango trees. Bat sampling
was only undertaken in farms where landowners did not ask for any kind of compensation
from our research activities. The understory habitat of the farmland was very open, and could
allow people or animals to wander about without obstruction. Due to the openness of the
farmland habitat the area experienced regular breeze from the nearby Indian Ocean.
Figure 5. Mango trees dominated farms in the farmland in the eastern part of ASF.

25
Figure 6. Coconut trees dominated farms in the farmland in the eastern part of ASF.
Figure 7. Mixed trees farms in the farmland on the eastern part of ASF.

26
3.3.3 Animal community
A total of 73 mammal species are found in ASF (Jackson et al., 2019). Those of major
conservation concerns include the Critically Endangered (CR) Ader’s Duiker (Cephalophus
adersi), endmic to Kenya and endangered (EN) R. chrysopygus, Vulnerable (VU) Sokoke Dog
Mongoose (Bdeogale omnivore) and African Elephant (Loxodonta Africana (IUCN, 2019).
Limited information exist about bats, rodents, forest shrews (Genus Crocidura) and small
carnivores of ASF.
There are 270 bird species known from ASF, six of which are globally threatened (ASFMP,
2002). These include Sokoke Scops Owl (Otus ireneae (EN), Spotted Ground Thrush
(Zoothera guttata (EN), Sokoke Pipit (Anthus sokokensis (EN), East Coast Akalat (Sheppardia
gunningi (VU), Amani Sunbird (Athreptes pallidigaster (EN) and Clarke's Weaver Ploceus
golandi (Endemic to Kenya (EN) Bennun and Njoroge, 1999). Other species recorded in ASF
include lizards (21 species), snakes (41), tortoises (2), butterflies (more than 100) and
amphibians (25) ASFMP, 2002). Lange (2003) and Bank et al. (2010) respectively described
the snails and arthropod community of the forest.
Large and medium sized wild mammals have been completely wiped out in the farmland,
mainly by hunting and destruction of suitable indigenous habitat for their survival. However,
the following wild animals were recorded during my fieldwork in the farmland: One individual
of Common Bush Duiker (Sylvicapra grimmia); Dwarf Galago (Galagoides cocos) were heard
calling and some individuals seen at night in the cashew nut trees, and a few individuals of
White-bellied Hedgehog (Atelerix albiventris). The most common bird species in Gede and
Watamu towns, and other small village shopping centres were Indian House Crow (Corvus
splendens) and Black Kite (Milvus migrans). Two gecko species Baobab Gecko

27
(Hemidactylus platycephalus), Barbour's Gecko (Hemidactylus barbouri) were
opportunistically collected from the farmland and deposited with the NMK Herpetology
Section.
3.4 Threats to biodiversity in study area
3.4.1 Threat to biodiversity in ASF
The rapid increase in human population around ASF is probably the single most serious threat
to this forest and it biodiversity (Ongugo et al., 2008). More than 54 villages occur around
ASF and depend on ASF for the supply of firewood for heating and cooking (ASFMP, 2002).
The old and big trees are more easily the target of loggers, while old trees which die and start
to decay are collected as firewood. Firewood is obtained legally by applying for a permit from
KFS or illegally. Mogaka (1992), estimated that over 30,000 poles and 610 tons of fire woods
were removed from ASF annually. The low number of KFS and KWS rangers posted to guard
the forest, is not adequate to patrol the whole forest regularly, which makes it difficult to
control illegal logging for timber, wood carving, building poles and charcoal burning (Habel
et al., 2017). Bush-meat hunting, using wire snares and other traditional traps is rampant in
ASF. More than 1, 000 local households living around ASF illegally hunt and capture a wide
assortment of mammal species from this forest annually (FitzGibbon et al., 1991). The
widespread and uncontrolled bush-meat hunting has probably contributed to the decline in the
population size of C. adersi, which has become very rare, and has not been seen in the forest
for many years.
3.4.2 Threat to biodiversity in farmland
Majority of inhabitants around ASF are subsistence farmers (ASFMP, 2002). The initial
occupants of the area in 1960s, were allocated 12 ha of land per household for settlement and

28
farming. However, with rapid human population increase over the years, the land has been
sub-divided into small farms (< 2 ha) among the relatives, with very few farms of 12 ha now
remaining. Farms were cultivated with different agricultural crops such as maize, cassava or
peas. In addition the individual farms were planted with neem, mango, cashew and coconut
trees, while others were left unattended and encroached by weeds. The sizes of cultivated
farms will continue to decline with time, and after many years much of the farmland will
possibly be converted to an urban area, as a result of increasing human population and process
of urbanisation.
Much of the eastern part of ASF was more urbanised, with rapidly growing population of
people from other parts of Kenya. Villages around Gede, Watamu and along the road to
Malindi and Mombasa had more electricity connection, and better rural access roads. Most of
the farms had at least about two traditional houses roofed with dry coconut leaves (makuti),
and walls constructed of building poles and plastered in mud. Other compounds had big
modern houses constructed of coastal coral stones, plastered with cement and roofed with
corrugated iron sheets, most of which were in use, while a few others had been abandoned and
unused by people. A few compounds had abandoned water well dug in the past and used as
sources of water. These different types of houses were potential roosts for many bats species.
Urbanisation, human population increase and proliferation of man-made structures, will
increase potential roosting environments for bats, but also will amplify human-bat
interactions, which eventually may threaten survival of bats in the farmland.
3.5 General materials and methods
3.5.1 Research design
The broad goal of the study was to investigate factors influencing bat community structure
and activity patterns in ASF and adjacent farmland, as well as human-bats interactions around

29
the forest. The taxon under investigation was bats, that are broadly divided into fruit and
insectivorous bats. Two study sites were going to be the focus of the research namely inside
ASF and farmland. The first important ecological question to address was; which species of
bats were found in both study sites? This question was closely linked to: if these two study
sites had bats; which one was actively used more for foraging and what were the differences
in the bat community structure and composition between these sites?
The two study sites could possibly have the same or different bat species richness and
abundance. In addition, they could be used the same way or differently by bats. If bat diversity
and abundance, as well as use between ASF and farmland was not the same, there would be
need to investigate factors causing these differences. A literature review indicates four main
factors likely influence the abundance and distribution of bats in time and space. These include
distribution and availability of roosts, fruit trees abundance (fruits eaten by fruit bats),
invertebrate prey abundance (eaten by insectivorous bats) and habitat structure. Areas with
many bat roosts tend to have more bats captured in mist-nets or detected with ultrasonic
detectors. Fruiting trees attract many foraging frugivorous bats when fruits ripen. Open areas
with abundant invertebrate prey abundance attract many foraging invertebrate prey
abundance, as compared to thick habitats, where the same prey may be available but difficult
to track and capture by these bats. Bats occur inside and outside protected areas, and interact
frequently with people during foraging, or when they roost in man-made structures used by
people. Since there is a worldwide negative perceptions about bats, attitudes and perceptions
were investigated toward bats among people living in the eastern part of ASF, to understand
whether their actions toward bats would either enhance or undermine the survival of bat
species and their habitats in the study area. Research design steps followed are illustrated
below (Fig. 8).

30
Figure 8. Conceptual framework of the research study
The broad goal of the study was to investigate factors influencing bat community
structure and activity patterns in ASF and adjacent farmland, as well as human-bats
interactions around the forest.
Insectivorous
Bats invertebrate
prey abundance
Distribution and
abundance of fruit tree
species
Habitat
structure
Actions of people toward bats can affect their habitat structure to the extent that;
distribution of individual bats in the two study sites, their roosts, prey and fruit trees
abundance also changes
Bat Species
Roosts
distribution
Insectivorous bats Fruit bats
Bats diversity and distribution and their activity in the two study sites can be influenced by
Factors influencing bats assemblage structure and activity patterns in Arabuko-Sokoke forest
and adjacent farmland, Gede, Malindi-Kenya
Which species of bats and in what numbers occur in ASF and Farmland?
ASF Farmland

31
3.5.2 Bats mist-netting method
Mist-netting is widely used in many bat community studies (Blake and Loiselle, 2009). Mist-
nets set at three metres above the ground were used to survey bats in ASF and farmland. The
nets had four shelves, with a mesh of 16mm, 12m in length and 2.5m in width (Manufacturer,
Ecotone Company, based in Poland). A total of five mist nets were used to capture bats in
different sampling stations in the three vegetation types in the farmland (mango, coconut and
mixed farms) and in the interior of ASF (Brachystegia woodland, Cynometra forest and Mixed
forest). Bats were surveyed in three main different seasons (dry, long rains, and short rains) in
seven field expeditions in the study area. During each survey, an equal number of stations
were used to sample bats, in each of the three different vegetation types both in ASF and in
the farmland. Mist-nets were monitored for varying duration of hours each night, but the
sampling effort was consistent in each vegetation type in both habitats in each survey and
season. In addition, the total length of net used in each vegetation type, in both habitats was
the same in each survey. Sampling was done alternately, one day in ASF and the next in the
farmland, to reduce bias associated with daily changes in weather conditions, which may affect
bat activity or availability of invertebrates for insectivorous bats. Nets were also moved to a
new sampling station each night, in order to reduce bias associated with decay in trapped bats,
when they avoid mist-nets, after they learn their presence as a result of repeated sampling in
the same location (Kunz et al., 2009). To compile a comprehensive checklist of bats in the
study area, bats were also sampled from roosts encountered.
3.5.3 Bat activity surveys methods
Bat activity can be described as the presence of an individual bat in the airspace, after it
emerges from its roost to forage or commute to suitable feeding or drinking areas. An area
with large number of trapped bat in a given time (e.g. one hour), or count of many
insectivorous passes (echolocation calls) has high bat activity. In this study bat activities were

32
investigated using mist-net captures and ultrasonic detectors. During bat mist-netting surveys,
the time of capture of each individual of all bat species was recorded, throughout the entire
duration nets were monitored in each sampling station. In addition at the same bat mist-netting
stations in the interior of ASF and the farmland, bat echolocation calls (passes) were also
counted, using a Pettersson D240x ultrasound detector (Manufacturer, Pettersson Elektronik
ABTM Company, Uppsala City, in Sweden) set in heterodyne mode (Estrada et al., 2004).
3.5.4 Sampling of invertebrates prey
Insectivorous bats exploit a wide variety of invertebrates as food prey, by foraging in different
habitats and height levels above the ground. Because the interior of ASF and farmland had
marked differences in habitat structure, it was predicted that this would influence the
abundance of invertebrate prey and insectivorous bat species richness and activity.
Invertebrate prey were sampled at night by use of solar lights (DP Light DP-6005A)
http://en.dpled.com) Sanyal et al., 2013) in 12 different sampling stations both in ASF and
farmland.
3.5.5 Assessment of bat habitat structure
Habitat characteristics play an important role in structuring animal communities. Point-
Centred Quarter (PCQ), a plotless vegetation survey method (Cottam and Curtis, 1956; Bryant
et al., 2005) was used to characterise vegetation structure in the both study sites. A total of
210 survey points, were used to describe the vegetation structure both in ASF and farmland.
The main vegetation data collected from each PCQ point included tree species, percentage
canopy and understory cover, Diameter at Breast Height (DBH), tree crown diameter and
distant between trees.

33
3.5.6 Human-bats interactions survey methods
To investigate bat-human interactions around ASF, people living at most 1 km around three
large bat roosts (limestone caves), and others living at most 3 km away from these caves were
interviewed. To document their responses I used semi-structured questionnaires.

34
CHAPTER FOUR: BATS DIVERSITY IN ARABUKO-SOKOKE FOREST AND
ADJACENT FARMLAND
ABSTRACT
Bats diversity and abundance were investigated in ASF and the farmland using mist-nets
erected at 3M above the ground. Bat species in roosts were sampled with hand nets and their
population sizes estimated. A total of 25 bat species were recorded both in ASF and the
farmland. This included 19 in ASF and 25 in farmland. A total of 18 bat species occurred both
in ASF and farmland. Moloney’s Mimic Bat (Mimetillus moloneyi) was recorded exclusively
in ASF, while six bat species were recorded solely in the farmland and not in ASF. Bat species
diversity in ASF was (H’= 1.48 ± 0.2) while that of farmland was (1.33 ± 0.1), but the farmland
had higher bat richness than ASF (Chao1, ASF: 19 [19-25], farmlands: 24 [24-32] species
[0.95% CI]). In both study sites 5,217 individuals of bats were captured; 82.9% in the farmland
and 19.1% in ASF. Fruit bats (R. aegyptiacus and E. wahlbergi), were the most common bat
species (represented by 79% of all captured bats) in both study sites, while the most commonly
captured insectivorous bat species was Heart-nosed Bat (Cardioderma cor (11.9%). A total of
14 bat roosts were found in the study area, which included 13 in the farmland and only one in
ASF. Although, the farmland outside ASF was exceedingly degraded, bats still occurred in it;
which emphasizes its importance for conservation of bats in the study area.
4.1 Introduction
Human-driven habitat changes and loss pose the greatest threat to global biodiversity (Barlow
et al., 2016). These anthropogenic activities continue to convert the remaining tropical forests
in Africa to human-modified areas or agroecosystems (Williams-Guillén et al., 2016). Bats
have the ability to fly and and are capable of exploiting different types of habitats in the
environment (Treitler et al., 2016). However, this does not mean they are unaffected by habitat
modifications and disturbance. Hence, the need to continue to study bats in protected areas
and neighbouring agricultural landscapes around them, so as to understand the roles of
agroecosystems in their conservation. This study investigated 1). Bat species richness and
diversity, 2). their composition and abundance, and 3). types of roosts and their characteristics
in ASF and in the adjacent farmland. Because the two study areas; ASF and farmland were
adjoining each other it was expected that the two habitats would have the same bat species
richness. However, the marked differences in habitat structure and other resources in ASF and
farmland could result in different bat species assemblages.

35
For example, the dense understory cover in ASF could result into reduced exploitation by bats
that forage below the canopy. This would result in low rate of capture of some bat species.
Besides, bat activity is generally lower in thick and cluttered habitats than in open areas (Kalko
et al., 1996). Resource availability (e.g. fruit trees and roost sites) in the environment could
also shape bat species composition. The farmland around ASF had many cultivated fruit trees,
such as mangos and cashew nuts, which are sources of food for frugivorous bats. Roost
availability is also known to influence bat species distribution and association (Kühnert et al.,
2016). Thus, I predicted that the farmland would have higher relative abundance of
insectivorous and frugivorous bat species than the interior of ASF. This assumption was also
confirmed by data from my preliminary surveys in both habitats in March 2014, in which
showed that the farmland had higher overall bat species richness and abundance (17 spp., 144
individuals), than that in ASF (10 spp., 63 individuals). This study sought to validate this
assumption and the supportive preliminary findings.
4.2 Materials and Methods
4.2.1. Bat surveys
Mist nets set at 3M above the ground were used to capture bats in 81 mist-netting stations
(Table 1, Fig. 9) in the three vegetation types in ASF and in the farmland (Musila et al., 2019c).
The distance between any two bat mist-netting stations was approximately 1.5km from each
other. Mist nets in a station were erected at most 100m from each other. Because roads through
ASF were narrow (maximum width of 4m), the mist-nets (12m length) were erected slantwise
across these roads. In the farmland, nets were erected in open areas cleared of trees or in
openings in between tree rows. Stations in ASF and farmland were sampled alternatively, one
day in the forest and the next in farmland, to reduce the decrease in bat captures by repetitively

36
sampling in the same station as previously done by Kunz et al. (2009) and Castro-Arellano
et al. (2010).
Table 1. Bat sampling seasons, dates, time and effort in ASF and farmland.
Note-The total effort in ASF and farmland was calculated by multiplication of (A*B*C*D) (net meter/hours (nmh).
Mist-nets were checked twice each hour throughout the night. All captured bats were kept in
a large cloth bag, and released at each bat mist-netting station after recording the following
information for each individual of a bat captured; time found in the net, species identity,
breeding status, sex, weight, age and forearm length. These variables are important for species
identification and assessment of reproductive condition of individual bats. To assess the rate
of bats recapture in each sampling station, a number of bats were marked by being wing
punched and released, and then those individuals which were recaptured in the same sampling
station recorded and released again.
In between November 2014-November 2016, seven bat sampling surveys were undertaken in
ASF and adjacent farmland. Sampling effort varied slightly between surveys, but was always
the same between vegetation types in ASF and farmland (Table 1).
Survey
month
Season
Survey hours
(start-end)
Surveyed
hours/
night (A)
Nets(m)
/habitat
(B)
No. of
mist-nets
/station
(C)
No. of nights
- ASF
(D)
No. of nights
- farmlands
(D)
Total
sampling
effort -
ASF
Total
Sampling
effort -
farmlands
Nov-2014 Short rain 19-24 5 12 5 9 9 2700 2700
Feb-2015 Dry 19-01 6 12 5 12 12 4320 4320
Jun-2015 Long rain 19-01 6 12 5 12 12 4320 4320
Nov-2015 Short rain 19-05 10 12 5 12 12 7200 7200
Feb-2016 Dry 19-05 10 12 5 12 12 7200 7200
Jun-2016 Long rain 19-05 10 12 5 12 12 7200 7200
Nov-2016 Short rain 19-23 4 18 2 12 12 1728 1728
TOTAL 81 81 34668 34668

37
Figure 9. Map of the study area showing the different vegetation types and sampling stations
in ASF (red dots) and farmland (green triangles).
Bats were also surveyed opportunistically from roosts, by interviewing the local people around
the study area to help locate any existing roosts. Specifically, during socioeconomic surveys,
respondents were asked to give information about places (e.g. trees, caves or houses) where
they knew bats roosted in large numbers. Reported roosts were visited to check whether bats

38
were still roosting in them. This was followed by directly capturing some with hand nets as
they flew out of active roosts. The number of bats in each roost was also estimated visually as
done by Flaquer et al. (2007) in other studies.
Bat identification keys developed by Monadjem et al. (2010) and Patterson and Webala (2012)
were used to identify bats in the field. Voucher specimens collected from the field were also
compared with bat specimens preserved at Mammalogy Section Lab-National Museums of
Kenya (Appindex 1). The classification provided by Happold and Happold (2013) is used for
scientific and English names. Voucher specimens were collected for some species, preserved
in 70% ethanol, and deposited with the Mammalogy Section-NMK.
4.2.2 Data analysis
To estimate the total sampling effort in each site site (ASF, farmland) the product of length of
all nets was multiplied with all hours worked during each expedition as done by Medellín
(1993) Table 4.1). To estimate the relative abundance of bats in each study site (ASF,
farmland), the total number of bats captured were divided with total sampling effort in each
study site. EstimateS 9.1.0, a program that uses data on species richness and abundance was
used to construct bat species estimate curves. To estimate the total bat species richeness in
ASF and farmland Chao1 and Jacknife1 (Chao, 1987; Colwell et al., 2012) were used. Bat
species diversity in both study sites and different vegetation types was calculated with
Shannon-Wiener Index (H/) of diversity (Shannon and Weaver, 1963). To compare the
similarity of bat species between ASF and farmland Morisita % similarity index was used
(Morisita, 1959). Unweighted Pair Group Method with Arithmetic Mean (UPGMA)
dendrograms, were used to classify bat species among different vegetation types, using their
presence or absence as well as the abundance of each species. To compare seasonal changes
in the distribution of captured bats by sex and age, and breeding conditions, data for three bat

39
species (R. aegyptiacus, E. wahlbergi (fruit bats) and C. cor (insectivorous bat) was used. This
was because the three species were captured each night in large numbers in the entire survey
and also in each season. The UPGMA dendrograms, were analyzed with PAleontological
STatistics (PAST 3.16) program (Hammer et al., 2001).
4.3 Results
4.3.1 Diversity and species richness of bats
In total, 25 bat species were recorded in the two study sites (some selected bat photos
(Appindex 2). This included 19 species in ASF (Table 2) and 25 in the farmland (Table 3).
Eighteen bat species occurred both in ASF and farmland. Three individuals of M. moloneyi
were captured exclusively in ASF and not in the farmland (Table 2). A total of five bat species
solely occurred in the farmland and not in ASF. These included Hildegarde’s Tomb Bat
(Taphozous hildegardeae), Egyptian Tomb Bat (Taphozous perforatus), Harrison’s Giant
Mastiff Bat (Otomops harrisoni), Rendall’s Pipistrelle (Neoromicia rendalli), White-winged
Pipistrelle (Neoromicia tenuipinnis) and Dark-winged Lesser House Bat (Scotoecus hirundo)
(Table 3). Two bat species (T. perforatus and T. hildegardeae) were captured directly from
roosts with hand nets in the farmland, but not from mist-net surveys. The Morista’s similarity
index between ASF and farmland was 65.8%. The coconut dominated farms in the farmland
had the largest number of bat species (19) recorded, while in ASF it was Cynometra forest
(16). The farmland rarefaction curves nearly reached the plateau (Fig. 10) and estimated higher
bat species richness in this habitat than in ASF (Fig. 11). The same pattern was depicted by
Jacknife1 with an an estimated of 22.95 ( ± 1.9 SD) bat species in ASF and 25.98 ( ± 1.3) in
the farmland. Chao1 estimated 19.33 (19.0-25.0 95% CI) species in the forest and 24.5 (24.0-
32.3) species in the farmland. The bat assemblage structure in the farmland was dominated by
frugivorous bats, which consequently resulted into higher evenness inside ASF (ASF: 0.48 ±

40
0.1) than in the farmland (0.22 ± 0.05). Consequently, the diversity was slightly higher in ASF
(Shannon-Wiener index forest: H/=1.48 ± 0.2, than in farmland: H/=1.33 ± 0.1). A total of
1,148 bats were wing punched; 1136 in the farmland and 53 in ASF. Only 12 (1.1%) were
recaptured at the same mist-netting station in the same night in the farmland, and none in ASF
and cumulatively 98.9% (1136) of the marked bats were not recaptured.
Figure 10. Bat species estimate curve for the farmland indicating species richness expected
values (solid line) and the 95% confidence intervals (dashed lines).
Figure 11. Bat species estimate curve for the interior of ASF indicating species richness
expected values (solid line) and the 95% confidence intervals (dashed lines).
0
5
10
15
20
25
1 11 21 31 41 51 61 71 81
Num
ber o
f Bat
Spe
cies
Number of sites sampled
ASF
0
5
10
15
20
25
1 11 21 31 41 51 61 71 81
Num
ber o
f Bat
Spe
cies
Number of sites sampled
Farmland

41
Table 2. Bat species, diversity and their abundance in different habitat types in ASF
Legend: Cynometra Forest (CYNO), Brachystegia Woodland (BRA) and Mixed Forest (MIXFo)
IUCN Status,
2019 Arabuko-Sokoke Forest Total
capture Vegetation Types
CYNO BRA MIXFo
Pteropodidae
1. Eidolon helvum NT 1 1
2. Epomophorus wahlbergi LC 206 59 153 418
3. Rousettus aegyptiacus LC 27 59 228 314
Rhinolophidae
4. Rhinolophus deckenii NT 8 1 1 10
Hipposideridae
5. Hipposideros caffer LC 13
13
6. Macronycteris vittata NT 7 6 7 20
Megadermatidae
7. Cardioderma cor LC
2
2
Emballonuridae
8. Coleura afra LC 1 10 6 17
9. Taphozous mauritianus LC 1
1
Nycteridae
10. Nycteris thebaica LC 1 13
14
Molossidae
11. Chaerephon pumilus LC 3
3
Miniopteridae
12. Miniopterus minor DD 14
5 19
13. Miniopterus cf inflatus LC 1 1
1
Vespertilionidae
14. Mimetillus moloneyi LC
3 3
15 Neoromicia capensis LC 2 3
5
16. Neoromicia nana LC 15 4
19
17. Nycticeinops schlieffeni LC 1 4 8 13
18. Pipistrellus rueppellii LC 5
5
19. Scotophilus trujilloi LC 1 3 7 11
No. of species
16 12 10 19
No. of insectivorous bats
73 47 37 157
No. of fruit bats
233 118 382 733
No. of bat individuals
306 165 419 890
Trap Stations/Vegetation type
27 27 27 81
Net Meter Hours (Nmh)
11556 11556 11556 34668
Relative abundance (Bats/ Nmh)
0.03 0.01 0.04 0.0

42
Table 3. Bat species, diversity and their abundance in different habitat types in farmland.
Note: Two additional bat species captured directely from roosts in farmland not included in this table
Legend: Mango (MAN), Coconut (COC), and Mixed (MIXFa).
IUCN Status,
2019
Farmland Total
capture
Vegetation Types
MAN COC MIXFa Pteropodidae
3. Eidolon helvum NT 4
4
2. Epomophorus wahlbergi LC 400 271 363 1034
1. Rousettus aegyptiacus LC 888 744 727 2359 Rhinolophidae
4. Rhinolophus deckenii NT 10 5 15 30
Hipposideridae
5. Hipposideros caffer LC 2 8 13 23
6. Macronycteris vittata NT 17 11 14 42
Rhinonycteridae
7. Triaenops afer LC 1 4
5
Megadermatidae
8. Cardioderma cor LC 146 215 260 621
Emballonuridae
9. Coleura afra LC 1 3 19 23
10. Taphozous mauritianus LC 5 2
7
Nycteridae
11. Nycteris thebaica LC 6 12 22 40
Molossidae
12. Chaerephon pumilus LC 2
2
13. Otomops harrisoni VU
10 1 11
Miniopteridae
14. Miniopterus minor DD 2 10 3 15
15. Miniopterus cf inflatus LC 1
1
Vespertilionidae
16 Neoromicia capensis LC 3 1 2 6
17. Neoromicia nana LC 10
2 12
18. Neoromicia rendalli LC
1
1
19. Neoromicia tenuipinnis LC
5 1 6
20. Nycticeinops schlieffeni LC 13 1 6 20
21. Pipistrellus rueppellii LC
3 1 4
22. Scotoecus hirundo LC
8 2 10
23. Scotophilus trujilloi LC 16 30 5 51
No. of species
18 19 17 23
No. of insectivorous bats
239 329 366 930
No. of fruit bats
1288 1015 1090 3397
No. of bat individuals
1527 1344 1456 4327
Trap Stations/Vegetation type
27 27 27 81
Net Meter Hours (Nmh)
11556 11556 11556 34668
Relative abundance (Bats/Nmh)
0.13 0.12 0.13 0.1

43
4.3.2 Bats abundance and their seasonal trends
In total 5,217 individuals of bats were trapped in the entire study, including 82.9% in the
farmland and 19.1% in ASF (Table 2, 3). The mean number of captured bats in the farmland
was (618.1 ± 11.6, N=7), and in ASF (127.1 ± 38.8, N=7). There was a significant difference
between the medians of bats captured in ASF and farmland (Mann-Whitney U-Test, U=4: p
<0.0069) Fig. 12). Of 5,217 bats, fruit bats were the most abundant (79.2%), while
insectivorous bats were less common (20.8%). The most abundant bat species were individuals
of two fruit bats (R. aegyptiacus and E. wahlbergi), which were represented by 79% of all
individuals of bats captured in the interior of ASF and the farmland. Overall the most
commonly captured insectivorous bat species were C. cor (11.9%), followed by Trujillo’s
House Bat (Scotophilus trujilloi (1.2%), Striped Leaf-nosed Bat (Macronycteris vittata
(1.2%), Egyptian Slit-faced Bat Nycteris thebaica (1.03%) and African Sheath-tailed Bat
(Coleura afra (0.77%). Of the three different vegetation types in ASF, the mixed forest had
the numerous number of inviduals of fruit bats trapped (381). In the farmland majority of fruit
bats were trapped in mango trees dominated farms (1288). Inside ASF, Cynometra habitat
had the most numerous capture of insectivorous bats (73), while in the farmland it was farms
with mixed cultivated trees (366 (Table 3).

44
Figure 12. The mean number of individual bats captured in each study site (Error bars are
standard errors).
The UPGMA dendrograms showed that species abundance clearly separated the forested
habitats from the farmland habitats (cophen. correl. = 0.959; Fig. 4.6a) while the incidence or
species analyses showed a greater similarity of species composition of bat assemblages present
in mango farms and in the three forested habitat types (cophen. correl. = 0.891; Fig. 13a,b).

45
Figure 13. UPGMA dendrogram (Ward’s method with Euclidean distance and 40 bootstraps),
on the differences of bat assemblage among vegetation types in ASF and farmland based on
species abundance (a) and incidence (b).
4.3.3 Bat roosts in ASF and in the farmland
A total of 14 bat roosts were found in the study area, which included seven limestone coral
caves, three trees and four man-made roosts (Table 4). Of the 14 roosts, 13 occurred in the
farmland and only one was found in ASF. Roosts found on private land were not under any
kind of legal protection. All roosts in farmland were used by 13 bat species for roosting, and
only one species one roosted inside a latrine in ASF (Appindex 3). Ten different bat species
INCIDENCE/PRESENCE
ABUNDANCE
a
b

46
roosted in the limestone coral caves, with Ali Baba/Makuruhu Cave (A) and Kaboga Cave (F)
being used by multiple species, but the former having the largest bat population (Table 4).
Individuals of C. cor were found in five different limestone coral caves.
Table 4. Bat roost types in ASF and farmland, estimate of bats population in them, and
different bat species found in each roost.
Legend: Ali Baba/Makuruhu Cave (A); Watamu Police Station Cave (B), Gede Market Tree Roost (C), Lion Cave (D), Panga
Yambo Cave (E), Uyombo Cave (F), Borehole Roost (G); Kaboga Cave (H), ASF Latrine Roost (I), Kanani Cave (J), Malindi
E. helvum Tree Roost (K), C. Afra Building Roost (L), Eco-Camp House Roost (M) and T. mauritianius Coconut Tree Roost
(N); + bat species recorded in a roost; R/S-number of roosts at which a bat species occurs; *Limestone bat cave.
4.3.4 Seasonal changes in bats abundance
Many individuals of bats were captured in the dry season (mean 1420.0 ± 364.9, N=3), than
in wet (mean 1062.6 ± 276.9, N=3) and short rain (mean 942.0 ± 242.8.9, N=3) seasons.
However, there was no significant difference in the sample medians of captured bats among
different seasons (Kruskal-Wallis Test, H=1.422, df=9, p>0.05, N =10). One individual of E.
wahlbergi was captured in mist net in the farmland with a ripe fruit of A. occidentale.
Type of Roost A* B* C D* E* F* G H* I J* K L M N
Estimated Number of bats >1000
,000
7,00
0
200 200 100
200
50 5,000 50 50 1000
0
100 50 2 R/
S
1. Eidolon helvum + 1 2. Epomophorus wahlbergi + 1 3. Rousettus aegyptiacus + 1 4. Hipposideros caffer + + + 3 5. Macronycteris vittata + 1 6. Triaenops afer + + 2 7. Cardioderma cor + + + + + + 6 8. Coleura afra + + + 2
9. Taphozous hildegardeae + + 2
10. Taphozous mauritianius + 1
11. Taphozous perforatus + 1 12. Nycteris thebaica + + 2 13. Miniopterus cf inflatus + + 2 14. Miniopterus minor +
+
2
Total Species/Roost 6 1 1 2 1 2
1 8 1 1 1 1 1 1 1

47
4.3.5 Age sex structure and breeding status of bats
Out of 5,217 bats trapped during this study, 52.3% were females and 45.6% were males; the
rest (2.1%) could not be sexed because they were very young (juveniles) and impossible to
sex. About 84.4% of the bats were adults while 14.2% were sub-adults and juveniles. Majority
of the sub-adults bats were individuals of R. aegyptiacus (564) followed by E. wahlbergi (165).
The largest number of individuals of R. aegyptiacus (1243) and C. cor (256) were captured in
the dry season; while those of E. wahlbergi (651) were captured in short rain season (Fig. 14).
The largest number (490) of sub-adults bats were captured in dry season (February to March),
followed by long (145 (June-July) and short rain seasons (107 (November-December). About
65.6% of the bats were not breeding, while 31.1% of bats were in breeding condition. Those
breeding included 1,052 males with engorged testes, 184 lactating females (teats which when
slightly pressed would exude milk), 356 pregnant and 32 bats captured carrying young bats.
Breeding males and females (lactating, pregnant, or with young) of R. aegyptiacus, E.
wahlbergi and C.cor were captured in all seasons. However, largest numbers of breeding R.
aegyptiacus (143) were captured in short rainy season, while with those of E. wahlbergi (85)
and C.cor (33) were trapped in the dry season.

48
Figure 14. Number of individual bats of three bat species captured in different seasons
0
200
400
600
800
1000
1200
1400
Num
ber
of
bat
s tr
apped
Rousettus aegyptiacus Epomophorus wahlbergi Cardioderma cor

49
4.4 Discussion
The current study shows that bats were more common in farmland than in ASF. Studies of
bats along disturbance gradient tend to give variable results. Results of the present study are
similar with the findings of Struebig et al. (2013), who reported that heavily degraded and
logged forests in Borneo had limited effects on bat species richness. However, the agricultural
areas around Lake Bogoria National Reserve (Wechuli et al. (2016) and Meru National Park
(Webala et al, 2004) in Kenya, had low bat species richness and abundance than the interior
of the two protected areas. In the current study, fruits bats were commonly found in the
farmland than in ASF. This was consistent with observation of Luskin (2010), in Fiji where
the mean foraging density of frugivorous Pacific Flying Fox (Pteropus tonganus) in farmland
was four times higher than in the forests. The presence of many cultivated orchard trees in the
farmland may have contributed to large captures of fruit bats in the farmland.
The availability of roost sites influences the distribution and abundance of bats (Fenton and
Rautenbach, 1986). There was only one active bat roost found in ASF, which was occupied
by few individuals of N. thebaica. Many other roosts may have existed in ASF, but were
difficult to locate, probably because of the high structural complexity of the forest vegetation.
However, the farmland had 13 roosts, which collectively provided roosting habitat for 13
different bat species. Limestone cave roosts such as Alibaba and Kaboga in the farmland, had
multiple species and in large numbers. In addition, some man-made structures in the farmland
were also used by some bats for roosting. For instance, more than 100 individuals of C. afra
roosted in one abandoned house in the farmland. The dry region of the western Madagascar
has more species of bats than the humid east because of high density of limestone karst roosts
(caves) in that region (Eger and Mitchell, 2003; Goodman et al., 2005). Therefore, the many
man-made infrastructures as well as other natural roosts, supported a large number of bats,
which probably hugely contributed to high captures in the farmland. However, the future of

50
the roosts in the farmland for sustaining bats was uncertain, because they occurred on private
land, where they could easily be destroyed or converted to other land uses incompatible to bat
conservation. Furthermore, there were no specific measures implemented by any organisation,
which were directed at the conservation of bats and or their roosts in the study area.
In conclusion, the farmland was richer in bat species, and bats were more abundant in it than
in ASF. In addition, more bat roosts were found in the farmland than in ASF. Although the
farmland outside the interior of ASF was extremely degraded, different bat species occurred
in it and for some species, especially the fruit bats in large numbers. Thus, the farmland in the
eastern part of ASF, is a vital habitat for bats conservation. It is therefore, important to enhance
bat investigations in agro-ecosystems in Africa, in order to comprehend the roles of this
ecosystem in the survival and management of bats habitats in the continent.

51
CHAPTER FIVE: BAT ACTIVITY IN ARABUKO-SOKOKE FOREST AND
ADJACENT FARMLAND
ABSTRACT
Bats spend the day in roosts, and emerge after sunset into the airspace to forage or commute
to suitable drinking areas. Bat activity was investigated in ASF and adjacent farmland, in order
to understand how bats used the two study sites. Activity of bats was monitored with mist-nets
(fruit and insectivorous individual bats captures) and acoustic (count of insectivorous bats
echolocation calls (passes) methods. The mean number of individual bats captured using mist-
nets hourly in the farmland was (425.3 ± 95.1, N=10), while in ASF it was (88.4 ± 11.2, N=10).
There was a significant difference between the medians of bats captured in mist-nets hourly
in both study sites (U=9.5: p <0.0025, Mann-Whitney U-Test). In total 14,727 insectivorous
bat passes were counted, including 10,552 in the farmland and 4,175 in ASF. The mean
number of counted bat passes nightly in the farmland (152.9 ± 13.2) was significantly higher
than in ASF (60.5 ± 4.6) df = 68, t = -8.671, P <0.05, N = 69). The activity pattern of mist-
netted bats and detector monitored insectivorous bats peaked after sunset (1900-2000hr),
plunged to lowest level past midnight (0100hr-0200hrs), then slightly increased at dawn
(0400hr-0500hr). Individuals of captured R. aegyptiacus, E. wahlbergi and C. cor were active
throughout the night. Although, the farmland was very disturbed than the interior of ASF, bats
actively used this habitat for either foraging or commuting. This underlines the importance of
farmland habitat around ASF for conservation of bats, and the need to conduct more research
in agricultural areas in Africa.
5.1 Introduction
Wild animals may coexist in the same area, if they forage in different types of habitats
(Arlettaz, 1999), feed on diverse food items (Arlettaz et al., 1997), or be active on different
times of the day or night (Bonaccorso et al., 2006). Bats spend the day time in roosts and
disperse in the evening mainly to forage (Eckert, 1982). Insectivorous bats use echolocation
to navigate, orientate and forage at night (Griffin, 1958). In contrast, fruit bats have superb
nocturnal vision for navigation, and an extremely developed sense of smell to locate food
(Happold and Happold, 2013). Fruit and insectivorous bats activity can be documented
directly with mist-nets captures (Kunz and Brock, 1975). The number of individual captures
of bats can be used as a surrogate for bat activity, under the assumption that higher flight
activity of bats leads to higher capture rates (Aguiar and Marinho-Filho, 2004). Thus, an area
where many individuals of bats are captured at any given time, may possibly indicate a habitat
which is preferred by bats to forage or commute to other areas.

52
The activity of insectivorous bats, which uses echolocation to find their way in the
environment, can also be documented indirectly with ultrasonic detectors (Hayes et al., 2009).
The activity is counted in insectivorous bats echolocation calls, also known as ‘passes’. A bat
‘pass’ is a signal of an echolocating bat picked by an ultrasonic detector (Fenton et al., 1998)
and translated to sound audible to human ear (< 20 kHz). An area where many bat passes are
counted at any given time, may indicate a habitat selected by insectivorous bats for foraging
or commuting to other areas. Furthermore, areas of high bat activity indicate areas that are
important to bats or others they use heavily (Adams et al., 2015), and such information can be
used to identify priority areas for bat conservation (Estrada et al., 2004). In this chapter the
activity of insectivorous and fruits bats was investigated in ASF and the adjacent farmland.
Since, the two study sites were adjoined, and bats are very mobile, it was predicted that the
ASF and the farmland would have the same pattern of bat activity.
5.2 Materials and Methods
5.2.1 Bat activity surveys
Mist-nets erected at 3M above ground were used to monitor bat activity in 69 different
sampling stations in ASF and in the farmland. For each individual bat trapped and extracted
from the net, the time it was found in the net, as well as the species and its sex were recorded.
Insectivorous bat activity was monitored in the same 69 bat mist-netting stations. This was
done by use of Pettersson D240x ultrasound detector (manufactured by Pettersson Elektronik
ABTM Company, Uppsala-Sweden (whttp://www.batsound.com/) tuned to heterodyne mode
(Estrada et al., 2004). The detector was always tuned to 33 kHz in all 69 stations. Fruit bats
do not echolocate, except R. aegyptiacus whose echolocation frequency range from 10-20 kHz
(Happold and Happold, 2013). Therefore, no fruit bat activity was monitored using the

53
detector because the 33 kHz frequency setting used was way above that of R. aegyptiacus.
However, by setting the detector at 33 kHz, it was possible to detect the presence of different
species of insectivorous bats whose echolocation calls ranges between 25-41 kHz, because the
detector has a bandwidth of 8 kHz (Musila et al. 2018a). Bat passes were counted for 10-
minute each hour, by walking along a transect of 400 m where the mist-nets were erected. Bat
passes were counted by an observer walking on foot with the detector held in one hand
(Estrada et al., 2004). The numbers of passes was recorded using a tally counter. No sampling
was done during nights of heavy rainfall. Stations in the farmland and in ASF were
investigated alternately; with one night used in a station in forest surveys followed by a station
in the farmland. Although the bat passes could not be identified to species, bat species such as
S. trujilloi, N. thebaica, C. afra, Schlieffen’s Twilight Bat (Nycticeinops schlieffeni), S.
hirundo, Cape Pipistrelle (Neoromicia capensis), N. tenuipinnis, Mauritian Tomb Bat
(Taphozous mauritianus), P. rueppellii, Little Free-tailed Bat (Chaerephon pumilus) and N.
rendalli whose echolocation range is 25-41 kHz (Monadjem et al., 2010) most likely
accounted for most of the counted passes. These bat species were captured throughout the
mist-netting sampling in ASF and in the farmland (Table 2, 3).
5.2.2 Data analysis
To analyse bat capture data for activity patterns, the data in different vegetation types in ASF
and farmland was pooled together, because in some vegetation types especially in ASF, it was
not sufficient to infer about the activity of bats. The individual captures of each bat species
were pooled into 1-h intervals (e.g., all bats captured from 1900 to 2000h) Presley et al., 2009),
which cumulatively resulted in patterns of activity in each hour of all bats captured at each
study site (ASF, farmland). Bat capture data were organized in MS excel program. Non-
parametric two sample Mann-Whitney U-Test was used to test for differences in the sampled
medians of captured bats each hour in ASF and farmland.

54
To investigate seasonal changes in bat activity, data for November 2015 (short rain season),
February (dry season) and June (long rain season) 2016 were used because the sampling effort
was uniform among seasons (Table 1). Means of the total number of bats captured in each
hour in each season were calculated, and the differences in the sampled medians was tested
using non-parametric Kruskal-Wallis Test. To understand pattern of bat activity among female
and male bats, the segments of data collected for five hours (1900-2300hrs) were selected,
because its sampling effort was consistent throughout the six visits undertaken in the study
area (Table 1). In addition, data were only analysed for three species (R. aegyptiacus,
E.wahlbergi (fruit bats) and C. cor (insectivorous bat), whose numbers were 20 or more
individuals captured each hour in the entire survey. The mean number of total captures per
hour of females and males of the three species in the five-hour duration was calculated, and
the differences between sexes tested using non-parametric two sample Mann-Whitney U-Test.
Insectivorous bat activity was estimated as the number of bat passes counted (Russo and Jones,
2003) in each habitat and hour. Independent samples t-test was used to tested for differences
in the mean number of bat passes between farmland and ASF, after log transforming the passes
count data because it was not uniformly distributed. Kruskal-Wallis test was used to test for
sampled medians of bat passes in three different vegetation types in ASF and farmland. To
compare seasonal changes and hourly trends in bat activity, I used 11 hours (1900-0500hr)
data for surveys in November 2015 (short rain season), February 2016 (dry) and November
2016 (long rain seasons) because the sampling effort was the same (Table 4.1). All statistical
tests for means and parametric tests for capture and acoustic data were undertaken using PAST
program (Hammer et al., 2001). Statistical differences were considered to be significant at
P<0.05.

55
5.3 Results
5.3.1 Activity patterns of mist-netted bats
A total of 5,137 bats were captured in the six surveys, including 884 individuals in ASF
(Appindex 4) and 4,253 in the farmland (Appindex 5). The mean number of bats captured in
mist-nets each hour in the farmland was 425.3 ± 95.1, N=10, and in ASF it was 88.4 ± 11.2,
N=10. There was a significant difference between the medians of captured bats each hour in
ASF and farmland (Mann-Whitney U-Test, U=9.5: p <0.0025). The cumulative bat activity in
both study sites, as well as in the farmland peaked after sunset from seven to eight in the
evening, maintained a stable decrease to midnight, plunged to lowest activity from one to two
in the morning, and then slightly increased between three to four at dawn (Fig. 5.15). The
interior of ASF had a different pattern; activity had a very small peak at midnight, after
maintaining a fairly uniform activity from seven to eleven, gradually declined to lowest
activity from one to two, and then experienced very slight and gradual increase in between
three to four at dawn (Fig. 15).
Figure 15. The percentage number bats captured each two hours and their pattern of activity
in ASF and farmland

56
5.3.2 Insectivorous bat activity in ASF and farmland
A total of 1,056 individuals of insectivorous bats were captured; including 901 in the farmland
and 155 in ASF. The mean number of captured insectivorous bats each hour in the farmland
was 90.1 ± 33.7, N=10, while in ASF it was 15.5 ± 6.2, N=10. There was a significant
difference between the medians of captured insectivorous bats hourly in both habitats (Mann-
Whitney U-Test, U=10: p <0.0028). Insectivorous bat activity in the farmland peaked at seven
in the evening, steeply declined from seven to nine, stabilized between nine to midnight,
declined again to lowest activity at one, and then gradually again increased from two to four
in morning. In ASF peak bat activity was at seven in evening, followed by a steady decline to
no bat captures at two, and slightly low activity at dawn at four in the morning (Fig. 16). In
ASF no species of insectivorous bat was captured each hour throughout the eleven hours of
monitoring. In the farmland, individuals of C. cor were active overnight with individuals of
this species captured each hour.
Figure 16. The percentage number of insectivorous bats captured each two hours and their
pattern of activity in ASF and farmland
0
10
20
30
40
50
60

57
5.3.3 Fruit bats in ASF and farmland
A total of 4,081 individuals of fruit bats were captured; including 3,352 in the farmland and
729 in the interior of ASF. The mean number of fruit bats captured each hour in the farmland
was 335.2 ± 67.1, N=10, and in ASF was 72.9 ± 14.8, N=10. There was a significant difference
between the medians of captured fruit bats per hour in both study sites (Mann-Whitney U-
Test, U=11: p <0.0036). Fruit bats activity in the farmland were more active from seven in the
evening, sharply declined to one in the morning, then followed by a slight activity increase
from three to four at dawn (Fig. 17). The interior of ASF had a different pattern; with the
highest peak activity being at midnight, and the lowest past midnight between one to two in
the morning (Fig. 17). The individuals of R. aegyptiacus and E. wahlbergi bats influenced the
pattern of bat activity in ASF and farmland, by being active overnight with many individuals
of these species captured each hour throughout the night.
Figure 17. The percentage number of fruit bats captured each two hours and their pattern of
activity in ASF and farmland
0
5
10
15
20
25
30
35

58
5.3.4 Seasonal changes in captured bats activity
A total of 2,391 bats were captured in three sampling seasons. This number is less than 5,137
bats reported earlier, because the analysis for this section used data for November 2015 (short
rain season), February 2016 (dry season) and June 2016 (long rain season) sampling seasons.
This was done because the sampling effort was uniform among seasons (Table 1). Of 2,391
bats, 809 were captured in the short rainy season in November 2015, 919 in the dry season in
February 2016, and 663 in the long rain season in June 2016. The mean number of bats
captured each hour in the dry season was (91.9 ± 9.6, N=10), short rainy season (80.9 ± 18.6,
N=10) and long rainy season (66.3 ± 12.2, N=10). There was no significant difference in the
sample medians of captured bats among different seasons (Kruskal-Wallis Test, H=3.698,
df=9, p>0.05, N =10). The mean number of the individuals of insectivorous bats, fruits bats,
C. cor and E. wahlbergi captured in each season was the same (Table 5). However, the mean
number of individuals of R. aegyptiacus captured hourly among season was not the same
(Table 5).
Table 5. Kruskal-Wallis test results of the medians of insectivorous and fruits bats; R.
aegyptiacus, E. wahlbergi and C. cor captured each hour in different seasons.
Legend: N-number of samples, H-Kruskal-Wallis test statistics, p-p value, NS-Not significant, S-significant.
5.3.5 Activity among female and male bats
A total of 3,289 bats were captured for five hours (1900-2300hr) in the entire survey both in
ASF and farmland. These include 1874 individuals of R. aegyptiacus, 994 E. wahlbergi and
Variables
N
Dry
season
Short rain
season
Long rain
season H P Result
1 Insectivorous bats 10 13.5 ± 3.1 20.1 ± 6.4 11.1 ± 4.9 4.131 0.1268 NS
2 Fruit bats 10 78.4 ± 8.6 55.2 ± 9.1 60.8 ± 12.3 4.849 0.089 NS
3 R. aegyptiacus 10 46.1 ± 4.2 29 ± 4.7 39.1 ± 7.8 6.155 0.046 S
4 E. wahlbergi 10 32.3 ± 5.1 30.8 ± 7.2 16.1 ± 2.4 7.256 0.2656 NS
5 C. cor 10 10 ± 1.8 10.3 ± 2.7 6.6 ± 2.8 4.412 0.11 NS

59
421 C. cor. Of the 3,289 bats, 53.3% were females and 46.7% were males. There was no
significant differences between the medians of captured bats between sexes (Table 6).
Table 6. Mann-Whitney test results of the median of bats of different sexes captured each
hour in the study area
Bats analysed N Males Females U P Result
1. All bats 5 307.4 ± 46.1 350.4 ± 41.1 10 0.675 NS
2. R. aegyptiacus 5 165.0 ± 26.7 209.8 ± 18.7 5 0.143 NS
3. E. wahlbergi 5 92.8 ± 16.8 106.0 ± 15.8 9.5 0.600 NS
4. C. cor 5 49.4 ± 15.1 34.4 ± 11.9 8.5 0.463 NS
Legend: N-number of samples, U- Mann-Whitney test statistics, p-p value, NS-Not significant
5.4 Insectivorous bat activity monitored with detector
5.4.1 Overall activity of insectivorous bats
In total 14,727 echolocation bat calls (passes) were counted including 71.7% in the farmland
and 28.3% in ASF. The mean number of insectivorous bat passes counted nightly in the
farmland was significantly larger (152.9 ± 13.2, N = 69) than in ASF (60.5 ± 4.6, N = 69) (t =
-8.67, P <0.05, df = 68). In the farmland, the bat activity in coconut farms was slightly higher
(156.3 ± 24.8, N = 23), than in mango (153.3 ± 19.2, N = 23) and mixed fruit tree (148.2 ±
24.9, N = 23 (Fig. 18) farms. However, there was no significant difference in the activity of
insectivorous bats in the three vegetation types in the farmland (Kruskal-Wallis test, H =
0.3869, df = 22, P = 0.82, N =23). In ASF the highest bat insectivorous bat activity was
recorded in Brachystegia woodland (65.2 ± 7.2, N = 23), followed by mixed forest (64.9 ±
9.7, N = 23) and Cynometra forest (51.5 ± 6.9, N = 23 (Fig. 18). However, the activity of
insectivorous bats in the three vegetation types in ASF was the same (Kruskal-Wallis test,
H=2.419, df =22, P = 0.2983, N =23).

60
Figure 18. The mean number of bat passes recorded in each vegetation type in the farmland
(COC-Coconut, MAN-Mango, MIX-Mixed farms) and in ASF (CF-Cynometra forest, BW-
Brachystegia woodland, MF-Mixed forest (Error bars are standard errors).
5.4.2 Hourly trend in insectivorous bat activity
The mean insectivorous bat activity per hour in the farmland was highest at 1900hr (30.3 ±
6.6, N=36) and lowest at 0100hr (8.4 ± 1.3, N=36). In ASF, the mean bat activity per hour was
highest at 1900hr (14.6 ± 1.9, N=36) and lowest at midnight (000hr (4.1 ± 0.7, N=36). In
general bat activity pattern in both ASF and farmland peaked at 1900hr after the sunset,
sharply declined to the lowest level in between 00hr-0100hr and maintained a gradual increase
from 0200hr in the morning, to another lower peak at 0500hr at dawn (Fig. 5.19-20).

61
Figure 19. The mean number of bat passes per night in farmland from 1900h to 0500h
(Error bars are standard errors).
Figure 20. The mean number of bat passes per night in ASF from 1900hr to 0500h (Error bars
are standard errors).

62
5.5 Discussion
Agricultural areas around protected areas provide important habitats for bats. The activity of
mist-netted bats, as well as insectivorous bats monitored with a detector was higher in
farmland than in the interior of ASF. This probably, indicate that the farmland in the eastern
part of ASF, was a suitable foraging and commuting habitat for bats. These findings are similar
to those of Estrada et al. (2004), in Los Tuxtlas, Veracruz-Mexico, where higher bat activity
was recorded in agricultural areas, than in the continuous tropical rain forest habitat in the
same area. The abundance of bats in a sampling station, their ease of capture with mist-nets,
or detection of insectivorous bats with acoustic methods, can influence their activity in a given
study area. In the current study, some bats were common and were frequently captured in the
farmland and the forest, while others were uncommon with few individuals of each species
recorded. The most common species increased the activity of bats, especially in the farmland.
For instance, although individuals of R. aegyptiacus and E. wahlbergi occurred in both
habitats, 65% of all captured fruit bats were found in the farmland. Furthermore, the large
numbers of individuals of C. cor (604) captured in the farmland also hugely contributed to
higher insectivorous bat activity in this habitat.
Although high levels of insectivorous bat activity in farmland may possibly point to areas that
are important to bats and those heavily used (Adams et al., 2015), these results should be
interpreted with caution. Even though bat calls could not be identified to species, 11
insectivorous bat species confirmed to occur in ASF and farmland through mist-netting
sampling, have echolocation calls frequencies ranging from 25-41 kHz (Musila et al., 2018a).
The use of one frequency setting (33 kHz) throughout the 69 stations, also reduced the number
of passes which could be counted in a sampling station. This is because some bat species
especially those of genera hipposideros and rhinolophus call at higher frequencies (Webala et
al., 2019a), and their presence would not be detected by the detector frequency setting used.

63
The number of bat passes counted is possibly correlated to the number of individuals present
(Wickramasinghe et al., 2003). However, it is impossible to enumerate the exact number of
individual bats that are found in one station, since a detector can record the same individual
more than once (Frick, 2013). However, this limitation was mitigated by ensuring that
insectivorous bat activity was monitored by an observer constatntly in motion walking for 10
minutes. Insectivorous bats also modify their echolocation calls throughout their flight based
on the habitat structure and activity (foraging or commuting). In a cluttered environment like
inside ASF, some bats emit quieter echolocation calls, which consequently reduce their
detection rates (Schnitzler and Kalko, 2001). The result is a false absence, with present
individuals of a bat species being undetected (MacKenzie, 2005), and consequently counting
a reduced number of passes.
Bat activity both in ASF and farmland showed the same pattern, it peaked after sunset, sharply
declined to lowest level after midnight, and then had a smaller peak at dawn. The activity of
many bat species peak during the first hour after sunset (Meyer et al., 2004). At Barro
Colorado Island, Panama Lang et al. (2006), recorded no bat flight activity at all between
2300h and 0200h. Bats in the study area roost for about 12 hours (600am-1800pm) during the
day without feeding. It is therefore, possible that in the evening there was a simultaneous
emergence of many individuals of different bat species from their roosts to maximize on their
feeding bout, hence the high activity at twilight. The lowest bat activity in both habitats was
recorded in between 0100-0200am. Bats break their foraging activity and rest in their roosts
at night (Kunz et al., 1995). The period of lowest bat activity in the study area, may suggest
return of bats to their roosts for temporary break from their foraging or commuting activities.
Female bats with young left behind in the roosts are more likely to return in the middle of the
night to feed their young. However, from the current study it was impossible to determine how

64
frequently bats returned to their roosts each night. Therefore, future studies, can use telemetry
method to shed more light on how often roosts in the study area were used by bats.
The activity of all species of bats combined, insectivorous and fruit bats captured in the study
area in three different sampling seasons was similar. Fruit bats that forage on fruits available
throughout the year are captured repeatedly, while species feeding on ephemeral resources are
found occasionally (Bumrungsri et al., 2007). Individuals of R. aegyptiacus and E. wahlbergi
were recorded throughout the different seasons, probably suggesting that the study area had
an abundant supply of fruit resources, which could sustain the fruit bats high energy demands.
The activity of individuals of R. aegyptiacus, E. wahlbergi and C. cor between different sexes
was same in our study area. Kunz et al. (1995) noted that due to high energetic demands of
pregnant and lactating female bats, they use more time feeding than male bats or others in non-
reproductive condition. Some other studies have also shown that males of several fruit bats
species travel shorter distance than females to forage (Winkelman, 2000), suggesting reduced
activity and may be rate of capture of males. The data analysed for seasonal changes in bat
activity and between sexes relied on a total of 24 sites sampled in ASF and farmland in each
season. The data may have been insufficient to make clear conclusions, which may explain
the contrarily results from what has been reported in the past, both for seasonal changes in
activity by bats of different sexes. Future studies should therefore, sample more stations in the
study area and for a longer period in each season, so as to have sufficient data and make
plausible conclusions.
In conclusion, the farmland had higher fruit and insectivorous bat activity than in ASF. Bat
activity peaked after sunset, experienced a low increase at midnight, and then plunged to
lowest activity in between 01:00-02:00hr, followed by a slight increase at dawn. Human-
modified habitats, consisting of agricultural areas and human settlements, are the largest and

65
rapidly expanding ecosystems in the world. The farmland around ASF, had completely lost
the coastal indigenous vegetation found in ASF, but bats were using the habitat for foraging
and commuting. Therefore, there is a need to work with land owners around ASF, to maintain
the vegetation structure of their farms, in order to ensure they continue to support bats
currently using the farmland habitat in the long run.

66
CHAPTER SIX: DIVERSITY OF INVERTEBRATE PREY IN ARABUKO-SOKOKE
FOREST AND ADJACENT FARMLAND
ABSTRACT
The primary food of insectivorous bats is invertebrates, especially insects. This study
investigated invertebrate prey abundance in ASF and adjacent farmland, in order to understand
its availability to foraging insectivorous bats found in the two study sites. Invertebrate prey
were sampled by use of solar powered lights, which attracted air-borne invertebrates to a
suspended white cloth sheet, for four hours each night in 12 different stations each in ASF and
farmland. A total of 6,557 individuals of invertebrates were captured: 52% in the farmland
and 48% in ASF. The order Hymenoptera (ants, bees, wasps and sawflies) was the most
abundant (38.1%), followed by Coleoptera (beetles (28.1%) and Lepidoptera (moths (15.7%).
The farmland had the largest number of Hymenopterans and Coleopterans, while the largest
number of Lepidopterans and of bigger sizes occurred in ASF than in the farmland. The
Shannon-Weiner index of diversity was higher in ASF (1.72 ± 0.1) than in the farmland (1.41
± 0.1). The mean number of invertebrate prey captured each night in the farmland was (260.5
± 52.9, N=12), and in ASF (200.3 ± 36.4, N=12), but with no significant difference between
the medians of captured invertebrates in both study sites (Mann-Whitney U-Test, U=61:
P>0.544). In conclusion, the farmland and forest had similar invertebrate prey abundance. This
study, highlight the importance of agricultural landscapes, which have been ignored in many
biodiversity surveys, in providing invertebrate prey items to insectivorous bats especially in
the study area.
6.1 Introduction
Measures of vegetation structure are important habitat variables which can serve to explain
the distribution pattern of species (MacKenzie et al., 2006), especially for insectivorous bats
(Loeb and O’Keefe 2006). However, habitat variables exclusively are insufficient to fully
understand animals’ distribution patterns and relationships (Morrison, 2001). Hence, there is
need to investigate resources associated with the habitat where animals are found (Morrison,
2001). For insectivorous bats, the primary resource is invertebrate prey (Ford et al., 2005).
Understanding the links between foraging insectivorous bats and prey availability has been
recognized as an important research area, particularly within forested landscapes (Lacki et al.,
2007). Furthermore, the activity of insectivorous bats is influenced by the density of
invertebrate prey, as well as vegetation characteristics (Scanlon and Petit, 2008). Although
dense vegetation structure may increase the abundance of invertebrates, which can
consequently intensify foraging activity by insectivorous bats (Bender et al., 2015), the effects

67
of vegetation structure may largely be independent of the abundance of invertebrate (Adams
et al., 2009).
In this chapter the diversity and abundance of insectivorous bats invertebrate prey was
investigated in ASF and the adjacent farmland. The results of bat studies, in six different
sampling expeditions both in ASF and farmland (November 2014 to June 2016, showed that
there was a higher insectivorous bat activity and bat captures in the farmland than in ASF (see
also chapter 4-5). As a result, it was predicted that the farmland would have higher abundance
of invertebrate prey than the interior of ASF.
6.2 Materials and Methods
6.2.1 Invertebrate prey sampling
Invertebrate prey sampling was undertaken once in November-December 2016, and not
simultaneously with bats mist-netting and activity sampling, because of the high bat activity
and large captures of insectivorous bats in the farmland than in ASF throughout the six
different sampling expeditions (Table 7). Hence, it was assumed that the high abundance of
captured insectivorous bats and activity in farmland in each season, reflected the existence of
higher invertebrate prey abundance. Many invertebrates that are active at night such as
different species of moths and beetles are attracted by light (Nag and Nath, 1991). Light traps
have been extensively used to survey invertebrate species that are active at night (Holyoak et
al., 1997). In this study four solar powered light traps (Sanyal et al., 2013). The lights erected
at least 70m from each other, were used to attract air-borne nocturnal invertebrates. The solar
lights (DP Light DP-6005A) http://en.dpled.com (Fig. 21), had an inbuilt sealed lead acid
battery, which attained a wide range of voltage (110-240 V, or 50/60 Hz). The battery when
charged with a panel (9V/3.5 W), from 0800-1600 hr during days of full sunlight, would keep
one bulb very bright without fading for more than six hours.

68
Table 7. Total bat insectivorous echolocation calls (passes) and insectivorous bats captures in
six different bat sampling expeditions in the interior of ASF and in the farmland
Survey Sampling Farmland ASF Forest Farmland ASF Forest
Dates/Trip Season Total
Passes/Trip
Total
Passes/Trip
Bat
capture/Trip
Bat
capture/Trip
1 Nov-14 Short rain season 1775 231 161 17
2 Feb-15 Dry season 2420 862 197 52
3 Jun-15 Long rain season 1808 461 140 31
4 Nov-15 Short rain season 2103 603 190 21
5 Feb-16 Dry season 1437 871 120 15
6 Jun-16 Long rain season 1009 1147 92 7
TOTAL
10,552 4,175 900 143
Note: Insectivorous bats were not monitored with acoustic method in November 2016 survey, the reason the
results are not included in this table
Figure 21. Solar DP Light DP-6005A used to attract nocturnal invertebrate prey
Inside ASF the light traps were fixed at the centre of a nylon string tied to two trees across the
road, at a height of 1.5m from the ground. In the farmland, light traps were tied at the centre
of a string tied to two selected nearby trees. A white cotton cloth sheet (c. 2m long by 1.5m
wide), was erected using other strings facing the direction of the light source at a distance of
1 m away from the light source (Fig. 22). The cloth sheet provided a landing surface to

69
attracted invertebrates (Fry and Waring, 2001), with the lowest part of the cloth from the
ground being 30 cm, while the top part being 1.5m. A transparent plastic sheet was also spread
under the suspended cloth sheet to enable easier detection of invertebrates in flight which
struck the cloth sheet and fell on the ground (Fig. 22). The light traps were operated for four
hours (1900-2300hr) each night (Fig. 23), in four different trapping stations each in Cynometra
and mixed forests, Brachystegia woodland in ASF, and in the mango, coconut and mixed trees
dominated farms. The light traps were checked twice each hour, with moths being killed in
chloroform vapour in glass jar (Sanyal et al., 2013) and later preserved in plastic containers
with toilet nappies placed in between specimens to prevent damage of moth’s delicate wings.
Other invertebrates were collected in plastic jars and stored in 70% ethanol, with a sample of
each hour (Wolbert et al., 2014) in each vegetation type kept in a separate container, to
determine their abundance throughout the trapping operation.
Figure 22. Set up of solar light trap, with white cloth screen and plastic sheet on the ground

70
Figure 23. Solar light trap in operation at night attracting invertebrate prey (black dots)
The moths of each trapping station in each vegetation type were stored together without
separating captures into hours. The larger moths were killed and kept in plastic zip bags. Only
invertebrates measuring 5-40mm in body length were collected, since small sized insects may
not be detected by foraging insectivorous bats (Anthony and Kunz, 1977), while others bigger
than this size would unlikely be consumed (Barclay, 1985). Invertebrate prey larger than
30mm by width were not collected, since they were considered too large for the largest resident
insectivorous bat, Striped Leaf-nosed Bat (Macronycteris vittata) recorded in and outside
ASF. Invertebrate prey sampling was conducted alternately, with one night in the forest,
followed by the next in the farmland to distribute sampling bias between ASF and farmland
vegetation types. Multiple trap types are recommended for a comprehensive sampling of
invertebrates in an area, even for just one taxon (Aguiar and Santos, 2010). However, this
approach is difficult to implement in most surveys, since it is time consuming and expensive
(Russo et al., 2011).

71
6.2.2 Data analysis
Invertebrate prey were counted and identified to taxonomic order using specimen samples
collected from ASF in the past and deposited with Entomology Section of NMK. Shannon-
Wiener index was used to calculate the species diversity of invertebrates (Shannon and
Weaver, 1963). The sizes of invertebrate were estimated by measuring their lengths (to the
nearest 0.25mm) with a ruler from the head (excluding antennae) to the tip of the abdomen
(without inclusion of cerci) (Coleman and Barclay, 2013). The invertebrates were grouped
into four main size categories: 5-10mm, 11-21mm, 22-32mm, >33mm; and counted for each
vegetation type in ASF and farmland. Mann-Whitney U-test was used to test for differences
in sample medians of invertebrates captured in each night in the farmland and in ASF. To
estimate the changes in invertebrate prey activity with night time, the number of invertebrates
excluding moths captured in each hour from 1900-2300hr were counted. Moths were excluded
from this analysis, because the information on the number of individuals captured each hour,
in the 12 different sampling stations in ASF and farmland had not been recorded throughout
the trapping operation. All statistical analyses were undertaken using PAST program (Hammer
et al., 2001).
6.3 Results
6.3.1 Invertebrates diversity
In total 6,557 individuals of invertebrate prey were captured, including 52% in the farmland
and 48% in ASF. The order Hymenoptera (ants, bees, wasps and sawflies) was the most
abundant (38.1%), followed by order Coleoptera (beetles) 28.1% and Lepidoptera (moths)
15.7%) Tables 8-9, Appindex 6). Many individuals of Hymenopterans and Coleopterans were
recorded in the farmland than in ASF (Table 8). There were more individuals of Lepidopterans
and of bigger sizes in ASF than in the farmland (Table 9). The Shannon-Weiner index of
diversity was higher in ASF than in the farmland. The mean number of invertebrate prey

72
captured each night in the farmland was 260.5 ± 52.9, and in ASF 200.3 ± 36.4. There was no
significant difference between the median abundance of invertebrate prey captured per night
in both study sites (Mann-Whitney U-Test, U=61: p >0.544).
Table 8. Diversity and abundance of invertebrate prey in three habitat types in the farmland.
Legend: MIXFo- Mixed forest, BRA-Brachystegia woodland, and CYNO-Cynometra forest.
Table 9. Diversity and abundance of invertebrate prey in three habitat types in the ASF.
Legend: MAN-Mango farms, COC-Coconut farms, MIXFa-Mixed farms
INVERTEBRATES ORDERS MIXFo BRA CYNO ASF Total
1 Hymenoptera (Ants, bees, wasps and sawflies) 131 537 376 1044
2 Coleoptera (Beetles) 120 357 158 635
3 Hemiptera (Bugs, aphids and cicadas) 79 73 41 193
4 Blattodea (Cockroaches and termites) 68 108 62 238
5 Diptera (Flies and mosquitoes) 27 91 25 143
6 Orthoptera (Grasshoppers, crickets, katydids) 32 38 29 99
7 Mantodea (Praying mantids) 5 21 7 33
7 Neuroptera (Net winged invertebrate) 3 11 4 18
8 Odonata (Dragonflies and damselflies) 0 1 0 1
10 Lepidoptera (Moths) 159 280 325 764
Abundance 624 1517 1027 3168
Shannon_H 1.85 ± 0.09 1.72 ± 0.08 1.57 ± 0.11 1.72 ±0.05
Invertebrates Orders MAN COC MIXFa
Farmland
Total
1 Hymenoptera (Ants, bees, wasps and sawflies) 1157 202 93 1452
2 Coleoptera (Beetles) 414 247 547 1208
3 Hemiptera (Bugs, aphids and cicadas) 39 42 23 104
4 Blattodea (Cockroaches and termites) 122 10 18 150
5 Diptera (Flies and mosquitoes) 39 12 14 65
6 Orthoptera (Grasshoppers, crickets, katydids) 47 42 33 122
7 Mantodea (Praying mantids) 1 7 1 9
7 Neuroptera (Net winged invertebrate) 8 4 3 15
8 Odonata (Dragonflies and damselflies) 1 0 0 1
10 Lepidoptera (Moths) 135 46 82 263
Abundance 1963 612 814 3389
Shannon_H 1.27 ±0.94 1.52 ± 0.15 1.16 ± 0.16 1.41 ± 0.06

73
6.3.2 Invertebrate sizes and hourly activity pattern
About 68% of captured invertebrates were of small size (5-10mm), followed by those of 11-
21mm (29%) Table 10). The largest number of individuals of invertebrate prey both in ASF
and in the farmland were captured at 1900hr; in forest they declined sharply to 2000hr, while
activity in farmland remained in a relatively stable decline, with activity in both habitats
gradually declining to 2300hr (Fig. 24).
Table 10. A summary of the counts of invertebrates of different sizes sampled in the
farmland and ASF
5-10mm 11-21mm 22-32mm sizes >33 Total
Total (Farmland and ASF) 3440 1869 167 54 5530
Total (Farmland and ASF) 994 30 3 0 1027
Total (Farmland and ASF) 4434 1899 170 54 6557
Percentage (%) 67.6 29.0 2.6 0.8 100.0

74
Figure 24. The hourly trend in the capture of invertebrate prey (excluding moths) sampled in
ASF and in the farmland.

75
6.4 Discussion
This study investigated invertebrate prey species richness, diversity and abundance in ASF
which is relatively intact, and surrounding farmland which has lost indigenous coastal forest
vegetation. Results showed that the ASF and farmland had the same invertebrate abundance,
but species diversity was higher in ASF than in the farmland. Moths were more abundant and
of bigger sizes in ASF than in the farmland. Moths abundance has been shown to decline with
agriculatural intensification (Wickramasinghe et al., 2004), mainly because relatively
undisturbed habitat such as ASF, provide sheltered environments (Merckx et al., 2008) as
compared to the more open and disturbed farmland outside this forest. The representatives of
different invertebrate orders were captured in large numbers in both study sites, but with
individuals of Hymenopterans, Coleopterans and Orthopterans being more abundant in the
farmland than in ASF. Similar results were recorded by Khadijah et al. (2013), at Kota
Damansara Community Forest Reserve in Malaysia.
Hymenoptera is one of the four largest orders of invertebrates, the other three being
Coleoptera, Lepidoptera and Diptera (Mason and Huber, 1993), and perhaps this explains the
high abundance of individuals these orders recorded in this study. The most common groups
of invertebrate prey eaten by insectivorous bats are Coleoptera, Lepidoptera, Diptera,
Hymenoptera and Isoptera (Pavey et al., 2001), which were also captured in large numbers in
both study sites. However, more individuals of Lepidopteran, Dipterans and Blattodea
occurred in ASF than in the farmland. Thus, although ASF had low captures of insectivorous
bats and activity than the farmland (Chapter 4-5), the invertebrate composition which are prey
items for these bats were abundant inside ASF.
A number of vegetation structure related factors may determine the abundance and
composition of invertebrates sampled in a location. For instance, understorey vegetation

76
structure can affect the capture of invertebrates sampled with light traps. Understorey openness
may increase the effectiveness of light-trapping radius, especially for nocturnal invertebrates
(Beck et al., 2010). For example, inside ASF, the light source was visible in a small area due
to the obstructions created by the thick understorey vegetation cover. Thus, a small area of
ASF was sampled, the radius immediately near the source of light. Nevertheless, in an open
habitat, as was the case of farmland in this study, the light source was detectable from further
distance, which probably attracted invertebrate prey from a large trapping radius. In addition,
canopy openness has also been shown to strongly affect beetle assemblages (Hosaka et al.,
2014), but not moths (Wirooks, 2005). Therefore, although cluttered (thick) habitats which are
less disturbed have high invertebrate densities (Kalcounis and Brigham, 1995), the obstruction
of trapping light source by canopy vegetation may have reduced light detection by aerial
insects, and hence reduced the overall abundance of captured invertebrates in ASF. This may
possibly suggest that, although results of this study showed that, the ASF and farmland had
the same abundance of invertebrates, the insects may be more abundant inside ASF.
Invertebrate prey activity peaked at 1900hrs and declined to the lowest level at 2300hr in the
farmland and as well as in ASF. Insectivorous bats capture and activity in and around ASF
was high immediately after dawn from 1900-2000hrs and lowest past midnight (Chapter 5),
probaly suggesting that insectiverous bats sychronized their foraging activity with
invertebrate prey abundance and activity.
In conclusion, the farmland was very disturbed and would be expected to have reduced
abundance of invertebarte prey (Chung et al., 2004). However, this habitat had the same
invertebarte prey abundance with the relatively undisturbed ASF, probally suggesting that
both study sites provided suitable foraging areas for the existing insectivorous bat species.
Nonetheless, in order to have a comprehensive understanding of invertebrate assemblages in
both study sites, there is need to use a combination of invertebrate sampling methods in future

77
studies (Aguiar and Santos, 2010). This is because the effectiveness of invertebrates prey
sampling using light traps varies between taxa (Bowden, 1982), and light traps sample only
invertebrate taxa attracted to light (Webala et al., 2011). In addition, there is need to assess the
types of insect prey items eaten by different insectivorous bat species found in the study area,
by collecting and analysing their faecal samples for fragments of invertebrates which they feed
on (Fukui et al., 2000).

78
CHAPTER SEVEN: INFLUENCE OF HABITAT STRUCTURE AND FRUIT TREES
DISTRIBUTION ON BATS ABUNDANCE IN ARABUKO-SOKOKE FOREST AND
ADJACENT FARMLAND
ABSTRACT
This study investigated habitat structure and fruit trees resources in ASF and nearby farmland,
and their roles in the distribution and abundance of bats in the two study sites. Point-centred
Quarter (PCQ) method was used to assess vegetation structure in each of the three different
vegetation types in ASF (Cynometra and mixed forest, Brachystegia woodland) and farmland
(mango, coconut or mixed farms). Understorey vegetation cover was assessed by use of
checkerboard of 25 squares painted in white and red. Canopy cover was assessed by use of
paper cylinder (diameter 4.5cm and 10cm long). Overall the farmland was cultivated with
orchards of exotic fruit trees dominated coconut (54%), mango (31%), cashew nut (11%) and
neem (3%) trees. The ASF was predominantly covered by four indigenous trees; Brachystegia
spiciformis (30%), Cynometra webberi (30%), Manikara sansibarensis (18%) and Hymenaea
verrucosa (11%). The largest number of trees producing fruits (mangos, guavas and cashew
nuts) eaten by fruit bats occured in the farmland (385) than in ASF (166). The % understory
cover at ASF (38.2 ± 1.9) was signficantly more closed than that of the farmland (5.8 ± 2.3) t
(208) = 16.634; P < 0.05). The % canopy cover at ASF (48.2 ± 1.4) was signficantly thicker
than that of the farmland (29.3 ± 2.9) t (208) = 5.6887; P < 0.05). The abundance of fruit
producing trees in the farmland attracted many individuals of fruit bats into this habitat, while
the cluttered nature of the interior of ASF, inhibited bats use of this habitat. The farmland trees
around ASF should be maintained in this habitat, because of their vital role in enhancing the
survival of bats in the study area.
7.1 Introduction
The tropical forest provide vital resources such as fruits, pollen and leaves which support fruit
bats, and also a wide variety of invertebrates consumed by insectivorous bats. In addition, the
forest structure and management influences its suitability for use by bats (Entwistle et al.,
1996). For example, the amount of spatial complexity in the environment, or vegetation clutter
(Fenton, 1990), influence the selection of foraging areas by insectivorous bats (Humes et al.,
1999). Small bats have a more manoeuvrable flight, and forage in cluttered airspaces (Norberg
and Rayner, 1987), whereas larger bats with higher wing loadings are less manoeuvrable, and
forage in the open areas (Fenton 1990; Brigham et al., 1997). Dense vegetation also obscure
calls from insectivorous bats (Patriquin et al., 2003) which is a major limitation of bat acoustic
studies on activity and habitat use.

79
The differences in habitat structure between the ASF and farmland, could influence the
availability of resources used by bats. For example, resource availability (e.g. fruit trees) in
the forest and the agricultural areas can shape bats composition (Hodgkison et al., 2004). The
study investigated vegetation structure in ASF and in the farmland and its influence in
structuring bat communities found in them, by assessments of 1). The abundance of fruit tree
species which produced suitable fruits that could be eaten by foraging fruit bats, and 2).
Canopy and understorey vegetation cover in ASF and in the farmland, which could enhance
or inhibit bats habitat use of the two study sites.
7.2 Materials and Methods
7.2.1 Assessments of tree species and their characteristics
Tree characteristics in both study sites was assessed using the Point-centred Quarter method
(PCQ) Cottam and Curtis, 1956), a plotless technique which uses a number of randomly
selected points covering an area under vegetation investigation (Cottam et al., 1953). In ASF
and in the farmland vegetation sampling transects were laid in the same general areas where
bats surveys had been previously sampled as done by Estrada et al. (2006). The PCQ points
in ASF were selected following forest roads through Cynometra forest, Brachystegia
woodland and mixed forests where bats had been sampled. In the farmland, transects were laid
parallel to each other at interval of 50M from the longest orientation of the mango, coconut or
mixed farms, especially for sampled farms which were at most 4ha.
In ASF, a random PCQ point selected to start sampling trees, was about 200M from the nearest
vegetation of different type. In the farmland, the random starting PCQ point was selected 5M
from the boundary with the neighbouring farm. A minimum distance of 30M interval from
each point was used, so as not to sample same trees in two adjacent PCQ points. The area

80
around each sampling point was divided into four 900 quadrants (Mueller-Dombois et al.,
2008; BirdLife International, 2012). Any tree species of >20cm DBH, nearest to the centre of
PCQ point was located, identified to species and recorded in each of four quadrants (Fig. 25).
The distance from the centre of the PCQ point to that tree, its DBH and crown diameter were
recorded. The trees crown diameter were measured with the assumption that the crown was
circular. A ruler was used to measure the DBH of trees. The distance to nearest selected trees
in each quadrant, their crown diameter, and distance between PCQ points were estimated by
pacing. Smaller trees (<19cm) were not sampled because they were less likely to be used by
bats (Ragusa-Netto and Santos, 2014), in the same way big trees would be selected by foliage
and hollow roosting bats. In the case of trees with multiple living trunk, all trunks were
evaluated (Ruschel et al., 2007) and DBH recorded as one trunk. Dead trees in any quadrant
were not included in the assessments. In each of the three vegetation types (Cynometra (70)
and mixed forest (70), Brachystegia woodland (70) in ASF and in farmland (mango (70),
coconut (70) or mixed (70) farms), 70 PCQ points were used to sample vegetation structure.
Thus, in total 210 PCQ points were used to assess vegetation structure and tree characteristics
each in the ASF and the farmland.
Figure 25. Point-centred Quarter Method (PCQ) method diagram (Mueller-Dombois et al.,
2008)

81
7.2.2 Assessments of understory and canopy vegetation cover
The understory/undergrowth vegetation cover was assessed by use of cover boards (Nudds,
1977). These boards vary in dimensions but are generally narrow panels with bands of
alternating colours (checkerboard pattern), which are modified to researcher’s requirements.
A board of plywood painted in red and white patterns of 25 squares, each measuring 10cm by
10cm (Fig. 26 A-D) assessed understory vegetation cover around each PCQ point (Higgins et
al., 1996). The cover board was held by an assistant in the north and south directions of the
compass at each sampling PCQ point, at a height of 1.5M above the ground and 5M away
from the centre of each point. To estimate the understory vegetation cover, the total number
of squares covered by more than 50% by tree branches and leaves were counted by one
observer at each distance (Fig. 26 A-D) Pacifici et al., 2008).
Figure 26 A-D. A wooden board of plywood checkerboard painted in red and white patterns
of 25 squares for assessing understorey vegetation cover.
A. 21 squares are >50% obscured by vegetation.
Highly cluttered/thick understorey cover
B. 20 squares >50% obscured by vegetation-
Highly cluttered/thick understorey cover
C. One square are >50% obscured by vegetation-
Not cluttered/very open understorey cover
D. No square is >50% obscured by vegetation-
Not cluttered/very open understorey cover

82
The % canopy cover was assessed with a paper cylinder (diameter 4.5cm and 10cm long)
Fanshawe, 1993). The cylinder was used as a sighting tube to assess canopy cover at each
PCQ point by use of naked eye (Rautiainen et al. 2005; Korhonen et al., 2006). To estimate
the % canopy cover at any given PCQ point, the cylinder was held pointing directly above,
and the percentage of the open space of the cylinder obstructed by tree branches and leaves
estimated. Dead plant matter were not included in canopy cover estimates at a sampling point
(Korhonen et al., 2006). Two canopy cover readings were taken at each PCQ point; one at the
centre of each PCQ and another 5M away, always on the northern direction of the compass.
To reduce the errors in assessment of the canopy cover at each point, the paper cylinder was
always held vertically (Jennings et al., 1999). To minimise observation bias, the count of the
number of squares, as well as the estimation of percentage canopy and understorey cover, were
all assessed by one person throughout the vegetation sampling exercise.
7.2.3 Data analysis
The Point-Centred Quarter (PCQ) data was organized in excel program and used the same to
summarize and analyse various tree characteristics at ASF and farmland following formulas
described by (Mitchell, 2007). The Mean distance between trees, was calculated by the sum
of the nearest neighbour distances in the quarters surveyed divided by the number of quarters.
The absolute density of an individual species is number of trees of that species that are
expected to occur in an area the size of one hectare (Mitchell, 2007). The absolute density,
which is the number of trees per unit area in one hectare was calculated using a method
provided by Cottam et al. (1953) and Morisita (1954). The % of the total number of tree
observations of that species is the relative density of each tree species. The cover or dominance
of an individual tree was measured by its basal area or cross-sectional area, with the absolute

83
cover or dominance of each species being expressed as its basal area per hectare. The relative
cover or relative dominance for a particular species was defined as the absolute cover for that
species divided by the total cover times 100 to express the result as a percentage (Cottam and
Curtis, 1956). The importance value of a tree species was calculated as the sum of relative
density + relative cover + relative frequency (Mitchell, 2007). To find out trees which
produced fruits eaten by fruit bats from the collected tree data, the type of fruits produced by
all tree species found in ASF and farmland in this study, were checked in ‘Kenya trees, shrubs
and lianas’ a plant book published by Beentje (1994). The selected fruiting trees targeted by
foraging frugivorous bats from the sampled trees in ASF and farmland, were those
documented by Beentje (1994) to produce small, big, wild or cultivated fruits, which when
ripe are soft and edible. This is because fruit bats teeth are not strong enough to crack hard
small or big seeds or nuts; however they target ripe and soft fruits (Happold and Happold,
2013). All trees from the sampled tree data in ASF and farmland documented by Beentje
(1994) to produce hard small or big fruits or nuts when ripe were not considered as potential
food resource of fruit bats.
Other habitat structure data, such as understorey, canopy and crown cover, and DBH and were
organized in excel. The data was checked for normality and analysed using one-way ANOVA
for habitat structure differences in ASF and farmland. If the p-value corresponding to the F-
statistic of one-way ANOVA was lower than 0.05, it indicated that, one or more habitat
variable were significantly different. Thus the, Tukey HSD post-hoc tests was done to identify
which of the pairs of variable were significantly different from each other. All analysis was
done using program PAST Hammer et al., 2001).

84
7.3 Results
7.3.1 Tree species in the farmland and ASF
A total of 840 individual trees (of >20cm DBH), of eight different species were found in 210
PCQ points assessed in the farmland. These trees included mango, cashew nut, coconut, neem,
casuarina, guava, Gmelia arborea and citrus spp (lemon) trees (Fig. 27). No indigenous tree
was recorded in the 210 PCQ points in the farmland. The commonest tree found in the
farmland was coconut, represented by 54% of all trees followed by mango (31%), cashew nut
(11%) and neem (4%) trees, with the other trees being very few in numbers (Appindex 7). In
mango farms sampled, mango trees were the most dominant and represented 71% of all trees,
followed by coconut trees (19.6%). In the sampled coconut farms, coconut trees were the most
dominant represented by 89% of all trees, followed by mangos (3.9%). The most dominant
tree in the sampled mixed farms was coconut represented by 53% of all trees, followed by
cashew nuts 23% and mango 19%.
Figure 27. Total number of individuals of diverse tree species found in 210 PCQ points in
the farmland
453
261
89
31
2 2 1 1

85
In total 840 individual trees (of >20cm DBH), of 20 different species occurred in the 210 PCQ
points assessed in the interior of ASF. The commonest trees found in ASF were B. spiciformis
represented by 30% of all trees, followed by C. webberi (29%), Manikara sansibarensis (18%)
and Hymenaea verrucosa (11%) with other trees being very few (Fig. 28). No exotic and
cultivated tree was recorded in the 210 PCQ points inside ASF (Appindex 8). In Cynometra
forest, C. webberi tree was the most dominant represented by 87% of all trees, followed by B.
huillensis (5%). In the Brachystegia woodland, B. spiciformis tree was the most dominant
represented by 89% of all trees, followed by H. verrucosa (5%). The mixed forest was
dominated by M. sansibarensis trees represented by 53.6%, followed by H. verrucosa (28%)
and Afzelia quanzensis trees (10%).
Figure 28. Total number of individuals of different tree species found in 210 PCQ points in
the interior of ASF.
7.3.2 Fruits trees found in the farmland and at ASF
Of 840 individual trees found in the farmland 210 PCQ points, 456 (54%) including coconut,
casuarina and citrus trees do not produce fruits which would be eaten by fruit bats. The
248 244
154
91
39
178 7 7 6 3 3 2 2 2 2 2 1 1 1
Tree species

86
remaining 384 (46%), which include cashew nuts, neem and mangos produce soft fruits when
ripe which could be consumed by fruit bats (Appindex 7). Out of 840 individual trees in ASF
210 PCQ points 674 trees (80%) do not produce fruits which would be eaten by fruit bats,
while 166 trees (20%) in the same habitat including M. sansibarensis, Mimusops obtusifolia,
Lannea schweinfurthii, Haplocoelum inoploeum and Dialium orientale (Appindex 8)produces
edible fruits which potentially are eaten by fruit bats.
7.3.3 Tree characteristics in the farmland and ASF
The mean distance between trees in the farmland was 9.5M, while in ASF it was 10.95M. The
absolute density in the farmland was 111/ha and in ASF 84/ha. In the farmland, the coconut
trees had the highest density per hectare (60), followed by mango (34) and cashew nut (12)
(Appindex 9). In ASF B. spiciformis had the highest density of of trees per ha (25), followed
by C. webberi (24) and M. sansibarensis (15) Appindex 10). The coconut trees in the farmland
had the highest (54%) relative density of all trees recorded in the farmland, followed by mango
(31%). In ASF B. spiciformis and C. webberi had highest relative density (30% and 29%
respectively). In the farmland the mango trees had the largest total basal area per ha (m2/ha)
26.3), followed by cashew nut (4.1) and coconut (3.8 (Appindex 11), while in ASF it was B.
spiciformis (7.2), followed by C. webberi (1.8), and M. sansibarensis (1.3) Appindex 12).
Mango trees in the farmland had the highest (75%) relative cover (relative dominance) of a
species, followed by cashew nut (12%) and coconut (11%). In ASF B. spiciformis had the
highest (54%) relative cover of a species, followed by C. webberi (14%) and Afzelia
quanzensis (11%). The mango tree had the highest (30%) relative frequency of a species in
the farmland followed by cashew nut (12%), while in ASF B. spiciformis and C. webberi had
the same relative frequency (20%). The tree species in the farmland with the highest important
value of a species was mango (136), followed by coconut (112) and cashew nut (39 (Appindex

87
13); while in ASF it was B. spiciformis (102) followed by C. webberi (62) and M.
sansibarensis (46) Appindex 14).
7.3.4 Habitat structure in the farmland and ASF
There was a significant difference in the mean distances among trees in the six different
vegetation types in the two study sites (One-Way ANOVA [F (5, 1674) = 27.39, p < 0.05].
Trees in Brachystegia woodland (BRA) in ASF were the most spaced (14.4m ±0.8) than in
the other vegetation types in the two study sites. In the farmland trees in coconut farms (COC)
were the least spaced (7.5m ±0.3) Fig. 29). Note MAN (mango farms), COC (coconut farms),
MIXFa (mixed exotic trees in farmland) BRA (Brachystegia woodland), MIXFo (mixed
indigenous tree forest in ASF) and CYNO (Cynometra forest).
Figure 29: Mean values (±SD) of distance between trees (m) N=280) in ASF vegetation types
(shaded) and farmland (unshaded). Different single letters (eg, a,b,c) indicate significant
difference in distance between trees among vegetation types, while combined different letters
(eg ac) indicate significant differences in distance between trees in two vegetation types.

88
There was a significant difference in the mean DBH of trees in the six different vegetation
types in the two study sites (One-Way ANOVA [F (5, 1674) = 115.68, p < 0.05]. Trees in
mango farms (MAN) had the largest DBH (76.3cm ± 2.7) followed by those in Brachystegia
woodland (BRA) 53.5cm ± 1.6) in ASF (Fig. 30). Some of the old B. spiciformis trees had
large hollows which some species of insectivorous bats would likely roosts in (Fig. 31).
Figure 30. Mean values (±SD) of Diameter at Breast Height (DBH (cm) N=280) in ASF
vegetation types (shaded) and farmland (unshaded). Single letters (e.g. a) indicate significant
difference in DBH among vegetation types, while two different letters (e.g. ac) indicate
significant differences in DBH between the two vegetation types.

89
Figure 31. Old large and hollowed B. spiciformis and M. sansibarensis trees in ASF which
could likely be used a roosts by some insectivorous bats.
There was a significant difference in the mean percentage vegetation canopy cover in the six
different vegetation types in the two study sites (One-Way ANOVA [F (5, 414) = 16.41, p <
0.05]. In the farmland the most closed canopy was in the mango farms (MAN) followed by
coconut farms. In ASF the canopy of Brachystegia woodland (BRA) and mixed forest
(MIXFo) was the most closed (Fig. 32). The canopy cover among Brachystegia woodland
(BRA), mixed forest (MIXFo) and mango farms (MAN) was the same, while that of
Cynometra forest in ASF was the most open among all the vegetation types in the two study
sites (Fig. 32).
M. sansibarensis trees with big hollows B. spiciformis with big hollows

90
Figure 32. Mean values (±SD) of % canopy cover (N=70) in ASF vegetation types (shaded)
and farmland (unshaded). Same single letters (e.g. b) indicate no significant difference in
canopy cover among the three vegetation types, while two letters (e.g. bc) indicate significant
differences in canopy cover between vegetation types.
There was a significant difference in the mean percentage understorey/undergrowth vegetation
cover in the six different vegetation types in the two study sites (One-Way ANOVA [F (5,
414) = 61.59, p < 0.05]. The % understorey cover among the three vegetation types (MAN,
COC, MIXFa) in the farmland was the same. In ASF, the thickest understorey was in
Cynometra forest (CYNO), while Brachystegia woodland (BRA) and mixed forest (MIXFo)
had the same percentage understorey cover (Fig. 33).

91
Figure 33. Mean values (±SD) of % understorey cover (N=70) in ASF vegetation types
(shaded) and farmland (unshaded). Same single letters (eg, b and c) indicate no significant
difference in understory thickness among vegetation types.
There was a significant difference in the mean crown diameter of trees in the six different
vegetation types in the two study sites (One-Way ANOVA [F (5, 1674) = 215.73, p < 0.05].
The crown diameter of trees in Brachystegia woodland (BRA) was the largest (18.4m ±0.4),
followed by those of mixed forest (MIXFo) and mango farms (MAN). The crown diameter of
trees in mixed forest (MIXFo) and mango farms (MAN) was the same (Fig. 34). The large
crown diameter of mango trees in the farmland, and the nature of these trees of being evergreen
throughout provided a suitable roosting habitat for some fruit bat species (Fig. 35-36).

92
Figure 34. Mean values (±SD) crown diameter (m) N=280) in ASF vegetation types (shaded)
and farmland (unshaded). Same single letters (eg, a or c) indicate no significant difference in
crown diameter between the two vegetation types.

93
Figure 35. Mango trees in the farmland with large crown diameter which remain evergreen
annually and the dense crown provided suitable roosts for foliage roosting bats
Figure 36. Individuals of E. wahlbergi roosting in the foliage of mango and cashew nut trees
at Gede market

94
When the habitat structure variables were compared between the ASF and the farmland, they
were found to be signficantly different (Table 11). The DBH of trees was significantly larger
in the farmland than in ASF (t (838) = 6.8934; P = 0.0001). The percentage understory and
canopy cover in ASF was more closed in ASF than in the farmland (Table 11).
Table 11. Comparison of different habitat structure variables between ASF and farmland.
Means (±S.E.) and student t-tests with associated probabilities. Significant results at P = 0.05
are shown in bold.
Comparison: Habitat Structure ASF And
Farmland
Vegetation Types ASF FARM
LAND
t-test P
1. Distance between trees (m) N=840) 10.9±0.3 9.5±0.2 5.0391 <0.05
2. DBH (cm) N= 840) 39.4±0.8 50.9±1.3 6.8934 <0.05
3. % Canopy cover (N = 210) 42.8±1.4 29.3±1.9 5.6887 <0.05
4. % Understory thickness (N= 210) 38.2±1.9 5.8±2.3 16.634 <0.05
5. Crown diameter (m) (N = 840) 12.9±0.2 10.2±0.2 9.016 <0.05
7.4 Discussion
In this chapter the vegetation structure in ASF and farmland were studied, in order to
undestand how the habitat structure and forest resources influenced the distribution and habitat
use by bats. No single indigenous tree typical of coastal forests in Kenya was found in the 210
PCQ points assesed in the farmland, but this habitat was dominated by exotic orchard of trees.
In addition, no single exotic tree occurred in the 210 PCQ points assesed in ASF. The current
study recorded the same indigenous dominant tree species recorded in the three broad
vegetation types in ASF by Robertson and Luke (1993), suggesting this forest is still relatively
in good habitat condition. The marked changes in habitat structure between ASF and farmland,
has dramaticaly affected the distribution of many wildlife species probably bats included, but
particularly more the globally threatened species found in this forest (Bennun and Njoroge,
1999).

95
The farmers around ASF cultivated exotic trees as sources of fruits which were consumed at
household level or were sold to provide additional income to families. Some of these trees
were also sources of timber for locals. Because of the immense livelihoods benefits derived
by the farmers, the trees were densely planted (9.5 m ± 0.2, from each other) as compared to
those inside ASF (10.9 m ± 0.3). The farmland trees were of bigger sizes (50.9m ± 1.3 DBH)
than those in ASF (39.4 m ± 0.8). This suggests that the farmland trees trees had been
cultivated for many years, the reason some like mangos had attained very big mean girths
(76.3m ± 2.7), much bigger in size than the largest B. spiciformis trees (53.5 m ± 1.6) in ASF.
Some of the big and old B. spiciformis and M. sansibarensis trees in ASF had large hollows
(Fig. 31) which potentially could be used by some insectivorous bats for roosting, although
this was not verified during the current study. In addition, trees like mango (Fig. 35), cashew
nut, coconut and neem remained evergreen annually, and could provide potential roosting
habitat especially for the foliage roosting bats (Fig. 36). The presence of the large density of
trees in the farmland probably enhanced this habitat use by bats. For example, bat activity and
captures (Chapter 4-5) was higher in the farmland than in ASF. This observation is consistent
with other bat studies elsewhere. For example, the activity of foraging bats was often higher
near trees in open areas in Australian forests (Law and Chidel, 2002). Furthermore,
agricultural landscapes which incorporate large trees on farms have limited effects on bat
activity and abundance (Williams-Guillén et al., 2016).
In the farmland, probably to increase the production of fruits by trees, as well as other crops,
much of the undergrowth in the cultivated farms was cleared to enable easy access and
possibly to reduce water and nutrients competition among growing plants. Thus, the
understorey and canopy cover in the farmland was more open than inside ASF. Some studies
have shown that thick vegetation or clutter decreases the number and species of bats that use
a habitat (Bobrowiec et al., 2014). In a thick forest habitat like ASF, with very few accessible

96
roads, there were very few bats flight paths, which essentially meant there were limited
foraging areas below the canopy. For instance, many individuals of N. thebaica a clutter
tolerant species, were captured in the farmland (40) than in ASF (14), probably suggesting the
less obstructed nature of farmland, may have provided a more preferred foraging habitat than
ASF interior. Hence, the dense clutter in ASF, may have inhibited bat use of this habitat, and
probably explains the low capture of all bats and activity recorded for this habitat (Chapters
4-5).
In addition, dense understorey clutter also affect the accessibility of insects prey by below the
canopy foraging bats (Rainho et al., 2010). Although farmland and ASF had the same
abundance of invertebrates (Chapter 6), the dense understorey and canopy cover may have
prevented their accessibility by foraging insectivorous bats in ASF. Contrary, the farmland
had many bats flyways and due to its openness, the habitat could possibly enable many bats
to forage or fly at lower level, and be easily captured in mist-nets.
The farmland had the largest number of trees (46%) which produces fruits which are eaten by
fruit bats as compared to the interior of ASF (20%). The neems, guavas, mangos and cashew
nuts cultivated in the farmland produces soft fruits when ripe and are consumed by frugivorous
bats (Korine et al., 1994). The largest number of individuals of fruit bats in the farmland were
captured in mango farms (1288, Table 3), while in ASF it was in mixed forest (382, Table 2).
The fruit trees in ASF including M. sansibarensis, M. obtusifolia, L. schweinfurthii, H.
inoploeum and D. orientale, produce tiny fruits characterised by soft pulp after they ripen
(Beentje, 1994), and are thus likely to be consumed by frugivorous bats. The mixed forest was
dominated by M. sansibarensis (150 trees), probably suggesting that the fruit bats were
attracted to fruits produced by this tree. Sixty five percent of all bats documented in this study
were frugivorous bats which occurred in the farmland and only 17% in ASF. The main fruit

97
bat species captured in the study area were R. aegyptiacus and E. wahlbergi. Individuals of R.
aegyptiacus and E. wahlbergi consume many different types of ripe cultivated fruits trees
including those of neem, mango, cashew nuts and guava (Ayensu, 1974). Most likely, because
of the tiny sizes of the wild forest fruits in ASF, when compared with the large commercial
fruits produced in farmland, the former fruits were probably exploited less by foraging bats.
Hence, the huge abundance of edible fruits cultivated in the farmland, may be the most likely
reasonable explanation for the large quantities of frugivorous bats captured in this site.
To conclude, the farmland habitat lacked all indigenous tree species found inside ASF. This
indicates a complete conversion of the original natural forest in this area into agroecosystem.
The dominant trees that characterised the three broad vegetation types in ASF in the past, were
recorded in large numbers, suggesting that the ASF is still relatively intact, and in good habitat
condition to sustain endemic, globally threatened and common wildlife species. The farmland
was covered in actively cultivated exotic trees which probably provided useful habitat to bats
for roosting and foraging. The understorey and canopy of the farmland were more open than
in ASF. In addition, the farmland had many cultivated fruit trees, which provided fruit
resources to frugivorous bats dominant in this habitat. Therefore, to enhance the conservation
of bats in the study area in the long run, there is a need to work with local farmers, to ensure
proper management and continued cultivation of trees (neem, mango, cashew nuts, coconut
and guavas) in their farms.

98
CHAPTER EIGHT: HUMAN-BAT INTERACTIONS AROUND ARABUKO-
SOKOKE FOREST
ABSTRACT
Human beings are the main drivers of flora and flauna extinctions worldwide. In this study
local people attitudes and perceptions were examined, in order to understand how their actions
might influence bats survival in the study area. A semi-structured questionnaire was used to
investigate knowledge, attitudes and perceptions about bats by 394 local people surrounding
ASF. Beliefs to unfounded mythologies were dominant among local people and these myths
were connected with low acceptance of bats. The attitudes of the elderly and more educated
respondents were more positive toward bats than those of the youths and illiterate people.
Females believed myths about bats more than males. The males around ASF had more
antagonistic behaviour toward bats as compared to females. About one-third of respondents
killed individuals of bats upon encounter or damaged their roosts; and a comparable number
associated bats with no benefits to humans. Many people around ASF implicated bats in the
damage of cultivated fruits such as mangos, cashew nuts and guavas. To counteract the low
appreciation of bats common among locals around ASF, there is a need to intensify bat
awareness among school going youths, in order to positively influence their attitudes toward
bats.
8.1 Introduction
The theory of how people behaves hypothesizes that attitudes, subjective customs, and
observed behaviour, regulates people behavioural objectives (Ajzen and Fishbein, 1980).
Attitude is the manner an individual reasons or acts about something (Eagly and Chaiken,
1993). Subjective customs are pressures which emanate from a society where one lives or is
born, which guide choices made by individuals, especially what they choose to do at any given
time (Ajzen, 1991). Perceived behaviour control refers to person’s perception of the likelihood
of behaving or acting in a certain way (Azjen, 1991). Bats as well as rats, microbes, spiders
and reptiles (snakes), are the major animals which recurrently have been reported to cause fear
to human (Robins and Regier, 1991). Bats are feared because they are associated with diseases
and parasites (Rego et al., 2015), and also due to negative myths, publicity and
misrepresentation of facts disseminated to the general public about them (Mayen, 2003).
Animals which are adversely perceived and are dreaded by people, face persistent attack from
people using an assortment of approaches (Prokop and Fančovičová, 2012). Therefore, it is
imperative to document information on human-bat interactions, in order to comprehend the

99
most appropriate approaches to use to involve people in the conservation of bats as well as
their habitats.
The knowledge, perceptions and attitudes toward bats among individuals of Mijikenda tribe
that live nearby ASF were investigated. The Mijikenda tribe is a Bantu speaking people, which
lives mainly along the Kenyan coast that primarily consists of nine different sub-tribes. The
nine sub-tribes are Duruma, Ribe, Rabai, Chonyi, Digo, Kambe, Kauma, Giriama and Jibana).
Though information about attitudes and perceptions about bats among 44 tribes in Kenya,
haven’t been documented, this traditional information can provide fundamental insights in the
preparation of a comprehensive national bat conservation plan. Like all tribes in the world, the
Mijikendas, have cultural beliefs about bats which may affect their survival both positively or
negatively (Musila et al. 2018b). Because more knowledge (Bjerke et al., 2003) and better
education positively influences human attitudes towards animals (Kleiven et al., 2004), it was
hypothesized that literate respondents around ASF would be more appreciative of bats than
illiterate people. Human females have more negative attitudes towards animals that are known
to be a threat to people than males (Ceríaco, 2012), hence it was also predicted that female
respondents in this study would be less appreciative of bats and have more negative beliefs
about them than their male counterparts.
8.2 Materials and Methods
8.2.1 Study area
This study was undertaken in villages in Gede and Watamu sub-locations, on the eastern part
of ASF (Fig. 37). Because one of the main interest of this study was to investigate how local
peoples’ knowledge, attitude and perception about bats varied among people living near
proximity to bat roosts and those living far away, there was a need to locate bat caves around
ASF, before socioeconomic surveys were conducted. During pilot surveys three limestone bat
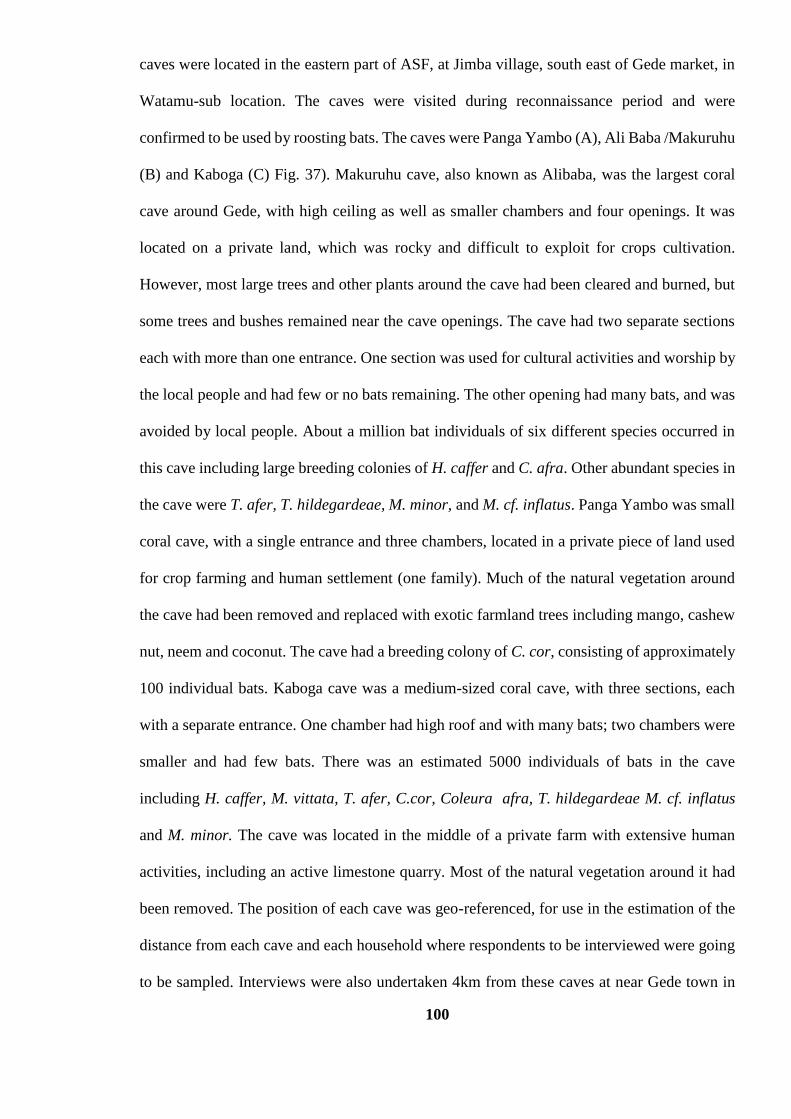
100
caves were located in the eastern part of ASF, at Jimba village, south east of Gede market, in
Watamu-sub location. The caves were visited during reconnaissance period and were
confirmed to be used by roosting bats. The caves were Panga Yambo (A), Ali Baba /Makuruhu
(B) and Kaboga (C) Fig. 37). Makuruhu cave, also known as Alibaba, was the largest coral
cave around Gede, with high ceiling as well as smaller chambers and four openings. It was
located on a private land, which was rocky and difficult to exploit for crops cultivation.
However, most large trees and other plants around the cave had been cleared and burned, but
some trees and bushes remained near the cave openings. The cave had two separate sections
each with more than one entrance. One section was used for cultural activities and worship by
the local people and had few or no bats remaining. The other opening had many bats, and was
avoided by local people. About a million bat individuals of six different species occurred in
this cave including large breeding colonies of H. caffer and C. afra. Other abundant species in
the cave were T. afer, T. hildegardeae, M. minor, and M. cf. inflatus. Panga Yambo was small
coral cave, with a single entrance and three chambers, located in a private piece of land used
for crop farming and human settlement (one family). Much of the natural vegetation around
the cave had been removed and replaced with exotic farmland trees including mango, cashew
nut, neem and coconut. The cave had a breeding colony of C. cor, consisting of approximately
100 individual bats. Kaboga cave was a medium-sized coral cave, with three sections, each
with a separate entrance. One chamber had high roof and with many bats; two chambers were
smaller and had few bats. There was an estimated 5000 individuals of bats in the cave
including H. caffer, M. vittata, T. afer, C.cor, Coleura afra, T. hildegardeae M. cf. inflatus
and M. minor. The cave was located in the middle of a private farm with extensive human
activities, including an active limestone quarry. Most of the natural vegetation around it had
been removed. The position of each cave was geo-referenced, for use in the estimation of the
distance from each cave and each household where respondents to be interviewed were going
to be sampled. Interviews were also undertaken 4km from these caves at near Gede town in

101
Gede Sub-location. Detailed description of human settlements, habitat and farming activities
around the caves is the same as provided in Chapter 3.
Figure 37. Map of ASF showing areas around Gede and Watamu sub-locations where bat-
human interactions studies were undertaken. Points A-C were areas around caves and blue
stars were areas 4km away from caves.
8.2.2 Selection of the respondents and interview procedure
Purposive sampling, a non-probability sampling technique in which the characteristics of the
sample to be involved in the study or study sites to be assessed are defined by the researcher
(Tongco 2007; Black, 2010; Quinn et al., 2014), was used in selection of study sites and
respondents in this study. Purposive sampling is widely used in socioeconomic studies

102
(Campbell 1955; Godambe 1982; McDonald et al. 2003; Li et al. 2006, Prance 2004; Garcia
2006; Dolisca et al. 2007). Purposive sampling was appropriate for the current study, because
there was need to compare knowledge, attitude and perception about bats among people living
near the proximity to selected limestone caves and those that lived far away.
Before the start of interviews, the local government administration (chiefs, sub-chiefs), were
visited and elucidated about the procedures of the planned socioeconomic surveys. The
government administration was provided with copies of letters authorizing the study, as well
as copies of prepared questionnaires used in data collection. The procedures of conducting the
socioeconomic survey were explained to them, as well as areas or villages to be visited. This
was done because of the heightened security situation along the Kenyan coast, and government
led Nyumba Kumi initiative, which was being implemented to control cases of terrorist
insecurity since 2013. Semi-structured questionnaires were first developed in English
(Appindex 15), then translated into Swahili (Appindex 16), the chief dialect used by majority
of the local people around ASF. The questionnaire was pre-tested by interviewing 50 people
in the study area prior to the actual data collection (Musila et al. 2018b).
Purposive sampling has potential biases (Quinn et al., 2014), which can be minimised by
collecting data in a systematic sampling manner (Bourdeau, 1953), and also by describing
steps used in selection of respondents in detail, in order to ensure that the procedures can be
repeated in future studies (Tongco, 2007; Quinn et al., 2014). Biases can also be mitigated by
use of maximum variation sampling technique, which relies on choosing participants with
human population features likely to influence respondent views about a subject under
investigation (Brikci and Green, 2007; Tongco, 2007). These variable in the current study
included gender (males, females) and age (youths and adults) of the respondents as well as
distance from the roosts. Almost an equal number of adults and youths of both gender were

103
interviewed in this study, in order to get views from the age groups representative of the
population. A youth in this study was a respondent aged below 8-20yrs, and an adult a person
above 21yrs.
A team of three people, accompanied by a native who spoke Giriama and Swahili visited
households. Respondents were sampled by walking along paths or roads in the villages and
selecting respondents from the third household from the first or the last visited. This was done
to ensure a systematic method of selecting respondents from households was applied around
the bat roosts away from them. The research team was introduced in each household by a local
guide. If adult members of the family were available, the purpose of the research team visit
was explained to them, if not available the household was skipped. Thereafter, a request to
participate in the interview was sought from adult members of the household available. If
permission was granted, two members of the household of dissimilar gender or age category
were selected for interview.
To get the information from the respondents; questions in the questionnaire were read by an
interviewer, and answers provided by each interviewee were used to fill each individual
questionnaire. An interview with one respondent lasted about 15 minutes. Respondents were
asked about their Mijikenda sub-tribe, their education background and number of family
members. To document what respondents knew about bats and how they interacted with them,
they were asked about names given to bats in their local dialect, the last time they had sighted
an individual bat, known bat roosts in the village which were actively being used by many
bats, cultural beliefs held about bats, whether bats were beneficial or harmful to people. To
document how local people reacted to bats which roosted in their households, respondents
were provided with five different choices to choose one option. These choices included I). I
killed many bats, 2). I killed at least one bat, 3). I destroyed roosts to chase bats away, 4). I

104
did nothing, and 5). I contacted responsible officer. To investigate how peoples’ knowledge,
perceptions and attitudes changed with distant from bat roosts (caves), 190 people were
interviewed among people living adjacent (at most 1km away each cave) to the three caves in
Jimba, Gongoni, Kanani, Mnanzini, Bikahanga, Adam B and Panga Yambo villages in
Watamu sub-location. Out of the 190 respondents, 93 were females (47 adults, 46 youths) and
97 males (49 adults, 48 youths). In addition, 204 people were interviewed 4KM away from
the three caves at Mkenge, Mabuani, Kizingo, Msabaha, Baraka Chembe and Gede villages in
Gede sub-location. These included 102 females (51 adults, 51 youths) and 102 males (51
adults, 51youths).
8.2.3 Measures for attitudes toward bats
The attitudes towards bats by local people around ASF were investigated by use of 5-point
Likert-type scale semi-structured questionnaire, prepared in the same way to attitudes towards
animals by Kellert (1996). The questionnaire was divided into five categories (domains) for
investigating attitudes (myths, negativistic, scientistic, ecologistic and knowledge) (Prokop et
al., 2009). Each category was accompanied by a number of listed questions for assessing
attitudes towards bats. Nine negativistic questions measured respondents shunning of bats due
to abhorrence or anxiety such as; “bats destroy fruits in our farm”. Four scientistic questions
measured concern in the natural history of bats such as; “I would like to know more about
bats”. A total of eight knowledge questions asked simple facts about natural science of bats,
by use of questions which were easy to understand by people who lack experience in bat
science such as: “bats lay eggs”. Nine ecologistic questions investigated local people
awareness about the role played by bats in the environment such as; “Bats help in seed
dispersal”. Seven myths questions investigated the levels of respondents’ belief of cultural
myths existing in their community about bats such as; “bats are ghosts”. Each question was

105
scored by selection of one option from a set of five choices that were rated on a Likert type
scale from one; strongly disagree, rather disagree, undecided, rather agree to strongly agree
Before the interviewees started answering the questions asked by the interviewer, they were
enlightened about the meaning of selecting one of the five provided multiple choices (strongly
disagree, rather disagree, undecided, rather agree and strongly agree), for each question posed
to them.
8.2.4 Data analysis
Data were organized in excel and summarized, especially for information on respondents
demographic characteristics including age, size of household, education level, names of bats
in mother tongue, myths, benefits and effects of bats on people. To analyse attitude data rated
on likert scale the reliabilities of each attitude domains (categories) were checked and were
found to be low (Cronbach α averaged (0.36-0.7). The scores of knowledge domain had a very
low reliability (α = 0.18) Nunnaly, 1978). To increase reliability scores of different domains
factor analysis was used with Varimax rotation on attitude data. Varimax rotation is a
statistical method used at one level of factor analysis to try to clarify the association among
variables under investigation (Forina et al., 1989). Barletts test of sphericity (χ2 = 2463.5) and
Kaiser-Meyer-Olkin measure of sampling adequacy (0.72) yielded to significant results (p <
0.001) indicating that it was appropriateto run factor analysis. A total of 14 factors that
explained 64.5 % of variance of results were derived. Factor loadings which had less than 0.3,
as well as domains associated with less than three items were removed from further analysis.
This further analysis resulted into a reduced number of items under each domain, but the
reliability of most domains was highly improved (scientistic domain, α = 0.72; negativistic
domain, α = 0.5; ecologistic domain, α = 0.67 and myths, α = 0.68). However, the reliability
of the knowledge domain did not improve. Thus, data on this domain was not included in
further statistical analyses. To test how attitude of different remaining domains were

106
influenced by independent predictors, multiple linear regression analysed the data in the same
way done by Kalteborn et al. (2006). Independent variables included in the analysis were: sex,
age of respondents, total number of people found in each household, the presence of
individuals of bats in different household farms, stages in the education of each respondent,
the last time a bat was seen and the distance of each household to bat roosts (caves).
The data on the observation of bats with time were combined into two categories of
observations; one in which respondents reported to have seen an individual bat within a week
(last seven days), and two, respondents who had not seen an individual of a bat in the last
seven days. For the analysis the dependent variabe was always one domain of attitudes using
the same method used by Kaltenborn et al. (2006). The analysis produced a number of various
multiple regression models. To achieve normality of the data the dependent variables were
Box-Cox transformed. To investigate behaviour toward bats among respondents, only data
from individuals from households who reported the presence of bats on their farms (N = 352)
were used in analysis. This was because respondents who did not report bats roosting in their
farms (42 of them), could not answer this question, since the provided choices in the
questionnaire (I. I killed many bats, 2). I killed at least one bat, 3). I destroyed roosts to chase
bats away, 4). I did nothing, 5) I contacted responsible officer, were not applicable to them.
Ordinal regression was performed to identify variables associated with respondents behaviour
towards bats (dependent variable), with independent variables being sex, age, total number of
household members, education level attained by each respodent, the last time a bat was seen,
distance to each bat roost (caves) and four domains of attitudes as described above. All
statistical analysis were made in Statistica (StatsSoft, 2007).

107
8.3. Results
8.3.1. Socioeconomic characteristics of respondents
A total 394 people were interviewed in the eastern part of the ASF. Their age, household sizes,
and distance from the roosts are summarized below (Table 12). Among the 394 respondents
there were five different tribes represented. These include Bajuni, Swahili, Taita and Sanya
and six sub-tribes of Mijikenda (Giriamas, Durumas, Chonyis, Digos, Kaumas and Rabais).
Ninety four percent (371) of respondents were of Giriama sub-tribe, with the rest of the other
tribes and Mijikenda sub-tribes represented by very few individuals. Majority of the
respondents had attained primary education (66%), followed by high school (19%), 10%
uneducated and very few with college or university education.
Table 12. Summary results of respondents’ age, household sizes and distances from near and
away from roosts (caves).
Demographic features Range Mean
1 Age
8-80 years
27 years.
SD = 16.0, N = 394)
2 Household sizes
1-25 people
M=9.0 people,
SD = 6.0, N = 394
3 Distance to households near roosts
(caves)
100-1000M
644.0M
(SD = 194.0, N = 190)
4 Distance to households away from
roosts (caves)
3-5km
4189.0M
(SD = 504.0, N = 204).
8.3.2. General knowledge about bats by local people around ASF
The main bat roosts reported by majority of respondents included trees (54%) and natural
caves (24%). An additional 16% of those interviewed did not know where bats roosted (Fig.
38). Popo is the Swahili name for a bat. The vernacular names given to a bat were Kanundu,
Nundu, Ndema, Mpopo and Popo. Seventy one percent of the respondents, of Giriama sub-
tribe called bat in their mother tongue Ndema. Other vernacular names used by Giriamas were

108
Kanundu (18%) and Nundu (10%). The name Ndema mainly was used in reference to big bats,
particularly individuals of frugivorous bats, which were not known by the locals to roost in
man-made structures. The names Nundu and kanundu were interchangeably used to refer to
small bats; especially the insectivorous bats which were known by the local people to
sporadically enter into living houses at night.
Figure 38. Bat roosting areas reported by respondents around ASF
8.3.3. Traditional myths about bats
A number of negative myths about bats were reported by local people around ASF. Bats were
mainly associated with witchcraft and witches, harmed people, and were dirty and a nuisance.
Many local people (61%) claimed that bats were agents of fiend, and that magicians could use
them to bewitch people, while 25% of the respondents did not know any cultural beliefs
associated with bats (Fig. 39). Bats particularly the insectivorous bats (Kanundu/Nundu), were
the ones known to be used by the sorcerers to bewitch people. This was assumed to happen
when witches sent the bats into people’s houses. Respondents reported that even though bats
occasionally entered their houses, it was their behaviour inside the houses, which indicated

109
whether they came to harm the family or not. For example, they said that if an insectivorous
bat entered a house quietly, flew around inside the house without making any noise and
departed, that type of bat was a harmless and a good bat that was a blessing to the household.
However, if an insectivorous bat entered into the house frequently, and each time it
immediately started making noise, which sounded like Ziz, Ziz, Ziz, Ziz, it was a sign of bad
omen, and misfortunes like death in the family could happen thereafter.
Some locals narrated how some members of the local community had died or faced
misfortunes, after a bat entered their houses regularly while making noise. Local people also
believed that when one opened the stomach of a bat, a young bat was found, which was
followed by finding a young bat if the inside of the young bat was opened; and this pattern
was reported to replicate itself, in the subsequent opening of the stomach of any next young
bat. This implied that countless number of young could be retrieved from any bat if its stomach
was opened. Bats were also a nuisance to local people because of their droppings which were
scattered on the floor of the houses, when they frequently roosted in the one place inside the
house or on trees near houses.

110
Figure 39. Different types of traditional myths associated with bats by local people around
ASF
8.3.4. The value of bats to people around ASF
Bats were reported to be beneficial to local people around ASF in eight different ways (Fig.
40). About 36% of respondents reported that bats had no value to people, while 64% reported
that bats were beneficial in different ways. Thirty percent of the respondents stated that bats
were valuable, because they brought seeds and fruits to their household farms, while 19
associated bats with seed dispersal to environment. Six percent of the respondents said that
bats made fruits drop from trees, while the remaining 9% of the respondents said that bats
were beneficial in other six minor ways (Fig. 40).The seeds or fruit fragments reported by
local people to be brought to their farms by bats included mangos, cashew nuts, neems, guavas,
pawpaws (Carica papaya) sugar-apples (Annona squamosa) and bananas (Musa spp). The
main fruit fragments and seeds brought by bats to individual farms were cashew nuts (57%)
and guavas (19%). The cashew nut seeds deposited under the trees in the individual farms by
bats were collected by children in the morning, roasted in open fires, eaten by them or stored
for sale at Gede market, one of the main towns around ASF.

111
Figure 40. The range of benefits of bats to local people around ASF
Bats were reported as seed dispersing agents because they picked fruits from one tree or farm,
and carried it, and ate it from a different tree or farm. In the process of eating the fruit pulp,
the incompletely eaten fruits or seeds dropped (Fig. 41) to the ground from the eating perches,
where they potentially would germinate and grow into trees. Fruits or seeds of cashew nut
were reported by local people to be dispersed by bats overnight, because the local children
collected nuts of this tree, under other trees available in their farms, such as mango, neem,
coconut or Casuarina. Respondents reported that children even collected cashew nut seeds
under other trees, in some farms without a single cashew nut tree. About 5-20 seeds were
reported as the number of seeds which could be found scattered on the ground under one tree
overnight. The locals also reported that they collected seeds and fruit fragments dropped by
foraging bats, from same selected trees, that were used as feeding perches for years. In
addition, bats in some natural caves provided some income to a few households, especially

112
when tourists and researchers paid some money to family members before being allowed to
explore caves located in their land.
Figure 41. Dispersal of cashew nut by fruit bats around ASF. Cashew nut ripe fruit pulp and
nut on the tree ready for harvest (1); E. wahlbergi caught in a mist net in farmland around
ASF transporting a cashew nut fruit to a feeding perch and (2); Sweet soft fruit pulp of
cashew nuts half eaten by foraging fruits bats dropped under trees (3).
8.3.5 Negative effects of bats to local people
There were four main negative effects of bats to people reported by respondents. These were
damaging of farmer’s fruits, nuisance to people, bats infected people with diseases and carried
fruits from one farmer’s farm to another. Majority of respondents (66%) associated bats with
damaging of fruits cultivated by local farmers (Fig. 42-43), while a few of the respondents
(18%) reported bats that did not effects people in anyway. Bats were reported to damage fruits,
when they ripped off their skin cover and sucked fluids in them, ate the fruit partially or in
other cases the whole fruit was completely eaten (Fig. 43). This made fruits unusable by people
for eating or sale as a source of income. The main fruit types reported to be destroyed by bats
were mango, cashew nut, guava, pawpaw, sugar apple and bananas. The fruits reported most
damaged were mangos (42%), guavas (18%) and cashew nuts (18%). Bat droppings,
2

113
especially those from roosts near the proximity to households, were implicated in the spreads
of diseases to local people which were not disclosed.
Figure 42. The negative effects of bats to local people around ASF
Figure 43. Damage to mango fruits by bats on farms around ASF, which starts by scratches
on the surface of mangoes to open the yellow pulp which is the main food of these bats.

114
8.3.6 Attitudes towards bats among local people around ASF
Attitudes on scientistic domain
The mean value of the interest in biology of bats (scientistic domain) was 3.92 (SE = 0.03),
meaning that in this domain the respondents manifested a positive attitude towards bats. The
multiple regression model was significant (R2 = 0.06, F(5,387) = 4.9 p < 0.001, Table 13). Of
the five variables which were entered into the regression model, only three were significantly
associated with scientistic attitudes. Households with many people held more positive attitude
about bats than those those with few members. In addition, local people with higher levels of
education held more positive scientistic attitude about bats than those who were illiterate.
People who reported encounters with bats within seven days held more more positive
scientistic attitudes toward bats. Even though data on the presence of bats on individual farms
and sex differences contributed to the regresseion model, their contributions were
insignificant.
Table 13. The results of multiple regression on the scientistic domain. The distance to bat
roosts and age of the respondents were removed from the regression model (N=394)
Β SE
t P of β
Intercept 0.41 0.68
Day bat/s last seen 0.11 0.05 2.18 0.03*
Level of education 0.12 0.05 2.36 0.02*
No. of household members 0.1 0.05 1.99 0.05*
Bats presence in the farm -0.07 0.05 -1.50 0.13NS
Gender 0.07 0.05 1.46 0.14NS
Legend: * significant, NS-not significant
Attitudes on negativistic domain
The mean value of the negativistic (fear, avoidance and dislike of bats) domain was 3.07 (SE
= 0.03), meaning than in this domain many respondents held neutral attitudes rather than

115
extremely positive (mean value ≥ 4; 3.8 % of respondents) or extremely negative attitudes
(mean value ≤ 2; 1.8 % of respondents). Multiple regression analysis resulted in a significant
model (R2 = 0.08, F (5,387) = 7.2 p < 0.0001, Table 14). The elderly people held more positive
attitudes toward bats than youths. In addition the female respondents held more negative
attitudes to bats than males. Although the number of individuals in households and encounter
with bats contributed to the regreession model the variables did not significantly influence the
negative attitudes toward bats.
Table 14. The results of multiple regression on the negativistic domain. The distance to bat
roosts and levels of education of the respondents were removed from the regression model
(N = 394).
β SE
t P of β
Intercept 3.14 0.00
Age -0.21 0.05 -4.18 0.00*
Gender -0.18 0.05 -3.50 0.00*
No of people in household 0.07 0.05 1.39 0.17NS
Bat lastly seen -0.07 0.05 -1.33 0.18NS
Legend: * significant, NS-not significant
Attitudes on ecologistic domain
The mean value of the ecologistic (concern for the role of bats in nature) domain was 3.52 (SE
= 0.03), meaning that in this domain the local people manifested slightly positive attitudes
toward bats. The model on ecologistic domain was significant (R2 = 0.1, F (4,388) = 14.131
p < 0.0001, Table 15). The old and highly educated people around ASF had more positive
ecologistic attitudes towards bats. Although gender differences of the respondents, as well as
encounters with bats contributed to the model, their results was a non-significant association
with ecologistic attitudes.

116
Table 15. Results of multiple regression on the ecologistic domain. The number of
individuals in household, distance to bat roosts as well as the presence of bats in the farms
were removed from the regression model (N = 394).
β SE
t P of β
Intercept -1.27 0.21
Age 0.34 0.05 6.86 0.00*
Education level 0.15 0.05 3.07 0.00*
Bat lastly seen 0.07 0.05 1.47 0.14NS
Gender 0.06 0.05 1.25 0.21NS
Legend: * significant, NS-not significant
Attitudes on myths domain
The mean value of the myths (acceptance of traditional beliefs) domain was 2.83 (SE = 0.03).
This means that some few respondents believed in myths (mean value ≥ 4; 2.5% of
respondents compared with 10% of respondents with a mean value ≤ 2). The model for the
myths domain was significant (R2 = 0.10, F (5,387) = 9.0, p < 0.0001, Table 16). The female
respondents held more belifes in traditional forklores about bats than males. Furthermore,
more literate and the elderly people had few untrue beliefs about bats. The respondents living
nearer to bat roosts held more myths about about bats than those living away, even though this
association was only marginally significant.
Table 16. Results of multiple regression on the myths domain. The number of individuals in
a household, the last time bats were observed and as well as presence of bat in farms were
removed from the regression model (N = 394).
β SE
t P of β
Intercept 3.86 0.00
Gender -0.24 0.07 -3.48 0.00*
Education level -0.31 0.07 -4.37 0.00*
Age -0.14 0.07 -2.04 0.04*
Cave distance 0.12 0.07 1.78 0.08NS
Legend: * significant, NS-not significant

117
Behaviour of individuals towards bats in their farms
Majority of respondents (73%) had sighted individuals of bats in the last two days (Fig. 44).
The mean score was 3.58 (SE=0.04). Few number of respondents (11%) killed many
individuals of bats or at least one when they occured in their farms. About 18% of the
respondents destroyed areas where bats roosted, so as to drive them away. Many respondents
(70 %) did not do anything to bats which occurred in their farms. Very few of people
interviewed (1%) contacted responsible officers about the presence of bats in their farms. The
males manifested very hostile behavior to bats than females (estimate = 1.21, p < 0.0001).
Recent encounters with bats by individuals interviewed were associated with positive behavior
towards bats (estimate = -0.75, p = 0.02). The associations between age of individual
respondents, number of individuals in households, education level and behavior towards bats
were not significant (all p > 0.05).
Figure 44: The number of respondents around ASF who saw a bat at different times
289
24 23
7 6
45

118
8.4 Discussion
This study investigated perceptions, knowledge and attitudes about bats by local people who
live around ASF. This forest is of special concern because around it there are some limestone
coral bat roosts (caves) in the farmland, which are actively used by bats for roosting. Many
people living around ASF had observed individuals of bats in the environment in the last two
days, probably suggesting that bats were very common around ASF, and people interacted
with them frequently. Bats also occurred in man-made structures in close proximity to people,
almost with daily interactions with them. Hence, how people reacted towards bats they
encountered, may determine whether they survive in the long run or not.
The fear generated due to encounter with events or even animals, like bats, most of the time
generates numerous mythologies that are more or less appreciated by affected people (Prokop
and Kubiatko, 2014). The current study confirmed this observation, because many respondents
(61 %) claimed that bats were agents of the evil spirits, which could potentially be used by
witches to inflict harm to people. Most encounters with individuals of bats and detections are
generally at a distance and transitory (Sexton and Stewart 2007). Furthermore, most of the
close encounters with bats takes place in a negative or dreadful setting, such as sources of
annoyance in human dwellings (Voigt et al., 2016). The brief encounters and limited
understanding about bats, may be the reason many people around ASF viewed them
negatively. Beliefs of untrue folklores are predominantly hostile, because they can lead to
development of negative attitudes among people (Alves et al., 2014), and also sometimes fuel
deliberate killing of animals (Dickman, 2010). Indeed, beliefs of untrue legends in current
research were pointedly associated with deliberate harassments of individual bats, as well as
destruction of their roosts.

119
The more information one has about a subject, as well as advanced levels of learning
influences the development of a positive attitudes towards animals by humans (Røskaft et al.,
2003), and enhances wildlife species conservation efforts (Kideghesho et al., 2007). In
particular, local people with advanced education in this study had more encouraging scientistic
and ecologistic attitudes towards bats. In Kenya, learners are exposed to the studies about the
environment for about 12 years, from primary to secondary school. This probably, improves
their understanding and appreciation about plants and animals’ interrelationships, and thus
improves their perception about wildlife. The age of an individual is also possibly associated
with better knowledge (Randler et al., 2007), and thus, the elderly around ASF had more
positive attitudes about bats. The old persons have interacted with natural world for a lengthier
period of time than young people. Consequently, some of the untrue folklores or
misrepresentation about bats learned by the old people in their infancy, may have been
invalidated by their extensive period of exposure to bats in their long life. Thus, the initial
negative attitudes, which the elderly respondents had acquired when they were young may
have been improved to a positive acceptance of bats with passing of age. For instance, the
elderly in Portugal had less negative attitudes towards frogs and reptiles, as compared to
youths (Ceríaco, 2012).
The respondents who lived near caves actively used by bats, had more myths about bats. This
may have arisen from frequent interaction with bats, as they emerged from the caves to forage
in the evening or during their return to caves to roost at dawn. Females had more negative
attitudes and believed more false folklores about bats than males. However, males had more
hostile behaviour towards bats than females. Some studies have shown that females habitually
harbour more negative attitudes toward, ostracised wild animals and carnivores compared to
males (Almeida et al., 2014). These sex differences in their reaction to detested animals,
probably arises from stronger evasion to carnivorous animals (Røskaft et al., 2003) and

120
infection cues (Prokop et al., 2010), since females are more susceptible to attacks (Treves and
Naughon-Treves, 1999) and innately want to defend their offsprings from pathogens (Prokop
and Fančovičová, 2016). Furthermore, males habitually perpetrate harm and persecution to
animal than females (Pagani et al., 2007), which might explain the reason males in this study
were more intolerant to bats.
Less than half of the people interviewed (36%) did not see any value of bats to human or by
extension to the improvement of their environment. Furthermore, a substantial (66%) number
of the respondents implicated bats with the damage of fruits cultivated by farmers.
Nevertheless, although the locals reported that bats damaged their fruits, the quantities lost by
bats compared to that used by local people may be marginal but highly overestimated.
Individuals of R. aegyptiacus, an abundant frugivorous bat around ASF, forages on numerous
fruits cultivated by farmers, and is labelled as a crop pest in some regions, but its impact on
the overall crop harvest has been generally overrated (Korine et al., 1999). In Israel and Cyprus
for example, conflict with farmers has led to the implementation of control measures, which
have drastically reduced the population size of this species (Hadjisterkotis, 2006).Therefore,
it would also be important to assess the quantities of fruits lost to bats around ASF, so as to
consider possibilities of implementing appropriate methods of controlling bat losses.
About 64% of respondents around ASF reported that bats were valuable to people, because
they supported essential ecosystem service of dispersing the seeds of cashew nuts and guavas
to their farms. In order to encourage local people to be tolerant to bat existences in the study
area, it would be important to emphasize the value of bats in bringing cashew nut seeds into
their farms. Cashew nut nuts were very valuable around ASF, because they were consumed
by local people. Furthermore, it would be important to quantify the amount of the seeds of

121
cashew nuts dispersed by frugivorous bats in the study area, in order to evaluate the financial
influence of the frugivorous bats to welfare of local people around ASF.
In conclusion, majority of the people living around ASF manifested impartial or marginally
positive attitudes towards bats. More educated and older people had positive scientistic and
ecologistic attitudes toward bats. Efforts to decrease the numerous conservation threats to bats
eventually hinge on altering peoples’ behaviour (Clayton and Myers, 2015). However, bat
knowledge is commonly low (Sheherazade and Tsang, 2015) and is associated with low
attitudes toward bats (Prokop et al., 2009). Hence, there is need to increase bat conservation
awareness around ASF, among population segments who are currently unappreciative of bats
existence, especially by targeting youths. This is because, when adult conservationists are
queried about the source of their obligation to defend the natural world, they recurrently
recount positive familiarities with environment in their childhood (Wells and Lekies, 2006).
This can be done by conducting bat awareness in boarding schools and colleges around ASF
in the evening (1600pm-0900pm), by catching bats using mist-nets, displaying them to
learners, and responding to queries raised by students and elucidating the details of ecology
and biology of bats. These awareness sessions would help to demystify the lives of bats and
their relationship with people, and probably change the negative attitudes the youths have
about bats.

122
CHAPTER NINE: SUMMARY OF FINDINGS, GENERAL DISCUSSION,
CONCLUSION AND RECOMMENDATIONS
9.1 Summary of findings
This study investigated factors which influenced bat community structure and their activity in
ASF and adjacent farmland, as well as bat-human interactions around this forest. The summary
of findings of each chapter are as follows: in chapter four; Bat diversity and abundance in ASF
and farmland, were investigated in order to document distribution of bat species in both
habitats. The farmland was richer (25) in bat species richness than ASF (19), but the forest
interior had higher bat diversity (H’= 1.48 ± 0.2) than the farmland (1.33 ± 0.1). Bats were
also more abundant in the farmland (4327) than in ASF (890). Of the 14 roosts actively used
by bats, 13 occurred in the farmland.
In chapter five, bat activity in ASF and adjacent farmland were investigated by use of mist-
net captures and acoustics methods, to understand the patterns of bat activity and their use of
both habitats. The farmland had a higher activity (425.3 ± 95.1, N=10) of captured bats per
hour than the forest interior (88.4 ± 11.2, N=10). For insectivorous bats, a total of 14,727 bat
echolocation calls (passes) were counted including 10,552 in the farmland and 4,175 in ASF.
The farmland had a higher activity of insectivorous bats per night (152.9 ± 13.2) than in ASF
(60.5 ± 4.6). The activity pattern of mist-nets and acoustic monitored bats, peaked after sunset
(1900-2000hr), plunged to lowest level past midnight (0100hr-0200hrs), then slightly
increased at dawn (0400hr-0500hr).
In chapter six, solar powered light traps were used to investigate invertebrate prey abundance
in ASF and adjacent farmland, in order to understand their availability and accessibility to
foraging insectivorous bats found in both habitats. Of 6,557 individuals of invertebrate prey
captured: 52% occurred in the farmland and 48% in ASF. Although the farmland had slightly

123
higher abundance (260.5 ± 52.9, N=12) of invertebrate prey, than the ASF (200.3 ± 36.4,
N=12), there was no significant difference in the abundance of prey between the two sites.
In Chapter seven, Point-Centred Quarter method was used to describe the habitat structure and
fruit trees resources in ASF and the farmland, and its roles in influencing the distribution and
abundance of bats in both study sites. The farmland was dominated by orchard of actively
cultivated exotic trees (coconut (54%), mango (31%) and cashew nut (11%), while the forest
was dominated by indigenous trees (B. spiciformis (30%), C. webberi (29%) and M.
sansibarensis (18%). The farmland had the largest number of fruit trees (385) producing large
fruits that are eaten by foraging frugivorous bats, while the forest had 166 native trees which
produces small sized fruits. The farmland had larger trees (mean DBH 50.9cm ± 1.3) than
those in ASF (39.4cm ± 0.8). The percentage canopy and understory cover of the interior of
ASF interior was more closed than that of the farmland.
In chapter eight, knowledge, attitudes and perceptions towards bats by local people living in
the eastern part of ASF were investigated using structured questionnaires. The purpose of this
investigation was to understand how people’s actions could affect the survival of bats in the
study arean in the long run. The elderly and people with advanced education, had more positive
attitudes towards bats than the young and uneducated people. Females had more negative
attitudes towards and believed more to untrue folklores about bats than males, while males
manifested a more antagonistic behaviour towards bats than females. About one-third of
respondents aggressively killed individuals of bats or damaged their roosts; and a comparable
number also reported that bats had no value to people. Although the locals recounted that bats
were valuable in the dispersal of cashew nut seeds, majority of them also associated bats with
the damage of mangos and cashew nuts fruits cultivated by the farmers.

124
9.2 General discussion
In this study, farmland around ASF had more bat species than the forest interior. In addition,
bats were more abundant in the farmland than in the interior of ASF. The responses of bat
species to habitat disturbance is unclear: abundances of some species may increase, decrease,
or remain unaffected (Aguirre et al., 2003; Willig et al., 2007). The findings of this study are
consistent with Heer et al. (2015), who found high diversity of bats in intensively used rubber-
cacao plantation in Brazil despite the shortage of resources for bats. In addition, highly
degraded forests that had been logged many times in Borneo had little effects on bat species
richness (Struebig et al., 2013). However, the results of the current study contrasts those of
Webala et al. (2019b), who recorded low bat species richness and abundance at Malava forests,
which was more disturbed, than in the interior of less disturbed and well conserved Buyangu
forest fragment of Kakamega forest. However, due to the use of ground level mist-nets, and
the ability of echolocating bats to detect the presence of these nets and avoid them (Kunz and
Kurta, 1988; Murray et al., 1999; Ratcliffe et al., 2005), the forest interior bat assemblage may
have been undersampled.
The activity of insectivorous and mist-netted bats (insectivorous and fruits bats) was higher in
the farmland than in the interior of the forest (ASF). This suggests that the farmland was highly
used by bats for either flying or foraging. In Los Tuxtlas, in south-eastern Veracruz, Mexico,
Estrada et al. (2004), recorded a higher bat activity in agricultural and human settled areas
than in interior of continuous forest in tropical rain forest habitats in this area. These
differences in bats assemblage and their activity patterns between the forest and the adjacent
farmland were possibly as a result of the marked differences in habitat structure and
availability of important resources (e.g. roosts, and fruit producing trees abundance,
accessibility to insectivorous prey) used by bats. A total of 13 active bat roosts were found in
the farmland. The availability of roosts in the farmland may also have contributed to higher

125
species richness and abundance in the farmland. Many of these roosts harbored large large bat
colonies of multi-species (e.g. Alibaba cave >million bats). The simulatenous flight of these
bats from their roosts at nightfall might have increased their capture rates and activity in the
farmland landscape.
The vegetation structure between adjacent farmland and forest interior was strickingly
different from each other. The percentage canopy and understory vegetation cover inside the
forest was more closed than that of the adjacent farmland. Thus individuals of bats had less
access to the forest floor, than the forest canopy. On the other hand the farmland landscape
was more open, and potentially provided many unhindered foraging and flying spaces.
Vegetation thickness (clutter) at ground level strongly influences bats abundance and species
composition (Marciente et al., 2015). It can also make foraging more complicated and increase
the energetic coast of flight (Aldridge and Rautenbach, 1987). This may explain the low
abundance and activity of bats inside ASF as opposed to the farmland. In addition, the
farmland had the largest number of trees producing fruits with soft pulp that are eaten by
frugivorous bats than the forest. The availability of food influences the distribution and
abundance of bats (Bernard and Fenton, 2003). The large numbers of fruit producing trees
(mangos, cashew nuts, neem) in the farmland, is the most reasonable explanation for the
numerous number of frugivorous bats that were found in this habitat. Frugivorous bats are
directly reliant on the geographical distribution of fruit producing plant species (Marciente et
al., 2015). Furthermore, farmland landscape around ASF, was not bare but had many actively
cultivated trees which provided suitable foraging and roosting habitat for the bats. The
biodiversity found in agricultural areas is critically enriched by the existence of trees (Fischer
et al., 2010). For example, foraging activity of bats is often higher near trees in open areas and
along the edges (Lumsden and Bennet, 2005).

126
Although the farmland had more insectivorous bat species (20 in farmland, 16 in ASF) and in
higher abundance (930 in farmland, 157 in ASF), the two habitats had similar invertebrate
prey abundance. Studies on effects of habitat disturbance on invertebrate abundance generate
mixed results in different types of habitat; in some resulting into decline, or no negative effect
at all. This study is consistent with the findings of Hovorka (1996) in southern Arizona, who
found cattle overgrazing on the vegetation, had no effects on the abundance of flying insects.
However, invertebrate densities tend to be high in cluttered habitats (Kalcounis and Brigham
(1995), and forest disturbance affects the composition of invertebrates (Bank et al., 2010).
Nonetheless, in a cluttered habitat like in the interior of ASF, although invertebrates may be
abundant, it is difficult for insectivorous bats to identify and capture them (Rainho et al., 2010;
Müller et al., 2012), possibly the reason there was higher insectivorous bat activity in the
farmland, which was more open, and may have facilitated foraging activity of bats.
The elderly and more educated people around ASF had more positive attitudes toward bats
than young and unschooled people. Studies have shown than educated people manifest more
positive attitudes toward animals (Kellert, 1980), and are likely to participate in conservation
efforts to save wildlife species (Kidegesho et al., 2007). The females around the study area
had more negative attitudes toward and more beliefs to cultural myths about bats than males,
while males showed more aggressive behaviour toward bats than females. The findings of the
current study are consisted with findings of Almeida et al. (2014), in Portugal who found that
female children had more negative attitudes toward animals than males. Some studies have
frequently shown that males are the main perpetrators of animal abuse than females (Flynn,
1999; Pagani et al., 2007). To change the attitudes toward bats among youths; illiterate,
females and male segment of population around ASF, there is need for sustained bat education
awareness. Even though, changing human behaviour is difficult (Zint et al., 2002), and wildlife
education awareness need to be undertaken for a long period of time, Bogner (1998) reported

127
that even a short out-door learning experience can have a positive influence on the future
environmental attitude of children.
9.3 Conclusion
Results of bat diversity study showed that; the farmland was richer in bat species richess than
the interior of ASF. In addition, fruit and insectivorous bats were more common in the
farmland than in the ASF. Thus, the finding of this section of study resulted in rejection of the
null hypothesis initially stated as; the interior of ASF and farmland would have the same bat
species richness, because bats are highly mobile.
Results of bat activity study showed that; activity of mist-nettted and accoustic monitored bats
was higher in the farmland than in the interior of ASF. Bats were more active immediately
after nightfall, activity declined to lowest between 1.00-2.00am, followed by a slight increase
at dawn (4.00-5.00am). This pattern of activity was the same in the interior of ASF and in the
farmland. These findings resulted in acceptance of null hypothesis of this section of the study
stated as; the farmland and interior of ASF would have the same pattern of bat activity.
Results of habitat structure and fruit trees resources showed that; the interior of ASF was
dominated by indigenous trees typical of the coastal forest, while the farmland was covered in
actively cultivated exotic trees. Many trees producing fruits which are eaten by fruit bats
occurred in the farmland (385) than in the ASF (166). The understorey and canopy cover was
higher in ASF than in the farmland. These differences in habitat structure and fruit tree
producing plants influenced the abundance of bat species in ASF (19 spp, and 890 bat
captures) and in the farmland (25 spp, and 4327 bat captures). These findings resulted in the
rejection of the null hypothesis of this section of the study stated as; highly cluttered habitats

128
and those with higher abundance of fruit trees resources would have similar bat species
diversity and abundance.
Results of insectivorous bats prey abundance study showed that; prey abundance was the
same in both in ASF (3168 invertebrates) and in the farmland (3381). These results,
supported the stated null hypothesis of this section of the study.
Results of human-bat interactions study around ASF showed that; the aged had more
positive attitudes toward bats than young people. In addition the females held more negative
attitudes to bats than males. These findings resulted in the rejection of the null hypothesis of
this section of the study initially stated as; there are would be no differences in the attitudes
and perceptions about bats between gender and age groups of local people in the study area.
To conclude, although the farmland habitat around ASF was highly degraded than the well
protected forest, it was still heavily used by bats, which emphasises the value of this ignored
habitat in biodiversity surveys for conservation of bats, especially in the study area. Thus,
there is a need to work with local people around ASF, to encourage them to maintain the
current habitat conditions of their cultivated farms, in order for them to continue to support
bat populations in the long run. The local people around ASF had negative attitudes towards
bats and their roosts. This can be mitigated by enhancing bat conservation education among
local people around ASF.

129
9.4 Recommendations
Further study
Further research is recommended in the following areas with a view to increasing our
understanding of bat biodiversity in and around ASF;
1. Mapping of echolocation calls of insectivorous bat species: the current study used
Patterson heterodyne D240 detector to monitor bat activity, but it was not possible
to identify the call to species. Therefore, there is a need to map the calls of the
insectivorous bat species using a either Pettersson D500x or SM4BAT bat
detectors, which allows for identification of bats using calls, and also would
improve our understanding of which bat species uses which habitat type.
2. Movement ecology of bats: There is need to attach transmitters to some
insectivorous and fruit bat species in the study area. This would improve our
understanding about foraging areas and range of some species, whether they switch
roosts at night, and types of roosts they use habitually.
3. Seed dispersal and assessment of damage of cultivated fruits by fruit bats: About
57 % of 394 respondents reported that fruits bats in the study area were useful in
dispersals of cashew nuts and guava seeds. Moreover, 66% of the people
interviewed associated frugivorous bats in the damage of fruits cultivated by
farmer. A follow-up study is required to assess the diversity of seeds dispersed,
their quantities, and by which bats, as well as quantify the amount of mangos
damaged by fruit bats compared to that harvested and eaten locally or sold by
landowners.

130
4. Monitor population trends of fruit bats: There was high fluctuation in seasonal
abundance of fruit bats in each month surveyed, with farmland having high
abundance throughout the sampling period than the forest interior. The factors
driving these fluctuations were unclear but are suspected to be influenced by either
local fruit abundance or local migration. There is need to monitor population
fluctuations of fruit bats around ASF and investigate factors which influence their
population turnover annually.
Conservation actions
The following recommendations to enhance the conservation of habitat and species would
ensure that bats are able to survive in and around ASF in the long run;
1. Establish a functioning coconut, mango and cashew nut trees sales and value chain:
The farmland around ASF were dominated by mango, cashew nut and coconut trees
which were the main sources of income and food to owners. The farmers depended on
middle men, who exploited them with low prices, since there was no organised
marketing chain dealing with the buying and sale of these fruits. As results many fruit
trees were not properly taken care of; were growing in fallow land infested with weeds,
some were aging and others were in the process of slow death in other farms,
supposedly due to the minimal economic benefits derived from the trees. Failure to
establish an organized functioning fruits sale and value chain may eventually lead to
loss of many cultivated trees or lack of interests to cultivate new trees, which will be a
loss of essential habitat which sustain large population and species of bats around ASF.
2. Enhance bat conservation awareness and protection of bat roosts: The eastern part of
ASF had many bat roosts, especially the large coral limestone caves which had
multiple bat species. However, these roosts occurred in private land and were highly

131
prone to destruction. Thus, there is need to work with the local land owners, and local
wildlife conservation organizations like AROCHA Kenya and Kenya Wildlife Service
to manage these roosts, and promote their protection by local people nd the
government. More awareness is also required especially to illiterate, adult males,
youths and females in order to improve their understanding about the value of bats to
the environment, in order reduce their fear toward them which fuel persecution of these
animals.
Management and policy actions
To enhance the long term conservation of bats in Kenya, and improve the livelihood of
communities around ASF and coastal areas in generals the following policy managements
actions are recommended;
1. Develop policy to map, protect and conserve bat roosts: Kenya has a large network of
wildlife conservation areas, but none of these areas was set aside principally to
conserve bats biodiversity. Many bat roosts (caves) that occur outside the protected
host large assemblages of bat species, yet they are not protected by law. Therefore,
there is need to develop policy guidelines on bats conservation in Kenya, by first
mapping roosts, their conservation status and implementation of active management
strategy. This will help save the currently remaining bat caves, as well as ensure that
they will not be converted to other land uses which are incompatible to bat
conservation.
2. Develop policy to enhance the farming of coconut, mango and cashew trees: Like
coffee and tea in central and western Kenya, coconut, mango and cashew trees are cash
crops, which if well managed can improve the economic status of coastal people in

132
Kenya. However, there is need for a government policy framework as well as an
injection of capital to enhance the production and sale of these fruit tree crops. This
policy would improve the income of local farmers, and planting of new trees and
improved care of the existing trees. The existence of these trees in the farmland, would
continue to provide vegetation cover for bat roosts as well as fruit resources to
frugivorous bats.

133
10.0 REFERENCES
Adams, A. M., McGuire, L. P., Hooton, L. A. and Fenton, M. B. (2015). How high is high?
Using percentile thresholds to identify peak bat activity. Canadian Journal of Zoology 93:
307-313.
Adams, M. D., Law, B. S., and French, K. O. (2009). Vegetation structure influences the
vertical stratification of open- and edge-space aerial-foraging bats in harvested forests. Forest
Ecology and Management 258: 2090-2100.
Aguiar, A. P. and Santos, B. F. (2010). Discovery of potent, unsuspected sampling disparities
for Malaise and Mo¨ricke traps, as shown for Neotropical Cryptini (Hymenoptera,
Ichneumonidae). Journal of Insect Conservation 14: 199–206.
Aguiar, L. and Marinho-Filho, J. (2004). Activity patterns of nine phyllostomid bats in a
fragment of the Atlantic Forest in southeastern Brazil. Revista Brasileira De Zoologia-Rev
Bras Zool. 21. 10.1590/S0101-81752004000200037.
Ajzen, I. (1991). The theory of planned behavior. Organic Behavior of Human Decision
Processes 50: 179-211.
Ajzen, I. and Fisbein, M. (1980). Understanding attitudes and predicting social behavior.
Prentice-Hall. Englewood Cliffs, New Jersey, USA.
Aldridge, H. D. and Rautenbach, I. L. (1987). Morphology, echolocation and resource
partitioning in insectivorous bats. Journal of Animal Ecology 56: 763-778.
Allocati, N., Petrucci, A. G., Di Giovanni, P., Masulli, M., Di Ilio, C., and De Laurenzi, V.
(2016). Bat-man disease transmission: zoonotic pathogens from wildlife reservoirs to human
populations. Cell Death Discovery 2(1):16048. doi: 10.1038/cddiscovery.2016.48.
Almeida, A., Vasconcelos, C. and Strecht-Ribeiro, O. (2014). Attitudes toward Animals: A
Study of Portuguese Children. Anthrozoos 27: 173-190.
Altringham, J. D. (1998). Bats: biology and behaviour. Oxford University Press. Oxford, UK.
Anti, P., Michael, O., Olivia, A., Augustina, A., Ebenezer, K. B., Nkrumah, E. E., Marco, T.,
Oppong, S., Adu-Sarkodie, Y. and Drosten, C. (2015). Human–Bat Interactions in Rural
West Africa. Emerging Infectious Diseases 21(8): 1418-1421.
Alves, R. R. N., Silva, V. N. S., Trovao, D. M. B. M., Oliveira, J. V., Mourao, J. S. and Dias,
T. L. P. (2014). Students’ attitudes towards and knowledge about snakes in the semiarid region
of Northeastern Brazil. Journal of Ethnobiology and Ethnomedicine 10: 30.
https://doi.org/10.1186/1746-4269-10-30.
Anthony, E. L. P. and Kunz, T. H. (1997). Feeding strategies of the little brown bat, Myotis
lucifugus, in southern New Hampshire. Ecology 58: 775-786.
Arabuko-Sokoke Forest Management Team (ASFMP (2002). Arabuko-Sokoke forest strategic
forest management plan 2002–2007. Arabuko-Sokoke Forest Management Team: Forest
Department and Partners, Nairobi.

134
Arlettaz R. (1999). Habitat selection as a major resource partitioning mechanism between the
two sympatric sibling bat species Myotis myotis and Myotis blythii. Journal of Animal Ecology
68: 460-471.
Arlettaz, R., Perrin, N. and Hausser J. (1997). Trophic resource partitioning and competition
between the two sibling bat species Myotis myotis and Myotis blythii. Journal of Animal
Ecology 66: 897-991.
Ayensu E. S. (1974). Plant and Bat Interactions in West Africa. Annual Missouri Botanical
Garden 61(3): 702-727.
Banks, J. E., Jackson, J., Hannon, L. M., Thomas, C. M., Baya, A. and Njoroge, L. (2010).
The cascading effects of elephant presence ⁄absence on arthropods and an Afrotropical thrush
in Arabuko-Sokoke Forest, Kenya. African Journal of Ecology 48: 1030-1038.
Banyard, A., Hayman, D., Freuling, C., Müller, T., Fooks, A. and Johnson, N. (2013). Bat
Rabies. 10.1016/B978-0-12-396547-9.00006-7.
Barclay, R. M. R. (1985). Foraging strategies of tropical bat Scotophilus leucogaster.
Biotropica 17: 65-70.
Barlow, J., Lennox, G. D., Ferreira, J., Berenguer, E., Lees, A. C., Mac Nally, R., Thomson,
J. R., de Barros Ferraz, S. F., Louzada, J., Oliveira, V. H. F., Parry, L., de Castro Solar, R. R.,
Vieira, I. C. G., Aragão, L. E. O. C., Begotti, R. A., Braga, R.F., Cardoso, T. M., de Oliveira
Jr, R. C., Souza Jr, C. M., Moura, N. G., Nunes, S. S., Siqueira, J. V., Pardini, R., Silveira, J.
M., Vaz-de-Mello, F. Z., Veiga, R. C. S., Venturieri, A. and Gardner, T. (2016).
Anthropogenic disturbance in tropical forests can double biodiversity loss from deforestation.
Nature 535: 144-147.
Bayat, S., Geiser, F., Kristiansen, P. and Wilson, S.C. (2014). Organic contaminants in bats:
trends and new issues. Environment International 63: 40–52.
Beck, J., Brehm, G. and Fiedler, K. (2011), Links between the Environment, Abundance and
Diversity of Andean Moths. Biotropica 43: 208-217.
Beentje, H. J. (1994). Kenya trees, shrubs and lianas. National Museums of Kenya. Nairobi,
Kenya.
Bender, M.J., Castleberry, S.B., Miller, D.A. and Wigley, T.B. (2015). Site occupancy of
foraging bats on landscapes of managed pine forest. Forest Ecology and Management
336: 1-10.
Bennun, L.A. and Njoroge, P. (1999). Important bird areas in Kenya. Nature Kenya,
Nairobi-Kenya.
Bernard, E. 2001. Vertical stratification of bat communities in primary forests of Central
Amazon, Brazil. Journal of Tropical Ecology 17:115-126.
Bernard, E. and Fenton, B. (2003). Bat Mobility and Roosts in a Fragmented Landscape in
Central Amazonia, Brazil. Biotropica 35: 262-277.

135
BirdLife International (2012). A guide for monitoring climate change impacts of forest birds
in the albertine rift region. BirdLife International, African Partnership Secretariat. Nairobi,
Kenya.
Bjerke, T., Ostdahl, T. and Kleiven, J. (2003). Attitudes and activities related to urban wildlife:
pet owners and non-owners. Anthrozoos 16: 252-262.
Black, K. (2010). Business Statistics: Contemporary Decision Making 6th edition. John Wiley
and Sons. London.
Blake, J.G. and Loiselle, B.A. (2009). Species composition of Neotropical understory bird
communities: local versus regional perspectives based on capture data. Biotropica 41: 85–94.
Bobrowiec, P. E. D., Rosa, L. D. S., Gazarini, J. and Haugaasen, T. (2014). Phyllostomid bat
assemblage structure in Amazonian flooded and unflooded forests. Biotropica 46: 312-321.
Bogner, F.X. (1998). The influence of short term door ecology education on long term
variables of environmental perspective. Journal of Environmental Education 20: 17-29.
Bonaccorso, F. J., Winkelmann, J. R., Shin, D., Agrawal, C. I., Aslami, N., Bonney, C., Hsu,
A., Jekielek, P. E., Knox, A. K., Kopach, S. J., Jennings, T. D., Lasky, J. R., Menesale, S. A.,
Richards, J. H., Rutland, J. A., Sessa, A. K., Zhaurova, L. and Kunz, T. H. (2006). Evidence
for exploitative competition: comparative foraging behavior and roosting ecology of short-
tailed fruit bats (Phyllostomidae). Biotropica 39: 249-256.
Bonaccorso, F.J. (1979). Foraging and reproduction in a Panamanian bat community. Bulletin
of the Florida State Museum Biological Sciences 24:359-408.
Bongaarts, J. (1994). Population policy options in the developing world. Science 263:771-776.
Bourdeau, P.F. (1953). A test of random versus systematic ecological sampling. Ecology
34:499-512.
Bowden, J. (1982). An analysis of factors affecting catches of insects in light traps. Bulletin
of Entomological Research 72: 535-556.
Bradshaw, C. J. A., Sodhi, N. S. and Brook, B. W. (2009). Tropical turmoil: a biodiversity
tragedy in progress. Frontiers in Ecology and the Environment 7: 79-87.
Brigham, R. M., Grindal, S. D., Firman, M.C. and Morissette, J. L. (1997). The influence of
structural clutter on activity patterns of insectivorous bats. Canadian Journal of Zoology 75:
131-136.
Brikci, N. and Green, J. (2007). A guide to using qualitative research methodology. Medicine
Sans Frontiers, UK.
Brooks, T. M., Mittermeier, R. A., Mittermeier, C. G., Da Fonseca, G. A. B., Rylands, A. B.,
Konstant, W. R., Flick, P., Pilgrim, J., Oldfield, S., Magin, G. and Hilton-Taylor, C. (2002)
Habitat loss and extinction in the hotspots of biodiversity. Conservation Biology 16: 909-923.

136
Bryant, D.M., Ducey, M.J., Innes, J.C., Lee, T.D., Eckert, R.T. and Zarin, D.J. (2005). Forest
community analysis and the point-centered quarter method. Plant Ecology. 175. 193-203.
Bumrungsri S, Leelapaibul W, Racey PA. 2007. Resource Partitioning in Sympatric
Cynopterus bats in Lowland Tropical Rain Forest, Thailand. Biotropica 39(2): 241-248.
Burgess, N., Butynski, T., Gordon, I., Sumbi, P., Like, Q. and Watkin, J. (2003). East Arc
Mountains and Coastal Forest of Tanzania and Kenya Biodiversity Hotspots. Conservation
International. Washington DC. USA.
Campbell, D.T. (1955). The informant in quantitative research. The American Journal of
Sociology 60:339-342.
Castro-Arellano, I., Lacher, T. E., Willig, M. R. and Range, T. F. (2010). Assessment of
assemblage-wide temporal niche segregation using null models. Methods in Ecology and
Evolution 1: 311-318.
Ceríaco, L. M. P. (2012). Human attitudes towards herpetofauna: the influence of folklore and
negative values on the conservation of amphibians and reptiles in Portugal. Journal of
Ethnobiology and Ethnomedicine 8: 8-15.
Chao, A. 1987. Estimating the population size for capture-recapture data with unequal
catchability. Biometrics 43: 783-791.
Chung, A.Y. C., Eggleton, P., Speight, M. R., Hammond, P. M. and Chey, V. K. (2004). The
diversity of beetle assemblages in different habitat types in Sabah, Malaysia. Bulletin of
Entomological Research 90: 475-496.
Clayton, S. and Myers, O. E. (2015). Conservation psychology: understanding and promoting
human care for nature. Wiley-Blackwell. Chichester, UK.
Cleveland, C. J., Betke, M., Federico, P., Frank, J. D., Hallam, T. G., Horn, J., López, J. D.,
McCracken, G. F., Medellín, R. A., Moreno-Valdez, A., Sansone, C. G., Westbrook J. K. and
Kunz, T. H. (2006). Economic value of the pest control service provided by Brazilian free-
tailed bats in south-central Texas. Frontiers in Ecology and the Environment 4: 238-243.
Coleman, J. L. and Barclay, R. M. R. (2013). Prey availability and foraging activity of
grassland bats in relation to urbanization. Journal of Mammalogy 94(5): 1111-1122.
Colwell, R. K., Chao, A., Gotelli, N. J., Lin, S.-Y., Mao, C. X. R., Chazdon, R. L. and Longino,
J. T. (2012) Models and estimators linking individual-based and sample-based rarefaction,
extrapolation, and comparison of assemblages. Journal of Plant Ecology 5:3-21.
Cottam, G., Curtis, J.T. and Hale, B.W. (1953). Some sampling characteristics of a population
of randomly dispersed individuals. Ecology 34(4): 741-757.
Cottam, G. and Curtis, J. T. (1956). The use of distance measures in phytosociological
sampling. Ecology 37: 451-460.
CotterilL, F. P. D. and Ferguson, R. A. (1999). Reproductive ecology of Commerson’s leaf-
nosed bats Hipposideros com mersoni (Chiroptera: Hipposideridae) in South-Central Africa:

137
interactions between seasonality and large body size; and implications for conservation. South
African Journal of Zoology 34: 53-63.
Cox, P. A. (1983). Observations of natural history of Samoan bats. Mammalia 47: 519-23.
Daszak, P., Cunningham, A. and Hyatt, A. (2000). Emerging infectious diseases of wildlife -
threats to biodiversity and human health. Science 287: 443-448.
Dickman, A. J. (2010). Complexities of conflict: the importance of considering social factors
for effectively resolving human-wildlife conflict. Animal Conservation 20: 458-466.
Djossa, B. A., Toni, H. C., Adekanmbi, I. D., Tognon, F. K. and Sinsin, B. A. (2015). Do
flying foxes limit flower abortion in African baobab (Adansonia digitata)? Case study in
Benin, West Africa. Fruits 70(5): 281-287.
Dolisca, F., McDaniel J. M. and Teeter, L. D. (2007). Farmers’ perceptions towards forests:
A case study from Haiti. Forest Policy and Economics 9:704-712.
Drews, C. (2002). Attitudes, knowledge and wild animals aspects in Costa Rica. Anthrozoös
15:119-138.
Eagly, A. H. and Chaiken, S. (1993). The psychology of attitudes. Harcourt, Brace and
Jovanovich. San Diego, CA.
Eby, P. (1991). Seasonal movements of Grey-headed flying foxes, Pteropus poliocephalus
(Chiroptera: pteropididae), from two maternity camps in northern New South Wales. Wildlife
Research 18: 547-59.
Eckert, H. G. (1982). Ecological aspects of bat activity rhythms. In: Ecology of Bats (T. H.
Kunz, ed.). Plenum Press, New York-USA. Pp 201-242.
Eguiarte, L. C., Martinez D. R. and Arita H. (1987). El Nectary elPolen como Recursos: El
Papel Ecolo gico de los Visitantes a las Flores de Pseudobombax ellipticum (H.B.K) Dugand.
Biotropica 19: 74–82.
Emmons, L. H. and Feer, F. (1990). Neotropical rainforest mammals. University of Chicago
Press. Chicago-USA.
Entwistle, A. C., Racey, P. A. and Speakman, J. R. (1996). Habitat exploitation by a gleaning
bat, Plecotus auritus. Philosophical transactions of the Royal Society of London. Series B 351:
921–931.
Epstein, J. H., Olival, K., Pulliam, J., Smith, C., Field, H. and Daszak, P. (2009). Pteropus
vampyrus, a hunted migratory species with a multinational home-range and a need for regional
management. Journal of Applied Ecology 46: 991-1002.
Estrada-Villegas, S., Meyer, C. F. J. and Kalko, E. K. V. (2009). Effects of tropical forest
fragmentation on aerial insectivorous bats in a land-bridge island system Biological
Conservation 143: 597-608.

138
Estrada, C. G. and Damona, A., Hernandez, C. S., Pinto, L. S. and Nunez, G. I. (2006). Bat
diversity in montane rainforest and shaded coffee under different management regimes in
southeastern Chiapas, Mexico. Biological Conservation 132: 351-361.
Estrada, A., Jiménez, C., Rivera, A. and Fuentes, E. (2004). General bat activity measured
with an ultrasound detector in a fragmented tropical landscape in Los Tuxtlas, Mexico. Animal
Biodiversity and Conservation 27 (2): 1-9.
FAOSTAT. 2011. Food and Agriculture Organization of the United Nations. FAOSTAT.
FAO3. org. Accessed 18 April 2018.
FAO. 2011. Investigating the role of bats in emerging zoonoses: Balancing ecology,
conservation and public health interests. In: FAO Animal Production and Health Manual No.
12 (S.H. Newman, H.E. Field, C.E. de Jong and J.H. Epstein, eds). FAO, Rome.-Italy.
Fahr, J. and Kalko, E. K. V. (2011). Biome transitions as centres of diversity: habitat
heterogeneity and diversity patterns of West African bat assemblages across spatial scales.
Ecography 34: 177-195.
Fanshawe, J. H. 1993. The effects of selective logging on bird community of Arabuko-Sokoke
Forest, Kenya. PhD thesis. University of Oxford. Oxford.
Fenton, B. M., Cumming, D. H. M., Rautenbach, I. L., Cumming, G. S., Cumming, M. S.,
Ford, G., Taylor, R. D., Dunlop, J.,. Hovorka, M. D, Johnston, D. S., Portfors, C.V., Kalcounis,
M. C. and Mahlanga, Z. (1998). Bats and the loss of tree canopy in African woodlands.
Conservation Biology 12: 399-407.
Fenton, M. B., Rautenbach, I. L., Chipese, D., Cumming, M. B., Musgrave, M. K., Taylor, J.
S. and Volpers, T. (1993). Variation in foraging behavior, habitat use, and diet of large slit-
faced bats (Nycum grandis). Zeitschrift rur Saeugetierkunde 58: 65-74.
Fenton, M. B. (1992). Wounds and the origin of blood-feeding in bats. Biological Journal of
the Linnean Society 47: 161-171.
Fenton, M. B. (1990). The foraging behaviour and ecology of animal-eating bats. Canadian
Journal of Zoology 68: 411-422.
Fenton, M. B. and Rautenbach, I. L. (1986). A comparison of the roosting and foraging
behaviour of three species of African insectivorous bats. Canadian Journal of Zoology 64:
2860-2867.
Fenton, M. B. (1970). A technique for monitoring bat activity with results obtained from
different environments in southern Ontario. Canadian Journal of Zoology 48: 847-851.
Fischer, J., Zerger, A., Gibbons, P. and Law, B. S. (2010). Tree decline and the future of
Australian farmland biodiversity. Proceedings of the National Academy of Sciences of the
United States of America 107(45): 19597-19602.
Fita, D. S., Neto, E. M. C. and Schiavetti, A. (2010). "Offensive" snakes: cultural beliefs and
practices related to snakebites in a Brazilian rural settlement. Journal of Ethnobiology and
Ethnomedicine 6: 1-13.

139
FitzGibbon, C.D., Mogaka, H. and Fanshawe, J.H. (1996). Subsistence hunting and mammal
conservation in a Kenyan coastal forest: resolving a conflict. In: Taylor V.J., Dunstone N.
(eds) The Exploitation of Mammal Populations. Springer, Dordrecht.
https://doi.org/10.1007/978-94-009-1525-1_10.
Flaquer, C., Torre, I. and Arrizabalaga, A. (2007). Comparison of sampling methods for
inventory of bat communities. Journal of Mammalogy 88(2):526-533.
Flynn, C. F. (1999). Animal abuse in childhood and later support for interpersonal violence
in families. Society and Animals 7(2): 161-172.
Forina, M., Armanino, C., Lanteri, S. and Leardi, R. (1989). Methods of varimax rotation in
factor analysis with applications in clinical and food chemistry. Journal of Chemometrics 3:
115-125.
Foley, J. A., Defries, R., Asner, G. P., Barford, C., Bonan, G., Carpenter, S. R., Chapin, F. S.,
Coe, M. T., Daily, G. C., Gibbs, H., Helkowski, J. H., Holloway, T., Howard, E. A., Kucharik,
C. J., Monfreda, C., Patz, J. A., Prentice, C., Ramankutty, N. and Snyder. P. K. (2005). Global
consequences of land use. Science 309: 570–574.
Ford, W. M., Menzel, J. M. A., Rodrigue, L., Menzel, J.M. and Johnson J. B. (2005). Relating
bat species presence to simple habitat measures in a central Appalachian forest. Biological
Conservation 126: 528-539.
Frick, W.F. (2013). Acoustic monitoring of bats, considerations of options for long-term
monitoring. Therya 4(1): 69-78.
Fry, R. and Waring P. (2001). A guide to moth traps and their use. The Amateur Entomologists’
Society 24: 1-68.
Fuentes-Montemayor E., Goulson, D., Cavin, L., Wallace, J. M. and Park, K. J. (2012). Factors
influencing moth assemblages in woodland fragments on farmland: implications for woodland
creation and management schemes. Biological Conservation 153: 265-275.
Fukui, D., Okazaki, K. and Maeda, K. (2009). Diet of three sympatric insectivorous bat species
on Ishigaki Island, Japan. ESR 8: 117-128.
Garcia, G.S.C. (2006). The mother-child nexus: knowledge and valuation of wild food plants
in Wayanad, Western ern Ghats, India. Journal of Ethnobiology and Ethnomedicine 2:39-50.
Godambe, V.P. (1982). Estimation in survey sampling: robustness and optimality. Journal of
the American Statistical Association 77:393-403.
Goodman, S. M., Andriafidison, D., Andrianaivoarivelo, R., Cardiff, S. G., Ifticene, E.,
Jenkins, R. K. B., Kofoky, A. F., Mbohoahy, T., Rakotondravony, D., Ranivo, J.,
Ratrimomanarivo, F., Razafimanahaka, J. and Racey, P.A. (2005). The distribution and
conservation of bats in the dry regions of Madagascar. Animal Conservation 8: 153-165.
Griffin, D. R. (1958). Listening in the dark: the acoustic orientation of bats and men. Yale
University Press, New Haven-USA.

140
Gunnell, G. and Simmons, N. (2005). Fossil Evidence and the Origin of Bats. Journal of
Mammalian Evolution 12: 209-246.
Habel, J. H., Casanova, I. C. C., Zamora, C., Teucher, M., Hornetz, B., Shauri, S., Mulwa, R.
M,. and Lens, L. (2017). East African coastal forest under pressure. Biodiversity and
Conservation doi: 0.1007/s10531-017-1375-z
Hadjisterkotis, E. (2006). The destruction and conservation of the Egyptian fruit bat Rousettus
aegyptiacus in Cyprus: a historic review. Eurasian Journal of Wildlife Research 52: 282-287.
Hammer, Ø., Harper, D. A. T. and Ryan, P. D. (2001) PAST: Paleontological Statistics
Software package for education and data. http://palaeo-
electronica.org/2001_1/past/issue1_01.htm [accessed 27th January 2017].
Hansen, D. M., Kaiser, C. N. and Muller, C. B. (2008). Seed dispersal and establishment of
endangered plants on oceanic islands: the Janzen-Connell Model, and the use of ecological
analogues. PLoS One 3: 1-13.
Happold, M. and Happold, D. C. D. (eds) 2013. Mammals of Africa. Volume IV: Hedgehogs,
Shrews and Bats. Bloomsbury Publishing, London.
Harvey, C. A., Medina, A., Sanchez, D. M., Vilchez, S., Hernandez, B. Saenz, J. C., Maes, J.
M., Casanoves, F. and Sinclair, F. L. (2006) Patterns of animal diversity in different forms of
tree cover in agricultural landscapes. Ecological Applications 16(5):1986-1999.
Hayes, J. P., Ober, H. K. and Sherwin, R. E. (2009). Survey and monitoring of bats. In: The
ecological and behavioral methods for the study of bats (T. H. Kunz and Parsons, S. eds.).
The John Hopkins University Press, Baltimore, Maryland-USA. Pp 112-132.
Heer, K., Helbig-Bonitz, M., Fernandes, R. G, Mello, M. A. R., Kalko, K. V. (2015). Effects
of land use on bat diversity in a complex plantation-forest landscape in northeastern Brazil.
Journal of Mammalogy 96(4):720-731.
Henry, M., Barriere, P., Gautier-Hion, A. and Colyn, M. (2004). Species composition,
abundance and vertical stratification of a bat communnity (Megachiroptera: Pteropodidae) in
a West African rain forest. Journal of Tropical Ecology 20: 21-29.
Higgins, K. F., J. L. Oldemeyer, K. J. Jenkins, G. K. Clambey, and R. F. Harlow. 1996.
Vegetation sampling and measurement. In: Research and Management Techniques for
Wildlife and Habitats (T. A. Bookhout, Ed.). Wildlife Society, Bethesda, Maryland-USA. Pp
567–591.
Hill, J. E. and Smith, J. D. (1984). Bats. A Natural History, British Museum (Natural
History), London.
Hillebrand, H. (2004). On the generality of the latitudinal diversity gradient. American
Naturalist 163(2):192-211.

141
Hodgkison, R., Balding, S. T., Zubaid, A. and Kunz, T. H. (2004). Habitat structure, wing
morphology, and the vertical stratification of Malaysisan fruit bats (Megachiroptera:
Pteropodidae). Journal of Tropical Ecology 20: 667-673.
Holyoak, M., Jarosik, V. and Novak, I. (1997). Weather-induced changes in moth activity bias
measurement of long-term population dynamics from light trap samples. Entomologia
Experimentalis et Applicata 83: 329-335.
Hosaka, T., Niino, M., Kon, M., Ochi, T., Yamada, T, Fletcher, C. D. and Okuda, T. (2014)
Impacts of smallscale clearings due to selective logging on dung beetle communities.
Biotropica 46: 720-731.
Hovorka, M. D. (1996). The impacts of livestock grazing on Sonoran desert scrub
vegetation, insect, and insectivorous bat communities. Master’s thesis, York University,
North York, Ontario, Canada.
Humes, M. L., Hayes, J. P., Collopy, M. W. (1999). Bat activity in thinned, unthinned, and
old-growth forests in western Oregon. Journal of Wildlife Management 63: 553-561.
IUCN (2019) Mammals. IUCN Red List of Threatened Species. Version 2012.2.
http://www.iucnredlist.org/initiatives/mammals [accessed 27th January 2019].
Jackson, H. W. C., Ochieng, J., Musila, S., Navarro, R. and Kanga, E. (2019). A Checklist of
the Mammals of Arabuko-Sokoke Forest,
Kenya. https://doi.org/10.15468/gn9igx [Accessed 25th April 2019].
Jennings, S. B., Brown, N. D., and Sheil, D. (1999). Assessing forest canopies and understorey
illumination: canopy closure, canopy cover and other measures. Forestry 72(1): 59-73.
Jones, G. and Rydell, J. (1994). Foraging strategy and predation risk as factors influencing
emergence time in echolocating bats. Philosophical Transactions of the Royal Society of
London, Series B 346: 445–455.
Jung, K. and Threlfall C. G. (2016). Urbanisation and its effects on bats-a global meta-
analysis. In: Bats in the Anthropocene: conservation of bats in a changing world (C. C. Voigt
and T. Kingston, eds). Springer International AG, New York-USA. Pp 13-33.
Kalcounis, M. C. and Brigham, R. M. (1995). Intraspecific variation in wing-loading affects
habitat use by little brown bats (Myotis lucifogus). Canadian journal of Zoology 73: 89-95.
Kalko, E. K. V., Handley, C. O., Handley, D. (1996). Organization, diversity, and long term
dynamics of a neotropical bat community. In: Long term studies in vertebrate communities
(M. Cody and J. Smallwood, eds). Academic Press, Washington-USA. Pp 503-553.
Kaltenborn, B. P., Bjerke, T., Nyahongo, J. W. and Williams, D. R. (2006). Animal
preferences and acceptability of wildlife management actions around Serengeti National Park,
Tanzania. Biodiversity and Conservation 15: 4,633–4,649.
Kamins, A. O., Restif, O., Ntiamoa-Baidu, Y., Suu-Ire, R., Hayman, D. T. S. Cunningham,
A. A., Wood, J. L. N. and Rowcliffe, J. M. (2011). Uncovering the fruit bat bushmeat

142
commodity chain and the true extent of fruit bat hunting in Ghana, West Africa. Biological
Conservation 144: 3000-3008.
Kellert, S. R. (1996). The Value of Life; Biodiversity and Human Society. Island Press.
Washington DC.
Kellert, S. R. (1980). Phase II: Activities of the American public relating to animals. New
York: United States Department of the Interior Fish and Wildlife Service.
Kelsey, M. G. and Langdon, T. E. S. (1984). The conservation of Arabuko-Sokoke Forest.
International Council for Bird Preservation (ICBP Study Report No. 4). Cambridge-UK.
Khadijah A. R., Azidah A. A. and Meor S. R. (2013). Diversity and abundance of insect
species at Kota Damansara Community Forest Reserve, Selangor. Scientific Research and
Essays 8: 359-374.
Khan, H. A. A., Akram. W., Shad S. A., Razaq, M., Naeem-Ullah, U., and Zia, K. (2013). A
cross sectional survey of knowledge, attitude and practices related to house flies among dairy
farmers in Punjab, Pakistan. Journal of Ethnobiology and Ethnomedicine 9:1-10.
Kideghesho, J., Røskaft, E., and Kaltenborn, B. (2007). Factors influencing conservation
attitudes of local people in Western Serengeti, Tanzania. Biological Diversity and
Conservation 16: 2213-2230.
Kleiven, J., Bjerke, T. and Kaltenborn, B. P. (2004). Factors influencing the social
acceptability of large carnivore behaviours. Biodiversity of Conservation 13: 1647-1658.
Kofoky, A. F., Andriafidison, D., Ratrimomanarivo, F. H., Razafimanahaka, J. H.,
Rakotondravony, D., Racey, P. A. and Jenkins R. K. B. (2007). Habitat use, roost selection
and conservation of bats in Tsingy de Bemaraha National Park, Madagascar. Biodiversity
Conservation 16 (4): 1039-1053.
Koopman, K. F. (1984). Bats. In: Orders and families of recent mammals of the World (S.
Anderson and J.K. Jones Jr., eds). John Wiley and sons, New York. Pp. 145-186.
Koopman, K. F. (1993). Chiroptera. In: Mammalian species of the world, 2nd Edition.
Smithsonina Institution Press, Wahsington, D.C-USA. Pp. 137-241.
Korine, C., Izhaki, I. and Arad, Z. (1999). Is the Egyptian fruit bat Rousettus aegyptiacus a
pest in Israel? An analysis of the bat’s diet and implications for its conservation. Biological
Conservation 88: 301-306.
Kühnert, E., Schönbächler, C., Arlettaz, R. and Christe, P. (2016). Roost selection and
switching in two forest-dwelling bats: implications for forest management. European Journal
of Wildlife Research 62: 497-500.
Kunz, T. H., Braun, de T. E., Bauer, D., Lobova, T. and Fleming, T. (2011). Ecosystem
services provided by bats. Annals of the New York Academy of Sciences 1223. 1-38.

143
Kunz, T.H., Hodgkison, R. and Weise, C.D. (2009) Methods for capturing and handling bats.
In: Kunz, T.H., Parsons, S., editors. Ecological and behavioral methods for the study of bats.
Baltimore: The Johns Hopkins University Press. 5-35.
Kunz, T. H. and Lumsden, L. F. (2003). Ecology of cavity and foliage roosting bats. In: Bat
ecology (T. H. Kunz and M. B. Fenton, eds). University of Chicago Press, Chicago-USA. Pp
3-90.
Kunz, T. H., Tidemann, C. R. and Richards, G. C. (1996). Small volant mammals. In:
Measuring and monitoring biological diversity: standard methods for mammals (D. E. Wilson,
F. R. Cole, J. D. Nichols, R. Rudran and M. S. Foster, eds). Smithsonian Institution Press,
Washington D.C-USA. Pp 122-146.
Kunz, T. H., Whitaker, J. O. Jr. and Wada-Roll, M. D. (1995). Dietary energetics of the
Mexican free-tailed bat (Tadarida braziliensis) during pregnancy and lactation. Oecologia
101: 407-415.
Kunz, T. H. and Pierson, E. D. (1994). Bats of the world: an introduction. In: Walker’s Bats
of the World (R. M. Nowak, ed.) The John Hopkins University Press, Baltimore-USA. Pp. 1-
46.
Kunz, T.H. and Kurta, A. (1988). Capture methods and holding devices. In: Ecological and
behavioral methods for the study of bats (T.H. Kunz and S. Parsons, eds.).. The Johns Hopkins
University Press, Baltimore-USA. Pp 1-29.
Kunz, T. H. and Brock, C. E. (1975). Comparison of mist-nets and ultrasonic device detectors
for monitoring flight activity of bats. Journal of Mammalogy 56(4): 907911.
Kurta, A., Bell, G.P., Nagy, K.A. and Kunz, T.H. (1989). Energetic of pregnancy and lactation
in free-ranging little brown bats (Myotis lucifugus). Physiological Zoology 62(3): 804-818.
Lacki, M. J., Hayes, J. P. and Kurta, A. (2007). Bats in forests: Conservation and management.
John Hopkins University. Baltimore, MD.
Lang, A. B., Kalko, E. K. V., Romer, H., Bockholdt, C. and Dechmann, D. K. N. (2006).
Activity levels of bats and katydids in relation to the lunar cycle. Oecologia 146: 659-666.
Lange, C. N. (2003). Environmental factors influencing land snail diversity patterns in
Arabuko-Sokoke Forest, Kenya. African Journal of Ecology 41: 352-355.
Larsen, R. J., Boegler, K. A., Genoways, H. H., Masefield, W. P., Kirsch, R. A. and Pedersen,
S.C. (2007). Mist netting bias, species accumulation curves, and the rediscovery of two bats
on Montserrat (Lesser Antilles). Acta Chiropterologica 9(2): 423-435.
Laurance, W.F. (1999). Laurance, W.F. Reflections on the tropical deforestation crisis.
Biological Conservation 91: 109-117.
Law, B. and Chidel, M. (2002). Tracks and riparian zones facilitate the use of Australian
regrowth forest by insectivorous bats. Journal of Applied Ecology 39: 605-617.

144
Li, S., Long, C., Liu, F., Lee, S., Guo, Q., Li, R. and Liu. Y. (2006). Herbs for medicinal
baths among the traditional Yao communities of China. Journal of Ethnopharmacology
108:59-67.
Loeb, S. C. and O’Keefe J.M. (2006). Habitat use by forest bats in South Carolina in relation
to local, stand, and landscape characteristics. Journal of Wildlife Management 70:1210-1218.
Lobova, T. A., Mori, S. A., Blanchard, F., Peckham, H. and Charles-Dominique, P. (2003)
Cecropia as a food resource for bats in French Guiana and the significance of fruit structure
in seed dispersal and longevity. American Journal of Botany 90: 388-403.
López-Baucells, A., Rocha, R., Webala, P.W., Nair, A., Uusitalo, R., Sironen, T. and Forbes,
K.M. (2016). Rapid assessment of bat diversity in the Taita Hills Afromontane cloud forests,
south-eastern Kenya. Barbastella 9:1-10.
López-Baucells, A., R. Rocha, Z. Andriatafika, T. Tojosoa, J. Kemp, K.M. Forbes and M.
Cabeza. 2017. Roost selection by synanthropic bats in rural Madagascar: what makes non-
traditional structures so tempting? Hystrix, Journal of Mammalalogy 28: 28–35.
Lovett, J. C. and Wasser, S.K., eds (1993). Biogeography and Ecology of the Rain Forests of
Eastern Africa. Cambridge University Press. Cambridge-UK.
Lumsden, L.F. and Bennett, A.F. (2005). Scattered trees in rural landscapes: foraging habitat
for insectivorous bats in south-eastern Australia. Biological Conservation 122: 205-222.
Luskin, M. S. (2010). Flying Foxes Prefer to Forage in Farmland in a Tropical Dry Forest
Landscape Mosaic in Fiji. Biotropica 42(2): 246-250.
MacKenzie, D. I., Nichols, J. D., Royle, J. A., Pollock, K. H., Bailey, L.L. and Hines. J. E.
(2006). Occupancy estimation and modelling: inferring patterns and dynamics of species
occurrence. Academic Press. Burlington, MA.
MacKenzie, D. I. (2005). What are the issues with presence-absence data for wildlife
managers? Journal of Wildlife Management 69: 849-860.
MacSwiney, M. C., Clarke, F. M. and Racey, P. A. (2008). What you see is not what you get:
the role of ultrasonic detectors in increasing inventory completeness in Neotropical bat
assemblages. Journal of Applied Ecology 45: 1364-1371.
Marciente, R., Bobrowiec, P. E. D. and Magnusson, W. E. (2015). Ground-Vegetation Clutter
Affects Phyllostomid Bat Assemblage Structure in Lowland Amazonian Forest. PLoS ONE
10(6): e0129560. doi:10.1371/journal.pone.0129560.
Marshall, A.G. (1983). Bats, flowers and fruit: evolutionary relationships in the old world.
Biological Journal of the Linnean Society 20:115-135.
Mason, W. R. M. and Huber, J. T. (1993). Chapter 2 Order Hymenoptera in: Hymenoptera of
the world: An identification guide to families (H. Goulet and JT Huber, eds). Centre for Land
and Biological Resources Research Ottawa, Ontario. Pg 14-56.

145
Mayen, F. (2003). Haematophagous bats in Brazil, their role in rabies transmission, impact on
public health, livestock industry and alternatives to an indiscriminate reduction of bat
population. Journal of Veterinary Medicine 50: 469-472.
McDonald, M.A., Hofny-Collins, A., Healey J.R. and Goodland, T.C.R. (2003). Evaluation
of trees indigenous to the montane forest of the Blue Mountains, Jamaica for reforestation
and agroforestry. Forest Ecology and Management 175:379-401.
McWilliam, A. N. (1987). Territorial and pair behaviour of the African false vampire bat,
Cardioderma cor (Chiroptera: Megadermatidae), in coastal Kenya. Journal of Zoology 213:
243-252.
McCracken, G. F., Westbrook, J. K., Brown, V.A., Eldridge, M., Federico, P. and Kunz, T. H.
2012. Bats track and exploit changes in insect pest populations. PLoS One. 7:e43839.
Medellı´n, R. and Gaona, O. (1999). Seed dispersal by bats and birds in forest and disturbed
habitats in Chiapas, Mexico. Biotropica 31: 478-485.
Medellı´n, R.A. (1993). Estructura y diversidad de una comunidad de murcie´lagos en el
tro´pico hu´medo mexicano. In: R. A. Medellı´n and G. Ceballos, eds. Avances en el Estudio
de los Mamı´feros de Me´xico. Publicaciones Especiales. Asociacio´n Crisci, J. V., and M.
Mexicana de Mastozoologı´a, A.C., Me´xico, D.F., Mexico. Pp. 333-354
Menon, V. and Lavigne, D. 2006. Attitudes, values and objectives: the real basis of wildlife
conservation. In: Lavigne DM (ed) Gaining ground: In pursuit of ecological sustainability.
International Fund for Animal Welfare and University of Limerick, Guelph and Limerick, pp
173-189.
Merckx, T., Van Dongen, S., Matthysen, E. and Van Dyck, H. (2008) Thermal flight budget
of a woodland butterfly in woodland versus agricultural landscapes: an experimental
assessment. Basic and Applied Ecology 9: 433–442.
Meyer, C. F. J., Struebig, M., Willig, M. R. (2016). Responses of tropical bats to habitat
fragmentation, logging, and deforestation. In: Bats in the anthropocene: conservation of bats
in a changing world (C. C. Voigt and T. Kingston, eds). Springer International AG, New York-
USA. Pp 63-103.
Meyer, C. F. J., Schwarz, C. J. and Fahr, J. (2004). Activity patterns and habitat preferences
of insectivorous bats in a West African forest–savanna mosaic. Journal of Tropical Ecology
20: 397-407.
Miller-Butterworth, C. M., Murphy, W. J., O’Brien, S.J., Jacobs, D.S., Springer M.S. and
Teeling E.C. (2007). A Family matter: conclusive resolution of the taxonomic position of the
long-fingered bats, Miniopterus. Molecular Biology and Evolution 24 (7): 1553-1561.
Mitchell, K. (2007). Quantitative analysis by the point-centered quarter method. Hobart and
William Smith Colleges, Geneva and New York.
Mittermeier, R. A., Turner, W. R., Larsen, F. W., Brooks, T.M. and Gascon, C. (2009). Global
biodiversity conservation: the critical role of hotspots. In: Biodiversity hotspots-distribution

146
and protection of conservation priority areas (F. E. Zachos and J. C. Habel, eds). Springer,
New York-USA. Pp 230-321.
Mogaka, H. (1992). A Socio-economic Survey of Arabuko-Sokoke Forest, Kenya. Kenya
Indigenous Forest Conservation Project. Nairobi-Kenya.
Monadjem, A., P. J. Taylor, W. Cotterill and M. C. Schoeman. 2010a. Bats of southern and
central Africa: a biogeographic and taxonomic synthesis. Wits University Press,
Johannesburg. Pp. 596.
Morrison, M. L. (2001). A proposed research emphasis to overcome the limits of wildlife-
habitat relationship studies. Journal of Wildlife Management 65: 613-623.
Morisita, M. (1959). Measuring of interspecific association and similarity between
communities. Memoirs of the Faculty of Science, Kyushu University 3: 65-80.
Morisita, M. (1954). Estimation of population density by spacing method. Memoirs of the
Faculty of Science, Kyushu University 1:187-197.
Muchiri, M. N., Kiriinya, C. K. and Mbithi ,D. M. (2001). Forestry Inventory Report for the
Indigenous Forest in Arabuko-Sokoke Forest Reserve. Kenya Forestry Research Institute.
Nairobi, Kenya.
Müller, J., Mehr, M., Bässler, C., Fenton, B., Hothorn, T., Pretzsch, H., Klemmt, H-J. and
Brandl, R. (2012). Aggregative response in bats: Prey abundance versus habitat. Oecologia
169: 673-84.
Mueller-Dombois, D., Jacobi, J. and Daehler, C. (2008). Chapter 3. Vegetation. In:
Biodiversity assessment of tropical island ecosystems: PABITRA manual for interactive
ecology and management (D. Mueller-Dombois, K.W. Bridges, and C. Daehler, eds). Bishop
Museum Press, Honolulu, Hawai'i-USA: Pp. 17-48.
Musila, S., Webala, P. W., Syingi, R., Zuhura, A. and Rydell, J. (2019a). Bat roosting crisis
in Kenya. African Conservation Telegraph, 15(2).
Musila, S., Monadjem, M., Webala, P. W., Patterson, B. D., Hutterer, R, De Jong, Y.A.,
Butynski, T. M., Mwangi, G., Chen, Z-Z. and Jiang, X-L. (2019b). Zoological Research 40(1):
1–50, 2019 45.
Musila, S., Gichuki, N., Castro-Arellano, I. and Rainho, I. (2019c). Composition and
diversity of bat assemblages at Arabuko-Sokoke Forest and the adjacent farmlands, Kenya.
Mammalia 84(2): 121-135.
Musila S, Robert Syingi, Nathan Gichuki, Ivan Castro-Arellano. (2018a). Bat activity in the
interior of Arabuko-Sokoke Forest and adjacent farmlands in Kenya. Journal of Bat Research
and Conservation. Volume 11 (1) 2018. DOI: 10.14709/BarbJ.11.1.2018.05.
Musila, S., Prokop, P. and Gichuki, N. (2018b). Knowledge and Perceptions of, and
Attitudes to, Bats by People Living around Arabuko-Sokoke Forest, Malindi Kenya,
Anthrozoös 31:2, 247-262.

147
Musila, S. and Mbau, J. (2010). Proceedings of bat conservation awareness workshop for
representatives of community based organizations along the coastal strip (North and South)
in Kenya. National Museums of Kenya. Nairobi-Kenya.
Myers, N., Mittermeier, R., Mittermeier, G. C., Fonseca, G. and Kent, J. (2000). Biodiversity
hotspots for conservation priorities. Biodiversity hotspot for conservation priorities. Nature.
403. 853-8. 10.
Nag, A. and Nath, P. (1991). Effect of moon light and lunar periodicity on the light trap catches
of cutworm Agrotis ipsilon (Hufn.) moths. Journal of Applied Entomology 111: 358-360.
Neuweiler, G. (1989). Foraging ecology and audition in echolocating bats. Trends in Ecology
and Evolution 4: 160-166.
Norberg, U. M. and Rayner, J. M. V. (1987). Ecologicalmorphology and flight in bats
(Mammalia; Chiroptera): wing adaptations, flight performance, foraging strategy and
echolocation. Philosophical Transactions of the Royal Society B 316: 335-427.
Nudds, T. D. (1977). Quantifying the vegetation structure of wildlife cover. Wildlife Society
Bulletin 5:113-117.
Nunnaly, J. (1978). Psychometric Theory. McGraw-Hill. New York-USA.
O’farrell, M. J. and Gannon W. L. (1999) A comparison of acoustics versus capture techniques
for the inventory of bats. Journal of Mammalogy 80: 24-30.
Ongugo, P. O., Mogoi, J. N., Obonyo, E. and Oeba, V. O. (2008). Examining the roles of
community forest associations (CFAS) in the decentralization process of Kenyan forests. Paper
presented to the IASC Conference July 11–19, 2008. Cheltenham-England, UK.
Pacifici, K., Simons, T. R. and Pollock, K. H. (2008). Effects of Vegetation and Background
Noise on the Detection Process in Auditory Avian Point-count Surveys. The Auk 125(3):600–
607.
Pagani, C., Robustelli, F. and Ascione, F. R. (2007). Italian youths' attitudes toward, and
concern for, animals. Anthrozoös 20: 275-293.
Patriquin, K. J. and Barclay, R. M. R. (2003). Foraging by bats in cleared, thinned and
unharvested boreal forest. Journal of Applied Ecology 40: 646–657.
Patterson, B. D. and Webala, P. W. (2012). Keys to the bats (Mammalia: Chiroptera) of East
Africa. Life and Earth Sciences. Fieldiana: Life and Earth Sciences 6: 1-63.
Pavey, C. R., Burwell, C. J., Grunwald, J. E., Marshall, C. J. and Neuweiler, G. (2001). Dietary
benefits of twilight foraging by insectivorous bats. Hipposideros speoris. Biotropica 33:670-
681.
Plowright, R. K., Peggy, E., Peter, J. H., Ina, L. S., Westcott, D., Bryden, W. L., Middleton,
D., Reid, P. A., McFarlane, R. A., Martin, G., Tabor, G. M., Skerratt, L. F., Anderson, D. L.,
Crameri, G., Quammen, D., Jordan, D., Freeman, P., Wang, L.-F., Epstein, J. H., Marsh, G.

148
A., Kung, N. Y. and McCallum, H. (2017). Ecological dynamics of emerging bat virus
Spillover. Proceedings of the Royal Society B 282: 1-9.
Power, A. G. (2010). Ecosystem services and agriculture: tradeoffs and synergies.
Philosophical Transactions of the Royal Society B 365: 2959–2971.
Presley, S., Willig, R. M., Saldanha, N., Wunderle, Jr, J. and Castro-Arellano, I. (2009).
Reduced‐impact Logging has Little Effect on Temporal Activity of Frugivorous Bats
(Chiroptera) in Lowland Amazonia. Biotropica 41. 10.1111/j.1744-7429.2008.00485.x.
Prokop, P. and Fančovičová, J. (2016). Mothers are less disgust sensitive than childless
females. Personality and Individual Differences 96: 65-69.
Prokop, P. and Kubiatko, M. (2014). Perceived vulnerability to disease predicts environmental
attitudes. Eurasia Journal of Mathematics, Science and Technology Education 10: 3-11.
Prokop, P. and Fančovičová, J. (2012). Tolerance of amphibians in Slovakian people: A
comparison of pond owners and non-owners. Anthrozoös 25: 277–288.
Prokop, P., Tolarovičová, A., Camerik, A. and Peterková, V. (2010). High school students’
attitudes towards spiders: A crosscultural comparison. International Journal of Science
Education 32(12): 1665-1688.
Prokop, P., Fančovičová, J. and Kubiatko, M. (2009). Vampires are still alive: Slovakian
students’ attitudes toward bats. Anthrozoös 22(1): 19-30.
Quinn, E.K., Massey, P.D., Cox-Witton, K., Paterson, B.J., Eastwood, K. and Durrheim,
D.N. (2014). Understanding human-bat interactions in NSW, Australia: improving risk
communication for prevention of Australian bat lyssavirus. BMC Veterinary Research 10,
144-150.
Racey, P. A. (1982). Ecology of bats reproduction. In: Ecology of bats (T.H. Kunz, ed.).
Plenum Press, Newyork-USA. Pp. 57-104.
Ragusa-Netto, J. and Santos, A. A. (2014). Seed rain generated by bats under Cerrado’s
pasture remnant trees in a Neotropical savanna. Brazilian Journal of Biology 74: 429-437.
Rainho, A, Augusto, A. M. and Palmeirim, J. M. (2010). Influence of vegetation clutter on
the capacity of ground foraging bats to capture prey. Journal of Applied Ecology 47: 850-
858.
Randler, C., Höllwarth, A. and Schaal, S. (2007). Urban Park Visitors and Their Knowledge
of Animal Species. Anthrozoos 20: 65-74.
Rautiainen, M., Stenberg, P., and Nilson, T. (2005). Estimating canopy cover in Scots pine
stands. Silva Fennica 39: 137–142.
Rautenbach, I. L., Fenton, M. B. and Whiting, M. J. (1996). Bats in riverine forests and
woodlands: A latitudinal transect in southern Africa. Canadian Journal of Zoology 74: 312-
322.

149
Razafindrakoto, N., Harwll, A. and Jenkins, R. (2011). Bats roosting in public buildings: a
preliminary assessment from Moramang, Eastern Madagascar. Madagascar Conservation and
Development 5: 85-88.
Rego, K. M. C., Zeppelini, C. G., Lopez, L. C. S. And Alves, R. R. N. (2015). Assessing
human-bat interactions around a protected area in northeastern Brazil. Journal of Ethnobiology
and Ethnomedicine 11: 80-90.
Robins, L. N. And Regier, D. A. (1991). Psychiatric Disorders in America. The Free Press.
New York. USA.
Røskaft, E., Bjerke, T., Kaltenborn, B. P., Linnell, J. D. C. and Andersen, R. (2003). Patterns
of self-reported fear towards large carnivores among the Norwegian public. Evolution and
Human Behavior 24: 184-198.
Robertson, S. A. and Luke, W. R. Q. (1993). Kenya Coastal Forests. The report of the NMK
⁄WWF Coast Forest Survey. WWF Project 3256: Kenya Coast Forest Status, Conservation and
Management, Nairobi, Kenya.
Ruschel, A. R., Nodari, R. O. and Moerschbacher, B. M. (2007). Woody plant species richness
in the Turvo State park, a large remnant of deciduous Atlantic forest, Brazil. Biodiversity
Conservation 16: 1699-1714.
Russo, D. and Jones, G. (2003). Use of foraging habitats by bats in a Mediterranean area
determined by acoustic surveys: conservation implications. Ecography 26(2):197-209.
Russo, L., Stehouwer, R., Heberling, J. M. and Shea, K. (2011). The Composite Insect Trap:
An Innovative Combination Trap for Biologically Diverse Sampling. PLoS ONE 6(6)
e21079.
Sampaio, E. M., Kalko, E. K. V., Bernard, E., Rodriguez-Herrera B. and Handley Jr. C. O.
(2003). Abiodiversity assessment of bats (Chiroptera) in a tropical lowland rainforest of
Central Amazonia, including methodological and conservation considerations. Studies in
Neotropical Fauna E. 38: 17-31.
Sanyal, A. K., Uniyal, V. P., Chandra, K. and Bhardwaj, M. (2013). Diversity, distribution
pattern and seasonal variation in moth assemblages along altitudinal gradient in Gangotri
landscape area, Western Himalaya, Uttarakhand, India. Journal of Threatened Taxa 5(2):
3646-3653.
Sexton, N. R. and Stewart, S. C. (2007). Understanding knowledge and perceptions of bats
among residents of Fort Collins, Colorado. USA Geological Survey Open-File Report 1245:
1-22.
Scanlon, A.T. and Petit, S. (2008). Effects of site, time, weather and light on urban bat
activity and richness: Considerations for survey effort. Wildlife Research 35. 821-834.
Schulze, M. D., Seavy, N. E. and Whitacre, D. F. (2000). A comparison of the phyllostomid
bat assemblages in undisturbed Neotropical forest and in forest fragments of a slash-and-burn
farming mosaic in Pet´en, Guatemala. Biotropica 32:174-184.

150
Shannon, C. E. and Weaver, W. (1963). The mathematical theory of communication.
University of University of Illinois Press. Urbana-USA.
Sheherazade, T., and Tsang, S. M. (2015). Quantifying the bat bushmeat trade in North
Sulawesi, Indonesia, with suggestions for conservation action. Global Ecology in
Conservation 3: 324-330.
Schnitzler, H.U. and Kalko, E.K.V. (2001). Echolocation by insect-eating bats. BioScience
51(7):557-569.
Simmons, N. B. (2005). Order Chiroptera. In: Mammal species of the world: a taxonomic and
geographic reference. Vol. 1 (Third edition) Wilson, D. E. and Reeder, D. M. (eds.). John
Hopkins University Press, Baltimore-USA. Pp. 312–529.
Simmons, N. B., and Geisler, J. H. (1998). Phylogenetic relationships of Icaronycteris,
Archaeonycteris, Hassianycteris, and Palaeochiropteryx to extant bat lineages,
withcomments on the evolution of echolocation and foraging strategies in Microchiroptera.
Bulletin of the American Museum of Natural History 235: 1-182.
Statsoft (2007). Data analysis program; Statistica Ver 8, StatSoft. Retrieved from
http://www.statsoft.com. 2007.
Struebig, M. J., Turner, A., Giles, E., Lasmana, F., Tollington, S., Bernard, H. and Bell, D.
(2013). Quantifying the biodiversity value of repeatedly logged rainforests: gradient and
comparative approaches from Borneo. In: Advances in ecological research (W. Guy and J. O.
G. Eoin (eds). Academic Press, New York-USA. Pp 183-224.
Tang, Z. H., Mukherjee, A., Sheng, L. X., Cao, M., Liang, B., Corlett, R. B. and Zhang, S.
Y. (2007). Effect of ingestion by two frugivorous bat species on the seed germination of
Ficus racemosa and F. hispida (Moraceae). Journal of Tropical Ecology 23: 125-127.
Taylor, D. A. R. (2005). The straw-colored fruit bat, Eidolon helvum, and Milicia excelsa seed
dispersal, survival, and germination. MSc. Thesis Master of Science in Forestry, Northern
Arizona University-USA.
Taylor, P.J. (2000). Bats of Africa; Guide to biology, identification and conservation.
University of Natal Press, Pietermartizburg-South Africa.
Teeling, E. C., Scally, M., Kao, D. J., Romagnoli, M. L., Springer, M. S. and Stanhope,
M. J. (2000). Molecular evidence regarding the origin of echolocation and flight in bats.
Nature 403: 188-192.
Thomas, D.W. (1984). Fruit intake and energy budgets of frugivorous bats. Physiological
Zoology 57: 457-467.
Tongco, D.C. (2007). Purposive sampling as a tool for informant selection. Ethnobotany
Research and Applications 5:147-158.
Treitler, J. T., Heim, O., Tschapka, M. and Jung, K. (2016). The effect of local land use and
loss of forests on bats and nocturnal insects. Ecology and Evolution 6(13): 4289-4297.

151
Treves, A., and Naughton-Treves, L. (1999). Risk and opportunity for humans coexisting with
large carnivores. Journal of Human Evolution 36(3): 275-82.
Tuttle, M. D. and Stevenson, D. (1982). Growth and survival of bats. In: Ecology of bats (T.H
Kunz, ed.). Plenum Press, Newyork-USA. Pp. 105-50.
Voigt, C. C. and Kingston T. (Eds.) 2016). Bats in the Anthropocene: Conservation of Bats in
a Changing World. Springer. New York-USA.
Voigt, C. C., Phelps, K. L., Aguirre, L. F., Schoeman, M. C., Vanitharani, J., and Zubaid, A.
(2016). Bats and buildings: the conservation of synanthropic bats. In: Bats in the
Anthropocene: conservation of bats in a changing world (C. C Voigt, Kingston T, eds).
Springer International AG, New York-USA. Pp 427-453.
Wechuli, D. B., Webala, P. W., Patterson, B. D. and Ochieng, R. S. (2016). Bat species
diversity and distribution in a disturbed regime at the Lake Bogoria National Reserve, Kenya.
African Journal Ecology 55: 465-476.
Webala, P., Mwaura, J.M., Mugo, J., Ndiritu, G. and Patterson, B. (2019b). Effects of habitat
fragmentation on the bats of Kakamega Forest, western Kenya. Journal of Tropical Ecology
35. 1-10.
Webala, P. W., Rydell, J., Dick, C. W., Musila, S., Patterson, B.D. (2019a). Echolocation
calls of high duty-cycle bats (Hipposideridae and Rhinonycteridae) from Kenya. Journal of
Bat Research and Conservation 12. doi: https://doi.org/10.14709/BarbJ.12.1.2019.02.
Webala, P. W., Musila, S. and Makau, R. (2014). Roost occupancy, roost site selection and
diet of straw-coloured fruit bats (Pteropodidae: Eidolon helvum) in western Kenya: the need
for continued public education. Acta Chiropterologica 16(1): 85-94.
Webala, P. W., Craig, M. D., Law, B. S., Armstrong, KN., Wayne, A. F. and Bradle, J. S.
(2011). Bat habitat use in logged jarrah eucalypt forests of south-western Australia. Journal
of Applied Ecology 48: 398-406.
Webala, P.W., Caruga,T.I. L., Canova, L. and Fasola, M. (2009). Bat assemblages from
Eastern Lake Turkana, Kenya. African Journal of Ecology 64: 85-91.
Webala, P.W., Muriuki, G., Lala, F. and Bett, A. (2006). The small mammal community of
Mukogodo forest, Kenya. African Journal of Ecology 44: 363-370.
Webala, P.W., Oguge, N.O. and Bekele, A. (2004). Bat species diversity and distribution in
three vegetation communities of Meru National Park Kenya. African Journal of Ecology
42:171-179.
Wells, N. M. and Lekies, K. S. (2006). Nature and the life course: pathways from childhood
nature experiences to adult environmentalism. Children Youth Environment 16: 1-24.
Wickramasinghe, L. P., Harris, S., Jones, G. and Vaughan Jennings, N. (2004) Abundance and
species richness of nocturnal invertebrates on organic and conventional farms: effects of
agricultural intensification on bat foraging. Conservation Biology 18: 1283-1292.

152
Wickramasinghe, L.P., Harris, S., Jones, G. and Vaughan, N. (2003). Bat activity and species
richness on organic and conventional farms: impact of agricultural intensification. Journal of
Applied Ecology 40: 984-993.
Willig, M. R. and Selcer, K. W. (1989). Bat species density gradients in the New World: a
statistical assessments. Journal of Biogeography 16: 189-95.
Willig, R. G., Patterson, B. D. and Stevens, R. D. (2003). Patterns of range size, richness and
body size in Chiroptera. In: Bat ecology (T.H. Kunz and M.B. Fenton, eds). The University of
Chicago Press, Chicago-USA. Pp. 580-621.
Williams-Guillén, K., Olimpi, E., Maas, B., Taylor P.J. and Arlettaz, R. (2016). Bats in the
Anthropogenic Matrix: Challenges and Opportunities for the Conservation of Chiroptera and
Their Ecosystem Services in Agricultural Landscapes. In: Bats in the anthropocene:
conservation of bats in a changing world (C. C. Voigt and T. Kingston, eds). Springer
International AG. New York-USA. Pp. 151-185.
Korhonen, L., Korhonen, K. T., Rautiainen, M. and Stenberg, P. (2006). Estimation of Forest
Canopy Cover: a Comparison of field measurement techniques. Silva Fennica 40: 577-588.
Winkelman, J. R., Bonaccorso, F. J. and Strickler, T. L. (2000). Home range of the southern
blossom bat, Syconycteris australis, in Papua New Guinea. Journal of Mammalogy 81: 408-
414.
Wirooks, L. (2005). Die ökologische Aussagekraft des Lichtfangs: Eine Studie zur
Habitatanbindung und kleinräumigen Verteilung von Nachtfaltern und ihren Raupen. Wolf
and Kreuels, Havixbeck-Hohenholte, 302 pp.
Wolbert, S. J., Zellner, A. S. and Whidde, H. P. (2014). Bat activity, insect biomass, and
temperature along an elevational gradient. Northeastern Naturalist 21: 72-85.
Wolton, R. J., Arak, P. A., Godfray, H. C. J. and Wilson, R. P. (1982). Ecological and
behavioural studies of the Mega-chiroptera at Mount Nimba, Liberia, with notes on
Microchiroptera. Mammalia 46: 419-448.
Zandi, H. (2013). The Trace of People’s Beliefs in the Animal Oriented Stories in Molavi’s
Masnavi. Anthropologist 16: 747-751.
Zint, M., Kraemer, A. and Northway, H. (2002). Evaluation of Chesapeake Bay Foundation
Conservation Education Programs in: Conservation Biology 3: 641-649.

153
APPINDICES
Appendix 1. Voucher specimens of different bat species collected at ASF and in farmland
and deposited with Mammalogy Section lab-National Museums of Kenya (NMK).
NOTE- Vouchers of Neoromicia tenuipinnis, Otomops harrisoni and Eidolon helvum were not collected
NO. GENUS NMK CAT. NO. LOCATION DATE SEX AGE FOREARM WEIGHT EAR
1 Pipistrellus rueppellii 191002 Arabuko Sokoke Forest 21/11/2014 F Adult 30 5
Pipistrellus rueppellii 190985 Arabuko Sokoke Forest 21/11/2014 M Adult 30 4
Pipistrellus rueppellii 190961 Arabuko Sokoke Forest 11/02/2014 F Adult 30 5.5
2 Nycteris thebaica 190982 Arabuko Sokoke Forest 11/04/2015 M Adult 50 12
Nycteris thebaica 190938 Arabuko Sokoke Forest 26/11/2014 M Adult 44 8
Nycteris thebaica 191086 Arabuko Sokoke Forest 03/03/2014
43.4 7.5
3 Rousettus aegyptiacus 191046 Arabuko Sokoke Forest 29/11/2014
100
Rousettus aegyptiacus 191051 Arabuko Sokoke Forest 29/11/2014
95
4 Scotoecus hirundo 190980 Arabuko Sokoke Forest 03/06/2014
33.6 9
Scotoecus hirundo 190971 Arabuko Sokoke Forest 13/04/2014 M Adult 37
5 Macronycteris vittata 191045 Nguwas Farm Gede 11/12/2016 M Adult 101 96
Macronycteris vittata 191060 Nguwas Farm Gede 11/12/2016 F Adult 89 55
Macronycteris vittata 191087 Arabuko Sokoke Forest 03/06/2014 F Adult 86 62
6 Epomophorus wahlbergi 191003 Arabuko Sokoke Forest 03/03/2014 F Adult 72
Epomophorus wahlbergi 191939 Arabuko Sokoke Forest 03/03/2014 F Adult 72.5
Epomophorus wahlbergi 191026 Arabuko Sokoke Forest 12/03/2014 F Adult 72
7 Scotophilus trujilloi 191000 Arabuko Sokoke Forest 11/02/2014 F Adult 55 27
Scotophilus trujilloi 191091 Arabuko Sokoke Forest 12/09/2014 M Adult 54 29
8 Rhinolophus deckenii 190986 Arabuko Sokoke Forest 03/04/2014 F Adult 54 21
Rhinolophus deckenii 191089 Arabuko Sokoke Forest 28/11/2014
57 19.5
Rhinolophus deckenii 191083 Arabuko Sokoke Forest 11/02/2015 F Adult 53 17
9 Nycticeinops schlieffeni 190945 Arabuko Sokoke Forest 11/02/2015 F Adult 34 6
10 Miniopterus minor 191052 Kaboga Cave Gede 11/12/2016 F Adult 40 6.5 9
Miniopterus minor 191044 Kaboga Cave Gede 11/12/2016 M Adult 40 7 9
11 Miniopterus cf inflatus 191056 Kaboga Cave Gede 11/12/2016 F Adult 41 6.5 9
12 Coleura afra 191071 Kaboga Cave Gede 11/12/2016 F Adult 53 12 12
Coleura afra 191074 Kaboga Cave Gede 11/12/2016
Adult 49 11 14
13 Neoromicia rendalli 190978 Mangrove edge 18/11/2015
34 6
14 Hipposideros caffer 190954 Arabuko Sokoke Forest 12/03/2014 F Adult 53
Hipposideros caffer 190962 Alibaba Cave Gede 03/05/2013 M Adult 47.9
Hipposideros caffer 191085 Arabuko Sokoke Forest 12/03/2014 M Adult 54
15 Chaerephon pumilus 191034 Arabuko Sokoke Forest 11/02/2015 F Adult 53 22
Chaerephon pumilus 190970 Arabuko Sokoke Forest 12/09/2014 M Adult 39 10
16 Cardioderma cor 191053 Arabuko Sokoke Forest 11/02/2015 M Adult 54 26
17 Taphozous mauritianus 190981 Arabuko Sokoke Forest 12/08/2014 M Adult 61 25
18 Neoromicia nana 191009 Arabuko Sokoke Forest 22/11/2014
30
30
Neoromicia nana 190996 Arabuko Sokoke Forest 03/03/2014 M Adult 26
3.5
19 Neoromicia capensis 190973 Arabuko Sokoke Forest 27/11/2014
Adult 34 8
Neoromicia capensis 190958 Arabuko Sokoke Forest 01/02/2014 F Adult 33 11
20 Triaenops afer 191041 Alikiba Cave Gede 03/04/2014
Adult 86.1 65
Triaenops afer 190953 Alikiba Cave Gede 03/05/2014 M Adult 50.6
21 Mimetillus moloneyi 191070 Arabuko Sokoke Forest 15/02/2015 M Adult 30 10
Mimetillus moloneyi 190984 Arabuko Sokoke Forest 15/02/2015 M Adult 30 8

154
Appendix 2. Some species bat photos recorded in the farmland and the interior of ASF
Triaenops afer Dobson, 1871. African Trident Bat captured in the farmland and ASF
Coleura afra (Peters, 1852) African Sheath-tailed bat captured in the farmland and ASF

155
Macronycteris vittata (Peters, 1852) Striped Leaf-nosed Bat captured in the farmland and
ASF
Taphozous mauritianus É. Geoffroy, 1818 Mauritian Tomb Bat captured in the farmland and
ASF

156
Nycteris thebaica É. Geoffroy, 1818 Egyptian Slit-faced Bat captured in the farmland and
ASF
Scotophilus trujilloi Brooks and Bickham, 2014 Trujillo’s House Bat captured in the
farmland and ASF
Chaerephon pumilus (Cretzschmar, 1830–1831). English: Little Free-tailed Bat captured in
the farmland and ASF

157
Cardioderma cor (Peters, 1872) Heart-nosed Bat captured in the farmland and ASF
Rhinolophus deckenii Peters, 1868 Decken’s Horseshoe Bat captured in the farmland and
ASF
Nycticeinops schlieffeni (Peters, 1859) Schlieffen’s Twilight Bat captured in the farmland
and ASF

158
Otomops harrisoni Ralph, Richards, Taylor, Napier and Lamb, 2015 Harrison’s Giant
Mastiff Bat only captured in the farmland
Mimetillus moloneyi (Thomas, 1891) Moloney’s Mimic Bat only captured in the ASF

159
Miniopterus minor Peters, 1867 Least Long-fingered Bat captured in the farmland and ASF
Rousettus aegyptiacus (É. Geoffroy, 1810) Egyptian Rousette breeding condition captured in
the farmland and ASF

160
Epomophorus wahlbergi (Sundevall, 1846). Wahlberg’s Epauletted Fruit Ba captured in the
farmland and ASF
Hipposideros caffer (Sundevall, 1846) Sundevall’s Leaf-nosed Bat colony roost at
Alibaba/Makuruhu limestone roost in the farmland; species captured in both study sites

161
Appendix 3. Location of some bat roosts in ASF and farmland
Legend: Ali Baba/Makuruhu cave (A); Watamu Police Station cave (B), Gede Market Tree
Roost (C), Lion cave (D), Panga Yambo (E), Uyombo cave (F), Borehole Roost (G); Kaboga
Cave (H), Latrine Roost (I) and Kanani Cave (J).
Bat roosts-A-J

162
Appendix 4. Bat species and total number of captures each hour in the interior of ASF
Genus Species
Bat
group
1900
hr
2000
hr
2100
hr
2200
hr
2300
hr
2400
hr
0100
hr
0200
hr
0300
hr
0400
hr
Total/
Species
1 Epomophorus wahlbergi Fruit bat 28 72 58 46 34 55 15 13 17 76 414
2 Roussetus aegyptiacus Fruit bat 5 41 67 36 50 90 6 2 10 7 314
3 Eidolon helvum Fruit bat
1
1
4 Neoromicia nana Insect bat 13 3 1
1
18
5 Macronycteris vittata Insect bat 15 1 1
1
2 20
6 Miniopterus minor Insect bat 1 6 2 1
4
1 4 19
7 Nycteris thebaica Insect bat 4 3 2 3 2
14
8 Hipposideros cafer Insect bat 3 4 1 3
1
1 13
9 Coleura afra Insect bat 1 7 2 1
4
1 1 17
10 Nycticeinops schlieffeni Insect bat 11
1
1
13
11 Rhinolophus deckenii Insect bat
5 2 1 2
10
12 Scotophilus trujilloi Insect bat 4 1
1 1
2
1 10
13 Neoromicia capensis Insect bat 4
1
5
14 Pipistrellus rueppellii Insect bat 4 1
5
15 Chaerophon pumilus Insect bat 3
3
16 Mimetillus moloneyi Insect bat 2
1 3
17 Miniopterus cf inflatus Insect bat
1
1
2
18 Cardioderma cor Insect bat
1
1
2
19 Taphozous mauritianius Insect bat
1
1
Total /hour
98 145 139 93 92 156 24 15 29 93 884
Appendix 5. Bat species and total number of captures each hour in the farmland
Genus Species
Bat
group
1900
hr
2000
hr
2100
hr
2200
hr
2300
hr
2400
hr
0100
hr
0200
hr
0300
hr
0400
hr
Total/
species
1 Roussetus aegyptiacus Fruit bat 338 498 313 281 254 311 45 87 69 132 2328
2 Epomophorus wahlbergi Fruit bat 273 184 113 114 85 99 36 31 29 56 1020
3 Eidolon helvum Fruit bat 1 1 1 1
4
4 Cardioderma cor Insect bat 183 143 72 32 44 53 14 14 17 32 604
5 Scotophilus trujilloi Insect bat 35 3 2 1
4 5 1 51
6 Nycteris thebaica Insect bat 16 4 6 5 2 3 1
3 40
7 Macronycteris vittata Insect bat 16 5 1 4
1
1
8 36
8 Hipposideros cafer Insect bat 15 2 3 1
21
9 Coleura afra Insect bat 17 1 2
1
1
1 23
10 Rhinolophus deckenii Insect bat 14 5 2 1 1
5 28
11 Nycticeinops schlieffeni Insect bat 16 3
19
12 Miniopterus minor Insect bat 13 2
15
13 Neoromicia nana Insect bat 9
1 1
1
12
14 Otomops harrisoni Insect bat 2
2 1 1
1 2 2 11
15 Scotoecus hirundo Insect bat 10
10
16 Neoromicia tenuipinnis Insect bat 5
1
6
17 Neoromicia capensis Insect bat 4 1
1
6
18 Taphozous mauritianius Insect bat
2
1
1 2 6
19 Pipistrellus ruepellii Insect bat 4
4
20 Triaenops afer Insect bat 5
5
21 Chaerephon pumilus Insect bat 1
1
2
22 Neoromicia rendalli Insect bat 1
1
23 Miniopterus cf inflatus Insect bat
1
1
Total/hour
978 852 518 444 388 471 96 139 125 242 4253

163
Appendix 6. Orders of different invertebrates excluding Order Lepidoptera (moths) trapped
in different vegetation types in ASF (Cynometra forest (CYN) Brachystegia forest (BRA),
mixed forest in ASF (MIXFo), and farmland (mango farmfarms (MAN), coconut farmfarms
(COC), and mixed farmfarms (MIXFa).
ORDERS Families MAN COC MIXFa FARM MIXFo BRA CYN ASF ASF+Farm
Blattodea Blattellidae 29 3 4 36 5 17 2 24 60
Blattidae 10 5 11 26 56 52 14 122 148
Euthyrrhaphidae 67 3 70 6 33 2 41 111
Termitidae 16 2 0 18 1 6 44 51 69
Order Total 122 10 18 150 68 108 62 238 388 Coleoptera Alleculidae 2 0 1 3 7 1 3 11 14
Bostrychidae 4 4 1 1 5
Brenithidae 4 5 0 9 1 2 0 3 12
Bruchidae 19 10 3 32 9 9 41
Buprestidae 0 2 0 2 3 0 0 3 5
Cantharidae 0 1 1 2 2
Carabidae 49 9 8 66 13 5 2 20 86
Cerambycidae 5 4 2 11 7 18 17 42 53
Chrysomelidae 21 25 31 77 16 153 28 197 274
Cleridae 0 1 1 1
Coccinelidae 24 24 0 24
Curculionidae 0 1 2 3 3
Elateridae 63 23 29 115 10 2 4 16 131
Erotylidae 17 4 21 1 27 52 80 101
Hybosoridae 4 11 1 16 0 16
Lymexilidae 1 1 2 2 3
Meloidae 1 2 0 3 0 0 2 2 5
Mordellidae 2 2 0 2
Paussidae 4 2 11 17 0 0 0 0 17
Rhynchophoridae 10 1 11 0 11
Scarabaeidae 104 84 340 528 17 50 36 103 631
Staphylinidae 2 2 20 49 3 72 74
Tenebrionidae 85 58 119 262 19 40 6 65 327
Trogidae 0 1 1 1
Order Total 414 244 548 1206 118 357 158 633 1839 Diptera Asilidae 14 2 5 21 7 26 14 47 68
Calliphoridae 1 1 0 1
Muscidae 20 9 7 36 20 60 5 85 121
Sarcophagidae 2 1 2 5 3 3 8
Tabanidae 1 1 1 1 2 3
Tephritidae 1 1 1 4 5 6
Order Total 39 12 14 65 27 91 24 142 207 Hemiptera Cercopidae 7 15 2 24 46 17 22 85 109
Coreidae 4 2 0 6 0 0 0 0 6
Cydnidae 6 2 8 0 8
Lygaeidae 8 14 15 37 3 31 7 41 78
Pentatomidae 7 2 1 10 3 0 0 3 13
Reduviidae 7 7 5 19 27 25 12 64 83
Order Total 39 42 23 104 79 73 41 193 297 Hymenoptera Apidae 1 1 0 1
Braconidae 1 1 0 1
Eumenidae 1 1 0 1
Formicidae 1154 201 92 1447 130 540 373 1043 2490
Mutilidae 0 1 1 1
Pompilidae 1 1 0 1
Scoliidae 1 1 0 1
Order Total 1157 202 93 1452 131 540 373 1044 2496 Mantodea Mantidae 1 7 1 9 5 21 7 33 42
Neuroptera Ascalephidae 1 1 2 0 2
Myrmeleontidae 0 3 2 13 3 11 4 18 31
Order Total 0 4 3 15 3 11 4 18 33
Odonata Libellulidae 1 1 1 1 2 Orthoptera Acrididae 32 36 17 85 14 6 4 24 109
Gryllacridae 2 3 5 1 1 8 10 15
Gryllidae 7 4 4 15 5 10 7 22 37
Pyrgomophidae 10 10 0 10
Tettigonidae 6 2 2 10 12 21 10 43 53
Order Total 47 45 33 125 32 38 29 99 224 TOTALS ALL SITES 1828 566 733 3127 463 1240 698 2401 5528

164
Appendix 7. Diversity of trees in different vegetation types in the farmland
Types of trees in
farmland
Trees in
mango
farms
% Trees in
mango
farms
Coconut
farms
% Trees in
coconut farm
mixed
farms
% Trees
In mixed
farms
Farmland
trees totals
% Trees in
farmland
1 Coconut 55 19.6 250 89.3 148 52.9 453 53.9
2 Mango 198 70.7 11 3.9 52 18.6 261 31.07
3 Cashew nut 8 2.9 16 5.7 65 23.2 89 10.59
4 Neem 15 5.4 3 1.1 13 4.6 31 3.69
5 Guava 1 0.4 0.0 1 0.4 2 0.24
6 Casuarina 1 0.4 0.0 0 1 0.12
7 Citrus 2 0.7 0.0 0 2 0.24
8 Gmelia arborea 0 0.0 1 0.4 1 0.12
TOTAL 280 100 280 100.0 280 100 840 100
Appendix 8. Diversity of trees in different vegetation types at ASF
Tree species
No. trees
Mixed forest
% of
trees in
mixed
No. trees in
Cynometra
forest
% of trees in
Cynometra
forest
No. of trees
in
Brachystegia
woodland
% of trees in
Brachystegia
woodland
ASF
tree
totals
%
Trees at
ASF
1 Brachystegia spiciformis 0.0 0 248 88.6 248 30
2 Cyometra webberi 0.0 244 87.1 0.0 244 29
3 Manikara sansibarensis 150 53.6 0.0 4 1.4 154 18
4 Hymenaea verrucosa 77 27.5 0.0 14 5.0 91 11
5 Afzelia quanzensis 27 9.6 0.0 12 4.3 39 5
6 Brachylaena huillensis 2 0.7 15 5.4 0.0 17 2
7 Manikara sulcata 0.0 8 2.9 0.0 8 1
8 Mimusops obtusifolia 7 2.5 0.0 0.0 7 1
9 Pleurostylia africana 7 2.5 0.0 0.0 7 1
10 Oldfieldia somalensis 0.0 6 2.1 0.0 6 1
11 Tamarindus indica 3 1.1 0.0 0.0 3 0
12 Jasminum streptopus 0.0 3 1.1 0.0 3 0
13 Lonchocarpus bussei 2 0.7 0.0 0.0 2 0
14 Drypetes reticulata 2 0.7 0.0 0.0 2 0
15 Haplocoelum inoploeum 0.0 2 0.7 0.0 2 0
16 Maerua angolenis 0.0 2 0.7 0.0 2 0
17 Lannea schweinfurthii 0.0 0.0 2 0.7 2 0
18 Ozoroa obovata 1 0.4 0.0 0.0 1 0
19 Dialium orientale 1 0.4 0.0 0.0 1 0
20 Grewia microcarpa 1 0.4 0.0 0.0 1 0
TOTALS 280 100.0 280 100 280 100.0 840 100
Appendix 9. Number of each tree species per ha in the farmland
Tree species Species in each quarter Frequency/Quarter
Overall
trees/ha
Tree species
/ha
Potential for fruit
bat food
1 Coconut 453 0.539285714 111 60
2 Mango 261 0.310714286 111 34 Fruit edible
3 Cashew nut 89 0.105952381 111 12 Fruit edible
4 Neem 31 0.036904762 111 4 Fruit edible
5 Citrus 2 0.002380952 111 0
6 Guava 2 0.002380952 111 0 Fruit edible
7 Gmelia arborea 1 0.001190476 111 0 Fruit edible
8 Casuarina 1 0.001190476 111 0
TOTALS 840 1 111

165
Appendix 10. Number of each tree species per ha in the interior of ASF
Tree species
Total tree species
in each quarter Frequency/Quarter
Overall
trees/ha Tree species /ha
Potential for
fruit bat food
1 Brachystegia spiciformis 248 0.30 84 25
2 Cyometra webberi 244 0.29 84 24
3 Manikara sansibarensis 154 0.18 84 15 Fruit edible
4 Hymenaea verrucosa 91 0.11 84 9
5 Afzelia quanzensis 39 0.05 84 4
6 Brachylaena huillensis 17 0.02 84 2
7 Manikara sulcata 8 0.01 84 1
8 Mimusops obtusifolia 7 0.01 84 1 Fruit edible
9 Pleurostylia africana 7 0.01 84 1
10 Oldfieldia somalensis 6 0.01 84 1
11 Tamarindus indica 3 0.00 84 0
12 Jasminum streptopus 3 0.00 84 0
13 Lannea schweinfurthii 2 0.00 84 0 Fruit edible
14 Lonchocarpus bussei 2 0.00 84 0
15 Maerua angolenis 2 0.00 84 0
16 Drypetes reticulata 2 0.00 84 0
17 Haplocoelum inoploeum 2 0.00 84 0 Fruit edible
18 Dialium orientale 1 0.00 84 0 Fruit edible
19 Ozoroa obovata 1 0.00 84 0
20 Grewia microcarpa 1 0.00 84 0
TOTALS 840 1.00 84
Appendix 11. The total tree basal area per hectare (m2/ha) in the farmland.
Tree species Mean Basal Area Tree species /ha Total BA/ha (m2/ha)
1 Mango 7728.655993 34 26.27743038
2 Cashew nut 3451.289727 12 4.141547673
3 Casuarina 4187.071429 0 0
4 Gmelia arborea 2828.571429 0 0
5 Neem 1785.193548 4 0.714077419
6 Citrus 1767.857143 0 0
7 Guava 1235.535714 0 0
8 Coconut 624.8319142 60 3.748991485
Total Cover/ha 34.88204695

166
Appendix 12. The total tree basal area per hectare (m2/ha) at ASF
Tree species Mean Basal Area Tree species /ha Total BA/ha (m2/ha)
1 Brachystegia spiciformis 2889.3 25 7.2
2 Cyometra webberi 755.0 24 1.8
3 Manikara sansibarensis 896.2 15 1.3
4 Hymenaea verrucosa 1278.5 9 1.2
5 Afzelia quanzensis 3581.3 4 1.4
6 Brachylaena huillensis 505.4 2 0.1
7 Manikara sulcata 589.1 1 0.1
8 Mimusops obtusifolia 919.2 1 0.1
9 Pleurostylia africana 1002.3 1 0.1
10 Oldfieldia somalensis 868.1 1 0.1
11 Tamarindus indica 8835.6 0 0.0
12 Jasminum streptopus 913.2 0 0.0
13 Lannea schweinfurthii 12951.7 0 0.0
14 Lonchocarpus bussei 990.4 0 0.0
15 Maerua angolenis 2642.0 0 0.0
16 Drypetes reticulata 3055.6 0 0.0
17 Haplocoelum inoploeum 671.4 0 0.0
18 Dialium orientale 3319.6 0 0.0
19 Ozoroa obovata 2124.6 0 0.0
20 Grewia microcarpa 346.5 0 0.0
TOTALS 1671 84 13.4
Appendix 13. The importance value of each tree species in the farmland
Tree species Relative Density of a Species Relative Cover of a Species Relative frequency Importance
1 Mango 31 75 30 136
2 Coconut 54 11 47 112
3 Cashew nut 11 12 16 39
4 Neem 4 2 6 12
5 Citrus 0 0 1 1
6 Guava 0 0 1 1
7 Gmelia arborea 0 0 0 0
8 Casuarina 0 0 0 0
TOTALS 100 100 100 300

167
Appendix 14. The importance value of each tree species in ASF
Tree species
Relative Density of
a Species
Relative Cover of a
Species
Relative frequency of a
species
importance value of a
species
1 Brachystegia spiciformis 30 54 20 103
2 Cyometra webberi 29 14 20 62
3 Manikara sansibarensis 18 10 17 46
4 Hymenaea verrucosa 11 9 18 38
5 Afzelia quanzensis 5 11 9 24
6 Brachylaena huillensis 2 1 4 7
7 Manikara sulcata 1 0 2 3
8 Mimusops obtusifolia 1 1 2 3
9 Pleurostylia africana 1 1 2 4
10 Oldfieldia somalensis 1 1 2 3
11 Tamarindus indica 0 0 1 1
12 Jasminum streptopus 0 0 1 1
13 Lannea schweinfurthii 0 0 0 0
14 Lonchocarpus bussei 0 0 0 0
15 Maerua angolenis 0 0 1 1
16 Drypetes reticulata 0 0 1 1
17 Haplocoelum inoploeum 0 0 1 1
18 Dialium orientale 0 0 0 0
19 Ozoroa obovata 0 0 0 0
20 Grewia microcarpa 0 0 0 0
TOTALS 100 100 100 300

168
Appendix 15: Bat attitude questionnaire (BAQ)-English version
BATS ATTITUDES SURVEYS AROUND CAVES IN ARABUKO-SOKOKE
FOREST
READ HERE FIRST: The purpose of this questionnaire is to collect information about bats
from local people around Arabuko Sokoke Forest purely for scientific research; therefore,
we would like to obtain honest answers.
INSTRUCTIONS: TICK AS APPROPRIATE: Thank you for taking part in this
interview- For more information contact: SIMON MUSILA: Mammalogy Section, National
Museums of Kenya, P. O Box 40658, GPO 00100 Nairobi-Kenya. Email-
[email protected], Mobile-0727-093737 and 0735-476314.
SECTION 1-RESPONDENTS DEMOGRAPHIC INFORMATION
Sex: 1.Male [ ] 2. Female [ ] Distance from nearest bats cave…. Tribe/Language spoken:
...
How old are you (Yrs): ……………………How many children do you have?...………
Level of education: 1. None [ ] 2. Primary [ ] 3. Secondary [ ] 4. College[ ] 5.
University [ ]
What is the name of bat in your mother tongue…………………when last did you see a
bat……..
Name a place you know where many bats are found in large
numbers……………………….……
What traditional beliefs exist in your community about
bats……………………………………..
…………………………………………………………………………………………………
……
List all benefits which people get from bats……………
………………………………………….
……………………………………………………………………………..................………
……
List ways in which bats affect people or anything owned by
people........…………………………
…………………………………………………………………………………………………
…....
Have you ever had bats living in your compound (farm or house) Yes [ ] No [ ]
If YES what did you do to these bats?
1. I killed at least one [ ]
2. Killed very many of them [ ]
3. I destroyed their resting place in order to chase the bats away [ ]
4. I did nothing [ ]
5. I contacted responsible officer [ ]
SECTION 2-NEGATIVISTIC
1. Are you afraid that bats can infect you with dangerous diseases? 1).Not at all[ ] 2).No[ ] 3).Undecided[ ] 4).Somehow they can[ ] 5).Extremely very much[ ]
2. How much do you consider appearance of bats attractive to you? 1). Absolutely not attractive [ ] 2).Not attractive[ ] 3).Undecided[ ] 4).Attractive[ ]
5). Extremely very attractive[ ]

169
3. I like holding a bat in my hand 1).Strongly disagree[ ] 2).Rather disagree[ ] 3).Undecided[ ] 4).Rather agree[ ] 5). Strongly agree [ ]
4. I cannot enter a cave where bats are found 1).Strongly disagree[ ] 2).Rather disagree[ ] 3).Undecided[ ] 4).Rather agree[ ] 5). Strongly agree [ ]
5. I can live in a house where bats are founds 1).Strongly disagree[ ] 2).Rather disagree[ ] 3).Undecided[ ] 4).Rather agree[ ] 5). Strongly
agree [ ]
6. When I see a bat I ran away immediately 1).Strongly disagree[ ] 2).Rather disagree[ ] 3).Undecided[ ] 4).Rather agree[ ] 5). Strongly
agree [ ]
7. How much do you consider bats disgusting to you? 1). Absolutely not disgusting [ ] 2). Not disgusting[ ] 3).Undecided[ ] 4).Disgusting[ ]
5). Extremely very disgusting[ ]
8. I can cut any tree down in our compound if it was occupied by bats 1).Strongly disagree[ ] 2).Rather disagree[ ] 3).Undecided[ ] 4).Rather agree[ ] 5). Strongly
agree [ ]
9. Bats destroy fruits in our farm 1).Strongly disagree[ ] 2).Rather disagree[ ] 3).Undecided[ ] 4).Rather agree[ ] 5). Strongly
agree [ ]
SECTION 3-SCIENSTISTIC
1. I would like to know more about bats
1).Strongly disagree[ ] 2).Rather disagree[ ] 3).Undecided[ ] 4).Rather agree[ ] 5). Strongly agree [ ]
2. We should learn more about bats in school
1).Strongly disagree[ ] 2).Rather disagree[ ] 3).Undecided[ ] 4).Rather agree[ ] 5). Strongly agree [ ]
3. I cannot understand how someone can be interested in bats
1).Strongly disagree[ ] 2).Rather disagree[ ] 3).Undecided[ ] 4).Rather agree[ ] 5). Strongly agree [ ]
4. I would like to join a bat trip/expedition and learn about bats
1).Strongly disagree[ ] 2).Rather disagree[ ] 3).Undecided[ ] 4).Rather agree[ ] 5). Strongly agree [ ]
SECTION 4-ECOLOGISTIC
1. Bats should be protected law 1).Strongly disagree[ ] 2).Rather disagree[ ] 3).Undecided[ ] 4).Rather agree[ ] 5). Strongly agree [
]
2. Bats play a very important role to the environment 1).Strongly disagree[ ] 2).Rather disagree[ ] 3).Undecided[ ] 4).Rather agree[ ] 5). Strongly
agree [ ]
3. Bats help in pollination of flowers 1).Strongly disagree[ ] 2).Rather disagree[ ] 3).Undecided[ ] 4).Rather agree[ ] 5). Strongly agree [
]

170
4. Bats help in seed dispersal 1).Strongly disagree[ ] 2).Rather disagree[ ] 3).Undecided[ ] 4).Rather agree[ ] 5). Strongly agree [
]
5. Bats help in insect pest control 1).Strongly disagree[ ] 2).Rather disagree[ ] 3).Undecided[ ] 4).Rather agree[ ] 5). Strongly agree [
]
6. Bats droppings are source of good fertilizer 1).Strongly disagree[ ] 2).Rather disagree[ ] 3).Undecided[ ] 4).Rather agree[ ] 5). Strongly agree [
]
7. Planting tress helps conserve bats species 1).Strongly disagree[ ] 2).Rather disagree[ ] 3).Undecided[ ] 4).Rather agree[ ] 5). Strongly agree [
]
8. Caves are very important for survival of bats 1).Strongly disagree[ ] 2).Rather disagree[ ] 3).Undecided[ ] 4).Rather agree[ ] 5). Strongly agree [
]
9. There is no problem even if we lose all bats species in Kenya 1).Strongly disagree[ ] 2).Rather disagree[ ] 3).Undecided[ ] 4).Rather agree[ ] 5). Strongly agree [
]
SECTION 5-KNOWLEDGE
1. A bat is a bird 1).Strongly disagree[ ] 2).Rather disagree[ ] 3).Undecided[ ] 4).Rather agree[ ] 5). Strongly agree [
]
2. Bats lay eggs 1).Strongly disagree[ ] 2).Rather disagree[ ] 3).Undecided[ ] 4).Rather agree[ ] 5). Strongly agree [
]
3. Bats are only active during the night 1).Strongly disagree[ ] 2).Rather disagree[ ] 3).Undecided[ ] 4).Rather agree[ ] 5). Strongly agree [
]
4. Bats build nets 1).Strongly disagree[ ] 2).Rather disagree[ ] 3).Undecided[ ] 4).Rather agree[ ] 5). Strongly agree [
]
5. Bats live in houses 1).Strongly disagree[ ] 2).Rather disagree[ ] 3).Undecided[ ] 4).Rather agree[ ] 5). Strongly agree [
]
6. Bats do not live in caves 1).Strongly disagree[ ] 2).Rather disagree[ ] 3).Undecided[ ] 4).Rather agree[ ] 5). Strongly agree [
]
7. Bats live in trees/bushes 1).Strongly disagree[ ] 2).Rather disagree[ ] 3).Undecided[ ] 4).Rather agree[ ] 5). Strongly agree [
]
8. Bats are blind and cannot see

171
1).Strongly disagree[ ] 2).Rather disagree[ ] 3).Undecided[ ] 4).Rather agree[ ] 5). Strongly agree [
]
SECTION 6-MYTHS
1. Bats are ghosts (majini) 1).Strongly disagree[ ] 2).Rather disagree[ ] 3).Undecided[ ] 4).Rather agree[ ] 5). Strongly agree [
]
2. When you see a bat in your house, it is send by your enemy to harm you 1).Strongly disagree[ ] 2).Rather disagree[ ] 3).Undecided[ ] 4).Rather agree[ ] 5). Strongly agree [
]
3. If a bat urinates on someone he/she becomes impotent 1).Strongly disagree[ ] 2).Rather disagree[ ] 3).Undecided[ ] 4).Rather agree[ ] 5). Strongly agree [
]
4. It is a sign of bad omen if bats start living in your new house before you move in 1).Strongly disagree[ ] 2).Rather disagree[ ] 3).Undecided[ ] 4).Rather agree[ ] 5). Strongly agree [
]
5. A home where many bats are found it is a sign of riches/wealth 1).Strongly disagree[ ] 2).Rather disagree[ ] 3).Undecided[ ] 4).Rather agree[ ] 5). Strongly agree [
]
6. Soup made from bats meat can heal stroke 1).Strongly disagree[ ] 2).Rather disagree[ ] 3).Undecided[ ] 4).Rather agree[ ] 5). Strongly agree [
]
7. Body parts of bats are used by witchdoctors to cast spells to people 1).Strongly disagree[ ] 2).Rather disagree[ ] 3).Undecided[ ] 4).Rather agree[ ] 5). Strongly agree [
]

172
Appendix 16. Bat attitude questionnaire (BAQ)-Swahili version
UTAFITI WA POPO/BATS KATIKA PANGO ZINAZOZUNGUKA MSITU WA
ARABUKO-SOKOKE FOREST-MALINDI
SOMA HAPA KWANZA: Nakushuru sana kwa kujitolea kushiriki katika utafiti wa popo,
unaoshirikisha watu waoishi katika sehemu zinaozunguka msitu wa Arabuko Sokoke Forest. Nia
ya haya maswali ni untafiti wa kisayansi, wa kujua maoni yako kuhusu popo. Kwa hivyo
ninakuomba majibu yako yawe ya kweli iwezekanavyo.
MAELEKEZO: CHANGUA JIBU MOJA KATIKA KILA SEHEMU: Ukiwa na swali yeyote
uliza: Simon Musila-Mammalogy Section, National Museums of Kenya, P. O Box 40658, GPO
00100 Nairobi-Kenya. Barua pepe: [email protected]; Rununu: Mobile-0727-093737 and
0735-476314.
SEHEMU-1 RESPONDENTS DEMOGRAPHIC INFORMATION
Gender: 1.Mume [ ] 2.Mke [ ] Umbali kutoka kwa pango ya popo iliyo karibu……..
Lugha ya mama:…………………. Wewe una umri gani (miaka)…………Nambari ya watoto
wako…………….……………………
Kisomo chako: 1. Sijasoma [ ] 2. Msingi [ ] 3. Sekondari [ ] 4. College[ ] 5. Chuo [ ]
Andika njina la popo kwa lugha ya mama…………………Ni lini uliona popo
mwisho……………
Andika njina ya mahali popo wanapopatikana kwa wingi kijijini kwenu…..…………………..
Eleza mambo watu wa kabila yako wanoyoamini kuhusu popo…………………………………..
……………………………………………………………………………………………………
…
Andika faida wanadamu wanapata kutoka kwa popo ……………………………………………
……………………………………………………………………………………………………..
Andika hasara wanadamu wanapata kutoka kwa popo …………………..……………………….
……………………………………………………………………………………………………
…
Kuna wakati popo wameishi nyumbani ama shambani mwenu? Ndiyo [ ] La[ ]
Kama NDIYO hoa popo uliwafanyia nini?
1. Niliuwa popo mmoja [ ]
2. Niliuwa popo wengi sana [ ]
3. Niliaribu mahali walipokuwa wamekaa ili niwafukunzie mbali [ ]
4. Sikufanya chochote [ ]
5. Nilimwendea afisa ambaye anausika [ ]
SEHEMU-2-NEGATIVISTIC
1. Wewe unaungopa ya kwamba popo anaweza kukuambukiza magonjwa hatari? 1). Nakataa kabisa hawezi[ ] 2). Nakataa [ ] 3). Sijui [ ] 4). Nakubali kidogo [ ] 5).
Nakubali anaweza Kabisa [ ]
2. Ni kwa kiwango ngani unafafikiria vile popo anakaa ama ameumbwa
anapendeza? 1). Hapendezi hata kidogo[ ] 2).Hapendezi[ ] 3).Sijui[ ] 4).Anapendeza kidogo[
] 5). Anapendenza sana[ ]
3. Napendelea kushika popo katika mkono wangu

173
1). Nakataa kabisa [ ] 2). Nakataa [ ] 3). Sijui [ ] 4). Nakubali [ ] 5). Nakubali Kabisa [
]
4. Siwezi nikaingia katika pango ambapo popo wanapatikana 1). Nakataa kabisa [ ] 2). Nakataa [ ] 3). Sijui [ ] 4). Nakubali [ ] 5). Nakubali Kabisa [
]
5. Siwezi kuishi katika nyumba ambayo popo wanapatikana 1). Nakataa kabisa [ ] 2). Nakataa [ ] 3). Sijui [ ] 4). Nakubali [ ] 5). Nakubali Kabisa [
]
6. Nikimouna popo mimi ukimbia mara moja 1). Nakataa kabisa [ ] 2). Nakataa [ ] 3). Sijui [ ] 4). Nakubali [ ] 5). Nakubali Kabisa [
]
7. Ni kwa kiwango ngani, wewe unafafikiria popo anachukiza? 1). Achukizi hata kidogo [ ] 2). Achukizi[ ] 3).sijui[ ] 4).Anachukizi kidogo[ ]
5). AnaAchukizi sana[ ]
8. Mimi naweza kukata mti wowote nyumbani kwetu ukifamiwa na popo 1). Nakataa kabisa [ ] 2). Nakataa [ ] 3). Sijui [ ] 4). Nakubali [ ] 5). Nakubali Kabisa [
]
9. Popo wanaharibu matunda katika shamba yetu 1). Nakataa kabisa [ ] 2). Nakataa [ ] 3). Sijui [ ] 4). Nakubali [ ] 5). Nakubali Kabisa [
]
SEHEMU-3-SCIENTISTIC
1. Mimi ningependa kufahamu/kujua mengi kuhusu popo 1). Nakataa kabisa [ ] 2). Nakataa [ ] 3). Sijui [ ] 4). Nakubali [ ] 5). Nakubali Kabisa [
]
2. Ingekuwa vyema kama tungesoma mengi kuhusu popo shuleni 1). Nakataa kabisa [ ] 2). Nakataa [ ] 3). Sijui [ ] 4). Nakubali [ ] 5). Nakubali Kabisa [
]
4. Siwezi nikaelewa vile mtu yeyote anawezwa kupendezwa na mambo ya popo 1). Nakataa kabisa [ ] 2). Nakataa [ ] 3). Sijui [ ] 4). Nakubali [ ] 5). Nakubali Kabisa [
]
6. Ningependelea kwenda safari ya kujifunza mambo ya popo 1). Nakataa kabisa [ ] 2). Nakataa [ ] 3). Sijui [ ] 4). Nakubali [ ] 5). Nakubali Kabisa [
]
SEHEMU-4-ECOLOGISTIC
1. Serikali inapaswa kumbuni sheria za kuhifadhi popo 1). Nakataa kabisa [ ] 2). Nakataa [ ] 3). Sijui [ ] 4). Nakubali [ ] 5). Nakubali Kabisa [
]
2. Popo ni mnyama wa maana katika mazingira yetu

174
1). Nakataa kabisa [ ] 2). Nakataa [ ] 3). Sijui [ ] 4). Nakubali [ ] 5). Nakubali Kabisa [
]
3. Popo anachangia katika utengezaji wa matunda ya mwituni 1). Nakataa kabisa [ ] 2). Nakataa [ ] 3). Sijui [ ] 4). Nakubali [ ] 5). Nakubali Kabisa [
]
4. Popo anachangia kutawanya mbegu za miti mwituni 1). Nakataa kabisa [ ] 2). Nakataa [ ] 3). Sijui [ ] 4). Nakubali [ ] 5). Nakubali Kabisa [
]
5. Popo anachangia kupunguza wadudu wabaya 1). Nakataa kabisa [ ] 2). Nakataa [ ] 3). Sijui [ ] 4). Nakubali [ ] 5). Nakubali Kabisa [
]
6. Mavi ya popo ni mbolea nzuri 1). Nakataa kabisa [ ] 2). Nakataa [ ] 3). Sijui [ ] 4). Nakubali [ ] 5). Nakubali Kabisa [
]
7. Upandaji miti unachangia uhifadhi wa aina nyingi za popo 1). Nakataa kabisa [ ] 2). Nakataa [ ] 3). Sijui [ ] 4). Nakubali [ ] 5). Nakubali Kabisa [
]
8. Mapango yana maana sana katika kuhifadhi popo 1). Nakataa kabisa [ ] 2). Nakataa [ ] 3). Sijui [ ] 4). Nakubali [ ] 5). Nakubali Kabisa [
]
9. Inchi yetu haitapoteza chochote aina wote wa popo wakiangamia 1). Nakataa kabisa [ ] 2). Nakataa [ ] 3). Sijui [ ] 4). Nakubali [ ] 5). Nakubali Kabisa [
]
SEHEMU-5-KNOWLEDGE
1. Popo ni ndege 1). Nakataa kabisa [ ] 2). Nakataa [ ] 3). Sijui [ ] 4). Nakubali [ ] 5). Nakubali Kabisa [
]
2. Popo hutaga mayai 1). Nakataa kabisa [ ] 2). Nakataa [ ] 3). Sijui [ ] 4). Nakubali [ ] 5). Nakubali Kabisa [
]
3. Popo anatembea tu usiku 1). Nakataa kabisa [ ] 2). Nakataa [ ] 3). Sijui [ ] 4). Nakubali [ ] 5). Nakubali Kabisa [
]
4. Popo anajenga kiota 1). Nakataa kabisa [ ] 2). Nakataa [ ] 3). Sijui [ ] 4). Nakubali [ ] 5). Nakubali Kabisa [
]
5. Popo anaishi katika nyumba 1). Nakataa kabisa [ ] 2). Nakataa [ ] 3). Sijui [ ] 4). Nakubali [ ] 5). Nakubali Kabisa [
]

175
6. Popo hawaishi Katika mapango 1). Nakataa kabisa [ ] 2). Nakataa [ ] 3). Sijui [ ] 4). Nakubali [ ] 5). Nakubali Kabisa [
]
7. Popo wanaishi katika miti 1). Nakataa kabisa [ ] 2). Nakataa [ ] 3). Sijui [ ] 4). Nakubali [ ] 5). Nakubali Kabisa [
]
8. Popo ni kipovu hawezi akaona kwa macho 1). Nakataa kabisa [ ] 2). Nakataa [ ] 3). Sijui [ ] 4). Nakubali [ ] 5). Nakubali Kabisa [
]
SEHEMU-6 MYTHS
1. Popo ni jini 1). Nakataa kabisa [ ] 2). Nakataa [ ] 3). Sijui [ ] 4). Nakubali [ ] 5). Nakubali Kabisa [
]
2. Ukimuona popo kwa nyumba yako, ametumwa na adui wako akudhuru 1). Nakataa kabisa [ ] 2). Nakataa [ ] 3). Sijui [ ] 4). Nakubali [ ] 5). Nakubali Kabisa [
]
3. Popo akikukojolea utakuwa tasa 1). Nakataa kabisa [ ] 2). Nakataa [ ] 3). Sijui [ ] 4). Nakubali [ ] 5). Nakubali Kabisa [
]
4. Popo akifamia nyumba yako mpya kabla ujaanza kiutumia, ni ishara mambo
mabaya 1). Nakataa kabisa [ ] 2). Nakataa [ ] 3). Sijui [ ] 4). Nakubali [ ] 5). Nakubali Kabisa [
]
5. Nyumba ambayo popo wengi wanapatika ni ishara ya kwamba ni matajiri 1). Nakataa kabisa [ ] 2). Nakataa [ ] 3). Sijui [ ] 4). Nakubali [ ] 5). Nakubali Kabisa [
]
6. Supu iliyotenezwa na nyama ya popo inatimbu kupooza 1). Nakataa kabisa [ ] 2). Nakataa [ ] 3). Sijui [ ] 4). Nakubali [ ] 5). Nakubali Kabisa [
]
7. Sehemu za mwili wa popo zinatumika na wachawi kuronga 1). Nakataa kabisa [ ] 2). Nakataa [ ] 3). Sijui [ ] 4). Nakubali [ ] 5). Nakubali
Kabisa [ ]

176
Appendix 17. List of publications
Papers in peer-reviewed journals (3)
1. Musila, S., Gichuli, N., Castro-Arellano, I. and Rainho, I. 2019. Composition and
diversity of bat assemblages at Arabuko-Sokoke Forest and the adjacent farmlands,
Kenya. Mammalia (https://doi.org/10.1515/mammalia-2018-0117 Received July 4,
2018; accepted June 27, 201).
2. Musila, S. & Bogdanowicz, Wieslaw & Syingi, Robert & Zuhura, Aziza &
Chylarecki, Przemysław & Rydell, Jens. 2019. No lunar phobia in insectivorous bats
in Kenya. Mammalian Biology. 95. 10.1016/j.mambio.2019.03.002.
3. Musila, S., Pavol Prokop & Nathan Gichuki .2018. Knowledge and Perceptions of,
and Attitudes to, Bats by People Living around Arabuko-Sokoke Forest, Malindi
Kenya, Anthrozoös, 31:2, 247-262, DOI: 10.1080/08927936.2018.1434065