
Materials management on construction projects - UoN ...
145
MATERIALS MANAGEMENT ON CONSTRUCTION PROJECTS: A CASE STUDY OF CONCRETING WORKS ON SITES IN NAIROBI BY ASIENGA J. EBOLE B. ARCH. (HONS) NRB. MAAK (A). REG. ARCHITECT A RESEARCH PROJECT PRESENTED AS PART FULFILMENT FOR THE AWARD OF THE DEGREE OF MASTER OF ARTS IN CONSTRUCTION MANAGEMENT OF THE DEPARTMENT OF REAL ESTATE AND CONSTRUCTION MANAGEMENT OF THE UNIVERSITY OF NAIROBI. NAIROBI 2005 40O University of NAIROBI Library
-
Upload
khangminh22 -
Category
Documents
-
view
1 -
download
0
Transcript of Materials management on construction projects - UoN ...

MATERIALS MANAGEMENT ON CONSTRUCTION PROJECTS: A CASE STUDY OF CONCRETING
WORKS ON SITES IN NAIROBI
BY
ASIENGA J. EBOLEB. ARCH. (HONS) NRB. MAAK (A). REG. ARCHITECT
A RESEARCH PROJECT PRESENTED AS PART FULFILMENT FOR THE AWARD OF THE DEGREE OF MASTER OF ARTS IN CONSTRUCTION MANAGEMENT OF THE DEPARTMENT OF REAL ESTATE AND CONSTRUCTION MANAGEMENT OF THE UNIVERSITY OF NAIROBI.
NAIROBI
2005
40O
U niversity of NAIROBI Library

DECLARATION
This research project is my original work and has not been presented in any university.
Signed DateA siengaJ. Ebole
This research project has been submitted for examination with the university supervision and approval of;
Philip MuchunguM.A (Building Management), B.A (Building Econ),
...... ........................Date
11

ACKNOWLEDGEMENT
This study and the entire course would not have been possible without the grace of God
Almighty. To him I give all the glory and honour.
I am very grateful to my supervisor Mr. Philip Muchungu for patiently and faithfully
guiding me through the research project. His comments were very valuable.
I acknowledge the input received from the rest o f the members o f staff and the
encouragement from my student colleagues.
Finally, I express my sincere thanks to Grace Ndege for her kind assistance in patiently
typing this work.
Thanks to all and God bless.
m

DEDICATION
To my dear wife Irene Cherotich for her love, support and encouragement; and to
daughters Dasha Muyanzi and Delcy Muhani for their inspiration.

ABSTRACT
Materials management can be defined as the planning and controlling o f all
necessary efforts to make certain that the right quality and quantity o f materials are
appropriately specified on time, are obtained at a reasonable cost and are available
when needed.
Materials management involves an integrated coordination o f all materials related
functions. These functions can be carried out efficiently only when sufficient
emphasis is placed on early project planning, use o f qualified personnel, adequate
personnel training and proper communication amongst those involved in the
process.
The essential and desired site materials characteristics (materials attributes) of right
quality, right quantity, right time and reasonable cost are evidently scarce on
construction projects in Kenya as characterized by emergency purchases of
materials, inadequate storage, material shortages and sometimes condemnation o f
materials and works by consultants.
The construction industry is becoming increasingly competitive and materials
management is now considered to be one o f the frontiers for cost reduction to
improve profitability and productivity, as materials can constitute 30-50% of the
cost o f the project. The problem o f poor materials attributes therefore needs to be
addressed and minimized.
This study hypothesized that inadequate materials management is the cause of poor
materials attributes on construction projects.
The objectives o f the study were to establish the extents o f materials management
and materials attributes on the construction sites, and to establish the relationship
between the two.
v

In order to achieve the objectives, the study carried out a survey o f concreting
works on accessible active sites in both formal and informal construction in Nairobi.
Data from the sites was statistically analyzed. Regression analysis between the two
major variables; extent o f materials management and extent o f materials attributes,
was carried out using SPSS software. Inferential statistics was used in hypothesis
testing and generalization o f the results.
The study concluded that inadequate management o f materials has resulted in
the poor level of materials attributes on construction sites. The problem was
found to be more severe on informal sites than on formal sites. The study
recommends that a systematic and integrated approach is needed to manage
materials and minimize the costs and effects associated with inadequate materials
management.
vi

TABLE OF CONTENTS
Title........................................................................................................................................................ (i)
Declaration..........................................................................................................................................(ii)
Acknowledgement............................................................................................................................(iii)
Dedication........................................................................................................................................ (iv)
Abstract................................................................................................................................................ (v)
Table o f contents.............................................................................................................................(vii)
List o f figures................................................................................................................................... (xi)
List o f ta b les ................................................................................................................................... (xii)
List o f abbreviations and acronyms............................................................................................ (xiv)
CHAPTER ONE: INTRODUCTION
1.1 Background o f the study........................................................................................................ 1
1.2 Problem statement................................................................................................................... 5
1.3 Research hypothesis.................................................................................................................6
1.4 Objectives o f the study............................................................................................................6
1.5 Significance of the study.........................................................................................................6
1.6 Scope and justification...........................................................................................................8
1.7 Limitations o f the study........................................................................................................... 9
1.8 Study assumptions.................................................................................................................... 9
1.9 Organization of the study......................................................................................................10
1.10 Definition o f terms................................................................................................................11
CHAPTER TWO: LITERATURE REVIEW
2.1 Introduction........................................................................................................................ 12
2.2 Theoretical framework......................................................................................................... 12
2.2.1 Management approaches.........................................................................12
2.2.2 Systems approach......................................................................................13
Page No.
Vll
2.2.3 Ingredients o f a system............................................................................. 14
2.2.4 Characteristics o f a system........................................................................16
2.2.5 Types o f systems....................................................................................... 16
2.2.6 Materials management and systems theory.......................................... 16
2.3 History and evolution of materials management............................................................ 17
2.4 Functions o f materials management...................................................................................19
2.4.1 Definition o f management....................................................................... 19
2.4.2 Planning, organizing and communication............................................20
2.4.3 Materials take off.....................................................................................25
2.4.4 Vendor selection.........................................................................................26
2.4.5 Purchasing.................................................................................................. 27
2.4.6 Expediting.................................................................................................. 30
2.4.7 Quality assurance and quality control...................................................32
2.4.8 Transportation.............................................................................................33
2.4.9 Site materials management....................................................................... 35
2.4.10 Surplus materials....................................................................................... 38
2.4.11 Materials w astage....................................................................................... 39
2.4.12 Bulking and shrinkages............................................................................43
2.5 Material management and computer systems............................................................... 44
2.6 Classification of construction m aterials.......................................................................... 46
2.7 Concrete in construction.................................................................................................... 47
2.7.1 Historical background..............................................................................48
2.7.2 Constituents o f concrete........................................................................... 49
2.7.3 Reinforced concre te .................................................................................. 51
2.7.4 Forms of concre te ......................................................................................52
2.7.5 Concreting p rocess....................................................................................53
2.7.6 Significance o f concrete in construction process in K en y a ..............56
CHAPTER THREE: METHODOLOGY
3.1 Introduction............................................................................................................................58
3.2 Description o f study area and population......................................................................... 58
viii
3.3 Research design..................................................................................................................... 59
3.4 Sampling techniques and sample size...............................................................................59
3.5 Data collection instruments................................................................................................. 61
3.6 Data collection procedures.................................................................................................. 61
3.7 Measurement of variables................................................................................................... 62
3.7.1 Independent variable.................................................................................62
3.7.2 Dependent variable.................................................................................... 64
3.8 Data analysis techniques..................................................................................................... 65
CHAPTER FOUR: DATA PRESENTATION AND ANALYSIS
4.1 Introduction.......................................................................................................................... 67
4.2 Findings and analysis o f independent variable.............................................................. 68
4.2.1 Planning, organizing and communication.............................................68
4.2.2 Materials ta k eo ff ......................................................................................71
4.2.3 Vendor/supplier identification and selection..................................... 73
4.2.4 Purchasing...................................................................................................78
4.2.5 Expediting................................................................................................. 79
4.2.6 Transportation........................................................................................... 80
42.7 Site materials m anagem ent.................................................................... 82
4.2.8 Quality m anagem ent................................................................................84
4.2.9 Wastage management................................................................................87
4.2.10 Surplus management.................................................................................88
4.3 Findings and analysis o f dependent variable.................................................................. 90
4.3.1 Availability o f materials........................................................................... 90
4.3.2 Wastage o f m aterials.................................................................................92
4.3.3 Quality o f m a teria ls ..................................................................................93
4.3.4 Surplus m ateria ls...................................................................................... 94
4.3.5 Cost o f m ateria ls........................................................................................95
4.4 Measurement of variables.................................................................................................. 95
4.5 Statistical analysis and hypothesis testing ....................................................................... 97
IX

CHATER FIVE: CONCLUSIONS AND RECOMMENDATIONS
5.1 Introduction.........................................................................................................................109
5.2 Findings on study objectives...........................................................................................109
5.3 Conclusions........................................................................................................................113
5.4 Recom mendations.............................................................................................................114
5.5 Suggested areas o f further s tu d y ....................................................................................116
BIBLIO G RA PH Y ...........................................................................................................................117
APPENDIX A - Letter o f introduction..................................................................................... 122
APPENDIX B - Questionnaire to contractors........................................................................... 123
APPENDIX C - Classification of contractors........................................................................... 131
x

LIST OF FIGURES Page No.
2.1 Illustration o f systems theory.............................................................................................15
2.2 The quality process o f construction materials................................................................ 33
2.3 Formation o f concrete.......................................................................................................... 48
2.4 Issues and interactions affecting concreting process for insitu concrete structures..55
4.1a Frequency graph for materials managem ent.................................................................. 101
4. lb Frequency graph for materials attributes.........................................................................101
4.2 Regression graph ............................................................................................................... 104
xi

2.1 Construction materials wastage norms.............................................................................42
2.2 Bulking and shrinkage allowance......................................................................................44
3.1 Scoring for functions o f materials management............................................................. 64
3.2 Scoring for materials attributes.......................................................................................... 65
4.1 Categories o f contractors................................................................................................... 67
4.2 Level o f training for materials managers on sites...........................................................69
4.3 Integrated materials management p lans...........................................................................70
4.4 Organizing for m aterials......................................................................................................71
4.5 Materials estim ation............................................................................................................ 71
4.6 Vendor selection (form al).................................................................................................. 73
4.7 Vendor selection (inform al)............................................................................................... 74
4.8 Number o f vendors selected (form al).............................................................................. 75
4.9 Number o f vendors selected (inform al)........................................................................... 75
4.10 Reasons for selection o f vendor (form al)........................................................................76
4.11 Reasons for selection of vendor (inform al)..................................................................... 77
4.12 Placement o f orders (fo rm al).............................................................................................78
4.13 Placement o f orders (inform al).......................................................................................... 78
4.14 Expediting/follow up on materials orders........................................................................ 79
4.15 Involvement in transportation o f m aterials...................................................................... 80
4.16 Involvement in packaging o f m aterials............................................................................. 80
4.17 Mode o f transportation for formal s ite s ............................................................................81
4.18 Mode o f transportation for informal s ite s ........................................................................ 81
4.19 Activation o f ordering o f m ateria ls ................................................................................... 83
4.20 Storage o f materials for formal sites................................................................................. 84
4.21 Storage o f materials for informal s ite s .............................................................................84
4.22 Quality control in purchasing..........................................................................................85
4.23 Measuring o f ingredients for concrete........................................................................... 86
4.24 Mixing o f concrete.............................................................................................................86
4.25a Slump test for fresh concrete ...........................................................................................86
4.25b Cube test for concrete....................................................................................................... 87
LIST OF TABLES Page No.
xii

4.26a Measurement of materials on formal s ite s ......................................................................88
4.26b Measurement of materials on informal s ite s .................................................................. 88
4.27 Delivery o f concrete into p o s itio n .....................................................................................88
4.28 Causes o f surplus on sites....................................................................................................89
4.29 Use o f surplus m aterials......................................................................................................90
4.30a Materials storage p rob lem s...............................................................................................91
4.30b Materials shortages............................................................................................................ 91
4.30c Emergency purchases of m ateria ls.................................................................................. 91
4.30d Extended working hours on s ite s .....................................................................................92
4.31 a Wastage o f materials on s i te s ............................................................................................92
4.31b Damage o f materials on sites............................................................................................. 93
4.32a Wrongful purchase o f m ateria ls........................................................................................94
4.33 Surplus materials on sites.................................................................................................... 94
4.34a Scoring for independent variab le ..................................................................................... 96
4.34b Scoring for dependent variab le ........................................................................................ 96
4.35 Summary of scoring for all the s ite s ................................................................................. 98
4.36 Descriptive statistics............................................................................................................ 99
4.37a Frequency table for level o f materials m anagem ent.................................................. 100
4.37b Frequency table for level o f materials attributes..........................................................100
4.38 Correlation between materials management and materials attributes......................102
4.39a Anova regression ta b le ......................................................................................................103
4.39b Coefficients o f correlation................................................................................................ 104
4.40 Comparative statistics between formal and informal s ite s .......................................... 106
4.41a Frequency table for level o f materials management for formal s ite s ................... 107
4.41b Frequency table for level o f materials management for informal s ite s ................107
4.41c Frequency table for level o f materials attributes for formal s ite s .........................108
4.4 Id Frequency table for level o f materials attributes for informal s ite s ......................108
xm

ABBREVIATIONS AND ACRONYMS
GPD: Gross Domestic Product
JBC: Joint Building Council
USA: United States of America
GTZ: Germany Technical Cooperation
CII: Construction Industry Institute
CICE: Construction Industry Cost Effectiveness
CAD: Computer Aided Design
FOB: Free on Board
FOR: Free on Rail
CIF: Cost Insurance and Freight
MTO: Materials Take Off
MOW: Ministry O f Works
CBD: Central Business District
ICT: Information and Communication Technology
GOK: Government of Kenya
ILO: International Labour Organization
SPSS: Statistical Programme for Socio-Scientific Data Analysis

CHAPTER ONE
INTRODUCTION
1.1 Background of the study
Construction materials can constitute 30-50% of the cost of the project
(Dawood 1996). Hence, effective management of building materials is of
cardinal importance to the construction project.
Good project management in construction must therefore vigorously pursue
the efficient utilization o f materials.
It has also been estimated that in the American construction industry, the lack
o f effective materials management has resulted in work hour overruns of up to
18%, and a basic materials management system can be expected to provide up
to 6% improvement in craft labour productivity (Thomas et al 1989).
Though there are no documented figures for the work hour overruns for
Kenyan construction industry, given the inefficiency in general management
o f construction projects in Kenya (Gichunge 2000), the figures are likely to be
high for the Kenyan situation.
Materials wastage is also considered to be one of the most serious aspects of
site production, though little is done to avoid this financial loss (Edmeads
1972).
It has also been estimated that up to 6% of all construction labour costs could
be saved if materials are available when needed (CII 1988). As Construction
projects become more competitive, new management techniques are necessary
to make construction projects more productive and thus more cost effective.
One area of concentration to establish projects o f shorter duration and less cost
is materials management.
1

Construction professionals are recognizing the need to focus on the materials
management process as a proactive identifiable entity that has a significant
impact on the cost of construction.
In America, the Construction industry institute (CII) formed a task force in
1983 to investigate problems in materials management in construction.
Construction materials management has then continued to be a major problem
o f concern in the American construction industry in the last two decades (Cryl
2001).
Many construction contractors have continued to address the problem of
materials management by trying to develop integrated materials management
systems that combine and integrate; the take off, vendor evaluation,
purchasing, warehousing, and distribution functions. Some of the systems are
computer based (Thomas et al 1989).
The availability of materials may greatly influence the schedules in projects
with fast track or very tight time schedules. Materials management when
properly planned and executed could provide project management with an
invaluable tool to optimize schedules and improve labour productivity (Bell
and Stukhart 1987).
The ability to manage the flow of materials has also been found to have a great
impact on the profitability of the firm (Tavakoli and Kakalia 1993).
Locally there is little evidence of efforts towards improved materials
management on construction projects. However, large and avoidable costs on
construction sites have been associated with materials mainly arising from
storage, labour, inventory and wastage (Oketch 2004).
Losses of building materials occur on most construction sites in Kenya
(Omondi 1999), and wastage of materials is a major problem on construction
sites in Kenya where the levels of wastage are considered to be fairly high
(Thairu 1999).
2

The volume and composition of construction output in Kenya has seen
significant changes since the 1980s. The contribution of the construction
industry to GDP declined from 6.5% in 1980 to 4.9% in 1990 to 4% in 1999
(Mitullah and Wachira 2003).
This is mainly a reflection of the decline in public sector investment in
construction and the harsh economic conditions prevailing in the country. This
decline in construction output is likely to continue until the economy recovers.
The trend has also seen increase in private sector developers dominate the
building construction market through the informal system where the developer
operates as the contractor and mostly with limited financing. These developers
mostly hire artisans to carry out the construction and the developer takes the
responsibility of management of materials, often relying on advice from the
artisans who may not be very experienced in materials management. Most of
these developers are not trained or experienced in issues o f construction and
experience many problems some of them material related (Okaka 2004).
For the formal contracts where the contractor takes charge o f the construction,
most of the building contracts by implication, confer the responsibility of
materials management to the contractor. However, some of the clauses about
materials in the contracts leave the contractors very vulnerable to liabilities
thus demanding prudence materials management by the contractors. Clause
23.4 of the Joint Building Council’s agreement and conditions of contract for
building works states that where not so described, the materials, goods and
workmanship shall be to a standard “appropriate” to the works and to the
“reasonable” satisfaction of the architect (The Joint Building Council, Kenya
1999). It further gives the architect authority and grounds to reject materials
and works at the expense of the contractor.
There has been an occasional shortage of materials, increased cost o f materials
due to inflation and stiff competition amongst contractors. In 2004, though the
construction industry was estimated to have grown by 11.9%, the sector was
hampered by increases in costs with the overall cost going up by 10%.
3

Construction material costs have been going up since 2001. For the year 2004
the cost of steel went up by 60%, cement by 10%, aggregates by 16.7%
cypress timber by 10.1% and cedar timber by 50% (Daily Nation, Friday 27th
May 2005).
Though the fluctuating contracts cover the contractors against inflation and
provide allowances for wastage, this is only to a limited extent.
The Kenyan construction industry has occasionally been blamed for general
poor quality and there is absolutely lack of general quality assurance in the
industry (Dindi 2004) and materials quality is an important component of the
general construction quality.
In the face of all these challenges, materials management is now considered to
be one of the frontiers for cost reduction to improve profitability and
productivity.
The Construction industry is increasingly becoming competitive and good
management practices are essential for those who want to remain competitive.
However, the essential and desired site materials characteristics (materials
attributes) of right quality, right quantity, right time and reasonable cost are
evidently scarce on construction projects in Kenya.
Can the Kenyan contractor/developer adequately manage materials for
specified tasks on the site?
This study investigates the relationship between the extent o f materials
management (Planning, organizing and controlling) and materials attributes
(availability, right quality, reasonable cost, minimal surplus and minimal
wastage) for concreting materials (ballast, Sand, Cement, steel and water) on
construction projects in Nairobi.
4

1.2 Problem statement
Construction projects in Kenya can be said to experience poor materials
attributes in terms of availability, right quality, reasonable cost, minimal
surplus and minimal wastage.
Observed manifestations o f poor materials attributes on the
construction site include but are not limited to the following;
i. emergency purchases of materials
ii. stoppage o f work due to material shortages
iii. ambiguity in working hours (like concreting in the night)
iv. surplus materials on site
v. inadequate storage space for materials
vi. uncontrolled wastage of materials
vii. damaged materials on site
viii. wrongful purchase of materials
ix. condemnation of materials and works by consultants
x. disappearance of materials from site through theft.
The design and construction of buildings is a balance and compromise in the
circumstances existing at the time, between quality, time and cost (Turner
1997).
Building projects in Kenya have been observed to experience time and cost
overruns, and increased litigation (Talukhaba 1999). There are also concerns
over quality standards (Dindi 2004).
Costly labour delays experienced due to required quantity and quality of
materials not being available could lead to increased cost overruns and
overall delays in the construction project and could also affect the quality of
the constructed facility.
5

The overall effect of poor materials attributes could therefore significantly
lead to increased time and cost overruns, and poor quality for the project. At
worst, for the contracted projects, it could also lead to protracted legal battles
and arbitration due to cost and time overruns, and bad quality of the project.
The problem under study is the cause o f poor materials attributes on
construction sites in Kenya.
1.3 Research hypothesis
It is the hypothesis of this study that inadequate materials management is the
cause of poor materials attributes on construction projects in Kenya.
1.4 Objectives of the study
The primary objective o f this study is to establish the extent o f materials
management on construction projects in Nairobi.
Pursuant to this objective, the study will therefore attempt to;
I. Examine the performance of materials management activities on
construction projects
II. Examine the extent of materials attributes on construction projects
III. Establish the relationship between the extent of materials management
and materials attributes on construction sites
1.5 Significance of the study.
It is widely recognized that construction industry plays a vital role in the
process of economic growth and development, both through its products
(infrastructure, buildings) and through the employment created in the process
o f construction itself (Gruneberg 1997 ).
6

Construction Industry in Kenya is an important source of employment, income
and capital formation. The industry creates investment opportunities for
individuals, firms and government as well as providing basic infrastructure
such as roads, housing, water and sewerage facilities required for development
o f other sectors (Kinyanjui and Mitullah 1997).
As mentioned earlier in this study, construction materials can constitute up to
50% of the cost of the project thus playing a very significant role in the
success of the project and the industry as a whole.
The industry has been very competitive recording only minimal annual
growth, 1.2% in 2003 (GOK 2004). Though the annual growth in 2004
increased to 11.9% (Daily Nation, Friday May 27Ih 2005) this high growth rate
cannot be guaranteed. Tendering procedures have also become very
competitive. Many contractors are therefore forced to take contracts at very
minimal profit margins. Occasionally some o f the contractors have had to
close down due to losses or have even been unable to complete some projects.
If good materials management can be enhanced, project delivery and profit
levels for the contractor or savings for the client will be greatly improved. This
will also ensure that they remain competitive and sustainable.
In a survey carried out by GTZ of input content on construction works in a low
income housing project in Nairobi (Umoja 11), it was revealed that at least
37% of the project cost demanded foreign exchange for purchasing building
materials, equipment and fuel (Kinyanjui and Mitullah 1997). Prudent
materials management would therefore be important if it was to be practiced in
the entire industry as it could have a direct impact on external trade.
Effective materials management can provide better tools to the work force,
improve cost effectiveness and have a significant impact on the ability of the
construction industry to compete in both the domestic and international market
place.
The informal construction sector within the construction industry has grown
since the 1970’s. With limited expertise and experience, this sector is likely to
7

experience more negative material attributes and eventually less efficiency.
The outcome o f this study will also assist the sector to be more efficient.
Even for the established contractors, because of lack of regulated legal
framework to regulate those who enter the industry as contractors, most of the
construction firms lack qualified personnel to handle the management
functions of the firms ( Wachira 2003). This study would therefore be helpful
to such firms in improving their management o f materials.
1.6 Scope and justification
For practical purposes, the study has been limited in scope to management of
materials and does not indulge into other management aspects of the project
that could also affect project performance.
The materials under study have been limited to major materials that constitute
concrete (ballast, Sand and Cement). Water which is also an ingredient of
concrete has also been briefly covered. However, formwork which is a
component of the concreting process has not been considered in data
collection in order to maintain the scope to manageable levels.
The activity o f study is major concreting works like casting of slabs and
columns, which mainly have to be done at once.
Concreting works were convenient to study, concrete being an end product of
several materials mixed together under defined standards/specifications. The
simultaneous use of many materials to give this end product is likely to
strongly expose aspects o f inadequate management of materials.
Concrete in its varied forms is used on virtually all building projects mainly
due to its unique properties and it being readily available. Consumption of
cement, which is the main constituent material o f concrete, is used to establish
the growth of the building industry (Daily Nation, Friday 27th May 2005).
Timber, steel and stone are supposedly substitute materials to concrete.
However due to various limitations of these substitutes, even when they are
used, they are always used together with concrete for anchoring, binding or
8

finishing. A study of concrete and its constituent materials is therefore likely
to receive wider application.
Although other factors could also be contributory to poor materials attributes,
in depth analysis has only been carried out on the relationship between extent
o f materials management and materials attributes.
This scope covers sites where concrete is prepared and cast on site (in situ) as
well as where ready mix concrete is used but not where precast concrete is
used since the first two are the most used on construction sites in Kenya.
This scope is meant to narrow down the study to a manageable level and
enable the researcher to carry out focused analysis.
1.7 Limitations of the study
By geographical coverage, the study is limited to the city of Nairobi due to
financial and time constraints.
Active construction sites within the city where reasonable concreting works
have been carried out have been considered to form the population.
Time constraints, lack o f adequate resources and denied access to sites limited
the actual number of sites studied.
1.8 Study assumptions
It is the basic assumption of this study that the sites studied follow
conventional construction procedures where regardless of the construction
procurement method used, designs are taken to some reasonable level of
completion before construction work begins.
It is assumed that the problems of poor materials attributes face both formal
and informal construction projects. However, it should be noted that there are
differences between the two groups particularly in terms of objectives,
resources, personnel, equipment, working procedures and general site
operations, which could impact on materials management. The study therefore
9

considered almost equal number of cases for both formal and informal
construction sites. Data presentation and analysis was therefore mainly
separated and also contrasted between formal and informal.
The size of the project, method of financing and size of the contractor could
also have influence on materials management. However, the study did not
dwell on these influences in details.
The study also assumed that the contractors or developers on sites studied are
not scrupulous and that they are interested in good project delivery,
particularly in terms of time, cost and quality.
Concreting was selected to form the basis o f this study because concreting is
done on virtually all major construction works and the process o f concreting
encompasses most of the major issues about materials management and
materials attributes. Thus concrete was assumed to be representative enough to
study. However, it is assumed that the findings of this study are applicable to
the rest of building materials.
Since Nairobi has the highest level of construction activities and all the
projects studied are in Nairobi, it is assumed that it would be representative of
other regions of the country. Nairobi is the capital city and the most active
economic centre of the country. Operations o f economic activities in other
parts of the country are mostly typical to similar activities in Nairobi.
1.9 Organization of the Study
The Study has five chapters;
Chapter one gives a general introduction including background o f the study,
problem statement, research hypothesis, objectives of the study, significance
o f the study, scope and justification, limitations, assumptions, organization of
the study and definition o f terms.
Chapter two covers literature related to management of materials and materials
attributes. This forms the theoretical basis o f the study and the basis for
evaluation of primary data to make research conclusions.
10

Chapter three covers research methodology. This includes research design,
population and sample, data collection procedures, data analysis procedures
and measurement of variables
Chapter four contains the actual data from the survey. It gives the findings and
analysis related to the problem of the study.
Chapter five contains conclusions and recommendations of the study.
1.10 Definition of terms
Materials attribute
Level/extent -
Informal
Formal
Overruns
Inadequate
Variables
Primary data -
Contractor
Client
Client contractor
Vendor/supplier
- an essential and desired site materials characteristic
magnitude or measure
not fully regulated by law
fully regulated by law
continue beyond or exceed the expected
not sufficient or good enough for a particular purpose
a measurable characteristic that assumes different values
amongst subjects
original data collected by researcher from the population
person or firm that has been awarded a contract for the
construction and completion o f a building
employer to contractor/building owner/developer
- where the building owner undertakes responsibility of
building himself without engaging a contractor
One who provides construction materials or equipment
11
CHAPTER TWO
LITERATURE REVIEW
2.1 Introduction
This chapter contains an extensive and thorough review o f relevant
publications and studies related to the research problem under investigation in
order to obtain detailed knowledge about the area under study.
2.2 Theoretical framework
2.2.1 Management approaches
Despite the inexactness and relative crudity of management theory and
science, the development of thought on management dates back to the days
when people first attempted to accomplish goals by working together in
groups. Although the modem operational management theory dates primarily
from the early twentieth century, there was serious thinking and theorizing
about managing many years before (Weihnrich and Koonz 1993).
There are three broad models of management which encompass most of the
ideas put forward about management over time. These are; the traditional
model, the behavioural and management science model, and the systems
approach.
The traditional model o f management is a broad body of knowledge, which
was put forward by early management thinkers to replace the rule o f thumb
method, which was used prior to the formation of a coherent body of
management knowledge. The aspects of traditional model include Fredrick
Taylor’s scientific management, Henri Fayol’s administrative management
and Max Weber’s bureaucratic model.
12
The behavioural science model of management seeks to understand, explain
and predict human behaviour in the same sense in which scientists understand,
explain and predict the behaviour of physical forces or biological factors.
The management science (operations research) approach is an improvement of
Taylor’s scientific management with an addition of more sophisticated
methods, computer technology and an orientation towards broader problems.
All the approaches explained above view an organization as an independent
entity whose success is governed by the appropriateness and consistency of the
tools of internal management (Kithinji 1988). These approaches contrast
heavily with the systems approach discussed below.
2.2.2 Systems approach
The systems approach realizes that a solution is achieved through the
interaction of many forces in the environment. The appeal of the systems
approach is the emphasis on the interrelatedness of the component parts.
Materials management is an organizational philosophy that has evolved
through applications of systems approach to management (Magad and Amos
1995)
A system may be defined as any group of interrelated parts or components that
function together to achieve some goals (Datta 2003).
This concept is used in manufacturing where for example a large
manufacturing organization viewed in its entirety, is a social system, having
many decisions which in tum may have departments, each of which is again a
system, or more precisely a subsystem.
The components of a system may themselves be systems with their own
components.
13

2.2.3 Ingredients of a system
There are four distinct and essential ingredients of a system. The first is the
input. In a manufacturing organization this could constitute, machinery, raw
and other materials.
The second ingredient is the process, which means a series of operations
performed by people and machinery, which transform raw and other materials
into finished goods.
The third ingredient is the output, which are the finished goods.
Finally is the control which gives rise to the need of management.
An open system does not exist in a vacuum but in an environment over which
it has little or no control, this control element is always present and works
through feedback loop (Weihnrich and Koonz 1993).
14

External environment
Figure 2.1: Illustration of systems theory
Source: Koontz and Weihrich (1993)
This loop is an important means through which management controls the
operations o f the enterprise taking corrective measures when needed to
achieve the desired goals.
Environment here means the set of all objects, which are influenced by/or
influence a system.
Export
(Output)
15

2.2.4 Characteristics of a system
The following are the characteristics of a system
i. the system is man-made
ii. all the components contribute to the same set of objectives
iii. the system is can be large and complex
iv. at least a part o f the operations are unpredictable
v. some functions are always performed by machines and others are
performed by human beings (Datta 2003).
2.2.5 Types of systems
There are various types o f systems as follows;
i. Natural systems created by man
ii. Open or closed systems where we take account o f the influence of
the environment on the systems under examination.
iii. Adoptive or non adoptive systems where adoptive systems can be
described as learning from experience
iv. Stable and unstable systems, a system being regarded as stable if the
values inherent in the system are constant or can be held within
defined limits.
v. Feedback systems or non-feedback systems (Chandler 1978).
2.2.6 Materials management and systems theory
When we use the systems concept as a framework for managing materials, we
find that it not only interacts with its environment, that is to say, anything
external to the system itself, but also interacts with the system’s components.
In particular when outside constraints limit operation, management must take
steps that will provide for a change.
Materials management can be defined as an integrated system which
emphasizes specific activities or functions and in which its relationships with
16
others are pronounced. Therefore it is not tied up to any specific structure,
rather it is system oriented. It takes account of the functional dependence with
an organization structure as a secondary consideration.
An integrated systems approach considers the entire flow of materials as
opposed to a partial flow. Any study which does not deal with this entire range
o f factors may tend to be simplistic. It is a dynamic management function,
which is again characterized by high level of sensitivity. Thus a change in one
sub-function is related to the changes in others, depending on the degree of
sensitivity (Magad and Amos 1995).
While the structure is static, the realities it attempts to fit into are dynamic.
Conversely structural models should be settled on the basis of similarities of a
given situation. Thus it will be seen that some of the materials management
functions require some basic modifications due to the changes in the industrial
management dynamics, which characterize the industrial society o f today
The task involved requires a sound approach in principle and its application to
obtain the desired results. It is this thinking which has given rise to the concept
o f integrated materials management.
2.3 History and evolution of materials management
Since creation, humans have been concerned with obtaining, moving and
controlling materials.
The term materials management came in use after world war II. Beyond an
enormously increased production capacity, the American military
requirements o f the war, demanded a means to reduce the time required to
produce needed products. Through the 1950’s and 1960’s fluctuation in
national and international markets requirements and economic conditions
highlighted the need for total control of materials.
Total materials management began to spread as an organizational concept in
America during the 1950’s and 1960’s.
17

During the 1970’s businesses in the USA were confronted with scarcity of
money, price controls, ecological concerns, energy shortages, and rapid
increases in energy costs. They therefore increasingly adopted materials
management as a way o f controlling costs and operations.
In 1969, individuals concerned with the inflation in the cost of construction
created the Construction Users Anti-Inflation Roundtable. In 1972, other
organizations merged with the Construction Users Anti-Inflation Roundtable
to form The Business Roundtable. The goal o f the committee was to promote
“quality, efficiency, productivity and cost effectiveness in the industry” .
In 1978 in response to deteriorating productivity in the industry, the
construction industry cost effectiveness (CICE) project was formed. In
response to one of the CICE recommendations the construction industry
institute (CII) was formed in 1983. CII formed a task force in 1983 to
investigate problems with materials management in construction (Cryl 2001).
From the Business Roundtable study, the CII developed a handbook, Project
Material Management Handbook, and a tutorial of a database type system. The
study tied proper management of materials to increased productivity on
projects.
The purpose of the CII publications was to assist owners, designers and
contractors in employing modem, successful materials management
techniques.
A study by the CII in the 1980s showed that 20% of the craftsperson’s time
was spent waiting on materials. It was also determined that materials and
equipment make up 50-60 percent of a construction project cost, and the lack
o f materials was the leading cause of construction delays (Stukhart 1995).
18

2.4 Functions of materials management
2.4.1 Definition
The term “management” has many facets. Mainly it is characterized by
reference to a group of individuals in an organization having the authority and
responsibility to make decisions, the total sum of the tasks performed by the
individuals, or the body of knowledge underlying the performance (Mbatha
1993).
Different authors may give different definitions for management though the
underlying principle and meaning remain the same.
Management is the process of designing and maintaining an environment in
which individuals, working together in groups, efficiently accomplish selected
aims (Weihnrich and Koontz 1993).
The “Functions Approach” to management considers management functions
as its most fundamental.
The indisputable managerial functions are planning, organizing and
controlling. A fourth function is the role of the manager in starting the system
and keeping it together. For some it is directing and for others it is leading.
Staffing has also become a significant function in the utilization of human
resources. Co-ordination, on the other hand, began as a separate function but it
is now considered an integral part of the entire management process
(Weihnrich and Koontz 1993).
Managing is concerned with productivity, which implies effectiveness and
efficiency.
Materials management can therefore be defined as the planning and
controlling o f all necessary efforts to make certain that the right quality and
quantity of materials are appropriately specified in a timely manner, are
19

obtained at a reasonable cost and are available when needed (Bell and
Sturkhat 1986).
Management of materials is therefore not just a concern during the
construction phase of the project but should actually begin when a materials
take off is performed to produce a bill of materials.
Different authors give different listings for functions and sub-functions of
materials management. However, in this study, the following functions and
sub-functions can be listed as logical boundaries of materials management.
i. Planning, organizing and communication
ii. Materials take off
iii. Vendor selection
iv. Purchasing
v. Expediting
vi. Quality assurance and control
vii. Transportation
viii. Site materials management
ix. Management of surplus
x. Management o f wastage
2.4.2 Planning, organizing and communication
Planning is a decision making process in advance of action which endeavors to
design a desired future and effective ways o f bringing it about.
Material planning is a scientific technique o f determining in advance the
requirements of materials as dictated by the production program. Construction
process relies to a great extent on the exchange of information and permanent
interactions o f entities and resources.
20

The interrelations of relevant participants in a construction process are
considerable and their management will have a different impact on the success
o f the project.
Adequate material management may involve complex communication
mechanisms, education activities and training programs that must be
established early in the project.
Decisions that are made early in the planning stages of the project appear to be
critical to the overall success of the project.
It is important to develop a project material plan which is a fundamental and
important document unique for each project.
In developing the materials plan, various factors must be considered such as
project size, scope, location, cash flow requirements, schedule and lead times
of critical purchases, owner philosophy, owner approvals, number of project
participants, inspection roles, acceptable suppliers list and extent of
prefabrication.
There must be a clear understanding of the materials required, their packaging,
quality available or required and other associated materials like thinner for
paint.
It is also important to understand the equipment and tools needed in the work
process.
The materials plan should record the assignment of responsibilities for
functions involved in materials management.
Engineering materials including equipment are the most visible, costly,
complex and quality critical. Engineered materials will usually drive the
project schedule, and major equipment lead times will influence the
engineering schedule.
Bulk materials’ planning is more difficult because bulk materials are more
numerous and quantities are never exactly known until the job is over.
21

Design evolution causes continual updating o f the bulk requirements (CII
1988).
Scheduling the entire materials program is essential to meeting the project
timetable. Materials schedules are as critical as those of engineering and
construction and span all phases of the project from defining and approving
the requirements to purchasing, vendor lead time, transportation and site
management. The schedule must determine sequential distribution o f quantity
over a period of time to avoid cash flow problems and other problems
associated with excess storage of materials like theft and damage.
International materials management schedules should include time for
transportation, import licensing and customs clearance.
Planning must also consider responsibility for purchasing (home office and
site) including vendor selection, terms and conditions of the purchase order,
forms used in purchasing, and procedures and schedules. Particular care
should be given to invoicing and payment procedures, which should be
discussed with accounting and the vendor to avoid any misunderstandings.
The transportation plan should consider safety, cost, timely delivery,
hazardous material content and point of title transfer. O f particular concern
are foreign shipments, which involve considerable, additional complications in
terms of export regulations, delays, tracing o f shipments and licensing and
import requirements.
Planning for site materials management includes consideration for receiving,
storage, control and distribution of materials at the construction site. This
includes layout and organization of lay down areas and warehouse facilities,
development of storage and maintenance plans, and planning for access to and
within the site. Preparations for field purchasing, materials control and
expediting must also be addressed. All of these functions should be planned to
allow craft labor work planning to proceed on the basis of known materials
availability.
22
An elaborate planning should be continuously reviewed to establish minimum
and maximum stock levels required at any given time of the project in order to
facilitate purchasing of materials.
The stock levels would depend on the rate of minimum average daily
consumption, maximum storage space, ordering and lead time required,
storage risk on the site, economic order quantity, working capital, available
interest on financing and the likelihood of steep price fluctuations
The materials quality plan is designed to ensure conformance o f vendor
supplied materials to project specifications. The plan should provide for the
use of realistic, achievable, specifications and address the quality aspects of
purchasing documents, shop fabrications and shop tests. The inspection plan
for each piece of equipment is developed during the design and preaward
phases. It includes an evaluation for the need for and level of shop inspection,
including hold points.
Special construction techniques (prefabrication, preassembly and
modularization) have significant impact on materials management. Materials’
planning is usually more complex because of the additional levels o f activities
at multiple sites. Early decisions are needed on the assignment of
responsibilities among the owner, design contractor, fabricator and the
erection contractor.
Organizing is that part of managing that involves establishing an intentional
structure of roles for people to fill in an organization (Mbatha 1993).
An integrated materials management organization plays a significant role in
determining the ultimate cost of a construction project. The organization must
be structured to provide for the timely performance of the work, with materials
personnel located at appropriate levels of project management to contribute to
and influence the decision making process.
In some cases, particularly on larger projects the entire scope o f materials
function may be consolidated into one unit. On smaller jobs, various materials
functions sometimes are assigned to individuals who have other
23

responsibilities and assignments. This poses significant challenges to the
individual responsible for managing all materials functions. A single focus for
the management of these functions is essential, even though the assigned
individual may have other project duties.
The organizational structure of materials management must take into
consideration the size, scope, contracting strategy and location of the project.
A primary requirement is the coordination between the home office and the
field, which is achieved by individuals and computer systems complementing
each other through out the materials cycle.
Large projects regardless of location will require a full staff of skilled
professionals with a direct reporting line to project management. These
materials organizations continue to rely on home office guidance in procedure
and policy development and the selection and supply of key field materials
management personnel.
It is essential that the organization be staffed with professionals possessing
skills consistent with the scope of work. The requirements are changing to
fewer semi-skilled and more professional personnel. The required key
personnel must have a thorough understanding of the projects materials plan
and its functions within the total project. Prior experience in requirement
definition, procurement, quality assurance/quality control, transportation and
site materials management is highly desirable. Computer conversancy is
increasingly important as the benefits of materials management automation
become practical for even small jobs.
Although proper selection of personnel will minimize the necessary training,
some training for the particular requirements o f each project will be required.
Much of this training can be on the job, but formal training in management,
business and computers is increasingly required. Lack of training especially of
site personnel has bee a frequently sited factor on “problem” projects (CII
1988).
24

Materials management personnel must be able to operate in the project
environment, to anticipate the requirements of other organizations, to
administer their program within a complex set o f organizational arrangements,
and to communicate the importance of materials management.
The control function o f materials management runs across the rest of the
functions and sub functions of material management. Although planning must
precede controlling, plans are not self achieving.
Controlling is measuring and correcting individual and organizational
performance to ensure that events conform to plans (Weihnrich and Koontz
1993). It involves measuring performance against goals and plans, showing
where deviations from standards exist, and helping to correct them. Thus
control facilitates the accomplishment of plans.
2.4.3 Materials take off
Materials management process actually begins when a materials takeoff is
performed to produce bills of materials. Before bills o f materials can be
created, materials specifications must be established.
In developed industries materials coding or numbering systems/standards have
been devised and high percentage of material takeoff information is being
generated using computer aided design (CAD) systems. As CAD software
becomes more common, more efficient procedures for transferring data
between computer systems have been developed. It is often easier to create a
bill of materials computer file if a master or project specification file is created
first.
A project specification file contains a list of all the materials items that will be
used on the project, material code number, a description, a specification and
the unit of measure. Unit prices and unit man-hour rates can be established for
certain material items (Dawood 1996).
25

Developing detailed bulk materials requirements is laborious and time
consuming. Judgment and experience are required to determine the level of
detail of the material take off.
From the perspective o f control and accountability, the level o f detail of
materials takeoff must be commensurate with the level o f control detail and
consistent with plans for construction work planning.
2.4.4 Vendor selection
Vendor performance has been observed to be a serious problem on
construction projects. When vendor performance deteriorates, the potential for
achieving benefits in the areas of improved labor productivity reduced
materials surplus and reduced management manpower decreases accordingly
(Bell and Sturkuat 1987).
Vendor selection therefore forms the success or failure of the project.
Vendors must be selected on the basis o f their capabilities, geographical
location, prior experience and owner preference.
Measurement of capabilities includes such considerations as past performance,
financial condition, bargaining agreements, shop capacity, engineering
support, quality assurance/quality control programs, competitiveness,
responsiveness and schedule adherence.
It is important to keep a register of public vendors/suppliers and keep updating
the register for easy sourcing of the materials.
In a well managed vendor selection system, it is always advisable to send
inquiries to identify vendors and invite them to make an offer.
The inquiry must contain the descriptions of the goods, specifications,
quantities required, supply schedule, place o f delivery, delivery date, validity
period and request for free sample if possible.
Offers can then be received and evaluated and prices negotiated before a
supply contract is entered into.
26

2.4.5 Purchasing
The purchasing function is central to material Management. The purchasing
has the responsibility and the authority to commit project funds for materials.
The activity may be accomplished by the home office, the field or a
combination of both depending on the size and scope of the project. Without
successful purchasing it is impossible to achieve the results for which the
project intends.
The following are some broad well recognized principles of scientific buying
(Datta 2003).
i. Buying the right quality
ii. Buying the right quantity
iii. Buying the right price
iv. Buying from the right source
v. Buying at the right time and place
i. Right quality
First and foremost, quality must be properly defined. No
general description of the character of the material or desired
attributes will be sufficient, like “high quality” or “poor or low
quality”.
The definition must be in greater detail and this must be
described in the purchase order. This description then becomes
the essence of the purchase order.
Significant elements like dimension, physical, chemical and
other properties, suitability and purpose must all be clearly
stated.
27

ii. Right quantity
Since quantity is a mathematical measure, there have been
many attempts to determine the optimum quantity which is
most economical.
iii. Right price
Price is an important economic consideration that is a guidance
factor in the terms and conditions of the purchase order.
A most common equation used in determining the right price is;
Value = Quality Price
Thus value varies in direct proportion to quality and inversely to the price paid.
But quality is defined in a specification, it is constant and the
comparison of value can be made in terms of price alone. It
would follow then that, the lower the price, the greater the
value (Datta 2003).
iv. Right source
Source selection and its importance has already been discussed
under vendor selection.
Vendor selection is usually considered as part of purchasing but
in this paper it has been considered separately.
28
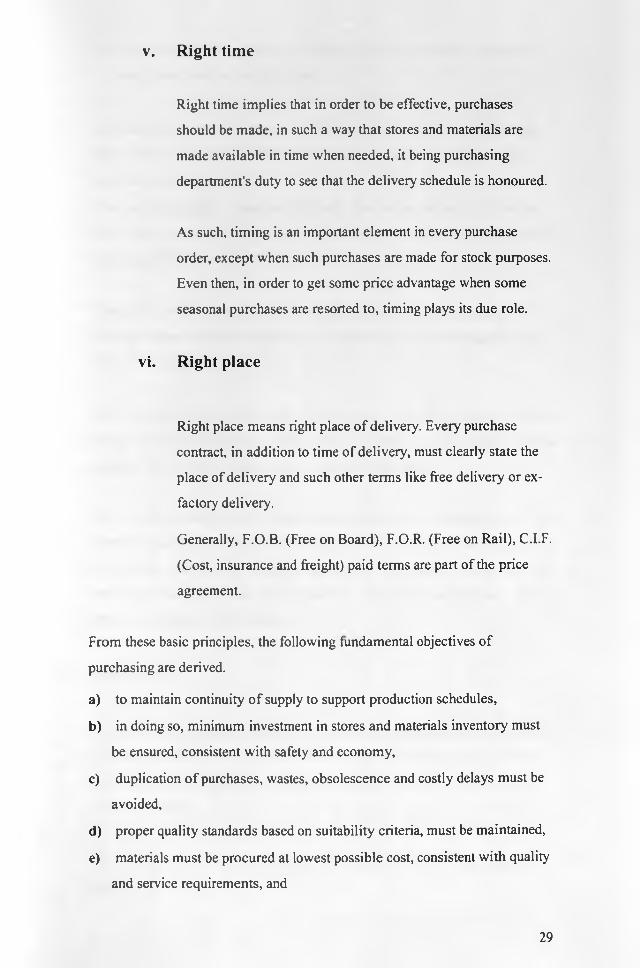
v. Right time
Right time implies that in order to be effective, purchases
should be made, in such a way that stores and materials are
made available in time when needed, it being purchasing
department's duty to see that the delivery schedule is honoured.
As such, timing is an important element in every purchase
order, except when such purchases are made for stock purposes.
Even then, in order to get some price advantage when some
seasonal purchases are resorted to, timing plays its due role.
vi. Right place
Right place means right place of delivery. Every purchase
contract, in addition to time of delivery, must clearly state the
place of delivery and such other terms like free delivery or ex
factory delivery.
Generally, F.O.B. (Free on Board), F.O.R. (Free on Rail), C.I.F.
(Cost, insurance and freight) paid terms are part of the price
agreement.
From these basic principles, the following fundamental objectives of
purchasing are derived.
a) to maintain continuity o f supply to support production schedules,
b) in doing so, minimum investment in stores and materials inventory must
be ensured, consistent with safety and economy,
c) duplication o f purchases, wastes, obsolescence and costly delays must be
avoided,
d) proper quality standards based on suitability criteria, must be maintained,
e) materials must be procured at lowest possible cost, consistent with quality
and service requirements, and
29
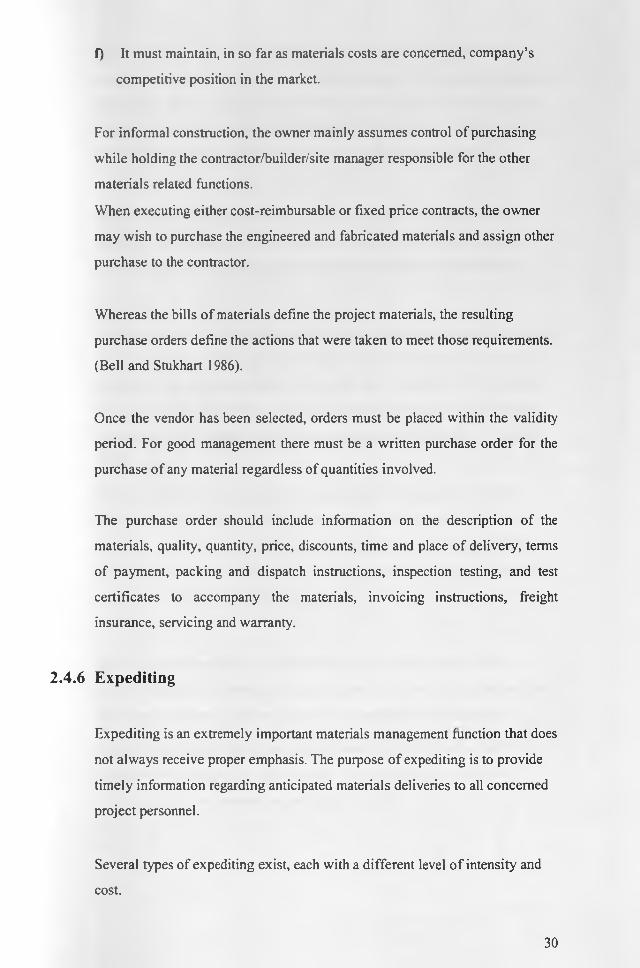
0 It must maintain, in so far as materials costs are concerned, company’s
competitive position in the market.
For informal construction, the owner mainly assumes control of purchasing
while holding the contractor/builder/site manager responsible for the other
materials related functions.
When executing either cost-reimbursable or fixed price contracts, the owner
may wish to purchase the engineered and fabricated materials and assign other
purchase to the contractor.
Whereas the bills o f materials define the project materials, the resulting
purchase orders define the actions that were taken to meet those requirements.
(Bell and Stukhart 1986).
Once the vendor has been selected, orders must be placed within the validity
period. For good management there must be a written purchase order for the
purchase of any material regardless of quantities involved.
The purchase order should include information on the description of the
materials, quality, quantity, price, discounts, time and place of delivery, terms
of payment, packing and dispatch instructions, inspection testing, and test
certificates to accompany the materials, invoicing instructions, freight
insurance, servicing and warranty.
2.4.6 Expediting
Expediting is an extremely important materials management function that does
not always receive proper emphasis. The purpose of expediting is to provide
timely information regarding anticipated materials deliveries to all concerned
project personnel.
Several types of expediting exist, each with a different level o f intensity and
cost.
30

The least intense type of expediting is simple status reporting. Periodic
telephone contact is made with the vendor to determine the status or progress
of an order, and the information is reported to the project in some systematic
format. This type o f expediting provides basic information to the project, but
does little to prevent or overcome delays or problems with an order.
Reactive or corrective expediting is more intense than the simple status
reporting, but is initiated only in response to some event or action. Vendor
contact may be made in response to a problem of delayed or late delivery.
Finally, proactive or preventative expediting is the most intense and aggressive
type o f expediting. Here, vendor and subvendor contact is initiated as soon as
the order is issued and continues through the life o f the order. The expediter
will review all elements of the order to ensure that the vendor understands the
various submittal, testing, and delivery requirements (Tavakoli and Kakalai
1993).
The expeditor will seek to gain a thorough understanding of the vendor's
engineering, purchasing, and manufacturing operations as they relate to the
particular order. This enables the expediter to monitor all elements of the
vendor's performance with the intent of anticipating and resolving problems
before they seriously impact the project.
Experienced professional expediters serve as a key bridge between the
engineering and purchasing activities that specify and order materials and the
field operations that are dependent on those materials for their progress.
Accurate and dependable expediting information is essential for informed
management of the project, and facilitates the mobilization of buyer and
vendor resources in response to problems or delays.
31

.4.7 Quality' assurance and quality control
In everyday usage the word ‘quality’ usually carries connotations of
excellence. However, in engineering context quality is not necessarily
indicative of special merit, excellence or high status.
Quality in engineering conveys the concepts of compliance with a defined
requirement, of value for money, of fitness for purpose, or customer
satisfaction. Thus a palace or a bicycle shade may be of equal quality if both
functions as they should and both give their owners an equal feeling o f having
received their money’s worth.
Quality therefore is a summation of all those characteristics which together
make a product acceptable to the market (Ashford 1989). Products which are
lacking in quality will in the long term prove unmarketable, and the purveyors
of such products will go out of business. Therefore the need to promote and
control quality is of fundamental importance to any enterprise.
The management o f construction quality has become a major concern o f
owners and contractors because they now realize that quality affects the
project schedule, ultimate cost, and performance o f the constructed facility.
Materials quality, which is an important component of construction quality,
depends for its success on an unbroken chain of positive actions by many
different parties, (See Figure 2.1).
Quality assurance includes verification that all participants in the fabrication
and inspection program follow established and specified procedures.
Management must emphasize that quality is one o f the most important, if not
the most important, function of materials management. Owners and
contractors should emphasize that quality performance is a major factor in the
selection of suppliers. Thus, supplier quality is an important link in the quality
of the constructed facility.
32
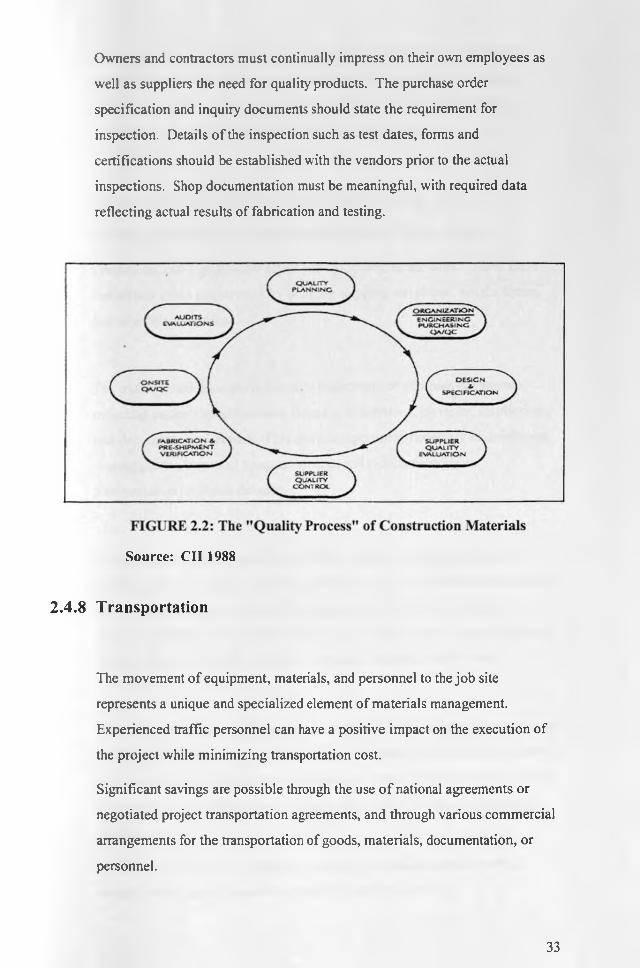
Owners and contractors must continually impress on their own employees as
well as suppliers the need for quality products. The purchase order
specification and inquiry documents should state the requirement for
inspection. Details of the inspection such as test dates, forms and
certifications should be established with the vendors prior to the actual
inspections. Shop documentation must be meaningful, with required data
reflecting actual results of fabrication and testing.
Source: CII 1988
2.4.8 Transportation
The movement of equipment, materials, and personnel to the job site
represents a unique and specialized element of materials management.
Experienced traffic personnel can have a positive impact on the execution of
the project while minimizing transportation cost.
Significant savings are possible through the use o f national agreements or
negotiated project transportation agreements, and through various commercial
arrangements for the transportation of goods, materials, documentation, or
personnel.
33

Special consideration is required in setting terms, thereby determining the
proper point for transfer of materials ownership and liability. The prime
contract, especially insurance clauses, may have a direct impact on the
purchasing terms and conditions concerning transportation.
Early specialized activities in the project planning phase, such as
Properly performed route surveys and consideration of local traffic
Conditions, can significantly affect later execution of the work. These front
end efforts affect engineering by defining shipping envelopes, weight limits,
and schedule limitations.
The traffic function or group has significant input to purchase documents
including packing specifications, shipping instructions, invoicing instructions,
and document requirements. This group's expertise is necessary in developing
routing guides, shipment progress reports, and troubleshooting as
transportation problems develop.
Transportation or traffic expertise aids the materials management team in
handling numerous types o f special loads from delicate electronics to massive
modules, each requiring transport equipment that is specially designed or of
limited availability. Knowledge of the requirements, source, and availability
of this equipment may be critical to successful execution of the work.
Transport permitting requirements also must be considered early in the project.
Assigning the above responsibilities to suppliers may present an easy upfront
decision, but can later lead to painful lessons if the expertise is not available to
the materials management team to ensure that traffic functions are handled
properly.
Traffic or logistics for foreign sites presents an added dimension to the
transportation requirements for a project. Each phase of the
34

transportation effort is more complex, with often stringent requirements due to
ocean shipment and transportation to remote areas of the world. Each
country's customs requirements are unique with potentially significant duties,
taxes, and delays that must be considered in the planning efforts.
2.4.9 Site materials management
Site materials management extends beyond the functions of receiving, storing,
and issuing materials. It is affected by other elements of project management
including engineering, procurement, expediting, and quality control.
It is important, therefore, that the site functions be well planned and executed,
and that they be an orderly and logical continuation of an overall materials
plan. Site materials management functions are detailed functions that increase
in complexity with the size o f the project, and may require specialized skills
and talents.
The large volumes of structural, piping, and electrical materials that must be
dealt with on large industrial projects make the use of computer systems at the
site a requirement. The ability of these systems to catalog, sort, and combine
materials by drawing, systems, areas, or other category and to allocate
materials to a specific work plan can be a significant aid to craft planning.
Full benefit is realized, however, only if the systems put in place on the job
site are fully understood, accepted, and utilized by the crafts. This interface is
the key to achieving the substantial cost savings that are possible through the
use o f this technology.
Properly managed site procurement is important to the success of the
construction effort because o f the potential to impact craft productivity by late
identification, purchase, or delivery of field purchased items. The crafts
35

depend on this group not only for permanent plant materials, but also for parts,
supplies, tools, equipment, and services needed in the erection process.
Materials handling functions (receiving, storage, control and distribution of
materials) at the job site are functions that appear routine on the surface, but
can significantly affect project cost and schedule. Lost, damaged, misplaced,
or improperly stored and maintained equipment and materials can result in
expensive delays and disruptions. These and many other materials problems
can be reduced or eliminated with the proper planning and implementation of
the necessary materials management systems and procedures.
Materials handling should be planned to coincide w'ith other site activities and
success will be achieved by:
i. Understanding the situation;
ii. Discussing the form of packaging beforehand;
iii. Controlling the sequence o f deliveries;
iv. Using the right equipment;
v. Adopting firm control of all the operations
Materials handling is not a site problem; it is affected by the designer, the
manufacturer and the contractor. Design will determine the shape, weight and
consistency of the materials; presentation of the package will depend upon the
manufacturer; and the contractor’s policy for mechanical handling on site will
influence the total operation. Unnecessary handling of materials increases site
costs, and yet often materials waste could be reduced by redirecting under
employed plant and equipment (Johnston 1981).
An effective site materials control should be able to verify that the materials
being delivered conform to what was ordered in terms of quantities and
specifications and that what is delivered conforms to what is in the purchase
order. The supplier should immediately be notified of any defects, shortfalls or
36

failure in specifications and remedial action immediately taken to avoid
delays.
Once the materials have been received, any special handling and instructions
should be followed to avoid damage and deterioration of materials while on
site.
Materials handling at the construction site can be broadly divided into:
i. Unloading from wagons/lorries and stacking in the storage
yard, transportation from there to the site, unloading at the
site, shifting, hoisting etc; of heavy contract materials; and
ii. Handling of light and medium stores (Joy 1990).
For the first type of handling, there will be requirements of hoisting and
transport machinery and facilities like; cranes, tractors, trailers, power trucks,
loading and handling attachments such as hooks, grabs and clamps; wire rope
slings and chains for hoisting and hauling, wooden sleepers, planks, used tires,
etc, to avoid damage while unloading; lifting tackles, drums, sheaves and
sprockets, power driven conveyers for handling civil engineering materials of
bulk quantity, if involved and sufficiently large handling and storage area with
solid approach road. These machinery and facilities shall be used both for
handling of materials and erection, to avoid idling.
For the second type of handling, the requirements shall be; wheelbarrows,
trolleys and forklift trucks.
There also must be an orderly requisition of materials from the stores and
special attention taken to minimize theft of materials.
Continuous physical inspection and verification o f materials is necessary to
ensure that the materials are available in the right qualities and quantities and
also minimize misuse and theft.
37
2.4.10 Surplus materials
All projects can expect a certain amount of surplus; however, the key to
successful surplus materials management is a well conceived and well
executed materials management plan. Various shortcomings in the
engineering, materials control, procurement, and field materials management
phases o f the work may result in surplus materials. Understanding and
anticipating these potential problem areas are the first steps in minimizing
surplus (Handrickson 1998).
Many causes of surplus can be identified. Surplus can be caused by a poorly
performed materials takeoff (MTO). Engineering revisions and changes are
yet another cause of surplus, particularly if the MTO occurs early and systems
are not adequately responsive to change.
Inadequate construction materials management practices also may lead to
surplus, particularly on fast track projects.
Primary causes are duplicate buying and poor control systems/procedures
leading to procurement of unnecessary materials.
Minimizing surplus on a project requires a proactive and timely system of
communication among all functions involved in the materials acquisition and
installation cycle. For example, design changes must be immediately
communicated to halt the acquisition of materials no longer required.
Similarly, substitutions in the field must be immediately communicated so
unused materials may be considered in the remaining design. An individual
should be identified as the focal point with the responsibility to track these
types of changes as well as to periodically review and adjust
minimum/maximum inventory limits.
38

Certain procurement practices can reduce surplus through the use of blanket
price agreements. Releases are issued when engineering is sufficiently
complete yet will still meet field requirements. Purchase orders for bulk
materials and other commodities should include a materials return provision
allowing return of surplus (CII 1988).
Options for disposal include using the surplus in alternative services, using the
surplus materials on other projects, returning them to the vendor, or selling
them to a third party. All options require complete records and timely
reporting to achieve optimum results. The best option is to do the necessary
planning and to implement the necessary materials management systems to
reduce surplus at the source.
2.4.11 Materials wastage
Material wastage may be defined as the difference between the net
measurement on drawings and the necessary allowance for any wastage that is
unavoidable. Material wastage that is attributable to problems o f poor
materials handling is due to one or a combination o f the following factors: -
i. Poor workmanship
ii. Construction errors
iii. Excessive use o f materials e.g. mortar and concrete
iv. Breakage
v. Poor storage
vi. Misdemeanour (Johnston 1981).
Building materials wastage falls into two categories i.e. avoidable and
unavoidable.
39

Avoidable wastage can be controlled and reduced through sound site
management.
Unavoidable wastage refers to that part of materials considered by the
estimator to be normal to the production process.
According to the Standard Method of Measurements of Building Works all
quantities must be given net, as they will appear in the completed building.
The material wastage must be reflected in the unit prices. The wastage
allowance depends on the skill and experience o f the estimator. This will also
vary from firm to firm depending on the efficiency o f the site foremen.
Unavoidable wastage can be further classified into six broad categories as
follows:-
i. Conversion wastage - when cutting small timber scantlings
from bulks of timber of logs.
ii. Cutting wastage - when sheet materials have to be cut for a
specific component e.g. plywood, block boards, plasterboard
and felt.
iii. Application wastage - occurs with most wet building
materials such as plaster and other finishings. This includes
wastage on many other materials such as bricks, tiles and
timbers, which are cut to length.
iv. Stockpile wastage - when most loose materials are dispersed
on the site because of partial use e.g. aggregate and sand.
v. Residue wastage - occurs with paints, glues and other
materials, which are normally delivered in containers, and are
never completely used.
vi. Transit wastage - occurs with brittle materials, which break
on transit such as glass and tiles (Wainwrightl970).
40

The extent of unavoidable wastage is generally known within reasonable
limits and is taken into account with some precision when taking off or
tendering.
The standard for unavoidable wastage of building materials will
depend upon various factors as indicated above including nature, of
work, type of material, method of application etc.
Table 2.1 below, illustrates typical unavoidable wastage
considered when estimating materials for housing.
41
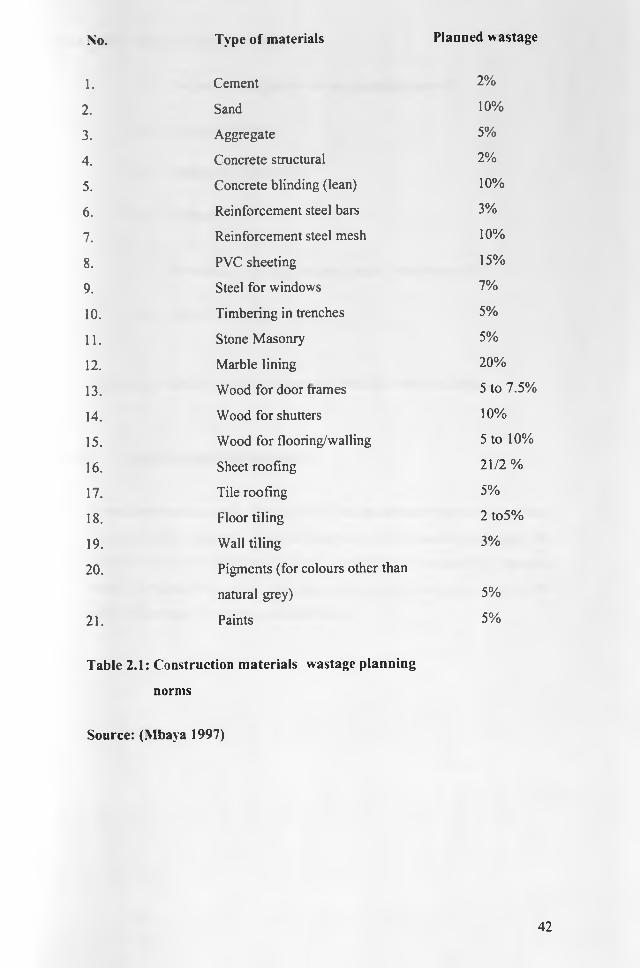
No. Type of materials Planned wastage
1. Cement 2%
2. Sand 10%
3. Aggregate 5%
4. Concrete structural 2%
5. Concrete blinding (lean) 10%
6. Reinforcement steel bars 3%
7. Reinforcement steel mesh 10%
8. PVC sheeting 15%
9. Steel for windows 7%
10. Timbering in trenches 5%
11. Stone Masonry 5%
12. Marble lining 20%
13. Wood for door frames 5 to 7.5%
14. Wood for shutters 10%
15. Wood for flooring/walling 5 to 10%
16. Sheet roofing 21/2 %
17. Tile roofing 5%
18. Floor tiling 2 to5%
19. Wall tiling 3%
20. Pigments (for colours other than
natural grey) 5%
21. Paints 5%
Table 2.1: Construction materials wastage planning
norms
Source: (Vlbaya 1997)
42

The avoidable wastage is mainly caused by: -
i. Designer's specification of non-standard materials
ii. Wrongful purchases
iii. Wastage in transportation
iv. Damages
v. Poor storage resulting in deterioration, obsolescence
vi. Poor workmanship
The minimization of avoidable wastage depends on site management.
2.4.12 Bulking and shrinkages
In wet construction, a reduction in bulk o f the constituent materials takes place
due to the finer materials filling the interstices o f the coarse aggregate, the
compaction and the addition of water. Shrinkages in concrete for example
would vary depending on the estimator. Table 2.2 below shows some of the
typical allowances for bulking and shrinkage.
43

Mixes Bulking/Shrinkage allowance
1:4:8 50%
1:3:6 35%
1:2:4 25%
1:11/2:3 15%
1:1:2 5%
Table 2.2: Bulking and shrinkage allowance
Source: JBC (2002)
Shrinkage and bulking should be included by the estimator as planned
wastage.
2.5 Material management and computer systems
The current trend in construction materials management is towards developing
computer-based data systems that provide the type o f information needed to
prevent materials shortages, surpluses, cash flow problems and labour delays.
The cost of developing and executing the computer programs has been
quantitatively justified through the results they provide and the lack of control
apparent in their absence.
Since materials management computer systems are relatively new
management tools it is not yet clear what degree o f computer control will be
most cost effective for a given type or size of construction project.
A computer system is usually required to achieve coordination of the
individual functions of materials management. A well designed computer
system assists with the generation of materials requirements and then tracks
44

materials requisitions and purchase orders through the purchasing, expediting,
and warehousing functions to final issue and installation.
Research has indicated that materials management computer systems can
play an important role in improving craft labor productivity, cash flow and
vendor performance, and in reducing bulk materials surplus.
Many factors must be considered when developing a materials management
computer system. In general, an efficient system will include the following
i. Full integration o f all materials management functions
throughout the home office and project site, with emphasis on
establishing capabilities that will produce project cost saving
benefits.
ii. Line item reporting of purchase orders and requisitions.
iii. Sufficient flexibility to respond to various contractual
arrangements, facility types, project sizes and locations, as well
as a wide range o f anticipated owner requirements and
constraints.
iv. Online capability to ensure availability of current information to
all system users.
v. A menu driven screen format, or some other user-friendly
format, to ensure user acceptance and minimum user training
time.
vi. Hardware portability, i.e., software that can be used on either
small or large computer systems, depending on the project data
requirements.
vii. Compatibility with other engineering, accounting, cost
estimating, and project control computer systems.
To be cost effective, the computer system must effectively combine and
integrate all o f the individual functions o f materials management systems. The
45

system must facilitate the dissemination of current data to a wide range of
system users, utilize current hardware and software technology, and possess
sufficient versatility to be applicable to a wide range of project conditions.
A major hindrance to effective application of computer systems in
management of materials is the reluctance to codification of materials by
manufacturers and suppliers o f construction materials. The reluctance has been
mainly due to general lack of appreciation of information and communication
technology (ICT) by the construction industry ( Paulson, 1995).
Codification would make identification, description and control of materials
much easier. The best way to codify is at the manufacturer’s source.
2.6 Classification of Construction materials
In construction projects the type and quality of construction materials differ
from project to project. Although some basic materials like steel, cement, sand
aggregate, water and timber are common.
The primary purpose of materials classification is to control quality, cost and
timely supply.
Factors to be considered when classifying materials are:
i. Storage space
ii. Shelf life
iii. Supply reliability
iv. Inventory cost
v. Case o f identification
vi. Construction sequence
vii. Transportation requirements
viii. Prices
ix. Procurement time
x. Procurement source
xi. Project life
46

Construction materials are generally grouped into the following categories
i. Bulky type - one time purchases, repetitive use and minor
materials
ii. Vital - essential and durable materials
iii. Locally available and imported
iv. High price, medium price and low price materials
v. High usage value, medium usage value and low usage value
materials.
The last category (category v) is the most commonly used classification
(Mbaya 1997).
2.7 Concrete in construction
Concrete consists of a mixture that contains a mass of loose inert particles of
graded size (commonly sand and gravel) held together in solid form by a
binding agent. The general description covers a wide range of end products.
The particles may consist o f wood chips, industrial waste, mineral fibers and
various synthetic materials. The binding agent may be coal tar, gypsum,
Portland cement, or various synthetic compounds (Parker 1994).
The end product range from asphalt pavement, insulating fill, shingles, wall
panels, and masonry units to the familiar sidewalks, roadways, foundations,
and frameworks.
The most commonly used concrete in the Kenyan construction industry is the
concrete formed with the common binding agent o f Portland cement, and a
loose mass consisting of sand and gravel. This is what most people mean when
they use the term concrete. With minor variations, this is the material used
mostly for structural concrete for various forms of construction.
Building frames, walls, pavements, sidewalks, parking lots, streets, floor
slabs in buildings, interstate highway systems, water control, marine
structures, large bridges, tunnels, all use concrete extensively.
47

Figure 2.3: Formation of concrete
Source: Parker 1994
2.7.1 Historical background
Concrete made from natural materials was used by ancient builders thousands
of years ago. Modem concrete, made with industrially produced cement, was
first produced in the early part of the 19th century when the process of
producing Portland cement was developed. Joseph Aspdin of England
invented Portland cement in 1824 by burning ground chalk with finely divided
clay in a lime kiln until carbon dioxide was driven off. The sintered product
was then ground and he called it Portland cement named after the high quality
building stones quarried at Portland, England.
Because o f its lack of tensile strength, however, concrete was used principally
for crude, massive structures- foundations, bridge piers, and heavy walls.
In the nineteenth century, several builders experimented with the technique of
inserting iron or steel rods into relatively thin structures of concrete to enhance
their ability to resist tensile forces. This was the beginning of what we now
know as reinforced concrete (http//www.matse.uiuc.edu).
In Kenya, the use of concrete in its current form was introduced by the
colonialist towards the end o f 19th century.
48

2.7.2 Constituents of concrete
i) Cement
Cement is a fine powder manufactured from clay and limestone. It sets and
hardens when mixed with water, although it is of structural use only when
mixed with aggregate. It is possible to buy cement with additives. Additives
are non-cementing materials such as blast furnace slag which change the
properties of the cement. Some additives cause the cement to set quickly and
are used when rapid construction is required. Cement manufacturers provide
details o f the additives when the cement is bought.
Storage of cement is very important. If cement is unavailable close to the site,
it is sometimes bought in large quantities to save on transport costs. However,
this may mean that the last bags to be used are several months old and may
have begun to set. Cement older than 3 months should not be used for large
structures; it may be used after this time for small structures, but if hard
lumps are found in the bag, it should not be used.
Cement should be kept dry during transportation and storage. Bags should be
stored on pallets or another form of support which will allow ventilation and
prevent ground moisture entering the bags. Bags should not be piled more than
six bags high, although if space is limited and the bags will not be stored for
long, they may be piled up to ten bags high.
ii) Filler
Filler is a very fine material and is used to fill the voids between the fine
aggregate particles. It is often omitted if the fine aggregate used is sufficiently
fine initially.
49

iii) Fine aggregate
Sand is nearly always used as the fine aggregate in concrete. It is a material
with particle size ranging from 2 to 0.3mm. Up to 10% by volume of
oversized particles (5 to 2mm) is normally acceptable, although if more than
10% it should be screened out by sieving. It is important to know the particle
size and the mineral composition of the sand when concrete structures. Some
fine aggregate minerals are very weak. If particles can be pulverized by
squeezing in the hand, the sand is not suitable for use.
Sand is usually collected from rivers, streams and isolated deposits. It should
be free o f contamination. If there is organic matter, silt or clay particles or an
obvious quantity of non-sand size material in the sand or if there is a
noticeable colour change, the sand should be cleaned or rejected. Sand should
be obtained as close to the site as possible as it is expensive to transport.
iv) Coarse aggregate
Coarse aggregate contributes most of the concrete’s compressive strength
through its high particle strength and close particle interlock. Coarse
aggregate particles should be between 50 and 7mm, although a reduced
maximum size may be specified if the structure is to be reinforced. Coarse
aggregate can be produced by quarrying and crushing rock or excavated from
a gravel quarry. Coarse aggregate can also be crushed and selected manually.
The aggregate should always be sieved to remove undersized particles.
In some areas coarse aggregate or hard rock may be unavailable. Alternatives
should be considered. One alternative is to bum and then crush clay bricks.
Although not as strong as normal coarse aggregate, burnt clay bricks are
durable and strong enough for use in concrete.
50

v) W a te r
The water used in concrete should be clean and free of organic material and
salts, including chlorides, although for low cost structures the salt content and
some suspended solids can be ignored. Most surface water is good enough for
concreting work, but care should be taken when using ground water. A
shortage o f w ater must not disrupt the concreting operation, so water should be
either readily available nearby or stored in sufficient quantity on site.
2.7.3 Reinforced concrete
Concrete become a reliable material with the introduction and
development of durable ‘Portland’ cement during the nineteenth century, and
was quite widely used for foundations and floors, where its strength under
compression was most required.
Before concrete could be safely employed for more complex structures,
however, some form of reinforcement was necessary to counteract its
w eakness under tension, and many methods were tried. Francois Hennebique
(1842- 1924), substituted steel for iron and devised hooked connections for
reinforcing bars in 1892 (Fletcher 1994).
The advent of reinforced concrete in the years around 1900 therefore
introduced a material capable of withstanding great compressive and tensile
loads, than steel could do, and with further important advantage o f a high
degree o f fire resistance. Steel was widely used for big structures before.
Reinforced concrete is now a common building material for the
construction of facilities and structures. While concrete has a high
compressive strength, it has a very limited tensile strength. To overcome
these tensile limitations, reinforcing bars are used in the tension side of
concrete structures.
51

Steel rebars have been and are an effective and cost-efficient concrete
reinforcement. Steel reinforcement is however susceptible to oxidation
when exposed to chlorides.
When properly protected from ion attack, steel reinforcement can last for
decades without exhibiting any visible signs of deterioration. However,
insufficient concrete cover, poor design or workmanship, poor concrete
mix, and presence of large amounts of aggressive agents all can lead to
corrosion o f the steel rebar and cracking o f the concrete.
Welded wire reinforcement is mainly used in ground slabs and
pavements while steel bars are used in suspended slabs and columns.
Recently, other forms of reinforcements like fibre based reinforcements,
have been introduced though their application in the Kenyan industry is
still very minimal.
2.7.4 Forms of concrete
For building structures, concrete is mostly used with one of three basic
construction methods.
i. Site cast concrete
In this method, wet concrete mix is deposited in some forming
at the location where it is to be used. This method is also
described as cast in place or in situ construction. The concrete
can either be prepared on site or be brought to site when
already mixed (ready mix) from another plant or supplier.
ii. Pre cast method
This method consists of casting portions of the structure at a
location away from the desired location of the
construction. These elements described as pre cast concrete are
52

then moved into position, much as blocks of stone or parts of
steel frames are.
iii. In the third method, concrete can be used for masonry
construction in one of two ways. Pre cast units of concrete
(called concrete masonry units) may be used in a manner similar
to bricks or stones or concrete fill may be used to produce solid
masonry by being poured into cavities in masonry produced by
bricks, stones or concrete masonry units. The latter technique,
combined with the insertion of steel reinforcement into the
cavities, is widely used for masonry structures today in
developed countries.
2.7.5 Concreting process
Concreting requires careful planning and preparation. For successful
concreting work, the concrete must be the right specification for the job and
has to be placed correctly.
Though ready mix concrete is not widely used locally, buying concrete ready
mixed is believed to be more convenient, quicker and less wasteful
(Flannery 2000).
When concrete is prepared on site, then the responsibility of ordering and
storing the ingredients and ensuring that there is adequate and competent
labour and equipment for mixing and placing of the concrete rests on the site
management. However, by ordering from a ready mix company the
responsibility of all these factors rests with the supply company.
Regardless of which kind of concrete (ready mix or site prepared) is used, the
site management still needs to deal with many issues including understanding
of the stages involved, specifications of the mix, delivery acceptance, issues of
wastage and quality control. The process becomes more complex when
dealing with reinforced concrete. The reinforcement must have been correctly
53

specified, acquired, fixed and inspected before the concreting. The formwork
must also be appropriately prepared in line with the desired level of finish.
Two tests are commonly carried out when concrete is being placed. These are
required to ensure that the concrete is of good quality. The slump test is a test
to ensure consistent quality. It is carried out on site and gives rapid results so
that adjustments can be made immediately to the mix. The other is the cube
test where concrete is sampled from a mix, cured and then tested to check that
the design strength has been obtained
Concreting is done on virtually all construction projects and this usually in
large quantities. The consequences associated with inappropriate management
of this process could be great if concrete is considered as a single material.
Achieving optimum efficiency and quality of the concreting process on site
therefore requires consideration of the concrete preparation/procurement
process as a whole and the interactions between concreting and the inter
related construction processes (fig 2.3).
The above therefore makes concreting an ideal case study for this project.
54
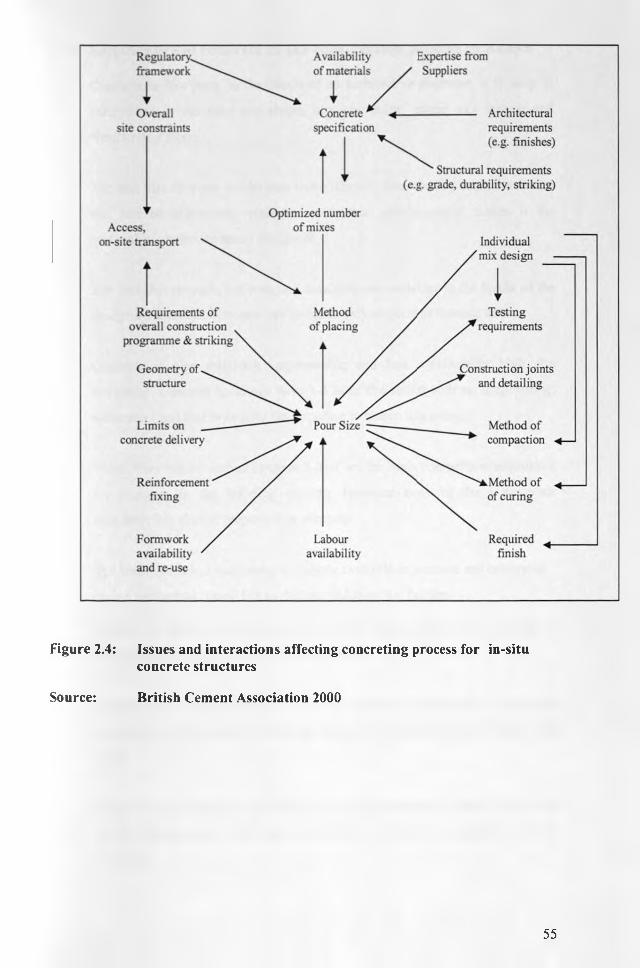
Figure 2.4: Issues and interactions affecting concreting process for in-situconcrete structures
Source: British Cement Association 2000
55

2.7.6 Significance of concrete in the construction process in Kenya
Concrete is like putty in the hands of an architect or engineer. It is easy to
manipulate, it can take any shape, turn any color, mimic any texture and
weather any storm.
The fact that concrete can be cast monolithically into visually attractive forms
and can be effectively reinforced with steel reinforcement makes it the
material o f choice for many designers.
The fact that strength, stillness and durability are variables in the hands o f the
designer means that concrete can be made only as good as it needs to be.
Concrete is also relatively impermeable and has considerably high fire
resistance. Concrete buildings have 1-3 hour fire rating with no fireproofing,
while steel and timber require fire proofing to obtain this rating.
Wood, clay bricks, natural stone and steel are the main competitors/substitutes
for concrete in the building industry however none of these materials
singularly has similar properties as concrete.
The breath of colors and textured finishes available in concrete are enormous
giving aesthetical appeal but saving on claddings for finishes.
It could be faster to work in concrete if the construction process is properly
planned especially with components like floors.
Concrete also has the advantage of lateral stiffness or resistance to horizontal
movement, which gives it advantage when constructing in areas of high wind
loads.
It can be argued that use of concrete in construction has economic advantage
of low maintenance and wide availability of concreting materials (except
cement).
56

The definition of what constitutes permanent structures by planning
authorities leave developers with very few options besides concrete in the
construction of buildings.
Though there are no available statistics on the use of concrete in its varied
forms either by volume or cost on construction projects in Kenya, it can be
argued that concrete is extensively used on nearly all construction projects in
Kenya. In fact the annual growth and magnitude o f the construction industry in
Kenya, is measured through the consumption of cement, which is the most
important component of concrete (Daily Nation, Friday 27th May 2005).
The cumulative values of cement, sand, course aggregate, reinforcement steel
and formwork on any given project may give an indication of the approximate
value of concrete on the project. However, these values may vary on different
projects depending on project design and specifications. Conservative
estimates obtained by the researcher from a few practicing quantity surveyors
on projects undertaken, gives the cumulative value of between 25% to 40% of
the total cost of construction. No other component except labour was valued
close to these percentages. This is still an indication of how important concrete
is to the building industry.
57

CHAPTER THREE
STUDY METHODOLY
3.1 Introduction
This chapter describes the procedures that have been followed in conducting
the study. The techniques of obtaining data have been explained.
The study area, population, sampling techniques, sample size, data collection
instruments, data collection procedures and data analysis methods are
discussed in details.
3.2 Description of study area and population
This study investigates the relationship between the extent of materials
management and attributes of materials (availability, right quality, reasonable
cost, minimal surplus and minimal wastage) for concreting materials
(ballast, Sand, Cement, Steel and water) on construction projects in Nairobi.
The intention of this study is to generalize the findings for all construction
projects in Kenya. Thus the target population was all the active sites in
Kenya.
However for accessibility and given the limitations already mentioned, the
study population consisted o f accessible active construction sites (both formal
and informal) within Nairobi city which were selected through sampling.
Nairobi is the capital and the most active economic centre of the country with
the highest level of construction activities.
Nairobi has many construction sites within any given moment due to its rapid
growth. Most of the works within the central business district and the suburbs
like Westlands, Upper Hill, Hurlingham, Muthaiga, Lavington, Runda,
Parklands, Industrial Area and Karen, are predominantly formal construction
58

sites with full design team and full construction contracts between developers
and contractors. However even in these high income areas, some developers
because of a perceived perception of trying to minimize costs, engage
qualified contractors, mainly small and medium sized, but only for labour
contracts. In such situations, the developer still retains the responsibility over
purchase and control o f materials.
The informal sites where the developer undertakes the construction directly
with a few masons are mainly found in middle and low income residential
areas such as Githurai, Zimmerman, Doonholm, Kahawa, Buruburu,
Kariobangi, Riruta, Umoja, Kayole, Dandora, and Mathare North.
The sites that formed the population were both formal and informal
construction sites within Nairobi and the ones studied were those undertaking
major concreting works mainly casting of floor slabs and columns within the
selected areas over the study period.
3.3 Research design
The problem under study is experienced on sites under construction and the
relevant information could easily be obtained through interviews on sites.
The study was therefore a survey research where data was collected from
members of population in order to determine the current status o f the
population with respect to the identified variables in the literature review.
3.4 Sampling techniques and sample size
A large sample from the accessible population was desired in order to
minimize the sampling error. However given the constraints of time and
resources a sample size of 43 sites was used for data collection. This was in
59
order to be above the recommended minimum of 30 members (Mugenda and
Mugenda 1999).
The desired sampling frame was all the active construction sites in Nairobi.
However due to the limitation of time and resources it was not possible to
exhaustively compile this frame given the geographical expansiveness of the
city.
For convenience and accessibility, cluster sampling was therefore used. The
areas of study were grouped into two clusters; formal and informal. The CBD,
Upper Hill, Westlands, Hurlingham, Parklands and Industrial Area were put in
the same cluster and formed the sampling frame for the formal sites. These
areas were physically visited and the active sites in these areas identified,
listed and numbered. A total o f 43 sites were found to be active in these areas.
Likewise, Zimmerman, Kahawa, Doonholm, Kayole, Dandora and Umoja,
formed the cluster and sampling frame for informal sites. The areas were
physically visited and the active sites identified, listed and numbered. A total
66 sites were found to be active in these areas.
To allow for generalization o f the findings and to minimize margin o f error,
simple random sampling was used to select the particular sites to study (units
of observation) from all the identified, listed and numbered sites o f each
cluster. The random sampling was done separately for each cluster.
Random sampling was done by writing the number representing each site on a
piece of paper. The papers were then folded to conceal the numbers and placed
in a container and then picked at random one at a time. The subjects
corresponding to the numbers on the papers picked were included in the study
sample.
Every time before a paper was picked, the papers were well mixed in the
container to minimize error.
60

A total o f 48 sites (24 formal and 24 informal) were randomly sampled. All
the sites were visited, however access was denied on some sites. A total of 43
sites (22 formal and 21 informal) were studied and the data collected from
those sites analyzed. This was a very encouraging response of 89.6% given
that some sites had to be visited several times before they were eventually
studied mainly because those responsible could not honour appointments.
Though there is no statistical evidence on the ratio o f the number of formal to
informal construction in Nairobi, the number of sites studied for each cluster
in this study was almost equal. This was deliberate due to the complications
involved in establishing the ratio and also in order to have reasonable number
of subjects to study from both clusters to make reasonable analysis and
comparisons given the limitations in the overall sample size.
3.5 Data collection instruments
Primary data (original data collected by the researcher from the population)
was used for this study.
The instrument used to collect the data was the questionnaire, which was
administered directly to the respondents by the researcher and the assistants.
The kind of questions used in the questionnaire were mainly structured (closed
ended) for ease of administration and analysis.
3.6 Data collection procedures
Data was collected from active construction sites using the questionnaire. The
questionnaire was administered to the site manager/foreman on the respective
sites.
61

Two research assistants with background knowledge in construction and who
were trained by the researcher on how to administer the questionnaire were
engaged on the study.
Before the questionnaire was used in the study it was presented to a selected
sample similar to the actual sample used in the study for testing and further
improvement.
3.7 Measurement of variables
A variable is a measurable characteristic that assumes different values among
the subjects. It is therefore a logical way o f expressing a particular
characteristic in a subject. Variables can be expressed quantitatively for
example height in metres and others in categories like gender expressed as
male or female (Mugenda and Mugenda 1999).
There are different classifications of variables;
3.7.1 Independent variable
An independent variable is a variable that a researcher manipulates in order to
determine its effect or influence on another. It is a variable whose available
categories are designated in advance by the researcher. Normally these
variables are selected because they are seen to be causative or very important
to the particular logical purpose of the research project.
The term independent means the categories of the variables are chosen by the
researcher independently in the measurement taken in the project and normally
prior to it.
In this study the extent of management of materials evidenced through the
functions of materials management was viewed as the independent variable.
These functions of materials management include planning, organizing,
communication, material take off, vendor selection, purchasing, expediting,
62
quality control, transportation, site materials management and management of
surplus and wastage.
The measurement of the components of this variable (planning, organizing,
communication, material take off, vendor selection, purchasing, expediting,
quality control, transportation, site materials management and management of
surplus and wastage) was in an ordinal scale as can be derived from the
descriptive nature of the study.
An ordinal scale groups subjects into categories and ranks them into some
order with numerals reflecting increasing amount o f the characteristics but not
at intervals. The numerals are used to represent relative position or order
among the values of the variables. However, the order indicated in an ordinal
scale does not imply a quantitative diction (Mugenda and Mugenda 1999 ).
Thus, based on the responses from the questionnaire, each site was given a
score o f either zero (0) or one (1) for each o f the components o f the
independent variable to indicate its performance in that aspect. For example a
site that was deemed to have excelled well in purchasing, would score one (1)
for purchasing while a site that has not excelled would score zero (0). This was
done for all the components o f the independent variable for every site studied.
The cumulative score for every site was assumed to form an interval scale and
thus a measurement o f the level or extent of management. Therefore a site that
excelled and scored one (1) in each of the components of the independent
variable would have a cumulative total of ten (10). Its score for extent of
materials management would therefore be taken to be ten (10). A site that
scores zero (0) in every component of the variable will have a cumulative total
of zero (0) and its score for the independent variable (extent of materials
management) will therefore be taken as zero (0).
In an interval scale the numerals reflect increasing amounts o f the
characteristic with equal interval (Mugenda and Mugenda 1999 ).
63

Function Maximum scorePlanning, organizing and
communication
1
Materials take off 1
Vendor selection 1
Purchasing 1
Expediting 1
Site materials management 1
Quality control 1
Transportation 1
Surplus management 1
Wastage management 1
Total 10
Table 3.1: Scoring for functions of materials management
3.7.2 Dependent variable
Dependent variables are so named because their results are presumed to
depend upon differences in the independent variable. The variation in them is
seen as being related to, caused by, or in some way influenced by differences
in the independent variable.
A dependent variable therefore varies as a function of the independent
variable.
In this study the extent of materials attributes expressed through availability,
right quality, reasonable cost, minimal surplus and minimal wastage of
materials on site was viewed as the dependent variable because it should vary
in some relationship to the independent variable. Its measurement was also
based on ordinal scale.
The occurrence or absence o f each of the attributes on a particular site was
denoted with either zero (0) or one (1), with zero (0) representing negativity
and one (1) representing positivity. For example based on the questionnaire a
64

site that was viewed to have materials available for the concreting activity
would score one (1) while a site with material shortages would score zero (0).
The cumulative total for each o f the sites was then transformed into interval
scale such that a site with no negative attribute scored five (5) points while one
with no positive attribute scored zero (0).
Function Maximum score
Availability 1Right quality 1
Reasonable cost 1Minimal surplus 1Minimal wastage 1
Total 5
Table 3.2: Scoring for materials attributes
3.8 Data analysis techniques
This is basically a quantitative/empirical research and therefore data
presentation and analysis is mainly based on empirical techniques.
Descriptive statistics have been used to explain the various outcomes and
relationships. To achieve this, the responses in the questionnaire were assigned
numerical values (a process referred to as ‘coding’) for ease of analysis. This
was facilitated with the items in the questionnaire being mainly closed ended.
The few open ended questions in the questionnaire were categorized and
numerical values assigned to various categories for ease of analysis.
Inferential statistics (using SPSS software) has been applied to assist in testing
o f hypothesis.
65

The testing of hypothesis followed regression and correlation analysis between
the two major variables in the study; the level of management of materials and
level of materials attributes on construction sites.
The inferential statistics is applied to help in generalization of the findings.
The hypothesis is tested at 95% confidence level (a=0.05 and 41 degrees of
freedom). A significant of 0.01 (that is, it would occur by chance less than
one in a hundred times) is used to generalize the findings.
66

CHAPTER FOUR
DATA PRESENTATION AND ANALYSIS
4.1 Introduction
In this chapter data that was collected from the sites is analyzed and explained.
Tables and descriptions are mainly used to explain the findings from the field
survey. The hypothesis that inadequate management o f materials is the cause
of poor level of materials attributes is also tested.
Out of the sample of 48 sites, 43 sites provided full response, representingS
89.6% which is reasonable and sufficient for proceeding with the analysis.
Though some sites were visited several times before actual data could be
colleted mainly due to those in charge of the sites not honouring appointments,
the good response was mainly due to contractors/developers’ keenness to
know about materials management, this area not having been studied before.
The fact that the questionnaire was administered on site also contributed much
to this good response as many o f those interviewed considered it very site
related.
Responses were received from 21 informal sites and 22 formal sites. Out of
the formal sites the breakdown as per the grade of the contractors is as shown
in table 4.1.
Grade of contractor Number of sites Percentage
A 8 36
B 7 32
C 4 18
D 3 14
Total 22 100
Table 4.1: Categories of contractors
Source: Field survey, March 2005
67

No site with contractor below grade D was studied. It was not the intention of
this study to stratify the contractors as that could complicate the study further.
It was therefore not possible to ensure that contractors for every category are
studied as the random sample was used. However, it is hoped that the findings
o f this study would be applicable to contractors of all grades.
O f all the formal sites studied the traditional method o f procurement (design
separate from construction) was found to be in use.
In line with the objectives of the study, the questionnaire was designed to
establish the extent of materials management through the functions of
management (independent variable) and the extent o f materials attributes
through the specific attributes (dependent variable). The findings of these
aspects of study are sequentially presented and analyzed.
4.2 Findings and analysis of independent variable
The findings and analysis of the various components o f the independent
variable are discussed in this section.
4.2.1 Organizing, planning and communication
The study sought to find out the level of training for those in charge of
materials management; table 4.2.
68

Level of training Number of sites and percentages
Formal sites Informal sites Combined
NO. % NO. % NO. %
University technical degree 6 27 0 0 6 14
Polytechnic diploma 9 41 4 19 13 30
Technical college certificate 1 5 5 24 6 14
No formal training 6 27 12 57 18 42
Total 22 100 21 100 43 100
Table 4.2: Level of training for materials managers on sites.
Source: Field survey, March 2005
On the formal sites, most of the staff involved in materials management is
fairly well trained. 68% of those in charge have at least a polytechnic
diploma, though even on some class A contractor sites, those in charge of
materials claimed not to have any formal technical training but to have leamt
through experience on site. It should be noted that most of these contractors
have evolved as family businesses and members of the family have grown
with the businesses.
It was not clear whether the high percentage of trained staff with contractors
is as a result of the recent directive by the government that contractors must
have certain level of trained staff for them to retain their registration status.
The survey did not investigate this fact.
For the informal sites there was no single site where those involved with
materials management had a university technical degree. Perhaps the
clients themselves were, but this was not investigated. It was only on 4 sites
representing 19% of the sites studied where those involved with materials
management had a polytechnic diploma and these were sites where there
were labour contracts. Therefore on average the informal sites rank poorly in
the level o f technical training for material management staff.
69
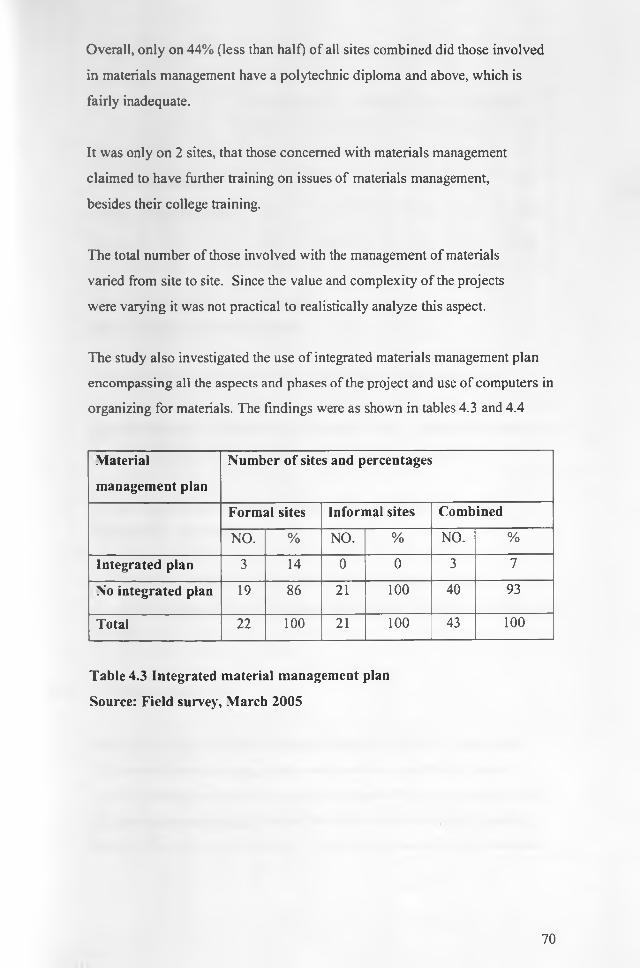
Overall, only on 44% (less than half) of all sites combined did those involved
in materials management have a polytechnic diploma and above, which is
fairly inadequate.
It was only on 2 sites, that those concerned with materials management
claimed to have further training on issues of materials management,
besides their college training.
The total number of those involved with the management of materials
varied from site to site. Since the value and complexity of the projects
were varying it was not practical to realistically analyze this aspect.
The study also investigated the use of integrated materials management plan
encompassing all the aspects and phases of the project and use of computers in
organizing for materials. The findings were as shown in tables 4.3 and 4.4
Material
management plan
Number of sites and percentages
Formal sites Informal sites Combined
NO. % NO. % NO. %
Integrated plan 3 14 0 0 3 7
No integrated plan 19 86 21 100 40 93
Total 22 100 21 100 43 100
Table 4.3 Integrated material management plan
Source: Field survey, March 2005
70
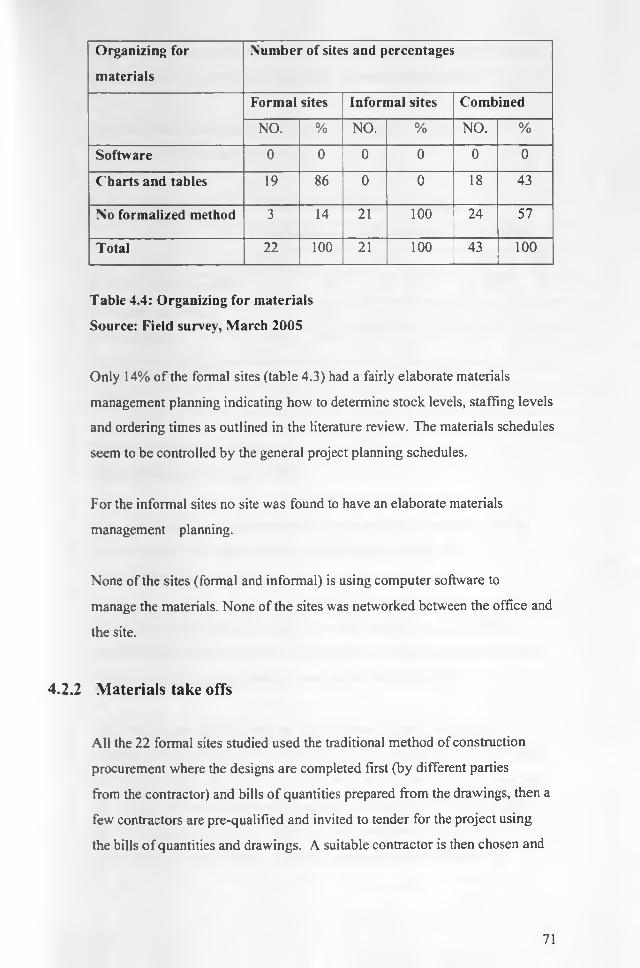
Organizing for
materials
Number of sites and percentages
Formal sites Informal sites Combined
NO. % NO. % NO. %
Software 0 0 0 0 0 0
Charts and tables 19 86 0 0 18 43
No formalized method 3 14 21 100 24 57
Total 22 100 21 100 43 100
Table 4.4: Organizing for materials
Source: Field survey, March 2005
Only 14% of the formal sites (table 4.3) had a fairly elaborate materials
management planning indicating how to determine stock levels, staffing levels
and ordering times as outlined in the literature review. The materials schedules
seem to be controlled by the general project planning schedules.
For the informal sites no site was found to have an elaborate materials
management planning.
None of the sites (formal and informal) is using computer software to
manage the materials. None of the sites was networked between the office and
the site.
4.2.2 Materials take offs
All the 22 formal sites studied used the traditional method of construction
procurement where the designs are completed first (by different parties
from the contractor) and bills of quantities prepared from the drawings, then a
few contractors are pre-qualified and invited to tender for the project using
the bills of quantities and drawings. A suitable contractor is then chosen and
71

enters into a contract with the developer for construction with the consultants
as the agents to the developer overseeing the construction process.
The bills of quantities therefore becomes a vital basis for estimation of
materials on formal sites (Table 4.5).
Materials estimation N umber of sites and percentages
Formal sites Informal sites Combined
NO. % NO. % NO. %
From bills of quantities 19 86 0 0 19 43
Quantity surveyors 4 14 4 19 2 17
-’Architects” 0 0 7 33 7 16
No proper estimation 0 0 10 48 11 24
Total 22 100 21 100 43 100
Table 4.5: Materials estimation
Source: Field survey, March 2005
86% of the formal contractors studied were therefore found to rely on the
bills of quantities for their materials estimates and only verified
occasionally with the drawings.
Only 14% o f the formal sites indicated to have carried out independent
materials take off different from tendering bills of quantities. They however
indicated to having used quantity surveyors to do the estimates.
However, for the informal sites no site indicated to have used bills of
quantities to prepare materials estimates mainly because there may have been
no tendering involved. 19% of the informal sites indicated to have some form
o f materials estimates prepared by quantity surveyors 33% of the informal
sites claimed that they had materials estimates prepared by the “project
architects” (not sure whether qualified architects were involved in the
72

projects), while the remaining 48% of the informal sites did not have any
elaborate way o f getting materials estimates.
4.2.3 Vendor/supplier identification and selection
The data on the vendor identification for formal sites is presented in table 4.6
below.
Identification of
vendor/suppliers
Number of sites and percentage for each materials
Ballast Sand Cement Steel
NO. % NO. % NO. % NO. %
Open tendering 1 5 1 5 1 5 1 5
3rd parties and
salesmen
10 50 10 50 5 22 3 13
Self inquiry 2 9 2 9 4 18 4 18
Previous
relationships
7 32 7 32 14 50 12 59
Self supply 2 9 2 9 1 5 1 5
Total 22 100 22 100 22 100 22 100
Table 4.6: Vendor identification for the formal sites.
Source: Field survey, March 2005
Vendor identifications for formal sites for ballast and sand was mainly
through salesmen and third parties at 50%. However for steel and cement
(industrial products) the identification was mostly through previous
relations from other projects. This was mainly because of credit offer.
Table 4.7 below shows the summary of the data on vendor identification for
the informal sites.
73

Identification of
vendor/suppliers
N umber of sites and percentage for each material
Ballast Sand Cement Steel
NO. % NO. % NO. % NO. %
Open tendering 0 0 0 0 0 0 0 0
3rd parties and
salesmen
16 76 16 76 7 33 8 38
Self inquiry 5 24 5 24 13 62 12 57
Previous
relationship
0 0 0 0 1 5 1 5
Self supply 0 0 0 0 0 0 0 0
Total 21 100 21 100 21 100 21 100
Table 4.7 Vendor identification for the informal sites
Source: Field survey, March 2005
For the informal sites identification of vendors for ballast and sand was also
mainly through third parties and salesmen (76%). However suppliers for
cement and steel were mainly through self inquiry at 62% for cement and 57%
for steel.
Though open tendering is considered to be the most appropriate and
profitable way of sourcing only one site representing just 2% of the total
sites studied, indicated to having used the method.
Tables 4.8 and 4.9, indicate the actual number of vendors identified for the
supply of each of the concreting materials for formal and informal sites
respectively.
74

No. of vendors
identified
Number of sites and percentage for each material
Ballast Sand Cement Steel
No. % No. % No. % No. %
1 8 36 14 72 17 77 19 86
2 8 36 4 18 3 14 2 9
3 and over 6 28 4 18 2 9 1 5
Total 22 100 22 100 22 100 22 100
Table 4.8: Number ofvendors/suppliers for each materials for formal
sites
Source: Field survey, March 2005
No. of vendors
identified
Number of sites and percentages for each material
Ballast Sand Cement Steel
No. % No. % No. % No. %
1 12 57 16 76 16 76 20 95
2 5 24 4 19 5 24 1 5
3 and over 4 19 1 5 0 0 0 0
Total 21 100 21 100 21 100 21 100
Table 4.9: Number of vendors for each materials for informal sites.
Source: Field survey, March 2005
For the formal sites, the percentage representation of the sites where only one
vendor was identified for the supply of ballast, sand, cement and steel are
36%, 72%, 77% and 86% respectively for each of the materials. While for the
informal sites the percentages for selection of only one vendor are 57%, 76%,
76% and 95% respectively for ballast, sand, cement and steel.
75

The study also investigated the reasons for selection of the vendor for each of
the materials. The outcome is as summarized in tables 4.10 and 4.11 below.
The tables show the number of sites (also expressed as a percentage of the
total sites studied) that indicated the given reason as criteria for selecting the
vendor for the respective material.
Reason for selection of
vendor
Number of sites and percentage for each materials
Ballast Sand Cement Steel
NO. % NO. % NO. % NO. %
Past success 15 71 13 61 12 57 13 61
Good price 16 76 14 67 15 71 16 76
Geographical location 4 19 3 33 6 28 5 24
Credit offer 4 19 5 24 15 71 15 71
Quality assurance
programme
0 0 0 0 0 0 0 0
Bargaining agreement 0 0 0 0 0 0 0 0
Schedule adherence 12 57 14 67 0 0 0 0
Table 4.10: Reasons for selection of vendors for formal sites.
Source: Field survey, March 2005
76

Reason for selection of
vendor
Number of sites and percentage for each materials
Ballast Sand Cement Steel
NO. % NO. % NO. % NO. %
Past success 5 23 4 18 2 9 1 45
Good price 17 77 15 68 14 64 13 59
Geographical location 6 27 7 32 14 64 15 68
Credit offer 5 23 7 32 3 14 3 14
Quality assurance
programme
0 0 0 0 0 0 0 0
Bargaining agreement 0 0 0 0 0 0 0 0
Schedule adherence 2 9 4 18 0 0 0 0
Table 4.11: Reasons for selection of vendors for informal sites.
Source: Field survey, March 2005
All the sites had at least more than one reason for selecting a given vendor for
the supply of the materials.
Majority of the formal sites indicated good price, credit offer, past success
and schedule adherence as the reasons for selecting the particular vendor for
ballast, sand, cement and steel. For the informal sites, the selection was based
mainly on good price and geographical location.
Though quality assurance programme by the vendor/supplier was included in
the questionnaire as part of criteria for selecting a supplier, it was not indicated
by any site as having been considered in the selection o f the suppliers.
Only one site from the formal cluster was using ready mix concrete and the
contractor was supplying the ready mix concrete himself. Therefore the issues
o f identification of supplier were not applicable in this case.
77

4.2.4 Purchasing
The study also investigated the method used for placement of orders for the
concreting materials. The outcome is outlined in tables 4.12 and 4.13 below.
Placement
of orders
Site numbers and percentages for materials
Ballast Sand Cement Steel
No % No % No % No %
Telephone
& verbal
13 59 15 68 2 9 2 9
Written
order
6 27 4 18 20 91 20 21
Direct
purchases
3 14 3 14 0 0 0 0
Total 22 100 22 100 22 100 22 100
Table 4.12: Placement of orders on formal sites.
Source: Field survey, March 2005.
Placement of
orders
Site numbers and percentages for materials
Ballast Sand Cement Steel
No. % No % No % No %
Telephone and
verbal(agents)
19 90 19 86 2 10 3 14
Written order 0 0 0 0 2 10 2 10
Direct purchase 2 10 3 14 17 80 16 76
Total 21 100 21 100 21 100 21 100
Table 4.13: Placement of orders for informal sites
Source: Field survey, March 2005
78

The placement of orders for ballast and sand on informal sites was mainly
through telephone and verbal orders through the agents, while for sand and
cement the orders were mainly placed through written orders. The latter could
be because of credit offers to the contractors by suppliers.
For the informal the ordering was mainly by telephone and verbal contacts
with agents for ballast and sand, while cement and steel were mainly
purchased directly.
4.2.5 Expediting
Table 4.14 indicates the findings on expediting (follow up) on orders for
materials for both formal and informal sites.
Follow up on orders Number of sites and percentages
Formal sites Informal sites Combined
NO. % NO. % NO. %
Follow up made 16 73 10 48 36 60
No follow up made 6 27 11 52 17 40
Total 22 100 21 100 43 100
Table 4.14: Expediting/follow up on orders for materials
Source: Field survey, March 2005
73% of the formal sites indicated that they make some form of follow up
with the suppliers once the orders have been placed to ensure that deliveries
are made correctly. However, for the informal sites only 48% indicated to be
involved with some follow up with the suppliers.
79

4.2.6 Transportation
This study also investigated the involvement of the contractor/developer in the
transportation and packaging of the materials as a means o f minimizing
transportation costs, damage and wastage associated with transportation. The
findings are shown in tables 4.15 and 4.16 below. The mode of transport was
also investigated and is shown in table 4.17 and 4.18 below.
Involvement in
transportation
Number of sites and percentages
Formal sites Informal sites Combined
NO. % NO. % NO. %
Involved 10 45 5 24 15 39
Not involved 12 55 16 76 28 61
Total 22 100 21 100 43 100
Table 4.15: Involvement in transportation of materials
Source: Field survey, March 2005
Involvement in
packaging of materials
Number of sites and percentages
Formal sites Informal sites Combined
NO. % NO. % NO. %
Involved 10 45 2 9 12 32
Not involved 12 55 19 81 31 68
Total 22 100 21 100 43 100
Table 4.16: Involvement in packaging of materials
Source: Field survey, March 2005
80
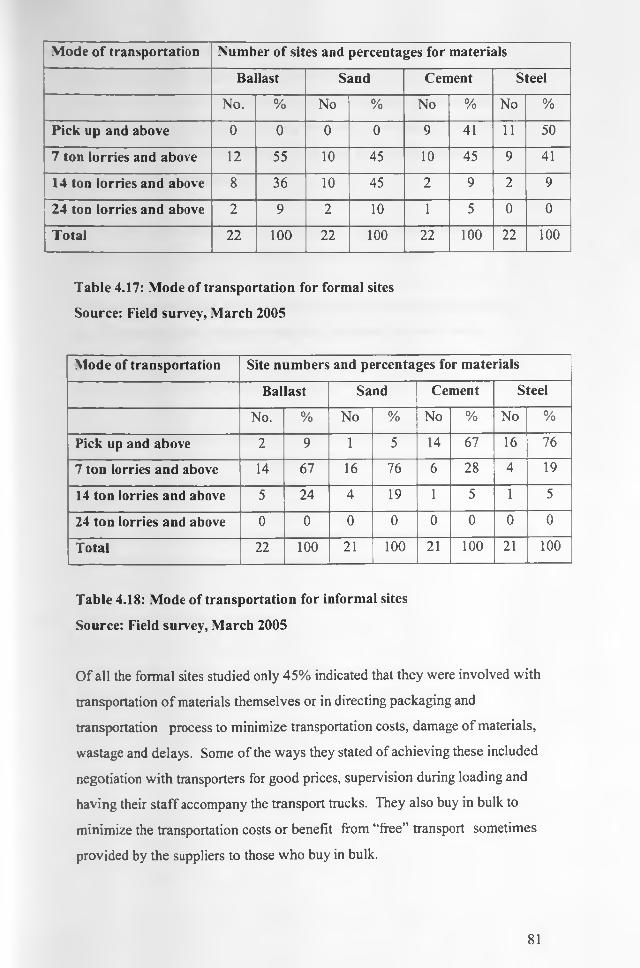
Mode of transportation Number of sites and percentages for materials
Ballast Sand Cement Steel
No. % No % No % No %
Pick up and above 0 0 0 0 9 41 11 50
7 ton lorries and above 12 55 10 45 10 45 9 41
14 ton lorries and above 8 36 10 45 2 9 2 9
24 ton lorries and above 2 9 2 10 1 5 0 0
Total 22 100 22 100 22 100 22 100
Table 4.17: Mode of transportation for formal sites
Source: Field survey, March 2005
Mode of transportation Site numbers and percentages for materials
Ballast Sand Cement Steel
No. % No % No % No %
Pick up and above 2 9 1 5 14 67 16 16
7 ton lorries and above 14 67 16 76 6 28 4 19
14 ton lorries and above 5 24 4 19 1 5 1 5
24 ton lorries and above 0 0 0 0 0 0 0 0
Total 22 100 21 100 21 100 21 100
Table 4.18: Mode of transportation for informal sites
Source: Field survey, March 2005
O f all the formal sites studied only 45% indicated that they were involved with
transportation o f materials themselves or in directing packaging and
transportation process to minimize transportation costs, damage of materials,
wastage and delays. Some of the ways they stated of achieving these included
negotiation with transporters for good prices, supervision during loading and
having their staff accompany the transport tmcks. They also buy in bulk to
minimize the transportation costs or benefit from “free” transport sometimes
provided by the suppliers to those who buy in bulk.
81

For the informal sites only 9% indicated to having been involved in
transportation and packaging of materials. Their way of involvement was
similar to the formal sites (negotiation with transporters for good prices,
supervision during loading and having their staff accompany the transport
trucks). They also indicated having to buy from the nearest suppliers to
minimize on transportation costs.
All the sites, formal and informal, indicated to having bought cement in the
standard 50kg package. None bought in bulk for silo storage.
Transportation mode for the formal sites for ballast and sand was mainly by
over 7 tones and over 14 tones lorries and for cement and steel was by
pick ups and 7 tones and above lorries. 14 tones and above trucks were not
commonly used for transportation of cement and steel for informal sites.
For the informal site, the transport mode for sand and ballast is also mainly
over 7 tones and over 14 tones lorries, while cement and steel is by mainly
pick up lorries/canters and over 7 tones lorries.
Only one site from the formal cluster indicated to be using ready mix concrete
occasionally and the transportation method was transmixers.
4.2.7 Site materials management
Table 4.19 represents the outcome o f the investigation on reasons that
triggered the ordering of materials for both formal and informal sites.
82
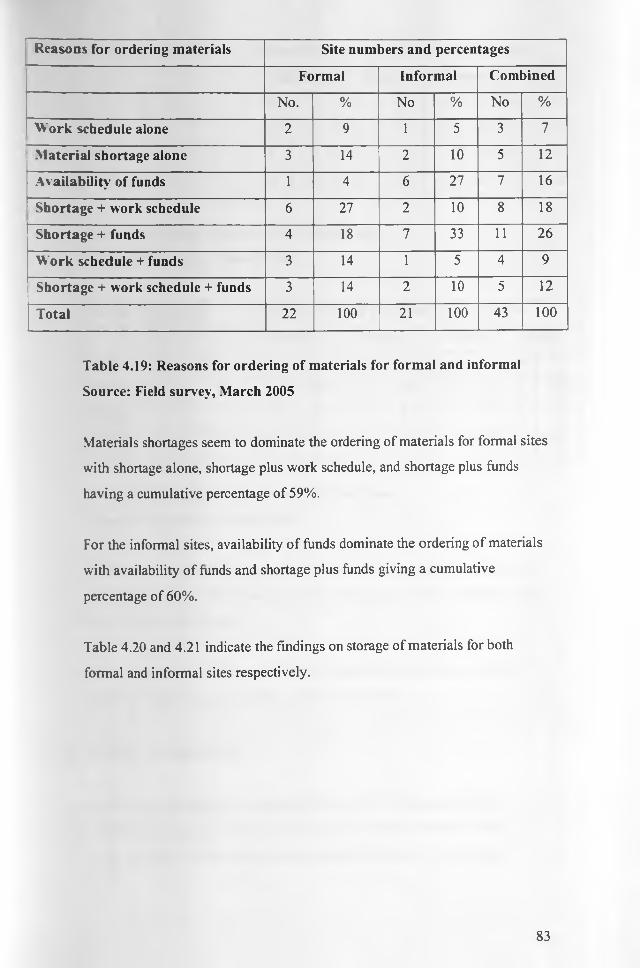
Reasons for ordering materials Site numbers and percentages
Formal Informal Combined
No. % No % No %
Work schedule alone 2 9 1 5 3 7
Material shortage alone 3 14 2 10 5 12
Availability' of funds 1 4 6 27 7 16
Shortage + work schedule 6 27 2 10 8 18
Shortage + funds 4 18 7 33 11 26
Work schedule + funds 3 14 1 5 4 9
Shortage + work schedule + funds 3 14 2 10 5 12
Total 22 100 21 100 43 100
Table 4.19: Reasons for ordering of materials for formal and informal
Source: Field survey, March 2005
Materials shortages seem to dominate the ordering of materials for formal sites
with shortage alone, shortage plus work schedule, and shortage plus funds
having a cumulative percentage of 59%.
For the informal sites, availability of funds dominate the ordering of materials
with availability of funds and shortage plus funds giving a cumulative
percentage of 60%.
Table 4.20 and 4.21 indicate the findings on storage of materials for both
formal and informal sites respectively.
83

Storage of materials Site numbers and percentages for materials
Ballast Sand Cement Steel
No. % No % No % No %
On site 20 91 20 91 22 100 22 100
Off site 2 9 2 9 0 0 0 0
Total 22 100 22 100 22 100 22 100
Table 4.20: Storage of materials for formal sites
Source: Field survey, March 2005
Storage of materials Site numbers and percentages for materials
Ballast Sand Cement Steel
No. % No % No % No %
On site 21 100 21 100 21 100 21 100
Off site 0 0 0 0 0 0 0 0
Total 21 100 21 100 21 100 21 100
Table 4.21 Storage of materials for informal sites
Source: Field survey, March 2005
The study established that materials are mainly stored on site for both formal
and informal with 91% of the formal sites storing most o f the materials on site
and 100% for the informal.
All the sites (both formal and informal) indicated to keeping some form of
records for receiving and issuing o f materials on site.
4.2.8 Quality management
Quality management is a component that should run through the entire
materials management process. In this study the component was mainly
examined under vendor selection, site management and site operations.
84

As already shown in table 4.11 under vendor selection, no site in both formal
and informal was found to select its materials vendor (supplier) on the basis of
the vendor having a quality control program.
Table 4.22 below shows the outcome on the investigation as to whether there
was any written agreement on the quality standards of the materials purchased
between the contractor/developer and the supplier/vendor.
Quality control Site numbers and percentages
Formal Informal Combined
No. % No % No %
Written standards on orders 7 32 0 0 7 16
No written standards 15 68 21 100 36 84
Total 22 100 21 100 43 100
Table 4.22: Quality control in purchasing
Source: Field survey, March 2005
Only 32% of the formal sites indicated to have some written
standards/specifications for materials which are included or form part of the
purchase order. However none of the informal sites included such standards in
the purchasing of materials.
On whether they carried out any tests apart from physical examination on
delivered materials to ensure that they are of the right quality, no site from
both informal and formal clusters was found to carry out any examinations.
Even for the water used for concreting there was no site found to carry out any
test to ensure that the water was not contaminated.
Tables 4.23, 4.24,4.25a and 4.25b indicate the outcome on investigation into
methods of measuring the concrete ingredients, methods of mixing concrete
and testing of concrete.
85

M easuring of ingredients Site num bers and percentages
Formal Informal Combined
No. % No % No %
M anual (wheelbarrows etc) 13 59 20 95 33 77
Batching boxes 8 36 1 5 9 20
Batching plant 1 5 0 0 1 3
Total 22 100 21 100 43 100
Table 4.23: Measuring of ingredients for concreting
Source: Field survey, March 2005
Mixing of concrete Site num bers and percentages
Formal Informal Combined
No. % No % No %
M anual (hand mixing) 0 0 3 14 3 7
Concrete mixers 21 95 18 86 39 90
Ready mix/transmixers 1 5 0 0 1 3
Total 22 100 21 100 43 100
Table 4.24: Mixing of concrete
Source: Field survey, March 2005
Testing for fresh concrete Site numbers and percentages
Formal Informal Combined
No. % No % No %
Slump test 3 14 0 0 3 7
No slump test 19 86 21 100 40 93
Total 22 100 21 100 43 100
Table 4.25a: Slump test for fresh concrete
Source: Field survey, March 2005
86

Testing for concrete Site numbers and percentages
Formal Informal Combined
No. % No % No %
Cube test 14 64 0 0 14 32
No cube test 8 36 21 100 29 68
Total 22 100 21 100 43 100
Table 4.25b: Cube test for concrete
Source: Field survey, March 2005
Measuring of concrete ingredients was mainly manual for both formal and
informal sites at 59% and 95% respectively. However, 36% of the formal sites
used batching boxes for measuring out. Mixing was mostly by concrete mixers
with 95% for formal sites and 86% for informal. This could be attributed to the
readily availability of concrete mixers for hire and the labour intensiveness
that concreting requires. No testing of concrete, both slump test and cube test,
was recorded for informal sites. However, only 14% of the formal sites
indicated to carryout slump test compared to 64% for the cube test. The high
percentage for cube test could be because this is sometimes a requirement in
the formal contracts.
4.2.9 Wastage management
Tables 4.26a and 4.26b show findings on physical measurement of materials
on delivery on site while table 4.27 shows the methods used in delivery of
concrete in position both of which are indications of wastage control.
87

Physical measurement Site numbers and percentages for materials
Ballast Sand Cement Steel
No. % No % No % No %
Measured 6 27 8 36 22 100 20 91
Not measured 16 73 14 64 0 0 2 9
Total 22 100 22 100 22 100 22 100
Table 4.26a: Measurement of materials for formal sites
Source: Field survey, March 2005
Physical measurement Site numbers and percentages for materials
Ballast Sand Cement Steel
No. % No % No % No %
Measured 1 5 1 5 21 100 20 95
Not measured 20 95 20 95 0 0 1 5
Total 21 100 21 100 21 100 21 100
Table 4.26b: Measurement of materials for informal sites
Source: Field survey, March 2005
Delivery of concrete Site numbers and percentages
Formal Informal Combined
No. % No % No %
Manual (wheelbarrows, trays) 5 23 14 67 19 45
Hoists and cranes 17 77 7 33 24 55
Total 22 100 21 100 43 100
Table 4.27: Delivery of concrete into position
Source: Field survey, March 2005
Apart from cement and steel where over 90% of both formal and informal sites
physically verified the quantities on purchase and delivery, there was very
88

little verification for ballast and sand averaging just 5% for informal sites and
31.5% for formal sites.
Majority of the informal sites (67%) delivered their concrete into position
manually. However for the formal sites the majority (77%) used hoists and
cranes.
The method of measuring of concrete ingredients shown in table 4.23 under
quality control and which is predominantly manual at 59%for formal sites and
95% for informal site also has influence on wastage o f materials.
4.2.10 Surplus management
Tables 4.28 and 4.29 respectively show the causes of surplus and the use o f
surplus materials respectively on the sites investigated.
Causes of surplus Site numbers and percentages
Formal Informal Combined
No. % No % No %
Deliberate over ordering 9 41 4 19 13 30
Overestimating 9 41 7 33 16 37
Changes in design and specs 3 14 0 0 3 7
No surplus (shortage) 1 4 10 48 11 26
Total 22 100 21 100 22 100
Table 4.28: Causes of surplus
Source: Field survey, March 2005
89

Uses of surplus Site numbers and percentages
Formal Informal Combined
No. % No % No %
Used on alternative tasks/jobs 19 86 8 38 17 62
Returned to supplier 0 0 0 0 0 0
Sold to third party 0 0 2 9 2 5
Donated to others 2 9 1 5 3 7
No surplus (shortage) 1 5 10 48 11 26
Total 22 100 21 100 43 100
Table 4.29: Uses of surplus
Source: Field survey, March 2005
96% of all the formal sites and 52% of the informal sites experienced
considerable surplus of materials during concreting. The causes of surplus
were mainly deliberate ordering at 41% and 19% respectively for formal and
informal sites; and overestimation at 41 % and 33% respectively for formal and
informal sites. The surplus materials were mainly used on alternative
tasks/jobs at 86% for formal and 38% for informal sites.
4.3 Findings and analysis of dependent variable
The questionnaire also set out to establish the extent/level of materials
attributes on all the sites studied. The findings and analysis are presented in
this section.
4.3.1 Av ailability of materials
Materials availability was investigated in terms of the sites having right
quantities of materials at any given time without having storage problems or
work being delayed, suspended, stopped or work time extended due to
90

shortage of materials or emergency purchases o f materials. The findings are
presented in tables 4.30a, 4.30b, 4.30c and 4.30d.
Storage problems Number of sites and percentages
Formal sites Informal sites Combined
NO. % NO. % NO. %
Storage problems 14 64 17 81 31 72
No storage problems 8 36 4 19 12 28
Total 22 100 21 100 43 100
Table 4.30a: Materials storage problems
Source: Field survey, March 2005
Material shortages Number of sites and percentages
Formal sites Informal sites Combined
NO. % NO. % NO. %
Shortages experienced 2 9 10 48 12 28
No shortage problems 20 91 11 52 31 72
Total 22 100 21 100 43 100
Table 4.30b: Stoppage or delay in work due to material shortages
Source: Field survey, March 2005
Emergency purchases Number of sites and percentages
Formal sites Informal sites Combined
NO. % NO. % NO. %
Emergency purchase 7 32 14 67 21 49
No emergency purchase 15 68 7 33 22 51
Total 22 100 21 100 43 100
Table 4.30c: Emergency purchases of materials
Source: Field survey, March 2005
91
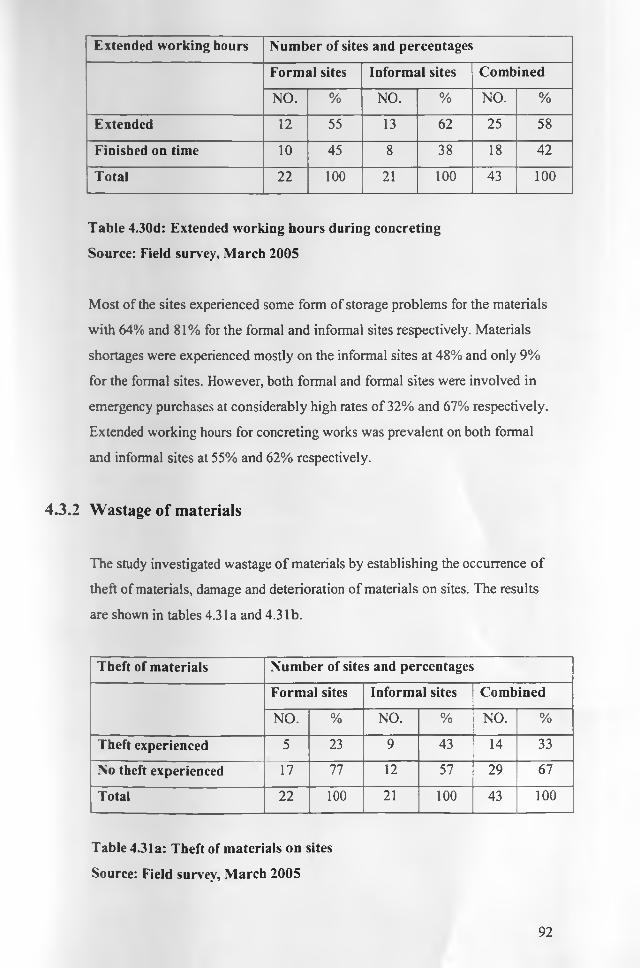
Extended working hours Number of sites and percentages
Formal sites Informal sites Combined
NO. % NO. % NO. %
Extended 12 55 13 62 25 58
Finished on time 10 45 8 38 18 42
Total 22 100 21 100 43 100
Table 4.30d: Extended working hours during concreting
Source: Field survey, March 2005
Most of the sites experienced some form of storage problems for the materials
with 64% and 81% for the formal and informal sites respectively. Materials
shortages were experienced mostly on the informal sites at 48% and only 9%
for the formal sites. However, both formal and formal sites were involved in
emergency purchases at considerably high rates of 32% and 67% respectively.
Extended working hours for concreting works was prevalent on both formal
and informal sites at 55% and 62% respectively.
4.3.2 Wastage of materials
The study investigated wastage of materials by establishing the occurrence of
theft of materials, damage and deterioration of materials on sites. The results
are shown in tables 4.31 a and 4.3 lb.
Theft of materials Number of sites and percentages
Formal sites Informal sites Combined
NO. % NO. % NO. %
Theft experienced 5 23 9 43 14 33
No theft experienced 17 77 12 57 29 67
Total 22 100 21 100 43 100
Table 4.31a: Theft of materials on sites
Source: Field survey, March 2005
92
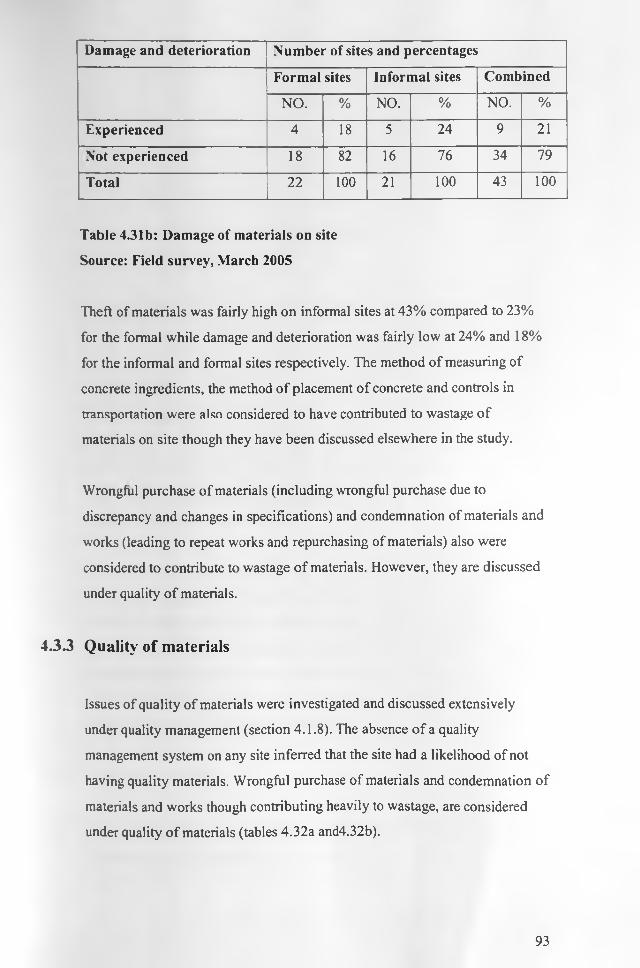
Damage and deterioration Number of sites and percentages
Formal sites Informal sites Combined
NO. % NO. % NO. %
Experienced 4 18 5 24 9 21
Not experienced 18 82 16 76 34 79
Total 22 100 21 100 43 100
Table 4.31b: Damage of materials on site
Source: Field survey, March 2005
Theft of materials was fairly high on informal sites at 43% compared to 23%
for the formal while damage and deterioration was fairly low at 24% and 18%
for the informal and formal sites respectively. The method of measuring of
concrete ingredients, the method of placement of concrete and controls in
transportation were also considered to have contributed to wastage o f
materials on site though they have been discussed elsewhere in the study.
Wrongful purchase of materials (including wrongful purchase due to
discrepancy and changes in specifications) and condemnation of materials and
works (leading to repeat works and repurchasing of materials) also were
considered to contribute to wastage o f materials. However, they are discussed
under quality o f materials.
4.33 Quality of materials
Issues of quality of materials were investigated and discussed extensively
under quality management (section 4.1.8). The absence o f a quality
management system on any site inferred that the site had a likelihood of not
having quality materials. Wrongful purchase of materials and condemnation of
materials and works though contributing heavily to wastage, are considered
under quality of materials (tables 4.32a and4.32b).
93

Wrongful purchase Number of sites and percentages
Formal sites Informal sites Combined
NO. % NO. % NO. %
Experienced 6 27 6 29 12 28
Not experienced 16 73 15 71 31 72
Total 22 100 21 100 43 100
Table 4.32a: Wrongful purchase of materials
Source: Field survey, March 2005
Condemnation Number of sites and percentages
Formal sites Informal sites Combined
NO. % NO. % NO. %
Experienced 8 36 0 0 8 18
Not experienced 14 64 21 100 35 82
Total 22 100 21 100 43 100
Table 4.32b: Condemnation of materials and works
Source: Field survey, March 2005
27% of the formal and 29% of the informal sites were found to have
experienced some form of wrongful purchase of materials while 36% of the
formal sites indicated to have experienced condemnation of materials and
works either by themselves (through wrongful supply) or by the consultants.
No informal site indicated to have experienced any condemnation, though this
could me attributed to lack of quality control and absence of formalized
supervision and consultants on informal sites.
4.3.4 Surplus materials
The study investigated the existence of surplus materials particularly from the
concreting process, table 4.33.
94

Surplus of materials Number of sites and percentages
Formal sites Informal sites Combined
NO. % NO. % NO. %
Surplus 20 91 11 52 31 72
No surplus 2 9 10 48 12 28
Total 22 100 21 100 43 100
Table 4.33: Surplus materials
Source: Field survey, March 2005
Surplus of materials was mainly experienced on formal sites at 91% while on
informal sites it was 52%.
4.3.5 Cost of materials
The investigation and measurement o f this component o f the dependent
variable was fairly subjective and was based on the findings of various aspects
of the study including the processes o f vendor section and occurrence of
emergency purchases of materials.
4.4 Measurement of variables
Each of the components of the variables (ten components for the independent
variable and five components for the dependent variable) was measured on an
ordinal scale. Thus based on the responses and analysis o f the questionnaire,
every site was given a score of either zero (0) or one (1) for each of the
components to indicate its performance in that aspect. The cumulative score
for each variable was assumed to form an interval scale and hence a
measure of the performance of each site in that variable.
Therefore a site that was excellent in all aspects of materials management
would score a total of ten (10) in the independent variable (extent of
management) while the poorest would score zero (0) in this variable. Likewise
95

an excellent site in all aspects o f the dependent variable (extent of materials
attributes) would score five (5) the poorest would score zero (0) in this attribute.
The outcome is shown in tables 4.34a and 4.34b.
Component of variable Number of sites and percentages with score of one (1)
Formal sites Informal sites Combined
NO. % NO. % NO. %
Planning, organizing &
staffing
10 45 6 28 16 36
.Materials take off 4 18 4 19 8 18
Vendor selection 12 54 9 43 21 48
Purchasing 9 41 6 28 15 34
Expediting 16 72 10 48 26 60
Transportation 10 45 5 24 15 34
Site management 10 45 10 48 20 45
Quality management 10 45 10 48 20 46
Wastage management 11 50 9 42 20 46
Surplus management 9 40 13 62 22 51
Table 4.34a: Scoring for independent variable
Source: Field survey, March 2005
Component of variable Number of sites and percentages with score of one (1)
Formal sites Informal sites Combined
NO. % NO. % NO. %
Availability 14 64 8 38 22 51
Minimal wastage 8 36 6 28 14 32
Right quality- 7 32 5 24 13 28
Minimal surplus 9 40 10 48 19 44
Right cost 7 32 5 24 12 28
Table 4.34b: Scoring for dependent variable
Source: Field survey, March 2005
96
According to the summary of site scoring expediting was ranked as the task
that was well managed will 60% o f the sites studied excelling (scoring one) in
this aspect o f management. It was followed by surplus management at 51%.
The worst performed management component was materials take off with only
18% of the sites studied excelling in this aspect. It was followed by
purchasing at 34%.
In terms of attributes, availability o f materials was the most observed/recorded
with 51% of the sites studied excelling in this component. The attributes that
were least observed/recorded, were right quality and right cost where only
28% of the sites studied excelled in these attributes respectively.
4.5 Statistical analysis and hypothesis testing
Table 4.35 below is a summary o f the scorings for both level of materials
management and materials attributes for all the 43 sites studied. These
scorings were then used for various inferential statistical analysis and
hypothesis testing.
97

Site number Level of materials management Level of materials attributes1 2 12 4 13 3 14 5 25 7 36 5 27 5 28 3 19 7 310 5 211 6 212 5 213 8 314 5 215 3 116 5 217 6 218 3 119 5 220 8 321 9 322 6 223 7 224 8 325 3 126 5 227 4 128 3 129 5 230 4 131 2 132 5 333 6 234 3 135 5 236 6 237 6 238 2 139 5 240 7 241 3 142 5 143 4 1
Table 4.35: Summary of scorings for all the sites
Source: Field survey, March 2005
98

As outlined elsewhere in this study, each of the sites was ranked on a scale of
ten for level of materials management and on scale five for materials
attributes. Scores for each of the sites are as indicated in table 4.35. Table
4.36 below shows the mean, median, mode and standard deviation for both
variables (level of materials management and level of materials attributes).
Level of materials management Level of materials attributesN Valid 43 43
Missing 0 0Mean 4.95 1.79
Median 5.00 2.00Mode 5 2
Std. Deviation 1.75 .71Sum 213 77
Percentiles 25 3.00 1.0050 5.00 2.0075 6.00 2.00
Table 4.36: Descriptive statistics
Source: Field survey, March 2005
The mean score for materials management was 4.95 (out of ten) while that
for materials attributes was 1.79 (out of five). The median score was 5 and 2
respectively for materials management and materials attributes respectively.
These were the same scores for the mode respectively.
Frequency tables
Tables 4.37a and 4.37b are frequency tables for the scorings for the sites for
the two variables under study.
99

Score Frequency Percent Valid Percent Cumulative PercentValid 2 3 7.0 7.0 7.0
3 8 18.6 18.6 25.64 4 9.3 9.3 34.95 14 32.6 32.6 67.46 6 14.0 14.0 81.47 4 9.3 9.3 90.78 3 7.0 7.0 97.7
9 1 2.3 2.3 100.0Total 43 100.0 100.0
Table 4.37a: Frequency table for level of materials management
Source: Field survey, March 2005
Score Frequency Percent Valid Percent Cumulative Percent
Valid 1 16 37.2 37.2 37.2
2 20 46.5 46.5 83.7
3 7 16.3 16.3 100.0
Total 43 100.0 100.0
Table 4.37b: Frequency table for level of materials attributes
Source: Field survey, March 2005
Frequencies provide statistics that are useful for describing variables. For a
frequency report, distinct values are arranged in ascending order or categories
ordered by their frequencies. From these tables it can be deduced that majority
of the sites, 67.4% scored 5 and below in materials management, while only
32.6% scored 6 and above in materials management. No site scored 10, the
maximum score in management while only one site scored 9 in management
representing only 2.3% of the sites.
In the component materials attributes, 83.7% of the sites scored 2 and below
while only 16.3% of the sites scored 3. None of the sites studied scored 4 or 5
(the maximum score).
100

Perc
ent
Figures 4.1a and 4.1b below are graphical presentations o f frequency tables for
both materials management and materials attributes.
Level of Material Management
2 3 4 5 6 7 8 9
Level of Material Management
Figure 4.1a: Frequency graph for materials management
Source: Field survey, March 2005
Level of Material Attributes50
1 2 3
Level of Material Attributes
Figure 4.1b: Frequency graph for materials attributes
Source: Field survey, March 2005
101
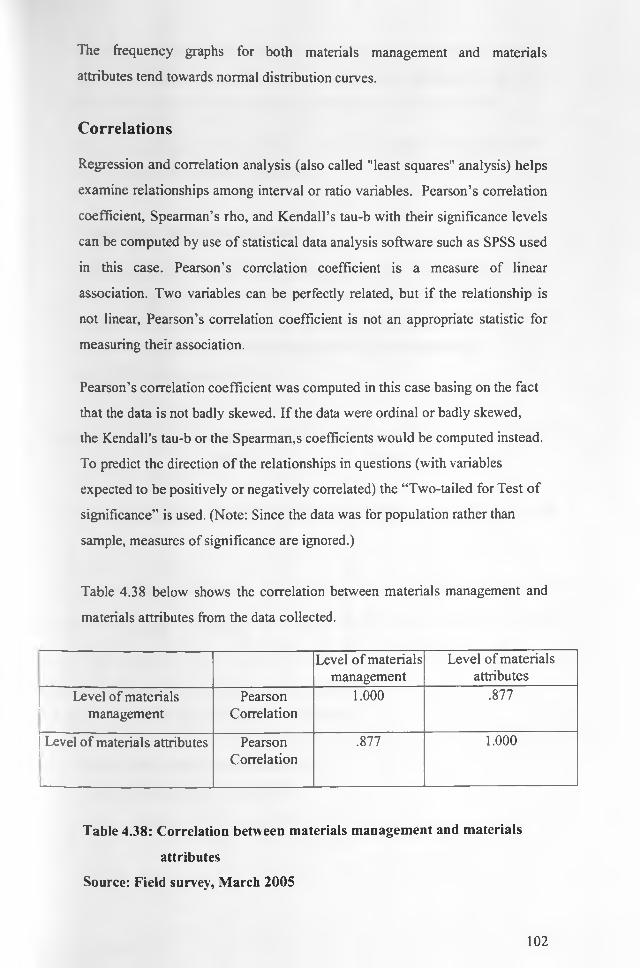
The frequency graphs for both materials management and materials
attributes tend towards normal distribution curves.
Correlations
Regression and correlation analysis (also called "least squares" analysis) helps
examine relationships among interval or ratio variables. Pearson’s correlation
coefficient, Spearman’s rho, and Kendall’s tau-b with their significance levels
can be computed by use o f statistical data analysis software such as SPSS used
in this case. Pearson’s correlation coefficient is a measure of linear
association. Two variables can be perfectly related, but if the relationship is
not linear, Pearson’s correlation coefficient is not an appropriate statistic for
measuring their association.
Pearson’s correlation coefficient was computed in this case basing on the fact
that the data is not badly skewed. If the data were ordinal or badly skewed,
the Kendall's tau-b or the Spearman,s coefficients would be computed instead.
To predict the direction o f the relationships in questions (with variables
expected to be positively or negatively correlated) the “Two-tailed for Test of
significance” is used. (Note: Since the data was for population rather than
sample, measures of significance are ignored.)
Table 4.38 below shows the correlation between materials management and
materials attributes from the data collected.
Level of materials management
Level of materials attributes
Level of materials management
PearsonCorrelation
1.000 .877
Level of materials attributes
1________
PearsonCorrelation
.877 1.000
Table 4.38: Correlation between materials management and materials
attributes
Source: Field survey, March 2005
102

The level of materials attributes has a very strong correlation (0.877) with the
level of materials management, which is statistically significant at the 0.01
level (that is, it would occur by change less than one time in a hundred).
Thus the hypothesis of the influence of level o f materials management with
level of materials attributes is supported.
Regression and regression lines
Linear regression estimates the coefficients of the linear equation involving
one or more independent variables that best predict the value of the dependent
variable. Tables 4.39a and 4.39b are regression tables generated from
statistical operations on the data while figure 4.2 is the regression in
graphical form (regression line).
Model Sum of Squares
df MeanSquare
F Sig.
1 Regression 16.244 1 16.244 136.676 .000
Residual 4.873 41 .119
Total 21.116 42
a Predictors: (Constant), Level o f materials management
b Dependent Variable: Level of materials attributes
Table 4.39a: Anova regression table
Source: Field survey, March 2005
103
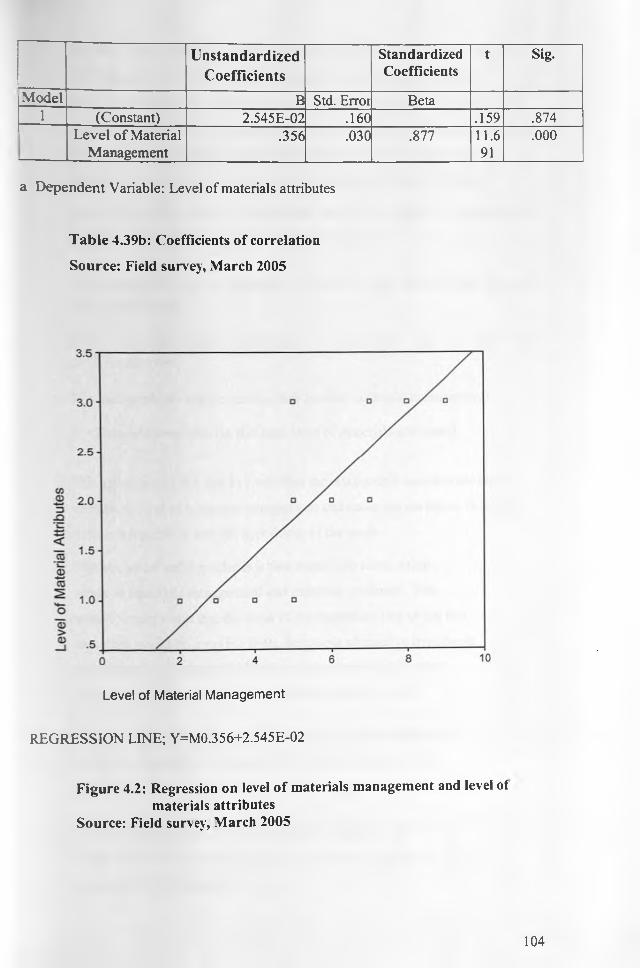
UnstandardizedCoefficients
StandardizedCoefficients
t Sig.
Model B Std. Error Beta1 (Constant) 2.545E-02 .160 .159 .874
Level of Material Management
.356 .030 .877 11.691
.000
a Dependent Variable: Level of materials attributes
Table 4.39b: Coefficients of correlation
Source: Field survey, March 2005
Level of Material M anagement
REGRESSION LINE; Y=M0.356+2.545E-02
Figure 4.2: Regression on level of materials management and level ol materials attributes
Source: Field survey, March 2005
104

For the regression line, most of the points fall fairly close to the line but
a few do not. The vertical distance between the point and the line is
called the residual, the difference between the actual value of the dependent
variable and the value "predicted" by the least squares equation represented by
the line. One may need to identify some o f the "outliers" (cases with high
residuals) and remove them but was not necessary in most of the cases.
More information about the regression line can be gotten by obtaining the
equation of the line in form of Y =MX+C, where;
C=Constant (i.e., the Y intercept) = 2.545E-02 (can also be read from the coefficients table)
M=B (un standardized coefficient) = 0.356 (can also be read from coefficients table)
X = Independent variable (in this case level of materials management)
Y= Dependent variable (in this case level of materials attributes)
The reliability o f this line in predicting the relationship between the two
variables, level of materials management and materials attributes, is tested.
This relationship is also the hypothesis of the study.
The statistical null hypothesis is that there is no relationship
between materials management and materials attributes. This
would simply mean that the slope o f the regression line o f the two
variables would be zero (H0: 6=0), hence our alternative hypothesis
(the research hypothesis) is that there is a relationship between
materials management and materials attributes (Ha: 6^0).
We test this at 95% confidence level (a=0.05 and 41 degrees of
freedom). The table value is 2.0452. When H0is true the test
statistic is distribute as student’s t with n-2 degrees of freedom.
The null hypothesis is thus rejected if the computed value of t is
either greater than or equal to 2.0452 or less than or equal to -2.0452
(obtained by interpolation).
105

The statistic is computed as t=b- B0 / Sb. The values of b and Sb are
0.356 and 0.030 respectively (also read from coefficients
table).
Thus t=0.356/0.030= 11.87
Thus Ho is rejected because 11.87 >2.0452
It can then be conclude that the slope of the true regression line is not
zero and that there is a relationship between materials
management and materials attributes which is statistically significant
at the 0.01 level (that is, it would occur by change less than one
time in a hundred {p<0.01}.
Comparison between formal and informal sites
Statistical comparison of formal and informal sites has been carried out as
indicated in tables 4.40, 4.41 a, 4.41 b, 4.41 c and 4.41 d below.
MaterialsAttributes
Formal
MaterialsAttributes-Informal
MaterialsManagement-Formal
MaterialsManagement-lnformal
N Valid 22 21 22 21Missing 0 0 0 0
Mean 1.95 1.64 5.23 4.64Std. Error of Mean .15 .14 .39 .35Median 2.00 2.00 5.00 5.00Mode 2 1 5 5Std. Deviation .72 .66 1.82 1.62Skewness .069 .547 .251 .212Std. Error of Skewness .491 .491 .491 .491Kurtosis -.929 -.528 -.326 -.470Std. Error of Kurtosis .953 .953 .953 .953Sum 43 36 115 102Percentiles 25 1.00 1.00 3.75 3.00
50 2.00 2.00 5.00 5.0075 2.25 2.00 6.25 6.00
Table 4.40: Comparative statistics between formal and informal sites
Source: Field survey, March 2005
106

Frequencv Percent Valid PercenCumulative
PercentValid 2 1 4.5 4.5 4.5
3 4 18.2 18.2 22.74 1 4.5 4.5 27.35 8 36.4 36.4 63.66 3 13.6 13.6 77.37 2 9.1 9.1 86.48 2 9.1 9.1 95.59 1 4.5 4.5 100.0Total 22 100.0 100.0
Table 4.41a: Frequency table for level of materials management for
formal sites
Source: Field survey, March 2005
Frequency Percent Valid PercentCumulative
PercentValid 2 2 9.5 9.5 9.5
3 4 19.0 19.0 28.54 3 14.3 14.3 42.85 6 28.6 28.6 71.46 3 14.3 14.3 85.77 2 9.5 9.5 95.28 1 4.8 4.8 100.0Total 21 100.0 100.0
Table 4.41b: Frequency table for level of materials management for
informal sites
Source: Field survey, March 2005
107

Frequency Percent Valid PercenCumulative
PercentValid 1 6 27.3 27.3 27.3
2 11 50.0 50.0 77.33 5 22.7 22.7 100.0Total 22 100.0 100.0
Table 4.41c: Frequency table for materials attributes for formal sites
Source: Field survey, March 2005
Frequency Percent Valid PercerCumulative
Percent
Valid 1 10 47.6 47.6 47.62 9 42.9 42.9 90.53 2 9.5 9.5 100.0Total 21 100.0 100.0
Table 4.41d: Frequency table for materials attributes for informal sites
Source: Field survey, March 2005
The mean score for level o f materials management for the formal sites is 5.23
while that of informal sites is 4.64. The mean score for level of materials
attributes is 1.95 and 1.64 for formal and informal sites respectively. The
mode score for level of management is 5 for both formal and informal sites
while the mode score for materials attributes is 2 and 1 for formal and
informal sites respectively. 63.6% o f all the formal sites studied scored 5 and
below in level of materials management while 71.4% of all the informal sites
studied scored 5 and below in level o f materials management. Most of the sites
studied scored 2 and below in level of materials attributes with 77.3% for the
formal and 90.5% for the informal sites.
108

CHAPTER FIVE
CONCLUSIONS AND RECOMMENDATIONS
5.1 Introduction
The aim of this study is to improve the level of materials management and
materials attributes on construction sites and thus enhance general project
performance. Inadequate materials management was hypothesized as the
cause of apparent poor materials attributes on construction sites. Objectives
were also set out at the beginning along which the research was to be carried
out. The related literature has been reviewed and data collected from the field
and analyzed.
This chapter therefore outlines the researcher’s conclusions and
recommendations based on the findings of the study.
However, it is worth noting that this research had several limitations as
outlined in chapter one. The conclusions and recommendations should
therefore be looked at in respect to the limitations.
5.2 Findings on study objectives
The main objective of this study was to establish the extent of materials
management on construction sites (both formal and informal).
The extent of materials management was established by examining the
performance o f materials management activities on the construction sites
studied. Ten functions of materials management that also formed the
components o f the independent variable were examined for every site.
From the findings of this study, fairly little effort is put towards planning,
organizing and staffing for materials on construction sites. Only 45% of the
109

formal sites and 28% of the informal sites studied were found to have what
can be considered as reasonable materials organization, planning and staffing.
Though materials take off is vital in determining the volumes of the materials
to be purchased throughout the construction process, only 18% of the formal
sites and 19% o f the informal sites studied were found to be sufficiently
involved in this process. Most of the formal sites (86%) basically relied on the
contract bills o f quantities, which are not prepared by the contractor/developer.
While for the informal sites, the majority of the sites (48%) did not have any
organized way o f estimating for the materials.
The study found that there is no systematic criterion for selecting materials
suppliers on most of the sites. The criterion used to select the suppliers on
most o f the sites is not professional and in the opinion of the researcher, it
does not give the contractors/developers value for their money. Only 54% of
the formal sites and 43% of the informal sites were found to select their
suppliers through a competitive process.
41% o f the formal sites and 28% of the informal sites studied were found to
have purchased their materials in a very casual manner, without any proper
documentation or contracts. This can be a source of problems in trying to
enforce the purchase contracts incase o f disputes.
Though 72% of the formal sites and 48% of the informal sites were found to
exercise some form of follow up on materials orders, this was mainly done
when there was a problem or anticipated problem. Ideal expediting should be
systematic and run through the entire process of materials procurement.
Minimal participation of contractors/developers in the materials transportation
process was established. Only 45% o f the formal sites and 24% of the informal
sites studied were directly involved in managing the materials transportation
process.
1 1 0

The study set criteria for examining sound site materials management, quality
management, wastage management and surplus management. Based on the set
criteria, 45% of the formal sites and 48% of the informal sites studied had
good site management. 45% of the formal sites and 48% of the informal sites
were considered to have good quality control practices. 50% of the formal
sites and 42% of the informal sites studied practiced what could be considered
as good surplus management, while 40% of the formal sites and 62% of the
informal sites had good wastage management.
Though the various aspects o f materials management were experienced with
varying degrees from site to site, a systematic and integrated approach to all
the management functions was missing. There was no site that had an
integrated materials management plan. Computer software was not used in the
management o f materials on all the sites studied.
With all the ten aspects of materials management considered for all the sites
studied, the mean score was found to be 4.95 out of a maximum of ten for the
variable management. This comprised of a mean score of 5.23 out of ten for
the formal sites and 4.64 out of ten for the informal sites. Of all the sites
studied, 67.4% of the sites scored 5 and below in level o f materials
management which can be considered to be below average. Of all the formal
sites studied, 63.6% scored 5 and below while 71.4% of the informal sites
scored 5 and below.
The second objective of the study was to establish the extent of materials
attributes on construction sites. Various aspects of materials attributes were
considered.
Out o f all the sites studied, 64% of the formal sites and 81% of the informal
sites were found to have either experienced some storage problems for
materials or increased costs associated with storage of materials. Shortage of
materials when needed was experienced on 9% of the formal sites and 48% of
the informal sites. 32% of the formal sites and 67% of the informal sites
studied undertook some form of emergency purchases during the concreting
111

process. The concreting process experienced extended working hours on 55%
ot the formal sites and 62% of the informal sites studied. There was
rescheduling/stoppage of concreting on 9% of the formal sites and on 19% of
the informal sites as a result of lack o f materials. On average, materials were
available when needed and in right quantities on 64% of the formal sites and
48% o f the informal sites.
Wastage of materials through theft was experienced at 23% for the formal
sites and 43% for the informal sites, while wastage through damage and
deterioration was experienced on 18% of the formal sites and 24% of the
informal sites. 59% of the formal sites and 95% of the informal sites were
involved in poor working methods that could increase wastage of materials.
Quality problems were experienced on 32% of the formal sites and 24% of the
informal sites. However, 27% of the formal sites and 29% of the informal sites
experienced wrongful purchases of materials. 36% of the formal sites
experienced condemnation o f works and materials by consultants. Though no
informal site experienced condemnation of materials and works by
consultants, the same could be attributed to limited involvement of consultants
on informal sites.
91% of the formal sites and 52% of the informal sites studied were
established to have experienced what could be considered as unplanned
surplus materials.
Based on the criteria established to examine whether materials were acquired
at reasonable cost, 32% of the formal sites and 24% of the informal sites
studied may not have acquired materials at what could be considered as
reasonable cost.
The various aspects of materials attributes were grouped into five categories
namely materials availability, minimal wastage, right quality, minimal surplus
and reasonable cost. The five formed the components of the dependent
variable. The mean score for all the sites studied was 1.79 out of five. The
11 2

formal sites had a mean score of 1.95 out o f five and the informal sites had a
mean score of 1.64 out of five. Of all the sites studied, 83.7% of them scored
2 and below in the level of materials attributes. 77.3% of the formal sites
scored 2 and below while 90.5% of the informal sites scored 2 and below.
The third and final objective of the study was to find out whether there existed
a realistic relationship between the extent of materials management and
materials attributes. This was also the study hypothesis. SPSS (Statistical
Programme for Socio- Scientific Data Analysis) software was used to test the
hypothesis. From the correlation and regression analysis, the relationship was
found to exist and the hypothesis supported. The correlation between level o f
materials management and materials attributes was 0.877.
5 3 Conclusions
From the findings and analysis of this study, it can be concluded that the
extent of materials management on construction sites is fairly poor. The
situation is more severe on informal sites.
Again based on the findings and analysis of the study it can also be concluded
that the extent o f materials attributes on construction sites is poor. The
attributes are relatively bad on the informal sites compared to the formal sites.
Based on correlation and regression analysis, and hence hypothesis testing
inadequate materials management on construction sites can be said to be the
cause of poor materials attributes on construction sites. The outcome of
hypothesis testing confirmed that at 95% confidence level (a=0.05 and 41
degrees of freedom). The outcome is supported with strong correlation (0.877)
between level of materials management and materials attributes. This is
statistically significant at 0.01 level (that is it would occur by chance less than
one in a hundred times). Therefore inadequate materials management results in
poor materials attributes on construction sites. This outcome can now be
113

generalized to the whole population and thus apply to all construction sites in
Kenya.
The implication o f the findings is that construction sites in Kenya will
continue to experience poor materials attributes unless adequate materials
management is enhanced.
The study concludes that proper project planning, use of qualified personnel
with adequate training and enhanced site management is lacking on formal
sites despite these aspects being very essential for effective materials
management.
For the informal sites, the study further concludes that materials management
functions are carried out in a very rudimentary and subjective manner, without
being considered as an essential aspect of the project. The personnel involved
also lack the necessary training.
5.4 Recommendations
1). From the findings o f the study, only 45% of the formal sites had some
form o f planning for materials. Only 14% of the formal sites had an
integrated materials management plan. A systematic and integrated
approach is therefore needed to manage materials and minimize the
costs associated with poor materials management. All materials
management functions should be well integrated and not performed in
isolation since they are interrelated and their performance affects each
other. It is therefore necessary to have an integrated materials
management plan at the beginning of the project and the plan should
span through out the project and be updated as the project progresses.
Only 28% of the informal sites had some form o f planning for
materials. However, 48% of the informal sites experienced materials
shortages and 67% of the informal sites were involved in emergency
114
purchases o f materials. Though a fully integrated materials
management planning may not be viable for the informal sites, some
form of forward planning for materials is necessary to avoid the costs
associated with lack o f it.
2) . The study established that despite the advancement and widespread use
of computer software globally in materials management, the same is
not used in the local industry in materials management. On the formal
sites only charts and tables were used (at 86%) and none of them was
found to use computer software. The study recommends enhanced use
of computers in management o f materials since they can easily be used
in the planning and monitoring of materials management. Codification
of the materials should also be encouraged to make use of computers
effective. However, given the costs associated with computer software,
its use may not be viable for informal construction which are mainly o f
modest value and a one off affair (the developer may not have another
project in a long time to reuse the software).
3) . 72% of those involved with materials management on formal sites had
formal training. However, only 36.4% of the formal sites were
considered to have performed fairly well in materials management.
Despite a great number of personnel involved in the management of
materials having formal training, they lack specialized training in
management of materials. Training should therefore be enhanced even
if it is through focused seminars targeting materials managers or by
developing a materials management handbook.
For the informal sites only 42% of those involved in materials
management had formal training and mostly intermediate college
training. Only 28.6% of the informal sites were considered to have
performed fairly well in materials management. The study therefore
recommends that the informal developers should be encouraged to use
trained personnel on their sites in order to improve on materials
management.
115

4) . In formal construction, cost, time and quality are mainly used to
measure performance o f projects. By extension, this would also be an
indicator o f good materials management. The three parameters are
mainly important for the client. However considering that on most of
the contracts the client only pays for the net materials used, it may be
important for contractors to be encouraged to use other indices like
materials management to measure their performance.
5) . This study established that most of the construction process for both
formal and informal sites is carried out on site. This involves a lot of
site handling of materials leading to challenges in materials
management. Use of in time construction like precasting of concrete
components off the site and use of ready mix concrete would minimize
handling o f materials on site. Subcontracting of various work
components would also minimize the burden of materials management.
6) . For both formal and informal sites, the study established that there was
very little effort towards quality management of materials. Since
materials contribute a lot to the overall quality of the projects, quality
management for materials should be enhanced.
5.5 Suggested areas of further study
1. Development o f materials management model appropriate for the
Kenyan construction industry.
2. Appropriate materials management training for the industry.
3. Research in developing an appropriate materials management
performance measurement index and other associated indices for
the Kenyan construction industry.
4. Improvement in procurement and performance of informal
construction.
116

b ib l io g r a p h y
Ashford, J.L.( 1989) The m anagem en t o f q u a lity in C onstruction. London, E & F.
N.SPON
Bell, L.C. and Stukhart, G. (1986) Attributes o f materials management
systems. Jo u rn a l o f C onstruction E n g in eerin g a n d M anagem ent, Vol.l 12
No. 1, March 1986, 14-21.
Bell, L.C. and Stukhart, G. (1987) Costs and benefits of materials
management systems. Jo u rn a l o f C onstruction E ng ineering a n d M anagem ent,
Vol.l 13 No. 2, June 1987, 222-235.
British Cement Association (2000) C oncre ting f o r im proved sp e e d a n d efficiency.
[online]. London, British Cement Association. Available from: http://www.bca.org.uk [Accessed 2nd March 2005],
Chandler, A.K. (1978) M ateria l m anagem en t on build ing sites. Lancaster,
Construction Press.
Construction Industry Institute (1988) P ro ject M ateria ls M anagem ent. Texas, The
Construction Industry Institute.
Cryl, E.D. (2001) A m ateria ls m anagem ent co u rse f o r a g ra d u a te leve l
construction m anagem ent curricu lum : A S C proceed ings o f the 37lh annual
C onference U niversity o f D enver- C olorado , April 4-7, 2001. Devner,
University of Devner. p. 101 -108. [online]. Available from: http://
www.acseditor.unl.edu [ Accessed 5lh January 2005].
D aily N ation (2005) Cement sector up by 11.9%. Friday May 27 2005, p.28.
Datta, A.K. (2003) M a teria ls m anagem ent. New Delhi, Prentice Hall.
Dawood, N.N. (1996) A strategy for a computer- based materials management
117
system for the building Industry. Jo u rn a l o f financ ia l m anagem ent in p ro p erty
a n d construc tion . [online]. Available from: http// www.rdg.ac.uk [Accessed
23rd November 2004],
Dindi, M.A. (2004) Q u a lity M anagem ent: a challenge f o r the K enyan Construction
industry. Unpublished M.A. research project, University of Nairobi.
Edmeads. D.H. (1972) T he construction site. London, Estates Gazzett Ltd.
Flannery, M. (2000) P ra c tica l restoration handbook: concreting, [online]. London,
Inland Waterways Association. Available from:
http//www.wrg.org.uk/prh/concreting.pdf [Accessed on 2nd March 2005].
Fletcher, B. (1994)A h is to ry o f arch itec tu re (19 th edition): London.
Buterworth/Heinmann.
Gichunge, H. (2000) R isk m anagem ent in th e bu ild ing industy in K enya: an analysis
of tim e and c o s t risks. Unpublished Phd. thesis, University of Nairobi.
Government of Kenya (2004) E conom ic S u rvey 2004. Nairobi, Government Printer.
Gruneberg L. S. (1997) C onstruction econom ics: an in troduction. London, Macmillan
Press.
Handrickson, C. (1998) P ro ject m anagem en t f o r construction. Pittsburg, Prentice
Hall.
H is to ry o f concrete (n .d .) [online]. Available from: http//www.matse.uiuc.edu.
[Accessed on 15th March, 2005].
Joint Building Council, Kenya (1999) A greem en t and cond itions o f contract fo r
build ing works. Nairobi, The Joint Building Council, Kenya.
Johnston, J. E. (1981) S ite contro l o f m ateria ls. London, Butterworths.
118

Joy. P.K. (1990) H a n d b o o k o f construction m anagem ent. New Delhi, Macmillan.
Kinyanjui, L. and Mitullah, W.V. (1997) In ter-firm dynam ics in th e construction
sector. Research Report. Nairobi, University of Nairobi.
Kithinji, B.N. (1988) S ystem s approach to b u ild in g p ro jec t m anagem ent: experience
fro m K enya. Unpublished M.A. thesis, University of Nairobi.
Magad, E.L. and Amos, J.M. (1995) Total m a teria ls m anagem ent. New York,
Chapman and Hall.
Mbatha, M. (1993) M a n a g em en t o f bu ild ing p ro je c ts ; Published Phd thesis,
Bcrgischcn University.
Mbaya, J. S. (1997) C onstruction m ateria ls m anagem ent: A paper presented at
construction management workshop organized by the Construction
Manpower development. Nairobi, Silver Springs Hotel.
Mitullah, W.V. and Wachira, N.I. (2003) In fo rm a l labor in the construction industry
in Kenya: a c a se o f Nairobi. Research Report. Geneva, International Labour
Organization (ILO).
Mugenda, O.M. and Mugenda, A.G. (1999) R esearch m ethods: quantita tive and
qualita tive approaches. Nairobi, Acts Press.
Okaka, J.O. (2004) C raftsm ansh ip in K enyan inform al construction: a case study o f
N airobi. Unpublished M.A. research project, University of Nairobi.
Oketch T.O. (2004) A n investiga tion into r isk m anagem ent: response in handling
build ing m a teria ls in K enya. Unpublished M.A research project, University
of Nairobi.
Omondi, C.G. (1992) A n investigation in to contribu tion o f s ite security to losses o f
build ing m ateria ls. Unpublished B.A project paper, University of Nairobi.
119

Parker, H (1994) S im p lified design o f co n cre te structure. 6lh Edition. London, John
Eitel & Sons Inc.
Paulson, B. C. Jr (1995) C om puter app lica tio n s in construction. New York, McGraw
Rukwaro R.W. (1997) K en ya n M aasa i arch itectu re in a chang ing in a changing
cu lture . Unpublished Phd. thesis, university of Nairobi.
Talukhaba, A. A. (1999) A n investigation in to fa c to rs causing p ro je c t delays in Kenya.
Unpublished Phd. thesis, University of Nairobi.
Tavakoli, A. and Kakalai, A. (1993) A materials management system. C onstruction
M anagem en t E conom ics Jo u rn a l [online]. Available from: http//
ww w.extra.rdg.cc.uk [Accessed on 23rd November 2004],
Thairu, J N. (1999) A n assessm ent o f level o f bu ild ing m ateria ls on construction sites.
Unpublished B.A. project paper, University of Nairobi.
Thormas, H. R. et al (1989) Impact of material management on productivity: a case
study. Jo u rn a l o f C onstruction, E ng ineering and M anagem ent, Vol. 115
No.3, September 1989, 370-375.
Turner E. A. (1997) B u ild in g procurem ent. London, Macmillan Press.
Wachira, N.I. (2001) The construction industry in the 21s' cen tury, its image,
em ploym ent p ro sp ec ts a n d sk ill requirem ents. Unpublished Research Report
for International Labour Organisation (ILO).
Waimvright, W.N. (1970) P ractica l bu ilders estim ating. London. Hutchinson
Educational Ltd.
Hill.
1 2 0

^ ihnnch, H. and Koonz, H. (1993) M anagem en t: a g lo b a l perspec tive . Singapore,
Me Graw-Hill Inc.
121

APPENDIX AP.O. BOX 2379-00100NAIROBI14/02/05
Dear Respondent
The author o f this letter and questionnaire is a graduate student in the department of
building economics and management of the University o f Nairobi, and is conducting a
research on materials management on construction sites in Nairobi.
The research is part fulfillment for the award of the degree o f Master of Arts in
Construction Management.
The Objective of the research is to evaluate the level of materials management on
construction sites in Nairobi.
Your site has been selected out of the accessible active sites to provide the
information needed in this study. Your experience presents the experiences of many
others participating in the construction process in Kenya.
Kindly provide the information required by helping complete the questionnaire.
The information will be used for research purposes only and will remain confidential
as well as your identity.
Your assistance shall be highly appreciated.
Yours faithfully
Asienga J. Ebole
1 2 2

APPENDIX B
QUESTIONNAIRE FOR CONSTRUCTION SITES
BY
ASIENGA J. EBOLE
DEPARTMENT OF BUILDING ECONOMICS AND
MANAGEMENT
UNIVERSITY OF NAIROBI
DECLARATION:
TH E INFORMATION COLLECTED THROUGH THIS QUESTIONNAIRE
SHALL BE TREATED AS CONFIDENTIAL.
Y our assistance in the completion o f this questionnaire will be highly appreciated
Questionnaire No....................................................................................................................
Enum erator..............................................................................................................................
Date..........................................................................................................................................
Location o f S ite ....................................................................................................................
Description of Project.........................................................................................................
INSTRUCTIONS
Please tick (V ) the appropriate answer and give reasons or
explanations where necessary. More than one answer may be
ticked where applicable.
r
123
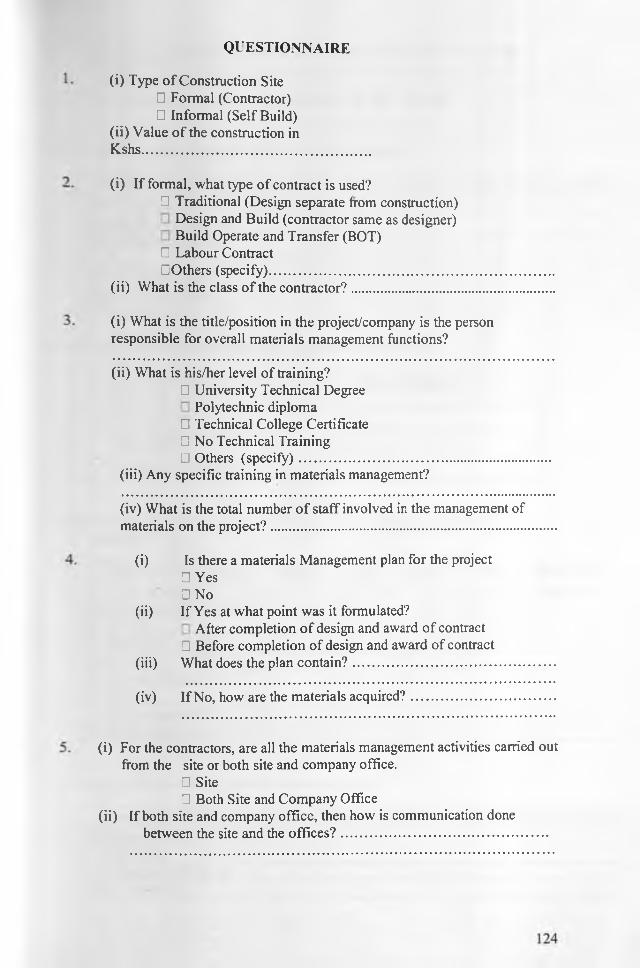
q u e s t io n n a ir e
(i) Type o f Construction Site□ Formal (Contractor)□ Informal (Self Build)
(ii) Value o f the construction inKshs..................................................................
(i) If formal, what type of contract is used?□ Traditional (Design separate from construction)
Design and Build (contractor same as designer)Build Operate and Transfer (BOT)
□ Labour Contract□Others (specify)................................................................ .
(ii) What is the class o f the contractor?.........................................
(i) What is the title/position in the project/company is the person responsible for overall materials management functions?
(ii) What is his/her level of training?□ University Technical Degree
Polytechnic diploma□ Technical College Certificate□ No Technical TrainingLI Others (specify).....................................
(iii) Any specific training in materials management?
(iv) What is the total number o f staff involved in the management of materials on the project?.........................................................................
(i) Is there a materials Management plan for the project□ Yes□ No
(ii) If Yes at what point was it formulated?After completion o f design and award of contract
□ Before completion of design and award of contract(iii) What does the plan contain?.................................................
(iv) If No, how are the materials acquired?
(i) For the contractors, are all the materials management activities carried out from the site or both site and company office.
□ Site□ Both Site and Company Office
(ii) If both site and company office, then how is communication donebetween the site and the offices?...........................................................
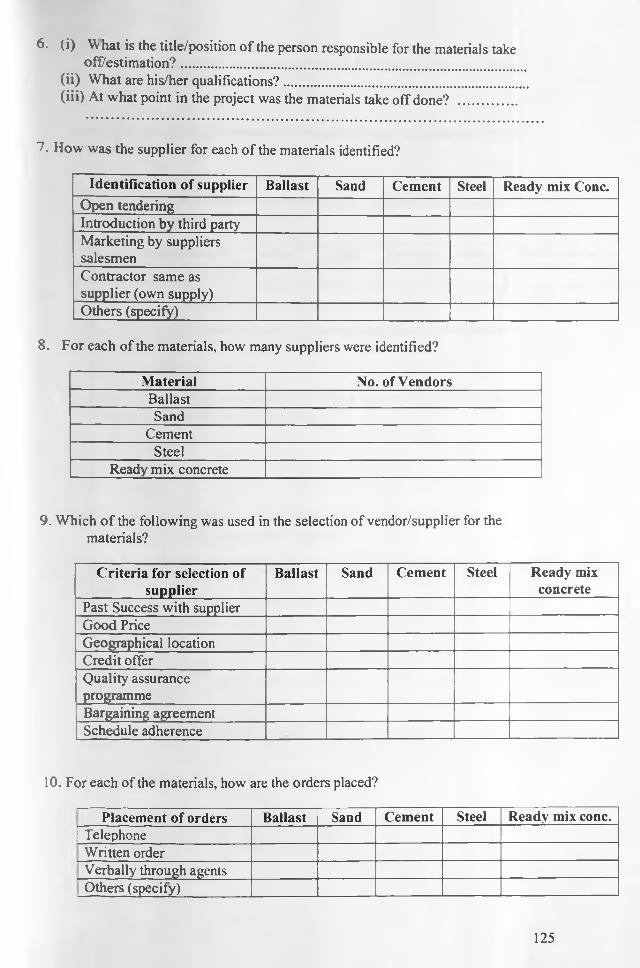
6- (i) What is the title/position o f the person responsible for the materials take off/estimation?................................................................................................
(ii) What are his/her qualifications?...................................................................(iii) At what point in the project was the materials take off done? .................
7. How was the supplier for each o f the materials identified?
Identification of supplier Ballast Sand Cement Steel Ready mix Cone.Open tenderingIntroduction by third partyMarketing by suppliers salesmenContractor same as supplier (own supply)Others (specify)
8. For each of the materials, how many suppliers were identified?
M aterial No. of VendorsBallastSand
CementSteel
Ready mix concrete
9. Which o f the following was used in the selection of vendor/supplier for the materials?
C riteria for selection of supplier
Ballast Sand Cement Steel Ready mix concrete
Past Success with supplierGood PriceGeographical locationCredit offerQuality assurance programmeBargaining agreementSchedule adherence
10. For each of the materials, how are the orders placed?
Placement of orders Ballast Sand Cement Steel Ready mix cone.1 Telephone
Written orderVerbally through agentsOthers (specify)
125

‘ 1 (i) Are there any written agreements with the suppliers on quantity, quality, price, delivery time and place of delivery for the materials before they were supplied?
□ Yes C No
(iii) Is any testing o f quality apart from physical examination carried out on materials on delivery?
□ Yes□ No
(iv)Is there any physical measurement/counting of quantities o f material at purchasing and delivery on site?
Physical measurement Ballast Sand Cement Steel Ready mix cone.YesNo
(iv)If no, how do you ensure that the right quantity and quality of materials are supplied at the right time and place? ......................................................................
12 (i) Once the materials are ordered are any follow ups made with the suppliers to ensure that deliveries are made correctly?
□ Yes□ No
(ii) If yes, what form of follow u p ..........................................................................
13 (i) Are there any disagreements with the suppliers from any o f the sources outlined below for the respective materials?
Source of disagreement Ballast Sand Cement Steel Ready mix cone.PriceQualityQuantityTime of deliveryDamage of materialsOthers (specify)
(ii) How are the disagreements settled?
14 What activates the ordering o f the materials?Shortage Work Schedule Availability of funds
□ Others, specify........
126
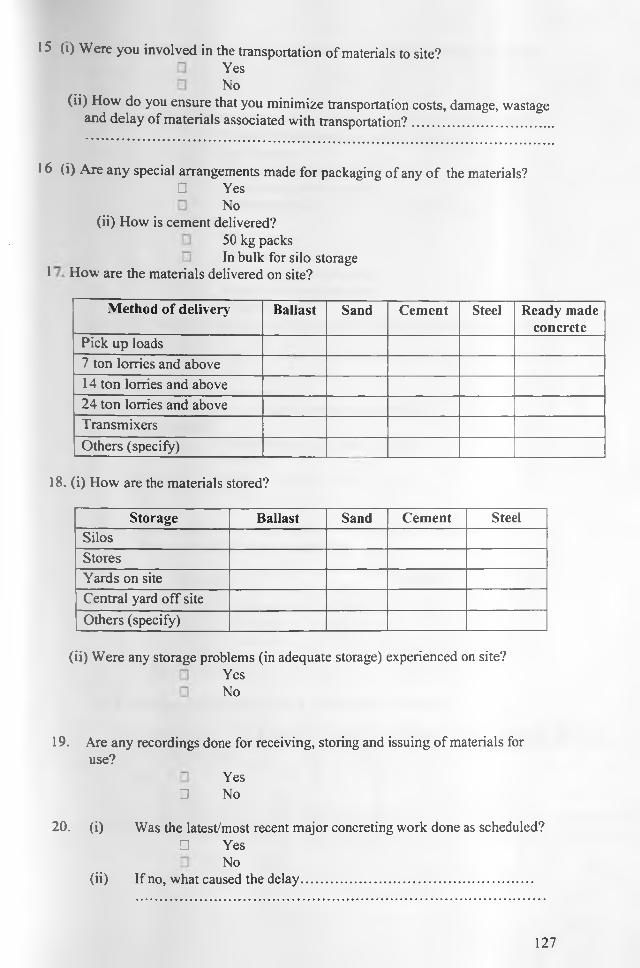
15 (i) Were you involved in the transportation of materials to site?YesNo
(ii) How do you ensure that you minimize transportation costs, damage, wastage and delay of materials associated with transportation?.......................................
16 (i) Are any special arrangements made for packaging of any o f the materials? □ Yes
No(ii) How is cement delivered?
50 kg packs In bulk for silo storage
1 How are the materials delivered on site?
Method of delivery Ballast Sand Cement Steel Ready made concrete
Pick up loads7 ton lorries and above14 ton lorries and above24 ton lorries and aboveTransmixersOthers (specify)
18. (i) How are the materials stored?
Storage Ballast Sand Cement SteelSilosStoresYards on siteCentral yard off siteOthers (specify)
(ii) Were any storage problems (in adequate storage) experienced on site?YesNo
19. Are any recordings done for receiving, storing and issuing of materials for use?
Yes□ No
20. (i) Was the latest/most recent major concreting work done as scheduled?□ Yes
No(ii) If no, what caused the delay...................................................................
127

(iii) Were there any emergency purchases of materials during concreting?□ Yes
No
(i) How are the concrete ingredients measured out before mixing of concrete?Manual (wheelbarrows, spades, trays etc)
□ Batching box Batching plant/equipment Ready mix concrete usedOthers (specify).................................................................
(ii) How is the concrete mixed?Hand mixed Concrete mixers Batching plant/equipment Ready mix concrete usedOthers (specify).................................................................
(iii) Is any testing for quality carried out on the freshly mixed concrete before pouring?
□ Yes No
(iv) If Yes which test is carried o u t .......................................................................(v) Which method is used to deliver the mixed concrete into
position/formwork?□ Wheelbarrows and trays (manual)
Pumps□ Hoists□ Cranes
22. (i)How much surplus was experienced for each of the following materials during the concreting? Express in quantities.
Material SurplusCement
SandBallastSteel
Ready mix cone.
(ii) Where there was surplus, what was the cause of surplus?
Cause of surplus Ballast Sand Cement Steel Ready mix cone.Deliberate over ordering
| OverestimationChanges in designChanges in specificationsOthers (specify)
128
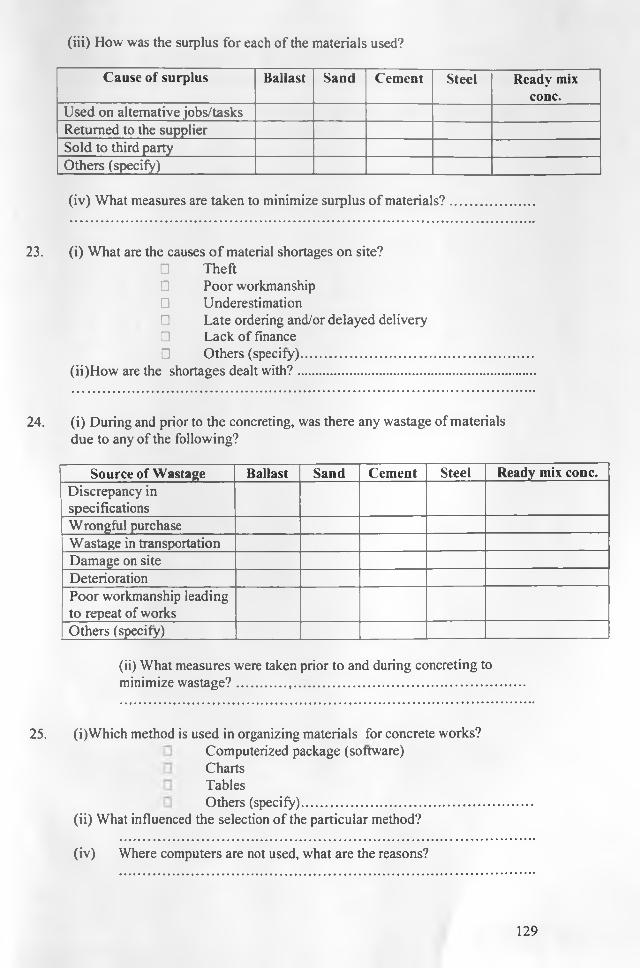
(iii) How was the surplus for each of the materials used?
Cause of surplus Ballast Sand Cement Steel Ready mix cone.
Used on alternative jobs/tasksReturned to the supplierSold to third partyOthers (specify)
(iv) What measures are taken to minimize surplus o f materials?
23. (i) What are the causes o f material shortages on site?□ Theft□ Poor workmanship□ Underestimation□ Late ordering and/or delayed delivery□ Lack of finance□ Others (specify)...................................................................
(ii)How are the shortages dealt w ith?....................................................................
24. (i) During and prior to the concreting, was there any wastage of materialsdue to any of the following?
Source of Wastage Ballast Sand Cement Steel Ready mix cone.Discrepancy in specificationsWrongful purchaseWastage in transportationDamage on siteDeteriorationPoor workmanship leading to repeat of worksOthers (specify)
(ii) What measures were taken prior to and during concreting to minimize wastage?.........................................................................
25. (i)Which method is used in organizing materials for concrete works?Computerized package (software)ChartsTablesOthers (specify)...................................................
(ii) What influenced the selection o f the particular method?
(iv) Where computers are not used, what are the reasons?
129

26. (i) What is the source of water used for concreting?.............................................(ii) How is the water stored on site? .......................................................................(iii) During mixing o f concrete, how is the water for the mix measured out?
(iv) What measures are taken to ensure that the water used for concreting is ofthe right quality and is not contaminated? ....................................................
" y or■ if?y r ' / / -
130

APPENDIX C
Classification of general contractors
C A TEG O R Y VALLE LIM IT (KSHS)
A .................................................................................. Unlimited
B ................................................................................ Up to Kshs. 250,000,000
C ................................................................................. Up to Kshs. 150,000,000
D ................................................................................ Up to Kshs. 100,000,000
E ............................................................................... Up to Kshs. 50,000,000
F ............................................................................... Up to Kshs. 20,000,000
G ................................................................................. Up to Kshs. 10,000,000
H .................................................................................. Up to Kshs. 5,000,000
Classification of specialist contractors
CATEGORY VALUE LIMIT (KSHS.)
A ................................................................................. Unlimited
B .......................................................... \ ......................Up to Ksh. 50,000,000
C ...................................................................................Up to Ksh 30,000,000
D ...................................................................................Up to Kshs. 20,000,000
E ....................................................................................Up to Kshs. 10,000,000
F ....................................................................................Up to Kshs. 4,000,000
G ....................................................................................Up to Kshs. 2,000,000
H .................................................................................... Up to Kshs. 1,000,000
Source: Ministry of Roads and Public Works (2005)
131