
capacity management, service quality and - UoN Repository
65
CAPACITY MANAGEMENT, SERVICE QUALITY AND CUSTOMER SATISFACTION IN INFORMATION TECHNOLOGY SERVICE COMPANIES IN NAIROBI, KENYA CHEPKEMOI JENIFFER D61/63023/2011 A RESEARCH PROJECT SUBMITTED IN PARTIAL FULFILMENT OF THE REQUIREMENT FOR THE AWARD OF MASTER OF BUSINESS ADMINISTRATION (MBA), SCHOOL OF BUSINESS, UNIVERSITY OF NAIROBI 2017
-
Upload
khangminh22 -
Category
Documents
-
view
2 -
download
0
Transcript of capacity management, service quality and - UoN Repository
CAPACITY MANAGEMENT, SERVICE QUALITY AND
CUSTOMER SATISFACTION IN INFORMATION TECHNOLOGY
SERVICE COMPANIES IN NAIROBI, KENYA
CHEPKEMOI JENIFFER
D61/63023/2011
A RESEARCH PROJECT SUBMITTED IN PARTIAL FULFILMENT
OF THE REQUIREMENT FOR THE AWARD OF MASTER OF
BUSINESS ADMINISTRATION (MBA), SCHOOL OF BUSINESS,
UNIVERSITY OF NAIROBI
2017

ii
DECLARATION
This research is my original work and has not been submitted for a degree in this or any
other university.
……………………………………….. …………………………
CHEPKEMOI JENIFFER Date
D61/63023/2011
Supervisor
This project has been submitted for Examination with my approval as the University
Supervisor.
……………………………………….. ………………………………..
AKELO ERNEST Date
Lecturer
Department of Management Science,
University of Nairobi, School of Business

iii
DEDICATION
To my parents Mr. Stanley Kirui and Mrs. Emily Kirui, my siblings and all my friends
for the support and encouragement and their presence throughout the entire period.

iv
ACKNOWLEDGEMENT
My gratitude goes to God for his grace, good health and provision of resources to
undertake these studies. Secondly I wish to extend my appreciation to my supervisor
Ernest Akelo for his guidance and dedication through the entire process. I am also
grateful to all the participants who accepted to be part of this project by willingly availing
the data requested for and going out of their way to ensure that I was content with their
data. Lastly, to my classmates who consistently supported me and offered their positive
criticism and help during the entire journey. May God bless you all.

v
TABLE OF CONTENTS
DECLARATION ................................................................................................................ ii
DEDICATION ................................................................................................................... iii
ACKNOWLEDGEMENT ................................................................................................. iv
LIST OF TABLES ........................................................................................................... viii
LIST OF FIGURES ........................................................................................................... ix
LIST OF ACRONYMS ...................................................................................................... x
ABSTRACT ....................................................................................................................... xi
CHAPTER ONE: INTRODUCTION ............................................................................. 1
1.1 Background of the Study .............................................................................................. 1
1.1.1 Capacity Management ...................................................................................... 2
1.1.2 Service Quality ................................................................................................. 3
1.1.3 Customer Satisfaction ....................................................................................... 5
1.1.4 IT service companies in Nairobi....................................................................... 5
1.2 Research Problem ......................................................................................................... 6
1.3 Research Objectives ...................................................................................................... 8
1.4 Value of the Study ........................................................................................................ 8
CHAPTER TWO: LITERATURE REVIEW .............................................................. 10
2.1 Introduction ................................................................................................................. 10
2.2 Theoretical Review ..................................................................................................... 10
2.2.1 Expectation Disconfirmation Theory ............................................................. 10
2.3 Capacity Management Strategies ................................................................................ 11
2.4 Service Quality............................................................................................................ 12
2.5 Customer Satisfaction ................................................................................................. 14
2.6 Capacity management, Service Quality and Customer Satisfaction ........................... 15
2.7 Empirical Studies ........................................................................................................ 16
2.8 Summary on Literature Review .................................................................................. 18
2.9 Conceptual Framework ............................................................................................... 18

vi
CHAPTER THREE: RESEARCH METHODOLOGY ............................................. 20
3.1 Introduction ................................................................................................................. 20
3.2 Research Design.......................................................................................................... 20
3.3 Target Population ........................................................................................................ 20
3.4 Sample Design ............................................................................................................ 21
3.5 Data Collection ........................................................................................................... 21
3.6 Data Analysis .............................................................................................................. 22
CHAPTER FOUR: DATA ANALYSIS, FINDINGS AND DISCUSSIONS ............. 23
4.1 Introduction ................................................................................................................. 23
4.2 The Response Rate ...................................................................................................... 23
4.3 The Respondent’s Profile ............................................................................................ 23
4.3.1 Gender .......................................................................................................... 23
4.3.2 Designation .................................................................................................. 24
4.3.3 Income.......................................................................................................... 24
4.4 Extent to which various Capacity Management practices are adopted by IT service
Companies......................................................................................................................... 25
4.5 Service quality dimension with the most impact on customer satisfaction ................ 26
4.5.1 Predictors that influence Customer satisfaction ............................................. 27
4.5.1.1 Assurance .................................................................................................... 27
4.5.1.2 Responsiveness ............................................................................................ 28
4.5.1.3 Reliability .................................................................................................... 29
4.5.1.4 Tangibility ................................................................................................... 30
4.5.1.5 Empathy ....................................................................................................... 31
4.6 Capacity Management, Service Quality and Customer satisfaction ........................... 32
4.6.1 Capacity Management and Service Quality ................................................... 32
4.6.2 Analysis of Variance: ANOVA ...................................................................... 32
4.6.3 Significance of the Regression Coefficients ................................................... 33
4.7 Service Quality and Customer Satisfaction ................................................................ 34
4.7.1 Analysis of Variance: ANOVA ...................................................................... 34
4.7.2 Significance of the Regression Coefficients ................................................... 35

vii
4.8 Capacity Management, Service Quality and Customer Satisfaction .......................... 36
4.9 Challenges affecting implementation of capacity management strategies ................. 37
CHAPTER FIVE: SUMMARY, CONCLUSION AND RECOMMENDATIONS .. 39
5.1 Introduction ................................................................................................................. 39
5.2 Summary of Findings .................................................................................................. 39
5.2.1 Capacity Management practices Service quality and Customer satisfaction . 39
5.2.2 Challenges in implementing capacity management practices ........................ 40
5.3 Conclusion .................................................................................................................. 41
5.4 Recommendations to Policy and Practice ................................................................... 42
5.5 Limitations of the Study.............................................................................................. 43
5.6 Suggestions for Further Research ............................................................................... 43
REFERENCES ................................................................................................................ 44
APPENDICES ................................................................................................................. 48
Appendix I: Questionnaire ................................................................................................ 48
Appendix II: Customer’s questionnaire ............................................................................ 51
Appendix III: List of Companies Registered with KITOs ................................................ 53
Appendix IV: Letter of Introduction ................................................................................. 54

viii
LIST OF TABLES
Table 4.1 Gender of the Respondents ............................................................................... 24
Table 4.2 Designation of the Respondents ....................................................................... 24
Table 4.3 Firms Average Annual Income ......................................................................... 25
Table 4.4 Extent to which Capacity Management strategies have been adopted by IT
service companies ........................................................................................... 25
Table 4.5 Impact of Individual Service Quality Dimensions on customer satisfaction.... 26
Table 4.6 Influence of Assurance on customer satisfaction ............................................. 27
Table 4.8 Influence of Reliability on customer satisfaction ............................................. 29
Table 4.9 Influence of Tangibility on customer satisfaction ............................................ 30
Table 4.10 Influence of Empathy on overall customer satisfaction.................................. 31
Table 4.11 Regression Analysis Results: Model Fitness .................................................. 32
Table 4.12 ANOVAa ......................................................................................................... 33
Table 4.14 Multiple Regression Analysis Results: Model Fitness ................................... 34
Table 4.15 ANOVA .......................................................................................................... 35
Table 4.16 Multiple Regression Analysis Results: Coefficients ...................................... 35
Table 4.17 Multiple Regression Analysis Results: Coefficients ...................................... 37
Table 4.18 Challenges in capacity management ............................................................... 38

ix
LIST OF FIGURES
Figure 2.1 Conceptual Framework ................................................................................... 18

x
LIST OF ACRONYMS
CDT Expectation Disconfirmation Theory
IS Information Systems
IT Information Technology
ITES Information Technology Enabled Services
KITOS Kenya IT and Outsourcing services
UIS User Information Satisfaction

xi
ABSTRACT
IT service providers are companies that provide advice to companies on how best to
apply IT in their operations in order to achieve their objectives. Capacity management for
IT service companies is important for optimization of available resource an
competitiveness. The main objective of this study was to establish capacity management
strategies used by IT service companies in Nairobi, Kenya, the most important service
quality dimension that impacts customer satisfaction and to also establish how service
quality influences the relationship between capacity management and customer
satisfaction as well as challenges faced by the firms in implementing capacity
management strategies. The researcher adopted a cross-sectional research design to carry
out the study on 28 IT service companies registered with the Kenya IT and Outsourcing
Services (KITOs) organization as at September 2017 and their customers based in
Nairobi. The researcher used a questionnaire to collect primary data. Regression and
correlation analysis was carried out to establish the relationship between the variables and
the direction of the relationship. The study ascertained that the four capacity management
strategies under study i.e. Level strategy, Chase demand strategy, coping strategy and
minimum staff levels have been adopted by the IT service firms to various degrees.
However, the most adopted capacity management strategy by IT service companies is
Chase demand strategy. The study also established that the capacity management practice
adopted has a positive influence on service quality. SERVQUAL scale was applied to
measure service quality of IT service companies. The results from the study of impact of
service quality dimensions namely Assurance, Responsiveness, Tangibility, Empathy and
reliability on customer satisfaction was studied show that Assurance has the highest
impact followed by Responsiveness while Empathy has the lowest impact. The four
conditions of Baron and Kenny (1981) were met and therefore the results of the study
show that service quality plays a mediating role between capacity management and
customer satisfaction. The study also establishes that although the various firms manage
their capacity, there are still challenges in their implementation such as the high cost of
implementation, lack of qualified staff and lack of proper communication among others.
In order to ensure effectiveness in their operations, this study recommends that IT service
companies should have a capacity management strategy implemented and rally the whole
organization to support its implementation given that capacity management greatly
impacts service quality and customer satisfaction. The IT service companies should also
look at reviewing their working hours in order to make their services available to the
customer when needed and also customize them to meet individual needs of each
customer.

1
CHAPTER ONE
INTRODUCTION
1.1 Background of the Study
Information Technology (IT), which is a knowledge-intensive industry, has an enormous
potential for accelerating economic growth, increasing productivity across all sectors of
the economy and is considered to be a means of efficient governance. The global
information technology has been growing at a constant rate and it surpassed $3.7 trillion
in 2015 and about$3.8 trillion in 2016 according to the research consultancy IDC. The
emerging markets in Africa, Asia and Latin America which are rapidly growing have
shifted the market proportions because of the growing number of the middle class. IT
covers hardware, software, services, information and infrastructure. The increasingly
competitive world and limited economic resources have pushed organizations to be
efficient in their organizational structures which include cost-effective information
technology systems. Because of the rapid growth, complexity and urgent attention
demanded by IT, outsourcing by organizations to specialist companies is becoming an
increasingly strategic option. The threat on IT delivery services that has a high impact on
all processes is customers who are dissatisfied, solutions delayed and lastly low employee
morale (Nazimoglu & Ozsen, 2010).
The provision of quality experiences to customers has been proven to be a sustainable
competitive advantage which improves a company’s financial standing. The success of
service providers is now dependent on their ability to provide customer-focused services
in the rising service economy (Gustafsson & Johnson, 2003). High quality service
delivery during service encounter is the key to gaining a competitive edge over the
competitors. Quality service and customer satisfaction are being reinforced as one of the
main concerns of manufacturing as well as service organizations in the increasingly
competitive world which puts the customer at the focal point (Wang, Hing-Po &Yang,
2004). The agility of an organization is affected by the ability to plan for future resource
requirements as well as being able to optimize the ones that they currently have. It is
therefore beneficial for an organization to learn how to plan and manage capacity so as to
2
achieve a balance between the quality of services required for its growth and ongoing
success and the investment in resources whether financial or human.
1.1.1 Capacity Management
Capacity is defined as the productive capability in total of all the utilized factors of
production that includes workforce and machinery (Alp & Tan, 2006). The capacity of a
production system defines the firm’s ability to compete by determining its response rate
to the market, costs incurred to run the business, its ability to constitute its workforce, the
investments to be made on technology, its management and staff requirements and how
they will manage their inventory. Lovelock (1992) defines service capacity as the
maximum output that may be obtained in a definite period with a given amount of
resources.
Capacity management can be defined as the process balancing between the demands of
customers and making the delivery system of the service efficient and effective to satisfy
the demand. Capacity management is considered to be a very crucial role to organizations
which involves matching capacity in the long term and demand while considering
operations and tactical aspects. Armistead and Clark (1991) indicate that an organization
can be able to project its short-term and long term demands through management of
capacity and the planning of the resources of a company. The level of capacity has an
impact on response to new projects, finances and other performance measures. A
company can either loose its customers through slow service or perceived lack of
attention hence quality issues or by allowing its competitors to get access to its customers
if the capacity is not sufficient.
In services, managing capacity so that supply is matched with demand directly influences
the firm’s ability to deliver timely services while maintaining the quality standards.
Operation managers face difficulty in the management of capacity because of how
services are made up, the process of delivery and the interaction between service provider
and the customer during service delivery which limits the options used for tangible
products to align supply to demand; namely, adjusting the capacity, maintaining buffer

3
stock and requiring customers to wait for the service. Services cannot be produced in
advance when demand is anticipated and stocked as inventory, (Armistead& Clark 1991).
It is imperative to understand how the demand of your firm behaves (Lovelock, 1984)
and secondly which strategy best applies to your firm in order to meet the expected
demand. It follows therefore that operation managers must understand how their capacity
is structured, whether or not it can be changed and to what level, and how fast it can be
altered (Slack, 1987) and the costs involved (Hart, Heskett & Sasser, 1990).
The task of harmonizing supply and demand can make an organization to forego
opportunities to meet the needs of other customers during peak demand and translates to
unreasonable costs resulting from forgone income during periods of low demand and the
available fixed capacity is not optimized. Many organizations are facing challenges
largely because in the past many organizations employed capacity management in a more
tactical way, with a specific team looking to address a specific set of goals, facilities and
systems rather than planning capacity from an enterprise-wide perspective. Capacity
management in IT can then be said to be the process of ensuring that IT resources are
aligned with the current and emerging demands. Therefore, core operational objectives of
an IT team can be addressed through capacity management which is considered key in
satisfying demand. Capacity management process can be said to be a success if the
amount of IT capacity in place satisfies the needs of the business and also the forecast for
IT capacity is accurate
1.1.2 Service Quality
Service quality is the ability of a provider to deliver the results that a customer wants
consistently (Chumpitaz & Paparoidamis, 2007). Fotiadis and Vassiliadis (2013) define
service quality as the result of how a customer perceived the service compared with how
they expected the service delivery to be resulting from how a customer looks at a bundle
of service. Quality in services is a theoretical construct, as contrasted to goods where the
physical aspects of quality exist and can be identified. Service quality is important to
firms because as service quality increases so does profitability, market share, returns on
investment and satisfying the customers therefore retaining them. The provision of
4
outstanding service quality gives a competitive advantage to an organization and results
in high financial gains and existence in a very competitive business world. The
abstractness of service quality makes objective measurement almost impossible hence the
challenge comes in managing user perceptions and appearances. Service quality when it
comes to the service sector is still shrouded in mystery and harmonization on what makes
delivery effective has not been done (Johnston, 1995; Voss, Roth, Rosenzweig,
Blackmon & Chase, 2004a). Parasuraman et al. (1985), who came up with SERVQUAL
scale, argue that the reason why service quality concept has not been clearly defined is
because quality has always been understood from the perspective of traditional
manufacturing definitions of quality which apply to products rather than services.
Zeithaml, Valerie, Parasuraman and Berry (1990) suggested that service quality can be
examined through the measurement of the expectations of customers and their
perceptions of performance levels across some service attributes. To measure service
quality therefore, one has to calculate and average the difference between the
expectations of the customer and his view of actual service across the given attributes.
The difference between expectations and perceptions, known as the gap, is then
measured. The key factors that determine the service quality expectation, as suggested by
Zeithamal et al. (1990), are word-of-mouth communications, personal needs, past
experiences, and communications by the service provider to the user. Convenience
attribute has been cited in most of the studies covering IT/IS-based services as a
determinant of service quality (Allen, 1997; Baily &Gordon, Cline, 1997; 1988; Milligan,
1997; Reed, 1998).
Parasuraman et al. (1985, 1988 & 1991) followed the framework of Churchill (1979) by
operationalizing their conceptual model of service quality through an instrument with 22
items that reflects the dimensions of service quality SERVQUAL. The service
dimensions are Tangibles which is regarded as the look of the facilities, equipment and
personnel, Reliability which is performing the service with precision and accuracy,
Responsiveness which is demonstrated by how the service provider’s willingness to help
customers and being prompt in their service provision, Assurance given by the comfort of

5
the customer knowing that the employees know their work and show courtesy and being
able to attain trust and confidence in them and last being Empathy which is being caring,
and customizing solutions to the needs of each customer.
1.1.3 Customer Satisfaction
Kotler (2000, p.36) defines satisfaction as a person being happy or disappointed with a
product’s perceived performance in relation to what they expected. Most researchers
agree that customers form an attitude or evaluate satisfaction by comparing their
expectations before purchasing the service or product to their personalized feelings of
how the service or product was after consumption (Oliver, 1977, 1993).
Organizations whose objectives are to satisfy their customers, must therefore aim at
increasing the standards of quality of the services they are offering. This is particularly
important because contented customers are repeatedly make purchases or become loyal to
the firm than those who are dissatisfied. The literatures also show that there are no agreed
determinants of service quality and the influence of each attribute on customer
satisfaction varies from one study to the other as well as from one context to the next.
This clearly shows why firms would benefit greatly by identifying the attributes of
service quality that are relevant to their service context so as to show managers on what
they need to improve thus satisfying their customers (Izogo & Ogba, 2015).
1.1.4 IT service companies in Nairobi
Information technology covers use of computers, storage, network devices and other
physical devices, infrastructure and processes to create, process, store, secure and
exchange all forms of electronic data to achieve specific objectives. IT service providers
are companies that provide advice to companies on how best to apply IT in their
operations in order to achieve their objectives. They also install, deploy, implement and
manage systems, repair and maintenance of IT equipment, integration, application
enhancements and support for their clients. The IT service delivery companies covers
firms that provide professional services, IT security consultants and staffing firms that
6
train and provide IT professionals to businesses on a temporary basis in response
temporary skill shortages or technical projects.
Nairobi city is the business and financial center of Kenya and East Africa. Global firms
have made it a habit to establish their branches or subsidiaries in Nairobi as a point of
entry into the East African market. Nairobi is referred to as the silicon savannah and it
has grown into the regional model for technology innovations. Global IT multinationals
such as Samsung, Hewlett-Packard, LG, Toshiba and Sony have their regional liaison
offices in Nairobi. The technology scene which continues to grow rapidly has triggered
the emergence of technological hubs and institutions. In a span of ten years technology
related services have grown into a $360 billion dollar industry thus making Nairobi a
center for technology. This growth has been made possible by government support
through projects and initiatives, digitization of government services and the emergence of
different technological inventions whereby developers have taken great advantage to
create different platforms and software. Kenyan companies in their bid to be efficient and
effective in their operations, have adopted technology in their operations which has given
rise to all sorts of technology start-ups.
1.2 Research Problem
Managing capacity so as to match supply and demand will determine the failure or
success of a delivery system to achieve its target for service quality and efficiency.
Operation managers put capacity management at the heart of their planning and control
processes. Capacity varies at different levels even when demand is kept constant. The
discrepancy in the way people and equipment accomplish their work causes fluctuations
(Armistead & Clark, 1991). Capacity management is used by operations managers to
minimize a trade-off between quality and resource productivity. Focus should be placed
on factors in capacity management which influence service quality and productive
performance (Bitner & Zeithamal, 2003).

7
Because of the rapid development of IT sector in Kenya, the main challenge faced by IT
companies, has been to balance the capacity available while ensuring that service quality
is maintained. Changes in service quality results in changes in customer perceptions or
causes underlying dissatisfaction. Without comprehensive, effective capacity
management, IT organizations cannot be efficient in their service delivery. This means
that their approach to customer needs and requirement is based on reactions to situations
or events rather than being proactive. This not only makes it difficult to manage current
resources and demands related to capacity, but it also in a big way prevents the
organization’s ability to support upcoming requirements and initiatives. For this reason
therefore a good evaluation of services in IT is needed with consideration to the different
changes such as rapidly changing demand and changes in customer perception regarding
their service experience.
In their study on capacity management model in service industries, Adenso-Diaz,
Gonzalez-Tore and Garcia (2002) established that uncertain demand and requirements
that must be customized to meet individual requirements make it difficult to plan and
assign the maximum possible output of a system or plant. Bairi, Manohar and Kundu
(2012) stated that innovation and the use of new tools and techniques is very important in
IT as they lead to an increase in the quality of services offered by a firm which in turn
gives value to the customer and increases a firm’s profitability.
Delgado-Alvarez, Van-Ackere, Larsen and Arango-Aramburo (2017) study on the
management of capacity at a service facility using an experimental approach established
the importance of having a well-developed information system to help the manager in
making decisions particularly in a fast changing environment which requires continuous
adjustment. They also noted that there was a need for system-redesign in order to shorten
the delays and make the system more vibrant thus easier to manage.
Locally, Onyango (2016) did a study on capacity management and service industry
performance focusing on the hospitality industry particularly Sunset hotel-Kisumu and
observed that the difficulty in managing demand resulted in shortages in some stations

8
while there was a surplus in others. Wairimu (2014) looked at the capacity management
strategies applied by petroleum distribution firms in Kenya and how they influenced
service quality and she observed the difficulties in effective capacity management in the
petroleum industry.
All the above mentioned studies however do not look at the capacity management
strategies employed specifically by the IT industry and its impact on perceived service
quality and customer satisfaction. This study therefore intends to enhance these studies
by answering the question; what is the effect of capacity management strategies on
service quality and customer satisfaction in IT service providers in Kenya?
1.3 Research Objectives
The objectives of this study are as follows:
i. To establish the capacity management strategies used by the IT service providers
in Kenya
ii. To establish the service quality dimension with the most impact on customer
satisfaction
iii. To determine the relationship between capacity management strategies, service
quality and customer satisfaction in IT services.
iv. To establish the challenges faced by IT service providers in Kenya in managing
their capacity.
1.4 Value of the Study
In the past few years, a significant growth has been noticed in IT namely, consulting,
business transformations through ERP implementations, digitization of government
services and even off shoring services. Taking into consideration the how costly it is to
acquire new customers and very high turnover of customers in the IT industry, it is very
important to study the capacity management strategies applied in the IT services industry.
This study narrows down its research directly on service quality as one of the factors
affected by capacity management strategies and the extended effect capacity management
has on customer satisfaction.

9
This study is also important to IT services providers who intend to stay competitive in the
industry as well as those service providers intending to enter the IT market in Kenya.
Capacity management being at the heart of operation management has elicited a lot of
attention. This will provide additional reference material by researchers and academicians
who have an interest in conducting more studies in the field of capacity management for
services and more so in the IT Industry.

10
CHAPTER TWO
LITERATURE REVIEW
2.1 Introduction
This chapter provides more details about what other researchers have done in the same
area of study. This chapter will be looking at the various schools of thoughts or major
issues, identify the gaps in the literature and questions in the gap that we could focus our
data collection or analysis from.
2.2 Theoretical Review
2.2.1 Expectation Disconfirmation Theory
The expectancy disconfirmation theory (CDT) suggests that a customer’s satisfaction or
dissatisfaction results from the evaluation of the actual service or product. It is considered
to be the most dominant theory of satisfaction (Mattila & O’Neil, 2003). The theory
forms its basis on a customer’s comparison of his or her expectations with the perceived
performance. With respect to IT expectations can be defined as a forecast of technology
performance with regard to some chosen attributes (Bhattacherjee & Premkumar, 2004;
Spreng & Page, 2003). A customer is said to be positively disconfirmed or satisfied when
the service performance or product meets or exceeds their expectations. If however, the
performance falls below the expectation of the customers, they experience dissatisfaction
or will be negatively disconfirmed. Positive disconfirmation increases the level of
satisfaction while negative disconfirmation will have the opposite effect. In a case where
expectations are perfectly matched with performance, no effect on satisfaction occurs.
This is because a user forms expectations from past experiences and word of mouth
(Kotler, Siew, Swee & Chin, 1996).
In the context of IT services, CDT would recommend that the service provider should try
and establish the customer’s expectation prior to the delivery of the service. The
customer’s expectations may be based on industry reports, reputation, marketing
initiatives and other customers’ experiences. These expectations may be magnified
positively or negatively depending on the interests of the source of information. The
customer however will be able to provide feedback on whether their initial expectations

11
were met after the usage experience. Although this theory has been supported strongly as
a measure of satisfaction, Churchill and Surprenant (1982) in their criticism of the theory
stated that disconfirmations or expectation is inconsequential to the user’s satisfaction
with durable goods but rather satisfaction is based on the performance of the durable
goods. This study will form its basis upon the disconfirmation of expectations as a
precursor to customer satisfaction.
2.3 Capacity Management Strategies
Effective capacity management has become a critical factor that sets apart IT
organizations. The organizations that attain progress in their capacity management
capabilities will be able to more effectively optimize their investments, support key IT
projects, and align resources with business objectives. Gilmore and Carson (1993)
classified capacity management strategies under two major categories: operational and
capital management. Operational strategies may be directed at ensuring that the
maximum gain is received out of the investments on assets over a period of time by
increasing revenue or reducing costs or both. On the other hand, capital management
entails debt and asset management strategies through, regulation of debt and borrowing
costs. In general, service organizations have been found not displaying unique
characteristics as identified by Sasser (1976) but rather the characteristics of chase or
level capacity strategies.
The Level capacity strategy acknowledges the fact that changing the capacity which a
process was designed for does not happen instantly. This means that the company
maintains the same number of staff, materials or machines in a particular period. A pure
level capacity strategy is not the best strategy for services given that services experience
seasonal demand. Chase demand strategy aims at matching capacity to the demand that
changes from period to period. It is also known as demand matching strategy. This
strategy is described by Sasser as entailing the control of the level of capacity through
change of the extent of resources by overtime, using part-time employees, sub-
contracting or leasing equipment and cross-training employees to be able to perform
more than one service. It is commonly practiced by industries that can easily train new

12
employees to begin work quickly as well as companies that have good responsiveness
and ability to change easily.
The coping strategy is an expansion of the Chase and Level capacity management
strategies. When service organizations do not have the capacity to satisfy demand at any
given stage when the service is required by the customer then two things could happen,
which are; to lower the standards of quality while ensuring that the impact on the service
is minimized or to try and manage the expectations of the customer thus not affecting
their view of the service delivery and in the process ensuring that the standards for the
core service are not affected (Armistead & Clark, 1994). The opposite of this is when
there is more capacity than demand which leads to reduced efficiency and in other
instances lower quality. In this scenario, the coping strategy is used to curtail these
negative effects by taking it as a period for staff to rest or recover or transferring them to
other sections where their services are required. Klassen and Rohleder (2002) suggests
that companies should pick the demand and capacity management strategies that will help
them to achieve good service, lower costs and increased profitability. Minimum staffing
level capacity management strategy is where organizations try to establish the minimum
number of staff requirement that a firm can operate without the quality of it service being
affected. The model ensures that the staff is distributed properly among the different units
of the organization and therefore resources are better utilized or rather optimized.
2.4 Service Quality
Service quality is the result of a customer’s comprehensive analysis of the contrast
between expected performance and actual service performance (Othman & Owen, 2002).
By conducting thorough interviews with firms and targeted groups in four service
industries, Parasuraman, Zeithaml and Berry (1985) came up with five determinants of
service quality. These determinants of service quality are namely; tangibility which is the
visual appeal of physical facilities, reliability which is the performance of a service by the
service provider in a dependable, reliable and with accurate way, responsiveness which is
promptness in providing the service and helpfulness, assurance defined as employees
having the required knowledge and skills, being courteous and conveying trust and the

13
last attribute being empathy which is the care and tailor made solutions the firm gives its
customers. The measurement scale for service quality based on the dimensions given
above is called SERVQUAL. Service quality is said to be a focused evaluation of what a
customer was expecting prior to receipt of the service and in the process of receiving the
service and the actual experience from the service delivery system.
These perceptions of quality dimensions determine how a person will react to the
particular service. The SERVQUAL scale has been adapted to different services such as
professional services (Dart & Freeman, 1993), tourism (Tribe & Snaith, 1988), business
school (Pariseau & McDaniel, 1997) healthcare (Lam, 1997), and information systems
(Kettinger & Lee, 1994) to measure their quality. Cronin and Taylor (1992) challenged
the use of SERVQUAL and argued that the measurement of service quality should be
from its performance. In a bid to test the accuracy and dependability of the two major
service quality measurements: SERVQUAL and SERVPERF, Jain and Gupta (2004)
compared the two through a comparative analysis. An ideal service quality scale is one
that measures what it ought to, accurately and dependably and also performs effectively
while its variables are altered so that the people responsible for taking corrective actions
in the event that quality standards are not met can be able to understand the source of the
deviation. The accuracy of the quality scales was assessed by surveying consumers of fast
food restaurants in Delhi. It is the SERVQUAL scale which outperformed the
SERVPERF scale because of its strength in providing accurate results that show precisely
what managers need to do when the quality of their services are falling.
In Kettinger and Lee’s (1994) study which pioneered the use of SERVQUAL in the
information technology context, it showed that the four dimensions, reliability, assurance
responsiveness and empathy are determinants of service quality in IT. The tangibles
dimension was found to be missing. Since SERVQUAL has been established as a
comprehensive method, this study will borrow from it and apply to cover service quality
in relation to the IT service providers in Kenya.

14
2.5 Customer Satisfaction
The definition of satisfaction varies from one researcher to the other but the common
argument is drawn from a customer’s judgment of the utilization experience that is
formed through some kind of cognitive process of comparing what was expected and
what was received. This however does not mean that a customer cannot make a judgment
however temporary along the consumption process but also that it is possible to make
satisfaction judgments after a definite transaction or after a series of transactions. In IT
satisfaction is defined as how the users rely on the information system and how services
available to them meet their needs (Ives, Olson & Baroudi, 1983).There are two or more
different concepts of customer satisfaction. One looks at it from the perspective of a
specific transaction while the other focuses on the cumulative process (Boulding, Staelin,
Kalra & Zeithaml, 1993; Andreassen, 2000). The concept on specific transaction views
the satisfaction of a customer as a way in which the customer expresses his attitude or
judgment made post choice in a one or specific occasion (Oliver, 1977, 1993).
Cumulative customer satisfaction however is where a customer makes an evaluation
based on the cumulative experiences of both purchase and consumption after a series of
transaction (Johnson & Fornell, 1991; Anderson, Fornell & Lehmann, 1994). Cumulative
satisfaction impels an organization to invest in customer satisfaction because it is a core
measure of an organization’s past, present and future performance.
In order to get the most reliable feedback that will provide a customer’s preferences or
experiences in a direct, practical, objective and meaningful way, customer satisfaction
has to be measured. Different instruments for measuring customer satisfaction in IT
services have been developed over the recent years. The most widely used instrument
was developed by Bailey and Pearson (1983) and identifies ease of use, flexibility, data
security, timeliness, speed, relevance among others. The determinants of customer’s
intentions and level of satisfaction vary from one service context to another and they
cannot be generalized. Atkinson (1988) identifies value for money, cleanliness, security
and courtesy of staff as governing the satisfaction of customers. In his study, Knutson
(1988) established that the cleanliness of a room and its comfort, a good location, fast
service, safety and security and amiable employees ranked up in the list of determinants.

15
Akan (1995) establishes employee behaviour, cleanliness and timeliness as the most
important determinants of satisfaction. In their findings Choi and Chu (2001) determined
that the aesthetic qualities of a room, the attributes of employees and perceived value are
considered among the top attributes that will lead to the satisfaction of customers in a
hotel.
The rise in the levels of satisfaction and customer retention generates referrals from
customers, higher revenues and lower marketing costs for the company (Reichheld, 1996;
Heskett et al., 1997). Thus, customer satisfaction could be considered as a starting point
for setting the performance standards and a possible measure of distinction for all
business organization (Gerson, 1993).
2.6 Capacity management, Service Quality and Customer Satisfaction
The causal link between capacity management and service quality and which of this
construct directly impacts on the satisfaction of customers is yet to elicit sufficient
interest in operations because researchers look at the concept from different perspectives.
However, the connection between service quality and customer satisfaction is
increasingly generating interest although the operationalization of customer satisfaction
has not been standardized. Cronin and Taylor (1992) definition and determination of
customer satisfaction was from the view of how they felt towards an organization taking
everything into consideration. Cronin and Taylor’s approach which views customer from
one perspective of overall satisfaction, fails to achieve the objective because just like
service quality, customer satisfaction would be defined differently by different customers
based on what they consider as the most important to them. The authors then introduced
the concept of encounter satisfaction which details the constructs that determine customer
satisfaction during his or her interaction with the service provider. Service encounter
defines the interaction between service user and service provider. Service quality is of
value in order to determine user satisfaction.
Several studies that focus on the correlation between service quality dimensions and
customer satisfaction have been carried out. Dahiyat, Akroush and Abu-Lail (2011),
Samen, Akroush and Abu-Lail (2013) and Ladhari (2009), all claimed that service quality

16
precedes customer satisfaction. Wang and Shieh (2006) found that tangibility, reliability,
assurance and empathy influenced the overall user satisfaction of a customer. No positive
effect was found to exist between customer satisfaction and the quality of service.
Different studies on the relationship between customer satisfaction and service quality
dimensions give different results. Jamal and Naser (2003) and Baumann, Burton and
Kehr (2007) in their studies failed to find any significant relationship between customer
satisfaction and tangible aspects of service environment which is contrary to the findings
of the study undertaken by Dabholkar, Thorpe and Rentz (1996) which established that
the customer’s perspective of service quality was influenced a lot by the tangible aspects
of it. Agrawal and Gupta (2016) in their study on public and private sector banks in India
established that the five service quality dimensions had a positively influenced customer
satisfaction but Assurance was the most important factor to the bank customers. Fah and
Kandasamy (2011) in their study on hotel guests in Malaysia established that all the
service quality influenced the rate of satisfaction even though the most significant
dimension was found to be that of tangibility. These results therefore show that customer
satisfaction is achieved if a customer perceives that the firm offers services of high
quality. It therefore becomes necessary to offer quality services in order to customers.
2.7 Empirical Studies
Ong’ondo (2013) conducted a study on how capacity management strategies affected the
service quality in Safaricom limited retail outlets. The findings from the study showed
that Safaricom limited had implemented various capacity management strategies though
some aspects were in their initial stages and needed to be strengthened in order to
optimize their effect on service quality. Wairimu (2014) in her study of how capacity
management influenced service quality in petroleum distribution firms in Kenya,
established that the capacity management strategy adopted by the firm can have a high
impact on the perceived service quality. The study established that chase strategy is
commonly used by firms in the petroleum distribution business.
17
Kawila (2014) on her research on the effect of capacity management on service delivery
of commercial banks in Kenya established that the commercial banks adopted the shifting
capacity strategy. The shifting capacity practices adopted included enhancement of
employee capacity through offering staff training that will enable them to handle more
than one task and therefore being able to be redeployed when the need arises, offering
overtime services to the staff such as paying them at a premium in times when they work
outside the normal working hours as well as providing transport services for the staff.
Adenso-Diaz et al. (2002) in their study to establish a model for managing capacity
through establishment of minimum staff levels, tested it in an internal medicine unit in a
hospital nursing department and in a hotel both based in Spain. Delphi methodology was
used to ascertain the average time it takes to perform the different general nursing tasks
and the frequency at which each task is performed with respect to the type of dependency
of the sick person. In both studies, total quality functions were developed to come up
with a lean staff required to oversee the work. In conclusion they argue that their model
can be applied in diverse service sectors where workforce is flexible and staff are limited
and diverse activities need to be done depending on what customer requires therefore
requiring that enough capacity be allocated that ensures maximum quality perceived. The
main problem identified in this study is that their model is limited to only one capacity
type, staff.
Dabholkar, Shepherd and Thorpe (2000) in their findings stated that customer satisfaction
is a strong intervener on the relationship between service quality and behavioural
intentions. The data was collected systematically and randomly from 397 churches. A
discriminant validity test on whether the service quality constructs and customer
satisfaction constructs were unrelated confirmed that the service quality constructs were
different from those of customer satisfaction.
Previous studies on service quality have conceptualized service quality in different
industries, such as retail (Danaher & Mattson, 1994), banking (Oxman, 1992) hospitality
(Wirtz & Johnson, 2003) and health care (White & Galbreith, 2000) and few on

18
manufacturing, such as steel and small engineering firms (Maclaren, McGowan & Hill,
1997). These studies came to a common conclusion that proper capacity management
leads to a competitive advantage in the respective service industries studied.
2.8 Summary on Literature Review
In summary from the literature reviewed, showed that capacity management by operation
managers determine the company will thrive or die. The literature also revealed that
capacity and demand work and relate to one another in one way or the other. The review
while delving on empirical studies on use of capacity management strategies and its
effect on service quality shows that only a few studies have been undertaken so far in the
area of capacity management, service quality and customer satisfaction in IT services
specifically in Nairobi, Kenya. The study seeks to fill the gap on capacity management in
IT companies in Kenya and its interrelationship with service quality and customer
satisfaction.
2.9 Conceptual Framework
Figure 2.1 Provides information on how the variables interact as shown in the
conceptual framework
From the above research model, the constructs can be hypothesized as follows:
Capacity Management
Strategies
Level Strategy
Chase Strategy
Coping Strategy
Minimum Staffing
Levels
Customer Satisfaction
Perceive Value
Data security
Repeat purchase
Timeliness
Service Quality
Reliability
Responsiveness
Tangibility
Assurance
Empathy

19
Hypothesis 1
Ho1: Capacity management strategies positively and significantly influences service
quality.
Hypothesis 2
Ho2: Service quality dimensions (Tangibles, Reliability, Responsiveness, Assurance and
Empathy) positively and significantly influences overall customer satisfaction.
Hypothesis 3
Ho3: Capacity management positively and significantly influences customer satisfaction.
Hypothesis 4
Ho4: Service quality significantly influences the relationship between capacity
management and customer satisfaction.

20
CHAPTER THREE
RESEARCH METHODOLOGY
3.1 Introduction
The purpose of this chapter is to answer the objectives of the study through the various
methodologies used to carry out the study. It comprises of the research design, target
population, sample and sampling procedures, data collection instruments and procedures
and methods of data analysis.
3.2 Research Design
The study used cross-sectional study design to establish the relationship between capacity
management practices, service quality, customer satisfaction and the extent to which
these variables interact. The study adopted a cross-sectional design because the
researcher’s objective was to identify the capacity management strategies adopted by IT
service companies in Nairobi and how they interact with service quality to affect
customer satisfaction, which concern a situation at one point in time. IT service
organization and their customers were identified and data was collected from them to
achieve the objective of the study.
3.3 Target Population
The population of study was the IT companies registered with the Kenya IT and
Outsourcing Services (KITOs) organization as at September 2017 and whose
headquarters are in Nairobi. KITOS is a Trade Association representing Kenyan
Information Technology and IT enabled Services (IT & ITeS) members Kenya. There
are28 companies registered with KITOs (Appendix iii). The respondents representing the
IT companies were project and delivery managers with extensive experience managing
and delivering IT projects. This is because the Project managers and delivery managers
are the ones responsible for decision making in regards to capacity issues. The main
reason the study was restricted to Nairobi is because, there is considerable infrastructural
differences between the different towns in Kenya. There is a considerable issue also on

21
whether or not sufficient response will be received if the study was to be extended to rest
of the country.
3.4 Sample Design
The entire population of 28 IT companies registered with KITOs was studied. The
population consists of small, medium and large enterprises. Convenience sampling was
employed to select the sample from the available population of customers. The
convenience sampling was used because the total number of customers for each of the
companies to be studied is difficult to ascertain. The respondents were purposefully and
conveniently approached. The reason for using convenient sampling in this study was
because we did not have all the customers available at the same time and it was not
possible to contact every customer who may have been sampled. The shortcoming of
convenient sampling is it is not representative and therefore will prevent generalization of
results. The purposive sampling method was applied so as to take care of the short-
comings of convenience sampling. So although the customers were approached, not all of
them were interviewed but only those who were in a position to provide reliable answers.
The questionnaires were administered by email, face to face and phone interviews to the
project managers/delivery managers of the 28 organizations studied and 3 questionnaires
were distributed randomly among the customers of each IT service organization. Efforts
were made to ensure that selected respondents were those capable of answering the
questionnaires.
3.5 Data Collection
The study used primary data in order to achieve its objectives. The research instrument
used to collect primary data was the questionnaire. The questionnaire was developed
based on research questions and the framework. The purpose of the study was presented
at the beginning of the questionnaire to help the respondents gain a better understanding
about the study. There were four sections for the questionnaire. The first section
contained the demographic details of the organization. The second section focused on the
strategies used by IT service companies in Kenya to manage their capacity. The third
section looked at the relationship between the variables of study. These variables were

22
measured with 5-point Likert-type. The fourth section was an open ended question to get
the respondent to give their opinion about the challenges faced by IT service companies
in Kenya in managing their capacity. Primary data source was used for the achievement
of the objectives of the study.
3.6 Data Analysis
The Baron and Kenny (1981) approach was used. Four regression analyses were
conducted and significance of the coefficients examined for each of the steps. Customer
satisfaction is represented by Y, service quality by Z and capacity management by X. The
approach utilizes four steps. The four steps are as follows;
Step Analysis
Step1 Y = B0 + B1X + e Simple regression analysis with capacity
management influencing customer
satisfaction
Step 2 Z = B0 + B1X +e Simple regression analysis with capacity
management influencing service quality
Step 3 Y= B0 + B1Z + e Simple regression analysis with service
quality influencing customer satisfaction
Step 4 Y= B0 + B1X + B2Z + e Multiple regression analysis with capacity
management and service quality influencing
customer satisfaction.
The purpose of steps 1-3 is to establish the relationship between the two variables with no
variable controlled for. If one or more of the relationship are not consistent with the
hypothesis the conclusion would be that mediation is not possible or likely. However, in
the last step, partial mediation is supported if the first 3 hypothesis is met but the fourth is
not. If all the steps are consistent with the hypothesis then it will be established that
service quality is a mediator between capacity management and customer satisfaction.

23
CHAPTER FOUR
DATA ANALYSIS, FINDINGS AND DISCUSSIONS
4.1 Introduction
This chapter comprises of data analysis, findings and interpretation. The results are
presented in tables and diagrams. The data is analyzed and arranged in themes that reflect
the research objectives.
4.2 The Response Rate
The questionnaires were distributed to two categories of respondents namely; 28 project
and delivery managers from the participating organizations and 84 customers of each of
these organizations. A total of 23 questionnaires were properly filled and returned by
project/delivery managers representing an overall successful response rate of 82.3%
while 79 out of 84 customers responded giving a response rate of 94.04% .Based on
Mugenda and Mugenda (2003) a response rate of 50% is considered to be adequate, 60%
to be good and above 70% is rated very well. The response rate for this study was
considered to be very good and hence the researcher proceeded for data analysis.
4.3 The Respondent’s Profile
In this study the respondent’s profile is described in terms of gender, their designation
and the average annual income of their organization. The purpose for asking the
respondents to state their characteristic was for classifying and comparing them
thereafter. The study employs closed ended questionnaires to categorize the respondent’s
profile and their responses are analyzed using frequencies and percentage distributions.
4.3.1 Gender
The table below presents the sample characteristic of the respondents of IT service
providers sample population.

24
Table 4.1 Gender of the Respondents
Gender Frequency Percent
Male 13 57.0
Female 10 43.0
Total 23 100.0
Source: Research Data
From the sample of 23 respondents, the findings indicate that male respondents make up
57% of the sample while female respondents make of 43%. This indicated that there is
gender imbalance in the IT service sector. However, the gap between the genders is small
giving an indication that female population is embracing the profession more.
4.3.2 Designation
The respondents were asked to indicate the post they hold in the organization in which
they worked. The table below represents the findings.
Table 4.2 Designation of the Respondents
Gender Frequency Percent
Project Manager 16 69.6
Delivery manager 7 30.4
Total 23 100.0
Source: Research Data
The findings indicate that 69.6% of the respondents are project managers while 30.4% of
the respondents are delivery managers showing indication that the roles are not equally
distributed across the different service organizations of study.
4.3.3 Income
The respondents were asked to indicate the firms average levels of income .The responses
are as indicated below:

25
Table 4.3 Firms Average Annual Income
Annual income Frequency Percent
Ksh 5m or under 9 39.1
Ksh 5m- 800m 6 60.9
Total 23 100.0
Source: Research Data
The findings indicate that 39.1% of the respondents ascertained that the firm earns Ksh 5
million or under annually which is an indication that they are small scale while most of
the firms under study earn between Ksh 5 million and Ksh 800 million annually which is
an indication that they are medium scale. This was an indication that most of the IT
service firms registered with KITOs fall under small and medium enterprises.
4.4 Extent to which various Capacity Management practices are adopted by IT
service Companies
The first objective of the study was to establish the extent to which various capacity
management practices were adopted by IT service companies in Kenya on a scale of 1-5
where 1= very low extent an 5= very great extent. The findings are given in the table 4.4
below:
Table 4.4 Extent to which Capacity Management strategies have been adopted by IT
service companies
Capacity Management Practices Mean Std. Deviation
Level strategy 2.3612 0.4813
Minimum staffing strategy 2.5001 0.5120
Coping strategy 3.6522 0.9821
Chase strategy 3.8696 0.8245
Grand mean 3.0958 0.6999
Source: Research Data
The results indicate that level strategy and minimum staff level strategy were adopted to a
low extent (M = 2.3612, SD =0.4813) and (M = 2.5001, SD = 0.5120) while Chase
strategy and coping strategy were highly adopted (M =3.8696, SD =0.8245) and (M
=3.6522, SD = 0.9821) respectively. Based on a scale of 1-5 used under this study, the
26
above results ascertained that the various organizations have adopted the capacity
management strategies to various degrees. From these results it is ascertained that Chase
demand strategy is adopted to a large extent by IT service firms to manage their capacity.
Wairimu (2014) in her study on capacity management practices in Oil distribution
companies in Nairobi Kenya revealed that Chase capacity management strategy was
employed mostly by firms in oil distribution industry in Kenya.
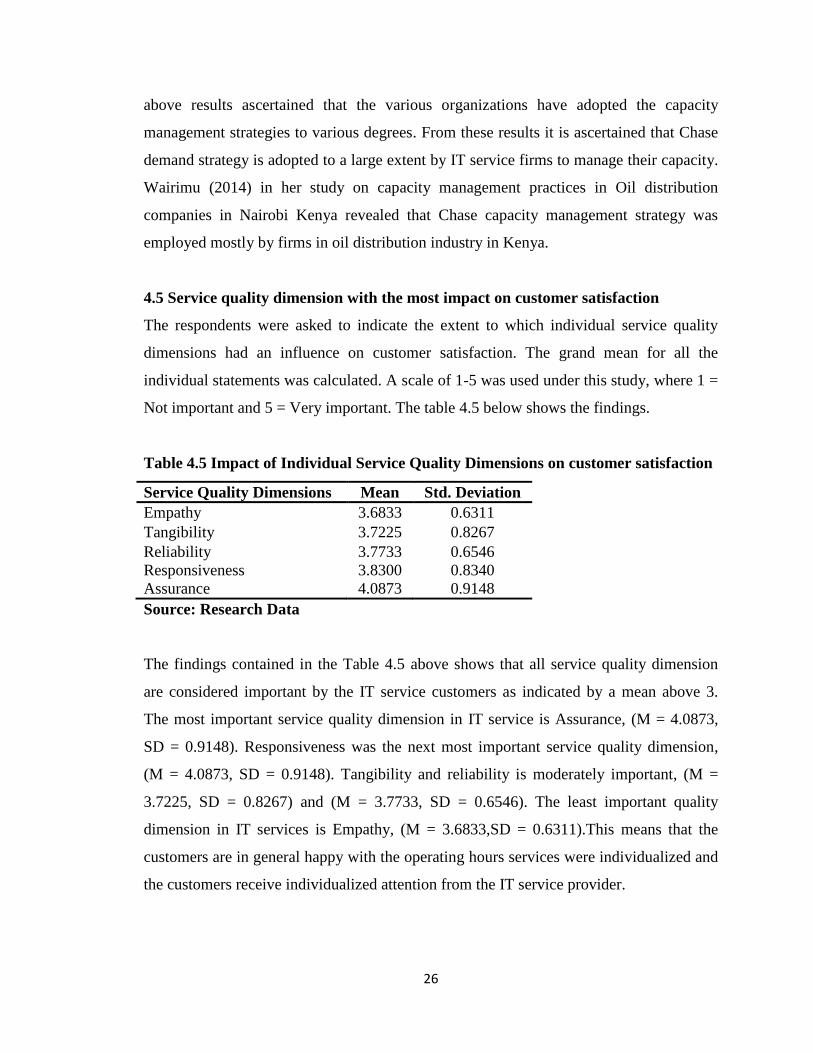
4.5 Service quality dimension with the most impact on customer satisfaction
The respondents were asked to indicate the extent to which individual service quality
dimensions had an influence on customer satisfaction. The grand mean for all the
individual statements was calculated. A scale of 1-5 was used under this study, where 1 =
Not important and 5 = Very important. The table 4.5 below shows the findings.
Table 4.5 Impact of Individual Service Quality Dimensions on customer satisfaction
Service Quality Dimensions Mean Std. Deviation
Empathy 3.6833 0.6311
Tangibility 3.7225 0.8267
Reliability 3.7733 0.6546
Responsiveness 3.8300 0.8340
Assurance 4.0873 0.9148
Source: Research Data
The findings contained in the Table 4.5 above shows that all service quality dimension
are considered important by the IT service customers as indicated by a mean above 3.
The most important service quality dimension in IT service is Assurance, (M = 4.0873,
SD = 0.9148). Responsiveness was the next most important service quality dimension,
(M = 4.0873, SD = 0.9148). Tangibility and reliability is moderately important, (M =
3.7225, SD = 0.8267) and (M = 3.7733, SD = 0.6546). The least important quality
dimension in IT services is Empathy, (M = 3.6833,SD = 0.6311).This means that the
customers are in general happy with the operating hours services were individualized and
the customers receive individualized attention from the IT service provider.

27
These results are consistent with the results from the studies conducted by Agrawal and
Gupta (2016) who established that Assurance was the most important aspect of service
quality which had an impact of customer satisfaction. This also was in agreement with
the study by Fah and Kandasamy (2011) of hotel guests in Malaysia established that all
five service quality dimensions influenced satisfaction but differed in the aspect of the
most important dimension. Their study identified Tangibility as more important
dimension. The difference could be as a result of the different contexts of study one being
in IT services and the other being Hotel industry.
4.5.1 Predictors that influence Customer satisfaction
The service quality predictors of customer satisfaction are arranged in an ascending order
according to their strength.
4.5.1.1 Assurance
The respondents’ score on the most important factor of Empathy in IT service are given
in the table:
Table 4.6 Influence of Assurance on customer satisfaction
Assurance Statements Mean Std. Deviation
The employee behaviour instills confidence in the customers 3.8683 0.8897
The employees make customers feel safe in their transaction 4.0714 0.9979
The support staff have the required skills to resolve problems
and answer questions
4.1879 0.8637
The employees are consistently courteous to the customers 4.2217 0.9077
Grand mean 4.0873 0.9148
Source: Research Data
The results indicate that the different statements were important to the customers as
indicated by the high mean values, (M = 4.0714, SD = 0.9979), (M = 4.2217, SD =
0.9077), (M = 4.1879, SD = 0.8637) and (M = 3.8683, SD = 0.8897). The lowest score to
the variable of Assurance was about employees instilling confidence in their customers.
The IT service organizations should therefore ensure that they consistently monitor and
reinforce preferred behaviour in their employee in order to increase the confidence of
their customers in them. These findings are in line with the findings by Jongpae and

28
Santhiti Treetipbut (2017) in their study of banks in Bangkok where the most important
factor was the courteousness of the employee and the lowest was the employee instilling
confidence on their customers.
4.5.1.2 Responsiveness
The respondents were asked to what extent they agreed with statements on the influence
of Responsiveness dimension of service quality on the overall customer satisfaction. The
table below represents the findings:
Table 4.7 Influence of Responsiveness on customer satisfaction
Responsiveness Statements Mean Std. Deviation
Employees give customers an exact when services will be
performed
3.52 0.7703
Employees are happy and willing to serve customers 4.12 0.7810
The management are accessible, listen and provide prompt and
honest responses to customers inquiries
3.64 0.9950
The employees are not too busy to respond to user requests 4.04 0.7895
Grand mean 3.83 0.8340
Source: Research Data
The results indicate that the statements ‘Employees are happy and willing to serve
customers’ and ‘The employees are not too busy to respond to user requests ’ were
important, (4.12,SD = 0.7810) and (4.04,SD = 0.7895) while the statements on the exact
time when services will be performed and ‘The accessibility of management, lending an
ear to them and providing prompt and honest responses to customers’ inquiries’ were
fairly important, (M=3.5200,SD = 0.7703) and (M = 3.6400,SD = 0.9950) respectively.
The least score was the statement ‘The employees show sincere interest in solving
customers’ concern’, (M=3.6800, SD = .78951).The lowest score was for the statement
regarding the time frame within which the service would be performed. The suggestion is
for the employees of the IT service organization to improve on how they communicate to
their customers and to try and provide a time frame within which the service would be
performed. This can be done by calculating the duration it takes to complete a task by
recording the time it takes to complete it every time it occurs.

29
These findings agree with the findings by Jongpae and Santhiti Treetipbut (2017) in their
study of banks in Bangkok where they identified the statement ‘‘Employees give
customers exact time when services will be performed’ to be the one with the least score
and also the most important factor in Responsiveness.
4.5.1.3 Reliability
The respondents were asked to what extent they agreed with statements on the influence
of Reliability on customer satisfaction. The table 4.8 below represents the findings:
Table 4.8 Influence of Reliability on customer satisfaction
Reliability Statements Mean Std. Deviation
The employees show sincere interest in solving customers’
concern
3.6800 0.6904
The organization is able to perform the service right first time 3.7600 0.6377
When the organization promises to deliver within a given time,
it does so
3.8800 0.6357
Grand mean 3.7733 0.6546
Source: Research Data
The results indicate that all the three statements depicting reliability are found to be fairly
important, (M=3.8800, SD = .6357), (M=3.7600, SD = .63770) and M=3.6800, SD =
.69041. The least score was the statement ‘The employees show sincere interest in
solving customers’ concern’, (M=3.6800, SD = 0.6904).
Therefore the suggestion is for the IT service organization is to encourage their employee
to improve their attitude towards addressing the concerns of their customers given the
fact that their interest in solving customers’ concern scores the lowest. The employees
need to be enthusiastic in their work. This is contrary to the study by Jongpae and
Santhiti Treetipbut (2017) in their study of banks in Bangkok where they identified the
statement ‘When the organization promises to deliver within a given time, it does so’ to
be the one with the least score. The difference in the findings could be due to the different
contexts of study.

30
4.5.1.4 Tangibility
The respondents were asked the most important factor in Tangibility dimension. The
table below represents the findings:
Table 4.9 Influence of Tangibility on customer satisfaction
Tangibility Statements Mean Std. Deviation
The material associated with the service for example
training manuals are visually appealing
3.56 0.7595
The company has visually appealing physical facilities 3.63 0.7613
The company uses modern and appropriate hardware and
software
3.64 0.9950
The employees are well dressed and neat in appearance 4.06 0.7910
Grand mean 3.73 0.8267
Source: Research Data
The results indicate that the different statements were had varying degrees of importance.
The statements ‘The company has visually appealing physical facilities describing
tangibility’, ‘The company uses modern and appropriate hardware and software’ and
‘The material associated with the service for example training manuals are visually
appealing’ are considered fairly important, (M=3.63,SD = 0.7613), (M=3.64,SD = 0.9950
and (M=3.56,SD = 0.7595) respectively while the statement ‘The employees are well
dressed and neat in appearance’ was considered important, (4.06,SD = 0.7910). The least
score was the statement ‘The material associated with the service for example training
manuals are visually appealing. This means that the IT service organizations need to
improve on the legibility, design of the training materials, instruction manual and make
the training material easy to understand.
The results also show that the customers consider the appearance of the employees as
their most important factors. These findings tally with the findings by Jongpae and
Santhiti Treetipbut (2017) in their study of banks in Bangkok where the visual appeal of
the bank physical facilities was considered to be the most important.

31
4.5.1.5 Empathy
The respondents were asked to state the importance of the factor of Assurance dimension
of service quality. The table below represents the findings:
Table 4.10 Influence of Empathy on overall customer satisfaction
Empathy Statements Mean Std. Deviation
The operating hours are convenient to all customers 3.4076 0.6655
The employees give customers individualized attention 3.5856 0.6854
Services are adjusted to suit individual customer needs 3.7600 0.6377
The employees are dedicated to ethics and promote ethical
behaviour in their place of work
3.9800 0.5356
Grand mean 3.6833 0.6311
Source: Research Data
The results indicate that the different statements carried different weights as per the
customers as indicated in the table 4.10 above. The statements ‘The employees are
consistently courteous to the customers’, ‘The employees give customers individual
attention and promote ethical behaviour in their place of work’ and ‘Services are adjusted
to suit individual customer needs’ are considered important, (M = 3.9800,SD = 0.5356),
(M=3.5856,SD = 0.6854) and (3.7600,SD = 0.6377) respectively while the statement
‘The operating hours are convenient to all customers’ is considered fairly important, (M =
3.4076, SD = 0.6655). It therefore means that the IT service organization need to work
out a schedule that works for all their customers either by adjusting their working hours
or by shifts.
These findings were contrary to Jongpae and Santhiti Treetipbut (2017) study of banks in
Bangkok where the visual appeal of the bank physical facilities was considered to be the
most important. The difference could be a result of the different service context.

32
4.6 Capacity Management, Service Quality and Customer satisfaction
The conceptual framework is broken in two parts; the first part represents the relationship
between capacity management and service quality and the second part the relationship
between service quality and customer satisfaction. To determine the relationship between
capacity management and service quality regression analyses was carried out.
4.6.1 Capacity Management and Service Quality
Regression analysis was conducted on capacity management practices and service quality
in order to validate the model and the results are shown on the table 4.11 below.
Table 4.11 Regression Analysis Results: Model Fitness
Model R R Square Adjusted R
Square
Std. Error
Estimate
Sig. F Change
1 .778a .605 .517 .57321 0.002
Source: Research Data
The results of the regression analysis depicted that the capacity management practices
have an influence on service quality with a strength of 60.5% (R2 =. 605, adjusted R2 =.
517, p = 002). It also means that all the independent variable accounted for the 60.5% of
the variance in service quality which indicate a good model as per the fitness test.
The other 39.5 % of the service quality in IT firms in Kenya is influenced by other
variables which are not included in this model. Besides the significance level is at 0.02
which is less that the critical value of 0.05 an indication that this model is statistically
significant at 95% confidence level. These findings agree with the findings of Armistead
and Clark (1991) who stated that capacity management quality management and resource
productivity significantly impact each other.
4.6.2 Analysis of Variance: ANOVA
The table below represents results of the analysis of variance of the effect of capacity
management practices on service quality in IT service companies in Kenya.

33
Table 4.12 ANOVAa
Source Sum of Squares Df Mean Square F Sig.
Regression 9.042 4 2.261 6.88 .002b
Residual 5.914 18 0.329
Total 14.957 22
Source: Research Data
Analysis of variance established that capacity management strategy adopted significantly
influenced service quality, F (4, 18) =6.88, P=0.002. The findings above indicates that the
model was significant on the basis of the p-value of 0.002 which was lower than the
critical value of 0.05 hence the model was statistically significant at 95% confidence
level.
4.6.3 Significance of the Regression Coefficients
The result of the regression coefficients are as shown in table 4.13
Table 4.13 Multiple Regression Analysis Results: Coefficients
Unstandardized
Coefficients
Standardized
Coefficients
Model B Std. Error Beta t Sig.
(Constant) 2.735 1.293
2.115 0.049
Level strategy 0.438 0.168 0.388 2.61 0.018
Chase strategy 0.662 0.152 0.654 4.361 0.000
Coping strategy 0.061 0.131 0.072 1.465 0.647
Minimum staffing strategy 0.565 0.157 0.326 3.646 0.034
Source: Research Data
The findings reveal that the Level strategy, Chase strategy and Minimum staffing strategy
have a positive and significant effect on service quality with, t=2.610 and P<0.05,
t=4.361 and P<0.05 and t=3.646 and P<0.05 respectively. However Coping strategy has a
positive influence on service quality, t=2.610 but is not statistically significant since
P>0.05.

34
These findings show that capacity management practices positively impact on service
quality an indication that adoption of capacity management strategies by IT service
companies in Nairobi results in the increase in the standards of service quality which is a
measure of performance. This is in line with the previous studies by different researchers
who conceptualized service quality in different industries, such as retail (Danaher &
Mattson, 1994), banking (Oxman, 1992) hospitality (Wirtz & Johnson, 2003) and health
care (White & Galbreith, 2000) and few on manufacturing, such as steel and small
engineering firms (Maclaren, McGowan & Hill1997 and came to a common conclusion
that proper capacity management leads to a competitive advantage in the respective
service industries studied.
4.7 Service Quality and Customer Satisfaction
The hypotheses that service quality dimensions (Reliability, Responsiveness, Tangibles,
Assurance and Empathy) influenced overall customer satisfaction in IT service
companies in Nairobi was observed to be true as the multiple regression analysis depicted
that the combination of all the dimensions of service quality influenced overall customer
satisfaction with a strength of 61 percent (R2 =. 610, adjusted R2 =. 495, p = 004) as
shown in table 4.14.
Table 4.14 Multiple Regression Analysis Results: Model Fitness
Model R R
Square
Adjusted R
Square
Std.Error
Estimate
Sig. F Change
.781a .610 .495 .58603 0.004
Source: Research Data
4.7.1 Analysis of Variance: ANOVA
The table below represents results of the analysis of variance of the effect of service
quality on customer satisfaction of IT service companies in Kenya.

35
Table 4.15 ANOVA
Source Sum of Squares df Mean Square F Sig.
Regression 9.118 5 1.824 5.310 .004b
Residual 5.838 17 .343
Total 14.957 22
Source: Research Data
Analysis of variance was conducted to establish the significance of the regression model,
the findings establish that service quality influenced customer satisfaction, F (5, 17)
=5.31, P=.004. The findings above indicate that the model was significant because the p-
value of 0.004 is lower that the critical value of 0.05. From the findings it is concluded
that service quality has positive impact on customer satisfaction. The results from this
study therefore agrees with the findings carried out by Dahiyat, Akroush and Abu-Lail
(2011), Samen, Akroush and Abu-Lail (2013) and Ladhari (2009), who all claimed that
service quality precedes customer satisfaction.
4.7.2 Significance of the Regression Coefficients
Multiple Regression Analysis was employed to determine the effect of service quality
dimension on customer satisfaction and the below table present the result.
Table 4.16 Multiple Regression Analysis Results: Coefficients
Model
Unstandardized Coefficients
Standardized
B Std. Error Beta t Sig.
1
(Constant) 3.331 1.832 1.819 .087
Reliability .404 .186 .358 2.171 .044
Responsiveness .039 .176 .039 .221 .828
Tangibility .054 .134 .065 .405 .690
Assurance .651 .157 .644 4.154 .001
Empathy .118 .251 .084 .470 .644
Source: Research Data

36
The beta values were the weight associated with the regression equation. According to
the beta weight, the regression equation was as follows: The results shows that Reliability
and Assurance have a positive and significant effect, t=2.171, P=.044 and t=4.154,
P=.001 respectively while Responsiveness, Tangibility and Empathy have a positive
influence on customer satisfaction but are not significant, t=.221, P=.828, t=.405, P=.690
and t=.470, P=.644.
4.8 Capacity Management, Service Quality and Customer Satisfaction
The hierarchical regression analysis was performed on the basis of the four conditions by
Baron and Kenny (1981) and the results are presented in Table 4.17 whereby the first
condition, capacity management has a significant impact on service quality was tested
and the condition was met. The second condition service quality has a significant impact
on customer satisfaction show that mediating variable of service quality has a positive
influence on customer satisfaction; the third condition show impact of capacity
management on customer satisfaction when service quality is controlled for has a
significant influence on customer satisfaction and the fourth condition testing the impact
of capacity management when the mediator is introduced shows that the influence of
service quality reduces, hence the Baron and Kenny mediator effect was met. It can then
be conclude that service quality fully mediates the relationship between capacity
management and customer satisfaction.

37
Table 4.17 Multiple Regression Analysis Results: Coefficients
Dependent Variables
Independent Service Quality Customer Satisfaction
Variables B t Sig. B t Sig. B t Sig.
(Constant) 2.735 2.115 0.049
0.042 1.829 0.860
Level strategy 0.438 2.61 0.018
0.151 2.923 0.064
Chase strategy 0.662 4.361 0.000
0.246 5.022 0.000
Coping strategy 0.061 1.465 0.647
0.212 3.519 0.084
Minimum staffing strategy 0.565 3.646 0.034
0.281 1.667 0.001
(Constant)
3.331 1.819 0.087 2.735 1.711 0.074
Reliability 0.404 2.171 0.044 0.377 1.192 0.036
Responsiveness 0.039 0.221 0.828 0.026 0.187 0.214
Tangibility 0.054 0.405 0.69 0.031 0.361 0.029
Assurance 0.651 4.154 0.001 0.466 3.465 0.359
Empathy 0.118 0.47 0.644 0.057 0.115 0.034
R2 0.605 0.61
0.6113
Adjusted R2 0.517
0.495
0.5913
Sig.F-Change 0.002
0.004
0.004
Source: Research Data
4.9 Challenges affecting implementation of capacity management strategies
Researcher sought to find out the challenges affecting implementation of capacity
management strategies in IT service companies in Nairobi Kenya through an open ended
question. Respondents were required to list the challenges and were analyzed as on table
below.

38
Table 4.18 Challenges in capacity management
Challenges Frequency Percent
Poor leadership and management 7 10.6
Lack of management support 12 18.2
Lack of qualified Staff 10 15.2
Resistance to change 6 9.1
Lack of communication in
organization 5 7.5
cost implementation 18 27.3
Lack of Processes 8 12.1
Total 66 100.0
Source Researcher
From the table above, the study identifies various challenges an indication that firms face
different challenges during the implementation of capacity management strategies. The
study finds out that the high cost of implementation; lack of management support,
insufficient trainings and lack of processes are frequently encountered challenges during
implementation of different capacity management strategies by IT service organizations,
(27.3%, 18.2%, 15.2% and 12.2%).
Other challenges that were noted were poor leadership, resistance to change and poor
communication within the departments or within the organization thus the stakeholders
fail to understand what is required of them to make implementation successful and lack
of measures performance. This therefore means that for IT service companies in Kenya to
successfully manage their capacity and improve their performance, they must first put in
place measures to address the listed challenges.

39
CHAPTER FIVE
SUMMARY, CONCLUSION AND RECOMMENDATIONS
5.1 Introduction
This chapter addressed the summary of the findings, the conclusions and the
recommendations. The study objectives was to ascertain the extent to which capacity
management strategies had been adopted in IT service companies in Nairobi, to establish
the role of service quality in the relationship between capacity management strategies and
customer satisfaction of IT service companies in Nairobi Kenya and the challenges faced
by IT service companies in Kenya in the adoption of capacity management strategies.
5.2 Summary of Findings
The study established that the IT service companies had processes in place to manage
their capacity. The first objective was to establish the most adopted capacity management
strategy by IT service companies in Nairobi Kenya. There results showed the use of the
different strategies to varying degrees. However, the result show that Chase strategy was
adopted to a large extent by IT service providers to manage their capacity which was the
highest followed by coping strategy. Minimum staffing strategy was moderately used by
IT service companies while the level strategy was the least used. This means that most IT
companies use contractors and part time workers as well as leasing equipment in to
manage their capacity when there is a high demand for their services.
5.2.1 Capacity Management practices Service quality and Customer satisfaction
The second objective was to establish the extent to which IT service organizations have
adopted the various strategies of managing capacity. The results established that level
strategy and minimum staffing levels were adopted to a low extent while Chase strategy
and coping strategy were highly adopted. The first part of the framework focused on the
effect of capacity management strategies on service quality. The results of the study show
that the capacity management strategy adopted by the IT service company greatly
influences service quality.

40
The results show that the influence on service quality by capacity management strategies
was significant for level, chase and minimum staffing levels but not significant for coping
strategy. Chase capacity management strategy was the strongest strategy that had an
influence on customer satisfaction. This means that although the use of contract or
temporary employees or leasing space or equipment, shifts provided most flexible and
fast way of resolving capacity issues, the organization has to pay very close attention on
how they implement these strategies as any mistake made would have a high likelihood
that it would impact service quality in a major way. This could be through unqualified
contract or temporary employees hired or obsolete equipment leased and many more.
The second part of the framework was to establish the impact service quality on customer
satisfaction. The results from the study shows that the Service quality dimensions
namely; Assurance, Empathy, Responsiveness, Tangibility and reliability had a positive
influence on customer satisfaction. The results show that Assurance was the strongest
factor on service quality. The highest score under assurance went to the fact that the
employees were consistently courteous to the customers, while the least score was to the
fact that the employee behaviour instilled confidence in the customers. This therefore
means that the IT service organization needs to consistently monitor and reinforce
preferred behaviour in their employee in order to increase the confidence of their
customers in them. This was followed by reliability, tangibility, responsiveness and the
least was empathy. Under reliability the highest score went to the ability of the IT service
organizations to deliver within the given time but that they needed to show enthusiasm to
resolve with issues as this had the lowest score. The results also showed that service
quality mediated between capacity management and customer satisfaction meaning that if
capacity management was not managed well there would be an impact in service quality
which would then impact customer satisfaction.
5.2.2 Challenges in implementing capacity management practices
The last objective of this study was to ascertain the challenges that affect the
implementation of capacity management strategies by IT service companies in Kenya.
The study findings indicate high costs of adopting capacity management strategies, lack

41
of top management support, lack of clear goals in capacity management and inadequate
resources in the capacity management are the major challenges facing IT service
organizations in Nairobi Kenya. The organizations therefore need to understand the
critical role that capacity management plays in the success of a business through reduced
costs and improved services and give priority to it and influencing the senior leaders in
the organization to buy into it. The organization should also put in place mechanisms to
establish the capacity requirements to meet service level agreements of their customers
and minimize capacity related incidences.
5.3 Conclusion
Effectiveness in operations of a firm is highly attributed to adoption of capacity
management practices. IT service organizations in Nairobi Kenya have become very
essential in the day to day life of the Kenyan Population based on the fact that they have
specialized services, fast internet service in the current digitalized economy. In
conclusion, the study was aimed at establishing the extent to which capacity management
strategies have been adopted, how capacity management affects service quality and the
impact on customer satisfaction as well as the challenges faced in the implementation of
capacity management strategies in IT service companies in Kenya in Kenya.
The findings indicate that to a large extent, all the capacity management strategies had
been adopted in IT service companies in Kenya. This was indicated by positive mean
values above three indications that all the practices had been implemented to a large
extent. The findings from the regression analysis indicated that capacity management
strategies and service quality to a significant extent have effect on customer satisfaction
in the IT service companies in Kenya in Kenya. The results of the study ascertained a
positive correlation between the various capacity management strategies and service
quality of IT service companies in Kenya in Nairobi.
The study established that the IT service organizations faced various challenges while
implementing strategies to manage capacity ranging from, lack of management support,
unqualified staff, lack of communication and processes not in place. The findings also

42
indicate that the customers were generally satisfied with the services from their IT service
providers.
5.4 Recommendations to Policy and Practice
From these study findings, it is established that despite the fact that the IT service
companies in Kenya were facing very many challenges in implementing the capacity
management practices, all of the IT service organizations studied in Nairobi Kenya had
processes in place to manage their capacity. The study recommends that organization
employees from operation management need to be trained further on the various capacity
management strategies and the need for the same towards boosting overall firm
performance. In addition, senior managers of various IT service companies in Kenya
should be the ones to lead in these initiatives since the changes would be more likely
implemented when senior management shows support. It is also imperative that change
management should be carried out in order to ensure that there is minimal resistance to
change by the employees of the IT service organizations. The IT service companies in
Kenya should therefore invest resources on training of employees so as to boost their
performance through service quality.
According to this research service quality is a very important antecedent to customer
satisfaction. Therefore the IT service companies in Kenya should focus on improving and
maintaining the standards of quality in their services in order to ensure that the customers
are content. They should also look at the pricing of their service such that the customer
should be able to vain value for their prices among the service quality dimension
Responsiveness receive the least mean although the dimension was confirmed to b
influencing customer satisfaction. The IT service companies in Kenya should therefore
focus on improving their responsiveness towards their customer by attending to the issues
of their customers as soon as they arise and if not communicate to them on how soon they
can be closed.

43
5.5 Limitations of the Study
The study findings were applicable to the IT setting, specifically those in Nairobi only
and registered with KITOs. Therefore, the findings cannot be used as representative of all
others contexts. An inadequate resource such as finances was a challenge in this study
leading to non-exhaustive exposition of majority of the capacity management strategies,
service quality applied by IT service companies in Kenya. Similarly, there was
constrained time resource. Reluctance of some respondents in giving out information on
the study was also a challenge in the study due to the rules and regulations of the firms
however the researcher communicated to the respondents that the study was to be used
for study purposes only.
Some of the respondents had very tight working schedules and were therefore not
available for the interview. However, the researcher tried as much as possible and got an
above average response rate which was considered an adequate representative sample of
the target population. Besides tight work schedules, some of the respondents did not
accept the questionnaires thus making it a challenge to effectively carry out the study.
5.6 Suggestions for Further Research
The study sought to determine the capacity management strategies used in IT service
companies in Kenya in Kenya as well as the relationship between capacity management
strategies, service quality and customer satisfaction. Further studies need to be carried out
on other sectors other than IT service companies in Nairobi Kenya. In addition, future
studies should consider other service quality dimensions and capacity management
strategies with an aim of establishing their effect on customer satisfaction. This therefore
means that a different industry apart from IT service companies in Kenya should be
considered in future studies.

44
REFERENCES
Adenso‐Díaz, B., González‐Torre, P., & García, V. (2002). A capacity management
model in service industries. International Journal of Service Industry
Management, 13(3), 286-302. Doi: 10.1108/09564230210431983
Agrawal, S., Mittal, M., & Gupta, R. (2016). Service Quality in Public and Private Sector
Banks of India. International Journal on Customer Relations, 4(1).
doi:10.21863/ijcr/2016.4.1.016
Akan, P. (1995). Dimensions of service quality: a study in Istanbul. Managing Service
Quality, 5(6): 39-43.
Anderson, E. W., Fornell, C., & Lehmann, D. R. (1994). Customer Satisfaction, Market
Share, and Profitability: Findings from Sweden. Journal of Marketing, 58(3), 53.
Doi: 10.2307/1252310
Armistead, C. G. and Clark, G. R. (1991). Capacity Management in Services and the
Influence on Quality and Productivity Performance, Cranfield School of
management working paper 56/91.
Armistead, C. G. and Clark, G. R. (1991). Capacity Management in Services and the
Influence on Quality and Productivity Performance, Cranfield School of
management working paper 56/91.
Armistead, C., &Clark, G. (1994). The “Coping” capacity management strategy in
services and the influence on quality performance. International Journal of
Service Industry Management, 5(2), 5-22. Doi: 10.1108/09564239410057654
Bairi, J., Manohar, B. M., & Kundu, G. K. (2012). Capacity and availability management
by quantitative project management in the IT service industry. Asian Journal on
Quality, 13(2), 163-176. Doi: 10.1108/15982681211265472
Bhattacherjee, A., Premkumar, G., (2004). Understanding changes in belief and attitude
toward information technology usage: a theoretical model and longitudinal test.
MIS Quarterly 28 (2), 229–254.
Boulding. W., Staelin, R., Kalra. A. & Zeithaml, V. A. (1993). A dynamic process model
of service quality: From expectations to behavioural intentions. Journal of
marketing Research. 30, 7-27
Choi, T. Y., & Chu, R. (2001). Determinants of hotel guests' satisfaction and repeat
patronage in the Hong Kong hotel industry. International Journal of Hospitality
Management, 20: 277-297.

45
Dabholkar, P. A., Shepherd, C. D., & Thorpe, D. I. (2000). A comprehensive framework
for service quality: An investigation of critical conceptual and measurement
issues through a longitudinal study. Journal of Retailing, 76(2), 139-173.
Dabholkar, P. A., Thorpe, D. I., & Rentz, J. O. (1996). A measure of service quality for
retail stores: Scale development and validation. Journal of the Academy of
Marketing Science, 24(1), 3-16. Doi: 10.1007/bf02893933
Dahiyat, S. E., Akroush, M. N., & Lail, B. N. (2011). An integrated model of perceived
service quality and customer loyalty: an empirical examination of the mediation
effects of customer satisfaction and customer trust. International Journal of
Services and Operations Management, 9(4), 453. doi:10.1504/ijsom.2011.041242
Delgado-Alvarez, C. A., Van Ackere, A., Larsen, E. R., & Arango-Aramburo, S. (2017).
Managing capacity at a service facility: An experimental approach. European
Journal of Operational Research, 259(1), 216-228.
doi:10.1016/j.ejor.2016.09.056
Izogo, E. E., & Ogba, I. (2015).Service quality, customer satisfaction and loyalty in
automobile repair services sector. International Journal of Quality & Reliability
Management, 32(3), 250-269. Doi: 10.1108/ijqrm-05-2013-0075
Fotiadis, A. K. & Vassiliadis, C. A. (2013). The effects of a transfer to new premises on
patients’ perceptions of service quality in a general hospital in Greece. Total
Quality Management & Business Excellence, 24(9-10), 1022-1034.
doi:10.1080/14783363.2013.799328
Gerson R. F. (1993). Measuring customer satisfaction, Crisp Publication, Inc., Menlo
Park, California.
Halstead, D., Hartman, D., and Schmidt, S.L. (1994). ‘Multisource Effects on the
Satisfaction Formation Process’, Journal of the Academy of Marketing Science,
Vol. 22 (spring), pp. 114 –129.
Hart, C.W.L., Heskett, J.L. & Sasser, W.E. (1990), “The Profitable art of service
recovery”, Harvard Business Review, July-August.
Heskett J. L, Sasser WE & Schlesinger LA, 1997, The Service Profit Chain, The
FreePress, New York
Ives, B., Olson, M.H., & Baroudi, J.J. (1983). The Measurement of User Information
Satisfaction. Communications of the ACM, 26(10), 785-793.

46
Jongpae, P. and Santhiti Treetipbut, D. (2017). The Influence of Service Quality on
Overall Customer Satisfaction and the Influence of Overall Customer Satisfaction
on Customer Loyalty in Retail Banking in Bangkok. Odijournal.au.edu.
http://www.odijournal.au.edu/index.php/yie/article/view/105
Knutson, B. (1988). Frequent travellers: making them happy and bringing them back. The
Cornell Hotel and Restaurant Administration Quarterly, 29(1): 83-87.
Kotler, P., Siew M., Swee H., & Chin, T. (1996), Marketing Management: An Asian
Perspective Singapore": Prentice Hall.
Lovelock, C.H. (1984), Services Marketing, Prentice Hall, Englewood Cliffs, NJ
Mattila A. & O’Neill J.W. (2003). ’Relationships between Hotel Room Pricing,
Occupancy, and Guest Satisfaction: A Longitudinal Case of a Midscale Hotel in
the United States’, Journal of Hospitality & Tourism Research, 27 (3), pp. 328-
341, Sage Publications
Nazimoglu, O., & Ozsen, Y. (2010). ‘Analysis of Risk dynamics in Information
Technology service delivery. Journal of Enterprise Information Management
23(3) 350-364 http://doi.org/:10.1108/17410391011036102
Oliver, R. L. (1977). Effect of expectation and disconfirmation on post exposure product
evaluations: An alternative interpretation. Journal of Applied Psychology, 62,
480-486.
Oliver, R. L. (1993). A conceptual model of service quality and service satisfaction:
Compatible goals, different concepts. In T. A. Swartz. D. E. Bowen, &S. W.
Brown (Ms.) Advances in services marketing and management (Vol. 2, pp. 65-
85). Greenwich, CT. JAI.
Ong’ondo, E. W. (2013). Effect of capacity management strategies On Service quality in
Safaricom. Unpublished MBA Project. University of Nairobi.
Onyango (2016) Capacity management and service industry performance, a case of
sunset hotel-Kisumu. Unpublished MBA Project. University of Nairobi.
Peyton, R., Pitts, S., Kamery, R.H., (2003) - “Consumer Satisfaction/Dissatisfaction
(CS/D): A Review of the Literature Prior to the 1990s”, Proceedings of the
Academy of Organizational Culture, Communication and Conflict. Vol. 7(2),
p.42.
Pitt, L. F., Watson, R. T., & Kavan, C. B. (1995).Service Quality: A measure of
information systems effectiveness. MIS Quarterly, 19(2), 173. doi:
10.2307/249687

47
Reichheld FF, 1996. The Loyalty Effect, Harvard Business School Press, Boston,
Massachusetts
Samen, A. A., Akroush, M. N., & Abu‐Lail, B. N. (2013).Mobile SERVQUAL.
International Journal of Quality & Reliability Management, 30(4), 403-425. doi:
10.1108/02656711311308394
Voss, C., Roth, A.V., Rosenzweig, E.D., Blackmon, K. and Chase, R.B. (2004a), “A tale
of two countries’ conservatism, service quality, and feedback on customer
satisfaction”, Journal of Service Research, Vol. 6 No. 3, pp. 212-23.
Wairimu, (2014) “Capacity management strategies and service quality in petroleum
distribution firms in Kenya”. Unpublished MBA Project. University of Nairobi.
Wang, I.M. and Shieh, C.J. (2006), “The relationship between service quality and
customer satisfaction: the example of CJCU library”, Journal of Information and
Optimization Sciences, Vol. 27 No. 1, pp. 193-209.
Wang, Y., Hing-Po, L. and Yang, Y. (2004), An integrated framework for service quality,
customer value, satisfaction: Evidence from China's telecommunication industry.
Information Systems Frontiers, 6(4), 325-340.
doi:10.1023/b:isfi.0000046375.72726.67
Zeithaml, V.A., Parasuraman, A. and Berry, L.L. (1990), Delivering quality service:
Balancing customer perceptions and expectations, The Free Press, New York,
NY.

48
APPENDICES
Appendix I: Questionnaire
The purpose of this questionnaire is to collect primary data on the relationship between
capacity management strategies, service quality and customer satisfaction. Please take a
few minutes to respond to the questions as truthfully as possible. The data collected is
purely for academic purposes and therefore confidentiality will be observed.
SECTION A: DEMOGRAPHICS
1. Please indicate your gender:
Male Female
2. Please state your designation
Project Manager Delivery Manager
3. What is the average annual income: Ksh 5m or under Ksh 5m-
Kshs 800m Ksh 800m and above
PART A: CAPACITY MANAGEMENT ADOPTED BY IT SERVICE
ORGANIZATION
1. Using a five point scale, please indicate the extent to which your organization has
adopted the following capacity management strategies. Use 1- Very low extent, 2-
Low extent, 3-Moderate extent, 4- Great extent, 5- Very great extent
CAPACITY MANAGEMENT
STRATEGIES
1 2 3 4 5
Level strategy
the company maintains the same
number of staff, materials or
machines in a particular period
Chase strategy
The company changes the extent of
resources by overtime, part-time
employees, sub-contracting or
leasing equipment and cross-training
employees

49
Coping strategy
There is more demand than can be
managed with the available capacity
and the company manages by
controlling how the service quality
fall when out of capacity to match
demand
Minimum staffing strategy
The company has worked out a
model to determine the right
number of employee at the right
place and time that provide
minimum coverage
PART B: CAPACITY MANAGEMENT STRATEGIES AND SERVICE QUALITY
2. Indicate to what extent you agree that capacity management strategies have
influenced the service quality in IT services. Rate using a scale of 1-5, where: 1
strongly disagree, 2 Disagree, 3 neither agree nor disagree, 4 agree, 5 strongly
agree
CAPACITY MANAGEMENT STRATEGIES 5 4 3 2 1
Level strategy
Our IT services are highly customized
Demand is relatively consistent and we are able to match it
The requirements from customers are the same in all
periods and standards of quality are maintained
The company make decisions based on staffing an stock
holding/leasing decision ensuring that operations are not
affected
Chase strategy
The company matches demand by hiring or firing employee
Altering or improving resources e.g. shifts ,overtime, cross
training
Use of external sources of capacity e.g. outsourcing
Rent, Lease or Sharing required equipment

50
Coping strategy
Customers have information on what is possible and in
times of high demand customers are persuaded to wait for
services
Customer service dimensions have been defined and are
reliable
The managers are aware of when service quality are being
degraded and act upon it after the event
The company understand the bottle-necks in its service
delivery and can manage them
Minimum staffing strategy
The company has calculated the average number of
activities per customer
The company knows the required number of employees to
attend to customers for each time period
The company has established the time it takes to perform
each task
The employees of the company are multipurpose i.e. can
perform any job requested by customer
PART C: CHALLENGES
3. In your opinion what are the challenges faced by IT service providers in
implementing capacity management strategies
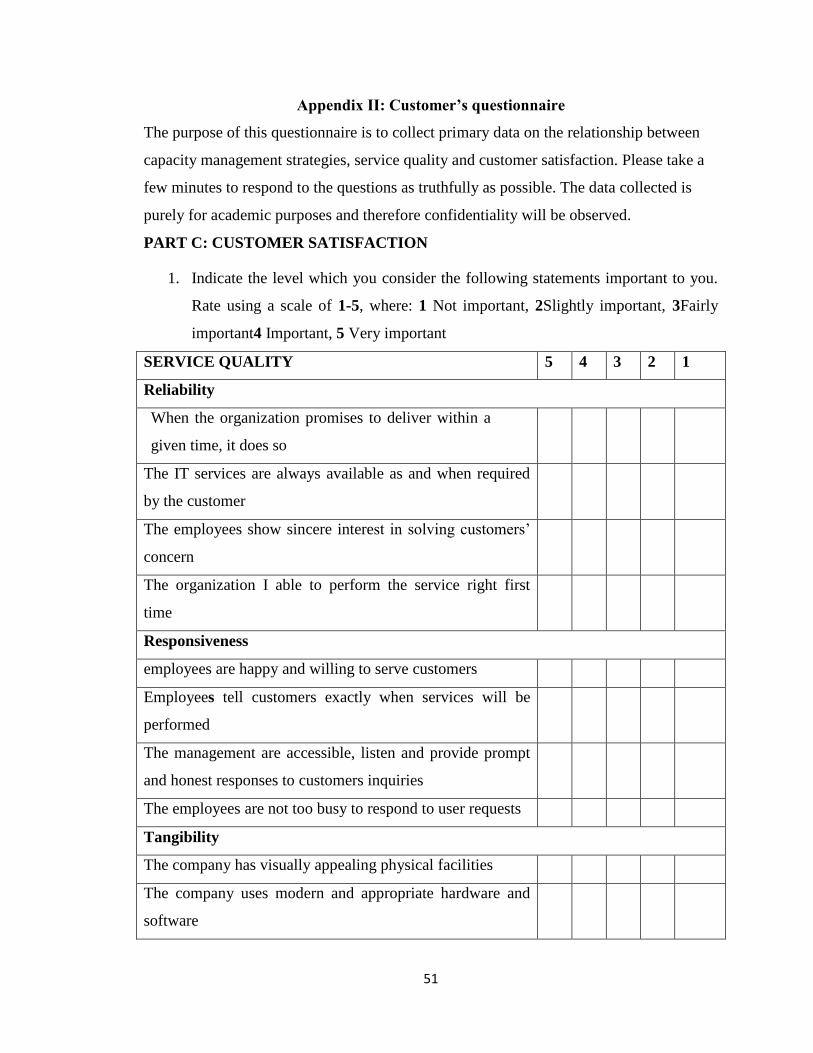
51
Appendix II: Customer’s questionnaire
The purpose of this questionnaire is to collect primary data on the relationship between
capacity management strategies, service quality and customer satisfaction. Please take a
few minutes to respond to the questions as truthfully as possible. The data collected is
purely for academic purposes and therefore confidentiality will be observed.
PART C: CUSTOMER SATISFACTION
1. Indicate the level which you consider the following statements important to you.
Rate using a scale of 1-5, where: 1 Not important, 2Slightly important, 3Fairly
important4 Important, 5 Very important
SERVICE QUALITY 5 4 3 2 1
Reliability
When the organization promises to deliver within a
given time, it does so
The IT services are always available as and when required
by the customer
The employees show sincere interest in solving customers’
concern
The organization I able to perform the service right first
time
Responsiveness
employees are happy and willing to serve customers
Employees tell customers exactly when services will be
performed
The management are accessible, listen and provide prompt
and honest responses to customers inquiries
The employees are not too busy to respond to user requests
Tangibility
The company has visually appealing physical facilities
The company uses modern and appropriate hardware and
software

52
The employees are well dressed and neat in appearance
The material associated with the service for example
training manuals are visually appealing
Assurance
The support staff have the required skills to resolve
problems and answer questions
The employees make customers feel safe in their transaction
The employee behavior instill confidence in the customers
The employee are consistently courteous to the customers
Empathy
The employees give customers individual attention
The employees are committed to ethics and promote ethical
behavior in the work place
Services are adjusted to suit individual customer needs
The operating hour are convenient to all customers
4. Below are statements describing Customer satisfaction, please indicated the level
to which you agree with them in accordance to the following scale:1-Extremely
Low, 2-Low, 3-Neutral, 4-Very High, 5-Extremely High
No. Statement 1 2 3 4 5
1 Customers’ overall satisfaction with the IT service provider
2 Customers intention for renewal of their contract with their IT
service provider
3 Customers consideration of the image of their IT service provider
for the renewal of their support contract
4 Customers consideration of price for renewal of their IT services
5 Customers consideration of Timeline of the service for renewal
of their contract with IT service provider

53
Appendix III: List of Companies Registered with KITOs
1. Adept Technologies
2. Attain Enterprise Solutions
3. Beninda.Com
4. Bunifu Technologies
5. Capture Solutions
6. Crystal Tech Solutions
7. DataScience LTD
8. Digital Vision East Africa
9. Digital Divide Data (DDD)
10. Foundation Support Services
11. Greenbell Communication LTD
12. Eighteen-O-Nine LTD
13. Empire Microsystems
14. Insynque Solutions
15. Netcom Information Systems
16. New edge Technologies
17. Pluspeople Kenya
18. Ramsa Ltd
19. Sabalink Technologies
20. Sapama.com
21. Sawasawa.com LIMITED
22. Shimba Technologies
23. Sunesis Consulting Ltd
24. Sycom Africa Limited
25. Synergy Informatics Limited
26. Systech LTD
27. Techno Brain LTD
28. WAVUH LTD

54
Appendix IV: Letter of Introduction